Table of Contents
UNITED STATES
SECURITIES AND EXCHANGE COMMISSION
Washington, D.C. 20549
FORM N-CSR
CERTIFIED SHAREHOLDER REPORT OF REGISTERED MANAGEMENT
INVESTMENT COMPANIES
Investment Company Act file number 811-07455
Virtus Opportunities Trust
(Exact name of registrant as specified in charter)
101 Munson Street
Greenfield, MA 01301-9668
(Address of principal executive offices) (Zip code)
Kevin J. Carr, Esq.
Senior Vice President, Chief Legal Officer, Counsel and Secretary for Registrant
100 Pearl Street
Hartford, CT 06103-4506
(Name and address of agent for service)
Registrant’s telephone number, including area code: (800) 243-1574
Date of fiscal year end: September 30
Date of reporting period: September 30, 2016
Form N-CSR is to be used by management investment companies to file reports with the Commission not later than 10 days after the transmission to stockholders of any report that is required to be transmitted to stockholders under Rule 30e-1 under the Investment Company Act of 1940 (17 CFR 270.30e-1). The Commission may use the information provided on Form N-CSR in its regulatory, disclosure review, inspection, and policymaking roles.
A registrant is required to disclose the information specified by Form N-CSR, and the Commission will make this information public. A registrant is not required to respond to the collection of information contained in Form N-CSR unless the Form displays a currently valid Office of Management and Budget (“OMB”) control number. Please direct comments concerning the accuracy of the information collection burden estimate and any suggestions for reducing the burden to Secretary, Securities and Exchange Commission, 100 F Street, NE, Washington, DC 20549. The OMB has reviewed this collection of information under the clearance requirements of 44 U.S.C. § 3507.
Table of Contents
Item 1. Reports to Stockholders.
The Report to Shareholders is attached herewith.
Table of Contents

ANNUAL REPORT
Virtus Bond Fund*
Virtus CA Tax-Exempt Bond Fund
Virtus Essential Resources Fund*
Virtus High Yield Fund*
Virtus Low Duration Income Fund
Virtus Low Volatility Equity Fund*
Virtus Multi-Sector Intermediate Bond Fund
Virtus Senior Floating Rate Fund*
Virtus Tax-Exempt Bond Fund
Virtus Wealth Masters Fund
September 30, 2016 TRUST NAME: VIRTUS OPPORTUNITIES TRUST * Prospectus and Statement of Additional Information supplements applicable to these Funds |
 |
Not FDIC Insured
No Bank Guarantee
May Lose Value
Table of Contents
| 1 | ||||||||
| 2 | ||||||||
| 4 | ||||||||
| Fund | Fund Summary | Schedule of Investments | ||||||
| 7 | 31 | |||||||
| 9 | 38 | |||||||
Virtus Essential Resources Fund (“Essential Resources Fund”) | 12 | 41 | ||||||
| 14 | 43 | |||||||
Virtus Low Duration Income Fund (“Low Duration Income Fund”) | 17 | 49 | ||||||
Virtus Low Volatility Equity Fund (“Low Volatility Equity Fund”) | 19 | 58 | ||||||
Virtus Multi-Sector Intermediate Bond Fund (“Multi-Sector Intermediate Bond Fund”) | 21 | 59 | ||||||
Virtus Senior Floating Rate Fund (“Senior Floating Rate Fund”) | 23 | 68 | ||||||
| 26 | 74 | |||||||
| 29 | 79 | |||||||
| 81 | ||||||||
| 84 | ||||||||
| 88 | ||||||||
| 95 | ||||||||
| 101 | ||||||||
| 116 | ||||||||
| 117 | ||||||||
Consideration of Advisory and Subadvisory Agreements by the Board of Trustees | 118 | |||||||
| 120 | ||||||||
| 124 | ||||||||
Proxy Voting Procedures and Voting Record (Form N-PX)
The subadvisers vote proxies relating to portfolio securities in accordance with procedures that have been approved by the Board of Trustees of the Trust (“Trustees,” or the “Board”). You may obtain a description of these procedures, along with information regarding how the Funds voted proxies during the most recent 12-month period ended June 30, free of charge, by calling toll-free 1-800-243-1574. This information is also available through the Securities and Exchange Commission’s (the “SEC”) website at http://www.sec.gov.
Form N-Q Information
The Trust files a complete schedule of portfolio holdings for each Fund with the SEC for the first and third quarters of each fiscal year on Form N-Q. Form N-Q is available on the SEC’s website at http://www.sec.gov. Form N-Q may be reviewed and copied at the SEC’s Public Reference Room. Information on the operation of the SEC’s Public Reference Room can be obtained by calling toll-free 1-800-SEC-0330.
This report is not authorized for distribution to prospective investors in the Funds presented in this book unless preceded or accompanied by an effective prospectus which includes information concerning the sales charge, each Fund’s record and other pertinent information.
Table of Contents
To My Fellow Shareholders of Virtus Mutual Funds:
 | I am pleased to present this annual report that reviews the performance of your fund for the 12 months ended September 30, 2016.
During the first half of the fiscal year, global equity markets were challenged by falling oil prices, China’s slowdown, and concerns over the Federal Reserve’s (“the Fed”) first rate hike in nine years, which occurred in December 2015. Equities plummeted in early 2016, but stabilizing oil prices and the Fed’s softened stance on further rate hikes for 2016 sparked a rally in mid-February that lasted until June. The U.K.’s June 23 “Brexit” decision to leave the European Union triggered a selloff that was largely | |
short-lived. Calm was restored by better-than-expected corporate earnings, an improving global economic picture, and reassurance that the world’s central banks would continue to provide monetary stimulus. By the end of September, U.S. equity markets had recovered much of their losses, and the 12-month period was positive for many asset classes.
For the 12 months ended September 30, 2016, U.S. small-cap stocks kept pace with U.S. large-cap stocks, as measured by the 15.47% and 15.43% returns of the Russell 2000® Index and S&P 500® Index, respectively. Within international equities, emerging markets significantly outperformed their developed peers, with the MSCI Emerging Markets Index (net) up 16.78%, while the MSCI EAFE® Index (net) returned 6.52%.
Demand for U.S. Treasuries remained strong, driven by foreign investors seeking safe havens and yield in light of the negative interest rate environment in many international economies. On September 30, 2016, the benchmark 10-year U.S. Treasury yielded 1.60% compared with 2.06% one year earlier. For the 12 months ended September 30, 2016, the broader U.S. fixed income market, as represented by the Bloomberg Barclays U.S. Aggregate Bond Index, which tracks Treasuries and other investment-grade debt securities, gained 5.19%, while non-investment grade bonds rose 12.73%, as measured by the Bloomberg Barclays U.S. Corporate High Yield Bond Index.
The strength of the global economy will likely remain a leading concern for markets in the months ahead, and investors will watch with great interest the actions of the Fed and other major central banks. The U.S. economy’s continued growth, as evidenced by recent strong jobs, housing, and consumer spending data, should give investors reason for optimism, but future market direction will be determined largely by the ability of corporations to continue to produce robust earnings.
Market uncertainty is an ever-present reminder of the importance of portfolio diversification, including exposure to both traditional and alternative asset classes. While diversification cannot guarantee a profit or prevent a loss, owning a variety of asset classes may cushion your portfolio against inevitable market fluctuations. Your financial advisor can help you ensure that your portfolio is adequately diversified across asset classes and investment strategies.
As always, thank you for entrusting Virtus with your assets. Should you have questions about your account or require assistance, please visit our website at Virtus.com, or call our customer service team at 1-800-243-1574. We appreciate your business and remain committed to your long-term financial success.
Sincerely,
George R. Aylward President, Virtus Mutual Funds
October 2016 | ||

Performance data quoted represents past results. Past performance is no guarantee of future results, and current performance may be higher or lower than the performance shown above.
1
Table of Contents
VIRTUS OPPORTUNITIES TRUST
Disclosure of Fund Expenses (Unaudited)
FOR THE SIX-MONTH PERIOD OF APRIL 1, 2016 TO SEPTEMBER 30, 2016
We believe it is important for you to understand the impact of costs on your investment. All mutual funds have operating expenses. As a shareholder of a Virtus Opportunities Trust Fund (each, a “Fund”) you may incur two types of costs: (1) transaction costs, including sales charges on purchases of Class A shares and contingent deferred sales charges on Class B and Class C shares; and (2) ongoing costs, including investment advisory fees, distribution and service fees, and other expenses. Class I shares and Class R6 shares are sold without sales charges and do not incur distribution and service fees. For further information regarding applicable sales charges, see Note 1 in the Notes to Financial Statements. These examples are intended to help you understand your ongoing costs (in dollars) of investing in a Fund and to compare these costs with the ongoing costs of investing in other mutual funds. These examples are based on an investment of $1,000 invested at the beginning of the period and held for the entire six-month period. The following Expense Table illustrates your Fund’s costs in two ways.
Actual Expenses
The first section of the accompanying table provides information about actual account values and actual expenses. You may use the information in this section, together with the amount you invested, to estimate the expenses that you paid over the period. Simply divide your account value by $1,000 (for example, an $8,600 account value divided by $1,000 = 8.6), then multiply the result by the number given for your Fund under the heading “Expenses Paid During Period” to estimate the expenses you paid on your account during the period.
Hypothetical Example for Comparison Purposes
The second section of the accompanying table provides information about hypothetical account values and hypothetical expenses based on the Fund’s actual expense ratio and an assumed rate of return of 5% per year before expenses, which is not your Fund’s actual return. The hypothetical account values and expenses may not be used to estimate the actual ending account balance or expenses you paid for the period. You may use this information to compare the ongoing costs of investing in your Fund and other funds. To do so, compare these 5% hypothetical examples with the 5% hypothetical examples that appear in the shareholder reports of the other funds.
Please note that the expenses shown in the accompanying table are meant to highlight your ongoing costs only and do not reflect any transactional costs, such as sales charges or contingent deferred sales charges. Therefore, the second section of the accompanying table is useful in comparing ongoing costs only, and will not help you determine the relative total costs of owning different funds. In addition, if these transactional costs were included, your costs would have been higher. The calculations assume no shares were bought or sold during the period. Your actual costs may have been higher or lower, depending on the amount of your investment and the timing of any purchases or redemptions.
| Expense Table | ||||||||||||||||
| Beginning Account Value April 1, 2016 | Ending Account Value September 30, 2016 | Annualized Expense Ratio | Expenses Paid During Period* | |||||||||||||
Bond Fund |
| |||||||||||||||
Actual | ||||||||||||||||
Class A | $ | 1,000.00 | $ | 1,048.70 | 0.87 | % | $ | 4.46 | ||||||||
Class B | 1,000.00 | 1,043.30 | 1.63 | 8.33 | ||||||||||||
Class C | 1,000.00 | 1,044.00 | 1.62 | 8.28 | ||||||||||||
Class I | 1,000.00 | 1,050.20 | 0.62 | 3.18 | ||||||||||||
Hypothetical (5% return before expenses) |
| |||||||||||||||
Class A | 1,000.00 | 1,020.65 | 0.87 | 4.39 | ||||||||||||
Class B | 1,000.00 | 1,016.85 | 1.63 | 8.22 | ||||||||||||
Class C | 1,000.00 | 1,016.90 | 1.62 | 8.17 | ||||||||||||
Class I | 1,000.00 | 1,021.90 | 0.62 | 3.13 | ||||||||||||
CA Tax Exempt Bond Fund |
| |||||||||||||||
Actual | ||||||||||||||||
Class A | $ | 1,000.00 | $ | 1,024.00 | 0.87 | % | $ | 4.41 | ||||||||
Class I | 1,000.00 | 1,026.20 | 0.62 | 3.15 | ||||||||||||
Hypothetical (5% return before expenses) |
| |||||||||||||||
Class A | 1,000.00 | 1,020.71 | 0.87 | 4.41 | ||||||||||||
Class I | 1,000.00 | 1,021.96 | 0.62 | 3.14 | ||||||||||||
Essential Resources Fund |
| |||||||||||||||
Actual | ||||||||||||||||
Class A | $ | 1,000.00 | $ | 1,052.40 | 1.68 | % | $ | 8.64 | ||||||||
Class C | 1,000.00 | 1,049.10 | 2.42 | 12.43 | ||||||||||||
Class I | 1,000.00 | 1,054.80 | 1.42 | 7.31 | ||||||||||||
Hypothetical (5% return before expenses) |
| |||||||||||||||
Class A | 1,000.00 | 1,016.60 | 1.68 | 8.47 | ||||||||||||
Class C | 1,000.00 | 1,012.90 | 2.42 | 12.18 | ||||||||||||
Class I | 1,000.00 | 1,017.90 | 1.42 | 7.16 | ||||||||||||
High Yield Fund |
| |||||||||||||||
Actual | ||||||||||||||||
Class A | $ | 1,000.00 | $ | 1,093.70 | 1.15 | % | $ | 6.02 | ||||||||
Class B | 1,000.00 | 1,089.70 | 1.89 | 9.87 | ||||||||||||
Class C | 1,000.00 | 1,091.30 | 1.90 | 9.93 | ||||||||||||
Class I | 1,000.00 | 1,095.10 | 0.90 | 4.71 | ||||||||||||
Hypothetical (5% return before expenses) |
| |||||||||||||||
Class A | 1,000.00 | 1,019.25 | 1.15 | 5.81 | ||||||||||||
Class B | 1,000.00 | 1,015.55 | 1.89 | 9.52 | ||||||||||||
Class C | 1,000.00 | 1,015.50 | 1.90 | 9.57 | ||||||||||||
Class I | 1,000.00 | 1,020.50 | 0.90 | 4.55 | ||||||||||||
Low Duration Income Fund |
| |||||||||||||||
Actual | ||||||||||||||||
Class A | $ | 1,000.00 | $ | 1,022.20 | 0.77 | % | $ | 3.89 | ||||||||
Class C | 1,000.00 | 1,017.40 | 1.52 | 7.67 | ||||||||||||
Class I | 1,000.00 | 1,023.50 | 0.52 | 2.63 | ||||||||||||
Hypothetical |
| |||||||||||||||
Class A | 1,000.00 | 1,021.15 | 0.77 | 3.89 | ||||||||||||
Class C | 1,000.00 | 1,017.40 | 1.52 | 7.67 | ||||||||||||
Class I | 1,000.00 | 1,022.40 | 0.52 | 2.63 | ||||||||||||
2
Table of Contents
VIRTUS OPPORTUNITIES TRUST
Disclosure of Fund Expenses (Unaudited) (Continued)
FOR THE SIX-MONTH PERIOD OF APRIL 1, 2016 TO SEPTEMBER 30, 2016
| Expense Table | ||||||||||||||||
| Beginning Account Value April 1, 2016 | Ending Account Value September 30, 2016 | Annualized Expense Ratio | Expenses Paid During Period* | |||||||||||||
Low Volatility Equity Fund |
| |||||||||||||||
Actual | ||||||||||||||||
Class A | $ | 1,000.00 | $ | 1,044.20 | 1.58 | % | $ | 8.07 | ||||||||
Class C | 1,000.00 | 1,041.10 | 2.34 | 11.94 | ||||||||||||
Class I | 1,000.00 | 1,046.80 | 1.33 | 6.81 | ||||||||||||
Hypothetical (5% return before expenses) |
| |||||||||||||||
Class A | 1,000.00 | 1,017.10 | 1.58 | 7.97 | ||||||||||||
Class C | 1,000.00 | 1,013.30 | 2.34 | 11.78 | ||||||||||||
Class I | 1,000.00 | 1,018.35 | 1.33 | 6.71 | ||||||||||||
Multi-Sector Intermediate Bond Fund |
| |||||||||||||||
Actual | ||||||||||||||||
Class A | $ | 1,000.00 | $ | 1,085.90 | 1.15 | % | $ | 6.00 | ||||||||
Class B | 1,000.00 | 1,082.10 | 1.89 | 9.84 | ||||||||||||
Class C | 1,000.00 | 1,082.00 | 1.89 | 9.84 | ||||||||||||
Class I | 1,000.00 | 1,087.20 | 0.89 | 4.64 | ||||||||||||
Class R6 | 1,000.00 | 1,088.70 | 0.83 | 4.33 | ||||||||||||
Hypothetical (5% return before expenses) |
| |||||||||||||||
Class A | 1,000.00 | 1,019.25 | 1.15 | 5.81 | ||||||||||||
Class B | 1,000.00 | 1,015.55 | 1.89 | 9.52 | ||||||||||||
Class C | 1,000.00 | 1,015.55 | 1.89 | 9.52 | ||||||||||||
Class I | 1,000.00 | 1,020.55 | 0.89 | 4.50 | ||||||||||||
Class R6 | 1,000.00 | 1,020.85 | 0.83 | 4.19 | ||||||||||||
Senior Floating Rate Fund |
| |||||||||||||||
Actual | ||||||||||||||||
Class A | $ | 1,000.00 | $ | 1,047.07 | 1.25 | % | $ | 6.40 | ||||||||
Class C | 1,000.00 | 1,043.08 | 2.00 | 10.22 | ||||||||||||
Class I | 1,000.00 | 1,048.44 | 1.00 | 5.12 | ||||||||||||
Hypothetical (5% return before expenses) |
| |||||||||||||||
Class A | 1,000.00 | 1,018.75 | 1.25 | 6.31 | ||||||||||||
Class C | 1,000.00 | 1,015.00 | 2.00 | 10.08 | ||||||||||||
Class I | 1,000.00 | 1,020.00 | 1.00 | 5.05 | ||||||||||||
Tax-Exempt Bond Fund |
| |||||||||||||||
Actual | ||||||||||||||||
Class A | $ | 1,000.00 | $ | 1,015.50 | 0.87 | % | $ | 4.38 | ||||||||
Class C | 1,000.00 | 1,011.60 | 1.62 | 8.15 | ||||||||||||
Class I | 1,000.00 | 1,016.80 | 0.63 | 3.18 | ||||||||||||
Hypothetical (5% return before expenses) |
| |||||||||||||||
Class A | 1,000.00 | 1,020.65 | 0.87 | 4.39 | ||||||||||||
Class C | 1,000.00 | 1,016.90 | 1.62 | 8.17 | ||||||||||||
Class I | 1,000.00 | 1,021.85 | 0.63 | 3.18 | ||||||||||||
Wealth Masters Fund |
| |||||||||||||||
Actual | ||||||||||||||||
Class A | $ | 1,000.00 | $ | 1,090.40 | 1.48 | % | $ | 7.73 | ||||||||
Class C | 1,000.00 | 1,086.10 | 2.23 | 11.63 | ||||||||||||
Class I | 1,000.00 | 1,091.60 | 1.23 | 6.43 | ||||||||||||
Hypothetical (5% return before expenses) |
| |||||||||||||||
Class A | 1,000.00 | 1,017.60 | 1.48 | 7.47 | ||||||||||||
Class C | 1,000.00 | 1,013.85 | 2.23 | 11.23 | ||||||||||||
Class I | 1,000.00 | 1,018.85 | 1.23 | 6.21 | ||||||||||||
| * | Expenses are equal to the relevant Funds’ annualized expense ratio, which is net of waived fees and reimbursed expenses, if applicable, multiplied by the average account value over the period, multiplied by the number of days (183) expenses were accrued in the most recent fiscal half-year, then divided by 366 to reflect the one-half year period. |
For Funds which may invest in other funds, the annualized expense ratios noted above do not reflect fees and expenses associated with the underlying funds. If such fees and expenses had been included, the expenses would have been higher.
You can find more information about the Funds’ expenses in the Financial Statements section that follows. For additional information on operating expenses and other shareholder costs, refer to the prospectus.
3
Table of Contents
VIRTUS OPPORTUNITIES TRUST
SEPTEMBER 30, 2016 (Unaudited)
American Depositary Receipt (ADR)
Represents shares of foreign companies traded in U.S. dollars on U.S. exchanges that are held by a U.S. bank or a trust. Foreign companies use ADRs in order to make it easier for Americans to buy their shares.
Bank of Japan (“BOJ”)
The Bank of Japan is the Japanese central bank.
Bloomberg Barclays California Municipal Bond Index
The Bloomberg Barclays California Municipal Bond Index measures long term investment grade, tax-exempt and fixed rate bonds issued in California. The index is calculated on a total return basis. The index is unmanaged, its returns do not reflect any fees, expenses, or sales charges, and it is not available for direct investment.
Bloomberg Barclays Municipal Bond Index
The Bloomberg Barclays Municipal Bond Index is a market capitalization-weighted index that measures the long-term tax-exempt bond market. The index is calculated on a total return basis. The index is unmanaged, its returns do not reflect any fees, expenses, or sales charges, and is not available for direct investment.
Bloomberg Barclays U.S. Aggregate Bond Index
The Bloomberg Barclays U.S. Aggregate Bond Index measures the U.S. investment grade fixed rate bond market. The index is calculated on a total return basis. The index is unmanaged, its returns do not reflect any fees, expenses, or sales charges, and it is not available for direct investment.
Bloomberg Barclays U.S. Corporate High Yield Bond Index
The Bloomberg Barclays U.S. Corporate High Yield Bond Index measures the U.S. dollar-denominated, high yield, fixed-rate corporate bond market. The index is calculated on a total return basis. The index is unmanaged, its returns do not reflect any fees, expenses, or sales charges, and it is not available for direct investment.
Bloomberg Barclays U.S. High-Yield 2% Issuer Capped Bond Index
The Bloomberg Barclays High-Yield 2% Issuer Capped Bond Index is a market capitalization-weighted index that measures fixed rate non-investment grade debt securities of U.S. and non-U.S. corporations. No single issuer accounts for more than 2% of market cap. The index is calculated on a total return basis. The index is unmanaged, its returns do not reflect any fees, expenses, or sales charges, and it is not available for direct investment.
Bloomberg Barclays U.S. Intermediate Government/Credit Bond Index
The Bloomberg Barclays U.S. Intermediate Government/Credit Bond Index measures U.S. investment grade government and corporate debt securities with an average maturity of 4 to 5 years. The index is calculated on a total return basis. The index is unmanaged, its returns do not reflect any fees, expenses, or sales charges, and is not available for direct investment.
BofA Merrill Lynch U.S. Municipal Securities Index
The BofA Merrill Lynch U.S. Municipal Securities Index tracks the performance of U.S. dollar denominated investment grade tax-exempt debt publicly issued by U.S. states and territories, and their political subdivisions, in the U.S. domestic market. The index is calculated on a total return basis. The index is unmanaged, its returns do not reflect any fees, expenses, or sales charges, and is not available for direct investment.
BofA Merrill Lynch 1–22 Year U.S. Municipal Securities Index
The BofA Merrill Lynch 1–22 Year U.S. Municipal Securities Index is a a subset of the BofA Merrill Lynch U.S. Municipal Securities Index including all securities with a remaining term to final maturity less than 22 years, calculated on a total return basis. The index is unmanaged, its returns do not reflect any fees, expenses, or sales charges, and is not available for direct investment.
Chicago Board Options Exchange (CBOE) Volatility Index
The Chicago Board Options Exchange (CBOE) Volatility Index (“VIX®”) shows the market’s expectation of 30-day volatility. It is constructed using the implied volatilities of a wide range of S&P 500® Index options. This volatility is meant to be forward looking and is calculated from both calls and puts. The VIX® is a widely used measure of market risk and is often referred to as the “investor fear gauge.” The index is unmanaged, its returns do not reflect any fees, expenses, or sales charges, and is not available for direct investment.
4
Table of Contents
VIRTUS OPPORTUNITIES TRUST
KEY INVESTMENT TERMS (Continued)
SEPTEMBER 30, 2016 (Unaudited)
CBOE S&P 500 Buywrite Index
The CBOE S&P 500 Buywrite Index is a passive total return index based on buying an S&P 500® stock index portfolio and “writing” (or selling) the nearterm S&P 500® Index (SPXSM) “covered” call option. The index is unmanaged, its returns do not reflect any fees, expenses, or sales charges, and is not available for direct investment.
Collateralized Loan Obligation (“CLO”)
A collateralized loan obligation is a type of security backed by a pool of debt, typically low-rated corporate loans, structured so that there are several classes of bondholders with varying maturities, called tranches.
European Central Bank (“ECB”)
The European Central Bank (ECB) is responsible for conducting monetary policy for the eurozone. The ECB was established as the core of the Eurosystem and the European System of Central Banks (ESCB). The ESCB comprises the ECB and the national central banks (NCBs) of all 17 European Union Member States whether they have adopted the Euro or not.
European Union (“EU”)
The European Union (“EU”) is a unique economic and political union of 28 European countries. The EU was created in the aftermath of the Second World War that has become a single market for goods and services and it created the single currency the euro.
Exchange-Traded Funds (ETF)
A Fund that is traded on a stock exchange. Most ETFs have a portfolio of stocks or bonds that track a specific market index.
Federal Reserve (the “Fed”)
The Central Bank of the United States, responsible for controlling the money supply, interest rates and credit with the goal of keeping the U.S. economy and currency stable. Governed by a seven-member board, the system includes 12 regional Federal Reserve Banks, 25 branches and all national and state banks that are part of the system.
Gross Domestic Product (“GDP”)
The market value of all officially recognized final goods and services produced within a country in a given period.
iShares®
Represents shares of an open-end exchange-traded fund.
London Interbank Offered Rate (LIBOR)
A benchmark rate that some of the world’s leading banks charge each other for short-term loans and that serves as the first step to calculating interest rates on various loans throughout the world.
Mergers and Acquisitions (M&A) Bond
An M&A bond is a type of corporate bond that is used to raise money for financing activities such as mergers and acquisitions.
MSCI EAFE® Index (net)
The MSCI EAFE® Index (net) is a free float-adjusted market capitalization-weighted index that measures developed foreign market equity performance, excluding the U.S. and Canada. The index is calculated on a total return basis with net dividends reinvested. The index is unmanaged, its returns do not reflect any fees, expenses, or sales charges, and is not available for direct investment.
MSCI Emerging Markets Index (net)
The MSCI Emerging Markets Index (net) is a free float-adjusted market capitalization-weighted index designed to measure equity market performance in the global emerging markets. The index is calculated on a total return basis with net dividends reinvested. The index is unmanaged, its returns do not reflect any fees, expenses, or sales charges, and is not available for direct investment.
MSCI World Index (net)
The MSCI World Index (net) is a free float-adjusted market capitalization-weighted index that measures developed global market equity performance. The index is calculated on a total return basis with net dividends reinvested. The index is unmanaged, its returns do not reflect any fees, expenses, or sales charges, and it is not available for direct investment.
5
Table of Contents
VIRTUS OPPORTUNITIES TRUST
KEY INVESTMENT TERMS (Continued)
SEPTEMBER 30, 2016 (Unaudited)
Organization of the Petroleum Exporting Countries (OPEC)
The Organization of the Petroleum Exporting Countries was originally organized in September 1960 with 5 member countries and there are currently 12 member countries. The organization’s objective is to co-ordinate and unify petroleum policies among member countries, in order to secure fair and stable prices for petroleum producers; an efficient, economic and regular supply of petroleum to consuming nations; and a fair return on capital to those investing in the industry.
Payment-in-Kind Security (PIK)
A bond which pays interest in the form of additional bonds, or preferred stock which pays dividends in the form of additional preferred stock.
Real Estate Investment Trust (REIT)
A publicly traded company that owns, develops and operates income-producing real estate such as apartments, office buildings, hotels, shopping centers and other commercial properties.
Russell 2000® Index
The Russell 2000® Index is a market capitalization-weighted index of the 2,000 smallest companies in the Russell Universe, which comprises the 3,000 largest U.S. companies. The index is calculated on a total return basis with dividends reinvested. The index is unmanaged, its returns do not reflect any fees, expenses, or sales charges, and is not available for direct investment.
S&P 100® Index
The S&P 100® Index, a sub-set of the S&P 500®, measures the performance of large-cap U.S. companies, and comprises 100 major, blue chip companies across multiple industry groups.
S&P 500® Index
The S&P 500® Index is a free-float market capitalization-weighted index of 500 of the largest U.S. companies. The index is calculated on a total return basis with dividends reinvested. The index is unmanaged, its returns do not reflect any fees, expenses, or sales charges, and it is not available for direct investment.
S&P Global Natural Resources Index (net)
The S&P Global Natural Resources Index (net) is a free-float market capitalization index calculated on a total return basis with net dividends reinvested. The index consists of 90 of the largest publicly traded companies in natural resources and commodities businesses that meet specific investability requirements, offering investors diversified and investable equity exposure across three primary commodity-related sectors: agribusiness, energy, and metals and mining. The index is unmanaged, its returns do not reflect any fees, expenses, or sales charges, and it is not available for direct investment.
S&P/LSTA Leveraged Loan Index
The S&P/LSTA Leveraged Loan Index is a daily total return index that uses LSTA/LPC Mark-to-Market Pricing (third-party research data on the price movements of senior secured floating rate loans in the secondary loan market) to calculate market value change. On a real-time basis, the Index tracks the current outstanding balance and spread over LIBOR for fully funded term loans. The facilities included in the Index represent a broad cross section of leveraged loans syndicated in the United States, including dollar-denominated loans to overseas issuers. The index is unmanaged, its returns do not reflect any fees, expenses, or sales charges and it is not available for direct investment.
Tax-Exempt Bond Linked Benchmark
The Tax-Exempt Bond Linked Benchmark consists of the BofA Merrill Lynch 1-22 Year US Municipal Securities Index, a subset of the BofA Merrill Lynch US Municipal Securities Index including all securities with a remaining term to final maturity less than 22 years, calculated on a total return basis. The index is unmanaged, its returns do not reflect any fees, expenses, or sales charges, and is not available for direct investment. Performance of the Tax- Exempt Bond Linked Benchmark prior to 6/30/2012 is that of the Barclays Municipal Bond Index.
When-issued and Forward Commitments (Delayed Delivery)
Securities purchased on a when-issued or forward commitment basis are also known as delayed delivery transactions. Delayed delivery transactions involve a commitment by a Fund to purchase or sell a security at a future date, ordinarily up to 90 days later. When-issued or forward commitments enable a Fund to lock in what is believed to be an attractive price or yield on a particular security for a period of time, regardless of future changes in interest rates.
6
Table of Contents
Fund Summary | Ticker Symbols: Class A: SAVAX Class B: SAVBX Class C: SAVCX Class I: SAVYX |
Portfolio Manager Commentary by Newfleet Asset Management, LLC
| ¢ | The Fund is diversified and has an investment objective of high total return from both current income and capital appreciation. |
| ¢ | For the fiscal year ended September 30, 2016, the Fund’s Class A shares at NAV returned 6.38%, Class B shares returned 5.47%, Class C shares returned 5.54%, and Class I shares returned 6.63%. For the same period, the Bloomberg Barclays U.S. Aggregate Bond Index, which serves as the broad-based and style-specific benchmark index appropriate for comparison, returned 5.19%. |
All performance figures assume reinvestment of distributions and exclude the effect of sales charges. Past performance is no guarantee of future results, and current performance may be higher or lower than the performance shown above.
How did the market perform during the Fund’s fiscal year?
| ¢ | Most fixed income spread sectors outperformed U.S. Treasuries during the fiscal year. The U.S. Federal Reserve’s (“the Fed”) dovish stance in mid-February sparked a rally that turned around a volatile time period that began with fresh concerns over China, plummeting oil prices, and fears that the Fed had raised interest rates too soon. |
| ¢ | Late in June volatility returned briefly with fallout from the U.K.’s unexpected decision to leave the European Union (“Brexit”). Bond yields in the U.S., Japan, and across Europe fell to historic lows in early July as investors fled to the safety of bonds on global growth concerns fueled by the June 23 Brexit vote. Markets recovered rather quickly however from the initial shock. Easing by major central banks and a weaker U.S. dollar helped to improve global risk sentiment and stabilize markets. |
| ¢ | September brought heightened concerns over the ability and willingness of global central banks to fight chronic low inflation and weak growth as the decision by the European Central Bank (“ECB”) to leave interest rates and its stimulus program unchanged was a precipitating factor in a widespread market sell-off, reinforced by fears that |
the Bank of Japan (“BOJ”) had run out of quantitative easing tools. Hawkish signals from the Fed added to the volatility. The BOJ subsequently decided not to reduce interest rates further but to shift its focus to stabilizing rates for longer maturity government bonds. This bolstered market sentiment, as did the Fed’s eventual decision to stand pat at its September monetary policy meeting. |
| ¢ | Over the last 12 months, U.S. Treasury yields increased for shorter maturity bonds while yields decreased for intermediate to longer term bonds. |
What factors affected the Fund’s performance during its fiscal year?
| ¢ | The underperformance of U.S. Treasuries relative to most fixed income spread sectors was the key driver of the Fund’s outperformance for the fiscal year. |
| ¢ | The Fund’s allocation to the corporate high yield sector and issue selection within corporate high quality bonds were the largest positive contributors to performance during the fiscal year. |
| ¢ | During the fiscal year, the Fund’s allocation to asset-backed securities detracted from performance. |
The preceding information is the opinion of portfolio management only through the end of the period stated on the cover. Any such opinions are subject to change at any time based upon market or other conditions and should not be relied upon as investment advice. Past performance is no guarantee of future results, and there is no guarantee that market forecasts will be realized.
There is no guarantee that the Fund will meet its objective.
Credit & Interest: Debt securities are subject to various risks, the most prominent of which are credit and interest rate risk. The issuer of a debt security may fail to make interest and/or principal payments. Values of debt securities may rise or fall in response to changes in interest rates, and this risk may be enhanced with longer-term maturities.
Foreign & Emerging Markets: Investing internationally, especially in emerging markets, involves additional risks such as currency, political, accounting, economic, and market risk.
ABS/MBS: Changes in interest rates can cause both extension and prepayment risks for asset- and mortgage-backed securities. These securities are also subject to risks associated with the repayment of underlying collateral.
High Yield-High Risk Fixed Income Securities: There is a greater level of credit risk and price volatility involved with high yield securities than investment grade securities.
Prospectus: For additional information on risks, please see the fund’s prospectus.
| Asset Allocation | ||||||||
| The following table presents asset allocations within certain sectors and as a percentage of total investments as of September 30, 2016. | ||||||||
Corporate Bonds and Notes | 47 | % | ||||||
Financials | 17 | % | ||||||
Consumer Discretionary | 6 | |||||||
Real Estate | 4 | |||||||
All other Corporate Bonds and Notes | 20 | |||||||
Mortgage-Backed Securities | 27 | |||||||
U.S. Government Securities | 7 | |||||||
Asset-Backed Securities | 5 | |||||||
Loan Agreements | 4 | |||||||
Preferred Stocks | 3 | |||||||
Other Investments | 7 | |||||||
|
| |||||||
Total | 100 | % | ||||||
|
| |||||||
For information regarding the indexes and certain investment terms, see the Key Investment Terms starting on page 4.
7
Table of Contents
Bond Fund (Continued)
| Average Annual Total Returns1 for periods ended 9/30/16 | ||||||||||||
| 1 year | 5 years | 10 years | ||||||||||
| Class A Shares at NAV2 | 6.38 | % | 4.29 | % | 5.04 | % | ||||||
| Class A Shares at POP3 | 2.39 | 3.50 | 4.64 | |||||||||
| Class B Shares at NAV2 | 5.47 | 3.50 | 4.24 | |||||||||
| Class B Shares with CDSC4 | 1.47 | 3.50 | 4.24 | |||||||||
| Class C Shares at NAV2 | 5.54 | 3.52 | 4.25 | |||||||||
| Class I Shares at NAV | 6.63 | 4.57 | 5.31 | |||||||||
| Bloomberg Barclays U.S. Aggregate Bond Index | 5.19 | 3.08 | 4.79 | |||||||||
Fund Expense Ratios5: A Shares: Gross 1.13%, Net 0.86%; B Shares: Gross 1.88%, Net 1.61%; C Shares: Gross 1.88%, Net 1.61%; I Shares: Gross 0.88%, Net 0.61%.
All returns represent past performance which is no guarantee of future results. Current performance may be higher or lower than the performance shown. The investment return and principal value of an investment will fluctuate so that an investor’s shares, when redeemed, may be worth more or less than their original cost. The above table and graph below do not reflect the deduction of taxes that a shareholder would pay on fund distributions or the redemption of shares. Please visit Virtus.com for performance data current to the most recent month-end.
| 1 | Total returns are historical and include changes in share price and the reinvestment of both dividends and capital gains distributions. |
| 2 | “NAV” (Net Asset Value) total returns do not include the effect of any sales charge. |
| 3 | “POP” (Public Offering Price) total returns include the effect of the maximum front-end 3.75% sales charge. |
| 4 | “CDSC” (Contingent Deferred Sales Charge) is applied to redemptions of certain classes of shares that do not have a sales charge applied at the time of purchase. CDSC charges for B shares decline from 5% to 0% over a five-year period. CDSC charges for certain redemptions of Class A shares made within 18 months of purchase in which a finder’s fee was paid and all redemptions of Class C shares within the first year are 1% and 0% thereafter. |
| 5 | The expense ratios of the Fund are set forth according to the prospectus for the Fund effective January 28, 2016, as supplemented and revised, and may differ from the expense ratios disclosed in the Financial Highlights tables in this report. See the Financial Highlights for more current expense ratios. Net Expense: Expenses reduced by contractual fee waiver in effect through January 31, 2017. Gross Expense: Does not reflect the effect of the fee waiver. Expense ratios include fees and expenses associated with underlying funds. |
Growth of $10,000 For periods ended 9/30
This chart assumes an initial investment of $10,000 made on September 30, 2006, for Class A, Class B, Class C, and Class I shares including any applicable sales charges or fees. Performance assumes reinvestment of dividends and capital gain distributions.
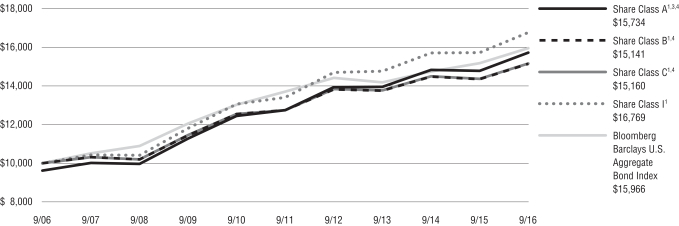
The indexes are unmanaged and not available for direct investment; therefore, their performance does not reflect the expenses associated with active management of an actual portfolio.
For information regarding the indexes and certain investment terms, see the Key Investment Terms starting on page 4.
8
Table of Contents
Fund Summary | Ticker Symbols: Class A: CTESX Class I: CTXEX |
Portfolio Manager Commentary by Newfleet Asset Management, LLC
| ¢ | The Fund is diversified and has an investment objective of obtaining a high level of current income exempt from California state and local income taxes, as well as federal income tax, consistent with the preservation of capital. |
| ¢ | For the fiscal year ended September 30, 2016, the Fund’s Class A shares at NAV returned 5.56% and Class I shares returned 5.83%. For the same period, the Bloomberg Barclays U.S. Aggregate Bond Index, a broad-based fixed income index, returned 5.19%, and the Bloomberg Barclays California Municipal Bond Index, the Fund’s style-specific benchmark appropriate for comparison, returned 5.45%. |
All performance figures assume reinvestment of distributions and exclude the effect of sales charges. Past performance is no guarantee of future results, and current performance may be higher or lower than the performance shown above.
How did the markets perform during the Fund’s fiscal year?
The municipal bond market experienced solid performance over the 12 months ended September 30, 2016, as tax-free interest rates declined and credit risk spreads narrowed. The market’s technical conditions (supply and demand) remained strong for much of the period, with investors continuing to pour money into open-end municipal bond mutual funds and new issuance of municipal bonds mostly manageable despite interest rates hovering near generational low levels. However, the technical support weakened somewhat as the end of September approached. U.S. Treasury yields began to rise and tax-free interest rates followed, as the market priced in a higher probability of a rate hike by the Federal Reserve (“the Fed”). At the same time, municipal bond supply increased as municipalities issued bonds to get ahead of potential Fed rate hikes and perhaps to catch up on issuance delayed as a result of disruptions related to the U.K.’s “Brexit” vote in late June. The markets also were receptive to lower-rated credits as investors reached for yield across all areas of the fixed income market. As a result of the rise in yields and surge in supply, municipal bond performance turned negative for the first time in over a year.
The municipal market was otherwise resilient in the face of a number of market events and conditions, including repercussions from the U.K.’s surprising Brexit vote outcome; Puerto Rico’s default on its general obligation bonds and select public corporations; oil price volatility; the increasing and decreasing probabilities of a Fed rate hike; the U.S. presidential election; and the problems surrounding underfunded pension plans across the country. Aside from Puerto Rico, defaults have been very low in the municipal bond sector.
Demand for municipal bonds continued unabated, with 52 consecutive weeks of inflows into municipal bond mutual funds totaling over $50 billion. While long-term funds represented the bulk of the assets in terms of flows, the highest percentage increase of assets under management occurred among high yield funds. Though interrupted by the recent increase in supply, strong technicals have been the driving factor in the municipal market’s strength.
The economy continued to expand during the period, but the slow pace of growth continued to have an adverse effect on state budgets. State and local sales tax growth remained positive, but showed signs of slowing. Personal tax collections in the second quarter of 2016 grew by only 1.8% year-over-year, according to the Rockefeller Institute. Local property taxes, however, continued to benefit from an improving housing market and home prices.
By far, the largest challenge to the municipal credit remained the extent of underfunded pension obligations. Pension funds across the country have been struggling to meet assumed rates of return in the current low interest rate/stagnant stock market environment. As an example of a particularly serious situation, the California Public Employees’ Retirement System (“CALPERS”) reported a 0.6% return in its last fiscal year, far short of an assumed rate of return of 7.5%. The impact of lower-than-expected returns on pension funding levels has increased the stress on municipal budgets to increase annual contributions and divert funds from other spending.
What factors affected the Fund’s performance during its fiscal year?
Over the past 12 months, the market’s best performers were longer duration, lower coupon, and lower credit quality bonds as interest rates declined beyond five years and risk premiums narrowed.
While they still produced positive performance, bonds with shorter maturities, lower duration, and higher credit quality displayed relatively weaker performance for most of the year.
The Fund’s performance relative to the benchmark benefited from exposure to bonds with long maturities, lower-rated securities (including below-investment grade-rated bonds), and lower coupon securities. The Fund’s relative performance was negatively impacted by exposure to short-term maturities, higher coupons, better quality, and pre-refunded bonds.
The preceding information is the opinion of portfolio management only through the end of the period stated on the cover. Any such opinions are subject to change at any time based upon market or other conditions and should not be relied upon as investment advice. Past performance is no guarantee of future results, and there is no guarantee that market forecasts will be realized.
There is no guarantee that the Fund will meet its objective.
Credit & Interest: Debt securities are subject to various risks, the most prominent of which are credit and interest rate risk. The issuer of a debt security may fail to make interest and/or principal payments. Values of debt securities may rise or fall in response to changes in interest rates, and this risk may be enhanced with longer-term maturities.
Geographic Concentration: A fund that focuses its investments in a particular geographic location will be highly sensitive to financial, economic, political, and other developments affecting the fiscal stability of that location.
Municipal Market: Events negatively impacting a municipal security, or the municipal bond market in general, may cause the fund to decrease in value.
State & AMT Tax: A portion of income may be subject to some state and/or local taxes and, for certain investors, a portion may be subject to the federal alternative minimum tax.
High Yield-High Risk Fixed Income Securities: There is a greater level of credit risk and price volatility involved with high yield securities than investment grade securities.
For information regarding the indexes and certain investment terms, see the Key Investment Terms starting on page 4.
9
Table of Contents
| CA Tax-Exempt Bond Fund (Continued) |
Prospectus: For additional information on risks, please see the fund’s prospectus.
| Asset Allocation | ||||||||
The following table presents asset allocations within certain sectors and as a percentage of total investments as of September 30, 2016.
|
| |||||||
Tax-Exempt Municipal Bonds | 100 | % | ||||||
Pre-Refunded | 15 | % | ||||||
General Obligation | 13 | |||||||
Development Revenue | 13 | |||||||
Water & Sewer Revenue | 11 | |||||||
Lease Revenue | 10 | |||||||
General Revenue | 9 | |||||||
Medical Revenue | 8 | |||||||
Other | 21 | |||||||
|
| |||||||
Total | 100 | % | ||||||
|
| |||||||
For information regarding the indexes and certain investment terms, see the Key Investment Terms starting on page 4.
10
Table of Contents
CA Tax-Exempt Bond Fund (Continued)
| Average Annual Total Returns1 for periods ended 9/30/16 | ||||||||||||
| 1 year | 5 years | 10 years | ||||||||||
| Class A Shares at NAV2 | 5.56 | % | 5.00 | % | 4.48 | % | ||||||
| Class A Shares at POP3,4 | 2.66 | 4.42 | 4.19 | |||||||||
| Class I Shares at NAV | 5.83 | 5.25 | 4.74 | |||||||||
| Bloomberg Barclays U.S. Aggregate Bond Index | 5.19 | 3.08 | 4.79 | |||||||||
| Bloomberg Barclays California Municipal Bond Index | 5.45 | 5.17 | 4.98 | |||||||||
Fund Expense Ratios5: A Shares: Gross 1.18%, Net 0.85%; I Shares: Gross 0.93%, Net 0.60%.
All returns represent past performance which is no guarantee of future results. Current performance may be higher or lower than the performance shown. The investment return and principal value of an investment will fluctuate so that an investor’s shares, when redeemed, may be worth more or less than their original cost. The above table and graph below do not reflect the deduction of taxes that a shareholder would pay on fund distributions or the redemption of shares. Please visit Virtus.com for performance data current to the most recent month-end.
| 1 | Total returns are historical and include changes in share price and the reinvestment of both dividends and capital gains distributions. |
| 2 | “NAV” (Net Asset Value) total returns do not include the effect of any sales charge. |
| 3 | “POP” (Public Offering Price) total returns include the effect of the maximum front-end 2.75% sales charge. |
| 4 | “CDSC” (Contingent Deferred Sales Charge) is applied to redemptions of certain classes of shares that do not have a sales charge applied at the time of purchase. CDSC charges for certain redemptions of Class A shares made within 18 months of purchase in which a finder’s fee was paid are 1% and 0% thereafter. |
| 5 | The expense ratios of the Fund are set forth according to the prospectus for the Fund effective January 28, 2016, as supplemented and revised, and may differ from the expense ratios disclosed in the Financial Highlights tables in this report. See the Financial Highlights for more current expense ratios. Net Expense: Expenses reduced by contractual fee waiver in effect through January 31, 2017. Gross Expense: Does not reflect the effect of the fee waiver. |
Growth of $10,000 For periods ended 9/30
This chart assumes an initial investment of $10,000 made on September 30, 2006 for Class A and Class I shares including any applicable sales charges or fees. Performance assumes reinvestment of dividends and capital gain distributions.
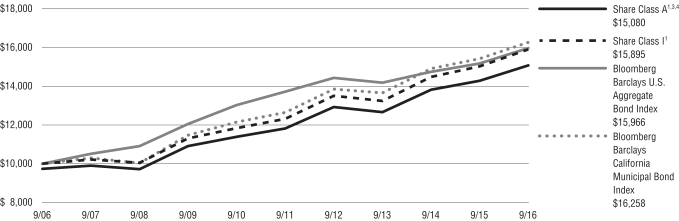
The indexes are unmanaged and not available for direct investment; therefore, their performance does not reflect the expenses associated with active management of an actual portfolio.
For information regarding the indexes and certain investment terms, see the Key Investment Terms starting on page 4.
11
Table of Contents
Fund Summary | Ticker Symbols: Class A: VERAX Class C: VERCX Class I: VERIX |
Portfolio Manager Commentary by KBI Global Investors (North America) Ltd.
| ¢ | The Fund is diversified and has an investment objective of capital appreciation. |
| ¢ | For the fiscal year ended September 30, 2016, the Fund’s Class A shares at NAV returned 12.93%, Class C shares returned 12.07%, and Class I shares returned 13.27%. For the same period, the S&P 500® Index, a broad-based fixed equity index, returned 15.43% and the S&P Global Natural Resources Index (net) the Fund’s style-specific benchmark appropriate for comparison returned 23.89%. |
All performance figures assume reinvestment of distributions and exclude the effect of sales charges. Past performance is no guarantee of future results, and current performance may be higher or lower than the performance shown above.
How did the markets perform during the Fund’s fiscal year?
During the Fund’s fiscal year, global stock markets made strong gains, bond yields continued to trend lower, and commodity prices were generally higher. The S&P Global Natural Resources Index returned a stellar 23.89% (net), in U.S. dollars (USD), outperforming the MSCI World Index (net) (+11.4% net, in USD) by a significant margin.
The extraordinary easy monetary policy being pursued by central banks globally since 2008 continued throughout the period. More recently, this journey has resulted in increasingly negative interest rates and bond yields around the globe. Indeed, the decision of the U.S. Federal Reserve to raise interest rates last December, even if repeated in coming months, is looking more and more like an anomaly in this overall context. Low rates and yields have become the new normal. Emerging markets have proven to be particular beneficiaries. A generally better tone for commodity prices and better-than-feared data from China also helped emerging market equities to outperform during the period.
The announcement in late September from oil cartel OPEC that it would scale back production later this year helped oil prices rally towards $50 a barrel. Latin America benefited in particular from strong gains in
Brazil. Growing expectations of improved earnings and economic growth continued to support the recovery there.
What factors affected the Fund’s performance during its fiscal year?
The Fund underperformed the S&P Global Natural Resources Index during the fiscal year ended September 30, 2016. Sector allocation was important as there is a high degree of difference between the composition of the Fund and the Index, both at the sector and stock levels. The Index had a high exposure to energy stocks (roughly 29%), which benefited from a very strong run due to rising oil prices, while the Fund had only 2% in energy stocks and zero exposure to oil stocks. The Index also had a large weighting in the materials sector (about 65%), which benefited from a rebound in mining and gold names. These stocks of extractive industries which the Fund did not hold. In terms of positive contributors, the Fund had positive stock selection in the consumer staples sector, and a larger exposure to this sector than the Index.
Water was the best performing sector for the Fund, both on a relative and absolute basis, followed by energy solutions. The agribusiness sector was the poorest performer. The Fund remained broadly equally weighted to the water, energy solutions, and agribusiness sectors, allowing for market movements.
Cyclical stocks came back into favor in 2016 as relatively cheap valuations saw value-oriented names outperform the growth stocks that had previously seen a lot of momentum. Company earnings over the period were also more in line with expectations and this provided support for many of our water-related stocks, particularly in instances where there was less certainty in the lead-up to results. The utility segment was a strong performer in the period due to its defensive nature as significant political and macro uncertainty provided momentum. The infrastructure segment also saw strong performance, particularly in the second half of the period, as our most cyclical segment benefited from the outperformance of stocks with more cyclical end markets.
The preceding information is the opinion of portfolio management only through the end of the period stated on the cover. Any such opinions are subject to
change at any time based upon market or other conditions and should not be relied upon as investment advice. Past performance is no guarantee of future results and there is no guarantee market forecasts will be realized.
There is no guarantee that the Fund will meet its objectives.
Equity Securities: The market price of equity securities may be adversely affected by financial market, industry, or issuer-specific events. Focus on a particular style or on small or medium-sized companies may enhance that risk.
Foreign & Emerging Markets: Investing internationally, especially in emerging markets, involves additional risks such as currency, political, accounting, economic, and market risk.
Industry/Sector Concentration: A fund that focuses its investments in a particular industry or sector will be more sensitive to conditions that affect that industry or sector than a non-concentrated fund.
Prospectus: For additional information on risks, please see the fund’s prospectus.
| Asset Allocation | ||||
The following table presents asset allocations within certain sectors and as a percentage of total investments as of September 30, 2016.
|
| |||
Industrials | 27 | % | ||
Consumer Staples | 16 | |||
Utilities | 16 | |||
Materials | 14 | |||
Information Technology | 8 | |||
Consumer Discretionary | 7 | |||
Financials | 4 | |||
Other | 8 | |||
|
| |||
Total | 100 | % | ||
|
| |||
For information regarding the indexes and certain investment terms, see the Key Investment Terms starting on page 4.
12
Table of Contents
Essential Resources Fund (Continued)
| Average Annual Total Returns1 for periods ended 9/30/16 | ||||||||||||
| 1 year | Since Inception | Inception Date | ||||||||||
| Class A Shares at NAV2 | 12.93 | % | -6.14 | % | 3/24/15 | |||||||
| Class A Shares at POP3,4 | 6.44 | -9.72 | 3/24/15 | |||||||||
| Class C Shares at NAV2 and with CDSC4 | 12.07 | -6.84 | 3/24/15 | |||||||||
| Class I Shares at NAV2 | 13.27 | -5.88 | 3/24/15 | |||||||||
| S&P 500® Index | 15.43 | 4.62 | 5 | — | ||||||||
| S&P Global Natural Resources Index (net) | 23.89 | -4.13 | 5 | — | ||||||||
Fund Expense Ratios6: A Shares: Gross 6.27%, Net 1.66%; C Shares: Gross 7.02%, Net 2.41%; I Shares: Gross 6.02%, Net 1.41%.
All returns represent past performance which is no guarantee of future results. Current performance may be higher or lower than the performance shown. The investment return and principal value of an investment will fluctuate so that an investor’s shares, when redeemed, may be worth more or less than their original cost. The above table and graph below do not reflect the deduction of taxes that a shareholder would pay on fund distributions or the redemption of shares. Please visit Virtus.com for performance data current to the most recent month-end.
| 1 | Total returns are historical and include changes in share price and the reinvestment of both dividends and capital gains distributions. |
| 2 | “NAV” (Net Asset Value) total returns do not include the effect of any sales charge. |
| 3 | “POP” (Public Offering Price) total returns include the effect of the maximum front-end 5.75% sales charge. |
| 4 | “CDSC” (Contingent Deferred Sales Charge) is applied to redemptions of certain classes of shares that do not have a sales charge applied at the time of purchase. CDSC charges for certain redemptions of Class A shares made within 18 months of purchase in which a finder’s fee was paid and all redemptions of Class C shares within the first year are 1% and 0% thereafter. |
| 5 | The since inception index returns are from the Fund’s inception date. |
| 6 | The expense ratios of the Fund are set forth according to the prospectus for the Fund effective January 28, 2016, as supplemented and revised and may differ from the expense ratios disclosed in the Financial Highlights tables in this report. See the Financial Highlights for more current expense ratios. Net Expense: Expenses reduced by a contractual fee waiver in effect through January 31, 2017. Gross Expense: Does not reflect the effect of the fee waiver. Expense ratios include fees and expenses associated with underlying funds. |
Growth of $10,000 For periods ended 9/30
This chart assumes an initial investment of $10,000 made on March 24, 2015 (inception date of the Fund) for Class A, Class C, and Class I shares including any applicable sales charges or fees. Performance assumes reinvestment of dividends and capital gain distributions.

The indexes are unmanaged and not available for direct investment; therefore, their performance does not reflect the expenses associated with active management of an actual portfolio.
For information regarding the indexes and certain investment terms, see the Key Investment Terms starting on page 4.
13
Table of Contents
Fund Summary | Ticker Symbols: Class A: PHCHX Class B: PHCCX Class C: PGHCX Class I: PHCIX |
Portfolio Manager Commentary by Newfleet Asset Management, LLC
| ¢ | The Fund is diversified and has a primary investment objective of high current income and a secondary objective of capital growth. |
| ¢ | For the fiscal year ended September 30, 2016, the Fund’s Class A shares at NAV returned 10.59%, Class B shares returned 9.52%, and Class C shares returned 9.68%. Class I shares returned 10.86%. For the same period, the Bloomberg Barclays U.S. Aggregate Bond Index, a broad-based fixed income index, returned 5.19%, and the Bloomberg Barclays U.S. High-Yield 2% Issuer Capped Bond Index, the Fund‘s style-specific index appropriate for comparison, returned 12.74%. |
All performance figures assume reinvestment of distributions and exclude the effect of sales charges. Past performance is no guarantee of future results, and current performance may be higher or lower than the performance shown above.
How did the market perform during the Fund’s fiscal year?
The U.S. high yield market, as measured by the Bloomberg Barclays U.S. High-Yield 2% Issuer Capped Bond Index, posted a 12.74% return for the fiscal year ended September 30, 2016. There was a sharp contrast in performance between the first quarter and the rest of the fiscal year. Heightened concerns over China’s slowdown and its adverse impact on commodity prices and currencies weighed heavily on the high yield sector from October to December 2015, producing a negative result. The energy and metals & mining industries led the sector down with double-digit negative returns, but other favorably-viewed industries followed them into negative territory. The turbulence continued into January and early February. The Federal Reserve’s dovish tone in mid-February, however, sparked a rally and a demand for risk assets that continued almost unabated for the rest of the year. As of September 30, the high yield sector had posted eight consecutive months of positive returns.
The steep recovery of the energy and metals & mining industry groups within the high yield benchmark index best accounts for the strength in the high yield market over the fiscal year. For the first
nine months of 2016, metals & mining gained 41.1%; for the last 12 months, which includes the negative performance from October to December 2015, the gain was 27.7%. The nine- and 12-month returns for energy were 29.81% and 13.09%, respectively, but the strong performance of the high yield sector really began February 11 with the Index returning 21.37%, while the underlying metals & mining and energy industries returned 48.51%, and 60.40%, respectively, from that point until the end of the fiscal year.
The returns across the rating spectrum demonstrated the effect of easy global monetary policy and the lack of viable income alternatives. As investors reached for yield, the lower credit tiers outperformed, as measured by the high yield benchmark index, with CCCs, Bs, and BBs returning 25.55%, 13.52%, and 12.29% over the last nine months, and 16.12%, 11.29%, and 12.13% for the full fiscal year, respectively.
Fundamentals have weakened, particularly in the energy and metals & mining industries. As is consistent with the later stages of the credit cycle, leverage has crept up, cash as a percentage of debt has decreased, and the default rate has continued to climb. The default rate rose to 5.4% as of the end of the Fund’s fiscal year.
From a technical perspective, the high yield sector experienced considerable outflows during October to December 2015. A dramatic reversal occurred in mid-February and flows were mostly positive after that watershed event. Similarly, initially anemic issuance turned robust over the last three quarters of the fiscal year.
What factors affected the Fund’s performance during its fiscal year?
The positive performance of the U.S. high yield market contributed to the Fund’s positive return during the year.
The top contributors to the Fund’s performance during the year were issue selection, as well as some of our conscious overweights and underweights within certain industries. In particular, the portfolio benefited from issue selection within the cable-satellite, wireline, and supermarket industries, and our allocations to gaming and banking. Our allocation
and issue selection to electric utilities was also additive to performance.
A primary detractor from performance was higher quality bias. Our underweight to the energy and metals & mining industries helped performance early in the year. However, our relatively lower risk positioning held the Fund back after the mid-February rally. We added some risk to the portfolio and brought up our energy and metals & mining weightings, but we did not chase yields in the most downtrodden areas of the high yield sector where the bulk of performance occurred.
The preceding information is the opinion of portfolio management only through the end of the period stated on the cover. Any such opinions are subject to change at any time based upon market or other conditions and should not be relied upon as investment advice. Past performance is no guarantee of future results, and there is no guarantee that market forecasts will be realized.
There is no guarantee that the Fund will meet its objectives.
Credit & Interest: Debt securities are subject to various risks, the most prominent of which are credit and interest rate risk. The issuer of a debt security may fail to make interest and/or principal payments. Values of debt securities may rise or fall in response to changes in interest rates, and this risk may be enhanced with longer-term maturities.
High Yield-High Risk Fixed Income Securities: There is a greater level of credit risk and price volatility involved with high yield securities than investment grade securities.
Foreign Investing: Investing internationally involves additional risks such as currency, political, accounting, economic, and market risk.
Industry/Sector Concentration: A fund that focuses its investments in a particular industry or sector will be more sensitive to conditions that affect that industry or sector than a non-concentrated fund.
Prospectus: For additional information on risks, please see the fund’s prospectus.
For information regarding the indexes and certain investment terms, see the Key Investment Terms starting on page 4.
14
Table of Contents
| High Yield Fund (Continued) |
| Asset Allocation | ||||||||
The following table presents asset allocations within certain sectors as a percentage of total investments as of September 30, 2016.
|
| |||||||
Corporate Bonds and Notes | 82 | % | ||||||
Consumer Discretionary | 22 | % | ||||||
Energy | 13 | |||||||
Health Care | 11 | |||||||
Materials | 9 | |||||||
Telecommunication Services | 7 | |||||||
Financials | 6 | |||||||
Industrials | 6 | |||||||
All other Corporate Bonds and Notes | 8 | |||||||
Loan Agreements | 10 | |||||||
Other (includes short-term investments) | 8 | |||||||
|
| |||||||
Total | 100 | % | ||||||
|
| |||||||
For information regarding the indexes and certain investment terms, see the Key Investment Terms starting on page 4.
15
Table of Contents
High Yield Fund (Continued)
| Average Annual Total Returns1 for periods ended 9/30/16 | ||||||||||||||||||||
| 1 year | 5 years | 10 years | Since Inception | Inception Date | ||||||||||||||||
| Class A Shares at NAV2 | 10.59 | % | 7.73 | % | 5.33 | % | — | — | ||||||||||||
| Class A Shares at POP3,4 | 6.44 | 6.91 | 4.93 | — | — | |||||||||||||||
| Class B Shares at NAV2 | 9.52 | 6.91 | 4.54 | — | — | |||||||||||||||
| Class B Shares with CDSC4 | 5.52 | 6.91 | 4.54 | — | — | |||||||||||||||
| Class C Shares at NAV2 and with CDSC4 | 9.68 | 6.94 | 4.57 | — | — | |||||||||||||||
| Class I Shares at NAV2 | 10.86 | — | — | 5.71 | % | 8/8/12 | ||||||||||||||
| Bloomberg Barclays U.S. Aggregate Bond Index | 5.19 | 3.08 | 4.79 | 2.64 | 5 | — | ||||||||||||||
| Bloomberg Barclays U.S. High-Yield 2% Issuer Capped Bond Index | 12.74 | 8.34 | 7.80 | 6.02 | 5 | — | ||||||||||||||
Fund Expense Ratios6: A Shares: Gross 1.33%, Net 1.16% B Shares: Gross 2.08%, Net 1.91% C Shares: Gross 2.08%, Net 1.91% Class I: Gross 1.08% Net 0.91%.
All returns represent past performance which is no guarantee of future results. Current performance may be higher or lower than the performance shown. The investment return and principal value of an investment will fluctuate so that an investor’s shares, when redeemed, may be worth more or less than their original cost. The above table and graph below do not reflect the deduction of taxes that a shareholder would pay on fund distributions or the redemption of shares. Please visit Virtus.com for performance data current to the most recent month-end.
| 1 | Total returns are historical and include changes in share price and the reinvestment of both dividends and capital gains distributions. |
| 2 | “NAV” (Net Asset Value) total returns do not include the effect of any sales charge. |
| 3 | “POP” (Public Offering Price) total returns include the effect of the maximum front-end 3.75% sales charge. |
| 4 | “CDSC” (Contingent Deferred Sales Charge) is applied to redemptions of certain classes of shares that do not have a sales charge applied at the time of purchase. CDSC charges for B shares decline from 5% to 0% over a five-year period. CDSC charges for certain redemptions of Class A shares made within 18 months of purchase in which a finder’s fee was paid and all redemptions of Class C shares within the first year are 1% and 0% thereafter. |
| 5 | The since inception index returns are from the inception date of Class I. |
| 6 | The expense ratios of the Fund are set forth according to the prospectus for the Fund effective January 28, 2016, as supplemented and revised, and may differ from the expense ratios disclosed in the Financial Highlights tables in this report. See the Financial Highlights for more current expense ratios. Net Expense: Expenses reduced by contractual fee waiver in effect through January 31, 2017. Gross Expense: Does not reflect the effect of the fee waiver. Expense ratios include fees and expenses associated with underlying funds. |
Growth of $10,000 For periods ended 9/30
This chart assumes an initial investment of $10,000 made on September 30, 2006, for Class A, Class B, and Class C shares including any applicable sales charges or fees. Performance assumes reinvestment of dividends and capital gain distributions.
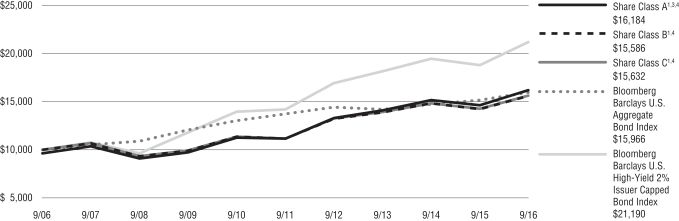
The indexes are unmanaged and not available for direct investment; therefore, their performance does not reflect the expenses associated with active management of an actual portfolio.
For information regarding the indexes and certain investment terms, see the Key Investment Terms starting on page 4.
16
Table of Contents
Fund Summary | Ticker Symbols: A Share: HIMZX C Share: PCMZX I Share: HIBIX |
Portfolio Manager Commentary by Newfleet Asset Management, LLC
| ¢ | The Fund is diversified and has an investment objective to provide a high level of total return, including a competitive level of current income, while limiting fluctuations in net asset value due to changes in interest rates. |
| Effective September 23, 2016, the Virtus Low Duration Fund was reorganized as a series of Virtus Opportunities Trust and its fiscal year end changed from December 31 to September 30. As a result, the commentary addresses nine months of performance through September 30. |
| ¢ | For the fiscal period January 1, 2016, through September 30, 2016, the Fund’s Class A shares at NAV returned 3.25%*, Class C shares at NAV returned 2.67%* and Class I shares at NAV returned 3.44%*. For the same period, the Bloomberg Barclays U.S. Aggregate Bond Index, a broad-based fixed income index, returned 5.80%* and the Bloomberg Barclays U.S. Intermediate Government/Credit Bond Index, which is the Fund’s style-specific benchmark appropriate for comparison, returned 4.23%*. |
| * | Returns less than 1 year are not annualized. |
All performance figures assume reinvestment of distributions and exclude the effect of sales charges. Past performance is no guarantee of future results, and current performance may be higher or lower than the performance shown above.
How did the market perform during the Fund’s nine- month fiscal period?
| ¢ | Most fixed income spread sectors outperformed U.S. Treasuries during the nine months ended September 30, 2016. The U.S. Federal Reserve’s (“the Fed”) dovish stance in mid-February sparked a rally that turned around a volatile time period that began with fresh concerns over China, plummeting oil prices, and fears that the Fed had raised interest rates too soon. |
| ¢ | Late in June volatility returned briefly with fallout from the U.K.’s unexpected decision to leave the European Union (“Brexit”). Bond yields in the U.S., Japan, and across Europe fell to historic lows in early July as investors fled to the safety of bonds |
on global growth concerns fueled by the June 23 Brexit vote. Markets recovered rather quickly, however, from the initial shock. Easing by major central banks and a weaker U.S. dollar helped to improve global risk sentiment and stabilize markets. |
| ¢ | September brought heightened concerns over the ability and willingness of global central banks to fight chronic low inflation and weak growth as the decision by the European Central Bank (“ECB”) to leave interest rates and its stimulus program unchanged was a precipitating factor in a widespread market sell-off, reinforced by fears that the Bank of Japan (“BOJ”) had run out of quantitative easing tools. Hawkish signals from the Fed added to the volatility. The BOJ subsequently decided not to reduce interest rates further but to shift its focus to stabilizing rates for longer maturity government bonds. This bolstered market sentiment, as did the Fed’s eventual decision to stand pat at its September monetary policy meeting. |
| ¢ | Over the last nine months, yields largely decreased for both shorter maturity and longer term U.S. Treasury bonds. |
What factors affected the Fund’s performance during the Fund’s nine-month fiscal period?
| ¢ | The underperformance of U.S. Treasuries relative to most fixed income spread sectors was the key driver of the Fund’s positive performance for the nine months ended September 30, 2016. |
| ¢ | The Fund’s allocation to corporate high yield securities was the largest positive contributor to performance during the nine month period. |
| ¢ | During the nine month period, the Fund’s allocation to asset-backed securities detracted from performance. |
The preceding information is the opinion of portfolio management only through the end of the period of the report as stated on the cover. Any such opinions are subject to change at any time based upon market or other conditions and should not be relied upon as investment advice.
There is no guarantee that the Fund will meet its objective.
ABS/MBS: Changes in interest rates can cause both extension and prepayment risks for asset- and mortgage-backed securities. These securities are also subject to risks associated with the repayment of underlying collateral.
Credit & Interest: Debt securities are subject to various risks, the most prominent of which are credit and interest rate risk. The issuer of a debt security may fail to make interest and/or principal payments. Values of debt securities may rise or fall in response to changes in interest rates, and this risk may be enhanced with longer-term maturities.
Foreign & Emerging Markets: Investing internationally, especially in emerging markets, involves additional risks such as currency, political, accounting, economic, and market risk.
High Yield-High Risk Fixed Income Securities: There is a greater level of credit risk and price volatility involved with high yield securities than investment grade securities.
Prospectus: For additional information on risks, please see the fund’s prospectus.
| Asset Allocation | ||||||||
The following table presents asset allocations within certain sectors as a percentage of total investments at September 30, 2016.
|
| |||||||
Mortgage-Backed Securities | 41 | % | ||||||
Asset-Backed Securities | 24 | |||||||
Corporate Bonds and Notes | 18 | |||||||
Financials | 7 | % | ||||||
Industrials | 2 | |||||||
Health Care | 2 | |||||||
Total of all others | 7 | |||||||
U.S. Government Securities | 10 | |||||||
Loan Agreements | 4 | |||||||
Other | 3 | |||||||
|
| |||||||
Total |
| 100 | % | |||||
|
| |||||||
For information regarding the indexes and certain investment terms, see the Key Investment Terms starting on page 4.
17
Table of Contents
Low Duration Income Fund (Continued)
| Average Annual Total Returns1 for periods ended 9/30/16 | ||||||||||||
| 1 year | 5 years | 10 years | ||||||||||
| Class A Shares at NAV2 | 2.78 | % | 2.71 | % | 3.82 | % | ||||||
| Class A Shares at POP3,4 | 0.47 | 2.24 | 3.58 | |||||||||
| Class C Shares at NAV2 and CDSC4 | 2.01 | 1.94 | 3.05 | |||||||||
| Class I Shares at NAV2 | 3.14 | 2.97 | 4.08 | |||||||||
| Bloomberg Barclays U.S. Aggregate Bond Index | 5.19 | 3.08 | 4.79 | |||||||||
| Bloomberg Barclays U.S. Intermediate Government/Credit Bond Index | 3.52 | 2.45 | 4.17 | |||||||||
Fund Expense Ratios5: A Shares: Gross 1.12%, Net 0.75%; C Shares: Gross 1.872%, Net 1.50%; I Shares: Gross 0.872%, Net 0.50%.
All returns represent past performance which is no guarantee of future results. Current performance may be higher or lower than the performance shown. The investment return and principal value of an investment will fluctuate so that an investor’s shares, when redeemed, may be worth more or less than their original cost. The above table and graph below do not reflect the deduction of taxes that a shareholder would pay on fund distributions or the redemption of shares. Please visit Virtus.com for performance data current to the most recent month-end.
| 1 | Total returns are historical and include changes in share price and the reinvestment of both dividends and capital gains distributions. |
| 2 | “NAV” (Net Asset Value) total returns do not include the effect of any sales charge. |
| 3 | “POP” (Public Offering Price) total returns include the effect of the maximum front-end 2.25% sales charge. |
| 4 | “CDSC” (Contingent Deferred Sales Charge) is applied to redemptions of certain classes of shares that do not have a sales charge applied at the time of purchase. CDSC charges for C shares are 1% in the first year and 0% thereafter. CDSC charges for certain redemptions of Class A shares are 1% within the first year and 0% thereafter. |
| 5 | The expense ratios of the Fund, both net and gross, are set forth according to the prospectus for the Fund effective September 23, 2016, as supplemented and revised, and may differ from the expense ratios disclosed in the Financial Highlights tables in this report. See the Financial Highlights for more current expense ratios. Net Expenses: Expenses reduced by a contractual fee waiver in effect through September 30, 2017. Gross Expenses: Do not reflect the effect of contractual fee waiver. |
Growth of $10,000 For periods ended 9/30
This chart assumes an initial investment of $10,000 made on September 30, 2006, for Class A, Class C and Class I shares including any applicable sales charges or fees. Performance assumes reinvestment of dividends and capital gain distributions.
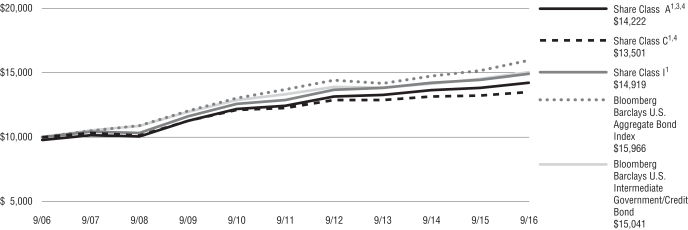
The indexes are unmanaged and not available for direct investment; therefore, their performance does not reflect the expenses associated with active management of an actual portfolio.
For information regarding the indexes and certain investment terms, see the Key Investment Terms starting on page 4.
18
Table of Contents
Fund Summary | Ticker Symbols: Class A: VLVAX Class C: VLVCX Class I: VLVIX |
Portfolio Manager Commentary by Rampart Investment Management Company, LLC
| ¢ | The Fund is diversified and has an investment objective of capital appreciation with lower volatility than U.S. markets over a full market cycle. |
| ¢ | For the fiscal year ended September 30, 2016, the Fund’s Class A shares at NAV returned 2.82%, Class C shares returned 2.05%, and Class I shares returned 3.08%. For the same period, the CBOE S&P 500 Buywrite Index, a broad-based fixed equity index returned 8.48%, and S&P 500® Index the Fund’s style-specific benchmark appropriate for comparison returned 15.43%. |
All performance figures assume reinvestment of distributions and exclude the effect of sales charges. Past performance is no guarantee of future results, and current performance may be higher or lower than the performance shown above.
How did the markets perform during the Fund’s fiscal year?
During the Fund’s fiscal year, the U.S. equity markets (as reflected by the S&P 500® Index) grinded higher to end the year more than 15% greater than where it began. During this time frame, there were only three months with negative returns: December (-1.58%), January (-4.96%), and February (-0.13%). The market’s large drawdown of approximately 9% that took place during the first 20 days of January was completely erased during a quick bounce back that occurred over the next 56 days. The S&P 500® Index has not had a negative monthly return since February 2016. This relatively calm environment also affected the overall volatility levels of the market and the level of the CBOE Volatility Index (“VIX®”) decreased more than 45% in the period, closing at 13.29 on September 30, 2016.
Since the Fund compares its performance to the S&P 500® Index, U.S. and global macro risks will affect how both the Fund and its benchmark perform. In mid-December 2015, the Fed raised the federal funds rate by 0.25% with no major market reaction. As we began to witness the January decline, most people pointed to the price slide in oil and suggested that investors were leaving riskier assets for the relative safety of U.S. Treasuries. If this slide
persisted over a long period of time, the Fund would have done well on a relative basis, but instead this flight from riskier assets did not last long, and both the markets and oil prices rebounded over the next two months. The next big piece of market news came about in late June when the U.K. voted to leave the European Union (“Brexit”). The bigger shock for many was that it only took two weeks and a day for the S&P 500® Index to close higher than where the markets were before the announcement. Finally, one of the Federal Reserve members suggested that the Fed planned to exercise “prudence” in raising interest rates, which served to remove some of the nervousness about how quickly rates would rise for the remainder of the year.
What factors affected the Fund’s performance during its fiscal year?
The Fund’s performance was positively impacted from its allocation to the larger-capitalization stocks in the S&P 500® Index. The equity portion was invested in the S&P 100® Index, which incurred a gain of 15.58% over the fiscal year ended September 30, 2016. This resulted in 0.15% outperformance over the S&P 500® Index which incurred a gain of 15.43%.
One of the tactics the Fund utilizes is selling calls on the S&P 500® Index to generate income. Some or all of this income is then used to purchase a negatively correlated investment, which can rise in value when the S&P 500® Index falls. Over the past 12 months, this strategy cost the Fund over 8.5% due to the market’s resilience. Call writing is difficult to successfully implement in upward moving markets. The Fund’s largest individual hit from this strategy occurred after calls were written at market lows for the period. To help maintain objectivity, the process used to implement this strategy is systematic and clearly defined.
The primary defensive investment for the Fund is done by purchasing call options on the futures contract of the VIX®. The VIX® options that the Fund purchases are meant to protect the Fund if the market experiences a sudden and violent move down. The Fund bought VIX® options for each month of the year, and of the 12 purchases, only one expiration period realized gains (January 2016). This result is to be expected based on the type of year the S&P 500® Index had and the way the market quickly erased losses.
The preceding information is the opinion of portfolio management only through the end of the period stated on the cover. Any such opinions are subject to change at any time based upon market or other conditions and should not be relied upon as investment advice. Past performance is no guarantee of future results and there is no guarantee market forecasts will be realized.
There is no guarantee that the Fund will meet its objectives.
Equity Securities: The market price of equity securities may be adversely affected by financial market, industry, or issuer-specific events. Focus on a particular style or on small or medium-sized companies may enhance that risk.
Exchange Traded Funds: The value of an ETF may be more volatile than the underlying portfolio of securities the ETF is designed to track. The costs of owning the ETF may exceed the cost of investing directly in the underlying securities.
Call Options: Selling call options may limit a fund’s opportunity to profit from the increase in price of its underlying portfolio. Buying call options risks the loss of the premium paid for those options.
Prospectus: For additional information on risks, please see the fund’s prospectus.
| Asset Allocation | ||||
The following table presents asset allocations within certain sectors and as a percentage of total investments as of September 30, 2016.
|
| |||
Exchange Traded Funds | 100 | % | ||
|
| |||
Total | 100 | % | ||
|
| |||
For information regarding the indexes and certain investment terms, see the Key Investment Terms starting on page 4.
19
Table of Contents
Low Volatility Equity Fund (Continued)
| Average Annual Total Returns1 for periods ended 9/30/16 | ||||||||||||
| 1 year | Since Inception | Inception Date | ||||||||||
| Class A Shares at NAV2 | 2.82 | % | 5.41 | % | 6/11/13 | |||||||
| Class A Shares at POP3,4 | -3.09 | 3.54 | 6/11/13 | |||||||||
| Class C Shares at NAV2 and with CDSC4 | 2.05 | 4.63 | 6/11/13 | |||||||||
| Class I Shares at NAV2 | 3.08 | 5.69 | 6/11/13 | |||||||||
| CBOE S&P 500 Buywrite Index | 8.48 | 6.68 | 5 | — | ||||||||
S&P 500® Index | 15.43 | 11.41 | 5 | — | ||||||||
Fund Expense Ratios6: A Shares: Gross 2.90%, Net 1.75%; C Shares: Gross 3.65%, Net 2.50%; I Shares: Gross 2.65%, Net 1.50%.
All returns represent past performance which is no guarantee of future results. Current performance may be higher or lower than the performance shown. The investment return and principal value of an investment will fluctuate so that an investor’s shares, when redeemed, may be worth more or less than their original cost. The above table and graph below do not reflect the deduction of taxes that a shareholder would pay on fund distributions or the redemption of shares. Please visit Virtus.com for performance data current to the most recent month-end.
| 1 | Total returns are historical and include changes in share price and the reinvestment of both dividends and capital gains distributions. |
| 2 | “NAV” (Net Asset Value) total returns do not include the effect of any sales charge. |
| 3 | “POP” (Public Offering Price) total returns include the effect of the maximum front-end 5.75% sales charge. |
| 4 | “CDSC” (Contingent Deferred Sales Charge) is applied to redemptions of certain classes of shares that do not have a sales charge applied at the time of purchase. CDSC charges for certain redemptions of Class A shares made within 18 months of purchase in which a finder’s fee was paid and all redemptions of Class C shares within the first year are 1% and 0% thereafter. |
| 5 | The since inception index returns are from the Fund’s inception date. |
| 6 | The expense ratios of the Fund are set forth according to the prospectus for the Fund effective January 28, 2016, as supplemented and revised and may differ from the expense ratios disclosed in the Financial Highlights tables in this report. See the Financial Highlights for more current expense ratios. Net Expense: Expenses reduced by a contractual fee waiver in effect through January 31, 2017. Gross Expense: Does not reflect the effect of the fee waiver. Expense ratios reflect fees and expenses associated with the underlying funds. |
Growth of $10,000 For periods ended 9/30
This chart assumes an initial investment of $10,000 made on June 11, 2013 (inception date of the Fund), for Class A, Class C, and Class I shares including any applicable sales charges or fees. Performance assumes reinvestment of dividends and capital gain distributions.
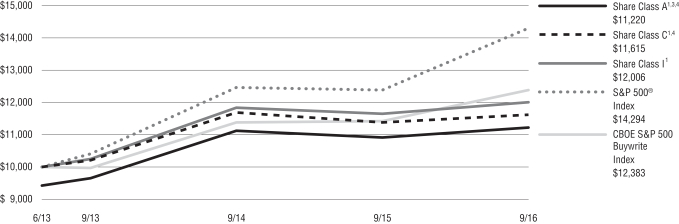
The indexes are unmanaged and not available for direct investment; therefore, their performance does not reflect the expenses associated with active management of an actual portfolio.
For information regarding the indexes and certain investment terms, see the Key Investment Terms starting on page 4.
20
Table of Contents
Multi-Sector Intermediate Bond Fund
Fund Summary | Ticker Symbols: Class A: NAMFX Class B: NBMFX Class C: NCMFX Class I: VMFIX Class R6: VMFRX |
Portfolio Manager Commentary by Newfleet Asset Management, LLC
| ¢ | The Fund is diversified and has an investment objective of maximizing current income while preserving capital. |
| ¢ | For the fiscal year ended September 30, 2016, the Fund’s Class A shares at NAV returned 10.15%, Class B shares returned 9.36%, Class C shares returned 9.34%, and Class I shares returned 10.42%. Class R6 shares returned 10.50%. For the fiscal year, the Bloomberg Barclays U.S. Aggregate Bond Index, which is both the Fund’s broad-based and style-specific fixed income index, returned 5.19%. |
All performance figures assume reinvestment of distributions and exclude the effect of sales charges. Past performance is no guarantee of future results, and current performance may be higher or lower than the performance shown above.
How did the market perform during the Fund’s fiscal year?
| ¢ | Most fixed income spread sectors outperformed U.S. Treasuries during the fiscal year. The U.S. Federal Reserve’s (“the Fed”) dovish stance in mid-February sparked a rally that turned around a volatile time period that began with fresh concerns over China, plummeting oil prices, and fears that the Fed had raised rates too soon. |
| ¢ | Late in June volatility returned briefly with fallout from the U.K.’s unexpected decision to leave the European Union (”Brexit”). Bond yields in the U.S., Japan, and across Europe fell to historic lows in early July as investors fled to the safety of bonds on global growth concerns fueled by the June 23 Brexit vote. Markets recovered rather quickly, however, from the initial shock. Easing by major central banks and a weaker U.S. dollar helped to improve global risk sentiment and stabilize markets. |
| ¢ | September brought heightened concerns over the ability and willingness of global central banks to fight chronic low inflation and weak growth as the decision by the European Central Bank (“ECB”) to leave interest rates and its stimulus program unchanged was a precipitating factor in a |
widespread market sell-off, reinforced by fears that the Bank of Japan (“BOJ”) had run out of quantitative easing tools. Hawkish signals from the Fed added to the volatility. The BOJ subsequently decided not to reduce interest rates further but to shift its focus to stabilizing rates for longer maturity government bonds. This bolstered market sentiment, as did the Fed’s eventual decision to stand pat at its September monetary policy meeting. |
| ¢ | Over the last 12 months, U.S. Treasury yields increased for shorter maturity bonds while yields decreased for intermediate to longer term bonds. |
What factors affected the Fund’s performance during its fiscal year?
| ¢ | The underperformance of U.S. Treasuries relative to most fixed income spread sectors was the key driver of the Fund’s outperformance for the fiscal year. |
| ¢ | The Fund’s allocation to the corporate high yield sector, and issue selection within emerging markets high yield and corporate high quality securities were the largest positive contributors to performance during the fiscal year. |
| ¢ | During the fiscal year, the Fund’s allocation to asset-backed securities and commercial mortgage-backed securities detracted from performance. |
The preceding information is the opinion of portfolio management only through the end of the period stated on the cover. Any such opinions are subject to change at any time based upon market or other conditions and should not be relied upon as investment advice. Past performance is no guarantee of future results, and there is no guarantee that market forecasts will be realized.
There is no guarantee that the Fund will meet its objective.
Credit & Interest: Debt securities are subject to various risks, the most prominent of which are credit and interest rate risk. The issuer of a debt security may fail to make interest and/or principal payments. Values of debt securities may rise or fall in response to changes in interest rates, and this risk may be enhanced with longer-term maturities.
Foreign & Emerging Markets: Investing internationally, especially in emerging markets, involves additional risks such as currency, political, accounting, economic, and market risk.
High Yield-High Risk Fixed Income Securities: There is a greater level of credit risk and price volatility involved with high yield securities than investment grade securities.
ABS/MBS: Changes in interest rates can cause both extension and prepayment risks for asset- and mortgage-backed securities. These securities are also subject to risks associated with the repayment of underlying collateral.
Bank Loans: Loans may be unsecured or not fully collateralized, may be subject to restrictions on resale and/or trade infrequently on the secondary market. Loans can carry significant credit and call risk, can be difficult to value and have longer settlement times than other investments, which can make loans relatively illiquid at times.
Prospectus: For additional information on risks, please see the fund’s prospectus.
| Asset Allocation | ||||||||
The following table presents asset allocations within certain sectors and as a percentage of total investments as of September 30, 2016.
|
| |||||||
Corporate Bonds and Notes | 54 | % | ||||||
Energy | 13 | % | ||||||
Financials | 12 | |||||||
Consumer Discretionary | 8 | |||||||
Materials | 5 | |||||||
All other Corporate Bonds and Notes | 16 | |||||||
Mortgage-Backed Securities | 15 | |||||||
Foreign Government Securities | 11 | |||||||
Loan Agreements | 10 | |||||||
Asset-Backed Securities | 4 | |||||||
Other | 6 | |||||||
|
| |||||||
Total | 100 | % | ||||||
|
| |||||||
For information regarding the indexes and certain investment terms, see the Key Investment Terms starting on page 4.
21
Table of Contents
Multi-Sector Intermediate Bond Fund (Continued)
| Average Annual Total Returns1 for periods ended 9/30/16 | ||||||||||||||||||||
| 1 year | 5 years | 10 years | Since Inception | Inception Date | ||||||||||||||||
| Class A Shares at NAV2 | 10.15 | % | 6.01 | % | 5.85 | % | — | — | ||||||||||||
| Class A Shares at POP3,4 | 6.02 | 5.20 | 5.45 | — | — | |||||||||||||||
| Class B Shares at NAV2 | 9.36 | 5.21 | 5.07 | — | — | |||||||||||||||
| Class B Shares with CDSC4 | 5.36 | 5.21 | 5.07 | — | — | |||||||||||||||
| Class C Shares at NAV2 and with CDSC4 | 9.34 | 5.23 | 5.08 | — | — | |||||||||||||||
| Class I Shares at NAV | 10.42 | 6.29 | — | 6.90 | % | 10/1/09 | ||||||||||||||
| Class R6 Shares at NAV | 10.50 | — | — | 3.58 | 11/12/14 | |||||||||||||||
| Bloomberg Barclays U.S. Aggregate Bond Index | 5.19 | 3.08 | 4.79 | — | 5 | — | ||||||||||||||
Fund Expense Ratios6: A Shares: 1.11%, B Shares: 1.86%, C Shares: 1.86%, I Shares: 0.86%, R6 Shares: 0.79%.
All returns represent past performance which is no guarantee of future results. Current performance may be higher or lower than the performance shown. The investment return and principal value of an investment will fluctuate so that an investor’s shares, when redeemed, may be worth more or less than their original cost. The above table and graph below do not reflect the deduction of taxes that a shareholder would pay on fund distributions or the redemption of shares. Please visit Virtus.com for performance data current to the most recent month-end.
| 1 | Total returns are historical and include changes in share price and the reinvestment of both dividends and capital gains distributions. |
| 2 | “NAV” (Net Asset Value) total returns do not include the effect of any sales charge. |
| 3 | “POP” (Public Offering Price) total returns include the effect of the maximum front-end 3.75% sales charge. |
| 4 | “CDSC” (Contingent Deferred Sales Charge) is applied to redemptions of certain classes of shares that do not have a sales charge applied at the time of purchase. CDSC charges for B shares decline from 5% to 0% over a five-year period. CDSC charges for certain redemptions of Class A shares made within 18 months of purchase in which a finder’s fee was paid and all redemptions of Class C shares within the first year are 1% and 0% thereafter. |
| 5 | The index returned 4.05 for Class I shares and 3.82% for Class R6 shares since the inception date of the respective share class. |
| 6 | The expense ratios of the Fund are set forth according to the prospectus for the Fund effective January 28, 2016, as supplemented and revised, and may differ from the expense ratios disclosed in the Financial Highlights tables in this report. See the Financial Highlights for more current expense ratios. Expense ratios include fees and expenses associated with underlying funds. |
Growth of $10,000 For periods ended 9/30
This chart assumes an initial investment of $10,000 made on September 30, 2006, for Class A, Class B, and Class C shares including any applicable sales charges or fees. Performance assumes reinvestment of dividends and capital gain distributions.
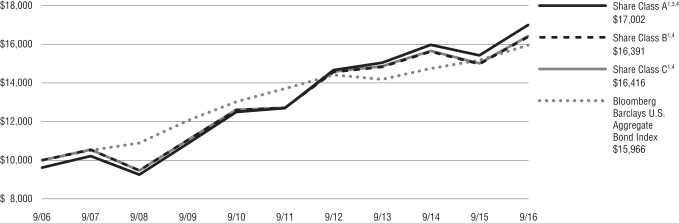
The index is unmanaged and not available for direct investment; therefore, its performance does not reflect the expenses associated with active management of an actual portfolio.
For information regarding the indexes and certain investment terms, see the Key Investment Terms starting on page 4.
22
Table of Contents
Fund Summary | Ticker Symbols: Class A: PSFRX Class C: PFSRX Class I: PSFIX |
Portfolio Manager Commentary by Newfleet Asset Management, LLC
| ¢ | The Fund is diversified and has an investment objective of high total return from both current income and capital appreciation. |
| ¢ | For the fiscal year ended September 30, 2016, the Fund’s Class A shares at NAV returned 4.42%, Class C shares returned 3.63%, and Class I shares returned 4.69%. For the same period, the Bloomberg Barclays U.S. Aggregate Bond Index, a fixed income index, returned 5.19%, and the S&P/LSTA Leveraged Loan Index, the Fund’s style-specific benchmark, returned 5.46%. |
All performance figures assume reinvestment of distributions and exclude the effect of sales charges. Past performance is no guarantee of future results, and current performance may be higher or lower than the performance shown above.
How did the markets perform during the Fund’s fiscal year?
Bank loans generated solid returns over the past year with a total return of 5.46% according to the S&P/LSTA Leveraged Loan Index. However, return performance was bifurcated during the past year, beginning with five straight months of losses before a very strong rally over the second half. Commodity-related credits and lower-quality credits significantly underperformed at the start of the year, but strongly rallied from late February through September, with the short-lived exception of June due to Brexit. Bank loans underperformed most other higher beta and longer duration fixed income sectors (high yield, emerging markets, and investment grade corporates) given the outperformance of commodity-related credits and a sharp decline in interest rates. However, bank loans produced solid risk-adjusted total returns with about half the return volatility of high yield over the last 12 months.
| ¢ | Lower-quality loans generally outperformed over the past year given the strong rally in the second half of the year with CCC, second liens, and single-B credits leading the way. The distressed sector remained an outlier to the downside with negative returns over the past year largely driven by TXU Energy and some commodity-related credits. |
| ¢ | From an industry perspective, within the S&P/LSTA Leveraged Loan Index the large outliers to the upside over the past year were the metals & minerals (+10.35%), gaming & lodging (8.53%) and conglomerate (8.12%) industry groups, while underperformers were the forest product (-18.3%), utility (-1.1%), and oil & gas (+3.1%) industry groups. However, since the rally started in February 2016, commodity-related credits significantly outperformed on a calendar year-to-date basis, with returns in the 26% range versus 7.7% for the index through September 30, 2016. |
| ¢ | Bank loan technicals started out the year on a weak note due to elevated net supply, slowing issuance of collateralized loan obligations (CLOs), and elevated retail fund outflows. However, technicals turned positive in March 2016 and steadily strengthened on increased CLO issuance, rising retail demand, and modest net new supply as a result of fairly muted M&A issuance and a continued high level of repayments. CLO issuance fell in the first quarter of 2016 to the lowest quarterly volume since 2012, however, issuance rebounded in the second and third quarters and is on a $60 billion annualized pace based on the last two quarters. CLO issuance totaled roughly $66 billion over the last four quarters and provided a solid bid for higher quality loans. Retail mutual fund outflows steadily improved from the large outflows of the fourth quarter of 2015 to three straight monthly inflows over the last quarter as LIBOR jumped to 0.85% on recent changes in money market fund rules. |
| ¢ | Outside of weakness in certain industry groups within the S&P/LSTA Leveraged Loan Index, including energy and metals & mining, fundamentals in the bank loan market remained acceptable. Defaults, within the S&P/LSTA Leveraged Loan Index by number of issuers, increased to 2.23% as of September 2016, up from 0.77% as of September 2015. The majority of the increase in defaults over the past year has been clustered in commodity-related sectors. Defaults remained below the long-term average of approximately 2.8%. |
What factors affected the Fund’s performance during its fiscal year?
| ¢ | The positive return of the U.S. leveraged loan market contributed to the Fund’s positive return during the year. |
| ¢ | Overall, positive issue selection and industry allocation relative to the benchmark benefited the portfolio’s performance. Performance was strong in the energy, gaming, and utility industries while it lagged in the metals & minerals, service, and information technology industries. |
| ¢ | We maintained a higher-quality bias in the portfolio over the entire year, which led to outperformance during the first five months, followed by modest underperformance as the market turned positive. There was a modest risk pivot in the portfolio in the second half of the year, as we added some lower-quality names at more attractive valuations to partially close our underweight to the lower-quality credit tiers. Remaining fully invested with modest leverage on a higher-quality portfolio added to performance. In keeping with the Fund’s liquidity strategy, the Fund’s out-of-index sector allocation to high yield made a positive contribution to performance as high yield outperformed loans over the past year. |
The preceding information is the opinion of portfolio management only through the end of the period stated on the cover. Any such opinions are subject to change at any time based upon market or other conditions and should not be relied upon as investment advice. Past performance is no guarantee of future results, and there is no guarantee that market forecasts will be realized.
There is no guarantee that the Fund will meet its objective.
Credit & Interest: Debt securities are subject to various risks, the most prominent of which are credit and interest rate risk. The issuer of a debt security may fail to make interest and/or principal payments. Values of debt securities may rise or fall in response to changes in interest rates, and this risk may be enhanced with longer-term maturities.
Bank Loans: Loans may be unsecured or not fully collateralized, may be subject to restrictions on resale and/or trade infrequently on the secondary market. Loans can carry significant credit and call risk, can be difficult to value and have longer settlement times than other investments, which can make loans relatively illiquid at times.
For information regarding the indexes and certain investment terms, see the Key Investment Terms starting on page 4.
23
Table of Contents
| Senior Floating Rate Fund (Continued) |
High Yield-High Risk Fixed Income Securities: There is a greater level of credit risk and price volatility involved with high yield securities than investment grade securities.
Leverage: When a fund leverages its portfolio, the value of its shares may be more volatile and all other risks may be compounded.
Liquidity: Certain securities may be difficult to sell at a time and price beneficial to the fund.
Prospectus: For additional information on risks, please see the fund’s prospectus.
| Asset Allocation | ||||||||
The following table presents asset allocations within certain sectors and as a percentage of total investments as of September 30, 2016.
|
| |||||||
Loan Agreements | 94 | % | ||||||
Consumer Discretionary | 23 | % | ||||||
Health Care | 14 | |||||||
Industrials | 13 | |||||||
Materials | 10 | |||||||
Information Technology | 10 | |||||||
Consumer Staples | 7 | |||||||
All Other Loan Agreements | 17 | |||||||
Corporate Bonds and Notes | 5 | |||||||
Other | 1 | |||||||
|
| |||||||
Total | 100 | % | ||||||
|
| |||||||
For information regarding the indexes and certain investment terms, see the Key Investment Terms starting on page 4.
24
Table of Contents
Senior Floating Rate Fund (Continued)
| Average Annual Total Returns1 for periods ended 9/30/16 | ||||||||||||||||
| 1 year | 5 years | Since Inception | Inception Date | |||||||||||||
| Class A Shares at NAV2 | 4.42 | % | 4.67 | % | 4.86 | % | 1/31/08 | |||||||||
| Class A Shares at POP3,4 | 1.55 | 4.09 | 4.52 | 1/31/08 | ||||||||||||
| Class C Shares at NAV2 and with CDSC4 | 3.63 | 3.89 | 4.09 | 1/31/08 | ||||||||||||
| Class I Shares at NAV | 4.69 | 4.94 | 5.12 | 1/31/08 | ||||||||||||
| Bloomberg Barclays U.S. Aggregate Bond Index | 5.19 | 3.08 | 4.38 | 5 | — | |||||||||||
| S&P/LSTA Leveraged Loan Index | 5.46 | 5.25 | 5.25 | 5 | — | |||||||||||
Fund Expense Ratios6: A Shares: 1.20%, C Shares: 1.95%, I Shares: 0.95%.
All returns represent past performance which is no guarantee of future results. Current performance may be higher or lower than the performance shown. The investment return and principal value of an investment will fluctuate so that an investor’s shares, when redeemed, may be worth more or less than their original cost. The above table and graph below do not reflect the deduction of taxes that a shareholder would pay on fund distributions or the redemption of shares. Please visit Virtus.com for performance data current to the most recent month-end.
| 1 | Total returns are historical and include changes in share price and the reinvestment of both dividends and capital gains distributions. |
| 2 | “NAV” (Net Asset Value) total returns do not include the effect of any sales charge. |
| 3 | “POP” (Public Offering Price) total returns include the effect of the maximum front-end 2.75% sales charge. |
| 4 | “CDSC” (Contingent Deferred Sales Charge) is applied to redemptions of certain classes of shares that do not have a sales charge applied at the time of purchase. CDSC charges for certain redemptions of Class A shares made within 18 months of purchase in which a finder’s fee was paid and all redemptions of Class C shares within the first year are 1% and 0% thereafter. |
| 5 | The since inception index returns are from the Fund’s inception date. |
| 6 | The expense ratios of the Fund are set forth according to the prospectus for the Fund effective January 28, 2016, as supplemented and revised, and may differ from the expense ratios disclosed in the Financial Highlights tables in this report. See the Financial Highlights for more current expense ratios. |
Growth of $10,000 For periods ended 9/30
This chart assumes an initial investment of $10,000 made on January 31, 2008 (inception date of the Fund), for Class A, Class C and Class I shares including any applicable sales charges or fees. Performance assumes reinvestment of dividends and capital gain distributions.
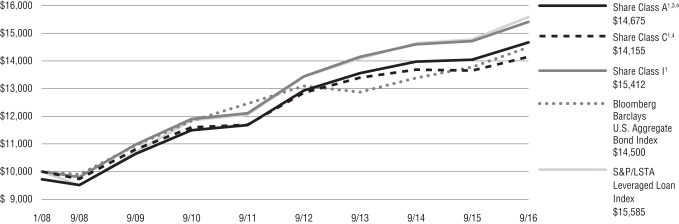
The indexes are unmanaged and not available for direct investment; therefore, their performance does not reflect the expenses associated with active management of an actual portfolio.
For information regarding the indexes and certain investment terms, see the Key Investment Terms starting on page 4.
25
Table of Contents
Fund Summary | Ticker Symbols: A Share: HXBZX C Share: PXCZX I Share: HXBIX |
Portfolio Manager Commentary by
Newfleet Asset Management, LLC
| ¢ | The Fund is diversified and has an investment objective of providing a high level of current income that is exempt from federal income tax. |
Effective September 23, 2016, the Virtus Tax-Exempt Bond Fund was reorganized as a series of Virtus Opportunities Trust and changed its fiscal year from December 31 to September 30. As a result, the commentary addresses nine months of performance through September 30.
| ¢ | For the fiscal period January 1, 2016 through September 30, 2016, the Fund’s Class A shares at NAV returned 3.00%*, Class C shares at NAV returned 2.42%* and Class I shares at NAV returned 3.19%*. For the same period, the Bloomberg Barclays U.S. Aggregate Bond Index, a broad-based fixed income index, returned 5.80%*, the Tax-Exempt Bond Linked Benchmark, which is the Fund’s style-specific benchmark appropriate for comparison, returned 3.41%*. |
| * | Returns less than 1 year are not annualized. |
All performance figures assume reinvestment of distributions and exclude the effect of sales charges. Past performance is no guarantee of future results, and current performance may be higher or lower than the performance shown above.
How did the municipal bond market perform during the Fund’s nine-month fiscal period?
The municipal bond market experienced solid performance over the nine months ended September 30, 2016, as tax-free interest rates declined and credit risk spreads narrowed. The market’s technical conditions (supply and demand) remained strong for much of the period, with investors continuing to pour money into open-end municipal bond mutual funds and new issuance of municipal bonds mostly manageable despite interest rates hovering near generational low levels. However, the technical support weakened somewhat as the end of September approached. U.S. Treasury yields began to rise and tax-free interest rates followed, as the market priced in a higher probability of a rate hike by the Federal Reserve (“the Fed”). At the same time, municipal bond supply increased as municipalities issued bonds to get
ahead of potential Fed rate hikes and perhaps to catch up on issuance delayed as a result of disruptions related to the U.K.’s “Brexit” vote in late June. The markets also were receptive to lower-rated credits as investors reached for yield across all areas of the fixed income market. As a result of the rise in yields and surge in supply, municipal bond performance turned negative for the first time in over a year.
The municipal market was otherwise resilient in the face of a number of market events and conditions, including repercussions from the U.K.’s surprising Brexit vote outcome; Puerto Rico’s default on its general obligation bonds and select public corporations; oil price volatility; the increasing and decreasing probabilities of a Fed rate hike; the U.S. presidential election; and the problems surrounding underfunded pension plans across the country. Aside from Puerto Rico, defaults have been very low in the municipal bond sector.
Demand for municipal bonds continued unabated, with 52 consecutive weeks of inflows into municipal bond mutual funds totaling over $50 billion. While long-term funds represented the bulk of the assets in terms of flows, the highest percentage increase of assets under management occurred among high yield funds. Though interrupted by the recent increase in supply, strong technicals have been the driving factor in the municipal market’s strength.
The economy continued to expand during the period, but the slow pace of growth continued to have an adverse effect on state budgets. State and local sales tax growth remained positive, but showed signs of slowing. Personal tax collections in the second quarter of 2016 grew by only 1.8% year-over-year, according to the Rockfeller Institute. Local property taxes, however, continued to benefit from an improving housing market and home prices.
By far, the largest challenge to the municipal credit remained the extent of underfunded pension obligations. Pension funds across the country have been struggling to meet assumed rates of return in the current low interest rate/stagnant stock market environment. As an example of a particularly serious situation, the California Public Employees’ Retirement System (“CALPERS”) reported a 0.6% return in its last fiscal year, far short of an assumed rate of return of 7.5%. The impact of lower-than-expected returns on pension funding levels has increased the stress on
municipal budgets to increase annual contributions and divert funds from other spending.
What factors affected the Fund’s performance during nine-month fiscal period?
Over the past nine months ended September 30, 2016, the market’s best performers were longer duration, lower coupon, and lower credit quality bonds as interest rates declined beyond five years and risk premiums narrowed. While they still produced positive performance, bonds with shorter maturities, lower duration, and higher credit quality displayed relatively weaker performance for most of the year.
The Fund’s performance relative to the benchmark during the fiscal period benefited from the Fund’s higher allocation to hospital/healthcare issuers, exposure to below-investment grade-rated bonds, and its higher allocation to revenue bonds compared to general obligation issues.
The Fund’s relative performance during the fiscal period was hurt by the portfolio’s higher exposure to shorter-dated maturities, lower allocation to bonds with maturities beyond 22 years, and larger allocation to pre-refunded bonds.
The preceding information is the opinion of portfolio management only through the end of the period of the report as stated on the cover. Any such opinions are subject to change at any time based upon market or other conditions and should not be relied upon as investment advice.
There is no guarantee that the Fund will meet its objective.
Credit & Interest: Debt securities are subject to various risks, the most prominent of which are credit and interest rate risk. The issuer of a debt security may fail to make interest and/or principal payments. Values of debt securities may rise or fall in response to changes in interest rates, and this risk may be enhanced with longer-term maturities.
Municipal Market: Events negatively impacting a municipal security, or the municipal bond market in general, may cause the fund to decrease in value.
State & AMT Tax: A portion of income may be subject to some state and/or local taxes and, for certain investors, a portion may be subject to the federal alternative minimum tax.
For information regarding the indexes and certain investment terms, see the Key Investment Terms starting on page 4.
26
Table of Contents
| Tax-Exempt Bond Fund (Continued) |
High Yield-High Risk Fixed Income Securities: There is a greater level of credit risk and price volatility involved with high yield securities than investment grade securities.
Prospectus: For additional information on risks, please see the fund’s prospectus.
| Asset Allocation | ||||
The following table presents asset allocations within certain sectors as a percentage of total investments as of September 30, 2016.
|
| |||
Texas | 12 | % | ||
New York | 12 | |||
Illinois | 8 | |||
California | 6 | |||
Florida | 6 | |||
Colorado | 5 | |||
Maryland | 5 | |||
Other (includes short-term investments) | 46 | |||
|
| |||
Total | 100 | % | ||
|
| |||
For information regarding the indexes and certain investment terms, see the Key Investment Terms starting on page 4.
27
Table of Contents
Tax-Exempt Bond Fund (Continued)
| Average Annual Total Returns1 for periods ended 9/30/16 | ||||||||||||
| 1 year | 5 years | 10 years | ||||||||||
| Class A Shares at NAV2 | 4.13 | % | 3.82 | % | 4.47 | % | ||||||
| Class A Shares at POP3,4 | 1.27 | 3.24 | 4.17 | |||||||||
| Class C Shares at NAV2 and CDSC4 | 3.35 | 3.05 | 3.68 | |||||||||
| Class I Shares at NAV2 | 4.39 | 4.08 | 4.74 | |||||||||
| Bloomberg Barclays U.S. Aggregate Bond Index | 5.19 | 3.08 | 4.79 | |||||||||
| Tax-Exempt Bond Linked Benchmark | 4.85 | 4.12 | 4.57 | |||||||||
Fund Expense Ratios5: A Shares: Gross 1.00%, Net 0.85%; C Shares: Gross 1.75%, Net 1.60%; I Shares: Gross 0.75%, Net 0.60%.
All returns represent past performance which is no guarantee of future results. Current performance may be higher or lower than the performance shown. The investment return and principal value of an investment will fluctuate so that an investor’s shares, when redeemed, may be worth more or less than their original cost. The above table and graph below do not reflect the deduction of taxes that a shareholder would pay on fund distributions or the redemption of shares. Please visit Virtus.com for performance data current to the most recent month-end.
| 1 | Total returns are historical and include changes in share price and the reinvestment of both dividends and capital gains distributions. |
| 2 | “NAV” (Net Asset Value) total returns do not include the effect of any sales charge. |
| 3 | “POP” (Public Offering Price) total returns include the effect of the maximum front-end 2.75% sales charge. |
| 4 | “CDSC” (Contingent Deferred Sales Charge) is applied to redemptions of certain classes of shares that do not have a sales charge applied at the time of purchase. CDSC charges for certain redemptions of Class A shares and all redemptions of Class C shares are 1% within the first year and 0% thereafter. |
| 5 | The expense ratios of the Fund, both net and gross, are set forth according to the prospectus for the Fund effective September 23, 2016, as supplemented and revised, and may differ from the expense ratios disclosed in the Financial Highlights tables in this report. See the Financial Highlights for more current expense ratios. Net Expenses: Expenses reduced by a contractual fee waiver in effect through September 30, 2017. Gross Expenses: Do not reflect the effect of contractual fee waiver. Expense ratios include fees and expenses associated with underlying funds. |
Growth of $10,000 For periods ended 9/30
This chart assumes an initial investment of $10,000 made on September 30, 2006 for Class A, Class C and Class I shares. Performance assumes reinvestment of dividends and capital gain distributions.
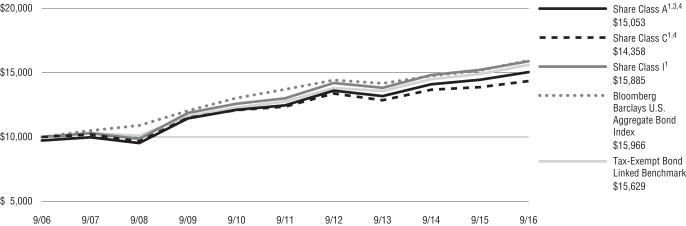
The indexes are unmanaged and not available for direct investment; therefore, their performance does not reflect the expenses associated with active management of an actual portfolio.
For information regarding the indexes and certain investment terms, see the Key Investment Terms starting on page 4.
28
Table of Contents
Fund Summary | Ticker Symbols: Class A: VWMAX Class C: VWMCX Class I: VWMIX |
Portfolio Manager Commentary by Horizon Asset Management, LLC
| ¢ | The Fund is diversified and has an investment objective of capital appreciation. |
| ¢ | For the fiscal year ended September 30, 2016, the Fund’s Class A shares at NAV returned 12.44%, Class C shares returned 11.56%, and Class I shares returned 12.75%. For the same period, the S&P 500® Index, a broad-based equity index, and the Fund’s style-specific benchmark, returned 15.43%. |
All performance figures assume reinvestment of distributions and exclude the effect of sales charges. Past performance is no guarantee of future results, and current performance may be higher or lower than the performance shown above.
How did the markets perform during the Fund’s fiscal year?
For the 12-month period ended September 30, 2016, broader equity markets ended up substantially, with the S&P 500® Index returning 15.43%. Markets tumbled in early 2016, as many stocks that had appreciated dramatically in 2015 fell significantly after they reported financial results and provided their outlooks for 2016. Markets rebounded, only to fall again in late June following the unexpected result of the “Brexit” referendum, whereby voters in the United Kingdom voted to exit the European Union. Once again, U.S. markets recovered swiftly, though it remained to be seen exactly when and how the exit would be implemented.
What factors affected the Fund’s performance during its fiscal year?
The Fund invests in companies owned and operated by the wealthiest, most successful investors, business executives, and entrepreneurs in the United States (“owner-operators”), and allows investors to readily leverage the business acumen of these highly-skilled individuals.
Though the Fund generated substantial returns during the 12 months ended September 30, 2016, its performance lagged relative to the benchmark S&P 500® Index. Underperformance was attributable, in part, to the continued flow of funds from active to passive management. Also, the Fund’s selection
criteria are indifferent to factors such as sector classification, for example, which resulted in an overweight to the consumer discretionary sector relative to the S&P 500® Index.
At the sector level, industrials and materials were the largest contributors to the Fund’s relative returns, while consumer discretionary and utilities were the largest detractors.
At the stock level, the five largest contributors to relative performance (and their owner-operators) were Clayton Williams Energy, Inc. (Clayton Williams, Jr.); DreamWorks Animation SKG, Inc. (Jeffrey Katzenberg); (the company was acquired by Comcast Corp. in August 2016); Navistar International Corporation (Carl Icahn); Amkor Technology, Inc. (James Kim); and Freeport-McMoRan, Inc. (Carl Icahn). The five largest detractors from relative performance were CVR Energy, Inc. (Carl Icahn); Sears Holdings Corp. (Edward Lampert); Lions Gate Entertainment Corp. (John Malone); SolarCity Corp. (Elon Musk); and Lands’ End, Inc. (Edward Lampert).
The preceding information is the opinion of portfolio management only through the end of the period stated on the cover. Any such opinions are subject to change at any time based on market or other conditions and should not be relied upon as investment advice. Past performance is no guarantee of future results, and there is no guarantee that market forecasts will be realized.
There is no guarantee the Fund will meet its objective.
| Asset Allocation | ||||
The following table presents asset allocations within certain sectors and as a percentage of total investments as of September 30, 2016.
|
| |||
Consumer Discretionary | 32 | % | ||
Financials | 14 | |||
Industrials | 11 | |||
Information Technology | 11 | |||
Energy | 7 | |||
Real Estate | 7 | |||
Materials | 5 | |||
Other (includes securities-lending collateral) | 13 | |||
|
| |||
Total | 100 | % | ||
|
| |||
Equity Securities: The market price of equity securities may be adversely affected by financial
market, industry, or issuer-specific events. Focus on a particular style or on small or medium-sized companies may enhance that risk.
Industry/Sector Concentration: A fund that focuses its investments in a particular industry or sector will be more sensitive to conditions that affect that industry or sector than a non-concentrated fund.
Prospectus: For additional information on risks, please see the fund’s prospectus.
For information regarding the indexes and certain investment terms, see the Key Investment Terms starting on page 4.
29
Table of Contents
Wealth Masters Fund (Continued)
| Average Annual Total Returns1 for periods ended 9/30/16 | ||||||||||||
| 1 year | Since Inception | Inception Date | ||||||||||
| Class A Shares at NAV2 | 12.44 | % | 11.24 | % | 9/5/12 | |||||||
| Class A Shares at POP3,4 | 5.98 | 9.63 | 9/5/12 | |||||||||
| Class C Shares at NAV2 and with CDSC4 | 11.56 | 10.41 | 9/5/12 | |||||||||
| Class I Shares at NAV | 12.75 | 11.51 | 9/5/12 | |||||||||
| S&P 500® Index | 15.43 | 13.67 | 5 | — | ||||||||
Fund Expense Ratios6: A Shares: Gross 1.46%, Net 1.45%; C Shares: Gross 2.21%, Net 2.20%; I Shares: Gross 1.21%, Net 1.20%.
All returns represent past performance which is no guarantee of future results. Current performance may be higher or lower than the performance shown. The investment return and principal value of an investment will fluctuate so that an investor’s shares, when redeemed, may be worth more or less than their original cost. The above table and graph below do not reflect the deduction of taxes that a shareholder would pay on fund distributions or the redemption of shares. Please visit Virtus.com for performance data current to the most recent month-end.
| 1 | Total returns are historical and include changes in share price and the reinvestment of both dividends and capital gains distributions. |
| 2 | “NAV” (Net Asset Value) total returns do not include the effect of any sales charge. |
| 3 | “POP” (Public Offering Price) total returns include the effect of the maximum front-end 5.75% sales charge. |
| 4 | “CDSC” (Contingent Deferred Sales Charge) is applied to redemptions of certain classes of shares that do not have a sales charge applied at the time of purchase. CDSC charges for certain redemptions of Class A shares made within 18 months of purchase in which a finder’s fee was paid and all redemptions of Class C shares within the first year are 1% and 0% thereafter. |
| 5 | The since inception index returns are from the Fund’s inception date. |
| 6 | The expense ratios of the Fund are set forth according to the prospectus for the Fund effective January 28, 2016, as supplemented and revised and may differ from the expense ratios disclosed in the Financial Highlights tables in this report. See the Financial Highlights for more current expense ratios. Net Expense: Expenses reduced by contractual fee waiver in effect through January 31, 2017. Gross Expense: Does not reflect the effect of the fee waiver. |
Growth of $10,000 For periods ended 9/30
This chart assumes an initial investment of $10,000 made on September 5, 2012 (inception date of the Fund), for Class A, Class C, and Class I shares including any applicable sales charges or fees. Performance assumes reinvestment of dividends and capital gain distributions.
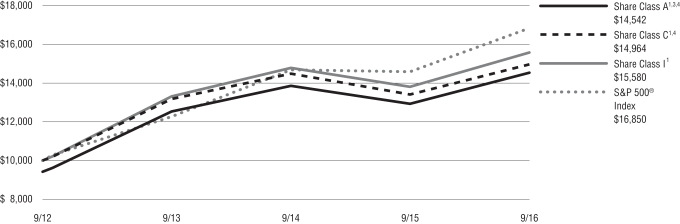
The indexes are unmanaged and not available for direct investment; therefore, their performance does not reflect the expenses associated with active management of an actual portfolio.
For information regarding the indexes and certain investment terms, see the Key Investment Terms starting on page 4.
30
Table of Contents
SEPTEMBER 30, 2016
($ reported in thousands)
| PAR VALUE | VALUE | |||||||
| U.S. GOVERNMENT SECURITIES—7.4% | ||||||||
U.S. Treasury Bond | $ | 3,505 | $ | 3,635 | ||||
U.S. Treasury Note | 2,060 | 2,134 | ||||||
| TOTAL U.S. GOVERNMENT SECURITIES (Identified Cost $5,672) | 5,769 | |||||||
| MUNICIPAL BONDS—1.5% | ||||||||
| California—1.1% | ||||||||
California, State of, Build America Bonds Taxable | 520 | 843 | ||||||
|
| |||||||
| Georgia—0.4% | ||||||||
Rockdale County Water & Sewerage Authority Revenue Taxable | 255 | 270 | ||||||
|
| |||||||
| Michigan—0.0% | ||||||||
City of Flat Rock Finance Authority, Series A, Taxable | 20 | 20 | ||||||
| TOTAL MUNICIPAL BONDS (Identified Cost $1,118) | 1,133 | |||||||
| FOREIGN GOVERNMENT SECURITIES—1.5% | ||||||||
Argentine Republic | ||||||||
144A 7.500%, 4/22/26(3) | 155 | 175 | ||||||
144A 7.625%, 4/22/46(3) | 150 | 169 | ||||||
Republic of Costa Rica 144A | 200 | 214 | ||||||
Republic of Panama | 200 | 216 | ||||||
Republic of Turkey | 200 | 204 | ||||||
Sultanate of Oman 144A | 200 | 201 | ||||||
| TOTAL FOREIGN GOVERNMENT SECURITIES | ||||||||
| (Identified Cost $1,091) | 1,179 | |||||||
| MORTGAGE-BACKED SECURITIES—26.8% | ||||||||
| Agency—12.0% | ||||||||
FHLMC | ||||||||
5.000%, 12/1/35 | 30 | 34 | ||||||
4.000%, 2/1/45 | 455 | 488 | ||||||
3.500%, 3/1/45 | 344 | 366 | ||||||
3.000%, 5/1/45 | 135 | 140 | ||||||
3.500%, 4/1/46 | 396 | 418 | ||||||
FNMA | ||||||||
6.000%, 7/1/17 | 2 | 2 | ||||||
5.500%, 9/1/17 | 3 | 3 | ||||||
5.000%, 4/1/20 | 51 | 52 | ||||||
5.000%, 8/1/21 | 9 | 9 | ||||||
6.000%, 5/1/29 | 29 | 33 | ||||||
6.500%, 5/1/30 | 1 | 1 | ||||||
7.000%, 7/1/31 | 8 | 8 | ||||||
5.500%, 4/1/36 | 43 | 49 | ||||||
5.500%, 9/1/36 | 159 | 181 | ||||||
6.000%, 9/1/37 | 21 | 25 | ||||||
6.000%, 8/1/38 | 200 | 231 | ||||||
| PAR VALUE | VALUE | |||||||
| Agency—continued | ||||||||
6.000%, 8/1/38 | $ | 13 | $ | 15 | ||||
5.000%, 6/1/39 | 581 | 656 | ||||||
5.000%, 9/1/39 | 154 | 174 | ||||||
5.500%, 9/1/39 | 310 | 351 | ||||||
4.500%, 9/1/40 | 246 | 275 | ||||||
3.500%, 12/1/42 | 286 | 303 | ||||||
3.000%, 3/1/43 | 490 | 511 | ||||||
3.000%, 5/1/43 | 143 | 149 | ||||||
3.000%, 5/1/43 | 326 | 339 | ||||||
4.000%, 9/1/44 | 121 | 130 | ||||||
3.000%, 5/1/45 | 795 | 827 | ||||||
3.000%, 8/1/45 | 576 | 601 | ||||||
3.500%, 8/1/45 | 617 | 650 | ||||||
3.500%, 8/1/45 | 659 | 696 | ||||||
3.500%, 1/1/46 | 147 | 155 | ||||||
3.000%, 2/1/46 | 684 | 712 | ||||||
3.000%, 4/1/46 | 723 | 752 | ||||||
GNMA | 28 | 33 | ||||||
|
| |||||||
| 9,369 | ||||||||
|
| |||||||
| Non-Agency—14.8% | ||||||||
Access Point Financial, Inc. 15-A, A 144A | 86 | 86 | ||||||
Agate Bay Mortgage Trust 13-1, 144A | 80 | 82 | ||||||
American Homes 4 Rent | ||||||||
14-SFR2, C 144A | 195 | 215 | ||||||
15-SFR2, C 144A | 125 | 138 | ||||||
15-SFR1, A 144A | 219 | 233 | ||||||
Ameriquest Mortgage Securities, Inc. 03-AR3, M4 | 130 | 125 | ||||||
Aventura Mall Trust | 325 | 341 | ||||||
Banc of America Funding Trust | ||||||||
04-B, 2A1 | 76 | 75 | ||||||
05-1, 1A1 | 84 | 85 | ||||||
Banc of America Mortgage Trust 05-3, 1A15 | 81 | 82 | ||||||
Bank of America (Countrywide) Asset-Backed Certificates 05-1, AF5A | 257 | 255 | ||||||
Bank of America (Merrill Lynch – Countrywide) Home Loan Mortgage Pass-Through-Trust 04-6, 1A2 | 255 | 252 | ||||||
Citigroup Commercial Mortgage Trust 07-C6, A4 | 350 | 356 | ||||||
Credit Suisse Mortgage-Backed Trust 06-08, 3A1 | 94 | 90 | ||||||
| PAR VALUE | VALUE | |||||||
| Non-Agency—continued | ||||||||
Deutsche Bank-UBS Mortgage Trust 11-LC3A, D 144A | $ | 180 | $ | 189 | ||||
Freddie Mac Structured Agency Credit Risk Debt Notes 16-DNA2, M2 | 250 | 254 | ||||||
GSAA Home Equity Trust 05-12, AF3W | 66 | 67 | ||||||
GSR Mortgage Loan Trust 06-1F, 2A4 | 174 | 153 | ||||||
Jefferies Resecuritization Trust 14-R1, 1A1 144A | 54 | 54 | ||||||
JPMorgan Chase (WaMu) Mortgage Pass-Through Certificates 03-S11, 3A5 | 169 | 176 | ||||||
JPMorgan Chase Commercial Mortgage Securities Trust | ||||||||
06-LDP9, A3 | 37 | 37 | ||||||
14- C22, A4 | 195 | 213 | ||||||
JPMorgan Chase Mortgage Trust | ||||||||
04-A4, 2A1 | 194 | 197 | ||||||
14-1, 1A1 144A | 112 | 118 | ||||||
16-1, M2 144A | 146 | 151 | ||||||
16-2, M2 144A | 186 | 193 | ||||||
15-4, 1A4 144A | 120 | 124 | ||||||
16-1, A3 144A | 555 | 573 | ||||||
11-C4, A4, 144A | 325 | 354 | ||||||
MASTR Adjustable Rate Mortgages Trust 05-1, 3A1 | 144 | 131 | ||||||
MASTR Specialized Loan Trust 05-3, A2 144A | 126 | 127 | ||||||
Morgan Stanley – Bank of America (Merrill Lynch) Trust | ||||||||
13-C13, AS | 360 | 400 | ||||||
15-C22, AS | 310 | 327 | ||||||
15-C26,C | 195 | 204 | ||||||
Morgan Stanley Capital Barclays Bank Trust | 140 | 140 | ||||||
Morgan Stanley Capital I Trust | ||||||||
07-T27, A4 | 539 | 551 | ||||||
See Notes to Financial Statements
31
Table of Contents
VIRTUS BOND FUND
SCHEDULE OF INVESTMENTS (Continued)
SEPTEMBER 30, 2016
($ reported in thousands)
| PAR VALUE | VALUE | |||||||
| Non-Agency—continued | ||||||||
08-T29, A4 | $ | 526 | $ | 551 | ||||
07-IQ14, A4 | 300 | 303 | ||||||
07-IQ14, AM | 190 | 184 | ||||||
Motel 6 Trust 15-MTL6, D 144A | 210 | 211 | ||||||
New Residential Mortgage Loan Trust | ||||||||
14-1A, A 144A | 178 | 185 | ||||||
15-2A, A1 144A | 200 | 208 | ||||||
16-1A, A1 144A | 169 | 175 | ||||||
Novastar Mortgage Funding Trust Series 04-4, M5 | 185 | 181 | ||||||
Residential Asset Securitization Trust 05-A1, A3 | 144 | 144 | ||||||
Sequoia Mortgage Trust | ||||||||
14-2, A1 144A | 106 | 110 | ||||||
14-4, A6 144A | 179 | 185 | ||||||
Towd Point Mortgage Trust | ||||||||
15-1, A2 144A | 150 | 152 | ||||||
16-1, A1B, 144A | 199 | 202 | ||||||
15-5, A2 144A | 220 | 222 | ||||||
16-4, A1 144A | 140 | 141 | ||||||
15-2, 1M1 144A | 225 | 219 | ||||||
Vericrest Opportunity Loan Transfer | ||||||||
15-NP11, A1 144A | 111 | 111 | ||||||
16-NPL9, A1 144A | 100 | 100 | ||||||
Vericrest Opportunity Loan Trust | ||||||||
16-NPL8, A1 144A | 116 | 116 | ||||||
15-NPL4, A1 144A | 111 | 111 | ||||||
Wells Fargo (Wachovia Bank) Commercial Mortgage Trust 15-LC20, B | 300 | 317 | ||||||
Wells Fargo – Royal Bank of Scotland plc Commercial Mortgage Trust | 205 | 227 | ||||||
|
| |||||||
| 11,503 | ||||||||
| TOTAL MORTGAGE-BACKED SECURITIES (Identified Cost $20,332) | 20,872 | |||||||
| PAR VALUE | VALUE | |||||||
| ASSET-BACKED SECURITIES—5.1% | ||||||||
AmeriCredit Automobile Receivables Trust 14-1, D | $ | 235 | $ | 238 | ||||
Avis Budget Rental Car Funding LLC | ||||||||
(AESOP) 12-3A, A 144A | 375 | 376 | ||||||
(AESOP) 16-1A, A 144A | 200 | 205 | ||||||
CarFinance Capital Auto Trust 14-1A, D 144A | 215 | 216 | ||||||
CarMax Auto Owner Trust 15-2, C | 235 | 238 | ||||||
Centre Point Funding LLC 12-2A, 1 144A | 220 | 218 | ||||||
Drive Auto Receivables Trust 15-DA, C 144A | 260 | 265 | ||||||
Drug Royalty II LP 1 | 161 | 159 | ||||||
DT Auto Owner Trust | 235 | 235 | ||||||
Exeter Automobile Receivables Trust 13-1A, C 144A | 207 | 209 | ||||||
Fairway Outdoor Funding LLC 12-1A, A2 144A | 142 | 144 | ||||||
Navistar Financial Dealer Note Master Owner Trust II | 310 | 312 | ||||||
Orange Lake Timeshare Trust 12-AA, A 144A | 42 | 43 | ||||||
Santander Drive Auto Receivables Trust 13-1, D | 215 | 217 | ||||||
Sierra Timeshare Receivables Funding LLC 12-3A, A 144A | 84 | 83 | ||||||
Silverleaf Finance XV LLC | 34 | 34 | ||||||
SoFi Professional Loan Program LLC 15-A, A2 144A | 105 | 106 | ||||||
Taco Bell Funding LLC | 240 | 243 | ||||||
Trip Rail Master Funding LLC 14-1A, A1 144A | 233 | 232 | ||||||
U-Haul S Fleet LLC | 231 | 234 | ||||||
| TOTAL ASSET-BACKED SECURITIES (Identified Cost $3,986) | 4,007 | |||||||
| PAR VALUE | VALUE | |||||||
| CORPORATE BONDS AND NOTES—46.9% | ||||||||
| Consumer Discretionary—6.3% | ||||||||
Boyd Gaming Corp. | $ | 75 | $ | 82 | ||||
Caesars Entertainment Operating Co., Inc. | 100 | 104 | ||||||
Caesars Growth Properties Holdings LLC | 75 | 81 | ||||||
CCO Holdings LLC 144A | 125 | 131 | ||||||
Cequel Communications Holdings I LLC (Cequel Capital Corp.) | ||||||||
144A 5.125%, | 45 | 45 | ||||||
144A 5.125%, | 110 | 110 | ||||||
Clear Channel Worldwide Holdings, Inc. Series B | 175 | 174 | ||||||
Columbus Cable Barbados Ltd. Series B, 144A | 200 | 213 | ||||||
Delphi Automotive plc | 145 | 150 | ||||||
Diamond Resorts International, Inc. 144A | 15 | 15 | ||||||
Grupo Televisa SAB | 200 | 214 | ||||||
Hanesbrands, Inc. 144A | 20 | 21 | ||||||
Landry’s, Inc. | ||||||||
144A 9.375%, 5/1/20(3) | 165 | 173 | ||||||
144A 6.750%, 10/15/24(3) | 45 | 46 | ||||||
M/I Homes, Inc. | 95 | 100 | ||||||
MDC Holdings, Inc. | 180 | 189 | ||||||
MGM Resorts International | 85 | 92 | ||||||
MPG Holdco I, Inc. | 145 | 149 | ||||||
New York University | 70 | 72 | ||||||
Newell Brands, Inc. | ||||||||
144A 5.000%, | 25 | 27 | ||||||
4.200%, 4/1/26 | 25 | 27 | ||||||
PetSmart, Inc. 144A | 135 | 142 | ||||||
Priceline Group, Inc. (The) | 195 | 205 | ||||||
QVC, Inc. | 265 | 266 | ||||||
Scientific Games International, Inc. | 95 | 73 | ||||||
SFR (Numericable) Group S.A. 144A | 200 | 205 | ||||||
Signet UK Finance plc | 210 | 202 | ||||||
Sirius XM Radio, Inc. 144A | 165 | 170 | ||||||
See Notes to Financial Statements
32
Table of Contents
VIRTUS BOND FUND
SCHEDULE OF INVESTMENTS (Continued)
SEPTEMBER 30, 2016
($ reported in thousands)
| PAR VALUE | VALUE | |||||||
| Consumer Discretionary—continued | ||||||||
Six Flags Entertainment Corp. 144A | $ | 130 | $ | 132 | ||||
Station Casinos LLC | 230 | 243 | ||||||
TI Group Automotive Systems LLC 144A | 80 | 87 | ||||||
Toll Brothers Finance Corp. | ||||||||
5.625%, 1/15/24 | 10 | 11 | ||||||
4.875%, 11/15/25 | 305 | 313 | ||||||
TRI Pointe Group, Inc. | 155 | 162 | ||||||
Wyndham Worldwide Corp. | 245 | 268 | ||||||
Ziggo Secured Finance BV 144A | 200 | 200 | ||||||
|
| |||||||
| 4,894 | ||||||||
|
| |||||||
| Consumer Staples—1.7% | ||||||||
Anheuser-Busch InBev Finance, Inc. | ||||||||
3.300%, 2/1/23 | 90 | 95 | ||||||
3.650%, 2/1/26 | 185 | 198 | ||||||
CVS Health Corp. | 255 | 259 | ||||||
Flowers Foods, Inc. | 275 | 297 | ||||||
Rite Aid Corp. 144A | 40 | 43 | ||||||
Safeway, Inc. | 115 | 115 | ||||||
Tops Holding LLC (Tops Markets II Corp.) 144A | 155 | 140 | ||||||
Whole Foods Market, Inc. 144A | 143 | 156 | ||||||
|
| |||||||
| 1,303 | ||||||||
|
| |||||||
| Energy—2.8% | ||||||||
Antero Midstream Partners LP 144A | 60 | 61 | ||||||
Antero Resources Corp. | 80 | 82 | ||||||
Blue Racer Midstream LLC 144A | 45 | 44 | ||||||
Callon Petroleum Co. 144A | 35 | 36 | ||||||
Cimarex Energy Co. | 120 | 125 | ||||||
Continental Resources, Inc. | ||||||||
5.000%, 9/15/22 | 110 | 110 | ||||||
4.500%, 4/15/23 | 70 | 68 | ||||||
Enbridge Energy Partners LP | 30 | 32 | ||||||
EnLink Midstream Partners LP | 15 | 15 | ||||||
| PAR VALUE | VALUE | |||||||
| Energy—continued | ||||||||
FTS International, Inc. | $ | 60 | $ | 23 | ||||
Helmerich & Payne International Drilling Co. | 115 | 121 | ||||||
Holly Energy Partners LP 144A | 15 | 16 | ||||||
Kinder Morgan Energy Partners LP | 245 | 293 | ||||||
MPLX LP | 255 | 264 | ||||||
NGL Energy Partners LP | 155 | 147 | ||||||
Parsley Energy LLC 144A | 215 | 223 | ||||||
Range Resources Corp. 144A | 130 | 128 | ||||||
Sabine Pass Liquefaction LLC | 140 | 153 | ||||||
Sunoco LP 144A | 215 | 222 | ||||||
|
| |||||||
| 2,163 | ||||||||
|
| |||||||
| Financials—16.6% | ||||||||
AerCap Ireland Capital Ltd. (Aercap Global Aviation Trust) | 200 | 205 | ||||||
Air Lease Corp. | 70 | 71 | ||||||
Allstate Corp. (The) | 180 | 193 | ||||||
Ally Financial, Inc. | 120 | 126 | ||||||
Apollo Management Holdings LP 144A | 190 | 196 | ||||||
Ares Capital Corp. | ||||||||
4.875%, 11/30/18 | 26 | 27 | ||||||
3.875%, 1/15/20 | 71 | 73 | ||||||
Ares Finance Co., LLC 144A | 270 | 262 | ||||||
Banco de Credito del Peru 144A | 175 | 195 | ||||||
Banco de Credito e Inversiones 144A | 275 | 291 | ||||||
Banco Inbursa S.A. Institucion de Banca Multiple 144A | 160 | 162 | ||||||
Banco Internacional del Peru SAA Interbank 144A | 185 | 205 | ||||||
Banco Nacional de Comercio Exterior SVC 144A | 200 | 207 | ||||||
Banco Santander Chile 144A | 215 | 228 | ||||||
Bancolombia S.A. | 260 | 271 | ||||||
| PAR VALUE | VALUE | |||||||
| Financials—continued | ||||||||
Bank of America Corp. | ||||||||
2.000%, 1/11/18 | $ | 150 | $ | 151 | ||||
5.625%, 7/1/20 | 235 | 264 | ||||||
4.450%, 3/3/26 | 340 | 365 | ||||||
Bank of India 144A | 265 | 270 | ||||||
Bank of New York Mellon Corp. (The) | 210 | 216 | ||||||
Barclays Bank plc 144A | 250 | 261 | ||||||
Berkshire Hathaway, Inc. | ||||||||
2.750%, 3/15/23 | 20 | 21 | ||||||
3.125%, 3/15/26 | 45 | 47 | ||||||
Capital One Financial Corp. | ||||||||
4.200%, 10/29/25 | 180 | 188 | ||||||
3.750%, 7/28/26 | 200 | 201 | ||||||
Citigroup, Inc. | 230 | 246 | ||||||
Compass Bank | 250 | 245 | ||||||
Development Bank of Kazakhstan OJSC 144A | 290 | 284 | ||||||
Discover Financial Services | 190 | 195 | ||||||
Ford Motor Credit Co., LLC | 235 | 265 | ||||||
FS Investment Corp. | ||||||||
4.250%, 1/15/20 | 165 | 169 | ||||||
4.750%, 5/15/22 | 40 | 41 | ||||||
General Motors Financial Co., Inc. | ||||||||
4.750%, 8/15/17 | 55 | 56 | ||||||
4.200%, 3/1/21 | 90 | 95 | ||||||
3.450%, 4/10/22 | 30 | 30 | ||||||
Goldman Sachs Group, Inc. (The) | 500 | 580 | ||||||
Hutchison Whampoa International Ltd. Series 12 144A 6.000%(2)(3)(5)(6) | 310 | 316 | ||||||
ICAHN Enterprises LP | 65 | 63 | ||||||
ING Groep NV 6.000%(2)(5)(6) | 200 | 195 | ||||||
iStar Financial, Inc. | 90 | 90 | ||||||
Jefferies Group LLC | 85 | 99 | ||||||
Kazakhstan Temir Zholy Finance BV 144A | 215 | 235 | ||||||
Leucadia National Corp. | 150 | 158 | ||||||
Liberty Mutual Group, Inc. 144A | 245 | 265 | ||||||
Lincoln National Corp. | 250 | 271 | ||||||
Macquarie Group Ltd. 144A | 210 | 240 | ||||||
Manulife Financial Corp. | 215 | 235 | ||||||
See Notes to Financial Statements
33
Table of Contents
VIRTUS BOND FUND
SCHEDULE OF INVESTMENTS (Continued)
SEPTEMBER 30, 2016
($ reported in thousands)
| PAR VALUE | VALUE | |||||||
| Financials—continued | ||||||||
Morgan Stanley | ||||||||
4.100%, 5/22/23 | $ | 155 | $ | 164 | ||||
4.350%, 9/8/26 | 340 | 363 | ||||||
6.375%, 7/24/42 | 435 | 594 | ||||||
Navient Corp. | 40 | 40 | ||||||
OM Asset Management plc | 200 | 200 | ||||||
PKO Finance AB 144A | 255 | 275 | ||||||
Prudential Financial, Inc. | ||||||||
5.875%, 9/15/42(2) | 190 | 210 | ||||||
5.625%, 6/15/43(2)(6) | 160 | 173 | ||||||
S&P Global, Inc. | 195 | 211 | ||||||
Santander Holdings USA, Inc. | 195 | 197 | ||||||
SBA Tower Trust 144A | 320 | 325 | ||||||
Societe Generale S.A. 144A | 200 | 207 | ||||||
Teachers Insurance & Annuity Association of America 144A | 160 | 162 | ||||||
Trinity Acquisition plc | ||||||||
3.500%, 9/15/21 | 15 | 16 | ||||||
4.400%, 3/15/26 | 80 | 84 | ||||||
UBS AG | 500 | 582 | ||||||
Woodside Finance Ltd. 144A | 50 | 50 | ||||||
|
| |||||||
| 12,922 | ||||||||
|
| |||||||
| Health Care—3.5% | ||||||||
AbbVie, Inc. | ||||||||
2.850%, 5/14/23 | 135 | 137 | ||||||
3.600%, 5/14/25 | 65 | 68 | ||||||
3.200%, 5/14/26 | 110 | 111 | ||||||
Capsugel S.A. PIK Interest Capitalization, 144A | 27 | 27 | ||||||
Cardinal Health, Inc. | ||||||||
3.200%, 3/15/23 | 130 | 137 | ||||||
3.750%, 9/15/25 | 165 | 179 | ||||||
Community Health Systems, Inc. | 45 | 45 | ||||||
Concordia Healthcare Corp. 144A | 10 | 6 | ||||||
Endo Finance LLC 144A | 110 | 101 | ||||||
Forest Laboratories LLC 144A | 160 | 178 | ||||||
Fresenius U.S. Finance II, Inc. 144A | 35 | 37 | ||||||
HCA, Inc. | ||||||||
5.375%, 2/1/25 | 80 | 83 | ||||||
5.250%, 6/15/26 | 20 | 21 | ||||||
4.500%, 2/15/27 | 180 | 181 | ||||||
IASIS Healthcare LLC | 80 | 73 | ||||||
| PAR VALUE | VALUE | |||||||
| Health Care—continued | ||||||||
MEDNAX, Inc. 144A | $ | 90 | $ | 95 | ||||
Mylan NV | ||||||||
144A 3.000%, | 55 | 56 | ||||||
144A 3.150%, 6/15/21(3) | 55 | 56 | ||||||
Ortho-Clinical Diagnostics, Inc. (Ortho-Clinical Diagnostics S.A.) 144A | 120 | 106 | ||||||
Owens & Minor, Inc. | 35 | 36 | ||||||
Shire Acquisitions Investments Ireland Dac | 80 | 80 | ||||||
Surgery Center Holdings, Inc. 144A | 120 | 128 | ||||||
Surgical Care Affiliates, Inc. 144A | 160 | 169 | ||||||
Team Health, Inc. 144A | 5 | 5 | ||||||
Teleflex, Inc. | 80 | 83 | ||||||
Tenet Healthcare Corp. | ||||||||
4.350%, 6/15/20(2) | 75 | 76 | ||||||
4.500%, 4/1/21 | 85 | 86 | ||||||
Teva Pharmaceutical Finance Netherlands III BV | 120 | 121 | ||||||
Universal Health Services, Inc. | ||||||||
144A 4.750%, 8/1/22(3) | 40 | 41 | ||||||
144A 5.000%, 6/1/26(3) | 95 | 99 | ||||||
Valeant Pharmaceuticals International, Inc. | ||||||||
144A 7.500%, 7/15/21(3) | 25 | 24 | ||||||
144A 5.500%, 3/1/23(3) | 50 | 43 | ||||||
Zoetis, Inc. | 45 | 47 | ||||||
|
| |||||||
| 2,735 | ||||||||
|
| |||||||
| Industrials—2.6% | ||||||||
Air Canada Pass-Through-Trust 13-1, B 144A | 81 | 84 | ||||||
AMN Healthcare, Inc. 144A | 20 | 20 | ||||||
Bombardier, Inc. 144A | 110 | 108 | ||||||
Carpenter Technology Corp. | 250 | 247 | ||||||
Continental Airlines Pass-Through-Trust | ||||||||
99-1, A 6.545%, 2/2/19 | 297 | 315 | ||||||
00-1, A1 8.048%, 11/1/20 | 249 | 279 | ||||||
GATX Corp. | 35 | 35 | ||||||
Masco Corp. | ||||||||
5.950%, 3/15/22 | 110 | 125 | ||||||
4.450%, 4/1/25 | 55 | 58 | ||||||
Owens Corning | 200 | 201 | ||||||
| PAR VALUE | VALUE | |||||||
| Industrials—continued | ||||||||
Penske Truck Leasing Co., LP 144A | $ | 75 | $ | 78 | ||||
Prime Security Services Borrower LLC (Prime Finance, Inc.) 144A | 75 | 82 | ||||||
TransDigm, Inc. | ||||||||
6.000%, 7/15/22 | 115 | 122 | ||||||
6.500%, 5/15/25 | 45 | 47 | ||||||
Wheels Up Finance I LLC | ||||||||
16-01, A 0.500%, | 43 | 42 | ||||||
16-01, A 7.500%, 6/30/24(9) | 199 | 198 | ||||||
|
| |||||||
| 2,041 | ||||||||
|
| |||||||
| Information Technology—2.7% | ||||||||
Apple, Inc. | ||||||||
2.850%, 2/23/23 | 55 | 58 | ||||||
3.250%, 2/23/26 | 155 | 165 | ||||||
Diamond 1 Finance Corp. (Diamond 2 Finance Corp.) | ||||||||
144A 5.450%, 6/15/23(3) | 40 | 43 | ||||||
144A 7.125%, 6/15/24(3) | 35 | 39 | ||||||
144A 6.020%, 6/15/26(3) | 40 | 44 | ||||||
144A 8.100%, 7/15/36(3) | 40 | 47 | ||||||
144A 8.350%, 7/15/46(3) | 45 | 54 | ||||||
Dun & Bradstreet Corp. (The) | 270 | 281 | ||||||
Electronic Arts, Inc. | 30 | 32 | ||||||
First Data Corp. 144A | 230 | 234 | ||||||
Flex Ltd. | 200 | 213 | ||||||
Hewlett Packard Enterprise Co. 144A | 120 | 128 | ||||||
Microsoft Corp. | 120 | 120 | ||||||
NXP BV (NXP Funding LLC) 144A | 200 | 214 | ||||||
Oracle Corp. | ||||||||
2.400%, 9/15/23 | 25 | 25 | ||||||
2.650%, 7/15/26 | 170 | 170 | ||||||
Verisk Analytics, Inc. | 190 | 202 | ||||||
|
| |||||||
| 2,069 | ||||||||
|
| |||||||
| Materials—2.7% | ||||||||
Alpek SA de C.V. 144A | 310 | 332 | ||||||
Berry Plastics Corp. | 145 | 148 | ||||||
Eldorado Gold Corp. 144A | 95 | 96 | ||||||
INEOS Group Holdings S.A. 144A | 200 | 197 | ||||||
Inversiones CMPC S.A. 144A | 375 | 391 | ||||||
See Notes to Financial Statements
34
Table of Contents
VIRTUS BOND FUND
SCHEDULE OF INVESTMENTS (Continued)
SEPTEMBER 30, 2016
($ reported in thousands)
| PAR VALUE | VALUE | |||||||
| Materials—continued | ||||||||
NewMarket Corp. | $ | 288 | $ | 299 | ||||
Novelis Corp. | ||||||||
144A 6.250%, 8/15/24(3) | 10 | 10 | ||||||
144A 5.875%, 9/30/26(3) | 150 | 154 | ||||||
Office Cherifien des Phosphates S.A. (OCP) 144A | 200 | 217 | ||||||
Reynolds Group Issuer, Inc. 144A | 50 | 52 | ||||||
Standard Industries, Inc. 144A | 145 | 155 | ||||||
Valvoline, Inc. 144A | 20 | 21 | ||||||
|
| |||||||
| 2,072 | ||||||||
|
| |||||||
| Real Estate—4.1% | ||||||||
Alexandria Real Estate Equities, Inc. | 120 | 126 | ||||||
American Campus Communities Operating Partnership LP | 25 | 26 | ||||||
Brixmor Operating Partnership LP | 55 | 58 | ||||||
Corporate Office Properties LP | 265 | 265 | ||||||
Corrections Corp. of America | 165 | 150 | ||||||
Developers Diversified Realty Corp. | ||||||||
7.875%, 9/1/20 | 155 | 186 | ||||||
3.500%, 1/15/21 | 130 | 135 | ||||||
Digital Realty Trust LP | 165 | 185 | ||||||
Education Realty Operating Partnership LP | 205 | 213 | ||||||
Healthcare Realty Trust, Inc. | 125 | 129 | ||||||
Kilroy Realty LP | 190 | 205 | ||||||
Kimco Realty Corp. | 185 | 195 | ||||||
MPT Operating Partnership LP | ||||||||
6.375%, 3/1/24 | 20 | 22 | ||||||
5.500%, 5/1/24 | 90 | 95 | ||||||
5.250%, 8/1/26 | 10 | 10 | ||||||
National Retail Properties, Inc. | 60 | 64 | ||||||
Retail Opportunity Investments Partnership LP | 155 | 156 | ||||||
Select Income REIT | 190 | 192 | ||||||
Sovran Acquisition LP | 125 | 128 | ||||||
Ventas Realty LP (Ventas Capital Corp.) | 250 | 261 | ||||||
| PAR VALUE | VALUE | |||||||
| Real Estate—continued | ||||||||
Welltower, Inc. | $ | 200 | $ | 212 | ||||
WP Carey, Inc. | 160 | 167 | ||||||
|
| |||||||
| 3,180 | ||||||||
|
| |||||||
| Telecommunication Services—2.5% | ||||||||
Altice Financing S.A. 144A | 200 | 206 | ||||||
AT&T, Inc. | 425 | 459 | ||||||
CenturyLink, Inc. Series Y | 140 | 150 | ||||||
Crown Castle International Corp. | 20 | 21 | ||||||
CSC Holdings LLC 144A | 110 | 113 | ||||||
Empresa Nacional de Telecomunicaciones S.A. 144A | 215 | 221 | ||||||
Qwest Corp. | 150 | 164 | ||||||
T-Mobile USA, Inc. | 135 | 150 | ||||||
Telefonica Emisiones SAU | 225 | 251 | ||||||
Windstream Corp. | 200 | 205 | ||||||
|
| |||||||
| 1,940 | ||||||||
|
| |||||||
| Utilities—1.4% | ||||||||
Dominion Resources, Inc. | 20 | 21 | ||||||
Duke Energy Corp. | 205 | 201 | ||||||
FirstEnergy Transmission LLC 144A | 210 | 225 | ||||||
NRG Yield Operating LLC | 60 | 62 | ||||||
Southern Power Co. | 230 | 248 | ||||||
State Grid Overseas Investment Ltd. 144A | 200 | 221 | ||||||
TerraForm Power Operating LLC 144A | 145 | 150 | ||||||
|
| |||||||
| 1,128 | ||||||||
| TOTAL CORPORATE BONDS AND NOTES (Identified Cost $35,002) | 36,447 | |||||||
| LOAN AGREEMENTS(2)—4.1% | ||||||||
| Consumer Discretionary—0.9% | ||||||||
Boyd Gaming Corp. Tranche B-2 | 46 | 46 | ||||||
| PAR VALUE | VALUE | |||||||
| Consumer Discretionary—continued | ||||||||
Caesars Entertainment Resort Properties LLC | $ | 155 | $ | 155 | ||||
Caesars Growth Properties Holdings LLC Tranche B, First Lien, | 60 | 59 | ||||||
CDS U.S. Intermediate Holdings, Inc. First Lien, | 40 | 40 | ||||||
Floor & Decor Outlets of America, Inc. | 77 | 77 | ||||||
Laureare Education, Inc. 2021 Extended, | 63 | 63 | ||||||
Station Casinos LLC Tranche B, | 72 | 72 | ||||||
U.S. Farathane LLC Tranche B-2, | 112 | 113 | ||||||
UFC Holdings LLC First Lien | 93 | 94 | ||||||
|
| |||||||
| 719 | ||||||||
|
| |||||||
| Consumer Staples—0.3% | ||||||||
Albertson’s LLC | 112 | 113 | ||||||
Hostess Brands LLC Tranche B, Second Lien, | 150 | 151 | ||||||
|
| |||||||
| 264 | ||||||||
|
| |||||||
| Energy—0.1% | ||||||||
Jonah Energy LLC Second Lien, | 94 | 84 | ||||||
|
| |||||||
| Health Care—1.0% | ||||||||
Ardent Legacy Acquisitions, Inc. | 79 | 79 | ||||||
CHG Healthcare Services, Inc. First Lien, | 104 | 106 | ||||||
Concordia Pharmaceuticals, Inc. | 66 | 59 | ||||||
InVentiv Health, Inc. | ||||||||
Tranche B-4, | 110 | 110 | ||||||
Tranche B | 58 | 58 | ||||||
MMM Holdings, Inc. | 50 | 49 | ||||||
MPH Acquisition Holdings LLC | 46 | 46 | ||||||
MSO of Puerto Rico, Inc. | 36 | 35 | ||||||
See Notes to Financial Statements
35
Table of Contents
VIRTUS BOND FUND
SCHEDULE OF INVESTMENTS (Continued)
SEPTEMBER 30, 2016
($ reported in thousands)
| PAR VALUE | VALUE | |||||||
| Health Care—continued | ||||||||
NVA Holdings, Inc. Second Lien, | $ | 64 | $ | 64 | ||||
Quorum Health Corp. | 92 | 89 | ||||||
Surgery Center Holdings, Inc. First Lien, | 99 | 100 | ||||||
|
| |||||||
| 795 | ||||||||
|
| |||||||
| Industrials—0.5% | ||||||||
Brickman Group Ltd. LLC (The) Second Lien, | 78 | 78 | ||||||
McGraw-Hill Global Education Holdings LLC Tranche B, First Lien, | 98 | 99 | ||||||
Navistar, Inc. Tranche B | 120 | 120 | ||||||
Sedgwick Claims Management Services, Inc. Second Lien, | 120 | 119 | ||||||
|
| |||||||
| 416 | ||||||||
|
| |||||||
| Information Technology—0.5% | ||||||||
Donnelley Financial Solutions | 41 | 41 | ||||||
First Data Corp. Tranche 2022 | 145 | 146 | ||||||
NXP BV Tranche F | 74 | 75 | ||||||
On Semiconductor | 50 | 50 | ||||||
SS&C European Holdings S.a.r.l. | ||||||||
Tranche B-2, | 5 | 5 | ||||||
Tranche B-1, | 41 | 42 | ||||||
Western Digital Corp. Tranche B-1, | 14 | 14 | ||||||
|
| |||||||
| 373 | ||||||||
|
| |||||||
| Materials—0.1% | ||||||||
Huntsman International LLC Tranche 16-B, | 44 | 44 | ||||||
INEOS U.S. Finance LLC Tranche 2022, | 9 | 9 | ||||||
|
| |||||||
| 53 | ||||||||
|
| |||||||
| Real Estate—0.1% | ||||||||
Capital Automotive LP Second Lien, | 71 | 72 | ||||||
|
| |||||||
| PAR VALUE | VALUE | |||||||
| Telecommunication Services—0.2% | ||||||||
T-Mobile USA, Inc. Senior Lien | $ | 85 | $ | 86 | ||||
UPC Financing Partnership | 63 | 63 | ||||||
|
| |||||||
| 149 | ||||||||
|
| |||||||
| Utilities—0.4% | ||||||||
Energy Future Holdings Corp. | ||||||||
5.000%, 7/27/23(4) | 70 | 71 | ||||||
Tranche C | 17 | 17 | ||||||
NRG Energy, Inc. | 236 | 236 | ||||||
|
| |||||||
| 324 | ||||||||
| TOTAL LOAN AGREEMENTS (Identified Cost $3,243) | 3,249 | |||||||
| SHARES | ||||||||
| PREFERRED STOCKS—3.2% | ||||||||
| Energy—0.3% | ||||||||
PTT Exploration & Production PCL 144A, | 200 | (11) | 204 | |||||
|
| |||||||
| Financials—2.0% | ||||||||
Bank of New York Mellon Corp. (The) Series E, 4.950%(2) | 150 | (11) | 153 | |||||
Citigroup, Inc. | ||||||||
Series J 7.125%(2) | 8,000 | 232 | ||||||
Series N 6.250%(2) | 155 | (11) | 167 | |||||
JPMorgan Chase & Co. Series Z, 5.300%(2) | 45 | (11) | 46 | |||||
KeyCorp. 5.000%(2) | 190 | (11) | 187 | |||||
PNC Financial Services Group, Inc. (The) Series R, 4.850%(2) | 215 | (11) | 214 | |||||
SunTrust Bank, Inc. 5.625%(2) | 45 | (11) | 47 | |||||
Wells Fargo & Co. Series K, 7.980%(2) | 230 | (11) | 240 | |||||
Zions Bancorp | 8,800 | 261 | ||||||
|
| |||||||
| 1,547 | ||||||||
|
| |||||||
| Industrials—0.9% | ||||||||
General Electric Co. Series D, 5.000%(2) | 686 | (11) | 729 | |||||
| TOTAL PREFERRED STOCKS (Identified Cost $2,328) | 2,481 | |||||||
| EXCHANGE-TRADED FUND—1.1% | ||||||||
iShares iBoxx $ Investment Grade Corporate Bond Fund(13) | 6,725 | 828 | ||||||
| TOTAL EXCHANGE-TRADED FUND (Identified Cost $803) | 828 | |||||||
| SHARES | VALUE | |||||||
| AFFILIATED MUTUAL FUND—1.5% | ||||||||
Virtus Credit Opportunities Fund Class R6(13) | 117,904 | $ | 1,159 | |||||
| TOTAL AFFILIATED MUTUAL FUND (Identified Cost $1,179) | 1,159 | |||||||
| TOTAL LONG TERM INVESTMENTS—99.1% | ||||||||
| (Identified Cost $74,754) | 77,124 | (12) | ||||||
| TOTAL INVESTMENTS—99.1% (Identified Cost $74,754) | 77,124 | (1) | ||||||
Other assets and liabilities, net—0.9% |
| 731 | ||||||
|
| |||||||
| NET ASSETS—100.0% | $ | 77,855 | ||||||
|
| |||||||
Abbreviations:
| FHLMC | Federal Home Loan Mortgage Corporation (“Freddie Mac”). |
| FNMA | Federal National Mortgage Association (“Fannie Mae”). |
| GNMA | Government National Mortgage Association (“Ginnie Mae”) |
| PIK | Payment-in-Kind Security |
| REIT | Real Estate Investment Trust |
Footnote Legend:
| (1) | Federal Income Tax Information: For tax information at September 30, 2016, see Note 10 Federal Income Tax Information in the Notes to Financial Statements. |
| (2) | Variable or step coupon security; interest rate shown reflects the rate in effect at September 30, 2016. |
| (3) | Security exempt from registration under Rule 144A of the Securities Act of 1933. These securities may be resold in transactions exempt from registration, normally to qualified institutional buyers. At September 30, 2016, these securities amounted to a value of $22,599 or 29.0% of net assets. |
| (4) | Security in default, interest payments are being received during the bankruptcy proceedings. |
| (5) | No contractual maturity date. |
| (6) | Interest payments may be deferred. |
| (7) | This Note was issued for the sole purpose of funding a loan agreement between the issuer and the borrower. As the credit risk for this security lies solely with the borrower, the name represented here is that of the borrower. |
| (8) | 100% of the income received was in cash. |
| (9) | Illiquid security. |
| (10) | This loan will settle after September 30, 2016, at which time the interest rate, based on the London Interbank Offered Rate (“LIBOR”) and the agreed upon spread on trade date, will be reflected. |
| (11) | Value shown as par value. |
| (12) | All or a portion of the Fund’s assets have been segregated for delayed delivery securities. |
| (13) | Shares of these funds are publicly offered and the prospectus and annual reports of each are publicly available. |
| (14) | Security in default, a portion of the interest payments are being received during the bankruptcy proceedings. |
| (15) | Represents unfunded portion of security and commitment fee earned on this portion. |
Security abbreviation definitions are located under the Key Investment Terms starting on page 4.
See Notes to Financial Statements
36
Table of Contents
VIRTUS BOND FUND
SCHEDULE OF INVESTMENTS (Continued)
SEPTEMBER 30, 2016
($ reported in thousands)
| Country Weightings† (Unaudited) | ||||
United States | 86 | % | ||
Canada | 1 | |||
Chile | 1 | |||
Mexico | 1 | |||
Netherlands | 1 | |||
Switzerland | 1 | |||
United Kingdom | 1 | |||
Other | 8 | |||
Total | 100 | % | ||
† % of total investments as of September 30, 2016 |
| |||
The following table provides a summary of inputs used to value the Fund’s investments as of September 30, 2016 (See Security Valuation Note 2A in the Notes to Financial Statements):
| Total Value at September 30, 2016 | Level 1 Quoted Prices | Level 2 Significant Observable Inputs | Level 3 Significant Unobservable Inputs | |||||||||||||
Debt Securities: | ||||||||||||||||
Asset-Backed Securities | $ | 4,007 | $ | — | $ | 4,007 | $ | — | ||||||||
Corporate Bonds And Notes | 36,447 | — | 36,207 | 240 | ||||||||||||
Foreign Government Securities | 1,179 | — | 1,179 | — | ||||||||||||
Loan Agreements | 3,249 | — | 3,249 | — | ||||||||||||
Mortgage-Backed Securities | 20,872 | — | 20,872 | — | ||||||||||||
Municipal Bonds | 1,133 | — | 1,133 | — | ||||||||||||
U.S. Government Securities | 5,769 | — | 5,769 | — | ||||||||||||
Equity Securities: | ||||||||||||||||
Affiliated Mutual Fund | 1,159 | 1,159 | — | — | ||||||||||||
Exchange-Traded Funds | 828 | 828 | — | — | ||||||||||||
Preferred Stocks | 2,481 | 493 | 1,988 | — | ||||||||||||
|
|
|
|
|
|
|
| |||||||||
Total Investments | $ | 77,124 | $ | 2,480 | $ | 74,404 | $ | 240 | ||||||||
|
|
|
|
|
|
|
| |||||||||
There were no transfers from Level 1 to Level 2 related to securities held as of September 30, 2016.
Securities held by the Fund with an end of period value of $261 were transferred from Level 2 into Level 1 since starting to use an exchange price.
The following is a reconciliation of assets of the Fund for Level 3 investments for which significant unobservable inputs were used to determine fair value.
| Corporate Bonds and Notes | ||||
Investments in Securities | ||||
Balance as of September 30, 2015: | $ | — | ||
Accrued discount/(premium) | — | (c) | ||
Realized gain (loss) | — | (c) | ||
Change in unrealized appreciation (depreciation) | — | (c) | ||
Purchases | 443 | |||
Sales(b) | (203 | ) | ||
Transfers into Level 3(a) | — | |||
Transfers from Level 3(a) | — | |||
|
| |||
Balance as of September 30, 2016 | $ | 240 | (d) | |
|
| |||
| (a) | “Transfers into and/or from” represent the ending value as of September 30, 2016, for any investment security where a change in the pricing level occurred from the beginning to the end of the period. |
| (b) | Includes paydown on securities. |
| (c) | Amount is less than $500. |
| (d) | The Fund’s investments that are categorized as Level 3 were valued utilizing third party pricing information without adjustment. Such valuations are based on unobservable inputs. A significant change in third party information could result in a significantly lower or higher value of Level 3 investments. |
None of the securities in this table are internally fair valued.
See Notes to Financial Statements
37
Table of Contents
SEPTEMBER 30, 2016
($ reported in thousands)
| PAR VALUE | VALUE | |||||||
| MUNICIPAL TAX-EXEMPT BONDS(2)—97.1% | ||||||||
| Development Revenue—12.9% | ||||||||
Garden Grove Agency for Community Development Successor Agency, Garden Grove Community Project, (BAM Insured) | $ | 350 | $ | 431 | ||||
Lafayette Redevelopment Agency Successor Agency, Lafayette Redevelopment Project, (AGM Insured) | 250 | 294 | ||||||
Los Angeles County Redevelopment Refunding Authority, Long Beach Project, | 215 | 259 | ||||||
Menlo Park Community Development Agency Successor Agency, Las Pulgas Community Development Project ,(AGM Insured) | 100 | 123 | ||||||
Milpitas Redevelopment Agency Successor Agency Redevelopment Project Area No.1, | 250 | 306 | ||||||
Palmdale Community Redevelopment Agency Successor Agency, Subordinate Lien, (NATL Insured) | 300 | 364 | ||||||
Sacramento Redevelopment Agency Successor Agency | ||||||||
(BAM Insured) 5.000%, 12/1/33 | 75 | 90 | ||||||
(BAM Insured) 5.000%, 12/1/34 | 75 | 90 | ||||||
San Diego Redevelopment Agency, Center City Redevelopment Project, (AMBAC Insured) | 500 | 501 | ||||||
San Marcos Redevelopment Agency Successor Agency, | 250 | 303 | ||||||
San Mateo Redevelopment Agency Successor Agency, | 250 | 306 | ||||||
Santa Clara Redevelopment Agency, Bayshore North Project, (NATL Insured) | 500 | 503 | ||||||
Union City Redevelopment Agency Successor Agency, Union City Redevelopment Project, | 200 | 239 | ||||||
Westminster Redevelopment Agency Successor Agency (BAM Insured) | 200 | 221 | ||||||
|
| |||||||
| 4,030 | ||||||||
|
| |||||||
| PAR VALUE | VALUE | |||||||
| General Obligation—13.0% | ||||||||
Cajon Valley Union School District, | $ | 250 | $ | 305 | ||||
California State of, | ||||||||
5.500%, 3/1/26 | 250 | 267 | ||||||
(AMBAC Insured) 5.000%, 2/1/27 | 290 | 377 | ||||||
5.000%, 9/1/32 | 300 | 354 | ||||||
5.000%, 12/1/37 | 75 | 78 | ||||||
6.000%, 4/1/38 | 250 | 281 | ||||||
Grossmont Healthcare District | 350 | 451 | ||||||
Los Alamitos Unified School District, School Facilities Improvement District No.1, 2008 Election | 250 | 304 | ||||||
Midpeninsula Regional Open Space District | 100 | 113 | ||||||
Oakland Unified School District | ||||||||
(AGM Insured) 5.000%, 8/1/24 | 200 | 253 | ||||||
5.000%, 8/1/33 | 300 | 365 | ||||||
Ross Valley School District, | 350 | 411 | ||||||
San Diego Community College District, | 150 | 180 | ||||||
San Diego Unified School District, (AGM Insured) | 225 | 301 | ||||||
|
| |||||||
| 4,040 | ||||||||
|
| |||||||
| General Revenue—8.3% | ||||||||
California Infrastructure & Economic Development Bank | 250 | 250 | ||||||
5.000%, 10/1/23 | 200 | 250 | ||||||
California State Municipal Finance Authority, Bowles Hall Foundation 4.000%, 6/1/22 | 100 | 110 | ||||||
Golden State Tobacco Securitization Corp., | ||||||||
5.000%, 6/1/29 | 350 | 421 | ||||||
5.125%, 6/1/47 | 950 | 948 | ||||||
Midpeninsula Regional Open Space District, Promissory Notes | 120 | 151 | ||||||
South Bay Regional Public Communications Authority, Hawthorne Projects, (ACA Insured) | 435 | 439 | ||||||
|
| |||||||
| 2,569 | ||||||||
|
| |||||||
| Higher Education Revenue—4.1% | ||||||||
California Educational Facilities Authority, Pomona College, | 500 | 501 | ||||||
California State University | 300 | 367 | ||||||
University of California, | ||||||||
General Revenue | 100 | 125 | ||||||
| PAR VALUE | VALUE | |||||||
| Higher Education Revenue—continued | ||||||||
Limited Projects Revenue | $ | 225 | $ | 280 | ||||
|
| |||||||
| 1,273 | ||||||||
|
| |||||||
| Lease Revenue—9.7% | ||||||||
California State Public Works Board, | ||||||||
Department of General Services, Buildings 8&9 | 500 | 563 | ||||||
Capital Projects, | 550 | 626 | ||||||
Department of Forestry & Fire Protection, | 500 | 520 | ||||||
Municipal Improvement Corp. of Los Angeles Real Property | 250 | 305 | ||||||
San Diego Regional Building Authority, County Operations Center | 335 | 407 | ||||||
Ventura County Public Financing Authority, | 250 | 305 | ||||||
West Hollywood Public Financing Authority, West Hollywood Park Phase II | 250 | 306 | ||||||
|
| |||||||
| 3,032 | ||||||||
|
| |||||||
| Medical Revenue—7.8% | ||||||||
California Municipal Finance Authority, Community Medical Centers, | 100 | 120 | ||||||
California State Health Facilities Financing Authority, | ||||||||
El Camino Hospital, | 100 | 124 | ||||||
Cedars-Sinai Medical Center, | 250 | 309 | ||||||
Sutter Health, | 125 | 153 | ||||||
Providence St. Joseph Health | 50 | 55 | ||||||
Lucille Salter Packard Children’s Hospital at Stanford, | 100 | 118 | ||||||
Sutter Health, | 135 | 162 | ||||||
California Statewide Communities Development Authority, | ||||||||
Kaiser Permanente | 300 | 300 | ||||||
Loma Linda University Medical Center, | 100 | 118 | ||||||
John Muir Health Center | 100 | 121 | ||||||
Cottage Health System, | 250 | 295 | ||||||
See Notes to Financial Statements
38
Table of Contents
VIRTUS CA TAX-EXEMPT BOND
SCHEDULE OF INVESTMENTS (Continued)
SEPTEMBER 30, 2016
($ reported in thousands)
| PAR VALUE | VALUE | |||||||
| Medical Revenue—continued | ||||||||
Loma Linda University Medical Center, | $ | 100 | $ | 114 | ||||
Regents of The University of California Medical Center Pooled Revenue | 250 | 291 | ||||||
San Benito Health Care District, (CHFCLIF Insured) | 140 | 146 | ||||||
|
| |||||||
| 2,426 | ||||||||
|
| |||||||
| Natural Gas Revenue—2.5% | ||||||||
Roseville Natural Gas Financing Authority, | ||||||||
5.000%, 2/15/24 | 450 | 530 | ||||||
5.000%, 2/15/27 | 195 | 236 | ||||||
|
| |||||||
| 766 | ||||||||
|
| |||||||
| Power Revenue—2.3% | ||||||||
Northern California Power Agency, Hydroelectric Project No.1, | 200 | 235 | ||||||
Sacramento Municipal Utility District, | 150 | 185 | ||||||
Southern California Public Power Authority, Windy Point Project, | 250 | 285 | ||||||
|
| |||||||
| 705 | ||||||||
|
| |||||||
| Pre-Refunded—14.6% | ||||||||
Bay Area Toll Authority, (Pre-refunded 4/1/19 @100) | 425 | 469 | ||||||
California State Health Facilities Financing Authority, Providence Health & Services, (Pre-refunded 10/1/18 @100) | 195 | 217 | ||||||
Providence Health & Services, (Pre-refunded 10/1/18 @100) | 5 | 6 | ||||||
California State Infrastructure & Economic Development Bank, Bay Area Toll Bridges (Pre-refunded 7/1/26 @100) (AMBAC Insured) | 530 | 698 | ||||||
California State of, (Pre-refunded 12/1/2017 @ 100) | 200 | 210 | ||||||
California State University, (Pre-refunded 5/1/19 @ 100) | 500 | 556 | ||||||
California Statewide Communities Development Authority, | ||||||||
Sutter Health, (AMBAC Insured) | 205 | 210 | ||||||
| PAR VALUE | VALUE | |||||||
| Pre-Refunded—continued | ||||||||
St. Joseph Health System, (FGIC Insured) (Pre-refunded 7/1/18 @100) | $ | 350 | $ | 380 | ||||
City of Stockton CA, (GNMA Collateralized) (Pre-refunded 9/20/17 @ 100) | 150 | 157 | ||||||
County of Riverside CA, (Escrowed to Maturity) (GNMA Collateralized) | 1,085 | 1,391 | ||||||
Northern California Power Agency, (AMBAC Insured) (Pre-refunded 7/1/21 @ 100) | 195 | 236 | ||||||
|
| |||||||
| 4,530 | ||||||||
|
| |||||||
| Special Tax Revenue—4.9% | ||||||||
Chula Vista Municipal Financing Authority, | 200 | 244 | ||||||
North City West School Facilities Financing Authority, (AMBAC Insured) | 635 | 709 | ||||||
Sacramento Area Flood Control Agency, Consololidated Capital Assessment District (BHAC Insured) | 250 | 273 | ||||||
Tustin Unified School District, Community Facilities District No. 97-1, (BAM Insured) | 250 | 298 | ||||||
|
| |||||||
| 1,524 | ||||||||
|
| |||||||
| Transportation Revenue—5.9% | ||||||||
Los Angeles Department of Airports | 200 | 246 | ||||||
Los Angeles Harbor Department, | 235 | 282 | ||||||
San Diego County Regional Airport Authority, | 400 | 449 | ||||||
San Diego County Regional Transportation Commission | 100 | 123 | ||||||
San Diego Unified Port District, | 200 | 238 | ||||||
San Francisco City & County Airport Commission, San Francisco International Airport, | 150 | 174 | ||||||
San Francisco Municipal Transportation Agency, | ||||||||
5.000%, 3/1/31 | 125 | 150 | ||||||
5.000%, 3/1/33 | 150 | 183 | ||||||
|
| |||||||
| 1,845 | ||||||||
|
| |||||||
| PAR VALUE | VALUE | |||||||
| Water & Sewer Revenue—11.1% | ||||||||
East Bay Municipal Utility District Water System Revenue | $ | 270 | $ | 332 | ||||
Los Angeles Department of Water & Power, | 295 | 360 | ||||||
Manteca, City of, Water Revenue, | 300 | 362 | ||||||
Metropolitan Water District of Southern California | 300 | 300 | ||||||
Oakland, City of, Sewer Revenue, | 200 | 245 | ||||||
Ross Valley Public Financing Authority, Sanitary District No.1 (AGM Insured) | 225 | 269 | ||||||
San Diego County Water Authority, 5.000%, 5/1/31 | 250 | 304 | ||||||
San Diego Public Facilities Financing Authority Sewer Revenue | 500 | 614 | ||||||
Santa Margarita-Dana Point Authority, Water Improvement Districts Nos. 2,3,4, | 630 | 674 | ||||||
|
| |||||||
| 3,460 | ||||||||
| TOTAL MUNICIPAL TAX-EXEMPT BONDS (Identified Cost $28,050) | 30,200 | |||||||
| TOTAL LONG TERM INVESTMENTS—97.1% | ||||||||
| (Identified Cost $28,050) | 30,200 | |||||||
| TOTAL INVESTMENTS—97.1% (Identified Cost $28,050) | 30,200 | (1) | ||||||
Other assets and liabilities, net—2.9% |
| 913 | ||||||
|
| |||||||
| NET ASSETS—100.0% | $ | 31,113 | ||||||
|
| |||||||
Abbreviations:
| ACA | American Capital Access Financial Guarantee Corp. |
| AGM | Assured Guaranty Municipal Corp. |
| AMBAC | American Municipal Bond Assurance Corp. |
| BAM | Build America Municipal Insured. |
| BHAC | Berkshire Hathaway Assurance Corp. |
| CHFCLIF | California Health Facility Construction Loan Insurance Fund. |
| FGIC | Financial Guaranty Insurance Company |
| GNMA | Government National Mortgage Association (“Ginnie Mae”) |
| NATL | National Public Finance Guarantee Corp. |
Security abbreviation definitions are located under the Key Investment Terms starting on page 4.
See Notes to Financial Statements
39
Table of Contents
VIRTUS CA TAX-EXEMPT BOND
SCHEDULE OF INVESTMENTS (Continued)
SEPTEMBER 30, 2016
($ reported in thousands)
Footnote Legend:
| (1) | Federal Income Tax Information: For tax information at September 30, 2016, see Note 10 Federal Income Tax Information in the Notes to Financial Statements. |
| (2) | At September 30, 2016, the concentration of the Fund’s investments by state or territory determined as a percentage of net assets is as follows: California 100%. At September 30, 2016, 30.40% of the securities in the portfolio are backed by insurance of financial institutions and financial guaranty assurance agencies. None of the insurers’ concentration exceeds 10% of the Fund’s net assets. |
| (3) | Variable or step coupon security; interest rate shown reflects the rate in effect at September 30, 2016. |
| (4) | Security exempt from registration under Rule 144A of the Securities Act of 1933. These securities may be resold in transactions exempt from registration, normally to qualified institutional buyers. At September 30, 2016, these securities amounted to a value of $232 or 0.7% of net assets. |
The following table provides a summary of inputs used to value the Fund’s investments as of September 30, 2016 (See Security Valuation Note 2A in the Notes to Financial Statements):
| Total Value at September 30, 2016 | Level 2 Significant Observable Inputs | |||||||
Debt Securities: | ||||||||
Municipal Tax-Exempt Bonds | $ | 30,200 | $ | 30,200 | ||||
|
|
|
| |||||
Total Investments | $ | 30,200 | $ | 30,200 | ||||
|
|
|
| |||||
There are no Level 1 (quoted prices) or Level 3 (significant unobservable inputs) priced securities.
There were no transfers between Level 1 and Level 2 related to securities held at September 30, 2016.
See Notes to Financial Statements
40
Table of Contents
VIRTUS ESSENTIAL RESOURCES FUND
SEPTEMBER 30, 2016
($ reported in thousands)
| SHARES | VALUE | |||||||
| COMMON STOCKS—97.9% | ||||||||
| Consumer Discretionary—6.9% | ||||||||
BorgWarner, Inc. (United States) | 978 | $ | 34 | |||||
Coway Co., Ltd. (South Korea) | 529 | 46 | ||||||
Delphi Automotive plc | 707 | 51 | ||||||
EnerCare, Inc. (Canada) | 5,722 | 82 | ||||||
Johnson Controls International plc (Ireland) | 2,108 | 98 | ||||||
LKQ Corp. (United States)(2) | 573 | 20 | ||||||
|
| |||||||
| 331 | ||||||||
|
| |||||||
| Consumer Staples—15.8% | ||||||||
Adecoagro SA (Brazil)(2) | 4,811 | 55 | ||||||
AG Growth International, Inc. (Canada) | 476 | 16 | ||||||
Andersons, Inc. (The) | 425 | 15 | ||||||
Archer-Daniels-Midland Co. (United States) | 2,127 | 90 | ||||||
BRF SA (Brazil) | 1,900 | 33 | ||||||
Bunge Ltd. (United States) | 1,290 | 76 | ||||||
Dean Foods Co. (United States) | 1,587 | 26 | ||||||
Glanbia plc (Ireland) | 1,039 | 20 | ||||||
Golden Agri-Resources Ltd. (Singapore) | 152,500 | 40 | ||||||
Greencore Group plc (Ireland) | 6,917 | 30 | ||||||
Ingredion, Inc. (United States) | 122 | 16 | ||||||
JBS SA (Brazil) | 11,800 | 43 | ||||||
KWS SAAT AG (Germany) | 65 | 22 | ||||||
Minerva SA (Brazil)(2) | 10,900 | 33 | ||||||
Origin Enterprises plc | 5,210 | 33 | ||||||
PureCircle Ltd. (United Kingdom)(2) | 6,672 | 24 | ||||||
SLC Agricola SA (Brazil) | 13,700 | 59 | ||||||
SunOpta, Inc. (Canada)(2) | 5,108 | 36 | ||||||
Tyson Foods, Inc. Class A | 429 | 32 | ||||||
United Natural Foods, Inc. | 676 | 27 | ||||||
Wilmar International Ltd. (Singapore) | 13,200 | 31 | ||||||
|
| |||||||
| 757 | ||||||||
|
| |||||||
| Energy—4.3% | ||||||||
CHORUS Clean Energy AG (Germany)(2) | 1,356 | 16 | ||||||
Cosan Ltd. (Brazil) | 11,400 | 81 | ||||||
Energiekontor AG (Germany) | 3,103 | 51 | ||||||
Energy Development Corp. (Philippines) | 146,000 | 18 | ||||||
Pattern Energy Group, Inc. | 957 | 22 | ||||||
TransAlta Renewables, Inc. (Canada) | 1,658 | 19 | ||||||
|
| |||||||
| 207 | ||||||||
|
| |||||||
| Financials—3.6% | ||||||||
Capital Stage AG (Germany) | 510 | 4 | ||||||
Hannon Armstrong Sustainable Infrastructure Capital, Inc. (United States) | 1,529 | 36 | ||||||
| SHARES | VALUE | |||||||
| Financials—continued | ||||||||
PICO Holdings, Inc. | 5,805 | $ | 68 | |||||
Renewables Infrastructure Group Ltd. (The) (United Kingdom) | 34,076 | 47 | ||||||
Saeta Yield SA (Spain) | 1,912 | 19 | ||||||
|
| |||||||
| 174 | ||||||||
|
| |||||||
| Health Care—2.9% | ||||||||
Agilent Technologies, Inc. | 664 | 31 | ||||||
Danaher Corp. (United States) | 934 | 73 | ||||||
Genus plc (United Kingdom) | 511 | 13 | ||||||
Novozymes A/S Class B (Denmark) | 452 | 20 | ||||||
|
| |||||||
| 137 | ||||||||
|
| |||||||
| Industrials—26.5% | ||||||||
Aalberts Industries NV (Netherlands) | 527 | 18 | ||||||
Aegion Corp. (United States)(2) | 843 | 16 | ||||||
Ameresco, Inc. Class A | 5,848 | 31 | ||||||
Amiad Water Systems Ltd. (Israel) | 7,152 | 13 | ||||||
Arcadis NV (Netherlands) | 1,973 | 28 | ||||||
BayWa AG (Germany) | 1,462 | 48 | ||||||
Broadwind Energy, Inc. | 1,170 | 5 | ||||||
China Everbright International Ltd. (Hong Kong) | 17,000 | 20 | ||||||
Costain Group plc | 6,827 | 32 | ||||||
Covanta Holding Corp. | 5,786 | 89 | ||||||
Deere & Co. (United States) | 304 | 26 | ||||||
DIRTT Environmental Solutions (Canada)(2) | 2,406 | 9 | ||||||
Eaton Corp. plc (United States) | 533 | 35 | ||||||
FuelCell Energy, Inc. | 582 | 3 | ||||||
GEA Group AG (Germany) | 745 | 41 | ||||||
H2O Innovation, Inc. | 9,874 | 13 | ||||||
HD Supply Holdings, Inc. | 1,633 | 52 | ||||||
Honeywell International, Inc. (United States) | 402 | 47 | ||||||
IDEX Corp. (United States) | 170 | 16 | ||||||
Kingspan Group plc (Ireland)(2) | 1,287 | 35 | ||||||
Kubota Corp. (Japan) | 5,400 | 82 | ||||||
Kurita Water Industries Ltd. (Japan) | 1,400 | 33 | ||||||
Lumenpulse, Inc. (Canada)(2) | 1,891 | 24 | ||||||
METAWATER Co., Ltd. (Japan) | 700 | 19 | ||||||
Nordex SE (Germany)(2) | 1,498 | 46 | ||||||
Pentair plc (United States) | 961 | 62 | ||||||
PNE Wind AG (Germany) | 10,370 | 25 | ||||||
Rexnord Corp. (United States)(2) | 2,207 | 47 | ||||||
Roper Technologies, Inc. | 268 | 49 | ||||||
RPS Group plc (United Kingdom) | 7,076 | 16 | ||||||
Senvion SA (Luxembourg)(2) | 1,200 | 22 | ||||||
SPX Corp. (United States)(2) | 2,608 | 53 | ||||||
Stantec, Inc. (Canada) | 1,367 | 32 | ||||||
Tetra Tech, Inc. (United States) | 1,050 | 37 | ||||||
| SHARES | VALUE | |||||||
| Industrials—continued | ||||||||
Vestas Wind Systems A/S (Denmark) | 779 | $ | 64 | |||||
Xylem, Inc. (United States) | 728 | 38 | ||||||
Zumtobel Group AG (Austria) | 2,224 | 43 | ||||||
|
| |||||||
| 1,269 | ||||||||
|
| |||||||
| Information Technology—7.5% | ||||||||
Canadian Solar, Inc. | 1,037 | 14 | ||||||
First Solar, Inc. | 887 | 35 | ||||||
Infineon Technologies AG (Germany) | 2,033 | 36 | ||||||
NXP Semiconductors NV (Netherlands)(2) | 592 | 60 | ||||||
Power Integrations, Inc. | 537 | 34 | ||||||
PSI AG Gesellschaft Fuer Produkte Und Systeme Der Informationstechnologie (Germany) | 838 | 12 | ||||||
Pure Technologies Ltd. (Canada) | 13,648 | 61 | ||||||
SolarEdge Technologies, Inc. (United States)(2) | 1,196 | 21 | ||||||
SunPower Corp. | 4,450 | 40 | ||||||
Trimble Navigation Ltd. | 1,313 | 38 | ||||||
Universal Display Corp. | 165 | 9 | ||||||
|
| |||||||
| 360 | ||||||||
|
| |||||||
| Materials—13.9% | ||||||||
Agrium, Inc. (Canada) | 712 | 65 | ||||||
Calgon Carbon Corp. | 3,778 | 57 | ||||||
CF Industries Holdings, Inc. (United States) | 1,654 | 40 | ||||||
Ecolab, Inc. (United States) | 325 | 40 | ||||||
FMC Corp. (United States) | 505 | 24 | ||||||
Israel Chemicals Ltd. (Israel) | 5,839 | 23 | ||||||
Kemira Oyj (Finland) | 1,231 | 17 | ||||||
Koninklijke Dsm NV (Netherlands) | 273 | 18 | ||||||
Monsanto Co. (United States) | 1,121 | 115 | ||||||
Mosaic Co. (The) (United States) | 1,403 | 34 | ||||||
PhosAgro OAO GDR Registered Shares (Russia) | 2,987 | 38 | ||||||
Potash Corp. of Saskatchewan, Inc. (Canada) | 2,557 | 42 | ||||||
Syngenta AG Registered Shares (Switzerland) | 278 | 122 | ||||||
Yara International ASA (Norway) | 989 | 33 | ||||||
|
| |||||||
| 668 | ||||||||
|
| |||||||
| Real Estate—0.4% | ||||||||
Gladstone Land Corp. | 1,612 | 17 | ||||||
|
| |||||||
| Utilities—16.1% | ||||||||
American Water Works Co., Inc. (United States) | 207 | 16 | ||||||
Aqua America, Inc. (United States) | 781 | 24 | ||||||
Atlantica Yield plc | 1,670 | 32 | ||||||
See Notes to Financial Statements
41
Table of Contents
VIRTUS ESSENTIAL RESOURCES FUND
SCHEDULE OF INVESTMENTS (Continued)
SEPTEMBER 30, 2016
($ reported in thousands)
| SHARES | VALUE | |||||||
| Utilities—continued | ||||||||
Beijing Enterprises Water Group Ltd. Class H (Hong Kong) | 52,000 | $ | 35 | |||||
California Water Service Group (United States) | 536 | 17 | ||||||
China Water Affairs Group Ltd. (Bermuda) | 28,000 | 18 | ||||||
CT Environmental Group Ltd. (Cayman Islands) | 28,000 | 8 | ||||||
EDP Renovaveis SA (Spain) | 9,093 | 73 | ||||||
Global Water Resources, Inc. (United States) | 879 | 7 | ||||||
Guangdong Investments Ltd. (China) | 16,000 | 26 | ||||||
Huaneng Renewables Corp., Ltd. Class H (China) | 146,000 | 51 | ||||||
Iberdrola SA (Spain) | 9,664 | 66 | ||||||
Manila Water Co., Inc. (Philippines) | 30,100 | 18 | ||||||
NextEra Energy, Inc. | 156 | 19 | ||||||
Northland Power, Inc. (Canada) | 607 | 11 | ||||||
NRG Yield, Inc. Class C | 2,712 | 46 | ||||||
Pennon Group plc (United Kingdom) | 2,114 | 24 | ||||||
SevernTrent plc (United Kingdom) | 925 | 30 | ||||||
Silver Spring Networks, Inc. (United States)(2) | 3,072 | 44 | ||||||
| SHARES | VALUE | |||||||
| Utilities—continued | ||||||||
Suez Environnement SA (France) | 5,031 | $ | 83 | |||||
United Utilities Group plc | 3,696 | 48 | ||||||
Veolia Environnement SA (France) | 3,327 | 77 | ||||||
|
| |||||||
| 773 | ||||||||
| TOTAL COMMON STOCKS (Identified Cost $4,619) | 4,693 | |||||||
| CLOSED END FUND—0.7% | ||||||||
| Financials—0.7% | ||||||||
Greencoat UK Wind plc Fund (United Kingdom)(3) | 23,384 | 35 | ||||||
| TOTAL CLOSED END FUND (Identified Cost $35) | 35 | |||||||
| TOTAL LONG TERM INVESTMENTS—98.6% | ||||||||
| (Identified Cost $4,654) | 4,728 | |||||||
| TOTAL INVESTMENTS—98.6% (Identified Cost $4,654) | 4,728 | (1) | ||||||
Other assets and liabilities, net—1.4% |
| 67 | ||||||
|
| |||||||
| NET ASSETS—100.0% | $ | 4,795 | ||||||
|
| |||||||
Abbreviation:
| GDR | Global Depositary Receipt |
Footnote Legend:
| (1) | Federal Income Tax Information: For tax information at September 30, 2016, see Note 10 Federal Income Tax Information in the Notes to Financial Statements. |
| (2) | Non-income producing. |
| (3) | Shares of this fund are publicly offered and its prospectus and annual report are publicly available. |
| Country Weightings† (Unaudited) | ||||
United States | 39 | % | ||
Canada | 9 | |||
United Kingdom | 8 | |||
Brazil | 6 | |||
Germany | 6 | |||
Ireland | 5 | |||
France | 3 | |||
Other | 24 | |||
Total | 100 | % | ||
† % of total investments as of September 30, 2016 |
| |||
The following table provides a summary of inputs used to value the Fund’s investments as of September 30, 2016 (See Security Valuation Note 2A in the Notes to Financial Statements):
| Total Value at September 30, 2016 | Level 1 Quoted Prices | Level 2 Significant Observable lnputs | ||||||||||
Equity Securities: | ||||||||||||
Closed End Fund | $ | 35 | $ | 35 | $ | — | ||||||
Common Stocks | 4,693 | 4,248 | 445 | |||||||||
|
|
|
|
|
| |||||||
Total Investments | $ | 4,728 | $ | 4,283 | $ | 445 | ||||||
|
|
|
|
|
| |||||||
There are no Level 3 (significant unobservable inputs) priced securities.
There were no transfers between Level 1 and Level 2 related to securities held at September 30, 2016.
Security abbreviation definitions are located under the Key Investment Terms starting on page 4.
See Notes to Financial Statements
42
Table of Contents
SEPTEMBER 30, 2016
($ reported in thousands)
| PAR VALUE | VALUE | |||||||
| FOREIGN GOVERNMENT SECURITIES—1.3% | ||||||||
Argentine Republic | ||||||||
144A 7.500%, 4/22/26(3) | $ | 340 | $ | 384 | ||||
144A 7.125%, 7/6/36(3) | 360 | 383 | ||||||
Provincia de Buenos Aires 144A | 210 | 235 | ||||||
| TOTAL FOREIGN GOVERNMENT SECURITIES (Identified Cost $916) | 1,002 | |||||||
| MORTGAGE-BACKED SECURITIES—1.3% | ||||||||
| Non-Agency—1.3% | ||||||||
Citigroup Mortgage Loan Trust, Inc. 05-5, 2A3 | 88 | 88 | ||||||
Home Equity Loan Trust 07-HSA3, AI4 | 415 | 418 | ||||||
JPMorgan Chase Commercial Mortgage Securities Trust 07-LDPX, AM | 180 | 176 | ||||||
MASTR Reperforming Loan Trust 05-1, 1A5 144A | 216 | 225 | ||||||
Residential Accredit Loans, Inc. 05-QS1, A5 | 91 | 91 | ||||||
| TOTAL MORTGAGE-BACKED SECURITIES (Identified Cost $986) | 998 | |||||||
| ASSET-BACKED SECURITIES—1.3% | ||||||||
CarFinance Capital Auto Trust 14-1A, D 144A | 205 | 206 | ||||||
Citi Held For Asset Issuance 15-PM3, B 144A | 360 | 360 | ||||||
Greater Capital Association of Realtors 15-1A, C | 250 | 255 | ||||||
Leaf Receivables Funding 9 LLC 10 LLC 15-1, E2 144A | 160 | 157 | ||||||
| TOTAL ASSET-BACKED SECURITIES (Identified Cost $971) | 978 | |||||||
| CORPORATE BONDS AND NOTES—80.5% | ||||||||
| Consumer Discretionary—21.6% | ||||||||
Allison Transmission, Inc. 144A | 65 | 67 | ||||||
Altice SA 144A | 300 | 321 | ||||||
Beazer Homes USA, Inc. | ||||||||
5.750%, 6/15/19 | 115 | 120 | ||||||
144A 8.750%, 3/15/22(3) | 75 | 79 | ||||||
Boyd Gaming Corp. | 265 | 289 | ||||||
Caesars Entertainment Operating Co., Inc. | 450 | 466 | ||||||
| PAR VALUE | VALUE | |||||||
| Consumer Discretionary—continued | ||||||||
Caesars Entertainment Resort Properties LLC | $ | 220 | $ | 229 | ||||
Caesars Growth Properties Holdings LLC | 445 | 478 | ||||||
CCO Holdings LLC 144A | 435 | 457 | ||||||
Cequel Communications Holdings I LLC 144A | 400 | 413 | ||||||
Clear Channel Worldwide Holdings, Inc. | ||||||||
Series A 7.625%, 3/15/20 | 150 | 145 | ||||||
Series B 7.625%, 3/15/20 | 1,060 | 1,056 | ||||||
Columbus Cable Barbados Ltd. Series B, 144A | 245 | 261 | ||||||
CSC Holdings LLC | 290 | 276 | ||||||
Dakota Merger Sub, Inc. 144A | 250 | 246 | ||||||
Dana Financing Luxembourg S.a.r.l. 144A | 55 | 58 | ||||||
Diamond Resorts International, Inc. 144A | 20 | 20 | ||||||
DISH DBS Corp. | ||||||||
5.000%, 3/15/23 | 475 | 463 | ||||||
144A 7.750%, 7/1/26(3) | 215 | 229 | ||||||
Hanesbrands, Inc. | ||||||||
144A 4.625%, 5/15/24(3) | 65 | 67 | ||||||
144A 4.875%, 5/15/26(3) | 135 | 139 | ||||||
i Heart Communications, Inc. | 115 | 91 | ||||||
IHO Verwaltungs GmbH PIK Interest Capitalization 144A | 380 | 385 | ||||||
Intelsat Jackson Holdings SA | 425 | 296 | ||||||
International Game Technology plc 144A | 200 | 214 | ||||||
Landry’s Holdings II, Inc. 144A | 175 | 179 | ||||||
Landry’s, Inc. | ||||||||
144A 9.375%, 5/1/20(3) | 425 | 446 | ||||||
144A 6.750%, 10/15/24(3) | 135 | 138 | ||||||
Lennar Corp. | ||||||||
4.500%, 11/15/19 | 215 | 228 | ||||||
4.875%, 12/15/23 | 70 | 72 | ||||||
M/I Homes, Inc. | 140 | 147 | ||||||
MDC Holdings, Inc. | 325 | 341 | ||||||
Meritor, Inc. | 225 | 229 | ||||||
MGM Growth Properties Operating Partnership LP (MGP Finance Co-Issuer, Inc.) 144A | 65 | 71 | ||||||
| PAR VALUE | VALUE | |||||||
| Consumer Discretionary—continued | ||||||||
MGM Resorts International | $ | 380 | $ | 372 | ||||
Mohegan Tribal Gaming Authority | 170 | 184 | ||||||
MPG Holdco I, Inc. | 225 | 232 | ||||||
Newell Brands, Inc. | ||||||||
144A 5.000%, 11/15/23(3) | 115 | 122 | ||||||
4.200%, 4/1/26 | 15 | 16 | ||||||
Penn National Gaming, Inc. | 180 | 187 | ||||||
PetSmart, Inc. 144A | 700 | 737 | ||||||
PulteGroup, Inc. | 200 | 211 | ||||||
RCN Telecom Services LLC (RCN Capital Corp.) 144A | 670 | 715 | ||||||
Sally Holdings LLC / Sally Capital, Inc. | 145 | 157 | ||||||
Scientific Games International, Inc. | ||||||||
6.625%, 5/15/21 | 150 | 115 | ||||||
144A 7.000%, 1/1/22(3) | 245 | 260 | ||||||
SFR (Numericable) Group S.A. | ||||||||
144A 6.000%, 5/15/22(3) | 465 | 476 | ||||||
144A 7.375%, 5/1/26(3) | 340 | 348 | ||||||
Sinclair Television Group, Inc. 144A | 200 | 196 | ||||||
Sirius XM Radio, Inc. 144A | 290 | 299 | ||||||
Six Flags Entertainment Corp. 144A | 170 | 172 | ||||||
Station Casinos LLC | 200 | 212 | ||||||
Tenneco, Inc. | 175 | 178 | ||||||
TI Group Automotive Systems LLC 144A | 290 | 317 | ||||||
Toll Brothers Finance Corp. | 450 | 462 | ||||||
TRI Pointe Group, Inc. | 400 | 419 | ||||||
Univision Communications, Inc. 144A | 195 | 198 | ||||||
UPCB Finance IV Ltd. 144A | 200 | 202 | ||||||
VTR Finance BV 144A | 450 | 467 | ||||||
Wolverine World Wide, Inc. 144A | 250 | 253 | ||||||
Ziggo Secured Finance BV 144A | 265 | 265 | ||||||
|
| |||||||
| 16,488 | ||||||||
|
| |||||||
See Notes to Financial Statements
43
Table of Contents
VIRTUS HIGH YIELD FUND
SCHEDULE OF INVESTMENTS (Continued)
SEPTEMBER 30, 2016
($ reported in thousands)
| PAR VALUE | VALUE | |||||||
| Consumer Staples—2.7% | ||||||||
Albertson’s, Inc. ( Albertson’s LLC) 144A | $ | 195 | $ | 195 | ||||
Dole Food Co., Inc. 144A | 250 | 254 | ||||||
Pinnacle Foods Corp. Finance LLC 144A | 35 | 38 | ||||||
Post Holdings, Inc. 144A | 305 | 304 | ||||||
Prestige Brands, Inc. 144A | 200 | 214 | ||||||
Rite Aid Corp. | ||||||||
6.750%, 6/15/21 | 475 | 501 | ||||||
144A 6.125%, 4/1/23(3) | 65 | 70 | ||||||
Safeway, Inc. | 215 | 214 | ||||||
Tops Holding LLC (Tops Markets II Corp.) 144A | 275 | 249 | ||||||
US Foods, Inc. 144A | 40 | 42 | ||||||
|
| |||||||
| 2,081 | ||||||||
|
| |||||||
| Energy—12.6% | ||||||||
Alberta Energy Co., Ltd. | 115 | 136 | ||||||
Antero Midstream Partners LP 144A | 85 | 86 | ||||||
Antero Resources Corp. | 275 | 282 | ||||||
Archrock Partners LP | 300 | 280 | ||||||
Blue Racer Midstream LLC 144A | 340 | 334 | ||||||
BreitBurn Energy Partners | 150 | 77 | ||||||
California Resources Corp. |
| |||||||
144A 8.000%, 12/15/22(3) | 239 | 160 | ||||||
6.000%, 11/15/24 | 16 | 8 | ||||||
Callon Petroleum Co. 144A | 115 | 119 | ||||||
Carrizo Oil & Gas, Inc. | 185 | 184 | ||||||
Cheniere Corpus Christi Holdings LLC 144A | 105 | 114 | ||||||
Chesapeake Energy Corp. | ||||||||
6.625%, 8/15/20 | 100 | 94 | ||||||
5.750%, 3/15/23 | 105 | 90 | ||||||
CONSOL Energy, Inc. | 200 | 185 | ||||||
Continental Resources, Inc. | ||||||||
5.000%, 9/15/22 | 240 | 240 | ||||||
4.500%, 4/15/23 | 145 | 140 | ||||||
Crestwood Midstream Partners LP (Crestwood Midstream Finance Corp.) | 295 | 300 | ||||||
Enbridge Energy Partners LP | 35 | 37 | ||||||
| PAR VALUE | VALUE | |||||||
| Energy—continued | ||||||||
Encana Corp. | $ | 190 | $ | 190 | ||||
Energy Transfer Equity LP | 400 | 417 | ||||||
EnLink Midstream Partners LP | 30 | 30 | ||||||
EnQuest plc 144A | 250 | 131 | ||||||
EP Energy LLC (Everest Acquisition Finance, Inc.) | 215 | 154 | ||||||
FTS International, Inc. | ||||||||
144A 8.350%, 6/15/20(2)(3) | 230 | 196 | ||||||
6.250%, 5/1/22 | 190 | 74 | ||||||
Gulfport Energy, Corp. | 150 | 156 | ||||||
Helmerich & Payne International Drilling Co. | 150 | 158 | ||||||
Holly Energy Partners LP 144A | 25 | 26 | ||||||
Laredo Petroleum, Inc. | 110 | 107 | ||||||
Linn Energy LLC (Linn Energy Finance Corp.) | 200 | 52 | ||||||
MPLX LP | 325 | 336 | ||||||
Newfield Exploration Co. | 165 | 166 | ||||||
NGL Energy Partners LP | 200 | 189 | ||||||
Pacific Exploration and Production Corp. 144A | 100 | 19 | ||||||
Parsley Energy LLC 144A | 410 | 425 | ||||||
Petrobras Global Finance BV | ||||||||
8.375%, 5/23/21 | 40 | 44 | ||||||
8.750%, 5/23/26 | 210 | 233 | ||||||
QEP Resources, Inc. | 300 | 297 | ||||||
Range Resources Corp. 144A | 270 | 265 | ||||||
Regency Energy Partners LP | 90 | 99 | ||||||
Rowan Cos., Inc. | 265 | 178 | ||||||
Sabine Oil & Gas Corp. | 329 | 6 | ||||||
Sabine Pass Liquefaction LLC | 380 | 404 | ||||||
SM Energy Co. | 115 | 116 | ||||||
Southern Gas Corridor CJSC 144A | 200 | 225 | ||||||
Sunoco LP 144A | 695 | 718 | ||||||
Transocean, Inc. | ||||||||
6.800%, 12/15/16 | 360 | 362 | ||||||
144A 9.000%, 7/15/23(3) | 80 | 78 | ||||||
6.800%, 3/15/38 | 300 | 200 | ||||||
| PAR VALUE | VALUE | |||||||
| Energy—continued | ||||||||
Weatherford International Ltd. | $ | 190 | $ | 189 | ||||
Whiting Petroleum Corp. | 130 | 122 | ||||||
WPX Energy, Inc. | 120 | 119 | ||||||
YPF S.A. 144A | 230 | 257 | ||||||
|
| |||||||
| 9,604 | ||||||||
|
| |||||||
| Financials—5.8% | ||||||||
AerCap Ireland Capital Ltd. (Aercap Global Aviation Trust) | ||||||||
4.625%, 10/30/20 | 150 | 158 | ||||||
4.500%, 5/15/21 | 400 | 418 | ||||||
3.950%, 2/1/22 | 175 | 179 | ||||||
Aircastle Ltd. | 350 | 367 | ||||||
Ally Financial, Inc. | ||||||||
3.250%, 11/5/18 | 120 | 121 | ||||||
4.250%, 4/15/21 | 205 | 209 | ||||||
5.750%, 11/20/25 | 235 | 247 | ||||||
Genworth Holdings, Inc. | 130 | 109 | ||||||
Guanay Finance Ltd. 144A | 239 | 244 | ||||||
ICAHN Enterprises LP | 295 | 285 | ||||||
ING Groep NV 6.000%(2)(5)(6) | 200 | 195 | ||||||
iStar Financial, Inc. | 500 | 500 | ||||||
Nationstar Mortgage LLC | 250 | 246 | ||||||
Navient Corp. | 60 | 60 | ||||||
Springleaf Finance Corp. | 410 | 420 | ||||||
Sprint Capital Corp. | 325 | 338 | ||||||
Voya Financial, Inc. | 205 | 205 | ||||||
Walter Investment Management Corp. | 215 | 144 | ||||||
|
| |||||||
| 4,445 | ||||||||
|
| |||||||
| Health Care—10.4% | ||||||||
Alere, Inc. | ||||||||
6.500%, 6/15/20 | 150 | 151 | ||||||
144A 6.375%, 7/1/23(3) | 50 | 51 | ||||||
Capsugel S.A. PIK Interest Capitalization, 144A | 212 | 213 | ||||||
Centene Corp | 150 | 160 | ||||||
Centene Escrow Corp. | 65 | 67 | ||||||
Community Health Systems, Inc. | ||||||||
5.125%, 8/15/18 | 21 | 21 | ||||||
5.125%, 8/1/21 | 400 | 397 | ||||||
6.875%, 2/1/22 | 145 | 125 | ||||||
See Notes to Financial Statements
44
Table of Contents
VIRTUS HIGH YIELD FUND
SCHEDULE OF INVESTMENTS (Continued)
SEPTEMBER 30, 2016
($ reported in thousands)
| PAR VALUE | VALUE | |||||||
| Health Care—continued | ||||||||
Concordia Healthcare Corp. 144A | $ | 450 | $ | 290 | ||||
DaVita Healthcare Partners, Inc. | ||||||||
5.125%, 7/15/24 | 100 | 102 | ||||||
5.000%, 5/1/25 | 100 | 101 | ||||||
Double Eagle Acquisition Sub, Inc. 144A | 75 | 77 | ||||||
Endo Finance LLC 144A | 250 | 222 | ||||||
Fresenius U.S. Finance II, Inc. 144A | 60 | 63 | ||||||
HCA, Inc. | ||||||||
6.500%, 2/15/20 | 175 | 194 | ||||||
5.375%, 2/1/25 | 505 | 522 | ||||||
5.250%, 6/15/26 | 230 | 244 | ||||||
4.500%, 2/15/27 | 270 | 271 | ||||||
inVentiv Health, Inc. 144A | 130 | 134 | ||||||
Mallinckrodt International Finance S.A. 144A | 110 | 106 | ||||||
MEDNAX, Inc. 144A | 295 | 310 | ||||||
MPH Acquisition Holdings LLC 144A | 20 | 22 | ||||||
Ortho-Clinical Diagnostics, Inc. (Ortho-Clinical Diagnostics S.A.) 144A | 225 | 199 | ||||||
Pinnacle Merger Sub, Inc. (PRA Holdings, Inc.) 144A | 225 | 249 | ||||||
Quintiles Transnational Corp. 144A | 175 | 181 | ||||||
Quorum Health Corp. 144A | 120 | 100 | ||||||
Sterigenics-Nordion Holdings LLC 144A | 325 | 339 | ||||||
Surgery Center Holdings, Inc. 144A | 200 | 214 | ||||||
Surgical Care Affiliates, Inc. 144A | 400 | 422 | ||||||
Team Health, Inc. 144A | 20 | 22 | ||||||
Teleflex, Inc. | 270 | 280 | ||||||
Tenet Healthcare Corp. | ||||||||
6.000%, 10/1/20 | 375 | 397 | ||||||
4.500%, 4/1/21 | 275 | 278 | ||||||
8.125%, 4/1/22 | 390 | 392 | ||||||
Universal Health Services, Inc. | ||||||||
144A 4.750%, 8/1/22(3) | 45 | 46 | ||||||
144A 5.000%, 6/1/26(3) | 80 | 84 | ||||||
Valeant Pharmaceuticals International, Inc. | ||||||||
144A 6.750%, 8/15/18(3) | 140 | 141 | ||||||
144A 5.375%, 3/15/20(3) | 420 | 391 | ||||||
| PAR VALUE | VALUE | |||||||
| Health Care—continued | ||||||||
144A 6.375%, 10/15/20(3) | $ | 325 | $ | 306 | ||||
144A 7.250%, 7/15/22(3) | 70 | 65 | ||||||
|
| |||||||
| 7,949 | ||||||||
|
| |||||||
| Industrials—6.2% | ||||||||
ADT Corp. (The) | 200 | 218 | ||||||
Advanced Disposal Services, Inc. | 300 | 315 | ||||||
AMN Healthcare, Inc. 144A | 70 | 71 | ||||||
Bombardier, Inc. | ||||||||
4.750%, 4/15/19 | 190 | 186 | ||||||
144A 6.125%, 1/15/23(3) | 200 | 179 | ||||||
Builders FirstSource, Inc. 144A | 150 | 173 | ||||||
Cemex SAB de C.V. 144A | 200 | 222 | ||||||
CNH Industrial N.V. | 250 | 253 | ||||||
Garda World Security Corp. 144A | 410 | 380 | ||||||
Harland Clarke Holdings Corp. | ||||||||
144A 6.875%, 3/1/20(3) | 150 | 144 | ||||||
144A 9.250%, 3/1/21(3) | 300 | 256 | ||||||
Hawaiian Airlines Pass-Through Certificates 13-1B, | 96 | 97 | ||||||
JBS Investments GmbH 144A | 200 | 205 | ||||||
Masco Corp. | 175 | 185 | ||||||
NCI Building Systems, Inc. 144A | 290 | 317 | ||||||
Owens Corning | 265 | 266 | ||||||
Prime Security Services Borrower LLC (Prime Finance, Inc.) 144A | 195 | 213 | ||||||
Standard Industries, Inc. 144A | 55 | 57 | ||||||
TransDigm, Inc. | ||||||||
6.000%, 7/15/22 | 300 | 318 | ||||||
6.500%, 5/15/25 | 230 | 241 | ||||||
UAL Pass-Through-Trust 07-01, A 6.636%, 7/2/22 | 161 | 172 | ||||||
United Rentals North America, Inc. | 270 | 278 | ||||||
|
| |||||||
| 4,746 | ||||||||
|
| |||||||
| Information Technology—2.3% | ||||||||
Blackboard, Inc. 144A | 125 | 125 | ||||||
Diamond 1 Finance Corp. (Diamond 2 Finance Corp.) | ||||||||
144A 5.450%, 6/15/23(3) | 60 | 64 | ||||||
144A 7.125%, 6/15/24(3) | 70 | 77 | ||||||
144A 6.020%, 6/15/26(3) | 45 | 50 | ||||||
144A 8.100%, 7/15/36(3) | 55 | 65 | ||||||
144A 8.350%, 7/15/46(3) | 45 | 54 | ||||||
| PAR VALUE | VALUE | |||||||
| Information Technology—continued | ||||||||
First Data Corp. | ||||||||
144A 5.000%, 1/15/24(3) | $ | 230 | $ | 234 | ||||
144A 5.750%, 1/15/24(3) | 450 | 464 | ||||||
Infor US, Inc. | 220 | 224 | ||||||
NXP BV (NXP Funding LLC) 144A | 325 | 356 | ||||||
WESCO Distribution, Inc. 144A | 75 | 75 | ||||||
|
| |||||||
| 1,788 | ||||||||
|
| |||||||
| Materials—9.1% | ||||||||
AK Steel Corp. | ||||||||
7.625%, 10/1/21 | 100 | 97 | ||||||
7.500%, 7/15/23 | 140 | 149 | ||||||
Aleris International, Inc. 144A | 360 | 389 | ||||||
ArcelorMittal | 300 | 328 | ||||||
Ardagh Packaging Finance plc | ||||||||
144A 6.250%, 1/31/19(3) | 145 | 149 | ||||||
144A 6.750%, 1/31/21(3) | 295 | 306 | ||||||
144A 7.250%, 5/15/24(3) | 345 | 370 | ||||||
Axalta Coating Systems, LLC 144A | 290 | 298 | ||||||
Berry Plastics Corp. | 400 | 409 | ||||||
BlueScope Steel Finance Ltd. 144A | 235 | 249 | ||||||
Boise Cascade Co. 144A | 190 | 194 | ||||||
Cascades, Inc. | ||||||||
144A 5.500%, 7/15/22(3) | 575 | 587 | ||||||
144A 5.750%, 7/15/23(3) | 225 | 229 | ||||||
Eldorado Gold Corp. 144A | 150 | 152 | ||||||
Fortescue Metals Group (FMG) Resources August 2006 Pty Ltd. 144A | 100 | 117 | ||||||
Freeport-McMoRan Copper & Gold, Inc. | ||||||||
3.550%, 3/1/22 | 160 | 146 | ||||||
3.875%, 3/15/23 | 180 | 164 | ||||||
Graphic Packaging International, Inc. | 225 | 227 | ||||||
Hexion U.S. Finance Corp. | ||||||||
8.875%, 2/1/18 | 125 | 120 | ||||||
6.625%, 4/15/20 | 75 | 66 | ||||||
INEOS Group Holdings S.A. | ||||||||
144A 5.875%, 2/15/19(3) | 305 | 312 | ||||||
144A 5.625%, 8/1/24(3) | 315 | 310 | ||||||
Novelis Corp. | ||||||||
144A 6.250%, 8/15/24(3) | 35 | 37 | ||||||
144A 5.875%, 9/30/26(3) | 230 | 236 | ||||||
Reynolds Group Issuer, Inc. | ||||||||
8.250%, 2/15/21 | 190 | 198 | ||||||
144A 5.125%, 7/15/23(3) | 150 | 155 | ||||||
144A 7.000%, 7/15/24(3) | 10 | 11 | ||||||
Standard Industries, Inc. 144A | 115 | 123 | ||||||
See Notes to Financial Statements
45
Table of Contents
VIRTUS HIGH YIELD FUND
SCHEDULE OF INVESTMENTS (Continued)
SEPTEMBER 30, 2016
($ reported in thousands)
| PAR VALUE | VALUE | |||||||
| Materials—continued | ||||||||
Teck Resources Ltd. | ||||||||
144A 8.000%, 6/1/21(3) | $ | 20 | $ | 22 | ||||
4.750%, 1/15/22 | 150 | 147 | ||||||
144A 8.500%, 6/1/24(3) | 50 | 57 | ||||||
6.125%, 10/1/35 | 150 | 143 | ||||||
United States Steel Corp. | 19 | 19 | ||||||
Vale Overseas Ltd. | 130 | 136 | ||||||
Valvoline, Inc. 144A | 30 | 32 | ||||||
Vedanta Resources plc | ||||||||
144A 9.500%, 7/18/18(3) | 100 | 106 | ||||||
144A 8.250%, 6/7/21(3) | 200 | 203 | ||||||
|
| |||||||
| 6,993 | ||||||||
|
| |||||||
| Real Estate—0.8% | ||||||||
Corrections Corp. of America | 145 | 132 | ||||||
ESH Hospitality, Inc. 144A | 170 | 171 | ||||||
GLP Capital LP (GLP Financing II, Inc.) | ||||||||
4.875%, 11/1/20 | 95 | 103 | ||||||
5.375%, 4/15/26 | 60 | 65 | ||||||
MPT Operating Partnership LP | ||||||||
6.375%, 3/1/24 | 100 | 109 | ||||||
5.250%, 8/1/26 | 10 | 10 | ||||||
|
| |||||||
| 590 | ||||||||
|
| |||||||
| Telecommunication Services—6.4% | ||||||||
Altice Financing S.A. 144A | 480 | 494 | ||||||
CenturyLink, Inc. | ||||||||
Series T | 65 | 67 | ||||||
Series Y | 370 | 396 | ||||||
CSC Holdings LLC 144A | 135 | 138 | ||||||
Frontier Communications Corp. | ||||||||
8.500%, 4/15/20 | 425 | 461 | ||||||
10.500%, 9/15/22 | 45 | 48 | ||||||
GTH Finance BV 144A | 200 | 218 | ||||||
Level 3 Financing, Inc. 144A | 135 | 140 | ||||||
Neptune Finance Corp. | ||||||||
144A 10.125%, 1/15/23(3) | 210 | 243 | ||||||
144A 6.625%, 10/15/25(3) | 210 | 228 | ||||||
Qwest Corp. | 130 | 142 | ||||||
Sprint Capital Corp. | 250 | 237 | ||||||
Sprint Communications, Inc. | 235 | 221 | ||||||
Sprint Corp. | 325 | 330 | ||||||
T-Mobile USA, Inc. | ||||||||
6.125%, 1/15/22 | 240 | 256 | ||||||
6.500%, 1/15/24 | 275 | 299 | ||||||
6.500%, 1/15/26 | 220 | 244 | ||||||
| PAR VALUE | VALUE | |||||||
| Telecommunication Services—continued | ||||||||
Virgin Media Finance plc 144A | $ | 250 | $ | 260 | ||||
Windstream Corp. | 300 | 300 | ||||||
Zayo Group LLC (Zayo Capital, Inc.) | 180 | 189 | ||||||
|
| |||||||
| 4,911 | ||||||||
|
| |||||||
| Utilities—2.6% | ||||||||
AmeriGas Partners LP | 325 | 345 | ||||||
Calpine Corp. | 350 | 351 | ||||||
Dynegy, Inc. | 355 | 352 | ||||||
NRG Energy, Inc. 144A | 185 | 189 | ||||||
NRG Yield Operating LLC | 190 | 196 | ||||||
Talen Energy Supply LLC 144A | 175 | 165 | ||||||
TerraForm Power Operating LLC 144A | 250 | 259 | ||||||
Texas Competitive Electric Holdings Co. LLC 144A | 500 | 153 | ||||||
|
| |||||||
| 2,010 | ||||||||
| TOTAL CORPORATE BONDS AND NOTES (Identified Cost $61,346) | 61,605 | |||||||
| LOAN AGREEMENTS(2)—9.3% | ||||||||
| Consumer Discretionary—2.2% | ||||||||
Boyd Gaming Corp. Tranche B-2 | 59 | 60 | ||||||
Caesars Entertainment Operating Co., Inc. Tranche B-7, | 165 | 189 | ||||||
Caesars Entertainment Resort Properties LLC | 115 | 115 | ||||||
CDS U.S. Intermediate Holdings, Inc. First Lien, | 177 | 178 | ||||||
Floor & Decor Outlets of America, Inc. | 150 | 150 | ||||||
Graton Resort & Casino Tranche B, | 104 | 105 | ||||||
Leslie’s Poolmart, Inc. Tranche B | 110 | 111 | ||||||
Mohegan Tribal Gaming Authority | ||||||||
Tranche B, | 110 | 110 | ||||||
0.00%, 9/30/23(9) | 190 | 187 | ||||||
Transtar Holding Co. Second Lien, | 200 | 28 | ||||||
| PAR VALUE | VALUE | |||||||
| Consumer Discretionary—continued | ||||||||
U.S. Farathane LLC Tranche B-2, | $ | 244 | $ | 245 | ||||
UFC Holdings LLC First Lien | 195 | 197 | ||||||
|
| |||||||
| 1,675 | ||||||||
|
| |||||||
| Consumer Staples—1.6% | ||||||||
Albertson’s LLC Trance B-4, | 209 | 211 | ||||||
Amplify Snack Brands, Inc. | 235 | 234 | ||||||
ASP MSG Acquisitions, Co., Inc. 6.000%, 8/16/23 | 149 | 150 | ||||||
Chobani LLC | 45 | 45 | ||||||
Crossmark Holdings, Inc. Second Lien, | 190 | 86 | ||||||
Hostess Brands LLC Tranche B, Second Lien, | 430 | 434 | ||||||
Kronos Second Lien, | 24 | 24 | ||||||
Pinnacle Foods Finance LLC | 32 | 32 | ||||||
|
| |||||||
| 1,216 | ||||||||
|
| |||||||
| Energy—0.8% | ||||||||
California Resources Corp. | 155 | 163 | ||||||
Chesapeake Energy Corp. | 31 | 33 | ||||||
EP Energy LLC | 190 | 187 | ||||||
Jonah Energy LLC Second Lien, | 125 | 112 | ||||||
MEG Energy Corp. | 85 | 79 | ||||||
Sabine Oil & Gas LLC Second Lien, | 285 | 10 | ||||||
|
| |||||||
| 584 | ||||||||
|
| |||||||
| Health Care—1.5% | ||||||||
21st Century Oncology Holdings, Inc. Tranche B, | 222 | 210 | ||||||
Ardent Legacy Acquisitions, Inc. | 129 | 128 | ||||||
InVentiv Health, Inc. | ||||||||
Tranche B-4, | 159 | 160 | ||||||
Tranche B | 57 | 57 | ||||||
MMM Holdings, Inc. | 79 | 77 | ||||||
MPH Acquisition Holdings LLC | 35 | 36 | ||||||
MSO of Puerto Rico, Inc. | 58 | 56 | ||||||
See Notes to Financial Statements
46
Table of Contents
VIRTUS HIGH YIELD FUND
SCHEDULE OF INVESTMENTS (Continued)
SEPTEMBER 30, 2016
($ reported in thousands)
| PAR VALUE | VALUE | |||||||
| Health Care—continued | ||||||||
NVA Holdings, Inc. | ||||||||
Tranche B-1, First Lien, | $ | 130 | $ | 131 | ||||
Second Lien, | 175 | 175 | ||||||
Quorum Health Corp. | 99 | 96 | ||||||
|
| |||||||
| 1,126 | ||||||||
|
| |||||||
| Industrials—1.3% | ||||||||
Aspen Merger Sub (Coinstar), Inc. | 89 | 90 | ||||||
Brickman Group Ltd. LLC (The) Second Lien, | 225 | 224 | ||||||
Filtration Group Corp. Second Lien, | 81 | 81 | ||||||
Navistar, Inc. Tranche B | 235 | 236 | ||||||
Sedgwick Claims Management Services, Inc. Second Lien, | 390 | 387 | ||||||
|
| |||||||
| 1,018 | ||||||||
|
| |||||||
| Information Technology—0.8% | ||||||||
Blackboard, Inc. Tranche B-4 | 142 | 141 | ||||||
Donnelley Financial Solutions | 50 | 50 | ||||||
First Data Corp. Tranche 2022 | 157 | 158 | ||||||
Mitchell International, Inc. Second Lien, | 64 | 63 | ||||||
NXP BV Tranche F | 61 | 62 | ||||||
Presidio, Inc. Refinancing, | 145 | 146 | ||||||
Press Ganey Holdings, Inc. | 16 | 16 | ||||||
Western Digital Corp. | 14 | 14 | ||||||
|
| |||||||
| 650 | ||||||||
|
| |||||||
| Materials—0.6% | ||||||||
CPI Acquisition, Inc. First Lien, | 160 | 157 | ||||||
Fortescue Metals Group (FMG) Resources Property Ltd. | 138 | 137 | ||||||
Omnova Solutions, Inc. Tranche B-2, | 193 | 193 | ||||||
|
| |||||||
| 487 | ||||||||
|
| |||||||
| Utilities—0.5% | ||||||||
Atlantic Power LP | 220 | 223 | ||||||
| PAR VALUE | VALUE | |||||||
| Utilities—continued | ||||||||
Energy Futures Holdings Corp. | ||||||||
5.000%, 7/27/23(8) | $ | 138 | $ | 139 | ||||
Tranche C | 31 | 31 | ||||||
|
| |||||||
| 393 | ||||||||
| TOTAL LOAN AGREEMENTS (Identified Cost $7,634) | 7,149 | |||||||
| SHARES | ||||||||
| PREFERRED STOCKS—1.4% | ||||||||
| Financials—1.4% | ||||||||
Citigroup, Inc. Series N | 205 | (10) | 221 | |||||
Goldman Sachs Group, Inc. (The) Series L, 5.700%(2) | 215 | (10) | 218 | |||||
JPMorgan Chase & Co. Series V, 5.000%(2) | 145 | (10) | 143 | |||||
KeyCorp. 5.000(2) | 375 | (10) | 370 | |||||
SunTrust Bank, Inc. | 95 | (10) | 98 | |||||
| TOTAL PREFERRED STOCKS (Identified Cost $1,037) | 1,050 | |||||||
| EXCHANGE-TRADED FUNDS(12)—2.0% | ||||||||
iShares 0-5 Year High Yield Corporate Bond Index Fund | 8,300 | 392 | ||||||
iShares iBoxx $ High Yield Corporate Bond Index Fund | 4,413 | 385 | ||||||
SPDR Barclays High Yield Bond Index Fund | 10,467 | 384 | ||||||
SPDR Barclays Short-Term High Yield Bond Index Fund | 14,000 | 388 | ||||||
| TOTAL EXCHANGE-TRADED FUNDS (Identified Cost $1,513) | 1,549 | |||||||
| AFFILIATED MUTUAL FUND(12)—0.5% | ||||||||
Virtus Credit Opportunities Fund Class R6 | 35,806 | 352 | ||||||
| TOTAL AFFILIATED MUTUAL FUND (Identified Cost $358) | 352 | |||||||
| TOTAL LONG TERM INVESTMENTS—97.6% | ||||||||
| (Identified Cost $74,761) | 74,683 | (13) | ||||||
| SHORT-TERM INVESTMENT—0.3% | ||||||||
| Money Market Mutual Fund(12)—0.3% | ||||||||
JPMorgan U.S. Government Money Market Fund – Institutional Shares (seven-day effective yield 0.360%) | 226,656 | 227 | ||||||
| TOTAL SHORT-TERM INVESTMENT (Identified Cost $227) | 227 | |||||||
| TOTAL INVESTMENTS—97.9% (Identified Cost $74,988) | 74,910 | (1) | ||||||
Other assets and liabilities, |
| 1,639 | ||||||
|
| |||||||
| NET ASSETS—100.0% | $ | 76,549 | ||||||
|
| |||||||
Abbreviations:
| ADS | American Depositary Share |
| PIK | Payment-in-Kind Security |
| SPDR | S&P Depositary Receipt |
Footnote Legend:
| (1) | Federal Income Tax Information: For tax information at September 30, 2016, see Note 10 Federal Income Tax Information in the Notes to Financial Statements. |
| (2) | Variable or step coupon security; interest rate shown reflects the rate in effect at September 30, 2016. |
| (3) | Security exempt from registration under Rule 144A of the Securities Act of 1933. These securities may be resold in transactions exempt from registration, normally to qualified institutional buyers. At September 30, 2016, these securities amounted to a value of $30,862 or 40.3% of net assets. |
| (4) | Security in default no interest payments are being received during the bankruptcy proceedings. |
| (5) | No contractual maturity date. |
| (6) | Interest payments may be deferred. |
| (7) | 100% of the income received was in cash. |
| (8) | Security in default, interest payments are being received during the bankruptcy proceedings. |
| (9) | This loan will settle after September 30, 2016, at which time the interest rate, based on the London Interbank Offered Rate (“LIBOR”) and the agreed upon spread on trade date, will be reflected. |
| (10) | Value shown as par value. |
| (11) | Illiquid security. |
| (12) | Shares of these funds are publicly offered and the prospectus and annual reports of each are publicly available. |
| (13) | All or a portion of the Fund’s assets have been segregated for delayed delivery securities. |
| (14) | Security in default, a portion of the interest payments are being received during bankruptcy proceedings. |
| Country Weightings† (Unaudited) | ||||
United States | 79 | % | ||
Canada | 5 | |||
Luxembourg | 3 | |||
Argentina | 2 | |||
Ireland | 2 | |||
Netherlands | 2 | |||
United Kingdom | 1 | |||
Other | 6 | |||
Total | 100 | % | ||
† % of total investments as of September 30, 2016 |
| |||
Security abbreviation definitions are located under the Key Investment Terms starting on page 4.
See Notes to Financial Statements
47
Table of Contents
VIRTUS HIGH YIELD FUND
SCHEDULE OF INVESTMENTS (Continued)
SEPTEMBER 30, 2016
($ reported in thousands)
The following table provides a summary of inputs used to value the Fund’s investments as of September 30, 2016 (See Security Valuation Note 2A in the Notes to Financial Statements):
| Total Value at September 30, 2016 | Level 1 Quoted Prices | Level 2 Significant Observable Inputs | Level 3 Significant Unobservable Inputs | |||||||||||||
Debt Securities: | ||||||||||||||||
Asset-Backed Securities | $ | 978 | $ | — | $ | 723 | $ | 255 | ||||||||
Corporate Bonds And Notes | 61,605 | — | 61,586 | 19 | ||||||||||||
Foreign Government Securities | 1,002 | — | 1,002 | — | ||||||||||||
Loan Agreements | 7,149 | — | 7,111 | 38 | ||||||||||||
Mortgage-Backed Securities | 998 | — | 998 | — | ||||||||||||
Equity Securities: | ||||||||||||||||
Affiliated Mutual Fund | 352 | 352 | — | — | ||||||||||||
Exchange-Traded Funds | 1,549 | 1,549 | — | — | ||||||||||||
Preferred Stocks | 1,050 | — | 1,050 | — | ||||||||||||
Short-Term Investment | 227 | 227 | — | — | ||||||||||||
|
|
|
|
|
|
|
| |||||||||
Total Investments | $ | 74,910 | $ | 2,128 | $ | 72,470 | $ | 312 | ||||||||
|
|
|
|
|
|
|
| |||||||||
There were no transfers between Level 1 and Level 2 related to securities held as of September 30, 2016.
The following is a reconciliation of assets of the Fund for Level 3 investments for which significant unobservable inputs were used to determine fair value.
| Total | Asset-Backed Securities | Corporate Bonds And Notes | Loan Agreements | |||||||||||||
Investments in Securities | ||||||||||||||||
Balance as of September 30, 2015: | $ | 444 | $ | 250 | $ | — | $ | 194 | ||||||||
Accrued discount/(premium) | 1 | — | — | 1 | ||||||||||||
Realized gain (loss) | — | — | — | — | ||||||||||||
Change in unrealized appreciation (depreciation)(c) | (162 | ) | 5 | — | (167 | ) | ||||||||||
Purchases | — | — | — | — | ||||||||||||
Sales(b) | — | — | — | — | ||||||||||||
Transfers into Level 3(a) | 29 | (d) | — | 19 | (d) | 10 | (d) | |||||||||
Transfers from Level 3(a) | — | — | — | — | ||||||||||||
|
|
|
|
|
|
|
| |||||||||
Balance as of September 30, 2016 | $ | 312 | $ | 255 | (e) | $ | 19 | (e) | $ | 38 | (e) | |||||
|
|
|
|
|
|
|
| |||||||||
| (a) | “Transfers into and/or from” represent the ending value as of September 30, 2016, for any investment security where a change in the pricing level occurred from the beginning to the end of the period. |
| (b) | Includes paydown on securities. |
| (c) | Included in the related net change in unrealized appreciation/(depreciation) in the Statements of Operations. The change in unrealized appreciation/(depreciation) on investments still held on September 30, 2016 was ($222) |
| (d) | The transfers into Level 3 are due to a decrease in trading activities at period end. |
| (e) | The Fund’s investments that are categorized as Level 3 were valued utilizing third party pricing information without adjustment. Such valuations are based on unobservable inputs. A significant change in third party information could result in a significantly lower or higher value of Level 3 investments. |
None of the securities in this table are internally fair valued.
See Notes to Financial Statements
48
Table of Contents
VIRTUS LOW DURATION INCOME FUND
SEPTEMBER 30, 2016
($ reported in thousands)
| PAR VALUE | VALUE | |||||||
| U.S. GOVERNMENT SECURITIES—10.1% | ||||||||
U.S. Treasury Note | $ | 19,355 | $ | 19,362 | ||||
1.375%, 4/30/20 | 14,265 | 14,451 | ||||||
1.625%, 2/15/26 | 6,755 | 6,772 | ||||||
| TOTAL U.S. GOVERNMENT SECURITIES (Identified Cost $40,357) | 40,585 | |||||||
| MUNICIPAL BONDS—0.1% | ||||||||
| Illinois—0.1% | ||||||||
State of Illinois Build America Taxable | 190 | 201 | ||||||
| TOTAL MUNICIPAL BONDS (Identified Cost $200) | 201 | |||||||
| FOREIGN GOVERNMENT SECURITIES—0.1% | ||||||||
Democratic Socialist Republic of Sri Lanka 144A | 235 | 243 | ||||||
Sultanate of Oman 144A | 200 | 202 | ||||||
| TOTAL FOREIGN GOVERNMENT SECURITIES (Identified Cost $437) | 445 | |||||||
| MORTGAGE-BACKED SECURITIES—41.2% | ||||||||
| Agency—12.8% | ||||||||
FHLMC | ||||||||
4.000%, 2/1/45 | 407 | 437 | ||||||
3.500%, 3/1/45 | 2,096 | 2,231 | ||||||
3.500%, 4/1/46 | 2,322 | 2,450 | ||||||
FNMA | ||||||||
4.000%, 8/1/25 | 91 | 96 | ||||||
3.000%, 6/1/27 | 278 | 292 | ||||||
3.000%, 11/1/27 | 965 | 1,014 | ||||||
2.500%, 5/1/28 | 764 | 794 | ||||||
2.500%, 11/1/29 | 749 | 776 | ||||||
2.500%, 9/1/30 | 4,628 | 4,802 | ||||||
3.000%, 9/1/30 | 3,000 | 3,152 | ||||||
3.000%, 10/1/30 | 1,692 | 1,778 | ||||||
3.000%, 10/1/30 | 5,275 | 5,543 | ||||||
2.500%, 2/1/31 | 6,419 | 6,655 | ||||||
4.000%, 11/1/31 | 440 | 476 | ||||||
5.000%, 10/1/39 | 329 | 372 | ||||||
4.500%, 4/1/40 | 136 | 149 | ||||||
3.500%, 12/1/42 | 653 | 691 | ||||||
3.000%, 3/1/43 | 1,112 | 1,160 | ||||||
3.000%, 5/1/43 | 321 | 335 | ||||||
4.000%, 10/1/44 | 981 | 1,054 | ||||||
3.000%, 5/1/45 | 1,070 | 1,114 | ||||||
3.500%, 8/1/45 | 1,704 | 1,798 | ||||||
3.500%, 1/1/46 | 2,117 | 2,234 | ||||||
3.500%, 1/1/46 | 2,634 | 2,779 | ||||||
3.500%, 1/1/46 | 483 | 509 | ||||||
3.000%, 4/1/46 | 3,009 | 3,132 | ||||||
3.500%, 4/1/46 | 560 | 591 | ||||||
3.000%, 5/1/46 | 373 | 388 | ||||||
3.500%, 5/1/46 | 564 | 595 | ||||||
3.000%, 6/1/46 | 1,044 | 1,087 | ||||||
3.000%, 7/1/46 | 381 | 396 | ||||||
3.000%, 7/1/46 | 1,704 | 1,774 | ||||||
3.000%, 10/1/46 | 480 | 500 | ||||||
| PAR VALUE | VALUE | |||||||
| Agency—continued | ||||||||
FNMA REMIC 97-70, PE (P.O.) | $ | 6 | $ | 6 | ||||
GNMA | ||||||||
7.000%, 7/15/23 | 2 | 2 | ||||||
7.000%, 9/15/23 | 8 | 9 | ||||||
7.000%, 9/15/23 | 2 | 2 | ||||||
7.000%, 1/15/24 | 5 | 5 | ||||||
7.000%, 9/15/24 | 6 | 7 | ||||||
7.000%, 7/15/25 | 3 | 3 | ||||||
7.000%, 7/15/25 | 12 | 12 | ||||||
|
| |||||||
| 51,200 | ||||||||
|
| |||||||
| Non-Agency—28.4% | ||||||||
A-10 Securitization LLC | 5 | 5 | ||||||
Access Point Financial, Inc. | 86 | 86 | ||||||
Agate Bay Mortgage Trust 13-1, 144A | 415 | 426 | ||||||
American Homes 4 Rent | 195 | 208 | ||||||
Ameriquest Mortgage Securities, Inc. 03-10, AF6 | 177 | 182 | ||||||
Asset Backed Funding Certificates 05-AQ1, A6 | 110 | 113 | ||||||
Aventura Mall Trust | ||||||||
13-AVM, C 144A | 1,130 | 1,185 | ||||||
13-AVM, A 144A | 1,721 | 1,849 | ||||||
Banc of America Commercial Mortgage Trust | ||||||||
07-2, A4 | 948 | 953 | ||||||
07-4, AM | 1,950 | 2,011 | ||||||
Banc of America Funding Trust | ||||||||
04-B, 2A1 | 51 | 50 | ||||||
05-1, 1A1 | 144 | 144 | ||||||
06-2, 3A1 | 34 | 35 | ||||||
16- R1, A1 144A | 1,808 | 1,796 | ||||||
Banc of America Mortgage Trust | ||||||||
04-5, 4A1 | 237 | 237 | ||||||
04-7, 6A3 | 57 | 57 | ||||||
04-11, 5A1 | 440 | 443 | ||||||
| PAR VALUE | VALUE | |||||||
| Non-Agency—continued | ||||||||
Bank of America (Merrill Lynch – Countrywide) Alternative Loan Trust | ||||||||
04-22CB, 1A1 | $ | 382 | $ | 409 | ||||
04-24CB, 1A1 | 254 | 258 | ||||||
Bank of America (Merrill Lynch) Investors | 765 | 774 | ||||||
Barclays (Lehman Brothers) – UBS Commercial Mortgage Trust | ||||||||
07-C2, A3 | 1,302 | 1,313 | ||||||
07-C6, A4 | 750 | 760 | ||||||
07-C3, A4 | 2,657 | 2,726 | ||||||
07-C7, A3 | 616 | 639 | ||||||
Bayview Commercial Asset Trust 08-1, A3 144A | 226 | 221 | ||||||
Bayview Financial Acquisition Trust 07-A, 1A2 | 370 | 384 | ||||||
BCRR Trust 09-1, 2A 144A | 143 | 143 | ||||||
Centex Home Equity Loan Trust | ||||||||
02-A, AF6 | 107 | 106 | ||||||
04-D, AF5 | 385 | 397 | ||||||
Citigroup – Deutsche Bank Commercial Mortgage Trust 07-CD4, A4 | 1,004 | 1,008 | ||||||
Citigroup Commercial Mortgage Trust | ||||||||
16-A Smpl A | 750 | 750 | ||||||
07-C6, A1A | 812 | 827 | ||||||
07-C6, A4 | 1,550 | 1,578 | ||||||
08-C7, AM | 230 | 238 | ||||||
10-RR3, MLSR 144A | 1,491 | 1,504 | ||||||
Citigroup Mortgage Loan Trust, Inc. | ||||||||
04-NCM2, 2CB2 | 166 | 173 | ||||||
14-A, A 144A | 607 | 630 | ||||||
15-PS1, 144A | 489 | 506 | ||||||
15-A, A1 144A | 1,214 | 1,238 | ||||||
See Notes to Financial Statements
49
Table of Contents
VIRTUS LOW DURATION INCOME FUND
SCHEDULE OF INVESTMENTS (Continued)
SEPTEMBER 30, 2016
($ reported in thousands)
| PAR VALUE | VALUE | |||||||
| Non-Agency—continued | ||||||||
Colony American Finance Ltd. 15-1 144A | $ | 625 | $ | 632 | ||||
Colony Multi-Family Mortgage Trust 14-1, A 144A | 1,126 | 1,123 | ||||||
COLT Mortgage Loan Trust Funding LLC | ||||||||
16-1 A1, 144A | 841 | 848 | ||||||
16-2, A1 144A | 1,165 | 1,172 | ||||||
Commercial Mortgage Lease-Backed Certificates 01-CMB, 1 144A | 460 | 521 | ||||||
Commercial Mortgage Trust | ||||||||
07-C9, A4 | 1,133 | 1,160 | ||||||
07-GG11, AM | 2,123 | 2,192 | ||||||
Credit Suisse Commercial Mortgage Trust | ||||||||
07-C1, A1A | 139 | 140 | ||||||
10-RR7, 1A 144A | 253 | 253 | ||||||
07-C2, A3 | 8 | 8 | ||||||
Credit Suisse First Boston Mortgage Securities Corp. | ||||||||
03-27, 5A3 | 70 | 70 | ||||||
13-HYB1, A16,144A | 1,134 | 1,136 | ||||||
Credit Suisse Mortgage Capital Trust 16-BDWN, A 144A | 875 | 875 | ||||||
Freddie Mac Structured Agency Credit Risk Debt Notes 16-DNA2, M2 | 835 | 849 | ||||||
GAHR Commercial Mortgage Trust 15-NRF, CFX 144A | 810 | 825 | ||||||
GMAC Mortgage Corp. Loan Trust 04-AR1, 12A | 198 | 200 | ||||||
Goldman Sachs Mortgage Securities Trust | ||||||||
07-GG10, A1A | 2,322 | 2,362 | ||||||
07-GG10, A4 | 1,353 | 1,373 | ||||||
GSAA Home Equity Trust | ||||||||
05-1, AF4 | 211 | 218 | ||||||
05-12, AF3W | 52 | 52 | ||||||
Hilton USA Trust 13-HLT, EFX 144A | 650 | 651 | ||||||
| PAR VALUE | VALUE | |||||||
| Non-Agency—continued | ||||||||
Home Equity Loan Trust 03-HS2, AIIB | $ | 296 | $ | 288 | ||||
IMC Home Equity Loan Trust 97-5, A9 | 110 | 110 | ||||||
Jefferies Resecuritization Trust 14-R1, 1A1 144A | 165 | 165 | ||||||
JPMorgan Chase (Bear Stearns) Adjustable Rate Mortgage Trust | ||||||||
04-1, 21A1 | 99 | 98 | ||||||
04-9, 22A1 | 770 | 756 | ||||||
04-10, 12A3 | 106 | 97 | ||||||
04-10, 21A1 | 862 | 869 | ||||||
JPMorgan Chase (Bear Stearns) Commercial Mortgage Securities Trust | ||||||||
06-T24, AM | 565 | 565 | ||||||
07- PW17, A4 | 747 | 767 | ||||||
07-PW18, A4 | 311 | 320 | ||||||
07-PW18, AM, | 965 | 998 | ||||||
JPMorgan Chase (Washington Mutual) Mortgage Pass-Through Certificates Trust | ||||||||
03-S8, A2 | 48 | 48 | ||||||
03-AR6, A1 | 338 | 336 | ||||||
03-AR4, 2A1 | 202 | 198 | ||||||
JPMorgan Chase Commercial Mortgage Securities Trust | ||||||||
10-CNTR, A2 144A | 110 | 118 | ||||||
15-SGP, B 144A | 759 | 760 | ||||||
11-C4, A3 144A | 1,446 | 1,503 | ||||||
06-LDP9, A3 | 399 | 399 | ||||||
06-LDP9, AM | 925 | 928 | ||||||
14- C22, A4 | 1,695 | 1,850 | ||||||
07-LDPX, AM | 889 | 872 | ||||||
07-CB19, A4 | 2,238 | 2,270 | ||||||
07-LD12, A4 | 2,069 | 2,114 | ||||||
JPMorgan Chase Mortgage Trust | ||||||||
14-2, 2A2 144A | 170 | 175 | ||||||
| PAR VALUE | VALUE | |||||||
| Non-Agency—continued | ||||||||
06-A2, 4A1 | $ | 165 | $ | 166 | ||||
04-A4, 2A1 | 133 | 134 | ||||||
05-A4, 3A1 | 706 | 697 | ||||||
14-1, 2A2 144A | 1,558 | 1,611 | ||||||
14-1, 1A1 144A | 314 | 331 | ||||||
16-1, M2 144A | 842 | 869 | ||||||
15-4, 1A4 144A | 1,491 | 1,541 | ||||||
16-2, M2 144A | 1,261 | 1,305 | ||||||
16-1, A3 144A | 2,407 | 2,486 | ||||||
11-C4, A4, 144A | 295 | 322 | ||||||
JPMorgan Chase Trust | ||||||||
15-1, AM1 144A | 958 | 956 | ||||||
15-5, A2 144A | 1,132 | 1,150 | ||||||
JPMorgan Mortgage Trust | ||||||||
14-OAK4, A16 144A | 764 | 786 | ||||||
16-1, A3 144A | 800 | 830 | ||||||
MASTR Alternative Loan Trust | ||||||||
04-10, 3A1 | 82 | 83 | ||||||
03-8, 2A1 | 129 | 133 | ||||||
04-4, 6A1 | 170 | 176 | ||||||
04-7, 9A1 | 133 | 138 | ||||||
05-2, 2A1 | 493 | 509 | ||||||
MASTR Asset Securitization Trust | 283 | 285 | ||||||
MASTR Specialized Loan Trust 05-3, A2 144A | 416 | 419 | ||||||
Mill City Mortgage Trust | ||||||||
15-1, A3 144A | 600 | 607 | ||||||
16-1, A1 144A | 1,211 | 1,217 | ||||||
Morgan Stanley – Bank of America (Merrill Lynch) Trust 13-C13, AS | 1,515 | 1,682 | ||||||
Morgan Stanley Capital Barclays Bank Trust 16-Mart, A 144A | 915 | 916 | ||||||
Morgan Stanley Capital I Trust | ||||||||
07-T27, A4 | 1,446 | 1,476 | ||||||
See Notes to Financial Statements
50
Table of Contents
VIRTUS LOW DURATION INCOME FUND
SCHEDULE OF INVESTMENTS (Continued)
SEPTEMBER 30, 2016
($ reported in thousands)
| PAR VALUE | VALUE | |||||||
| Non-Agency—continued | ||||||||
08-T29, A4 | $ | 190 | $ | 199 | ||||
08-T29, AM | 950 | 993 | ||||||
07-IQ14, A4 | 760 | 768 | ||||||
07-IQ14, AM | 428 | 414 | ||||||
07- LQ16, A4 | 679 | 698 | ||||||
Morgan Stanley Residential Mortgage Loan Trust 14-1A, A1 144A | 537 | 544 | ||||||
Motel 6 Trust | ||||||||
15-MTL6, B 144A | 365 | 365 | ||||||
15-MTL6, D 144A | 810 | 813 | ||||||
New Residential Mortgage Loan Trust | ||||||||
16-2A, A1 144A | 397 | 412 | ||||||
14-1A, A 144A | 1,265 | 1,314 | ||||||
14-2A, 3A 144A | 251 | 261 | ||||||
14-3A, AFX3 144A | 2,122 | 2,196 | ||||||
15-2A, A1 144A | 1,713 | 1,785 | ||||||
16-1A, A1 144A | 698 | 723 | ||||||
16-3A, A1 144A | 1,450 | 1,513 | ||||||
Novastar Mortgage Funding Trust Series 04-4, M5 | 1,560 | 1,523 | ||||||
Sequoia Mortgage Trust | ||||||||
14-3, A9 144A | 771 | 800 | ||||||
14-4, A6 144A | 738 | 760 | ||||||
Structured Adjustable Rate Mortgage Loan Trust | ||||||||
04-1, 6A | 762 | 742 | ||||||
04-4, 3A2 | 524 | 520 | ||||||
04-4, 3A1 | 170 | 167 | ||||||
04-5, 3A2 | 368 | 372 | ||||||
04-14, 7A | 327 | 326 | ||||||
Structured Asset Securities Corp. | ||||||||
03-AL1, A 144A | 193 | 190 | ||||||
03-37A, 2A | 163 | 162 | ||||||
| PAR VALUE | VALUE | |||||||
| Non-Agency—continued | ||||||||
Structured Asset Securities Corp. Mortgage-Pass-Through Certificates | ||||||||
02-AL1, A2 | $ | 157 | $ | 156 | ||||
02-AL1, A3 | 829 | 822 | ||||||
03-33H, 1A1 | 453 | 462 | ||||||
03-34A, 6A | 394 | 387 | ||||||
04-15, 3A3 | 168 | 169 | ||||||
Towd Point Mortgage Trust | ||||||||
15-3, A1B 144A | 712 | 727 | ||||||
16-1, A1B, 144A | 814 | 826 | ||||||
15-5, A1B 144A | 1,161 | 1,173 | ||||||
15-5, A2 144A | 175 | 177 | ||||||
16-2, A1 144A | 399 | 407 | ||||||
16-4, A1 144A | 920 | 924 | ||||||
Vericrest Opportunity Loan Transfer | ||||||||
16-NPL9, A1 144A | 385 | 385 | ||||||
15-NPL2, A1 144A | 263 | 263 | ||||||
15-NPL3, A1 144A | 254 | 253 | ||||||
Vericrest Opportunity Loan Trust | ||||||||
16-NPL8, A1 144A | 835 | 836 | ||||||
14-NPL9, A1 144A | 136 | 136 | ||||||
15-NPL4, A1 144A | 74 | 74 | ||||||
Wells Fargo (Wachovia Bank) Commercial Mortgage Trust | ||||||||
07-C30, A5 | 1,430 | 1,439 | ||||||
07-C30, AM | 1,760 | 1,776 | ||||||
07-C31, A4 | 1,025 | 1,034 | ||||||
07-C32, A3 | 815 | 828 | ||||||
07-C33, A5 | 79 | 81 | ||||||
Wells Fargo Mortgage Backed Securities Trust | ||||||||
03-G, A1 | 78 | 78 | ||||||
03-J, 2A1 | 172 | 173 | ||||||
03-J, 5A1 | 276 | 277 | ||||||
04-A, 2.869%, | 74 | 74 | ||||||
| PAR VALUE | VALUE | |||||||
| Non-Agency—continued | ||||||||
04-K, 1A2 | $ | 318 | $ | 318 | ||||
04-U, A1 | 96 | 96 | ||||||
04-Z, 2A1 | 235 | 239 | ||||||
05-14, 2A1 | 81 | 84 | ||||||
|
| |||||||
| 113,685 | ||||||||
| TOTAL MORTGAGE-BACKED SECURITIES (Identified Cost $163,567) | 164,885 | |||||||
| ASSET-BACKED SECURITIES—23.7% | ||||||||
American Credit Acceptance Receivables Trust 16- 1A, B 144A | 835 | 866 | ||||||
AmeriCredit Automobile Receivables Trust | ||||||||
12-4, D | 160 | 160 | ||||||
13-2, D | 800 | 806 | ||||||
14-1, D | 650 | 658 | ||||||
16-1, B | 2,045 | 2,072 | ||||||
15-3, C | 615 | 627 | ||||||
16-2, B | 1,000 | 1,011 | ||||||
15-4, C | 700 | 718 | ||||||
Associates Manufactured Housing Pass-Through Certificates 96-1, B1 | 567 | 586 | ||||||
Avis Budget Rental Car Funding LLC | ||||||||
(AESOP) 12-3A, A 144A | 540 | 542 | ||||||
(AESOP) 13-1A, A 144A | 1,000 | 1,000 | ||||||
(AESOP) 13-2A, A 144A | 900 | 918 | ||||||
(AESOP) 16-1A, A 144A | 800 | 821 | ||||||
BXG Receivables Note Trust | ||||||||
12-A, A 144A | 57 | 57 | ||||||
13-A, A 144A | 177 | 178 | ||||||
15-A, A 144A | 405 | 401 | ||||||
California Republic Auto Receivables Trust | ||||||||
13-1, B 144A | 340 | 342 | ||||||
15-3, B | 650 | 662 | ||||||
16-1, B | 785 | 811 | ||||||
See Notes to Financial Statements
51
Table of Contents
VIRTUS LOW DURATION INCOME FUND
SCHEDULE OF INVESTMENTS (Continued)
SEPTEMBER 30, 2016
($ reported in thousands)
| PAR VALUE | VALUE | |||||||
| ASSET-BACKED SECURITIES—continued | ||||||||
Capital Auto Receivables Asset Trust | ||||||||
13-1, C | $ | 1,081 | $ | 1,082 | ||||
13-4, C | 505 | 510 | ||||||
16-3, C | 1,365 | 1,366 | ||||||
CarFinance Capital Auto Trust | ||||||||
13-1A, B 144A | 137 | 137 | ||||||
14-1A, A 144A | 79 | 79 | ||||||
13-2A, B 144A | 127 | 127 | ||||||
14-2A, B 144A | 425 | 428 | ||||||
CarMax Auto Owner Trust | ||||||||
14-4, B | 700 | 710 | ||||||
15-2, C | 1,495 | 1,517 | ||||||
15-4B 2.160%, 8/16/21 | 725 | 732 | ||||||
16-2, B | 750 | 759 | ||||||
CarNow Auto Receivables Trust 14-1A, D 144A | 350 | 352 | ||||||
CCG Receivables Trust | ||||||||
14-1, B 144A | 400 | 401 | ||||||
15-1, A3 144A | 1,000 | 1,007 | ||||||
Centerpoint Energy Transition Bond Co.IV LLC 12-1, A1 | 114 | 114 | ||||||
Centre Point Funding LLC 12-2A, 1 144A | 1,322 | 1,312 | ||||||
Cheesecake Restaurant Holdings, Inc. 13-1A, A2 144A | 630 | 632 | ||||||
Chrysler Capital Auto Receivables Trust | ||||||||
14-BA D 144A | 750 | 769 | ||||||
15-BA D 144A | 965 | 987 | ||||||
Citigroup 15-PM3,A 144A | 382 | 383 | ||||||
Conseco Financial Corp. 97-3, A5 | 110 | 113 | ||||||
Diamond Resorts Owner Trust 14-1, A 144A | 906 | 907 | ||||||
DRB Prime Student Loan Trust 15-D, A3 144A | 537 | 539 | ||||||
Drive Auto Receivables Trust | ||||||||
15-DA, B 144A | 1,080 | 1,086 | ||||||
| PAR VALUE | VALUE | |||||||
| ASSET-BACKED SECURITIES—continued | ||||||||
16-AA, B 144A | $ | 1,490 | $ | 1,511 | ||||
16-BA, B 144A | 1,785 | 1,801 | ||||||
15-AA, C 144A | 1,665 | 1,679 | ||||||
15-DA, C 144A | 1,505 | 1,533 | ||||||
DT Auto Owner Trust | ||||||||
14-1A, C 144A | 239 | 239 | ||||||
14-2A, C 144A | 161 | 162 | ||||||
16-1A, B 144A | 850 | 858 | ||||||
14-3A, C 144A | 1,350 | 1,362 | ||||||
15-3A, C 144A | 655 | 663 | ||||||
16-2A, C 144A | 820 | 838 | ||||||
16-3A C,144A | 865 | 872 | ||||||
16-4A C,144A | 1,200 | 1,200 | ||||||
Exeter Automobile Receivables Trust | ||||||||
12-2A, C 144A | 116 | 116 | ||||||
14-1A, B 144A | 350 | 350 | ||||||
13-1A, C 144A | 441 | 444 | ||||||
14-1A, C 144A | 150 | 151 | ||||||
14-2A, C 144A | 335 | 339 | ||||||
16-1A A, 144A | 1,072 | 1,075 | ||||||
15-A1, C 144A | 1,000 | 1,016 | ||||||
Fairway Outdoor Funding LLC 12-1A, A2 144A | 431 | 436 | ||||||
Fifth Third Auto Trust | 385 | 385 | ||||||
First Investors Auto Owner Trust 16-2A, C 144A | 1,490 | 1,492 | ||||||
Flagship Credit Auto Trust | ||||||||
16-1, A 144A | 831 | 839 | ||||||
15-2, C 144A | 505 | 505 | ||||||
16-2, B 144A | 825 | 860 | ||||||
Foursight Capital Automobile Receivables Trust 16-1 A2, 144A | 1,220 | 1,229 | ||||||
Gold Key Resorts LLC 14-A, A 144A | 398 | 399 | ||||||
| PAR VALUE | VALUE | |||||||
| ASSET-BACKED SECURITIES—continued | ||||||||
Hertz Vehicle Financing LLC | �� | |||||||
11-1A, A2 144A | $ | 1,300 | $ | 1,306 | ||||
15-2A, A 144A | 1,080 | 1,075 | ||||||
16 -1A, A144A | 750 | 754 | ||||||
Hilton Grand Vacations Trust | ||||||||
13-A, A 144A | 853 | 849 | ||||||
14-AA, A 144A | 247 | 246 | ||||||
Hyundai Auto Receivables Trust | ||||||||
14-B, D | 400 | 402 | ||||||
15-A, D | 550 | 555 | ||||||
15-C, B | 1,500 | 1,519 | ||||||
LEAF Receivables Funding 10 LLC 15-1, D 144A | 585 | 582 | ||||||
Marriott Vacation Club Owner Trust 12-1A, A 144A | 330 | 332 | ||||||
MVW Owner Trust | ||||||||
15-1A, B 144A | 443 | 447 | ||||||
16-1A, A 144A | 1,123 | 1,121 | ||||||
National City Mortgage Capital Trust 08-1, 2A1 | 237 | 246 | ||||||
Navistar Financial Dealer Note Master Owner Trust II 16-1, B 144A | 1,710 | 1,722 | ||||||
OneMain Financial Issuance Trust | ||||||||
14-1A, A 144A | 479 | 479 | ||||||
15-A, A 144A | 1,660 | 1,677 | ||||||
Orange Lake Timeshare Trust | ||||||||
12-AA, A 144A | 381 | 385 | ||||||
15-AA, A 144A | 391 | 394 | ||||||
Santander Drive Auto Receivables Trust | ||||||||
12-6, C | 9 | 9 | ||||||
12-5, C | 24 | 24 | ||||||
12-6, D | 450 | 452 | ||||||
13-1, D | 1,691 | 1,703 | ||||||
13-3, C | 524 | 525 | ||||||
13-5, D | 540 | 548 | ||||||
See Notes to Financial Statements
52
Table of Contents
VIRTUS LOW DURATION INCOME FUND
SCHEDULE OF INVESTMENTS (Continued)
SEPTEMBER 30, 2016
($ reported in thousands)
| PAR VALUE | VALUE | |||||||
| ASSET-BACKED SECURITIES—continued | ||||||||
14-4, D | $ | 1,095 | $ | 1,123 | ||||
16-2, B | 1,000 | 1,007 | ||||||
16-1, C | 1,300 | 1,334 | ||||||
Security National Automotive Acceptance Company Receivables Trust 14-1A, C 144A | 492 | 492 | ||||||
Sierra Timeshare Receivables Funding LLC | ||||||||
12-3A, A 144A | 373 | 371 | ||||||
13-1A, A 144A | 76 | 76 | ||||||
14-1A, A 144A | 122 | 122 | ||||||
14-2A, A 144A | 81 | 81 | ||||||
16-1A, A 144A | 658 | 669 | ||||||
16-2A, A 144A | 903 | 903 | ||||||
Silverleaf Finance LLC | ||||||||
XVII 13-A, A 144A | 70 | 69 | ||||||
XVIII 14-A, A 144A | 267 | 265 | ||||||
Silverleaf Finance XV LLC 12-D, A 144A | 23 | 23 | ||||||
SLM Private Education Loan Trust | ||||||||
14-A, 2A2 144A | 1,450 | 1,468 | ||||||
13-B, A2A 144A | 1,000 | 999 | ||||||
13-C, A2A 144A | 325 | 332 | ||||||
SoFi Professional Loan Program LLC | ||||||||
14-B, A2 144A | 725 | 736 | ||||||
15-A, A2 144A | 276 | 280 | ||||||
16-C, A2B 144A | 1,441 | 1,455 | ||||||
16-A, A2 144A | 565 | 579 | ||||||
Structured Asset Securities Corp. Mortgage Pass-Through Certificates 01-SB1, A2 | 156 | 154 | ||||||
SVO VOI Mortgage Corp. 12-AA, A 144A | 1,194 | 1,181 | ||||||
Taco Bell Funding LLC 16-1A, A21 144A | 995 | 1,009 | ||||||
| PAR VALUE | VALUE | |||||||
| ASSET-BACKED SECURITIES—continued | ||||||||
TCF Auto Receivables Owner Trust 14-1A, B 144A | $ | 475 | $ | 476 | ||||
Tidewater Auto Receivables Trust 16-AA, B 144A | 785 | 797 | ||||||
Trip Rail Master Funding LLC 11-1A, A1A 144A | 249 | 255 | ||||||
U-Haul S Fleet LLC 10-BT1A, 1 144A | 1,010 | 1,022 | ||||||
United Auto Credit Securitization Trust | ||||||||
16-1, B 144A | 900 | 904 | ||||||
16-2, C 144A | 1,365 | 1,366 | ||||||
Verizon Owner Trust 16-1A, A 144A | 1,645 | 1,649 | ||||||
Volvo Financial Equipment LLC 14-1A, C 144A | 205 | 206 | ||||||
VSE VOI Mortgage LLC 16-A, A 144A | 1,585 | 1,590 | ||||||
Welk Resorts LLC | ||||||||
13-AA, A 144A | 141 | 142 | ||||||
15-AA, A 144A | 285 | 285 | ||||||
Westgate Resorts LLC 16-1A, A 144A | 598 | 599 | ||||||
Westlake Automobile Receivables Trust | ||||||||
14-1A, C 144A | 151 | 151 | ||||||
15-1A, B 144A | 723 | 724 | ||||||
16-2A C, 144A | 1,030 | 1,043 | ||||||
| TOTAL ASSET-BACKED SECURITIES (Identified Cost $94,156) | 94,928 | |||||||
| CORPORATE BONDS AND NOTES—18.3% | ||||||||
| Consumer Discretionary—1.7% | ||||||||
Alibaba Group Holding Ltd. | 600 | 612 | ||||||
CCO Holdings LLC 144A | 520 | 546 | ||||||
Cequel Communications Holdings I LLC (Cequel Capital Corp.) | ||||||||
144A 5.125%, 12/15/21(3) | 105 | 106 | ||||||
144A 5.125%, 12/15/21(3) | 250 | 251 | ||||||
Delphi Automotive plc | 540 | 559 | ||||||
Hanesbrands, Inc. 144A | 135 | 139 | ||||||
| PAR VALUE | VALUE | |||||||
| Consumer Discretionary—continued | ||||||||
Hyundai Capital America | ||||||||
RegS 1.450%, 2/6/17(4) | $ | 335 | $ | 335 | ||||
144A 1.450%, 2/6/17(3) | 170 | 170 | ||||||
144A 2.125%, 10/2/17(3) | 60 | 60 | ||||||
144A 2.450%, 6/15/21(3) | 355 | 360 | ||||||
M/I Homes, Inc. | 325 | 342 | ||||||
Marriott International, Inc. Series N, | 290 | 303 | ||||||
Newell Brands, Inc. | ||||||||
3.850%, 4/1/23 | 75 | 80 | ||||||
4.200%, 4/1/26 | 100 | 109 | ||||||
QVC, Inc. | 990 | 1,015 | ||||||
Time Warner Cable, Inc. | 215 | 234 | ||||||
Toll Brothers Finance Corp. | ||||||||
5.625%, 1/15/24 | 25 | 27 | ||||||
4.875%, 11/15/25 | 745 | 765 | ||||||
TRI Pointe Group, Inc. | ||||||||
4.375%, 6/15/19 | 295 | 305 | ||||||
4.875%, 7/1/21 | 400 | 411 | ||||||
Wyndham Worldwide Corp. | 40 | 40 | ||||||
|
| |||||||
| 6,769 | ||||||||
|
| |||||||
| Consumer Staples—0.5% | ||||||||
Anheuser-Busch InBev Finance, Inc. | ||||||||
1.900%, 2/1/19 | 180 | 182 | ||||||
2.650%, 2/1/21 | 540 | 557 | ||||||
CVS Health Corp. | 540 | 560 | ||||||
Kraft Heinz Foods Co. (The) | ||||||||
2.800%, 7/2/20 | 85 | 88 | ||||||
3.500%, 7/15/22 | 90 | 96 | ||||||
Whole Foods Market, Inc. 144A | 615 | 668 | ||||||
|
| |||||||
| 2,151 | ||||||||
|
| |||||||
| Energy—0.8% | ||||||||
Anadarko Petroleum Corp. | 170 | 183 | ||||||
Antero Resources Corp. | 215 | 220 | ||||||
Cimarex Energy Co. | 490 | 512 | ||||||
Concho Resources, Inc. | 45 | 47 | ||||||
Enbridge Energy Partners LP | 90 | 95 | ||||||
Energy Transfer Partners LP | 130 | 141 | ||||||
Kinder Morgan, Inc. 144A | 85 | 94 | ||||||
MPLX LP | 290 | 300 | ||||||
NGL Energy Partners LP | 365 | 345 | ||||||
See Notes to Financial Statements
53
Table of Contents
VIRTUS LOW DURATION INCOME FUND
SCHEDULE OF INVESTMENTS (Continued)
SEPTEMBER 30, 2016
($ reported in thousands)
| PAR VALUE | VALUE | |||||||
| Energy—continued | ||||||||
Occidental Petroleum Corp. | ||||||||
2.600%, 4/15/22 | $ | 55 | $ | 56 | ||||
3.400%, 4/15/26 | 45 | 48 | ||||||
Regency Energy Partners LP | 215 | 227 | ||||||
Sabine Pass Liquefaction LLC 6.250%, 3/15/22 | 340 | 372 | ||||||
Sinopec Capital Ltd. 144A | 250 | 250 | ||||||
Sunoco LP 144A | 400 | 413 | ||||||
|
| |||||||
| 3,303 | ||||||||
|
| |||||||
| Financials—7.5% | ||||||||
Air Lease Corp. | 550 | 555 | ||||||
Ally Financial, Inc. | 330 | 346 | ||||||
Ares Capital Corp. | ||||||||
4.875%, 11/30/18 | 62 | 65 | ||||||
3.875%, 1/15/20 | 173 | 179 | ||||||
Aviation Capital Group Corp. | ||||||||
2.875%, 9/17/18 | 220 | 223 | ||||||
144A 2.875%, | 115 | 116 | ||||||
Bank of America Corp. | ||||||||
5.490%, 3/15/19 | 66 | 71 | ||||||
2.650%, 4/1/19 | 350 | 357 | ||||||
4.450%, 3/3/26 | 475 | 510 | ||||||
Bank of India 144A | 300 | 306 | ||||||
Bank of New York Mellon Corp. (The) | ||||||||
2.200%, 3/4/19 | 230 | 234 | ||||||
2.050%, 5/3/21 | 860 | 866 | ||||||
Barclays Bank plc 144A | 100 | 105 | ||||||
BBVA Banco Continental S.A. RegS | 520 | 571 | ||||||
Berkshire Hathaway Finance Corp. | 1,955 | 1,958 | ||||||
Berkshire Hathaway, Inc. | 90 | 94 | ||||||
Blackstone Holdings Finance Co. LLC 144A | 200 | 227 | ||||||
Citigroup, Inc. | 630 | 673 | ||||||
Corp Andina de Fomento | 455 | 459 | ||||||
Fifth Third Bancorp | 150 | 156 | ||||||
First Horizon National Corp. | 440 | 449 | ||||||
First Tennessee Bank N.A. | 250 | 253 | ||||||
Ford Motor Credit Co., LLC | 400 | 451 | ||||||
FS Investment Corp. | ||||||||
4.250%, 1/15/20 | 300 | 308 | ||||||
4.750%, 5/15/22 | 185 | 190 | ||||||
| PAR VALUE | VALUE | |||||||
| Financials—continued | ||||||||
General Motors Financial Co., Inc. | ||||||||
3.700%, 11/24/20 | $ | 670 | $ | 698 | ||||
4.200%, 3/1/21 | 405 | 427 | ||||||
3.200%, 7/6/21 | 975 | 988 | ||||||
Goldman Sachs Group, Inc. (The) | ||||||||
2.350%, 11/15/21 | 350 | 349 | ||||||
4.250%, 10/21/25 | 320 | 337 | ||||||
Guanay Finance Ltd. 144A | 892 | 911 | ||||||
HSBC Holdings plc | 860 | 872 | ||||||
Huntington Bancshares, Inc. | 245 | 285 | ||||||
Hutchison Whampoa International Ltd. | 280 | 286 | ||||||
ICAHN Enterprises LP | 200 | 193 | ||||||
ICAHN Enterprises LP (ICAHN Enterprises Finance Corp.) | 15 | 15 | ||||||
Industrial & Commercial Bank of China Ltd. | 250 | 260 | ||||||
iStar Financial, Inc. | 375 | 375 | ||||||
Jefferies Group LLC | 150 | 157 | ||||||
JPMorgan Chase & Co. | ||||||||
6.125%, 6/27/17 | 200 | 207 | ||||||
2.250%, 1/23/20 | 540 | 547 | ||||||
2.295%, 8/15/21 | 300 | 301 | ||||||
JPMorgan Chase Bank N.A. | 615 | 616 | ||||||
KeyCorp. 5.100%, 3/24/21 | 185 | 209 | ||||||
Korea Development Bank | 250 | 254 | ||||||
Lazard Group LLC | 350 | 375 | ||||||
Lincoln National Corp. | ||||||||
8.750%, 7/1/19 | 225 | 265 | ||||||
4.200%, 3/15/22 | 470 | 509 | ||||||
6.050%, 4/20/67(2)(5) | 75 | 58 | ||||||
Macquarie Group Ltd. 144A | 75 | 77 | ||||||
Metropolitan Life Global Funding I 144A | 650 | 668 | ||||||
Mizuho Corporate Bank Ltd. 144A | 200 | 201 | ||||||
Mizuho Financial Group Inc | 565 | 563 | ||||||
Morgan Stanley | 1,660 | 1,773 | ||||||
MUFG Union Bank N.A. | 300 | 306 | ||||||
New York Life Global Funding 144A | 70 | 71 | ||||||
| PAR VALUE | VALUE | |||||||
| Financials—continued | ||||||||
Nordea Bank AB 144A | $ | 1,005 | $ | 1,002 | ||||
PNC Funding Corp. | 10 | 10 | ||||||
Prudential Financial, Inc. | 100 | 111 | ||||||
S&P Global, Inc. | 519 | 545 | ||||||
Santander Holdings USA, Inc. | ||||||||
2.700%, 5/24/19 | 265 | 268 | ||||||
2.650%, 4/17/20 | 575 | 578 | ||||||
SBA Tower Trust | ||||||||
144A 2.933%, 12/15/17(3) | 155 | 156 | ||||||
144A 3.156%, 10/15/20(3) | 750 | 757 | ||||||
144A 2.877%, 7/15/21(3) | 800 | 814 | ||||||
State Street Corp. | 525 | 548 | ||||||
TIAA Asset Management Finance Co. LLC 144A | 430 | 443 | ||||||
Toronto-Dominion Bank (The) | 700 | 708 | ||||||
UBS Group Funding Jersey Ltd. 144A | 400 | 399 | ||||||
Voya Financial, Inc. | 267 | 272 | ||||||
Willis North America, Inc. | 40 | 41 | ||||||
XLIT Ltd. Series E, | 135 | 137 | ||||||
Zions Bancorp | 225 | 227 | ||||||
|
| |||||||
| 29,891 | ||||||||
|
| |||||||
| Health Care—1.7% | ||||||||
AbbVie, Inc. | ||||||||
2.500%, 5/14/20 | 370 | 378 | ||||||
2.300%, 5/14/21 | 495 | 499 | ||||||
3.200%, 11/6/22 | 45 | 47 | ||||||
2.850%, 5/14/23 | 495 | 503 | ||||||
Actavis Capital S.a.r.l. | ||||||||
(Actavis Funding) | 85 | 88 | ||||||
(Actavis Funding) | 90 | 94 | ||||||
Aetna Inc. | 1,010 | 1,023 | ||||||
Community Health Systems, Inc. | 65 | 65 | ||||||
Forest Laboratories LLC 144A 4.375%, 2/1/19(3) | 205 | 216 | ||||||
Fresenius U.S. Finance II, Inc. 144A | 95 | 100 | ||||||
HCA, Inc. | ||||||||
3.750%, 3/15/19 | 200 | 206 | ||||||
6.500%, 2/15/20 | 325 | 360 | ||||||
Mylan NV | ||||||||
144A 3.000%, 12/15/18(3) | 195 | 199 | ||||||
144A 3.150%, 6/15/21(3) | 230 | 234 | ||||||
See Notes to Financial Statements
54
Table of Contents
VIRTUS LOW DURATION INCOME FUND
SCHEDULE OF INVESTMENTS (Continued)
SEPTEMBER 30, 2016
($ reported in thousands)
| PAR VALUE | VALUE | |||||||
| Health Care—continued | ||||||||
Owens & Minor, Inc. | $ | 65 | $ | 67 | ||||
Shire Acquisitions Investments Ireland Dac | ||||||||
1.900%, 9/23/19 | 200 | 200 | ||||||
2.400%, 9/23/21 | 235 | 236 | ||||||
Tenet Healthcare Corp. | ||||||||
4.350%, 6/15/20(2) | 440 | 444 | ||||||
6.000%, 10/1/20 | 80 | 85 | ||||||
Teva Pharmaceutical Finance Netherlands III BV | ||||||||
2.200%, 7/21/21 | 140 | 140 | ||||||
2.800%, 7/21/23 | 140 | 140 | ||||||
Universal Health Services, Inc. 144A | 260 | 268 | ||||||
Valeant Pharmaceuticals International, Inc. 144A | 170 | 158 | ||||||
Zimmer Biomet Holdings, Inc. | 825 | 854 | ||||||
Zoetis, Inc. | 165 | 172 | ||||||
|
| |||||||
| 6,776 | ||||||||
|
| |||||||
| Industrials—1.8% | ||||||||
America West Airlines Pass-Through-Trust 01-1, G | 611 | 663 | ||||||
BAE Systems Holdings, Inc. 144A | 200 | 205 | ||||||
Bombardier, Inc. 144A | 215 | 210 | ||||||
British Airways Pass-Through-Trust 13-1, B 144A | 705 | 742 | ||||||
Continental Airlines Pass-Through-Trust | ||||||||
99-1, A | 138 | 146 | ||||||
01-1, A1 | 445 | 478 | ||||||
Lockheed Martin Corp. | 125 | 127 | ||||||
Masco Corp. | 295 | 336 | ||||||
Penske Truck Leasing Co. LP RegS | 150 | 152 | ||||||
Penske Truck Leasing Co., LP 144A | 205 | 213 | ||||||
UAL Pass-Through-Trust 07-01, A | 2,624 | 2,795 | ||||||
Virgin Australia Trust 13-1A 144A | 1,148 | 1,191 | ||||||
|
| |||||||
| 7,258 | ||||||||
|
| |||||||
| PAR VALUE | VALUE | |||||||
| Information Technology—0.9% | ||||||||
Apple, Inc. | ||||||||
2.250%, 2/23/21 | $ | 400 | $ | 410 | ||||
2.850%, 2/23/23 | 175 | 184 | ||||||
Diamond 1 Finance Corp. (Diamond 2 Finance Corp.) 144A | 115 | 123 | ||||||
Dun & Bradstreet Corp. (The) | ||||||||
3.250%, 12/1/17 | 65 | 66 | ||||||
4.000%, 6/15/20 | 135 | 141 | ||||||
Electronic Arts, Inc. | 120 | 128 | ||||||
First Data Corp. 144A | 785 | 800 | ||||||
Hewlett Packard Enterprise Co. | ||||||||
144A 2.850%, 10/5/18(3) | 325 | 331 | ||||||
144A 3.600%, | 60 | 63 | ||||||
Microsoft Corp. | 320 | 320 | ||||||
NXP BV (NXP Funding LLC) 144A | 425 | 455 | ||||||
Oracle Corp. | ||||||||
1.900%, 9/15/21 | 175 | 175 | ||||||
2.400%, 9/15/23 | 220 | 222 | ||||||
|
| |||||||
| 3,418 | ||||||||
|
| |||||||
| Materials—0.4% | ||||||||
Airgas, Inc. | 28 | 29 | ||||||
Ardagh Packaging Finance plc 144A | 360 | 362 | ||||||
CRH America, Inc. | 100 | 111 | ||||||
Office Cherifien des Phosphates S.A. (OCP) 144A | 790 | 858 | ||||||
Packaging Corp. of America | 185 | 196 | ||||||
|
| |||||||
| 1,556 | ||||||||
|
| |||||||
| Real Estate—1.3% | ||||||||
American Campus Communities Operating Partnership LP | 70 | 73 | ||||||
Brixmor Operating Partnership LP | 140 | 147 | ||||||
Corporate Office Properties LP | 220 | 228 | ||||||
Corrections Corp. of America | 390 | 355 | ||||||
Developers Diversified Realty Corp. | ||||||||
7.875%, 9/1/20 | 570 | 684 | ||||||
3.400%, 10/1/20 | 325 | 339 | ||||||
3.950%, 7/1/22 | 195 | 207 | ||||||
| PAR VALUE | VALUE | |||||||
| Real Estate—continued | ||||||||
HCP, Inc. | $ | 225 | $ | 233 | ||||
Healthcare Trust of America Holdings LP | 135 | 140 | ||||||
Kimco Realty Corp. | 550 | 579 | ||||||
MPT Operating Partnership LP (MPT Finance Corp.) | 45 | 47 | ||||||
Select Income REIT | 580 | 583 | ||||||
Senior Housing Properties Trust | 125 | 126 | ||||||
Ventas Realty LP (Ventas Capital Corp.) | ||||||||
4.000%, 4/30/19 | 505 | 530 | ||||||
2.700%, 4/1/20 | 152 | 156 | ||||||
West Europe Finance LLC 144A | 535 | 557 | ||||||
|
| |||||||
| 4,984 | ||||||||
|
| |||||||
| Telecommunication Services—1.4% | ||||||||
Altice Financing S.A. 144A | 660 | 680 | ||||||
AT&T, Inc. | ||||||||
2.800%, 2/17/21 | 1,065 | 1,096 | ||||||
3.000%, 6/30/22 | 195 | 200 | ||||||
CenturyLink, Inc. | ||||||||
Series T | 180 | 185 | ||||||
Series Y | 470 | 503 | ||||||
Crown Castle Towers LLC 144A | 765 | 836 | ||||||
Sprint Corp. | 235 | 237 | ||||||
Telefonica Emisiones SAU | 195 | 200 | ||||||
Verizon Communications, Inc. | ||||||||
3.650%, 9/14/18 | 310 | 324 | ||||||
2.550%, 6/17/19 | 1,335 | 1,373 | ||||||
4.600%, 4/1/21 | 70 | 78 | ||||||
|
| |||||||
| 5,712 | ||||||||
|
| |||||||
| Utilities—0.3% | ||||||||
Exelon Corp. | 805 | 834 | ||||||
Korea Western Power Co., Ltd. 144A | 200 | 202 | ||||||
State Grid Overseas Investment Ltd. 144A | 330 | 339 | ||||||
|
| |||||||
| 1,375 | ||||||||
| TOTAL CORPORATE BONDS AND NOTES (Identified Cost $71,655) | 73,193 | |||||||
See Notes to Financial Statements
55
Table of Contents
VIRTUS LOW DURATION INCOME FUND
SCHEDULE OF INVESTMENTS (Continued)
SEPTEMBER 30, 2016
($ reported in thousands)
| PAR VALUE | VALUE | |||||||
| LOAN AGREEMENTS(2)—3.9% | ||||||||
| Consumer Discretionary—1.2% | ||||||||
Altice U.S. Finance I Corp. | $ | 310 | $ | 313 | ||||
Aristocrat Leisure Ltd. Tranche B-1 | 550 | 553 | ||||||
Boyd Gaming Corp. | ||||||||
Tranche B, | 58 | 59 | ||||||
Tranche B-2 | 221 | 223 | ||||||
Charter Communications Operating LLC (CCO Safari LLC) | ||||||||
Tranche F, | 120 | 121 | ||||||
Tranche H, | 83 | 83 | ||||||
Tranche I, | 158 | 159 | ||||||
CSC Holdings, Inc. | 281 | 282 | ||||||
Harbor Freight Tools USA, Inc. | 755 | 760 | ||||||
Hilton Worldwide Finance LLC | ||||||||
Tranche B-1 | 67 | 67 | ||||||
Tranche B-2 | 685 | 690 | ||||||
Las Vegas Sands LLC Tranche B, | 331 | 333 | ||||||
Libbey Glass, Inc. | 145 | 146 | ||||||
MGM Growth Properties | 284 | 286 | ||||||
PetSmart, Inc. Tranche B-1, | 308 | 309 | ||||||
Six Flags Theme Parks, Inc. Tranche B, | 122 | 123 | ||||||
Station Casinos LLC Tranche B, | 297 | 300 | ||||||
|
| |||||||
| 4,807 | ||||||||
|
| |||||||
| Consumer Staples—0.7% | ||||||||
Albertson’s LLC | ||||||||
Trance B-4, | 201 | 203 | ||||||
Tranche B-5, | 333 | 337 | ||||||
ARAMARK Corp. | ||||||||
Tranche E, | 416 | 420 | ||||||
Tranche F, | 855 | 861 | ||||||
Charger OpCo B.V. (Oak Tea, Inc.) Tranche B-1, | 48 | 49 | ||||||
| PAR VALUE | VALUE | |||||||
| Consumer Staples—continued | ||||||||
Coty, Inc. Tranche B, | $ | 65 | $ | 65 | ||||
Dell International, Inc. Tranche B | 600 | 604 | ||||||
Galleria Co. Tranche B, | 130 | 131 | ||||||
Kronos First Lien, | 292 | 293 | ||||||
Pinnacle Foods Finance LLC | 52 | 52 | ||||||
|
| |||||||
| 3,015 | ||||||||
|
| |||||||
| Energy—0.1% | ||||||||
MEG Energy Corp. | 309 | 289 | ||||||
Paragon Offshore Finance Co. | 137 | 35 | ||||||
|
| |||||||
| 324 | ||||||||
|
| |||||||
| Financials—0.0% | ||||||||
Delos Finance S.a.r.l. | 95 | 96 | ||||||
|
| |||||||
| Health Care—0.4% | ||||||||
Community Health Systems, Inc. (CHS) Tranche F, | 291 | 290 | ||||||
DaVita HealthCare Partners, Inc. Tranche B, | 99 | 99 | ||||||
Endo Luxembourg Finance Co. S.a.r.l. Tranche B, | 131 | 131 | ||||||
Envision Healthcare Corp. | 97 | 97 | ||||||
IMS Health, Inc. Tranche B, | 72 | 73 | ||||||
Quintiles Transnational Corp. Tranche B, | 43 | 44 | ||||||
RPI Finance Trust Tranche B-4, | 539 | 542 | ||||||
Team Health, Inc. Tranche B, | 193 | 194 | ||||||
Valeant Pharmaceuticals International, Inc. Series D-2, Tranche B, | 137 | 137 | ||||||
|
| |||||||
| 1,607 | ||||||||
|
| |||||||
| Industrials—0.4% | ||||||||
American Airlines, Inc. Tranche B, | 660 | 662 | ||||||
AWAS Finance Luxembourg S.A. | 97 | 98 | ||||||
| PAR VALUE | VALUE | |||||||
| Industrials—continued | ||||||||
McGraw-Hill Global Education Holdings LLC Tranche B, First Lien, | $ | 301 | $ | 304 | ||||
TransDigm, Inc. | ||||||||
Tranche D, | 65 | 66 | ||||||
Tranche E, | 79 | 79 | ||||||
Tranche F, | 138 | 138 | ||||||
United Airlines, Inc. (f/k/a Continental Airlines, Inc.) Tranche B-1, | 72 | 73 | ||||||
Waste Industries | 186 | 187 | ||||||
|
| |||||||
| 1,607 | ||||||||
|
| |||||||
| Information Technology—0.3% | ||||||||
Abacus Innovations Corp.(Leidos, Inc.) | 259 | 261 | ||||||
NXP BV Tranche F | 250 | 251 | ||||||
SS&C European Holdings S.a.r.l. | ||||||||
Tranche A-1, | 18 | 18 | ||||||
Tranche A-2, | 28 | 28 | ||||||
Tranche B-2, | 13 | 13 | ||||||
Tranche B-1, | 104 | 105 | ||||||
Western Digital Corp. Tranche B-1, | 543 | 549 | ||||||
|
| |||||||
| 1,225 | ||||||||
|
| |||||||
| Materials—0.1% | ||||||||
Huntsman International LLC Tranche 16-B, | 177 | 178 | ||||||
INEOS U.S. Finance LLC Tranche 2022, | 25 | 25 | ||||||
|
| |||||||
| 203 | ||||||||
|
| |||||||
| Real Estate—0.0% | ||||||||
ESH Hospitality, Inc. | 107 | 108 | ||||||
|
| |||||||
| Telecommunication Services—0.2% | ||||||||
Level 3 Financing, Inc. | ||||||||
Tranche B, 2020 | 127 | 128 | ||||||
Tranche B-II, | 93 | 94 | ||||||
T-Mobile USA, Inc. Senior Lien | 254 | 256 | ||||||
See Notes to Financial Statements
56
Table of Contents
VIRTUS LOW DURATION INCOME FUND
SCHEDULE OF INVESTMENTS (Continued)
SEPTEMBER 30, 2016
($ reported in thousands)
| PAR VALUE | VALUE | |||||||
| Telecommunication Services—continued | ||||||||
UPC Financing Partnership | $ | 297 | $ | 299 | ||||
|
| |||||||
| 777 | ||||||||
|
| |||||||
| Utilities—0.5% | ||||||||
Calpine Corp. | 673 | 677 | ||||||
Energy Future Holdings Corp. | ||||||||
5.000%, 7/27/23(8) | 234 | 236 | ||||||
Tranche C | 54 | 54 | ||||||
NRG Energy, Inc. | 1,003 | 1,007 | ||||||
|
| |||||||
| 1,974 | ||||||||
| TOTAL LOAN AGREEMENTS (Identified Cost $15,723) | 15,743 | |||||||
| SHARES | ||||||||
| PREFERRED STOCKS—0.4% | ||||||||
| Financials—0.4% | ||||||||
Bank of New York Mellon Corp. (The) | 390 | (7) | 398 | |||||
Citigroup, Inc. | 660 | (7) | 712 | |||||
JPMorgan Chase & Co. Series Z, 5.300%(2) | 50 | (7) | 51 | |||||
Wells Fargo & Co. | 325 | (7) | 339 | |||||
| TOTAL PREFERRED STOCKS (Identified Cost $1,445) | 1,500 | |||||||
| SHARES | VALUE | |||||||
| EXCHANGE-TRADED FUNDS—1.8% | ||||||||
iShares iBoxx $ Investment Grade Corporate Bond Fund(9) | 59,529 | $ | 7,333 | |||||
| TOTAL EXCHANGE-TRADED FUNDS (Identified Cost $7,163) | 7,333 | |||||||
| TOTAL LONG TERM INVESTMENTS—99.6% | ||||||||
| (Identified Cost $394,703) | 398,813 | |||||||
| TOTAL INVESTMENTS—99.6% (Identified Cost $394,703) | 398,813 | (1) | ||||||
Other assets and liabilities, net—0.4% |
| 1,508 | ||||||
|
| |||||||
| NET ASSETS—100.0% | $ | 400,321 | ||||||
|
| |||||||
Abbreviations:
| FHLMC | Federal Home Loan Mortgage Corporation (“Freddie Mac”). |
| FNMA | Federal National Mortgage Association (“Fannie Mae”). |
| GNMA | Government National Mortgage Association (“Ginnie Mae”) |
| REIT | Real Estate Investment Trust |
| REMIC | Real Estate Mortgage Investment Conduit |
Footnote Legend:
| (1) | Federal Income Tax Information: For tax information at September 30, 2016, see Note 10 Federal Income Tax Information in the Notes to Financial Statements. |
| (2) | Variable or step coupon security; interest rate shown reflects the rate in effect at September 30, 2016. |
| (3) | Security exempt from registration under Rule 144A of the Securities Act of 1933. These securities may be resold in transactions exempt from registration, normally to qualified institutional buyers. At September 30, 2016, these securities amounted to a value of $143,068 or 35.7% of net assets. |
| (4) | Regulation S security. Security is offered and sold outside of the United States, therefore, it is exempt from registration with the SEC under Rules 903 and 904 of the Securities Act of 1933. |
| (5) | Interest payments may be deferred. |
| (6) | No contractual maturity date. |
| (7) | Value shown as par value. |
| (8) | Security in default interest payments are being received during the bankruptcy proceedings. |
| (9) | Shares of this fund are publicly offered and its prospectus and annual report are publicly available. |
The following table provides a summary of inputs used to value the Fund’s investments as of September 30, 2016 (See Security Valuation Note 2A in the Notes to Financial Statements):
| Total Value at September 30, 2016 | Level 1 Quoted Prices | Level 2 Significant Observable Inputs | ||||||||||
Debt Securities: | ||||||||||||
Asset-Backed Securities | $ | 94,928 | $ | — | $ | 94,928 | ||||||
Corporate Bonds And Notes | 73,193 | — | 73,193 | |||||||||
Foreign Government Securities | 445 | — | 445 | |||||||||
Loan Agreements | 15,743 | — | 15,743 | |||||||||
Mortgage-Backed Securities | 164,885 | — | 164,885 | |||||||||
Municipal Bonds | 201 | — | 201 | |||||||||
U.S. Government Securities | 40,585 | — | 40,585 | |||||||||
Equity Securities: | ||||||||||||
Preferred Stocks | 1,500 | — | 1,500 | |||||||||
Exchange-Traded Funds | 7,333 | 7,333 | — | |||||||||
|
|
|
|
|
| |||||||
Total Investments | $ | 398,813 | $ | 7,333 | $ | 391,480 | ||||||
|
|
|
|
|
| |||||||
There are no Level 3 (significant unobservable inputs) priced securities.
There were no transfers between Level 1 and Level 2 related to securities held as of September 30, 2016.
Security abbreviation definitions are located under the Key Investment Terms starting on page 4.
See Notes to Financial Statements
57
Table of Contents
VIRTUS LOW VOLATILITY EQUITY FUND
SEPTEMBER 30, 2016
($ reported in thousands)
| SHARES | VALUE | |||||||
| EXCHANGE-TRADED FUND—98.9% | ||||||||
iShares S&P 100 Index Fund(2)(3) | 38,450 | $ | 3,688 | |||||
| TOTAL EXCHANGE-TRADED FUND (Identified Cost $3,066) | 3,688 | |||||||
| CONTRACTS | ||||||||
| PURCHASED OPTION—0.1% | ||||||||
| Call Option—0.1% | ||||||||
CBOE Volatility Index expiration 10/19/16 strike price $21 | 98 | 4 | ||||||
| TOTAL PURCHASED OPTION—0.1% (Premiums Paid $9) | 4 | |||||||
| TOTAL LONG TERM INVESTMENTS—99.0% | ||||||||
| (Identified Cost $3,075) | 3,692 | (1) | ||||||
| TOTAL INVESTMENTS, BEFORE WRITTEN OPTION—99.0% | ||||||||
| (Identified Cost $3,075) | 3,692 | (1) | ||||||
| CONTRACTS | VALUE | |||||||
| WRITTEN OPTION—(0.1)% | ||||||||
| Call Option—(0.1)% | ||||||||
S&P 500® Index expiration 10/21/16 strike price $2225 | 17 | $ | (2 | ) | ||||
| TOTAL WRITTEN OPTION—(0.1)% (Premiums Received $4) | (2 | ) | ||||||
| TOTAL INVESTMENTS, NET OF WRITTEN OPTION—98.9% | ||||||||
| (Identified Cost $3,071) | 3,690 | (1) | ||||||
Other assets and liabilities, net—1.1% |
| 40 | ||||||
|
| |||||||
| NET ASSETS—100.0% | $ | 3,730 | ||||||
|
| |||||||
Footnote Legend:
| (1) | Federal Income Tax Information: For tax information at September 30, 2016, see Note 10 Federal Income Tax Information in the Notes to Financial Statements. |
| (2) | All or a portion of the security is segregated as collateral for written options. |
| (3) | Shares of this fund are publicly offered and its prospectus and annual report are publicly available. |
The following table provides a summary of inputs used to value the Fund’s investments as of September 30, 2016 (See Security Valuation Note 2A in the Notes to Financial Statements):
| Total Value at September 30, 2016 | Level 1 Quoted Prices | |||||||
Equity Securities: | ||||||||
Exchange-traded Funds | $ | 3,688 | $ | 3,688 | ||||
Purchased Option | 4 | 4 | ||||||
|
|
|
| |||||
Total Investments before Written Option | $ | 3,692 | $ | 3,692 | ||||
|
|
|
| |||||
Written Option | $ | (2 | ) | $ | (2 | ) | ||
|
|
|
| |||||
Total Investments Net of Written Option | $ | 3,690 | $ | 3,690 | ||||
|
|
|
| |||||
There are no Level 2 (significant observable inputs) or Level 3 (significant unobservable inputs) priced securities.
There were no transfers between level 1 and Level 2 related to securities held at September 30, 2016.
See Notes to Financial Statements
58
Table of Contents
VIRTUS MULTI-SECTOR INTERMEDIATE BOND FUND
SEPTEMBER 30, 2016
($ reported in thousands)
| PAR VALUE | VALUE | |||||||
| MUNICIPAL BONDS—0.1% | ||||||||
| Michigan—0.0% | ||||||||
Tobacco Settlement Finance Authority Taxable Series A, | $ | 145 | $ | 143 | ||||
|
| |||||||
| Virginia—0.1% | ||||||||
Tobacco Settlement Financing Corp. Series A-1, Taxable | 325 | 279 | ||||||
| TOTAL MUNICIPAL BONDS (Identified Cost $460) | 422 | |||||||
| FOREIGN GOVERNMENT SECURITIES—11.0% | ||||||||
Argentine Republic | ||||||||
144A 7.500%, 4/22/26(3) | 1,055 | 1,191 | ||||||
7.875%, 6/15/27 | 1,180 | 1,265 | ||||||
Series NY, | 1,570 | 1,810 | ||||||
144A 7.125%, 7/6/36(3) | 735 | 781 | ||||||
144A 7.625%, 4/22/46(3) | 370 | 417 | ||||||
Bolivarian Republic of Venezuela RegS | 216 | 153 | ||||||
RegS 7.750%, 10/13/19(4) | 202 | 125 | ||||||
7.650%, | 1,500 | 728 | ||||||
9.375%, 1/13/34 | 2,145 | 1,122 | ||||||
City of Buenos Aires 144A | 365 | 398 | ||||||
Federative Republic of Brazil | 1,690 | BRL | 480 | |||||
Treasury Note Series F, | 1,880 | BRL | 549 | |||||
10.250%, 1/10/28 | 250 | BRL | 78 | |||||
5.625%, 1/7/41 | 670 | 668 | ||||||
Kingdom of Morocco 144A | 800 | 914 | ||||||
Mongolia 144A | 825 | 728 | ||||||
Provincia de Buenos Aires 144A | 730 | 819 | ||||||
Republic of Azerbaijan | 930 | 919 | ||||||
Republic of Chile | 474,000 | CLP | 767 | |||||
Republic of Colombia | 1,867,000 | COP | 582 | |||||
9.850%, 6/28/27 | 1,685,000 | COP | 713 | |||||
Republic of Costa Rica | 795 | 775 | ||||||
144A 7.000%, 4/4/44(3) | 200 | 214 | ||||||
Republic of Cote d’Ivoire 144A | 905 | 948 | ||||||
Republic of El Salvador 144A | 1,405 | 1,419 | ||||||
Republic of Indonesia Series FR56, | 19,446,000 | IDR | 1,624 | |||||
| PAR VALUE | VALUE | |||||||
| FOREIGN GOVERNMENT SECURITIES—continued | ||||||||
Republic of Iraq RegS | $ | 610 | $ | 499 | ||||
Republic of Kazakhstan 144A | 245 | 276 | ||||||
Republic of South Africa Series R203, | 3,690 | ZAR | 271 | |||||
Series R208, | 11,230 | ZAR | 779 | |||||
Republic of Sri Lanka 144A | 800 | 861 | ||||||
Republic of Turkey | 1,250 | TRY | 419 | |||||
6.250%, 9/26/22 | 515 | 567 | ||||||
4.875%, 10/9/26 | 1,710 | 1,744 | ||||||
4.875%, 4/16/43 | 945 | 882 | ||||||
Russian Federation 144A | 60,000 | RUB | 944 | |||||
State of Qatar 144A | 480 | 488 | ||||||
Sultanate of Oman 144A | 1,170 | 1,174 | ||||||
Ukraine 144A | 850 | 803 | ||||||
United Mexican States Series M, | 38,590 | MXN | 2,055 | |||||
4.750%, 3/8/44 | 1,014 | 1,055 | ||||||
| TOTAL FOREIGN GOVERNMENT SECURITIES | ||||||||
| (Identified Cost $34,759) | 33,004 | |||||||
| MORTGAGE-BACKED SECURITIES—14.9% | ||||||||
| Agency—3.7% | ||||||||
FHLMC | 1,323 | 1,395 | ||||||
FNMA | ||||||||
3.000%, 4/1/43 | 1,472 | 1,534 | ||||||
3.000%, 5/1/43 | 751 | 782 | ||||||
3.000%, 6/1/43 | 2,086 | 2,174 | ||||||
3.000%, 7/1/43 | 1,530 | 1,595 | ||||||
4.000%, 10/1/44 | 1,256 | 1,350 | ||||||
3.500%, 9/1/45 | 2,105 | 2,220 | ||||||
|
| |||||||
| 11,050 | ||||||||
|
| |||||||
| Non-Agency—11.2% | ||||||||
American Homes 4 Rent | ||||||||
14-SFR2, C 144A | 915 | 1,008 | ||||||
15-SFR2, C 144A | 805 | 891 | ||||||
15-SFR1, A 144A | 682 | 726 | ||||||
Ameriquest Mortgage Securities, Inc. 03-AR3, M4 | 1,135 | 1,094 | ||||||
Banc of America Funding Trust 05-1, 1A1 | 389 | 389 | ||||||
06-2, 3A1 | 209 | 215 | ||||||
| PAR VALUE | VALUE | |||||||
| Non-Agency—continued | ||||||||
Bank of America (Countrywide) Asset-Backed Certificates | ||||||||
05-1, AF5A | $ | 988 | $ | 980 | ||||
05-12, 2A4 | 540 | 537 | ||||||
Bank of America (Merrill Lynch – Countrywide) Alternative Loan Trust | ||||||||
04-22CB, 1A1 | 414 | 442 | ||||||
04-24CB, 1A1 | 94 | 95 | ||||||
Bank of America (Merrill Lynch) Mortgage Investors Trust 98-C1, C | 1,260 | 1,304 | ||||||
Citigroup Mortgage Loan Trust, Inc. 05-5, 2A3 | 246 | 246 | ||||||
15-A, A1 144A | 715 | 729 | ||||||
Colony American Finance Ltd. 15-1 144A | 649 | 657 | ||||||
Commercial Mortgage Trust 07-GG11, AM | 600 | 619 | ||||||
Credit Suisse Commercial Mortgage-Backed Trust 07-C5, A1AM | 939 | 863 | ||||||
Credit Suisse Mortgage-Backed Trust 06-08, 3A1 | 423 | 404 | ||||||
Deutsche Bank-UBS Mortgage Trust 11-LC3A, D 144A | 860 | 902 | ||||||
GAHR Commercial Mortgage Trust 15-NRF, CFX 144A | 600 | 611 | ||||||
GSAA Home Equity Trust 05-12, AF3W | 296 | 299 | ||||||
GSR Mortgage Loan Trust 06-1F, 2A4 | 363 | 319 | ||||||
Home Equity Loan Trust | ||||||||
03-HS3, AI4 | 178 | 181 | ||||||
07-HSA3, AI4 | 1,481 | 1,490 | ||||||
Jefferies Resecuritization Trust 14-R1, 2A1 144A | 368 | 367 | ||||||
JPMorgan Chase Commercial Mortgage Securities Trust 07-LDPX, AM | 676 | 663 | ||||||
See Notes to Financial Statements
59
Table of Contents
VIRTUS MULTI-SECTOR INTERMEDIATE BOND FUND
SCHEDULE OF INVESTMENTS (Continued)
SEPTEMBER 30, 2016
($ reported in thousands)
| PAR VALUE | VALUE | |||||||
| Non-Agency—continued | ||||||||
JPMorgan Chase Mortgage Trust | ||||||||
14-1, 1A1 144A | $ | 644 | $ | 680 | ||||
16-1, M2 144A | 608 | 628 | ||||||
16-2, M2 144A | 984 | 1,018 | ||||||
MASTR Adjustable Rate Mortgages Trust 05-1, 3A1 | 541 | 492 | ||||||
MASTR Alternative Loan Trust | ||||||||
04-6, 7A1 | 1,147 | 1,118 | ||||||
05-2, 2A1 | 458 | 474 | ||||||
MASTR Reperforming Loan Trust 05-1, 1A5 144A | 575 | 601 | ||||||
MASTR Specialized Loan Trust 05-3, A2 144A | 328 | 331 | ||||||
Mill City Mortgage Loan Trust 16-1, M1 144A | 525 | 527 | ||||||
Morgan Stanley – Bank of America (Merrill Lynch) Trust 15-C26,C | 840 | 877 | ||||||
Morgan Stanley Capital I Trust 07-IQ14, AM | 925 | 895 | ||||||
Motel 6 Trust 15-MTL6, D 144A | 1,080 | 1,083 | ||||||
Nomura Asset Acceptance Corp. 04-R3, A1 144A | 246 | 242 | ||||||
Resecuritization Pass-Through Trust 05-BR, A5 | 405 | 407 | ||||||
Residential Asset Securitization Trust 05-A1, A3 | 669 | 671 | ||||||
Sequoia Mortgage Trust | ||||||||
14-2, A1 144A | 270 | 281 | ||||||
14-4, A6 144A | 657 | 677 | ||||||
15-1, A1 144A | 753 | 774 | ||||||
Towd Point Mortgage Trust | ||||||||
15-1, A2 144A | 555 | 564 | ||||||
15-5, A2 144A | 690 | 697 | ||||||
16-4, A1 144A | 420 | 422 | ||||||
15-2, 1M1 144A | 1,060 | 1,034 | ||||||
| PAR VALUE | VALUE | |||||||
| Non-Agency—continued | ||||||||
Vericrest Opportunity Loan Transfer | ||||||||
15-NP11, A1 144A | $ | 518 | $ | 520 | ||||
16-NPL9, A1 144A | 300 | 300 | ||||||
15-NPL2, A1 144A | 445 | 445 | ||||||
15-NPL3, A1 144A | 436 | 435 | ||||||
Wells Fargo (Wachovia Bank) Commercial Mortgage Trust 15-LC20, B | 875 | 924 | ||||||
Wells Fargo – Royal Bank of Scotland plc Commercial Mortgage Trust 11-C5, C 144A | 645 | 714 | ||||||
|
| |||||||
| 33,862 | ||||||||
| TOTAL MORTGAGE-BACKED SECURITIES | ||||||||
| (Identified Cost $44,314) | 44,912 | |||||||
| ASSET-BACKED SECURITIES—4.1% | ||||||||
CarFinance Capital Auto Trust | ||||||||
14-1A, D 144A | 1,316 | 1,320 | ||||||
15-1A, C 144A | 2,160 | 2,176 | ||||||
Citi Held For Asset Issuance 15-PM3, B 144A | 740 | 741 | ||||||
DB Master Finance LLC 15-A1, A2II 144A | 377 | 386 | ||||||
Exeter Automobile Receivables Trust | ||||||||
15-A1, C 144A | 900 | 915 | ||||||
15-3A, D 144A | 840 | 862 | ||||||
Fairway Outdoor Funding LLC 12-1A, A2 144A | 529 | 534 | ||||||
Flagship Credit Auto Trust 14-1, E 144A | 665 | 676 | ||||||
Foursight Capital Automobile Receivables Trust 15-1, B 144A | 1,110 | 1,123 | ||||||
Greater Capital Association of Realtors 15-1A, C | 545 | 556 | ||||||
IndyMac Manufactured Housing Contract 98-1, A3 | 208 | 213 | ||||||
Leaf Receivables Funding 9 LLC 10 LLC 15-1, E2 144A | 555 | 544 | ||||||
LEAF Receivables Funding 9 LLC 11 LLC 16-1, E2 144A | 290 | 270 | ||||||
| PAR VALUE | VALUE | |||||||
| ASSET-BACKED SECURITIES—continued | ||||||||
SolarCity LMC Series III LLC 14-2, A 144A | $ | 920 | $ | 866 | ||||
Trip Rail Master Funding LLC 11-1A, A1A 144A | 178 | 182 | ||||||
Wendy’s Funding LLC 15-1A, A2II 144A | 1,099 | 1,116 | ||||||
| TOTAL ASSET-BACKED SECURITIES | ||||||||
| (Identified Cost $12,404) | 12,480 | |||||||
| CORPORATE BONDS AND NOTES—53.4% | ||||||||
| Consumer Discretionary—7.8% | ||||||||
Aramark Services, Inc. 144A | 405 | 408 | ||||||
Beazer Homes USA, Inc. | ||||||||
5.750%, 6/15/19 | 472 | 493 | ||||||
144A 8.750%, | 245 | 259 | ||||||
Boyd Gaming Corp. | 415 | 452 | ||||||
Brookfield Residential Properties, Inc. 144A | 185 | 188 | ||||||
Caesars Entertainment Operating Co., Inc. | 535 | 554 | ||||||
Caesars Entertainment Resort Properties LLC | 320 | 332 | ||||||
Caesars Growth Properties Holdings LLC | 785 | 844 | ||||||
CCO Holdings LLC 144A | 275 | 289 | ||||||
Cequel Communications Holdings I LLC (Cequel Capital Corp.) | ||||||||
144A 5.125%, 12/15/21(3) | 275 | 276 | ||||||
144A 5.125%, 12/15/21(3) | 655 | 657 | ||||||
Clear Channel Worldwide Holdings, Inc. | ||||||||
Series A | 320 | 309 | ||||||
Series B | 930 | 926 | ||||||
Columbus Cable Barbados Ltd. Series B,144A | 200 | 213 | ||||||
Dana Financing Luxembourg S.a.r.l. 144A | 230 | 242 | ||||||
Diamond Resorts International, Inc. 144A | 60 | 60 | ||||||
DISH DBS Corp. 144A | 40 | 43 | ||||||
Hanesbrands, Inc. | ||||||||
144A 4.625%, | 120 | 124 | ||||||
144A 4.875%, | 250 | 257 | ||||||
See Notes to Financial Statements
60
Table of Contents
VIRTUS MULTI-SECTOR INTERMEDIATE BOND FUND
SCHEDULE OF INVESTMENTS (Continued)
SEPTEMBER 30, 2016
($ reported in thousands)
| PAR VALUE | VALUE | |||||||
| Consumer Discretionary—continued | ||||||||
IHO Verwaltungs GmbH PIK Interest Capitalization 144A | $ | 215 | $ | 218 | ||||
International Game Technology plc 144A | 340 | 364 | ||||||
Landry’s Holdings II, Inc. 144A | 425 | 435 | ||||||
Landry’s, Inc. | ||||||||
144A 9.375%, 5/1/20(3) | 210 | 221 | ||||||
144A 6.750%, | 215 | 219 | ||||||
M/I Homes, Inc. | 525 | 553 | ||||||
MDC Holdings, Inc. | 860 | 903 | ||||||
Meritor, Inc. | 300 | 305 | ||||||
MGM Growth Properties Operating Partnership LP (MGP Finance Co-Issuer, Inc.) 144A | 145 | 157 | ||||||
144A 4.500%, 9/1/26(3) | 200 | 201 | ||||||
MGM Resorts International | 490 | 533 | ||||||
Mohegan Tribal Gaming Authority | 585 | 632 | ||||||
MPG Holdco I, Inc. | 830 | 855 | ||||||
New York University | 545 | 559 | ||||||
Newell Brands, Inc. 144A | 135 | 144 | ||||||
Party City Holdings, Inc. 144A | 125 | 134 | ||||||
PetSmart, Inc. 144A | 775 | 816 | ||||||
QVC, Inc. | 240 | 254 | ||||||
RCN Telecom Services LLC (RCN Capital Corp.) 144A | 510 | 544 | ||||||
Scientific Games International, Inc. | ||||||||
6.625%, 5/15/21 | 540 | 413 | ||||||
144A 7.000%, 1/1/22(3) | 590 | 627 | ||||||
SFR (Numericable) Group S.A. | ||||||||
144A 6.000%, 5/15/22(3) | 580 | 594 | ||||||
144A 7.375%, 5/1/26(3) | 290 | 297 | ||||||
Signet UK Finance plc | 895 | 862 | ||||||
Sirius XM Radio, Inc. 144A | 755 | 778 | ||||||
Six Flags Entertainment Corp. 144A | 610 | 618 | ||||||
TI Group Automotive Systems LLC 144A | 490 | 535 | ||||||
| PAR VALUE | VALUE | |||||||
| Consumer Discretionary—continued | ||||||||
Toll Brothers Finance Corp. | ||||||||
5.625%, 1/15/24 | $ | 175 | $ | 188 | ||||
4.875%, 11/15/25 | 1,100 | 1,130 | ||||||
TRI Pointe Group, Inc. | 890 | 932 | ||||||
VTR Finance BV 144A | 600 | 622 | ||||||
Ziggo Secured Finance BV 144A | 890 | 890 | ||||||
|
| |||||||
| 23,459 | ||||||||
|
| |||||||
| Consumer Staples—1.3% | ||||||||
Dole Food Co., Inc. 144A | 545 | 555 | ||||||
Pilgrim’s Pride Corp. 144A | 340 | 352 | ||||||
Post Holdings, Inc. 144A | 620 | 619 | ||||||
Rite Aid Corp. 144A | 250 | 270 | ||||||
Safeway, Inc. | 510 | 509 | ||||||
Tops Holding LLC (Tops Markets II Corp.) 144A | 925 | 837 | ||||||
US Foods, Inc. 144A | 120 | 125 | ||||||
Whole Foods Market, Inc. 144A | 543 | 590 | ||||||
|
| |||||||
| 3,857 | ||||||||
|
| |||||||
| Energy—12.6% | ||||||||
Afren plc 144A | 464 | 2 | ||||||
Alberta Energy Co., Ltd. | 330 | 390 | ||||||
Anadarko Petroleum Corp. | ||||||||
4.850%, 3/15/21 | 150 | 162 | ||||||
5.550%, 3/15/26 | 215 | 245 | ||||||
6.600%, 3/15/46 | 460 | 563 | ||||||
Antero Midstream Partners LP 144A | 220 | 223 | ||||||
Antero Resources Corp. | 490 | 502 | ||||||
Archrock Partners LP | 740 | 690 | ||||||
Blue Racer Midstream LLC 144A | 305 | 300 | ||||||
Callon Petroleum Co. 144A | 265 | 275 | ||||||
Carrizo Oil & Gas, Inc. | 675 | 672 | ||||||
Cheniere Corpus Christi Holdings LLC 144A | 400 | 434 | ||||||
Cimarex Energy Co. | 450 | 470 | ||||||
| PAR VALUE | VALUE | |||||||
| Energy—continued | ||||||||
Compagnie Generale de Geophysique-Veritas | $ | 725 | $ | 357 | ||||
Concho Resources, Inc. | 295 | 306 | ||||||
CONSOL Energy, Inc. | 325 | 301 | ||||||
Continental Resources, Inc. | ||||||||
5.000%, 9/15/22 | 510 | 510 | ||||||
4.500%, 4/15/23 | 305 | 294 | ||||||
Ecopetrol S.A. | ||||||||
5.875%, 9/18/23 | 615 | 663 | ||||||
5.375%, 6/26/26 | 910 | 947 | ||||||
Enbridge Energy Partners LP | 170 | 179 | ||||||
Encana Corp. | 320 | 321 | ||||||
Energy Transfer Equity LP | 885 | 923 | ||||||
EnLink Midstream Partners LP | 80 | 81 | ||||||
EnQuest plc 144A | 885 | 465 | ||||||
EP Energy LLC (Everest Acquisition Finance, Inc.) | 420 | 300 | ||||||
FTS International, Inc. | 450 | 174 | ||||||
Gazprom OAO (Gaz Capital S.A.) | ||||||||
144A 6.000%, | 255 | 276 | ||||||
144A 4.950%, 2/6/28(3)(7) | 750 | 756 | ||||||
Gulfport Energy, Corp. | 445 | 464 | ||||||
Helmerich & Payne International Drilling Co. | 540 | 570 | ||||||
Holly Energy Partners LP 144A | 65 | 68 | ||||||
KazMunayGas National Co. 144A | 450 | 498 | ||||||
Kinder Morgan, Inc. | 890 | 1,078 | ||||||
Laredo Petroleum, Inc. | 610 | 634 | ||||||
Linn Energy LLC | ||||||||
6.500%, 5/15/19(12) | 512 | 133 | ||||||
6.500%, 9/15/21(12) | 155 | 40 | ||||||
Lukoil International Finance BV 144A | 930 | 962 | ||||||
MPLX LP | 1,390 | 1,438 | ||||||
Newfield Exploration Co. | 785 | 805 | ||||||
NGL Energy Partners LP | 925 | 874 | ||||||
Novatek OAO (Novatek Finance Ltd.) 144A | 1,105 | 1,114 | ||||||
See Notes to Financial Statements
61
Table of Contents
VIRTUS MULTI-SECTOR INTERMEDIATE BOND FUND
SCHEDULE OF INVESTMENTS (Continued)
SEPTEMBER 30, 2016
($ reported in thousands)
| PAR VALUE | VALUE | |||||||
| Energy—continued | ||||||||
Occidental Petroleum Corp. | ||||||||
3.400%, 4/15/26 | $ | 30 | $ | 32 | ||||
4.400%, 4/15/46 | 430 | 476 | ||||||
Odebrecht Offshore Drilling Finance Ltd. 144A | 1,048 | 194 | ||||||
Pacific Exploration and Production Corp. 144A | 610 | 116 | ||||||
Parker Drilling Co. | 1,075 | 863 | ||||||
Parsley Energy LLC 144A | 1,020 | 1,058 | ||||||
Pertamina Persero PT | ||||||||
144A 4.300%, 5/20/23(3) | 600 | 631 | ||||||
144A 6.000%, 5/3/42(3) | 400 | 441 | ||||||
144A 5.625%, 5/20/43(3) | 320 | 337 | ||||||
Petrobras Global Finance BV | ||||||||
5.375%, 1/27/21 | 830 | 822 | ||||||
8.375%, 5/23/21 | 170 | 187 | ||||||
8.750%, 5/23/26 | 725 | 803 | ||||||
Petroleos de Venezuela S.A | ||||||||
RegS 8.500%, 11/2/17(4) | 323 | 280 | ||||||
144A 6.000%, 5/16/24(3) | 1,580 | 677 | ||||||
Petroleos Mexicanos | ||||||||
144A 6.875%, 8/4/26(3) | 790 | 891 | ||||||
6.500%, 6/2/41 | 465 | 452 | ||||||
5.500%, 6/27/44 | 650 | 563 | ||||||
PHI, Inc. | 360 | 348 | ||||||
QEP Resources, Inc. | ||||||||
6.875%, 3/1/21 | 445 | 467 | ||||||
5.250%, 5/1/23 | 350 | 346 | ||||||
Range Resources Corp. 144A | 835 | 820 | ||||||
Regency Energy Partners LP | 1,010 | 1,066 | ||||||
Sabine Oil & Gas Corp. | 935 | 17 | ||||||
Sabine Pass Liquefaction LLC | 915 | 973 | ||||||
SM Energy Co. | 320 | 322 | ||||||
Southern Gas Corridor CJSC 144A | 400 | 449 | ||||||
Sunoco LP 144A | 1,790 | 1,848 | ||||||
TransCanada Trust | 940 | 952 | ||||||
Transocean, Inc. | ||||||||
6.800%, 12/15/16 | 300 | 302 | ||||||
144A 9.000%, 7/15/23(3) | 215 | 210 | ||||||
6.800%, 3/15/38 | 250 | 166 | ||||||
YPF S.A. 144A | 490 | 548 | ||||||
|
| |||||||
| 38,116 | ||||||||
|
| |||||||
| Financials—11.5% | ||||||||
Akbank TAS 144A | 2,440 | TRY | 775 | |||||
Allstate Corp. (The) | 845 | 907 | ||||||
| PAR VALUE | VALUE | |||||||
| Financials—continued | ||||||||
Ally Financial, Inc. | ||||||||
4.250%, 4/15/21 | $ | 285 | $ | 290 | ||||
5.750%, 11/20/25 | 575 | 604 | ||||||
Ares Capital Corp. | 465 | 468 | ||||||
Australia & New Zealand Banking Group Ltd. 144A | 725 | 770 | ||||||
Banco Bilbao Vizcaya Argentaria Bancomer S.A. 144A | 425 | 464 | ||||||
Banco de Credito del Peru 144A | 1,095 | 1,220 | ||||||
Banco Internacional del Peru SAA Interbank 144A | 395 | 437 | ||||||
Banco Nacional de Comercio Exterior SVC 144A | 550 | 569 | ||||||
Bancolombia S.A. | 1,015 | 1,056 | ||||||
Bank of America Corp. | 1,055 | 1,133 | ||||||
Bank of China Ltd. 144A | 875 | 947 | ||||||
Barclays plc | 550 | 553 | ||||||
Bonos del Banco Central de Chile En Pesos | 185,000 | CLP | 293 | |||||
Capital One Financial Corp. | 775 | 779 | ||||||
Citigroup, Inc. | 580 | 620 | ||||||
Citizens Financial Group, Inc. | 920 | 902 | ||||||
Compass Bank | 900 | 881 | ||||||
Development Bank of Kazakhstan OJSC 144A | 1,090 | 1,069 | ||||||
Discover Financial Services | 1,250 | 1,280 | ||||||
Drawbridge Special Opportunities Fund LP 144A | 915 | 879 | ||||||
Eurasian Development Bank 144A | 925 | 971 | ||||||
FS Investment Corp. | 200 | 205 | ||||||
General Motors Financial Co., Inc. | 740 | 754 | ||||||
Genworth Holdings, Inc. | 585 | 490 | ||||||
GrupoSura Finance S.A. 144A | 725 | 770 | ||||||
ICAHN Enterprises LP | ||||||||
6.000%, 8/1/20 | 370 | 373 | ||||||
5.875%, 2/1/22 | 510 | 492 | ||||||
| PAR VALUE | VALUE | |||||||
| Financials—continued | ||||||||
ICICI Bank Ltd. 144A | $ | 230 | $ | 239 | ||||
ING Groep NV 6.000%(2)(5)(6) | 865 | 843 | ||||||
iStar Financial, Inc. | 940 | 941 | ||||||
Kazakhstan Temir Zholy Finance BV 144A | 795 | 868 | ||||||
Leucadia National Corp. | 575 | 604 | ||||||
Lincoln National Corp. | 300 | 231 | ||||||
Morgan Stanley | ||||||||
144A 10.090%, 5/3/17(3) | 2,400 | BRL | 726 | |||||
4.350%, 9/8/26 | 415 | 443 | ||||||
Navient Corp. | 190 | 190 | ||||||
OM Asset Management plc | 785 | 787 | ||||||
PKO Finance AB 144A | 1,315 | 1,420 | ||||||
Prudential Financial, Inc. | 1,430 | 1,578 | ||||||
Santander Bank NA | 400 | 438 | ||||||
Sberbank of Russia Via SB Capital S.A. 144A | 450 | 454 | ||||||
Springleaf Finance Corp. | 500 | 512 | ||||||
Teachers Insurance & Annuity Association of America 144A | 740 | 749 | ||||||
Toronto-Dominion Bank (The) | 295 | 296 | ||||||
Trinity Acquisition plc | 715 | 749 | ||||||
Turkiye Garanti Bankasi AS 144A | 500 | 505 | ||||||
Voya Financial, Inc. | 870 | 871 | ||||||
Woodside Finance Ltd. 144A | 135 | 136 | ||||||
|
| |||||||
| 34,531 | ||||||||
|
| |||||||
| Health Care—3.0% | ||||||||
Capsugel S.A. PIK Interest Capitalization, 144A | 155 | 155 | ||||||
Community Health Systems, Inc. | 525 | 454 | ||||||
Concordia Healthcare Corp. 144A | 175 | 113 | ||||||
Double Eagle Acquisition Sub, Inc. 144A | 300 | 306 | ||||||
See Notes to Financial Statements
62
Table of Contents
VIRTUS MULTI-SECTOR INTERMEDIATE BOND FUND
SCHEDULE OF INVESTMENTS (Continued)
SEPTEMBER 30, 2016
($ reported in thousands)
| PAR VALUE | VALUE | |||||||
| Health Care—continued | ||||||||
Endo Finance LLC 144A | $ | 660 | $ | 587 | ||||
HCA, Inc. | ||||||||
5.375%, 2/1/25 | 435 | 450 | ||||||
4.500%, 2/15/27 | 600 | 602 | ||||||
IASIS Healthcare LLC | 545 | 496 | ||||||
MEDNAX, Inc. 144A | 395 | 415 | ||||||
MPH Acquisition Holdings LLC 144A | 45 | 49 | ||||||
Ortho-Clinical Diagnostics, Inc. (Ortho-Clinical Diagnostics S.A.) 144A | 710 | 628 | ||||||
Quintiles Transnational Corp. 144A | 435 | 449 | ||||||
Quorum Health Corp. 144A | 300 | 251 | ||||||
Surgery Center Holdings, Inc. 144A | 570 | 610 | ||||||
Surgical Care Affiliates, Inc. 144A | 912 | 962 | ||||||
Team Health, Inc. 144A | 40 | 43 | ||||||
Teleflex, Inc. | 370 | 384 | ||||||
Tenet Healthcare Corp. | ||||||||
4.750%, 6/1/20 | 275 | 281 | ||||||
6.000%, 10/1/20 | 180 | 191 | ||||||
8.125%, 4/1/22 | 385 | 387 | ||||||
Universal Health Services, Inc. | ||||||||
144A 4.750%, 8/1/22(3) | 145 | 150 | ||||||
144A 5.000%, 6/1/26(3) | 320 | 334 | ||||||
Valeant Pharmaceuticals International, Inc. | ||||||||
144A 6.375%, 10/15/20(3) | 320 | 302 | ||||||
144A 7.500%, 7/15/21(3) | 130 | 126 | ||||||
144A 5.625%, 12/1/21(3) | 140 | 126 | ||||||
144A 5.875%, 5/15/23(3) | 380 | 330 | ||||||
|
| |||||||
| 9,181 | ||||||||
|
| |||||||
| Industrials—4.9% | ||||||||
Air Canada | ||||||||
144A 6.750%, 10/1/19(3) | 1,050 | 1,085 | ||||||
Pass-Through-Trust 13-1, B 144A | 1,246 | 1,283 | ||||||
AMN Healthcare, Inc. 144A | 135 | 137 | ||||||
Bombardier, Inc. | ||||||||
4.750%, 4/15/19 | 110 | 108 | ||||||
144A 6.125%, 1/15/23(3) | 740 | 660 | ||||||
Builders FirstSource, Inc. 144A | 480 | 553 | ||||||
Carpenter Technology Corp. | 600 | 625 | ||||||
| PAR VALUE | VALUE | |||||||
| Industrials—continued | ||||||||
Cemex Finance LLC 144A | $ | 740 | $ | 760 | ||||
Continental Airlines Pass-Through-Trust 01-1, A1 | 83 | 89 | ||||||
DP World Ltd. 144A | 400 | 463 | ||||||
GATX Corp. | 125 | 125 | ||||||
Harland Clarke Holdings Corp. 144A | 910 | 874 | ||||||
Hawaiian Airlines Pass-Through Certificates 13-1B, | 749 | 750 | ||||||
JBS Investments GmbH 144A | 865 | 884 | ||||||
Masco Corp. | ||||||||
5.950%, 3/15/22 | 640 | 730 | ||||||
4.450%, 4/1/25 | 320 | 340 | ||||||
Owens Corning | 900 | 905 | ||||||
Pelabuhan Indonesia II PT 144A | 925 | 944 | ||||||
Prime Security Services Borrower LLC (Prime Finance, Inc.) 144A | 490 | 535 | ||||||
SCF Capital Ltd. 144A | 470 | 492 | ||||||
Standard Industries, Inc. 144A | 225 | 235 | ||||||
TransDigm, Inc. | ||||||||
6.000%, 7/15/22 | 630 | 668 | ||||||
6.500%, 5/15/25 | 270 | 283 | ||||||
United Airlines Pass-Through Trust 14-1, B | 431 | 440 | ||||||
Wheels Up Finance I LLC | ||||||||
16-01, A | 156 | 154 | ||||||
16-01, A | 729 | 721 | ||||||
|
| |||||||
| 14,843 | ||||||||
|
| |||||||
| Information Technology—0.9% | ||||||||
Blackboard, Inc. 144A | 485 | 485 | ||||||
Diamond 1 Finance Corp. (Diamond 2 Finance Corp.) | ||||||||
144A 5.450%, 6/15/23(3) | 150 | 161 | ||||||
144A 7.125%, 6/15/24(3) | 160 | 176 | ||||||
144A 6.020%, 6/15/26(3) | 145 | 159 | ||||||
144A 8.100%, 7/15/36(3) | 140 | 165 | ||||||
144A 8.350%, 7/15/46(3) | 155 | 186 | ||||||
Hewlett Packard Enterprise Co. 144A | 425 | 454 | ||||||
Infor US, Inc. | 420 | 427 | ||||||
| PAR VALUE | VALUE | |||||||
| Information Technology—continued | ||||||||
NXP BV (NXP Funding LLC) 144A | $ | 355 | $ | 389 | ||||
WESCO Distribution, Inc. 144A | 255 | 256 | ||||||
|
| |||||||
| 2,858 | ||||||||
|
| |||||||
| Materials—5.3% | ||||||||
AK Steel Corp. | 385 | 411 | ||||||
Alpek SA de C.V. 144A | 1,460 | 1,562 | ||||||
ArcelorMittal 6.125%, 6/1/25 | 945 | 1,035 | ||||||
Axalta Coating Systems, LLC 144A | 150 | 154 | ||||||
Berry Plastics Corp. | 870 | 889 | ||||||
BHP Billiton Finance USA Ltd. 144A | 525 | 595 | ||||||
BlueScope Steel Finance Ltd. 144A | 500 | 530 | ||||||
Boise Cascade Co. 144A | 600 | 612 | ||||||
Cascades, Inc. 144A | 1,100 | 1,123 | ||||||
Eldorado Gold Corp. 144A | 455 | 460 | ||||||
Fibria Overseas Finance Ltd. | 440 | 459 | ||||||
Fortescue Metals Group (FMG) Resources August 2006 Pty Ltd. 144A | 375 | 437 | ||||||
Freeport-McMoRan Copper & Gold, Inc. | ||||||||
3.550%, 3/1/22 | 255 | 233 | ||||||
3.875%, 3/15/23 | 385 | 350 | ||||||
Gerdau Holdings, Inc. 144A | 635 | 684 | ||||||
Gerdau Trade, Inc. 144A | 150 | 156 | ||||||
Graphic Packaging International, Inc. | 790 | 797 | ||||||
INEOS Group Holdings S.A. 144A | 910 | 895 | ||||||
Novelis Corp. | ||||||||
144A 6.250%, 8/15/24(3) | 60 | 64 | ||||||
144A 5.875%, 9/30/26(3) | 700 | 718 | ||||||
Office Cherifien des Phosphates S.A. (OCP) 144A | 690 | 749 | ||||||
Reynolds Group Issuer, Inc. | ||||||||
144A 5.125%, 7/15/23(3) | 150 | 155 | ||||||
144A 7.000%, 7/15/24(3) | 25 | 27 | ||||||
See Notes to Financial Statements
63
Table of Contents
VIRTUS MULTI-SECTOR INTERMEDIATE BOND FUND
SCHEDULE OF INVESTMENTS (Continued)
SEPTEMBER 30, 2016
($ reported in thousands)
| PAR VALUE | VALUE | |||||||
| Materials—continued | ||||||||
Severstal OAO Via Steel Capital SA 144A | $ | 275 | $ | 301 | ||||
Standard Industries, Inc. 144A | 450 | 482 | ||||||
Teck Resources Ltd. | ||||||||
144A 8.000%, 6/1/21(3) | 70 | 77 | ||||||
144A 8.500%, 6/1/24(3) | 180 | 207 | ||||||
United States Steel Corp. | 76 | 76 | ||||||
Vale Overseas Ltd. | 535 | 561 | ||||||
Valvoline, Inc. 144A | 90 | 95 | ||||||
Vedanta Resources plc 144A | 995 | 993 | ||||||
|
| |||||||
| 15,887 | ||||||||
|
| |||||||
| Real Estate—1.3% | ||||||||
Corporate Office Properties LP | 950 | 950 | ||||||
ESH Hospitality, Inc. 144A | 605 | 607 | ||||||
Healthcare Realty Trust, Inc. | 395 | 408 | ||||||
MPT Operating Partnership LP | ||||||||
5.500%, 5/1/24 | 455 | 478 | ||||||
5.250%, 8/1/26 | 40 | 42 | ||||||
Select Income REIT | 900 | 910 | ||||||
WP Carey, Inc. | 380 | 385 | ||||||
|
| |||||||
| 3,780 | ||||||||
|
| |||||||
| Telecommunication Services—3.2% | ||||||||
Altice Financing S.A. 144A | 1,010 | 1,040 | ||||||
America Movil SAB de C.V. Series 12 | 5,000 | MXN | 251 | |||||
AT&T, Inc. | ||||||||
4.800%, 6/15/44 | 580 | 610 | ||||||
5.650%, 2/15/47 | 300 | 355 | ||||||
CenturyLink, Inc. | ||||||||
Series T | 355 | 365 | ||||||
Series Y | 210 | 225 | ||||||
CSC Holdings LLC 144A | 420 | 431 | ||||||
Digicel Group Ltd. 144A | 665 | 581 | ||||||
Empresa Nacional de Telecomunicaciones S.A. 144A | 430 | 443 | ||||||
Frontier Communications Corp. | ||||||||
6.250%, 9/15/21 | 370 | 358 | ||||||
10.500%, 9/15/22 | 210 | 223 | ||||||
| PAR VALUE | VALUE | |||||||
| Telecommunication Services—continued | ||||||||
GTH Finance BV 144A | $ | 700 | $ | 761 | ||||
Neptune Finance Corp. | ||||||||
144A 10.125%, 1/15/23(3) | 340 | 393 | ||||||
144A 6.625%, 10/15/25(3) | 650 | 707 | ||||||
Qwest Corp. | 400 | 438 | ||||||
Sprint Communications, Inc. | 1,320 | 1,242 | ||||||
T-Mobile USA, Inc. | 400 | 445 | ||||||
Windstream Corp. | 780 | 800 | ||||||
|
| |||||||
| 9,668 | ||||||||
|
| |||||||
| Utilities—1.6% | ||||||||
Lamar Funding Ltd. 144A | 910 | 862 | ||||||
Majapahit Holding BV 144A | 795 | 916 | ||||||
NRG Yield Operating LLC | 345 | 356 | ||||||
Southern Power Co. | 1,030 | 1,110 | ||||||
Talen Energy Supply LLC 144A | 625 | 590 | ||||||
TerraForm Power Operating LLC 144A | 860 | 890 | ||||||
Texas Competitive Electric Holdings Co. LLC Series A | 200 | 14 | ||||||
|
| |||||||
| 4,738 | ||||||||
| TOTAL CORPORATE BONDS AND NOTES | ||||||||
| (Identified Cost $162,851) | 160,918 | |||||||
| LOAN AGREEMENTS(2)—9.9% | ||||||||
| Consumer Discretionary—2.1% | ||||||||
Advantage Sales & Marketing, Inc. Second Lien, | 370 | 353 | ||||||
Affinity Gaming LLC | 540 | 542 | ||||||
Caesars Entertainment Operating Co., Inc. Tranche B-6, | 512 | 562 | ||||||
Caesars Entertainment Resort Properties LLC | 755 | 755 | ||||||
Caesars Growth Properties Holdings LLC Tranche B, First Lien, | 349 | 345 | ||||||
CDS U.S. Intermediate Holdings, Inc. First Lien, | 251 | 252 | ||||||
Cengage Learning, Inc. | 243 | 244 | ||||||
| PAR VALUE | VALUE | |||||||
| Consumer Discretionary—continued | ||||||||
Floor & Decor Outlets of America, Inc. | $ | 497 | $ | 498 | ||||
Graton Resort & Casino Tranche B, | 240 | 242 | ||||||
Harbor Freight Tools USA, Inc. | 338 | 340 | ||||||
Laureare Education, Inc. 2021 Extended, | 459 | 457 | ||||||
Leslie’s Poolmart, Inc. Tranche B | 305 | 307 | ||||||
Mohegan Tribal Gaming Authority | 450 | 446 | ||||||
Transtar Holding Co. Second Lien, | 380 | 52 | ||||||
U.S. Farathane LLC Tranche B-2, | 492 | 494 | ||||||
UFC Holdings LLC First Lien | 361 | 365 | ||||||
|
| |||||||
| 6,254 | ||||||||
|
| |||||||
| Consumer Staples—1.3% | ||||||||
Albertson’s LLC Trance B-4, | 664 | 670 | ||||||
Amplify Snack Brands, Inc. | 770 | 766 | ||||||
ASP MSG Acquisitions, Co., Inc. | 560 | 563 | ||||||
Chobani LLC | 142 | 141 | ||||||
Coty, Inc. Tranche B, | 118 | 119 | ||||||
Galleria Co. Tranche B, | 237 | 238 | ||||||
Hostess Brands LLC Tranche B, Second Lien, | 890 | 898 | ||||||
Kronos Second Lien, | 457 | 466 | ||||||
|
| |||||||
| 3,861 | ||||||||
|
| |||||||
| Energy—0.6% | ||||||||
California Resources Corp. | 420 | 442 | ||||||
Chesapeake Energy Corp. | 122 | 129 | ||||||
EP Energy LLC | 610 | 600 | ||||||
Jonah Energy LLC Second Lien, | 520 | 465 | ||||||
Seadrill Operating LP | 497 | 250 | ||||||
|
| |||||||
| 1,886 | ||||||||
|
| |||||||
See Notes to Financial Statements
64
Table of Contents
VIRTUS MULTI-SECTOR INTERMEDIATE BOND FUND
SCHEDULE OF INVESTMENTS (Continued)
SEPTEMBER 30, 2016
($ reported in thousands)
| PAR VALUE | VALUE | |||||||
| Financials—0.2% | ||||||||
Walter Investment Management Corp. Tranche B, | $ | 665 | $ | 611 | ||||
|
| |||||||
| Health Care—1.5% | ||||||||
21st Century Oncology Holdings, Inc. Tranche B, | 225 | 213 | ||||||
American Renal Holdings, Inc. Tranche B, First Lien, | 269 | 269 | ||||||
Ardent Legacy Acquisitions, Inc. | 454 | 452 | ||||||
CHG Healthcare Services, Inc. First Lien, | 442 | 447 | ||||||
Concordia Pharmaceuticals, Inc. | 286 | 256 | ||||||
InVentiv Health, Inc. | ||||||||
Tranche B-4, | 583 | 585 | ||||||
Tranche B | 224 | 225 | ||||||
MMM Holdings, Inc. | 245 | 238 | ||||||
MPH Acquisition Holdings LLC | 208 | 211 | ||||||
MSO of Puerto Rico, Inc. | 178 | 173 | ||||||
NVA Holdings, Inc. Second Lien, | 509 | 509 | ||||||
Quorum Health Corp. | 248 | 241 | ||||||
Surgery Center Holdings, Inc. First Lien, | 640 | 641 | ||||||
|
| |||||||
| 4,460 | ||||||||
|
| |||||||
| Industrials—1.1% | ||||||||
Aspen Merger Sub (Coinstar), Inc. | 279 | 282 | ||||||
Brickman Group Ltd. LLC (The) Second Lien, | 344 | 343 | ||||||
Filtration Group Corp. Second Lien, | 194 | 194 | ||||||
Husky Injection Molding Systems Ltd. | 527 | 527 | ||||||
McGraw-Hill Global Education Holdings LLC Tranche B, First Lien, | 442 | 445 | ||||||
Navistar, Inc. Tranche B | 450 | 452 | ||||||
| PAR VALUE | VALUE | |||||||
| Industrials—continued | ||||||||
Sedgwick Claims Management Services, Inc. Second Lien, | $ | 1,105 | $ | 1,096 | ||||
|
| |||||||
| 3,339 | ||||||||
|
| |||||||
| Information Technology—1.5% | ||||||||
Applied Systems, Inc. Second Lien, | 284 | 287 | ||||||
Blackboard, Inc. | 450 | 447 | ||||||
Donnelley Financial Solutions | 196 | 197 | ||||||
First Data Corp. | ||||||||
Tranche 2021 | 1,008 | 1,017 | ||||||
Tranche 2022 | 932 | 938 | ||||||
Infinity Acquisition Ltd. | 351 | 336 | ||||||
Mitchell International, Inc. Second Lien, | 382 | 375 | ||||||
On Semiconductor | 230 | 231 | ||||||
Presidio, Inc. Refinancing, | 669 | 670 | ||||||
Press Ganey Holdings, Inc. | 64 | 64 | ||||||
Western Digital Corp. Tranche B-1, | 54 | 55 | ||||||
|
| |||||||
| 4,617 | ||||||||
|
| |||||||
| Materials—1.0% | ||||||||
Anchor Glass Container Corp. Tranche B, | 576 | 580 | ||||||
CPI Acquisition, Inc. First Lien, | 674 | 660 | ||||||
Fortescue Metals Group (FMG) Resources Property Ltd. | 365 | 365 | ||||||
INEOS U.S. Finance LLC Tranche 2022, | 56 | 57 | ||||||
Macdermid, Inc. (Platform Speciality Products Corp.) Tranche B-3, | 731 | 736 | ||||||
Omnova Solutions, Inc. Tranche B-2, | 593 | 592 | ||||||
PQ Corp. Tranche B-1, | 123 | 124 | ||||||
|
| |||||||
| 3,114 | ||||||||
|
| |||||||
| PAR VALUE | VALUE | |||||||
| Real Estate—0.2% | ||||||||
Capital Automotive LP Second Lien, | $ | 450 | $ | 454 | ||||
|
| |||||||
| Utilities—0.4% | ||||||||
Atlantic Power LP | 678 | 687 | ||||||
Energy Future Holdings Corp. | ||||||||
5.000%, 10/31/17(14) | 324 | 328 | ||||||
Tranche C | 73 | 74 | ||||||
Texas Competitive Electric Holdings Co. LLC | ||||||||
2017 Extended, | 375 | 109 | ||||||
|
| |||||||
| 1,198 | ||||||||
| TOTAL LOAN AGREEMENTS (Identified Cost $30,331) | 29,794 | |||||||
| SHARES | ||||||||
| PREFERRED STOCKS—3.1% | ||||||||
| Energy—0.3% | ||||||||
PTT Exploration & Production PCL 144A, 4.875%(2)(3) | 905 | (9) | 923 | |||||
|
| |||||||
| Financials—2.3% | ||||||||
Banco Bilbao Vizcaya Argentaria S.A. International S.A. Unipersonal 5.919%(2) | 265 | (9) | 264 | |||||
Citigroup, Inc. | ||||||||
Series J 7.125%(2) | 46,600 | 1,350 | ||||||
Series N 6.250%(2) | 1,010 | (9) | 1,089 | |||||
JPMorgan Chase & Co. Series Z, 5.300%(2) | 175 | (9) | 178 | |||||
KeyCorp. 5.000%(2) | 735 | (9) | 724 | |||||
PNC Financial Services Group, Inc. (The) Series R, 4.850%(2) | 965 | (9) | 962 | |||||
SunTrust Bank, Inc. 5.625%(2) | 260 | (9) | 269 | |||||
Wells Fargo & Co. Series K, 7.980%(2) | 950 | (9) | 993 | |||||
Zions Bancorp 6.950%(2) | 38,525 | 1,143 | ||||||
|
| |||||||
| 6,972 | ||||||||
|
| |||||||
| Industrials—0.5% | ||||||||
General Electric Co. Series D, 5.000%(2) | 1,485 | (9) | 1,579 | |||||
| TOTAL PREFERRED STOCKS (Identified Cost $8,861) | 9,474 | |||||||
| COMMON STOCKS—0.0% | ||||||||
| Consumer Discretionary—0.0% | ||||||||
Mark IV Industries | 446 | 13 | ||||||
| TOTAL COMMON STOCKS (Identified Cost $4) | 13 | |||||||
See Notes to Financial Statements
65
Table of Contents
VIRTUS MULTI-SECTOR INTERMEDIATE BOND FUND
SCHEDULE OF INVESTMENTS (Continued)
SEPTEMBER 30, 2016
($ reported in thousands)
| SHARES | VALUE | |||||||
| AFFILIATED MUTUAL FUND—3.1% | ||||||||
Virtus Credit Opportunities Fund Class R6(15) | 934,418 | $ | 9,186 | |||||
| TOTAL AFFILIATED MUTUAL FUND (Identified Cost $9,341) | 9,186 | |||||||
| TOTAL LONG TERM INVESTMENTS—99.6% | ||||||||
| (Identified Cost $303,325) | 300,203 | (16) | ||||||
| TOTAL INVESTMENTS—99.6% (Identified Cost $303,325) | 300,203 | (1) | ||||||
Other assets and liabilities, net—0.4% |
| 1,272 | ||||||
|
| |||||||
| NET ASSETS—100.0% | $ | 301,475 | ||||||
|
| |||||||
Abbreviations:
| FHLMC | Federal Home Loan Mortgage Corporation (“Freddie Mac”). |
| FNMA | Federal National Mortgage Association (“Fannie Mae”). |
| PIK | Payment-in-Kind Security |
| REIT | Real Estate Investment Trust |
Footnote Legend:
| (1) | Federal Income Tax Information: For tax information at September 30, 2016, see Note 10 Federal Income Tax Information in the Notes to Financial Statements. |
| (2) | Variable or step coupon security; interest rate shown reflects the rate in effect at September 30, 2016. |
| (3) | Security exempt from registration under Rule 144A of the Securities Act of 1933. These securities may be resold in transactions exempt from registration, normally to qualified institutional buyers. At September 30, 2016, these securities amounted to a value of $122,710 or 40.7% of net assets. |
| (4) | Regulation S security. Security is offered and sold outside of the United States, therefore, it is exempt from registration with the SEC under Rules 903 and 904 of the Securities Act of 1933. |
| (5) | No contractual maturity date. |
| (6) | Interest payments may be deferred. |
| (7) | This Note was issued for the sole purpose of funding a loan agreement between the issuer and the borrower. As the credit risk for this security lies solely with the borrower, the name represented here is that of the borrower. |
| (8) | This loan will settle after September 30, 2016, at which time the interest rate, based on the London Interbank Offered Rate (“LIBOR”) and the agreed upon spread on trade date, will be reflected. |
| (9) | Value shown as par value. |
| (10) | 100% of the income received was in cash. |
| (11) | Security in default, a portion of the interest payments are being received during the bankruptcy proceedings. |
| (12) | Security in default no interest payments are being received during the bankruptcy proceedings. |
| (13) | Illiquid security. |
| (14) | Security in default, interest payments are being received during the bankruptcy proceedings. |
| (15) | Shares of this fund are publicly offered and its prospectus and annual report are publicly available. |
| (16) | All or a portion of the Fund’s assets have been segregated for delayed delivery securities. |
| (17) | Represents unfunded portion of security and commitment fee earned on this portion. |
Foreign Currencies:
| BRL | Brazilian Real |
| CLP | Chilean Peso |
| COP | Colombian Peso |
| IDR | Indonesian Rupiah |
| MXN | Mexican Peso |
| RUB | Russian Ruble |
| TRY | Turkish Lira |
| ZAR | South African Rand |
| Country Weightings† (Unaudited) | ||||
United States | 68 | % | ||
Canada | 3 | |||
Mexico | 3 | |||
Argentina | 2 | |||
Brazil | 2 | |||
Indonesia | 2 | |||
Turkey | 2 | |||
Other | 18 | |||
Total | 100 | % | ||
† % of total investments as of September 30, 2016 |
| |||
The following table provides a summary of inputs used to value the Fund’s investments as of September 30, 2016 (See Security Valuation Note 2A in the Notes to Financial Statements):
| Total Value at September 30, 2016 | Level 1 Quoted Prices | Level 2 Significant Observable Inputs | Level 3 Significant Unobservable Inputs | |||||||||||||
Debt Securities: | ||||||||||||||||
Asset-Backed Securities | $ | 12,480 | $ | — | $ | 11,924 | $ | 556 | ||||||||
Corporate Bonds And Notes | 160,918 | — | 159,925 | 993 | ||||||||||||
Foreign Government Securities | 33,004 | — | 33,004 | — | ||||||||||||
Loan Agreements | 29,794 | — | 29,742 | 52 | ||||||||||||
Mortgage-Backed Securities | 44,912 | — | 44,912 | — | ||||||||||||
Municipal Bonds | 422 | — | 422 | — | ||||||||||||
Equity Securities: | ||||||||||||||||
Affiliated Mutual Fund | 9,186 | 9,186 | — | — | ||||||||||||
Common Stocks | 13 | — | — | 13 | ||||||||||||
Preferred Stocks | 9,474 | 2,493 | 6,981 | |||||||||||||
|
|
|
|
|
|
|
| |||||||||
Total Investments | $ | 300,203 | $ | 11,679 | $ | 286,910 | $ | 1,614 | ||||||||
|
|
|
|
|
|
|
| |||||||||
There were no transfers from Level 1 to Level 2 related to securities held as of September 30, 2016.
Securities held by the Fund with an end of period value of $1,143 were transferred from Level 2 into Level 1 since starting to use an exchange price.
Security abbreviation definitions are located under the Key Investment Terms starting on page 4.
See Notes to Financial Statements
66
Table of Contents
VIRTUS MULTI-SECTOR INTERMEDIATE BOND FUND
SCHEDULE OF INVESTMENTS (Continued)
SEPTEMBER 30, 2016
($ reported in thousands)
The following is a reconciliation of assets of the Fund for Level 3 investments for which significant unobservable inputs were used to determine fair value.
| Total | Asset-Backed Securities | Common Stocks | Corporate Bonds And Notes | Loan Agreements | ||||||||||||||||
Investments in Securities | ||||||||||||||||||||
Balance as of September 30, 2015: | $ | 929 | $ | 544 | $ | 16 | $ | — | $ | 369 | ||||||||||
Accrued discount/(premium) | 1 | — | — | — | 1 | |||||||||||||||
Realized gain (loss) | — | — | — | — | — | |||||||||||||||
Change in unrealized appreciation /(depreciation)(c) | (309 | ) | 12 | (3 | ) | — | (318 | ) | ||||||||||||
Purchases | 1,618 | — | — | 1,618 | ||||||||||||||||
Sales(b) | (743 | ) | — | — | (743 | ) | — | |||||||||||||
Transfers into Level 3(a) | 118 | — | — | 118 | (d) | — | ||||||||||||||
Transfers from Level 3(a) | — | — | — | — | — | |||||||||||||||
|
|
|
|
|
|
|
|
|
| |||||||||||
Balance as of September 30, 2016 | $ | 1,614 | $ | 556 | (e) | $ | 13 | (e) | $ | 993 | (e) | $ | 52 | (e) | ||||||
|
|
|
|
|
|
|
|
|
| |||||||||||
| (a) | “Transfers into and/or from” represent the ending value as of September 30, 2016, for any investment security where a change in the pricing level occurred from the beginning to the end of the period. |
| (b) | Includes paydown on securities. |
| (c) | Included in the related net change in unrealized appreciation/(depreciation) in the Statements of Operations. The change in unrealized appreciation/(depreciation) on investments still held as of September 30, 2016, was ($427). |
| (d) | The transfers into Level 3 are due to a decrease in trading activities at period end. |
| (e) | The Fund’s investments that are categorized as Level 3 were valued utilizing third party pricing information without adjustment. Such valuations are based on unobservable inputs. A significant change in third party information could result in a significantly lower or higher value of Level 3 investments. |
None of the securities in this table are internally fair valued.
See Notes to Financial Statements
67
Table of Contents
VIRTUS SENIOR FLOATING RATE FUND
SEPTEMBER 30, 2016
($ reported in thousands)
| PAR VALUE | VALUE | |||||||
| MORTGAGE-BACKED SECURITIES—0.2% | ||||||||
| Non-Agency—0.2% | ||||||||
Home Equity Loan Trust 07-HSA3, AI4 | $ | 1,146 | $ | 1,153 | ||||
| TOTAL MORTGAGE-BACKED SECURITIES (Identified Cost $1,135) | 1,153 | |||||||
| CORPORATE BONDS AND NOTES—4.9% | ||||||||
| Consumer Discretionary—0.6% | ||||||||
Boyd Gaming Corp. | 365 | 398 | ||||||
IHO Verwaltungs GmbH PIK Interest Capitalization 144A | 330 | 334 | ||||||
PetSmart, Inc. 144A | 905 | 952 | ||||||
SFR (Numericable) Group S.A. 144A | 615 | 630 | ||||||
TRI Pointe Group, Inc. | 1,165 | 1,197 | ||||||
|
| |||||||
| 3,511 | ||||||||
|
| |||||||
| Consumer Staples—0.2% | ||||||||
Dole Food Co., Inc. 144A | 880 | 895 | ||||||
|
| |||||||
| Energy—0.9% | ||||||||
Antero Midstream Partners LP 144A | 430 | 436 | ||||||
Carrizo Oil & Gas, Inc. | 895 | 891 | ||||||
FTS International, Inc. | ||||||||
144A 8.350%, 6/15/20(2) | 1,120 | 952 | ||||||
6.250%, 5/1/22 | 825 | 320 | ||||||
Laredo Petroleum, Inc. | 620 | 604 | ||||||
Newfield Exploration Co. | 580 | 602 | ||||||
Range Resources Corp. 144A | 600 | 600 | ||||||
Whiting Petroleum Corp. | 350 | 329 | ||||||
|
| |||||||
| 4,734 | ||||||||
|
| |||||||
| Financials—0.5% | ||||||||
iStar Financial, Inc. | ||||||||
4.875%, 7/1/18 | 785 | 792 | ||||||
5.000%, 7/1/19 | 430 | 430 | ||||||
Springleaf Finance Corp. | 1,410 | 1,444 | ||||||
|
| |||||||
| 2,666 | ||||||||
|
| |||||||
| Health Care—0.6% | ||||||||
Capsugel S.A. PIK Interest Capitalization, 144A | 270 | 271 | ||||||
| PAR VALUE | VALUE | |||||||
| Health Care—continued | ||||||||
Quintiles Transnational Corp. 144A | $ | 385 | $ | 398 | ||||
Surgery Center Holdings, Inc. 144A | 435 | 465 | ||||||
Tenet Healthcare Corp. | ||||||||
5.000%, 3/1/19 | 415 | 410 | ||||||
4.350%, 6/15/20(2) | 730 | 737 | ||||||
6.000%, 10/1/20 | 435 | 461 | ||||||
Valeant Pharmaceuticals International, Inc. 144A | 750 | 698 | ||||||
|
| |||||||
| 3,440 | ||||||||
|
| |||||||
| Industrials—0.5% | ||||||||
American Airlines Group, Inc. 144A | 460 | 466 | ||||||
Standard Industries, Inc. 144A | 555 | 580 | ||||||
Wheels Up Finance I LLC | ||||||||
16-01, A | 309 | 306 | ||||||
16-01, A | 1,445 | 1,430 | ||||||
|
| |||||||
| 2,782 | ||||||||
|
| |||||||
| Information Technology—0.3% | ||||||||
Diamond 1 Finance Corp. / Diamond 2 Finance Corp. 144A | 610 | 649 | ||||||
First Data Corp. | ||||||||
144A 5.000%, 1/15/24 | 600 | 611 | ||||||
144A 5.750%, 1/15/24 | 225 | 232 | ||||||
|
| |||||||
| 1,492 | ||||||||
|
| |||||||
| Materials—0.9% | ||||||||
Ardagh Packaging Finance plc 144A | 400 | 411 | ||||||
Hexion U.S. Finance Corp. | 645 | 569 | ||||||
INEOS Group Holdings S.A. 144A | 1,130 | 1,157 | ||||||
Reynolds Group Issuer, Inc. | ||||||||
144A 4.127%, 7/15/21(2) | 1,500 | 1,526 | ||||||
144A 5.125%, 7/15/23 | 575 | 594 | ||||||
Vedanta Resources plc 144A | 685 | 683 | ||||||
|
| |||||||
| 4,940 | ||||||||
|
| |||||||
| Telecommunication Services—0.3% | ||||||||
Altice Financing S.A. 144A | 875 | 901 | ||||||
West Corp. 144A | 695 | 718 | ||||||
|
| |||||||
| 1,619 | ||||||||
|
| |||||||
| PAR VALUE | VALUE | |||||||
| Utilities—0.1% | ||||||||
Talen Energy Supply LLC 144A | $ | 780 | $ | 737 | ||||
| TOTAL CORPORATE BONDS AND NOTES (Identified Cost $26,974) | 26,816 | |||||||
| LOAN AGREEMENTS(2)—100.5% | ||||||||
| Consumer Discretionary—24.8% | ||||||||
Advantage Sales & Marketing, Inc. Second Lien, | 890 | 849 | ||||||
Affinity Gaming LLC | 1,033 | 1,036 | ||||||
Altice U.S. Finance I Corp. | 1,634 | 1,649 | ||||||
Aristocrat Leisure Ltd. Tranche B-1 | 2,241 | 2,252 | ||||||
Aspen Merger Sub (Coinstar), Inc. | 1,264 | 1,272 | ||||||
Boyd Gaming Corp. | ||||||||
Tranche B, | 1,537 | 1,549 | ||||||
Tranche B-2 | 448 | 452 | ||||||
Caesars Entertainment Operating Co., Inc. | ||||||||
Tranche B-4, | 943 | 1,088 | ||||||
Tranche B-6, | 2,558 | 2,808 | ||||||
Tranche B-7, | 1,270 | 1,456 | ||||||
Caesars Entertainment Resort Properties LLC | 3,903 | 3,902 | ||||||
Caesars Growth Properties Holdings LLC Tranche B, First Lien, | 1,229 | 1,216 | ||||||
CBAC Borrower LLC Tranche B, | 951 | 938 | ||||||
CDS U.S. Intermediate Holdings, Inc. First Lien, | 1,597 | 1,601 | ||||||
Cengage Learning, Inc. | 1,466 | 1,468 | ||||||
Charter Communications Operating LLC (CCO Safari LLC) | ||||||||
Tranche F, | 6,117 | 6,142 | ||||||
Tranche H, | 1,098 | 1,104 | ||||||
Tranche I, | 1,341 | 1,352 | ||||||
CityCenter Holdings LLC Tranche B, | 2,056 | 2,073 | ||||||
CS Intermediate Holding Co. II LLC | 2,957 | 2,977 | ||||||
See Notes to Financial Statements
68
Table of Contents
VIRTUS SENIOR FLOATING RATE FUND
SCHEDULE OF INVESTMENTS (Continued)
SEPTEMBER 30, 2016
($ reported in thousands)
| PAR VALUE | VALUE | |||||||
| Consumer Discretionary—continued | ||||||||
CSC Holdings, Inc. | $ | 5,047 | $ | 5,069 | ||||
Delta 2 (Lux) S.a.r.l. Tranche B-3, | 1,813 | 1,818 | ||||||
Diamond Resorts International, Inc. | 233 | 232 | ||||||
El Dorado Resorts, Inc. | 1,032 | 1,037 | ||||||
Federal-Mogul Corp. Tranche C, | 2,284 | 2,214 | ||||||
Floor & Decor Outlets of America, Inc. | 1,637 | 1,639 | ||||||
Gates Global LLC | 2,127 | 2,099 | ||||||
Graton Resort & Casino Tranche B, | 1,026 | 1,034 | ||||||
Harbor Freight Tools USA, Inc. | 2,447 | 2,464 | ||||||
Hilton Worldwide Finance LLC | ||||||||
Tranche B-1 | 797 | 803 | ||||||
Tranche B-2 | 8,146 | 8,205 | ||||||
iHeartCommunications, Inc. Tranche D, | 4,503 | 3,481 | ||||||
Intelsat Jackson Holdings S.A. Tranche B-2, | 1,838 | 1,753 | ||||||
KAR Auction Services, Inc. Tranche B-2, | 2,532 | 2,553 | ||||||
Laureare Education, Inc. 2021 Extended, | 2,432 | 2,424 | ||||||
Leslie’s Poolmart, Inc. Tranche B | 1,152 | 1,161 | ||||||
Libbey Glass, Inc. | 1,395 | 1,402 | ||||||
MCC LLC | ||||||||
Tranche H, | 1,626 | 1,638 | ||||||
Tranche G, | 2,295 | 2,310 | ||||||
Metaldyne LLC | 2,579 | 2,592 | ||||||
MGM Growth Properties | 2,508 | 2,534 | ||||||
Michaels Stores, Inc. | 3,234 | 3,251 | ||||||
Mohegan Tribal Gaming Authority | ||||||||
Tranche B, | 2,230 | 2,234 | ||||||
0.000%, 9/30/23(7) | 1,455 | 1,440 | ||||||
Neiman Marcus Group | 1,821 | 1,681 | ||||||
| PAR VALUE | VALUE | |||||||
| Consumer Discretionary—continued | ||||||||
Nexstar Broadcasting, Inc. | $ | 113 | $ | 113 | ||||
Party City Holdings, Inc. | 2,979 | 2,994 | ||||||
Penn National Gaming, Inc. Tranche B, | 2,175 | 2,181 | ||||||
PetSmart, Inc. Tranche B-1, | 1,106 | 1,110 | ||||||
Scientific Games International, Inc. Tranche B-2, | 2,758 | 2,767 | ||||||
ServiceMaster Co. LLC (The) | 5,192 | 5,251 | ||||||
SFR Group S.A.(Numericable) Tranche B-1 | 2,170 | 2,196 | ||||||
Sinclair Television Group, Inc. Tranche B-1, | 2,723 | 2,742 | ||||||
SRAM LLC First Lien, | 1,638 | 1,597 | ||||||
Station Casinos LLC Tranche B, | 2,032 | 2,048 | ||||||
TI Group Auto Systems LLC | 1,131 | 1,136 | ||||||
Transtar Holding Co. | ||||||||
First Lien, | 1,418 | 1,141 | ||||||
Second Lien, | 460 | 63 | ||||||
Tribune Media Co. Tranche B, | 2,597 | 2,622 | ||||||
U.S. Farathane LLC Tranche B-2, | 2,013 | 2,023 | ||||||
UFC Holdings LLC First Lien | 1,380 | 1,394 | ||||||
University Support Services LLC | 1,132 | 1,140 | ||||||
Univision Communications, Inc. | ||||||||
Tranche C-3 | 6,219 | 6,237 | ||||||
Tranche C-4 | 3,352 | 3,362 | ||||||
|
| |||||||
| 136,369 | ||||||||
|
| |||||||
| Consumer Staples—7.5% | ||||||||
Albertson’s LLC | ||||||||
Trance B-4, | 2,252 | 2,272 | ||||||
Tranche B-5, | 2,030 | 2,053 | ||||||
Amplify Snack Brands, Inc. | 1,750 | 1,740 | ||||||
ARAMARK Corp. | ||||||||
Tranche E, | 2,696 | 2,716 | ||||||
ASP MSG Acquisitions, Co., Inc. | 1,180 | 1,187 | ||||||
| PAR VALUE | VALUE | |||||||
| Consumer Staples—continued | ||||||||
Charger OpCo B.V. (Oak Tea, Inc.) Tranche B-1, | $ | 889 | $ | 896 | ||||
Chobani LLC | 346 | 344 | ||||||
Coty, Inc. Tranche B, | 845 | 856 | ||||||
Crossmark Holdings, Inc. | ||||||||
First Lien, | 1,948 | 1,282 | ||||||
Second Lien, | 520 | 235 | ||||||
Dell International, Inc. Tranche B | 7,020 | 7,070 | ||||||
Dole Food Co., Inc. Tranche B, | 2,155 | 2,165 | ||||||
Galleria Co. Tranche B, | 1,698 | 1,708 | ||||||
Hostess Brands LLC | ||||||||
Tranche B, First Lien, | 2,544 | 2,566 | ||||||
Tranche B, Second Lien, | 1,900 | 1,917 | ||||||
Kronos Second Lien, | 2,271 | 2,315 | ||||||
Pinnacle Foods Finance LLC | 452 | 456 | ||||||
Prestige Brands, Inc. Tranche B-3, | 212 | 213 | ||||||
Reynolds Group Holdings, Inc. | 5,016 | 5,039 | ||||||
Rite Aid Corp. Tranche 2, Second Lien, | 1,150 | 1,154 | ||||||
Spectrum Brands, Inc. | 1,428 | 1,436 | ||||||
US Foods, Inc. | 1,466 | 1,480 | ||||||
|
| |||||||
| 41,100 | ||||||||
|
| |||||||
| Energy—2.5% | ||||||||
Chesapeake Energy Corp. | 325 | 342 | ||||||
Chief Exploration & Development LLC Second Lien, | 1,639 | 1,545 | ||||||
Drillships Financing Holding, Inc. (Ocean Rig) Tranche B-1, | 1,722 | 869 | ||||||
Drillships Ocean Ventures, Inc. | 750 | 523 | ||||||
EP Energy LLC | 1,185 | 1,166 | ||||||
Fieldwood Energy LLC | 733 | 613 | ||||||
Second Lien, | 1,623 | 654 | ||||||
First Lien, | 989 | 705 | ||||||
See Notes to Financial Statements
69
Table of Contents
VIRTUS SENIOR FLOATING RATE FUND
SCHEDULE OF INVESTMENTS (Continued)
SEPTEMBER 30, 2016
($ reported in thousands)
| PAR VALUE | VALUE | |||||||
| Energy—continued | ||||||||
Jonah Energy LLC Second Lien, 7.500%, 5/12/21 | $ | 2,045 | $ | 1,830 | ||||
MEG Energy Corp. | 3,157 | 2,959 | ||||||
Paragon Offshore Finance Co. | 1,712 | 431 | ||||||
Sabine Oil & Gas LLC Second Lien, | 1,290 | 47 | ||||||
Seadrill Operating LP | 4,061 | 2,039 | ||||||
|
| |||||||
| 13,723 | ||||||||
|
| |||||||
| Financials—3.6% | ||||||||
Alix Partners LLP | 3,164 | 3,174 | ||||||
Asurion LLC | ||||||||
Tranche B-2, | 717 | 719 | ||||||
Tranche B-4, | 1,048 | 1,055 | ||||||
Delos Finance S.a.r.l. | 2,212 | 2,230 | ||||||
iStar Financial, Inc. | 463 | 469 | ||||||
Starwood Property Trust, Inc. | 3,262 | 3,268 | ||||||
TransUnion LLC Tranche B-2, | 5,161 | 5,185 | ||||||
Vertafore Holdings Corp. | 1,028 | 1,033 | ||||||
Walter Investment Management Corp. Tranche B, | 3,123 | 2,871 | ||||||
|
| |||||||
| 20,004 | ||||||||
|
| |||||||
| Health Care—14.8% | ||||||||
21st Century Oncology Holdings, Inc. Tranche B, | 1,886 | 1,782 | ||||||
Acadia Healthcare Co., Inc. Tranche B-2, | 2,071 | 2,088 | ||||||
Akorn, Inc. | 2,180 | 2,208 | ||||||
Alere, Inc. Tranche B, | 1,553 | 1,545 | ||||||
American Renal Holdings, Inc. Tranche B, First Lien, | 2,217 | 2,219 | ||||||
Amneal Pharmaceuticals LLC Tranche B, | 1,859 | 1,866 | ||||||
Ardent Legacy Acquisitions, Inc. | 1,543 | 1,536 | ||||||
Capsugel Holdings LLC | 3,217 | 3,239 | ||||||
| PAR VALUE | VALUE | |||||||
| Health Care—continued | ||||||||
Change Healthcare Holdings, Inc. | ||||||||
Tranche B-2, | $ | 1,356 | $ | 1,360 | ||||
Tranche B-3, | 490 | 491 | ||||||
Community Health Systems, Inc. (CHS) | ||||||||
Tranche F, | 1,140 | 1,135 | ||||||
Tranche G, | 1,319 | 1,297 | ||||||
Tranche H, | 3,567 | 3,509 | ||||||
Concordia Pharmaceuticals, Inc. | 1,226 | 1,099 | ||||||
DaVita HealthCare Partners, Inc. Tranche B, | 3,084 | 3,106 | ||||||
DJO Finance | 1,447 | 1,423 | ||||||
Endo Luxembourg Finance Co. S.a.r.l. Tranche B, | 2,234 | 2,232 | ||||||
Greatbatch, Inc. Tranche B, | 834 | 824 | ||||||
HCA, Inc. Tranche B-6, | 1,165 | 1,180 | ||||||
Iasis Healthcare LLC Tranche B-2, | 1,951 | 1,933 | ||||||
IMS Health, Inc. Tranche B, | 4,234 | 4,254 | ||||||
InVentiv Health, Inc. | ||||||||
Tranche B-4, | 2,887 | 2,895 | ||||||
Tranche B | 1,302 | 1,307 | ||||||
Jaguar Holding Company I | 2,630 | 2,643 | ||||||
Kindred Healthcare, Inc. | 1,150 | 1,152 | ||||||
MMM Holdings, Inc. | 364 | 355 | ||||||
MPH Acquisition Holdings LLC 5.000%, 6/7/23 | 837 | 849 | ||||||
MSO of Puerto Rico, Inc. | 265 | 258 | ||||||
National Mentor Holdings, Inc. Tranche B, | 1,056 | 1,059 | ||||||
National Surgical Hospitals First Lien, | 1,074 | 1,064 | ||||||
NVA Holdings, Inc. | ||||||||
Tranche B-1, First Lien, | 755 | 758 | ||||||
Second Lien, | 856 | 857 | ||||||
Ortho-Clinical Diagnostics Holdings S.a.r.l. | 3,162 | 3,100 | ||||||
Patterson Medical | 1,617 | 1,601 | ||||||
| PAR VALUE | VALUE | |||||||
| Health Care—continued | ||||||||
PRA Holdings, Inc. Tranche B-1, | $ | 2,322 | $ | 2,335 | ||||
Quintiles Transnational Corp. Tranche B, | 1,116 | 1,117 | ||||||
Quorum Health Corp. | 1,506 | 1,464 | ||||||
RPI Finance Trust Tranche B-4, 3.588%, 11/9/20 | 1,123 | 1,129 | ||||||
Select Medical Corp. Tranche B-F | 1,686 | 1,701 | ||||||
Sterigenics-Nordion | 1,075 | 1,080 | ||||||
Surgery Center Holdings, Inc. First Lien, | 1,446 | 1,449 | ||||||
Surgical Care Affiliates, Inc. | 722 | 728 | ||||||
Team Health, Inc. Tranche B, | 1,945 | 1,959 | ||||||
U.S. Renal Care, Inc. First Lien, | 1,672 | 1,610 | ||||||
Valeant Pharmaceuticals International, Inc. | ||||||||
Series D-2, Tranche B, | 2,093 | 2,098 | ||||||
Series C-2, Tranche B, | 2 | 2 | ||||||
Series E-1, Tranche B, | 3,861 | 3,873 | ||||||
Series F-1, Tranche B, | 2,407 | 2,418 | ||||||
|
| |||||||
| 81,187 | ||||||||
|
| |||||||
| Industrials—14.2% | ||||||||
Accudyne Industries Borrower S.C.A. (Accudyne Industries LLC) (Silver II US Holdings LLC) | 1,800 | 1,687 | ||||||
Air Canada | ||||||||
4.000%, 9/26/19 | 2,209 | 2,216 | ||||||
0.000%, 9/21/23(7) | 633 | 635 | ||||||
American Airlines, Inc. | ||||||||
3.250%, 6/27/20 | 6,446 | 6,468 | ||||||
Tranche B, | 1,210 | 1,215 | ||||||
Aspen Merger Sub (Coinstar), Inc. | ||||||||
0.000%, 9/27/23(7) | 813 | 820 | ||||||
0.000%, 9/27/24(7) | 570 | 567 | ||||||
Brickman Group Ltd. LLC (The) | ||||||||
First Lien, | 3,782 | 3,781 | ||||||
Second Lien, | 1,971 | 1,963 | ||||||
Brock Holdings III, Inc. First Lien, | 1,839 | 1,824 | ||||||
Builders FirstSource, Inc. | 1,598 | 1,610 | ||||||
See Notes to Financial Statements
70
Table of Contents
VIRTUS SENIOR FLOATING RATE FUND
SCHEDULE OF INVESTMENTS (Continued)
SEPTEMBER 30, 2016
($ reported in thousands)
| PAR VALUE | VALUE | |||||||
| Industrials—continued | ||||||||
Cortes NP Acquisition Corp. | $ | 1,061 | $ | 1,029 | ||||
Filtration Group Corp. | ||||||||
First Lien, | 1,411 | 1,420 | ||||||
Second Lien, | 543 | 545 | ||||||
Gardner Denver, Inc. | 1,771 | 1,719 | ||||||
Harland Clarke Holdings Corp. | ||||||||
Tranche B-3, | 772 | 764 | ||||||
Tranche B-4, | 641 | 632 | ||||||
Tranche B-5, | 970 | 954 | ||||||
HD Supply, Inc. | ||||||||
3.750%, 8/13/21 | 2,941 | 2,952 | ||||||
0.000%, 10/16/23(7) | 669 | 671 | ||||||
Headwaters, Inc. | 3,112 | 3,133 | ||||||
Husky Injection Molding Systems Ltd. | 3,258 | 3,258 | ||||||
McGraw-Hill Global Education Holdings LLC Tranche B, First Lien, | 1,783 | 1,797 | ||||||
MRC Global (U.S.), Inc. (f/k/a McJunkin Red Man Corp.) | 1,853 | 1,814 | ||||||
Navistar, Inc. Tranche B | 1,310 | 1,315 | ||||||
NV, Inc. | 1,443 | 1,444 | ||||||
Quikrete Co., Inc. First Lien, | 2,829 | 2,855 | ||||||
Rexnord LLC Tranche B, | 3,959 | 3,972 | ||||||
Science Applications Tranche B, | 1,501 | 1,512 | ||||||
Sedgwick Claims Management Services, Inc. | ||||||||
First Lien, | 3,471 | 3,453 | ||||||
Second Lien, | 1,725 | 1,711 | ||||||
SiteOne Landscaping Supply LLC | 1,230 | 1,243 | ||||||
Spin Holdco, Inc. First Lien, | 2,257 | 2,251 | ||||||
The ADT Corp. | 1,668 | 1,686 | ||||||
TransDigm, Inc. | ||||||||
Tranche D, | 1,620 | 1,623 | ||||||
Tranche F, | 6,044 | 6,054 | ||||||
United Airlines, Inc. (f/k/a Continental Airlines, Inc.) Tranche B-1, | 1,148 | 1,155 | ||||||
| PAR VALUE | VALUE | |||||||
| Industrials—continued | ||||||||
Waste Industries | $ | 2,163 | $ | 2,176 | ||||
Wex, Inc. | 2,028 | 2,055 | ||||||
|
| |||||||
| 77,979 | ||||||||
|
| |||||||
| Information Technology—10.4% | ||||||||
Abacus Innovations Corp.(Leidos, Inc.) | 1,410 | 1,420 | ||||||
Allflex Holdings III, Inc. First Lien, | 1,552 | 1,550 | ||||||
Alorica, Inc. | 411 | 417 | ||||||
Applied Systems, Inc. Second Lien, | 1,145 | 1,158 | ||||||
Avago Technologies Cayman Finance Ltd. | 3,965 | 4,017 | ||||||
Blackboard, Inc. | ||||||||
Tranche B-4 | 2,030 | 2,028 | ||||||
Tranche B-4 | 3,706 | 3,682 | ||||||
BMC Software, Inc. | 1,845 | 1,784 | ||||||
CCC Information Services | 2,251 | 2,253 | ||||||
CDW LLC | 5,411 | 5,434 | ||||||
Cypress Semiconductor Corp. | 1,800 | 1,826 | ||||||
Deltek, Inc. | ||||||||
First Lien | 190 | 191 | ||||||
Second Lien | 858 | 870 | ||||||
Donnelley Financial Solutions | 636 | 640 | ||||||
First Data Corp. | ||||||||
Tranche 2021 | 5,876 | 5,926 | ||||||
Tranche 2022 | 1,664 | 1,675 | ||||||
Infinity Acquisition Ltd. | 2,546 | 2,435 | ||||||
Infor (U.S.), Inc. | ||||||||
Tranche B-3, | 1,419 | 1,413 | ||||||
Tranche B-5, | 3,412 | 3,397 | ||||||
Mitchell International, Inc. | ||||||||
4.500%, 10/13/20 | 3,295 | 3,300 | ||||||
Second Lien, | 1,291 | 1,266 | ||||||
MKS Instruments, Inc. | 521 | 528 | ||||||
NXP BV Tranche F | 806 | 810 | ||||||
On Semiconductor | 1,258 | 1,265 | ||||||
| PAR VALUE | VALUE | |||||||
| Information Technology—continued | ||||||||
Presidio, Inc. Refinancing, | $ | 1,405 | $ | 1,406 | ||||
Press Ganey Holdings, Inc. | 297 | 298 | ||||||
Sophia, LP | 2,536 | 2,541 | ||||||
SS&C European Holdings S.a.r.l. | ||||||||
Tranche A-1, | 179 | 179 | ||||||
Tranche A-2, | 277 | 278 | ||||||
Tranche B-2, | 132 | 134 | ||||||
Tranche B-1, | 1,066 | 1,075 | ||||||
Western Digital Corp. Tranche B-1, | 2,290 | 2,317 | ||||||
|
| |||||||
| 57,513 | ||||||||
|
| |||||||
| Materials—10.5% | ||||||||
ABC Supply, Inc. | 238 | 239 | ||||||
American Builders & Contractors Supply Co., Inc. Tranche B, | 4,305 | 4,321 | ||||||
Anchor Glass Container Corp. Tranche B, | 4,122 | 4,154 | ||||||
Ardagh Packaging Finance plc | 854 | 859 | ||||||
Berlin Packaging, Inc. S.a.r.l. First Lien, | 1,315 | 1,322 | ||||||
Berry Plastics Corp. | ||||||||
Tranche D, | 4,485 | 4,496 | ||||||
Tranche G, | 1,843 | 1,847 | ||||||
Tranche H, | 631 | 634 | ||||||
CPG International, Inc. | 1,743 | 1,748 | ||||||
CPI Acquisition, Inc. First Lien, | 2,257 | 2,211 | ||||||
Fortescue Metals Group (FMG) Resources Property Ltd. | 3,821 | 3,822 | ||||||
Huntsman International LLC | ||||||||
Tranche 14-1 | 3,930 | 3,956 | ||||||
Tranche 16-B, | 430 | 433 | ||||||
Ineos U.S .Finance LLC | 6,871 | 6,895 | ||||||
Kraton Polymers | 1,800 | 1,817 | ||||||
Macdermid, Inc. (Platform Speciality Products Corp.) Tranche B-3, | 1,776 | 1,787 | ||||||
See Notes to Financial Statements
71
Table of Contents
VIRTUS SENIOR FLOATING RATE FUND
SCHEDULE OF INVESTMENTS (Continued)
SEPTEMBER 30, 2016
($ reported in thousands)
| PAR VALUE | VALUE | |||||||
| Materials—continued | ||||||||
Omnova Solutions, Inc. Tranche B-2, | $ | 2,843 | $ | 2,839 | ||||
Owens Illinois, Inc. Tranche B, | 553 | 558 | ||||||
PolyOne Corp. Tranche B-1, | 400 | 405 | ||||||
PQ Corp. Tranche B-1, | 619 | 625 | ||||||
Royal Holdings, Inc. First Lien, | 2,112 | 2,126 | ||||||
Solenis International LP First Lien, 4.250%, 7/31/21 | 2,297 | 2,297 | ||||||
Summit Materials | 3,510 | 3,528 | ||||||
Univar, Inc. | 2,848 | 2,856 | ||||||
W.R. Grace & Co. | 2,038 | 2,044 | ||||||
|
| |||||||
| 57,819 | ||||||||
|
| |||||||
| Real Estate—2.7% | ||||||||
Capital Automotive LP | ||||||||
Tranche B-1, | 1,086 | 1,095 | ||||||
Second Lien, | 1,828 | 1,847 | ||||||
Communications Sales & Leasing, Inc. | 1,468 | 1,477 | ||||||
DTZ U.S. Borrower, LLC (DTZ AUS Holdco PTY Ltd.) First Lien, | 2,963 | 2,970 | ||||||
ESH Hospitality, Inc. | 799 | 806 | ||||||
Realogy Group LLC | 3,561 | 3,609 | ||||||
Ziggo Secured Finance Partnership Tranche D | 3,131 | 3,140 | ||||||
|
| |||||||
| 14,944 | ||||||||
|
| |||||||
| Telecommunication Services—4.8% | ||||||||
Cable & Wireless / Sable International Finance | ||||||||
Tranche B-1, | 1,296 | 1,310 | ||||||
Tranche B-2, | 1,060 | 1,072 | ||||||
Global Tel*Link Corp. First Lien, | 1,783 | 1,732 | ||||||
Level 3 Financing, Inc. | ||||||||
Tranche B-III, | 2,575 | 2,591 | ||||||
Tranche B, 2020 | 3,388 | 3,410 | ||||||
Tranche B-II, | 2,343 | 2,359 | ||||||
SBA Senior Finance II LLC Tranche B-1, | 3,701 | 3,715 | ||||||
| PAR VALUE | VALUE | |||||||
| Telecommunication Services—continued | ||||||||
Securus Technologies Holdings, Inc. | ||||||||
First Lien, | $ | 1,482 | $ | 1,467 | ||||
Tranche B-2, | 759 | 752 | ||||||
UPC Financing Partnership | 3,189 | 3,205 | ||||||
Virgin Media Investment Holdings Ltd. Tranche F, | 2,590 | 2,605 | ||||||
West Corp. Tranche B-12, | 1,146 | 1,153 | ||||||
XO Communications LLC | 1,254 | 1,259 | ||||||
|
| |||||||
| 26,630 | ||||||||
|
| |||||||
| Utilities—4.7% | ||||||||
Atlantic Power LP | 1,838 | 1,862 | ||||||
Calpine Construction Finance Co. LP | ||||||||
Tranche B-1, | 4,649 | 4,622 | ||||||
Tranche B-2, | 3,779 | 3,765 | ||||||
Dayton Power and Light Co. | 276 | 280 | ||||||
Dynegy Finance IV, Inc. | 3,857 | 3,893 | ||||||
Energy Future Holding Corp. 5.000%, 10/31/17(5) |
| 1,365 |
|
| 1,377 |
| ||
Tranche C | 312 | 315 | ||||||
NRG Energy, Inc. | 7,139 | 7,164 | ||||||
Texas Competitive Electric Holdings Co. LLC | ||||||||
2017 Extended, | 9,165 | 2,665 | ||||||
|
| |||||||
| 25,943 | ||||||||
| TOTAL LOAN AGREEMENTS (Identified Cost $563,706) | 553,211 | |||||||
| SHARES | ||||||||
| AFFILIATED MUTUAL FUND—1.1% | ||||||||
Virtus Credit Opportunities Fund Class R6(10) | 610,288 | 5,999 | ||||||
| TOTAL AFFILIATED MUTUAL FUND (Identified Cost $6,100) | 5,999 | |||||||
| TOTAL LONG TERM INVESTMENTS—106.7% | ||||||||
| (Identified Cost $597,915) | 587,179 | (9) | ||||||
| TOTAL INVESTMENTS—106.7% (Identified Cost $597,915) | 587,179 | (1) | ||||||
Other assets and liabilities, |
| (37,000 | ) | |||||
|
| |||||||
| NET ASSETS—100.0% | $ | 550,179 | ||||||
|
| |||||||
Abbreviation:
| PIK | Payment-in-Kind Security |
Footnote Legend:
| (1) | Federal Income Tax Information: For tax information at September 30, 2016, see Note 10 Federal Income Tax Information in the Notes to Financial Statements. |
| (2) | Variable or step coupon security; interest rate shown reflects the rate in effect at September 30, 2016. |
| (3) | Security exempt from registration under Rule 144A of the Securities Act of 1933. These securities may be resold in transactions exempt from registration, normally to qualified institutional buyers. At September 30, 2016, these securities amounted to a value of $15,896 or 2.9% of net assets. |
| (4) | 100% of the income received was in cash. |
| (5) | Security in default, interest payments are being received during the bankruptcy proceedings. |
| (6) | Security in default no interest payments are being received during the bankruptcy proceedings. |
| (7) | This loan will settle after September 30, 2016, at which time the interest rate, based on the London Interbank Offered Rate (“LIBOR”) and the agreed upon spread on trade date, will be reflected. |
| (8) | Illiquid security. |
| (9) | All or a portion of the Fund’s assets have been segregated as collateral for delayed delivery settlements and leverage. |
| (10) | Shares of this fund are publicly offered and its prospectus and annual report are publicly available. |
| (11) | Security in default, a portion of the interest payments are being received during the bankruptcy proceedings. |
| (12) | Represents unfunded portion of security and commitment fee earned on this portion. |
| Country Weightings† (Unaudited) | ||||
United States | 94 | % | ||
Canada | 2 | |||
Luxembourg | 2 | |||
Australia | 1 | |||
Cayman Islands | 1 | |||
Total | 100 | % | ||
† % of total investments as of September 30, 2016 |
| |||
Security abbreviation definitions are located under the Key Investment Terms starting on page 4.
See Notes to Financial Statements
72
Table of Contents
VIRTUS SENIOR FLOATING RATE FUND
SCHEDULE OF INVESTMENTS (Continued)
SEPTEMBER 30, 2016
($ reported in thousands)
The following table provides a summary of inputs used to value the Fund’s investments as of September 30, 2016 (See Security Valuation Note 2A in the Notes to Financial Statements):
| Total Value at September 30, 2016 | Level 1 Quoted Prices | Level 2 Significant Observable lnputs | Level 3 Significant Unobservable lnputs | |||||||||||||
Debt Securities: | ||||||||||||||||
Corporate Bonds And Notes | $ | 26,816 | $ | — | $ | 25,080 | $ | 1,736 | ||||||||
Loan Agreements | 553,211 | — | 553,101 | 110 | ||||||||||||
Mortgage-Backed Securites | 1,153 | — | 1,153 | — | ||||||||||||
Equity Securities: | ||||||||||||||||
Affiliated Mutual Fund | 5,999 | 5,999 | — | — | ||||||||||||
|
|
|
|
|
|
|
| |||||||||
Total Investments | $ | 587,179 | $ | 5,999 | $ | 579,334 | $ | 1,846 | ||||||||
|
|
|
|
|
|
|
| |||||||||
There were no transfers between Level 1 and Level 2 related to securities held as of September 30, 2016.
The following is a reconciliation of assets of the Fund for Level 3 investments for which significant unobservable inputs were used to determine fair value.
| Total | Corporate Bonds | Loan Agreements | ||||||||||
Investments in Securities | ||||||||||||
Balance as of September 30, 2015: | $ | 446 | $ | — | $ | 446 | ||||||
Accrued discount/(premium) | 2 | 1 | 1 | |||||||||
Realized gain (loss) | — | — | — | (f) | ||||||||
Change in unrealized appreciation (depreciation)(d) | (385 | ) | (1 | ) | (384 | ) | ||||||
Purchases | 3,209 | 3,209 | — | |||||||||
Sales(b) | (1,473 | ) | (1,473 | ) | — | |||||||
Transfers into Level 3(a) | 47 | (c) | — | 47 | (c) | |||||||
Transfers from Level 3(a) | — | — | — | |||||||||
|
|
|
|
|
| |||||||
Balance as of September 30, 2016 | $ | 1,846 | $ | 1,736 | (e) | $ | 110 | (e) | ||||
|
|
|
|
|
| |||||||
| (a) | “Transfers into and/or from” represent the ending value as of September 30, 2016, for any investment security where a change in the pricing level occurred from the beginning to the end of the period.” |
| (b) | Includes paydown on securities. |
| (c) | The transfers into Level 3 are due to a decrease in trading activities at period end. |
| (d) | Included in the related net change in unrealized appreciation (depreciation) in the Statements of Operations. The change in unrealized appreciation (depreciation) on investments still held at September 30, 2016, was $(1,642). |
| (e) | The Fund’s investments that are categorized as Level 3 were valued utilizing third party pricing information without adjustment. Such valuations are based on unobservable inputs. A significant change in third party information could result in a significantly lower or higher value of Level 3 investments. |
| (f) | Amount is less than $500. |
None of the securities in this table are internally fair valued.
See Notes to Financial Statements
73
Table of Contents
SEPTEMBER 30, 2016
($ reported in thousands)
| PAR VALUE | VALUE | |||||||
| MUNICIPAL BONDS(3)—97.7% | ||||||||
| Alabama—2.8% | ||||||||
Jefferson County School Warrant Revenue, | $ | 4,000 | $ | 4,057 | ||||
Pell City Special Care Facilities Financing Authority, Noland Health Services Revenue, | ||||||||
4.000%, 12/1/25 | 500 | 536 | ||||||
5.000%, 12/1/25 | 1,000 | 1,141 | ||||||
|
| |||||||
| 5,734 | ||||||||
|
| |||||||
| Arizona—3.8% | ||||||||
Arizona Department of Transportation State Highway Fund Revenue (Pre-refunded 7/1/26 @ 100) | 500 | 617 | ||||||
Arizona State Health Facilities Authority, Scottsdale Lincoln Hospital Revenue, | 565 | 706 | ||||||
Arizona State University | ||||||||
5.000%, 7/1/37 | 360 | 439 | ||||||
5.000%, 7/1/36 | 1,000 | 1,222 | ||||||
Mesa, City of, Excise Tax Revenue | 500 | 515 | ||||||
Northern Arizona University, Stimulus Plan for Economic and Educational Development Revenue, | ||||||||
5.000%, 8/1/24 | 1,115 | 1,345 | ||||||
5.000%, 8/1/25 | 2,290 | 2,758 | ||||||
|
| |||||||
| 7,602 | ||||||||
|
| |||||||
| Arkansas—0.3% | ||||||||
University of Arkansas, Facility Revenue, (Pre-refunded 11/1/26 @100) | 505 | 625 | ||||||
|
| |||||||
| California—6.2% | ||||||||
California Health Facilities Financing Authority | 275 | 305 | ||||||
California Health Facilities Financing Authority, Sutter Health Revenue, | 600 | 748 | ||||||
California Municipal Finance Authority, | ||||||||
Bowles Hall Foundation Revenue, | 100 | 109 | ||||||
Bowles Hall Foundation Revenue, | 225 | 255 | ||||||
| PAR VALUE | VALUE | |||||||
| California—continued | ||||||||
Bowles Hall Foundation Revenue, | $ | 150 | $ | 171 | ||||
Community Medical Centers, (Pre-refunded 2/1/17 @100) | 400 | 481 | ||||||
California, State of, General Obligation, | ||||||||
5.000%, 10/1/23 | 150 | 150 | ||||||
5.000%, 2/1/24 | 1,500 | 1,832 | ||||||
California, State of, Public Works Board, Judicial Council Projects Revenue, | 500 | 605 | ||||||
Garden Grove Agency Community Development Successor Agency, Tax Allocation Revenue (BAM Insured), | 1,000 | 1,225 | ||||||
Metropolitan Water District of Southern California Revenue, | 2,000 | 2,096 | ||||||
Oakland Unified School District, General Obligation, | ||||||||
5.000%, 8/1/29 | 1,000 | 1,247 | ||||||
5.000%, 8/1/30 | 500 | 620 | ||||||
San Diego Public Facilities Financing Authority Sewer Revenue, (Pre-refunded 11/15/16 @100) | 2,000 | 2,512 | ||||||
Temecula Valley Unified School District Financing Authority, Special Tax Revenue (BAM Insured), | 175 | 215 | ||||||
|
| |||||||
| 12,571 | ||||||||
|
| |||||||
| Colorado—5.4% | ||||||||
Colorado State Health Facilities Authority, Catholic Health Initiatives Revenue, | 650 | 714 | ||||||
E-470 Public Highway Authority Revenue, | ||||||||
5.000%, 9/1/20 | 340 | 386 | ||||||
(NATL Insured), | 665 | 358 | ||||||
Public Authority For Colorado Energy, Natural Gas Purchase Revenue, | ||||||||
6.125%, 11/15/23 | 2,135 | 2,644 | ||||||
6.250%, 11/15/28 | 2,250 | 2,983 | ||||||
University of Colorado, Enterprise Revenue | ||||||||
5.000%, 6/1/19 | 625 | 691 | ||||||
(Pre-refunded 6/1/19 @100) | 1,650 | 1,853 | ||||||
| PAR VALUE | VALUE | |||||||
| Colorado—continued | ||||||||
(Pre-refunded 6/1/21 @100) | $ | 1,000 | $ | 1,180 | ||||
|
| |||||||
| 10,809 | ||||||||
|
| |||||||
| Connecticut—0.9% | ||||||||
Connecticut State Health & Educational Facility Authority, Hartford Healthcare Revenue, | 1,500 | 1,814 | ||||||
|
| |||||||
| District of Columbia—2.7% | ||||||||
Metropolitan Washington Airports Authority, Dulles Toll Road Revenue, Second Lien, (AGC Insured) | 4,000 | 5,425 | ||||||
|
| |||||||
| Florida—5.6% | ||||||||
Brevard County Health Facilities Authority, Health First Revenue, | ||||||||
5.000%, 4/1/21 | 115 | 133 | ||||||
(Pre-refunded 4/1/19 @100) | 1,050 | 1,207 | ||||||
Broward County School District, Certificates of Participation, (Pre-refunded 1/1/17 @100) | 300 | 362 | ||||||
Central Florida Expressway Authority (Pre-refunded 7/1/26 @100), Second Lien, Series B | 200 | 225 | ||||||
Lee County Transportation Facilities Revenue, (AGM Insured) | 400 | 446 | ||||||
Miami Beach Redevelopment Agency, Tax Increment Revenue, | 300 | 355 | ||||||
Miami Beach, City of, Stormwater Revenue, | 1,265 | 1,498 | ||||||
Miami-Dade County Aviation Revenue, | 2,425 | 2,883 | ||||||
Miami-Dade County Educational Facilities Authority, University of Miami Revenue, 5.000%, 4/1/30 | 200 | 242 | ||||||
Miami-Dade County Expressway Authority Series A | 400 | 489 | ||||||
See Notes to Financial Statements
74
Table of Contents
VIRTUS TAX-EXEMPT BOND FUND
SCHEDULE OF INVESTMENTS (Continued)
SEPTEMBER 30, 2016
($ reported in thousands)
| PAR VALUE | VALUE | |||||||
| Florida—continued | ||||||||
Miami-Dade County School Board, Certifiicates of Participation, (Pre-refunded 2/1/17 @100) | $ | 1,700 | $ | 2,023 | ||||
South Florida Water Management District, Certificates of Participation, (Pre-refunded 4/1/17 @100) | 750 | 899 | ||||||
Tallahassee, City of, Health Facilities Revenue, Tallahassee Memorial Healthcare | 480 | 559 | ||||||
|
| |||||||
| 11,321 | ||||||||
|
| |||||||
| Georgia—2.8% | ||||||||
Athens-Clarke County Unified Government, Water and Sewer Revenue (Pre-refunded 1/19/19 @100) | 1,500 | 1,656 | ||||||
Atlanta Water & Wastewater Revenue, (Pre-refunded 11/1/16 @100) | 650 | 796 | ||||||
DeKalb County Water & Sewer Revenue, | 2,750 | 3,278 | ||||||
|
| |||||||
| 5,730 | ||||||||
|
| |||||||
| Idaho—0.8% | ||||||||
Idaho Housing & Finance Association, Federal Highway Grant Anticipation Revenue, | 1,500 | 1,679 | ||||||
|
| |||||||
| Illinois—7.6% | ||||||||
Chicago O’Hare International Airport, | ||||||||
Customer Facilities Charge Revenue, Senior Lien, | 1,250 | 1,406 | ||||||
Passenger Facilities Charge Revenue, | 750 | 841 | ||||||
Chicago Park District, General Obligation (NATL Insured), | 660 | 661 | ||||||
Chicago, City of, | 750 | 842 | ||||||
Waterworks Revenue, Second Lien, | 500 | 580 | ||||||
Waterworks Revenue, Second Lien, | 500 | 596 | ||||||
| PAR VALUE | VALUE | |||||||
| Illinois—continued | ||||||||
Illinois Finance Authority Series A-1 | $ | 1,000 | $ | 1,000 | ||||
Illinois Finance Authority, | ||||||||
KishHealth System Revenue (Escrowed to Maturity), | 700 | 751 | ||||||
Rush University Medical Center Revenue (Pre-refunded 11/15/16 @100) | 1,220 | 1,379 | ||||||
Rush University Medical Center Revenue, | 250 | 295 | ||||||
Illinois State Toll Highway Authority, Toll Highway Revenue Senior Lien, | 1,000 | 1,225 | ||||||
Illinois, State of, General Obligation, | ||||||||
5.000%, 4/1/22 | 815 | 914 | ||||||
5.000%, 2/1/26 | 1,490 | 1,676 | ||||||
Metropolitan Pier & Exposition Authority, McCormick Place Expansion Project Revenue (AGM Insured), | 1,000 | 723 | ||||||
University of Illinois, Auxiliary Facilities System Revenue, | ||||||||
5.500%, 4/1/31 | 1,540 | 1,753 | ||||||
5.125%, 4/1/36 | 500 | 555 | ||||||
|
| |||||||
| 15,197 | ||||||||
|
| |||||||
| Indiana—2.6% | ||||||||
Indiana Finance Authority, Indiana University Health Center Revenue, | 800 | 971 | ||||||
Indiana University Revenue, (Pre-refunded 6/1/19 @100) | 1,320 | 1,471 | ||||||
Indianapolis Local Public Improvements Bond Bank Revenue, | 2,500 | 2,750 | ||||||
|
| |||||||
| 5,192 | ||||||||
|
| |||||||
| Iowa—1.3% | ||||||||
Iowa, State of, Prison Infrastructure Funding Revenue, (Pre-refunded 6/15/20 @100) | 2,250 | 2,577 | ||||||
|
| |||||||
| Louisiana—0.6% | ||||||||
New Orleans Sewerage Service Revenue, | ||||||||
5.000%, 6/1/19 | 500 | 548 | ||||||
5.000%, 6/1/20 | 550 | 621 | ||||||
|
| |||||||
| 1,169 | ||||||||
|
| |||||||
| PAR VALUE | VALUE | |||||||
| Maine—1.4% | ||||||||
Portland, City of, General Airport Revenue, | ||||||||
5.000%, 7/1/26 | $ | 1,000 | $ | 1,183 | ||||
5.000%, 7/1/29 | 580 | 684 | ||||||
5.000%, 7/1/30 | 770 | 906 | ||||||
|
| |||||||
| 2,773 | ||||||||
|
| |||||||
| Maryland—5.3% | ||||||||
Baltimore Convention Center, Hotel Revenue Senior Lien, (XLCA Insured), | ||||||||
5.250%, 9/1/22 | 400 | 401 | ||||||
5.250%, 9/1/23 | 1,500 | 1,504 | ||||||
Maryland Economic Development Corp., Exelon Generation Co. Revenue, | 500 | 510 | ||||||
Maryland Health & Higher Educational Facilities Authority, | ||||||||
Anne Arundel Health System Revenue, | 250 | 273 | ||||||
Anne Arundel Health System Revenue, (Pre-refunded 7/1/19 @100) | 2,015 | 2,331 | ||||||
Medstar Health, Inc. Revenue, (Pre-refunded 2/15/17 @100) | 800 | 989 | ||||||
Maryland, State of, General Obligation, | 3,945 | 4,583 | ||||||
|
| |||||||
| 10,591 | ||||||||
|
| |||||||
| Massachusetts—1.2% | ||||||||
Massachusetts Bay Transportation Authority, Assessment Revenue, | 1,000 | 1,213 | ||||||
Massachusetts Water Pollution Abatement Trust, State Revolving Fund Revenue, | 1,000 | 1,114 | ||||||
|
| |||||||
| 2,327 | ||||||||
|
| |||||||
| Michigan—2.0% | ||||||||
Michigan Finance Authority, Beaumont Health Credit Group Revenue, (Pre-refunded 2/1/17 @100) | 1,250 | 1,510 | ||||||
Michigan State Building Authority, Facilities Program Lease Revenue | 500 | 548 | ||||||
5.000%, 4/15/25 | 500 | 627 | ||||||
See Notes to Financial Statements
75
Table of Contents
VIRTUS TAX-EXEMPT BOND FUND
SCHEDULE OF INVESTMENTS (Continued)
SEPTEMBER 30, 2016
($ reported in thousands)
| PAR VALUE | VALUE | |||||||
| Michigan—continued | ||||||||
Michigan, State of, Federal Highway Grant Anticipation Revenue, (AGM Insured), (Pre-refunded 9/15/17 @100) | $ | 1,015 | $ | 1,057 | ||||
Royal Oak Hospital Finance Authority, William Beaumont Hospital Revenue, | 200 | 221 | ||||||
|
| |||||||
| 3,963 | ||||||||
|
| |||||||
| Missouri—1.0% | ||||||||
Metropolitan St. Louis Sewer District, Wastewater Revenue (Pre-refunded 9/15/17 @100) | 2,000 | 2,056 | ||||||
|
| |||||||
| Nebraska—0.5% | ||||||||
University of Nebraska – Lincoln, Student Fee Revenue, (Pre-refunded 1/1/19 @100) | 1,000 | 1,090 | ||||||
|
| |||||||
| New Jersey—3.3% | ||||||||
Camden County Improvement Authority Healthcare Redevelopment Project, Cooper Health System Revenue, | 950 | 1,115 | ||||||
New Jersey Economic Development Authority, Cigarette Tax Revenue (AGM Insured), | 3,000 | 3,473 | ||||||
New Jersey Housing & Mortgage Finance Agency, Mortgage Revenue, | 1,915 | 2,057 | ||||||
|
| |||||||
| 6,645 | ||||||||
|
| |||||||
| New York—11.7% | ||||||||
Buffalo & Erie County Industrial Land Development Corp., Catholic Health System Revenue, | 550 | 663 | ||||||
Metropolitan Transportation Authority, | ||||||||
(Pre-refund 11/15/18 @100) | 2,510 | 2,792 | ||||||
6.250%, 11/15/23 | 630 | 701 | ||||||
| PAR VALUE | VALUE | |||||||
| New York—continued | ||||||||
New York City General Obligation, | ||||||||
6.250%, 10/15/28 | $ | 40 | $ | 44 | ||||
(Pre-refunded 10/15/18 @100) | 960 | 1,063 | ||||||
New York City Industrial Development Agency, Queens Baseball Stadium Project Revenue, | ||||||||
(AGC Insured), | 500 | 553 | ||||||
(AMBAC Insured), | 900 | 909 | ||||||
(AMBAC Insured), | 470 | 474 | ||||||
New York City Municipal Water Finance Authority, Water & Sewer System Revenue, | ||||||||
(Pre-refunded 6/15/18 @100) | 500 | 540 | ||||||
(Pre-refunded 6/15/18 @100) | 1,000 | 1,079 | ||||||
(Pre-refunded 6/15/18 @100) | 1,050 | 1,135 | ||||||
5.750%, 6/15/40 | 3,530 | 3,822 | ||||||
(Pre-refunded 6/15/18 @100) | 1,060 | 1,147 | ||||||
New York City Transitional Finance Authority, Subordinate Future Tax Secured Revenue | 3,165 | 3,871 | ||||||
New York Municipal Bond Bank Agency, Special School Purpose Revenue, | 1,995 | 2,308 | ||||||
New York State Dormitory Authority, | ||||||||
New York University Hospitals Center Revenue, (Pre-refunded 1/1/17 @100) | 150 | 182 | ||||||
Orange Regional Medical Center Revenue, | 300 | 350 | ||||||
New York Transportation Development Corp., Transportation Development Revenue, | 250 | 277 | ||||||
Triborough Bridge & Tunnel Authority, Toll Revenue Surbordinate Lien, | 750 | 920 | ||||||
| PAR VALUE | VALUE | |||||||
| New York—continued | ||||||||
Utility Debt Securitization Authority Restructuring Charge, Electric Revenue, | $ | 500 | $ | 625 | ||||
|
| |||||||
| 23,455 | ||||||||
|
| |||||||
| North Dakota—0.7% | ||||||||
Barnes County North Public School District Building Authority, Lease Revenue, | 1,330 | 1,408 | ||||||
|
| |||||||
| Ohio—2.3% | ||||||||
New Albany Community Authority, Community Facilities Revenue | 1,250 | 1,487 | ||||||
Ohio State Juvenile Correction Facilities Project, Lease Revenue, | ||||||||
5.000%, 10/1/20 | 465 | 535 | ||||||
5.000%, 10/1/21 | 1,080 | 1,277 | ||||||
5.000%, 10/1/22 | 1,135 | 1,376 | ||||||
|
| |||||||
| 4,675 | ||||||||
|
| |||||||
| Oklahoma—0.7% | ||||||||
Oklahoma State Turnpike Authority, Turnpike Revenue, Second Senior Lien, | 1,250 | 1,444 | ||||||
|
| |||||||
| Oregon—0.8% | ||||||||
Oregon Facilities Authority, University of Portland Revenue, | 240 | 290 | ||||||
Oregon, State of, General Obligation, | 1,095 | 1,372 | ||||||
|
| |||||||
| 1,662 | ||||||||
|
| |||||||
| Pennsylvania—3.6% | ||||||||
Butler County Hospital Authority, Butler Health System Revenue, (Pre-refunded 01/01/17 @100) | 250 | 298 | ||||||
Pennsylvania Turnpike Commission Authority, Turnpike Revenue Surbordinate Lien, | ||||||||
5.250%, 12/1/31 | 2,000 | 2,333 | ||||||
6.000%, 12/1/34 | 1,500 | 1,768 | ||||||
(Pre-refunded 12/1/20 @100) | 250 | 300 | ||||||
0.000%, 12/1/38 | 2,000 | 2,481 | ||||||
|
| |||||||
| 7,180 | ||||||||
|
| |||||||
See Notes to Financial Statements
76
Table of Contents
VIRTUS TAX-EXEMPT BOND FUND
SCHEDULE OF INVESTMENTS (Continued)
SEPTEMBER 30, 2016
($ reported in thousands)
| PAR VALUE | VALUE | |||||||
| South Carolina—0.8% | ||||||||
Dorchester County, Waterworks & Sewer Revenue, | $ | 1,020 | $ | 1,223 | ||||
South Carolina Association of Governmental Organizations Educational Facilities Corp., for Pickens School District Lease Revenue, (Pre-refunded 12/1/16 @100) | 250 | 307 | ||||||
|
| |||||||
| 1,530 | ||||||||
|
| |||||||
| Tennessee—1.1% | ||||||||
Chattanooga-Hamilton County Hospital Authority, Erlanger Health System Revenue, | 1,000 | 1,208 | ||||||
Tennessee Housing Development Agency, Residential Finance Program Revenue, | ||||||||
2.050%, 7/1/20 | 675 | 687 | ||||||
2.300%, 1/1/21 | 395 | 405 | ||||||
|
| |||||||
| 2,300 | ||||||||
|
| |||||||
| Texas—12.3% | ||||||||
Dallas Independent School District General Obligation, (PSF Guaranteed) (Pre-refunded 2/15/18 @100) | 1,850 | 1,959 | ||||||
Forney Independent School District, General Obligation, | ||||||||
(PSF Guaranteed) (Pre-refunded 8/15/18 @100) | 750 | 817 | ||||||
(PSF Guaranteed) (Pre-refunded 8/15/18 @100) | 2,000 | 2,188 | ||||||
Harris County Health Facilities Development Corp., Memorial Hermann Healthcare System, (Pre-refunded 12/1/18 @100) | 2,525 | 2,866 | ||||||
Hidalgo County Drain District No 1, General Obligation, (Pre-refunded 3/1/17 @100) | 1,000 | 1,238 | ||||||
La Joya Independent School District, General Obligation, (PSF Guaranteed), | 1,000 | 1,129 | ||||||
North Texas Tollway Authority, Senior Lien Toll Revenue, (Pre-refunded 1/1/17 @100) | 400 | 493 | ||||||
| PAR VALUE | VALUE | |||||||
| Texas—continued | ||||||||
Southmost Regional Water Authority, Desalination Plant Project Revenue, | ||||||||
(AGM Insured), | $ | 1,015 | $ | 1,202 | ||||
(AGM Insured), | 1,085 | 1,287 | ||||||
Texas Municipal Gas Acquisition & Supply, Gas Supply Revenue, | ||||||||
Corp. I, Senior. Lien, | 1,580 | 2,001 | ||||||
Corp. II, | 3,000 | 2,811 | ||||||
Texas Transportation Commission, General Obligation, | 3,250 | 3,916 | ||||||
Upper Trinity Regional Water District Authority, Regional Treated Supply System Revenue (BAM Insured), | 1,340 | 1,646 | ||||||
Ysleta Independent School District, General Obligation, (PSF Guaranteed), | 1,140 | 1,298 | ||||||
|
| |||||||
| 24,851 | ||||||||
|
| |||||||
| Utah—0.2% | ||||||||
Utah Transit Authority, Sales Tax Revenue, | 250 | 316 | ||||||
|
| |||||||
| Vermont—0.3% | ||||||||
Burlington, City of, Airport Revenue, (AGM Insured), | 200 | 232 | ||||||
Vermont Educational & Health Buildings Financing Agency, University of Vermont Health Network Revenue, (Pre-refunded 12/1/16 @100) | 300 | 357 | ||||||
|
| |||||||
| 589 | ||||||||
|
| |||||||
| Virginia—1.2% | ||||||||
Riverside Regional Jail Authority, Jail Facility Revenue, (Pre-refunded 1/1/17 @100) | 1,250 | 1,571 | ||||||
Virginia College Building Authority, | ||||||||
Marymount University Revenue, | 200 | 218 | ||||||
Marymount University Revenue, | 400 | 442 | ||||||
| PAR VALUE | VALUE | |||||||
| Virginia—continued | ||||||||
Marymount University Revenue, | $ | 195 | $ | 218 | ||||
|
| |||||||
| 2,449 | ||||||||
|
| |||||||
| Washington—1.9% | ||||||||
County of King WA Sewer Revenue (Pre-refunded 7/1/26 @ 100) Series B | 1,630 | 1,999 | ||||||
Washington, State of, General Obligation (Pre-refunded 01/01/17 @100) | 1,375 | 1,757 | ||||||
|
| |||||||
| 3,756 | ||||||||
|
| |||||||
| West Virginia—0.2% | ||||||||
Monongalia County Building Commission, Monongalia Health System Revenue, | 400 | 478 | ||||||
|
| |||||||
| Wisconsin—1.8% | ||||||||
Public Finance Authority, Waste Management, Inc. Revenue, | 250 | 258 | ||||||
Wisconsin, State of, General Obligation, | 1,910 | 2,245 | ||||||
Public Finance Authority, Renown Regional Medical Center Revenue | 1,000 | 1,187 | ||||||
|
| |||||||
| 3,690 | ||||||||
| TOTAL MUNICIPAL BONDS (Identified Cost $183,303) | 196,673 | |||||||
| TOTAL LONG TERM INVESTMENTS—97.7% | ||||||||
| (Identified Cost $183,303) | 196,673 | |||||||
| SHARES | ||||||||
| SHORT-TERM INVESTMENT—2.2% | ||||||||
| Money Market Mutual Fund—2.2% | ||||||||
BlackRock Liquidity Funds MuniCash Portfolio – Institutional Shares (seven-day effective yield 0.590%)(5) | 4,354,946 | 4,355 | ||||||
| TOTAL SHORT-TERM INVESTMENT (Identified Cost $4,355) | 4,355 | |||||||
| TOTAL INVESTMENTS—99.9% (Identified Cost $187,658) | 201,028 | (1) | ||||||
Other assets and liabilities, net—0.1% |
| 195 | ||||||
|
| |||||||
| NET ASSETS—100.0% | $ | 201,223 | ||||||
|
| |||||||
See Notes to Financial Statements
77
Table of Contents
VIRTUS TAX-EXEMPT BOND FUND
SCHEDULE OF INVESTMENTS (Continued)
SEPTEMBER 30, 2016
($ reported in thousands)
Abbreviations:
| AGC | Assured Guaranty Corp. |
| AGM | Assured Guaranty Municipal Corp. |
| AMBAC | American Municipal Bond Assurance Corp. |
| BAM | Build America Municipal Insured. |
| NATL | National Public Finance Guarantee Corp. |
| PSF | Permanent School Fund |
| XLCA | XL Capital Assurance |
Footnote Legend:
| (1) | Federal Income Tax Information: For tax information at September 30, 2016, see Note 10 Federal Income Tax Information in the Notes to Financial Statements. |
| (2) | Variable or step coupon security; interest rate shown reflects the rate in effect at September 30, 2016. |
| (3) | At September 30, 2016, 21.0% of the securities in the portfolio are backed by insurance of financial institutions and financial guaranty assurance agencies. None of the Insurers concentration exceeds 10% of the Fund’s net assets. |
| (4) | Security exempt from registration under Rule 144A of the Securities Act of 1933. These securities may be resold in transactions exempt from registration, normally to qualified institutional buyers. At September 30, 2016, these securities amounted to a value of $1,228 0.6% of net assets. |
| (5) | Shares of this fund are publicly offered and its prospectus and annual report are publicly available. |
The following table provides a summary of inputs used to value the Fund’s investments as of September 30, 2016 (See Security Valuation Note 2A in the Notes to Financial Statements):
| Total Value at September 30, 2016 | Level 1 Quoted Prices | Level 2 Significant Observable Inputs | ||||||||||
Debt Securities: | ||||||||||||
Municipal Bonds | $ | 196,673 | $ | — | $ | 196,673 | ||||||
Equity Securities: | ||||||||||||
Short-Term Investment | 4,355 | 4,355 | — | |||||||||
|
|
|
|
|
| |||||||
Total Investments | $ | 201,028 | $ | 4,355 | $ | 196,673 | ||||||
|
|
|
|
|
| |||||||
There are no Level 3 (significant unobservable inputs) priced securities.
There were no transfers between Level 1 and Level 2 related to securities held at September 30, 2016.
Security abbreviation definitions are located under the Key Investment Terms starting on page 4.
See Notes to Financial Statements
78
Table of Contents
SEPTEMBER 30, 2016
($ reported in thousands)
| SHARES | VALUE | |||||||
| COMMON STOCKS—99.6% | ||||||||
| Consumer Discretionary—33.6% | ||||||||
Amazon.com, Inc.(2) | 519 | $ | 435 | |||||
AMC Networks, Inc. Class A(2) | 7,978 | 414 | ||||||
American Eagle Outfitters, Inc. | 22,266 | 398 | ||||||
AutoNation, Inc.(2) | 8,611 | 419 | ||||||
Buckle, Inc. (The) | 16,885 | 406 | ||||||
Cabela’s, Inc.(2) | 8,184 | 450 | ||||||
Carnival Corp. | 8,950 | 437 | ||||||
CBS Corp. Class B | 8,185 | 448 | ||||||
Choice Hotels International, Inc. | 8,791 | 396 | ||||||
Columbia Sportswear Co. | 7,124 | 404 | ||||||
Comcast Corp. Class A | 6,104 | 405 | ||||||
Dick’s Sporting Goods, Inc. | 6,667 | 378 | ||||||
Dillard’s, Inc. Class A | 7,071 | 446 | ||||||
Discovery Communications, Inc. Class C(2) | 17,185 | 452 | ||||||
DISH Network Corp. Class A(2) | 7,701 | 422 | ||||||
DSW, Inc. Class A | 19,098 | 391 | ||||||
Expedia, Inc. | 3,799 | 443 | ||||||
Federal-Mogul Corp.(2) | 42,673 | 410 | ||||||
Fossil Group, Inc.(2) | 14,048 | 390 | ||||||
Gap, Inc. (The) | 18,237 | 406 | ||||||
Garmin Ltd. | 8,460 | 407 | ||||||
Horton (D.R.), Inc. | 13,531 | 409 | ||||||
Hyatt Hotels Corp. Class A(2) | 8,066 | 397 | ||||||
International Speedway Corp. Class A | 12,440 | 416 | ||||||
L Brands, Inc. | 5,626 | 398 | ||||||
Lands’ End, Inc.(2)(3) | 22,769 | 330 | ||||||
Las Vegas Sands Corp. | 7,215 | 415 | ||||||
Lennar Corp. Class A | 9,410 | 398 | ||||||
Liberty Braves Group Class C(2) | 23,632 | 411 | ||||||
Liberty Broadband Corp. Class C(2) | 5,697 | 407 | ||||||
Liberty Global plc Class C(2) | 12,636 | 418 | ||||||
Liberty Global plc Class C(2) | 14,133 | 396 | ||||||
Liberty Interactive Corp. Class A(2) | 22,088 | 442 | ||||||
Liberty Media Series Class C(2) | 14,005 | 394 | ||||||
Liberty Sirius XM Group Class C(2) | 12,332 | 412 | ||||||
Liberty Tripadvisor Holdings, Class A(2) | 19,765 | 432 | ||||||
Liberty Ventures Class A(2) | 10,633 | 424 | ||||||
Lions Gate Entertainment Corp. | 19,575 | 391 | ||||||
Madison Square Garden Co. (The) Class A(2) | 2,359 | 400 | ||||||
Marriott International, Inc. Class A | 5,844 | 394 | ||||||
Marriott Vacations Worldwide Corp. | 5,500 | 403 | ||||||
Mohawk Industries, Inc.(2) | 1,986 | 398 | ||||||
MSG Networks, Inc. Class A(2) | 22,537 | 419 | ||||||
News Corp. Class A | 29,418 | 411 | ||||||
NIKE, Inc. Class B | 7,393 | 389 | ||||||
Nordstrom, Inc.(3) | 8,033 | 417 | ||||||
Papa John’s International, Inc. | 5,230 | 412 | ||||||
Penn National Gaming, Inc.(2) | 31,806 | 432 | ||||||
Penske Automotive Group, Inc. | 8,504 | 410 | ||||||
Ralph Lauren Corp. | 4,134 | 418 | ||||||
Restaurant Brands International, Inc. | 8,910 | 397 | ||||||
Sears Holdings Corp.(2) | 34,914 | 400 | ||||||
Sears Hometown and Outlet Stores, Inc.(2) | 78,874 | 389 | ||||||
Starbucks Corp. | 7,586 | 411 | ||||||
Starz – Liberty Capital Class A(2) | 12,985 | 405 | ||||||
Tesla Motors, Inc.(2) | 1,999 | 408 | ||||||
| SHARES | VALUE | |||||||
| Consumer Discretionary—continued | ||||||||
Tronc, Inc. | 24,008 | $ | 405 | |||||
Twenty-First Century Fox, Inc. Class A | 17,085 | 414 | ||||||
Under Armour, Inc. Class C(2) | 11,932 | 404 | ||||||
Urban Outfitters, Inc.(2) | 11,472 | 396 | ||||||
Viacom, Inc. Class B | 11,374 | 433 | ||||||
Weight Watchers International, Inc.(2) | 39,273 | 405 | ||||||
Wendy’s Co. (The) | 38,632 | 417 | ||||||
Wynn Resorts Ltd. | 3,980 | 388 | ||||||
|
| |||||||
| 26,222 | ||||||||
|
| |||||||
| Consumer Staples—5.3% | ||||||||
Boston Beer Co., Inc. (The) Class A(2) | 2,714 | 421 | ||||||
Brown-Forman Corp. Class B | 8,726 | 414 | ||||||
Estee Lauder Cos., Inc. (The) Class A | 4,648 | 412 | ||||||
HRG Group, Inc.(2) | 26,702 | 419 | ||||||
Kraft Heinz Co.(The) | 4,665 | 418 | ||||||
Lancaster Colony Corp. | 3,105 | 410 | ||||||
Monster Beverage Corp.(2) | 2,789 | 410 | ||||||
Nomad Foods Ltd.(2) | 34,119 | 403 | ||||||
PriceSmart, Inc. | 4,960 | 415 | ||||||
Tootsie Roll Industries, Inc. | 10,905 | 402 | ||||||
|
| |||||||
| 4,124 | ||||||||
|
| |||||||
| Energy—7.1% | ||||||||
Archrock, Inc. | 34,858 | 456 | ||||||
Cheniere Energy, Inc.(2) | 9,262 | 404 | ||||||
Chesapeake Energy Corp.(2) | 60,838 | 381 | ||||||
Clayton Williams Energy, | 4,912 | 420 | ||||||
Continental Resources, Inc.(2) | 8,657 | 450 | ||||||
CVR Energy, Inc. | 27,421 | 378 | ||||||
Exterran Corp.(2) | 29,034 | 455 | ||||||
Hess Corp. | 8,724 | 468 | ||||||
Par Petroleum Corp.(2) | 30,374 | 397 | ||||||
RPC, Inc.(2) | 26,560 | 446 | ||||||
Transocean Ltd.(2)(3) | 44,770 | 477 | ||||||
W&T Offshore, Inc.(2) | 256,321 | 451 | ||||||
Western Refining, Inc. | 14,541 | 385 | ||||||
|
| |||||||
| 5,568 | ||||||||
|
| |||||||
| Financials—14.3% | ||||||||
Altisource Portfolio Solutions SA(2) | 13,025 | 422 | ||||||
American Financial Group, Inc. | 5,426 | 407 | ||||||
AmTrust Financial Services, Inc. | 15,443 | 414 | ||||||
Berkley (W.R.) Corp. | 7,059 | 408 | ||||||
Berkshire Hathaway, Inc. Class B(2) | 2,799 | 404 | ||||||
BOK Financial Corp. | 6,121 | 422 | ||||||
Brown & Brown, Inc. | 10,898 | 411 | ||||||
Charles Schwab Corp. (The) | 13,168 | 416 | ||||||
Cohen & Steers, Inc. | 9,730 | 416 | ||||||
Colony Capital, Inc. Class A | 22,148 | 404 | ||||||
Credit Acceptance Corp.(2) | 2,070 | 416 | ||||||
Erie Indemnity Co. Class A | 4,079 | 416 | ||||||
First Citizens BancShares, Inc. Class A | 1,470 | 432 | ||||||
Franklin Resources, Inc. | 11,473 | 408 | ||||||
Gaming and Leisure Properties, Inc. | 12,233 | 409 | ||||||
| SHARES | VALUE | |||||||
| Financials—continued | ||||||||
Greenlight Capital Re Ltd. Class A(2) | 20,291 | $ | 415 | |||||
Hilltop Holdings, Inc.(2) | 18,586 | 417 | ||||||
Leucadia National Corp. | 21,424 | 408 | ||||||
Loews Corp. | 10,026 | 413 | ||||||
Mercury General Corp. | 7,425 | 407 | ||||||
Morningstar, Inc. | 5,154 | 409 | ||||||
National General Holdings Corp. | 18,620 | 414 | ||||||
Ocwen Financial Corp.(2) | 115,090 | 422 | ||||||
PJT Partners, Inc. Class A | 16,154 | 441 | ||||||
Raymond James Financial, Inc. | 7,095 | 413 | ||||||
Third Point Reinsurance Ltd.(2) | 33,815 | 406 | ||||||
WisdomTree Investments, Inc. | 39,446 | 406 | ||||||
|
| |||||||
| 11,176 | ||||||||
|
| |||||||
| Health Care—3.7% | ||||||||
Akorn, Inc.(2) | 14,766 | 402 | ||||||
Bruker Corp. | 18,350 | 416 | ||||||
Cerner Corp.(2) | 6,577 | 406 | ||||||
Danaher Corp. | 5,295 | 415 | ||||||
Halozyme Therapeutics, Inc.(2) | 32,970 | 398 | ||||||
Intrexon Corp.(2)(3) | 14,592 | 409 | ||||||
OPKO Health, Inc.(2)(3) | 38,329 | 406 | ||||||
|
| |||||||
| 2,852 | ||||||||
|
| |||||||
| Industrials—11.7% | ||||||||
Air Lease Corp. | 14,949 | 427 | ||||||
American Railcar Industries, Inc. | 10,388 | 431 | ||||||
Cintas Corp. | 3,571 | 402 | ||||||
Colfax Corp.(2) | 14,192 | 446 | ||||||
Covanta Holding Corp. | 27,680 | 426 | ||||||
FedEx Corp. | 2,357 | 412 | ||||||
Fortive Corp. | 8,031 | 409 | ||||||
Heartland Express, Inc. | 21,789 | 411 | ||||||
Herc Holdings, Inc.(2) | 12,473 | 420 | ||||||
Hertz Global Holdings, Inc.(2) | 8,702 | 349 | ||||||
Manitowoc Co., Inc. (The) | 91,545 | 438 | ||||||
Manitowoc Foodservice, Inc.(2) | 24,229 | 393 | ||||||
MasTec, Inc.(2) | 14,533 | 432 | ||||||
MSC Industrial Direct Co., Inc. Class A | 5,745 | 422 | ||||||
Navistar International | 18,262 | 418 | ||||||
Rollins, Inc. | 14,161 | 415 | ||||||
Seaspan Corp. | 29,929 | 399 | ||||||
Solarcity Corp.(2)(3) | 22,447 | 439 | ||||||
Timken Co. (The) | 12,451 | 438 | ||||||
W.W. Grainger, Inc. | 1,873 | 421 | ||||||
Werner Enterprises, Inc. | 17,555 | 409 | ||||||
XPO Logistics, Inc.(2) | 11,495 | 422 | ||||||
|
| |||||||
| 9,179 | ||||||||
|
| |||||||
| Information Technology—11.7% | ||||||||
Alphabet, Inc. Class C(2) | 528 | 411 | ||||||
Amkor Technology, Inc.(2) | 44,532 | 433 | ||||||
Anixter International, Inc.(2) | 6,814 | 440 | ||||||
CommerceHub, Inc. | 27,234 | 433 | ||||||
eBay, Inc.(2) | 12,816 | 422 | ||||||
EchoStar Corp. Class A(2) | 10,222 | 448 | ||||||
Facebook, Inc. Class A(2) | 3,152 | 404 | ||||||
IAC/InterActiveCorp. | 6,663 | 416 | ||||||
Intuit, Inc. | 3,703 | 407 | ||||||
Marvell Technology Group Ltd. | 31,737 | 421 | ||||||
See Notes to Financial Statements
79
Table of Contents
VIRTUS WEALTH MASTERS FUND
SCHEDULE OF INVESTMENTS (Continued)
SEPTEMBER 30, 2016
($ reported in thousands)
| SHARES | VALUE | |||||||
| Information Technology—continued | ||||||||
National Instruments Corp. | 14,721 | $ | 418 | |||||
Oracle Corp. | 10,370 | 407 | ||||||
Paychex, Inc. | 6,869 | 398 | ||||||
PayPal Holdings, Inc.(2) | 10,182 | 417 | ||||||
Pegasystems, Inc. | 14,204 | 419 | ||||||
Rackspace Hosting, Inc.(2) | 13,010 | �� | 412 | |||||
RealPage, Inc.(2) | 15,954 | 410 | ||||||
salesforce.com, Inc.(2) | 5,529 | 395 | ||||||
SS&C Technologies Holdings, Inc. | 12,668 | 407 | ||||||
Syntel, Inc. | 9,503 | 398 | ||||||
TeleTech Holdings, Inc. | 14,136 | 410 | ||||||
Yahoo!, Inc.(2) | 9,284 | 400 | ||||||
|
| |||||||
| 9,126 | ||||||||
|
| |||||||
| Materials—5.4% | ||||||||
Freeport-McMoRan Copper & Gold, Inc. | 38,831 | 421 | ||||||
Huntsman Corp. | 26,176 | 426 | ||||||
LyondellBasell Industries N.V. Class A | 5,242 | 423 | ||||||
NewMarket Corp. | 985 | 423 | ||||||
Novagold Resources, Inc.(2) | 71,383 | 400 | ||||||
Platform Specialty Products Corp.(2) | 47,475 | 385 | ||||||
Scotts Miracle-Gro Co. (The) Class A | 5,043 | 420 | ||||||
Silgan Holdings, Inc. | 8,284 | 419 | ||||||
Timkensteel Corp.(2) | 45,027 | 470 | ||||||
| SHARES | VALUE | |||||||
| Materials—continued | ||||||||
Westlake Chemical Corp. | 8,128 | $ | 435 | |||||
|
| |||||||
| 4,222 | ||||||||
|
| |||||||
| Real Estate—6.8% | ||||||||
American Homes 4 Rent Class A | 19,045 | 412 | ||||||
Boston Properties, Inc. | 2,989 | 407 | ||||||
Equity Lifestyle Properties, Inc. | 5,228 | 404 | ||||||
Equity Residential | 6,506 | 419 | ||||||
Host Hotels & Resorts, Inc. | 25,638 | 399 | ||||||
Howard Hughes Corp. (The)(2) | 3,551 | 407 | ||||||
Marcus & Millichap, Inc.(2) | 16,363 | 428 | ||||||
Seritage Growth Properties Class A | 8,251 | 418 | ||||||
Simon Property Group, Inc. | 1,944 | 402 | ||||||
Taubman Centers, Inc. | 5,538 | 412 | ||||||
Urban Edge Properties | 14,667 | 413 | ||||||
Vornado Realty Trust | 4,036 | 408 | ||||||
Washington Prime Group, Inc. | 33,880 | 419 | ||||||
|
| |||||||
| 5,348 | ||||||||
| TOTAL COMMON STOCKS (Identified Cost $66,649) | 77,817 | |||||||
| TOTAL LONG TERM INVESTMENTS—99.6% | ||||||||
| (Identified Cost $66,649) | 77,817 | |||||||
| SHARES | VALUE | |||||||
| SECURITIES LENDING COLLATERAL—4.0% | ||||||||
INVESCO Trust Short-Term Investments Liquid Assets Portfolio (The) – Institutional Shares (seven-day effective | 3,131,575 | $ | 3,132 | |||||
| TOTAL SECURITIES LENDING COLLATERAL (Identified Cost $3,132) | 3,132 | |||||||
| TOTAL INVESTMENTS—103.6% (Identified Cost $69,781) | 80,949 | (1) | ||||||
Other assets and liabilities, net—(3.6)% |
| (2,795 | ) | |||||
|
| |||||||
| NET ASSETS—100.0% | $ | 78,154 | ||||||
|
| |||||||
Abbreviations:
Footnote Legend:
| (1) | Federal Income Tax Information: For tax information at September 30, 2016, see Note 10 Federal Income Tax Information in the Notes to Financial Statements. |
| (2) | Non-income producing. |
| (3) | All or a portion of security is on loan. |
| (4) | Represents security purchased with cash collateral received for securities on loan. |
| (5) | Shares of this fund are publicly offered and its prospectus and annual report are publicly available. |
The following table provides a summary of inputs used to value the Fund’s investments as of September 30, 2016 (See Security Valuation Note 2A in the Notes to Financial Statements):
| Total Value at September 30, 2016 | Level 1 Quoted Prices | |||||||
Equity Securities: | ||||||||
Common Stocks | $ | 77,817 | $ | 77,817 | ||||
Securities Lending Collateral | 3,132 | 3,132 | ||||||
|
|
|
| |||||
Total Investments | $ | 80,949 | $ | 80,949 | ||||
|
|
|
| |||||
There are no Level 2 (significant observable inputs) or Level 3 (significant unobservable inputs) priced securities.
There were no transfers between Level 1 and Level 2 related to securities held as of September 30, 2016.
Security abbreviation definitions are located under the Key Investment Terms starting on page 4.
See Notes to Financial Statements
80
Table of Contents
VIRTUS OPPORTUNITIES TRUST
STATEMENTS OF ASSETS AND LIABILITIES
SEPTEMBER 30, 2016
(Reported in thousands except shares and per share amounts)
|
|
|
|
|
| |||||||
| Bond Fund | CA Tax-Exempt Bond | Essential Resources Fund | ||||||||||
| Assets | ||||||||||||
Investment in unaffiliated securities at value(1) | $ | 75,965 | $ | 30,200 | $ | 4,728 | ||||||
Investments in affiliated securities at value(2) | 1,159 | — | — | |||||||||
Foreign currency at value(3) | — | — | 8 | |||||||||
Cash | — | 603 | 73 | |||||||||
Receivables | ||||||||||||
Investment securities sold | 1,537 | — | 30 | |||||||||
Fund shares sold | 143 | — | (5) | — | (5) | |||||||
Receivable from adviser | — | 2 | — | |||||||||
Dividends and interest receivable | 616 | 384 | 6 | |||||||||
Tax reclaims | — | — | 2 | |||||||||
Prepaid expenses | 26 | 15 | 17 | |||||||||
Prepaid trustee retainer | 2 | 1 | — | (5) | ||||||||
Other assets | 1 | — | (5) | — | (5) | |||||||
|
|
|
|
|
| |||||||
Total assets | 79,449 | 31,205 | 4,864 | |||||||||
|
|
|
|
|
| |||||||
| Liabilities | ||||||||||||
Cash overdraft | 53 | — | — | |||||||||
Payables | ||||||||||||
Fund shares repurchased | 188 | 37 | — | |||||||||
Investment securities purchased | 1,255 | — | 33 | |||||||||
Dividend distributions | 10 | 7 | — | |||||||||
Investment advisory fees | 6 | — | — | (5) | ||||||||
Distribution and service fees | 17 | 4 | — | (5) | ||||||||
Administration fees | 8 | 4 | — | (5) | ||||||||
Transfer agent fees and expenses | 18 | 4 | — | (5) | ||||||||
Trustees’ fees and expenses | 1 | — | (5) | — | (5) | |||||||
Professional fees | 31 | 34 | 29 | |||||||||
Trustee deferred compensation plan | 1 | — | (5) | — | (5) | |||||||
Other accrued expenses | 6 | 2 | 7 | |||||||||
|
|
|
|
|
| |||||||
Total liabilities | 1,594 | 92 | 69 | |||||||||
|
|
|
|
|
| |||||||
| Net Assets | $ | 77,855 | $ | 31,113 | $ | 4,795 | ||||||
|
|
|
|
|
| |||||||
| Net Assets Consist of: | ||||||||||||
Capital paid in on shares of beneficial interest | $ | 80,361 | $ | 28,754 | $ | 5,248 | ||||||
Accumulated undistributed net investment income (loss) | 108 | 48 | 28 | |||||||||
Accumulated undistributed net realized gain (loss) | (4,984 | ) | 161 | (554 | ) | |||||||
Net unrealized appreciation (depreciation) on investments | 2,370 | 2,150 | 73 | |||||||||
|
|
|
|
|
| |||||||
| Net Assets | $ | 77,855 | $ | 31,113 | $ | 4,795 | ||||||
|
|
|
|
|
| |||||||
| Class A | ||||||||||||
Net asset value (net assets/shares outstanding) per share | $ | 11.38 | $ | 12.17 | $ | 9.03 | ||||||
Maximum offering price per share NAV/(1–2.75%) | $ | — | $ | 12.51 | $ | — | ||||||
Maximum offering price per share NAV/(1–3.75%) | $ | 11.82 | $ | — | $ | — | ||||||
Maximum offering price per share NAV/(1–5.75%) | $ | — | $ | — | $ | 9.58 | ||||||
Shares of beneficial interest outstanding, par value(4), unlimited authorization | 3,879,743 | 1,598,894 | 18,688 | |||||||||
Net Assets | $ | 44,136 | $ | 19,464 | $ | 169 | ||||||
| Class B | ||||||||||||
Net asset value (net assets/shares outstanding) and offering price per share | $ | 11.07 | $ | — | $ | — | ||||||
Shares of beneficial interest outstanding, par value(4), unlimited authorization | 6,700 | — | — | |||||||||
Net Assets | $ | 74 | $ | — | $ | — | ||||||
| Class C | ||||||||||||
Net asset value (net assets/shares outstanding) and offering price per share | $ | 11.12 | $ | — | $ | 8.97 | ||||||
Shares of beneficial interest outstanding, par value(4), unlimited authorization | 846,175 | — | 13,278 | |||||||||
Net Assets | $ | 9,409 | $ | — | $ | 119 | ||||||
| Class I | ||||||||||||
Net asset value (net assets/shares outstanding) and offering price per share | $ | 11.56 | $ | 12.15 | $ | 9.05 | ||||||
Shares of beneficial interest outstanding, par value(4), unlimited authorization | 2,097,261 | 959,075 | 497,968 | |||||||||
Net Assets | $ | 24,236 | $ | 11,649 | $ | 4,507 | ||||||
(1) Investment in unaffiliated securities at cost | $ | 73,575 | $ | 28,050 | $ | 4,654 | ||||||
(2) Investment in affiliated securities at cost | $ | 1,179 | $ | — | $ | — | ||||||
(3) Foreign currency at cost | $ | — | $ | — | $ | 8 | ||||||
(4) All Funds with the exception of the Bond Fund have no par value. Bond Fund has a par value of $1.00. | ||||||||||||
(5) Amount is less than $500. | ||||||||||||
See Notes to Financial Statements
81
Table of Contents
VIRTUS OPPORTUNITIES TRUST
STATEMENTS OF ASSETS AND LIABILITIES (Continued)
SEPTEMBER 30, 2016
(Reported in thousands except shares and per share amounts)
|
|
|
|
|
| |||||||
| High Yield Fund | Low Duration Income Fund | Low Volatility Equity Fund | ||||||||||
| Assets | ||||||||||||
Investment in unaffiliated securities at value(1) | $ | 74,558 | $ | 398,813 | $ | 3,692 | ||||||
Investments in affiliated securities at value(2) | 352 | — | — | |||||||||
Cash | 1,560 | 56 | 42 | |||||||||
Deposits with prime broker | — | — | — | (5) | ||||||||
Receivables | ||||||||||||
Investment securities sold | 594 | 3,748 | — | |||||||||
Fund shares sold | 50 | 2,383 | — | |||||||||
Receivable from adviser | — | — | 6 | |||||||||
Dividends and interest receivable | 1,133 | 1,507 | — | |||||||||
Tax reclaims | — | — | — | |||||||||
Prepaid expenses | 28 | 39 | 19 | |||||||||
Prepaid trustee retainer | 2 | 5 | — | (5) | ||||||||
Other assets | 1 | 5 | — | (5) | ||||||||
|
|
|
|
|
| |||||||
Total assets | 78,278 | 406,556 | 3,759 | |||||||||
|
|
|
|
|
| |||||||
| Liabilities | ||||||||||||
Written options(3) | — | — | 2 | |||||||||
Payables | ||||||||||||
Fund shares repurchased | 63 | 2,035 | 4 | |||||||||
Investment securities purchased | 1,526 | 3,854 | — | |||||||||
Foreign capital gain taxes payable | — | — | (5) | — | ||||||||
Dividend distributions | 27 | 85 | — | |||||||||
Investment advisory fees | 24 | 46 | — | |||||||||
Distribution and service fees | 16 | 59 | 1 | |||||||||
Administration fees | 8 | 40 | 1 | |||||||||
Transfer agent fees and expenses | 22 | 59 | 1 | |||||||||
Trustees’ fees and expenses | 1 | 5 | — | (5) | ||||||||
Professional fees | 37 | 33 | 19 | |||||||||
Trustee deferred compensation plan | 1 | 5 | — | (5) | ||||||||
Other accrued expenses | 4 | 14 | 1 | |||||||||
|
|
|
|
|
| |||||||
Total liabilities | 1,729 | 6,235 | 29 | |||||||||
|
|
|
|
|
| |||||||
| Net Assets | $ | 76,549 | $ | 400,321 | $ | 3,730 | ||||||
|
|
|
|
|
| |||||||
| Net Assets Consist of: | ||||||||||||
Common stock $0.001 par value | $ | — | $ | 37 | $ | — | ||||||
Capital paid in on shares of beneficial interest | 102,896 | 397,907 | 3,648 | |||||||||
Accumulated undistributed net investment income (loss) | (39 | ) | 242 | 17 | ||||||||
Accumulated undistributed net realized gain (loss) | (26,231 | ) | (1,975 | ) | (553 | ) | ||||||
Net unrealized appreciation (depreciation) on investments | (77 | ) | 4,110 | 618 | ||||||||
|
|
|
|
|
| |||||||
| Net Assets | $ | 76,549 | $ | 400,321 | $ | 3,730 | ||||||
|
|
|
|
|
| |||||||
| Class A | ||||||||||||
Net asset value (net assets/shares outstanding) per share | $ | 4.18 | $ | 10.90 | $ | 11.57 | ||||||
Maximum offering price per share NAV/(1–2.25%) | $ | — | $ | 11.15 | $ | — | ||||||
Maximum offering price per share NAV/(1–3.75%) | $ | 4.34 | $ | — | $ | — | ||||||
Maximum offering price per share NAV/(1–5.75%) | $ | — | $ | — | $ | 12.28 | ||||||
Shares of beneficial interest outstanding, par value(4), unlimited authorization | 15,406,934 | 9,361,292 | 141,101 | |||||||||
Net Assets | $ | 64,338 | $ | 102,049 | $ | 1,633 | ||||||
| Class B | ||||||||||||
Net asset value (net assets/shares outstanding) and offering price per share | $ | 4.06 | $ | — | $ | — | ||||||
Shares of beneficial interest outstanding, par value(4), unlimited authorization | 6,410 | — | — | |||||||||
Net Assets | $ | 26 | $ | — | $ | — | ||||||
| Class C | ||||||||||||
Net asset value (net assets/shares outstanding) and offering price per share | $ | 4.11 | $ | 10.90 | $ | 11.39 | ||||||
Shares of beneficial interest outstanding, par value(4), unlimited authorization | 1,030,260 | 4,278,336 | 43,110 | |||||||||
Net Assets | $ | 4,231 | $ | 46,642 | $ | 491 | ||||||
| Class I | ||||||||||||
Net asset value (net assets/shares outstanding) and offering price per share | $ | 4.18 | $ | 10.90 | $ | 11.63 | ||||||
Shares of beneficial interest outstanding, par value(4), unlimited authorization | 1,902,756 | 23,088,910 | 138,084 | |||||||||
Net Assets | $ | 7,954 | $ | 251,630 | $ | 1,606 | ||||||
(1) Investment in unaffiliated securities at cost | $ | 74,630 | $ | 394,703 | $ | 3,075 | ||||||
(2) Investments in affiliated securities at cost | $ | 358 | $ | — | $ | — | ||||||
(3) Written options premiums received | $ | — | $ | — | $ | 4 | ||||||
(4) All of the Funds with the exception of Low Duration Income have no par value. Low Duration Income Fund has a par value of $0.001. | ||||||||||||
(5) Amount is less than $500. | ||||||||||||
See Notes to Financial Statements
82
Table of Contents
VIRTUS OPPORTUNITIES TRUST
STATEMENTS OF ASSETS AND LIABILITIES (Continued)
SEPTEMBER 30, 2016
(Reported in thousands except shares and per share amounts)
|
|
|
|
|
|
|
| |||||||||
| Multi-Sector Intermediate Bond Fund | Senior Floating Rate Fund | Tax-Exempt Bond Fund | Wealth Masters Fund | |||||||||||||
| Assets | ||||||||||||||||
Investment in unaffiliated securities at value(1)(2) | $ | 291,017 | $ | 581,180 | $ | 201,028 | $ | 80,949 | ||||||||
Investment in affiliated securities at value(3) | 9,186 | 5,999 | — | — | ||||||||||||
Foreign currency at value(4) | — | (6) | — | — | — | |||||||||||
Cash | — | 10,549 | — | — | ||||||||||||
Deposits with prime broker | — | — | — | — | ||||||||||||
Receivables | ||||||||||||||||
Investment securities sold | 4,974 | 7,082 | — | 5,921 | ||||||||||||
Fund shares sold | 688 | 804 | 1,586 | 70 | ||||||||||||
Dividends and interest receivable | 3,663 | 1,839 | 2,429 | 89 | ||||||||||||
Securities lending receivable | — | — | — | 23 | ||||||||||||
Prepaid expenses | 49 | 34 | 22 | 29 | ||||||||||||
Prepaid trustee retainer | 6 | �� | 11 | 3 | 2 | |||||||||||
Other assets | 4 | 7 | 3 | 1 | ||||||||||||
|
|
|
|
|
|
|
| |||||||||
Total assets | 309,587 | 607,505 | 205,071 | 87,084 | ||||||||||||
|
|
|
|
|
|
|
| |||||||||
| Liabilities | ||||||||||||||||
Cash overdraft | 1,324 | — | — | 4 | ||||||||||||
Payables | ||||||||||||||||
Fund shares repurchased | 1,014 | 1,233 | 790 | 226 | ||||||||||||
Investment securities purchased | 5,265 | 25,266 | 2,854 | 5,425 | ||||||||||||
Borrowings (Note 13) | — | 30,000 | — | — | ||||||||||||
Collateral on securities loaned | — | — | — | 3,132 | ||||||||||||
Dividend distributions | 142 | 161 | 21 | — | ||||||||||||
Investment advisory fees | 131 | 267 | 45 | 52 | ||||||||||||
Distribution and service fees | 84 | 139 | 37 | 28 | ||||||||||||
Administration fees | 30 | 55 | 21 | 8 | ||||||||||||
Transfer agent fees and expenses | 60 | 74 | 32 | 19 | ||||||||||||
Trustees’ fees and expenses | 3 | 5 | 2 | 1 | ||||||||||||
Professional fees | 38 | 47 | 33 | 29 | ||||||||||||
Trustee deferred compensation plan | 4 | 7 | 3 | 1 | ||||||||||||
Interest payable on line of credit | — | 2 | — | — | ||||||||||||
Other accrued expenses | 17 | 70 | 10 | 5 | ||||||||||||
|
|
|
|
|
|
|
| |||||||||
Total liabilities | 8,112 | 57,326 | 3,848 | 8,930 | ||||||||||||
|
|
|
|
|
|
|
| |||||||||
| Net Assets | $ | 301,475 | $ | 550,179 | $ | 201,223 | $ | 78,154 | ||||||||
|
|
|
|
|
|
|
| |||||||||
| Net Assets Consist of: | ||||||||||||||||
Capital stock $0.001 par | $ | — | $ | — | $ | 17 | $ | — | ||||||||
Capital paid in on shares of beneficial interest | 315,097 | 585,600 | 187,470 | 76,368 | ||||||||||||
Accumulated undistributed net investment income (loss) | 1,029 | (461 | ) | 109 | 286 | |||||||||||
Accumulated undistributed net realized gain (loss) | (11,530 | ) | (24,224 | ) | 258 | (9,668 | ) | |||||||||
Net unrealized appreciation (depreciation) on investments | (3,121 | ) | (10,736 | ) | 13,369 | 11,168 | ||||||||||
|
|
|
|
|
|
|
| |||||||||
| Net Assets | $ | 301,475 | $ | 550,179 | $ | 201,223 | $ | 78,154 | ||||||||
|
|
|
|
|
|
|
| |||||||||
| Class A | ||||||||||||||||
Net asset value (net assets/shares outstanding) per share | $ | 10.30 | $ | 9.42 | $ | 11.55 | $ | 14.60 | ||||||||
Maximum offering price per share NAV/(1–2.75%) | $ | — | $ | 9.69 | $ | 11.88 | $ | — | ||||||||
Maximum offering price per share NAV/(1–3.75%) | $ | 10.70 | $ | — | $ | — | $ | — | ||||||||
Maximum offering price per share NAV/(1–5.75%) | $ | — | $ | — | $ | — | $ | 15.49 | ||||||||
Shares of beneficial interest outstanding, par value, unlimited authorization | 9,607,763 | 24,154,279 | 6,036,574 | 2,274,099 | ||||||||||||
Net Assets | $ | 98,969 | $ | 227,588 | $ | 69,711 | $ | 33,204 | ||||||||
| Class B | ||||||||||||||||
Net asset value (net assets/shares outstanding) and offering price per share | $ | 10.27 | $ | — | $ | — | $ | — | ||||||||
Shares of beneficial interest outstanding, par value(5), unlimited authorization | 167,259 | — | — | — | ||||||||||||
Net Assets | $ | 1,717 | $ | — | $ | — | $ | — | ||||||||
| Class C | ||||||||||||||||
Net asset value (net assets/shares outstanding) and offering price per share | $ | 10.40 | $ | 9.43 | $ | 11.55 | $ | 14.26 | ||||||||
Shares of beneficial interest outstanding, par value(5), unlimited authorization | 7,247,009 | 11,856,330 | 2,323,161 | 1,739,887 | ||||||||||||
Net Assets | $ | 75,350 | $ | 111,839 | $ | 26,833 | $ | 24,816 | ||||||||
| Class I | ||||||||||||||||
Net asset value (net assets/shares outstanding) and offering price per share | $ | 10.31 | $ | 9.41 | $ | 11.55 | $ | 14.66 | ||||||||
Shares of beneficial interest outstanding, par value(5), unlimited authorization | 11,974,248 | 22,392,942 | 9,064,630 | 1,373,295 | ||||||||||||
Net Assets | $ | 123,435 | $ | 210,752 | $ | 104,679 | $ | 20,134 | ||||||||
| Class R6 | ||||||||||||||||
Net asset value (net assets/shares outstanding) and offering price per share | $ | 10.31 | $ | — | $ | — | $ | — | ||||||||
Shares of beneficial interest outstanding, no par value(5), unlimited authorization | 194,426 | — | — | — | ||||||||||||
Net Assets | $ | 2,004 | $ | — | $ | — | $ | — | ||||||||
(1) Investment in unaffiliated securities at cost | $ | 293,984 | $ | 591,815 | $ | 187,658 | $ | 69,781 | ||||||||
(2) Market value of securities on loan | $ | — | $ | — | $ | — | $ | 3,073 | ||||||||
(3) Investment in affiliated securities at cost | $ | 9,341 | $ | 6,100 | $ | — | $ | — | ||||||||
(4) Foreign currency at cost | $ | — | (6) | $ | — | $ | — | $ | — | |||||||
(5) All of the Funds with the exception of Tax-Exempt Bond Fund have no par value. Tax-Exempt Bond Fund has a par value of $0.001 | ||||||||||||||||
(6) Amount is less than $500. | ||||||||||||||||
See Notes to Financial Statements
83
Table of Contents
VIRTUS OPPORTUNITIES TRUST
($ reported in thousands)
|
|
|
|
|
| |||||||
| Bond Fund | CA Tax-Exempt Bond | Essential Resources Fund | ||||||||||
| Year Ended September 30, 2016 | Year Ended September 30, 2016 | Year Ended September 30, 2016 | ||||||||||
| Investment Income | ||||||||||||
Dividends | $ | 40 | $ | — | $ | 106 | ||||||
Dividends from affiliated funds | 44 | — | — | |||||||||
Interest | 3,087 | 1,217 | — | (1) | ||||||||
Foreign taxes withheld | — | — | (7 | ) | ||||||||
|
|
|
|
|
| |||||||
Total investment income | 3,171 | 1,217 | 99 | |||||||||
|
|
|
|
|
| |||||||
| Expenses | ||||||||||||
Investment advisory fees | 346 | 141 | 49 | |||||||||
Service fees, Class A | 114 | 50 | — | (1) | ||||||||
Distribution and service fees, Class B | 1 | — | — | |||||||||
Distribution and service fees, Class C | 103 | — | 1 | |||||||||
Administration fees | 97 | 40 | 5 | |||||||||
Transfer agent fees and expenses | 125 | 35 | 2 | |||||||||
Registration fees | 63 | 33 | 59 | |||||||||
Printing fees and expenses | 27 | 9 | 2 | |||||||||
Custodian fees | 6 | 1 | 25 | |||||||||
Professional fees | 33 | 37 | 36 | |||||||||
Trustees’ fees and expenses | 8 | 3 | 1 | |||||||||
Miscellaneous expenses | 10 | 4 | 5 | |||||||||
|
|
|
|
|
| |||||||
Total expenses | 933 | 353 | 185 | |||||||||
Less expenses reimbursed and/or waived by investment adviser | (244 | ) | (112 | ) | (121 | ) | ||||||
Earnings credit from custodian | (1 | ) | — | — | (1) | |||||||
Low balance account fees | (2 | ) | — | (1) | — | |||||||
|
|
|
|
|
| |||||||
Net expenses | 686 | 241 | 64 | |||||||||
|
|
|
|
|
| |||||||
Net investment income (loss) | 2,485 | 976 | 35 | |||||||||
|
|
|
|
|
| |||||||
| Net Realized and Unrealized Gain (Loss) on Investments | ||||||||||||
Net realized gain (loss) on unaffiliated investments | (649 | ) | 218 | (525 | ) | |||||||
Net realized gain (loss) on foreign currency transactions | — | (1) | — | (2 | ) | |||||||
Net increase from payment by affiliate(2) | 1 | — | — | |||||||||
Net change in unrealized appreciation (depreciation) on unaffiliated investments | 2,985 | 522 | 1,051 | |||||||||
Net change in unrealized appreciation (depreciation) on affiliated investments | 7 | — | — | |||||||||
Net change in unrealized appreciation (depreciation) on foreign currency translation | — | (1) | — | — | (1) | |||||||
|
|
|
|
|
| |||||||
| Net gain (loss) on investments | 2,344 | 740 | 524 | |||||||||
|
|
|
|
|
| |||||||
Net increase (decrease) in net assets resulting from operations | $ | 4,829 | $ | 1,716 | $ | 559 | ||||||
|
|
|
|
|
| |||||||
(1) Amount is less than $500.
(2) See Note 4I in the Notes to Financial Statements.
See Notes to Financial Statements
84
Table of Contents
VIRTUS OPPORTUNITIES TRUST
STATEMENTS OF OPERATIONS (Continued)
($ reported in thousands)
|
|
|
| |||||||||
| High Yield Fund | Low Duration Income Fund | |||||||||||
| Year Ended September 30, 2016 | Fiscal Period Ended September 30, 2016(3) | Year Ended December 31, 2015 | ||||||||||
| Investment Income | ||||||||||||
Dividends | $ | 149 | $ | 90 | $ | 7 | ||||||
Dividends from affiliated fund | 13 | — | — | |||||||||
Interest | 4,332 | 6,724 | 5,382 | |||||||||
Foreign taxes withheld | — | — | — | |||||||||
|
|
|
|
|
| |||||||
Total investment income | 4,494 | 6,814 | 5,389 | |||||||||
|
|
|
|
|
| |||||||
| Expenses | ||||||||||||
Investment advisory fees | 464 | 1,408 | 1,173 | |||||||||
Service fees, Class A | 150 | 179 | 179 | |||||||||
Distribution and service fees, Class B | — | (1) | — | — | ||||||||
Distribution and service fees, Class C | 36 | 356 | 394 | |||||||||
Distribution fees, Class I | — | — | 15 | |||||||||
Administration fees | 90 | 322 | 260 | |||||||||
Transfer agent fees and expenses | 134 | 290 | 261 | |||||||||
Registration fees | 60 | 58 | 67 | |||||||||
Printing fees and expenses | 21 | 57 | 15 | |||||||||
Custodian fees | 8 | 10 | 8 | |||||||||
Professional fees | 38 | 38 | 37 | |||||||||
Trustees’ fees and expenses | 7 | 24 | 10 | |||||||||
Miscellaneous expenses | 11 | 21 | 18 | |||||||||
|
|
|
|
|
| |||||||
Total expenses | 1,019 | 2,763 | 2,437 | |||||||||
Less expenses reimbursed and/or waived by investment adviser | (185 | ) | (906 | ) | (798 | ) | ||||||
Earnings credit from custodian | (3 | ) | — | — | ||||||||
Low balance account fees | (6 | ) | — | (1) | — | |||||||
|
|
|
|
|
| |||||||
Net expenses | 825 | 1,857 | 1,639 | |||||||||
|
|
|
|
|
| |||||||
Net investment income (loss) | 3,669 | 4,957 | 3,750 | |||||||||
|
|
|
|
|
| |||||||
| Net Realized and Unrealized Gain (Loss) on Investments | ||||||||||||
Net realized gain (loss) on unaffiliated investments | (1,272 | ) | (74 | ) | (588 | ) | ||||||
Net realized gain (loss) on foreign currency transactions | — | — | — | (1) | ||||||||
Net increase from payments by affiliates(2) | 3 | — | 3 | |||||||||
Net change in unrealized appreciation (depreciation) on unaffiliated investments | 4,424 | 6,087 | (1,490 | ) | ||||||||
Net change in unrealized appreciation (depreciation) affiliated investments | 2 | — | — | |||||||||
|
|
|
|
|
| |||||||
| Net gain (loss) on investments | 3,157 | 6,013 | (2,075 | ) | ||||||||
|
|
|
|
|
| |||||||
Net increase (decrease) in net assets resulting from operations | $ | 6,826 | $ | 10,970 | $ | 1,675 | ||||||
|
|
|
|
|
| |||||||
(1) Amount is less than $500.
(2) See Note 4I in the Notes to Financial Statements.
(3) Fund changed its fiscal year-end to September 30 during the period.
See Notes to Financial Statements
85
Table of Contents
VIRTUS OPPORTUNITIES TRUST
STATEMENTS OF OPERATIONS (Continued)
($ reported in thousands)
|
|
|
|
|
| |||||||
| Low Volatility Equity Fund | Multi-Sector Intermediate Bond Fund | Senior Floating Rate Fund | ||||||||||
| Year Ended September 30, 2016 | Year Ended September 30, 2016 | Year Ended September 30, 2016 | ||||||||||
| Investment Income | ||||||||||||
Dividends | $ | 96 | $ | 212 | $ | — | ||||||
Dividends from affiliated fund | — | 349 | 232 | |||||||||
Interest | — | 17,331 | 28,795 | |||||||||
|
|
|
|
|
| |||||||
Total investment income | 96 | 17,892 | 29,027 | |||||||||
|
|
|
|
|
| |||||||
| Expenses | ||||||||||||
Investment advisory fees | 45 | 1,660 | 3,560 | |||||||||
Service fees, Class A | 5 | 251 | 592 | |||||||||
Distribution and service fees, Class B | — | 22 | — | |||||||||
Distribution and service fees, Class C | 11 | 777 | 1,216 | |||||||||
Administration fees | 6 | 380 | 747 | |||||||||
Transfer agent fees and expenses | 6 | 379 | 600 | |||||||||
Interest expense and fees | — | — | 404 | |||||||||
Registration fees | 44 | 106 | 77 | |||||||||
Printing fees and expenses | 3 | 72 | 115 | |||||||||
Custodian fees | 1 | 21 | 20 | |||||||||
Professional fees | 21 | 44 | 62 | |||||||||
Trustees’ fees and expenses | 1 | 27 | 46 | |||||||||
Miscellaneous expenses | 2 | 35 | 218 | |||||||||
|
|
|
|
|
| |||||||
Total expenses | 145 | 3,774 | 7,657 | |||||||||
Less expenses reimbursed and/or waived by investment adviser | (67 | ) | (50 | ) | (38 | ) | ||||||
Earnings credit from custodian | — | (1) | (4 | ) | (24 | ) | ||||||
Low balance account fees | — | (1 | ) | — | (1) | |||||||
|
|
|
|
|
| |||||||
Net expenses | 78 | 3,719 | 7,595 | |||||||||
|
|
|
|
|
| |||||||
Net investment income (loss) | 18 | 14,173 | 21,432 | |||||||||
|
|
|
|
|
| |||||||
| Net Realized and Unrealized Gain (Loss) on Investments | ||||||||||||
Net realized gain (loss) on unaffiliated investments | (127 | ) | (5,188 | ) | (14,295 | ) | ||||||
Net realized gain (loss) on affiliated investments | — | — | (49 | ) | ||||||||
Net realized gain (loss) on foreign currency transactions | — | (23 | ) | (17 | ) | |||||||
Net realized gain (loss) on written options | (370 | ) | — | — | ||||||||
Net change in unrealized appreciation (depreciation) on unaffiliated investments | 609 | 18,527 | 15,109 | |||||||||
Net change in unrealized appreciation (depreciation) affiliated investments | — | 57 | 75 | |||||||||
Net change in unrealized appreciation (depreciation) on foreign currency translations | — | 8 | — | (1) | ||||||||
Net change in unrealized appreciation (depreciation) on written options | (52 | ) | — | — | ||||||||
|
|
|
|
|
| |||||||
| Net gain (loss) on investments | 60 | 13,381 | 823 | |||||||||
|
|
|
|
|
| |||||||
Net increase (decrease) in net assets resulting from operations | $ | 78 | $ | 27,554 | $ | 22,255 | ||||||
|
|
|
|
|
| |||||||
(1) Amount is less than $500.
See Notes to Financial Statements
86
Table of Contents
VIRTUS OPPORTUNITIES TRUST
STATEMENTS OF OPERATIONS (Continued)
($ reported in thousands)
|
|
|
| |||||||||
| Tax-Exempt Bond Fund | Wealth Masters Fund | |||||||||||
| Fiscal Period Ended September 30, 2016(2) | Year Ended December 31, 2015 | Year Ended September 30, 2016 | ||||||||||
| Investment Income | ||||||||||||
Dividends | $ | 8 | $ | 1 | $ | 1,303 | ||||||
Interest | 5,089 | 6,729 | — | |||||||||
Security lending, net of fees | — | — | 555 | |||||||||
Foreign taxes withheld | — | — | (2 | ) | ||||||||
|
|
|
|
|
| |||||||
Total investment income | 5,097 | 6,730 | 1,856 | |||||||||
|
|
|
|
|
| |||||||
| Expenses | ||||||||||||
Investment advisory fees | 675 | 878 | 808 | |||||||||
Service fees, Class A | 136 | 191 | 106 | |||||||||
Distribution and service fees, Class C | 212 | 294 | 287 | |||||||||
Distribution fees, Class I | — | 15 | — | |||||||||
Administration fees | 189 | 238 | 120 | |||||||||
Transfer agent fees and expenses | 167 | 216 | 152 | |||||||||
Registration fees | 36 | 52 | 60 | |||||||||
Printing fees and expenses | 36 | 15 | 30 | |||||||||
Custodian fees | 3 | 3 | 8 | |||||||||
Professional fees | 36 | 36 | 31 | |||||||||
Trustees’ fees and expenses | 14 | 9 | 9 | |||||||||
Miscellaneous expenses | 13 | 13 | 10 | |||||||||
|
|
|
|
|
| |||||||
Total expenses | 1,517 | 1,960 | 1,621 | |||||||||
Less expenses reimbursed and/or waived by investment adviser | (242 | ) | (304 | ) | (74 | ) | ||||||
Earnings credit from custodian | — | — | — | (1) | ||||||||
Low balance account fees | — | (1) | — | — | (1) | |||||||
|
|
|
|
|
| |||||||
Total expenses | 1,275 | 1,656 | 1,547 | |||||||||
|
|
|
|
|
| |||||||
Net investment income (loss) | 3,822 | 5,074 | 309 | |||||||||
|
|
|
|
|
| |||||||
| Net Realized and Unrealized Gain (Loss) on Investments | ||||||||||||
Net realized gain (loss) on unaffiliated investments | 345 | 67 | (4,300 | ) | ||||||||
Net change in unrealized appreciation (depreciation) on unaffiliated investments | 1,789 | (683 | ) | 13,223 | ||||||||
|
|
|
|
|
| |||||||
| Net gain (loss) on investments | 2,134 | (616 | ) | 8,923 | ||||||||
|
|
|
|
|
| |||||||
Net increase (decrease) in net assets resulting from operations | $ | 5,956 | $ | 4,458 | $ | 9,232 | ||||||
|
|
|
|
|
| |||||||
(1) Amount is less than $500.
(2) The Fund changed its fiscal year end to September 30 during the period.
See Notes to Financial Statements
87
Table of Contents
VIRTUS OPPORTUNITIES TRUST
STATEMENTS OF CHANGES IN NET ASSETS
($ reported in thousands)
|
|
|
| |||||||||||||
| Bond Fund | CA Tax-Exempt Bond | |||||||||||||||
| Year Ended September 30, 2016 | Year Ended September 30, 2015 | Year Ended September 30, 2016 | Year Ended September 30, 2015 | |||||||||||||
| INCREASE/(DECREASE) IN NET ASSETS | ||||||||||||||||
| From Operations | ||||||||||||||||
Net investment income (loss) | $ | 2,485 | $ | 2,691 | $ | 976 | $ | 1,095 | ||||||||
Net realized gain (loss) | (648 | ) | (1,801 | ) | 218 | 672 | ||||||||||
Net change in unrealized appreciation (depreciation) | 2,992 | (1,079 | ) | 522 | (606 | ) | ||||||||||
|
|
|
|
|
|
|
| |||||||||
Increase (decrease) in net assets resulting from operations | 4,829 | (189 | ) | 1,716 | 1,161 | |||||||||||
|
|
|
|
|
|
|
| |||||||||
| From Distributions to Shareholders | ||||||||||||||||
Net investment income, Class A | (1,355 | ) | (1,481 | ) | (576 | ) | (736 | ) | ||||||||
Net investment income, Class B | (2 | ) | (4 | ) | — | — | ||||||||||
Net investment income, Class C | (236 | ) | (188 | ) | — | — | ||||||||||
Net investment income, Class I | (650 | ) | (533 | ) | (361 | ) | (396 | ) | ||||||||
Net realized short-term gains, Class A | — | — | (10 | ) | (21 | ) | ||||||||||
Net realized short-term gains, Class I | — | — | (6 | ) | (10 | ) | ||||||||||
Net realized long-term gains, Class A | — | — | (434 | ) | (706 | ) | ||||||||||
Net realized long-term gains, Class I | — | — | (273 | ) | (354 | ) | ||||||||||
Return of capital Class A | — | (253 | ) | — | — | |||||||||||
Return of capital Class B | — | (1 | ) | — | — | |||||||||||
Return of capital Class C | — | (41 | ) | — | — | |||||||||||
Return of capital Class I | — | (84 | ) | — | — | |||||||||||
|
|
|
|
|
|
|
| |||||||||
Decrease in net assets from distributions to shareholders | (2,243 | ) | (2,585 | ) | (1,660 | ) | (2,223 | ) | ||||||||
|
|
|
|
|
|
|
| |||||||||
| From Share Transactions (See Note 6) | ||||||||||||||||
Change in net assets from share transactions, Class A | (5,315 | ) | (3,738 | ) | (567 | ) | (1,030 | ) | ||||||||
Change in net assets from share transactions, Class B | (54 | ) | (102 | ) | — | — | ||||||||||
Change in net assets from share transactions, Class C | 154 | 2,882 | — | — | ||||||||||||
Change in net assets from share transactions, Class I | 5,985 | 1,612 | 587 | (53 | ) | |||||||||||
|
|
|
|
|
|
|
| |||||||||
Increase (decrease) in net assets from share transactions | 770 | 654 | 20 | (1,083 | ) | |||||||||||
|
|
|
|
|
|
|
| |||||||||
Net increase (decrease) in net assets | 3,356 | (2,120 | ) | 76 | (2,145 | ) | ||||||||||
| Net Assets | ||||||||||||||||
Beginning of period | 74,499 | 76,619 | 31,037 | 33,182 | ||||||||||||
|
|
|
|
|
|
|
| |||||||||
End of period | $ | 77,855 | $ | 74,499 | $ | 31,113 | $ | 31,037 | ||||||||
|
|
|
|
|
|
|
| |||||||||
Accumulated undistributed net investment income (loss) at end of period | $ | 108 | $ | (8 | ) | $ | 48 | $ | 9 | |||||||
See Notes to Financial Statements
88
Table of Contents
VIRTUS OPPORTUNITIES TRUST
STATEMENTS OF CHANGES IN NET ASSETS (Continued)
($ reported in thousands)
|
|
|
| |||||||||||||
| Essential Resources | High Yield Fund | |||||||||||||||
| Year Ended September 30, 2016 | From Inception March 24, 2015 to September 30, 2015 | Year Ended September 30, 2016 | Year Ended September 30, 2015 | |||||||||||||
| INCREASE/(DECREASE) IN NET ASSETS | ||||||||||||||||
| From Operations | ||||||||||||||||
Net investment income (loss) | $ | 35 | $ | 23 | $ | 3,669 | $ | 4,606 | ||||||||
Net realized gain (loss) | (527 | ) | (26 | ) | (1,269 | ) | (2,049 | ) | ||||||||
Net change in unrealized appreciation (depreciation) | 1,051 | (978 | ) | 4,426 | (4,614 | ) | ||||||||||
|
|
|
|
|
|
|
| |||||||||
Increase (decrease) in net assets resulting from operations | 559 | (981 | ) | 6,826 | (2,057 | ) | ||||||||||
|
|
|
|
|
|
|
| |||||||||
| From Distributions to Shareholders | ||||||||||||||||
Net investment income, Class A | — | (1) | — | (3,093 | ) | (4,183 | ) | |||||||||
Net investment income, Class B | — | — | (2 | ) | (4 | ) | ||||||||||
Net investment income, Class C | — | — | (162 | ) | (189 | ) | ||||||||||
Net investment income, Class I | (28 | ) | — | (421 | ) | (376 | ) | |||||||||
Net realized short-term gains, Class A | — | (1) | — | — | — | |||||||||||
Net realized short-term gains, Class C | — | (1) | — | — | — | |||||||||||
Net realized short-term gains, Class I | (3 | ) | — | — | — | |||||||||||
|
|
|
|
|
|
|
| |||||||||
Decrease in net assets from distributions to shareholders | (31 | ) | — | (3,678 | ) | (4,752 | ) | |||||||||
|
|
|
|
|
|
|
| |||||||||
| From Share Transactions (See Note 6) | ||||||||||||||||
Change in net assets from share transactions, Class A | 69 | 103 | 579 | (4,168 | ) | |||||||||||
Change in net assets from share transactions, Class B | — | — | (15 | ) | (59 | ) | ||||||||||
Change in net assets from share transactions, Class C | 3 | 129 | 378 | 21 | ||||||||||||
Change in net assets from share transactions, Class I | 118 | 4,826 | 3,137 | (969 | ) | |||||||||||
|
|
|
|
|
|
|
| |||||||||
Increase (decrease) in net assets from share transactions | 190 | 5,058 | 4,079 | (5,175 | ) | |||||||||||
|
|
|
|
|
|
|
| |||||||||
Net increase (decrease) in net assets | 718 | 4,077 | 7,227 | (11,984 | ) | |||||||||||
| Net Assets | ||||||||||||||||
Beginning of period | 4,077 | — | 69,322 | 81,306 | ||||||||||||
|
|
|
|
|
|
|
| |||||||||
End of period | $ | 4,795 | $ | 4,077 | $ | 76,549 | $ | 69,322 | ||||||||
|
|
|
|
|
|
|
| |||||||||
Accumulated undistributed net investment income (loss) at end of period | $ | 28 | $ | 23 | $ | (39 | ) | $ | (30 | ) | ||||||
(1) Amount less than $500.
See Notes to Financial Statements
89
Table of Contents
VIRTUS OPPORTUNITIES TRUST
STATEMENTS OF CHANGES IN NET ASSETS (Continued)
($ reported in thousands)
|
| |||||||||||
| Low Duration Income Fund | ||||||||||||
| Fiscal Period Ended September 30, 2016(1) | Year Ended December 31, 2015 | Year Ended December 31, 2014 | ||||||||||
| INCREASE/(DECREASE) IN NET ASSETS | ||||||||||||
| From Operations | ||||||||||||
Net investment income (loss) | $ | 4,957 | $ | 3,750 | $ | 2,921 | ||||||
Net realized gain (loss) | (74 | ) | (588 | ) | (118 | ) | ||||||
Net increase in payments by affiliates | — | 3 | — | |||||||||
Net change in unrealized appreciation (depreciation) | 6,087 | (1,490 | ) | (685 | ) | |||||||
|
|
|
|
|
| |||||||
Increase (decrease) in net assets resulting from operations | 10,970 | 1,675 | 2,118 | |||||||||
|
|
|
|
|
| |||||||
| From Distributions to Shareholders | ||||||||||||
Net investment income, Class A | (1,288 | ) | (1,241 | ) | (917 | ) | ||||||
Net investment income, Class C | (375 | ) | (392 | ) | (389 | ) | ||||||
Net investment income, Class I | (3,052 | ) | (2,021 | ) | (1,607 | ) | ||||||
Return of capital Class A | — | (182 | ) | — | ||||||||
Return of capital Class C | — | (100 | ) | — | ||||||||
Return of capital Class I | — | (261 | ) | — | ||||||||
|
|
|
|
|
| |||||||
Decrease in net assets from distributions to shareholders | (4,715 | ) | (4,197 | ) | (2,913 | ) | ||||||
|
|
|
|
|
| |||||||
| From Share Transactions (See Note 6) | ||||||||||||
Change in net assets from share transactions, Class A | 14,626 | 11,010 | 36,290 | |||||||||
Change in net assets from share transactions, Class C | 1,140 | (6,317 | ) | 25,981 | ||||||||
Change in net assets from share transactions, Class I | 97,036 | 59,540 | 40,388 | |||||||||
|
|
|
|
|
| |||||||
Increase (decrease) in net assets from share transactions | 112,802 | 64,233 | 102,659 | |||||||||
|
|
|
|
|
| |||||||
Net increase (decrease) in net assets | 119,057 | 61,711 | 101,864 | |||||||||
| Net Assets | ||||||||||||
Beginning of period | 281,264 | 219,553 | 117,689 | |||||||||
|
|
|
|
|
| |||||||
End of period | $ | 400,321 | $ | 281,264 | $ | 219,553 | ||||||
|
|
|
|
|
| |||||||
Accumulated undistributed net investment income (loss) at end of period | $ | 242 | $ | — | $ | (70 | ) | |||||
(1) The Fund changed its fiscal year-end to September 30 during the period.
See Notes to Financial Statements
90
Table of Contents
VIRTUS OPPORTUNITIES TRUST
STATEMENTS OF CHANGES IN NET ASSETS (Continued)
($ reported in thousands)
|
|
|
| |||||||||||||
| Low Volatility Equity Fund | Multi-Sector Intermediate Bond Fund | |||||||||||||||
| Year Ended September 30, 2016 | Year Ended September 30, 2015 | Year Ended September 30, 2016 | Year Ended September 30, 2015 | |||||||||||||
| INCREASE/(DECREASE) IN NET ASSETS | ||||||||||||||||
| From Operations | ||||||||||||||||
Net investment income (loss) | $ | 18 | $ | 24 | $ | 14,173 | $ | 17,003 | ||||||||
Net realized gain (loss) | (497 | ) | 74 | (5,211 | ) | (10,025 | ) | |||||||||
Net change in unrealized appreciation (depreciation) | 557 | (272 | ) | 18,592 | (19,678 | ) | ||||||||||
|
|
|
|
|
|
|
| |||||||||
Increase (decrease) in net assets resulting from operations | 78 |
| (174
| )
| 27,554 | (12,700 | ) | |||||||||
|
|
|
|
|
|
|
| |||||||||
| From Distributions to Shareholders | ||||||||||||||||
Net investment income, Class A | (8 | ) | (7 | ) | (4,295 | ) | (4,622 | ) | ||||||||
Net investment income, Class B | — | — | (79 | ) | (127 | ) | ||||||||||
Net investment income, Class C | — | (2 | ) | (2,715 | ) | (2,903 | ) | |||||||||
Net investment income, Class I | (9 | ) | (6 | ) | (5,418 | ) | (6,036 | ) | ||||||||
Net investment income, Class R6 | — | — | (81 | ) | (32 | ) | ||||||||||
Net realized short-term gains, Class A | (13 | ) | — | — | (226 | ) | ||||||||||
Net realized short-term gains, Class B | — | — | — | (8 | ) | |||||||||||
Net realized short-term gains, Class C | (9 | ) | — | — | (178 | ) | ||||||||||
Net realized short-term gains, Class I | (10 | ) | — | — | (278 | ) | ||||||||||
Net realized short-term gains, Class R6 | — | — | — | (2 | ) | |||||||||||
Net realized long-term gains, Class A | (19 | ) | — | — | (1,292 | ) | ||||||||||
Net realized long-term gains, Class B | — | — | — | (50 | ) | |||||||||||
Net realized long-term gains, Class C | (13 | ) | — | — | (1,037 | ) | ||||||||||
Net realized long-term gains, Class I | (13 | ) | — | — | (1,595 | ) | ||||||||||
Net realized long-term gains, Class R6 | — | — | — | (— | )(1) | |||||||||||
Return of capital Class A | — | — | — | (625 | ) | |||||||||||
Return of capital Class B | — | — | — | (21 | ) | |||||||||||
Return of capital Class C | — | — | — | (491 | ) | |||||||||||
Return of capital Class I | — | — | — | (770 | ) | |||||||||||
Return of capital Class R6 | — | — | — | (5 | ) | |||||||||||
|
|
|
|
|
|
|
| |||||||||
Decrease in net assets from distributions to shareholders | (94 | ) | (15 | ) | (12,588 | ) | (20,298 | ) | ||||||||
|
|
|
|
|
|
|
| |||||||||
| From Share Transactions (See Note 6) | ||||||||||||||||
Change in net assets from share transactions, Class A | (421 | ) | 1,668 | (11,062 | ) | (3,826 | ) | |||||||||
Change in net assets from share transactions, Class B | — | — | (1,247 | ) | (2,133 | ) | ||||||||||
Change in net assets from share transactions, Class C | (900 | ) | 1,188 | (12,694 | ) | (3,590 | ) | |||||||||
Change in net assets from share transactions, Class I | 8 | 77 | (21,152 | ) | 8,043 | |||||||||||
Change in net assets from share transactions, Class R6 | — | — | 130 | 1,885 | ||||||||||||
|
|
|
|
|
|
|
| |||||||||
Increase (decrease) in net assets from share transactions | (1,313 | ) | 2,933 | (46,025 | ) | 379 | ||||||||||
|
|
|
|
|
|
|
| |||||||||
Net increase (decrease) in net assets | (1,329 | ) | 2,744 | (31,059 | ) | (32,619 | ) | |||||||||
| Net Assets | ||||||||||||||||
Beginning of period | 5,059 | 2,315 | 332,534 | 365,153 | ||||||||||||
|
|
|
|
|
|
|
| |||||||||
End of period | $ | 3,730 | $ | 5,059 | $ | 301,475 | $ | 332,534 | ||||||||
|
|
|
|
|
|
|
| |||||||||
Accumulated undistributed net investment income (loss) at end of period | $ | 17 | $ | 16 | $ | 1,029 | $ | (249 | ) | |||||||
(1) Amount less than $500.
See Notes to Financial Statements
91
Table of Contents
VIRTUS OPPORTUNITIES TRUST
STATEMENTS OF CHANGES IN NET ASSETS (Continued)
($ reported in thousands)
|
| |||||||
| Senior Floating Rate Fund | ||||||||
| Year Ended September 30, 2016 | Year Ended September 30, 2015 | |||||||
| INCREASE/(DECREASE) IN NET ASSETS | ||||||||
| From Operations | ||||||||
Net investment income (loss) | $ | 21,432 | $ | 30,523 | ||||
Net realized gain (loss) | (14,361 | ) | (9,938 | ) | ||||
Net change in unrealized appreciation (depreciation) | 15,184 | (16,754 | ) | |||||
|
|
|
| |||||
Increase (decrease) in net assets resulting from operations | 22,255 | 3,831 | ||||||
|
|
|
| |||||
| From Distributions to Shareholders | ||||||||
Net investment income, Class A | (8,701 | ) | (11,297 | ) | ||||
Net investment income, Class C | (3,550 | ) | (5,079 | ) | ||||
Net investment income, Class I | (9,212 | ) | (14,848 | ) | ||||
Net realized short-term gains, Class A | — | (394 | ) | |||||
Net realized short-term gains, Class C | — | (231 | ) | |||||
Net realized short-term gains, Class I | — | (540 | ) | |||||
Net realized long-term gains, Class A | — | (341 | ) | |||||
Net realized long-term gains, Class C | — | (199 | ) | |||||
Net realized long-term gains, Class I | — | (463 | ) | |||||
|
|
|
| |||||
Decrease in net assets from distributions to shareholders | (21,463 | ) | (33,392 | ) | ||||
|
|
|
| |||||
| From Share Transactions (See Note 6) | ||||||||
Change in net assets from share transactions, Class A | (41,744 | ) | (15,274 | ) | ||||
Change in net assets from share transactions, Class C | (26,952 | ) | (33,299 | ) | ||||
Change in net assets from share transactions, Class I | (73,726 | ) | (159,653 | ) | ||||
|
|
|
| |||||
Increase (decrease) in net assets from share transactions | (142,422 | ) | (208,226 | ) | ||||
|
|
|
| |||||
Net increase (decrease) in net assets | (141,630 | ) | (237,787 | ) | ||||
| Net Assets | ||||||||
Beginning of period | 691,809 | 929,596 | ||||||
|
|
|
| |||||
End of period | $ | 550,179 | $ | 691,809 | ||||
|
|
|
| |||||
Accumulated undistributed net investment income (loss) at end of period | $ | (461 | ) | $ | (347 | ) | ||
See Notes to Financial Statements
92
Table of Contents
VIRTUS OPPORTUNITIES TRUST
STATEMENTS OF CHANGES IN NET ASSETS (Continued)
($ reported in thousands)
|
| |||||||||||
| Tax-Exempt Bond Fund | ||||||||||||
| Fiscal Period Ended September 30, 2016(2) | Year Ended December 31, 2015 | Year Ended December 31, 2014 | ||||||||||
| INCREASE/(DECREASE) IN NET ASSETS | ||||||||||||
| From Operations | ||||||||||||
Net investment income (loss) | $ | 3,822 | $ | 5,074 | $ | 5,308 | ||||||
Net realized gain (loss) | 345 | 67 | 1,214 | |||||||||
Net change in unrealized appreciation (depreciation) | 1,789 | (683 | ) | 8,491 | ||||||||
|
|
|
|
|
| |||||||
Increase (decrease) in net assets resulting from operations | 5,956 | 4,458 | 15,013 | |||||||||
|
|
|
|
|
| |||||||
| From Distributions to Shareholders | ||||||||||||
Net investment income, Class A | (1,394 | ) | (1,938 | ) | (2,408 | ) | ||||||
Net investment income, Class C | (385 | ) | (525 | ) | (595 | ) | ||||||
Net investment income, Class I | (2,087 | ) | (2,479 | ) | (2,459 | ) | ||||||
Net realized short-term gains, Class A | — | (1) | — | — | ||||||||
Net realized short-term gains, Class C | — | (1) | — | — | ||||||||
Net realized short-term gains, Class I | — | (1) | — | — | ||||||||
Net realized long-term gains, Class A | — | (57 | ) | (4 | ) | |||||||
Net realized long-term gains, Class C | — | (23 | ) | (2 | ) | |||||||
Net realized long-term gains, Class I | — | (69 | ) | (4 | ) | |||||||
|
|
|
|
|
| |||||||
Decrease in net assets from distributions to shareholders | (3,866 | ) | (5,091 | ) | (5,472 | ) | ||||||
|
|
|
|
|
| |||||||
| From Share Transactions (See Note 6) | ||||||||||||
Change in net assets from share transactions, Class A | (5,512 | ) | (5,220 | ) | (13,624 | ) | ||||||
Change in net assets from share transactions, Class C | (3,808 | ) | (530 | ) | 723 | |||||||
Change in net assets from share transactions, Class I | 12,807 | 4,697 | (392 | ) | ||||||||
|
|
|
|
|
| |||||||
Increase (decrease) in net assets from share transactions | 3,487 | (1,053 | ) | (13,293 | ) | |||||||
|
|
|
|
|
| |||||||
Net increase (decrease) in net assets | 5,577 | (1,686 | ) | (3,752 | ) | |||||||
| Net Assets | ||||||||||||
Beginning of period | 195,646 | 197,332 | 201,084 | |||||||||
|
|
|
|
|
| |||||||
End of period | $ | 201,223 | $ | 195,646 | $ | 197,332 | ||||||
|
|
|
|
|
| |||||||
Accumulated undistributed net investment income (loss) at end of period | $ | 109 | $ | 152 | $ | 22 | ||||||
(1) Amount is less than $500.
(2) The Fund changed its fiscal year end to September 30 during the period.
See Notes to Financial Statements
93
Table of Contents
VIRTUS OPPORTUNITIES TRUST
STATEMENTS OF CHANGES IN NET ASSETS (Continued)
($ reported in thousands)
|
| |||||||
| Wealth Masters Fund | ||||||||
| Year Ended September 30, 2016 | Year Ended September 30, 2015 | |||||||
| INCREASE/(DECREASE) IN NET ASSETS | ||||||||
| From Operations | ||||||||
Net investment income (loss) | $ | 309 | $ | 378 | ||||
Net realized gain (loss) | (4,300 | ) | (563 | ) | ||||
Net change in unrealized appreciation (depreciation) | 13,223 | (10,130 | ) | |||||
|
|
|
| |||||
Increase (decrease) in net assets resulting from operations | 9,232 | (10,315 | ) | |||||
|
|
|
| |||||
| From Distributions to Shareholders | ||||||||
Net investment income, Class A | (112 | ) | (184 | ) | ||||
Net investment income, Class C | (3 | ) | — | |||||
Net investment income, Class I | (137 | ) | (252 | ) | ||||
Net realized short-term gains, Class A | (666 | ) | (1,046 | ) | ||||
Net realized short-term gains, Class C | (438 | ) | (622 | ) | ||||
Net realized short-term gains, Class I | (391 | ) | (869 | ) | ||||
Net realized long-term gains, Class A | (231 | ) | (20 | ) | ||||
Net realized long-term gains, Class C | (152 | ) | (12 | ) | ||||
Net realized long-term gains, Class I | (136 | ) | (17 | ) | ||||
|
|
|
| |||||
Decrease in net assets from distributions to shareholders | (2,266 | ) | (3,022 | ) | ||||
|
|
|
| |||||
| From Share Transactions (See Note 6) | ||||||||
Change in net assets from share transactions, Class A | (23,994 | ) | 4,094 | |||||
Change in net assets from share transactions, Class C | (11,563 | ) | 7,353 | |||||
Change in net assets from share transactions, Class I | (14,030 | ) | (12,645 | ) | ||||
|
|
|
| |||||
Increase (decrease) in net assets from share transactions | (49,587 | ) | (1,198 | ) | ||||
|
|
|
| |||||
Net increase (decrease) in net assets | (42,621 | ) | (14,535 | ) | ||||
| Net Assets | ||||||||
Beginning of period | 120,775 | 135,310 | ||||||
|
|
|
| |||||
End of period | $ | 78,154 | $ | 120,775 | ||||
|
|
|
| |||||
Accumulated undistributed net investment income (loss) at end of period | $ | 286 | $ | 229 | ||||
See Notes to Financial Statements
94
Table of Contents
VIRTUS OPPORTUNITIES TRUST
SELECTED PER SHARE DATA AND RATIOS FOR A SHARE OUTSTANDING
THROUGHOUT EACH PERIOD
| Net Asset Value, Beginning of Period | Net Investment Income (Loss)(2) | Net Realized and Unrealized Gain (Loss) | Total from Investment Operations | Dividends from Net Investment Income | Distributions from Net Realized Gains | Return of Capital | Total Distributions | Payment from Affiliate | Change in Net Asset Value | Net Asset Value, End of Period | Total Return(1) | Net Assets, End of Period (in thousands) | Ratio of Net Expenses to Average Net Assets(8) | Ratio of Gross Expenses to Average Net Assets (before waivers and reimburse ments)(8) | Ratio of Net Investment Income (Loss) to Average Net Assets | Portfolio Turnover Rate | ||||||||||||||||||||||||||||||||||||||||||||||||||||||||||||||||||||||
Bond Fund | |||||||||||||||||||||||||||||||||||||||||||||||||||||||||||||||||||||||||||||||||||||||
Class A | |||||||||||||||||||||||||||||||||||||||||||||||||||||||||||||||||||||||||||||||||||||||
10/1/15 to 9/30/16 | $ | 11.02 | 0.36 | 0.33 | 0.69 | (0.33 | ) | — | — | (0.33 | ) | — | (5) | 0.36 | $ | 11.38 | 6.38 | %(11) | $ | 44,136 | 0.86 | %(10)(12) | 1.18 | % | 3.28 | % | 64 | % | |||||||||||||||||||||||||||||||||||||||||||||||||||||||||||
10/1/14 to 9/30/15 | 11.43 | 0.40 | (0.43 | ) | (0.03 | ) | (0.32 | ) | — | (0.06 | ) | (0.38 | ) | — | (0.41 | ) | 11.02 | (0.26 | ) | 48,064 | 0.85 | 1.12 | 3.55 | 64 | |||||||||||||||||||||||||||||||||||||||||||||||||||||||||||||||
10/1/13 to 9/30/14 | 11.21 | 0.47 | 0.22 | 0.69 | (0.47 | ) | — | — | (0.47 | ) | — | 0.22 | 11.43 | 6.18 | 53,603 | 0.85 | 1.10 | 4.08 | 38 | ||||||||||||||||||||||||||||||||||||||||||||||||||||||||||||||||||||
10/1/12 to 9/30/13 | 11.61 | 0.43 | (0.41 | ) | 0.02 | (0.42 | ) | — | — | (0.42 | ) | — | (0.40 | ) | 11.21 | 0.17 | 57,286 | 0.85 | 1.07 | 3.75 | 107 | ||||||||||||||||||||||||||||||||||||||||||||||||||||||||||||||||||
10/1/11 to 9/30/12 | 10.96 | 0.35 | 0.67 | 1.02 | (0.37 | ) | — | — | (0.37 | ) | — | 0.65 | 11.61 | 9.34 | 67,804 | 0.85 | 1.02 | 3.12 | 210 | ||||||||||||||||||||||||||||||||||||||||||||||||||||||||||||||||||||
Class B | |||||||||||||||||||||||||||||||||||||||||||||||||||||||||||||||||||||||||||||||||||||||
10/1/15 to 9/30/16 | $ | 10.74 | 0.27 | 0.31 | 0.58 | (0.25 | ) | — | — | (0.25 | ) | — | (5) | 0.33 | $ | 11.07 | 5.47 | %(11) | $ | 74 | 1.61 | %(10)(12) | 1.92 | % | 2.54 | % | 64 | % | |||||||||||||||||||||||||||||||||||||||||||||||||||||||||||
10/1/14 to 9/30/15 | 11.14 | 0.31 | (0.41 | ) | (0.10 | ) | (0.24 | ) | — | (0.06 | ) | (0.30 | ) | — | (0.40 | ) | 10.74 | (0.91 | ) | 126 | 1.60 | 1.86 | 2.82 | 64 | |||||||||||||||||||||||||||||||||||||||||||||||||||||||||||||||
10/1/13 to 9/30/14 | 10.95 | 0.37 | 0.20 | 0.57 | (0.38 | ) | — | — | (0.38 | ) | — | 0.19 | 11.14 | 5.27 | 233 | 1.60 | 1.84 | 3.34 | 38 | ||||||||||||||||||||||||||||||||||||||||||||||||||||||||||||||||||||
10/1/12 to 9/30/13 | 11.34 | 0.33 | (0.38 | ) | (0.05 | ) | (0.34 | ) | — | — | (0.34 | ) | — | (0.39 | ) | 10.95 | (0.50 | ) | 401 | 1.60 | 1.82 | 2.95 | 107 | ||||||||||||||||||||||||||||||||||||||||||||||||||||||||||||||||
10/1/11 to 9/30/12 | 10.71 | 0.27 | 0.64 | 0.91 | (0.28 | ) | — | — | (0.28 | ) | — | 0.63 | 11.34 | 8.48 | 727 | 1.60 | 1.77 | 2.43 | 210 | ||||||||||||||||||||||||||||||||||||||||||||||||||||||||||||||||||||
Class C | |||||||||||||||||||||||||||||||||||||||||||||||||||||||||||||||||||||||||||||||||||||||
10/1/15 to 9/30/16 | $ | 10.78 | 0.27 | 0.32 | 0.59 | (0.25 | ) | — | — | (0.25 | ) | — | (5) | 0.34 | $ | 11.12 | 5.54 | %(11) | $ | 9,409 | 1.61 | %(10)(12) | 1.93 | % | 2.52 | % | 64 | % | |||||||||||||||||||||||||||||||||||||||||||||||||||||||||||
10/1/14 to 9/30/15 | 11.19 | 0.30 | (0.41 | ) | (0.11 | ) | (0.24 | ) | — | (0.06 | ) | (0.30 | ) | — | (0.41 | ) | 10.78 | (1.00 | ) | 8,853 | 1.60 | 1.87 | 2.74 | 64 | |||||||||||||||||||||||||||||||||||||||||||||||||||||||||||||||
10/1/13 to 9/30/14 | 10.99 | 0.37 | 0.21 | 0.58 | (0.38 | ) | — | — | (0.38 | ) | — | 0.20 | 11.19 | 5.34 | 6,315 | 1.60 | 1.85 | 3.33 | 38 | ||||||||||||||||||||||||||||||||||||||||||||||||||||||||||||||||||||
10/1/12 to 9/30/13 | 11.38 | 0.34 | (0.39 | ) | (0.05 | ) | (0.34 | ) | — | — | (0.34 | ) | — | (0.39 | ) | 10.99 | (0.51 | ) | 6,825 | 1.60 | 1.82 | 2.99 | 107 | ||||||||||||||||||||||||||||||||||||||||||||||||||||||||||||||||
10/1/11 to 9/30/12 | 10.75 | 0.26 | 0.65 | 0.91 | (0.28 | ) | — | — | (0.28 | ) | — | 0.63 | 11.38 | 8.55 | 8,756 | 1.60 | 1.77 | 2.36 | 210 | ||||||||||||||||||||||||||||||||||||||||||||||||||||||||||||||||||||
Class I | |||||||||||||||||||||||||||||||||||||||||||||||||||||||||||||||||||||||||||||||||||||||
10/1/15 to 9/30/16 | $ | 11.19 | 0.40 | 0.33 | 0.73 | (0.36 | ) | — | — | (0.36 | ) | — | (5) | 0.37 | $ | 11.56 | 6.63 | %(11) | $ | 24,236 | 0.61 | %(10)(12) | 0.93 | % | 3.51 | % | 64 | % | |||||||||||||||||||||||||||||||||||||||||||||||||||||||||||
10/1/14 to 9/30/15 | 11.59 | 0.43 | (0.42 | ) | 0.01 | (0.35 | ) | — | (0.06 | ) | (0.41 | ) | — | (0.40 | ) | 11.19 | 0.08 | 17,456 | 0.60 | 0.87 | 3.78 | 64 | |||||||||||||||||||||||||||||||||||||||||||||||||||||||||||||||||
10/1/13 to 9/30/14 | 11.37 | 0.50 | 0.21 | 0.71 | (0.49 | ) | — | — | (0.49 | ) | — | 0.22 | 11.59 | 6.35 | 16,468 | 0.60 | 0.85 | 4.33 | 38 | ||||||||||||||||||||||||||||||||||||||||||||||||||||||||||||||||||||
10/1/12 to 9/30/13 | 11.76 | 0.47 | (0.41 | ) | 0.06 | (0.45 | ) | — | — | (0.45 | ) | — | (0.39 | ) | 11.37 | 0.49 | 22,037 | 0.60 | 0.82 | 3.98 | 107 | ||||||||||||||||||||||||||||||||||||||||||||||||||||||||||||||||||
10/1/11 to 9/30/12 | 11.10 | 0.39 | 0.66 | 1.05 | (0.39 | ) | — | — | (0.39 | ) | — | 0.66 | 11.76 | 9.64 | 29,527 | 0.60 | 0.77 | 3.39 | 210 | ||||||||||||||||||||||||||||||||||||||||||||||||||||||||||||||||||||
CA Tax-Exempt | |||||||||||||||||||||||||||||||||||||||||||||||||||||||||||||||||||||||||||||||||||||||
Bond Fund | |||||||||||||||||||||||||||||||||||||||||||||||||||||||||||||||||||||||||||||||||||||||
Class A | |||||||||||||||||||||||||||||||||||||||||||||||||||||||||||||||||||||||||||||||||||||||
10/1/15 to 9/30/16 | $ | 12.14 | 0.37 | 0.29 | 0.66 | (0.36 | ) | (0.27 | ) | — | (0.63 | ) | — | 0.03 | $ | 12.17 | 5.56 | % | $ | 19,464 | 0.86 | %(12) | 1.22 | % | 3.03 | % | 21 | % | |||||||||||||||||||||||||||||||||||||||||||||||||||||||||||
10/1/14 to 9/30/15 | 12.51 | 0.39 | 0.03 | 0.42 | (0.40 | ) | (0.39 | ) | — | (0.79 | ) | — | (0.37 | ) | 12.14 | 3.44 | 19,978 | 0.85 | 1.18 | 3.16 | 24 | ||||||||||||||||||||||||||||||||||||||||||||||||||||||||||||||||||
10/1/13 to 9/30/14 | 12.10 | 0.43 | 0.64 | 1.07 | (0.42 | ) | (0.24 | ) | — | (0.66 | ) | — | 0.41 | 12.51 | 9.16 | 21,729 | 0.85 | 1.11 | 3.49 | 7 | |||||||||||||||||||||||||||||||||||||||||||||||||||||||||||||||||||
10/1/12 to 9/30/13 | 12.96 | 0.43 | (0.68 | ) | (0.25 | ) | (0.43 | ) | (0.18 | ) | — | (0.61 | ) | — | (0.86 | ) | 12.10 | (2.12 | ) | 22,612 | 0.85 | 1.04 | 3.39 | 22 | |||||||||||||||||||||||||||||||||||||||||||||||||||||||||||||||
10/1/11 to 9/30/12 | 12.30 | 0.46 | 0.68 | 1.14 | (0.48 | ) | — | — | (0.48 | ) | — | 0.66 | 12.96 | 9.40 | 28,803 | 0.85 | 1.04 | 3.65 | 16 | ||||||||||||||||||||||||||||||||||||||||||||||||||||||||||||||||||||
Class I | |||||||||||||||||||||||||||||||||||||||||||||||||||||||||||||||||||||||||||||||||||||||
10/1/15 to 9/30/16 | $ | 12.12 | 0.40 | 0.29 | 0.69 | (0.39 | ) | (0.27 | ) | — | (0.66 | ) | — | 0.03 | $ | 12.15 | 5.83 | % | $ | 11,649 | 0.61 | %(12) | 0.97 | % | 3.28 | % | 21 | % | |||||||||||||||||||||||||||||||||||||||||||||||||||||||||||
10/1/14 to 9/30/15 | 12.49 | 0.42 | 0.03 | 0.45 | (0.43 | ) | (0.39 | ) | — | (0.82 | ) | — | (0.37 | ) | 12.12 | 3.71 | 11,059 | 0.60 | 0.93 | 3.41 | 24 | ||||||||||||||||||||||||||||||||||||||||||||||||||||||||||||||||||
10/1/13 to 9/30/14 | 12.09 | 0.45 | 0.64 | 1.09 | (0.45 | ) | (0.24 | ) | — | (0.69 | ) | — | 0.40 | 12.49 | 9.36 | 11,453 | 0.60 | 0.83 | 3.74 | 7 | |||||||||||||||||||||||||||||||||||||||||||||||||||||||||||||||||||
10/1/12 to 9/30/13 | 12.95 | 0.46 | (0.68 | ) | (0.22 | ) | (0.46 | ) | (0.18 | ) | — | (0.64 | ) | — | (0.86 | ) | 12.09 | (1.88 | ) | 26,026 | 0.60 | 0.79 | 3.65 | 22 | |||||||||||||||||||||||||||||||||||||||||||||||||||||||||||||||
10/1/11 to 9/30/12 | 12.29 | 0.49 | 0.68 | 1.17 | (0.51 | ) | — | — | (0.51 | ) | — | 0.66 | 12.95 | 9.68 | 28,639 | 0.60 | 0.79 | 3.90 | 16 | ||||||||||||||||||||||||||||||||||||||||||||||||||||||||||||||||||||
The footnote legend is at the end of the Financial Highlights.
See Notes to Financial Statements
95
Table of Contents
VIRTUS OPPORTUNITIES TRUST
FINANCIAL HIGHLIGHTS
SELECTED PER SHARE DATA AND RATIOS FOR A SHARE OUTSTANDING
THROUGHOUT EACH PERIOD
| Net Asset Value, Beginning of Period | Net Investment Income (Loss)(2) | Net Realized and Unrealized Gain (Loss) | Total from Investment Operations | Dividends from Net Investment Income | Distributions from Net Realized Gains | Total Distributions | Payment from Affiliate | Change in Net Asset Value | Net Asset Value, End of Period | Total Return(1) | Net Assets, End of Period (in thousands) | Ratio of Net Expenses to Average Net Assets(8) | Ratio of Gross Expenses to Average Net Assets (before waivers and reimburse ments)(8) | Ratio of Net Investment Income (Loss) to Average Net Assets | Portfolio Turnover Rate | ||||||||||||||||||||||||||||||||||||||||||||||||||||||||||||||||||
| Essential Resources | ||||||||||||||||||||||||||||||||||||||||||||||||||||||||||||||||||||||||||||||||||
Fund | ||||||||||||||||||||||||||||||||||||||||||||||||||||||||||||||||||||||||||||||||||
Class A | ||||||||||||||||||||||||||||||||||||||||||||||||||||||||||||||||||||||||||||||||||
10/1/15 to 9/30/16 | $ | 8.04 | 0.04 | 1.00 | 1.04 | (0.04 | ) | (0.01 | ) | (0.05 | ) | — | 0.99 | $ | 9.03 | 12.93 | % | $ | 169 | 1.67 | %(10)(12) | 4.30 | % | 0.51 | % | 88 | % | |||||||||||||||||||||||||||||||||||||||||||||||||||||||
3/24/15(6) to 9/30/15 | 10.00 | 0.03 | (1.99 | ) | (1.96 | ) | — | — | — | — | (1.96 | ) | 8.04 | (19.60 | )(4) | 84 | 1.65 | (3) | 6.26 | (3) | 0.66 | (3) | 48 | (4) | ||||||||||||||||||||||||||||||||||||||||||||||||||||||||||
Class C | ||||||||||||||||||||||||||||||||||||||||||||||||||||||||||||||||||||||||||||||||||
10/1/15 to 9/30/16 | $ | 8.01 | (0.02 | ) | 0.99 | 0.97 | — | (0.01 | ) | (0.01 | ) | — | 0.96 | $ | 8.97 | 12.07 | % | $ | 119 | 2.41 | %(10)(12) | 5.12 | % | (0.19 | )% | 88 | % | |||||||||||||||||||||||||||||||||||||||||||||||||||||||
3/24/15(6) to 9/30/15 | 10.00 | (— | )(5) | (1.99 | ) | (1.99 | ) | — | — | — | — | (1.99 | ) | 8.01 | (19.90 | )(4) | 104 | 2.40 | (3) | 7.26 | (3) | (0.10 | )(3) | 48 | (4) | |||||||||||||||||||||||||||||||||||||||||||||||||||||||||
Class I | ||||||||||||||||||||||||||||||||||||||||||||||||||||||||||||||||||||||||||||||||||
10/1/15 to 9/30/16 | $ | 8.05 | 0.07 | 1.00 | 1.07 | (0.06 | ) | (0.01 | ) | (0.07 | ) | — | 1.00 | $ | 9.05 | 13.27 | % | $ | 4,507 | 1.41 | %(10)(12) | 4.14 | % | 0.83 | % | 88 | % | |||||||||||||||||||||||||||||||||||||||||||||||||||||||
3/24/15(6) to 9/30/15 | 10.00 | 0.05 | (2.00 | ) | (1.95 | ) | — | — | — | — | (1.95 | ) | 8.05 | (19.50 | )(4) | 3,889 | 1.40 | (3) | 5.98 | (3) | 0.93 | (3) | 48 | (4) | ||||||||||||||||||||||||||||||||||||||||||||||||||||||||||
High Yield Fund | ||||||||||||||||||||||||||||||||||||||||||||||||||||||||||||||||||||||||||||||||||
Class A | ||||||||||||||||||||||||||||||||||||||||||||||||||||||||||||||||||||||||||||||||||
10/1/15 to 9/30/16 | $ | 3.98 | 0.21 | 0.20 | 0.41 | (0.21 | ) | — | (0.21 | ) | — | (5) | 0.20 | $ | 4.18 | 10.59 | %(11) | $ | 64,338 | 1.15 | %(10)(12) | 1.42 | % | 5.15 | % | 81 | % | |||||||||||||||||||||||||||||||||||||||||||||||||||||||
10/1/14 to 9/30/15 | 4.35 | 0.22 | (0.36 | ) | (0.14 | ) | (0.23 | ) | — | (0.23 | ) | — | (0.37 | ) | 3.98 | (3.39 | ) | 60,951 | 1.15 | 1.32 | 5.26 | 94 | ||||||||||||||||||||||||||||||||||||||||||||||||||||||||||||
10/1/13 to 9/30/14 | 4.27 | 0.24 | 0.08 | 0.32 | (0.24 | ) | — | (0.24 | ) | — | 0.08 | 4.35 | 7.53 | 71,042 | 1.15 | 1.31 | 5.55 | 82 | ||||||||||||||||||||||||||||||||||||||||||||||||||||||||||||||||
10/1/12 to 9/30/13 | 4.28 | 0.26 | (0.01 | ) | 0.25 | (0.26 | ) | — | (0.26 | ) | — | (0.01 | ) | 4.27 | 5.98 | 80,155 | 1.15 | 1.31 | 6.05 | 100 | ||||||||||||||||||||||||||||||||||||||||||||||||||||||||||||||
10/1/11 to 9/30/12 | 3.85 | 0.28 | 0.44 | 0.72 | (0.29 | ) | — | (0.29 | ) | — | 0.43 | 4.28 | 19.19 | 98,701 | 1.15 | 1.31 | 6.82 | 92 | ||||||||||||||||||||||||||||||||||||||||||||||||||||||||||||||||
Class B | ||||||||||||||||||||||||||||||||||||||||||||||||||||||||||||||||||||||||||||||||||
10/1/15 to 9/30/16 | $ | 3.88 | 0.17 | 0.19 | 0.36 | (0.18 | ) | — | (0.18 | ) | — | (5) | 0.18 | $ | 4.06 | 9.52 | %(11) | $ | 26 | 1.90 | %(10)(12) | 2.16 | % | 4.40 | % | 81 | % | |||||||||||||||||||||||||||||||||||||||||||||||||||||||
10/1/14 to 9/30/15 | 4.24 | 0.19 | (0.35 | ) | (0.16 | ) | (0.20 | ) | — | (0.20 | ) | — | (0.36 | ) | 3.88 | (3.96 | ) | 41 | 1.90 | 2.07 | 4.54 | 94 | ||||||||||||||||||||||||||||||||||||||||||||||||||||||||||||
10/1/13 to 9/30/14 | 4.17 | 0.21 | 0.07 | 0.28 | (0.21 | ) | — | (0.21 | ) | — | 0.07 | 4.24 | 6.68 | 106 | 1.90 | 2.07 | 4.80 | 82 | ||||||||||||||||||||||||||||||||||||||||||||||||||||||||||||||||
10/1/12 to 9/30/13 | 4.19 | 0.23 | (0.02 | ) | 0.21 | (0.23 | ) | — | (0.23 | ) | — | (0.02 | ) | 4.17 | 5.06 | 131 | 1.90 | 2.05 | 5.31 | 100 | ||||||||||||||||||||||||||||||||||||||||||||||||||||||||||||||
10/1/11 to 9/30/12 | 3.77 | 0.24 | 0.44 | 0.68 | (0.26 | ) | — | (0.26 | ) | — | 0.42 | 4.19 | 18.46 | 307 | 1.90 | 2.06 | 6.07 | 92 | ||||||||||||||||||||||||||||||||||||||||||||||||||||||||||||||||
Class C | ||||||||||||||||||||||||||||||||||||||||||||||||||||||||||||||||||||||||||||||||||
10/1/15 to 9/30/16 | $ | 3.92 | 0.17 | 0.20 | 0.37 | (0.18 | ) | — | (0.18 | ) | — | (5) | 0.19 | $ | 4.11 | 9.68 | %(11) | $ | 4,231 | 1.90 | %(10)(12) | 2.17 | % | 4.40 | % | 81 | % | |||||||||||||||||||||||||||||||||||||||||||||||||||||||
10/1/14 to 9/30/15 | 4.28 | 0.19 | (0.35 | ) | (0.16 | ) | (0.20 | ) | — | (0.20 | ) | — | (0.36 | ) | 3.92 | (3.93 | ) | 3,705 | 1.90 | 2.07 | 4.52 | 94 | ||||||||||||||||||||||||||||||||||||||||||||||||||||||||||||
10/1/13 to 9/30/14 | 4.21 | 0.21 | 0.07 | 0.28 | (0.21 | ) | — | (0.21 | ) | — | 0.07 | 4.28 | 6.60 | 4,038 | 1.90 | 2.07 | 4.79 | 82 | ||||||||||||||||||||||||||||||||||||||||||||||||||||||||||||||||
10/1/12 to 9/30/13 | 4.23 | 0.23 | (0.02 | ) | 0.21 | (0.23 | ) | — | (0.23 | ) | — | (0.02 | ) | 4.21 | 5.00 | 3,302 | 1.90 | 2.06 | 5.31 | 100 | ||||||||||||||||||||||||||||||||||||||||||||||||||||||||||||||
10/1/11 to 9/30/12 | 3.80 | 0.25 | 0.44 | 0.69 | (0.26 | ) | — | (0.26 | ) | — | 0.43 | 4.23 | 18.59 | 2,944 | 1.90 | 2.07 | 6.07 | 92 | ||||||||||||||||||||||||||||||||||||||||||||||||||||||||||||||||
Class I | ||||||||||||||||||||||||||||||||||||||||||||||||||||||||||||||||||||||||||||||||||
10/1/15 to 9/30/16 | $ | 3.98 | 0.21 | 0.21 | 0.42 | (0.22 | ) | — | (0.22 | ) | — | (5) | 0.20 | $ | 4.18 | 10.86 | %(11) | $ | 7,954 | 0.90 | %(10)(12) | 1.16 | % | 5.38 | % | 81 | % | |||||||||||||||||||||||||||||||||||||||||||||||||||||||
10/1/14 to 9/30/15 | 4.35 | 0.23 | (0.36 | ) | (0.13 | ) | (0.24 | ) | — | (0.24 | ) | — | (0.37 | ) | 3.98 | (3.15 | ) | 4,625 | 0.90 | 1.07 | 5.53 | 94 | ||||||||||||||||||||||||||||||||||||||||||||||||||||||||||||
10/1/13 to 9/30/14 | 4.27 | 0.26 | 0.07 | 0.33 | (0.25 | ) | — | (0.25 | ) | — | 0.08 | 4.35 | 7.80 | 6,120 | 0.90 | 1.07 | 5.80 | 82 | ||||||||||||||||||||||||||||||||||||||||||||||||||||||||||||||||
10/1/12 to 9/30/13 | 4.28 | 0.27 | (0.01 | ) | 0.26 | (0.27 | ) | — | (0.27 | ) | — | (0.01 | ) | 4.27 | 6.25 | 5,812 | 0.90 | 1.05 | 6.37 | 100 | ||||||||||||||||||||||||||||||||||||||||||||||||||||||||||||||
8/8/12(6) to 9/30/12 | 4.23 | 0.04 | 0.06 | 0.10 | (0.05 | ) | — | (0.05 | ) | — | 0.05 | 4.28 | 2.37 | (4) | 102 | 0.90 | (3) | 1.08 | (3) | 6.86 | (3) | 92 | (4) | |||||||||||||||||||||||||||||||||||||||||||||||||||||||||||
The footnote legend is at the end of the Financial Highlights.
See Notes to Financial Statements
96
Table of Contents
VIRTUS OPPORTUNITIES TRUST
FINANCIAL HIGHLIGHTS
SELECTED PER SHARE DATA AND RATIOS FOR A SHARE OUTSTANDING
THROUGHOUT EACH PERIOD
| Net Asset Value, Beginning of Period | Net Investment Income (Loss)(2) | Net Realized and Unrealized Gain/(Loss) | Total from Investment Operations | Dividends from Net Investment Income | Distributions from Net Realized Gains | Return of Capital | Total Distributions | Payment from Affiliate | Change in Net Asset Value | Net Asset Value, End of Period | Total Return(1) | Net Assets, End of Period (in thousands) | Ratio of Net Operating Expenses to Average Net Assets(8) | Ratio of Gross Operating Expenses to Average Net Assets(8) | Ratio of Net Investment Income to Average Net Assets | Portfolio Turnover Rate | ||||||||||||||||||||||||||||||||||||||||||||||||||||||||||||||||||||||
| Low Duration Income | |||||||||||||||||||||||||||||||||||||||||||||||||||||||||||||||||||||||||||||||||||||||
Fund | |||||||||||||||||||||||||||||||||||||||||||||||||||||||||||||||||||||||||||||||||||||||
Class A | |||||||||||||||||||||||||||||||||||||||||||||||||||||||||||||||||||||||||||||||||||||||
1/1/16 to 9/30/16(14) | $ | 10.70 | 0.15 | 0.20 | 0.35 | (0.15 | ) | — | — | (0.15 | ) | — | 0.20 | $ | 10.90 | 3.25 | %(4) | $ | 102,049 | 0.76 | %(3)(12) | 1.12 | %(3) | 1.89 | %(3) | 38 | %(4) | ||||||||||||||||||||||||||||||||||||||||||||||||||||||||||||
1/1/15 to 12/31/15 | 10.82 | 0.19 | (0.09 | ) | 0.10 | (0.19 | ) | — | (0.03 | ) | (0.22 | ) | — | (5) | (0.12 | ) | 10.70 | 0.89 | (11) | 85,666 | 0.75 | 1.12 | 1.77 | 56 | |||||||||||||||||||||||||||||||||||||||||||||||||||||||||||||||
1/1/14 to 12/31/14 | 10.83 | 0.22 | (0.01 | ) | 0.21 | (0.22 | ) | — | — | (0.22 | ) | — | (0.01 | ) | 10.82 | 1.94 | 75,456 | 0.92 | (7) | 1.11 | 2.02 | 58 | |||||||||||||||||||||||||||||||||||||||||||||||||||||||||||||||||
1/1/13 to 12/31/13 | 10.96 | 0.21 | (0.13 | ) | 0.08 | (0.21 | ) | — | — | (0.21 | ) | — | (0.13 | ) | 10.83 | 0.76 | 39,436 | 0.95 | 1.14 | 1.93 | 51 | ||||||||||||||||||||||||||||||||||||||||||||||||||||||||||||||||||
1/1/12 to 12/31/12 | 10.54 | 0.23 | 0.41 | 0.64 | (0.22 | ) | — | — | (0.22 | ) | — | 0.42 | 10.96 | 6.14 | 28,266 | 0.96 | (12) | 1.20 | 2.12 | 87 | (13) | ||||||||||||||||||||||||||||||||||||||||||||||||||||||||||||||||||
1/1/11 to 12/31/11 | 10.51 | 0.28 | 0.03 | 0.31 | (0.28 | ) | — | — | (0.28 | ) | — | 0.03 | 10.54 | 2.99 | 15,145 | 0.95 | 1.13 | 2.62 | 47 | ||||||||||||||||||||||||||||||||||||||||||||||||||||||||||||||||||||
Class C | |||||||||||||||||||||||||||||||||||||||||||||||||||||||||||||||||||||||||||||||||||||||
1/1/16 to 9/30/16(14) | $ | 10.70 | 0.09 | 0.19 | 0.28 | (0.08 | ) | — | — | (0.08 | ) | — | 0.20 | $ | 10.90 | 2.67 | %(4) | $ | 46,642 | 1.51 | %(3)(12) | 1.87 | %(3) | 1.15 | %(3) | 38 | %(4) | ||||||||||||||||||||||||||||||||||||||||||||||||||||||||||||
1/1/15 to 12/31/15 | 10.82 | 0.11 | (0.10 | ) | 0.01 | (0.10 | ) | — | (0.03 | ) | (0.13 | ) | — | (5) | (0.12 | ) | 10.70 | 0.13 | (11) | 44,621 | 1.50 | 1.86 | 1.02 | 56 | |||||||||||||||||||||||||||||||||||||||||||||||||||||||||||||||
1/1/14 to 12/31/14 | 10.84 | 0.14 | (0.02 | ) | 0.12 | (0.14 | ) | — | — | (0.14 | ) | — | (0.02 | ) | 10.82 | 1.08 | 51,303 | 1.68 | (7) | 1.87 | 1.28 | 58 | |||||||||||||||||||||||||||||||||||||||||||||||||||||||||||||||||
1/1/13 to 12/31/13 | 10.97 | 0.13 | (0.13 | ) | — | (0.13 | ) | — | — | (0.13 | ) | — | (0.13 | ) | 10.84 | 0.01 | 25,463 | 1.70 | 1.89 | 1.17 | 51 | ||||||||||||||||||||||||||||||||||||||||||||||||||||||||||||||||||
1/1/12 to 12/31/12 | 10.54 | 0.15 | 0.42 | 0.57 | (0.14 | ) | — | — | (0.14 | ) | — | 0.43 | 10.97 | 5.44 | 20,156 | 1.71 | (12) | 1.95 | 1.38 | 87 | (13) | ||||||||||||||||||||||||||||||||||||||||||||||||||||||||||||||||||
1/1/11 to 12/31/11 | 10.51 | 0.20 | 0.03 | 0.23 | (0.20 | ) | — | — | (0.20 | ) | — | 0.03 | 10.54 | 2.23 | 13,761 | 1.70 | 1.88 | 1.86 | 47 | ||||||||||||||||||||||||||||||||||||||||||||||||||||||||||||||||||||
Class I | |||||||||||||||||||||||||||||||||||||||||||||||||||||||||||||||||||||||||||||||||||||||
1/1/16 to 9/30/16(14) | $ | 10.70 | 0.17 | 0.20 | 0.37 | (0.17 | ) | — | — | (0.17 | ) | — | 0.20 | $ | 10.90 | 3.44 | %(4) | $ | 251,630 | 0.52 | %(3)(12) | 0.87 | %(3) | 2.15 | %(3) | 38 | %(4) | ||||||||||||||||||||||||||||||||||||||||||||||||||||||||||||
1/1/15 to 12/31/15 | 10.81 | 0.22 | (0.09 | ) | 0.13 | (0.21 | ) | — | (0.03 | ) | (0.24 | ) | — | (5) | (0.11 | ) | 10.70 | 1.24 | (11) | 150,977 | 0.50 | 0.88 | 2.03 | 56 | |||||||||||||||||||||||||||||||||||||||||||||||||||||||||||||||
1/1/14 to 12/31/14 | 10.83 | 0.25 | (0.02 | ) | 0.23 | (0.25 | ) | — | — | (0.25 | ) | — | (0.02 | ) | 10.81 | 2.10 | 92,794 | 0.68 | (7) | 0.91 | 2.27 | 58 | |||||||||||||||||||||||||||||||||||||||||||||||||||||||||||||||||
1/1/13 to 12/31/13 | 10.96 | 0.24 | (0.13 | ) | 0.11 | (0.24 | ) | — | — | (0.24 | ) | — | (0.13 | ) | 10.83 | 1.02 | 52,790 | 0.70 | 0.94 | 2.18 | 51 | ||||||||||||||||||||||||||||||||||||||||||||||||||||||||||||||||||
1/1/12 to 12/31/12 | 10.54 | 0.26 | 0.41 | 0.67 | (0.25 | ) | — | — | (0.25 | ) | — | 0.42 | 10.96 | 6.40 | 29,513 | 0.73 | (12) | 0.99 | 2.40 | 87 | (13) | ||||||||||||||||||||||||||||||||||||||||||||||||||||||||||||||||||
1/1/11 to 12/31/11 | 10.51 | 0.31 | 0.03 | 0.34 | (0.31 | ) | — | — | (0.31 | ) | — | 0.03 | 10.54 | 3.25 | 65,206 | 0.70 | 0.93 | 2.91 | 47 | ||||||||||||||||||||||||||||||||||||||||||||||||||||||||||||||||||||
| Low Volatility | |||||||||||||||||||||||||||||||||||||||||||||||||||||||||||||||||||||||||||||||||||||||
Equity Fund | |||||||||||||||||||||||||||||||||||||||||||||||||||||||||||||||||||||||||||||||||||||||
Class A | |||||||||||||||||||||||||||||||||||||||||||||||||||||||||||||||||||||||||||||||||||||||
10/1/15 to 9/30/16 | $ | 11.45 | 0.05 | 0.28 | 0.33 | (0.04 | ) | (0.17 | ) | — | (0.21 | ) | — | 0.12 | $ | 11.57 | 2.82 | % | $ | 1,633 | 1.56 | %(10)(12) | 2.98 | % | 0.46 | % | 10 | % | |||||||||||||||||||||||||||||||||||||||||||||||||||||||||||
10/1/14 to 9/30/15 | 11.71 | 0.08 | (0.30 | ) | (0.22 | ) | (0.04 | ) | — | — | (0.04 | ) | — | (5) | (0.26 | ) | 11.45 | (1.88 | )(11) | 2,055 | 1.55 | 2.70 | 0.64 | 1 | |||||||||||||||||||||||||||||||||||||||||||||||||||||||||||||||
10/1/13 to 9/30/14 | 10.24 | 0.06 | 1.50 | 1.56 | (0.09 | ) | — | — | (0.09 | ) | — | 1.47 | 11.71 | 15.23 | 485 | 1.55 | 6.15 | 0.56 | 3 | ||||||||||||||||||||||||||||||||||||||||||||||||||||||||||||||||||||
6/11/13(6) to 9/30/13 | 10.00 | 0.06 | 0.18 | 0.24 | — | — | — | — | — | 0.24 | 10.24 | 2.40 | (4) | 136 | 1.55 | (3) | 7.66 | (3) | 2.00 | (3) | 0 | ||||||||||||||||||||||||||||||||||||||||||||||||||||||||||||||||||
Class C | |||||||||||||||||||||||||||||||||||||||||||||||||||||||||||||||||||||||||||||||||||||||
10/1/15 to 9/30/16 | $ | 11.32 | (0.04 | ) | 0.28 | 0.24 | — | (0.17 | ) | — | (0.17 | ) | — | 0.07 | $ | 11.39 | 2.05 | % | $ | 491 | 2.31 | %(10)(12) | 3.64 | % | (0.39 | )% | 10 | % | |||||||||||||||||||||||||||||||||||||||||||||||||||||||||||
10/1/14 to 9/30/15 | 11.64 | 0.01 | (0.31 | ) | (0.30 | ) | (0.02 | ) | — | — | (0.02 | ) | — | (5) | (0.32 | ) | 11.32 | (2.61 | )(11) | 1,423 | 2.30 | 3.47 | 0.04 | 1 | |||||||||||||||||||||||||||||||||||||||||||||||||||||||||||||||
10/1/13 to 9/30/14 | 10.21 | (0.02 | ) | 1.50 | 1.48 | (0.05 | ) | — | — | (0.05 | ) | — | 1.43 | 11.64 | 14.47 | 291 | 2.30 | 6.72 | (0.19 | ) | 3 | ||||||||||||||||||||||||||||||||||||||||||||||||||||||||||||||||||
6/11/13(6) to 9/30/13 | 10.00 | 0.03 | 0.18 | 0.21 | — | — | — | — | — | 0.21 | 10.21 | 2.10 | (4) | 130 | 2.30 | (3) | 8.49 | (3) | 0.99 | (3) | 0 | ||||||||||||||||||||||||||||||||||||||||||||||||||||||||||||||||||
Class I | |||||||||||||||||||||||||||||||||||||||||||||||||||||||||||||||||||||||||||||||||||||||
10/1/15 to 9/30/16 | $ | 11.50 | 0.09 | 0.27 | 0.36 | (0.06 | ) | (0.17 | ) | — | (0.23 | ) | — | 0.13 | $ | 11.63 | 3.08 | % | $ | 1,606 | 1.32 | %(10)(12) | 2.78 | % | 0.80 | % | 10 | % | |||||||||||||||||||||||||||||||||||||||||||||||||||||||||||
10/1/14 to 9/30/15 | 11.73 | 0.09 | (0.27 | ) | (0.18 | ) | (0.05 | ) | — | — | (0.05 | ) | — | (5) | (0.23 | ) | 11.50 | (1.57 | )(11) | 1,581 | 1.30 | 2.62 | 0.79 | 1 | |||||||||||||||||||||||||||||||||||||||||||||||||||||||||||||||
10/1/13 to 9/30/14 | 10.25 | 0.07 | 1.51 | 1.58 | (0.10 | ) | — | — | (0.10 | ) | — | 1.48 | 11.73 | 15.45 | 1,539 | 1.30 | 5.32 | 0.67 | 3 | ||||||||||||||||||||||||||||||||||||||||||||||||||||||||||||||||||||
6/11/13(6) to 9/30/13 | 10.00 | �� | 0.07 | 0.18 | 0.25 | — | — | — | — | — | 0.25 | 10.25 | 2.50 | (4) | 1,332 | 1.30 | (3) | 7.51 | (3) | 2.23 | (3) | 0 | |||||||||||||||||||||||||||||||||||||||||||||||||||||||||||||||||
The footnote legend is at the end of the Financial Highlights.
See Notes to Financial Statements
97
Table of Contents
VIRTUS OPPORTUNITIES TRUST
FINANCIAL HIGHLIGHTS
SELECTED PER SHARE DATA AND RATIOS FOR A SHARE OUTSTANDING
THROUGHOUT EACH PERIOD
| Net Asset Value, Beginning of Period | Net Investment Income (Loss)(2) | Net Realized and Unrealized Gain (Loss) | Total from Investment Operations | Dividends from Net Investment Income | Distributions from Net Realized Gains | Return of Capital | Total Distributions | Payment from Affiliate | Change in Net Asset Value | Net Asset Value, End of Period | Total Return(1) | Net Assets, End of Period (in thousands) | Ratio of Net Expenses to Average Net Assets(8) | Ratio of Gross Expenses to Average Net Assets (before waivers and reimburse ments)(8) | Ratio of Net Investment Income (Loss) to Average Net Assets | Portfolio Turnover Rate | ||||||||||||||||||||||||||||||||||||||||||||||||||||||||||||||||||||||
| Multi-Sector Intermediate | |||||||||||||||||||||||||||||||||||||||||||||||||||||||||||||||||||||||||||||||||||||||
Bond Fund | |||||||||||||||||||||||||||||||||||||||||||||||||||||||||||||||||||||||||||||||||||||||
Class A | |||||||||||||||||||||||||||||||||||||||||||||||||||||||||||||||||||||||||||||||||||||||
10/1/15 to 9/30/16 | $ | 9.76 | 0.47 | 0.49 | 0.96 | (0.42 | ) | — | — | (0.42 | ) | — | 0.54 | $ | 10.30 | 10.15 | % | $ | 98,969 | 1.14 | %(10)(12) | 1.15 | % | 4.80 | % | 60 | % | ||||||||||||||||||||||||||||||||||||||||||||||||||||||||||||
10/1/14 to 9/30/15 | 10.70 | 0.49 | (0.85 | ) | (0.36 | ) | (0.40 | ) | (0.13 | ) | (0.05 | ) | (0.58 | ) | — | (5) | (0.94 | ) | 9.76 | (3.41 | )(11) | 104,833 | 1.10 | 1.10 | 4.81 | 66 | |||||||||||||||||||||||||||||||||||||||||||||||||||||||||||||
10/1/13 to 9/30/14 | 10.77 | 0.54 | 0.11 | 0.65 | (0.52 | ) | (0.20 | ) | — | (0.72 | ) | — | (0.07 | ) | 10.70 | 6.18 | 119,423 | 1.11 | 1.11 | 5.00 | 54 | ||||||||||||||||||||||||||||||||||||||||||||||||||||||||||||||||||
10/1/12 to 9/30/13 | 11.15 | 0.57 | (0.28 | ) | 0.29 | (0.55 | ) | (0.12 | ) | — | (0.67 | ) | — | (0.38 | ) | 10.77 | 2.59 | 184,524 | 1.10 | 1.10 | 5.13 | 77 | |||||||||||||||||||||||||||||||||||||||||||||||||||||||||||||||||
10/1/11 to 9/30/12 | 10.24 | 0.62 | 0.93 | 1.55 | (0.64 | ) | — | — | (0.64 | ) | — | 0.91 | 11.15 | 15.51 | 196,554 | 1.13 | 1.13 | 5.73 | 76 | ||||||||||||||||||||||||||||||||||||||||||||||||||||||||||||||||||||
Class B | |||||||||||||||||||||||||||||||||||||||||||||||||||||||||||||||||||||||||||||||||||||||
10/1/15 to 9/30/16 | $ | 9.73 | 0.39 | 0.50 | 0.89 | (0.35 | ) | — | — | (0.35 | ) | — | 0.54 | $ | 10.27 | 9.36 | % | $ | 1,717 | 1.88 | %(10)(12) | 1.90 | % | 4.04 | % | 60 | % | ||||||||||||||||||||||||||||||||||||||||||||||||||||||||||||
10/1/14 to 9/30/15 | 10.67 | 0.41 | (0.84 | ) | (0.43 | ) | (0.33 | ) | (0.13 | ) | (0.05 | ) | (0.51 | ) | — | (5) | (0.94 | ) | 9.73 | (4.14 | )(11) | 2,868 | 1.85 | 1.85 | 4.01 | 66 | |||||||||||||||||||||||||||||||||||||||||||||||||||||||||||||
10/1/13 to 9/30/14 | 10.74 | 0.46 | 0.11 | 0.57 | (0.44 | ) | (0.20 | ) | — | (0.64 | ) | — | (0.07 | ) | 10.67 | 5.40 | 5,360 | 1.86 | 1.86 | 4.26 | 54 | ||||||||||||||||||||||||||||||||||||||||||||||||||||||||||||||||||
10/1/12 to 9/30/13 | 11.12 | 0.49 | (0.28 | ) | 0.21 | (0.47 | ) | (0.12 | ) | — | (0.59 | ) | — | (0.38 | ) | 10.74 | 1.83 | 7,603 | 1.85 | 1.85 | 4.39 | 77 | |||||||||||||||||||||||||||||||||||||||||||||||||||||||||||||||||
10/1/11 to 9/30/12 | 10.22 | 0.54 | 0.92 | 1.46 | (0.56 | ) | — | — | (0.56 | ) | — | 0.90 | 11.12 | 14.59 | 9,974 | 1.88 | 1.88 | 5.02 | 76 | ||||||||||||||||||||||||||||||||||||||||||||||||||||||||||||||||||||
Class C | |||||||||||||||||||||||||||||||||||||||||||||||||||||||||||||||||||||||||||||||||||||||
10/1/15 to 9/30/16 | $ | 9.85 | 0.40 | 0.50 | 0.90 | (0.35 | ) | — | — | (0.35 | ) | — | 0.55 | $ | 10.40 | 9.34 | % | $ | 75,350 | 1.88 | %(10)(12) | 1.90 | % | 4.04 | % | 60 | % | ||||||||||||||||||||||||||||||||||||||||||||||||||||||||||||
10/1/14 to 9/30/15 | 10.79 | 0.42 | (0.85 | ) | (0.43 | ) | (0.33 | ) | (0.13 | ) | (0.05 | ) | (0.51 | ) | — | (5) | (0.94 | ) | 9.85 | (4.11 | )(11) | 84,099 | 1.85 | 1.85 | 4.06 | 66 | |||||||||||||||||||||||||||||||||||||||||||||||||||||||||||||
10/1/13 to 9/30/14 | 10.86 | 0.47 | 0.10 | 0.57 | (0.44 | ) | (0.20 | ) | — | (0.64 | ) | — | (0.07 | ) | 10.79 | 5.33 | 96,072 | 1.86 | 1.86 | 4.25 | 54 | ||||||||||||||||||||||||||||||||||||||||||||||||||||||||||||||||||
10/1/12 to 9/30/13 | 11.23 | 0.49 | (0.27 | ) | 0.22 | (0.47 | ) | (0.12 | ) | — | (0.59 | ) | — | (0.37 | ) | 10.86 | 1.90 | 104,591 | 1.85 | 1.85 | 4.39 | 77 | |||||||||||||||||||||||||||||||||||||||||||||||||||||||||||||||||
10/1/11 to 9/30/12 | 10.31 | 0.54 | 0.94 | 1.48 | (0.56 | ) | — | — | (0.56 | ) | — | 0.92 | 11.23 | 14.65 | 108,595 | 1.88 | 1.88 | 4.98 | 76 | ||||||||||||||||||||||||||||||||||||||||||||||||||||||||||||||||||||
Class I | |||||||||||||||||||||||||||||||||||||||||||||||||||||||||||||||||||||||||||||||||||||||
10/1/15 to 9/30/16 | $ | 9.77 | 0.50 | 0.49 | 0.99 | (0.45 | ) | — | — | (0.45 | ) | — | 0.54 | $ | 10.31 | 10.42 | % | $ | 123,435 | 0.88 | %(10)(12) | 0.90 | % | 5.04 | % | 60 | % | ||||||||||||||||||||||||||||||||||||||||||||||||||||||||||||
10/1/14 to 9/30/15 | 10.71 | 0.52 | (0.85 | ) | (0.33 | ) | (0.43 | ) | (0.13 | ) | (0.05 | ) | (0.61 | ) | — | (5) | (0.94 | ) | 9.77 | (3.17 | )(11) | 138,956 | 0.85 | 0.85 | 5.06 | 66 | |||||||||||||||||||||||||||||||||||||||||||||||||||||||||||||
10/1/13 to 9/30/14 | 10.77 | 0.57 | 0.12 | 0.69 | (0.55 | ) | (0.20 | ) | — | (0.75 | ) | — | (0.06 | ) | 10.71 | 6.54 | 144,298 | 0.86 | 0.86 | 5.24 | 54 | ||||||||||||||||||||||||||||||||||||||||||||||||||||||||||||||||||
10/1/12 to 9/30/13 | 11.15 | 0.60 | (0.28 | ) | 0.32 | (0.58 | ) | (0.12 | ) | — | (0.70 | ) | — | (0.38 | ) | 10.77 | 2.85 | 86,387 | 0.85 | 0.85 | 5.38 | 77 | |||||||||||||||||||||||||||||||||||||||||||||||||||||||||||||||||
10/1/11 to 9/30/12 | 10.24 | 0.64 | 0.93 | 1.57 | (0.66 | ) | — | — | (0.66 | ) | — | 0.91 | 11.15 | 15.80 | 74,847 | 0.88 | 0.88 | 5.93 | 76 | ||||||||||||||||||||||||||||||||||||||||||||||||||||||||||||||||||||
Class R6 | |||||||||||||||||||||||||||||||||||||||||||||||||||||||||||||||||||||||||||||||||||||||
10/1/15 to 9/30/16 | $ | 9.77 | 0.50 | 0.50 | 1.00 | (0.46 | ) | — | — | (0.46 | ) | — | 0.54 | $ | 10.31 | 10.50 | % | $ | 2,004 | 0.81 | %(10)(12) | 0.83 | % | 5.12 | % | 60 | % | ||||||||||||||||||||||||||||||||||||||||||||||||||||||||||||
11/14/14(6) to 9/30/15 | 10.67 | 0.46 | (0.81 | ) | (0.35 | ) | (0.37 | ) | (0.13 | ) | (0.05 | ) | (0.55 | ) | — | (5) | (0.90 | ) | 9.77 | (3.31 | )(4)(11) | 1,778 | 0.76 | 0.77 | (3) | 5.12 | (3) | 66 | |||||||||||||||||||||||||||||||||||||||||||||||||||||||||||
The footnote legend is at the end of the Financial Highlights.
See Notes to Financial Statements
98
Table of Contents
VIRTUS OPPORTUNITIES TRUST
FINANCIAL HIGHLIGHTS
SELECTED PER SHARE DATA AND RATIOS FOR A SHARE OUTSTANDING
THROUGHOUT EACH PERIOD
| Net Asset Value, Beginning of Period | Net Investment Income (Loss)(2) | Net Realized and Unrealized Gain (Loss) | Total from Investment Operations | Dividends from Net Investment Income | Distributions from Net Realized Gains | Total Distributions | Payment from Affiliate | Change in Net Asset Value | Net Asset Value, End of Period | Total Return(1) | Net Assets, End of Period (in thousands) | Ratio of Net Expenses to Average Net Assets(8) | Ratio of Gross Expenses to Average Net Assets(8) | Ratio of Net Investment Income to Average Net Assets | Portfolio Turnover Rate | ||||||||||||||||||||||||||||||||||||||||||||||||||||||||||||||||||
| Senior Floating | ||||||||||||||||||||||||||||||||||||||||||||||||||||||||||||||||||||||||||||||||||
Rate Fund | ||||||||||||||||||||||||||||||||||||||||||||||||||||||||||||||||||||||||||||||||||
Class A | ||||||||||||||||||||||||||||||||||||||||||||||||||||||||||||||||||||||||||||||||||
10/1/15 to 9/30/16 | $ | 9.36 | 0.34 | 0.06 | 0.40 | (0.34 | ) | — | (0.34 | ) | — | 0.06 | $ | 9.42 | 4.42 | % | $ | 227,588 | 1.23 | %(9)(10)(12) | 1.24 | % | 3.67 | % | 48 | % | ||||||||||||||||||||||||||||||||||||||||||||||||||||||||
10/1/14 to 9/30/15 | 9.72 | 0.38 | (0.32 | ) | 0.06 | (0.39 | ) | (0.03 | ) | (0.42 | ) | — | (5) | (0.36 | ) | 9.36 | 0.53 | (11) | 268,596 | 1.20 | (9) | 1.20 | 3.94 | 34 | ||||||||||||||||||||||||||||||||||||||||||||||||||||||||||
10/1/13 to 9/30/14 | 9.79 | 0.37 | (0.07 | ) | 0.30 | (0.37 | ) | — | (0.37 | ) | — | (0.07 | ) | 9.72 | 3.08 | 294,617 | 1.18 | (9) | 1.18 | 3.79 | 77 | |||||||||||||||||||||||||||||||||||||||||||||||||||||||||||||
10/1/12 to 9/30/13 | 9.79 | 0.42 | 0.04 | 0.46 | (0.46 | ) | (— | )(5) | (0.46 | ) | — | — | 9.79 | 4.84 | 386,113 | 1.21 | (9) | 1.21 | 4.29 | 68 | ||||||||||||||||||||||||||||||||||||||||||||||||||||||||||||||
10/1/11 to 9/30/12 | 9.28 | 0.49 | 0.49 | 0.98 | (0.47 | ) | — | (0.47 | ) | — | 0.51 | 9.79 | 10.75 | 256,397 | 1.23 | (9) | 1.23 | 5.06 | 56 | |||||||||||||||||||||||||||||||||||||||||||||||||||||||||||||||
Class C | ||||||||||||||||||||||||||||||||||||||||||||||||||||||||||||||||||||||||||||||||||
10/1/15 to 9/30/16 | $ | 9.37 | 0.27 | 0.06 | 0.33 | (0.27 | ) | — | (0.27 | ) | — | 0.06 | $ | 9.43 | 3.63 | % | $ | 111,839 | 1.98 | %(9)(10)(12) | 1.99 | % | 2.92 | % | 48 | % | ||||||||||||||||||||||||||||||||||||||||||||||||||||||||
10/1/14 to 9/30/15 | 9.73 | 0.31 | (0.33 | ) | (0.02 | ) | (0.31 | ) | (0.03 | ) | (0.34 | ) | — | (5) | (0.36 | ) | 9.37 | (0.22 | )(11) | 138,478 | 1.95 | (9) | 1.95 | 3.19 | 34 | |||||||||||||||||||||||||||||||||||||||||||||||||||||||||
10/1/13 to 9/30/14 | 9.81 | 0.30 | (0.08 | ) | 0.22 | (0.30 | ) | — | (0.30 | ) | — | (0.08 | ) | 9.73 | 2.20 | 177,485 | 1.93 | (9) | 1.93 | 3.04 | 77 | |||||||||||||||||||||||||||||||||||||||||||||||||||||||||||||
10/1/12 to 9/30/13 | 9.80 | 0.35 | 0.05 | 0.40 | (0.39 | ) | (— | )(5) | (0.39 | ) | — | 0.01 | 9.81 | 4.15 | 182,667 | 1.96 | (9) | 1.96 | 3.51 | 68 | ||||||||||||||||||||||||||||||||||||||||||||||||||||||||||||||
10/1/11 to 9/30/12 | 9.29 | 0.41 | 0.50 | 0.91 | (0.40 | ) | — | (0.40 | ) | — | 0.51 | 9.80 | 9.92 | 95,078 | 1.98 | (9) | 1.98 | 4.31 | 56 | |||||||||||||||||||||||||||||||||||||||||||||||||||||||||||||||
Class I | ||||||||||||||||||||||||||||||||||||||||||||||||||||||||||||||||||||||||||||||||||
10/1/15 to 9/30/16 | $ | 9.35 | 0.36 | 0.06 | 0.42 | (0.36 | ) | — | (0.36 | ) | — | 0.06 | $ | 9.41 | 4.69 | % | $ | 210,752 | 0.97 | %(9)(10)(12) | 0.98 | % | 3.91 | % | 48 | % | ||||||||||||||||||||||||||||||||||||||||||||||||||||||||
10/1/14 to 9/30/15 | 9.71 | 0.40 | (0.32 | ) | 0.08 | (0.41 | ) | (0.03 | ) | (0.44 | ) | — | (5) | (0.36 | ) | 9.35 | 0.78 | (11) | 284,735 | 0.95 | (9) | 0.95 | 4.20 | 34 | ||||||||||||||||||||||||||||||||||||||||||||||||||||||||||
10/1/13 to 9/30/14 | 9.79 | 0.40 | (0.09 | ) | 0.31 | (0.39 | ) | — | (0.39 | ) | — | (0.08 | ) | 9.71 | 3.23 | 457,494 | 0.93 | (9) | 0.93 | 4.06 | 77 | |||||||||||||||||||||||||||||||||||||||||||||||||||||||||||||
10/1/12 to 9/30/13 | 9.78 | 0.43 | 0.07 | 0.50 | (0.49 | ) | (— | )(5) | (0.49 | ) | — | 0.01 | 9.79 | 5.21 | 381,791 | | 0.96 | (9) | 0.96 | 4.41 | 68 | |||||||||||||||||||||||||||||||||||||||||||||||||||||||||||||
10/1/11 to 9/30/12 | 9.27 | 0.51 | 0.49 | 1.00 | (0.49 | ) | — | (0.49 | ) | — | 0.51 | 9.78 | 11.04 | 94,193 | 0.98 | (9) | 0.98 | 5.31 | 56 | |||||||||||||||||||||||||||||||||||||||||||||||||||||||||||||||
| Tax-Exempt Bond | ||||||||||||||||||||||||||||||||||||||||||||||||||||||||||||||||||||||||||||||||||
Fund | ||||||||||||||||||||||||||||||||||||||||||||||||||||||||||||||||||||||||||||||||||
Class A | ||||||||||||||||||||||||||||||||||||||||||||||||||||||||||||||||||||||||||||||||||
1/1/16 to 9/30/16(14) | $ | 11.43 | 0.22 | 0.12 | 0.34 | (0.22 | ) | — | (0.22 | ) | — | 0.12 | $ | 11.55 | 3.00 | %(4) | $ | 69,711 | 0.87 | %(3)(12) | 1.03 | %(3) | 2.53 | %(3) | 9 | %(4) | ||||||||||||||||||||||||||||||||||||||||||||||||||||||||
1/1/15 to 12/31/15 | 11.46 | 0.30 | (0.03 | ) | 0.27 | (0.29 | ) | (0.01 | ) | (0.30 | ) | — | (0.03 | ) | 11.43 | 2.39 | 74,418 | 0.85 | 1.00 | 2.60 | 10 | |||||||||||||||||||||||||||||||||||||||||||||||||||||||||||||
1/1/14 to 12/31/14 | 10.91 | 0.31 | 0.56 | 0.87 | (0.32 | ) | — | (5) | (0.32 | ) | — | 0.55 | 11.46 | 7.94 | 79,906 | 0.85 | 0.99 | 2.73 | 22 | |||||||||||||||||||||||||||||||||||||||||||||||||||||||||||||||
1/1/13 to 12/31/13 | 11.62 | 0.30 | (0.71 | ) | (0.41 | ) | (0.30 | ) | — | (0.30 | ) | — | (0.71 | ) | 10.91 | (3.48 | ) | 89,303 | 0.85 | 0.98 | 2.66 | 29 | ||||||||||||||||||||||||||||||||||||||||||||||||||||||||||||
1/1/12 to 12/31/12 | 11.10 | 0.30 | 0.52 | 0.82 | (0.30 | ) | — | (0.30 | ) | — | 0.52 | 11.62 | 7.45 | 143,397 | 0.87 | (12) | 1.00 | 2.61 | 35 | |||||||||||||||||||||||||||||||||||||||||||||||||||||||||||||||
1/1/11 to 12/31/11 | 10.38 | 0.39 | 0.74 | 1.13 | (0.41 | ) | — | (0.41 | ) | — | 0.72 | 11.10 | 10.98 | 107,873 | 0.81 | 0.98 | 3.62 | 59 | ||||||||||||||||||||||||||||||||||||||||||||||||||||||||||||||||
Class C | ||||||||||||||||||||||||||||||||||||||||||||||||||||||||||||||||||||||||||||||||||
1/1/16 to 9/30/16(14) | $ | 11.43 | 0.15 | 0.13 | 0.28 | (0.16 | ) | — | (0.16 | ) | — | 0.12 | $ | 11.55 | 2.42 | %(4) | $ | 26,833 | 1.61 | %(3)(12) | 1.78 | %(3) | 1.78 | %(3) | 9 | %(4) | ||||||||||||||||||||||||||||||||||||||||||||||||||||||||
1/1/15 to 12/31/15 | 11.46 | 0.21 | (0.03 | ) | 0.18 | (0.20 | ) | (0.01 | ) | (0.21 | ) | — | (0.03 | ) | 11.43 | 1.62 | 30,316 | 1.60 | 1.75 | 1.85 | 10 | |||||||||||||||||||||||||||||||||||||||||||||||||||||||||||||
1/1/14 to 12/31/14 | 10.92 | 0.22 | 0.55 | 0.77 | (0.23 | ) | — | (5) | (0.23 | ) | — | 0.54 | 11.46 | 7.13 | 30,967 | 1.60 | 1.74 | 1.98 | 22 | |||||||||||||||||||||||||||||||||||||||||||||||||||||||||||||||
1/1/13 to 12/31/13 | 11.63 | 0.22 | (0.72 | ) | (0.50 | ) | (0.21 | ) | — | (0.21 | ) | — | (0.71 | ) | 10.92 | (4.29 | ) | 28,845 | 1.60 | 1.73 | 1.92 | 29 | ||||||||||||||||||||||||||||||||||||||||||||||||||||||||||||
1/1/12 to 12/31/12 | 11.10 | 0.21 | 0.54 | 0.75 | (0.22 | ) | — | (0.22 | ) | — | 0.53 | 11.63 | 6.74 | 39,792 | 1.62 | (12) | 1.75 | 1.86 | 35 | |||||||||||||||||||||||||||||||||||||||||||||||||||||||||||||||
1/1/11 to 12/31/11 | 10.38 | 0.31 | 0.74 | 1.05 | (0.33 | ) | — | (0.33 | ) | — | 0.72 | 11.10 | 10.15 | 28,641 | 1.54 | 1.70 | 2.91 | 59 | ||||||||||||||||||||||||||||||||||||||||||||||||||||||||||||||||
Class I | ||||||||||||||||||||||||||||||||||||||||||||||||||||||||||||||||||||||||||||||||||
1/1/16 to 9/30/16(14) | $ | 11.43 | 0.24 | 0.12 | 0.36 | (0.24 | ) | — | (0.24 | ) | — | 0.12 | $ | 11.55 | 3.19 | %(4) | $ | 104,679 | 0.62 | %(3)(12) | 0.78 | %(3) | 2.78 | %(3) | 9 | %(4) | ||||||||||||||||||||||||||||||||||||||||||||||||||||||||
1/1/15 to 12/31/15 | 11.46 | 0.33 | (0.03 | ) | 0.30 | (0.32 | ) | (0.01 | ) | (0.33 | ) | — | (0.03 | ) | 11.43 | 2.64 | 90,912 | 0.60 | 0.77 | 2.85 | 10 | |||||||||||||||||||||||||||||||||||||||||||||||||||||||||||||
1/1/14 to 12/31/14 | 10.91 | 0.34 | 0.56 | 0.90 | (0.35 | ) | — | (5) | (0.35 | ) | — | 0.55 | 11.46 | 8.30 | 86,459 | 0.60 | 0.79 | 2.98 | 22 | |||||||||||||||||||||||||||||||||||||||||||||||||||||||||||||||
1/1/13 to 12/31/13 | 11.62 | 0.33 | (0.71 | ) | (0.38 | ) | (0.33 | ) | — | (0.33 | ) | — | (0.71 | ) | 10.91 | (3.33 | ) | 82,936 | 0.60 | 0.77 | 2.88 | 29 | ||||||||||||||||||||||||||||||||||||||||||||||||||||||||||||
1/1/12 to 12/31/12 | 11.10 | 0.33 | 0.52 | 0.85 | (0.33 | ) | — | (0.33 | ) | — | 0.52 | 11.62 | 7.72 | 162,094 | 0.62 | (12) | 0.79 | 2.84 | 35 | |||||||||||||||||||||||||||||||||||||||||||||||||||||||||||||||
1/1/11 to 12/31/11 | 10.38 | 0.41 | 0.74 | 1.15 | (0.43 | ) | — | (0.43 | ) | — | 0.72 | 11.10 | 11.36 | 94,228 | 0.57 | 0.77 | 3.78 | 59 | ||||||||||||||||||||||||||||||||||||||||||||||||||||||||||||||||
The footnote legend is at the end of the Financial Highlights.
See Notes to Financial Statements
99
Table of Contents
VIRTUS OPPORTUNITIES TRUST
FINANCIAL HIGHLIGHTS
SELECTED PER SHARE DATA AND RATIOS FOR A SHARE OUTSTANDING
THROUGHOUT EACH PERIOD
| Net Asset Value, Beginning of Period | Net Investment Income (Loss)(2) | Net Realized and Unrealized Gain (Loss) | Total from Investment Operations | Dividends from Net Investment Income | Distributions from Net Realized Gains | Total Distributions | Change in Net Asset Value | Net Asset Value, End of Period | Total Return(1) | Net Assets, End of Period (in thousands) | Ratio of Net Expenses to Average Net Assets(8) | Ratio of Gross Expenses to Average Net Assets(8) | Ratio of Net Investment Income to Average Net Assets | Portfolio Turnover Rate | ||||||||||||||||||||||||||||||||||||||||||||||||||||||||||||||
Wealth Masters | |||||||||||||||||||||||||||||||||||||||||||||||||||||||||||||||||||||||||||||
Fund | |||||||||||||||||||||||||||||||||||||||||||||||||||||||||||||||||||||||||||||
Class A | |||||||||||||||||||||||||||||||||||||||||||||||||||||||||||||||||||||||||||||
10/1/15 to 9/30/16 | $ | 13.25 | 0.07 | 1.55 | 1.62 | (0.03 | ) | (0.24 | ) | (0.27 | ) | 1.35 | $ | 14.60 | 12.44 | % | $ | 33,204 | 1.46 | %(10)(12) | 1.54 | % | 0.53 | % | 30 | % | |||||||||||||||||||||||||||||||||||||||||||||||||||
10/1/14 to 9/30/15 | 14.50 | 0.05 | (0.98 | ) | (0.93 | ) | (0.05 | ) | (0.27 | ) | (0.32 | ) | (1.25 | ) | 13.25 | (6.74 | ) | 54,109 | 1.45 | 1.46 | 0.36 | 51 | |||||||||||||||||||||||||||||||||||||||||||||||||||||||
10/1/13 to 9/30/14 | 13.12 | 0.02 | 1.37 | 1.39 | — | (0.01 | ) | (0.01 | ) | 1.38 | 14.50 | 10.67 | 55,881 | 1.45 | 1.46 | 0.11 | 62 | ||||||||||||||||||||||||||||||||||||||||||||||||||||||||||||
10/1/12 to 9/30/13 | 10.22 | (0.01 | ) | 3.05 | 3.04 | (0.09 | ) | (0.05 | ) | (0.14 | ) | 2.90 | 13.12 | 30.09 | 5,169 | 1.45 | 3.29 | (0.10 | ) | 22 | |||||||||||||||||||||||||||||||||||||||||||||||||||||||||
9/5/12(6) to 9/30/12 | 10.00 | 0.01 | 0.21 | 0.22 | — | — | — | 0.22 | 10.22 | 2.20 | (4) | 106 | 1.45 | (3) | 44.72 | (3) | 0.78 | (3) | 26 | (4) | |||||||||||||||||||||||||||||||||||||||||||||||||||||||||
Class C | |||||||||||||||||||||||||||||||||||||||||||||||||||||||||||||||||||||||||||||
10/1/15 to 9/30/16 | $ | 13.02 | (0.03 | ) | 1.51 | 1.48 | — | (0.24 | ) | (0.24 | ) | 1.24 | $ | 14.26 | 11.56 | % | $ | 24,816 | 2.21 | %(10)(12) | 2.29 | % | (0.22 | )% | 30 | % | |||||||||||||||||||||||||||||||||||||||||||||||||||
10/1/14 to 9/30/15 | 14.32 | (0.06 | ) | (0.97 | ) | (1.03 | ) | — | (0.27 | ) | (0.27 | ) | (1.30 | ) | 13.02 | (7.41 | ) | 34,171 | 2.20 | 2.21 | (0.39 | ) | 51 | ||||||||||||||||||||||||||||||||||||||||||||||||||||||
10/1/13 to 9/30/14 | 13.04 | (0.09 | ) | 1.38 | 1.29 | — | (0.01 | ) | (0.01 | ) | 1.28 | 14.32 | 9.90 | 30,511 | 2.20 | 2.22 | (0.65 | ) | 62 | ||||||||||||||||||||||||||||||||||||||||||||||||||||||||||
10/1/12 to 9/30/13 | 10.21 | (0.08 | ) | 3.03 | 2.95 | (0.07 | ) | (0.05 | ) | (0.12 | ) | 2.83 | 13.04 | 29.11 | 1,742 | 2.20 | 4.41 | (0.66 | ) | 22 | |||||||||||||||||||||||||||||||||||||||||||||||||||||||||
9/5/12(6) to 9/30/12 | 10.00 | (— | )(5) | 0.21 | 0.21 | — | — | — | 0.21 | 10.21 | 2.10 | (4) | 107 | 2.20 | (3) | 45.67 | (3) | 0.04 | (3) | 26 | (4) | ||||||||||||||||||||||||||||||||||||||||||||||||||||||||
Class I | |||||||||||||||||||||||||||||||||||||||||||||||||||||||||||||||||||||||||||||
10/1/15 to 9/30/16 | $ | 13.30 | 0.08 | 1.58 | 1.66 | (0.06 | ) | (0.24 | ) | (0.30 | ) | 1.36 | $ | 14.66 | 12.75 | % | $ | 20,134 | 1.21 | %(10)(12) | 1.29 | % | 0.61 | % | 30 | % | |||||||||||||||||||||||||||||||||||||||||||||||||||
10/1/14 to 9/30/15 | 14.56 | 0.09 | (1.00 | ) | (0.91 | ) | (0.08 | ) | (0.27 | ) | (0.35 | ) | (1.26 | ) | 13.30 | (6.53 | ) | 32,495 | 1.20 | 1.21 | 0.62 | 51 | |||||||||||||||||||||||||||||||||||||||||||||||||||||||
10/1/13 to 9/30/14 | 13.14 | 0.05 | 1.39 | 1.44 | (0.01 | ) | (0.01 | ) | (0.02 | ) | 1.42 | 14.56 | 10.96 | 48,918 | 1.20 | 1.20 | 0.33 | 62 | |||||||||||||||||||||||||||||||||||||||||||||||||||||||||||
10/1/12 to 9/30/13 | 10.22 | 0.06 | 3.01 | 3.07 | (0.10 | ) | (0.05 | ) | (0.15 | ) | 2.92 | 13.14 | 30.37 | 44,813 | 1.20 | 4.64 | 0.52 | 22 | |||||||||||||||||||||||||||||||||||||||||||||||||||||||||||
9/5/12(6) to 9/30/12 | 10.00 | 0.01 | 0.21 | 0.22 | — | — | — | 0.22 | 10.22 | 2.20 | (4) | 818 | 1.20 | (3) | 44.40 | (3) | 1.04 | (3) | 26 | (4) | |||||||||||||||||||||||||||||||||||||||||||||||||||||||||
Footnote Legend
| (1) | Sales charges, where applicable, are not reflected in the total return calculation. |
| (2) | Computed using average shares outstanding. |
| (3) | Annualized. |
| (4) | Not annualized. |
| (5) | Amount is less than $0.005 per share. |
| (6) | Inception date. |
| (7) | Due to a change in expense ratio, the ratio shown is a blended expense ratio. |
| (8) | The Funds will also indirectly bear their prorated share of expenses of the underlying funds in which they invest. Such expenses are not included in the calculation of this ratio. |
| (9) | The Fund is currently under its expense limitation. |
| (10) | Earnings credits from the custodian were not material, as reflected in the Statements of Operations and had no impact on the Financial Highlights. |
| (11) | Payment from affiliate had no impact on total return. |
| (12) | Net expense ratio includes extraordinary proxy expenses. |
| (13) | Portfolio turnover calculation excludes security transactions that were distributed as a result of a redemption-in-kind. |
| (14) | The Fund changed its fiscal-year-end to September 30 during the period. |
See Notes to Financial Statements
100
Table of Contents
VIRTUS OPPORTUNITIES TRUST
SEPTEMBER 30, 2016
| Note 1. Organization |
Virtus Opportunities Trust (the “Trust”) is organized as a Delaware statutory trust and is registered under the Investment Company Act of 1940, as amended (“1940 Act”), as an open-end management investment company.
As of the date of this report, 31 funds of the Trust are offered for sale, of which ten (each a “Fund”) are reported in this annual report.
Each Fund’s investment objective is outlined in each Fund’s summary page.
| There | is no guarantee that a Fund will achieve its objective. |
All of the Funds offer Class A shares and Class C shares with the exception of the CA Tax-Exempt Bond Fund which does not offer Class C shares. All of the Funds offer Class I shares. Class B shares are no longer available for purchase by new or existing shareholders, except for existing shareholders through Qualifying Transactions. For information regarding Qualifying Transactions, refer to each Fund’s prospectus. The Multi-Sector Intermediate Bond Fund also offers Class R6 shares.
Class A shares of Low Duration Income Fund are sold with a front-end sales charge of 2.25% with some exceptions. Class A shares of the CA Tax-Exempt Bond Fund, Senior Floating Rate Fund and Tax-Exempt Bond Fund are sold with a front-end sales charge of up to 2.75% with some exceptions. Class A shares of the Bond Fund, High Yield Fund, and Multi-Sector Intermediate Bond Fund are sold with a front-end sales charge of up to 3.75% with some exceptions. Class A shares of the Essential Resources, Low Volatility Equity and Wealth Masters Funds are sold with a front-end sales charge of up to 5.75% with some exceptions. Generally, Class A shares are not subject to any charges by the Funds when redeemed; however, a 0.50% – 1% contingent deferred sales charge (“CDSC”) may be imposed on certain redemptions made within a certain period following purchases on which a finder’s fee has been paid. The period for which such CDSC applies for the Funds is 18 months. The CDSC period begins on the last day of the month preceding the month in which the purchase was made.
Class B shares were generally sold with a CDSC, which declines from 5% to zero depending on the period of time the shares are held. Class C shares are generally sold with a 1% CDSC, applicable if redeemed within one year of purchase. Class R6 and Class I shares are sold without a front-end sales charge or CDSC.
Class R6 shares are only available to participants in employer-sponsored retirement plans, such as 401(k) plans, profit-sharing plans, defined benefit plans and other employer-directed plans. Class R6 shares do not carry sales commissions or pay Rule 12b-1 fees. No compensation, administrative payments, sub-transfer agency payments or service payments are paid to brokers or other entities from fund assets or the Distributor’s or an affiliate’s resources on sales of or investments in Class R6 Shares.
Virtus Mutual Funds may impose an annual fee on accounts having balances of less than $2,500. The small account fee may be waived in certain circumstances, as disclosed in the prospectuses and/or statements of additional information. The fees collected will be used to offset certain expenses of the Funds. These fees are reflected as “Low Balance Account Fees” in each Fund’s Statement of Operations for the period, as applicable.
Each Class of shares has identical voting, dividend, liquidation and other rights and the same terms and conditions, except that each Class bears different distribution and/or service fees under a Board-approved Rule 12b-1 and/or shareholder servicing plan (“12b-1 plan”) and has exclusive voting rights with respect to such plans. Class I shares and Class R6 shares are not subject to a 12b-1 plan. Income and other expenses as well as realized and unrealized gains and losses of each Fund are borne pro rata by the holders of each class of shares.
| Note 2. Significant Accounting Policies |
The significant accounting policies consistently followed by the Trust in the preparation of its financial statements are summarized below and for derivatives, included in Note 3 below. The preparation of financial statements in conformity with accounting principles generally accepted in the United States of America requires management to make estimates and assumptions that affect the reported amounts of assets and liabilities, and disclosure of contingent assets and liabilities at the date of the financial statements and the reported amounts of increases and decreases in net assets from operations during the reporting period. Actual results could differ from those estimates and those differences could be significant.
| A. | Security Valuation |
Security valuation procedures for each Fund, which include nightly price variance as well as back-testing such as bi-weekly unchanged price, monthly secondary source and transaction analysis, have been approved by the Board of Trustees (the ���Board”, or the “Trustees”). All internally fair valued securities are approved by a valuation committee (the “Valuation Committee”) appointed by the Board. The Valuation Committee is comprised of certain members of management as identified to the Board and convenes independently from portfolio management. All internally fair valued securities, referred to below, are updated daily and reviewed in detail by the Valuation Committee monthly unless changes occur within the period. The Valuation Committee reviews the validity of the model inputs and any changes to the model. Quarterly fair valuations are reviewed by the Board.
Each Fund utilizes a fair value hierarchy which prioritizes the inputs to valuation techniques used to measure fair value into three broad levels. The Funds’ policy is to recognize transfers between levels at the end of the reporting period.
| • Level 1 – | quoted prices in active markets for identical securities (security types generally include listed equities). |
| • Level 2 – | prices determined using other significant observable inputs (including quoted prices for similar securities, interest rates, prepayment speeds, credit risk, etc.). |
| • Level 3 – | prices determined using significant unobservable inputs (including the Valuation Committee’s own assumptions in determining the fair value of investments). |
101
Table of Contents
VIRTUS OPPORTUNITIES TRUST
NOTES TO FINANCIAL STATEMENTS (Continued)
SEPTEMBER 30, 2016
A description of the valuation techniques applied to a Fund’s major categories of assets and liabilities measured at fair value on a recurring basis is as follows:
Equity securities are valued at the official closing price (typically last sale) on the exchange on which the securities are primarily traded or, if no closing price is available, at the last bid price and are categorized as Level 1 in the hierarchy. Restricted equity securities and private placements that are not widely traded, are illiquid, or are internally fair valued by the Valuation Committee, are generally categorized as Level 3 in the hierarchy.
Certain non-U.S. securities may be fair valued in cases where closing prices are not readily available or are deemed not reflective of readily available market prices. For example, significant events (such as movement in the U.S. securities market, or other regional and local developments) may occur between the time that non-U.S. markets close (where the security is principally traded) and the time that a Fund calculates its net asset value (“NAV”) (at the close of regular trading on the New York Stock Exchange (“NYSE”), generally 4 p.m. Eastern time) that may impact the value of securities traded in these non-U.S. markets. In such cases the Fund fair values non-U.S. securities using an independent pricing service which considers the correlation of the trading patterns of the non-U.S. security to the intraday trading in the U.S. markets for investments such as ADRs, financial futures, ETFs, and certain indexes, as well as prices for similar securities. Such fair valuations are categorized as Level 2 in the hierarchy. Because the frequency of significant events is not predictable, fair valuation of certain non-U.S. common stocks may occur on a frequent basis.
Debt securities, including restricted securities, are valued based on evaluated quotations received from independent pricing services or from dealers who make markets in such securities. For most bond types, the pricing service utilizes matrix pricing that considers one or more of the following factors: yield or price of bonds of comparable quality, coupon, maturity, current cash flows, type, and current day trade information, as well as dealer-supplied prices. These valuations are generally categorized as Level 2 in the hierarchy. Structured debt instruments such as mortgage-backed and asset-backed securities may also incorporate collateral analysis and utilize cash flow models for valuation and are generally categorized as Level 2 in the hierarchy. Pricing services do not provide pricing for all securities and therefore indicative bids from dealers are utilized which are based on pricing models used by market makers in the security and are generally categorized as Level 2 in the hierarchy. Debt securities that are not widely traded, are illiquid, or are internally fair valued by the Valuation Committee, are generally categorized as Level 3 in the hierarchy.
Listed derivatives, such as treasury futures, that are actively traded are valued based on quoted prices from the exchange and are categorized as Level 1 in the hierarchy. Over-the-counter derivative contracts, which include forward currency contracts and equity-linked instruments, do not require material subjectivity as pricing inputs are observed from actively quoted markets and are categorized as Level 2 in the hierarchy.
Investments in open-end mutual funds are valued at NAV. Investments in closed-end funds are valued as of the close of regular trading on the NYSE each business day. Both are categorized as Level 1 in the hierarchy.
A summary of the inputs used to value a Fund’s net assets by each major security type is disclosed at the end of the Schedule of Investments for each Fund. The inputs or methodologies used for valuing securities are not necessarily an indication of the risk associated with investing in those securities.
| B. | Security Transactions and Investment Income |
Security transactions are recorded on the trade date. Realized gains and losses from sales of securities are determined on the identified cost basis. Dividend income is recognized on the ex-dividend date or, in the case of certain foreign securities, as soon as a Fund is notified. Interest income is recorded on the accrual basis. Each Fund amortizes premiums and accretes discounts using the effective interest method. Any distributions from underlying funds are recorded in accordance with the character of the distributions as designated by the underlying funds.
Dividend income from REIT investments is recorded using management’s estimate of the income included in distributions received from the REIT investments. Distributions received in excess of this estimated amount are recorded as a reduction of the cost of investments or reclassified to capital gains. The actual amounts of income, return of capital, and capital gains are only determined by each REIT after its fiscal year-end, and may differ from the estimated amounts.
| C. | Income Taxes |
Each Fund is treated as a separate taxable entity. It is the intention of each Fund to comply with the requirements of Subchapter M of the Internal Revenue Code and to distribute substantially all of its taxable income to its shareholders. Therefore, no provision for federal income taxes or excise taxes has been made.
Certain Funds may be subject to foreign taxes on income, gains on investments or currency repatriation, a portion of which may be recoverable. Each Fund will accrue such taxes and recoveries as applicable based upon current interpretations of the tax rules and regulations that exist in the markets in which it invests.
Management of the Funds has concluded that there are no significant uncertain tax positions that would require recognition in the financial statements. As of September 30, 2016, the tax years that remain subject to examination by the major tax jurisdictions under the statute of limitations are from the year 2013 forward (with limited exceptions).
| D. | Distributions to Shareholders |
Distributions are recorded by each Fund on the ex-dividend date. For the Bond Fund, CA Tax-Exempt Fund, High Yield Fund, Low Duration Income Fund, Multi-Sector Intermediate Bond Fund, Senior Floating Rate Fund and Tax-Exempt Bond Fund income distributions are declared and recorded daily and distributed monthly. Income and capital gain distributions are determined in accordance with income tax regulations that may differ from accounting principles generally accepted in the United States of America. These differences may include the treatment of non-taxable dividends, market premium and discount, non-deductible expenses, expiring capital loss carryovers, foreign currency gain or loss, gain or loss on futures contracts, partnerships, operating losses and losses deferred due to wash sales. Permanent book and tax basis differences relating to shareholder distributions will result in reclassifications to capital paid in on shares of beneficial interest.
| E. | Expenses |
Expenses incurred together by a Fund and other affiliated mutual funds are allocated in proportion to the net assets of each such fund, except where allocation of direct expense to each fund or an alternative allocation method can be more appropriately used.
102
Table of Contents
VIRTUS OPPORTUNITIES TRUST
NOTES TO FINANCIAL STATEMENTS (Continued)
SEPTEMBER 30, 2016
In addition to the net annual operating expenses that a Fund bears directly, the shareholders of a Fund indirectly bear the pro rata expenses of the underlying mutual funds in which the Fund invests.
| F. | Foreign Currency Translation |
Non-U.S. investment securities and other assets and liabilities denominated in foreign currencies are translated into U.S. dollar amounts at the foreign currency exchange rate effective at the end of the reporting period. Cost of investments is translated at the currency exchange rate effective at the trade date. The gain or loss resulting from a change in currency exchange rates between the trade and settlement date of a portfolio transaction is treated as a gain or loss on foreign currency. Likewise, the gain or loss resulting from a change in currency exchange rates between the date income is accrued and the date it is paid is treated as a gain or loss on foreign currency. The Funds do not isolate that portion of the results of operations arising from changes in foreign exchange rates on investments from the fluctuations arising from changes in the market prices of securities held. Such fluctuations are included with the net realized and unrealized gain or loss on investments.
| G. | When-issued Purchases and Forward Commitments (Delayed Delivery) |
Certain Funds may engage in when-issued or forward commitment transactions. Securities purchased on a when-issued or forward commitment basis are also known as delayed delivery transactions. Delayed delivery transactions involve a commitment by a Fund to purchase or sell a security at a future date (ordinarily up to 90 days later). When-issued or forward commitments enable a Fund to lock in what is believed to be an attractive price or yield on a particular security for a period of time, regardless of future changes in interest rates. Each Fund records when-issued and delayed delivery securities on the trade date. Each Fund maintains collateral for the securities purchased. Securities purchased on a when-issued or delayed delivery basis begin earning interest on the settlement date.
| H. | Interest-Only and Principal-Only Securities |
Certain Funds may invest in stripped mortgage-backed securities. Stripped mortgage-backed securities represent a participation in, or are secured by, or payable from, mortgage loans on real property, and may be structured in classes with rights to receive varying proportions of principal and interest. Stripped mortgage-backed securities include interest-only securities (IOs) which receive all of the interest, and principal-only securities (POs) which receive all of the principal. The market value of these securities is highly sensitive to changes in interest rates and a rapid (slow) rate of principal payments may have an adverse (positive) effect on yield to maturity. Payments received for IOs are included in interest income. Because principal will not be received at the maturity of an IO, adjustments are made to the book value of the security on a daily basis until maturity and these adjustments are also included in interest income. Payments received for POs are treated as reductions to the cost and par value of the securities. Any pay down gains or losses associated with the payments received are included in interest income. If the underlying mortgage assets are greater than anticipated payments of principal, a Fund may fail to recoup some or all of its initial investment in these securities.
| I. | Loan Agreements |
Certain Funds may invest in direct debt instruments which are interests in amounts owed by a corporate, governmental, or other borrower to lenders or lending syndicates. Loan agreements are generally non-investment grade and often involve borrowers that are highly leveraged. The Funds may invest in obligations of borrowers who are in bankruptcy proceedings. Loan agreements are typically senior in the corporate capital structure of the borrower. A loan is often administered by a bank or other financial institution (the “lender”) that acts as agent for all holders. The agent administers the terms of the loan, as specified in the loan agreement. A Fund’s investments in loans may be in the form of participations in loans or assignments of all or a portion of loans from third parties. When investing in loan participations, a Fund has the right to receive payments of principal, interest and any fees to which it is entitled only from the lender selling the loan participation and only upon receipt by the lender of payments from the borrower. A Fund generally has no right to enforce compliance with the terms of the loan agreement with the borrower. As a result, a Fund may be subject to the credit risk of both the borrower and the lender that is selling the loan agreement. When a Fund purchases assignments from lenders it acquires direct rights against the borrower on the loan.
A Fund may invest in multiple series or tranches of a loan, which may have varying terms and carry different associated risks. Loan agreements may involve foreign borrowers, and investments may be denominated in foreign currencies. Direct indebtedness of emerging countries involves a risk that the government entities responsible for the repayment of the debt may be unable, or unwilling, to pay the principal and interest when due.
The loan agreements have floating rate loan interests which generally pay interest at rates that are periodically determined by reference to a base lending rate plus a premium. The base lending rates are generally LIBOR (London Interbank Offered Rate), the prime rate offered by one or more U.S. banks or the certificate of deposit rate. When a loan agreement is purchased a Fund may pay an assignment fee. On an ongoing basis, a Fund may receive a commitment fee based on the undrawn portion of the underlying line of credit portion of a loan agreement. Prepayment penalty fees are received upon the prepayment of a loan agreement by a borrower. Prepayment penalty, facility, commitment, consent and amendment fees are recorded to income as earned or paid.
At September 30, 2016, all loan agreements held by the Funds are assignment loans.
| J. | Securities Lending |
($ reported in thousands)
Certain Funds may loan securities to qualified brokers through an agreement with Brown Brothers Harriman (“BBH”), as a third party lending agent. Under the terms of agreement, a Fund doing so is required to maintain collateral with a market value not less than 100% of the market value of loaned securities. Collateral is adjusted daily in connection with changes in the market value of securities on loan. Collateral may consist of cash and securities issued by the U.S. Government or its agencies. Cash collateral is invested in a short-term money market fund. Dividends earned on the collateral and premiums paid by the broker are recorded as income by a Fund net of fees and rebates charged by BBH for its services as securities lending agent and in connection with this securities lending program. Lending portfolio securities involves a risk of delay in the recovery of the loaned securities or in the declining value of the collateral.
At September 30, 2016, the Wealth Masters Fund had securities on loan with a market value of $3,073 and cash collateral of $3,132.
103
Table of Contents
VIRTUS OPPORTUNITIES TRUST
NOTES TO FINANCIAL STATEMENTS (Continued)
SEPTEMBER 30, 2016
| K. | Earnings Credit and Interest |
Through arrangements with each Fund’s custodian, each Fund either receives an earnings credit or interest on agreed upon target un-invested cash balances to reduce each Fund’s custody expenses. The credits are reflected as “Earnings credit from Custodian” and the interest is reflected under “Interest income” in each Fund’s Statements of Operations for the period, as applicable.
| Note | 3. Derivative Financial Instruments and Transactions |
($ reported in thousands)
Disclosures about derivative instruments and hedging activities are intended to enable investors to understand how and why a Fund uses derivatives, how derivatives are accounted for, and how derivative instruments affect a fund’s results of operations and financial position. Summarized below are such disclosures and accounting policies for each specific type of derivative instrument used by certain Funds.
| A. | Options contracts |
An options contract provides the purchaser with the right, but not the obligation, to buy (call option) or sell (put option) a financial instrument at an agreed upon price. Certain Funds may purchase or write both put and call options on portfolio securities. The Fund is subject to equity price risk in the normal course of pursuing its investment objectives. The Fund uses options contracts to hedge against changes in the values of equities.
When a Fund purchases an option, it pays a premium and an amount equal to that premium is recorded as an asset. When a Fund writes an option, it receives a premium and an amount equal to that premium is recorded as a liability. The asset or liability is adjusted daily to reflect the current market value of the option. Holdings of the Fund designated to cover outstanding written options are noted in the Schedules of Investments. Purchased options are reported as an asset within “Investment securities at value” in the Statement of Assets and Liabilities. Options written are reported as a liability within “Written options outstanding at value”. Changes in value of the purchased option is included in “Net change in unrealized appreciation/(depreciation) on investments” in the Statement of Operations. Changes in value of written options is included in “Net change in unrealized appreciation/(depreciation) on written options”.
If an option expires unexercised, the Fund realizes a gain or loss to the extent of the premium received or paid. If an option is exercised, the premium received or paid is recorded as an adjustment to the proceeds from the sale or the cost basis of the purchase. The difference between the premium and the amount received or paid on affecting a closing purchase or sale transaction is also treated as a realized gain or loss. Gain or loss on purchased options is included in “Net realized gain/(loss) on investments” in the Statement of Operations. Gain or loss on written options is presented separately as “Net realized gain/(loss) on written options” in the Statement of Operations.
The risk in writing call options is that the Fund gives up the opportunity for profit if the market price of the security increases and the option is exercised. The risk in writing put options is that the Fund may incur a loss if the market price of the security decreases and the option is exercised. The risk in buying options is that the Fund pays a premium whether or not the option is exercised. The use of such instruments may involve certain additional risks as a result of unanticipated movements in the market. Writers (sellers) of options are subject to unlimited risk of loss, as the seller will be obligated to deliver or take delivery of the security at a predetermined price which may, upon exercise of the option, be significantly different from the then-market value.
The Low Volatility Equity Fund invested in writing index call options and buying call options on VIX futures. Both are used as techniques for limiting the volatility of the Fund’s portfolio.
The Fund had transactions in written call options for the period ended September 30, 2016 as follows:
Written call options | Number of | Premium | ||||||
Written Options outstanding at September 30, 2015 | 25 | $ | 92 | |||||
Options written | 293 | 465 | ||||||
Options closed | (275 | ) | (463 | ) | ||||
Options expired | (26 | ) | (90 | ) | ||||
Options exercised | — | — | ||||||
|
|
|
| |||||
Written Options outstanding at September 30, 2016 | 17 | $ | 4 | |||||
|
|
|
| |||||
The following is a summary of the Fund’s option contracts which have a primary risk exposure to equity contracts as of September 30, 2016:
Statements of Assets and Liabilities | ||||
Assets: Purchased call options at value | $ | 4 | (1) | |
Liabilities: Written options | (2 | ) | ||
|
| |||
Net asset (liability) balance | $ | 2 | ||
|
| |||
Statements of Operations | ||||
| Net realized gain (loss) on purchased options | $ | (116 | )(2) | |
Net realized gain (loss) on written options | (370 | ) | ||
Net change in unrealized appreciation (depreciation) on purchased options | (3 | )(3) | ||
Net change in unrealized appreciation (depreciation) on written options | (52 | ) | ||
|
| |||
Total realized and unrealized gain (loss) on purchased and written options | $ | (541 | ) | |
|
| |||
| (1) | Amount included in Investment in unaffiliated securities at value. |
| (2) | Amount included in Net realized gain (loss) on unaffiliated investments. |
| (3) | Amount included in net change in unrealized appreciation (depreciation) on unaffiliated investments. |
For the period ended September 30, 2016, the average daily premiums paid by the Fund for purchased call options were $9, and the average daily premiums received for written call options by the Fund were $41.
104
Table of Contents
VIRTUS OPPORTUNITIES TRUST
NOTES TO FINANCIAL STATEMENTS (Continued)
SEPTEMBER 30, 2016
| Note 4. Investment | Advisory Fees and Related Party Transactions |
($ reported in thousands except as noted)
| A. | Adviser |
Virtus Investment Advisers, Inc. (the “Adviser”), an indirect wholly owned subsidiary of Virtus Investment Partners, Inc. (“Virtus”), is the adviser to the Trust. The Adviser manages the Funds’ investment programs and general operations of the Funds, including oversight of the Funds’ subadvisers.
As compensation for its services to the Funds, the Adviser is entitled to a fee based upon the following annual rates as a percentage of the average daily net assets of each Fund:
Essential Resources Fund | 1.10 | % | ||
Tax-Exempt Bond Fund | 0.45 |
| First $1 Billion | $1+ Billion | |||||||
Bond Fund | 0.45 | % | 0.40 | % | ||||
Wealth Masters Fund | 0.85 | 0.80 | ||||||
| First $1 Billion | $1+ Billion through $2 Billion | $2+ Billion | ||||||||||
CA Tax-Exempt Bond Fund | 0.45 | % | 0.40 | % | 0.35 | % | ||||||
High Yield Fund | 0.65 | 0.60 | 0.55 | |||||||||
Low Duration Income Fund | 0.55 | 0.50 | 0.45 | |||||||||
Multi-Sector Intermediate Bond Fund | 0.55 | 0.50 | 0.45 | |||||||||
Senior Floating Rate Fund | 0.60 | 0.55 | 0.50 | |||||||||
| First $2 Billion | $2+ Billion through $4 Billion | $4+ Billion | ||||||||||
Low Volatility Equity Fund | 0.95 | % | 0.90 | % | 0.85 | % | ||||||
During the period covered by these financial statements, the Bond Fund, High Yield Fund, Multi-Sector Intermediate Fund, and the Senior Floating Rate Fund invested a portion of its assets in Virtus Credit Opportunities Fund, an affiliated mutual fund. In order to avoid any duplication of advisory fees, the Adviser has voluntarily waived its advisory fees in an amount equal to that which would otherwise be paid by the Fund on the assets invested in the Credit Opportunities Fund. For the period covered by these financial statements, the waiver amounted to $5, $2, $50, and $38, respectively. These waivers are in addition to the expense limitation and/or fee waiver covered elsewhere in these financial statements and are included in the Statements of Operations in “expenses reimbursed and/or waived by the investment adviser”.
| B. | Subadvisers |
The subadvisers manage the investments of each Fund for which they are paid a fee by the Adviser. The subadvisers and the Fund(s) they serve are as follows:
Fund | Subadviser | Fund | Subadviser | |||
| Bond Fund | NF(1) | Low Volatility Equity Fund | Rampart(4) | |||
| CA Tax-Exempt Bond Fund | NF(1) | Multi-Sector Intermediate Bond Fund | NF(1) | |||
| Essential Resources Fund | KBI(3) | Senior Floating Rate Fund | NF(1) | |||
High Yield Fund | NF(1) | Tax-Exempt Bond Fund | NF(1) | |||
| Low Duration Income Fund | NF(1) | Wealth Masters Fund | Horizon(2) |
| (1) | Newfleet Asset Management, LLC, an indirect wholly-owned subsidiary of Virtus (“NF”) |
| (2) | Horizon Asset Management, LLC (“Horizon”) |
| (3) | KBI Global Investors (North America) Ltd. (“KBI”) |
| (4) | Rampart Investment Management Company, LLC (“Rampart”) |
| C. | Expense Limits and Fee Waivers |
The Adviser has contractually agreed to limit certain Funds’ total operating expenses (excluding dividend and interest expenses, taxes, brokerage commissions, extraordinary expenses and acquired fund fees and expenses), so that such expenses do not exceed the percentages of the applicable Fund’s average daily net asset values as listed below.
| Class A | Class B | Class C | Class I | Through Date | ||||||||||||||||
Bond Fund | 0.85 | % | 1.60 | % | 1.60 | % | 0.60 | % | 1/31/17 | |||||||||||
CA Tax-Exempt Bond Fund | 0.85 | — | — | 0.60 | 1/31/17 | |||||||||||||||
Essential Resources Fund | 1.65 | — | 2.40 | 1.40 | 1/31/17 | |||||||||||||||
High Yield Fund | 1.15 | 1.90 | 1.90 | 0.90 | 1/31/17 | |||||||||||||||
Low Duration Income Fund | 0.75 | — | 1.50 | 0.50 | 4/30/17 | |||||||||||||||
Low Volatility Equity Fund | 1.55 | — | 2.30 | 1.30 | 1/31/17 | |||||||||||||||
Senior Floating Rate Fund(1) | 1.20 | — | 1.95 | 0.95 | 1/31/17 | |||||||||||||||
Tax-Exempt Bond Fund | 0.85 | — | 1.60 | 0.60 | 4/30/17 | |||||||||||||||
Wealth Masters Fund | 1.45 | — | 2.20 | 1.20 | 1/31/17 | |||||||||||||||
| (1) | Excluding leverage expenses, if any. |
105
Table of Contents
VIRTUS OPPORTUNITIES TRUST
NOTES TO FINANCIAL STATEMENTS (Continued)
SEPTEMBER 30, 2016
| D. | Expense Recapture |
For certain Funds, the Adviser may recapture operating expenses waived or reimbursed under these arrangements within three years after the date on which such waiver or reimbursement occurred. A Fund must pay its ordinary operating expenses before the Adviser is entitled to any reimbursement and must remain in compliance with any applicable expense limitations or, if none, the expense limitation in effect at the time of the waiver or reimbursement. All or a portion of the following Adviser reimbursed expenses may be recaptured as follows:
| Fiscal Year Ended | ||||||||||||||||
| 2017 | 2018 | 2019 | Total | |||||||||||||
Bond Fund | $ | 197 | $ | 204 | $ | 239 | $ | 640 | ||||||||
CA Tax-Exempt Bond Fund | 103 | 110 | 112 | 325 | ||||||||||||
Essential Resources Fund | — | 113 | 121 | 234 | ||||||||||||
High Yield Fund | 150 | 146 | 183 | 479 | ||||||||||||
Low Duration Income Fund | 276 | 783 | 906 | 1,965 | ||||||||||||
Low Volatility Equity Fund | 81 | 55 | 67 | 203 | ||||||||||||
Tax-Exempt Bond Fund | 269 | 290 | 242 | 801 | ||||||||||||
Wealth Masters Fund | 8 | 14 | 74 | 96 | ||||||||||||
| E. | Distributor |
VP Distributors, LLC (“VP Distributors”), an indirect wholly owned subsidiary of Virtus, serves as the distributor of each Fund’s shares and has advised the Funds that for the fiscal year (the “period”) ended September 30, 2016, it retained net commissions of $28 for Class A shares and deferred sales charges of $30, $0 and $25 for Class A shares, Class B shares, and Class C shares respectively.
In addition, each Fund pays VP Distributors distribution and/or service fees under a 12b-1 plan as a percentage of the average daily net assets of each respective class at the annual rates of 0.25% for Class A shares, 1.00% for Class B shares and 1.00% for Class C shares; Class I shares and Class R6 shares are not subject to a 12b-1 plan. Prior to its elimination on February 26, 2015, VP Distributors was also entitled to a service fee under a Shareholder Services Plan for Class I shares of the Low Duration Income Fund and Tax-Exempt Bond Fund, at a rate of 0.05% of the average daily net assets, of such class of the Low Duration Income Fund and Tax-Exempt Bond Funds; however VP Distributors had waived such fee prior to its elimination, so each Fund’s Class I shares did not pay such fee during the fiscal year ended December 31, 2015.
Under certain circumstances, shares of certain Virtus Mutual Funds may be exchanged for shares of the same class of certain other Virtus Mutual Funds on the basis of the relative NAV per share at the time of the exchange. On exchanges with share classes that carry a CDSC, the CDSC schedule of the original shares purchased continues to apply.
| F. | Administrator and Transfer Agent |
Virtus Fund Services, LLC, an indirect wholly owned subsidiary of Virtus, serves as the administrator and transfer agent to the Funds.
For the period ended September 30, 2016, the Funds incurred administration fees totaling $1,591 which are included in the Statements of Operations.
For the period ended September 30, 2016, the Funds incurred transfer agent fees totaling $1,774 which are included in the Statements of Operations. A portion of these fees are paid to outside entities that also provide services to the Trust.
| G. | Affiliated Shareholders |
At September 30, 2016, Virtus and its affiliates and the retirement plans of Virtus and its affiliates held shares of certain Funds which may be redeemed at any time that aggregated to the following:
| Shares | Aggregate Net Asset Value | |||||||
| Essential Resources Fund | ||||||||
Class A | 10,055 | $ | 91 | |||||
Class C | 10,007 | 90 | ||||||
Class I | 483,600 | 4,377 | ||||||
| Low Duration Income Fund | ||||||||
Class I | 344,459 | 3,754 | ||||||
| Low Volatility Equity Fund | ||||||||
Class A | 10,289 | 119 | ||||||
Class C | 10,197 | 116 | ||||||
Class I | 134,208 | 1,561 | ||||||
| Multi-Sector Intermediate Bond Fund | ||||||||
Class R6 | 10,363 | 107 | ||||||
| Senior Floating Rate Fund | ||||||||
Class I | 475,774 | 4,487 | ||||||
106
Table of Contents
VIRTUS OPPORTUNITIES TRUST
NOTES TO FINANCIAL STATEMENTS (Continued)
SEPTEMBER 30, 2016
| H. | Investments in Affiliates |
A summary of the total long-term and short-term purchases and sales of an affiliated fund, Virtus Credit Opportunities Fund, during the period ended September 30, 2016 is as follows:
| Value, beginning of period | Purchases | Sales Proceeds | Value, end of period | Dividend Income | Distributions of Realized Gains | |||||||||||||||||||
Bond Fund | $ | 1,143 | $ | 9 | $ | — | $ | 1,159 | $ | 44 | $ | — | ||||||||||||
High Yield Fund | 342 | 8 | — | 352 | 13 | — | ||||||||||||||||||
Multi-Sector Intermediate Bond Fund | 9,058 | 70 | — | 9,186 | 349 | — | ||||||||||||||||||
Senior Floating Rate Fund | 7,502 | 51 | 1,579 | 5,999 | 232 | — | ||||||||||||||||||
The Funds do not invest in the underlying fund for the purpose of exercising management or control; however the investments made by one or more Funds within each Fund’s principal investment strategies may represent a significant portion of the underlying fund’s net assets. At September 30, 2016 the Multi-Sector Intermediate Bond Fund was the owner of record of approximately 10% of the Virtus Credit Opportunities Fund.
| I. | Payment from Affiliate |
During the period the Adviser reimbursed certain funds for losses. These amounts are included in payments by affiliates in the Statements of Operations. There was no impact on the total return.
| J. | Trustee Compensation |
The Trust provides a deferred compensation plan for its Trustees who receive compensation from the Trust. Under the deferred compensation plan, Trustees may elect to defer all or a portion of their compensation. Amounts deferred are retained by the Trust, and then, to the extent permitted by the 1940 Act, in turn, may be invested in the shares of affiliated or unaffiliated mutual funds selected by the participating Trustees. Investments in such instruments are included in “Other Assets” on the Statement of Assets and Liabilities at September 30, 2016.
| Note 5. Purchases and Sales of Securities |
($ reported in thousands)
Purchases and sales of securities (excluding U.S. Government and agency securities, short-term securities and written options) during the period ended September 30, 2016, were as follows:
| Purchases | Sales | |||||||
Bond Fund | $ | 34,669 | $ | 36,134 | ||||
CA Tax-Exempt Bond | 6,325 | 7,522 | ||||||
Essential Resources Fund | 3,981 | 3,832 | ||||||
High Yield Fund | 61,083 | 55,031 | ||||||
Low Duration Income Fund | 179,460 | 90,834 | ||||||
Low Volatility Equity Fund | 452 | 2,336 | ||||||
Multi-Sector Intermediate Bond Fund | 170,535 | 214,798 | ||||||
Senior Floating Rate Fund | 293,880 | 427,236 | ||||||
Tax-Exempt Bond Fund | 26,711 | 18,160 | ||||||
Wealth Masters Fund | 28,593 | 79,590 | ||||||
Purchases and sales of long term U.S. Government and agency securities for the Funds during the period ended September 30, 2016, were as follows:
| Purchases | Sales | |||||||
Bond Fund | $ | 14,311 | $ | 11,739 | ||||
Low Duration Income Fund | 80,066 | 33,395 | ||||||
Multi-Sector Intermediate Bond Fund | 11,001 | 13,160 | ||||||
107
Table of Contents
VIRTUS OPPORTUNITIES TRUST
NOTES TO FINANCIAL STATEMENTS (Continued)
SEPTEMBER 30, 2016
| Note 6. Capital | Share Transactions |
(reported in thousands)
Transactions in shares of capital stock, during the periods ended as indicated below, were as follows:
| Bond Fund | CA Tax-Exempt Bond Fund | |||||||||||||||||||||||||||||||
| Year Ended September 30, 2016 | Year Ended September 30, 2015 | Year Ended September 30, 2016 | Year Ended September 30, 2015 | |||||||||||||||||||||||||||||
| SHARES | AMOUNT | SHARES | AMOUNT | SHARES | AMOUNT | SHARES | AMOUNT | |||||||||||||||||||||||||
| Class A | ||||||||||||||||||||||||||||||||
| Sale of shares | 195 | $ | 2,159 | 248 | $ | 2,789 | �� | 53 | $ | 647 | 245 | $ | 3,076 | |||||||||||||||||||
| Reinvestment of distributions | 104 | 1,157 | 128 | 1,443 | 69 | 828 | 95 | 1,156 | ||||||||||||||||||||||||
| Shares repurchased | (780 | ) | (8,631 | ) | (707 | ) | (7,970 | ) | (168 | ) | (2,042 | ) | (432 | ) | (5,262 | ) | ||||||||||||||||
|
|
|
|
|
|
|
|
|
|
|
|
|
|
|
| |||||||||||||||||
| Net Increase / (Decrease) | (481 | ) | $ | (5,315 | ) | (331 | ) | $ | (3,738 | ) | (46 | ) | $ | (567 | ) | (92 | ) | $ | (1,030 | ) | ||||||||||||
|
|
|
|
|
|
|
|
|
|
|
|
|
|
|
| |||||||||||||||||
| Class B | ||||||||||||||||||||||||||||||||
| Sale of shares | — | (1) | $ | — | (2) | — | $ | — | (2) | — | $ | — | — | $ | — | |||||||||||||||||
| Reinvestment of distributions | — | (1) | 2 | — | (1) | 4 | — | — | — | — | ||||||||||||||||||||||
| Shares repurchased | (5 | ) | (56 | ) | (10 | ) | (106 | ) | — | — | — | — | ||||||||||||||||||||
|
|
|
|
|
|
|
|
|
|
|
|
|
|
|
| |||||||||||||||||
| Net Increase / (Decrease) | (5 | ) | $ | (54 | ) | (10 | ) | $ | (102 | ) | — | $ | — | — | $ | — | ||||||||||||||||
|
|
|
|
|
|
|
|
|
|
|
|
|
|
|
| |||||||||||||||||
| Class C | ||||||||||||||||||||||||||||||||
| Sale of shares | 567 | $ | 6,059 | 1,066 | $ | 11,856 | — | $ | — | — | $ | — | ||||||||||||||||||||
| Reinvestment of distributions | 19 | 202 | 17 | 190 | — | — | — | — | ||||||||||||||||||||||||
| Shares repurchased | (560 | ) | (6,107 | ) | (827 | ) | (9,164 | ) | — | — | — | — | ||||||||||||||||||||
|
|
|
|
|
|
|
|
|
|
|
|
|
|
|
| |||||||||||||||||
| Net Increase / (Decrease) | 26 | $ | 154 | 256 | $ | 2,882 | — | $ | — | — | $ | — | ||||||||||||||||||||
|
|
|
|
|
|
|
|
|
|
|
|
|
|
|
| |||||||||||||||||
| Class I | ||||||||||||||||||||||||||||||||
| Sale of shares | 1,001 | $ | 11,191 | 429 | $ | 4,917 | 247 | $ | 3,008 | 66 | $ | 807 | ||||||||||||||||||||
| Reinvestment of distributions | 56 | 630 | 52 | 600 | 53 | 637 | 64 | 753 | ||||||||||||||||||||||||
| Shares repurchased | (519 | ) | (5,836 | ) | (342 | ) | (3,905 | ) | (254 | ) | (3,058 | ) | (133 | ) | (1,613 | ) | ||||||||||||||||
|
|
|
|
|
|
|
|
|
|
|
|
|
|
|
| |||||||||||||||||
| Net Increase / (Decrease) | 538 | $ | 5,985 | 139 | $ | 1,612 | 46 | $ | 587 | (3 | ) | $ | (53 | ) | ||||||||||||||||||
|
|
|
|
|
|
|
|
|
|
|
|
|
|
|
| |||||||||||||||||
| Essential Resources Fund | High Yield Fund | |||||||||||||||||||||||||||||||
| Year Ended September 30, 2016 | From Inception March 23, 2015 to September 30, 2015 | Year Ended September 30, 2016 | Year Ended September 30, 2015 | |||||||||||||||||||||||||||||
| SHARES | AMOUNT | SHARES | AMOUNT | SHARES | AMOUNT | SHARES | AMOUNT | |||||||||||||||||||||||||
| Class A | ||||||||||||||||||||||||||||||||
| Sale of shares | 8 | $ | 69 | 10 | $ | 103 | 1,752 | $ | 7,051 | 11,578 | $ | 49,167 | ||||||||||||||||||||
| Reinvestment of distributions | — | (1) | — | (2) | — | — | 644 | 2,578 | 824 | 3,485 | ||||||||||||||||||||||
| Shares repurchased | — | — | — | — | (2,294 | ) | (9,050 | ) | (13,440 | ) | (56,820 | ) | ||||||||||||||||||||
|
|
|
|
|
|
|
|
|
|
|
|
|
|
|
| |||||||||||||||||
Net Increase / (Decrease) | 8 | $ | 69 | 10 | $ | 103 | 102 | $ | 579 | (1,038 | ) | $ | (4,168 | ) | ||||||||||||||||||
|
|
|
|
|
|
|
|
|
|
|
|
|
|
|
| |||||||||||||||||
Class B | ||||||||||||||||||||||||||||||||
Sale of shares | — | $ | — | — | $ | — | — | $ | — | (2) | 1 | $ | 4 | |||||||||||||||||||
Reinvestment of distributions | — | — | — | — | — | (1) | 2 | 1 | 3 | |||||||||||||||||||||||
Shares repurchased | — | — | — | — | (4 | ) | (17 | ) | (16 | ) | (66 | ) | ||||||||||||||||||||
|
|
|
|
|
|
|
|
|
|
|
|
|
|
|
| |||||||||||||||||
Net Increase / (Decrease) | — | $ | — | — | $ | — | (4 | ) | $ | (15 | ) | (14 | ) | $ | (59 | ) | ||||||||||||||||
|
|
|
|
|
|
|
|
|
|
|
|
|
|
|
| |||||||||||||||||
| Class C | ||||||||||||||||||||||||||||||||
| Sale of shares | 1 | $ | 8 | 13 | $ | 129 | 372 | $ | 1,482 | 349 | $ | 1,452 | ||||||||||||||||||||
| Reinvestment of distributions | — | (1) | — | (2) | — | — | 39 | 153 | 41 | 172 | ||||||||||||||||||||||
| Shares repurchased | (1 | ) | (5 | ) | — | (1) | — | (2) | (326 | ) | (1,257 | ) | (388 | ) | (1,603 | ) | ||||||||||||||||
|
|
|
|
|
|
|
|
|
|
|
|
|
|
|
| |||||||||||||||||
Net Increase / (Decrease) | — | (1) | $ | 3 | 13 | $ | 129 | 85 | $ | 378 | 2 | $ | 21 | |||||||||||||||||||
|
|
|
|
|
|
|
|
|
|
|
|
|
|
|
| |||||||||||||||||
| Class I | ||||||||||||||||||||||||||||||||
| Sale of shares | 101 | $ | 862 | 485 | $ | 4,847 | 2,307 | $ | 9,282 | 815 | $ | 3,498 | ||||||||||||||||||||
| Reinvestment of distributions | 4 | 31 | — | — | 103 | 413 | 87 | 367 | ||||||||||||||||||||||||
| Shares repurchased | (90 | ) | (775 | ) | (2 | ) | (19 | ) | (1,669 | ) | (6,558 | ) | (1,148 | ) | (4,834 | ) | ||||||||||||||||
|
|
|
|
|
|
|
|
|
|
|
|
|
|
|
| |||||||||||||||||
Net Increase / (Decrease) | 15 | $ | 118 | 483 | $ | 4,826 | 741 | $ | 3,137 | (246 | ) | $ | (969 | ) | ||||||||||||||||||
|
|
|
|
|
|
|
|
|
|
|
|
|
|
|
| |||||||||||||||||
| (1) | Amount is less than 500. |
| (2) | Amount is less than $500. |
108
Table of Contents
VIRTUS OPPORTUNITIES TRUST
NOTES TO FINANCIAL STATEMENTS (Continued)
SEPTEMBER 30, 2016
| Low Duration Income Fund | ||||||||||||||||||||||||||||||||
| Fiscal Period Ended September 30, 2016 | Year Ended December 31, 2015 | Year Ended December 31, 2014 | ||||||||||||||||||||||||||||||
| SHARES | AMOUNT | SHARES | AMOUNT | SHARES | AMOUNT | |||||||||||||||||||||||||||
| Class A | ||||||||||||||||||||||||||||||||
| Sale of shares | 3,603 | $ | 38,896 | 3,576 | $ | 38,617 | 5,969 | $ | 64,993 | |||||||||||||||||||||||
| Reinvestment of distributions | 110 | 1,190 | 122 | 1,317 | 78 | 845 | ||||||||||||||||||||||||||
| Shares repurchased | (2,357 | ) | (25,460 | ) | (2,669 | ) | (28,924 | ) | (2,710 | ) | (29,548 | ) | ||||||||||||||||||||
|
|
|
|
|
|
|
|
|
|
|
| |||||||||||||||||||||
| Net Increase / (Decrease) | 1,356 | $ | 14,626 | 1,029 | $ | 11,010 | 3,337 | $ | 36,290 | |||||||||||||||||||||||
|
|
|
|
|
|
|
|
|
|
|
| |||||||||||||||||||||
| Class C | ||||||||||||||||||||||||||||||||
| Sale of shares | 1,363 | $ | 14,668 | 2,142 | $ | 23,100 | 4,749 | $ | 51,623 | |||||||||||||||||||||||
| Reinvestment of distributions | 28 | 307 | 35 | 383 | 27 | 295 | ||||||||||||||||||||||||||
| Shares repurchased | (1,282 | ) | (13,835 | ) | (2,751 | ) | (29,800 | ) | (2,383 | ) | (25,937 | ) | ||||||||||||||||||||
|
|
|
|
|
|
|
|
|
|
|
| |||||||||||||||||||||
| Net Increase / (Decrease) | 109 | $ | 1,140 | (574 | ) | $ | (6,317 | ) | 2,393 | $ | 25,981 | |||||||||||||||||||||
|
|
|
|
|
|
|
|
|
|
|
| |||||||||||||||||||||
| Class I | ||||||||||||||||||||||||||||||||
| Sale of shares | 15,127 | $ | 163,364 | 11,692 | $ | 126,118 | 6,140 | $ | 66,872 | |||||||||||||||||||||||
| Reinvestment of distributions | 214 | 2,320 | 181 | 1,955 | 127 | 1,386 | ||||||||||||||||||||||||||
| Shares repurchased | (6,365 | ) | (68,648 | ) | (6,345 | ) | (68,533 | ) | (2,558 | ) | (27,870 | ) | ||||||||||||||||||||
|
|
|
|
|
|
|
|
|
|
|
| |||||||||||||||||||||
| Net Increase / (Decrease) | 8,976 | $ | 97,036 | 5,528 | $ | 59,540 | 3,709 | $ | 40,388 | |||||||||||||||||||||||
|
|
|
|
|
|
|
|
|
|
|
| |||||||||||||||||||||
| Low Volatility Equity Fund | Multi-Sector Intermediate Bond Fund | |||||||||||||||||||||||||||||||
| Year Ended September 30 2016 | Year Ended September 30, 2015 | Year Ended September 30, 2016 | Year Ended September 30, 2015 | |||||||||||||||||||||||||||||
| SHARES | AMOUNT | SHARES | AMOUNT | SHARES | AMOUNT | SHARES | AMOUNT | |||||||||||||||||||||||||
| Class A | ||||||||||||||||||||||||||||||||
| Sale of shares | 25 | $ | 289 | 171 | $ | 2,056 | 1,400 | $ | 13,704 | 2,970 | $ | 30,801 | ||||||||||||||||||||
| Reinvestment of distributions | 3 | 40 | 1 | 7 | 383 | 3,779 | 565 | 5,794 | ||||||||||||||||||||||||
| Shares repurchased | (67 | ) | (750 | ) | (34 | ) | (395 | ) | (2,914 | ) | (28,545 | ) | (3,956 | ) | (40,421 | ) | ||||||||||||||||
| �� |
|
|
|
|
|
|
|
|
|
|
|
|
|
|
|
| ||||||||||||||||
| Net Increase / (Decrease) | (39 | ) | $ | (421 | ) | 138 | $ | 1,668 | (1,131 | ) | $ | (11,062 | ) | (421 | ) | $ | (3,826 | ) | ||||||||||||||
|
|
|
|
|
|
|
|
|
|
|
|
|
|
|
| |||||||||||||||||
| Class B | ||||||||||||||||||||||||||||||||
| Sale of shares | — | $ | — | — | $ | — | — | (1) | $ | — | (2) | 3 | $ | 36 | ||||||||||||||||||
| Reinvestment of distributions | — | — | — | — | 8 | 77 | 19 | 196 | ||||||||||||||||||||||||
| Shares repurchased | — | — | — | — | (135 | ) | (1,324 | ) | (230 | ) | (2,365 | ) | ||||||||||||||||||||
|
|
|
|
|
|
|
|
|
|
|
|
|
|
|
| |||||||||||||||||
| Net Increase / (Decrease) | — | $ | — | — | $ | — | (127 | ) | $ | (1,247 | ) | (208 | ) | $ | (2,133 | ) | ||||||||||||||||
|
|
|
|
|
|
|
|
|
|
|
|
|
|
|
| |||||||||||||||||
| Class C | ||||||||||||||||||||||||||||||||
| Sale of shares | 19 | $ | 216 | 140 | $ | 1,648 | 1,047 | $ | 10,368 | 2,225 | $ | 23,203 | ||||||||||||||||||||
| Reinvestment of distributions | 2 | 23 | — | (1) | 2 | 213 | 2,115 | 337 | 3,489 | |||||||||||||||||||||||
| Shares repurchased | (103 | ) | (1,139 | ) | (39 | ) | (462 | ) | (2,552 | ) | (25,177 | ) | (2,927 | ) | (30,282 | ) | ||||||||||||||||
|
|
|
|
|
|
|
|
|
|
|
|
|
|
|
| |||||||||||||||||
| Net Increase / (Decrease) | (82 | ) | $ | (900 | ) | 101 | $ | 1,188 | (1,292 | ) | $ | (12,694 | ) | (365 | ) | $ | (3,590 | ) | ||||||||||||||
|
|
|
|
|
|
|
|
|
|
|
|
|
|
|
| |||||||||||||||||
| Class I | ||||||||||||||||||||||||||||||||
| Sale of shares | — | (1) | $ | 2 | 6 | $ | 71 | 6,322 | $ | 61,665 | 7,369 | $ | 75,867 | |||||||||||||||||||
| Reinvestment of distributions | 3 | 32 | 1 | 6 | 433 | 4,269 | 657 | 6,736 | ||||||||||||||||||||||||
| Shares repurchased | (2 | ) | (26 | ) | — | — | (9,006 | ) | (87,086 | ) | (7,278 | ) | (74,560 | ) | ||||||||||||||||||
|
|
|
|
|
|
|
|
|
|
|
|
|
|
|
| |||||||||||||||||
| Net Increase / (Decrease) | 1 | $ | 8 | 7 | $ | 77 | (2,251 | ) | $ | (21,152 | ) | 748 | $ | 8,043 | ||||||||||||||||||
|
|
|
|
|
|
|
|
|
|
|
|
|
|
|
| |||||||||||||||||
| Class R6 | ||||||||||||||||||||||||||||||||
| Sale of shares | — | $ | — | — | $ | — | 33 | $ | 329 | 183 | $ | 1,906 | ||||||||||||||||||||
| Reinvestment of distributions | — | — | — | — | 8 | 81 | 5 | 40 | ||||||||||||||||||||||||
| Shares repurchased | — | — | — | — | (29 | ) | (280 | ) | (6 | ) | (61 | ) | ||||||||||||||||||||
|
|
|
|
|
|
|
|
|
|
|
|
|
|
|
| |||||||||||||||||
| Net Increase / (Decrease) | — | $ | — | — | $ | — | 12 | $ | 130 | 182 | $ | 1,885 | ||||||||||||||||||||
|
|
|
|
|
|
|
|
|
|
|
|
|
|
|
| |||||||||||||||||
| (1) | Amount is less than 500. |
| (2) | Amount is less than $500. |
109
Table of Contents
VIRTUS OPPORTUNITIES TRUST
NOTES TO FINANCIAL STATEMENTS (Continued)
SEPTEMBER 30, 2016
| Senior Floating Rate Fund | ||||||||||||||||||||||||||||||||
| Year Ended September 30, 2016 | Year Ended September 30, 2015 | |||||||||||||||||||||||||||||||
| SHARES | AMOUNT | SHARES | AMOUNT | |||||||||||||||||||||||||||||
| Class A | ||||||||||||||||||||||||||||||||
| Sale of shares | 1,242 | $ | 11,489 | 5,295 | $ | 51,097 | ||||||||||||||||||||||||||
| Reinvestment of distributions | 895 | 8,271 | 1,177 | 11,287 | ||||||||||||||||||||||||||||
| Shares repurchased | (6,679 | ) | (61,504 | ) | (8,090 | ) | (77,658 | ) | ||||||||||||||||||||||||
|
|
|
|
|
|
|
| |||||||||||||||||||||||||
| Net Increase / (Decrease) | (4,542 | ) | $ | (41,744 | ) | (1,618 | ) | $ | (15,274 | ) | ||||||||||||||||||||||
|
|
|
|
|
|
|
| |||||||||||||||||||||||||
| Class C | ||||||||||||||||||||||||||||||||
| Sale of shares | 759 | $ | 7,026 | 1,575 | $ | 15,160 | ||||||||||||||||||||||||||
| Reinvestment of distributions | 330 | 3,056 | 483 | 4,636 | ||||||||||||||||||||||||||||
| Shares repurchased | (4,010 | ) | (37,034 | ) | (5,520 | ) | (53,095 | ) | ||||||||||||||||||||||||
|
|
|
|
|
|
|
| |||||||||||||||||||||||||
| Net Increase / (Decrease) | (2,921 | ) | $ | (26,952 | ) | (3,462 | ) | $ | (33,299 | ) | ||||||||||||||||||||||
|
|
|
|
|
|
|
| |||||||||||||||||||||||||
| Class I | ||||||||||||||||||||||||||||||||
| Sale of shares | 9,465 | $ | 87,241 | 9,564 | $ | 91,910 | ||||||||||||||||||||||||||
| Reinvestment of distributions | 690 | 6,376 | 1,206 | 11,564 | ||||||||||||||||||||||||||||
| Shares repurchased | (18,214 | ) | (167,343 | ) | (27,432 | ) | (263,127 | ) | ||||||||||||||||||||||||
|
|
|
|
|
|
|
| |||||||||||||||||||||||||
| Net Increase / (Decrease) | (8,059 | ) | $ | (73,726 | ) | (16,662 | ) | $ | (159,653 | ) | ||||||||||||||||||||||
|
|
|
|
|
|
|
| |||||||||||||||||||||||||
| Tax-Exempt Bond Fund | ||||||||||||||||||||||||||||||||
| Fiscal Period Ended September 30, 2016 | Year Ended December 31, 2015 | Year Ended December 31, 2014 | ||||||||||||||||||||||||||||||
| SHARES | AMOUNT | SHARES | AMOUNT | SHARES | AMOUNT | |||||||||||||||||||||||||||
| Class A | ||||||||||||||||||||||||||||||||
| Sale of shares | 494 | $ | 5,709 | 920 | $ | 10,518 | 1,272 | $ | 14,392 | |||||||||||||||||||||||
| Reinvestment of distributions | 104 | 1,200 | 152 | 1,730 | 183 | 2,067 | ||||||||||||||||||||||||||
| Shares repurchased | (1,074 | ) | (12,421 | ) | (1,533 | ) | (17,468 | ) | (2,663 | ) | (30,083 | ) | ||||||||||||||||||||
|
|
|
|
|
|
|
|
|
|
|
| |||||||||||||||||||||
| Net Increase / (Decrease) | (476 | ) | $ | (5,512 | ) | (461 | ) | $ | (5,220 | ) | (1,208 | ) | $ | (13,624 | ) | |||||||||||||||||
|
|
|
|
|
|
|
|
|
|
|
| |||||||||||||||||||||
| Class C | ||||||||||||||||||||||||||||||||
| Sale of shares | 259 | $ | 2,996 | 576 | $ | 6,588 | 756 | $ | 8,588 | |||||||||||||||||||||||
| Reinvestment of distributions | 28 | 322 | 41 | 465 | 43 | 484 | ||||||||||||||||||||||||||
| Shares repurchased | (617 | ) | (7,126 | ) | (666 | ) | (7,583 | ) | (739 | ) | (8,349 | ) | ||||||||||||||||||||
|
|
|
|
|
|
|
|
|
|
|
| |||||||||||||||||||||
| Net Increase / (Decrease) | (330 | ) | $ | (3,808 | ) | (49 | ) | $ | (530 | ) | 60 | $ | 723 | |||||||||||||||||||
|
|
|
|
|
|
|
|
|
|
|
| |||||||||||||||||||||
| Class I | ||||||||||||||||||||||||||||||||
| Sale of shares | 2,773 | $ | 32,072 | 1,916 | $ | 21,874 | 2,664 | $ | 30,145 | |||||||||||||||||||||||
| Reinvestment of distributions | 161 | 1,868 | 191 | 2,180 | 173 | 1,952 | ||||||||||||||||||||||||||
| Shares repurchased | (1,827 | ) | (21,133 | ) | (1,696 | ) | (19,357 | ) | (2,889 | ) | (32,489 | ) | ||||||||||||||||||||
|
|
|
|
|
|
|
|
|
|
|
| |||||||||||||||||||||
| Net Increase / (Decrease) | 1,107 | $ | 12,807 | 411 | $ | 4,697 | (52 | ) | $ | (392 | ) | |||||||||||||||||||||
|
|
|
|
|
|
|
|
|
|
|
| |||||||||||||||||||||
110
Table of Contents
VIRTUS OPPORTUNITIES TRUST
NOTES TO FINANCIAL STATEMENTS (Continued)
SEPTEMBER 30, 2016
| Wealth Masters Fund | ||||||||||||||||||||||||||||||||
| Year Ended September 30, 2016 | Year Ended September 30, 2015 | |||||||||||||||||||||||||||||||
| SHARES | AMOUNT | SHARES | AMOUNT | |||||||||||||||||||||||||||||
| Class A | ||||||||||||||||||||||||||||||||
| Sale of shares | 312 | $ | 4,201 | 1,889 | $ | 28,329 | ||||||||||||||||||||||||||
| Reinvestment of distributions | 74 | 981 | 82 | 1,205 | ||||||||||||||||||||||||||||
| Shares repurchased | (2,195 | ) | (29,176 | ) | (1,740 | ) | (25,440 | ) | ||||||||||||||||||||||||
|
|
|
|
|
|
|
| |||||||||||||||||||||||||
Net Increase / (Decrease) | (1,809 | ) | $ | (23,994 | ) | 231 | $ | 4,094 | ||||||||||||||||||||||||
|
|
|
|
|
|
|
| |||||||||||||||||||||||||
| Class C | ||||||||||||||||||||||||||||||||
| Sale of shares | 200 | $ | 2,581 | 1,134 | $ | 16,676 | ||||||||||||||||||||||||||
| Reinvestment of distributions | 40 | 520 | 39 | 567 | ||||||||||||||||||||||||||||
| Shares repurchased | (1,124 | ) | (14,664 | ) | (680 | ) | (9,890 | ) | ||||||||||||||||||||||||
|
|
|
|
|
|
|
| |||||||||||||||||||||||||
Net Increase / (Decrease) | (884 | ) | $ | (11,563 | ) | 493 | $ | 7,353 | ||||||||||||||||||||||||
|
|
|
|
|
|
|
| |||||||||||||||||||||||||
| Class I | ||||||||||||||||||||||||||||||||
| Sale of shares | 600 | $ | 8,275 | 1,346 | $ | 20,069 | ||||||||||||||||||||||||||
| Reinvestment of distributions | 47 | 630 | 74 | 1,097 | ||||||||||||||||||||||||||||
| Shares repurchased | (1,717 | ) | (22,935 | ) | (2,336 | ) | (33,811 | ) | ||||||||||||||||||||||||
|
|
|
|
|
|
|
| |||||||||||||||||||||||||
Net Increase / (Decrease) | (1,070 | ) | $ | (14,030 | ) | (916 | ) | $ | (12,645 | ) | ||||||||||||||||||||||
|
|
|
|
|
|
|
| |||||||||||||||||||||||||
| Note 7. 10% Shareholders |
As of September 30, 2016, certain Funds had individual shareholder account(s) and/or omnibus shareholder account(s) (comprised of a group of individual shareholders), which individually amounted to more than 10% of the total shares outstanding of each such Fund as detailed below:
| % of Shares Outstanding | Number of Accounts | |||||||
Bond Fund | 22 | % | 2 | |||||
CA-Tax Exempt Bond Fund | 33 | 1 | ||||||
Essential Resources Fund | 91 | 1 | * | |||||
Low Duration Income Fund | 27 | 2 | ||||||
Low Volatility Equity Fund | 69 | 2 | ||||||
Multi-Sector Intermediate Bond Fund | 11 | 1 | ||||||
Senior Floating Rate Fund | 35 | 2 | ||||||
Tax-Exempt Bond Fund | 11 | 1 | ||||||
Wealth Masters Fund | 18 | 1 | ||||||
| * | Includes affiliated shareholder account(s) |
| Note 8. Credit Risk and Asset Concentration |
In countries with limited or developing markets, investments may present greater risks than in more developed markets and the prices of such investments may be volatile. The consequences of political, social or economic changes in these markets may have disruptive effects on the market prices of these investments and the income they generate, as well as a Fund’s ability to repatriate such amounts.
High-yield/high-risk securities typically entail greater price volatility and/or principal and interest rate risk. There is a greater chance that an issuer will not be able to make principal and interest payments on time. Analysis of the creditworthiness of issuers of high-yield/high-risk securities may be complex, and as a result, it may be more difficult for the Adviser and/or subadviser to accurately predict risk.
Many municipalities insure repayment for their obligations. Although bond insurance reduces the risk of loss due to default by an issuer, such bonds remain subject to the risk that the market may fluctuate for other reasons, and there is no assurance that the insurance company will meet its obligations. Insured securities have been identified in the Schedule of Investments. A real or perceived decline in creditworthiness of a bond insurer can have an adverse impact on the value of insured bonds held in the Funds.
Certain Funds may invest a high percentage of their assets in specific sectors of the market in the pursuit of their investment objectives. Fluctuations in these sectors of concentration may have a greater impact on a Fund, positive or negative, than if a Fund did not concentrate its investments in such sectors.
At September 30, 2016, the following Funds held securities issued by various companies in specific sectors or countries as detailed below:
Fund | Sector | Percentage of Total Investments | ||||
Essential Resources Fund | Industrials | 27 | % | |||
Wealth Masters Fund | Consumer Discretionary | 32 | ||||
111
Table of Contents
VIRTUS OPPORTUNITIES TRUST
NOTES TO FINANCIAL STATEMENTS (Continued)
SEPTEMBER 30, 2016
| Note 9. Indemnifications |
Under the Trust’s organizational documents, its Trustees and officers are indemnified against certain liabilities arising out of the performance of their duties to the Funds. Each Trustee has also entered into an indemnification agreement with the Trust. In addition, in the normal course of business, the Funds enter into contracts that provide a variety of indemnifications to other parties. The Funds’ maximum exposure under these arrangements is unknown as this would involve future claims that may be made against the Funds and that have not occurred. However, the Funds have not had prior claims or losses pursuant to these arrangements and expect the risk of loss to be remote.
| Note 10. Federal Income Tax Information |
($ reported in thousands)
At September 30, 2016, federal tax cost and aggregate gross unrealized appreciation (depreciation) of securities held by the Funds were as follows:
Fund | Federal Tax Cost | Unrealized Appreciation | Unrealized (Depreciation) | Net Unrealized Appreciation (Depreciation) | ||||||||||||
Bond Fund | $ | 74,772 | $ | 2,662 | $ | (310 | ) | $ | 2,352 | |||||||
CA Tax-Exempt Bond Fund | 28,050 | 2,171 | (21 | ) | 2,150 | |||||||||||
Essential Resources Fund | 4,817 | 213 | (302 | ) | (89 | ) | ||||||||||
High Yield Fund | 75,161 | 2,440 | (2,691 | ) | (251 | ) | ||||||||||
Low Duration Income Fund | 394,737 | 4,605 | (529 | ) | 4,076 | |||||||||||
Low Volatility Equity Fund Securities | 3,076 | 616 | — | 616 | ||||||||||||
Low Volatility Equity Fund Options | (2 | ) | — | — | — | |||||||||||
Multi-Sector Intermediate Bond Fund | 303,468 | 9,897 | (13,162 | ) | (3,265 | ) | ||||||||||
Senior Floating Rate Fund | 599,139 | 4,255 | (16,215 | ) | (11,960 | ) | ||||||||||
Tax-Exempt Bond Fund | 187,658 | 13,783 | (413 | ) | 13,370 | |||||||||||
Wealth Masters Fund | 76,169 | 8,669 | (3,889 | ) | 4,780 | |||||||||||
Certain Funds have capital loss carryovers available to offset future realized capital gains, through the indicated expiration dates shown below:
| 2017 | 2018 | No Expiration | Total | |||||||||||||||||||||
| Short-Term | Short-Term | Short-Term | Long-Term | Short-Term | Long-Term | |||||||||||||||||||
Bond Fund | $ | 3,149 | $ | — | $ | 590 | $ | 858 | $ | 3,739 | $ | 858 | ||||||||||||
Essential Resources Fund | — | — | 37 | — | 37 | — | ||||||||||||||||||
High Yield Fund | 13,758 | 9,151 | 936 | 1,348 | 23,845 | 1,348 | ||||||||||||||||||
Low Duration Income Fund | 1,168 | — | 128 | 644 | 1,296 | 644 | ||||||||||||||||||
Low Volatility Equity Fund | — | — | 96 | 145 | 96 | 145 | ||||||||||||||||||
Multi-Sector Intermediate Bond Fund | — | — | 3,254 | 3,906 | 3,254 | 3,906 | ||||||||||||||||||
Senior Floating Rate Fund | — | — | 3,474 | 9,164 | 3,474 | 9,164 | ||||||||||||||||||
Wealth Masters Fund | — | — | — | 36 | — | 36 | ||||||||||||||||||
The Trust may not realize the benefit of these losses to the extent each Fund does not realize gains on investments prior to the expiration of the capital loss carryovers.
Under the Regulated Investment Company Modernization Act of 2010 (the “Act”), net capital losses recognized for tax years beginning after December 22, 2010 may be carried forward indefinitely, and their character is retained as short-term and/or long-term losses. Previously, net capital losses were carried forward for eight years and treated as short-term losses. As a transition rule, the Act requires that post-enactment net capital losses be used before pre-enactment net capital losses.
Capital losses realized after October 31 and certain late year ordinary losses may be deferred and treated as occurring on the first day of the following fiscal year. For the fiscal period ended September 30, 2016, certain Funds deferred and recognized post-October losses as follows:
| Fund | Late Year Ordinary Losses Deferred | Late Year Ordinary Losses Recognized | Capital Loss Deferred | Capital Loss Recognized | ||||||||||||
Bond Fund | $ | — | $ | — | $ | 386 | $ | 1,302 | ||||||||
Essential Resources Fund | — | — | 356 | — | ||||||||||||
High Yield Fund | — | — | 1,023 | 2,043 | ||||||||||||
Low Duration Income Fund | — | — | — | 140 | ||||||||||||
Low Volatility Equity Fund | — | — | 310 | — | ||||||||||||
Multi-Sector Intermediate Bond Fund | — | — | 4,369 | 6,431 | ||||||||||||
Senior Floating Rate Fund | — | — | 11,582 | 9,748 | ||||||||||||
Tax-Exempt Bond Fund | — | — | — | 86 | ||||||||||||
Wealth Masters Fund | — | — | 3,244 | — | ||||||||||||
112
Table of Contents
VIRTUS OPPORTUNITIES TRUST
NOTES TO FINANCIAL STATEMENTS (Continued)
SEPTEMBER 30, 2016
The components of distributable earnings on a tax basis (excluding unrealized appreciation (depreciation) which are disclosed in the Schedules of Investments) consist of the following:
| Undistributed Ordinary Income | Undistributed Long-Term Capital Gains | Undistributed Tax-Exempt Income | ||||||||||
Bond Fund | $ | 125 | $ | — | $ | — | ||||||
CA Tax-Exempt Bond Fund | — | 161 | 48 | |||||||||
Essential Resources Fund | 29 | — | — | |||||||||
High Yield Fund | 120 | — | — | |||||||||
Low Duration Income Fund | 242 | — | — | |||||||||
Low Volatility Equity Fund | 16 | — | — | |||||||||
Multi-Sector Intermediate Bond Fund | 1,172 | — | — | |||||||||
Senior Floating Rate Fund | 758 | — | — | |||||||||
Tax-Exempt Bond Fund | — | 258 | 109 | |||||||||
Wealth Masters Fund | 286 | — | — | |||||||||
For the period ended September 30, 2016, the CA Tax-Exempt Bond Fund and the Tax-Exempt Bond Fund distributed $936 and $3,842 of exempt interest dividends, respectively.
The differences between the book and tax basis components of distributable earnings relate principally to the timing of recognition of income and gains for federal income tax purposes. Short-term gain distributions reported in the Statements of Changes in Net Assets, if any, are reported as ordinary income for federal tax purposes. Distributions are determined on a tax basis and may differ from net investment income and realized capital gains for financial reporting purposes.
| 2016 | 2015 | |||||||||||||||||||||||||||||||||||
| Tax Exempt Income | Ordinary income | Long-Term Capital Gains | Total | Tax Exempt Income | Ordinary income | Long-Term Capital Gains | Tax Return of Capital | Total | ||||||||||||||||||||||||||||
Bond Fund | $ | — | $ | 2,243 | $ | — | $ | 2,243 | $ | — | $ | 2,207 | $ | — | $ | 379 | $ | 2,586 | ||||||||||||||||||
CA Tax-Exempt Bond Fund | 936 | 18 | 706 | 1,660 | 1,130 | 33 | 1,061 | — | 2,224 | |||||||||||||||||||||||||||
Essential Resources Fund | — | 31 | — | (1) | 31 | — | — | — | — | — | ||||||||||||||||||||||||||
High Yield Fund | — | 3,678 | — | 3,678 | — | 4,752 | — | — | 4,752 | |||||||||||||||||||||||||||
Low Duration Income Fund | — | 4,715 | — | 4,715 | — | 3,654 | — | 543 | 4,197 | |||||||||||||||||||||||||||
Low Volatility Equity Fund | — | 49 | 45 | 94 | — | 15 | — | — | 15 | |||||||||||||||||||||||||||
Multi-Sector Intermediate Bond Fund | — | 12,588 | — | 12,588 | — | 14,411 | 3,975 | 1,912 | 20,298 | |||||||||||||||||||||||||||
Senior Floating Rate Fund | — | 21,463 | — | 21,463 | — | 32,389 | 1,003 | — | 33,392 | |||||||||||||||||||||||||||
Tax-Exempt Bond Fund | 3,842 | 24 | — | 3,866 | 4,923 | 19 | 149 | — | 5,091 | |||||||||||||||||||||||||||
Wealth Masters Fund | — | 1,747 | 519 | 2,266 | — | 2,974 | 48 | — | 3,022 | |||||||||||||||||||||||||||
(1) Amount is less than $500.
| Note 11. Reclassification of Capital Accounts |
($ reported in thousands)
For financial reporting purposes, book basis capital accounts are adjusted to reflect the tax character of permanent book/tax differences. Permanent reclassifications can arise from differing treatment of certain income and gain transactions, nondeductible current year net operating losses, expiring capital loss carryovers and investments in passive foreign investment companies. The reclassifications have no impact on the net assets or net asset value of the Funds. As of September 30, 2016, the Funds recorded reclassifications to increase (decrease) the accounts as listed below:
| Capital Paid in on Shares of Beneficial Interest | Undistributed Net Investment Income (Loss) | Accumulated Net Realized Gain (Loss) | ||||||||||
Bond Fund | $ | — | $ | (126 | ) | $ | 126 | |||||
CA Tax-Exempt Bond Fund | — | — | — | |||||||||
Essential Resources Fund | — | (2 | ) | 2 | ||||||||
High Yield Fund | — | — | — | |||||||||
Low Duration Income Fund | — | — | — | |||||||||
Low Volatility Equity Fund | — | — | — | |||||||||
Multi-Sector Intermediate Bond Fund | — | (304 | ) | 304 | ||||||||
Senior Floating Rate Fund | — | (84 | ) | 84 | ||||||||
Tax-Exempt Bond Fund | — | — | — | |||||||||
Wealth Masters Fund | — | — | — | |||||||||
(1) Amount less than $500.
| Note 12. Regulatory | Matters and Litigation |
From time to time, the Trust, the Funds’ Adviser and/or Subadvisers and/or their affiliates may be involved in litigation and arbitration as well as examinations and investigations by various regulatory bodies, including the SEC, involving compliance with, among other things, securities laws, client investment guidelines, laws governing the activities of broker-dealers and other laws and regulations affecting their products and other activities. At this time, the Adviser believes that the outcomes of such matters are not likely, either individually or in the aggregate, to be material to these financial statements.
113
Table of Contents
VIRTUS OPPORTUNITIES TRUST
NOTES TO FINANCIAL STATEMENTS (Continued)
SEPTEMBER 30, 2016
On February 20, 2015, a putative class action complaint (In re Virtus Investment Partners, Inc. Securities Litigation; formerly styled as Tom Cummins v. Virtus Investment Partners Inc. et al.) alleging violation of the federal securities laws was filed by an individual shareholder against Virtus and certain of its officers (the “defendants”) in the United States District Court for the Southern District of New York. On August 21, 2015, the lead plaintiff filed a Consolidated Class Action Complaint (the “Consolidated Complaint”) amending the originally filed complaint and adding the Trust as a defendant. The Consolidated Complaint was purportedly filed on behalf of all purchasers of Virtus common stock between January 25, 2013 and May 11, 2015 (the “Class Period”). The Consolidated Complaint alleges that during the Class Period, the defendants disseminated materially false and misleading statements and concealed material adverse facts relating to certain funds previously subadvised by F-Squared Investments, Inc. and/or its affiliates (“F-Squared”). The plaintiff seeks to recover unspecified damages. A motion to dismiss the Consolidated Complaint was filed on behalf of the defendants on October 21, 2015. Pursuant to an Opinion & Order (“Order”) filed on July 1, 2016, the court granted in part and denied in part the defendants’ motion to dismiss. Although the Order narrows the scope of the claims asserted, claims under Sections 10(b) and 20(a) of the Exchange Act and Rule 10b-5 thereunder survive the motion. The defendants filed an Answer to the Consolidated Complaint on August 5, 2016. Virtus and its affiliates, including the Adviser, believe that the suit is without merit and intend to defend it vigorously. The Trust believes that the risk of loss to the Funds as a result of this suit is remote. The Adviser does not believe that the suit will have any impact on its ability to provide services to the Funds.
On May 8, 2015, a putative class action complaint (Mark Youngers v. Virtus Investment Partners, Inc. et al.) alleging violations of certain provisions of the federal securities laws was filed in the United States District Court for the Central District of California. The complaint, which was purportedly filed on behalf of purchasers of certain Virtus Funds previously subadvised by F-Squared between May 8, 2010 and December 22, 2014, inclusive (the “Class Period”), alleged claims against Virtus, certain Virtus officers and affiliates (including the Adviser, Euclid Advisors LLC (“Euclid”) and VP Distributors, LLC), the trustees and certain officers of the Trust, and certain other parties (the “defendants”). The complaint alleges that during the Class Period the defendants disseminated materially false and misleading statements and concealed or omitted material facts necessary to make the statements made not misleading. On October 1, 2015, the plaintiff filed a First Amended Class Action Complaint which, among other things, added a derivative claim for breach of fiduciary duty on behalf of the Trust. On October 19, 2015, the United States District Court for the Central District of California entered an order transferring the action to the Southern District of New York. On January 4, 2016, Plaintiffs filed a Second Amended Complaint. Motions to dismiss were filed on behalf of Virtus, its officers and affiliates and the independent trustees on February 1, 2016. An Opinion & Order (“Order”) granting in part and denying in part the defendants’ motions to dismiss was issued on July 1, 2016. The Order dismissed all claims against the Adviser, Euclid, the independent trustees and certain of the other individual defendants and narrowed the claims asserted against the remaining defendants. The remaining defendants filed an Answer to the Second Amended Complaint on August 5, 2016. The defendants filed a motion to certify an interlocutory appeal of the July 1, 2016 order to the Court of Appeals for the Second Circuit on August 26, 2016. Oral argument on the motion is scheduled for October 7, 2016. Virtus and its affiliates, including the Adviser, believe that the suit has no basis in law or fact and intend to defend it vigorously. The Trust believes that the risk of loss to the Funds as a result of this suit is remote. The Adviser does not believe that the suit will have any impact on its ability to provide services to the Funds.
| Note 13. Borrowings |
($ reported in thousands)
On June 29, 2016, the Funds as well as other funds of the Trust (with the exception of the Senior Floating Rate Fund) renewed a $50,000 secured line of Credit. The Credit Agreement (the “Agreement”) is with a commercial bank (the “Bank”) that allows the Funds to manage large unexpected redemptions and trade fails, up to a limit of one-third or one-fifth of each Fund’s total net assets in accordance with the Agreement. The agreement has a term of 364 days and is renewable by the Funds with the Bank’s consent. Interest is charged at the higher of the LIBOR (London Interbank Offered Rate) or the Federal Funds rate plus an additional percentage rate on the amount borrowed. Commitment fees are charged on the undrawn balance. The Funds and other funds that are parties are individually, and not jointly, liable for their particular advances, if any, under the line of credit. The Bank has the ability to require repayment of outstanding borrowings under the Agreement upon certain circumstances such as an event of default.
No Funds made borrowings during the period and no Fund had any outstanding borrowings as of September 30, 2016.
On April 30, 2012, the Senior Floating Rate Fund entered into a Credit Agreement (the “Agreement”) with a commercial bank (the “Bank”) that allows the Fund to borrow cash from the Bank, up to a limit of $125,000. Borrowings under the Agreement are collateralized by investments of the Fund. Interest is charged at LIBOR (London Interbank Offered Rate) plus an additional percentage rate on the amount borrowed. Commitment fees are charged on the undrawn balance. Total commitment fees paid and accrued for the period ended September 30, 2016, were $197 and are included in interest expense and fees on the Statement of Operations. The Agreement is renewable by the Fund with the Bank’s consent. The Agreement can also be converted to a 364 day fixed term facility, one time at the Fund’s option. The Bank has the ability to require repayment of outstanding borrowings under the Agreement upon certain circumstances such as an event of default. From October 1, 2015 to September 30, 2016, the average daily borrowings under the Agreement and the weighted daily average interest rate were $24,124 and 1.222%, respectively. At September 30, 2016, the Fund had $30,000 in such outstanding borrowings with an interest rate of 1.374%.
| Note 14. Illiquid and Restricted Securities |
Investments are generally considered illiquid if they cannot be disposed of within seven days in the ordinary course of business at the approximate amount at which such securities have been valued by a Fund. Additionally, the following information is also considered in determining liquidity: the frequency of trades and quotes for the investment, whether the investment is listed for trading on a recognized domestic exchange and/or whether two or more brokers are willing to purchase or sell the security at a comparable price, the extent of market making activity in the investment and the nature of the market for investment. Illiquid securities are footnoted as such at the end of each Fund’s Schedule of Investments where applicable. However, a portion of such footnoted securities could be liquid where it is determined that some, though not all, of the position could be disposed of within seven days in the ordinary course of business at the approximate amount at which such securities have been valued by the applicable Fund.
Restricted securities are illiquid securities, as defined above, not registered under the Securities Act of 1933, as amended (the “1933 Act”). Generally, 144A securities are excluded from this category, except where defined as illiquid.
Each Fund will bear any costs, including those involved in registration under the 1933 Act, in connection with the disposition of such securities.
114
Table of Contents
VIRTUS OPPORTUNITIES TRUST
NOTES TO FINANCIAL STATEMENTS (Continued)
SEPTEMBER 30, 2016
The following Funds held securities considered to be illiquid at September 30, 2016:
Fund | Aggregate Value | % of Fund’s | ||||||
Bond Fund | $ | 324 | 0.42 | % | ||||
High Yield Fund | 262 | 0.34 | ||||||
Multi-Sector Intermediate Bond Fund | 1,355 | 0.45 | ||||||
Senior Floating Rate Fund | 5,117 | 0.93 | ||||||
None of the securities referenced in this table are restricted.
At September 30, 2016, the Funds did not hold any securities that are both illiquid and restricted.
| Note 15. Subsequent Events |
Management has evaluated the impact of all subsequent events on the Funds through the date the financial statements were issued, and has determined that there the following subsequent events require recognition or disclosure in the financial statements.
Effective November 3, 2016, the Virtus Bond Fund, Virtus High Yield Fund and Virtus Senior Floating Rate Fund began offering Class R6 Shares.
Effective November 1, 2016, the expense limits applicable to Virtus High Yield Fund (as discussed in Note 4C) have changed. The new limits are set forth in the Prospectus Supplement for that Fund dated November 1, 2016, in the back of this Shareholder Report.
115
Table of Contents

REPORT OF INDEPENDENT REGISTERED PUBLIC ACCOUNTING FIRM
To the Board of Trustees of
Virtus Opportunities Trust and
Shareholders of the Funds, as defined:
In our opinion, the accompanying statements of assets and liabilities, including the schedules of investments, and the related statements of operations and of changes in net assets and the financial highlights present fairly, in all material respects, the financial position of the Virtus Bond Fund, Virtus CA Tax-Exempt Bond Fund, Virtus Essential Resources Fund, Virtus High Yield Fund, Virtus Low Duration Bond Fund, Virtus Low Volatility Equity Fund, Virtus Multi-Sector Intermediate Bond Fund, Virtus Senior Floating Rate Fund, Virtus Tax-Exempt Bond Fund, and Virtus Wealth Masters Fund (constituting funds within Virtus Opportunities Trust, hereafter referred to as the “Funds”) at September 30, 2016, the results of each of their operations, the changes in each of their net assets and the financial highlights for each of the periods indicated, in conformity with accounting principles generally accepted in the United States of America. These financial statements and financial highlights (hereafter referred to as “financial statements”) are the responsibility of the Fund’s management. Our responsibility is to express an opinion on these financial statements based on our audits. We conducted our audits of these financial statements in accordance with the standards of the Public Company Accounting Oversight Board (United States). Those standards require that we plan and perform the audit to obtain reasonable assurance about whether the financial statements are free of material misstatement. An audit includes examining, on a test basis, evidence supporting the amounts and disclosures in the financial statements, assessing the accounting principles used and significant estimates made by management, and evaluating the overall financial statement presentation. We believe that our audits, which included confirmation of securities at September 30, 2016 by correspondence with the custodian, brokers, and transfer agent of the investee funds, provide a reasonable basis for our opinion.

Philadelphia, Pennsylvania
November 22, 2016
116
Table of Contents
VIRTUS OPPORTUNITIES TRUST
SEPTEMBER 30, 2016
(Unaudited)
For the fiscal year ended September 30, 2016, the Funds make the following disclosures for federal income tax purposes. Below is listed the percentages, or the maximum amount allowable, of its ordinary income dividends (“QDI”) to qualify for the lower tax rates applicable to individual shareholders, and the percentage of ordinary income dividends earned by the Funds which qualifies for the dividends received deduction (“DRD”) for corporate shareholders. The Funds designate the amounts below as long-term capital gains dividends (“LTCG”) ($ reported in thousands), or if subsequently different, the amounts will be designated in the next annual report. The actual percentage for the calendar year will be designated in year-end tax statements.
Fund | QDI | DRD | LTCG | |||||||||
Bond Fund | 0 | % | 0 | % | $ | — | ||||||
CA Tax-Exempt Bond Fund | — | — | 214 | |||||||||
Essential Resources Fund | 100 | 58 | — | |||||||||
High Yield Fund | — | — | — | |||||||||
Low Duration Income Fund | — | — | — | |||||||||
Low Volatility Equity Fund | 100 | 100 | — | |||||||||
Multi-Sector Intermediate Bond Fund | — | — | — | |||||||||
Senior Floating Rate Fund | — | — | — | |||||||||
Tax-Exempt Bond Fund | — | — | 258 | |||||||||
Wealth Masters Fund | 100 | 100 | 10 | |||||||||
For federal income tax purposes, 100% and 99% of the income dividends paid by the CA Tax-Exempt Bond Fund and the Tax-Exempt Bond Fund, respectively qualify as exempt-interest dividends.
For the period ended September 30, 2016, the Essential Resources Fund (the “Fund”) recognized $79 ($ reported in thousands) of foreign source income on which the Fund paid foreign taxes of $7 ($ reported in thousands). This information is being furnished to you pursuant to notice requirements of Section 853(a) and 855(d) of the Internal Revenue Code, as amended and the Treasury Regulations thereunder.
117
Table of Contents
CONSIDERATION OF SUBADVISORY AGREEMENTS FOR VIRTUS EMERGING MARKETS EQUITY INCOME FUND AND VIRTUS ESSENTIAL RESOURCES FUND
BY THE BOARD OF TRUSTEES
The Board of Trustees (the “Board”) of Virtus Opportunities Trust (the “Trust”) is responsible for the consideration and approval of advisory and subadvisory agreements for the Trust. As further discussed below, at meetings held on January 26, 2016, and February 23-24, 2016, the Board, including a majority of the Trustees who are not interested persons of the Trust as defined in Section 2(a)(19) of the Investment Company Act of 1940, as amended (such Act, the “1940 Act” and such Trustees, the “Independent Trustees”), considered and approved interim and new subadvisory agreements (together, the “Subadvisory Agreements”) with Kleinwort Benson Investors International, Ltd. (“KBII” or the “Subadviser”), subadviser to the Virtus Emerging Markets Equity Income Fund and Virtus Essential Resources Fund (each a “Fund” and collectively, the “Funds”).
KBII has served as the subadviser to each Fund since inception, and the Board previously approved subadvisory agreements with KBII (the “Old Subadvisory Agreements”) in 2014 and 2015. On January 13, 2016, Oddo & Cie, a French financial services group based primarily in Europe, (“Oddo”) acquired in excess of 25% of the outstanding shares of BHF Kleinwort Benson SA (“BHFKB”), an indirect parent of KBII. Under the 1940 Act, an acquisition of more than 25% of the voting shares of a company is generally considered to be a change in control. As the indirect parent company of KBII, a change in control at BHFKB also causes a change in control at KBII. Under the 1940 Act, when a change in control occurs, affected subadvisory agreements automatically terminate. In order to continue utilizing KBII as a subadviser, at a telephonic meeting held on January 26, 2016, the Board approved an interim subadvisory agreement (the “Interim Subadvisory Agreement”) effective January 13, 2016, with the proviso that such agreement may not continue for a period of more than 150 days from the termination event or the date on which a new subadvisory agreement is entered into. At an in-person meeting held on February 23-24, 2016, the Board then approved the new investment subadvisory agreement (the “New Subadvisory Agreement”) with KBII. The New Subadvisory Agreement was approved by shareholders on May 26, 2016.
In considering the approval of the Interim Subadvisory Agreement and the New Subadvisory Agreement (collectively, the “Subadvisory Agreements”), the Board requested and evaluated information provided by Virtus Investment Advisers, Inc. (“VIA” or the “Adviser”) and the Subadviser which, in the Board’s view, constituted information necessary for the Board to form a judgment as to whether the approval of the Subadvisory Agreements would be in the best interests of each applicable Fund and its respective shareholders. The Board also considered information furnished throughout the year at regular Board meetings with respect to the services provided by VIA and already provided by the Subadviser for the Funds, including quarterly performance reports prepared by management containing reviews of investment results and periodic presentations from the Subadviser.
The Independent Trustees were separately advised by independent legal counsel throughout the process. The Board considered all the criteria separately with respect to the applicable Fund and its shareholders. In their deliberations, the Trustees considered various factors, including those discussed below, none of which were controlling, and each Trustee may have attributed different weights to the various factors. The Independent Trustees also discussed the proposed approval of the Subadvisory Agreements in private sessions with their independent legal counsel at which no representatives of management were present.
| Basis | for the Board’s Recommendation |
In making its determination with respect to the Interim Subadvisory Agreement, the Board took into account that it was approving an agreement of limited duration and that the Board would have an opportunity to consider a new subadvisory agreement at a meeting to be scheduled in the near future. The Board noted that the New Subadvisory Agreement would be submitted to shareholders for approval. The Board also took into consideration that the terms of Interim Subadvisory Agreement were substantially identical to the terms of the Old Subadvisory Agreements, including that there was no change in the compensation to be paid thereunder. The Board noted that the key difference between the Old Subadvisory Agreements and the Interim Subadvisory Agreement resulted from compliance with a regulatory requirement that interim advisory agreements have a limited term. The Board also considered that the Subadviser had been managing the Funds since they commenced operations, and that the Subadviser had stated that there would be no change in the scope or quality of services to be provided by it as a result of the change in control. Based on all of the foregoing considerations, the Board, including the Independent Trustees, determined that approval of the Interim Subadvisory Agreement with KBII was in the best interests of each Fund and its shareholders. Accordingly, the Board, and the Independent Trustees voting separately, approved the Interim Subadvisory Agreement with respect to each Fund.
In making its determination with respect to the New Subadvisory Agreement, the Board considered various factors, including:
| • | Nature, extent, and quality of the services to be provided by the Subadviser. The Trustees received in advance of the meeting information in the form of an extensive questionnaire completed by the Subadviser concerning a number of topics, including its investment philosophy, resources, operations and compliance structure. The Trustees noted that the Subadviser would continue to provide portfolio management, compliance with each Fund’s investment policies and procedures, compliance with applicable securities laws, and assurances thereof. The Trustees reviewed biographical information for the portfolio managers who would provide services under the New Subadvisory Agreement and had done so under the Old Subadvisory Agreements and the Interim Subadvisory Agreement, and noted the breadth and depth of experience of the portfolio managers. In considering the approval of the New Subadvisory Agreement, the Trustees considered the Subadviser’s investment management process, including (a) the experience, capability and integrity of the Subadviser’s management and other personnel committed by the Subadviser to each Fund; (b) the quality and commitment of the Subadviser’s regulatory and legal compliance policies, procedures and systems; and (c) the Subadviser’s brokerage and trading practices. The Board concluded that the nature, extent and quality of the services to be provided by the Subadviser to the Funds was reasonable. |
| • | Investment Performance. The Board considered performance reports and discussions at Board meetings throughout the year, as well as data furnished in connection with the consideration of the New Subadvisory Agreement. The Board noted that the Emerging Markets Equity Income Fund had underperformed its benchmark for the 1- and 3-year periods, and considered the Subadviser’s explanation for the underperformance. The Board also noted that the Essential Resources Fund had a limited performance history, but that the Fund had outperformed its benchmark since its inception in March of 2015. After reviewing these and related factors, the Board concluded that the Subadviser’s overall performance was satisfactory. |
| • | Subadvisory Fee. The Board took into account that each Fund’s subadvisory fees are paid by the Adviser and not by the Funds, so that the Funds’ shareholders would not be directly impacted by those fees. The Board also noted that the fees under the New Subadvisory Agreement would be unchanged from those in the Old Subadvisory Agreements and the Interim Subadvisory Agreement. The Board concluded that the proposed subadvisory fees were fair and reasonable in light of services to be provided by the Subadviser and all factors considered. |
118
Table of Contents
CONSIDERATION OF SUBADVISORY AGREEMENTS FOR VIRTUS EMERGING MARKETS EQUITY INCOME FUND AND VIRTUS ESSENTIAL RESOURCES FUND
BY THE BOARD OF TRUSTEES (Continued)
| • | Profitability and economies of scale. In considering the expected profitability to the Subadviser of its relationship with the Funds, the Board noted that the fees under the New Subadvisory Agreement would be paid by the Adviser out of the advisory fees that it receives under its Advisory Agreement and not by the Funds The Board also noted that there was no change to the subadvisory fee under the New Subadvisory Agreement. In considering the reasonableness of the fees payable by VIA to the Subadviser, the Board relied on the ability of VIA to negotiate the New Subadvisory Agreement and the fees thereunder at arm’s length. For each of the above reasons, the Board concluded that the profitability to the Subadviser and its affiliates from its relationship with the Funds was not a material factor in approval of the New Subadvisory Agreement. |
| • | Other Benefits. The Board considered other benefits that may be realized by the Subadviser and its affiliates from its relationship with the Funds and concluded that there were no other direct benefits to the Subadviser in providing investment advisory services to each Fund, other than the fees to be earned although there may be certain indirect benefits gained, including to the extent that serving the Funds could provide the opportunity to provide advisory services to additional portfolios of the Trust or certain reputational benefits. |
Based on all of the foregoing considerations, the Board, including the Independent Trustees, determined that approval of the New Subadvisory Agreement with KBII was in the best interests of each Fund and its shareholders. Accordingly, the Board, and the Independent Trustees voting separately, approved the New Subadvisory Agreement with respect to each Fund.
119
Table of Contents
RESULTS OF SHAREHOLDER MEETING
VIRTUS OPPORTUNITIES TRUST
MAY 19, 2016 (Unaudited)
At a special meeting of shareholders of all series of Virtus Equity Trust, Virtus Insight Trust and Virtus Opportunities Trust, held on May 19, 2016, shareholders of Virtus Opportunities Trust (the “Trust”) voted on the following proposals:
| Number of Eligible Votes: | ||||||||||||
| Proposal 1. | FOR | AGAINST | ABSTAIN | |||||||||
To elect six Trustees to serve on the Board of Trustees until the next meeting of shareholders at which Trustees are elected. | ||||||||||||
George R. Aylward | 1,145,056,198.477 | 24,756,597.221 | 0 | |||||||||
Thomas J. Brown | 1,144,160,222.050 | 25,652,573.650 | 0 | |||||||||
Donald C. Burke | 1,145,758,834.912 | 24,053,960.790 | 0 | |||||||||
Roger A. Gelfenbien | 1,144,297,795.833 | 25,514,999.865 | 0 | |||||||||
John R. Mallin | 1,144,938,076.292 | 24,874,719.410 | 0 | |||||||||
Hassell H. McClellan | 1,143,864,433.134 | 25,948,362.566 | 0 | |||||||||
Shareholders of the Trust voted to approve the above proposal.
| Number of Eligible Votes: | ||||||||||||
| Proposal 2. | FOR | AGAINST | ABSTAIN | |||||||||
To approve a proposal to permit Virtus Investment Advisers, Inc., as the investment adviser to all the Funds, to hire and replace subadvisers or to modify subadvisory agreements without shareholder approval. | ||||||||||||
Virtus CA Tax Exempt Bond Fund | 1,258,194.893 | 91,895.368 | 41,271.245 | |||||||||
Virtus Emerging Markets Debt Fund | 3,015,152.206 | 198.283 | 0 | |||||||||
Virtus Emerging Markets Equity Income Fund | 3,672,832.400 | 0 | 0 | |||||||||
Virtus Emerging Markets Opportunities Fund | 620,793,093.034 | 25,302,093.728 | 9,306,937.262 | |||||||||
Virtus Emerging Markets Small-Cap Fund | 494,281.793 | 0 | 0 | |||||||||
Virtus Essential Resources Fund | 504,931.913 | 0 | 0 | |||||||||
Virtus Foreign Opportunities Fund | 27,726,679.250 | 666,663.374 | 564,703.507 | |||||||||
Virtus Greater European Opportunities Fund | 818,457.900 | 37,502.974 | 15,676.215 | |||||||||
Virtus International Small-Cap Fund | 3,074,638.276 | 5,991.041 | 10,261.000 | |||||||||
Virtus International Wealth Masters Fund | 518,044.295 | 0 | 0 | |||||||||
Virtus Low Duration Income Fund | 10,449,114.393 | 779,684.940 | 311,840.943 | |||||||||
Virtus Multi-Sector Intermediate Bond Fund | 11,147,670.008 | 724,253.699 | 406,427.672 | |||||||||
Virtus Multi-Sector Short Term Bond Fund | 618,834,424.483 | 21,316,032.964 | 14,819,955.463 | |||||||||
Shareholders of the Funds listed above voted to approve the above proposal.
| Number of Eligible Votes: | ||||||||||||
| Proposal 6. | FOR | AGAINST | ABSTAIN | |||||||||
To approve a proposal to amend the fundamental restrictions of the Fundamental Restriction Funds with respect to loans. | ||||||||||||
Virtus Foreign Opportunities Fund | 27,568,524.708 | 741,409.046 | 648,118.377 | |||||||||
Virtus Multi-Sector Short Term Bond Fund | 615,281,810.614 | 22,749,361.497 | 16,939,237.795 | |||||||||
Shareholders of the Funds listed above voted to approve the above proposal.
120
Table of Contents
RESULTS OF SHAREHOLDER MEETING
VIRTUS OPPORTUNITIES TRUST
MAY 26, 2016 (Unaudited)
At a special meeting of shareholders of Virtus Emerging Markets Equity Income Fund and Virtus Essential Resources Fund (collectively, the “Funds”), each a series of Virtus Opportunities Trust, held on May 26, 2016, shareholders voted on the following proposal:
| Number of Eligible Votes: | ||||||||||||
| FOR | AGAINST | ABSTAIN | ||||||||||
To approve a new subadvisory agreement between Virtus Investment Advisers, Inc., the Funds’ Investment Adviser, and Kleinwort Benson Investors International, Ltd., the Funds’ Subadviser. | ||||||||||||
Virtus Emerging Markets Equity Income Fund | 3,697,072.869 | 0 | 0 | |||||||||
Virtus Essential Resources Fund | 506,647.913 | 0 | 0 | |||||||||
Shareholders of the Funds voted to approve the above proposal.
121
Table of Contents
RESULTS OF SHAREHOLDER MEETING
VIRTUS OPPORTUNITIES TRUST
JUNE 16, 2016 (Unaudited)
At a special meeting of shareholders of Virtus Bond Fund, Virtus Global Infrastructure Fund, Virtus Global Real Estate Securities Fund, Virtus High Yield Fund, Virtus International Real Estate Securities Fund and Virtus Senior Floating Rate Fund (each a “Fund”), held on June 16, 2016, shareholders of each Fund voted on the following proposal:
| Number of Eligible Votes: | ||||||||||||
| Proposal 2. | FOR | AGAINST | ABSTAIN | |||||||||
To approve a proposal to permit Virtus Investment Advisers, Inc., as the investment adviser to all the Funds, to hire and replace subadvisers or to modify subadvisory agreements without shareholder approval. | ||||||||||||
Virtus Bond Fund | 3,027,478.512 | 194,272.268 | 147,040.417 | |||||||||
Virtus Global Infrastructure Fund | 3,636,950.694 | 307,905.417 | 172,360.145 | |||||||||
Virtus Global Real Estate Securities Fund | 1,661,823.911 | 122,802.243 | 36,355.685 | |||||||||
Virtus High Yield Fund | 6,737,350.870 | 765,216.446 | 446,105.991 | |||||||||
Virtus International Real Estate Securities Fund | 2,728,863.703 | 48,714.840 | 63,894.599 | |||||||||
Virtus Senior Floating Rate Fund | 30,432,212.381 | 775,729.890 | 326,306.209 | |||||||||
Shareholders of the Funds listed above voted to approve the above proposal.
122
Table of Contents
RESULTS OF SHAREHOLDER MEETING
VIRTUS OPPORTUNITIES TRUST
JULY 18, 2016 (Unaudited)
At a special meeting of shareholders of Virtus Global Equity Trend Fund, Virtus Global Opportunities Fund, Virtus Herzfeld Fund, Virtus International Equity Fund, Virtus Low Volatility Equity Fund, Virtus Real Estate Securities Fund, Virtus Sector Trend Fund, Virtus Wealth Masters Fund, Virtus Alternatives Diversifier Fund, Virtus Equity Trend Fund, Virtus Multi-Asset Trend Fund and Virtus Tax-Exempt Bond Fund, held on July 18, 2016, shareholders of the Funds voted on the following proposals:
| Number of Eligible Votes: | ||||||||||||
| Proposal 2. | FOR | AGAINST | ABSTAIN | |||||||||
To approve a proposal to permit Virtus Investment Advisers, Inc., as the investment adviser to all the Funds, to hire and replace subadvisers or to modify subadvisory agreements without shareholder approval. | ||||||||||||
Virtus Global Equity Trend Fund | 2,071,338.688 | 221,721.989 | 61,016.655 | |||||||||
Virtus Global Opportunities Fund | 6,475,669.315 | 399,601.579 | 221,211.057 | |||||||||
Virtus Herzfeld Fund | 2,285,754.412 | 134,756.871 | 89,510.278 | |||||||||
Virtus International Equity Fund | 347,976.498 | 45,434.960 | 4,980.529 | |||||||||
Virtus Low Volatility Equity Fund | 234,510.520 | 7,334.000 | 90,835.796 | |||||||||
Virtus Real Estate Securities Fund | 14,196,247.698 | 691,146.713 | 476,502.196 | |||||||||
Virtus Sector Trend Fund | 14,380,526.646 | 1,274,297.224 | 1,097,176.679 | |||||||||
Virtus Wealth Masters Fund | 2,759,756.937 | 182,003.481 | 154,822.394 | |||||||||
Virtus Alternatives Diversifier Fund | 2,054,425.037 | 135,901.800 | 177,500.739 | |||||||||
Virtus Equity Trend Fund | 47,080,228.694 | 3,814,318.119 | 2,960,680.324 | |||||||||
Virtus Multi-Asset Trend Fund | 7,428,521.065 | 660,946.728 | 521,389.418 | |||||||||
Virtus Tax-Exempt Bond Fund | 7,423,225.114 | 802,129.342 | 492,588.498 | |||||||||
Shareholders of Virtus Global Equity Trend Fund, Virtus Global Opportunities Fund, Virtus Herzfeld Fund, Virtus International Equity Fund, Virtus Low Volatility Equity Fund, Virtus Real Estate Securities Fund, Virtus Sector Trend Fund and Virtus Wealth Masters Fund voted to approve the above proposal. Shareholders of Virtus Alternatives Diversifier Fund, Virtus Equity Trend Fund, Virtus Multi-Asset Trend Fund and Virtus Tax-Exempt Bond Fund did not approve the above proposal.
| Number of Eligible Votes: | ||||||||||||
| Proposal 6. | FOR | AGAINST | ABSTAIN | |||||||||
To approve a proposal to amend the fundamental restrictions of the Fundamental Restriction Funds with respect to loans. | ||||||||||||
Virtus Sector Trend Fund | 14,250,883.760 | 1,251,197.022 | 1,249,922.768 | |||||||||
Virtus Real Estate Securities Fund | 13,928,178.018 | 864,726.603 | 570,992.984 | |||||||||
Shareholders of Virtus Sector Trend Fund voted to approve the above proposal. Shareholders of Virtus Real Estate Securities Fund did not approve the above proposal.
| Number of Eligible Votes: | ||||||||||||
| Proposal 7. | FOR | AGAINST | ABSTAIN | |||||||||
To approve a proposal to amend the fundamental restrictions of the Fundamental Restriction Funds with respect to loans. | ||||||||||||
Virtus Multi-Sector Short Term Bond Fund | 238,431,276.605 | 411,212,271.419 | 20,011,935.573 | |||||||||
Virtus Real Estate Securities Fund | 9,635,396.247 | 5,113,977.185 | 614,521.174 | |||||||||
Virtus Sector Trend Fund | 9,706,807.226 | 5,648,494.88 | 1,396,703.437 | |||||||||
Shareholders of the Funds listed above did not approve the above proposal.
123
Table of Contents
(UNAUDITED)
Information pertaining to the trustees and officers of the Trust as of September 30, 2016, is set forth below. The statement of additional information (SAI) includes additional information about the trustees and is available without charge, upon request, by calling (800) 243-1574. The address of each individual, unless otherwise noted, is 100 Pearl Street, Hartford, CT 06103-4506. There is no stated term of office for trustees of the Trust.
Independent Trustees
| Name, Year of Birth, Year Elected and Number of Funds Overseen | Principal Occupation(s) During Past 5 Years and Other Directorships Held by Trustee | |
Thomas J. Brown YOB: 1945 Elected: 2016 65 Portfolios | Retired. Trustee (since 2016), Virtus Mutual Fund Complex (52 portfolios) and Virtus Alternative Solutions Trust (4 portfolios); Trustee (since 2011), Virtus Variable Insurance Trust (9 portfolios); Director (since 2010), D’Youville Senior Care Center; and Director (since 2005), VALIC Company Funds (49 portfolios). | |
Burke, Donald C. YOB: 1961 Elected: 2016 69 Portfolios | Retired. Trustee (since 2016), Virtus Mutual Fund Complex (52 portfolios), Virtus Variable Insurance Trust (9 portfolios) and Virtus Alternative Solutions Trust (4 portfolios); Director (since 2014) closed-end funds managed by Duff & Phelps Investment Management Co. (4 funds); Director, Avista Corp. (energy company) (since 2011); Trustee, Goldman Sachs Fund Complex (2010 to 2014); and Director, BlackRock Luxembourg and Cayman Funds (2006 to 2010). | |
Roger A. Gelfenbien YOB: 1943 Elected: 2016 65 Portfolios | Retired. Trustee (since 2016), Virtus Mutual Fund Complex (52 portfolios) and Virtus Alternative Solutions Trust (4 portfolios); Trustee (since 2000), Virtus Variable Insurance Trust (9 portfolios); and Director (since 1999), USAllianz Variable Insurance Product Trust (42 portfolios). | |
John R. Mallin YOB: 1950 Elected: 2016 65 Portfolios | Partner/Attorney (since 2003), McCarter & English LLP (law firm), Real Property Practice Group; and Member (since 2014), Counselors of Real Estate. Trustee (since 2016), Virtus Mutual Fund Complex (52 portfolios) and Virtus Alternative Solutions Trust (4 portfolios); Director (since 2013), Horizon, Inc. (non-profit); and Trustee (since 1999), Virtus Variable Insurance Trust (9 portfolios). | |
McClellan, Hassell H. YOB: 1945 Elected: 2015 65 Portfolios | Retired (since 2013); and Professor (1984 to 2013), Wallace E. Carroll School of Management, Boston College. Trustee (since 2016), Virtus Alternative Solutions Trust (4 portfolios); Trustee (since 2015), Virtus Mutual Fund Complex (52 portfolios); and Director (since 2010), Barnes Group, Inc. (diversified global components manufacturer and logistical services company); Trustee, Virtus Variable Insurance Trust (9 portfolios) (since 2008); and Trustee, John Hancock Fund Complex (since 2000) (collectively, 228 portfolios). | |
McLoughlin, Philip YOB: 1946 Elected: 1999 74 Portfolios | Retired. Director and Chairman (since 2016), The Zweig Fund and Virtus Global Dividend & Income Fund Inc.; Trustee and Chairman (since 2013), Virtus Alternative Solutions Trust (4 portfolios); Trustee/Director and Chairman (since 2011), Virtus Closed-End Funds (3 funds); Chairman and Trustee (since 2003), Virtus Variable Insurance Trust (9 portfolios); Director (since 1995), closed-end funds managed by Duff & Phelps Investment Management Co. (4 funds); Director (since 1991) and Chairman (since 2010), Lazard World Trust Fund (closed-end investment firm in Luxembourg); and Trustee (since 1989) and Chairman (since 2002), Virtus Mutual Fund Complex (52 portfolios). | |
McNamara, Geraldine M. YOB: 1951 Elected: 2001 69 Portfolios | Retired. Trustee (since 2016) Virtus Alternative Solutions Trust (4 portfolios); Trustee (since 2015), Virtus Variable Insurance Trust (9 portfolios); Director (since 2003), closed-end funds managed by Duff & Phelps Investment Management Co. (4 funds); and Trustee (since 2001), Virtus Mutual Fund Complex (52 portfolios). | |
Oates, James M. YOB: 1946 Elected: 2000 70 Portfolios | Managing Director (since 1994), Wydown Group (consulting firm). Director (since 2016), The Zweig Fund and Virtus Global Dividend & Income Fund Inc.; Trustee (since 2016) Virtus Variable Insurance Trust (9 portfolios); Trustee/Director (since 2013), Virtus Closed-End Funds (3 funds); Trustee (since 2013), Virtus Alternative Solutions Trust (4 portfolios); Chairman and Trustee (since 2005), John Hancock Fund Complex (228 portfolios); Director (2002 to 2014), New Hampshire Trust Company; Chairman (since 2000), Emerson Investment Management, Inc.; Non-Executive Chairman (2000 to 2014), Hudson Castle Group, Inc. (formerly IBEX Capital Markets, Inc.) (financial services) Chairman and Director (1999 to 2014), Connecticut River Bank; Director (since 1996), Stifel Financial; and Trustee (since 1987), Virtus Mutual Fund Complex (52 portfolios). | |
Segerson, Richard E. YOB: 1948 Elected: 2000 65 Portfolios | Retired; and Managing Director (1998 to 2013), Northway Management Company. Trustee (since 2016) Virtus Alternative Solutions Trust (4 portfolios) and Virtus Variable Insurance Trust (9 portfolios); and Trustee (since 1983), Virtus Mutual Fund Complex (52 portfolios). | |
Verdonck, Ferdinand L.J. YOB: 1942 Elected: 2005 65 Portfolios | Vice Chairman (since 2014), Affirmed Therapeutics (biotechnology); Director (1998 to 2015), The J.P. Morgan Continental European Investment Trust; Director (2005 to 2013), Galapagos N.V. (biotechnology); Director (1998 to 2015) Groupe SNEF; and Mr. Verdonck is also a director of several non-U.S. companies. Trustee (since 2016) Virtus Variable Insurance Trust (9 portfolios) and Virtus Alternative Solutions Trust (4 portfolios); and Trustee (since 2002), Virtus Mutual Fund Complex (52 portfolios). | |
124
Table of Contents
FUND MANAGEMENT TABLES (Continued)
(UNAUDITED)
Interested Trustee
The individual listed below is an “interested person” of the Trust, as defined in Section 2(a)(19) of the 1940 Act, as amended, and the rules and regulations thereunder.
| Name, Year of Birth, Year Elected and Number of Funds Overseen | Principal Occupation(s) During Past 5 Years and Other Directorships Held by Trustee | |
Aylward, George R.* Trustee and President YOB: 1964 Elected: 2006 70 Portfolios | Director, President and Chief Executive Officer (since 2008), Virtus Investment Partners, Inc. and/or certain of its subsidiaries; various senior officer positions with Virtus affiliates (since 2005). Chairman and Trustee (since 2015), Virtus ETF Trust II; Trustee and President (since 2013), Virtus Alternative Solutions Trust (4 portfolios); Director (since 2013), Virtus Global Funds, PLC (2 portfolios); Trustee (since 2012) and President (since 2010), Virtus Variable Insurance Trust (9 portfolios); Trustee and President (since 2011), Virtus Closed-End Funds (3 funds); Trustee (since 2006), Virtus Mutual Funds (52 portfolios); and Director, President and Chief Executive Officer (since 2006), The Zweig Fund and Virtus Global Dividend & Income Fund Inc. | |
Officers of the Trust Who Are Not Trustees
Name, Address and Year of Birth | Position(s) Held with Trust and Length of Time Served | Principal Occupation(s) During Past 5 Years | ||
Bradley, W. Patrick YOB: 1972 | Executive Vice President (since 2016); Senior Vice President (2013 to 2016); Vice President (2011 to 2013); Chief Financial Officer and Treasurer (since 2006). | Executive Vice President, Fund Services (since 2016), Senior Vice President, Fund Services (2010 to 2016), Virtus Investment Partners, Inc. and/or certain of its subsidiaries; various officer positions (since 2006) with Virtus affiliates; Executive Vice President (since 2016), Senior Vice President (2013 to 2016), Vice President (2011 to 2013), Chief Financial Officer and Treasurer (since 2004), Virtus Variable Insurance Trust; Executive Vice President (since 2016), Senior Vice President (2013 to 2016), Vice President (2011 to 2013), Chief Financial Officer and Treasurer (since 2006), Virtus Mutual Fund Complex; Executive Vice President (since 2016), Senior Vice President (2013 to 2016), Vice President (2012 to 2013) and Treasurer (Chief Financial Officer) (since 2007), The Zweig Fund and Virtus Global Dividend & Income Fund Inc.; Executive Vice President (since 2016), Senior Vice President (2013 to 2016), Vice President (2011 to 2013), Chief Financial Officer and Treasurer (since 2011), Virtus Closed-End Funds; Vice President and Assistant Treasurer (since 2011), Duff & Phelps Global Utility Income Fund Inc.; Director (since 2013), Virtus Global Funds, PLC; and Executive Vice President (since 2016), Senior Vice President, Chief Financial Officer and Treasurer (2013 to 2016), Virtus Alternative Solutions Trust. | ||
Carr, Kevin J. YOB: 1954 | Senior Vice President (since 2013); Vice President (2005 to 2013); Chief Legal Officer, Counsel and Secretary (since 2005). | Senior Vice President (since 2009), Vice President, Counsel and Secretary (2008 to 2009), Virtus Investment Partners, Inc. and/or certain of its subsidiaries; various senior officer positions (since 2005) with Virtus affiliates; Senior Vice President (since 2013), Vice President (2005 to 2013), Chief Legal Officer, Counsel and Secretary (since 2005), Virtus Mutual Fund Complex; Senior Vice President (2013 to 2014), Vice President (2012 to 2013) and Assistant Secretary (since 2012), Secretary and Chief Legal Officer (2005 to 2012), The Zweig Fund and Virtus Global Dividend & Income Fund Inc.; Assistant Secretary (since 2013), Vice President, Chief Legal Officer, Counsel and Secretary (2010 to 2013), Virtus Variable Insurance Trust; Vice President and Assistant Secretary (since 2011), Duff & Phelps Global Utility Income Fund Inc.; Senior Vice President and Assistant Secretary (2013 to 2014), Vice President and Assistant Secretary (2012 to 2013), Vice President, Chief Legal Officer, Counsel and Secretary (2011 to 2012), Virtus Closed-End Funds; and Assistant Secretary (since 2013), Virtus Alternative Solutions Trust. | ||
Engberg, Nancy J. YOB: 1956 | Vice President and Chief Compliance Officer since 2011. | Vice President (since 2008) and Chief Compliance Officer (2008 to 2011 and since 2016), Virtus Investment Partners, Inc. and/or certain of its subsidiaries; various officer positions (since 2003) with Virtus affiliates; Vice President and Chief Compliance Officer (since 2011), Virtus Mutual Fund Complex; Vice President (since 2010) and Chief Compliance Officer (since 2011), Virtus Variable Insurance Trust; Vice President and Chief Compliance Officer (since 2011), Virtus Closed-End Funds; Vice President and Chief Compliance Officer (since 2012), The Zweig Fund and Virtus Global Dividend & Income Fund Inc.; Vice President and Chief Compliance Officer (since 2013), Virtus Alternative Solutions Trust; Chief Compliance Officer (since 2015), ETFis Series Trust I; and Chief Compliance Officer (since 2015), Virtus ETF Trust II. | ||
Waltman, Francis G. YOB: 1962 | Executive Vice President (since 2013); Senior Vice President (2008-2013). | Executive Vice President, Product Development (since 2009), Virtus Investment Partners, Inc. and/or certain of its subsidiaries; various senior officer positions (since 2006) with Virtus affiliates; Executive Vice President (since 2013), Senior Vice President (2008 to 2013), Virtus Mutual Fund Complex; Executive Vice President (since 2013), Senior Vice President (2010 to 2013), Virtus Variable Insurance Trust; Executive Vice President (since 2013), Senior Vice President (2011 to 2013), Virtus Closed-End Funds; Director (since 2013), Virtus Global Funds PLC; and Executive Vice President (since 2013), Virtus Alternative Solutions Trust. | ||
125
Table of Contents
Virtus Bond Fund, Virtus High Yield Fund,
and Virtus Senior Floating Rate Fund,
each a series of Virtus Opportunities Trust
Supplement dated November 1, 2016 to the Summary Prospectuses dated January 28, 2016, as supplemented, and the Virtus Opportunities Trust Statutory Prospectus, dated January 28, 2016, as supplemented
IMPORTANT NOTICETO INVESTORS
As of November 1, 2016, Virtus Bond Fund, Virtus High Yield Fund and Virtus Senior Floating Rate Fund are offering Class R6 Shares, in addition to the share classes already offered by the funds. Additionally, Virtus High Yield Fund has increased its expense reimbursement arrangement, effective November 1, 2016. Accordingly, the funds’ prospectuses are hereby amended to add the following disclosure.
Virtus Bond Fund
The cover page of the statutory prospectus is hereby revised by replacing the row showing ticker symbols for the fund’s share classes with the row shown below:
| A | B | C | I | R6 | T | |||||||
| Virtus Bond Fund | SAVAX | SAVBX | SAVCX | SAVYX | VBFRX |
The tables under “Fees and Expenses” in the fund’s summary prospectus and the summary section of the statutory prospectus are hereby revised to add the Class R6 column and to revise the associated footnotes as shown below:
| Shareholder Fees (fees paid directly from your investment) | Class R6 | |||
| Maximum Sales Charge (load) Imposed on Purchases (as a percentage of offering price) | None | |||
| Maximum Sales Charge (load) (as a percentage of the lesser of purchase price or redemption proceeds) | None |
| Annual Fund Operating Expenses (expenses that you pay each year as a percentage of the value of your investment) | Class R6 | |||
| Management Fee | 0.45% | |||
| Distribution and Shareholder Servicing (12b-1) Fees | None | |||
| Other Expenses | 0.36% | (b) | ||
| Acquired Fund Fees and Expenses | 0.01% | |||
| Total Annual Fund Operating Expenses(c) | 0.82% | |||
| Less: Fee Waiver and/or Expense Reimbursement(d) | (0.27% | ) | ||
| Total Annual Fund Operating Expenses After Expense Reimbursement(c)(d) | 0.55% |
| (b) | Estimated for current fiscal year, as annualized. |
| (c) | The Total Annual Fund Operating Expenses do not correlate to the ratio of expenses to average net assets appearing in the Financial Highlights tables, which tables reflect only the operating expenses of the fund and do not include acquired fund fees and expenses. |
| (d) | The fund’s investment adviser has contractually agreed to limit the fund’s total operating expenses (excluding dividend and interest expenses, taxes, brokerage commissions, extraordinary expenses and acquired fund fees and expenses) so that such expenses do not exceed 0.85% for Class A Shares, 1.60% for Class B Shares, 1.60% for Class C Shares, 0.60% for Class I Shares and 0.54% for Class R6 Shares through January 31, 2017. Following the contractual period, the adviser may discontinue these expense reimbursement arrangements at any time. Under certain conditions, the adviser may recapture operating expenses reimbursed under these arrangements for a period of three years following the time such reimbursement occurred. |
The Example table is hereby revised to add the Class R6 row as shown below:
| Share Status | 1 Year | 3 Years | 5 Years | 10 Years | ||||||||||||||
| Class R6 | Sold or Held | $ | 56 | $ | 235 | $ | 429 | $ | 988 | |||||||||
Virtus High Yield Fund
The cover page of the statutory prospectus is hereby revised by replacing the row showing ticker symbols for the fund’s share classes with the row shown below:
| A | B | C | I | R6 | T | |||||||||
| Virtus High Yield Fund | PHCHX | PHCCX | PGHCX | PHCIX | VRHYX | |||||||||
Table of Contents
The tables under “Fees and Expenses” in the fund’s summary prospectus and the summary section of the statutory prospectus are hereby revised to reflect the new expense reimbursement arrangements, to add the Class R6 column and to revise the associated footnotes:
| Shareholder Fees (fees paid directly from your investment) | Class A | Class B | Class C | Class I | Class R6 | |||||||||||||||
| Maximum Sales Charge (load) Imposed on Purchases (as a percentage of offering price) | 3.75% | None | None | None | None | |||||||||||||||
| Maximum Sales Charge (load) (as a percentage of the lesser of purchase price or redemption proceeds) | None | 5.00% | (a) | 1.00% | (a) | None | None |
| Annual Fund Operating Expenses (expenses that you pay each year as a percentage of the value of your investment) | Class A | Class B | Class C | Class I | Class R6 | |||||||||||||||
| Management Fees | 0.65% | 0.65% | 0.65% | �� | 0.65% | 0.65% | ||||||||||||||
| Distribution and Shareholder Servicing (12b-1) Fees | 0.25% | 1.00% | 1.00% | None | None | |||||||||||||||
| Other Expenses | 0.42% | 0.42% | 0.42% | 0.42% | 0.36% | (b) | ||||||||||||||
| Acquired Fund Fees and Expenses | 0.01% | 0.01% | 0.01% | 0.01% | 0.01% | |||||||||||||||
| Total Annual Fund Operating Expenses(c) | 1.33% | 2.08% | 2.08% | 1.08% | 1.02% | |||||||||||||||
| Less: Expense Reimbursement(d) | (0.32% | ) | (0.32% | ) | (0.32% | ) | (0.32% | ) | (0.32% | ) | ||||||||||
| Total Annual Fund Operating Expenses After Expense Reimbursement(c)(d) | 1.01% | 1.76% | 1.76% | 0.76% | 0.70% |
| (a) | The maximum deferred sales charge is imposed on Class B Shares redeemed during the first year; thereafter, it decreases 1% annually to 2% during the fourth and fifth years and to 0% after the fifth year. The deferred sales charge is imposed on Class C Shares redeemed during the first year only. |
| (b) | Estimated for current fiscal year, as annualized. |
| (c) | The Total Annual Fund Operating Expenses do not correlate to the ratio of expenses to average net assets appearing in the Financial Highlights tables, which tables reflect only the operating expenses of the fund and do not include acquired fund fees and expenses. |
| (d) | The fund’s investment adviser has contractually agreed to limit the fund’s total operating expenses (excluding dividend and interest expenses, taxes, brokerage commissions, extraordinary expenses and acquired fund fees and expenses) so that such expenses do not exceed 1.00% for Class A Shares, 1.75% for Class B Shares, 1.75% for Class C Shares, 0.75% for Class I Shares and 0.69% for Class R6 Shares through January 31, 2017. Following the contractual period, the adviser may discontinue these expense reimbursement arrangements at any time. Under certain conditions, the adviser may recapture operating expenses reimbursed under these arrangements for a period of three years following the time such reimbursement occurred. |
Under “Fees and Expenses, the “Example” table is hereby replaced with the following:
| Share Status | 1 Year | 3 Years | 5 Years | 10 Years | ||||||||||||||
| Class A | Sold or Held | $ | 474 | $ | 750 | $ | 1,047 | $ | 1,890 | |||||||||
| Class B | Sold | $ | 579 | $ | 821 | $ | 1,089 | $ | 2,193 | |||||||||
| Held | $ | 179 | $ | 621 | $ | 1,089 | $ | 2,193 | ||||||||||
| Class C | Sold | $ | 279 | $ | 621 | $ | 1,089 | $ | 2,385 | |||||||||
| Held | $ | 179 | $ | 621 | $ | 1,089 | $ | 2,385 | ||||||||||
| Class I | Sold or Held | $ | 78 | $ | 312 | $ | 564 | $ | 1,288 | |||||||||
| Class R6 | Sold or Held | $ | 72 | $ | 293 | $ | 532 | $ | 1,219 | |||||||||
Virtus Senior Floating Rate Fund
The cover page of the statutory prospectus is hereby revised by replacing the row showing ticker symbols for the fund’s share classes with the row shown below:
| A | B | C | I | R6 | T | |||||||
| Virtus Senior Floating Rate Fund | PSFRX | PFSRX | PSFIX | VRSFX |
Table of Contents
The tables under “Fees and Expenses” in the fund’s summary prospectus and the summary section of the statutory prospectus, are hereby revised to add the Class R6 column and to revise the associated footnote as shown below:
| Shareholder Fees (fees paid directly from your investment) | Class R6 | |||
| Maximum Sales Charge (load) Imposed on Purchases (as a percentage of offering price) | None | |||
| Maximum Sales Charge (load) (as a percentage of the lesser of purchase price or redemption proceeds) | None |
| Annual Fund Operating Expenses (expenses that you pay each year as a percentage of the value of your investment) | Class R6 | |||
| Management Fee | 0.60% | |||
| Distribution and Shareholder Servicing (12b-1) Fees | None | |||
| Other Expenses | 0.29% | (b) | ||
| Total Annual Fund Operating Expenses | 0.89% |
| (b) | Estimated for current fiscal year, as annualized. |
The Example table is hereby revised to add the Class R6 row as shown below:
| Share Status | 1 Year | 3 Years | 5 Years | 10 Years | ||||||||||||||
| Class R6 | Sold or Held | $ | 91 | $ | 284 | $ | 493 | $ | 1,096 | |||||||||
All Funds
In the first table in the section “More Information About Fund Expenses” on page 128 of the statutory prospectus, the rows corresponding to the funds are hereby replaced with the following.
| | Class A Shares | | | Class B Shares | | | Class C Shares | | | Class I Shares | | | Class R6 Shares | | | Class T Shares | | Through Date | ||||||||||
| Virtus Bond Fund | 0.85% | 1.60% | 1.60% | 0.60% | 0.54% | N/A | January 31, 2017 | |||||||||||||||||||||
| Virtus High Yield Fund | 1.00% | 1.75% | 1.75% | 0.75% | 0.69% | N/A | January 31, 2017 | |||||||||||||||||||||
| Virtus Senior Floating Rate Fund* | 1.20% | N/A | 1.95% | 0.95% | 0.89% | N/A | January 31, 2017 |
In the second table in the section “More Information About Fund Expenses” on page 129 of the statutory prospectus, the rows corresponding to the funds are hereby replaced and an associated footnote has been added.
| | Class A Shares | | | Class B Shares | | | Class C Shares | | | Class I Shares | | | Class R6 Shares | | | Class T Shares | | |||||||
| Virtus Bond Fund | 0.86% | 1.61% | 1.61% | 0.61% | 0.55% | N/A | ||||||||||||||||||
| Virtus High Yield Fund** | 1.16% | 1.91% | 1.91% | 0.91% | 0.85% | *** | N/A | |||||||||||||||||
| Virtus Senior Floating Rate Fund* | 1.20% | N/A | 1.95% | 0.95% | 0.89% | N/A |
| ** | Rates shown reflect prior expense reimbursement arrangements. |
| *** | Estimated based on then existing share classes. |
Under “What are the classes and how do they differ?” on page 202 of the statutory prospectus, the table in this section is hereby amended to read “None” in the column entitled “Class R6” for Virtus Bond Fund, Virtus High Yield Fund and Virtus Senior Floating Rate Fund.
The Class R6 Shares subheading under “What arrangement is best for you?” on pages 202-204 of the statutory prospectus is hereby amended to read:
Class R6 Shares (Virtus Bond Fund, Virtus Emerging Markets Opportunities Fund, Virtus Equity Trend Fund, Virtus Foreign Opportunities Fund, Virtus Global Real Estate Securities Fund, Virtus High Yield Fund, Virtus International Small-Cap Fund, Virtus Multi-Sector Intermediate Bond Fund, Virtus MultiSector Short Term Bond Fund, Virtus Real Estate Securities Fund and Virtus Senior Floating Rate Fund only).
Investors should retain this supplement with the Prospectuses for future reference.
VOT 8020/BFHYFSFRFAddR6NewExpCap (11/16)
Table of Contents
Virtus Emerging Markets Equity Income Fund
and Virtus Essential Resources Fund,
each a series of Virtus Opportunities Trust
Supplement dated September 13, 2016 to the Summary and Statutory Prospectuses and Statement of Additional Information (“SAI”), each dated January 28, 2016, as supplemented
IMPORTANT NOTICETO INVESTORS
Effective September 1, 2016, the subadviser to the above-named funds changed its name from Kleinwort Benson Investors International, Ltd. to KBI Global Investors (North America) Ltd. Accordingly, all references to the subadviser’s previous name in each fund’s summary prospectus, the statutory prospectus and SAI are hereby changed to reflect the subadviser’s new name, KBI Global Investors (North America) Ltd. and references to the defined term “KBII” are hereby changed to “KBIGI (North America).” Also, KBIGI (North America)’s affiliate, Kleinwort Benson Investors Dublin Ltd., has changed its name to KBI Global Investors Ltd. Accordingly, all references to that entity’s previous name in each fund’s summary prospectus, the statutory prospectus and SAI are hereby changed to reflect its new name, KBI Global Investors Ltd.
Investors should retain this supplement with the Prospectuses and SAI for future reference.
VOT 8020 KBIINameChange (9/2016)
Table of Contents
Virtus Low Volatility Equity Fund, a series of Virtus Opportunities Trust
Supplement dated September 7, 2016 to the Summary and Statutory Prospectuses dated January 28, 2016
IMPORTANT NOTICE TO INVESTORS
Effective September 7, 2016, Michael Davis and Warun Kumar are added as portfolio managers of the fund. Accordingly, the disclosure under “Portfolio Management” in the summary prospectuses and in the summary section of the statutory prospectus is hereby revised to read:
> Michael Davis, a Portfolio Manager at Rampart is a manager of the fund. Mr. Davis has served as a Portfolio Manager of the fund since September 2016.
> Brendan R. Finneran, Portfolio Manager and Trader at Rampart, is a manager of the fund. Mr. Finneran has served as a Portfolio Manager of the fund since June 2013.
> Robert F. Hofeman, Jr., Portfolio Manager and Trader at Rampart, is a manager of the fund. Mr. Hofeman has served as a Portfolio Manager of the fund since June 2013.
> Warun Kumar, Chief Investment Officer and Portfolio Manager at Rampart, is a manager of the fund. Mr. Kumar has served as a Portfolio Manager of the fund since September 2016.
In the section “Portfolio Management” on page 188 of the statutory prospectus, the table under the subheading “Rampart” is hereby replaced with the following:
Virtus Low Volatility Equity Fund | Michael Davis (since September 2016) | |
| Brendan R. Finneran (since June 2013) | ||
| Robert F. Hofeman, Jr. (since June 2013) | ||
| Warun Kumar (since September 2016) |
The narrative under the referenced table is hereby amended by adding the following biographical information for Mr. Davis and Mr. Kumar:
Michael Davis. Mr. Davis is Portfolio Manager at Rampart (since September 2016) and at VIA (since 2014) and has over 15 years of experience in the financial services industry, including investment management and capital markets. Prior to joining Virtus in 2014, he was a founding partner of Varick Asset Management, an independent alternative manager focused on the development of innovative portfolio solutions and investment strategies. Before forming Varick, Mr. Davis worked in the institutional asset management division of Barclays Capital, focused on quantitative and derivative-based investment strategies. Prior to Barclays, he worked in the derivative structuring group at Lehman Brothers. Mr. Davis started his career at Merrill Lynch in the asset-backed finance business.
Warun Kumar. Mr. Kumar is Chief Investment Officer and Portfolio Manager at Rampart (since October 2015), and Portfolio Manager at Virtus Alternative Investment Advisers, Inc., an affiliate of VIA (since May 2014). Before joining Virtus, Mr. Kumar was founder and managing partner of Varick Asset Management, an independent alternative manager focused on the development of innovative portfolio solutions and investment strategies for high net worth investors and institutional clients (2010 to 2014). Prior to forming Varick, Mr. Kumar was the U.S. head of Barclays Capital Fund Solutions, where he led the investment committee and managed business expansion throughout the Americas (2007 to 2010). Mr. Kumar’s investment management career began at Volaris Advisors, where he was a partner and headed the derivative advisory business. In addition to these roles, Mr. Kumar has held senior positions in the capital markets divisions of Lehman Brothers and Robertson Stephens, and was a founding partner of Sigma Advisors, an alternative investment advisory firm. Mr. Kumar began his financial services career in 1993 as a member of JP Morgan’s equity derivatives business.
All other disclosure concerning the fund, including fees and expenses, remains unchanged from the prospectuses dated January 28, 2016.
Investors should retain this supplement with the Prospectuses for future reference.
VOT 8020/LVE PMChanges (9/2016)
Table of Contents
VIRTUS OPPORTUNITIES TRUST
101 Munson Street
Greenfield, MA 01301-9668
Trustees
George R. Aylward
Thomas J. Brown
Donald C. Burke
Roger A. Gelfenbein
John R. Mallin
Hassell H. McClellan
Philip R. McLoughlin, Chairman
Geraldine M. McNamara
James M. Oates
Richard E. Segerson
Ferdinand L.J. Verdonck
Officers
George R. Aylward, President
Francis G. Waltman, Executive Vice President
W. Patrick Bradley, Executive Vice President, Chief Financial Officer and Treasurer
Kevin J. Carr, Senior Vice President, Chief Legal Officer, Counsel and Secretary
Nancy J. Engberg, Vice President and Chief Compliance Officer
Investment Adviser
Virtus Investment Advisers, Inc.
100 Pearl Street
Hartford, CT 06103-4506
Principal Underwriter
VP Distributors, LLC
100 Pearl Street
Hartford, CT 06103-4506
Administrator and Transfer Agent
Virtus Fund Services, LLC
100 Pearl Street
Hartford, CT 06103-4506
Custodian
JPMorgan Chase Bank, NA
1 Chase Manhattan Plaza
New York, NY 10005-1401
Independent Registered Public Accounting Firm
PricewaterhouseCoopers LLP
2001 Market Street
Philadelphia, PA 19103-7042
How to Contact Us
Mutual Fund Services | 1-800-243-1574 | |||
Adviser Consulting Group | 1-800-243-4361 | |||
Website | Virtus.com |
Important Notice to Shareholders
The Securities and Exchange Commission has modified mailing regulations for semiannual and annual shareholder fund reports to allow mutual fund companies to send a single copy of these reports to shareholders who share the same mailing address. If you would like additional copies, please call Mutual Fund Services at 1-800-243-1574.
Table of Contents
| ||
P.O. Box 9874 Providence, RI 02940-8074 |

For more information about Virtus Mutual Funds,
please call your financial representative, or contact us
at 1-800-243-1574 or Virtus.com.
8008 | 11-16 |
Table of Contents

ANNUAL REPORT
Virtus Real Estate Securities Fund
September 30, 2016
TRUST NAME: VIRTUS OPPORTUNITIES TRUST
Not FDIC Insured
No Bank Guarantee
May Lose Value

Table of Contents
Virtus Real Estate Securities Fund
(“Real Estate Securities Fund”)
| 1 | ||||
| 2 | ||||
| 4 | ||||
| 6 | ||||
| 10 | ||||
| 12 | ||||
| 13 | ||||
| 14 | ||||
| 16 | ||||
| 20 | ||||
| 28 | ||||
| 29 | ||||
| 30 | ||||
| 34 |
PROXY VOTING PROCEDURES AND VOTING RECORD (FORM N-PX)
The subadviser votes proxies relating to portfolio securities in accordance with procedures that have been approved by the Board of Trustees of the Trust (“Trustees,” or the “Board”). You may obtain a description of these procedures, along with information regarding how the Fund voted proxies during the most recent 12-month period ended June 30, free of charge, by calling toll-free 1-800-243-1574. This information is also available through the Securities and Exchange Commission’s (“SEC”) website at http://www.sec.gov.
FORM N-Q INFORMATION
The Trust files a complete schedule of portfolio holdings for the Fund with the SEC for the first and third quarters of each fiscal year on Form N-Q. Form N-Q is available on the SEC’s website at http://www.sec.gov. Form N-Q may be reviewed and copied at the SEC’s Public Reference Room. Information on the operation of the SEC’s Public Reference Room can be obtained by calling toll-free 1-800-SEC-0330.
This report is not authorized for distribution to prospective investors in the Virtus Real Estate Securities Fund unless preceded or accompanied by an effective prospectus which includes information concerning the sales charge, the Fund’s record and other pertinent information.
Table of Contents
To My Fellow Shareholders of Virtus Mutual Funds:
 | I am pleased to present this annual report that reviews the performance of your fund for the 12 months ended September 30, 2016.
During the first half of the fiscal year, global equity markets were challenged by falling oil prices, China’s slowdown, and concerns over the Federal Reserve’s (“the Fed”) first rate hike in nine years, which occurred in December 2015. Equities plummeted in early 2016, but stabilizing oil prices and the Fed’s softened stance on further rate hikes for 2016 sparked a rally in mid-February that lasted until June. The U.K.’s June 23 “Brexit” decision to leave the European Union triggered a selloff that was largely short-lived. Calm was restored by better-than-expected corporate earnings, an improving global economic picture, and reassurance that the world’s central banks would continue to provide monetary stimulus. By | |
the end of September, U.S. equity markets had recovered much of their losses, and the 12-month period was positive for many asset classes.
For the 12 months ended September 30, 2016, U.S. small-cap stocks kept pace with U.S. large-cap stocks, as measured by the 15.47% and 15.43% returns of the Russell 2000® Index and S&P 500® Index, respectively. Within international equities, emerging markets significantly outperformed their developed peers, with the MSCI Emerging Markets Index (net) up 16.78%, while the MSCI EAFE® Index (net) returned 6.52%.
Demand for U.S. Treasuries remained strong, driven by foreign investors seeking safe havens and yield in light of the negative interest rate environment in many international economies. On September 30, 2016, the benchmark 10-year U.S. Treasury yielded 1.60% compared with 2.06% one year earlier. For the 12 months ended September 30, 2016, the broader U.S. fixed income market, as represented by the Bloomberg Barclays U.S. Aggregate Bond Index, which tracks Treasuries and other investment-grade debt securities, gained 5.19%, while non-investment grade bonds rose 12.73%, as measured by the Bloomberg Barclays U.S. Corporate High Yield Bond Index.
The strength of the global economy will likely remain a leading concern for markets in the months ahead, and investors will watch with great interest the actions of the Fed and other major central banks. The U.S. economy’s continued growth, as evidenced by recent strong jobs, housing, and consumer spending data, should give investors reason for optimism, but future market direction will be determined largely by the ability of corporations to continue to produce robust earnings.
Market uncertainty is an ever-present reminder of the importance of portfolio diversification, including exposure to both traditional and alternative asset classes. While diversification cannot guarantee a profit or prevent a loss, owning a variety of asset classes may cushion your portfolio against inevitable market fluctuations. Your financial advisor can help you ensure that your portfolio is adequately diversified across asset classes and investment strategies.
As always, thank you for entrusting Virtus with your assets. Should you have questions about your account or require assistance, please visit our website at Virtus.com, or call our customer service team at 1-800-243-1574. We appreciate your business and remain committed to your long-term financial success.
Sincerely,
George R. Aylward President, Virtus Mutual Funds
October 2016
Performance data quoted represents past results. Past performance is no guarantee of future results, and current performance may be higher or lower than the performance shown above. | ||

1
Table of Contents
VIRTUS REAL ESTATE SECURITIES FUND
DISCLOSURE OF FUND EXPENSES (Unaudited)
FOR THE SIX-MONTH PERIOD OF APRIL 1, 2016 TO SEPTEMBER 30, 2016
We believe it is important for you to understand the impact of costs on your investment. All mutual funds have operating expenses. As a shareholder of the Virtus Real Estate Securities Fund (the “Fund”), you may incur two types of costs: (1) transaction costs, including sales charges on purchases of Class A shares and contingent deferred sales charges on Class B and Class C shares; and (2) ongoing costs, including investment advisory fees, distribution and service fees, and other expenses. Class I shares and Class R6 shares are sold without a sales charge and do not incur distribution and service fees. For further information regarding applicable sales charges, see Note 1 in the Notes to Financial Statements. These examples are intended to help you understand your ongoing costs (in dollars) of investing in the Fund and to compare these costs with the ongoing costs of investing in other mutual funds. These examples are based on an investment of $1,000 invested at the beginning of the period and held for the entire six-month period. The following Expense Table illustrates your Fund’s costs in two ways.
Actual Expenses
The first section of the accompanying table provides information about actual account values and actual expenses. You may use the information in this section, together with the amount you invested, to estimate the expenses that you paid over the period. Simply divide your account value by $1,000 (for example, an $8,600 account value divided by $1,000 = 8.6), then multiply the result by the number in the first section under the heading “Expenses Paid During Period” to estimate the expenses you paid on your account during the period.
Hypothetical Example for Comparison Purposes
The second section of the accompanying table provides information about hypothetical account values and hypothetical expenses based on the Fund’s actual expense ratio and an assumed rate of return of 5% per year before expenses, which is not your Fund’s actual return. The hypothetical account values and expenses may not be used to estimate the actual ending account balance or expenses you paid for the period. You may use this information to compare the ongoing costs of investing in your Fund and other funds. To do so, compare these 5% hypothetical examples with the 5% hypothetical examples that appear in the shareholder reports of the other funds.
Please note that the expenses shown in the accompanying table are meant to highlight your ongoing costs only and do not reflect any transactional costs, such as sales charges or contingent deferred sales charges. Therefore, the second section of the accompanying table is useful in comparing ongoing costs only, and will not help you determine the relative total costs of owning different funds. In addition, if these transactional costs were included, your costs would have been higher. The calculations assume no shares were bought or sold during the period. Your actual costs may have been higher or lower, depending on the amount of your investment and timing of any purchases or redemptions.
2
Table of Contents
VIRTUS REAL ESTATE SECURITIES FUND
DISCLOSURE OF FUND EXPENSES (Unaudited) (Continued)
FOR THE SIX-MONTH PERIOD OF APRIL 1, 2016 TO SEPTEMBER 30, 2016
| Expense Table | ||||||||||||||||
Beginning Value | Ending Account Value September 30, 2016 | Annualized Expense Ratio | Expenses Paid During Period* | |||||||||||||
Actual | ||||||||||||||||
| Class A | $ | 1,000.00 | $ | 1,039.70 | 1.41 | % | $ | 7.19 | ||||||||
| Class B | 1,000.00 | 1,035.70 | 2.16 | 10.99 | ||||||||||||
| Class C | 1,000.00 | 1,035.40 | 2.16 | 10.99 | ||||||||||||
| Class I | 1,000.00 | 1,041.10 | 1.16 | 5.92 | ||||||||||||
| Class R6 | 1,000.00 | 1,041.70 | 0.99 | 5.05 | ||||||||||||
Hypothetical (5% return before expenses) |
| |||||||||||||||
| Class A | 1,000.00 | 1,017.95 | 1.41 | 7.11 | ||||||||||||
| Class B | 1,000.00 | 1,014.20 | 2.16 | 10.88 | ||||||||||||
| Class C | 1,000.00 | 1,014.20 | 2.16 | 10.88 | ||||||||||||
| Class I | 1,000.00 | 1,019.20 | 1.16 | 5.86 | ||||||||||||
| Class R6 | 1,000.00 | 1,020.05 | 0.99 | 5.00 | ||||||||||||
| * | Expenses are equal to the Fund’s annualized expense ratio, which is net of waived fees and reimbursed expenses, if applicable, multiplied by the average account value over the period, multiplied by the number of days (183) expenses were accrued in the most recent fiscal half-year, then divided by 366 to reflect the one-half year period. |
| The Fund may invest in other funds, and the annualized expense ratios noted above do not reflect fees and expenses associated with the underlying funds. If such fees and expenses were included, the expenses would have been higher. |
| You can find more information about the Fund’s expenses in the Financial Statements section that follows. For additional information on operating expenses and other shareholder costs, refer to the prospectus. |
3
Table of Contents
VIRTUS REAL ESTATE SECURITIES FUND
SEPTEMBER 30, 2016 (Unaudited)
Bank of England
The Bank of England is the United Kingdom’s Central Bank.
Bank of Japan
The Bank of Japan is the Japanese Central Bank.
Bloomberg Barclays U.S. Aggregate Bond Index
The Bloomberg Barclays U.S. Aggregate Bond Index measures the U.S. investment grade fixed rate bond market. The index is calculated on a total return basis. The index is unmanaged, its returns do not reflect any fees, expenses, or sales charges, and it is not available for direct investment.
Bloomberg Barclays U.S. Corporate High Yield Bond Index
The Bloomberg Barclays U.S. Corporate High Yield Bond Index measures the U.S. dollar-denominated, high yield, fixed-rate corporate bond market. The index is calculated on a total return basis. The index is unmanaged, its returns do not reflect any fees, expenses, or sales charges, and it is not available for direct investment.
European Central Bank (“ECB”)
The European Central Bank (ECB) is responsible for conducting monetary policy for the euro area. The ECB was established as the core of the Eurosystem and the European System of Central Banks (ESCB). The ESCB comprises the ECB and the National Central Banks (NCBs) of all 17 EU Member States whether they have adopted the Euro or not.
Federal Reserve (the “Fed”)
The Central Bank of the United States, responsible for controlling the money supply, interest rates and credit with the goal of keeping the U.S. economy and currency stable.
Governed by a seven-member board, the system includes 12 regional Federal Reserve Banks, 25 branches and all national and state banks that are part of the system.
FTSE NAREIT Equity REITs Index
The FTSE NAREIT Equity REITs Index is a free-float market capitalization index measuring equity tax-qualified real estate investment trusts, which meet minimum size and liquidity criteria, that are listed on the New York Stock Exchange, the American Stock Exchange and the NASDAQ National Market System. The index is calculated on a total return basis with dividends reinvested. The index is unmanaged, its returns do not reflect any fees, expenses, or sales charges, and it is not available for direct investment.
Global Industry Classification Standard (GICS)
The Global Industry Classification Standard (GICS) is a standardized classification system for equities that was developed by, and is the exclusive property and a service mark of, MSCI Inc. (MSCI) and Standard & Poor’s, a division of the McGraw-Hill Companies, Inc. (S&P). As of September 1, 2016, the GICS structure comprises 11 sectors, 24 industry groups, 68 industries, and 157 subindustries.
MSCI EAFE® Index (net)
The MSCI EAFE® Index (net) is a free float-adjusted market capitalization-weighted index that measures developed foreign market equity performance, excluding the U.S. and Canada. The
4
Table of Contents
VIRTUS REAL ESTATE SECURITIES FUND
KEY INVESTMENT TERMS (Continued)
SEPTEMBER 30, 2016 (Unaudited)
index is calculated on a total return basis with net dividends reinvested. The index is unmanaged, its returns do not reflect any fees, expenses, or sales charges, and is not available for direct investment.
MSCI Emerging Markets Index (net)
The MSCI Emerging Markets Index (net) is a free float-adjusted market capitalization-weighted index designed to measure equity market performance in the global emerging markets. The index is calculated on a total return basis with net dividends reinvested. The index is unmanaged, its returns do not reflect any fees, expenses, or sales charges, and is not available for direct investment.
REIT (Real Estate Investment Trust)
A publicly traded company that owns, develops and operates income-producing real estate such as apartments, office buildings, hotels, shopping centers and other commercial properties.
Russell 2000® Index
The Russell 2000® Index is a market capitalization-weighted index of the 2,000 smallest companies in the Russell Universe, which comprises the 3,000 largest U.S. companies. The index is calculated on a total return basis with dividends reinvested. The index is unmanaged, its returns do not reflect any fees, expenses, or sales charges, and is not available for direct investment.
S&P 500® Index
The S&P 500® Index is a free-float market capitalization-weighted index of 500 of the largest U.S. companies. The index is calculated on a total return basis with dividends reinvested. The index is unmanaged, its returns do not reflect any fees, expenses, or sales charges, and it is not available for direct investment.
5
Table of Contents
Fund Summary Portfolio Manager Commentary by Duff & Phelps Investment Management Co. | Ticker Symbols: Class A: PHRAX Class B: PHRBX Class C: PHRCX Class I: PHRIX Class R6: VRREX |
| ¢ | The Fund is diversified and has investment objectives of capital appreciation and income with approximately equal emphasis. |
| ¢ | For the fiscal year ended September 30, 2016, the Fund’s Class A shares at NAV returned 15.58%, Class B shares returned 14.70%, Class C shares returned 14.70%, Class I shares returned 15.85% and Class R6 shares returned 16.06%. For the fiscal year, the S&P 500® Index, a broad-based equity index, returned 15.43%, and the FTSE NAREIT Equity REITs Index, the Fund’s style-specific index appropriate for comparison, returned 19.86%. |
All performance figures assume reinvestment of distributions and exclude the effect of sales charges. Past performance is no guarantee of future results, and current performance may be higher or lower than the performance shown above.
How did the markets perform during the Fund’s fiscal year?
U.S. real estate equities outperformed U.S. equities during the 12 months ended September 30, 2016, as measured by the 19.86% increase in the FTSE NAREIT Equity REITs Index versus the 15.43% increase in the S&P 500® Index.
In many ways the macro environment during the Fund’s fiscal year came full circle. While global central banks remained rather dovish over the course of the fiscal year, at the outset in December 2015, the U.S. Federal Reserve (“the Fed”) announced an increase in the target range for the federal funds rate to 0.25% to 0.50% after seven years in the 0% to 0.25% range. While admittedly this was a small move, it was the first time the Fed increased rates in over nine years. At that time the Fed also appeared to be signaling that several more rate increases would be coming in the next year.
The likelihood of further rate increases quickly faded as policy uncertainty out of China and concerns regarding global economic growth sent
global equity markets into a tailspin in early 2016. Also of note during the first quarter of 2016 were further monetary policy actions by the Bank of Japan (“BOJ”) and European Central Bank (“ECB”) seeking to stimulate economic growth and inflation. The BOJ embraced for the first time a negative interest rate policy and the ECB extended its negative interest rate policy.
During the second quarter of 2016, voters in the U.K. delivered a shocking result on June 23 to leave the European Union (“EU”). Despite polls indicating that the result would be close, very few observers actually believed that the “Brexit” camp would carry the day. Volatility in the global equity and currency markets spiked dramatically following the vote, with the British pound falling 11.1% in the first two days. The U.K. political situation also became more uncertain as Prime Minister Cameron announced his resignation, and Theresa May was appointed as his successor on July 11. It became apparent that Article 50, a two-year negotiating process for the U.K. to leave the EU, would not be engaged anytime soon. As of the end of the Fund’s fiscal year, the ultimate implications of Brexit on the U.K. and the broader European Union remained very uncertain and would likely take months, if not years, to gain greater clarity. In the meantime, U.K. risk premiums increased and the British pound experienced increased pressure.
As the Fund’s fiscal year came to a close, the Fed appeared once again to be contemplating an increase in the federal funds rate after not raising it since December 2015. Based on the rhetoric leading up to their respective September policy meetings and the meetings themselves, major global central banks seemed to be questioning to varying degrees the efficacy of current monetary policy to achieve their medium term inflation goals. More than ever, central bankers appeared to be indicating that it would be difficult to achieve their inflation goals without an assist from fiscal policy and structural economic reforms.
For information regarding the indexes and certain investment terms, see the Key Investment Terms on page 4.
6
Table of Contents
| REAL ESTATE SECURITIES FUND (Continued) |
To provide further support of these events on the bond market, the 10-Year U.S. Treasury started the Fund’s fiscal year with a yield of 2.04%, sold off to a peak yield in November 2015 of 2.34%, then rallied on and off again to a low yield of 1.36% post the Brexit vote in the U.K., to finally finish the fiscal year at 1.59%.
Thematically, real estate companies remained active on the capital raising front, particularly in the U.S., Europe excluding the U.K., and Japan as they looked to fund redevelopment, development, and acquisitions of companies or portfolios of assets. In addition, it was a common occurrence for companies to lock in long-term, inexpensive fixed-rate debt. Portfolio pruning and asset recycling were additional sources of capital and were more evident in the U.S. than in other markets, as is often the case. We also witnessed ongoing mergers and acquisition activity. Our global travels during the period brought us to numerous countries and cities in the U.S., Europe, and Asia Pacific regions and were helpful in providing timely updates on the space and asset markets in each locale. Additionally, quality time was spent visiting existing REIT holdings in the Fund and conducting due diligence on potential new investment opportunities. At a high level, the strong appetite for high-quality commercial real estate from a wide and deep pool of institutional capital sources was evident across most locations as reflected in recent asset market pricing trends.
From our time spent in London, it was difficult to detect negative ramifications from the fallout of the Brexit vote. On the contrary, the anecdotal observations were positive as it related to tourist activity and retail spending, both of which have benefited from the dramatic fall in the British pound since the June vote. However, based on the limited amount of commercial real estate transaction activity since the vote, we know there has been a small negative impact to real estate values, particularly city-oriented offices, and that rental levels have softened a bit. While we have yet to witness a Brexit-related benefit to other
cities, it could be an incremental future demand driver for the likes of Paris, Frankfurt, Dublin, and New York, should possible relocations from London occur. For the time being, decision making, as it relates to London office space, has slowed. As a whole, new office development would be needed in any of the European cities mentioned to accommodate a significant move, were it to occur, from London. New York would also be in a position to absorb demand from London.
After the market closed on August 31, real estate became the eleventh sector of the Global Industry Classification Standard (“GICS”) – the first sector added since the classification system was created in 1999. Importantly, we believe this decision reflects the views of industry participants that real estate is a separate asset class with distinct investment characteristics, particularly relative to other financial companies.
What factors affected the Fund’s performance during its fiscal year?
For the one-year period ended September 30, 2016, the Fund demonstrated solid performance, yet lagged its style-specific benchmark. The Fund’s relative performance to the benchmark was driven by security selection and sector allocation, as both detracted from performance over the period.
On the whole, central banks remained dovish throughout the fiscal year, as witnessed by the Fed, ECB, BOJ, and Bank of England (“BOE”), and global bonds rallied. Although early in the Fund’s fiscal year, the Fed was predicting three to four staggered increases in the federal funds rate for 2016, it did not raise rates further after December 2015. As a result, any portfolio management steps taken to position for such moves, while one could suggest were prudent, were, in fact, premature. In fact, in the U.S., the best performing property sector was freestanding retail, a property sector with the longest lease durations, and the most bond-like in the benchmark.
For information regarding the indexes and certain investment terms, see the Key Investment Terms on page 4.
7
Table of Contents
| REAL ESTATE SECURITIES FUND (Continued) |
Within U.S. property sectors, freestanding retail, data centers (which became a new property sector late in 2015), and industrial demonstrated the best total returns over the last 12 months. Lodging, self-storage, and apartments were the laggards, yet all property sectors delivered positive returns.
Based on both property sector allocation and security selection, the largest positive contributors to the Fund’s relative performance during the fiscal year were the industrial sector, as a result of an overweight allocation and strong performance; health care, as a result of an underweight allocation; and diversified, due to an underweight allocation.
The most significant detractors from the Fund’s relative performance during the fiscal year were lodging, due to an overweight allocation during its period of underperformance and security selection; freestanding retail, due to an underweight allocation and its top performance among property sectors in an environment that favored the bond-like qualities of the sector; and the office sector, resulting from an overweight allocation and security selection.
The preceding information is the opinion of portfolio management only through the end of the period stated on the cover. Any such opinions are subject to change at any time based upon market or other conditions and should not be relied upon as investment advice. Past performance is no guarantee of future results, and there is no guarantee that market forecasts will be realized.
There is no guarantee that the Fund will meet its objectives.
Equity Securities: The market price of equity securities may be adversely affected by financial market, industry, or issuer-specific events. Focus on a particular style or on small or medium-sized companies may enhance that risk.
Real Estate: The fund may be negatively affected by factors specific to the real estate market, including interest rates, leverage, property, and management.
Industry/Sector Concentration: A fund that focuses its investments in a particular industry or sector will be more sensitive to conditions that affect that industry or sector than a non-concentrated fund.
Prospectus: For additional information on risks, please see the fund’s prospectus.
| Asset Allocations | ||||
The following table presents asset allocations within certain sectors as a percentage of total investments at September 30, 2016.
|
| |||
Office | 14 | % | ||
Apartments | 12 | |||
Shopping Centers | 11 | |||
Industrials | 11 | |||
Data Centers | 11 | |||
Regional Malls | 11 | |||
Self Storage | 8 | |||
Other | 22 | |||
|
| |||
Total | 100 | % | ||
|
| |||
For information regarding the indexes and certain investment terms, see the Key Investment Terms on page 4.
8
Table of Contents
| REAL ESTATE SECURITIES FUND (Continued) |
| Average Annual Total Returns1 for periods ended 9/30/16 | ||||||||||||||||||||
| 1 Year | 5 Years | 10 Years | Since Inception | Inception Date | ||||||||||||||||
| Class A Shares at NAV2 | 15.58 | % | 14.79 | % | 5.86 | % | — | — | ||||||||||||
| Class A Shares at POP3,4 | 8.93 | 13.44 | 5.24 | — | — | |||||||||||||||
| Class B Shares at NAV2 | 14.70 | 13.93 | 5.06 | — | — | |||||||||||||||
| Class B Shares with CDSC4 | 10.87 | 13.93 | 5.06 | — | — | |||||||||||||||
| Class C Shares with NAV2 and with CDSC4 | 14.70 | 13.93 | 5.07 | — | — | |||||||||||||||
| Class I Shares at NAV2 | 15.85 | 15.08 | — | 5.28 | % | 12/29/06 | ||||||||||||||
| Class R6 Shares at NAV2 | 16.06 | — | — | 9.10 | 11/12/14 | |||||||||||||||
| S&P 500® Index | 15.43 | 16.37 | 7.24 | —5 | — | |||||||||||||||
| FTSE NAREIT Equity REITs Index | 19.86 | 15.91 | 6.35 | —6 | — | |||||||||||||||
Fund Expense Ratios7: A Shares: 1.36%, B Shares: 2.11%, C Shares: 2.11%, I Shares: 1.11%, R6 Shares 0.93%.
All returns represent past performance which is no guarantee of future results. Current performance may be higher or lower than the performance shown. The investment return and principal value of an investment will fluctuate so that an investor’s shares, when redeemed, may be worth more or less than their original cost. The above table and graph below do not reflect the deduction of taxes that a shareholder would pay on fund distributions or the redemption of fund shares. Please visit Virtus.com for performance data current to the most recent month-end.
| 1 | Total returns are historical and include changes in share price and the reinvestment of both dividends and capital gains distributions. |
| 2 | “NAV” (Net Asset Value) total returns do not include the effect of any sales charge. |
| 3 | “POP” (Public Offering Price) total returns include the effect of the maximum front-end 5.75% sales charge. |
| 4 | CDSC (contingent deferred sales charge) is applied to redemptions of certain classes of shares that do not have a sales charge applied at the time of purchase. CDSC charges for Class B shares decline from 5% to 0% over a five-year period. CDSC charges for certain redemptions of Class A shares made within 18 months of purchases on which a finder’s fee was paid and all redemptions of Class C shares are 1% within the first year and 0% thereafter. |
| 5 | The index returned 6.71% for Class I shares and 5.56% for Class R6 shares since the inception date of the respective class. |
| 6 | The index returned 5.53% for Class I shares and 10.30% for Class R6 shares since the inception date of the respective class. |
| 7 | The expense ratios of the Fund are set forth according to the prospectus for the Fund effective January 28, 2016, as supplemented and revised, and may differ from the expense ratios disclosed in the Financial Highlights tables in this report. See the Financial Highlights for more current expense ratios. |
Growth of $10,000 for periods ended 9/30
This chart assumes an initial investment of $10,000 made on September 30, 2006, for Class A,
Class B, and Class C shares including any applicable sales charges or fees. Performance assumes reinvestment of dividends and capital gain distributions.
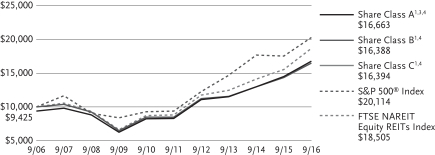
The indexes are unmanaged and not available for direct investment; therefore, their performance does not reflect the expenses associated with active management of an actual portfolio.
9
Table of Contents
VIRTUS REAL ESTATE SECURITIES FUND
SEPTEMBER 30, 2016
($ reported in thousands)
| SHARES | VALUE | |||||||
| COMMON STOCKS—98.8% | ||||||||
| REAL ESTATE INVESTMENT TRUSTS—98.8% | ||||||||
| DATA CENTERS—10.7% | ||||||||
Coresite Realty Corp. | 270,900 | $ | 20,057 | |||||
CyrusOne, Inc. | 196,000 | �� | 9,324 | |||||
Digital Realty Trust, Inc. | 512,850 | 49,808 | ||||||
Equinix, Inc. | 148,500 | 53,497 | ||||||
|
| |||||||
| 132,686 | ||||||||
|
| |||||||
| DIVERSIFIED—4.1% | ||||||||
Vornado Realty Trust | 506,700 | 51,283 | ||||||
|
| |||||||
| 51,283 | ||||||||
|
| |||||||
| HEALTH CARE—7.7% | ||||||||
Healthcare Realty Trust, Inc. | 627,775 | 21,382 | ||||||
Healthcare Trust of America, Inc. Class A | 948,200 | 30,931 | ||||||
Ventas, Inc. | 390,361 | 27,571 | ||||||
Welltower, Inc. | 212,241 | 15,869 | ||||||
|
| |||||||
| 95,753 | ||||||||
|
| |||||||
| INDUSTRIAL/OFFICE—24.4% | ||||||||
| Industrial—10.9% | ||||||||
DCT Industrial Trust, Inc. | 979,303 | 47,545 | ||||||
Duke Realty Corp. | 1,613,952 | 44,109 | ||||||
Prologis, Inc. | 802,752 | 42,980 | ||||||
|
| |||||||
| 134,634 | ||||||||
|
| |||||||
| Office—13.5% | ||||||||
Boston Properties, Inc. | 108,983 | 14,853 | ||||||
Cousins Properties, Inc. | 1,219,170 | 12,728 | ||||||
Douglas Emmett, Inc. | 820,829 | 30,067 | ||||||
Highwoods Properties, Inc. | 654,942 | 34,135 | ||||||
Kilroy Realty Corp. | 667,942 | 46,322 | ||||||
Paramount Group, Inc. | 1,808,236 | 29,637 | ||||||
|
| |||||||
| 167,742 | ||||||||
|
| |||||||
Total Industrial/Office | 302,376 | |||||||
|
| |||||||
| LODGING/RESORTS—3.6% | ||||||||
Host Hotels & Resorts, Inc. | 808,986 | 12,596 | ||||||
Pebblebrook Hotel Trust | 573,363 | 15,251 | ||||||
RLJ Lodging Trust | 801,652 | 16,859 | ||||||
|
| |||||||
| 44,706 | ||||||||
|
| |||||||
| SHARES | VALUE | |||||||
| RESIDENTIAL—15.5% | ||||||||
| Apartments—11.7% | ||||||||
American Campus Communities, Inc. | 349,117 | $ | 17,760 | |||||
Apartment Investment & Management Co. Class A | 243,800 | 11,193 | ||||||
AvalonBay Communities, Inc. | 176,290 | 31,351 | ||||||
Equity Residential | 473,145 | 30,438 | ||||||
Essex Property Trust, Inc. | 245,740 | 54,726 | ||||||
|
| |||||||
| 145,468 | ||||||||
|
| |||||||
| Manufactured Homes—2.6% | ||||||||
Equity LifeStyle Properties, Inc. | 216,053 | 16,675 | ||||||
Sun Communities, Inc. | 189,300 | 14,856 | ||||||
|
| |||||||
| 31,531 | ||||||||
|
| |||||||
| Single Family Homes—1.2% | ||||||||
American Homes 4 Rent Class A | 682,300 | 14,765 | ||||||
|
| |||||||
| 14,765 | ||||||||
|
| |||||||
Total Residential |
| 191,764 | ||||||
|
| |||||||
| RETAIL—24.5% | ||||||||
| Free Standing—2.8% | ||||||||
STORE Capital Corp. | 1,182,843 | 34,858 | ||||||
|
| |||||||
| 34,858 | ||||||||
|
| |||||||
| Regional Malls—10.6% | ||||||||
General Growth Properties, Inc. | 1,057,575 | 29,189 | ||||||
Simon Property Group, Inc. | 493,541 | 102,168 | ||||||
|
| |||||||
| 131,357 | ||||||||
|
| |||||||
| Shopping Centers—11.1% | ||||||||
Brixmor Property Group, Inc. | 1,153,696 | 32,061 | ||||||
Federal Realty Investment Trust | 223,200 | 34,357 | ||||||
Regency Centers Corp. | 447,700 | 34,693 | ||||||
See Notes to Financial Statements
10
Table of Contents
VIRTUS REAL ESTATE SECURITIES FUND
SCHEDULE OF INVESTMENTS (Continued)
SEPTEMBER 30, 2016
($ reported in thousands)
| SHARES | VALUE | |||||||
| Shopping Centers (continued) | ||||||||
Tanger Factory Outlet Centers, Inc. | 923,432 | $ | 35,977 | |||||
|
| |||||||
| 137,088 | ||||||||
|
| |||||||
Total Retail | 303,303 | |||||||
|
| |||||||
| SELF STORAGE—8.3% | ||||||||
CubeSmart | 1,264,650 | 34,474 | ||||||
Extra Space Storage, Inc. | 394,183 | 31,302 | ||||||
Public Storage | 165,692 | 36,973 | ||||||
|
| |||||||
| 102,749 | ||||||||
| TOTAL COMMON STOCKS (Identified Cost $795,302) | 1,224,620 | |||||||
| TOTAL LONG TERM INVESTMENTS—98.8% | ||||||||
| (Identified Cost $795,302) | 1,224,620 | |||||||
| TOTAL INVESTMENTS—98.8% (Identified Cost $795,302) | 1,224,620 | (1) | ||||||
Other assets and liabilities, net—1.2% |
| 14,677 | ||||||
|
| |||||||
| NET ASSETS—100.0% | $ | 1,239,297 | ||||||
|
| |||||||
FOOTNOTE LEGEND:
| (1) | Federal Income Tax Information: For tax information at September 30, 2016, see Note 9 Federal Income Tax Information in the Notes to Financial Statements. |
The following table provides a summary of inputs used to value the Fund’s investments as of September 30, 2016 (See Security Valuation Note 2A in the Notes to Financial Statements):
| Total Value at September 30, 2016 | Level 1 Quoted Prices | |||||||
Equity Securities: | ||||||||
Common Stocks | $ | 1,224,620 | $ | 1,224,620 | ||||
|
|
|
| |||||
Total Investments | $ | 1,224,620 | $ | 1,224,620 | ||||
|
|
|
| |||||
There are no Level 2 (significant observable inputs) or Level 3 (significant unobservable inputs) priced securities.
There were no transfers between Level 1 and Level 2 related to securities held at September 30, 2016.
See Notes to Financial Statements
11
Table of Contents
VIRTUS REAL ESTATE SECURITIES FUND
STATEMENT OF ASSETS AND LIABILITIES
SEPTEMBER 30, 2016
($ Reported in thousands except shares and per share amounts)
| Assets | ||||
Investment in securities at value(1) | $ | 1,224,620 | ||
Cash | 9,588 | |||
Receivables | ||||
Investment securities sold | 11,000 | |||
Fund shares sold | 3,996 | |||
Dividends and interest receivable | 5,136 | |||
Prepaid expenses | 57 | |||
Prepaid trustee retainer | 27 | |||
Other assets | 17 | |||
|
| |||
Total assets | 1,254,441 | |||
|
| |||
| Liabilities | ||||
Payables | ||||
Fund shares repurchased | 5,351 | |||
Investment securities purchased | 8,231 | |||
Investment advisory fees | 762 | |||
Distribution and service fees | 168 | |||
Administration fees | 126 | |||
Transfer agent fees and expenses | 381 | |||
Professional fees | 13 | |||
Trustee fees and expenses | 29 | |||
Trustee deferred compensation plan | 17 | |||
Other accrued expenses | 66 | |||
|
| |||
Total liabilities | 15,144 | |||
|
| |||
| Net Assets | $ | 1,239,297 | ||
|
| |||
| Net Assets Consist of: | ||||
Capital paid in on shares of beneficial interest | $ | 654,957 | ||
Accumulated undistributed net investment income (loss) | — | |||
Accumulated undistributed net realized gain (loss) | 155,022 | |||
Net unrealized appreciation (depreciation) on investments | 429,318 | |||
|
| |||
| Net Assets | $ | 1,239,297 | ||
|
| |||
| Class A | ||||
Net asset value (net assets/shares outstanding) per share | $ | 36.87 | ||
Maximum offering price per share NAV/(1-5.75%) | $ | 39.12 | ||
Shares of beneficial interest outstanding, no par value, unlimited authorization | 14,378,976 | |||
Net Assets | $ | 530,135 | ||
| Class B | ||||
Net asset value (net assets/shares outstanding) and offering price per share | $ | 36.28 | ||
Shares of beneficial interest outstanding, no par value, unlimited authorization | 14,437 | |||
Net Assets | $ | 524 | ||
| Class C | ||||
Net asset value (net assets/shares outstanding) and offering price per share | $ | 36.77 | ||
Shares of beneficial interest outstanding, no par value, unlimited authorization | 1,827,766 | |||
Net Assets | $ | 67,216 | ||
| Class I | ||||
Net asset value (net assets/shares outstanding) and offering price per share | $ | 36.83 | ||
Shares of beneficial interest outstanding, no par value, unlimited authorization | 16,830,219 | |||
Net Assets | $ | 619,818 | ||
| Class R6 | ||||
Net asset value (net assets/shares outstanding) and offering price per share | $ | 36.84 | ||
Shares of beneficial interest outstanding, no par value, unlimited authorization | 586,517 | |||
Net Assets | $ | 21,604 | ||
(1) Investment in securities at cost | $ | 795,302 | ||
See Notes to Financial Statements
12
Table of Contents
VIRTUS REAL ESTATE SECURITIES FUND
YEAR ENDED SEPTEMBER 30, 2016
($ reported in thousands)
| Investment Income | ||||
Dividends | $ | 34,640 | ||
Interest | 31 | |||
|
| |||
Total investment income | 34,671 | |||
|
| |||
| Expenses | ||||
Investment advisory fees | 9,561 | |||
Service fees, Class A | 1,462 | |||
Distribution and service fees, Class B | 9 | |||
Distribution and service fees, Class C | 669 | |||
Administration fees | 1,629 | |||
Transfer agent fees and expenses | 2,862 | |||
Registration fees | 131 | |||
Printing fees and expenses | 318 | |||
Trustees’ fees and expenses | 127 | |||
Professional fees | 47 | |||
Custodian fees | 26 | |||
Miscellaneous expenses | 93 | |||
|
| |||
Total expenses | 16,934 | |||
Low balance account fees | — | (1) | ||
|
| |||
Net expenses | 16,934 | |||
|
| |||
| Net investment income (loss) | 17,737 | |||
|
| |||
| Net Realized and Unrealized Gain (Loss) on Investments | ||||
Net realized gain (loss) on investments | 207,975 | |||
Net change in unrealized appreciation (depreciation) on investments | (35,860 | ) | ||
|
| |||
| Net gain (loss) on investments | 172,115 | |||
|
| |||
| Net increase (decrease) in net assets resulting from operations | $ | 189,852 | ||
|
|
| (1) | Amount is less than $500. |
See Notes to Financial Statements
13
Table of Contents
VIRTUS REAL ESTATE SECURITIES FUND
STATEMENTS OF CHANGES IN NET ASSETS
(Reported in thousands)
| Year Ended September 30, 2016 | Year Ended September 30, 2015 | |||||||
| INCREASE/(DECREASE) IN NET ASSETS | ||||||||
| From Operations | ||||||||
Net investment income (loss) | $ | 17,737 | $ | 21,459 | ||||
Net realized gain (loss) | 207,975 | 197,947 | ||||||
Net change in unrealized appreciation (depreciation) | (35,860 | ) | (43,973 | ) | ||||
|
|
|
| |||||
| Increase (decrease) in net assets resulting from operations | 189,852 | 175,433 | ||||||
|
|
|
| |||||
| From Distributions to Shareholders | ||||||||
Net investment income, Class A | (7,500 | ) | (9,863 | ) | ||||
Net investment income, Class B | (4 | ) | (10 | ) | ||||
Net investment income, Class C | (382 | ) | (399 | ) | ||||
Net investment income, Class I | (9,664 | ) | (11,111 | ) | ||||
Net investment income, Class R6 | (251 | ) | (12 | ) | ||||
Net realized short-term gains, Class A | (4,959 | ) | (2,206 | ) | ||||
Net realized short-term gains, Class B | (9 | ) | (7 | ) | ||||
Net realized short-term gains, Class C | (548 | ) | (189 | ) | ||||
Net realized short-term gains, Class I | (5,095 | ) | (1,983 | ) | ||||
Net realized short-term gains, Class R6 | (91 | ) | (— | )(1) | ||||
Net realized long-term gains, Class A | (92,687 | ) | (36,741 | ) | ||||
Net realized long-term gains, Class B | (183 | ) | (122 | ) | ||||
Net realized long-term gains, Class C | (10,113 | ) | (3,144 | ) | ||||
Net realized long-term gains, Class I | (93,730 | ) | (33,016 | ) | ||||
Net realized long-term gains, Class R6 | (1,630 | ) | (5 | ) | ||||
|
|
|
| |||||
| Decrease in net assets from distributions to shareholders | (226,846 | ) | (98,808 | ) | ||||
|
|
|
| |||||
| From Share Transactions | ||||||||
| Sale of shares | ||||||||
Class A (3,093 and 5,635 shares, respectively) | 113,074 | 229,447 | ||||||
Class B (1 and —(2) shares, respectively) | 18 | 14 | ||||||
Class C (184 and 249 shares, respectively) | 6,659 | 10,111 | ||||||
Class I (4,851 and 3,839 shares, respectively) | 174,976 | 156,081 | ||||||
Class R6 (562 and 55 shares, respectively) | 21,137 | 2,219 | ||||||
| Reinvestment of distributions | ||||||||
Class A (2,973 and 1,152 shares, respectively) | 100,358 | 46,862 | ||||||
Class B (5 and 3 shares, respectively) | 177 | 124 | ||||||
Class C (300 and 83 shares, respectively) | 10,097 | 3,363 | ||||||
Class I (3,135 and 1,103 shares, respectively) | 105,792 | 44,771 | ||||||
Class R6 (58 and —(2) shares, respectively) | 1,972 | 17 | ||||||
| Shares repurchased | ||||||||
Class A (7,850 and 10,962 shares, respectively) | (285,777 | ) | (439,189 | ) | ||||
Class B (29 and 43 shares, respectively) | (1,038 | ) | (1,694 | ) | ||||
Class C (377 and 330 shares, respectively) | (13,622 | ) | (13,174 | ) | ||||
Class I (8,024 and 6,450 shares, respectively) | (293,340 | ) | (260,654 | ) | ||||
Class R6 (77 and 12 shares, respectively) | (2,763 | ) | (489 | ) | ||||
|
|
|
| |||||
| Increase (decrease) in net assets from share transactions | (62,280 | ) | (222,191 | ) | ||||
|
|
|
| |||||
| Net increase (decrease) in net assets | (99,274 | ) | (145,566 | ) | ||||
| Net Assets | ||||||||
Beginning of period | 1,338,571 | 1,484,137 | ||||||
|
|
|
| |||||
| End of period | $ | 1,239,297 | $ | 1,338,571 | ||||
|
|
|
| |||||
Accumulated undistributed net investment income (loss) at end of period | — | $ | 64 | |||||
| (1) | Amount is less than $500. |
| (2) | Amount is less than 500 shares. |
See Notes to Financial Statements
14
Table of Contents
THIS PAGE INTENTIONALLY BLANK.
Table of Contents
VIRTUS REAL ESTATE SECURITIES FUND
SELECTED PER SHARE DATA AND RATIOS FOR A SHARE OUTSTANDING
THROUGHOUT EACH PERIOD
| Net Asset Value, Beginning of Period | Net Investment Income (Loss)(2) | Net Realized and Unrealized Gain (Loss) | Total from Investment Operations | Dividends from Net Investment Income | Distributions from Net Realized Gains | Total Distributions | |||||||||||||||||||||||||||||
Class A | |||||||||||||||||||||||||||||||||||
10/1/15 to 9/30/16 | $ | 38.45 | 0.47 | 4.80 | 5.27 | (0.48 | ) | (6.37 | ) | (6.85 | ) | ||||||||||||||||||||||||
10/1/14 to 9/30/15 | 36.65 | 0.51 | 3.76 | 4.27 | (0.53 | ) | (1.94 | ) | (2.47 | ) | |||||||||||||||||||||||||
10/1/13 to 9/30/14 | 35.10 | 0.29 | 3.86 | 4.15 | (0.29 | ) | (2.31 | ) | (2.60 | ) | |||||||||||||||||||||||||
10/1/12 to 9/30/13 | 34.19 | 0.36 | 0.91 | 1.27 | (0.36 | ) | — | (0.36 | ) | ||||||||||||||||||||||||||
10/1/11 to 9/30/12 | 26.05 | 0.21 | 8.24 | 8.45 | (0.31 | ) | — | (0.31 | ) | ||||||||||||||||||||||||||
Class B | |||||||||||||||||||||||||||||||||||
10/1/15 to 9/30/16 | $ | 37.90 | 0.17 | 4.75 | 4.92 | (0.17 | ) | (6.37 | ) | (6.54 | ) | ||||||||||||||||||||||||
10/1/14 to 9/30/15 | 36.13 | 0.17 | 3.74 | 3.91 | (0.20 | ) | (1.94 | ) | (2.14 | ) | |||||||||||||||||||||||||
10/1/13 to 9/30/14 | 34.62 | (0.01 | ) | 3.84 | 3.83 | (0.01 | ) | (2.31 | ) | (2.32 | ) | ||||||||||||||||||||||||
10/1/12 to 9/30/13 | 33.72 | 0.10 | 0.89 | 0.99 | (0.09 | ) | — | (0.09 | ) | ||||||||||||||||||||||||||
10/1/11 to 9/30/12 | 25.71 | 0.02 | 8.06 | 8.08 | (0.07 | ) | — | (0.07 | ) | ||||||||||||||||||||||||||
Class C | |||||||||||||||||||||||||||||||||||
10/1/15 to 9/30/16 | $ | 38.37 | 0.20 | 4.78 | 4.98 | (0.21 | ) | (6.37 | ) | (6.58 | ) | ||||||||||||||||||||||||
10/1/14 to 9/30/15 | 36.59 | 0.22 | 3.73 | 3.95 | (0.23 | ) | (1.94 | ) | (2.17 | ) | |||||||||||||||||||||||||
10/1/13 to 9/30/14 | 35.04 | 0.01 | 3.87 | 3.88 | (0.02 | ) | (2.31 | ) | (2.33 | ) | |||||||||||||||||||||||||
10/1/12 to 9/30/13 | 34.14 | 0.08 | 0.92 | 1.00 | (0.10 | ) | — | (0.10 | ) | ||||||||||||||||||||||||||
10/1/11 to 9/30/12 | 26.02 | (0.03 | ) | 8.22 | 8.19 | (0.07 | ) | — | (0.07 | ) | |||||||||||||||||||||||||
The footnote legend is at the end of the Financial Highlights.
See Notes to Financial Statements
16
Table of Contents
VIRTUS REAL ESTATE SECURITIES FUND
FINANCIAL HIGHLIGHTS
SELECTED PER SHARE DATA AND RATIOS FOR A SHARE OUTSTANDING
THROUGHOUT EACH PERIOD
| Change in Net Asset Value | Net Asset Value, End of Period | Total Return(1) | Net Assets, End of Period (000’s) | Ratio of Expenses to Average Net Assets(3) | Ratio of Net Investment Income (Loss) to Average Net Assets | Portfolio Turnover Rate | ||||||||||||||||||||||||||||
| (1.58 | ) | $ | 36.87 | 15.58 | % | $ | 530,135 | 1.39 | %(7) | 1.29 | % | 31 | % | |||||||||||||||||||||
| 1.80 | 38.45 | 11.34 | 621,507 | 1.36 | 1.26 | 22 | ||||||||||||||||||||||||||||
| 1.55 | 36.65 | 12.75 | 745,473 | 1.38 | 0.79 | 28 | ||||||||||||||||||||||||||||
| 0.91 | 35.10 | 3.70 | 745,631 | 1.40 | 1.00 | 30 | ||||||||||||||||||||||||||||
| 8.14 | 34.19 | 32.49 | 789,925 | 1.41 | 0.67 | 24 | ||||||||||||||||||||||||||||
| (1.62 | ) | $ | 36.28 | 14.70 | % | $ | 524 | 2.14 | %(7) | 0.48 | % | 31 | % | |||||||||||||||||||||
| 1.77 | 37.90 | 10.51 | 1,418 | 2.11 | 0.42 | 22 | ||||||||||||||||||||||||||||
| 1.51 | 36.13 | 11.91 | 2,770 | 2.13 | (0.02 | ) | 28 | |||||||||||||||||||||||||||
| 0.90 | 34.62 | 2.92 | 3,978 | 2.15 | 0.29 | 30 | ||||||||||||||||||||||||||||
| 8.01 | 33.72 | 31.49 | 6,761 | 2.16 | 0.07 | 24 | ||||||||||||||||||||||||||||
| (1.60 | ) | $ | 36.77 | 14.70 | % | $ | 67,216 | 2.15 | %(7) | 0.55 | % | 31 | % | |||||||||||||||||||||
| 1.78 | 38.37 | 10.49 | 66,023 | 2.11 | 0.56 | 22 | ||||||||||||||||||||||||||||
| 1.55 | 36.59 | 11.91 | 62,889 | 2.13 | 0.04 | 28 | ||||||||||||||||||||||||||||
| 0.90 | 35.04 | 2.93 | 63,005 | 2.15 | 0.23 | 30 | ||||||||||||||||||||||||||||
| 8.12 | 34.14 | 31.48 | 60,941 | 2.16 | (0.10 | ) | 24 | |||||||||||||||||||||||||||
The footnote legend is at the end of the Financial Highlights.
See Notes to Financial Statements
17
Table of Contents
VIRTUS REAL ESTATE SECURITIES FUND
FINANCIAL HIGHLIGHTS (Continued)
SELECTED PER SHARE DATA AND RATIOS FOR A SHARE OUTSTANDING
THROUGHOUT EACH PERIOD
| Net Asset Value, Beginning of Period | Net Investment Income (Loss)(2) | Net Realized and Unrealized Gain (Loss) | Total from Investment Operations | Dividends from Net Investment Income | Distributions from Net Realized Gains | Total Distributions | |||||||||||||||||||||||||||||
Class I | |||||||||||||||||||||||||||||||||||
10/1/15 to 9/30/16 | $ | 38.42 | 0.56 | 4.80 | 5.36 | (0.58 | ) | (6.37 | ) | (6.95 | ) | ||||||||||||||||||||||||
10/1/14 to 9/30/15 | 36.62 | 0.62 | 3.75 | 4.37 | (0.63 | ) | (1.94 | ) | (2.57 | ) | |||||||||||||||||||||||||
10/1/13 to 9/30/14 | 35.07 | 0.39 | 3.86 | 4.25 | (0.39 | ) | (2.31 | ) | (2.70 | ) | |||||||||||||||||||||||||
10/1/12 to 9/30/13 | 34.16 | 0.43 | 0.92 | 1.35 | (0.44 | ) | — | (0.44 | ) | ||||||||||||||||||||||||||
10/1/11 to 9/30/12 | 26.03 | 0.30 | 8.22 | 8.52 | (0.39 | ) | — | (0.39 | ) | ||||||||||||||||||||||||||
Class R6 | |||||||||||||||||||||||||||||||||||
10/1/15 to 9/30/16 | $ | 38.42 | 0.70 | 4.73 | 5.43 | (0.64 | ) | (6.37 | ) | (7.01 | ) | ||||||||||||||||||||||||
11/12/14(4) to 9/30/15 | 40.32 | 0.79 | (0.06 | ) | 0.73 | (0.69 | ) | (1.94 | ) | (2.63 | ) | ||||||||||||||||||||||||
The footnote legend is at the end of the Financial Highlights.
See Notes to Financial Statements
18
Table of Contents
VIRTUS REAL ESTATE SECURITIES FUND
FINANCIAL HIGHLIGHTS (Continued)
SELECTED PER SHARE DATA AND RATIOS FOR A SHARE OUTSTANDING
THROUGHOUT EACH PERIOD
| Change in Net Asset Value | Net Asset Value, End of Period | Total Return(1) | Net Assets, End of Period (000’s) | Ratio of Expenses to Average Net Assets(3) | Ratio of Net Investment Income (Loss) to Average Net Assets | Portfolio Turnover Rate | ||||||||||||||||||||||||||||
| (1.59 | ) | $ | 36.83 | 15.85 | % | $ | 619,818 | 1.14 | %(7) | 1.52 | % | 31 | % | |||||||||||||||||||||
| 1.80 | 38.42 | 11.63 | 647,976 | 1.11 | 1.55 | 22 | ||||||||||||||||||||||||||||
| 1.55 | 36.62 | 13.04 | 673,005 | 1.13 | 1.07 | 28 | ||||||||||||||||||||||||||||
| 0.91 | 35.07 | 3.96 | 494,963 | 1.15 | 1.21 | 30 | ||||||||||||||||||||||||||||
| 8.13 | 34.16 | 32.80 | 422,374 | 1.16 | 0.93 | 24 | ||||||||||||||||||||||||||||
| (1.58 | ) | $ | 36.84 | 16.06 | % | $ | 21,604 | 0.98 | %(7) | 1.93 | % | 31 | % | |||||||||||||||||||||
| (1.90 | ) | 38.42 | 1.54 | (6) | 1,647 | 0.94 | (5) | 2.30 | (5) | 22 | ||||||||||||||||||||||||
Footnote Legend
| (1) | Sales charges, where applicable, are not reflected in the total return calculation. |
| (2) | Computed using average shares outstanding. |
| (3) | The Fund may invest in other funds, and the annualized expense ratios do not reflect fees and expenses associated with the underlying funds. |
| (4) | Inception date of class. |
| (5) | Annualized. |
| (6) | Not annualized. |
| (7) | Expense ratios include extraordinary proxy expenses |
See Notes to Financial Statements
19
Table of Contents
VIRTUS REAL ESTATE SECURITIES FUND
SEPTEMBER 30, 2016
Note 1. Organization
Virtus Opportunities Trust (the “Trust”) is organized as a Delaware statutory trust and is registered under the Investment Company Act of 1940, as amended (“1940 Act”), as an open-end management investment company.
As of the date of this report, 31 funds of the Trust are offered for sale, of which the Real Estate Securities Fund (the “Fund”) is reported in this annual report. The Fund’s investment objectives are outlined in the Fund Summary Page. There is no guarantee the Fund will achieve its objective.
The Fund offers Class A shares, Class C shares, Class I shares and Class R6 shares for sale. Class B shares are no longer available for purchase by new or existing shareholders, except by existing shareholders through Qualifying Transactions. (For information regarding Qualifying Transactions, refer to the Fund’s prospectus.)
Class A shares are sold with a front-end sales charge of up to 5.75% with some exceptions. Generally, Class A shares are not subject to any charges by the Fund when redeemed; however, a 1% contingent deferred sales charge (“CDSC”) may be imposed on certain redemptions made within a certain period following purchases on which a finder’s fee has been paid. The period for which the CDSC applies for the Fund is 18 months. The CDSC period begins on the last day of the month preceding the month in which the purchase was made.
Class B shares were generally sold with a CDSC which declines from 5% to zero depending on the period of time the shares are held.
Class C shares are generally sold with a 1% CDSC, applicable if redeemed within one year of purchase. Class I shares are sold without a front-end sales charge or CDSC.
Class R6 shares are only available to participants in employer-sponsored retirement plans, such as 401(k) plans, profit sharing plans, defined benefit plans and other employer directed plans. Class R6 shares do not carry sales commissions or pay Rule 12b-1 fees. No compensation, administrative payments, sub-transfer agency payments or service payments are paid to brokers or other entities from fund assets or the Distributor’s or an affiliate’s resources on sales of or investments in Class R6 Shares.
Virtus Mutual Funds may impose an annual fee on accounts having balances of less than $2,500. The small account fee may be waived in certain circumstances, as disclosed in the prospectuses and/or statements of additional information. The fees collected will be used to offset certain expenses of the Fund. These fees are reflected as “Low Balance Account Fees” in the Fund’s Statement of Operations for the period, as applicable.
Each class of shares has identical voting, dividend, liquidation and other rights and the same terms and conditions, except that each class bears different distribution and/or service fees under a Board-approved Rule 12b-1 and/or shareholder service plan (“12b-1 plan”) and has exclusive voting rights with respect to such plans. Class I shares and Class R6 shares are not subject to a 12b-1 plan. Income and other expenses as well as realized and unrealized gains and losses of the Fund are borne pro rata by the holders of each class of shares.
Note 2. Significant Accounting Policies
The following is a summary of significant accounting policies consistently followed by the Trust in the preparation of its financial statements. The preparation of financial statements in conformity with accounting principles generally accepted in the United States of America requires management to make estimates and assumptions that affect the reported amounts of assets and liabilities, disclosure of contingent assets and liabilities at the date of the
20
Table of Contents
VIRTUS REAL ESTATE SECURITIES FUND
NOTES TO FINANCIAL STATEMENTS (Continued)
SEPTEMBER 30, 2016
financial statements and the reported amounts of increases and decreases in net assets from operations during the reporting period. Actual results could differ from those estimates and those differences could be significant.
| A. | Security Valuation |
Security valuation procedures for the Fund, which include nightly price variance, as well as back-testing such as bi-weekly unchanged price, monthly secondary source and transaction analysis, have been approved by the Board of Trustees (the “Board”, or the “Trustees”). All internally fair valued securities are approved by a valuation committee (the “Valuation Committee”) appointed by the Board. The Valuation Committee is comprised of certain members of management as identified to the Board and convenes independently from portfolio management. All internally fair valued securities are updated daily and reviewed in detail by the Valuation Committee monthly unless changes occur within the period. The Valuation Committee reviews the validity of the model inputs and any changes to the model. Quarterly fair valuations are reviewed by the Board.
The Fund utilizes a fair value hierarchy which prioritizes the inputs to valuation techniques used to measure fair value into three broad levels. It is the Fund’s policy to recognize transfers at the end of the reporting period.
| • Level 1 – | quoted prices in active markets for identical securities (security types generally include listed equities). |
| • Level 2 – | prices determined using other significant observable inputs (including quoted prices for similar securities, interest rates, prepayment speeds, credit risk, etc.). |
| • Level 3 – | prices determined using significant unobservable inputs (including the Valuation Committee’s own assumptions in determining the fair value of investments). |
A description of the valuation techniques applied to the Fund’s major categories of assets and liabilities measured at fair value on a recurring basis is as follows:
Equity securities are valued at the official closing price (typically last sale) on the exchange on which the securities are primarily traded or, if no closing price is available, at the last bid price and are categorized as Level 1 in the hierarchy. Restricted equity securities and private placements that are not widely traded, are illiquid, or are internally fair valued by the Valuation Committee, are generally categorized as Level 3 in the hierarchy.
Certain non-U.S. securities may be fair valued in cases where closing prices are not readily available or are deemed not reflective of readily available market prices. For example, significant events (such as movement in the U.S. securities market, or other regional and local developments) may occur between the time that non-U.S. markets close (where the security is principally traded) and the time that the Fund calculates its net asset value (“NAV”) (at the close of regular trading on the New York Stock Exchange (“NYSE”), generally 4 p.m. Eastern time) that may impact the value of securities traded in these non-U.S. markets. In such cases the Fund fair values non-U.S. securities using an independent pricing service which considers the correlation of the trading patterns of the non-U.S. security to the intraday trading in the U.S. markets for investments such as American Depositary Receipts, financial futures, exchange-traded funds, and certain indexes, as well as prices for similar securities. Such fair valuations are categorized as Level 2 in the hierarchy. Because the frequency of significant events is not predictable, fair valuation of certain non-U.S. common stocks may occur on a frequent basis.
21
Table of Contents
VIRTUS REAL ESTATE SECURITIES FUND
NOTES TO FINANCIAL STATEMENTS (Continued)
SEPTEMBER 30, 2016
Listed derivatives that are actively traded are valued based on quoted prices from the exchange and are categorized as Level 1 in the hierarchy. Over-the-counter derivative contracts, which include forward currency contracts and equity-linked instruments, do not require material subjectivity as pricing inputs are observed from actively quoted markets and are categorized as Level 2 in the hierarchy.
Investments in open-end mutual funds are valued at NAV. Investments in closed-end funds are valued as of the close of regular trading on the NYSE each business day. Both are categorized as Level 1 in the hierarchy.
A summary of the inputs used to value the Fund’s net assets by each major security type is disclosed at the end of the Schedule of Investments for the Fund. The inputs or methodologies used for valuing securities are not necessarily an indication of the risk associated with investing in those securities.
| B. | Security Transactions and Investment Income |
Security transactions are recorded on the trade date. Realized gains and losses from the sale of securities are determined on the identified cost basis. Dividend income is recognized on the ex-dividend date or, in the case of certain foreign securities, as soon as the Fund is notified. Interest income is recorded on the accrual basis. The Fund amortizes premiums and accretes discounts using the effective interest method.
Dividend income from REIT investments is recorded using management’s estimate of the income included in distributions received from the REIT investments. Distributions received in excess of this estimated amount are recorded as a reduction of the cost of investments or reclassified to capital gains. The actual amounts of income, return of capital, and capital gains are only determined by each REIT after its fiscal year-end, and may differ from the estimated amounts.
| C. | Income Taxes |
The Fund is treated as a separate taxable entity. It is the intention of the Fund to comply with the requirements of Subchapter M of the Internal Revenue Code and to distribute substantially all of its taxable income to its shareholders. Therefore, no provision for federal income taxes or excise taxes has been made.
The Fund may be subject to foreign taxes on income, gains on investments or currency repatriation, a portion of which may be recoverable. The Fund will accrue such taxes and recoveries as applicable based upon current interpretations of the tax rules and regulations that exist in the markets in which it invests.
Management of the Fund has concluded that there are no significant uncertain tax positions that would require recognition in the financial statements. As of September 30, 2016, the tax years that remain subject to examination by the major tax jurisdictions under the statute of limitations are from the year 2013 forward (with limited exceptions).
| D. | Distributions to Shareholders |
Distributions are recorded by the Fund on the ex-dividend date. Income and capital gain distributions are determined in accordance with income tax regulations that may differ from accounting principles generally accepted in the United States of America. These differences may include the treatment of non-taxable dividends, market premium and discount, non-deductible expenses, expiring capital loss carryovers, foreign currency gain or loss, gain or loss on futures contracts, partnerships, operating losses
22
Table of Contents
VIRTUS REAL ESTATE SECURITIES FUND
NOTES TO FINANCIAL STATEMENTS (Continued)
SEPTEMBER 30, 2016
and losses deferred due to wash sales. Permanent book and tax basis differences relating to shareholder distributions will result in reclassifications to capital paid in on shares of beneficial interest.
| E. | Expenses |
Expenses incurred together by the Fund and other affiliated mutual funds are allocated in proportion to the net assets of each such fund, except where allocation of direct expense to each fund or an alternative allocation method can be more appropriately used.
In addition to the net operating expenses that the Fund bears directly, the shareholders of the Fund indirectly bear the Fund’s pro rata expenses of any underlying mutual funds in which the Fund invests.
| F. | Earnings Credit and Interest |
Through arrangements with the Fund’s custodian, the Fund either receives an earnings credit or interest on agreed upon target un-invested cash balances to reduce the Fund’s custody expenses. The credits are reflected as “Earnings credit from Custodian” and the interest is reflected under “Interest income” in the Fund’s Statement of Operations for the period, as applicable.
Note 3. Investment Advisory Fees and Related Party Transactions
($ reported in thousands except as noted)
| A. | Adviser |
Virtus Investment Advisers, Inc. (the “Adviser”), an indirect, wholly owned subsidiary of Virtus Investment Partners, Inc. (“Virtus”), is the adviser to the Trust. The Adviser manages the Fund’s investment program and general operations of the Fund, including oversight of the Fund’s subadviser.
As compensation for its services to the Fund, the Adviser is entitled to a fee based upon the following annual rates as a percentage of the average daily net assets of the Fund:
First $1 Billion | $1 Billion through | $2+ Billion | ||
| 0.75% | 0.70% | 0.65% |
| B. | Subadviser |
Duff & Phelps Investment Management Co. (the “Subadviser”), an indirect wholly owned subsidiary of Virtus, is the subadviser to the Fund. The subadviser manages the investments of the Fund for which the Subadviser is paid a fee by the Adviser.
| C. | Distributor |
VP Distributors, LLC (“VP Distributors”), an indirect wholly owned subsidiary of Virtus, serves as the distributor of the Fund’s shares. VP Distributors has advised the Fund that for the fiscal year (the “period”) ended September 30, 2016, it retained net commissions of $16 for Class A shares and deferred sales charges of $4 for Class C shares.
In addition, the Fund pays VP Distributors distribution and/or service fees under a 12b-1 plan as a percentage of the daily average net assets of each respective class at
23
Table of Contents
VIRTUS REAL ESTATE SECURITIES FUND
NOTES TO FINANCIAL STATEMENTS (Continued)
SEPTEMBER 30, 2016
the annual rates as follows: 0.25% for Class A shares, 1.00% for Class B shares, and 1.00% for Class C shares. Class R6 shares and Class I shares are not subject to a 12b-1 plan.
Under certain circumstances, shares of certain Virtus Mutual Funds may be exchanged for shares of the same class of certain other Virtus Mutual Funds on the basis of the relative NAV per share at the time of the exchange. On exchanges with share classes that carry a CDSC, the CDSC schedule of the original shares purchased continues to apply.
| D. | Administrator and Transfer Agent |
Virtus Fund Services, LLC, an indirect wholly owned subsidiary of Virtus, serves as administrator and transfer agent to the Fund.
For the period ended September 30, 2016, the Fund incurred administration fees totaling $1,266 which are included in the Statement of Operations.
For the period ended September 30, 2016, the Fund incurred transfer agent fees totaling $2,786 which are included in the Statement of Operations. A portion of these fees was paid to outside entities that also provide services to the Trust.
| E. | Affiliated Shareholders |
At September 30, 2016, Virtus and its affiliates, and the retirement plans of Virtus and its affiliates, held shares of the Fund which may be redeemed at any time that aggregated to the following:
| Shares | Aggregate Net Asset Value | |||||||
Class I | 118,789 | $ | 4,375 | |||||
| Class R6 | 3,200 | 118 | ||||||
| F. | Trustee Compensation |
The Trust provides a deferred compensation plan for its Trustees who receive compensation from the Trust. Under the deferred compensation plan, Trustees may elect to defer all or a portion of their compensation. Amounts deferred are retained by the Trust, and then, to the extent permitted by the 1940 Act, in turn, may be invested in the shares of affiliated or unaffiliated mutual funds selected by the participating Trustees. Investments in such instruments are included in “Other Assets” on the Statement of Assets and Liabilities at September 30, 2016.
Note 4. Purchases and Sales of Securities
($ reported in thousands)
Purchases and sales of securities (excluding U.S. Government and agency securities and short-term securities) during the period ended September 30, 2016, were as follows:
| Purchases | Sales | |||||||
| $ | 402,144 | $ | 663,310 | |||||
There were no purchases or sales of long-term U.S. Government and agency securities for the period ended September 30, 2016.
24
Table of Contents
VIRTUS REAL ESTATE SECURITIES FUND
NOTES TO FINANCIAL STATEMENTS (Continued)
SEPTEMBER 30, 2016
Note 5. Borrowings
($ reported in thousands)
On June 29, 2016, the Fund and other affiliated funds renewed a $50,000 secured line of credit. The Credit Agreement (the “Agreement”) is with a commercial bank (the “Bank”) that allows the Fund to borrow cash from the Bank to manage large unexpected redemptions and trade fails, up to a limit of one-fifth of the Fund’s total net assets in accordance with the Agreement. The agreement has a term of 364 days and is renewable by the Fund with the Bank’s consent. Interest is charged at the higher of the LIBOR (London Interbank Offered Rate) or the Federal Funds rate plus an additional percentage rate on the amount borrowed. Commitment fees are charged on the undrawn balance. The Fund and other affiliated funds are individually, and not jointly, liable for their particular advances, if any, under the line of credit. The Bank has the ability to require repayment of outstanding borrowings under the Agreement upon certain circumstances such as an event of default.
The Fund had no outstanding borrowings at any time during the period ended September 30, 2016.
Note 6. 10% Shareholders
As of September 30, 2016, the Fund had individual shareholder account(s) and/or omnibus shareholder account(s) (comprised of a group of individual shareholders), which individually amounted to more than 10% of the total shares outstanding of the Fund as detailed below:
| % of Shares Outstanding | Number of Accounts | |||||||
| 22 | % | 2* | ||||||
* The shareholders are not affiliated with Virtus.
Note 7. Credit Risk and Asset Concentrations
The Fund may invest a high percentage of its assets in specific sectors of the market in its pursuit of its investment objective. Fluctuations in these sectors of concentration may have a greater impact on the Fund, positive or negative, than if the Fund did not concentrate its investments in such sectors.
Note 8. Indemnifications
Under the Trust’s organizational documents, its Trustees and officers are indemnified against certain liabilities arising out of the performance of their duties to the Fund. Each Trustee has also entered into an indemnification agreement with the Trust. In addition, in the normal course of business, the Fund enters into contracts that provide a variety of indemnifications to other parties. The Fund’s maximum exposure under these arrangements is unknown as this would involve future claims that may be made against the Fund and that have not occurred. However, the Fund has not had prior claims or losses pursuant to these arrangements and expects the risk of loss to be remote.
25
Table of Contents
VIRTUS REAL ESTATE SECURITIES FUND
NOTES TO FINANCIAL STATEMENTS (Continued)
SEPTEMBER 30, 2016
Note 9. Federal Income Tax Information
($ reported in thousands)
At September 30, 2016, federal tax cost and aggregate gross unrealized appreciation (depreciation) of securities held by the Fund were as follows:
Federal | Unrealized | Unrealized | Net Unrealized | |||
| $814,521 | $420,256 | $(10,157) | $410,099 |
The components of distributable earnings on a tax basis (excluding unrealized appreciation (depreciation) (which are disclosed above) consist of the following:
| Undistributed Ordinary Income | Undistributed Long-term Capital Gains | |||||||
| $ | 6,457 | $ | 167,784 | |||||
The differences between the book and tax basis components of distributable earnings relate principally to the timing of recognition of income and gains for federal income tax purposes. Short-term gain distributions reported in the Statements of Changes in Net Assets, if any, are reported as ordinary income for federal tax purposes. Distributions are determined on a tax basis and may differ from net investment income and realized capital gains for financial reporting purposes.
The tax character of dividends and distributions paid during the years ended September 30, 2016 and 2015 was as follows:
| Year Ended | ||||||||
| 2016 | 2015 | |||||||
Ordinary Income | $ | 28,503 | $ | 25,780 | ||||
Long-Term Capital Gains | 198,343 | 73,028 | ||||||
|
|
|
| |||||
Total | $ | 226,846 | $ | 98,808 | ||||
|
|
|
| |||||
Note 10. Regulatory Matters and Litigation
From time to time, the Trust, the Fund’s Adviser and/or Subadviser and/or their affiliates may be involved in litigation and arbitration as well as examinations and investigations by various regulatory bodies, including the SEC, involving compliance with, among other things, securities laws, client investment guidelines, laws governing the activities of broker-dealers and other laws and regulations affecting their products and other activities. At this time, the Adviser believes that the outcomes of such matters are not likely, either individually or in the aggregate, to be material to these financial statements.
On February 20, 2015, a putative class action complaint (In re Virtus Investment Partners, Inc. Securities Litigation; formerly styled as Tom Cummins v. Virtus Investment Partners Inc. et al.) alleging violation of the federal securities laws was filed by an individual shareholder against Virtus and certain of its officers (the “defendants”) in the United States District Court for the Southern District of New York. On August 21, 2015, the lead plaintiff filed a Consolidated Class Action Complaint (the “Consolidated Complaint”) amending the originally filed complaint and adding the Trust as a defendant. The Consolidated Complaint
26
Table of Contents
VIRTUS REAL ESTATE SECURITIES FUND
NOTES TO FINANCIAL STATEMENTS (Continued)
SEPTEMBER 30, 2016
was purportedly filed on behalf of all purchasers of Virtus common stock between January 25, 2013 and May 11, 2015 (the “Class Period”). The Consolidated Complaint alleges that during the Class Period, the defendants disseminated materially false and misleading statements and concealed material adverse facts relating to certain funds previously subadvised by F-Squared Investments, Inc. and/or its affiliates (“F-Squared”). The plaintiff seeks to recover unspecified damages. A motion to dismiss the Consolidated Complaint was filed on behalf of the defendants on October 21, 2015. Pursuant to an Opinion & Order (“Order”) filed on July 1, 2016, the court granted in part and denied in part the defendants’ motion to dismiss. Although the Order narrows the scope of the claims asserted, claims under Sections 10(b) and 20(a) of the Exchange Act and Rule 10b-5 thereunder survive the motion. The defendants filed an Answer to the Consolidated Complaint on August 5, 2016. Virtus and its affiliates, including the Adviser, believe that the suit is without merit and intend to defend it vigorously. The Trust believes that the risk of loss to the Fund as a result of this suit is remote. The Adviser does not believe that the suit will have any impact on its ability to provide services to the Fund.
On May 8, 2015, a putative class action complaint (Mark Youngers v. Virtus Investment Partners, Inc. et al.) alleging violations of certain provisions of the federal securities laws was filed in the United States District Court for the Central District of California. The complaint, which was purportedly filed on behalf of purchasers of certain Virtus Funds previously subadvised by F-Squared between May 8, 2010 and December 22, 2014, inclusive (the “Class Period”), alleged claims against Virtus, certain Virtus officers and affiliates (including the Adviser, Euclid Advisors LLC (“Euclid”) and VP Distributors, LLC), the trustees and certain officers of the Trust, and certain other parties (the “defendants”). The complaint alleges that during the Class Period the defendants disseminated materially false and misleading statements and concealed or omitted material facts necessary to make the statements made not misleading. On October 1, 2015, the plaintiff filed a First Amended Class Action Complaint which, among other things, added a derivative claim for breach of fiduciary duty on behalf of the Trust. On October 19, 2015, the United States District Court for the Central District of California entered an order transferring the action to the Southern District of New York. On January 4, 2016, Plaintiffs filed a Second Amended Complaint. Motions to dismiss were filed on behalf of Virtus, its officers and affiliates and the independent trustees on February 1, 2016. An Opinion & Order (“Order”) granting in part and denying in part the defendants’ motions to dismiss was issued on July 1, 2016. The Order dismissed all claims against the Adviser, Euclid, the independent trustees and certain of the other individual defendants and narrowed the claims asserted against the remaining defendants. The remaining defendants filed an Answer to the Second Amended Complaint on August 5, 2016. The defendants filed a motion to certify an interlocutory appeal of the July 1, 2016 order to the Court of Appeals for the Second Circuit on August 26, 2016. Oral argument on the motion is scheduled for October 7, 2016. Virtus and its affiliates, including the Adviser, believe that the suit has no basis in law or fact and intend to defend it vigorously. The Trust believes that the risk of loss to the Fund as a result of this suit is remote. The Adviser does not believe that the suit will have any impact on its ability to provide services to the Fund.
Note 11. Subsequent Events
Management has evaluated the impact of all subsequent events on the Fund through the date the financial statements were issued, and has determined that there are no subsequent events requiring recognition or disclosure in the financial statements.
27
Table of Contents

Report of Independent Registered Public
Accounting Firm
To the Board of Trustees of
Virtus Opportunities Trust and Shareholders of
Virtus Real Estate Securities Fund:
In our opinion, the accompanying statement of assets and liabilities, including the schedule of investments, and the related statements of operations and of changes in net assets and the financial highlights present fairly, in all material respects, the financial position of the Virtus Real Estate Securities Fund (one of the funds constituting Virtus Opportunities Trust, hereafter referred to as the “Fund”) at September 30, 2016, the results of its operations for the year then ended, the changes in its net assets for each of the two years in the period then ended and the financial highlights for each of the periods indicated, in conformity with accounting principles generally accepted in the United States of America. These financial statements and financial highlights (hereafter referred to as “financial statements”) are the responsibility of the Fund’s management. Our responsibility is to express an opinion on these financial statements based on our audits. We conducted our audits of these financial statements in accordance with the standards of the Public Company Accounting Oversight Board (United States). Those standards require that we plan and perform the audit to obtain reasonable assurance about whether the financial statements are free of material misstatement. An audit includes examining, on a test basis, evidence supporting the amounts and disclosures in the financial statements, assessing the accounting principles used and significant estimates made by management, and evaluating the overall financial statement presentation. We believe that our audits, which included confirmation of securities at September 30, 2016 by correspondence with the custodian and brokers, provide a reasonable basis for our opinion.

Philadelphia, Pennsylvania
November 22, 2016
28
Table of Contents
VIRTUS REAL ESTATE SECURITIES FUND
TAX INFORMATION NOTICE (Unaudited)
SEPTEMBER 30, 2016
For the fiscal year ended September 30, 2016, the Fund makes the following disclosures for federal income tax purposes. Below is listed the percentage, or the maximum amount allowable, of its ordinary income dividends (“QDI”) to qualify for the lower tax rates applicable to individual shareholders, and the percentage of ordinary income dividends earned by the Fund which qualifies for the dividends received deduction (“DRD”) for corporate shareholders. The actual percentage of QDI and DRD for the calendar year will be designated in year-end tax statements. The Fund designates the amount below as long-term capital gains dividends (“LTCG”) taxable at a 20% rate, or lower depending on the shareholder’s income ($ reported in thousands). LTCG amount, if subsequently different, will be designated in the next annual report.
QDI | DRD | LTCG | ||
| —% | —% | $196,075 |
29
Table of Contents
RESULTS OF SHAREHOLDER MEETING
VIRTUS OPPORTUNITIES TRUST
MAY 19, 2016 (Unaudited)
At a special meeting of shareholders of all series of Virtus Equity Trust, Virtus Insight Trust and Virtus Opportunities Trust, held on May 19, 2016, shareholders of Virtus Opportunities Trust (the “Trust”) voted on the following proposals:
Proposal 1.
| Number of Eligible Votes: | ||||||||||||
| FOR | AGAINST | ABSTAIN | ||||||||||
To elect six Trustees to serve on the Board of Trustees until the next meeting of shareholders at which Trustees are elected. | ||||||||||||
George R. Aylward | 1,145,056,198.477 | 24,756,597.221 | 0 | |||||||||
Thomas J. Brown | 1,144,160,222.050 | 25,652,573.650 | 0 | |||||||||
Donald C. Burke | 1,145,758,834.912 | 24,053,960.790 | 0 | |||||||||
Roger A. Gelfenbien | 1,144,297,795.833 | 25,514,999.865 | 0 | |||||||||
John R. Mallin | 1,144,938,076.292 | 24,874,719.410 | 0 | |||||||||
Hassell H. McClellan | 1,143,864,433.134 | 25,948,362.566 | 0 | |||||||||
Shareholders of the Trust voted to approve the above proposal.
Proposal 2.
| Number of Eligible Votes: | ||||||||||||
| FOR | AGAINST | ABSTAIN | ||||||||||
To approve a proposal to permit Virtus Investment Advisers, Inc., as the investment adviser to all the Funds, to hire and replace subadvisers or to modify subadvisory agreements without shareholder approval. | ||||||||||||
Virtus CA Tax Exempt Bond Fund | 1,258,194.893 | 91,895.368 | 41,271.245 | |||||||||
Virtus Emerging Markets Debt Fund | 3,015,152.206 | 198.283 | 0 | |||||||||
Virtus Emerging Markets Equity Income Fund | 3,672,832.400 | 0 | 0 | |||||||||
Virtus Emerging Markets Opportunities Fund | 620,793,093.034 | 25,302,093.728 | 9,306,937.262 | |||||||||
Virtus Emerging Markets Small-Cap Fund | 494,281.793 | 0 | 0 | |||||||||
Virtus Essential Resources Fund | 504,931.913 | 0 | 0 | |||||||||
Virtus Foreign Opportunities Fund | 27,726,679.250 | 666,663.374 | 564,703.507 | |||||||||
Virtus Greater European Opportunities Fund | 818,457.900 | 37,502.974 | 15,676.215 | |||||||||
Virtus International Small-Cap Fund | 3,074,638.276 | 5,991.041 | 10,261.000 | |||||||||
Virtus International Wealth Masters Fund | 518,044.295 | 0 | 0 | |||||||||
Virtus Low Duration Income Fund | 10,449,114.393 | 779,684.940 | 311,840.943 | |||||||||
Virtus Multi-Sector Intermediate Bond Fund | 11,147,670.008 | 724,253.699 | 406,427.672 | |||||||||
Virtus Multi-Sector Short Term Bond Fund | 618,834,424.483 | 21,316,032.964 | 14,819,955.463 | |||||||||
Shareholders of the Funds listed above voted to approve the above proposal.
30
Table of Contents
RESULTS OF SHAREHOLDER MEETING (Continued)
VIRTUS OPPORTUNITIES TRUST
MAY 19, 2016 (Unaudited)
Proposal 6.
| Number of Eligible Votes: | ||||||||||||
| FOR | AGAINST | ABSTAIN | ||||||||||
To approve a proposal to amend the fundamental restrictions of the Fundamental Restriction Funds with respect to loans. | ||||||||||||
Virtus Foreign Opportunities Fund | 27,568,524.708 | 741,409.046 | 648,118.377 | |||||||||
Virtus Multi-Sector Short Term Bond Fund | 615,281,810.614 | 22,749,361.497 | 16,939,237.795 | |||||||||
Shareholders of the Funds listed above voted to approve the above proposal.
31
Table of Contents
RESULTS OF SHAREHOLDER MEETING
VIRTUS OPPORTUNITIES TRUST
JULY 18, 2016 (Unaudited)
At a special meeting of shareholders of Virtus Global Equity Trend Fund, Virtus Global Opportunities Fund, Virtus Herzfeld Fund, Virtus International Equity Fund, Virtus Low Volatility Equity Fund, Virtus Real Estate Securities Fund, Virtus Sector Trend Fund, Virtus Wealth Masters Fund, Virtus Alternatives Diversifier Fund, Virtus Equity Trend Fund, Virtus Multi-Asset Trend Fund and Virtus Tax-Exempt Bond Fund, held on July 18, 2016, shareholders of the Funds voted on the following proposals:
Proposal 2.
| Number of Eligible Votes: | ||||||||||||
| FOR | AGAINST | ABSTAIN | ||||||||||
To approve a proposal to permit Virtus Investment Advisers, Inc., as the investment adviser to all the Funds, to hire and replace subadvisers or to modify subadvisory agreements without shareholder approval. | ||||||||||||
Virtus Global Equity Trend Fund | 2,071,338.688 | 221,721.989 | 61,016.655 | |||||||||
Virtus Global Opportunities Fund | 6,475,669.315 | 399,601.579 | 221,211.057 | |||||||||
Virtus Herzfeld Fund | 2,285,754.412 | 134,756.871 | 89,510.278 | |||||||||
Virtus International Equity Fund | 347,976.498 | 45,434.960 | 4,980.529 | |||||||||
Virtus Low Volatility Equity Fund | 234,510.520 | 7,334.000 | 90,835.796 | |||||||||
Virtus Real Estate Securities Fund | 14,196,247.698 | 691,146.713 | 476,502.196 | |||||||||
Virtus Sector Trend Fund | 14,380,526.646 | 1,274,297.224 | 1,097,176.679 | |||||||||
Virtus Wealth Masters Fund | 2,759,756.937 | 182,003.481 | 154,822.394 | |||||||||
Virtus Alternatives Diversifier Fund | 2,054,425.037 | 135,901.800 | 177,500.739 | |||||||||
Virtus Equity Trend Fund | 47,080,228.694 | 3,814,318.119 | 2,960,680.324 | |||||||||
Virtus Multi-Asset Trend Fund | 7,428,521.065 | 660,946.728 | 521,389.418 | |||||||||
Virtus Tax-Exempt Bond Fund | 7,423,225.114 | 802,129.342 | 492,588.498 | |||||||||
Shareholders of Virtus Global Equity Trend Fund, Virtus Global Opportunities Fund, Virtus Herzfeld Fund, Virtus International Equity Fund, Virtus Low Volatility Equity Fund, Virtus Real Estate Securities Fund, Virtus Sector Trend Fund and Virtus Wealth Masters Fund voted to approve the above proposal. Shareholders of Virtus Alternatives Diversifier Fund, Virtus Equity Trend Fund, Virtus Multi-Asset Trend Fund and Virtus Tax-Exempt Bond Fund did not approve the above proposal.
Proposal 6.
| Number of Eligible Votes: | ||||||||||||
| FOR | AGAINST | ABSTAIN | ||||||||||
To approve a proposal to amend the fundamental restrictions of the Fundamental Restriction Funds with respect to loans. | ||||||||||||
Virtus Sector Trend Fund | 14,250,883.760 | 1,251,197.022 | 1,249,922.768 | |||||||||
Virtus Real Estate Securities Fund | 13,928,178.018 | 864,726.603 | 570,992.984 | |||||||||
Shareholders of Virtus Sector Trend Fund voted to approve the above proposal. Shareholders of Virtus Real Estate Securities Fund did not approve the above proposal.
32
Table of Contents
RESULTS OF SHAREHOLDER MEETING (Continued)
VIRTUS OPPORTUNITIES TRUST
JULY 18, 2016 (Unaudited)
Proposal 7.
| Number of Eligible Votes: | ||||||||||||
| FOR | AGAINST | ABSTAIN | ||||||||||
To approve a proposal to amend the fundamental restrictions of the Fundamental Restriction Funds with respect to loans. | ||||||||||||
Virtus Multi-Sector Short Term Bond Fund | 238,431,276.605 | 411,212,271.419 | 20,011,935.573 | |||||||||
Virtus Real Estate Securities Fund | 9,635,396.247 | 5,113,977.185 | 614,521.174 | |||||||||
Virtus Sector Trend Fund | 9,706,807.226 | 5,648,494.88 | 1,396,703.437 | |||||||||
Shareholders of the Funds listed above did not approve the above proposal.
33
Table of Contents
FUND MANAGEMENT TABLES (UNAUDITED)
Information pertaining to the Trustees and officers of the Trust as of September 30, 2016, is set forth below. The statement of additional information (SAI) includes additional information about the Trustees and is available without charge, upon request, by calling (800) 243-1574. The address of each individual, unless otherwise noted, is 100 Pearl Street, Hartford, CT 06103-4506. There is no stated term of office for Trustees of the Trust.
Independent Trustees
| Name, Year of Birth, Year Elected and Number of Funds Overseen | Principal Occupation(s) Other Directorships Held by Trustee | |
Thomas J. Brown YOB: 1945 Elected: 2016 65 Portfolios | Retired. Trustee (since 2016), Virtus Mutual Fund Complex (52 portfolios) and Virtus Alternative Solutions Trust (4 portfolios); Trustee (since 2011), Virtus Variable Insurance Trust (9 portfolios); Director (since 2010), D’Youville Senior Care Center; and Director (since 2005), VALIC Company Funds (49 portfolios). | |
Burke, Donald C. YOB: 1961 Elected: 2016 69 Portfolios | Retired. Trustee (since 2016), Virtus Mutual Fund Complex (52 portfolios), Virtus Variable Insurance Trust (9 portfolios) and Virtus Alternative Solutions Trust (4 portfolios); Director (since 2014) closed-end funds managed by Duff & Phelps Investment Management Co. (4 funds); Director, Avista Corp. (energy company) (since 2011); Trustee, Goldman Sachs Fund Complex (2010 to 2014); and Director, BlackRock Luxembourg and Cayman Funds (2006 to 2010). | |
Roger A. Gelfenbien YOB: 1943 Elected: 2016 65 Portfolios | Retired. Trustee (since 2016), Virtus Mutual Fund Complex (52 portfolios) and Virtus Alternative Solutions Trust (4 portfolios); Trustee (since 2000), Virtus Variable Insurance Trust (9 portfolios); and Director (since 1999), USAllianz Variable Insurance Product Trust (42 portfolios). | |
John R. Mallin YOB: 1950 Elected: 2016 65 Portfolios | Partner/Attorney (since 2003), McCarter & English LLP (law firm), Real Property Practice Group; and Member (since 2014), Counselors of Real Estate. Trustee (since 2016), Virtus Mutual Fund Complex (52 portfolios) and Virtus Alternative Solutions Trust (4 portfolios); Director (since 2013), Horizon, Inc. (non-profit); and Trustee (since 1999), Virtus Variable Insurance Trust (9 portfolios). | |
McClellan, Hassell H. YOB: 1945 Elected: 2015 65 Portfolios | Retired (since 2013); and Professor (1984 to 2013), Wallace E. Carroll School of Management, Boston College. Trustee (since 2016), Virtus Alternative Solutions Trust (4 portfolios); Trustee (since 2015), Virtus Mutual Fund Complex (52 portfolios); and Director (since 2010), Barnes Group, Inc. (diversified global components manufacturer and logistical services company); Trustee, Virtus Variable Insurance Trust (9 portfolios) (since 2008); and Trustee, John Hancock Fund Complex (since 2000) (collectively, 228 portfolios). | |
McLoughlin, Philip YOB: 1946 Elected: 1999 74 Portfolios | Retired. Director and Chairman (since 2016), The Zweig Fund and Virtus Global Dividend & Income Fund Inc.; Trustee and Chairman (since 2013), Virtus Alternative Solutions Trust (4 portfolios); Trustee/Director and Chairman (since 2011), Virtus Closed-End Funds (3 funds); Chairman and Trustee (since 2003), Virtus Variable Insurance Trust (9 portfolios); Director (since 1995), closed-end funds managed by Duff & Phelps Investment Management Co. (4 funds); Director (since 1991) and Chairman (since 2010), Lazard World Trust Fund (closed-end investment firm in Luxembourg); and Trustee (since 1989) and Chairman (since 2002), Virtus Mutual Fund Complex (52 portfolios). | |
McNamara, Geraldine M. YOB: 1951 Elected: 2001 69 Portfolios | Retired. Trustee (since 2016) Virtus Alternative Solutions Trust (4 portfolios); Trustee (since 2015), Virtus Variable Insurance Trust (9 portfolios); Director (since 2003), closed-end funds managed by Duff & Phelps Investment Management Co. (4 funds); and Trustee (since 2001), Virtus Mutual Fund Complex (52 portfolios). |
34
Table of Contents
FUND MANAGEMENT TABLES (UNAUDITED) (Continued)
Independent Trustees (Continued)
| Name, Year of Birth, Year Elected and Number of Funds Overseen | Principal Occupation(s) Other Directorships Held by Trustee | |
Oates, James M. YOB: 1946 Elected: 2000 70 Portfolios | Managing Director (since 1994), Wydown Group (consulting firm). Director (since 2016), The Zweig Fund and Virtus Global Dividend & Income Fund Inc.; Trustee (since 2016) Virtus Variable Insurance Trust (9 portfolios); Trustee/Director (since 2013), Virtus Closed-End Funds (3 funds); Trustee (since 2013), Virtus Alternative Solutions Trust (4 portfolios); Chairman and Trustee (since 2005), John Hancock Fund Complex (228 portfolios); Director (2002 to 2014), New Hampshire Trust Company; Chairman (since 2000), Emerson Investment Management, Inc.; Non-Executive Chairman (2000 to 2014), Hudson Castle Group, Inc. (formerly IBEX Capital Markets, Inc.) (financial services) Chairman and Director (1999 to 2014), Connecticut River Bank; Director (since 1996), Stifel Financial; and Trustee (since 1987), Virtus Mutual Fund Complex (52 portfolios). | |
Segerson, Richard E. YOB: 1948 Elected: 2000 65 Portfolios | Retired; and Managing Director (1998 to 2013), Northway Management Company. Trustee (since 2016) Virtus Alternative Solutions Trust (4 portfolios) and Virtus Variable Insurance Trust (9 portfolios); and Trustee (since 1983), Virtus Mutual Fund Complex (52 portfolios). | |
Verdonck, Ferdinand L.J. YOB: 1942 Elected: 2005 65 Portfolios | Vice Chairman (since 2014), Affirmed Therapeutics (biotechnology); Director (1998 to 2015), The J.P. Morgan Continental European Investment Trust; Director (2005 to 2013), Galapagos N.V. (biotechnology); Director (1998 to 2015) Groupe SNEF; and Mr. Verdonck is also a director of several non-U.S. companies. Trustee (since 2016) Virtus Variable Insurance Trust (9 portfolios) and Virtus Alternative Solutions Trust (4 portfolios); and Trustee (since 2002), Virtus Mutual Fund Complex (52 portfolios). |
Interested Trustee
The individual listed below is an “interested person” of the Trust, as defined in Section 2(a)(19) of the 1940 Act, as amended, and the rules and regulations thereunder.
| Name, Year of Birth, Year Elected and Number of Funds Overseen | Principal Occupation(s) During Past 5 Years and | |
Aylward, George R.* Trustee and President YOB: 1964 Elected: 2006 70 Portfolios | Director, President and Chief Executive Officer (since 2008), Virtus Investment Partners, Inc. and/or certain of its subsidiaries; various senior officer positions with Virtus affiliates (since 2005). Chairman and Trustee (since 2015), Virtus ETF Trust II; Trustee and President (since 2013), Virtus Alternative Solutions Trust (4 portfolios); Director (since 2013), Virtus Global Funds, PLC (2 portfolios); Trustee (since 2012) and President (since 2010), Virtus Variable Insurance Trust (9 portfolios); Trustee and President (since 2011), Virtus Closed-End Funds (3 funds); Trustee (since 2006), Virtus Mutual Funds (52 portfolios); and Director, President and Chief Executive Officer (since 2006), The Zweig Fund and Virtus Global Dividend & Income Fund Inc. |
35
Table of Contents
FUND MANAGEMENT TABLES (UNAUDITED) (Continued)
Officers of the Trust Who Are Not Trustees
Name, Address and Year of Birth | Position(s) Held with Time Served | Principal Occupation(s) During Past 5 Years | ||
Bradley, W. Patrick YOB: 1972 | Executive Vice President (since 2016); Senior Vice President (2013 to 2016); Vice President (2011 to 2013); Chief Financial Officer and Treasurer (since 2006). | Executive Vice President, Fund Services (since 2016), Senior Vice President, Fund Services (2010 to 2016), Virtus Investment Partners, Inc. and/or certain of its subsidiaries; various officer positions (since 2006) with Virtus affiliates; Executive Vice President (since 2016), Senior Vice President (2013 to 2016), Vice President (2011 to 2013), Chief Financial Officer and Treasurer (since 2004), Virtus Variable Insurance Trust; Executive Vice President (since 2016), Senior Vice President (2013 to 2016), Vice President (2011 to 2013), Chief Financial Officer and Treasurer (since 2006), Virtus Mutual Fund Complex; Executive Vice President (since 2016), Senior Vice President (2013 to 2016), Vice President (2012 to 2013) and Treasurer (Chief Financial Officer) (since 2007), The Zweig Fund and Virtus Global Dividend & Income Fund Inc.; Executive Vice President (since 2016), Senior Vice President (2013 to 2016), Vice President (2011 to 2013), Chief Financial Officer and Treasurer (since 2011), Virtus Closed-End Funds; Vice President and Assistant Treasurer (since 2011), Duff & Phelps Global Utility Income Fund Inc.; Director (since 2013), Virtus Global Funds, PLC; and Executive Vice President (since 2016), Senior Vice President, Chief Financial Officer and Treasurer (2013 to 2016), Virtus Alternative Solutions Trust. | ||
Carr, Kevin J. YOB: 1954 | Senior Vice President (since 2013); Vice President (2005 to 2013); Chief Legal Officer, Counsel and Secretary (since 2005). | Senior Vice President (since 2009), Vice President, Counsel and Secretary (2008 to 2009), Virtus Investment Partners, Inc. and/or certain of its subsidiaries; various senior officer positions (since 2005) with Virtus affiliates; Senior Vice President (since 2013), Vice President (2005 to 2013), Chief Legal Officer, Counsel and Secretary (since 2005), Virtus Mutual Fund Complex; Senior Vice President (2013 to 2014), Vice President (2012 to 2013) and Assistant Secretary (since 2012), Secretary and Chief Legal Officer (2005 to 2012), The Zweig Fund and Virtus Global Dividend & Income Fund Inc.; Assistant Secretary (since 2013), Vice President, Chief Legal Officer, Counsel and Secretary (2010 to 2013), Virtus Variable Insurance Trust; Vice President and Assistant Secretary (since 2011), Duff & Phelps Global Utility Income Fund Inc.; Senior Vice President and Assistant Secretary (2013 to 2014), Vice President and Assistant Secretary (2012 to 2013), Vice President, Chief Legal Officer, Counsel and Secretary (2011 to 2012), Virtus Closed-End Funds; and Assistant Secretary (since 2013), Virtus Alternative Solutions Trust. |
36
Table of Contents
FUND MANAGEMENT TABLES (UNAUDITED) (Continued)
Officers of the Trust Who Are Not Trustees (Continued)
Name, Address and Year of Birth | Position(s) Held with Time Served | Principal Occupation(s) During Past 5 Years | ||
Engberg, Nancy J. YOB: 1956 | Vice President and Chief Compliance Officer since 2011. | Vice President (since 2008) and Chief Compliance Officer (2008 to 2011 and since 2016), Virtus Investment Partners, Inc. and/or certain of its subsidiaries; various officer positions (since 2003) with Virtus affiliates; Vice President and Chief Compliance Officer (since 2011), Virtus Mutual Fund Complex; Vice President (since 2010) and Chief Compliance Officer (since 2011), Virtus Variable Insurance Trust; Vice President and Chief Compliance Officer (since 2011), Virtus Closed-End Funds; Vice President and Chief Compliance Officer (since 2012), The Zweig Fund and Virtus Global Dividend & Income Fund Inc.; Vice President and Chief Compliance Officer (since 2013), Virtus Alternative Solutions Trust; Chief Compliance Officer (since 2015), ETFis Series Trust I; and Chief Compliance Officer (since 2015), Virtus ETF Trust II. | ||
Waltman, Francis G. YOB: 1962 | Executive Vice President (since 2013); Senior Vice President (2008-2013). | Executive Vice President, Product Development (since 2009), Virtus Investment Partners, Inc. and/or certain of its subsidiaries; various senior officer positions (since 2006) with Virtus affiliates; Executive Vice President (since 2013), Senior Vice President (2008 to 2013), Virtus Mutual Fund Complex; Executive Vice President (since 2013), Senior Vice President (2010 to 2013), Virtus Variable Insurance Trust; Executive Vice President (since 2013), Senior Vice President (2011 to 2013), Virtus Closed-End Funds; Director (since 2013), Virtus Global Funds PLC; and Executive Vice President (since 2013), Virtus Alternative Solutions Trust. |
37
Table of Contents
VIRTUS OPPORTUNITIES TRUST
101 Munson Street
Greenfield, MA 01301-9668
Trustees
George R. Aylward
Thomas J. Brown
Donald C. Burke
Roger A. Gelfenbein
John R. Mallin
Hassell H. McClellan
Philip R. McLoughlin, Chairman
Geraldine M. McNamara
James M. Oates
Richard E. Segerson
Ferdinand L.J. Verdonck
Officers
George R. Aylward, President
Francis G. Waltman, Executive Vice President
W. Patrick Bradley, Executive Vice President, Chief Financial Officer and Treasurer
Kevin J. Carr, Senior Vice President, Chief Legal Officer, Counsel and Secretary
Nancy J. Engberg, Vice President and Chief Compliance Officer
Investment Adviser
Virtus Investment Advisers, Inc.
100 Pearl Street
Hartford, CT 06103-4506
Principal Underwriter
VP Distributors, LLC
100 Pearl Street
Hartford, CT 06103-4506
Administrator and Transfer Agent
Virtus Fund Services, LLC
100 Pearl Street
Hartford, CT 06103-4506
Custodian
JPMorgan Chase Bank, NA
1 Chase Manhattan Plaza
New York, NY 10005-1401
Independent Registered Public Accounting Firm
PricewaterhouseCoopers LLP
2001 Market Street
Philadelphia, PA 19103-7042
How to Contact Us
Mutual Fund Services | 1-800-243-1574 | |||
Adviser Consulting Group | 1-800-243-4361 | |||
Website | Virtus.com |
Important Notice to Shareholders
The Securities and Exchange Commission has modified mailing regulations for semiannual and annual shareholder fund reports to allow mutual fund companies to send a single copy of these reports to shareholders who share the same mailing address. If you would like additional copies, please call Mutual Fund Services at 1-800-243-1574.
Table of Contents
For more information about
Virtus Mutual Funds, please call
your financial representative, or
contact us at 1-800-243-1574
or Virtus.com
| 8009 | 11-16 |

P.O. Box 9874
Providence, RI 02940-8074
Table of Contents

ANNUAL REPORT
Virtus Foreign Opportunities Fund
September 30, 2016
TRUST NAME: VIRTUS OPPORTUNITIES TRUST
Not FDIC Insured
No Bank Guarantee
May Lose Value

Table of Contents
Virtus Foreign Opportunities Fund
(“Foreign Opportunities Fund”)
| 1 | ||||
| 2 | ||||
| 4 | ||||
| 6 | ||||
| 10 | ||||
| 12 | ||||
| 13 | ||||
| 14 | ||||
| 16 | ||||
| 20 | ||||
| 30 | ||||
| 31 | ||||
| 32 | ||||
| 34 |
PROXY VOTING PROCEDURES AND VOTING RECORD (FORM N-PX)
The subadviser votes proxies relating to portfolio securities in accordance with procedures that have been approved by the Board of Trustees of the Trust (“Trustees,” or the “Board”). You may obtain a description of these procedures, along with information regarding how the Fund voted proxies during the most recent 12-month period ended June 30, free of charge, by calling toll-free 1-800-243-1574. This information is also available through the Securities and Exchange Commission’s (the “SEC”) website at http://www.sec.gov.
FORM N-Q INFORMATION
The Trust files a complete schedule of portfolio holdings for the Fund with the SEC for the first and third quarters of each fiscal year on Form N-Q. Form N-Q is available on the SEC’s website at http://www.sec.gov. Form N-Q may be reviewed and copied at the SEC’s Public Reference Room. Information on the operation of the SEC’s Public Reference Room can be obtained by calling toll-free 1-800-SEC-0330.
This report is not authorized for distribution to prospective investors in the Virtus Foreign Opportunities Fund unless preceded or accompanied by an effective prospectus which includes information concerning the sales charge, the Fund’s record and other pertinent information.
Table of Contents
To My Fellow Shareholders of Virtus Mutual Funds:
 | I am pleased to present this annual report that reviews the performance of your fund for the 12 months ended September 30, 2016.
During the first half of the fiscal year, global equity markets were challenged by falling oil prices, China’s slowdown, and concerns over the Federal Reserve’s (“the Fed”) first rate hike in nine years, which occurred in December 2015. Equities plummeted in early 2016, but stabilizing oil prices and the Fed’s softened stance on further rate hikes for 2016 sparked a rally in mid-February that lasted until June. The U.K.’s June 23 “Brexit” decision to leave the European Union triggered a selloff that was largely short-lived. Calm was restored by better-than-expected corporate earnings, an improving global economic picture, and reassurance that the world’s central banks would continue to provide monetary stimulus. By | |
the end of September, U.S. equity markets had recovered much of their losses, and the 12-month period was positive for many asset classes.
For the 12 months ended September 30, 2016, U.S. small-cap stocks kept pace with U.S. large-cap stocks, as measured by the 15.47% and 15.43% returns of the Russell 2000® Index and S&P 500® Index, respectively. Within international equities, emerging markets significantly outperformed their developed peers, with the MSCI Emerging Markets Index (net) up 16.78%, while the MSCI EAFE® Index (net) returned 6.52%.
Demand for U.S. Treasuries remained strong, driven by foreign investors seeking safe havens and yield in light of the negative interest rate environment in many international economies. On September 30, 2016, the benchmark 10-year U.S. Treasury yielded 1.60% compared with 2.06% one year earlier. For the 12 months ended September 30, 2016, the broader U.S. fixed income market, as represented by the Bloomberg Barclays U.S. Aggregate Bond Index, which tracks Treasuries and other investment-grade debt securities, gained 5.19%, while non-investment grade bonds rose 12.73%, as measured by the Bloomberg Barclays U.S. Corporate High Yield Bond Index.
The strength of the global economy will likely remain a leading concern for markets in the months ahead, and investors will watch with great interest the actions of the Fed and other major central banks. The U.S. economy’s continued growth, as evidenced by recent strong jobs, housing, and consumer spending data, should give investors reason for optimism, but future market direction will be determined largely by the ability of corporations to continue to produce robust earnings.
Market uncertainty is an ever-present reminder of the importance of portfolio diversification, including exposure to both traditional and alternative asset classes. While diversification cannot guarantee a profit or prevent a loss, owning a variety of asset classes may cushion your portfolio against inevitable market fluctuations. Your financial advisor can help you ensure that your portfolio is adequately diversified across asset classes and investment strategies.
As always, thank you for entrusting Virtus with your assets. Should you have questions about your account or require assistance, please visit our website at Virtus.com, or call our customer service team at 1-800-243-1574. We appreciate your business and remain committed to your long-term financial success. | ||
Sincerely,
George R. Aylward President, Virtus Mutual Funds
October 2016
Performance data quoted represents past results. Past performance is no guarantee of future results, and current performance may be higher or lower than the performance shown above. | ||

1
Table of Contents
VIRTUS FOREIGN OPPORTUNITIES FUND
DISCLOSURE OF FUND EXPENSES (Unaudited)
FOR THE SIX-MONTH PERIOD OF APRIL 1, 2016 TO SEPTEMBER 30, 2016
We believe it is important for you to understand the impact of costs on your investment. All mutual funds have operating expenses. As a shareholder of the Virtus Foreign Opportunities Fund (the “Fund”) you may incur two types of costs: (1) transaction costs, including sales charges on purchases of Class A shares and contingent deferred sales charges on Class C shares; and (2) ongoing costs, including investment advisory fees, distribution and service fees, and other expenses. Class I shares and Class R6 shares are sold without a sales charge and do not incur distribution and service fees. For further information regarding applicable sales charges, see Note 1 in the Notes to Financial Statements. These examples are intended to help you understand your ongoing costs (in dollars) of investing in the Fund and to compare these costs with the ongoing costs of investing in other mutual funds. These examples are based on an investment of $1,000 invested at the beginning of the period and held for the entire six-month period. The following Expense Table illustrates your Fund’s costs in two ways.
Actual Expenses
The first section of the accompanying table provides information about actual account values and actual expenses. You may use the information in this section, together with the amount you invested, to estimate the expenses that you paid over the period. Simply divide your account value by $1,000 (for example, an $8,600 account value divided by $1,000 = 8.6), then multiply the result by the number in the first section under the heading “Expenses Paid During Period” to estimate the expenses you paid on your account during the period.
Hypothetical Example for Comparison Purposes
The second section of the accompanying table provides information about hypothetical account values and hypothetical expenses based on the Fund’s actual expense ratio and an assumed rate of return of 5% per year before expenses, which is not your Fund’s actual return. The hypothetical account values and expenses may not be used to estimate the actual ending account balance or expenses you paid for the period. You may use this information to compare the ongoing costs of investing in your Fund and other funds. To do so, compare these 5% hypothetical examples with the 5% hypothetical examples that appear in the shareholder reports of the other funds.
Please note that the expenses shown in the accompanying table are meant to highlight your ongoing costs only and do not reflect any transactional costs, such as sales charges or contingent deferred sales charges. Therefore, the second section of the accompanying table is useful in comparing ongoing costs only, and will not help you determine the relative total costs of owning different funds. In addition, if these transactional costs were included, your costs would have been higher. The calculations assume no shares were bought or sold during the period. Your actual costs may have been higher or lower, depending on the amount of your investment and the timing of any purchases or redemptions.
2
Table of Contents
VIRTUS FOREIGN OPPORTUNITIES FUND
DISCLOSURE OF FUND EXPENSES (Unaudited) (Continued)
FOR THE SIX-MONTH PERIOD OF APRIL 1, 2016 TO SEPTEMBER 30, 2016
| Expense Table | ||||||||||||||||
Beginning April 1, 2016 | Ending September 30, 2016 | Annualized Expense Ratio | Expenses Paid During Period* | |||||||||||||
Actual | ||||||||||||||||
Class A | $ | 1,000.00 | $ | 1,037.70 | 1.46 | % | $ | 7.44 | ||||||||
Class C | 1,000.00 | 1,034.00 | 2.21 | 11.24 | ||||||||||||
Class I | 1,000.00 | 1,039.20 | 1.21 | 6.17 | ||||||||||||
| Class R6 | 1,000.00 | 1,039.80 | 1.11 | 5.66 | ||||||||||||
Hypothetical (5% return before expenses) |
| |||||||||||||||
Class A | 1,000.00 | 1,017.70 | 1.46 | 7.36 | ||||||||||||
Class C | 1,000.00 | 1,013.95 | 2.21 | 11.13 | ||||||||||||
Class I | 1,000.00 | 1,018.95 | 1.21 | 6.11 | ||||||||||||
| Class R6 | 1,000.00 | 1,019.45 | 1.11 | 5.60 | ||||||||||||
| * | Expenses are equal to the Fund’s annualized expense ratio, which is net of waived fees and reimbursed expenses, if applicable, multiplied by the average account value over the period, multiplied by the number of days (183) expenses were accrued in the most recent fiscal half-year, then divided by 366 to reflect the one-half year period. |
| The Fund may invest in other funds, and the annualized expense ratios noted above do not reflect fees and expenses associated with the underlying funds. If such fees and expenses were included, the expenses would have been higher. |
| You can find more information about the Fund’s expenses in the Financial Statements section that follows. For additional information on operating expenses and other shareholder costs, refer to the prospectus. |
3
Table of Contents
VIRTUS FOREIGN OPPORTUNITIES FUND
SEPTEMBER 30, 2016 (Unaudited)
American Depositary Receipt (ADR)
Represents shares of foreign companies traded in U.S. dollars on U.S. exchanges that are held by a U.S. bank or trust. Foreign companies use ADRs in order to make it easier for Americans to buy their shares.
Bloomberg Barclays U.S. Aggregate Bond Index
The Bloomberg Barclays U.S. Aggregate Bond Index measures the U.S. investment grade fixed rate bond market. The index is calculated on a total return basis. The index is unmanaged its returns do not reflect any fees, expenses, or sales charges, and it is not available for direct investment.
Bloomberg Barclays U.S. Corporate High Yield Bond Index
The Bloomberg Barclays U.S. Corporate High Yield Bond Index measures the U.S. dollar-denominated, high yield, fixed-rate corporate bond market. The index is calculated on a total return basis. The index is unmanaged, its returns do not reflect any fees, expenses, or sales charges, and it is not available for direct investment.
European Central Bank (“ECB”)
The European Central Bank (ECB) is responsible for conducting monetary policy for the eurozone. The ECB was established as the core of the Eurosystem and the European System of Central Banks (ESCB). The ESCB comprises the ECB and the national central banks (NCBs) of all 17 European Union Member States whether they have adopted the Euro or not.
Federal Reserve (the “Fed”)
The Central Bank of the United States, responsible for controlling the money supply, interest rates and credit with the goal of keeping the U.S. economy and currency stable. Governed by a seven-member board, the system includes 12 regional Federal Reserve Banks, 25 branches and all national and state banks that are part of the system.
MSCI EAFE® Index (net)
A free float-adjusted market capitalization-weighted index that measures developed foreign market equity performance, excluding the U.S. and Canada. The index is calculated on a total return basis with net dividends reinvested. The index is unmanaged its returns do not reflect any fees, expenses, or sales charges, and it is not available for direct investment.
MSCI Emerging Markets Index (net)
The MSCI Emerging Markets Index (net) is a free float-adjusted market capitalization-weighted index designed to measure equity market performance in the global emerging markets. The index is calculated on a total return basis with net dividends reinvested. The index is unmanaged, its returns do not reflect any fees, expenses, or sales charges, and it is not available for direct investment.
Real Estate Investment Trust (REIT)
A publicly traded company that owns, develops, and operates income producing real estate such as apartments, office buildings, hotels, shopping centers, and other commercial properties.
4
Table of Contents
VIRTUS FOREIGN OPPORTUNITIES FUND
KEY INVESTMENT TERMS (Continued)
SEPTEMBER 30, 2016 (Unaudited)
Russell 2000® Index
The Russell 2000® Index is a market capitalization-weighted index of the 2,000 smallest companies in the Russell Universe, which comprises the 3,000 largest U.S. companies. The index is calculated on a total return basis with dividends reinvested. The index is unmanaged, its returns do not reflect any fees, expenses, or sales charges, and is not available for direct investment.
S&P 500® Index
The S&P 500® Index is a free-float market capitalization-weighted index of 500 of the largest U.S. companies. The index is calculated on a total return basis with dividends reinvested. The index is unmanaged its returns do not reflect any fees, expenses, or sales charges, and it is not available for direct investment.
5
Table of Contents
VIRTUS FOREIGN OPPORTUNITIES FUND
Fund Summary Portfolio Manager Commentary by Vontobel Asset Management, Inc. | Ticker Symbols: Class A: JVIAX Class C: JVICX Class R6: VFOPX Class I: JVXIX |
| ¢ | The Fund is diversified and has an investment objective of long-term capital appreciation. |
| ¢ | For the fiscal year ended September 30, 2016, the Fund’s Class A shares at NAV returned 9.77%, Class C shares returned 8.94%, Class I shares returned 10.05%, and Class R6 shares returned 10.16%. For the fiscal year, the MSCI EAFE® Index (net), which serves as the Fund’s the broad-based and style-specific index appropriate for comparison, returned 6.52%. |
All performance figures assume reinvestment of distribution and exclude the effect of sales charges. Past performance is no guarantee of future results, and current performance may be higher or lower than the performance shown.
How did the market perform during the Fund’s fiscal year?
The performance of the MSCI EAFE® Index was positive in the first quarter of the Fund’s fiscal year, negative in the second and third quarters, and positive in the fourth quarter.
Global equity markets were generally positive throughout the fiscal year, with emerging markets outperforming their developed market counterparts. After posting slightly positive results in the fourth quarter of 2015, emerging market equities rebounded early in 2016, driven by stronger commodity prices, a sharp rise in many emerging market currencies, and lower expectations for U.S. interest rate increases. The rally reversed in May as investors digested waning commodities prices and the prospect of a U.S. rate hike. Emerging markets rebounded again over the summer as lower-than-expected interest rates in the United States continued to support demand for higher-yielding assets in the emerging world. Improved capital flows helped some emerging market currencies recover lost ground relative to the U.S. dollar, and stabilizing commodity prices helped a number of markets.
In the fourth quarter of 2015, the European Central Bank (“ECB”) announced stimulus and cut its deposit rate by 0.10% to -0.3%, which was on the lower end of expectations and disappointed markets. In the first quarter of 2016, the ECB announced a stimulus package that lowered its main policy rates and expanded its asset purchase program. While the package exceeded investors’ expectations, ECB President Mario Draghi hinted that future hikes were unlikely to be forthcoming, which drove European stocks down. Economic data signaled that the eurozone economy continued to grow, albeit slowly. In the second quarter of 2016, European equity markets gained momentum with a weaker euro, encouraging macroeconomic data, and hopes for a new debt deal with Greece. On June 23, the U.K.’s unexpected vote to exit the European Union (“Brexit”) shocked financial markets, prompting increased volatility with a sell-off in global risk assets, rallies in safe-haven assets, and a sharp decline in the British pound against its major trading currencies. However, most global equity market indices recovered some of their losses in the few trading days after the Brexit decision. In the third quarter of 2016, European markets were bolstered by a rapid recovery from the Brexit sell-off and a generally optimistic earnings reporting season for the second quarter of 2016.
What factors affected the Fund’s performance during its fiscal year?
The following discussion highlights the specific stocks that provided the largest contributions to the Fund’s performance and those that were the largest detractors. As bottom-up stock pickers, we hope that investors find this useful and gain a greater understanding of how we invest their capital.
Stocks that Helped Absolute Performance
| ¢ | Philip Morris International (“PMI”) (U.S.) – Investors were drawn to the company which |
For information regarding the indexes and certain investment terms, see Key Investment Terms starting on page 4.
6
Table of Contents
| VIRTUS FOREIGN OPPORTUNITIES FUND (Continued) |
continued to perform well. PMI produces and sells cigarettes under brands such as Marlboro and L&M. In our opinion as of the end of the Fund’s fiscal year, the company continues to have strong pricing power, leading brands, consistent constant currency earnings growth, opportunities for cost savings, and a large dividend. The company also has been investing behind next generation products such as its heat-not-burn device, iQos. |
| ¢ | British American Tobacco (“BAT”) (U.K.) – With its stability and consistency of earnings, BAT was also a top contributor to Fund performance. While based in the U.K., its earnings typically come from outside the U.K. Currency, after years of being a headwind, turned into a tailwind due to favorable currency translation as BAT reports its earnings in British pounds. The company also reported solid numbers for the first quarter of 2016, again, highlighting its strong business model even in volatile markets. BAT is one of the world’s largest tobacco companies, with market leadership in more than 50 of the 180 markets in which it operates. Nearly 60% of the company’s revenue and over 70% of volumes have been generated from emerging markets. It has great global brands including Dunhill, Kent, Lucky Strike, Pall Mall, and Rothmans. As of the end of the Fund’s fiscal year, we believe the company should be able to deliver consistent high single-digit earnings growth in constant currencies as it has strong pricing power, and opportunities to increase margins through cost saving measures, while paying a very hefty dividend. |
Stocks that Hurt Absolute Performance
| ¢ | Persimmon (U.K.) – Even though Persimmon was a bottom performer for the year, as of the end of the Fund’s fiscal year we continue to like the company and believe it’s a strong business in a fundamentally strong industry in the U.K. However, due to the uncertainty around the effects of Brexit, concerns around continued volume growth, and pricing of new |
home sales in the U.K., it is difficult to analyze the company in the near and medium term. As a result, we sold the stock. |
| ¢ | Lloyds Banking Group (U.K.) – Following the Brexit referendum, Lloyds’ stock sold off in the last few days of June, as the resulting uncertainty raised the chances that the U.K. will slide into a recession. As of the end of the Fund’s fiscal year we continue to like Lloyds’ competitive position in the concentrated U.K. banking market. As the largest U.K. retail bank, Lloyds enjoys substantial economies of scale, with operations comprised of simple retail and commercial businesses. However, the macroeconomic environment will be challenging, as both consumer and business confidence will suffer from the uncertainty surrounding the U.K.’s relationship with the European Union. |
The preceding information is the opinion of portfolio management only through the end of the period stated on the cover. Any such opinions are subject to change at any time based upon market or other conditions and should not be relied upon as investment advice. Past performance is no guarantee of future results, and there is no guarantee that market forecasts will be realized.
Past performance is not indicative of future results. Any performance results portrayed reflect the reinvestment of dividends and other earnings. Any companies described in this commentary may or may not currently represent a position in the subadviser’s client portfolios. Also, any sector and industry weights described in the commentary may or may not have changed since the writing of this commentary. The information and methodology described in this commentary should not be construed as a recommendation to purchase or sell securities.
Any projections, forecasts or estimates contained in this commentary are based on a variety of estimates and assumptions. There can be no assurance that the estimates or
For information regarding the indexes and certain investment terms, see the Key Investment Terms on page 4.
7
Table of Contents
| VIRTUS FOREIGN OPPORTUNITIES FUND (Continued) |
assumptions made will prove accurate, and actual results may differ materially.
In the event a company described in this commentary is a position in the subadviser’s client portfolios, the securities identified and described do not represent all of the securities purchased, sold or recommended. The reader should not assume that an investment in any securities identified was or will be profitable or that investment recommendations or investment decisions we make in the future will be profitable.
There is no guarantee that the Fund will meet its objective.
Equity Securities: The market price of equity securities may be adversely affected by financial market, industry, or issuer-specific events. Focus on a particular style or on small or medium-sized companies may enhance that risk.
Foreign & Emerging Markets: Investing internationally, especially in emerging markets, involves additional risks such as currency, political, accounting, economic, and market risk.
Industry/Sector Concentration: A fund that focuses its investments in a particular industry or sector will be more sensitive to conditions that affect that industry or sector than a non-concentrated fund.
Prospectus: For additional information on risks, please see the fund’s prospectus.
| Asset Allocations | ||||
The following table presents asset allocations within certain sectors and as a percentage of total investments as of September 30, 2016.
|
| |||
Consumer Staples | 41 | % | ||
Information Technology | 15 | |||
Consumer Discretionary | 13 | |||
Health Care | 12 | |||
Financials | 12 | |||
Industrials | 6 | |||
Real Estate | 1 | |||
|
| |||
Total | 100 | % | ||
|
| |||
For information regarding the indexes and certain investment terms, see the Key Investment Terms on page 4.
8
Table of Contents
| VIRTUS FOREIGN OPPORTUNITIES FUND (Continued) |
| Average Annual Total Returns1 for periods ended 9/30/16 | ||||||||||||||||||||
1 Year | 5 Years | 10 Years | Since Inception | Inception Date | ||||||||||||||||
| Class A Shares at NAV2 | 9.77 | % | 8.41 | % | 3.90 | % | — | — | ||||||||||||
| Class A Shares at POP3,4 | 3.46 | 7.14 | 3.29 | — | — | |||||||||||||||
| Class C Shares at NAV2 and with CDSC4 | 8.94 | 7.61 | 3.12 | — | — | |||||||||||||||
| Class I Shares at NAV2 | 10.05 | 8.69 | 4.18 | — | — | |||||||||||||||
| Class R6 Shares at NAV2 | 10.16 | — | — | 3.10 | % | 11/14/14 | ||||||||||||||
| MSCI EAFE® Index (net)* | 6.52 | 7.39 | 1.82 | -0.46 | 5 | — | ||||||||||||||
| S&P 500® Index* | 15.43 | 16.37 | 7.24 | 5.56 | 5 | — | ||||||||||||||
Fund Expense Ratios6: A Shares: 1.41%; C Shares: 2.16%; I Shares: 1.16%; R6 Shares: 1.05%.
All returns represent past performance which is no guarantee of future results. Current performance may be higher or lower than the performance shown. The investment return and principal value of an investment will fluctuate so that an investor’s shares, when redeemed, may be worth more or less than their original cost. The above table and graph below do not reflect the deduction of taxes that a shareholder would pay on fund distributions or the redemption of fund shares. Please visit Virtus.com for performance data current to the most recent month-end.
| 1 | Total returns are historical and include changes in share price and the reinvestment of both dividends and capital gains distributions. |
| 2 | “NAV” (Net Asset Value) total returns do not include the effect of any sales charge. |
| 3 | “POP” (Public Offering Price) total returns include the effect of the maximum front-end 5.75% sales charge. |
| 4 | “CDSC” (contingent deferred sales charge) is applied to redemptions of certain classes of shares that do not have a sales charge applied at the time of purchase. CDSC charges for certain redemptions of Class A shares made within 18 months of purchases in which a finder’s fee was paid and all Class C shares are 1% within the first year and 0% thereafter. |
| 5 | The since inception index returns are from the inception date of Class R6 shares. |
| 6 | The expense ratios of the Fund are set forth according to the prospectus for the Fund effective January 28, 2016, as supplemented and revised, and may differ from the expense ratios disclosed in the Financial Highlights tables in this report. See the Financial Highlights for more current expense ratios. |
| * | The MSCI EAFE® Index (net) is an appropriate Broad Based Index. |
| * | The Fund is no longer using the S&P 500® Index. |
Growth of $10,000 for periods ended 9/30
This chart assumes an initial investment of $10,000 made on September 30, 2006, for Class A, Class C and Class I shares including any applicable sales charges or fees. Performance assumes reinvestment of dividends and capital gain distributions.
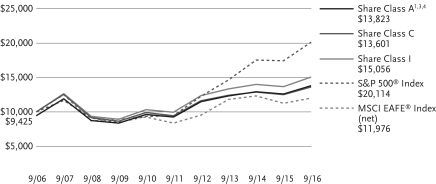
The indexes are unmanaged and not available for direct investment; therefore, their performance does not reflect the expenses associated with active management of an actual portfolio.
9
Table of Contents
VIRTUS FOREIGN OPPORTUNITIES FUND
SEPTEMBER 30, 2016
($ reported in thousands)
| SHARES | VALUE | |||||||
| COMMON STOCKS—98.9% | ||||||||
| Consumer Discretionary—12.7% | ||||||||
Alimentation Couche –Tard, Inc. Class B (Canada) | 672,132 | $ | 32,573 | |||||
Domino’s Pizza Group plc (United Kingdom) | 4,179,840 | 20,235 | ||||||
Hermes International SA (France) | 36,011 | 14,654 | ||||||
Naspers Ltd. Class N (South Africa) | 210,717 | 36,473 | ||||||
Paddy Power Betfair plc (Ireland) | 180,949 | 20,469 | ||||||
Priceline Group, Inc. (The) (United States)(2) | 20,737 | 30,514 | ||||||
Shimano, Inc. (Japan) | 95,100 | 14,125 | ||||||
Sodexo SA (France) | 127,605 | 15,195 | ||||||
|
| |||||||
| 184,238 | ||||||||
|
| |||||||
| Consumer Staples—40.1% | ||||||||
Anheuser-Busch InBev N.V. (Belgium) | 220,839 | 28,926 | ||||||
British American Tobacco plc (United Kingdom) | 1,323,671 | 84,582 | ||||||
Chocoladefabrike Lindt & Spruengli AG (Switzerland) | 4,214 | 24,356 | ||||||
Diageo plc (United Kingdom) | 861,544 | 24,684 | ||||||
Imperial Brands plc (United Kingdom) | 675,643 | 34,797 | ||||||
ITC Ltd. (India) | 3,810,702 | 13,829 | ||||||
Japan Tobacco, Inc. (Japan) | 623,200 | 25,511 | ||||||
L’Oreal SA (France) | 118,238 | 22,328 | ||||||
Nestle S.A. Registered Shares (Switzerland) | 736,180 | 58,008 | ||||||
Philip Morris International, Inc. (United States) | 800,299 | 77,805 | ||||||
Reckitt Benckiser Group plc (United Kingdom) | 722,969 | 68,078 | ||||||
SABMiller plc (United Kingdom) | 569,994 | 33,209 | ||||||
| SHARES | VALUE | |||||||
| Consumer Staples (continued) | ||||||||
Unicharm Corp. (Japan) | 1,000,300 | $ | 25,955 | |||||
Unilever N.V. CVA (Netherlands) | 1,253,502 | 57,839 | ||||||
|
| |||||||
| 579,907 | ||||||||
|
| |||||||
| Financials—11.9% | ||||||||
Daito Trust Construction Co., Ltd. (Japan) | 155,300 | 24,839 | ||||||
Housing Development Finance Corp. (India) | 2,451,483 | 51,420 | ||||||
Housing Development Finance Corp. Bank Ltd. (India) | 3,898,167 | 74,646 | ||||||
Lloyds Banking Group plc (United Kingdom) | 10,249,583 | 7,247 | ||||||
UBS Group AG (Switzerland) | 1,009,625 | 13,749 | ||||||
|
| |||||||
| 171,901 | ||||||||
|
| |||||||
| Health Care—12.1% | ||||||||
Coloplast A/S Class B (Denmark) | 202,293 | 15,688 | ||||||
CSL Ltd. (Australia) | 297,073 | 24,429 | ||||||
Essilor International SA (France) | 166,076 | 21,417 | ||||||
Grifols SA (Spain) | 1,083,112 | 23,337 | ||||||
Novo Nordisk A/S Class B (Denmark) | 607,718 | 25,252 | ||||||
Ramsay Health Care Ltd. (Australia) | 260,603 | 15,857 | ||||||
Roche Holding AG (Switzerland) | 195,978 | 48,616 | ||||||
|
| |||||||
| 174,596 | ||||||||
|
| |||||||
| Industrials—5.6% | ||||||||
Aena SA (Spain)(3) | 160,990 | 23,746 | ||||||
Bureau Veritas SA (France) | 1,005,114 | 21,560 | ||||||
Canadian National Railway Co. (Canada) | 304,915 | 19,932 | ||||||
DCC plc (Ireland) | 175,535 | 15,983 | ||||||
|
| |||||||
| 81,221 | ||||||||
|
| |||||||
See Notes to Financial Statements
10
Table of Contents
VIRTUS FOREIGN OPPORTUNITIES FUND
SCHEDULE OF INVESTMENTS (Continued)
SEPTEMBER 30, 2016
($ reported in thousands)
| SHARES | VALUE | |||||||
| Information Technology—15.1% | ||||||||
Accenture plc Class A (United States) | 245,756 | $ | 30,024 | |||||
Alibaba Group Holding Ltd. Sponsored ADR (China)(2) | 288,850 | 30,557 | ||||||
Alphabet, Inc. Class C (United States)(2) | 59,285 | 46,082 | ||||||
MasterCard, Inc. Class A (United States) | 364,728 | 37,118 | ||||||
SAP SE (Germany) | 497,224 | 45,199 | ||||||
Tencent Holdings Ltd. (Cayman Islands) | 1,066,618 | 29,654 | ||||||
|
| |||||||
| 218,634 | ||||||||
|
| |||||||
| Real Estate—1.4% | ||||||||
Link REIT (The) (Hong Kong) | 2,656,907 | 19,613 | ||||||
| TOTAL COMMON STOCKS (Identified Cost $969,686) | 1,430,110 | |||||||
| TOTAL LONG TERM INVESTMENTS—98.9% | ||||||||
| (Identified Cost $969,686) | 1,430,110 | |||||||
| TOTAL INVESTMENTS—98.9% (Identified Cost $969,686) | 1,430,110(1) | |||||||
Other assets and liabilities, |
| 15,176 | ||||||
|
| |||||||
| NET ASSETS—100.0% | $ | 1,445,286 | ||||||
|
| |||||||
Abbreviations:
| ADR | American Depositary Receipt |
| REIT | Real Estate Investment Trust |
FOOTNOTE LEGEND:
| (1) | Federal Income Tax Information: For tax information at September 30, 2016, see Note 9 Federal Income Tax Information in the Notes to Financial Statements. |
| (2) | Non-income producing. |
| (3) | Security exempt from registration under Rule 144A of the Securities Act of 1933. These securities may be resold in transactions exempt from registration, normally to qualified institutional buyers. At September 30, 2016, these securities amounted to a value of $23,746 or 1.6% of net assets |
| Country Weightings (Unaudited)† | ||||
United Kingdom | 19 | % | ||
United States | 15 | |||
Switzerland | 10 | |||
India | 10 | |||
France | 7 | |||
Japan | 6 | |||
Netherlands | 4 | |||
Other | 29 | |||
Total | 100 | % | ||
| † | % of total investments as of September 30, 2016 |
The following table provides a summary of inputs used to value the Fund’s investments as of September 30, 2016 (See Security Valuation Note 2A in the Notes to Financial Statements):
| Total Value at September 30, 2016 | Level 1 Quoted Prices | Level 2 Significant Observable Inputs | ||||||||||
Equity Securities: | ||||||||||||
Common Stocks | $ | 1,430,110 | $ | 1,110,231 | $ | 319,879 | ||||||
|
|
|
|
|
| |||||||
Total Investments | $ | 1,430,110 | $ | 1,110,231 | $ | 319,879 | ||||||
|
|
|
|
|
| |||||||
There are no Level 3 (significant unobservable inputs) priced securities.
There were no transfers between Level 1 and Level 2 related to securities held as of September 30, 2016.
For information regarding the abbreviations, See Key Investment Terms starting on page 4
See Notes to Financial Statements
11
Table of Contents
VIRTUS FOREIGN OPPORTUNITIES FUND
STATEMENT OF ASSETS AND LIABILITIES
SEPTEMBER 30, 2016
(Reported in thousands except shares and per share amounts)
| Assets | ||||
Investment in securities at value(1) | $ | 1,430,110 | ||
Cash | 9,810 | |||
| Receivables | ||||
Investment securities sold | 21,831 | |||
Fund shares sold | 5,154 | |||
Dividends and interest receivable | 1,854 | |||
Tax reclaims | 4,401 | |||
Prepaid expenses | 62 | |||
Prepaid trustee retainer | 30 | |||
Other assets | 19 | |||
|
| |||
Total assets | 1,473,271 | |||
|
| |||
| Liabilities | ||||
| Payables | ||||
Fund shares repurchased | 2,474 | |||
Investment securities purchased | 23,646 | |||
Investment advisory fees | 1,012 | |||
Distribution and service fees | 170 | |||
Administration fees | 145 | |||
Transfer agent fees and expenses | 408 | |||
Trustees’ fees and expenses | 14 | |||
Professional fees | 35 | |||
Trustee deferred compensation plan | 19 | |||
Other accrued expenses | 62 | |||
|
| |||
Total liabilities | 27,985 | |||
|
| |||
| Net Assets | $ | 1,445,286 | ||
|
| |||
| Net Assets Consist of: | ||||
Capital paid in on shares of beneficial interest | $ | 1,169,308 | ||
Accumulated undistributed net investment income (loss) | 7,909 | |||
Accumulated undistributed net realized gain (loss) | (192,189 | ) | ||
Net unrealized appreciation (depreciation) on investments | 460,258 | |||
|
| |||
| Net Assets | $ | 1,445,286 | ||
|
| |||
| Class A | ||||
Net asset value (net assets/shares outstanding) per share | $ | 29.62 | ||
Maximum offering price per share NAV/(1–5.75%) | $ | 31.43 | ||
Shares of beneficial interest outstanding, $0.001 par value, unlimited authorization | 12,414,610 | |||
Net Assets | $ | 367,684 | ||
| Class C | ||||
Net asset value (net assets/shares outstanding) and offering price per share | $ | 29.23 | ||
Shares of beneficial interest outstanding, $0.001 par value, unlimited authorization | 3,837,182 | |||
Net Assets | $ | 112,180 | ||
| Class I | ||||
Net asset value (net assets/shares outstanding) and offering price per share | $ | 29.63 | ||
Shares of beneficial interest outstanding, $0.001 par value, unlimited authorization | 32,357,750 | |||
Net Assets | $ | 958,835 | ||
| Class R6 | ||||
Net asset value (net assets/shares outstanding) and offering price per share | $ | 29.63 | ||
Shares of beneficial interest outstanding, no par value, unlimited authorization | 222,301 | |||
Net Assets | $ | 6,587 | ||
(1) Investment in securities at cost | $ | 969,686 | ||
See Notes to Financial Statements
12
Table of Contents
VIRTUS FOREIGN OPPORTUNITIES FUND
YEAR ENDED SEPTEMBER 30, 2016
($ reported in thousands)
| Investment Income | ||||
Dividends | $ | 36,469 | ||
Interest | — | (1) | ||
Security lending, net of fees | 35 | |||
Foreign taxes withheld | (1,996 | ) | ||
|
| |||
Total investment income | 34,508 | |||
|
| |||
| Expenses | ||||
Investment advisory fees | 13,969 | |||
Service fees, Class A | 1,000 | |||
Distribution and service fees, Class C | 1,195 | |||
Administration fees | 2,068 | |||
Transfer agent fees and expenses | 2,529 | |||
Registration fees | 135 | |||
Printing fees and expenses | 391 | |||
Custodian fees | 149 | |||
Professional fees | 106 | |||
Trustees’ fees and expenses | 163 | |||
Miscellaneous expenses | 140 | |||
|
| |||
Total expenses | 21,845 | |||
Earnings credit from custodian | (74 | ) | ||
Low balance account fees | (3 | ) | ||
|
| |||
Net expenses | 21,768 | |||
|
| |||
| Net investment income (loss) | 12,740 | |||
|
| |||
| Net Realized and Unrealized Gain (Loss) on Investments | ||||
Net realized gain (loss) on investments | 54,341 | |||
Net realized gain (loss) on foreign currency transactions | 770 | |||
Net change in unrealized appreciation (depreciation) on investments | 91,254 | |||
Net change in unrealized appreciation (depreciation) on foreign currency translation | (27 | ) | ||
|
| |||
| Net gain (loss) on investments | 146,338 | |||
|
| |||
| Net increase (decrease) in net assets resulting from operations | $ | 159,078 | ||
|
|
| (1) | Amount is less than $500. |
See Notes to Financial Statements
13
Table of Contents
VIRTUS FOREIGN OPPORTUNITIES FUND
STATEMENTS OF CHANGES IN NET ASSETS
($ Reported in thousands)
| Year Ended September 30, 2016 | Year Ended September 30, 2015 | |||||||
| INCREASE/(DECREASE) IN NET ASSETS | ||||||||
| From Operations | ||||||||
Net investment income (loss) | $ | 12,740 | $ | 19,610 | ||||
Net realized gain (loss) | 55,111 | (54,757 | ) | |||||
Net change in unrealized appreciation (depreciation) | 91,227 | (7,892 | ) | |||||
|
|
|
| |||||
| Increase (decrease) in net assets resulting from operations | 159,078 | (43,039 | ) | |||||
|
|
|
| |||||
| From Distributions to Shareholders | ||||||||
Net investment income, Class A | (3,571 | ) | (4,099 | ) | ||||
Net investment income, Class C | (544 | ) | (244 | ) | ||||
Net investment income, Class I | (13,003 | ) | (14,754 | ) | ||||
Net investment income, Class R6 | (68 | ) | (22 | ) | ||||
|
|
|
| |||||
| Decrease in net assets from distributions to shareholders | (17,186 | ) | (19,119 | ) | ||||
|
|
|
| |||||
| From Share Transactions | ||||||||
| Sale of shares | ||||||||
Class A (2,270 and 3,683 shares, respectively) | 64,565 | 104,669 | ||||||
Class C (463 and 981 shares, respectively) | 12,947 | 27,884 | ||||||
Class I (12,573 and 13,604 shares, respectively) | 353,363 | 387,428 | ||||||
Class R6 (134 and 170 shares, respectively) | 3,639 | 4,966 | ||||||
| Reinvestment of distributions | ||||||||
Class A (117 and 133 shares, respectively) | 3,301 | 3,774 | ||||||
Class C (17 and 8 shares, respectively) | 484 | 211 | ||||||
Class I (432 and 488 shares, respectively) | 12,258 | 13,901 | ||||||
Class R6 (2 and 1 shares, respectively) | 68 | 22 | ||||||
| Shares repurchased | ||||||||
Class A (4,907 and 5,843 shares, respectively) | (139,993 | ) | (164,218 | ) | ||||
Class C (1,006 and 855 shares, respectively) | (28,344 | ) | (24,083 | ) | ||||
Class I (25,875 and 13,756 shares, respectively) | (736,620 | ) | (390,723 | ) | ||||
Class R6 (79 and 6 shares, respectively) | (2,122 | ) | (165 | ) | ||||
|
|
|
| |||||
| Increase (decrease) in net assets from share transactions | (456,454 | ) | (36,334 | ) | ||||
|
|
|
| |||||
| Net increase (decrease) in net assets | (314,562 | ) | (98,492 | ) | ||||
| Net Assets | ||||||||
Beginning of period | 1,759,848 | 1,858,340 | ||||||
|
|
|
| |||||
| End of period | $ | 1,445,286 | $ | 1,759,848 | ||||
|
|
|
| |||||
Accumulated undistributed net investment income (loss) at end of period | $ | 7,909 | $ | 11,585 | ||||
See Notes to Financial Statements
14
Table of Contents
THIS PAGE INTENTIONALLY BLANK.
Table of Contents
VIRTUS FOREIGN OPPORTUNITIES FUND
SELECTED DATA FOR A SHARE OUTSTANDING
THROUGHOUT EACH PERIOD
| Net Asset Value, Beginning of Period | Net Investment Income (Loss)(2) | Net Realized and Unrealized Gain (Loss) | Total from Investment Operations | Dividends from Net Investment Income | Total Distributions | Change in Net Asset Value | Net Asset Value, End of Period | |||||||||||||||||||||||||||||||||
Class A | ||||||||||||||||||||||||||||||||||||||||
10/1/15 to 9/30/16 | $ | 27.21 | | 0.19 | | 2.47 | 2.66 | (0.25 | ) | (0.25 | ) | 2.41 | $ | 29.62 | ||||||||||||||||||||||||||
10/1/14 to 9/30/15 | 28.12 | 0.25 | (0.92 | ) | (0.67 | ) | (0.24 | ) | (0.24 | ) | (0.91 | ) | 27.21 | |||||||||||||||||||||||||||
10/1/13 to 9/30/14 | 27.01 | 0.24 | 1.03 | 1.27 | (0.16 | ) | (0.16 | ) | 1.11 | 28.12 | ||||||||||||||||||||||||||||||
10/1/12 to 9/30/13 | 25.42 | 0.23 | 1.63 | 1.86 | (0.27 | ) | (0.27 | ) | 1.59 | 27.01 | ||||||||||||||||||||||||||||||
10/1/11 to 9/30/12 | 20.83 | 0.27 | 4.73 | 5.00 | (0.41 | ) | (0.41 | ) | 4.59 | 25.42 | ||||||||||||||||||||||||||||||
Class C | ||||||||||||||||||||||||||||||||||||||||
10/1/15 to 9/30/16 | $ | 26.95 | (0.02 | ) | 2.42 | 2.40 | (0.12 | ) | (0.12 | ) | 2.28 | $ | 29.23 | |||||||||||||||||||||||||||
10/1/14 to 9/30/15 | 27.88 | 0.04 | (0.91 | ) | (0.87 | ) | (0.06 | ) | (0.06 | ) | (0.93 | ) | 26.95 | |||||||||||||||||||||||||||
10/1/13 to 9/30/14 | 26.82 | 0.04 | 1.02 | 1.06 | — | — | 1.06 | 27.88 | ||||||||||||||||||||||||||||||||
10/1/12 to 9/30/13 | 25.27 | 0.03 | 1.62 | 1.65 | (0.10 | ) | (0.10 | ) | 1.55 | 26.82 | ||||||||||||||||||||||||||||||
10/1/11 to 9/30/12 | 20.57 | 0.10 | 4.70 | 4.80 | (0.10 | ) | (0.10 | ) | 4.70 | 25.27 | ||||||||||||||||||||||||||||||
See Notes to Financial Statements
16
Table of Contents
VIRTUS FOREIGN OPPORTUNITIES FUND
FINANCIAL HIGHLIGHTS (Continued)
SELECTED DATA FOR A SHARE OUTSTANDING
THROUGHOUT EACH PERIOD
| Total Return(1) | Net Assets, End of Period (000’s) | Ratio of Expenses to Average Net Assets(3) | Ratio of Net Investment Income (Loss) to Average Net Assets | Portfolio Turnover Rate | ||||||||||||||||||||
| 9.77 | % | $ | 367,684 | 1.45 | %(8)(9) | 0.68 | % | 25 | % | |||||||||||||||
| (2.41 | ) | 406,429 | 1.41 | 0.89 | 32 | |||||||||||||||||||
| 4.72 | 477,036 | 1.43 | 0.85 | 31 | ||||||||||||||||||||
| 7.37 | 676,149 | 1.46 | 0.85 | 29 | ||||||||||||||||||||
| 24.34 | �� | 398,166 | 1.45 | 1.16 | 47 | |||||||||||||||||||
| 8.94 | % | $ | 112,180 | 2.20 | %(8)(9) | (0.06 | )% | 25 | % | |||||||||||||||
| (3.13 | ) | 117,568 | 2.17 | 0.15 | 32 | |||||||||||||||||||
| 3.95 | 117,906 | 2.18 | 0.15 | 31 | ||||||||||||||||||||
| 6.56 | 101,655 | 2.21 | 0.10 | 29 | ||||||||||||||||||||
| 23.43 | 54,634 | 2.20 | 0.42 | 47 | ||||||||||||||||||||
See Notes to Financial Statements
17
Table of Contents
VIRTUS FOREIGN OPPORTUNITIES FUND
FINANCIAL HIGHLIGHTS (Continued)
SELECTED DATA FOR A SHARE OUTSTANDING
THROUGHOUT EACH PERIOD
| Net Asset Value, Beginning of Period | Net Investment Income (Loss)(2) | Net Realized and Unrealized Gain (Loss) | Total from Investment Operations | Dividends from Net Investment Income | Total Distributions | Change in Net Asset Value | Net Asset Value, End of Period | |||||||||||||||||||||||||||||||||
Class I | ||||||||||||||||||||||||||||||||||||||||
10/1/15 to 9/30/16 | $ | 27.23 | 0.26 | 2.46 | 2.72 | (0.32 | ) | (0.32 | ) | 2.40 | $ | 29.63 | ||||||||||||||||||||||||||||
10/1/14 to 9/30/15 | 28.14 | 0.32 | (0.91 | ) | (0.59 | ) | (0.32 | ) | (0.32 | ) | (0.91 | ) | 27.23 | |||||||||||||||||||||||||||
10/1/13 to 9/30/14 | 27.03 | 0.32 | 1.02 | 1.34 | (0.23 | ) | (0.23 | ) | 1.11 | 28.14 | ||||||||||||||||||||||||||||||
10/1/12 to 9/30/13 | 25.43 | 0.28 | 1.66 | 1.94 | (0.34 | ) | (0.34 | ) | 1.60 | 27.03 | ||||||||||||||||||||||||||||||
10/1/11 to 9/30/12 | 20.89 | 0.34 | 4.72 | 5.06 | (0.52 | ) | (0.52 | ) | 4.54 | 25.43 | ||||||||||||||||||||||||||||||
Class R6 | ||||||||||||||||||||||||||||||||||||||||
10/1/15 to 9/30/16 | $ | 27.24 | 0.33 | 2.42 | 2.75 | (0.36 | ) | (0.36 | ) | 2.39 | $ | 29.63 | ||||||||||||||||||||||||||||
11/14/14(4) to 9/30/15 | 28.66 | 0.36 | (1.45 | ) | (1.09 | ) | (0.33 | ) | (0.33 | ) | (1.42 | ) | 27.24 | |||||||||||||||||||||||||||
See Notes to Financial Statements
18
Table of Contents
VIRTUS FOREIGN OPPORTUNITIES FUND
FINANCIAL HIGHLIGHTS (Continued)
SELECTED DATA FOR A SHARE OUTSTANDING
THROUGHOUT EACH PERIOD
| Total Return(1) | Net Assets, End of Period (000’s) | Ratio of Expenses to Average Net Assets(3) | Ratio of Net Investment Income (Loss) to Average Net Assets | Portfolio Turnover Rate | ||||||||||||||||||||
| 10.05 | % | $ | 958,835 | 1.20 | %(5)(8) | 0.90 | % | 25 | % | |||||||||||||||
| (2.16 | ) | 1,231,349 | 1.17 | 1.14 | 32 | |||||||||||||||||||
| 4.97 | 1,263,398 | 1.18 | 1.13 | 31 | ||||||||||||||||||||
| 7.66 | 1,048,274 | 1.21 | 1.04 | 29 | ||||||||||||||||||||
| 24.64 | 672,948 | 1.20 | 1.46 | 47 | ||||||||||||||||||||
| 10.16 | % | $ | 6,587 | 1.10 | %(5)(8) | 1.14 | % | 25 | % | |||||||||||||||
| (3.84 | )(7) | 4,502 | 1.07 | (6) | 1.44 | (6) | 32 | |||||||||||||||||
Footnote Legend
| (1) | Sales charges, where applicable, are not reflected in the total return calculation. |
| (2) | Computed using average shares outstanding. |
| (3) | The Fund may invest in other funds, and the annualized expense ratios do not reflect fees and expenses associated with the underlying funds. |
| (4) | Inception date of class. |
| (5) | Earnings credits from custodian were not material, as reflected in the Statement of Operations, and had no impact on the financial highlights. |
| (6) | Annualized. |
| (7) | Not annualized. |
| (8) | Ratio includes extraordinary proxy expenses. |
See Notes to Financial Statements
19
Table of Contents
VIRTUS FOREIGN OPPORTUNITIES FUND
SEPTEMBER 30, 2016
Note 1. Organization
Virtus Opportunities Trust (the “Trust”) is organized as a Delaware statutory trust and is registered under the Investment Company Act of 1940, as amended (“1940 Act”), as an open-end management investment company.
As of the date of this report, 31 funds of the Trust are offered for sale, of which the Foreign Opportunities Fund (the “Fund”) is reported in this annual report. The Fund’s investment objective is outlined in the Fund Summary Page. There is no guarantee the Fund will achieve its objective.
The Fund offers Class A shares, Class C shares, Class I shares and Class R6 shares.
Class A shares are sold with a front-end sales charge of up to 5.75% with some exceptions. Generally, Class A shares are not subject to any charges by the Fund when redeemed; however, a 1% contingent deferred sales charge (“CDSC”) may be imposed on certain redemptions made within a certain period following purchases on which a finder’s fee has been paid. The period for which the CDSC applies for the Fund is 18 months. The CDSC period begins on the last day of the month preceding the month in which the purchase was made.
Class C shares are generally sold with a 1% CDSC, applicable if redeemed within one year of purchase. Class I shares are sold without a front-end sales charge or CDSC.
Class R6 shares are only available to participants in employer-sponsored retirement plans, such as 401(k) plans, profit sharing plans, defined benefit plans and other employer directed plans. Class R6 shares do not carry sales commissions or pay Rule 12b-1 fees. No compensation, administrative payments, sub-transfer agency payments or service payments are paid to brokers or other entities from fund assets or the Distributor’s or an affiliate’s resources on sales of or investments in Class R6 Shares.
Virtus Mutual Funds may impose an annual fee on accounts having balances of less than $2,500. The small account fee may be waived in certain circumstances, as disclosed in the prospectuses and/or statements of additional information. The fees collected will be used to offset certain expenses of the Fund. These fees are reflected as “Low Balance Account Fees” in the Fund’s Statement of Operations for the period, as applicable.
Each class of shares has identical voting, dividend, liquidation and other rights and the same terms and conditions, except that each class bears different distribution and/or service fees under a Board-approved Rule 12b-1 and/or shareholder service plan (“12b-1 plan”) and has exclusive voting rights with respect to such plans. Class I shares and Class R6 shares are not subject to a 12b-1 plan. Income and other expenses as well as realized and unrealized gains and losses of the Fund are borne pro rata by the holders of each class of shares.
Note 2. Significant Accounting Policies
The following is a summary of significant accounting policies consistently followed by the Trust in the preparation of its financial statements. The preparation of financial statements in conformity with accounting principles generally accepted in the United States of America requires management to make estimates and assumptions that affect the reported amounts of assets and liabilities, disclosure of contingent assets and liabilities at the date of the financial statements and the reported amounts of increases and decreases in net assets from operations during the reporting period. Actual results could differ from those estimates and those differences could be significant.
20
Table of Contents
VIRTUS FOREIGN OPPORTUNITIES FUND
NOTES TO FINANCIAL STATEMENTS (Continued)
SEPTEMBER 30, 2016
| A. | Security Valuation |
Security valuation procedures for the Fund, which include nightly price variance, as well as back-testing such as bi-weekly unchanged price, monthly secondary source and transaction analysis, have been approved by the Board of Trustees (the “Board”, or the “Trustees”). All internally fair valued securities are approved by a valuation committee (the “Valuation Committee”) appointed by the Board. The Valuation Committee is comprised of certain members of management as identified to the Board and convenes independently from portfolio management. All internally fair valued securities are updated daily and reviewed in detail by the Valuation Committee monthly unless changes occur within the period. The Valuation Committee reviews the validity of the model inputs and any changes to the model. Quarterly fair valuations are reviewed by the Board.
The Fund utilizes a fair value hierarchy which prioritizes the inputs to valuation techniques used to measure fair value into three broad levels. The Fund’s policy is to recognize transfers at the end of the reporting period.
| • Level 1 – | quoted prices in active markets for identical securities (security types generally include listed equities). |
| • Level 2 – | prices determined using other significant observable inputs (including quoted prices for similar securities, interest rates, prepayment speeds, credit risk, etc.). |
| • Level 3 – | prices determined using significant unobservable inputs (including the Valuation Committee’s own assumptions in determining the fair value of investments). |
A description of the valuation techniques applied to the Fund’s major categories of assets and liabilities measured at fair value on a recurring basis is as follows:
Equity securities are valued at the official closing price (typically last sale) on the exchange on which the securities are primarily traded or, if no closing price is available, at the last bid price and are categorized as Level 1 in the hierarchy. Restricted equity securities and private placements that are not widely traded, are illiquid, or are internally fair valued by the Valuation Committee, are generally categorized as Level 3 in the hierarchy.
Certain non-U.S. securities may be fair valued in cases where closing prices are not readily available or are deemed not reflective of readily available market prices. For example, significant events (such as movement in the U.S. securities market, or other regional and local developments) may occur between the time that non-U.S. markets close (where the security is principally traded) and the time that the Fund calculates its net asset value (“NAV”) (at the close of regular trading on the New York Stock Exchange (“NYSE”), generally 4 p.m. Eastern time) that may impact the value of securities traded in these non-U.S. markets. In such cases the Fund fair values non-U.S. securities using an independent pricing service which considers the correlation of the trading patterns of the non-U.S. security to the intraday trading in the U.S. markets for investments such as ADRs, financial futures, exchange-traded funds (“ETFs”), and certain indexes, as well as prices for similar securities. Such fair valuations are categorized as Level 2 in the hierarchy. Because the frequency of significant events is not predictable, fair valuation of certain non-U.S. common stocks may occur on a frequent basis.
21
Table of Contents
VIRTUS FOREIGN OPPORTUNITIES FUND
NOTES TO FINANCIAL STATEMENTS (Continued)
SEPTEMBER 30, 2016
Listed derivatives that are actively traded are valued based on quoted prices from the exchange and are categorized as Level 1 in the hierarchy. Over-the-counter derivative contracts, which include forward currency contracts and equity-linked instruments, do not require material subjectivity as pricing inputs are observed from actively quoted markets and are categorized as Level 2 in the hierarchy.
Investments in open-end mutual funds are valued at NAV. Investments in closed-end funds are valued as of the close of regular trading on the NYSE each business day. Both are categorized as Level 1 in the hierarchy.
A summary of the inputs used to value the Fund’s net assets by each major security type is disclosed at the end of the Schedule of Investments for the Fund. The inputs or methodologies used for valuing securities are not necessarily an indication of the risk associated with investing in those securities.
| B. | Security Transactions and Investment Income |
Security transactions are recorded on the trade date. Realized gains and losses from the sale of securities are determined on the identified cost basis. Dividend income is recognized on the ex-dividend date or, in the case of certain foreign securities, as soon as the Fund is notified. Interest income is recorded on the accrual basis. The Fund amortizes premiums and accretes discounts using the effective interest method.
| C. | Income Taxes |
The Fund is treated as a separate taxable entity. It is the intention of the Fund to comply with the requirements of Subchapter M of the Internal Revenue Code and to distribute substantially all of its taxable income to its shareholders. Therefore, no provision for federal income taxes or excise taxes has been made.
The Fund may be subject to foreign taxes on income, gains on investments or currency repatriation, a portion of which may be recoverable. The Fund will accrue such taxes and recoveries as applicable based upon current interpretations of the tax rules and regulations that exist in the markets in which it invests.
Management of the Fund has concluded that there are no significant uncertain tax positions that would require recognition in the financial statements. As of September 30, 2016, the tax years that remain subject to examination by the major tax jurisdictions under the statute of limitations are from the year 2013 forward (with limited exceptions).
| D. | Distributions to Shareholders |
Distributions are recorded by the Fund on the ex-dividend date. Income and capital gain distributions are determined in accordance with income tax regulations that may differ from accounting principles generally accepted in the United States of America. These differences may include the treatment of non-taxable dividends, market premium and discount, non-deductible expenses, expiring capital loss carryovers, foreign currency gain or loss, gain or loss on futures contracts, partnerships, operating losses and losses deferred due to wash sales. Permanent book and tax basis differences relating to shareholder distributions will result in reclassifications to capital paid in on shares of beneficial interest.
| E. | Expenses |
Expenses incurred together by the Fund and other affiliated mutual funds are allocated in proportion to the net assets of each such fund, except where allocation of direct expense to each fund or an alternative allocation method can be more appropriately used.
22
Table of Contents
VIRTUS FOREIGN OPPORTUNITIES FUND
NOTES TO FINANCIAL STATEMENTS (Continued)
SEPTEMBER 30, 2016
In addition to the net operating expenses that the Fund bears directly, the shareholders of the Fund indirectly bear the Fund’s pro rata expenses of any underlying mutual funds in which the Fund invests.
| F. | Foreign Currency Translation |
Non-U.S. investment securities and other assets and liabilities denominated in foreign currencies are translated into U.S. dollar amounts at the foreign currency exchange rate effective at the end of the reporting period. Cost of investments is translated at the currency exchange rate effective at the trade date. The gain or loss resulting from a change in currency exchange rates between the trade and settlement date of a portfolio transaction is treated as a gain or loss on foreign currency. Likewise, the gain or loss resulting from a change in currency exchange rates between the date income is accrued and the date it is paid is treated as a gain or loss on foreign currency. The Fund does not isolate that portion of the results of operations arising from changes in foreign exchange rates on investments from the fluctuations arising from changes in the market prices of securities held. Such fluctuations are included with the net realized and unrealized gain or loss on investments.
| G. | Securities Lending |
($ reported in thousands)
The Fund may loan securities to qualified brokers through an agreement with Brown Brothers Harriman (“BBH”), as a third party lending agent. Under the terms of the agreement, when doing so the Fund is required to maintain collateral with a market value not less than 100% of the market value of loaned securities. Collateral is adjusted daily in connection with changes in the market value of securities on loan. Collateral may consist of cash and securities issued by the U.S. Government or its agencies. Cash collateral is invested in a short-term money market fund. Dividends earned on the collateral and premiums paid by the broker are recorded as income by the Fund net of fees and rebates charged by BBH for its services as securities lending agent and in connection with this securities lending program. Lending portfolio securities involves a risk of delay in the recovery of the loaned securities or in the declining value of the collateral.
At September 30, 2016, the Fund had no securities on loan.
| I. | Earnings Credit and Interest |
Through arrangements with the Fund’s custodian, the Fund either receives an earnings credit or interest on agreed upon target un-invested cash balances to reduce the Fund’s custody expenses. The credits are reflected as “Earnings credit from Custodian” and the interest is reflected under “Interest income” in the Fund’s Statement of Operations for the period, as applicable.
Note 3. Investment Advisory Fees and Related Party Transactions
($ reported in thousands except as noted)
| A. | Adviser |
Virtus Investment Advisers, Inc. (the “Adviser”), an indirect, wholly owned subsidiary of Virtus Investment Partners, Inc. (“Virtus”), is the adviser to the Trust. The Adviser manages the Fund’s investment program and general operations of the Fund, including oversight of the Fund’s subadviser.
23
Table of Contents
VIRTUS FOREIGN OPPORTUNITIES FUND
NOTES TO FINANCIAL STATEMENTS (Continued)
SEPTEMBER 30, 2016
As compensation for its services to the Fund, the Adviser is entitled to a fee based upon the following annual rates as a percentage of the average daily net assets of the Fund:
First $2 Billion | $2+ Billion – | $4+ Billion | ||
| 0.85% | 0.80% | 0.75% |
| B. | Subadviser |
Vontobel Asset Management, Inc. (the “Subadviser”) is the Subadviser to the Fund. The subadviser manages the investments of the Fund for which the subadviser is paid a fee by the Adviser.
| C. | Distributor |
VP Distributors, LLC (“VP Distributors”), an indirect wholly owned subsidiary of Virtus, serves as the distributor of the Fund’s shares. VP Distributors has advised the Fund that for the fiscal year (the “period”) ended September 30, 2016, it retained net commissions of $16 for Class A shares and deferred sales charges of $3 for Class A shares and $7 for Class C shares.
In addition, the Fund pays VP Distributors distribution and/or service fees under a 12b-1 plan, as a percentage of the average daily net assets of each respective class at the annual rates as follows: Class A shares 0.25% and Class C shares 1.00%. Class R6 shares and Class I shares are not subject to a 12b-1 plan.
Under certain circumstances, shares of certain Virtus Mutual Funds may be exchanged for shares of the same class of certain other Virtus Mutual Funds on the basis of the relative NAV per share at the time of the exchange. On exchanges with share classes that carry a CDSC, the CDSC schedule of the original shares purchased continues to apply.
| D. | Administrator and Transfer Agent |
Virtus Fund Services, LLC, an indirect wholly owned subsidiary of Virtus, serves as the administrator and transfer agent to the Fund.
For the period ended September 30, 2016, the Fund incurred administration fees totaling $1,607 which are included in the Statement of Operations.
For the period ended September 30, 2016, the Fund incurred transfer agent fees totaling $2,421 which are included in the Statement of Operations. A portion of these fees was paid to outside entities that also provide services to the Trust.
| E. | Affiliated Shareholders |
At September 30, 2016, Virtus and its affiliates, and the retirement plans of Virtus and its affiliates, held shares of the Fund which may be redeemed at any time that aggregated the following:
| Shares | Aggregate Net Asset Value | |||||||
Class R6 shares | 3,575 | 106 | ||||||
24
Table of Contents
VIRTUS FOREIGN OPPORTUNITIES FUND
NOTES TO FINANCIAL STATEMENTS (Continued)
SEPTEMBER 30, 2016
| F. | Trustee Compensation |
The Trust provides a deferred compensation plan for its Trustees who receive compensation from the Trust. Under the deferred compensation plan, Trustees may elect to defer all or a portion of their compensation. Amounts deferred are retained by the Trust, and then, to the extent permitted by the 1940 Act, in turn, may be invested in the shares of affiliated or unaffiliated mutual funds selected by the participating Trustees. Investments in such instruments are included in “Other Assets” on the Statement of Assets and Liabilities at September 30, 2016.
Note 4. Purchases and Sales of Securities
($ reported in thousands)
Purchases and sales of securities (excluding U.S. Government and agency securities, and short-term securities) during the period ended September 30, 2016, were as follows:
| Purchases | Sales | |||||||
| $ | 395,574 | $ | 875,287 | |||||
There were no purchases or sales of long-term U.S. Government and agency securities for the Fund during the period ended September 30, 2016.
Note 5. Borrowings
($ reported in thousands)
On June 29, 2016, the Fund and other affiliated funds renewed a $50,000 secured line of credit. The Credit Agreement (the “Agreement”) with a commercial bank (the “Bank”) that allows the Fund to borrow cash from the Bank to manage large unexpected redemptions and trade fails, up to a limit of one-third of the Fund’s total net assets in accordance with the Agreement. The agreement has a term of 364 days and is renewable by the Fund with the Bank’s consent. Interest is charged at the higher of the LIBOR (London Interbank Offered Rate) or the Federal Funds rate plus an additional percentage rate on the amount borrowed. Commitment fees are charged on the undrawn balance. The Fund and other affiliated funds are individually, and not jointly, liable for their particular advances, if any, under the line of credit. The Bank has the ability to require repayment of outstanding borrowings under the Agreement upon certain circumstances such as an event of default.
The Fund had no outstanding borrowings at any time during the period ended September 30, 2016.
Note 6. 10% Shareholders
As of September 30, 2016, the Fund had individual shareholder account(s) and/or omnibus shareholder account(s) (comprised of a group of individual shareholders), which individually amounted to more than 10% of the total shares outstanding of the Fund as detailed below:
| % of Shares Outstanding | Number of Accounts | |||||||
| 33 | % | 2* | ||||||
| * | The shareholders are not affiliated with Virtus. |
25
Table of Contents
VIRTUS FOREIGN OPPORTUNITIES FUND
NOTES TO FINANCIAL STATEMENTS (Continued)
SEPTEMBER 30, 2016
Note 7. Credit Risk and Asset Concentrations
In countries with limited or developing markets, investments may present greater risks than in more developed markets and the prices of such investments may be volatile. The consequences of political, social or economic changes in these markets may have disruptive effects on the market prices of these investments and the income they generate, as well as the Fund’s ability to repatriate such amounts.
The Fund may invest a high percentage of its assets in specific sectors of the market in the pursuit of its investment objective. Fluctuations in these sectors of concentration may have a greater impact on the Fund, positive or negative, than if the Fund did not concentrate its investments in such sectors.
At September 30, 2016, the Fund held securities issued by various companies in specific sectors detailed below:
| Sector | Percentage of Total Investments | |||||||
| Consumer Staples | 41 | % | ||||||
Note 8. Indemnifications
Under the Trust’s organizational documents, its Trustees and officers are indemnified against certain liabilities arising out of the performance of their duties to the Fund. Each Trustee has also entered into an indemnification agreement with the Trust. In addition, in the normal course of business, the Fund enters into contracts that provide a variety of indemnifications to other parties. The Fund’s maximum exposure under these arrangements is unknown as this would involve future claims that may be made against the Fund and that have not occurred. However, the Fund has not had prior claims or losses pursuant to these arrangements and expects the risk of loss to be remote.
Note 9. Federal Income Tax Information
($ reported in thousands)
At September 30, 2016, federal tax cost and aggregate gross unrealized appreciation (depreciation) of securities held by the Fund were as follows:
Federal | Unrealized | Unrealized | Net Unrealized | |||
| $977,333 | $465,469 | $(12,692) | $452,777 |
The Fund has capital loss carryovers available to offset future realized capital gains, through the indicated expiration dates shown below:
2018 | Total | |||||
Short-Term | Long-Term | Short-Term | Long-Term | |||
175,299 | — | 175,299 | — | |||
The Fund may not realize the benefit of these losses to the extent the Fund does not realize gains on investments prior to the expiration of the capital loss carryovers.
Under the Regulated Investment Company Modernization Act of 2010 (the “Act”), net capital losses recognized for tax years beginning after December 22, 2010, may be carried forward indefinitely, and their character is retained as short-term and/or long-term losses. Previously, net capital losses were carried forward for eight years and treated as short-term losses. As a transition rule, the Act requires that post-enactment net capital losses be used before pre-enactment net capital losses.
26
Table of Contents
VIRTUS FOREIGN OPPORTUNITIES FUND
NOTES TO FINANCIAL STATEMENTS (Continued)
SEPTEMBER 30, 2016
For the period ended September 30, 2016, the Fund utilized losses of $18,882 deferred in prior years against current year capital gains.
Capital losses realized after October 31 and certain late year losses may be deferred and treated as occurring on the first day of the following fiscal year. For the fiscal year ended September 30, 2016 the Fund deferred and recognized qualified late-year losses as follows:
Late Year | Late Year | Capital | Capital | |||
$— | $— | $9,243 | $45,251 |
The components of distributable earnings on a tax basis (excluding unrealized appreciation (depreciation) (which is disclosed above) consist of the following:
Undistributed | Undistributed | |
| $7,908 | $— |
The tax character of dividends and distributions paid during the years ended September 30, 2016 and 2015 was as follows:
| Year Ended | ||||||||
| 2016 | 2015 | |||||||
Ordinary Income | $ | 17,186 | $ | 19,119 | ||||
|
|
|
| |||||
Total | $ | 17,186 | $ | 19,119 | ||||
|
|
|
| |||||
The differences between the book and tax basis components of distributable earnings relate principally to the timing of recognition of income and gains for federal income tax purposes. Short-term gain distributions reported in the Statements of Changes in Net Assets, if any, are reported as ordinary income for federal tax purposes. Distributions are determined on a tax basis and may differ from net investment income and realized capital gains for financial reporting purposes.
Note 10. Reclassifications of Capital Accounts
($ reported in thousands)
For financial reporting purposes, book basis capital accounts are adjusted to reflect the tax character of permanent book/tax differences. Permanent reclassifications can arise from differing treatment of certain income and gain transactions, nondeductible current year net operating losses, expiring capital loss carryovers and investments in passive foreign investment companies. The reclassifications have no impact on the net assets or net asset value of the Fund. As of September 30, 2016, the Fund recorded reclassifications to increase (decrease) the accounts as listed below:
Capital Paid | Undistributed | Accumulated | ||
| $—(1) | $770 | $(770) |
| (1) | Amount less than $500. |
27
Table of Contents
VIRTUS FOREIGN OPPORTUNITIES FUND
NOTES TO FINANCIAL STATEMENTS (Continued)
SEPTEMBER 30, 2016
Note 11. Regulatory Matters and Litigation
From time to time, the Trust, the Adviser and/or Subadviser and/or their affiliates may be involved in litigation and arbitration as well as examinations and investigations by various regulatory bodies, including the SEC, involving compliance with, among other things, securities laws, client investment guidelines, laws governing the activities of broker-dealers and other laws and regulations affecting their products and other activities. At this time, the Adviser believes that the outcomes of such matters are not likely, either individually or in the aggregate, to be material to these financial statements.
On February 20, 2015, a putative class action complaint (In re Virtus Investment Partners, Inc. Securities Litigation; formerly styled as Tom Cummins v. Virtus Investment Partners Inc. et al.) alleging violation of the federal securities laws was filed by an individual shareholder against Virtus and certain of its officers (the “defendants”) in the United States District Court for the Southern District of New York. On August 21, 2015, the lead plaintiff filed a Consolidated Class Action Complaint (the “Consolidated Complaint”) amending the originally filed complaint and adding the Trust as a defendant. The Consolidated Complaint was purportedly filed on behalf of all purchasers of Virtus common stock between January 25, 2013 and May 11, 2015 (the “Class Period”). The Consolidated Complaint alleges that during the Class Period, the defendants disseminated materially false and misleading statements and concealed material adverse facts relating to certain funds previously subadvised by F-Squared Investments, Inc. and/or its affiliates (“F-Squared”). The plaintiff seeks to recover unspecified damages. A motion to dismiss the Consolidated Complaint was filed on behalf of the defendants on October 21, 2015. Pursuant to an Opinion & Order (“Order”) filed on July 1, 2016, the court granted in part and denied in part the defendants’ motion to dismiss. Although the Order narrows the scope of the claims asserted, claims under Sections 10(b) and 20(a) of the Exchange Act and Rule 10b-5 thereunder survive the motion. The defendants filed an Answer to the Consolidated Complaint on August 5, 2016. Virtus and its affiliates, including the Adviser, believe that the suit is without merit and intend to defend it vigorously. The Trust believes that the risk of loss to the Funds as a result of this suit is remote. The Adviser does not believe that the suit will have any impact on its ability to provide services to the Fund.
On May 8, 2015, a putative class action complaint (Mark Youngers v. Virtus Investment Partners, Inc. et al.) alleging violations of certain provisions of the federal securities laws was filed in the United States District Court for the Central District of California. The complaint, which was purportedly filed on behalf of purchasers of certain Virtus Funds previously subadvised by F-Squared between May 8, 2010 and December 22, 2014, inclusive (the “Class Period”), alleged claims against Virtus, certain Virtus officers and affiliates (including the Adviser, Euclid Advisors LLC (“Euclid”) and VP Distributors, LLC), the trustees and certain officers of the Trust, and certain other parties (the “defendants”). The complaint alleges that during the Class Period the defendants disseminated materially false and misleading statements and concealed or omitted material facts necessary to make the statements made not misleading. On October 1, 2015, the plaintiff filed a First Amended Class Action Complaint which, among other things, added a derivative claim for breach of fiduciary duty on behalf of the Trust. On October 19, 2015, the United States District Court for the Central District of California entered an order transferring the action to the Southern District of New York. On January 4, 2016, Plaintiffs filed a Second Amended Complaint. Motions to dismiss were filed on behalf of Virtus, its officers and affiliates and the independent trustees on February 1, 2016. An Opinion & Order (“Order”) granting in part and denying in part the defendants’ motions to
28
Table of Contents
VIRTUS FOREIGN OPPORTUNITIES FUND
NOTES TO FINANCIAL STATEMENTS (Continued)
SEPTEMBER 30, 2016
dismiss was issued on July 1, 2016. The Order dismissed all claims against the Adviser, Euclid, the independent trustees and certain of the other individual defendants and narrowed the claims asserted against the remaining defendants. The remaining defendants filed an Answer to the Second Amended Complaint on August 5, 2016. The defendants filed a motion to certify an interlocutory appeal of the July 1, 2016 order to the Court of Appeals for the Second Circuit on August 26, 2016. Oral argument on the motion is scheduled for October 7, 2016. Virtus and its affiliates, including the Adviser, believe that the suit has no basis in law or fact and intend to defend it vigorously. The Trust believes that the risk of loss to the Fund as a result of this suit is remote. The Adviser does not believe that the suit will have any impact on its ability to provide services to the Fund.
Note 12. Subsequent Events
Management has evaluated the impact of all subsequent events on the Fund through the date the financial statements were issued, and has determined that there are no subsequent events requiring recognition or disclosure in the financial statements.
29
Table of Contents

Report of Independent Registered Public
Accounting Firm
To the Board of Trustees of
Virtus Opportunities Trust and Shareholders of
Virtus Foreign Opportunities Fund:
In our opinion, the accompanying statement of assets and liabilities, including the schedule of investments, and the related statements of operations and of changes in net assets and the financial highlights present fairly, in all material respects, the financial position of the Virtus Foreign Opportunities Fund (one of the funds constituting Virtus Opportunities Trust, hereafter referred to as the “Fund”) at September 30, 2016, the results of its operations for the year then ended, the changes in its net assets for each of the two years in the period then ended and the financial highlights for each of the periods indicated, in conformity with accounting principles generally accepted in the United States of America. These financial statements and financial highlights (hereafter referred to as “financial statements”) are the responsibility of the Fund’s management. Our responsibility is to express an opinion on these financial statements based on our audits. We conducted our audits of these financial statements in accordance with the standards of the Public Company Accounting Oversight Board (United States). Those standards require that we plan and perform the audit to obtain reasonable assurance about whether the financial statements are free of material misstatement. An audit includes examining, on a test basis, evidence supporting the amounts and disclosures in the financial statements, assessing the accounting principles used and significant estimates made by management, and evaluating the overall financial statement presentation. We believe that our audits, which included confirmation of securities at September 30, 2016 by correspondence with the custodian and brokers, provide a reasonable basis for our opinion.

Philadelphia, Pennsylvania
November 22, 2016
30
Table of Contents
VIRTUS FOREIGN OPPORTUNITIES FUND
SEPTEMBER 30, 2016 (Unaudited)
For the fiscal year ended September 30, 2016, the Fund makes the following disclosures for federal income tax purposes. Below is listed the percentage, or the maximum amount allowable, of its ordinary income dividends (“QDI”) to qualify for the lower tax rates applicable to individual shareholders, and the percentage of ordinary income dividends earned by the Fund which qualifies for the dividends received deduction (“DRD”) for corporate shareholders. The actual percentage of QDI and DRD for the calendar year will be designated in year-end tax statements. The Fund designates the amounts below as long-term capital gains dividends (“LTCG”) taxable at a 20% rate, or lower depending on the shareholder’s income ($ reported in thousands). LTCG amounts, if subsequently different, will be designated in the next annual report.
QDI | DRD | LTCG | ||
| 100% | 26% | $— |
For the fiscal year ended September 30, 2016, the Fund recognized $32,638 ($ reported in thousands), of foreign source income on which the Fund paid foreign taxes of $1,996 ($ reported in thousands). This information is being furnished to you pursuant to notice requirements of Section 853(a) and 855(d) of the Internal Revenue Code, as amended, and the Treasury Regulations thereunder.
31
Table of Contents
RESULTS OF SHAREHOLDER MEETING
VIRTUS OPPORTUNITIES TRUST
MAY 19, 2016 (Unaudited)
At a special meeting of shareholders of all series of Virtus Equity Trust, Virtus Insight Trust and Virtus Opportunities Trust, held on May 19, 2016, shareholders of Virtus Opportunities Trust (the “Trust”) voted on the following proposals:
Proposal 1.
| Number of Eligible Votes: | ||||||||||||
| FOR | AGAINST | ABSTAIN | ||||||||||
To elect six Trustees to serve on the Board of Trustees until the next meeting of shareholders at which Trustees are elected. | ||||||||||||
George R. Aylward | 1,145,056,198.477 | 24,756,597.221 | 0 | |||||||||
Thomas J. Brown | 1,144,160,222.050 | 25,652,573.650 | 0 | |||||||||
Donald C. Burke | 1,145,758,834.912 | 24,053,960.790 | 0 | |||||||||
Roger A. Gelfenbien | 1,144,297,795.833 | 25,514,999.865 | 0 | |||||||||
John R. Mallin | 1,144,938,076.292 | 24,874,719.410 | 0 | |||||||||
Hassell H. McClellan | 1,143,864,433.134 | 25,948,362.566 | 0 | |||||||||
Shareholders of the Trust voted to approve the above proposal.
Proposal 2.
| Number of Eligible Votes: | ||||||||||||
| FOR | AGAINST | ABSTAIN | ||||||||||
To approve a proposal to permit Virtus Investment Advisers, Inc., as the investment adviser to all the Funds, to hire and replace subadvisers or to modify subadvisory agreements without shareholder approval. | ||||||||||||
Virtus CA Tax Exempt Bond Fund | 1,258,194.893 | 91,895.368 | 41,271.245 | |||||||||
Virtus Emerging Markets Debt Fund | 3,015,152.206 | 198.283 | 0 | |||||||||
Virtus Emerging Markets Equity Income Fund | 3,672,832.400 | 0 | 0 | |||||||||
Virtus Emerging Markets Opportunities Fund | 620,793,093.034 | 25,302,093.728 | 9,306,937.262 | |||||||||
Virtus Emerging Markets Small-Cap Fund | 494,281.793 | 0 | 0 | |||||||||
Virtus Essential Resources Fund | 504,931.913 | 0 | 0 | |||||||||
Virtus Foreign Opportunities Fund | 27,726,679.250 | 666,663.374 | 564,703.507 | |||||||||
Virtus Greater European Opportunities Fund | 818,457.900 | 37,502.974 | 15,676.215 | |||||||||
Virtus International Small-Cap Fund | 3,074,638.276 | 5,991.041 | 10,261.000 | |||||||||
Virtus International Wealth Masters Fund | 518,044.295 | 0 | 0 | |||||||||
Virtus Low Duration Income Fund | 10,449,114.393 | 779,684.940 | 311,840.943 | |||||||||
Virtus Multi-Sector Intermediate Bond Fund | 11,147,670.008 | 724,253.699 | 406,427.672 | |||||||||
Virtus Multi-Sector Short Term Bond Fund | 618,834,424.483 | 21,316,032.964 | 14,819,955.463 | |||||||||
32
Table of Contents
RESULTS OF SHAREHOLDER MEETING (Continued)
VIRTUS OPPORTUNITIES TRUST
MAY 19, 2016 (Unaudited)
Shareholders of the Funds listed above voted to approve the above proposal.
Proposal 6.
| Number of Eligible Votes: | ||||||||||||
| FOR | AGAINST | ABSTAIN | ||||||||||
To approve a proposal to amend the fundamental restrictions of the Fundamental Restriction Funds with respect to loans. | ||||||||||||
Virtus Foreign Opportunities Fund | 27,568,524.708 | 741,409.046 | 648,118.377 | |||||||||
Virtus Multi-Sector Short Term Bond Fund | 615,281,810.614 | 22,749,361.497 | 16,939,237.795 | |||||||||
Shareholders of the Funds listed above voted to approve the above proposal.
33
Table of Contents
FUND MANAGEMENT TABLES (UNAUDITED)
Information pertaining to the Trustees and officers of the Trust as of September 30, 2016, is set forth below. The statement of additional information (SAI) includes additional information about the Trustees and is available without charge, upon request, by calling (800) 243-1574. The address of each individual, unless otherwise noted, is 100 Pearl Street, Hartford, CT 06103-4506. There is no stated term of office for Trustees of the Trust.
Independent Trustees
| Name, Year of Birth, Year Elected and Number of Funds Overseen | Principal Occupation(s) Other Directorships Held by Trustee | |
Thomas J. Brown YOB: 1945 Elected: 2016 65 Portfolios | Retired. Trustee (since 2016), Virtus Mutual Fund Complex (52 portfolios) and Virtus Alternative Solutions Trust (4 portfolios); Trustee (since 2011), Virtus Variable Insurance Trust (9 portfolios); Director (since 2010), D’Youville Senior Care Center; and Director (since 2005), VALIC Company Funds (49 portfolios). | |
Burke, Donald C. YOB: 1961 Elected: 2016 69 Portfolios | Retired. Trustee (since 2016), Virtus Mutual Fund Complex (52 portfolios), Virtus Variable Insurance Trust (9 portfolios) and Virtus Alternative Solutions Trust (4 portfolios); Director (since 2014) closed-end funds managed by Duff & Phelps Investment Management Co. (4 funds); Director, Avista Corp. (energy company) (since 2011); Trustee, Goldman Sachs Fund Complex (2010 to 2014); and Director, BlackRock Luxembourg and Cayman Funds (2006 to 2010). | |
Roger A. Gelfenbien YOB: 1943 Elected: 2016 65 Portfolios | Retired. Trustee (since 2016), Virtus Mutual Fund Complex (52 portfolios) and Virtus Alternative Solutions Trust (4 portfolios); Trustee (since 2000), Virtus Variable Insurance Trust (9 portfolios); and Director (since 1999), USAllianz Variable Insurance Product Trust (42 portfolios). | |
John R. Mallin YOB: 1950 Elected: 2016 65 Portfolios | Partner/Attorney (since 2003), McCarter & English LLP (law firm), Real Property Practice Group; and Member (since 2014), Counselors of Real Estate. Trustee (since 2016), Virtus Mutual Fund Complex (52 portfolios) and Virtus Alternative Solutions Trust (4 portfolios); Director (since 2013), Horizon, Inc. (non-profit); and Trustee (since 1999), Virtus Variable Insurance Trust (9 portfolios). | |
McClellan, Hassell H. YOB: 1945 Elected: 2015 65 Portfolios | Retired (since 2013); and Professor (1984 to 2013), Wallace E. Carroll School of Management, Boston College. Trustee (since 2016), Virtus Alternative Solutions Trust (4 portfolios); Trustee (since 2015), Virtus Mutual Fund Complex (52 portfolios); and Director (since 2010), Barnes Group, Inc. (diversified global components manufacturer and logistical services company); Trustee, Virtus Variable Insurance Trust (9 portfolios) (since 2008); and Trustee, John Hancock Fund Complex (since 2000) (collectively, 228 portfolios). | |
McLoughlin, Philip YOB: 1946 Elected: 1999 74 Portfolios | Retired. Director and Chairman (since 2016), The Zweig Fund and Virtus Global Dividend & Income Fund Inc.; Trustee and Chairman (since 2013), Virtus Alternative Solutions Trust (4 portfolios); Trustee/Director and Chairman (since 2011), Virtus Closed-End Funds (3 funds); Chairman and Trustee (since 2003), Virtus Variable Insurance Trust (9 portfolios); Director (since 1995), closed-end funds managed by Duff & Phelps Investment Management Co. (4 funds); Director (since 1991) and Chairman (since 2010), Lazard World Trust Fund (closed-end investment firm in Luxembourg); and Trustee (since 1989) and Chairman (since 2002), Virtus Mutual Fund Complex (52 portfolios). | |
McNamara, Geraldine M. YOB: 1951 Elected: 2001 69 Portfolios | Retired. Trustee (since 2016) Virtus Alternative Solutions Trust (4 portfolios); Trustee (since 2015), Virtus Variable Insurance Trust (9 portfolios); Director (since 2003), closed-end funds managed by Duff & Phelps Investment Management Co. (4 funds); and Trustee (since 2001), Virtus Mutual Fund Complex (52 portfolios). |
34
Table of Contents
FUND MANAGEMENT TABLES (UNAUDITED) (Continued)
Independent Trustees (Continued)
| Name, Year of Birth, Year Elected and Number of Funds Overseen | Principal Occupation(s) Other Directorships Held by Trustee | |
Oates, James M. YOB: 1946 Elected: 2000 70 Portfolios | Managing Director (since 1994), Wydown Group (consulting firm). Director (since 2016), The Zweig Fund and Virtus Global Dividend & Income Fund Inc.; Trustee (since 2016) Virtus Variable Insurance Trust (9 portfolios); Trustee/Director (since 2013), Virtus Closed-End Funds (3 funds); Trustee (since 2013), Virtus Alternative Solutions Trust (4 portfolios); Chairman and Trustee (since 2005), John Hancock Fund Complex (228 portfolios); Director (2002 to 2014), New Hampshire Trust Company; Chairman (since 2000), Emerson Investment Management, Inc.; Non-Executive Chairman (2000 to 2014), Hudson Castle Group, Inc. (formerly IBEX Capital Markets, Inc.) (financial services) Chairman and Director (1999 to 2014), Connecticut River Bank; Director (since 1996), Stifel Financial; and Trustee (since 1987), Virtus Mutual Fund Complex (52 portfolios). | |
Segerson, Richard E. YOB: 1948 Elected: 2000 65 Portfolios | Retired; and Managing Director (1998 to 2013), Northway Management Company. Trustee (since 2016) Virtus Alternative Solutions Trust (4 portfolios) and Virtus Variable Insurance Trust (9 portfolios); and Trustee (since 1983), Virtus Mutual Fund Complex (52 portfolios). | |
Verdonck, Ferdinand L.J. YOB: 1942 Elected: 2005 65 Portfolios | Vice Chairman (since 2014), Affirmed Therapeutics (biotechnology); Director (1998 to 2015), The J.P. Morgan Continental European Investment Trust; Director (2005 to 2013), Galapagos N.V. (biotechnology); Director (1998 to 2015) Groupe SNEF; and Mr. Verdonck is also a director of several non-U.S. companies. Trustee (since 2016) Virtus Variable Insurance Trust (9 portfolios) and Virtus Alternative Solutions Trust (4 portfolios); and Trustee (since 2002), Virtus Mutual Fund Complex (52 portfolios). |
Interested Trustee
The individual listed below is an “interested person” of the Trust, as defined in Section 2(a)(19) of the 1940 Act, as amended, and the rules and regulations thereunder.
| Name, Year of Birth, Year Elected and Number of Funds Overseen | Principal Occupation(s) During Past 5 Years and | |
Aylward, George R.* Trustee and President YOB: 1964 Elected: 2006 70 Portfolios | Director, President and Chief Executive Officer (since 2008), Virtus Investment Partners, Inc. and/or certain of its subsidiaries; various senior officer positions with Virtus affiliates (since 2005). Chairman and Trustee (since 2015), Virtus ETF Trust II; Trustee and President (since 2013), Virtus Alternative Solutions Trust (4 portfolios); Director (since 2013), Virtus Global Funds, PLC (2 portfolios); Trustee (since 2012) and President (since 2010), Virtus Variable Insurance Trust (9 portfolios); Trustee and President (since 2011), Virtus Closed-End Funds (3 funds); Trustee (since 2006), Virtus Mutual Funds (52 portfolios); and Director, President and Chief Executive Officer (since 2006), The Zweig Fund and Virtus Global Dividend & Income Fund Inc. |
35
Table of Contents
FUND MANAGEMENT TABLES (UNAUDITED) (Continued)
Officers of the Trust Who Are Not Trustees
Name, Address and Year of Birth | Position(s) Held with Time Served | Principal Occupation(s) During Past 5 Years | ||
Bradley, W. Patrick YOB: 1972 | Executive Vice President (since 2016); Senior Vice President (2013 to 2016); Vice President (2011 to 2013); Chief Financial Officer and Treasurer (since 2006). | Executive Vice President, Fund Services (since 2016), Senior Vice President, Fund Services (2010 to 2016), Virtus Investment Partners, Inc. and/or certain of its subsidiaries; various officer positions (since 2006) with Virtus affiliates; Executive Vice President (since 2016), Senior Vice President (2013 to 2016), Vice President (2011 to 2013), Chief Financial Officer and Treasurer (since 2004), Virtus Variable Insurance Trust; Executive Vice President (since 2016), Senior Vice President (2013 to 2016), Vice President (2011 to 2013), Chief Financial Officer and Treasurer (since 2006), Virtus Mutual Fund Complex; Executive Vice President (since 2016), Senior Vice President (2013 to 2016), Vice President (2012 to 2013) and Treasurer (Chief Financial Officer) (since 2007), The Zweig Fund and Virtus Global Dividend & Income Fund Inc.; Executive Vice President (since 2016), Senior Vice President (2013 to 2016), Vice President (2011 to 2013), Chief Financial Officer and Treasurer (since 2011), Virtus Closed-End Funds; Vice President and Assistant Treasurer (since 2011), Duff & Phelps Global Utility Income Fund Inc.; Director (since 2013), Virtus Global Funds, PLC; and Executive Vice President (since 2016), Senior Vice President, Chief Financial Officer and Treasurer (2013 to 2016), Virtus Alternative Solutions Trust. | ||
Carr, Kevin J. YOB: 1954 | Senior Vice President (since 2013); Vice President (2005 to 2013); Chief Legal Officer, Counsel and Secretary (since 2005). | Senior Vice President (since 2009), Vice President, Counsel and Secretary (2008 to 2009), Virtus Investment Partners, Inc. and/or certain of its subsidiaries; various senior officer positions (since 2005) with Virtus affiliates; Senior Vice President (since 2013), Vice President (2005 to 2013), Chief Legal Officer, Counsel and Secretary (since 2005), Virtus Mutual Fund Complex; Senior Vice President (2013 to 2014), Vice President (2012 to 2013) and Assistant Secretary (since 2012), Secretary and Chief Legal Officer (2005 to 2012), The Zweig Fund and Virtus Global Dividend & Income Fund Inc.; Assistant Secretary (since 2013), Vice President, Chief Legal Officer, Counsel and Secretary (2010 to 2013), Virtus Variable Insurance Trust; Vice President and Assistant Secretary (since 2011), Duff & Phelps Global Utility Income Fund Inc.; Senior Vice President and Assistant Secretary (2013 to 2014), Vice President and Assistant Secretary (2012 to 2013), Vice President, Chief Legal Officer, Counsel and Secretary (2011 to 2012), Virtus Closed-End Funds; and Assistant Secretary (since 2013), Virtus Alternative Solutions Trust. |
36
Table of Contents
FUND MANAGEMENT TABLES (UNAUDITED) (Continued)
Officers of the Trust Who Are Not Trustees (Continued)
Name, Address and Year of Birth | Position(s) Held with Time Served | Principal Occupation(s) During Past 5 Years | ||
Engberg, Nancy J. YOB: 1956 | Vice President and Chief Compliance Officer since 2011. | Vice President (since 2008) and Chief Compliance Officer (2008 to 2011 and since 2016), Virtus Investment Partners, Inc. and/or certain of its subsidiaries; various officer positions (since 2003) with Virtus affiliates; Vice President and Chief Compliance Officer (since 2011), Virtus Mutual Fund Complex; Vice President (since 2010) and Chief Compliance Officer (since 2011), Virtus Variable Insurance Trust; Vice President and Chief Compliance Officer (since 2011), Virtus Closed-End Funds; Vice President and Chief Compliance Officer (since 2012), The Zweig Fund and Virtus Global Dividend & Income Fund Inc.; Vice President and Chief Compliance Officer (since 2013), Virtus Alternative Solutions Trust; Chief Compliance Officer (since 2015), ETFis Series Trust I; and Chief Compliance Officer (since 2015), Virtus ETF Trust II. | ||
Waltman, Francis G. YOB: 1962 | Executive Vice President (since 2013); Senior Vice President (2008-2013). | Executive Vice President, Product Development (since 2009), Virtus Investment Partners, Inc. and/or certain of its subsidiaries; various senior officer positions (since 2006) with Virtus affiliates; Executive Vice President (since 2013), Senior Vice President (2008 to 2013), Virtus Mutual Fund Complex; Executive Vice President (since 2013), Senior Vice President (2010 to 2013), Virtus Variable Insurance Trust; Executive Vice President (since 2013), Senior Vice President (2011 to 2013), Virtus Closed-End Funds; Director (since 2013), Virtus Global Funds PLC; and Executive Vice President (since 2013), Virtus Alternative Solutions Trust. |
37
Table of Contents
VIRTUS OPPORTUNITIES TRUST
101 Munson Street
Greenfield, MA 01301-9668
Trustees
George R. Aylward
Thomas J. Brown
Donald C. Burke
Roger A. Gelfenbein
John R. Mallin
Hassell H. McClellan
Philip R. McLoughlin, Chairman
Geraldine M. McNamara
James M. Oates
Richard E. Segerson
Ferdinand L.J. Verdonck
Officers
George R. Aylward, President
Francis G. Waltman, Executive Vice President
W. Patrick Bradley, Executive Vice President, Chief Financial Officer and Treasurer
Kevin J. Carr, Senior Vice President, Chief Legal Officer, Counsel and Secretary
Nancy J. Engberg, Vice President and Chief Compliance Officer
Investment Adviser
Virtus Investment Advisers, Inc.
100 Pearl Street
Hartford, CT 06103-4506
Principal Underwriter
VP Distributors, LLC
100 Pearl Street
Hartford, CT 06103-4506
Administrator and Transfer Agent
Virtus Fund Services, LLC
100 Pearl Street
Hartford, CT 06103-4506
Custodian
JPMorgan Chase Bank, NA
1 Chase Manhattan Plaza
New York, NY 10005-1401
Independent Registered Public Accounting Firm
PricewaterhouseCoopers LLP
2001 Market Street
Philadelphia, PA 19103-7042
How to Contact Us
Mutual Fund Services | 1-800-243-1574 | |||
Adviser Consulting Group | 1-800-243-4361 | |||
Website | Virtus.com |
Important Notice to Shareholders
The Securities and Exchange Commission has modified mailing regulations for semiannual and annual shareholder fund reports to allow mutual fund companies to send a single copy of these reports to shareholders who share the same mailing address. If you would like additional copies, please call Mutual Fund Services at 1-800-243-1574.
Table of Contents
For more information about
Virtus Mutual Funds, please call
your financial representative, or
contact us at 1-800-243-1574
or Virtus.com
| 8011 | 11-16 |
P.O. Box 9874
Providence, RI 02940-8074
Table of Contents

ANNUAL REPORT
Virtus Alternatives Diversifier Fund*
Virtus Equity Trend Fund*
Virtus Global Equity Trend Fund*
Virtus Herzfeld Fund
Virtus Multi-Asset Trend Fund*
Virtus Sector Trend Fund*
September 30, 2016 TRUST NAME: VIRTUS OPPORTUNITIES TRUST * Prospectus supplements applicable to these funds appear at the back of this annual report. |
 |
Not FDIC Insured
No Bank Guarantee
May Lose Value
Table of Contents
| 1 | ||||||||
| 2 | ||||||||
| 4 | ||||||||
| Fund | Fund Summary | Schedule of Investments | ||||||
Virtus Alternatives Diversifier Fund (“Alternatives Diversifier Fund”) | 7 | 25 | ||||||
| 10 | 26 | |||||||
Virtus Global Equity Trend Fund (“Global Equity Trend Fund”) | 13 | 28 | ||||||
| 16 | 31 | |||||||
| 19 | 32 | |||||||
| 22 | 35 | |||||||
| 39 | ||||||||
| 41 | ||||||||
| 43 | ||||||||
| 46 | ||||||||
| 50 | ||||||||
| 61 | ||||||||
| 62 | ||||||||
| 63 | ||||||||
| 65 | ||||||||
Proxy Voting Procedures and Voting Record (Form N-PX)
The subadvisers vote proxies relating to portfolio securities in accordance with procedures that have been approved by the Board of Trustees (“Trustees” or the “Board”) of the Trust. You may obtain a description of these procedures, along with information regarding how the Funds voted proxies during the most recent 12-month period ended June 30, free of charge, by calling toll-free 1-800-243-1574. This information is also available through the Securities and Exchange Commission’s (the “SEC”) website at http://www.sec.gov.
Form N-Q Information
The Trust files a complete schedule of portfolio holdings for each Fund with the SEC for the first and third quarters of each fiscal year on Form N-Q. Form N-Q is available on the SEC’s website at http://www.sec.gov. Form N-Q may be reviewed and copied at the SEC’s Public Reference Room. Information on the operation of the SEC’s Public Reference Room can be obtained by calling toll-free 1-800-SEC-0330.
This report is not authorized for distribution to prospective investors in the Funds presented in this book unless preceded or accompanied by an effective prospectus which includes information concerning the sales charge, each Fund’s record and other pertinent information.
Table of Contents
To My Fellow Shareholders of Virtus Mutual Funds:
 | I am pleased to present this annual report that reviews the performance of your fund for the 12 months ended September 30, 2016.
During the first half of the fiscal year, global equity markets were challenged by falling oil prices, China’s slowdown, and concerns over the Federal Reserve’s (“the Fed”) first rate hike in nine years, which occurred in December 2015. Equities plummeted in early 2016, but stabilizing oil prices and the Fed’s softened stance on further rate hikes for 2016 sparked a rally in mid-February that lasted until June. The U.K.’s June 23 “Brexit” decision to leave the European Union triggered a selloff that was largely | |
short-lived. Calm was restored by better-than-expected corporate earnings, an improving global economic picture, and reassurance that the world’s central banks would continue to provide monetary stimulus. By the end of September, U.S. equity markets had recovered much of their losses, and the 12-month period was positive for many asset classes.
For the 12 months ended September 30, 2016, U.S. small-cap stocks kept pace with U.S. large-cap stocks, as measured by the 15.47% and 15.43% returns of the Russell 2000® Index and S&P 500® Index, respectively. Within international equities, emerging markets significantly outperformed their developed peers, with the MSCI Emerging Markets Index (net) up 16.78%, while the MSCI EAFE® Index (net) returned 6.52%.
Demand for U.S. Treasuries remained strong, driven by foreign investors seeking safe havens and yield in light of the negative interest rate environment in many international economies. On September 30, 2016, the benchmark 10-year U.S. Treasury yielded 1.60% compared with 2.06% one year earlier. For the 12 months ended September 30, 2016, the broader U.S. fixed income market, as represented by the Bloomberg Barclays U.S. Aggregate Bond Index, which tracks Treasuries and other investment-grade debt securities, gained 5.19%, while non-investment grade bonds rose 12.73%, as measured by the Bloomberg Barclays U.S. Corporate High Yield Bond Index.
The strength of the global economy will likely remain a leading concern for markets in the months ahead, and investors will watch with great interest the actions of the Fed and other major central banks. The U.S. economy’s continued growth, as evidenced by recent strong jobs, housing, and consumer spending data, should give investors reason for optimism, but future market direction will be determined largely by the ability of corporations to continue to produce robust earnings.
Market uncertainty is an ever-present reminder of the importance of portfolio diversification, including exposure to both traditional and alternative asset classes. While diversification cannot guarantee a profit or prevent a loss, owning a variety of asset classes may cushion your portfolio against inevitable market fluctuations. Your financial advisor can help you ensure that your portfolio is adequately diversified across asset classes and investment strategies.
As always, thank you for entrusting Virtus with your assets. Should you have questions about your account or require assistance, please visit our website at Virtus.com, or call our customer service team at 1-800-243-1574. We appreciate your business and remain committed to your long-term financial success.
Sincerely,
George R. Aylward President, Virtus Mutual Funds
October 2016 | ||

Performance data quoted represents past results. Past performance is no guarantee of future results, and current performance may be higher or lower than the performance shown above.
1
Table of Contents
VIRTUS OPPORTUNITIES TRUST
Disclosure of Fund Expenses (Unaudited)
For the six-month period of April 1, 2016 to September 30, 2016
We believe it is important for you to understand the impact of costs on your investment. All mutual funds have operating expenses. As a shareholder of a Virtus Opportunities Trust Fund (each, a “Fund”) you may incur two types of costs: (1) transaction costs, including sales charges on purchases of Class A shares and contingent deferred sales charges on Class C shares; and (2) ongoing costs, including investment advisory fees, distribution and service fees, and other expenses. Class I shares and Class R6 shares are sold without sales charges and do not incur distribution and service fees. For further information regarding applicable sales charges, see Note 1 in the Notes to Financial Statements. These examples are intended to help you understand your ongoing costs (in dollars) of investing in a Fund and to compare these costs with the ongoing costs of investing in other mutual funds. These examples are based on an investment of $1,000 invested at the beginning of the period and held for the entire six-month period. The following Expense Table illustrates your Fund’s costs in two ways.
Actual Expenses
The first section of the accompanying table provides information about actual account values and actual expenses. You may use the information in this section, together with the amount you invested, to estimate the expenses that you paid over the period. Simply divide your account value by $1,000 (for example, an $8,600 account value divided by $1,000 = 8.6), then multiply the result by the number in the first section under the heading “Expenses Paid During Period” to estimate the expenses you paid on your account during the period.
Hypothetical Example for Comparison Purposes
The second section of the accompanying table provides information about hypothetical account values and hypothetical expenses based on each Fund’s actual expense ratio and an assumed rate of return of 5% per year before expenses, which is not your Fund’s actual return. The hypothetical account values and expenses may not be used to estimate the actual ending account balance or expenses you paid for the period. You may use this information to compare the ongoing costs of investing in your Fund and other funds. To do so, compare these 5% hypothetical examples with the 5% hypothetical examples that appear in the shareholder reports of the other funds.
Please note that the expenses shown in the accompanying table are meant to highlight your ongoing costs only and do not reflect any transactional costs, such as sales charges or contingent deferred sales charges. Therefore, the second section of the accompanying table is useful in comparing ongoing costs only, and will not help you determine the relative total costs of owning different funds. In addition, if these transactional costs were included, your costs would have been higher. The calculations assume no shares were bought or sold during the period. Your actual costs may have been higher or lower, depending on the amount of your investment and the timing of any purchases or redemptions.
| Expense Table | ||||||||||||||||
| Beginning Account Value April 1, 2016 | Ending Account Value September 30, 2016 | Annualized Expense Ratio | Expenses Paid During Period* | |||||||||||||
Alternatives Diversifier Fund |
| |||||||||||||||
Actual | ||||||||||||||||
Class A | $ | 1,000.00 | $ | 1,074.00 | 0.75 | % | $ | 3.89 | ||||||||
Class C | 1,000.00 | 1,069.80 | 1.51 | 7.81 | ||||||||||||
Class I | 1,000.00 | 1,075.00 | 0.51 | 2.65 | ||||||||||||
Hypothetical (5% return before expenses) |
| |||||||||||||||
Class A | 1,000.00 | 1,021.25 | 0.75 | 3.79 | ||||||||||||
Class C | 1,000.00 | 1,017.45 | 1.51 | 7.62 | ||||||||||||
Class I | 1,000.00 | 1,022.45 | 0.51 | 2.58 | ||||||||||||
Equity Trend Fund |
| |||||||||||||||
Actual | ||||||||||||||||
Class A | $ | 1,000.00 | $ | 1,037.30 | 1.46 | % | $ | 7.44 | ||||||||
Class C | 1,000.00 | 1,033.90 | 2.06 | 10.47 | ||||||||||||
Class I | 1,000.00 | 1,038.80 | 1.28 | 6.52 | ||||||||||||
Class R6 | 1,000.00 | 1,039.60 | 1.07 | 5.46 | ||||||||||||
Hypothetical (5% return before expenses) |
| |||||||||||||||
Class A | 1,000.00 | 1,017.70 | 1.46 | 7.36 | ||||||||||||
Class C | 1,000.00 | 1,014.70 | 2.06 | 10.38 | ||||||||||||
Class I | 1,000.00 | 1,018.60 | 1.28 | 6.46 | ||||||||||||
Class R6 | 1,000.00 | 1,019.65 | 1.07 | 5.40 | ||||||||||||
Global Equity Trend Fund |
| |||||||||||||||
Actual | ||||||||||||||||
Class A | $ | 1,000.00 | $ | 1,055.20 | 1.79 | % | $ | 9.20 | ||||||||
Class C | 1,000.00 | 1,051.00 | 2.54 | 13.02 | ||||||||||||
Class I | 1,000.00 | 1,056.00 | 1.54 | 7.92 | ||||||||||||
Hypothetical (5% return before expenses) |
| |||||||||||||||
Class A | 1,000.00 | 1,016.05 | 1.79 | 9.02 | ||||||||||||
Class C | 1,000.00 | 1,012.30 | 2.54 | 12.78 | ||||||||||||
Class I | 1,000.00 | 1,017.30 | 1.54 | 7.77 | ||||||||||||
Herzfeld Fund |
| |||||||||||||||
Actual | ||||||||||||||||
Class A | $ | 1,000.00 | $ | 1,118.60 | 1.63 | % | $ | 8.63 | ||||||||
Class C | 1,000.00 | 1,114.70 | 2.38 | 12.58 | ||||||||||||
Class I | 1,000.00 | 1,119.60 | 1.37 | 7.26 | ||||||||||||
Hypothetical (5% return before expenses) |
| |||||||||||||||
Class A | 1,000.00 | 1,016.85 | 1.63 | 8.22 | ||||||||||||
Class C | 1,000.00 | 1,013.10 | 2.38 | 11.98 | ||||||||||||
Class I | 1,000.00 | 1,018.15 | 1.37 | 6.91 | ||||||||||||
Multi-Asset Trend Fund |
| |||||||||||||||
Actual | ||||||||||||||||
Class A | $ | 1,000.00 | $ | 1,058.50 | 1.61 | % | $ | 8.29 | ||||||||
Class C | 1,000.00 | 1,054.30 | 2.36 | 12.12 | ||||||||||||
Class I | 1,000.00 | 1,059.40 | 1.36 | 7.00 | ||||||||||||
Hypothetical (5% return before expenses) |
| |||||||||||||||
Class A | 1,000.00 | 1,016.95 | 1.61 | 8.12 | ||||||||||||
Class C | 1,000.00 | 1,013.20 | 2.36 | 11.88 | ||||||||||||
Class I | 1,000.00 | 1,018.20 | 1.36 | 6.86 | ||||||||||||
2
Table of Contents
Disclosure of Fund Expenses (Unaudited) (Continued)
For the six-month period of April 1, 2016 to September 30, 2016
| Beginning Account Value April 1, 2016 | Ending Account Value September 30, 2016 | Annualized Expense Ratio | Expenses Paid During Period* | |||||||||||||
Sector Trend Fund |
| |||||||||||||||
Actual | ||||||||||||||||
Class A | $ | 1,000.00 | $ | 1,026.40 | 1.04 | % | $ | 5.27 | ||||||||
Class C | 1,000.00 | 1,022.20 | 1.79 | 9.05 | ||||||||||||
Class I | 1,000.00 | 1,027.30 | 0.79 | 4.00 | ||||||||||||
Hypothetical (5% return before expenses) |
| |||||||||||||||
Class A | 1,000.00 | 1,019.80 | 1.04 | 5.25 | ||||||||||||
Class C | 1,000.00 | 1,016.05 | 1.79 | 9.02 | ||||||||||||
Class I | 1,000.00 | 1,021.05 | 0.79 | 3.99 | ||||||||||||
| * | Expenses are equal to the relevant Fund’s annualized expense ratio, which is net of waived fees and reimbursed expenses, if applicable, multiplied by the average account value over the period, multiplied by the number of days (183) expenses were accrued in the most recent fiscal half-year, then divided by 366 to reflect the one-half year period. |
For Funds which may invest in other funds, the annualized expense ratios noted above do not reflect fees and expenses associated with the underlying funds. If such fees and expenses had been included, the expenses would have been higher.
You can find more information about the Funds’ expenses in the Financial Statements section that follows. For additional information on operating expenses and other shareholder costs, refer to the prospectus.
3
Table of Contents
(Unaudited)
Alternatives Diversifier Composite Index
The Alternatives Diversifier Composite consists of Diversified Trends Index (15%)*, FTSE EPRA/NAREIT Developed Rental Index-net (20%)**, MSCI World Infrastructure Sector Capped Index (15%)*** , S&P North American Natural Resources Sector Index (10%), Deutsche Bank Liquid Commodity Index (15%), Deutsche Bank G10 Currency Harvest Index (15%)**** and Credit Suisse Leveraged Loan Index (10%). The indexes are unmanaged, their returns do not reflect any fees, expenses, or sales charges, and they are not available for direct investment. *Prior to 3/1/12 was the HFRX Equity Market Neutral Index (20%). **Prior to 6/1/15 was the UBS Global Investors (Real Estate) Index (20%). ***Prior to 9/1/08 was a mix of the MSCI USA Utilities Index (65%), MSCI World Telecom Services Index (20%) and MSCI World ex US Utilities Index (15%). ****Prior to 3/1/12 was Deutsche Bank G10 Currency Harvest Index (10%).
American Depositary Receipt (ADR)
Represents shares of foreign companies traded in U.S. dollars on U.S. exchanges that are held by a U.S. bank or a trust. Foreign companies use ADRs in order to make it easier for Americans to buy their shares.
Bloomberg Barclays U.S. Aggregate Bond Index
The Bloomberg Barclays U.S. Aggregate Bond Index measures the U.S. investment grade fixed rate bond market. The index is calculated on a total return basis. The index is unmanaged, its returns do not reflect any fees, expenses, or sales charges, and it is not available for direct investment.
Bloomberg Barclays U.S. Corporate High Yield Bond Index
The Bloomberg Barclays U.S. Corporate High Yield Bond Index measures the U.S. dollar-denominated, high yield, fixed-rate corporate bond market. The index is calculated on a total return basis. The index is unmanaged, its returns do not reflect any fees, expenses, or sales charges, and it is not available for direct investment.
Brexit
A combination of the words “Britain” and “exit” which refers to Britain’s withdrawal form the European Union.
Chicago Board Options Exchange (CBOE) Volatility Index
The Chicago Board Options Exchange (CBOE) Volatility Index (“VIX®”) shows the market’s expectation of 30-day volatility. It is constructed using the implied volatilities of a wide range of S&P 500® Index options. This volatility is meant to be forward looking and is calculated from both calls and puts. The VIX® is a widely used measure of market risk and is often referred to as the “investor fear gauge.” The index is unmanaged, its returns do not reflect any fees, expenses, or sales charges, and is not available for direct investment.
Credit Suisse Leveraged Loan Index
The Credit Suisse Leveraged Loan Index is designed to mirror the investable universe of the U.S. dollar denominated leveraged loan market, calculated on a total return basis.
Deutsche Bank G10 Currency Harvest Index
The Deutsche Bank G10 Currency Harvest Index consists of long futures contracts on the three G10 currencies associated with the highest interest rates and short futures contracts on the three G10 currencies associated with the lowest interest rates.
Deutsche Bank Liquid Commodity Index
The Deutsche Bank Liquid Commodity Index (DBLCI) tracks the performance of six commodity futures: sweet light crude oil (WTI), heating oil, aluminum, gold, wheat, and corn.
Diversified Trends Index
The Diversified Trends Index is the S&P Diversified Trends Indicator, a diversified composite of global commodity and financial futures that are highly liquid. The components are formed into sectors that are long or short the underlying futures using a rules-based methodology. The indicator measures the extent and duration of the trends of these sectors in aggregate. The index is calculated on a total return basis.
4
Table of Contents
KEY INVESTMENT TERMS (Continued)
(Unaudited)
Dow Jones Global Moderate Portfolio Index
The Dow Jones Global Moderate Portfolio Index is a benchmark that takes 60% of the risk of the global securities market. It is a total returns index that is a time-varying weighted average of stocks, bonds, and cash. The index is the efficient allocation of stocks, bonds, and cash in a portfolio with 60% of the risk of the Dow Jones Aggressive Portfolio Index. The index is calculated on a total return basis with dividends reinvested. The index is unmanaged, its returns do not reflect any fees, expenses, or sales charges, and it is not available for direct investment.
European Union (“EU”)
The European Union (“EU”) is a unique economic and political union of 28 European countries. The EU was created in the aftermath of the Second World War that has become a single market for goods and services and it created the single currency the euro.
Exchange-Traded Funds (ETF)
An open-end fund that is traded on a stock exchange. Most ETFs have a portfolio of stocks or bonds that track a specific market index.
Federal Reserve (the “Fed”)
The Central Bank of the United States, responsible for controlling the money supply, interest rates and credit with the goal of keeping the U.S. economy and currency stable. Governed by a seven-member board, the system includes 12 regional Federal Reserve Banks, 25 branches and all national and state banks that are part of the system.
FTSE EPRA/NAREIT Developed Rental Index (net)
The FTSE EPRA/NAREIT Developed Rental Index (net) is a free-float market capitalization-weighted index measuring global real estate securities, which meet minimum size, liquidity and investment focus criteria. The index is a sub-set of the FTSE EPRA/NAREIT Investment Focus Index Series, which separates the existing constituents into both Rental and Non-Rental Indices. A company is classified as Rental if the rental revenue from properties is greater than or equal to 70% of total revenue. The classification is based on revenue sources as disclosed in the latest published financial statement. The index is calculated on a total return basis with net dividends reinvested. The index is unmanaged, its returns do not reflect any fees, expenses, or sales charges, and it is not available for direct investment.
Global Industry Classification Standard (GICS)
The Global Industry Classification Standard (GICS) is a standardized classification system for equities that was developed by, and is the exclusive property and a service mark of, MSCI Inc. (MSCI) and Standard & Poor’s, a division of the McGraw-Hill Companies, Inc. (S&P). As of September 1, 2016, the GICS structure comprises 11 sectors, 24 industry groups, 68 industries, and 157 subindustries.
Herzfeld Composite Index (60% MSCI AC World Index (net)/40% Bloomberg Barclays U.S. Aggregate Bond Index)
The composite index consists of 60% MSCI AC World Index (net) and 40% Bloomberg Barclays U.S. Aggregate Bond Index. The MSCI AC World Index (net) is a free float-adjusted market capitalization-weighted index that measures equity performance of developed and emerging markets. The index is calculated on a total return basis with net dividends reinvested. The Bloomberg Barclays U.S. Aggregate Bond Index measures the U.S. investment grade fixed rate bond market. The index is calculated on a total return basis. Each index is unmanaged, its returns do not reflect any fees, expenses, or sales charges, and is not available for direct investment.
HFRX Equity Market Neutral Index
The HFRX Equity Market Neutral Index is a common benchmark for long/short market neutral hedge funds, which employ sophisticated quantitative techniques of analyzing price data to ascertain information about future price movement and relationships between select securities for purchase and sale.
iShares®
Represents shares of an open-end exchange-traded fund.
Master Limited Partnership (MLP)
A type of limited partnership that is publicly traded. The partnership must derive most of its cash flows from real estate, natural resources and commodities.
5
Table of Contents
KEY INVESTMENT TERMS (Continued)
(Unaudited)
MSCI All-Country World ex USA Utilities Index
The MSCI All-Country World (ACWI) ex USA Utilities Index includes large and mid cap securities across 22 of 23 developed markets countries (excluding the US) and 23 emerging markets countries. All securities in the index are classified in the utilities sector as per the Global Industry Classification Standard (GICS®).
MSCI All Country World Index (Net)
The MSCI All Country World Index (Net) is a free float-adjusted market capitalization-weighted index that measures equity performance of developed and emerging markets. The index is calculated on a total return basis with net dividends reinvested. The index is unmanaged, its returns do not reflect any fees, expenses, or sales charges, and is not available for direct investment.
MSCI EAFE® Index (net)
The MSCI EAFE® (Europe, Australasia, Far East) Index (net) is a free float-adjusted market capitalization-weighted index that measures developed foreign market equity performance, excluding the U.S. and Canada. The index is calculated on a total return basis with net dividends reinvested. The index is unmanaged, its returns do not reflect any fees, expenses, or sales charges, and it is not available for direct investment.
MSCI Emerging Markets Index (net)
The MSCI Emerging Markets Index (net) is a free float-adjusted market capitalization-weighted index designed to measure equity market performance in the global emerging markets. The index is calculated on a total return basis with net dividends reinvested. The index is unmanaged, its returns do not reflect any fees, expenses, or sales charges, and it is not available for direct investment.
MSCI USA Utilities Index
The MSCI USA Utilities Index is designed to capture the large and mid cap segments of the U.S. equity universe. All securities in the index are classified in the utilities sector as per the Global Industry Classification Standard (GICS®).
MSCI World Infrastructure Sector Capped Index
The MSCI World Infrastructure Sector Capped Index is a market capitalization weighted index that measures performance of global infrastructure companies by capturing broad and diversified opportunities across telecommunication, utilities, energy, transportation, and social infrastructure sectors. The telecommunication, infrastructure and utilities sectors each represent one-third of the index weight, while energy, transportation and social infrastructure sectors have a combined weight of the remaining one-third of the index. The index is calculated on a total return basis with net dividends reinvested.
MSCI World Telecom Services Index
The MSCI World Telecom Services Index is designed to capture the large and midcap segments across 23 developed markets countries. All securities in the index are classified in the Telecommunication Services sector as per the Global Industry Classification Standard (GICS®).
Russell 2000® Index
The Russell 2000® Index is a market capitalization-weighted index of the 2,000 smallest companies in the Russell Universe, which comprises the 3,000 largest U.S. companies. The index is calculated on a total return basis with dividends reinvested. The index is unmanaged, its returns do not reflect any fees, expenses, or sales charges, and it is not available for direct investment.
S&P 500® Index
The S&P 500® Index is a free-float market capitalization-weighted index of 500 of the largest U.S. companies. The index is calculated on a total return basis with dividends reinvested. The index is unmanaged, its returns do not reflect any fees, expenses, or sales charges, and it is not available for direct investment.
S&P North American Natural Resources Sector Index
The S&P North American Natural Resources Index provides investors with a benchmark that represents U.S. traded securities that are classified under the GICS® energy and materials sector excluding the chemicals industry; and steel sub-industry.
UBS Global Investors (Real Estate) Index
The UBS Global Investors (Real Estate) Index measures the global investable universe of publicly traded real estate securities that derive 70% or more of total revenue from rental income.
6
Table of Contents
Fund Summary | Ticker Symbols: Class A: PDPAX Class C: PDPCX Class I: VADIX |
Portfolio Manager Commentary by Virtus Investment Advisers
| ¢ | The Fund is non-diversified and has an investment objective of long-term capital appreciation. |
| ¢ | For the fiscal year ended September 30, 2016, the Fund’s Class A shares at NAV returned 9.74%, Class C shares returned 8.86%, and Class I shares returned 9.94%. For the same period, the S&P 500® Index, a broad-based equity index, returned 15.43%, and the Alternatives Diversifier Composite Index, the Fund’s style-specific index appropriate for comparison, returned 8.70%. |
All performance figures assume reinvestment of distributions and exclude the effect of sales charges. Past performance is no guarantee of future results, and current performance may be higher or lower than the performance shown above.
Effective September 7, 2016, the Virtus Alternatives Diversifier Fund’s former subadviser and portfolio managers were removed from the management of the Fund. The commentary below, which discusses performance achieved largely by the former subadviser and portfolio managers, was provided by the Fund’s adviser.
How did the markets perform during the Fund’s fiscal year?
Global markets continued to experience increased volatility over the 12-month period, with correlations increasing between domestic and international equities before bottoming in February. At their lows, the S&P 500® Index was down 12.47% and the MSCI All Country World Index (ACWI) was down 14.16%, as a result of China growth concerns, global recession, and central bank disappointments. However, the S&P 500® Index and MSCI ACWI both staged strong recoveries, and ended the period strongly positive, up 15.43% and 11.96%, respectively. Also impacting markets was the much anticipated U.K. “Brexit” vote on June 23, which resulted in the unexpected outcome to withdraw from the European Union. Following the Brexit decision, markets grinded higher through September, as central banks remained accommodative.
Bond markets remained subdued for the period, with government yields in most developed markets
trending lower, resulting in higher bond prices. However, concerns over rising interest rates remained an overhang, with consensus anticipating a rate hike at the Fed’s end-of-year meeting.
Commodity markets were heavily under pressure during the period. West Texas Intermediate (WTI) crude oil fell to a low of $26.21 a barrel on February 11 before recovering to almost $50.00 by fiscal year-end after oversupply and inventories found better equilibrium. Generally, the slow pace of global growth, particularly in China, caused industrial metals and other natural resources to be under pressure before slowly recovering later in the period.
What factors affected the Fund’s performance during its fiscal year?
The Fund’s sector selection within commodities and slight underweight was a positive performance driver, as it was a volatile asset class, ultimately ending in slightly negative territory at the end of the period. The Fund’s exposure to global infrastructure securities was also beneficial, with the snap-back in energy-related companies, as well as strong performance from defensive sectors such as utilities, contributing strongly versus the benchmark.
Detractors from performance were primarily driven by the Fund’s underweight to real estate, both domestic and international, with both sector and security selection bringing down performance relative to the benchmark. Global currencies were also challenging to navigate; while absolute returns were positive, they slightly lagged the benchmark. The U.S. dollar hit a high point at the end of November 2015, before retreating, and by fiscal year-end, negatively impacted the portfolio.
Effective September 7, 2016, the Fund’s management changed, and the portfolio began to transition to the new management. The transition continued through the end of the period.
The preceding information is the opinion of portfolio management. Any such opinions are subject to change at any time based upon market or other conditions and should not be relied upon as investment
advice. Past performance is no guarantee of future results, and there is no guarantee that market forecasts will be realized.
There is no guarantee that the Fund will meet its objective.
Equity Securities: The market price of equity securities may be adversely affected by financial market, industry, or issuer-specific events. Focus on a particular style or on small or medium-sized companies may enhance that risk.
Credit & Interest: Debt securities are subject to various risks, the most prominent of which are credit and interest rate risk. The issuer of a debt security may fail to make interest and/or principal payments. Values of debt securities may rise or fall in response to changes in interest rates, and this risk may be enhanced with longer-term maturities.
Industry/Sector Concentration: A fund that focuses its investments in a particular industry or sector will be more sensitive to conditions that affect that industry or sector than a non-concentrated fund.
Derivatives: Investments in derivatives such as futures, options, forwards, and swaps may increase volatility or cause a loss greater than the principal investment.
Allocation: The fund’s exposure to different asset classes may not be optimal for market conditions at a given time. Asset allocation does not guarantee a profit or protect against a loss in declining markets.
Foreign Investing: Investing internationally involves additional risks such as currency, political, accounting, economic, and market risk.
Real Estate: The fund may be negatively affected by factors specific to the real estate market, including interest rates, leverage, property, and management.
Fund of funds: Because the fund can invest in other funds, it indirectly bears its proportionate share of the operating expenses and management fees of the underlying fund(s).
Affiliated Funds: The fund’s adviser can select affiliated and/or unaffiliated funds, which may create a conflict of interest.
Prospectus: For additional information on risks, please see the fund’s prospectus.
For information regarding the indexes and certain investment terms, see the Key Investment Terms starting on page 4.
7
Table of Contents
| Alternatives Diversifier Fund (Continued) |
| Asset Allocation | ||||
The following table presents asset allocations within certain sectors and as a percentage of total investments as of September 30, 2016.
|
| |||
Affiliated Equity Mutual Funds | 50 | % | ||
Exchange-Traded Funds | 49 | |||
Money Market Mutual Fund | 1 | |||
|
| |||
Total | 100 | % | ||
|
| |||
For information regarding the indexes and certain investment terms, see the Key Investment Terms starting on page 4.
8
Table of Contents
Alternatives Diversifier Fund (Continued)
| Average Annual Total Returns1 for periods ended 9/30/16 | ||||||||||||||||||||
| 1 year | 5 years | 10 years | Since Inception | Inception Date | ||||||||||||||||
| Class A Shares at NAV2 | 9.74 | % | 3.65 | % | 1.74 | % | — | — | ||||||||||||
| Class A Shares at POP3,4 | 3.43 | 2.43 | 1.14 | — | — | |||||||||||||||
| Class C Shares at NAV2 and with CDSC4 | 8.86 | 2.86 | 0.97 | — | — | |||||||||||||||
| Class I Shares at NAV | 9.94 | 3.90 | — | 4.04 | % | 10/1/09 | ||||||||||||||
| S&P 500® Index | 15.43 | 16.37 | 7.24 | 13.59 | 5 | — | ||||||||||||||
| Alternatives Diversifier Composite Index | 8.70 | 3.63 | 2.30 | 4.00 | 5 | — | ||||||||||||||
Fund Expense Ratios6: A Shares: 1.62%; C Shares: 2.37%; I Shares: 1.37%.
All returns represent past performance which is no guarantee of future results. Current performance may be higher or lower than the performance shown. The investment return and principal value of an investment will fluctuate so that an investor’s shares, when redeemed, may be worth more or less than their original cost. The above table and graph below do not reflect the deduction of taxes that a shareholder would pay on fund distributions or the redemption of shares. Please visit Virtus.com for performance data current to the most recent month-end.
| 1 | Total returns are historical and include changes in share price and the reinvestment of both dividends and capital gains distributions. |
| 2 | “NAV” (Net Asset Value) total returns do not include the effect of any sales charge. |
| 3 | “POP” (Public Offering Price) total returns include the effect of the maximum front-end 5.75% sales charge. |
| 4 | “CDSC” (Contingent Deferred Sales Charge) is applied to redemptions of certain classes of shares that do not have a sales charge applied at the time of purchase. CDSC charges for certain redemptions of Class A shares made within 18 months of purchase in which a finder’s fee was paid and all redemptions of Class C shares within the first year are 1% and 0% thereafter. |
| 5 | The since inception index returns are from the inception date of Class I. |
| 6 | The expense ratios of the Fund are set forth according to the prospectus for the Fund effective January 28, 2016, as supplemented and revised, and may differ from the expense ratios disclosed in the Financial Highlights tables in this report. See the Financial Highlights for more current expense ratios. Expense ratios include fees and expenses associated with underlying funds. |
Growth of $10,000 For periods ended 9/30
This chart assumes an initial investment of $10,000 made on September 30, 2006, for Class A and Class C shares including any applicable sales charges or fees. Performance assumes reinvestment of dividends and capital gain distributions.
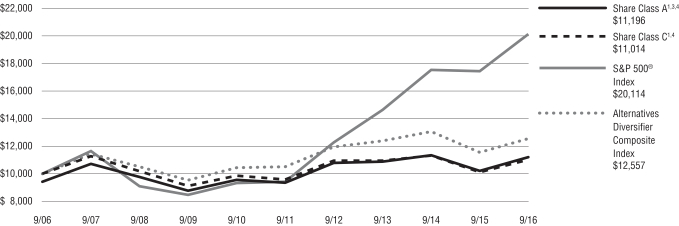
The indexes are unmanaged and not available for direct investment; therefore, their performance does not reflect the expenses associated with active management of an actual portfolio.
For information regarding the indexes and certain investment terms, see the Key Investment Terms starting on page 4.
9
Table of Contents
Fund Summary | Ticker Symbols: Class A: VAPAX Class C: VAPCX Class I: VAPIX Class R6: VRPAX |
Portfolio Manager Commentary by Virtus Investment Advisers
| ¢ | The Fund is diversified and has an investment objective of long-term capital appreciation. |
| ¢ | For the fiscal year ended September 30, 2016, the Fund’s Class A shares at NAV returned 0.74%, Class C shares returned 0.08%, Class I shares returned 0.98%, and Class R6 shares returned 1.15%. For the same period, the S&P 500® Index, both the broad-based equity index and the style specific index, returned 15.43%. |
All performance figures assume reinvestment of distributions and exclude the effect of sales charges. Past performance is no guarantee of future results, and current performance may be higher or lower than the performance shown above.
How did the markets perform during the Fund’s fiscal year?
Over the past 12 months, the S&P 500® Index climbed by over 15%. While this performance is slightly above historical averages, the encouraging headline number masks the significant turbulence that was experienced along the way.
The beginning of October 2015 marked the point of rebound from a steep, but brief, 10% market correction during August and September. The strong relief rally which persisted through October faded as year-end 2015 approached, and November and December were marked by sideways performance and increasing risk (as measured by the CBOE Volatility Index (“VIX® Index”). Expectations of central bank rate increases, multiple tensions in the geopolitical arena, and a minor meltdown in the junk bond market all contributed to a general sense of discomfort.
This discomfort was validated in January 2016 with another steep market correction. The losses extended into February with fear evolving into outright panic. Existing concerns related to slowing growth in China were exacerbated by a steep decline in oil prices, highlighting the stagnant levels of global economic growth. By the third week of February, though, the wave of selling had passed, and the “greed” trade had taken over from the “fear” trade. A strong, extended rally was in place that would last until late spring/early
summer. At that point, the U.K.’s pending “Brexit” vote became the “fear of the moment,” taking some of the steam out of the stock market.
Global market reaction to the eventual Brexit decision in late June was puzzling. In the first two trading sessions after the vote, the U.S. equity market dropped in excess of 5%, as measured by the S&P 500® Index. European markets fared even worse. Within a week, however, the prior market highs were regained. It appeared that the rally was back in place but, in fact, it evolved into a frustrating, sideways market throughout the rest of the summer. A brief risk flare in the middle of September – loosely linked to Federal Reserve rate hike fears – was dispatched relatively quickly and the market level at fiscal year-end was near all-time highs.
What factors affected the Fund’s performance during its fiscal year?
The Fund trailed the S&P 500® Index by over 14% for the year. The underperformance was primarily due to two whipsaw events that occurred in rapid succession. A “whipsaw” event is when a stock (or index) price quickly reverses direction. The Fund can be impacted by these events because price moves drive both the portfolio allocations and the risk management mechanisms. For example, the dramatic risk flare that occurred in August and September 2015 (at the end of the Fund’s 2015 fiscal year) caused the Fund to adopt a defensive posture and introduce a significant allocation to cash equivalents. This happened as the S&P 500® Index level fell below its 200-day moving average, signaling that all weak sub-industries in the portfolio (as measured by their own 200-day moving average analyses) should be removed from the portfolio and replaced with cash equivalents. As the market’s strong recovery began in early October 2015, over half the Fund’s assets were invested in cash equivalents, and full equity exposure did not resume until the beginning of November, at which point the Fund significantly trailed the Index. Unfortunately, by that time, the market had begun to weaken once again.
A similar whipsaw event occurred in the first quarter of 2016. Between December 31, 2015 and March 24, 2016, the performance of the U.S. stock market was essentially flat. In the early weeks of the quarter, though, the market had declined by more than 10%. The severity of the decline, and the steepness of the
subsequent recovery, led to another situation where the Fund adopted a large allocation to cash equivalents, just in time for the recovery to begin. In this case, the Fund locked in additional underperformance as it had less than 30% exposure to equities during the market’s 10% rebound. As with the prior whipsaw event, this defensive positioning was guided by a breach of the key 200-day moving average price level by the S&P 500® Index. At the time of the whipsaw, the VIX® Index was elevated, reaching levels in excess of 28, indicating significant stress in the stock market. By the time the portfolio was fully re-invested in equities, the VIX® had quickly fallen to below 14.
The Fund has built-in mechanisms to mitigate the negative impact of this sort of event, but whipsaws cannot be avoided entirely. The most damaging feature of the past year, though, was the fact that the Fund experienced two whipsaw events in a relatively short period of time. While single, isolated whipsaw events can be observed with some frequency, it is exceedingly rare for two severe events to occur so close together. The damage caused by these two whipsaw events can be seen if we separate the performance on those days when the Fund was fully invested from those days when the Fund had an allocation to cash equivalents. Nearly 12% of the 14.4% of underperformance experienced during the year occurred during periods when the Fund had a defensive cash equivalent position in place.
The preceding information is the opinion of portfolio management. Any such opinions are subject to change at any time based upon market or other conditions and should not be relied upon as investment advice. Past performance is no guarantee of future results, and there is no guarantee that market forecasts will be realized.
There is no guarantee that the Fund will meet its objective.
Equity Securities: The market price of equity securities may be adversely affected by financial market, industry, or issuer-specific events. Focus on a particular style or on small or medium-sized companies may enhance that risk.
Industry/Sector Concentration: A fund that focuses its investments in a particular industry or sector will be more sensitive to conditions that affect that industry or sector than a non-concentrated fund.
For information regarding the indexes and certain investment terms, see the Key Investment Terms starting on page 4.
10
Table of Contents
| Equity Trend Fund (Continued) |
Allocation: The fund’s exposure to different asset classes may not be optimal for market conditions at a given time. Asset allocation does not guarantee a profit or protect against a loss in declining markets.
Prospectus: For additional information on risks, please see the fund’s prospectus.
| Asset Allocation | ||||
The following table presents asset allocations within certain sectors and as a percentage of total investments as of September 30, 2016. |
| |||
Consumer Discretionary | 24 | % | ||
Information Technology | 14 | |||
Consumer Staples | 13 | |||
Industrials | 12 | |||
Materials | 10 | |||
Health Care | 9 | |||
Real Estate | 8 | |||
Other | 10 | |||
|
| |||
Total | 100 | % | ||
|
| |||
For information regarding the indexes and certain investment terms, see the Key Investment Terms starting on page 4.
11
Table of Contents
Equity Trend Fund (Continued)
| Average Annual Total Returns1 for periods ended 9/30/16 | ||||||||||||||||
| 1 year | 5 years | Since Inception | Inception Date | |||||||||||||
| Class A Shares at NAV2 | 0.74 | % | 6.44 | % | 7.90 | % | 7/1/10 | |||||||||
| Class A Shares at POP3,4 | -5.05 | 5.18 | 6.89 | 7/1/10 | ||||||||||||
| Class C Shares at NAV2 and with CDSC4 | 0.08 | 5.66 | 7.11 | 7/1/10 | ||||||||||||
| Class I Shares at NAV | 0.98 | 6.69 | 8.16 | 7/1/10 | ||||||||||||
| Class R6 Shares at NAV | 1.15 | — | -5.64 | 11/12/14 | ||||||||||||
| S&P 500® Index | 15.43 | 16.37 | — | 5 | — | |||||||||||
Fund Expense Ratios6: A Shares: Gross 1.55%, Net 1.44%; C Shares: Gross 2.30%, Net 2.04%; I Shares: Gross 1.30%, Net 1.26%; R6 Shares: Gross 1.23%, Net 1.05%.
All returns represent past performance which is no guarantee of future results. Current performance may be higher or lower than the performance shown. The investment return and principal value of an investment will fluctuate so that an investor’s shares, when redeemed, may be worth more or less than their original cost. The above table and graph below do not reflect the deduction of taxes that a shareholder would pay on fund distributions or the redemption of shares. Please visit Virtus.com for performance data current to the most recent month-end.
| 1 | Total returns are historical and include changes in share price and the reinvestment of both dividends and capital gains distributions. |
| 2 | “NAV” (Net Asset Value) total returns do not include the effect of any sales charge. |
| 3 | “POP” (Public Offering Price) total returns include the effect of the maximum front-end 5.75% sales charge. |
| 4 | “CDSC” (Contingent Deferred Sales Charge) is applied to redemptions of certain classes of shares that do not have a sales charge applied at the time of purchase. CDSC charges for certain redemptions of Class A shares made within 18 months of purchase in which a finder’s fee was paid and all redemptions of Class C shares within the first year are 1% and 0% thereafter. |
| 5 | The index returned 15.10% for Classes A, C, and I since the inception date of those respective classes and 5.56% since the inception date of Class R6. |
| 6 | The expense ratios of the Fund are set forth according to the prospectus for the Fund effective January 28, 2016, as supplemented and revised, and may differ from the expense ratios disclosed in the Financial Highlights tables in this report. See the Financial Highlights for more current expense ratios. Net expense: Expenses reduced by the contractual fee waiver, in effect through January 31, 2017. Gross Expense: Does not reflect the effect of the fee waiver. Expense ratios include fees and expenses associated with underlying funds. |
Growth of $10,000 For periods ended 9/30
This chart assumes an initial investment of $10,000 made on July 1, 2010 (inception date of the Fund), for Class A, Class C, and Class I shares including any applicable sales charges or fees. Performance assumes reinvestment of dividends and capital gain distributions.

The indexes are unmanaged and not available for direct investment; therefore, their performance does not reflect the expenses associated with active management of an actual portfolio.
For information regarding the indexes and certain investment terms, see the Key Investment Terms starting on page 4.
12
Table of Contents
Fund Summary | Ticker Symbols: Class A: VGPAX Class C: VGPCX Class I: VGPIX |
Portfolio Manager Commentary by Virtus Investment Advisers
| ¢ | The Fund is diversified and has an investment objective of capital appreciation. In pursuing this objective, the Fund maintains an emphasis on preservation of capital. |
| ¢ | For the fiscal year ended September 30, 2016, the Fund’s Class A shares at NAV returned 1.84%, Class C shares returned 1.04%, and Class I shares returned 2.15%. For the same period, the S&P 500® Index, a broad-based equity index, returned 15.43%. MSCI All Country World Index (net), the Fund’s style-specific benchmark appropriate for comparison returned 11.96%. |
All performance figures assume reinvestment of distributions and exclude the effect of sales charges. Past performance is no guarantee of future results, and current performance may be higher or lower than the performance shown above.
How did the markets perform during the Fund’s fiscal year?
Over the past 12 months, the S&P 500® Index climbed by over 15%. The MSCI All-Country World Index (net) was up 11.96% during the same period. In both cases, the encouraging headline numbers masked significant turbulence that was experienced along the way.
The beginning of October 2015 marked the point of rebound from a steep, but brief, global market correction during August and September. The strong relief rally which persisted through October faded as year-end 2015 approached, and November and December were marked by sideways performance in the U.S. and further deterioration globally. Expectations of central bank rate increases, multiple tensions in the geopolitical arena, and a minor meltdown in the junk bond market all contributed to a general sense of discomfort.
This discomfort was validated in January 2016 with another steep market correction. The losses extended into February with a second dip, as fear evolved into outright panic. Existing concerns related to slowing growth in China were exacerbated by a steep decline in oil prices, highlighting the stagnant levels of global economic growth. By the third week of February,
though, the wave of selling had passed, and the “greed” trade had taken over from the “fear” trade. A strong, extended rally was in place that would last until late spring/early summer. At that point, the U.K.’s pending “Brexit” vote became the “fear of the moment,” taking some of the steam out of global markets, especially outside the U.S.
Global market reaction to the eventual Brexit decision in late June was puzzling. In the first two trading sessions after the vote, the U.S. equity market dropped in excess of 5%, as measured by the S&P 500® Index. European markets fared far worse in the initial panic. In due course, though, the prior market highs were regained. It appeared that the rally was back in place, but it evolved into a frustrating, sideways, choppy market throughout the rest of the summer, with the U.S. underperforming global markets (but still up for the period). A brief risk flare in the middle of September, which was loosely linked to interest rate fears, was dispatched relatively quickly and the market level at the end of September was near all-time highs.
What factors affected the Fund’s performance during its fiscal year?
The Fund’s underperformance of its benchmark was primarily due to two whipsaw events that occurred in rapid succession.
A “whipsaw” event is when a stock or index price quickly reverses direction. The Fund can be impacted by these events because price moves drive both the portfolio allocations and the risk management mechanisms. For example, the dramatic risk flare that occurred in August and September 2015 (at the end of the Fund’s 2015 fiscal year) caused the Fund to adopt a defensive posture in the U.S. portion of the portfolio and introduce a significant allocation to cash equivalents. This happened as the S&P 500® Index level fell below its 200-day moving average, signaling that all weak U.S. sub-industries in the portfolio (as measured by their own 200-day moving average analyses) should be removed from the portfolio and replaced with cash equivalents. During this period, given the relative weakness in non-U.S. markets, the global portion of the portfolio maintained an additional cash buffer, leading to cash equivalent levels approaching 70% of the total portfolio. As the market’s strong recovery began in early October 2015, this significant defensive positioning weighed on the
Fund’s ability to participate. Unfortunately, by the time the Fund began to reduce its position in cash equivalents and take on additional risk, the markets had begun to weaken once again.
A similar whipsaw event occurred in the first quarter of 2016. Between December 31, 2015 and March 24, 2016, the performance of the U.S. stock market was essentially flat, and global markets were down slightly. In the early weeks of the quarter, though, the U.S. equity market had declined by more than 10%, and global equity markets were down about 12%. The severity of these declines, and the steepness of the subsequent recovery, led to another situation where the Fund adopted a large allocation to cash equivalents, just in time for the recovery to begin.
The Fund has built-in mechanisms to mitigate the negative impact of this sort of event, but whipsaws cannot be avoided entirely. The most damaging feature of the past year, though, was the fact that the Fund experienced two whipsaw events in a relatively short period of time. While single, isolated whipsaw events can be observed with some frequency, it is exceedingly rare for two severe events to occur so close together.
The preceding information is the opinion of portfolio management. Any such opinions are subject to change at any time based upon market or other conditions and should not be relied upon as investment advice. Past performance is no guarantee of future results, and there is no guarantee that market forecasts will be realized.
There is no guarantee that the Fund will meet its objective.
Equity Securities: The market price of equity securities may be adversely affected by financial market, industry, or issuer-specific events. Focus on a particular style or on small or medium-sized companies may enhance that risk.
Industry/Sector Concentration: A fund that focuses its investments in a particular industry or sector will be more sensitive to conditions that affect that industry or sector than a non-concentrated fund.
Exchange Traded Funds: The value of an ETF may be more volatile than the underlying portfolio of securities the ETF is designed to track. The costs of owning the ETF may exceed the cost of investing directly in the underlying securities.
For information regarding the indexes and certain investment terms, see the Key Investment Terms starting on page 4.
13
Table of Contents
| Global Equity Trend Fund (Continued) |
Foreign & Emerging Markets: Investing internationally, especially in emerging markets, involves additional risks such as currency, political, accounting, economic, and market risk.
Allocation: The fund’s exposure to different asset classes may not be optimal for market conditions at a given time. Asset allocation does not guarantee a profit or protect against a loss in declining markets.
Prospectus: For additional information on risks, please see the fund’s prospectus.
Fund of funds: Because the fund can invest in other funds, it indirectly bears its proportionate share of the operating expenses and management fees of the underlying fund(s).
| Asset Allocation | ||||||||
The following table presents asset allocations within certain sectors and as a percentage of total investments as of September 30, 2016. |
| |||||||
Common Stocks | 58 | % | ||||||
Consumer Discretionary | 14 | % | ||||||
Information Technology | 8 | |||||||
Consumer Staples | 7 | |||||||
Industrials | 6 | |||||||
Materials | 6 | |||||||
Health Care | 6 | |||||||
All other Common Stocks | 11 | |||||||
Exchange-Traded Funds | 42 | |||||||
|
| |||||||
Total | 100 | % | ||||||
|
| |||||||
For information regarding the indexes and certain investment terms, see the Key Investment Terms starting on page 4.
14
Table of Contents
Global Equity Trend Fund (Continued)
| Average Annual Total Returns1 for periods ended 9/30/16 | ||||||||||||||||
| 1 year | 5 years | Since Inception | Inception Date | |||||||||||||
| Class A Shares at NAV2 | 1.84 | % | 3.95 | % | 2.48 | % | 3/15/11 | |||||||||
| Class A Shares at POP3,4 | -4.01 | 2.73 | 1.39 | 3/15/11 | ||||||||||||
| Class C Shares at NAV2 and with CDSC4 | 1.04 | 3.21 | 1.72 | 3/15/11 | ||||||||||||
| Class I Shares at NAV | 2.15 | 4.22 | 2.72 | 3/15/11 | ||||||||||||
| S&P 500® Index | 15.43 | 16.37 | 12.30 | 5 | — | |||||||||||
| MSCI AC World Index (Net) | 11.96 | 10.63 | 6.87 | 5 | — | |||||||||||
Fund Expense Ratios6: A Shares: 1.78%; C Shares: 2.53%; I Shares: 1.53%.
All returns represent past performance which is no guarantee of future results. Current performance may be higher or lower than the performance shown. The investment return and principal value of an investment will fluctuate so that an investor’s shares, when redeemed, may be worth more or less than their original cost. The above table and graph below do not reflect the deduction of taxes that a shareholder would pay on fund distributions or the redemption of shares. Please visit Virtus.com for performance data current to the most recent month-end.
| 1 | Total returns are historical and include changes in share price and the reinvestment of both dividends and capital gains distributions. |
| 2 | “NAV” (Net Asset Value) total returns do not include the effect of any sales charge. |
| 3 | “POP” (Public Offering Price) total returns include the effect of the maximum front-end 5.75% sales charge. |
| 4 | “CDSC” (Contingent Deferred Sales Charge) is applied to redemptions of certain classes of shares that do not have a sales charge applied at the time of purchase. CDSC charges for certain redemptions of Class A shares made within 18 months of purchase in which a finder’s fee was paid and all redemptions of Class C shares within the first year are 1% and 0% thereafter. |
| 5 | The since inception index returns are from the Fund’s inception date. |
| 6 | The expense ratios of the Fund are set forth according to the prospectus for the Fund effective January 28, 2016, as supplemented and revised, and may differ from the expense ratios disclosed in the Financial Highlights tables in this report. See the Financial Highlights for more current expense ratios. Expense ratios include fees and expenses associated with underlying funds. |
Growth of $10,000 For periods ended 9/30
This chart assumes an initial investment of $10,000 made on March 15, 2011 (inception date of the Fund), for Class A, Class C, and Class I shares including any applicable sales charges or fees. Performance assumes reinvestment of dividends and capital gain distributions.
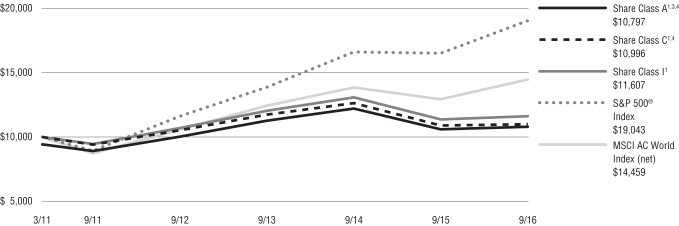
The indexes are unmanaged and not available for direct investment; therefore, their performance does not reflect the expenses associated with active management of an actual portfolio.
For information regarding the indexes and certain investment terms, see the Key Investment Terms starting on page 4.
15
Table of Contents
Fund Summary | Ticker Symbols: Class A: VHFAX Class C: VHFCX Class I: VHFIX |
Portfolio Manager Commentary by Thomas J. Herzfeld Advisors, Inc.
| ¢ | The Fund is non-diversified and has investment objectives of capital appreciation and current income. |
| ¢ | For the fiscal year ended September 30, 2016, the Fund’s Class A shares at NAV returned 16.04%, Class C shares returned 15.22%, and Class I shares returned 16.40%. For the same period, the Fund’s style-specific benchmark, the Herzfeld Composite Index, which consists of 60% MSCI All Country World Index (net) and 40% Bloomberg Barclays U.S. Aggregate Index, returned 9.43%. Performance for the composite’s underlying indices over the period was 11.96% for the MSCI AC World Index (net) and 5.19% for the Bloomberg Barclays U.S. Aggregate Bond Index. |
All performance figures assume reinvestment of distributions and exclude the effect of sales charges. Past performance is no guarantee of future results and current performance may be higher or lower than the performance shown above.
How did the markets perform during the Fund’s fiscal year?
Over the Fund’s fiscal year, global equity markets rose 11.96%, as measured by the MSCI All Country World Index (net), while the Bloomberg Barclays U.S. Aggregate Bond Index gained 5.19%, providing solid returns for both asset classes. The rally in equities was due to the rebound in commodity-sensitive stocks, with energy, industrials, and materials leading the way, while technology continued to be an area investors looked to for growth. Within fixed income, credit and high yield rallied as fears of defaults in commodity-sensitive companies abated, leading to strong gains in those sectors.
The trend of widening closed-end fund discounts that started in September 2012 ended in January 2016, which gave a boost to the product class through the end of September 2016. The closed-end fund (“CEF”) industry started the fiscal year with an average weighted discount of -9.99%, and closed the year at -5.03%, narrowing 4.96 percentage points (Source: Bloomberg, compiled by Thomas J. Herzfeld Advisors). Discount narrowing and positive returns for both equity and fixed income CEFs is the holy
grail for CEF investors as leveraged positions during a bull market enhance returns, and discount narrowing adds to the alpha.
The period was not without its headaches, however. Between the solid fiscal year gains, global equity markets saw their sharpest sell-off since 2009, with the MSCI AC World Index (net) dropping more than 10% in the first six weeks of 2016 before reversing course in mid-February. The sell-off followed the first Fed rate hike since 2006, increasing worries of a slowing China once again, and the continued bear market in oil.
In January at the peak of selling, CEFs traded at their widest discounts since the “flash crash” of August 2015 (the widest they had been since 2009), before making an about-face and starting the current discount narrowing trend. Cyclical discount-narrowing trends have historically peaked at premiums before reversing. CEF investors continued to buy fixed income funds, through the end of the Fund’s fiscal year, as they exhibited the strongest discount narrowing trends.
What factors affected the Fund’s performance during its fiscal year?
Significant CEF discount narrowing, after more than three years of discount widening had a positive effect on the Fund’s performance in the fiscal year. The use of leverage by the CEF holdings hurt the Fund for the first part of the fiscal year before helping generate strong returns since February. From September 30, 2015 to February 11, 2016, the Fund’s A share (VHFAX) dropped 8.92% on a total return basis before rallying 27.41% on a total return basis through the end of the fiscal year.
The Fund was fully invested as we headed into calendar 2016. Historically, CEFs have exhibited discount narrowing in the first few months of the year due to the year-end phenomenon of discount widening as a direct result of seasonal tax-loss selling. However, discounts widened significantly to start the year, exacerbating the Fund’s poor performance. We remained invested throughout the equity market sell-off in the early part of 2016 as we believed the CEFs were exhibiting capitulation which is typically the best time to buy. Remaining fully invested once the sell-off started turned out to be the correct decision as the rebound was extremely sharp
for CEFs. The last thing investors in CEFs typically want to do is chase a rising market as it is difficult to add to positions at attractive prices because few investors are selling shares and the spreads are wide.
Energy CEFs provided the best returns in the period for the Fund but were also the most volatile. They were the worst performers from the start of the Fund’s fiscal year through February before becoming the best performers over the next seven months and for the one-year period. We continued to overweight energy, through the end of the Fund’s fiscal year, as we believe the rebound in this space would continue.
Preferred shares provided some of the best risk-adjusted returns for the portfolio, although they lagged the overall return of the Fund. Our top three preferred holdings, Oxford Lane 8.125% (“OXLCN”), Oxford Lane 7.50% (“OXLCO”), and MVC Capital 7.25% (“MVCB”), generated returns in excess of 10% while exhibiting less volatility than the overall CEF market. We continued to hold a large portion of the portfolio in these preferred shares, through the end of the Fund’s fiscal year, as fixed income CEFs were not attractive with their narrow discounts and lower yields at that time.
Health care was the weakest performer in the fiscal year as political discourse was the main driver of the price action. Presidential candidates excoriated increasing drug prices in the news, focusing on some of the bad actors in the space which worried investors. As a result, our large allocation to healthcare hurt the Fund’s performance over the period. Over the last six months, health care showed signs of a rebound. We continued to like the space through the end of the Fund’s fiscal year, due to its historically low valuations combined with future expected growth.
The preceding information is the opinion of portfolio management. Any such opinions are subject to change at any time based on market or other conditions and should not be relied upon as investment advice. Past performance is no guarantee of future results, and there is no guarantee that market forecasts will be realized.
There is no guarantee that the Fund will meet its objectives.
For information regarding the indexes and certain investment terms, see the Key Investment Terms starting on page 4.
16
Table of Contents
| Herzfeld Fund (Continued) |
| Asset Allocation | ||||
The following table presents asset allocations within certain sectors and as a percentage of total investments as of September 30, 2016.
|
| |||
Equity Funds | 30 | % | ||
Preferred Stocks | 26 | |||
International Equity Funds | 17 | |||
Fixed Income Funds | 6 | |||
International Fixed Income Funds | 1 | |||
Other (includes short-term investments) | 20 | |||
|
| |||
Total | 100 | % | ||
|
| |||
Closed-end Funds: Closed-end funds may trade at a discount from their net asset values, which may affect whether the fund will realize gains or losses. They may also employ leverage, which may increase volatility.
Equity Securities: The market price of equity securities may be adversely affected by financial market, industry, or issuer-specific events. Focus on a particular style or on small or medium-sized companies may enhance that risk.
Credit & Interest: Debt securities are subject to various risks, the most prominent of which are credit and interest rate risk. The issuer of a debt security may fail to make interest and/or principal payments. Values of debt securities may rise or fall in response to changes in interest rates, and this risk may be enhanced with longer-term maturities.
Foreign & Emerging Markets: Investing internationally, especially in emerging markets, involves additional risks such as currency, political, accounting, economic, and market risk.
Fund of funds: Because the fund can invest in other funds, it indirectly bears its proportionate share of the operating expenses and management fees of the underlying fund(s).
Prospectus: For additional information on risks, please see the fund’s prospectus.
For information regarding the indexes and certain investment terms, see the Key Investment Terms starting on page 4.
17
Table of Contents
Herzfeld Fund (Continued)
| Average Annual Total Returns1 for periods ended 9/30/16 | ||||||||||||
| 1 year | Since Inception | Inception Date | ||||||||||
| Class A Shares at NAV2 | 16.04 | % | 6.83 | % | 9/5/12 | |||||||
| Class A Shares at POP3,4 | 9.36 | 5.28 | 9/5/12 | |||||||||
| Class C Shares at NAV2 and with CDSC | 15.22 | 6.04 | 9/5/12 | |||||||||
| Class I Shares at NAV | 16.40 | 7.11 | 9/5/12 | |||||||||
MSCI AC World Index (net) | 11.96 | 8.99 | 5 | — | ||||||||
| Bloomberg Barclays U.S. Aggregate Bond Index | 5.19 | 2.57 | 5 | — | ||||||||
| Herzfeld Composite: 60% MSCI AC World Index (net) / 40% Bloomberg Barclays U.S. Aggregate Index | 9.43 | 6.53 | 5 | — | ||||||||
Fund Expense Ratios6: A Shares: Gross 2.91%, Net 2.78%; C Shares: Gross 3.66%, Net 3.53%; I Shares: Gross 2.66%, Net 2.53%.
All returns represent past performance which is no guarantee of future results. Current performance may be higher or lower than the performance shown. The investment return and principal value of an investment will fluctuate so that an investor’s shares, when redeemed, may be worth more or less than their original cost. The above table and graph below do not reflect the deduction of taxes that a shareholder would pay on fund distributions or the redemption of shares. Please visit Virtus.com for performance data current to the most recent month-end.
| 1 | Total returns are historical and include changes in share price and the reinvestment of both dividends and capital gains distributions. |
| 2 | “NAV” (Net Asset Value) total returns do not include the effect of any sales charge. |
| 3 | “POP” (Public Offering Price) total returns include the effect of the maximum front-end 5.75% sales charge. |
| 4 | “CDSC” (Contingent Deferred Sales Charge) is applied to redemptions of certain classes of shares that do not have a sales charge applied at the time of purchase. CDSC charges for certain redemptions of Class A shares made within 18 months of purchase in which a finder’s fee was paid and all redemptions of Class C shares within the first year are 1% and 0% thereafter. |
| 5 | The since inception index returns are from the Fund’s inception date. |
| 6 | The expense ratios of the Fund are set forth according to the prospectus for the Fund effective January 28, 2016, as supplemented and revised, and may differ from the expense ratios disclosed in the Financial Highlights tables in this report. See the Financial Highlights for more current expense ratios. Net Expense: Expenses reduced by the contractual fee waiver in effect through January 31, 2017. Gross Expense: Does not reflect the effect of the fee waiver. Expense ratios include fees and expenses associated with underlying funds. |
Growth of $10,000 For periods ended 9/30
This chart assumes an initial investment of $10,000 made on September 5, 2012 (inception date of the Fund), for Class A, Class C, and Class I shares including any applicable sales charges or fees. Performance assumes reinvestment of dividends and capital gain distributions.
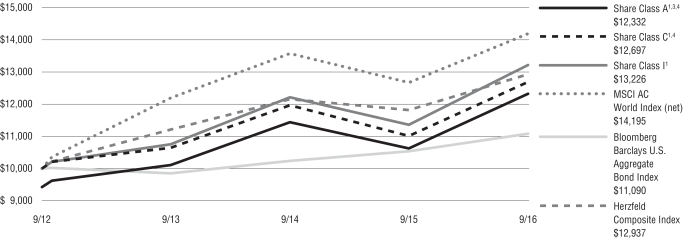
The indexes are unmanaged and not available for direct investment; therefore, their performance does not reflect the expenses associated with active management of an actual portfolio.
For information regarding the indexes and certain investment terms, see the Key Investment Terms starting on page 4.
18
Table of Contents
Fund Summary | Ticker Symbols: Class A: VAAAX Class C: VAACX Class I: VAISX |
Portfolio Manager Commentary by Virtus Investment Advisers
| ⬛ | The Fund is diversified and has an investment objective of capital appreciation. In pursuing this objective, the Fund maintains an emphasis on preservation of capital. |
| ⬛ | For the fiscal year ended September 30, 2016, the Fund’s Class A shares at NAV returned 3.82%, Class C shares returned 3.06%, and Class I shares returned 4.08%*. For the same period, the S&P 500® Index, a broad-based equity index, returned 15.43%. Dow Jones Global Moderate Portfolio Index, the Fund’s style-specific index appropriate for comparison, returned 10.98%. |
| * | See footnote 7 on page 21. |
All performance figures assume reinvestment of distributions and exclude the effect of sales charges. Past performance is no guarantee of future results, and current performance may be higher or lower than the performance shown above.
How did the markets perform during the Fund’s fiscal year?
Over the past 12 months, the S&P 500® Index climbed by over 15%. The Dow Jones Moderate Portfolio Index, which is the Fund’s primary benchmark, climbed by nearly 11%. While the headline numbers are positive, investors experienced significant turbulence along the way.
The beginning of October 2015 marked the point of rebound from a steep, but brief, global market correction during August and September. The strong relief rally which persisted through October faded as year-end 2015 approached, and November and December were marked by sideways performance in the U.S. and further deterioration globally. Expectations of central bank rate increases, multiple tensions in the geopolitical arena, and a minor meltdown in the junk bond market all contributed to a general sense of discomfort.
This discomfort was validated in January 2016, with another steep market correction. The losses extended into February, with a second dip, as fear evolved into outright panic. Existing concerns related to slowing growth in China were exacerbated by a steep decline in oil prices, highlighting the stagnant levels of global economic growth.
By the third week of February, though, the wave of selling had passed, and the “greed” trade had taken over from the “fear” trade. A strong, extended rally was in place that would last until late spring/early summer. At that point, the U.K.’s pending “Brexit” vote became the “fear of the moment,” taking some of the steam out of global markets, especially outside of the U.S.
Global market reaction to the eventual Brexit decision in late June was puzzling. In the first two trading sessions after the vote, the U.S. equity market dropped in excess of 5%, as measured by the S&P 500® Index. European markets fared even worse. Within a week, however, the prior market highs were regained. It appeared that the rally was back in place but, in fact, it evolved into a frustrating, sideways market throughout the rest of the summer. A brief risk flare in the middle of September —loosely linked to Federal Reserve rate hike fears — was dispatched relatively quickly and the market level at fiscal year-end was near all-time highs.
What factors affected the Fund’s performance during its fiscal year?
The Fund’s underperformance of the benchmark was primarily due to two whipsaw events that occurred in rapid succession.
A “whipsaw” event is when a stock (or index) price quickly reverses direction. The Fund can be impacted by these events because price moves drive both the portfolio allocations and the risk management mechanisms. For example, the dramatic risk flare that occurred in August and September 2015 (at the end of the Fund’s 2015 fiscal year) caused the Fund to adopt a defensive posture in the U.S. equity portion of the portfolio, introducing a significant allocation to cash equivalents. This happened as the S&P 500® Index level fell below its 200-day moving average, signaling that all weak U.S. sub-industries in the portfolio (as measured by their own 200-day moving average analyses) should be removed from the portfolio and replaced with cash equivalents. During this period, given the relative weakness in non-U.S. markets, the global portion of the portfolio maintained an additional cash buffer, leading to increased cash equivalent levels across the total portfolio, and highly conservative positioning in the alternatives and fixed income components. As the market’s strong recovery began in early October 2015, this significant defensive
positioning weighed on the Fund’s ability to participate. Unfortunately, by the time the Fund began to reduce the cash equivalents position and take on additional risk, the markets had begun to weaken once again.
A similar whipsaw event occurred in the first quarter of 2016. Between December 31, 2015 and March 24, 2016, the performance of the U.S. stock market was essentially flat, and global markets were down slightly. In the early weeks of the quarter, though, the U.S. market had declined by more than 10%, and global markets were down about 12%. The severity of these declines, and the steepness of the subsequent recovery, led to another situation where the Fund adopted a large allocation to cash equivalents, just in time for the recovery to begin.
The Fund has built-in mechanisms to mitigate the negative impact of this sort of event, but whipsaws cannot be avoided entirely. The most damaging feature of the past year, though, was the fact that the Fund experienced two whipsaw events in a relatively short period of time. While single, isolated whipsaw events can be observed with some frequency, it is exceedingly rare for two severe events to occur so close together.
The preceding information is the opinion of portfolio management. Any such opinions are subject to change at any time based upon market or other conditions and should not be relied upon as investment advice. Past performance is no guarantee of future results, and there is no guarantee that market forecasts will be realized.
There is no guarantee that the Fund will meet its objective.
Equity Securities: The market price of equity securities may be adversely affected by financial market, industry, or issuer-specific events. Focus on a particular style or on small or medium-sized companies may enhance that risk.
Industry/Sector Concentration: A fund that focuses its investments in a particular industry or sector will be more sensitive to conditions that affect that industry or sector than a non-concentrated fund.
Credit & Interest: Debt securities are subject to various risks, the most prominent of which are credit and interest rate risk. The issuer of a debt security may fail to make interest and/or principal payments.
For information regarding the indexes and certain investment terms, see the Key Investment Terms starting on page 4.
19
Table of Contents
| Multi-Asset Trend Fund (Continued) |
Values of debt securities may rise or fall in response to changes in interest rates, and this risk may be enhanced with longer-term maturities.
High Yield-High Risk Fixed Income Securities: There is a greater level of credit risk and price volatility involved with high yield securities than investment grade securities.
Foreign & Emerging Markets: Investing internationally, especially in emerging markets, involves additional risks such as currency, political, accounting, economic, and market risk.
Exchange Traded Funds: The value of an ETF may be more volatile than the underlying portfolio of securities the ETF is designed to track. The costs of owning the ETF may exceed the cost of investing directly in the underlying securities.
Commodity-Linked: Commodity-linked instruments may experience a return different than the commodity they attempt to track and may also be exposed to counterparty risk.
Allocation: The fund’s exposure to different asset classes may not be optimal for market conditions at a given time. Asset allocation does not guarantee a profit or protect against a loss in declining markets.
Prospectus: For additional information on risks, please see the fund’s prospectus.
| Asset Allocation | ||||||||
The following table presents asset allocations within certain sectors and as a percentage of total investments as of September 30, 2016.
|
| |||||||
Exchange-Traded Funds | 63 | % | ||||||
Common Stocks | 37 | |||||||
Consumer Discretionary | 9 | % | ||||||
Information Technology | 5 | |||||||
Consumer Staples | 5 | |||||||
All other Common Stocks | 18 | |||||||
|
| |||||||
Total | 100 | % | ||||||
|
| |||||||
For information regarding the indexes and certain investment terms, see the Key Investment Terms starting on page 4.
20
Table of Contents
Multi-Asset Trend Fund (Continued)
| Average Annual Total Returns1 for periods ended 9/30/16 | ||||||||||||||||
| 1 year | 5 years | Since Inception | �� | Inception Date | ||||||||||||
| Class A Shares at NAV2 | 3.82 | % | 3.71 | % | 2.75 | % | 3/15/11 | |||||||||
| Class A Shares at POP3,4 | -2.15 | 2.49 | 1.66 | 3/15/11 | ||||||||||||
| Class C Shares at NAV2 and with CDSC4 | 3.06 | 2.94 | 2.01 | 3/15/11 | ||||||||||||
| Class I Shares at NAV7 | 4.08 | 3.95 | 3.00 | 3/15/11 | ||||||||||||
| S&P 500® Index | 15.43 | 16.37 | 12.30 | 5 | — | |||||||||||
| Dow Jones Global Moderate Portfolio IndexSM | 10.98 | 8.66 | 6.70 | 5 | — | |||||||||||
Fund Expense Ratios6: A Shares: 1.75%; C Shares: 2.50%; I Shares: 1.50%.
All returns represent past performance which is no guarantee of future results. Current performance may be higher or lower than the performance shown. The investment return and principal value of an investment will fluctuate so that an investor’s shares, when redeemed, may be worth more or less than their original cost. The above table and graph below do not reflect the deduction of taxes that a shareholder would pay on fund distributions or the redemption of shares. Please visit Virtus.com for performance data current to the most recent month-end.
| 1 | Total returns are historical and include changes in share price and the reinvestment of both dividends and capital gains distributions. |
| 2 | “NAV” (Net Asset Value) total returns do not include the effect of any sales charge. |
| 3 | “POP” (Public Offering Price) total returns include the effect of the maximum front-end 5.75% sales charge. |
| 4 | “CDSC” (Contingent Deferred Sales Charge) is applied to redemptions of certain classes of shares that do not have a sales charge applied at the time of purchase. CDSC charges for certain redemptions of Class A shares made within 18 months of purchase in which a finder’s fee was paid and all redemptions of Class C shares within the first year are 1% and 0% thereafter. |
| 5 | The index returns are from the Fund’s inception date. |
| 6 | The expense ratios of the Fund are set forth according to the prospectus for the Fund effective January 28, 2016, as supplemented and revised, and may differ from the expense ratios disclosed in the Financial Highlights tables in this report. See the Financial Highlights for more current expense ratios. Expense ratios include fees and expenses associated with underlying funds. |
| 7 | Total Return for the report period presented in the table differs from the return in the Financial Highlights. The total return presented in the above table is calculated based on the NAV at which shareholder transactions were processed. The total return presented in the Financial Highlights section of the report is calculated in the same manner, but also takes into account certain adjustments that are necessary under generally accepted accounting principals required in the annual report and semiannual report. |
Growth of $10,000 For periods ended 9/30
This chart assumes an initial investment of $10,000 made on March 15, 2011 (inception date of the Fund), for Class A, Class C, and Class I shares including any applicable sales charges or fees. Performance assumes reinvestment of dividends and capital gain distributions.
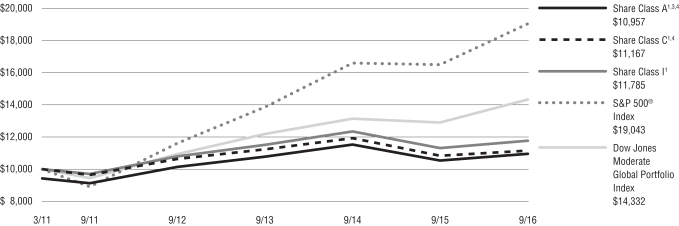
The indexes are unmanaged and not available for direct investment; therefore, their performance does not reflect the expenses associated with active management of an actual portfolio.
For information regarding the indexes and certain investment terms, see the Key Investment Terms starting on page 4.
21
Table of Contents
Fund Summary | Ticker Symbols: Class A: PWBAX Class C: PWBCX Class I: VARIX |
Portfolio Manager Commentary by Virtus Investment Advisers
| ⬛ | The Fund is diversified and has an investment objective of long-term capital appreciation. |
| ⬛ | For the fiscal year ended September 30, 2016, the Fund’s Class A shares at NAV returned 3.45%*, Class C shares returned 2.60%, and Class I shares returned 3.65%. For the same period, the S&P 500® Index, which is both the broad-based equity index and the Fund’s style-specific benchmark, returned 15.43%. |
| * | See footnote 7 on page 24. |
All performance figures assume reinvestment of distributions and exclude the effect of sales charges. Past performance is no guarantee of future results, and current performance may be higher or lower than the performance shown above.
How did the markets perform during the Fund’s fiscal year?
Over the past 12 months, the S&P 500® Index climbed by over 15%. While this performance is slightly above historical averages, the encouraging headline number masks the significant turbulence that was experienced along the way.
The beginning of October 2015 marked the point of rebound from a steep, but brief, 10% market correction during August and September. The strong relief rally which persisted through October faded as year-end 2015 approached, and November and December were marked by sideways performance and increasing risk (as measured by the CBOE Volatility Index (“VIX® Index”). Expectations of central bank rate increases, multiple tensions in the geopolitical arena, and a minor meltdown in the junk bond market all contributed to a general sense of discomfort.
This discomfort was validated in January 2016 with another steep market correction. The losses extended into February with fear evolving into outright panic. Existing concerns related to slowing growth in China were exacerbated by a steep decline in oil prices, highlighting the stagnant levels of global economic growth. By the third week of February, though, the wave of selling had passed, and the “greed” trade had taken over from the “fear” trade. A strong, extended
rally was in place that would last until late spring/early summer. At that point, the U.K.’s pending “Brexit” vote became the “fear of the moment,” taking some of the steam out of the stock market.
Global market reaction to the eventual Brexit decision in late June was puzzling. In the first two trading sessions after the vote, the U.S. equity market dropped in excess of 5%, as measured by the S&P 500® Index. European markets fared even worse. Within a week, however, the prior market highs were regained. It appeared that the rally was back in place but, in fact, it evolved into a frustrating, sideways market throughout the rest of the summer. A brief risk flare in the middle of September loosely linked to Federal Reserve rate hike fears was dispatched relatively quickly and the market level at fiscal year-end was near all-time highs.
What factors affected the Fund’s performance during its fiscal year?
The Fund trailed the S&P 500® Index by over 11% for the year. This underperformance was primarily due to two whipsaw events that occurred in rapid succession.
A “whipsaw” event is when a stock (or index) price quickly reverses direction. The Fund can be impacted by these events because price moves drive both the portfolio allocations and the risk management mechanisms. For example, the dramatic risk flare that occurred in August and September 2015 (at the end of the Fund’s 2015 fiscal year) caused the Fund to adopt a defensive posture and introduce a significant allocation to cash equivalents. During the first week of October 2015, the Fund reached a 100% allocation to cash equivalents. This defensive positioning was adopted as each of the nine (at the time) sectors within the S&P 500® Index fell below their 200-day average levels (a measurement that is subject to a five-day confirmation period). The timing was unfortunate, as it became clear in hindsight that the market’s strong recovery had already begun. Full equity exposure didn’t resume until the beginning of November, at which point the Fund had locked in 8.04% of underperformance. By that time, the market had begun to weaken once again.
A similar whipsaw event occurred in the first quarter of 2016. Between December 31, 2015 and March 24, 2016, the performance of the U.S. stock market was
essentially flat. In the early weeks of the quarter, though, the market had declined by more than 10%. The severity of the decline, and the steepness of the subsequent recovery, led to another situation where the Fund adopted a large allocation to cash equivalents, just in time for the recovery to begin. In this case, the Fund handled the whipsaw much better, but still locked in a loss of 1.41%. One big difference during this whipsaw as compared to the last was the relatively smaller allocation to cash equivalents, maxing out at around 60% of the portfolio.
The Fund has built-in mechanisms to mitigate the negative impact of this sort of event, but whipsaws cannot be avoided entirely. The most damaging feature of the past year, though, was the fact that the Fund experienced two whipsaw events in a relatively short period of time. While single, isolated whipsaw events can be observed with some frequency, it is exceedingly rare for two severe events to occur so close together.
The damage caused by these two whipsaw events can be seen if we separate the performance on those days when the Fund was fully invested from those days when the Fund had an allocation to cash equivalents. Over 9% of the underperformance experienced during the year occurred during periods when the Fund had a defensive cash equivalent position in place.
The preceding information is the opinion of portfolio management. Any such opinions are subject to change at any time based upon market or other conditions and should not be relied upon as investment advice. Past performance is no guarantee of future results, and there is no guarantee that market forecasts will be realized.
There is no guarantee that the Fund will meet its objective.
Equity Securities: The market price of equity securities may be adversely affected by financial market, industry, or issuer-specific events. Focus on a particular style or on small or medium-sized companies may enhance that risk.
Industry/Sector Concentration: A fund that focuses its investments in a particular industry or sector will be more sensitive to conditions that affect that industry or sector than a non-concentrated fund.
For information regarding the indexes and certain investment terms, see the Key Investment Terms starting on page 4.
22
Table of Contents
| Sector Trend Fund (Continued) |
Allocation: The fund’s exposure to different asset classes may not be optimal for market conditions at a given time. Asset allocation does not guarantee a profit or protect against a loss in declining markets.
Prospectus: For additional information on risks, please see the fund’s prospectus.
| Asset Allocation | ||||
The following table presents asset allocations within certain sectors and as a percentage of total investments as of September 30, 2016.
|
| |||
Consumer Staples | 20 | % | ||
Utilities | 20 | |||
Consumer Discretionary | 15 | |||
Health Care | 15 | |||
Energy | 5 | |||
Industrials | 5 | |||
Financials | 5 | |||
Other | 15 | |||
|
| |||
Total | 100 | % | ||
|
| |||
For information regarding the indexes and certain investment terms, see the Key Investment Terms starting on page 4.
23
Table of Contents
Sector Trend Fund (Continued)
| Average Annual Total Returns1 for periods ended 9/30/16 | ||||||||||||||||||||
| 1 year | 5 years | 10 years | Since Inception | Inception Date | ||||||||||||||||
| Class A Shares at NAV2,7 | 3.45 | % | 9.96 | % | 5.38 | % | — | — | ||||||||||||
| Class A Shares at POP3,4 | -2.49 | 8.66 | 4.76 | — | — | |||||||||||||||
| Class C Shares at NAV2 and with CDSC4 | 2.60 | 9.12 | 4.60 | — | — | |||||||||||||||
| Class I Shares at NAV | 3.65 | 10.21 | — | 10.02 | % | 10/1/09 | ||||||||||||||
| S&P 500® Index | 15.43 | 16.37 | 7.24 | 13.59 | 5 | — | ||||||||||||||
Fund Expense Ratios6: A Shares 1.01%; C Shares 1.76%; I Shares 0.76%.
All returns represent past performance which is no guarantee of future results. Current performance may be higher or lower than the performance shown. The investment return and principal value of an investment will fluctuate so that an investor’s shares, when redeemed, may be worth more or less than their original cost. The above table and graph below do not reflect the deduction of taxes that a shareholder would pay on fund distributions or the redemption of shares. Please visit Virtus.com for performance data current to the most recent month-end.
| 1 | Total returns are historical and include changes in share price and the reinvestment of both dividends and capital gains distributions. |
| 2 | “NAV” (Net Asset Value) total returns do not include the effect of any sales charge. |
| 3 | “POP” (Public Offering Price) total returns include the effect of the maximum front-end 5.75% sales charge. |
| 4 | “CDSC” (Contingent Deferred Sales Charge) is applied to redemptions of certain classes of shares that do not have a sales charge applied at the time of purchase. CDSC charges for certain redemptions of Class A shares made within 18 months of purchase in which a finder’s fee was paid and all redemptions of Class C shares within the first year are 1% and 0% thereafter. |
| 5 | The since inception index returns are from the inception date of Class I shares. |
| 6 | The expense ratios of the Fund are set forth according to the prospectus for the Fund effective January 28, 2016, as supplemented and revised, and may differ from the expense ratios disclosed in the Financial Highlights tables in this report. See the Financial Highlights for more current expense ratios. Expense ratios include fees and expenses associated with underlying funds. |
| 7 | Total Return for the report period presented in the table differs from the return in the Financial Highlights. The total return presented in the above table is calculated based on the NAV at which shareholder transactions were processed. The total return presented in the Financial Highlights section of the report is calculated in the same manner, but also takes into account certain adjustments that are necessary under generally accepted accounting principals required in the annual report and semiannual report. |
Growth of $10,000 For periods ended 9/30
This chart assumes an initial investment of $10,000 made on September 30, 2006, for Class A and Class C shares including any applicable sales charges or fees. Performance assumes reinvestment of dividends and capital gain distributions.
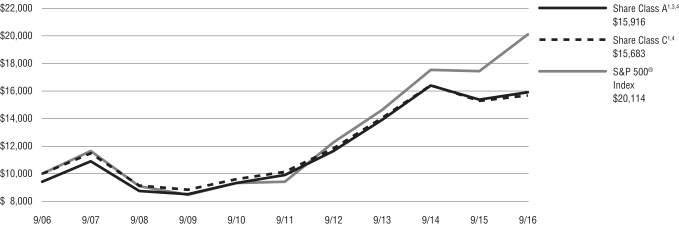
The indexes are unmanaged and not available for direct investment; therefore, their performance does not reflect the expenses associated with active management of an actual portfolio.
For information regarding the indexes and certain investment terms, see the Key Investment Terms starting on page 4.
24
Table of Contents
VIRTUS ALTERNATIVES DIVERSIFIER FUND
SCHEDULE OF INVESTMENTS
SEPTEMBER 30, 2016
($ reported in thousands)
| SHARES | VALUE | |||||||
| AFFILIATED MUTUAL FUNDS(3)—50.0% | ||||||||
| Equity Funds—42.4% | ||||||||
Virtus Global Infrastructure Fund Class I | 684,076 | $ | 9,734 | |||||
Virtus Global Real Estate Securities Fund Class I | 176,175 | 5,143 | ||||||
Virtus International Real Estate Securities Fund Class I | 766,372 | 5,564 | ||||||
Virtus Real Estate Securities Fund Class I | 118,789 | 4,375 | ||||||
|
| |||||||
| 24,816 | ||||||||
|
| |||||||
| Fixed Income Fund—7.6% | ||||||||
Virtus Senior Floating Rate Fund Class I | 475,774 | 4,486 | ||||||
| TOTAL AFFILIATED MUTUAL FUNDS (Identified Cost $20,545) | 29,302 | |||||||
| EXCHANGE-TRADED FUNDS(3)—49.0% | ||||||||
Global X Uranium Index Fund | 1,570 | 21 | ||||||
iShares S&P North American Natural Resources Sector Index Fund | 308,910 | 10,645 | ||||||
PowerShares DB Commodity Index Tracking Fund(2) | 539,600 | 8,099 | ||||||
PowerShares DB G10 Currency Harvest Fund(2) | 226,250 | 5,638 | ||||||
Vaneck Vectors Agribusiness Index Fund | 40,700 | 2,033 | ||||||
Vaneck Vectors Coal Index Fund | 172,332 | 2,034 | ||||||
WisdomTree Managed Futures Strategy Fund(2) | 5,800 | 244 | ||||||
| TOTAL EXCHANGE-TRADED FUNDS (Identified Cost $27,197) | 28,714 | |||||||
| TOTAL LONG TERM INVESTMENTS—99.0% | ||||||||
| (Identified Cost $47,742) | 58,016 | |||||||
| SHARES | VALUE | |||||||
| SHORT-TERM INVESTMENT—0.6% | ||||||||
| Money Market Mutual Fund—0.6% | ||||||||
JPMorgan U.S. Government Money Market Fund – Institutional Shares (seven-day effective yield 0.360%)(3) | 324,668 | $ | 325 | |||||
| TOTAL SHORT-TERM INVESTMENT (Identified Cost $325) | 325 | |||||||
| TOTAL INVESTMENTS—99.6% (Identified Cost $48,067) | 58,341 | (1) | ||||||
Other assets and liabilities, net—0.4% |
| 218 | ||||||
|
| |||||||
| NET ASSETS—100.0% | $ | 58,559 | ||||||
|
| |||||||
Footnote Legend:
| (1) | Federal Income Tax Information: For tax information at September 30, 2016, see Note 10 Federal Income Tax Information in the Notes to Financial Statements. |
| (2) | Non-income producing. |
| (3) | Shares of these funds are publicly offered and the prospectus and annual reports of each are publicly available. |
The following table provides a summary of inputs used to value the Fund’s investments as of September 30, 2016 (See Security Valuation Note 2A in the Notes to Financial Statements):
| Total Value at, September 30, 2016 | Level 1 Quoted Prices | |||||||
Equity Securities: |
| |||||||
Affiliated Mutual Funds | $ | 29,302 | $ | 29,302 | ||||
Exchange-Traded Funds | 28,714 | 28,714 | ||||||
Short-Term Investments | 325 | 325 | ||||||
|
|
|
| |||||
Total Investments | $ | 58,341 | $ | 58,341 | ||||
|
|
|
| |||||
There are no Level 2 (significant observable inputs) or Level 3 (significant unobservable inputs) priced securities.
There were no transfers between Level 1 and Level 2 related to securities held at September 30, 2016.
See Notes to Financial Statements
25
Table of Contents
SCHEDULE OF INVESTMENTS
SEPTEMBER 30, 2016
($ reported in thousands)
| SHARES | VALUE | |||||||
| COMMON STOCKS—99.3% | ||||||||
| Consumer Discretionary—24.1% | ||||||||
Advance Auto Parts, Inc. | 13,416 | $ | 2,001 | |||||
Amazon.com, Inc.(2) | 15,388 | 12,884 | ||||||
AutoNation, Inc.(2) | 13,387 | 652 | ||||||
AutoZone, Inc.(2) | 5,496 | 4,223 | ||||||
Best Buy Co., Inc. | 389,420 | 14,868 | ||||||
CarMax, Inc.(2) | 36,931 | 1,970 | ||||||
Chipotle Mexican Grill, Inc.(2) | 1,784 | 755 | ||||||
Comcast Corp. Class A | 165,054 | 10,950 | ||||||
Darden Restaurants, Inc. | 6,284 | 385 | ||||||
Dollar General Corp. | 44,493 | 3,114 | ||||||
Dollar Tree, Inc.(2) | 36,734 | 2,899 | ||||||
Expedia, Inc. | 5,048 | 589 | ||||||
Foot Locker, Inc. | 17,649 | 1,195 | ||||||
Gap, Inc. (The) | 33,223 | 739 | ||||||
Genuine Parts Co. | 150,046 | 15,072 | ||||||
Hasbro, Inc. | 79,033 | 6,270 | ||||||
Home Depot, Inc. (The) | 79,754 | 10,263 | ||||||
Horton (D.R.), Inc. | 146,179 | 4,415 | ||||||
Interpublic Group of Cos., Inc. (The) | 242,069 | 5,410 | ||||||
L Brands, Inc. | 35,589 | 2,519 | ||||||
Leggett & Platt, Inc. | 79,617 | 3,629 | ||||||
Lennar Corp. Class A | 79,754 | 3,377 | ||||||
LKQ Corp.(2) | 179,910 | 6,380 | ||||||
Lowe’s Cos., Inc. | 56,497 | 4,080 | ||||||
Mattel, Inc. | 238,916 | 7,234 | ||||||
McDonald’s Corp. | 52,550 | 6,062 | ||||||
Mohawk Industries, Inc.(2) | 37,194 | 7,451 | ||||||
Netflix, Inc.(2) | 16,617 | 1,638 | ||||||
Newell Brands, Inc. | 252,632 | 13,304 | ||||||
NIKE, Inc. Class B | 231,187 | 12,172 | ||||||
O’Reilly Automotive, Inc.(2) | 17,865 | 5,004 | ||||||
Omnicom Group, Inc. | 138,664 | 11,786 | ||||||
Priceline Group, Inc. (The)(2) | 2,005 | 2,950 | ||||||
PulteGroup, Inc. | 141,512 | 2,836 | ||||||
Ross Stores, Inc. | 55,624 | 3,577 | ||||||
Starbucks Corp. | 85,561 | 4,632 | ||||||
Target Corp. | 95,614 | 6,567 | ||||||
TJX Cos., Inc. (The) | 92,208 | 6,895 | ||||||
TripAdvisor, Inc.(2) | 4,356 | 275 | ||||||
Urban Outfitters, Inc.(2) | 13,983 | 483 | ||||||
Wynn Resorts Ltd. | 163,362 | 15,915 | ||||||
Yum! Brands, Inc. | 24,629 | 2,237 | ||||||
|
| |||||||
| 229,657 | ||||||||
|
| |||||||
| Consumer Staples—12.8% | ||||||||
Altria Group, Inc. | 83,263 | 5,265 | ||||||
Brown-Forman Corp. Class B | 84,798 | 4,023 | ||||||
Campbell Soup Co. | 9,595 | 525 | ||||||
Church & Dwight Co., Inc. | 9,571 | 459 | ||||||
Clorox Co. (The) | 4,955 | 620 | ||||||
Coca-Cola Co. (The) | 162,326 | 6,870 | ||||||
Colgate-Palmolive Co. | 35,066 | 2,600 | ||||||
ConAgra Foods, Inc. | 24,197 | 1,140 | ||||||
Constellation Brands, Inc. Class A | 80,118 | 13,339 | ||||||
CVS Health Corp. | 64,629 | 5,751 | ||||||
Dr. Pepper Snapple Group, Inc. | 6,542 | 597 | ||||||
General Mills, Inc. | 31,857 | 2,035 | ||||||
Hershey Co. (The) | 8,539 | 816 | ||||||
Hormel Foods Corp. | 12,918 | 490 | ||||||
J.M. Smucker Co. (The) | 5,669 | 768 | ||||||
| SHARES | VALUE | |||||||
| Consumer Staples—continued | ||||||||
Kellogg Co. | 13,502 | $ | 1,046 | |||||
Kimberly-Clark Corp. | 13,782 | 1,739 | ||||||
Kraft Heinz Co.(The) | 31,149 | 2,788 | ||||||
McCormick & Co., Inc. | 5,957 | 595 | ||||||
Mead Johnson Nutrition Co. | 9,880 | 781 | ||||||
Molson Coors Brewing Co. Class B | 173,256 | 19,024 | ||||||
Mondelez International, Inc. Class A | 66,826 | 2,934 | ||||||
Monster Beverage Corp.(2) | 5,098 | 748 | ||||||
PepsiCo, Inc. | 60,728 | 6,605 | ||||||
Philip Morris International, Inc. | 67,225 | 6,536 | ||||||
Procter & Gamble Co. (The) | 102,723 | 9,219 | ||||||
Reynolds American, Inc. | 45,883 | 2,163 | ||||||
Sysco Corp. | 343,665 | 16,843 | ||||||
Tyson Foods, Inc. Class A | 14,467 | 1,080 | ||||||
Walgreens Boots Alliance, Inc. | 50,832 | 4,098 | ||||||
|
| |||||||
| 121,497 | ||||||||
|
| |||||||
| Energy—1.5% | ||||||||
Marathon Petroleum Corp. | 82,522 | 3,349 | ||||||
Phillips 66 | 72,758 | 5,861 | ||||||
Tesoro Corp. | 18,991 | 1,511 | ||||||
Valero Energy Corp. | 73,955 | 3,920 | ||||||
|
| |||||||
| 14,641 | ||||||||
|
| |||||||
| Financials—4.4% | ||||||||
Allstate Corp. (The) | 36,510 | 2,526 | ||||||
AON plc | 50,799 | 5,714 | ||||||
CHUBB Ltd. | 40,402 | 5,077 | ||||||
Cincinnati Financial Corp. | 12,800 | 965 | ||||||
CME Group, Inc. | 32,824 | 3,431 | ||||||
Intercontinental Exchange, Inc. | 11,546 | 3,110 | ||||||
Marsh & McLennan Cos., Inc. | 96,509 | 6,490 | ||||||
Moody’s Corp. | 16,673 | 1,805 | ||||||
NASDAQ OMX Group, Inc. (The) | 11,147 | 753 | ||||||
Progressive Corp. (The) | 54,521 | 1,717 | ||||||
S&P Global, Inc. | 26,229 | 3,320 | ||||||
Travelers Cos., Inc. (The) | 26,567 | 3,043 | ||||||
Willis Towers Watson plc | 25,698 | 3,412 | ||||||
XL Group Ltd. | 27,227 | 916 | ||||||
|
| |||||||
| 42,279 | ||||||||
|
| |||||||
| Health Care—9.0% | ||||||||
Abbott Laboratories | 52,349 | 2,214 | ||||||
Aetna, Inc. | 18,510 | 2,137 | ||||||
Agilent Technologies, Inc. | 41,343 | 1,947 | ||||||
Allergan plc | 4,381 | 1,009 | ||||||
AmerisourceBergen Corp. | 22,255 | 1,798 | ||||||
Anthem, Inc. | 13,929 | 1,745 | ||||||
Bard (C.R.), Inc. | 2,693 | 604 | ||||||
Baxter International, Inc. | 19,761 | 941 | ||||||
Becton, Dickinson & Co. | 7,586 | 1,363 | ||||||
Boston Scientific Corp.(2) | 48,615 | 1,157 | ||||||
Bristol-Myers Squibb Co. | 18,595 | 1,003 | ||||||
Cardinal Health, Inc. | 37,362 | 2,903 | ||||||
Centene Corp.(2) | 7,925 | 531 | ||||||
Cigna Corp. | 13,824 | 1,801 | ||||||
Danaher Corp. | 18,139 | 1,422 | ||||||
DENTSPLY SIRONA, Inc. | 249,779 | 14,844 | ||||||
Edwards Lifesciences Corp.(2) | 8,137 | 981 | ||||||
Eli Lilly & Co. | 10,881 | 873 | ||||||
| SHARES | VALUE | |||||||
| Health Care—continued | ||||||||
Endo International plc(2) | 2,492 | $ | 50 | |||||
Henry Schein, Inc.(2) | 9,357 | 1,525 | ||||||
Hologic, Inc.(2) | 8,075 | 314 | ||||||
Humana, Inc. | 8,126 | 1,437 | ||||||
Illumina, Inc.(2) | 18,616 | 3,382 | ||||||
Intuitive Surgical, Inc.(2) | 1,353 | 981 | ||||||
Johnson & Johnson | 30,854 | 3,645 | ||||||
Mallinckrodt plc(2) | 1,412 | 98 | ||||||
McKesson Corp. | 26,133 | 4,358 | ||||||
Medtronic plc | 49,857 | 4,308 | ||||||
Merck & Co., Inc. | 31,154 | 1,944 | ||||||
Mylan NV(2) | 4,962 | 189 | ||||||
Patterson Cos., Inc. | 9,862 | 453 | ||||||
PerkinElmer, Inc. | 14,683 | 824 | ||||||
Perrigo Co. plc | 1,714 | 158 | ||||||
Pfizer, Inc. | 68,830 | 2,331 | ||||||
St. Jude Medical, Inc. | 9,450 | 754 | ||||||
Stryker Corp. | 11,622 | 1,353 | ||||||
Thermo Fisher Scientific, Inc. | 50,947 | 8,104 | ||||||
UnitedHealth Group, Inc. | 51,534 | 7,215 | ||||||
Varian Medical Systems, Inc.(2) | 3,575 | 356 | ||||||
Waters Corp.(2) | 10,258 | 1,626 | ||||||
Zimmer Biomet Holdings, Inc. | 6,664 | 866 | ||||||
Zoetis, Inc. | 5,506 | 286 | ||||||
|
| |||||||
| 85,830 | ||||||||
|
| |||||||
| Industrials—11.4% | ||||||||
3M Co. | 19,875 | 3,503 | ||||||
Allegion plc | 87,449 | 6,026 | ||||||
Avery Dennison Corp. | 22,874 | 1,779 | ||||||
Boeing Co. (The) | 20,133 | 2,652 | ||||||
Cintas Corp. | 154,888 | 17,440 | ||||||
Dover Corp. | 17,896 | 1,318 | ||||||
Dun & Bradstreet Corp. (The) | 10,924 | 1,493 | ||||||
Equifax, Inc. | 35,348 | 4,757 | ||||||
Flowserve Corp. | 15,794 | 762 | ||||||
Fortive Corp. | 9,376 | 477 | ||||||
General Dynamics Corp. | 9,340 | 1,449 | ||||||
General Electric Co. | 326,830 | 9,681 | ||||||
Honeywell International, Inc. | 23,853 | 2,781 | ||||||
Illinois Tool Works, Inc. | 38,206 | 4,579 | ||||||
Ingersoll-Rand plc | 30,625 | 2,081 | ||||||
L-3 Communications Holdings, Inc. | 2,382 | 359 | ||||||
Lockheed Martin Corp. | 7,768 | 1,862 | ||||||
Masco Corp. | 303,419 | 10,410 | ||||||
Nielsen Holdings plc | 108,075 | 5,790 | ||||||
Northrop Grumman Corp. | 5,679 | 1,215 | ||||||
Parker Hannifin Corp. | 15,698 | 1,971 | ||||||
Pentair plc | 20,716 | 1,331 | ||||||
Raytheon Co. | 9,374 | 1,276 | ||||||
Republic Services, Inc. | 77,105 | 3,890 | ||||||
Rockwell Collins, Inc. | 4,203 | 355 | ||||||
Roper Technologies, Inc. | 3,115 | 568 | ||||||
Snap-On, Inc. | 6,994 | 1,063 | ||||||
Stanley Black & Decker, Inc. | 17,055 | 2,097 | ||||||
Stericycle, Inc.(2) | 26,991 | 2,163 | ||||||
Textron, Inc. | 8,524 | 339 | ||||||
TransDigm Group, Inc.(2) | 1,717 | 496 | ||||||
United Technologies Corp. | 24,628 | 2,502 | ||||||
Waste Management, Inc. | 132,909 | 8,474 | ||||||
Xylem, Inc. | 20,807 | 1,091 | ||||||
|
| |||||||
| 108,030 | �� | |||||||
|
| |||||||
See Notes to Financial Statements
26
Table of Contents
VIRTUS EQUITY TREND FUND
SCHEDULE OF INVESTMENTS (Continued)
SEPTEMBER 30, 2016
($ reported in thousands)
| SHARES | VALUE | |||||||
| Information Technology—14.0% | ||||||||
Activision Blizzard, Inc. | 148,674 | $ | 6,586 | |||||
Adobe Systems, Inc.(2) | 49,841 | 5,410 | ||||||
Akamai Technologies, | 7,701 | 408 | ||||||
Alliance Data Systems Corp.(2) | 1,655 | 355 | ||||||
Alphabet, Inc. Class A(2) | 6,018 | 4,839 | ||||||
Alphabet, Inc. Class C(2) | 6,175 | 4,800 | ||||||
Amphenol Corp. Class A | 110,554 | 7,177 | ||||||
Analog Devices, Inc. | 9,171 | 591 | ||||||
Applied Materials, Inc. | 298,939 | 9,013 | ||||||
Autodesk, Inc.(2) | 22,802 | 1,649 | ||||||
Automatic Data Processing, Inc. | 11,943 | 1,053 | ||||||
Broadcom Ltd. | 11,345 | 1,957 | ||||||
CA, Inc. | 7,448 | 246 | ||||||
Citrix Systems, Inc.(2) | 15,245 | 1,299 | ||||||
Corning, Inc. | 387,635 | 9,168 | ||||||
eBay, Inc.(2) | 37,638 | 1,238 | ||||||
Electronic Arts, Inc.(2) | 91,582 | 7,821 | ||||||
Facebook, Inc. Class A(2) | 54,189 | 6,951 | ||||||
Fidelity National Information Services, Inc. | 7,290 | 562 | ||||||
First Solar, Inc.(2) | 2,832 | 112 | ||||||
Fiserv, Inc.(2) | 5,920 | 589 | ||||||
Global Payments, Inc. | 4,974 | 382 | ||||||
Intel Corp. | 143,728 | 5,426 | ||||||
Intuit, Inc. | 25,799 | 2,838 | ||||||
KLA-Tencor Corp. | 54,832 | 3,822 | ||||||
Lam Research Corp. | 42,188 | 3,996 | ||||||
Linear Technology Corp. | 8,237 | 488 | ||||||
MasterCard, Inc. Class A | 25,628 | 2,608 | ||||||
Microchip Technology, Inc. | 5,825 | 362 | ||||||
Micron Technology, Inc.(2) | 33,906 | 603 | ||||||
Microsoft Corp. | 222,506 | 12,816 | ||||||
NVIDIA Corp. | 14,806 | 1,014 | ||||||
Oracle Corp. | 78,358 | 3,078 | ||||||
Paychex, Inc. | 8,461 | 490 | ||||||
PayPal Holdings, Inc.(2) | 28,756 | 1,178 | ||||||
Qorvo, Inc.(2) | 3,719 | 207 | ||||||
QUALCOMM, Inc. | 45,391 | 3,109 | ||||||
Red Hat, Inc.(2) | 4,759 | 385 | ||||||
salesforce.com, Inc.(2) | 62,138 | 4,432 | ||||||
Skyworks Solutions, Inc. | 5,970 | 455 | ||||||
Symantec Corp. | 18,429 | 463 | ||||||
Texas Instruments, Inc. | 30,638 | 2,150 | ||||||
Total System Services, Inc. | 4,694 | 221 | ||||||
VeriSign, Inc.(2) | 3,326 | 260 | ||||||
Verisk Analytics, Inc.(2) | 47,034 | 3,823 | ||||||
Visa, Inc. Class A | 50,371 | 4,166 | ||||||
Western Union Co. (The) | 14,064 | 293 | ||||||
Xerox Corp. | 26,512 | 269 | ||||||
Xilinx, Inc. | 7,863 | 427 | ||||||
Yahoo!, Inc.(2) | 29,250 | 1,261 | ||||||
|
| |||||||
| 132,846 | ||||||||
|
| |||||||
| Materials—10.1% | ||||||||
Alcoa, Inc.(2) | 1,305,081 | 13,233 | ||||||
Dow Chemical Co. (The) | 120,154 | 6,228 | ||||||
Du Pont (E.I.) de Nemours & Co. | 93,214 | 6,243 | ||||||
Eastman Chemical Co. | 16,353 | 1,107 | ||||||
Ecolab, Inc. | 31,836 | 3,875 | ||||||
International Flavors & Fragrances, Inc. | 9,620 | 1,375 | ||||||
| SHARES | VALUE | |||||||
| Materials—continued | ||||||||
International Paper Co. | 104,012 | $ | 4,990 | |||||
Martin Marietta Materials, Inc. | 39,263 | 7,032 | ||||||
Newmont Mining Corp. | 453,117 | 17,803 | ||||||
Nucor Corp. | 275,333 | 13,615 | ||||||
PPG Industries, Inc. | 32,286 | 3,337 | ||||||
Sealed Air Corp. | 49,541 | 2,270 | ||||||
Sherwin-Williams Co. (The) | 9,488 | 2,625 | ||||||
Vulcan Materials Co. | 79,387 | 9,029 | ||||||
Westrock Co. | 66,369 | 3,218 | ||||||
|
| |||||||
| 95,980 | ||||||||
|
| |||||||
| Real Estate—8.0% | ||||||||
American Tower Corp. | 36,658 | 4,154 | ||||||
Apartment Investment & Management Co. Class A | 25,166 | 1,155 | ||||||
AvalonBay Communities, Inc. | 23,056 | 4,100 | ||||||
Crown Castle International Corp. | 29,424 | 2,772 | ||||||
Digital Realty Trust, Inc. | 10,032 | 974 | ||||||
Equinix, Inc. | 6,142 | 2,213 | ||||||
Equity Residential | 61,652 | 3,966 | ||||||
Essex Property Trust, Inc. | 11,047 | 2,460 | ||||||
Extra Space Storage, Inc. | 11,023 | 875 | ||||||
Federal Realty Investment Trust | 7,197 | 1,108 | ||||||
General Growth Properties, Inc. | 82,053 | 2,265 | ||||||
HCP, Inc. | 94,508 | 3,587 | ||||||
Iron Mountain, Inc. | 15,576 | 585 | ||||||
Kimco Realty Corp. | 57,684 | 1,670 | ||||||
Macerich Co. (The) | 18,773 | 1,518 | ||||||
Prologis, Inc. | 295,047 | 15,797 | ||||||
Public Storage | 13,048 | 2,912 | ||||||
Realty Income Corp. | 32,477 | 2,174 | ||||||
Simon Property Group, Inc. | 37,524 | 7,768 | ||||||
UDR, Inc. | 44,484 | 1,601 | ||||||
Ventas, Inc. | 68,974 | 4,872 | ||||||
Welltower, Inc. | 72,964 | 5,455 | ||||||
Weyerhaeuser Co. | 68,919 | 2,201 | ||||||
|
| |||||||
| 76,182 | ||||||||
|
| |||||||
| Telecommunication Services—1.4% | ||||||||
AT&T, Inc. | 167,768 | 6,813 | ||||||
CenturyLink, Inc. | 16,310 | 447 | ||||||
Frontier Communications Corp. | 39,384 | 164 | ||||||
Verizon Communications, Inc. | 111,574 | 5,800 | ||||||
|
| |||||||
| 13,224 | ||||||||
|
| |||||||
| Utilities—2.6% | ||||||||
Ameren Corp. | 13,315 | 655 | ||||||
American Electric Power Co., Inc. | 17,198 | 1,104 | ||||||
CenterPoint Energy, Inc. | 25,281 | 587 | ||||||
CMS Energy Corp. | 15,587 | 655 | ||||||
Consolidated Edison, Inc. | 16,245 | 1,223 | ||||||
Dominion Resources, Inc. | 31,653 | 2,351 | ||||||
DTE Energy Co. | 9,849 | 923 | ||||||
Duke Energy Corp. | 24,924 | 1,995 | ||||||
Edison International | 11,046 | 798 | ||||||
Entergy Corp. | 6,562 | 504 | ||||||
Eversource Energy | 11,199 | 607 | ||||||
| SHARES | VALUE | |||||||
| Utilities—continued | ||||||||
Exelon Corp. | 33,150 | $ | 1,104 | |||||
FirstEnergy Corp. | 14,132 | 467 | ||||||
NextEra Energy, Inc. | 16,228 | 1,985 | ||||||
NiSource, Inc. | 18,375 | 443 | ||||||
PG&E Corp. | 26,054 | 1,594 | ||||||
Pinnacle West Capital Corp. | 4,767 | 362 | ||||||
PPL Corp. | 23,185 | 802 | ||||||
Public Service Enterprise Group, Inc. | 27,757 | 1,162 | ||||||
SCANA Corp. | 7,305 | 529 | ||||||
Sempra Energy | 12,902 | 1,383 | ||||||
Southern Co. | 32,290 | 1,656 | ||||||
WEC Energy Group, Inc. | 16,436 | 984 | ||||||
XCEL Energy, Inc. | 17,824 | 733 | ||||||
|
| |||||||
| 24,606 | ||||||||
| TOTAL COMMON STOCKS (Identified Cost $858,155) | 944,772 | |||||||
| TOTAL LONG TERM INVESTMENTS—99.3% | ||||||||
| (Identified Cost $858,155) | 944,772 | |||||||
| TOTAL INVESTMENTS—99.3% (Identified Cost $858,155) | 944,772 | (1) | ||||||
Other assets and liabilities, net—0.7% |
| 7,012 | ||||||
|
| |||||||
| NET ASSETS—100.0% | $ | 951,784 | ||||||
|
| |||||||
Footnote Legend:
| (1) | Federal Income Tax Information: For tax information at September 30, 2016, see Note 10 Federal Income Tax Information in the Notes to Financial Statements. |
| (2) | Non-income producing. |
The following table provides a summary of inputs used to value the Fund’s investments as of September 30, 2016 (See Security Valuation Note 2A in the Notes to Schedules of Investments):
| Total Value at September 30, 2016 | Level 1 Quoted Prices | |||||||
Equity Securities: | ||||||||
Common Stocks | $ | 944,772 | $ | 944,772 | ||||
|
|
|
| |||||
Total Investments | $ | 944,772 | $ | 944,772 | ||||
|
|
|
| |||||
There are no Level 2 (significant observable inputs) or Level 3 (significant unobservable inputs) priced securities.
There were no transfers between Level 1 and Level 2 related to securities held at September 30, 2016.
See Notes to Financial Statements
27
Table of Contents
VIRTUS GLOBAL EQUITY TREND FUND
SCHEDULE OF INVESTMENTS
SEPTEMBER 30, 2016
($ reported in thousands)
| SHARES | VALUE | |||||||
| COMMON STOCKS—57.2% | ||||||||
| Consumer Discretionary—14.2% | ||||||||
Advance Auto Parts, Inc. | 211 | $ | 31 | |||||
Amazon.com, Inc.(2) | 177 | 148 | ||||||
AutoNation, Inc.(2) | 208 | 10 | ||||||
AutoZone, Inc.(2) | 81 | 62 | ||||||
Best Buy Co., Inc. | 5,838 | 223 | ||||||
CarMax, Inc.(2) | 537 | 29 | ||||||
Chipotle Mexican Grill, Inc.(2) | 26 | 11 | ||||||
Comcast Corp. Class A | 2,312 | 153 | ||||||
Darden Restaurants, Inc. | 95 | 6 | ||||||
Dollar General Corp. | 674 | 47 | ||||||
Dollar Tree, Inc.(2) | 561 | 44 | ||||||
Expedia, Inc. | 69 | 8 | ||||||
Foot Locker, Inc. | 344 | 23 | ||||||
Gap, Inc. (The) | 563 | 13 | ||||||
Genuine Parts Co. | 2,164 | 217 | ||||||
Hasbro, Inc. | 1,067 | 85 | ||||||
Home Depot, Inc. (The) | 1,088 | 140 | ||||||
Horton (D.R.), Inc. | 2,439 | 74 | ||||||
Interpublic Group of Cos., Inc. (The) | 2,633 | 59 | ||||||
L Brands, Inc. | 620 | 44 | ||||||
Leggett & Platt, Inc. | 1,329 | 61 | ||||||
Lennar Corp. Class A | 1,332 | 56 | ||||||
LKQ Corp.(2) | 3,241 | 115 | ||||||
Lowe’s Cos., Inc. | 753 | 54 | ||||||
Mattel, Inc. | 3,742 | 113 | ||||||
McDonald’s Corp. | 737 | 85 | ||||||
Mohawk Industries, Inc.(2) | 625 | 125 | ||||||
Netflix, Inc.(2) | 286 | 28 | ||||||
Newell Rubbermaid, Inc. | 4,209 | 222 | ||||||
NIKE, Inc. Class B | 3,606 | 190 | ||||||
O’Reilly Automotive, Inc.(2) | 277 | 78 | ||||||
Omnicom Group, Inc. | 1,695 | 144 | ||||||
Priceline Group, Inc. (The)(2) | 29 | 43 | ||||||
PulteGroup, Inc. | 2,389 | 48 | ||||||
Ross Stores, Inc. | 840 | 54 | ||||||
Starbucks Corp. | 1,287 | 70 | ||||||
Target Corp. | 1,608 | 110 | ||||||
TJX Cos., Inc. (The) | 1,310 | 98 | ||||||
TripAdvisor, Inc.(2) | 67 | 4 | ||||||
Urban Outfitters, Inc.(2) | 203 | 7 | ||||||
Wynn Resorts Ltd. | 2,284 | 223 | ||||||
Yum! Brands, Inc. | 343 | 31 | ||||||
|
| |||||||
| 3,386 | ||||||||
|
| |||||||
| Consumer Staples—7.0% | ||||||||
Altria Group, Inc. | 1,229 | 78 | ||||||
Brown-Forman Corp. Class B | 1,176 | 56 | ||||||
Campbell Soup Co. | 142 | 8 | ||||||
Church & Dwight Co., Inc. | 151 | 7 | ||||||
Clorox Co. (The) | 78 | 10 | ||||||
Coca-Cola Co. (The) | 2,219 | 94 | ||||||
Colgate-Palmolive Co. | 556 | 41 | ||||||
ConAgra Foods, Inc. | 306 | 14 | ||||||
Constellation Brands, Inc. Class A | 960 | 160 | ||||||
CVS Health Corp. | 1,081 | 96 | ||||||
Dr. Pepper Snapple Group, Inc. | 119 | 11 | ||||||
General Mills, Inc. | 437 | 28 | ||||||
Hershey Co. (The) | 121 | 12 | ||||||
Hormel Foods Corp. | 268 | 10 | ||||||
J.M. Smucker Co. (The) | 91 | 12 | ||||||
Kellogg Co. | 191 | 15 | ||||||
| SHARES | VALUE | |||||||
| Consumer Staples—continued | ||||||||
Kimberly-Clark Corp. | 227 | $ | 29 | |||||
Kraft Heinz Co.(The) | 417 | 37 | ||||||
McCormick & Co., Inc. | 80 | 8 | ||||||
Mead Johnson Nutrition Co. | 138 | 11 | ||||||
Molson Coors Brewing Co. Class B | 2,103 | 231 | ||||||
Mondelez International, Inc. Class A | 1,086 | 48 | ||||||
Monster Beverage Corp.(2) | 73 | 11 | ||||||
PepsiCo, Inc. | 803 | 87 | ||||||
Philip Morris International, Inc. | 1,012 | 98 | ||||||
Procter & Gamble Co. (The) | 1,573 | 141 | ||||||
Reynolds American, Inc. | 557 | 26 | ||||||
Sysco Corp. | 4,205 | 206 | ||||||
Tyson Foods, Inc. Class A | 211 | 16 | ||||||
Walgreens Boots Alliance, Inc. | 857 | 69 | ||||||
|
| |||||||
| 1,670 | ||||||||
|
| |||||||
| Energy—0.9% | ||||||||
Marathon Petroleum Corp. | 1,257 | 51 | ||||||
Phillips 66 | 1,131 | 91 | ||||||
Tesoro Corp. | 297 | 23 | ||||||
Valero Energy Corp. | 1,146 | 61 | ||||||
|
| |||||||
| 226 | ||||||||
|
| |||||||
| Financials—2.4% | ||||||||
Allstate Corp. (The) | 488 | 34 | ||||||
AON plc | 699 | 79 | ||||||
CHUBB Ltd. | 587 | 74 | ||||||
Cincinnati Financial Corp. | 193 | 14 | ||||||
CME Group, Inc. | 545 | 57 | ||||||
Intercontinental Exchange, Inc. | 190 | 51 | ||||||
Marsh & McLennan Cos., Inc. | 1,304 | 88 | ||||||
Moody’s Corp. | 290 | 31 | ||||||
NASDAQ OMX Group, Inc. (The) | 196 | 13 | ||||||
Progressive Corp. (The) | 826 | 26 | ||||||
Travelers Cos., Inc. (The) | 416 | 48 | ||||||
Willis Towers Watson plc | 355 | 47 | ||||||
XL Group Ltd. | 420 | 14 | ||||||
|
| |||||||
| 576 | ||||||||
|
| |||||||
| Health Care—5.7% | ||||||||
Abbott Laboratories | 893 | 38 | ||||||
Aetna, Inc. | 284 | 33 | ||||||
Agilent Technologies, Inc. | 568 | 27 | ||||||
Allergan plc(2) | 70 | 16 | ||||||
AmerisourceBergen Corp. | 371 | 30 | ||||||
Anthem, Inc. | 201 | 25 | ||||||
Bard (C.R.), Inc. | 27 | 6 | ||||||
Baxter International, Inc. | 358 | 17 | ||||||
Becton, Dickinson & Co. | 117 | 21 | ||||||
Boston Scientific Corp.(2) | 614 | 15 | ||||||
Bristol-Myers Squibb Co. | 319 | 17 | ||||||
Cardinal Health, Inc. | 623 | 48 | ||||||
Centene Corp.(2) | 154 | 10 | ||||||
Cigna Corp. | 201 | 26 | ||||||
Danaher Corp. | 259 | 20 | ||||||
DENTSPLY SIRONA, Inc. | 3,350 | 199 | ||||||
Edwards Lifesciences Corp.(2) | 113 | 14 | ||||||
Eli Lilly & Co. | 190 | 15 | ||||||
Endo International plc(2) | 39 | 1 | ||||||
Henry Schein, Inc.(2) | 150 | 24 | ||||||
Hologic, Inc.(2) | 151 | 6 | ||||||
| SHARES | VALUE | |||||||
| Health Care—continued | ||||||||
Humana, Inc. | 123 | $ | 22 | |||||
Illumina, Inc.(2) | 318 | 58 | ||||||
Intuitive Surgical, Inc.(2) | 22 | 16 | ||||||
Johnson & Johnson | 524 | 62 | ||||||
Mallinckrodt plc(2) | 27 | 2 | ||||||
McKesson Corp. | 425 | 71 | ||||||
Medtronic plc | 728 | 63 | ||||||
Merck & Co., Inc. | 541 | 34 | ||||||
Mylan NV(2) | 78 | 3 | ||||||
Patterson Cos., Inc. | 157 | 7 | ||||||
PerkinElmer, Inc. | 196 | 11 | ||||||
Perrigo Co. plc | 25 | 2 | ||||||
Pfizer, Inc. | 1,161 | 39 | ||||||
St. Jude Medical, Inc. | 123 | 10 | ||||||
Stryker Corp. | 158 | 18 | ||||||
Thermo Fisher Scientific, Inc. | 705 | 112 | ||||||
UnitedHealth Group, Inc. | 733 | 103 | ||||||
Varian Medical Systems, Inc.(2) | 47 | 5 | ||||||
Waters Corp.(2) | 141 | 22 | ||||||
Welltower, Inc. | 1,076 | 81 | ||||||
Zimmer Biomet Holdings, Inc. | 87 | 11 | ||||||
Zoetis, Inc. | 88 | 5 | ||||||
|
| |||||||
| 1,365 | ||||||||
|
| |||||||
| Industrials—6.2% | ||||||||
3M Co. | 257 | 45 | ||||||
Allegion plc | 1,128 | 78 | ||||||
Avery Dennison Corp. | 388 | 30 | ||||||
Boeing Co. (The) | 295 | 39 | ||||||
Cintas Corp. | 2,225 | 251 | ||||||
Dover Corp. | 272 | 20 | ||||||
Dun & Bradstreet Corp. (The) | 130 | 18 | ||||||
Equifax, Inc. | 460 | 62 | ||||||
Flowserve Corp. | 224 | 11 | ||||||
Fortive Corp. | 122 | 6 | ||||||
General Dynamics Corp. | 116 | 18 | ||||||
General Electric Co. | 4,319 | 128 | ||||||
Honeywell International, Inc. | 356 | 41 | ||||||
Illinois Tool Works, Inc. | 535 | 64 | ||||||
Ingersoll-Rand plc | 420 | 28 | ||||||
L-3 Communications Holdings, Inc. | 24 | 4 | ||||||
Lockheed Martin Corp. | 117 | 28 | ||||||
Masco Corp. | 4,007 | 137 | ||||||
Nielsen Holdings plc | 1,542 | 83 | ||||||
Northrop Grumman Corp. | 70 | 15 | ||||||
Parker Hannifin Corp. | 217 | 27 | ||||||
Pentair plc | 279 | 18 | ||||||
Raytheon Co. | 125 | 17 | ||||||
Republic Services, Inc. | 1,063 | 54 | ||||||
Rockwell Collins, Inc. | 66 | 6 | ||||||
Roper Technologies, Inc. | 40 | 7 | ||||||
Snap-On, Inc. | 92 | 14 | ||||||
Stanley Black & Decker, Inc. | 224 | 28 | ||||||
Stericycle, Inc.(2) | 476 | 38 | ||||||
Textron, Inc. | 122 | 5 | ||||||
TransDigm Group, Inc.(2) | 31 | 9 | ||||||
United Technologies Corp. | 357 | 36 | ||||||
Waste Management, Inc. | 1,766 | 113 | ||||||
Xylem, Inc. | 276 | 14 | ||||||
|
| |||||||
| 1,492 | ||||||||
|
| |||||||
See Notes to Financial Statements
28
Table of Contents
VIRTUS GLOBAL EQUITY TREND FUND
SCHEDULE OF INVESTMENTS (Continued)
SEPTEMBER 30, 2016
($ reported in thousands)
| SHARES | VALUE | |||||||
| Information Technology—8.1% | ||||||||
Activision Blizzard, Inc. | 2,450 | $ | 109 | |||||
Adobe Systems, Inc.(2) | 680 | 74 | ||||||
Akamai Technologies, Inc.(2) | 50 | 3 | ||||||
Alliance Data Systems Corp.(2) | 24 | 5 | ||||||
Alphabet, Inc. Class A(2) | 80 | 64 | ||||||
Alphabet, Inc. Class C(2) | 83 | 65 | ||||||
Amphenol Corp. Class A | 1,611 | 105 | ||||||
Analog Devices, Inc. | 143 | 9 | ||||||
Applied Materials, Inc. | 4,594 | 139 | ||||||
Autodesk, Inc.(2) | 346 | 25 | ||||||
Automatic Data Processing, Inc. | 201 | 18 | ||||||
Broadcom Ltd. | 180 | 31 | ||||||
CA, Inc. | 117 | 4 | ||||||
Citrix Systems, Inc.(2) | 196 | 17 | ||||||
Corning, Inc. | 5,684 | 134 | ||||||
eBay, Inc.(2) | 313 | 10 | ||||||
Electronic Arts, Inc.(2) | 1,526 | 130 | ||||||
Equinix, Inc. | 78 | 28 | ||||||
Facebook, Inc. Class A(2) | 570 | 73 | ||||||
Fidelity National Information Services, Inc. | 122 | 9 | ||||||
First Solar, Inc.(2) | 36 | 1 | ||||||
Fiserv, Inc.(2) | 116 | 12 | ||||||
Global Payments, Inc. | 73 | 6 | ||||||
Intel Corp. | 2,280 | 86 | ||||||
Intuit, Inc. | 358 | 39 | ||||||
KLA-Tencor Corp. | 885 | 62 | ||||||
Lam Research Corp. | 625 | 59 | ||||||
Linear Technology Corp. | 121 | 7 | ||||||
MasterCard, Inc. Class A | 431 | 44 | ||||||
Microchip Technology, Inc. | 99 | 6 | ||||||
Micron Technology, Inc.(2) | 492 | 9 | ||||||
Microsoft Corp. | 2,886 | 166 | ||||||
NVIDIA Corp. | 189 | 13 | ||||||
Oracle Corp. | 1,163 | 46 | ||||||
Paychex, Inc. | 136 | 8 | ||||||
PayPal Holdings, Inc.(2) | 492 | 20 | ||||||
Qorvo, Inc.(2) | 41 | 2 | ||||||
QUALCOMM, Inc. | 649 | 44 | ||||||
Red Hat, Inc.(2) | 73 | 6 | ||||||
salesforce.com, Inc.(2) | 810 | 58 | ||||||
Skyworks Solutions, Inc. | 101 | 8 | ||||||
Symantec Corp. | 270 | 7 | ||||||
Texas Instruments, Inc. | 463 | 32 | ||||||
Total System Services, Inc. | 73 | 3 | ||||||
VeriSign, Inc.(2) | 20 | 2 | ||||||
Verisk Analytics, Inc.(2) | 671 | 55 | ||||||
Visa, Inc. Class A | 837 | 69 | ||||||
Western Union Co. (The) | 214 | 4 | ||||||
Xerox Corp. | 444 | 4 | ||||||
Xilinx, Inc. | 123 | 7 | ||||||
Yahoo!, Inc.(2) | 226 | 10 | ||||||
|
| |||||||
| 1,947 | ||||||||
|
| |||||||
| Materials—6.0% | ||||||||
Alcoa, Inc. | 22,122 | 224 | ||||||
Dow Chemical Co. (The) | 1,806 | 94 | ||||||
Du Pont (E.I.) de Nemours & Co. | 1,380 | 92 | ||||||
Eastman Chemical Co. | 256 | 17 | ||||||
Ecolab, Inc. | 535 | 65 | ||||||
International Flavors & Fragrances, Inc. | 157 | 23 | ||||||
International Paper Co. | 1,741 | 84 | ||||||
| SHARES | VALUE | |||||||
| Materials—continued | ||||||||
Martin Marietta Materials, Inc. | 460 | $ | 82 | |||||
Newmont Mining Corp. | 6,081 | 239 | ||||||
Nucor Corp. | 4,161 | 206 | ||||||
PPG Industries, Inc. | 543 | 56 | ||||||
Sealed Air Corp. | 837 | 38 | ||||||
Sherwin-Williams Co. (The) | 148 | 41 | ||||||
Vulcan Materials Co. | 1,037 | 118 | ||||||
Westrock Co. | 1,078 | 52 | ||||||
|
| |||||||
| 1,431 | ||||||||
|
| |||||||
| Real Estate—4.1% | ||||||||
American Tower Corp. | 482 | 55 | ||||||
Apartment Investment & Management Co. Class A | 368 | 17 | ||||||
AvalonBay Communities, Inc. | 351 | 62 | ||||||
Crown Castle International Corp. | 385 | 36 | ||||||
Digital Realty Trust, Inc. | 191 | 19 | ||||||
Equity Residential | 978 | 63 | ||||||
Essex Property Trust, Inc. | 161 | 36 | ||||||
Extra Space Storage, Inc. | 149 | 12 | ||||||
Federal Realty Investment Trust | 118 | 18 | ||||||
General Growth Properties, Inc. | 1,048 | 29 | ||||||
HCP, Inc. | 1,373 | 52 | ||||||
Iron Mountain, Inc. | 205 | 8 | ||||||
Kimco Realty Corp. | 683 | 20 | ||||||
Macerich Co. (The) | 203 | 16 | ||||||
Prologis, Inc. | 4,399 | 235 | ||||||
Public Storage | 192 | 43 | ||||||
Realty Income Corp. | 430 | 29 | ||||||
Simon Property Group, Inc. | 520 | 108 | ||||||
UDR, Inc. | 706 | 25 | ||||||
Ventas, Inc. | 1,010 | 71 | ||||||
Weyerhaeuser Co. | 949 | 30 | ||||||
|
| |||||||
| 984 | ||||||||
|
| |||||||
| Telecommunication Services—0.8% | ||||||||
AT&T, Inc. | 2,492 | 101 | ||||||
CenturyLink, Inc. | 233 | 7 | ||||||
Frontier Communications Corp. | 491 | 2 | ||||||
Verizon Communications, Inc. | 1,639 | 85 | ||||||
|
| |||||||
| 195 | ||||||||
|
| |||||||
| Utilities—1.8% | ||||||||
Ameren Corp. | 258 | 13 | ||||||
American Electric Power Co., Inc. | 277 | 18 | ||||||
CenterPoint Energy, Inc. | 447 | 10 | ||||||
CMS Energy Corp. | 285 | 12 | ||||||
Consolidated Edison, Inc. | 306 | 23 | ||||||
Dominion Resources, Inc. | 615 | 46 | ||||||
DTE Energy Co. | 191 | 18 | ||||||
Duke Energy Corp. | 398 | 32 | ||||||
Edison International | 190 | 14 | ||||||
Entergy Corp. | 114 | 9 | ||||||
Eversource Energy | 198 | 11 | ||||||
Exelon Corp. | 522 | 17 | ||||||
FirstEnergy Corp. | 271 | 9 | ||||||
NextEra Energy, Inc. | 257 | 31 | ||||||
NiSource, Inc. | 332 | 8 | ||||||
PG&E Corp. | 271 | 17 | ||||||
Pinnacle West Capital Corp. | 72 | 5 | ||||||
PPL Corp. | 357 | 12 | ||||||
| SHARES | VALUE | |||||||
| Utilities—continued | ||||||||
Public Service Enterprise Group, Inc. | 537 | $ | 23 | |||||
SCANA Corp. | 141 | 10 | ||||||
Sempra Energy | 222 | 24 | ||||||
Southern Co. | 529 | 27 | ||||||
WEC Energy Group, Inc. | 325 | 19 | ||||||
XCEL Energy, Inc. | 266 | 11 | ||||||
|
| |||||||
| 419 | ||||||||
| TOTAL COMMON STOCKS (Identified Cost $12,522) | 13,691 | |||||||
| EXCHANGE-TRADED FUNDS(3)—42.0% | ||||||||
iShares MSCI Australia Index Fund | 58,930 | 1,232 | ||||||
iShares MSCI Brazil Capped Index Fund | 41,042 | 1,384 | ||||||
iShares MSCI Hong Kong Index Fund | 58,212 | 1,281 | ||||||
iShares MSCI India Index Fund | 42,038 | 1,236 | ||||||
iShares MSCI Japan Index Fund | 95,090 | 1,193 | ||||||
iShares MSCI South Korea Capped Index Fund | 22,605 | 1,314 | ||||||
iShares MSCI Switzerland Capped Index Fund | 37,916 | 1,158 | ||||||
iShares MSCI Taiwan Index Fund | 78,821 | 1,238 | ||||||
| TOTAL EXCHANGE-TRADED FUNDS (Identified Cost $9,088) | 10,036 | |||||||
| TOTAL LONG TERM INVESTMENTS—99.2% | ||||||||
| (Identified Cost $21,610) | 23,727 | |||||||
| TOTAL INVESTMENTS—99.2% (Identified Cost $21,610) | 23,727 | (1) | ||||||
Other assets and liabilities, net—0.8% |
| 203 | ||||||
|
| |||||||
| NET ASSETS—100.0% | $ | 23,930 | ||||||
|
| |||||||
Footnote Legend:
| (1) | Federal Income Tax Information: For tax information at September 30, 2016, see Note 10 Federal Income Tax Information in the Notes to Financial Statements. |
| (2) | Non-income producing. |
| (3) | Shares of these funds are publicly offered and the prospectus and annual reports of each are publicly available. |
| Country Weightings (Unaudited)† | ||||
United States | 83 | % | ||
Korea | 6 | |||
India | 5 | |||
Taiwan | 5 | |||
Ireland | 1 | |||
Total | 100 | % | ||
† % of total investments as of September 30, 2016 |
| |||
See Notes to Financial Statements
29
Table of Contents
VIRTUS GLOBAL EQUITY TREND FUND
SCHEDULE OF INVESTMENTS (Continued)
SEPTEMBER 30, 2016
($ reported in thousands)
The following table provides a summary of inputs used to value the Fund’s investments as of September 30, 2016 (See Security Valuation Note 2A in the Notes to Financial Statements):
| Total Value at September 30, 2016 | Level 1 Quoted Prices | |||||||
Equity Securities: | ||||||||
Common Stocks | $ | 13,691 | $ | 13,691 | ||||
Exchange-Traded Funds | 10,036 | 10,036 | ||||||
|
|
|
| |||||
Total Investments | $ | 23,727 | $ | 23,727 | ||||
|
|
|
| |||||
There are no Level 2 (significant observable inputs) or Level 3 (significant unobservable inputs) priced securities.
There were no transfers between Level 1 and Level 2 related to securities held at September 30, 2016.
See Notes to Financial Statements
30
Table of Contents
SCHEDULE OF INVESTMENTS
SEPTEMBER 30, 2016
($ reported in thousands)
| SHARES | VALUE | |||||||
| CLOSED END FUNDS(3)—54.1% | ||||||||
| Equity Funds—29.8% | ||||||||
Adams Diversified Equity Fund, Inc. | 52,189 | $ | 686 | |||||
Adams Natural Resources Fund, Inc. | 37,946 | 756 | ||||||
Allianzgi NFJ Dividend Interest & Premium Strategy Fund | 57,707 | 729 | ||||||
Alpine Total Dynamic Dividend Fund | 126,834 | 968 | ||||||
BlackRock Science & Technology Trust | 122,284 | 2,278 | ||||||
Boulder Growth & Income Fund, Inc. | 261,002 | 2,187 | ||||||
Gabelli Healthcare & WellnessRx Trust (The) | 57,157 | 596 | ||||||
Gabelli Multimedia Trust, Inc. | 36,000 | 277 | ||||||
General American Investors Co., Inc. | 29,765 | 972 | ||||||
Liberty All Star Equity Fund | 183,754 | 952 | ||||||
Salient Midstream & MLP Fund | 115,986 | 1,471 | ||||||
Special Opportunities Fund, Inc. | 2,824 | 73 | ||||||
Tortoise Pipeline & Energy Fund, Inc. | 74,979 | 1,588 | ||||||
Tri-Continental Corp. | 24,736 | 529 | ||||||
|
| |||||||
| 14,062 | ||||||||
|
| |||||||
| Fixed Income Funds—6.5% | ||||||||
NexPoint Credit Strategies Fund | 90,845 | 2,020 | ||||||
PIMCO Dynamic Credit Income Fund | 50,240 | 1,024 | ||||||
|
| |||||||
| 3,044 | ||||||||
|
| |||||||
| International Equity Funds—17.1% | ||||||||
Aberdeen Japan Equity Fund, Inc. | 71,048 | 584 | ||||||
Alpine Global Dynamic Dividend Fund | 105,759 | 920 | ||||||
Clough Global Opportunities Fund | 40,477 | 391 | ||||||
Delaware Enhanced Global Dividend and Income Fund | 18,872 | 191 | ||||||
First Trust Dynamic Europe Equity Income Fund | 38,955 | 612 | ||||||
Japan Smaller Capitalization Fund, Inc. | 56,954 | 602 | ||||||
New Germany Fund, Inc. (The) | 45,240 | 649 | ||||||
| SHARES | VALUE | |||||||
| International Equity Funds—continued | ||||||||
Taiwan Fund, Inc. (The)(2) | 10,400 | $ | 180 | |||||
Tekla Healthcare Opportunities Fund | 123,203 | 2,154 | ||||||
Tekla World Healthcare Fund | 106,990 | 1,569 | ||||||
Templeton Dragon Fund, Inc. | 10,137 | 178 | ||||||
|
| |||||||
| 8,030 | ||||||||
|
| |||||||
| International Fixed Income Fund—0.7% | ||||||||
Diversified Real Asset Income Fund | 19,626 | 338 | ||||||
| TOTAL CLOSED END FUNDS (Identified Cost $25,205) | 25,474 | |||||||
| PREFERRED STOCKS—25.4% | ||||||||
| Financials—25.4% | ||||||||
Eagle Point Credit Co., Inc. 7.00% | 152,396 | 3,889 | ||||||
Eagle Point Credit Co., Inc. Series A 7.75% | 19,349 | 507 | ||||||
MVC Capital, Inc. | 84,231 | 2,127 | ||||||
Oxford Lane Capital Corp. 7.50% | 61,456 | 1,577 | ||||||
Oxford Lane Capital Corp. 8.125% | 150,730 | 3,881 | ||||||
| TOTAL PREFERRED STOCKS (Identified Cost $11,614) | 11,981 | |||||||
| TOTAL LONG TERM INVESTMENTS—79.5% | ||||||||
| (Identified Cost $36,819) | 37,455 | |||||||
| SHORT-TERM INVESTMENT—19.4% | ||||||||
| Money Market Mutual Fund—19.4% | ||||||||
JPMorgan U.S. Government Money Market Fund – Institutional Shares (seven-day effective yield | 9,167,116 | 9,167 | ||||||
| TOTAL SHORT-TERM INVESTMENT (Identified Cost $9,167) | 9,167 | |||||||
| TOTAL INVESTMENTS—98.9% (Identified Cost $45,986) | 46,622 | (1) | ||||||
Other assets and liabilities, net—1.1% |
| 517 | ||||||
|
| |||||||
| NET ASSETS—100.0% | $ | 47,139 | ||||||
|
| |||||||
Footnote Legend:
| (1) | Federal Income Tax Information: For tax information at September 30, 2016, see Note 10 Federal Income Tax Information in the Notes to Financial Statements. |
| (2) | Non-income producing. |
| (3) | Shares of these funds are publicly offered and the prospectus and annual reports of each are publicly available. |
The following table provides a summary of inputs used to value the Fund’s investments as of September 30, 2016 (See Security Valuation Note 2A in the Notes to Financial Statements):
| Total Value at September 30, 2016 | Level 1 Quoted Prices | |||||||
Equity Securities: | ||||||||
Closed-End Funds | $ | 25,474 | $ | 25,474 | ||||
Preferred Stocks | 11,981 | 11,981 | ||||||
Short-Term Investments | 9,167 | 9,167 | ||||||
|
|
|
| |||||
Total Investments | $ | 46,622 | $ | 46,622 | ||||
|
|
|
| |||||
There are no Level 2 (significant observable inputs) or Level 3 (significant unobservable inputs) priced securities.
There were no transfers between Level 1 and Level 2 related to securities held at September 30, 2016.
See Notes to Financial Statements
31
Table of Contents
SCHEDULE OF INVESTMENTS
SEPTEMBER 30, 2016
($ reported in thousands)
| SHARES | VALUE | |||||||
| COMMON STOCKS—35.9% | ||||||||
| Consumer Discretionary—8.4% | ||||||||
Advance Auto Parts, Inc. | 661 | $ | 99 | |||||
Amazon.com, Inc.(2) | 787 | 659 | ||||||
AutoNation, Inc.(2) | 748 | 36 | ||||||
AutoZone, Inc.(2) | 299 | 230 | ||||||
Best Buy Co., Inc. | 20,240 | 773 | ||||||
CarMax, Inc.(2) | 1,908 | 102 | ||||||
Chipotle Mexican Grill, Inc.(2) | 135 | 57 | ||||||
Comcast Corp. Class A | 8,601 | 571 | ||||||
Darden Restaurants, Inc. | 460 | 28 | ||||||
Dollar General Corp. | 2,232 | 156 | ||||||
Dollar Tree, Inc.(2) | 1,894 | 150 | ||||||
Expedia, Inc. | 275 | 32 | ||||||
Foot Locker, Inc. | 937 | 63 | ||||||
Gap, Inc. (The) | 1,495 | 33 | ||||||
Genuine Parts Co. | 7,559 | 759 | ||||||
Hasbro, Inc. | 3,965 | 315 | ||||||
Home Depot, Inc. (The) | 4,076 | 525 | ||||||
Horton (D.R.), Inc. | 6,505 | 196 | ||||||
Interpublic Group of Cos., Inc. (The) | 15,114 | 338 | ||||||
L Brands, Inc. | 1,854 | 131 | ||||||
Leggett & Platt, Inc. | 3,538 | 161 | ||||||
Lennar Corp. Class A | 3,545 | 150 | ||||||
LKQ Corp.(2) | 9,377 | 333 | ||||||
Lowe’s Cos., Inc. | 3,004 | 217 | ||||||
Mattel, Inc. | 12,259 | 371 | ||||||
McDonald’s Corp. | 2,675 | 309 | ||||||
Mohawk Industries, Inc.(2) | 1,680 | 337 | ||||||
Netflix, Inc.(2) | 948 | 93 | ||||||
Newell Brands, Inc. | 11,217 | 591 | ||||||
NIKE, Inc. Class B | 11,763 | 619 | ||||||
O’Reilly Automotive, Inc.(2) | 914 | 256 | ||||||
Omnicom Group, Inc. | 6,773 | 576 | ||||||
Priceline Group, Inc. (The)(2) | 126 | 185 | ||||||
PulteGroup, Inc. | 6,278 | 126 | ||||||
Ross Stores, Inc. | 2,807 | 180 | ||||||
Starbucks Corp. | 4,281 | 232 | ||||||
Target Corp. | 4,896 | 336 | ||||||
TJX Cos., Inc. (The) | 4,806 | 359 | ||||||
TripAdvisor, Inc.(2) | 237 | 15 | ||||||
Urban Outfitters, Inc.(2) | 523 | 18 | ||||||
Wynn Resorts Ltd. | 8,304 | 809 | ||||||
Yum! Brands, Inc. | 1,292 | 117 | ||||||
|
| |||||||
| 11,643 | ||||||||
|
| |||||||
| Consumer Staples—4.8% | ||||||||
Altria Group, Inc. | 4,928 | 312 | ||||||
Brown-Forman Corp. Class B | 4,251 | 202 | ||||||
Campbell Soup Co. | 880 | 48 | ||||||
Church & Dwight Co., Inc. | 588 | 28 | ||||||
Clorox Co. (The) | 335 | 42 | ||||||
Coca-Cola Co. (The) | 8,247 | 349 | ||||||
Colgate-Palmolive Co. | 1,866 | 138 | ||||||
ConAgra Foods, Inc. | 1,947 | 92 | ||||||
Constellation Brands, Inc. Class A | 3,600 | 599 | ||||||
CVS Health Corp. | 2,871 | 255 | ||||||
Dr. Pepper Snapple Group, Inc. | 453 | 41 | ||||||
General Mills, Inc. | 2,502 | 160 | ||||||
Hershey Co. (The) | 684 | 65 | ||||||
Hormel Foods Corp. | 1,360 | 52 | ||||||
J.M. Smucker Co. (The) | 353 | 48 | ||||||
Kellogg Co. | 911 | 71 | ||||||
| SHARES | VALUE | |||||||
| Consumer Staples—continued | ||||||||
Kimberly-Clark Corp. | 764 | $ | 96 | |||||
Kraft Heinz Co. (The) | 2,421 | 217 | ||||||
McCormick & Co., Inc. | 549 | 55 | ||||||
Mead Johnson Nutrition Co. | 798 | 63 | ||||||
Molson Coors Brewing Co. Class B | 8,460 | 929 | ||||||
Mondelez International, Inc. Class A | 6,664 | 292 | ||||||
Monster Beverage Corp.(2) | 316 | 46 | ||||||
PepsiCo, Inc. | 3,020 | 328 | ||||||
Philip Morris International, Inc. | 3,966 | 386 | ||||||
Procter & Gamble Co. (The) | 5,525 | 496 | ||||||
Reynolds American, Inc. | 3,343 | 158 | ||||||
Sysco Corp. | 17,367 | 851 | ||||||
Tyson Foods, Inc. Class A | 988 | 74 | ||||||
Walgreens Boots Alliance, Inc. | 2,258 | 182 | ||||||
|
| |||||||
| 6,675 | ||||||||
|
| |||||||
| Energy—0.6% | ||||||||
Marathon Petroleum Corp. | 4,322 | 175 | ||||||
Phillips 66 | 3,911 | 315 | ||||||
Tesoro Corp. | 964 | 77 | ||||||
Valero Energy Corp. | 3,845 | 204 | ||||||
|
| |||||||
| 771 | ||||||||
|
| |||||||
| Financials—1.7% | ||||||||
Allstate Corp. (The) | 2,733 | 189 | ||||||
AON plc | 2,685 | 302 | ||||||
CHUBB Ltd. | 2,977 | 374 | ||||||
Cincinnati Financial Corp. | 1,012 | 76 | ||||||
CME Group, Inc. | 1,470 | 154 | ||||||
Four Corners Property Trust, Inc. | 90 | 2 | ||||||
Intercontinental Exchange, Inc. | 533 | 144 | ||||||
Marsh & McLennan Cos., Inc. | 5,037 | 339 | ||||||
Moody’s Corp. | 755 | 82 | ||||||
NASDAQ OMX Group, Inc. (The) | 543 | 37 | ||||||
Progressive Corp. (The) | 4,045 | 127 | ||||||
S&P Global, Inc. | 1,159 | 147 | ||||||
Travelers Cos., Inc. (The) | 1,973 | 226 | ||||||
Willis Towers Watson plc | 1,305 | 173 | ||||||
XL Group Ltd. | 2,037 | 68 | ||||||
|
| |||||||
| 2,440 | ||||||||
|
| |||||||
| Health Care—3.2% | ||||||||
Abbott Laboratories | 2,818 | 119 | ||||||
Aetna, Inc. | 922 | 106 | ||||||
Agilent Technologies, Inc. | 2,310 | 109 | ||||||
Allergan plc(2) | 238 | 55 | ||||||
AmerisourceBergen Corp. | 1,000 | 81 | ||||||
Anthem, Inc. | 761 | 95 | ||||||
Bard (C.R.), Inc. | 145 | 32 | ||||||
Baxter International, Inc. | 947 | 45 | ||||||
Becton, Dickinson & Co. | 433 | 78 | ||||||
Boston Scientific Corp.(2) | 2,871 | 68 | ||||||
Bristol-Myers Squibb Co. | 850 | 46 | ||||||
Cardinal Health, Inc. | 1,648 | 128 | ||||||
Centene Corp.(2) | 397 | 27 | ||||||
Cigna Corp. | 719 | 94 | ||||||
Danaher Corp. | 1,253 | 98 | ||||||
DENTSPLY SIRONA, Inc. | 14,065 | 836 | ||||||
Edwards Lifesciences Corp.(2) | 456 | 55 | ||||||
Eli Lilly & Co. | 525 | 42 | ||||||
| SHARES | VALUE | |||||||
| Health Care—continued | ||||||||
Endo International plc(2) | 138 | $ | 3 | |||||
Henry Schein, Inc.(2) | 428 | 70 | ||||||
Hologic, Inc.(2) | 389 | 15 | ||||||
Humana, Inc. | 423 | 75 | ||||||
Illumina, Inc.(2) | 1,000 | 182 | ||||||
Intuitive Surgical, Inc.(2) | 81 | 59 | ||||||
Johnson & Johnson | 1,382 | 163 | ||||||
Mallinckrodt plc(2) | 73 | 5 | ||||||
McKesson Corp. | 1,143 | 191 | ||||||
Medtronic plc | 2,614 | 226 | ||||||
Merck & Co., Inc. | 1,421 | 89 | ||||||
Mylan NV(2) | 244 | 9 | ||||||
Patterson Cos., Inc. | 442 | 20 | ||||||
PerkinElmer, Inc. | 830 | 47 | ||||||
Perrigo Co. plc | 94 | 9 | ||||||
Pfizer, Inc. | 3,062 | 104 | ||||||
St. Jude Medical, Inc. | 490 | 39 | ||||||
Stryker Corp. | 643 | 75 | ||||||
Thermo Fisher Scientific, Inc. | 2,637 | 419 | ||||||
UnitedHealth Group, Inc. | 2,604 | 364 | ||||||
Varian Medical Systems, Inc.(2) | 191 | 19 | ||||||
Waters Corp.(2) | 526 | 83 | ||||||
Zimmer Biomet Holdings, Inc. | 369 | 48 | ||||||
Zoetis, Inc. | 256 | 13 | ||||||
|
| |||||||
| 4,441 | ||||||||
|
| |||||||
| Industrials—4.1% | ||||||||
3M Co. | 1,487 | 262 | ||||||
Allegion plc | 4,434 | 306 | ||||||
Avery Dennison Corp. | 1,028 | 80 | ||||||
Boeing Co. (The) | 1,024 | 135 | ||||||
Cintas Corp. | 7,928 | 893 | ||||||
Dover Corp. | 1,008 | 74 | ||||||
Dun & Bradstreet Corp. (The) | 555 | 76 | ||||||
Equifax, Inc. | 1,810 | 244 | ||||||
Flowserve Corp. | 888 | 43 | ||||||
Fortive Corp. | 678 | 34 | ||||||
General Dynamics Corp. | 506 | 78 | ||||||
General Electric Co. | 16,700 | 495 | ||||||
Honeywell International, Inc. | 1,300 | 152 | ||||||
Illinois Tool Works, Inc. | 1,948 | 233 | ||||||
Ingersoll-Rand plc | 1,536 | 104 | ||||||
L-3 Communications Holdings, Inc. | 144 | 22 | ||||||
Lockheed Martin Corp. | 387 | 93 | ||||||
Masco Corp. | 15,495 | 532 | ||||||
Nielsen Holdings plc | 5,562 | 298 | ||||||
Northrop Grumman Corp. | 294 | 63 | ||||||
Parker Hannifin Corp. | 826 | 104 | ||||||
Pentair plc | 1,013 | 65 | ||||||
Raytheon Co. | 550 | 75 | ||||||
Republic Services, Inc. | 3,946 | 199 | ||||||
Rockwell Collins, Inc. | 164 | 14 | ||||||
Roper Technologies, Inc. | 241 | 44 | ||||||
Snap-On, Inc. | 351 | 53 | ||||||
Stanley Black & Decker, Inc. | 892 | 110 | ||||||
Stericycle, Inc.(2) | 1,402 | 112 | ||||||
Textron, Inc. | 402 | 16 | ||||||
TransDigm Group, Inc.(2) | 109 | 31 | ||||||
United Technologies Corp. | 1,314 | 133 | ||||||
Waste Management, Inc. | 6,700 | 427 | ||||||
Xylem, Inc. | 1,008 | 53 | ||||||
|
| |||||||
| 5,653 | ||||||||
|
| |||||||
See Notes to Financial Statements
32
Table of Contents
VIRTUS MULTI-ASSET TREND FUND
SCHEDULE OF INVESTMENTS (Continued)
SEPTEMBER 30, 2016
($ reported in thousands)
| SHARES | VALUE | |||||||
| Information Technology—4.9% | ||||||||
Activision Blizzard, Inc. | 6,622 | $ | 293 | |||||
Adobe Systems, Inc.(2) | 2,530 | 275 | ||||||
Akamai Technologies, Inc.(2) | 460 | 24 | ||||||
Alliance Data Systems | 91 | 20 | ||||||
Alphabet, Inc. Class A(2) | 460 | 370 | ||||||
Alphabet, Inc. Class C(2) | 480 | 373 | ||||||
Amphenol Corp. Class A | 5,839 | 379 | ||||||
Analog Devices, Inc. | 444 | 29 | ||||||
Applied Materials, Inc. | 15,232 | 459 | ||||||
Autodesk, Inc.(2) | 1,108 | 80 | ||||||
Automatic Data Processing, Inc. | 571 | 50 | ||||||
Broadcom Ltd. | 580 | 100 | ||||||
CA, Inc. | 669 | 22 | ||||||
Citrix Systems, Inc.(2) | 858 | 73 | ||||||
Corning, Inc. | 20,600 | 487 | ||||||
eBay, Inc.(2) | 2,426 | 80 | ||||||
Electronic Arts, Inc.(2) | 4,074 | 348 | ||||||
Facebook, Inc. Class A(2) | 2,071 | 266 | ||||||
Fidelity National Information Services, Inc. | 349 | 27 | ||||||
First Solar, Inc.(2) | 224 | 9 | ||||||
Fiserv, Inc.(2) | 288 | 29 | ||||||
Global Payments, Inc. | 194 | 15 | ||||||
Intel Corp. | 7,339 | 277 | ||||||
Intuit, Inc. | 1,403 | 154 | ||||||
KLA-Tencor Corp. | 2,546 | 177 | ||||||
Lam Research Corp. | 2,154 | 204 | ||||||
Linear Technology Corp. | 310 | 18 | ||||||
MasterCard, Inc. Class A | 1,121 | 114 | ||||||
Microchip Technology, Inc. | 287 | 18 | ||||||
Micron Technology, Inc.(2) | 1,180 | 21 | ||||||
Microsoft Corp. | 10,265 | 591 | ||||||
NVIDIA Corp. | 711 | 49 | ||||||
Oracle Corp. | 5,179 | 203 | ||||||
Paychex, Inc. | 391 | 23 | ||||||
PayPal Holdings, Inc.(2) | 1,307 | 54 | ||||||
Qorvo, Inc.(2) | 271 | 15 | ||||||
QUALCOMM, Inc. | 2,194 | 150 | ||||||
Red Hat, Inc.(2) | 245 | 20 | ||||||
salesforce.com, Inc.(2) | 3,235 | 231 | ||||||
Skyworks Solutions, Inc. | 338 | 26 | ||||||
Symantec Corp. | 868 | 22 | ||||||
Texas Instruments, Inc. | 1,495 | 105 | ||||||
Total System Services, Inc. | 240 | 11 | ||||||
VeriSign, Inc.(2) | 160 | 12 | ||||||
Verisk Analytics, Inc.(2) | 2,396 | 195 | ||||||
Visa, Inc. Class A | 2,230 | 184 | ||||||
Western Union Co. (The) | 634 | 13 | ||||||
Xerox Corp. | 1,141 | 12 | ||||||
Xilinx, Inc. | 287 | 16 | ||||||
Yahoo!, Inc.(2) | 2,126 | 92 | ||||||
|
| |||||||
| 6,815 | ||||||||
|
| |||||||
| Materials—3.6% | ||||||||
Alcoa, Inc.(2) | 67,810 | 688 | ||||||
Dow Chemical Co. (The) | 6,168 | 320 | ||||||
Du Pont (E.I.) de Nemours & Co. | 4,925 | 330 | ||||||
Eastman Chemical Co. | 851 | 58 | ||||||
Ecolab, Inc. | 1,421 | 173 | ||||||
International Flavors & Fragrances, Inc. | 444 | 63 | ||||||
International Paper Co. | 4,616 | 221 | ||||||
Martin Marietta Materials, Inc. | 1,993 | 357 | ||||||
| SHARES | VALUE | |||||||
| Materials—continued | ||||||||
Newmont Mining Corp. | 29,564 | $ | 1,161 | |||||
Nucor Corp. | 14,400 | 712 | ||||||
PPG Industries, Inc. | 1,448 | 150 | ||||||
Sealed Air Corp. | 2,200 | 101 | ||||||
Sherwin-Williams Co. (The) | 426 | 118 | ||||||
Vulcan Materials Co. | 4,021 | 457 | ||||||
Westrock Co. | 2,882 | 140 | ||||||
|
| |||||||
| 5,049 | ||||||||
|
| |||||||
| Real Estate—3.0% | ||||||||
American Tower Corp. | 1,889 | 214 | ||||||
Apartment Investment & Management Co. Class A | 1,343 | 62 | ||||||
AvalonBay Communities, Inc. | 1,195 | 212 | ||||||
Crown Castle International Corp. | 1,494 | 141 | ||||||
Digital Realty Trust, Inc. | 539 | 52 | ||||||
Equinix, Inc. | 316 | 114 | ||||||
Equity Residential | 3,175 | 204 | ||||||
Essex Property Trust, Inc. | 584 | 130 | ||||||
Extra Space Storage, Inc. | 658 | 52 | ||||||
Federal Realty Investment Trust | 723 | 111 | ||||||
General Growth Properties, Inc. | 5,480 | 151 | ||||||
HCP, Inc. | 4,844 | 184 | ||||||
Iron Mountain, Inc. | 923 | 35 | ||||||
Kimco Realty Corp. | 3,646 | 106 | ||||||
Macerich Co. (The) | 1,148 | 93 | ||||||
Prologis, Inc. | 15,051 | 806 | ||||||
Public Storage | 664 | 148 | ||||||
Realty Income Corp. | 2,327 | 156 | ||||||
Simon Property Group, Inc. | 2,229 | 461 | ||||||
UDR, Inc. | 2,173 | 78 | ||||||
Ventas, Inc. | 3,654 | 258 | ||||||
Welltower, Inc. | 3,837 | 287 | ||||||
Weyerhaeuser Co. | 3,627 | 116 | ||||||
|
| |||||||
| 4,171 | ||||||||
|
| |||||||
| Telecommunication Services—0.5% | ||||||||
AT&T, Inc. | 8,967 | 364 | ||||||
CenturyLink, Inc. | 964 | 26 | ||||||
Frontier Communications Corp. | 2,835 | 12 | ||||||
Verizon Communications, Inc. | 5,732 | 298 | ||||||
|
| |||||||
| 700 | ||||||||
|
| |||||||
| Utilities—1.1% | ||||||||
Ameren Corp. | 905 | 45 | ||||||
American Electric Power Co., Inc. | 1,105 | 71 | ||||||
CenterPoint Energy, Inc. | 1,544 | 36 | ||||||
CMS Energy Corp. | 1,064 | 45 | ||||||
Consolidated Edison, Inc. | 979 | 74 | ||||||
Dominion Resources, Inc. | 2,124 | 158 | ||||||
DTE Energy Co. | 654 | 61 | ||||||
Duke Energy Corp. | 1,583 | 127 | ||||||
Edison International | 661 | 48 | ||||||
Entergy Corp. | 396 | 30 | ||||||
Eversource Energy | 772 | 42 | ||||||
Exelon Corp. | 2,301 | 77 | ||||||
FirstEnergy Corp. | 849 | 28 | ||||||
NextEra Energy, Inc. | 1,066 | 130 | ||||||
NiSource, Inc. | 1,317 | 32 | ||||||
PG&E Corp. | 1,691 | 103 | ||||||
Pinnacle West Capital Corp. | 246 | 19 | ||||||
| SHARES | VALUE | |||||||
| Utilities—continued | ||||||||
PPL Corp. | 1,517 | $ | 52 | |||||
Public Service Enterprise Group, Inc. | 1,673 | 70 | ||||||
SCANA Corp. | 449 | 32 | ||||||
Sempra Energy | 860 | 92 | ||||||
Southern Co. | 2,171 | 111 | ||||||
WEC Energy Group, Inc. | 992 | 59 | ||||||
XCEL Energy, Inc. | 1,097 | 45 | ||||||
|
| |||||||
| 1,587 | ||||||||
| TOTAL COMMON STOCKS (Identified Cost $45,429) | 49,945 | |||||||
| EXCHANGE-TRADED FUNDS(3)—60.3% | ||||||||
iShares 20+ Year Treasury Bond Fund | 116,417 | 16,008 | ||||||
iShares Dow Jones U.S. Real Estate Index Fund | 54,682 | 4,410 | ||||||
iShares iBoxx $ High Yield Corporate Bond Index Fund | 91,923 | 8,021 | ||||||
iShares iBoxx $ Investment Grade Corporate Bond Fund | 64,621 | 7,960 | ||||||
iShares JPMorgan Emerging Markets Bond Index Fund | 70,922 | 8,313 | ||||||
iShares MSCI Australia Index Fund | 205,773 | 4,301 | ||||||
iShares MSCI Brazil Capped Index Fund | 145,084 | 4,894 | ||||||
iShares MSCI Hong Kong Index Fund | 196,616 | 4,327 | ||||||
iShares MSCI India Index Fund | 141,844 | 4,172 | ||||||
iShares MSCI Japan Index Fund | 340,280 | 4,267 | ||||||
iShares MSCI South Korea Capped Index Fund | 74,321 | 4,320 | ||||||
iShares MSCI Switzerland Capped Index Fund | 135,679 | 4,145 | ||||||
iShares MSCI Taiwan Index Fund | 282,122 | 4,429 | ||||||
PowerShares DB Gold | 105,651 | 4,500 | ||||||
| TOTAL EXCHANGE-TRADED FUNDS (Identified Cost $77,169) | 84,067 | |||||||
| TOTAL LONG TERM INVESTMENTS—96.2% | ||||||||
| (Identified Cost $122,598) | 134,012 | |||||||
| TOTAL INVESTMENTS—96.2% (Identified Cost $122,598) | 134,012 | (1) | ||||||
Other assets and liabilities, net—3.8% |
| 5,270 | ||||||
|
| |||||||
| NET ASSETS—100.0% | $ | 139,282 | ||||||
|
| |||||||
Footnote Legend:
| (1) | Federal Income Tax Information: For tax information at September 30, 2016, see Note 10 Federal Income Tax Information in the Notes to Financial Statements. |
| (2) | Non-income producing. |
| (3) | Shares of these funds are publicly offered and the prospectus and annual reports of each are publicly available. |
See Notes to Financial Statements
33
Table of Contents
VIRTUS MULTI-ASSET TREND FUND
SCHEDULE OF INVESTMENTS (Continued)
SEPTEMBER 30, 2016
($ reported in thousands)
The following table provides a summary of inputs used to value the Fund’s investments as of September 30, 2016 (See Security Valuation Note 2A in the Notes to Financial Statements):
| Total Value at September 30, 2016 | Level 1 Quoted Prices | |||||||
Equity Securities: | ||||||||
Common Stocks | $ | 49,945 | $ | 49,945 | ||||
Exchange-Traded Funds | 84,067 | 84,067 | ||||||
|
|
|
| |||||
Total Investments | $ | 134,012 | $ | 134,012 | ||||
|
|
|
| |||||
There are no Level 2 (significant observable inputs) or Level 3 (significant unobservable inputs) priced securities.
There were no transfers between Level 1 and Level 2 related to securities held at September 30, 2016.
See Notes to Financial Statements
34
Table of Contents
SCHEDULE OF INVESTMENTS
SEPTEMBER 30, 2016
($ reported in thousands)
| SHARES | VALUE | |||||||
| COMMON STOCKS—99.1% | ||||||||
| Consumer Discretionary—15.1% | ||||||||
Advance Auto Parts, Inc. | 1,914 | $ | 285 | |||||
Amazon.com, Inc.(2) | 10,109 | 8,464 | ||||||
AutoNation, Inc.(2) | 1,714 | 84 | ||||||
AutoZone, Inc.(2) | 758 | 582 | ||||||
Bed Bath & Beyond, Inc. | 3,964 | 171 | ||||||
Best Buy Co., Inc. | 7,110 | 271 | ||||||
BorgWarner, Inc. | 5,163 | 182 | ||||||
CarMax, Inc.(2) | 4,958 | 265 | ||||||
Carnival Corp. | 11,107 | 542 | ||||||
CBS Corp. Class B | 10,565 | 578 | ||||||
Charter Communications, Inc. Class A(2) | 5,657 | 1,527 | ||||||
Chipotle Mexican Grill, Inc.(2) | 756 | 320 | ||||||
Coach, Inc. | 7,149 | 261 | ||||||
Comcast Corp. Class A | 62,259 | 4,130 | ||||||
Darden Restaurants, Inc. | 3,249 | 199 | ||||||
Delphi Automotive plc | 7,013 | 500 | ||||||
Discovery Communications, Inc. Class A(2) | 3,896 | 105 | ||||||
Discovery Communications, Inc. Class C(2) | 5,776 | 152 | ||||||
Dollar General Corp. | 6,721 | 470 | ||||||
Dollar Tree, Inc.(2) | 6,074 | 479 | ||||||
Expedia, Inc. | 3,138 | 366 | ||||||
Foot Locker, Inc. | 3,495 | 237 | ||||||
Ford Motor Co. | 100,559 | 1,214 | ||||||
Gap, Inc. (The) | 5,609 | 125 | ||||||
Garmin Ltd. | 2,982 | 144 | ||||||
General Motors Co. | 36,585 | 1,162 | ||||||
Genuine Parts Co. | 3,837 | 385 | ||||||
Goodyear Tire & Rubber Co. (The) | 6,794 | 219 | ||||||
H&R Block, Inc. | 5,664 | 131 | ||||||
Hanesbrands, Inc. | 9,823 | 248 | ||||||
Harley-Davidson, Inc. | 4,681 | 246 | ||||||
Harman International Industries, Inc. | 1,803 | 152 | ||||||
Hasbro, Inc. | 2,938 | 233 | ||||||
Home Depot, Inc. (The) | 32,010 | 4,119 | ||||||
Horton (D.R.), Inc. | 8,827 | 267 | ||||||
Interpublic Group of Cos., Inc. (The) | 10,320 | 231 | ||||||
Johnson Controls International plc | 24,397 | 1,135 | ||||||
Kohl’s Corp. | 4,614 | 202 | ||||||
L Brands, Inc. | 6,238 | 442 | ||||||
Leggett & Platt, Inc. | 3,505 | 160 | ||||||
Lennar Corp. Class A | 4,877 | 207 | ||||||
LKQ Corp.(2) | 7,957 | 282 | ||||||
Lowe’s Cos., Inc. | 22,784 | 1,645 | ||||||
Macy’s, Inc. | 7,866 | 291 | ||||||
Marriott International, Inc. Class A | 8,288 | 558 | ||||||
Mattel, Inc. | 8,927 | 270 | ||||||
McDonald’s Corp. | 22,082 | 2,547 | ||||||
Michael Kors Holdings Ltd.(2) | 4,420 | 207 | ||||||
Mohawk Industries, Inc.(2) | 1,633 | 327 | ||||||
Netflix, Inc.(2) | 11,040 | 1,088 | ||||||
Newell Brands, Inc. | 12,431 | 655 | ||||||
News Corp. Class A | 9,835 | 138 | ||||||
News Corp. Class B | 3,086 | 44 | ||||||
NIKE, Inc. Class B | 34,650 | 1,824 | ||||||
| SHARES | VALUE | |||||||
| Consumer Discretionary—continued | ||||||||
Nordstrom, Inc. | 3,010 | $ | 156 | |||||
O’Reilly Automotive, Inc.(2) | 2,457 | 688 | ||||||
Omnicom Group, Inc. | 6,088 | 518 | ||||||
Phillips-Van Heusen Corp. | 2,027 | 224 | ||||||
Priceline Group, Inc. (The)(2) | 1,289 | 1,897 | ||||||
PulteGroup, Inc. | 8,022 | 161 | ||||||
Ralph Lauren Corp. | 1,452 | 147 | ||||||
Ross Stores, Inc. | 10,222 | 657 | ||||||
Royal Caribbean Cruises Ltd. | 4,319 | 324 | ||||||
Scripps Networks Interactive, Inc. Class A | 2,477 | 157 | ||||||
Signet Jewelers Ltd. | 1,964 | 146 | ||||||
Staples, Inc. | 16,735 | 143 | ||||||
Starbucks Corp. | 37,640 | 2,038 | ||||||
Target Corp. | 14,843 | 1,019 | ||||||
TEGNA, Inc. | 5,545 | 121 | ||||||
Tiffany & Co. | 2,752 | 200 | ||||||
Time Warner, Inc. | 19,958 | 1,589 | ||||||
TJX Cos., Inc. (The) | 16,916 | 1,265 | ||||||
Tractor Supply Co. | 3,499 | 236 | ||||||
TripAdvisor, Inc.(2) | 2,947 | 186 | ||||||
Twenty-First Century Fox, Inc. Class A | 27,452 | 665 | ||||||
Twenty-First Century Fox, Inc. Class B | 12,549 | 311 | ||||||
Ulta Salon Cosmetics & Fragrance, Inc.(2) | 1,512 | 360 | ||||||
Under Armour, Inc. Class A(2) | 4,748 | 184 | ||||||
Under Armour, Inc. Class C(2) | 4,780 | 162 | ||||||
Urban Outfitters, Inc.(2) | 2,308 | 80 | ||||||
VF Corp. | 8,500 | 476 | ||||||
Viacom, Inc. Class B | 9,026 | 344 | ||||||
Walt Disney Co. (The) | 37,743 | 3,505 | ||||||
Whirlpool Corp. | 1,941 | 315 | ||||||
Wyndham Worldwide Corp. | 2,852 | 192 | ||||||
Wynn Resorts Ltd. | 2,122 | 207 | ||||||
Yum! Brands, Inc. | 9,534 | 866 | ||||||
|
| |||||||
| 60,607 | ||||||||
|
| |||||||
| Consumer Staples—19.7% | ||||||||
Altria Group, Inc. | 75,428 | 4,769 | ||||||
Archer-Daniels-Midland Co. | 26,969 | 1,137 | ||||||
Brown-Forman Corp. Class B | 9,054 | 430 | ||||||
Campbell Soup Co. | 10,731 | 587 | ||||||
Church & Dwight Co., Inc. | 10,974 | 526 | ||||||
Clorox Co. (The) | 6,465 | 809 | ||||||
Coca-Cola Co. (The) | 165,372 | 6,999 | ||||||
Colgate-Palmolive Co. | 39,117 | 2,900 | ||||||
ConAgra Foods, Inc. | 20,625 | 972 | ||||||
Constellation Brands, Inc. Class A | 11,378 | 1,894 | ||||||
Costco Wholesale Corp. | 19,337 | 2,949 | ||||||
Coty, Inc. Class A | 2,953 | 69 | ||||||
CVS Health Corp. | 46,391 | 4,128 | ||||||
Dr. Pepper Snapple Group, Inc. | 9,266 | 846 | ||||||
Estee Lauder Cos., Inc. (The) Class A | 10,653 | 943 | ||||||
General Mills, Inc. | 27,159 | 1,735 | ||||||
Hershey Co. (The) | 6,910 | 661 | ||||||
Hormel Foods Corp. | 16,322 | 619 | ||||||
J.M. Smucker Co. (The) | 5,957 | 807 | ||||||
Kellogg Co. | 12,174 | 943 | ||||||
Kimberly-Clark Corp. | 16,132 | 2,035 | ||||||
| SHARES | VALUE | |||||||
| Consumer Staples—continued | ||||||||
Kraft Heinz Co.(The) | 25,475 | $ | 2,280 | |||||
Kroger Co. (The) | 45,709 | 1,357 | ||||||
McCormick & Co., Inc. | 6,049 | 604 | ||||||
Mead Johnson Nutrition Co. | 8,600 | 680 | ||||||
Molson Coors Brewing Co. Class B | 9,942 | 1,092 | ||||||
Mondelez International, Inc. Class A | 62,324 | 2,736 | ||||||
Monster Beverage Corp.(2) | 6,598 | 969 | ||||||
PepsiCo, Inc. | 34,976 | 3,804 | ||||||
Philip Morris International, Inc. | 66,257 | 6,442 | ||||||
Procter & Gamble Co. (The) | 113,332 | 10,172 | ||||||
Reynolds American, Inc. | 39,323 | 1,854 | ||||||
Sysco Corp. | 23,813 | 1,167 | ||||||
Tyson Foods, Inc. Class A | 16,584 | 1,238 | ||||||
Wal-Mart Stores, Inc. | 63,770 | 4,599 | ||||||
Walgreens Boots Alliance, Inc. | 38,618 | 3,113 | ||||||
Whole Foods Market, Inc. | 15,045 | 427 | ||||||
|
| |||||||
| 79,292 | ||||||||
|
| |||||||
| Energy—5.1% | ||||||||
Anadarko Petroleum Corp. | 8,586 | 544 | ||||||
Apache Corp. | 6,378 | 407 | ||||||
Baker Hughes, Inc. | 8,407 | 424 | ||||||
Cabot Oil & Gas Corp. | 15,076 | 389 | ||||||
Chesapeake Energy Corp.(2) | 12,733 | 80 | ||||||
Chevron Corp. | 28,389 | 2,922 | ||||||
Cimarex Energy Co. | 1,380 | 185 | ||||||
Concho Resources, Inc.(2) | 2,068 | 284 | ||||||
ConocoPhillips | 13,436 | 584 | ||||||
Devon Energy Corp. | 8,829 | 390 | ||||||
EOG Resources, Inc. | 9,754 | 943 | ||||||
EQT Corp. | 2,542 | 185 | ||||||
Exxon Mobil Corp. | 41,065 | 3,584 | ||||||
FMC Technologies, Inc.(2) | 5,986 | 178 | ||||||
Halliburton Co. | 15,260 | 685 | ||||||
Helmerich & Payne, Inc. | 1,567 | 106 | ||||||
Hess Corp. | 4,889 | 262 | ||||||
Kinder Morgan, Inc. | 28,159 | 651 | ||||||
Marathon Oil Corp. | 14,610 | 231 | ||||||
Marathon Petroleum Corp. | 7,702 | 313 | ||||||
Murphy Oil Corp. | 3,172 | 96 | ||||||
National Oilwell Varco, Inc. | 7,055 | 259 | ||||||
Newfield Exploration Co.(2) | 2,854 | 124 | ||||||
Noble Energy, Inc. | 8,571 | 306 | ||||||
Occidental Petroleum Corp. | 9,799 | 715 | ||||||
ONEOK, Inc. | 3,086 | 159 | ||||||
Phillips 66 | 6,455 | 520 | ||||||
Pioneer Natural Resources Co. | 5,655 | 1,050 | ||||||
Range Resources Corp. | 4,545 | 176 | ||||||
Schlumberger Ltd. | 21,238 | 1,670 | ||||||
Southwestern Energy Co.(2) | 9,375 | 130 | ||||||
Spectra Energy Corp. | 13,660 | 584 | ||||||
Tesoro Corp. | 5,394 | 429 | ||||||
Transocean Ltd.(2) | 5,073 | 54 | ||||||
Valero Energy Corp. | 9,252 | 490 | ||||||
Williams Cos., Inc. (The) | 14,035 | 431 | ||||||
|
| |||||||
| 20,540 | ||||||||
|
| |||||||
| Financials—5.0% | ||||||||
Affiliated Managers Group, Inc.(2) | 443 | 64 | ||||||
Aflac, Inc. | 3,362 | 242 | ||||||
Allstate Corp. (The) | 3,035 | 210 | ||||||
See Notes to Financial Statements
35
Table of Contents
SCHEDULE OF INVESTMENTS (Continued)
SEPTEMBER 30, 2016
($ reported in thousands)
| SHARES | VALUE | |||||||
| Financials—continued | ||||||||
American Express Co. | 6,344 | $ | 406 | |||||
American International Group, Inc. | 8,371 | 497 | ||||||
Ameriprise Financial, Inc. | 1,337 | 133 | ||||||
AON plc | 2,169 | 244 | ||||||
Assurant, Inc. | 491 | 45 | ||||||
Bank of America Corp. | 83,612 | 1,308 | ||||||
Bank of New York Mellon Corp. (The) | 8,843 | 353 | ||||||
BB&T Corp. | 6,693 | 252 | ||||||
Berkshire Hathaway, Inc. | 15,623 | 2,257 | ||||||
BlackRock, Inc. | 997 | 361 | ||||||
Capital One Financial Corp. | 4,169 | 299 | ||||||
Charles Schwab Corp. (The) | 9,932 | 314 | ||||||
CHUBB Ltd. | 3,797 | 477 | ||||||
Cincinnati Financial Corp. | 1,224 | 92 | ||||||
Citigroup, Inc. | 23,970 | 1,132 | ||||||
Citizens Financial Group, Inc. | 4,284 | 106 | ||||||
CME Group, Inc. | 2,760 | 288 | ||||||
Comerica, Inc. | 1,429 | 68 | ||||||
Discover Financial Services | 3,317 | 188 | ||||||
E*Trade Financial Corp.(2) | 2,244 | 65 | ||||||
Fifth Third Bancorp | 6,278 | 128 | ||||||
Franklin Resources, Inc. | 2,922 | 104 | ||||||
Gallagher (Arthur J.) & Co. | 1,445 | 73 | ||||||
Goldman Sachs Group, Inc. (The) | 3,105 | 501 | ||||||
Hartford Financial Services Group, Inc. (The) | 3,171 | 136 | ||||||
Huntington Bancshares, Inc. | 8,984 | 89 | ||||||
Intercontinental Exchange, Inc. | 972 | 262 | ||||||
Invesco Ltd. | 3,409 | 107 | ||||||
JPMorgan Chase & Co. | 29,806 | 1,985 | ||||||
KeyCorp | 8,960 | 109 | ||||||
Legg Mason, Inc. | 763 | 26 | ||||||
Leucadia National Corp. | 2,656 | 51 | ||||||
Lincoln National Corp. | 1,945 | 91 | ||||||
Loews Corp. | 2,280 | 94 | ||||||
M&T Bank Corp. | 1,288 | 149 | ||||||
Marsh & McLennan Cos., Inc. | 4,246 | 286 | ||||||
MetLife, Inc. | 9,091 | 404 | ||||||
Moody’s Corp. | 1,369 | 148 | ||||||
Morgan Stanley | 12,099 | 388 | ||||||
NASDAQ OMX Group, Inc. (The) | 925 | 62 | ||||||
Navient Corp. | 2,618 | 38 | ||||||
Northern Trust Corp. | 1,759 | 120 | ||||||
People’s United Financial, Inc. | 2,567 | 41 | ||||||
PNC Financial Services Group, Inc. (The) | 4,054 | 365 | ||||||
Principal Financial Group, Inc. | 2,215 | 114 | ||||||
Progressive Corp. (The) | 4,713 | 148 | ||||||
Prudential Financial, Inc. | 3,611 | 295 | ||||||
Regions Financial Corp. | 10,318 | 102 | ||||||
S&P Global, Inc. | 2,163 | 274 | ||||||
SL Green Realty Corp. | 3,513 | 380 | ||||||
State Street Corp. | 3,027 | 211 | ||||||
SunTrust Banks, Inc. | 4,129 | 181 | ||||||
Synchrony Financial | 6,511 | 182 | ||||||
T. Rowe Price Group, Inc. | 2,053 | 136 | ||||||
Torchmark Corp. | 917 | 59 | ||||||
Travelers Cos., Inc. (The) | 2,353 | 269 | ||||||
U.S. Bancorp | 13,236 | 568 | ||||||
Unum Group | 1,950 | 69 | ||||||
| SHARES | VALUE | |||||||
| Financials—continued | ||||||||
Wells Fargo & Co. | 37,553 | $ | 1,663 | |||||
Willis Towers Watson plc | 1,068 | 142 | ||||||
XL Group Ltd. | 2,260 | 76 | ||||||
Zions Bancorp | 1,693 | 52 | ||||||
|
| |||||||
| 20,079 | ||||||||
|
| |||||||
| Health Care—14.7% | ||||||||
Abbott Laboratories | 26,612 | 1,125 | ||||||
AbbVie, Inc. | 34,637 | 2,185 | ||||||
Aetna, Inc. | 7,683 | 887 | ||||||
Agilent Technologies, Inc. | 7,034 | 331 | ||||||
Alexion Pharmaceuticals, Inc.(2) | 4,769 | 584 | ||||||
Allergan plc | 8,902 | 2,050 | ||||||
AmerisourceBergen Corp. | 4,017 | 324 | ||||||
Amgen, Inc. | 15,973 | 2,664 | ||||||
Anthem, Inc. | 5,726 | 718 | ||||||
Bard (C.R.), Inc. | 1,651 | 370 | ||||||
Baxter International, Inc. | 10,578 | 504 | ||||||
Becton, Dickinson & Co. | 4,648 | 835 | ||||||
Biogen, Inc.(2) | 4,775 | 1,495 | ||||||
Boston Scientific Corp.(2) | 29,124 | 693 | ||||||
Bristol-Myers Squibb Co. | 35,789 | 1,930 | ||||||
Cardinal Health, Inc. | 6,862 | 533 | ||||||
Celgene Corp.(2) | 16,534 | 1,728 | ||||||
Centene Corp.(2) | 3,638 | 244 | ||||||
Cerner Corp.(2) | 6,399 | 395 | ||||||
Cigna Corp. | 5,650 | 736 | ||||||
Cooper Cos, Inc. (The) | 1,035 | 186 | ||||||
Danaher Corp. | 12,947 | 1,015 | ||||||
DaVita HealthCare Partners, Inc.(2) | 3,518 | 232 | ||||||
DENTSPLY SIRONA, Inc. | 5,020 | 298 | ||||||
Edwards Lifesciences Corp.(2) | 4,570 | 551 | ||||||
Eli Lilly & Co. | 20,721 | 1,663 | ||||||
Endo International plc(2) | 4,215 | 85 | ||||||
Express Scripts Holding Co.(2) | 14,177 | 1,000 | ||||||
Gilead Sciences, Inc. | 28,122 | 2,225 | ||||||
HCA Holdings, Inc.(2) | 6,327 | 479 | ||||||
Henry Schein, Inc.(2) | 1,739 | 283 | ||||||
Hologic, Inc.(2) | 5,937 | 231 | ||||||
Humana, Inc. | 3,441 | 609 | ||||||
Illumina, Inc.(2) | 3,128 | 568 | ||||||
Intuitive Surgical, Inc.(2) | 825 | 598 | ||||||
Johnson & Johnson | 58,251 | 6,881 | ||||||
Laboratory Corporation of America Holdings(2) | 2,173 | 299 | ||||||
Mallinckrodt plc(2) | 2,307 | 161 | ||||||
McKesson Corp. | 4,960 | 827 | ||||||
Medtronic plc | 29,521 | 2,551 | ||||||
Merck & Co., Inc. | 59,176 | 3,693 | ||||||
Mettler-Toledo International, Inc.(2) | 571 | 240 | ||||||
Mylan NV(2) | 9,832 | 375 | ||||||
Patterson Cos., Inc. | 1,780 | 82 | ||||||
PerkinElmer, Inc. | 2,329 | 131 | ||||||
Perrigo Co. plc | 3,043 | 281 | ||||||
Pfizer, Inc. | 129,431 | 4,384 | ||||||
Quest Diagnostics, Inc. | 3,076 | 260 | ||||||
Regeneron Pharmaceuticals, Inc.(2) | 1,608 | 646 | ||||||
St. Jude Medical, Inc. | 6,252 | 499 | ||||||
Stryker Corp. | 6,753 | 786 | ||||||
Thermo Fisher Scientific, Inc. | 8,390 | 1,335 | ||||||
| SHARES | VALUE | |||||||
| Health Care—continued | ||||||||
UnitedHealth Group, Inc. | 20,484 | $ | 2,868 | |||||
Universal Health Services, Inc. Class B | 1,908 | 235 | ||||||
Varian Medical Systems, Inc.(2) | 2,000 | 199 | ||||||
Vertex Pharmaceuticals, Inc.(2) | 5,279 | 460 | ||||||
Waters Corp.(2) | 1,734 | 275 | ||||||
Zimmer Biomet Holdings, Inc. | 4,322 | 562 | ||||||
Zoetis, Inc. | 10,619 | 552 | ||||||
|
| |||||||
| 58,936 | ||||||||
|
| |||||||
| Industrials—5.1% | ||||||||
3M Co. | 6,650 | 1,172 | ||||||
Acuity Brands, Inc. | 472 | 125 | ||||||
Alaska Air Group, Inc. | 1,323 | 87 | ||||||
Allegion plc | 1,027 | 71 | ||||||
American Airlines Group, Inc. | 5,710 | 209 | ||||||
Ametek, Inc. | 2,501 | 120 | ||||||
Avery Dennison Corp. | 3,544 | 276 | ||||||
Boeing Co. (The) | 6,493 | 855 | ||||||
Caterpillar, Inc. | 6,634 | 589 | ||||||
Cintas Corp. | 1,102 | 124 | ||||||
CSX Corp. | 12,111 | 369 | ||||||
Cummins, Inc. | 3,044 | 390 | ||||||
Deere & Co. | 3,432 | 293 | ||||||
Delta Air Lines, Inc. | 8,067 | 318 | ||||||
Dover Corp. | 2,014 | 148 | ||||||
Dun & Bradstreet Corp. (The) | 392 | 54 | ||||||
Eaton Corp. plc | 5,988 | 393 | ||||||
Emerson Electric Co. | 7,309 | 398 | ||||||
Equifax, Inc. | 1,756 | 236 | ||||||
Expeditors International of Washington, Inc. | 1,933 | 100 | ||||||
Fastenal Co. | 3,133 | 131 | ||||||
FedEx Corp. | 2,810 | 491 | ||||||
Flowserve Corp. | 1,392 | 67 | ||||||
Fluor Corp. | 2,180 | 112 | ||||||
Fortive Corp. | 3,634 | 185 | ||||||
Fortune Brands Home & Security, Inc. | 1,662 | 97 | ||||||
General Dynamics Corp. | 3,361 | 522 | ||||||
General Electric Co. | 70,701 | 2,094 | ||||||
Honeywell International, Inc. | 8,627 | 1,006 | ||||||
Hunt (JB) Transport Services, Inc. | 935 | 76 | ||||||
Illinois Tool Works, Inc. | 3,640 | 436 | ||||||
Ingersoll-Rand plc | 2,769 | 188 | ||||||
Jacobs Engineering Group, Inc.(2) | 1,317 | 68 | ||||||
Kansas City Southern | 1,161 | 108 | ||||||
L-3 Communications Holdings, Inc. | 824 | 124 | ||||||
Lockheed Martin Corp. | 2,859 | 685 | ||||||
Masco Corp. | 3,966 | 136 | ||||||
Nielsen Holdings plc | 3,593 | 192 | ||||||
Norfolk Southern Corp. | 3,672 | 356 | ||||||
Northrop Grumman Corp. | 2,051 | 439 | ||||||
PACCAR, Inc. | 4,339 | 255 | ||||||
Parker Hannifin Corp. | 1,815 | 228 | ||||||
Pentair plc | 1,770 | 114 | ||||||
Pitney Bowes, Inc. | 2,282 | 41 | ||||||
Quanta Services, Inc.(2) | 1,621 | 45 | ||||||
Raytheon Co. | 3,448 | 469 | ||||||
Republic Services, Inc. | 2,492 | 126 | ||||||
Robert Half International, Inc. | 1,967 | 74 | ||||||
See Notes to Financial Statements
36
Table of Contents
SCHEDULE OF INVESTMENTS (Continued)
SEPTEMBER 30, 2016
($ reported in thousands)
| SHARES | VALUE | |||||||
| Industrials—continued | ||||||||
Robinson (C.H.) Worldwide, Inc. | 1,526 | $ | 108 | |||||
Rockwell Automation, Inc. | 1,809 | 221 | ||||||
Rockwell Collins, Inc. | 1,798 | 152 | ||||||
Roper Technologies, Inc. | 1,090 | 199 | ||||||
Ryder System, Inc. | 1,036 | 68 | ||||||
Snap-On, Inc. | 620 | 94 | ||||||
Southwest Airlines Co. | 7,293 | 284 | ||||||
Stanley Black & Decker, Inc. | 1,614 | 199 | ||||||
Stericycle, Inc.(2) | 911 | 73 | ||||||
Textron, Inc. | 3,592 | 143 | ||||||
TransDigm Group, Inc.(2) | 532 | 154 | ||||||
Union Pacific Corp. | 9,695 | 946 | ||||||
United Continental Holdings, Inc.(2) | 3,132 | 164 | ||||||
United Parcel Service, Inc. Class B | 7,533 | 824 | ||||||
United Rentals, Inc.(2) | 935 | 73 | ||||||
United Technologies Corp. | 8,756 | 890 | ||||||
W.W. Grainger, Inc. | 815 | 183 | ||||||
Waste Management, Inc. | 4,726 | 301 | ||||||
Xylem, Inc. | 1,919 | 101 | ||||||
|
| |||||||
| 20,369 | ||||||||
|
| |||||||
| Information Technology—4.5% | ||||||||
Accenture plc Class A | 2,789 | 341 | ||||||
Activision Blizzard, Inc. | 3,117 | 138 | ||||||
Adobe Systems, Inc.(2) | 2,245 | 244 | ||||||
Akamai Technologies, Inc.(2) | 824 | 44 | ||||||
Alliance Data Systems | 274 | 59 | ||||||
Alphabet, Inc. Class A(2) | 1,309 | 1,052 | ||||||
Alphabet, Inc. Class C(2) | 1,313 | 1,021 | ||||||
Amphenol Corp. Class A | 1,412 | 92 | ||||||
Analog Devices, Inc. | 1,420 | 91 | ||||||
Apple, Inc. | 24,012 | 2,715 | ||||||
Applied Materials, Inc. | 4,862 | 147 | ||||||
Autodesk, Inc.(2) | 905 | 65 | ||||||
Automatic Data Processing, Inc. | 2,061 | 182 | ||||||
Broadcom Ltd. | 1,780 | 307 | ||||||
CA, Inc. | 1,492 | 49 | ||||||
Cisco Systems, Inc. | 22,640 | 718 | ||||||
Citrix Systems, Inc.(2) | 724 | 62 | ||||||
Cognizant Technology Solutions Corp. Class A(2) | 2,761 | 132 | ||||||
Corning, Inc. | 4,702 | 111 | ||||||
CSRA, Inc. | 766 | 21 | ||||||
eBay, Inc.(2) | 4,772 | 157 | ||||||
Electronic Arts, Inc.(2) | 1,371 | 117 | ||||||
F5 Networks, Inc.(2) | 318 | 40 | ||||||
Facebook, Inc. Class A(2) | 10,228 | 1,312 | ||||||
Fidelity National Information Services, Inc. | 1,511 | 116 | ||||||
First Solar, Inc.(2) | 402 | 16 | ||||||
Fiserv, Inc.(2) | 1,005 | 100 | ||||||
FLIR Systems, Inc. | 689 | 22 | ||||||
Global Payments, Inc. | 728 | 56 | ||||||
Harris Corp. | 586 | 54 | ||||||
Hewlett Packard Enterprise Co. | 7,482 | 170 | ||||||
HP Inc. | 7,749 | 120 | ||||||
Intel Corp. | 20,474 | 773 | ||||||
International Business Machines Corp. | 3,888 | 618 | ||||||
Intuit, Inc. | 1,116 | 123 | ||||||
Juniper Networks, Inc. | 1,856 | 45 | ||||||
| SHARES | VALUE | |||||||
| Information Technology—continued | ||||||||
KLA-Tencor Corp. | 740 | $ | 52 | |||||
Lam Research Corp. | 740 | 70 | ||||||
Linear Technology Corp. | 1,118 | 66 | ||||||
MasterCard, Inc. Class A | 4,272 | 435 | ||||||
Microchip Technology, Inc. | 1,004 | 62 | ||||||
Micron Technology, Inc.(2) | 4,729 | 84 | ||||||
Microsoft Corp. | 34,442 | 1,984 | ||||||
Motorola Solutions, Inc. | 784 | 60 | ||||||
NetApp, Inc. | 1,350 | 48 | ||||||
NVIDIA Corp. | 2,415 | 165 | ||||||
Oracle Corp. | 13,911 | 546 | ||||||
Paychex, Inc. | 1,479 | 86 | ||||||
PayPal Holdings, Inc.(2) | 5,074 | 208 | ||||||
Qorvo, Inc.(2) | 626 | 35 | ||||||
QUALCOMM, Inc. | 6,524 | 447 | ||||||
Red Hat, Inc.(2) | 835 | 67 | ||||||
salesforce.com, Inc.(2) | 2,891 | 206 | ||||||
Seagate Technology plc | 1,433 | 55 | ||||||
Skyworks Solutions, Inc. | 881 | 67 | ||||||
Symantec Corp. | 2,800 | 70 | ||||||
TE Connectivity Ltd. | 1,630 | 105 | ||||||
Teradata Corp.(2) | 689 | 21 | ||||||
Texas Instruments, Inc. | 4,486 | 315 | ||||||
Total System Services, Inc. | 792 | 37 | ||||||
VeriSign, Inc.(2) | 441 | 34 | ||||||
Verisk Analytics, Inc.(2) | 1,686 | 137 | ||||||
Visa, Inc. Class A | 8,392 | 694 | ||||||
Western Digital Corp. | 1,281 | 75 | ||||||
Western Union Co. (The) | 2,300 | 48 | ||||||
Xerox Corp. | 4,060 | 41 | ||||||
Xilinx, Inc. | 1,183 | 64 | ||||||
Yahoo!, Inc.(2) | 3,958 | 171 | ||||||
|
| |||||||
| 17,985 | ||||||||
|
| |||||||
| Materials—4.9% | ||||||||
Air Products & Chemicals, Inc. | 6,674 | 1,003 | ||||||
Albemarle Corp. | 4,150 | 355 | ||||||
Alcoa, Inc.(2) | 50,875 | 516 | ||||||
Ball Corp. | 6,767 | 555 | ||||||
CF Industries Holdings, Inc. | 9,262 | 225 | ||||||
Dow Chemical Co. (The) | 41,468 | 2,149 | ||||||
Du Pont (E.I.) de Nemours & Co. | 32,234 | 2,159 | ||||||
Eastman Chemical Co. | 5,788 | 392 | ||||||
Ecolab, Inc. | 9,714 | 1,182 | ||||||
FMC Corp. | 5,376 | 260 | ||||||
Freeport-McMoRan Copper & Gold, Inc. | 46,823 | 508 | ||||||
International Flavors & Fragrances, Inc. | 3,086 | 441 | ||||||
International Paper Co. | 15,209 | 730 | ||||||
LyondellBasell Industries N.V. Class A | 9,952 | 803 | ||||||
Martin Marietta Materials, Inc. | 2,502 | 448 | ||||||
Monsanto Co. | 16,125 | 1,648 | ||||||
Mosaic Co. (The) | 13,727 | 336 | ||||||
Newmont Mining Corp. | 20,842 | 819 | ||||||
Nucor Corp. | 12,088 | 598 | ||||||
Owens-Illinois, Inc.(2) | 7,586 | 139 | ||||||
PPG Industries, Inc. | 9,847 | 1,018 | ||||||
Praxair, Inc. | 10,512 | 1,270 | ||||||
Sealed Air Corp. | 7,767 | 356 | ||||||
Sherwin-Williams Co. (The) | 3,044 | 842 | ||||||
Vulcan Materials Co. | 5,114 | 582 | ||||||
| SHARES | VALUE | |||||||
| Materials—continued | ||||||||
Westrock Co. | 9,451 | $ | 458 | |||||
|
| |||||||
| 19,792 | ||||||||
|
| |||||||
| Real Estate—4.9% | ||||||||
American Tower Corp. | 14,850 | 1,683 | ||||||
Apartment Investment & Management Co. Class A | 5,488 | 252 | ||||||
AvalonBay Communities, Inc. | 4,803 | 854 | ||||||
Boston Properties, Inc. | 5,378 | 733 | ||||||
CBRE Group, Inc. Class A(2) | 10,362 | 290 | ||||||
Crown Castle International Corp. | 11,781 | 1,110 | ||||||
Digital Realty Trust, Inc. | 5,157 | 501 | ||||||
Equinix, Inc. | 2,496 | 899 | ||||||
Equity Residential | 12,777 | 822 | ||||||
Essex Property Trust, Inc. | 2,294 | 511 | ||||||
Extra Space Storage, Inc. | 4,398 | 349 | ||||||
Federal Realty Investment Trust | 2,483 | 382 | ||||||
General Growth Properties, Inc. | 20,416 | 563 | ||||||
HCP, Inc. | 16,351 | 620 | ||||||
Host Hotels & Resorts, Inc. | 25,967 | 404 | ||||||
Iron Mountain, Inc. | 8,548 | 321 | ||||||
Kimco Realty Corp. | 14,701 | 426 | ||||||
Macerich Co. (The) | 4,220 | 341 | ||||||
Prologis, Inc. | 18,445 | 988 | ||||||
Public Storage | 5,199 | 1,160 | ||||||
Realty Income Corp. | 9,056 | 606 | ||||||
Simon Property Group, Inc. | 10,947 | 2,266 | ||||||
UDR, Inc. | 9,358 | 337 | ||||||
Ventas, Inc. | 12,273 | 867 | ||||||
Vornado Realty Trust | 6,013 | 609 | ||||||
Welltower, Inc. | 12,515 | 936 | ||||||
Weyerhaeuser Co. | 26,259 | 839 | ||||||
|
| |||||||
| 19,669 | ||||||||
|
| |||||||
| Telecommunication Services—0.5% | ||||||||
AT&T, Inc. | 27,390 | 1,112 | ||||||
CenturyLink, Inc. | 2,519 | 69 | ||||||
Frontier Communications Corp. | 6,012 | 25 | ||||||
Level 3 Communications, | 1,347 | 63 | ||||||
Verizon Communications, Inc. | 14,935 | 776 | ||||||
|
| |||||||
| 2,045 | ||||||||
|
| |||||||
| Utilities—19.6% | ||||||||
AES Corp. | 85,331 | 1,097 | ||||||
Alliant Energy Corp. | 29,105 | 1,115 | ||||||
Ameren Corp. | 31,235 | 1,536 | ||||||
American Electric Power Co., Inc. | 63,406 | 4,071 | ||||||
American Water Works Co., Inc. | 22,740 | 1,702 | ||||||
CenterPoint Energy, Inc. | 55,687 | 1,294 | ||||||
CMS Energy Corp. | 36,521 | 1,534 | ||||||
Consolidated Edison, Inc. | 39,126 | 2,946 | ||||||
Dominion Resources, Inc. | 80,004 | 5,942 | ||||||
DTE Energy Co. | 23,152 | 2,169 | ||||||
Duke Energy Corp. | 81,651 | 6,535 | ||||||
Edison International | 41,798 | 3,020 | ||||||
Entergy Corp. | 22,896 | 1,757 | ||||||
Eversource Energy | 40,762 | 2,208 | ||||||
Exelon Corp. | 118,205 | 3,935 | ||||||
FirstEnergy Corp. | 54,622 | 1,807 | ||||||
NextEra Energy, Inc. | 59,922 | 7,330 | ||||||
NiSource, Inc. | 41,681 | 1,005 | ||||||
See Notes to Financial Statements
37
Table of Contents
SCHEDULE OF INVESTMENTS (Continued)
SEPTEMBER 30, 2016
($ reported in thousands)
| SHARES | VALUE | |||||||
| Utilities—continued | ||||||||
NRG Energy, Inc. | 41,140 | $ | 461 | |||||
PG&E Corp. | 64,167 | 3,925 | ||||||
Pinnacle West Capital Corp. | 14,560 | 1,106 | ||||||
PPL Corp. | 87,090 | 3,011 | ||||||
Public Service Enterprise Group, Inc. | 64,888 | 2,717 | ||||||
SCANA Corp. | 18,280 | 1,323 | ||||||
Sempra Energy | 32,117 | 3,443 | ||||||
Southern Co. | 125,207 | 6,423 | ||||||
WEC Energy Group, Inc. | 40,417 | 2,420 | ||||||
XCEL Energy, Inc. | 65,660 | 2,701 | ||||||
|
| |||||||
| 78,533 | ||||||||
| TOTAL COMMON STOCKS (Identified Cost $375,117) | 397,847 | |||||||
| TOTAL LONG TERM INVESTMENTS—99.1% | ||||||||
| (Identified Cost $375,117) | 397,847 | |||||||
| TOTAL INVESTMENTS—99.1% (Identified Cost $375,117) | 397,847 | (1) | ||||||
Other assets and liabilities, net—0.9% |
| 3,712 | ||||||
|
| |||||||
| NET ASSETS—100.0% | $ | 401,559 | ||||||
|
| |||||||
Footnote Legend:
| (1) | Federal Income Tax Information: For tax information at September 30, 2016, see Note 10 Federal Income Tax Information in the Notes to Financial Statements. |
| (2) | Non-income producing. |
The following table provides a summary of inputs used to value the Fund’s investments as of September 30, 2016 (See Security Valuation Note 2A in the Notes to Financial Statements):
| Total Value at September 30, 2016 | Level 1 Quoted Prices | |||||||
Equity Securities: | ||||||||
Common Stocks | $ | 397,847 | $ | 397,847 | ||||
|
|
|
| |||||
Total Investments | $ | 397,847 | $ | 397,847 | ||||
|
|
|
| |||||
There are no Level 2 (significant observable inputs) or Level 3 (significant unobservable inputs) priced securities.
There were no transfers between Level 1 and Level 2 related to securities held at September 30, 2016.
See Notes to Financial Statements
38
Table of Contents
VIRTUS OPPORTUNITIES TRUST
STATEMENTS OF ASSETS AND LIABILITIES
SEPTEMBER 30, 2016
(Reported in thousands except shares and per share amounts)
|
|
|
|
|
| |||||||
| Alternatives Diversifier Fund | Equity Trend Fund | Global Equity Trend Fund | ||||||||||
| Assets | ||||||||||||
Investment in unaffiliated securities at value(1) | $ | 29,039 | $ | 944,772 | $ | 23,727 | ||||||
Investments in affiliated funds at value(2) | 29,302 | — | — | |||||||||
Cash | 300 | — | 226 | |||||||||
Receivables | ||||||||||||
Investment securities sold | — | 15,507 | — | |||||||||
Fund shares sold | 83 | 191 | 12 | |||||||||
Dividends and interest receivable | — | (3) | 1,541 | 23 | ||||||||
Prepaid trustee retainer | 1 | 22 | 1 | |||||||||
Prepaid expenses | 23 | 49 | 18 | |||||||||
Other assets | 1 | 13 | — | (3) | ||||||||
|
|
|
|
|
| |||||||
Total assets | 58,749 | 962,095 | 24,007 | |||||||||
|
|
|
|
|
| |||||||
| Liabilities | ||||||||||||
Cash overdraft | — | 1,885 | — | |||||||||
Payables | ||||||||||||
Fund shares repurchased | 119 | 6,708 | 14 | |||||||||
Investment advisory fees | — | 822 | 20 | |||||||||
Distribution and service fees | 20 | 414 | 11 | |||||||||
Administration fees | 6 | 99 | 3 | |||||||||
Transfer agent fees and expenses | 18 | 198 | 7 | |||||||||
Trustees’ fees and expenses | 1 | 10 | — | (3) | ||||||||
Professional fees | 19 | 28 | 18 | |||||||||
Trustee deferred compensation plan | 1 | 13 | — | (3) | ||||||||
Other accrued expenses | 6 | 134 | 4 | |||||||||
|
|
|
|
|
| |||||||
Total liabilities | 190 | 10,311 | 77 | |||||||||
|
|
|
|
|
| |||||||
| Net Assets | $ | 58,559 | $ | 951,784 | $ | 23,930 | ||||||
|
|
|
|
|
| |||||||
| Net Assets Consist of: | ||||||||||||
Capital paid in on shares of beneficial interest | $ | 127,270 | $ | 1,465,643 | $ | 36,349 | ||||||
Accumulated undistributed net investment income (loss) | 316 | (1,663 | ) | (207 | ) | |||||||
Accumulated undistributed net realized gain (loss) | (79,301 | ) | (598,813 | ) | (14,328 | ) | ||||||
Net unrealized appreciation (depreciation) on investments | 10,274 | 86,617 | 2,116 | |||||||||
|
|
|
|
|
| |||||||
| Net Assets | $ | 58,559 | $ | 951,784 | $ | 23,930 | ||||||
|
|
|
|
|
| |||||||
| Class A | ||||||||||||
Net asset value (net assets/shares outstanding) per share | $ | 10.89 | $ | 12.23 | $ | 9.94 | ||||||
Maximum offering price per share NAV/(1–5.75%) | $ | 11.55 | $ | 12.98 | $ | 10.55 | ||||||
Shares of beneficial interest outstanding, no par value, unlimited authorization | 1,760,761 | 20,041,186 | 840,123 | |||||||||
Net Assets | $ | 19,171 | $ | 245,109 | $ | 8,351 | ||||||
| Class C | ||||||||||||
Net asset value (net assets/shares outstanding) and offering price per share | $ | 10.73 | $ | 11.88 | $ | 9.69 | ||||||
Shares of beneficial interest outstanding, no par value, unlimited authorization | 1,826,873 | 35,663,123 | 1,162,279 | |||||||||
Net Assets | $ | 19,611 | $ | 423,675 | $ | 11,267 | ||||||
| Class I | ||||||||||||
Net asset value (net assets/shares outstanding) and offering price per share | $ | 10.89 | $ | 12.31 | $ | 10.00 | ||||||
Shares of beneficial interest outstanding, no par value, unlimited authorization | 1,815,229 | 22,978,762 | 431,008 | |||||||||
Net Assets | $ | 19,777 | $ | 282,818 | $ | 4,312 | ||||||
| Class R6 | ||||||||||||
Net asset value (net assets/shares outstanding) and offering price per share | $ | — | $ | 12.34 | $ | — | ||||||
Shares of beneficial interest outstanding, no par value, unlimited authorization | — | 14,720 | — | |||||||||
Net Assets | $ | — | $ | 182 | $ | — | ||||||
(1) Investment in unaffiliated securities at cost | $ | 27,522 | $ | 858,155 | $ | 21,610 | ||||||
(2) Investment in affiliated funds at cost | $ | 20,545 | $ | — | $ | — | ||||||
(3) Amount is less than $500. | ||||||||||||
See Notes to Financial Statements
39
Table of Contents
VIRTUS OPPORTUNITIES TRUST
STATEMENTS OF ASSETS AND LIABILITIES (Continued)
SEPTEMBER 30, 2016
(Reported in thousands except shares and per share amounts)
|
|
|
|
|
| |||||||
| Herzfeld Fund | Multi-Asset Trend Fund | Sector Trend Fund | ||||||||||
| Assets | ||||||||||||
Investment in securities at value(1) | $ | 46,622 | $ | 134,012 | $ | 397,847 | ||||||
Cash | 750 | 5,173 | 4,706 | |||||||||
Receivables | ||||||||||||
Investment securities sold | 65 | 1,432 | 40,527 | |||||||||
Fund shares sold | 83 | 25 | 587 | |||||||||
Dividends and interest receivable | 50 | 85 | 803 | |||||||||
Prepaid trustee retainer | 1 | 3 | 9 | |||||||||
Prepaid expenses | 32 | 20 | 36 | |||||||||
Other assets | 1 | 2 | 5 | |||||||||
|
|
|
|
|
| |||||||
Total assets | 47,604 | 140,752 | 444,520 | |||||||||
|
|
|
|
|
| |||||||
| Liabilities | ||||||||||||
Payables | ||||||||||||
Fund shares repurchased | 90 | 1,199 | 1,765 | |||||||||
Investment securities purchased | 289 | — | 40,697 | |||||||||
Investment advisory fees | 29 | 118 | 150 | |||||||||
Distribution and service fees | 14 | 75 | 165 | |||||||||
Administration fees | 5 | 15 | 41 | |||||||||
Transfer agent fees and expenses | 13 | 28 | 81 | |||||||||
Trustees’ fees and expenses | 1 | 1 | 4 | |||||||||
Professional fees | 19 | 18 | 19 | |||||||||
Trustee deferred compensation plan | 1 | 2 | 5 | |||||||||
Other accrued expenses | 4 | 14 | 34 | |||||||||
|
|
|
|
|
| |||||||
Total liabilities | 465 | 1,470 | 42,961 | |||||||||
|
|
|
|
|
| |||||||
| Net Assets | $ | 47,139 | $ | 139,282 | $ | 401,559 | ||||||
|
|
|
|
|
| |||||||
| Net Assets Consist of: | ||||||||||||
Capital paid in on shares of beneficial interest | $ | 48,009 | $ | 163,588 | $ | 442,248 | ||||||
Accumulated undistributed net investment income (loss) | 5 | (529 | ) | 2,144 | ||||||||
Accumulated undistributed net realized gain (loss) | (1,511 | ) | (35,191 | ) | (65,564 | ) | ||||||
Net unrealized appreciation (depreciation) on investments | 636 | 11,414 | 22,731 | |||||||||
|
|
|
|
|
| |||||||
| Net Assets | $ | 47,139 | $ | 139,282 | $ | 401,559 | ||||||
|
|
|
|
|
| |||||||
| Class A | ||||||||||||
Net asset value (net assets/shares outstanding) per share | $ | 10.92 | $ | 10.31 | $ | 11.29 | ||||||
Maximum offering price per share NAV/(1–5.75%) | $ | 11.59 | $ | 10.94 | $ | 11.98 | ||||||
Shares of beneficial interest outstanding, no par value, unlimited authorization | 1,012,667 | 2,890,104 | 11,639,415 | |||||||||
Net Assets | $ | 11,060 | $ | 29,798 | $ | 131,389 | ||||||
| Class C | ||||||||||||
Net asset value (net assets/shares outstanding) and offering price per share | $ | 10.88 | $ | 10.10 | $ | 11.04 | ||||||
Shares of beneficial interest outstanding, no par value, unlimited authorization | 1,430,483 | 8,018,321 | 15,146,948 | |||||||||
Net Assets | $ | 15,568 | $ | 80,962 | $ | 167,265 | ||||||
| Class I | ||||||||||||
Net asset value (net assets/shares outstanding) and offering price per share | $ | 10.94 | $ | 10.34 | $ | 11.28 | ||||||
Shares of beneficial interest outstanding, no par value, unlimited authorization | 1,874,859 | 2,757,612 | 9,121,404 | |||||||||
Net Assets | $ | 20,511 | $ | 28,522 | $ | 102,905 | ||||||
(1) Investment in securities at cost | $ | 45,986 | $ | 122,598 | $ | 375,117 | ||||||
See Notes to Financial Statements
40
Table of Contents
VIRTUS OPPORTUNITIES TRUST
YEAR ENDED SEPTEMBER 30, 2016
($ reported in thousands)
|
|
|
|
|
| |||||||
| Alternatives Diversifier Fund | Equity Trend Fund | Global Equity Trend Fund | ||||||||||
| Investment Income | ||||||||||||
Dividends | $ | 210 | $ | 20,226 | $ | 424 | ||||||
Dividends from affiliated funds | 763 | — | — | |||||||||
Interest | — | 46 | 3 | |||||||||
|
|
|
|
|
| |||||||
Total investment income | 973 | 20,272 | 427 | |||||||||
|
|
|
|
|
| |||||||
| Expenses | ||||||||||||
Investment advisory fees | — | 13,889 | 371 | |||||||||
Service fees, Class A | 50 | 933 | 31 | |||||||||
Distribution and service fees, Class C | 216 | 5,876 | 158 | |||||||||
Administration fees | 80 | 1,750 | 47 | |||||||||
Transfer agent fees and expenses | 123 | 1,872 | 62 | |||||||||
Registration fees | 46 | 198 | 47 | |||||||||
Printing fees and expenses | 20 | 377 | 12 | |||||||||
Custodian fees | 7 | 50 | 2 | |||||||||
Professional fees | 23 | 42 | 19 | |||||||||
Trustees’ fees and expenses | 6 | 134 | 3 | |||||||||
Miscellaneous expenses | 7 | 131 | 6 | |||||||||
|
|
|
|
|
| |||||||
Total expenses | 578 | 25,252 | 758 | |||||||||
Less expenses reimbursed and/or waived by investment adviser | — | (1,475 | ) | (7 | ) | |||||||
Earnings credit from custodian | (1 | ) | — | — | ||||||||
Low balance account fees | — | (1) | — | (1) | — | |||||||
|
|
|
|
|
| |||||||
Net expenses | 577 | 23,777 | 751 | |||||||||
|
|
|
|
|
| |||||||
Net investment income (loss) | 396 | (3,505 | ) | (324 | ) | |||||||
|
|
|
|
|
| |||||||
| Net Realized and Unrealized Gain (Loss) on Investments | ||||||||||||
Net realized gain (loss) on unaffiliated investments | (3,160 | ) | (51,631 | ) | (1,741 | ) | ||||||
Net realized gain (loss) on affiliated investments | 3,486 | — | — | |||||||||
Capital gain distributions from affiliated funds | 1,938 | — | — | |||||||||
Net change in unrealized appreciation (depreciation) on unaffiliated investments | 5,474 | 68,111 | 1,774 | |||||||||
Net change in unrealized appreciation (depreciation) on affiliated investments | (2,816 | ) | — | — | ||||||||
|
|
|
|
|
| |||||||
| Net gain (loss) on investments | 4,922 | 16,480 | 33 | |||||||||
|
|
|
|
|
| |||||||
Net increase (decrease) in net assets resulting from operations | $ | 5,318 | $ | 12,975 | $ | (291 | ) | |||||
|
|
|
|
|
| |||||||
(1) Amount is less than $500.
See Notes to Financial Statements
41
Table of Contents
VIRTUS OPPORTUNITIES TRUST
STATEMENTS OF OPERATIONS (Continued)
YEAR ENDED SEPTEMBER 30, 2016
($ reported in thousands)
|
|
|
|
|
| |||||||
| Herzfeld Fund | Multi-Asset Trend Fund | Sector Trend Fund | ||||||||||
| Investment Income | ||||||||||||
Dividends | $ | 2,213 | $ | 2,883 | $ | 8,805 | ||||||
Interest | — | 19 | 18 | |||||||||
|
|
|
|
|
| |||||||
Total investment income | 2,213 | 2,902 | 8,823 | |||||||||
|
|
|
|
|
| |||||||
| Expenses | ||||||||||||
Investment advisory fees | 446 | 1,875 | 1,953 | |||||||||
Service fees, Class A | 20 | 99 | 344 | |||||||||
Distribution and service fees, Class C | 152 | 1,049 | 1,741 | |||||||||
Administration fees | 56 | 237 | 547 | |||||||||
Transfer agent fees and expenses | 61 | 275 | 588 | |||||||||
Registration fees | 52 | 54 | 164 | |||||||||
Printing fees and expenses | 15 | 51 | 115 | |||||||||
Custodian fees | 4 | 3 | 7 | |||||||||
Professional fees | 21 | 21 | 26 | |||||||||
Trustees’ fees and expenses | 4 | 17 | 39 | |||||||||
Miscellaneous expenses | 5 | 18 | 35 | |||||||||
|
|
|
|
|
| |||||||
Total expenses | 836 | 3,699 | 5,559 | |||||||||
Less expenses reimbursed and/or waived by investment adviser | (55 | ) | — | — | ||||||||
Earnings credit from custodian | (1 | ) | — | — | ||||||||
Low balance account fees | — | — | (1) | (1 | ) | |||||||
|
|
|
|
|
| |||||||
Net expenses | 780 | 3,699 | 5,558 | |||||||||
|
|
|
|
|
| |||||||
Net investment income (loss) | 1,433 | (797 | ) | 3,265 | ||||||||
|
|
|
|
|
| |||||||
| Net Realized and Unrealized Gain (Loss) on Investments | ||||||||||||
Net realized gain (loss) on investments | (3,058 | ) | (5,127 | ) | (17,641 | ) | ||||||
Capital gain distributions from underlying funds | 2,512 | — | — | |||||||||
Net change in unrealized appreciation (depreciation) on investments | 5,023 | 9,563 | 25,827 | |||||||||
|
|
|
|
|
| |||||||
| Net gain (loss) on investments | 4,477 | 4,436 | 8,186 | |||||||||
|
|
|
|
|
| |||||||
Net increase (decrease) in net assets resulting from operations | $ | 5,910 | $ | 3,639 | $ | 11,451 | ||||||
|
|
|
|
|
| |||||||
(1) Amount is less than $500.
See Notes to Financial Statements
42
Table of Contents
VIRTUS OPPORTUNITIES TRUST
STATEMENTS OF CHANGES IN NET ASSETS
($ reported in thousands)
|
|
|
| |||||||||||||
| Alternatives Diversifier Fund | Equity Trend Fund | |||||||||||||||
| Year Ended September 30, 2016 | Year Ended September 30, 2015 | Year Ended September 30, 2016 | Year Ended September 30, 2015 | |||||||||||||
| INCREASE/(DECREASE) IN NET ASSETS | ||||||||||||||||
| From Operations | ||||||||||||||||
Net investment income (loss) | $ | 396 | $ | 1,799 | $ | (3,505 | ) | $ | (15,311 | ) | ||||||
Net realized gain (loss) | 2,264 | 400 | (51,631 | ) | 179,217 | |||||||||||
Net change in unrealized appreciation (depreciation) | 2,658 | (12,509 | ) | 68,111 | (738,910 | ) | ||||||||||
|
|
|
|
|
|
|
| |||||||||
| Increase (decrease) in net assets resulting from operations | 5,318 | (10,310 | ) | 12,975 | (575,004 | ) | ||||||||||
|
|
|
|
|
|
|
| |||||||||
| From Distributions to Shareholders | ||||||||||||||||
Net investment income, Class A | (140 | ) | (652 | ) | — | (816 | ) | |||||||||
Net investment income, Class C | (97 | ) | (386 | ) | — | — | ||||||||||
Net investment income, Class I | (177 | ) | (977 | ) | — | (4,384 | ) | |||||||||
Net realized short-term gains, Class A | — | — | — | (96,936 | ) | |||||||||||
Net realized short-term gains, Class C | — | — | — | (98,311 | ) | |||||||||||
Net realized short-term gains, Class I | — | — | — | (160,323 | ) | |||||||||||
Net realized short-term gains, Class R6 | — | — | — | (5 | ) | |||||||||||
Net realized long-term gains, Class A | — | — | — | (286,197 | ) | |||||||||||
Net realized long-term gains, Class C | — | — | — | (289,362 | ) | |||||||||||
Net realized long-term gains, Class I | — | — | — | (473,696 | ) | |||||||||||
Net realized long-term gains, Class R6 | — | — | — | (15 | ) | |||||||||||
|
|
|
|
|
|
|
| |||||||||
| Decrease in net assets from distributions to shareholders | (414 | ) | (2,015 | ) | — | (1,410,045 | ) | |||||||||
|
|
|
|
|
|
|
| |||||||||
| From Share Transactions (See Note 6) | ||||||||||||||||
Change in net assets from share transactions, Class A | (7,767 | ) | (9,920 | ) | (278,173 | ) | (984,779 | ) | ||||||||
Change in net assets from share transactions, Class C | (7,687 | ) | (8,585 | ) | (326,634 | ) | (668,784 | ) | ||||||||
Change in net assets from share transactions, Class I | (12,448 | ) | (12,643 | ) | (317,745 | ) | (2,373,748 | ) | ||||||||
Change in net assets from share transactions, Class R6 | — | — | 85 | 120 | ||||||||||||
|
|
|
|
|
|
|
| |||||||||
| Increase (decrease) in net assets from share transactions | (27,902 | ) | (31,148 | ) | (922,467 | ) | (4,027,191 | ) | ||||||||
|
|
|
|
|
|
|
| |||||||||
| Net increase (decrease) in net assets | (22,998 | ) | (43,473 | ) | (909,492 | ) | (6,012,240 | ) | ||||||||
| Net Assets | ||||||||||||||||
Beginning of fiscal year | 81,557 | 125,030 | 1,861,276 | 7,873,516 | ||||||||||||
|
|
|
|
|
|
|
| |||||||||
| End of fiscal year | $ | 58,559 | $ | 81,557 | $ | 951,784 | $ | 1,861,276 | ||||||||
|
|
|
|
|
|
|
| |||||||||
Accumulated undistributed net investment income (loss) at end of fiscal year | $ | 316 | $ | 411 | $ | (1,663 | ) | $ | (8,830 | ) | ||||||
(1) Amount is less than $500.
See Notes to Financial Statements
43
Table of Contents
VIRTUS OPPORTUNITIES TRUST
STATEMENTS OF CHANGES IN NET ASSETS (Continued)
($ reported in thousands)
|
|
|
| |||||||||||||
| Global Equity Trend Fund | Herzfeld Fund | |||||||||||||||
| Year Ended September 30, 2016 | Year Ended September 30, 2015 | Year Ended September 30, 2016 | Year Ended September 30, 2015 | |||||||||||||
| INCREASE/(DECREASE) IN NET ASSETS | ||||||||||||||||
| From Operations | ||||||||||||||||
Net investment income (loss) | $ | (324 | ) | $ | (487 | ) | $ | 1,433 | $ | 929 | ||||||
Net realized gain (loss) | (1,741 | ) | (8,221 | ) | (546 | ) | 218 | |||||||||
Net change in unrealized appreciation (depreciation) | 1,774 | (10,115 | ) | 5,023 | (4,845 | ) | ||||||||||
|
|
|
|
|
|
|
| |||||||||
| Increase (decrease) in net assets resulting from operations | (291 | ) | (18,823 | ) | 5,910 | (3,698 | ) | |||||||||
|
|
|
|
|
|
|
| |||||||||
| From Distributions to Shareholders | ||||||||||||||||
Net investment income, Class A | — | (271 | ) | (348 | ) | (283 | ) | |||||||||
Net investment income, Class C | — | — | (527 | ) | (365 | ) | ||||||||||
Net investment income, Class I | — | (467 | ) | (971 | ) | (414 | ) | |||||||||
Net realized short-term gains, Class A | — | (1,492 | ) | — | (122 | ) | ||||||||||
Net realized short-term gains, Class C | — | (1,771 | ) | — | (166 | ) | ||||||||||
Net realized short-term gains, Class I | — | (1,788 | ) | — | (74 | ) | ||||||||||
Net realized long-term gains, Class A | — | (3,944 | ) | (77 | ) | (104 | ) | |||||||||
Net realized long-term gains, Class C | — | (4,687 | ) | (151 | ) | (143 | ) | |||||||||
Net realized long-term gains, Class I | — | (4,759 | ) | (232 | ) | (69 | ) | |||||||||
|
|
|
|
|
|
|
| |||||||||
| Decrease in net assets from distributions to shareholders | — | (19,179 | ) | (2,306 | ) | (1,740 | ) | |||||||||
|
|
|
|
|
|
|
| |||||||||
| From Share Transactions (See Note 6) | ||||||||||||||||
Change in net assets from share transactions, Class A | (10,228 | ) | (45,890 | ) | 2,011 | 428 | ||||||||||
Change in net assets from share transactions, Class C | (10,974 | ) | (36,615 | ) | (595 | ) | 6,251 | |||||||||
Change in net assets from share transactions, Class I | (11,474 | ) | (70,130 | ) | 3,886 | 13,715 | ||||||||||
|
|
|
|
|
|
|
| |||||||||
| Increase (decrease) in net assets from share transactions | (32,676 | ) | (152,635 | ) | 5,302 | 20,394 | ||||||||||
|
|
|
|
|
|
|
| |||||||||
| Net increase (decrease) in net assets | (32,967 | ) | (190,637 | ) | 8,906 | 14,956 | ||||||||||
| Net Assets | ||||||||||||||||
Beginning of fiscal year | 56,897 | 247,534 | 38,233 | 23,277 | ||||||||||||
|
|
|
|
|
|
|
| |||||||||
| End of fiscal year | $ | 23,930 | $ | 56,897 | $ | 47,139 | $ | 38,233 | ||||||||
|
|
|
|
|
|
|
| |||||||||
Accumulated undistributed net investment income (loss) at end of fiscal year | $ | (207 | ) | $ | (698 | ) | $ | 5 | $ | — | ||||||
See Notes to Financial Statements
44
Table of Contents
VIRTUS OPPORTUNITIES TRUST
STATEMENTS OF CHANGES IN NET ASSETS (Continued)
($ reported in thousands)
|
|
|
| |||||||||||||
| Multi-Asset Trend Fund | Sector Trend Fund | |||||||||||||||
| Year Ended September 30, 2016 | Year Ended September 30, 2015 | Year Ended September 30, 2016 | Year Ended September 30, 2015 | |||||||||||||
| INCREASE/(DECREASE) IN NET ASSETS | ||||||||||||||||
| From Operations | ||||||||||||||||
Net investment income (loss) | $ | (797 | ) | $ | (2,088 | ) | $ | 3,265 | $ | 1,801 | ||||||
Net realized gain (loss) | (5,127 | ) | (20,676 | ) | (17,641 | ) | 94,402 | |||||||||
Net change in unrealized appreciation (depreciation) | 9,563 | (21,205 | ) | 25,827 | (139,165 | ) | ||||||||||
|
|
|
|
|
|
|
| |||||||||
| Increase (decrease) in net assets resulting from operations | 3,639 | (43,969 | ) | 11,451 | (42,962 | ) | ||||||||||
|
|
|
|
|
|
|
| |||||||||
| From Distributions to Shareholders | ||||||||||||||||
Net investment income, Class A | (41 | ) | (516 | ) | (986 | ) | (1,055 | ) | ||||||||
Net investment income, Class C | — | — | — | (406 | ) | |||||||||||
Net investment income, Class I | (244 | ) | (1,292 | ) | (1,649 | ) | (1,161 | ) | ||||||||
Net realized short-term gains, Class A | — | (3,223 | ) | — | (13,616 | ) | ||||||||||
Net realized short-term gains, Class C | — | (7,394 | ) | — | (13,013 | ) | ||||||||||
Net realized short-term gains, Class I | — | (6,241 | ) | — | (12,582 | ) | ||||||||||
Net realized long-term gains, Class A | — | (7,765 | ) | — | (59,091 | ) | ||||||||||
Net realized long-term gains, Class C | — | (17,829 | ) | — | (56,735 | ) | ||||||||||
Net realized long-term gains, Class I | — | (15,105 | ) | — | (54,658 | ) | ||||||||||
|
|
|
|
|
|
|
| |||||||||
| Decrease in net assets from distributions to shareholders | (285 | ) | (59,365 | ) | (2,635 | ) | (212,317 | ) | ||||||||
|
|
|
|
|
|
|
| |||||||||
| From Share Transactions (See Note 6) | ||||||||||||||||
Change in net assets from share transactions, Class A | (26,252 | ) | (68,771 | ) | (28,578 | ) | (72,892 | ) | ||||||||
Change in net assets from share transactions, Class C | (60,210 | ) | (146,112 | ) | (42,844 | ) | (2,219 | ) | ||||||||
Change in net assets from share transactions, Class I | (45,575 | ) | (206,162 | ) | (69,127 | ) | (62,196 | ) | ||||||||
|
|
|
|
|
|
|
| |||||||||
| Increase (decrease) in net assets from share transactions | (132,037 | ) | (421,045 | ) | (140,549 | ) | (137,307 | ) | ||||||||
|
|
|
|
|
|
|
| |||||||||
| Net increase (decrease) in net assets | (128,683 | ) | (524,379 | ) | (131,733 | ) | (392,586 | ) | ||||||||
| Net Assets | ||||||||||||||||
Beginning of fiscal year | 267,965 | 792,344 | 533,292 | 925,878 | ||||||||||||
|
|
|
|
|
|
|
| |||||||||
| End of fiscal year | $ | 139,282 | $ | 267,965 | $ | 401,559 | $ | 533,292 | ||||||||
|
|
|
|
|
|
|
| |||||||||
Accumulated undistributed net investment income (loss) at end of fiscal year | $ | (529 | ) | $ | (2,581 | ) | $ | 2,144 | $ | 1,513 | ||||||
(1) Amount is less than $500.
See Notes to Financial Statements
45
Table of Contents
VIRTUS OPPORTUNITIES TRUST
SELECTED PER SHARE DATA AND RATIOS FOR A SHARE OUTSTANDING
THROUGHOUT EACH PERIOD
| Net Asset Value, Beginning of Period | Net Investment Income (Loss)(2) | Capital Gains Distributions Received from Affiliated Funds(2) | Net Realized and Unrealized Gain (Loss) | Total from Investment Operations | Dividends from Net Investment Income | Total Distributions | Change in Net Asset Value | Net Asset Value, End of Period | Total Return(1) | Net Assets, End of Period (in thousands) | Ratio of Net Expenses to Average Net Assets(8) | Ratio of Gross Expenses to Average Net Assets (before waivers and reimburse ments)(8) | Ratio of Net Investment Income (Loss) to Average Net Assets | Portfolio Turnover Rate | ||||||||||||||||||||||||||||||||||||||||||||||||||||||||||||||
| Alternatives | |||||||||||||||||||||||||||||||||||||||||||||||||||||||||||||||||||||||||||||
Diversifier Fund | |||||||||||||||||||||||||||||||||||||||||||||||||||||||||||||||||||||||||||||
Class A | |||||||||||||||||||||||||||||||||||||||||||||||||||||||||||||||||||||||||||||
10/1/15 to 9/30/16 | $ | 9.99 | 0.08 | 0.31 | 0.58 | 0.97 | (0.07 | ) | (0.07 | ) | 0.90 | $ | 10.89 | 9.74 | % | $ | 19,171 | 0.74 | %(9)(12) | 0.74 | % | 0.80 | % | 56 | % | ||||||||||||||||||||||||||||||||||||||||||||||||||||
10/1/14 to 9/30/15 | 11.31 | 0.19 | 0.09 | (1.39 | ) | (1.11 | ) | (0.21 | ) | (0.21 | ) | (1.32 | ) | 9.99 | (10.02 | ) | 25,377 | 0.64 | 0.64 | 1.77 | 46 | ||||||||||||||||||||||||||||||||||||||||||||||||||||||||
10/1/13 to 9/30/14 | 10.97 | 0.15 | 0.07 | 0.25 | 0.47 | (0.13 | ) | (0.13 | ) | 0.34 | 11.31 | 4.28 | 39,076 | 0.65 | 0.65 | 1.32 | 27 | ||||||||||||||||||||||||||||||||||||||||||||||||||||||||||||
10/1/12 to 9/30/13 | 11.10 | 0.21 | — | (0.13 | ) | 0.08 | (0.21 | ) | (0.21 | ) | (0.13 | ) | 10.97 | 0.73 | 51,339 | 0.58 | (7) | 0.63 | 1.93 | 24 | |||||||||||||||||||||||||||||||||||||||||||||||||||||||||
10/1/11 to 9/30/12 | 9.68 | 0.10 | — | 1.38 | 1.48 | (0.06 | ) | (0.06 | ) | 1.42 | 11.10 | 15.37 | 65,463 | 0.45 | 0.65 | 0.95 | 29 | ||||||||||||||||||||||||||||||||||||||||||||||||||||||||||||
Class C | |||||||||||||||||||||||||||||||||||||||||||||||||||||||||||||||||||||||||||||
10/1/15 to 9/30/16 | $ | 9.90 | — | (5) | 0.31 | 0.56 | 0.87 | (0.04 | ) | (0.04 | ) | 0.83 | $ | 10.73 | 8.86 | % | $ | 19,611 | 1.49 | %(9)(12) | 1.49 | % | 0.04 | % | 56 | % | |||||||||||||||||||||||||||||||||||||||||||||||||||
10/1/14 to 9/30/15 | 11.21 | 0.11 | 0.09 | (1.39 | ) | (1.19 | ) | (0.12 | ) | (0.12 | ) | (1.31 | ) | 9.90 | (10.66 | ) | 25,637 | 1.39 | 1.39 | 1.02 | 46 | ||||||||||||||||||||||||||||||||||||||||||||||||||||||||
10/1/13 to 9/30/14 | 10.83 | 0.07 | 0.07 | 0.25 | 0.39 | (0.01 | ) | (0.01 | ) | 0.38 | 11.21 | 3.47 | 38,005 | 1.40 | 1.40 | 0.58 | 27 | ||||||||||||||||||||||||||||||||||||||||||||||||||||||||||||
10/1/12 to 9/30/13 | 10.93 | 0.13 | — | (0.13 | ) | — | (0.10 | ) | (0.10 | ) | (0.10 | ) | 10.83 | (0.05 | ) | 44,850 | 1.33 | (7) | 1.38 | 1.22 | 24 | ||||||||||||||||||||||||||||||||||||||||||||||||||||||||
10/1/11 to 9/30/12 | 9.55 | 0.02 | — | 1.36 | 1.38 | — | — | 1.38 | 10.93 | 14.45 | 57,336 | 1.20 | 1.40 | 0.20 | 29 | ||||||||||||||||||||||||||||||||||||||||||||||||||||||||||||||
Class I | |||||||||||||||||||||||||||||||||||||||||||||||||||||||||||||||||||||||||||||
10/1/15 to 9/30/16 | $ | 9.98 | 0.11 | 0.31 | 0.56 | 0.98 | (0.07 | ) | (0.07 | ) | 0.91 | $ | 10.89 | 9.94 | % | $ | 19,777 | 0.49 | %(9)(12) | 0.49 | % | 1.04 | % | 56 | % | ||||||||||||||||||||||||||||||||||||||||||||||||||||
10/1/14 to 9/30/15 | 11.30 | 0.22 | 0.09 | (1.39 | ) | (1.08 | ) | (0.24 | ) | (0.24 | ) | (1.32 | ) | 9.98 | (9.77 | ) | 30,543 | 0.39 | 0.39 | 1.99 | 46 | ||||||||||||||||||||||||||||||||||||||||||||||||||||||||
10/1/13 to 9/30/14 | 10.98 | 0.18 | 0.08 | 0.24 | 0.50 | (0.18 | ) | (0.18 | ) | 0.32 | 11.30 | 4.52 | 47,949 | 0.40 | 0.40 | 1.56 | 27 | ||||||||||||||||||||||||||||||||||||||||||||||||||||||||||||
10/1/12 to 9/30/13 | 11.12 | 0.16 | — | (0.05 | ) | 0.11 | (0.25 | ) | (0.25 | ) | (0.14 | ) | 10.98 | 1.00 | 111,396 | 0.36 | (7) | 0.38 | 1.48 | 24 | |||||||||||||||||||||||||||||||||||||||||||||||||||||||||
10/1/11 to 9/30/12 | 9.70 | 0.13 | — | 1.38 | 1.51 | (0.09 | ) | (0.09 | ) | 1.42 | 11.12 | 15.63 | 37,590 | 0.20 | 0.40 | 1.21 | 29 | ||||||||||||||||||||||||||||||||||||||||||||||||||||||||||||
The footnote legend is at the end of the Financial Highlights
See Notes to Financial Statements
46
Table of Contents
VIRTUS OPPORTUNITIES TRUST
FINANCIAL HIGHLIGHTS
SELECTED PER SHARE DATA AND RATIOS FOR A SHARE OUTSTANDING
THROUGHOUT EACH PERIOD
| Net Asset Value, Beginning of Period | Net Investment Income (Loss)(2) | Net Realized and Unrealized Gain (Loss) | Total from Investment Operations | Dividends from Net Investment Income | Distributions from Net Realized Gains | Total Distributions | Change in Net Asset Value | Net Asset Value, End of Period | Total Return(1) | Net Assets, End of Period (In thousands) | Ratio of Net Expenses to Average Net Assets(8) | Ratio of Gross Expenses to Average Net Assets (before waivers and reimbursements)(8) | Ratio of Net Investment Income (Loss) to Average Net Assets | Portfolio Turnover Rate | ||||||||||||||||||||||||||||||||||||||||||||||||||||||||||||||
Equity Trend | |||||||||||||||||||||||||||||||||||||||||||||||||||||||||||||||||||||||||||||
Fund | |||||||||||||||||||||||||||||||||||||||||||||||||||||||||||||||||||||||||||||
Class A | |||||||||||||||||||||||||||||||||||||||||||||||||||||||||||||||||||||||||||||
10/1/15 to 9/30/16 | $ | 12.14 | (0.01 | ) | 0.10 | 0.09 | — | — | — | 0.09 | $ | 12.23 | 0.74 | % | $ | 245,109 | 1.50 | %(7)(12) | 1.58 | % | (0.05 | )% | 229 | % | |||||||||||||||||||||||||||||||||||||||||||||||||||||
10/1/14 to 9/30/15 | 17.39 | (0.03 | ) | (1.79 | ) | (1.82 | ) | (0.01 | ) | (3.42 | ) | (3.43 | ) | (5.25 | ) | 12.14 | (12.79 | ) | 520,337 | 1.60 | (11) | 1.60 | (0.22 | ) | 674 | ||||||||||||||||||||||||||||||||||||||||||||||||||||
10/1/13 to 9/30/14 | 15.52 | 0.06 | 2.29 | 2.35 | (0.04 | ) | (0.44 | ) | (0.48 | ) | 1.87 | 17.39 | 15.31 | 2,044,955 | 1.61 | (11) | 1.61 | 0.36 | 227 | ||||||||||||||||||||||||||||||||||||||||||||||||||||||||||
10/1/12 to 9/30/13 | 13.43 | 0.11 | 2.09 | 2.20 | (0.11 | ) | — | (0.11 | ) | 2.09 | 15.52 | 16.50 | 1,937,456 | 1.62 | (11) | 1.62 | 0.75 | 140 | |||||||||||||||||||||||||||||||||||||||||||||||||||||||||||
10/1/11 to 9/30/12 | 11.69 | 0.10 | 1.73 | 1.83 | (0.09 | ) | — | (0.09 | ) | 1.74 | 13.43 | 15.74 | 1,323,109 | 1.64 | 1.64 | 0.80 | 297 | ||||||||||||||||||||||||||||||||||||||||||||||||||||||||||||
Class C | |||||||||||||||||||||||||||||||||||||||||||||||||||||||||||||||||||||||||||||
10/1/15 to 9/30/16 | $ | 11.87 | (0.08 | ) | 0.09 | 0.01 | — | — | — | 0.01 | $ | 11.88 | 0.08 | % | $ | 423,675 | 2.16 | %(7)(12) | 2.33 | % | (0.69 | )% | 229 | % | |||||||||||||||||||||||||||||||||||||||||||||||||||||
10/1/14 to 9/30/15 | 17.16 | (0.13 | ) | (1.76 | ) | (1.89 | ) | — | (3.40 | ) | (3.40 | ) | (5.29 | ) | 11.87 | (13.45 | ) | 746,390 | 2.36 | (11) | 2.36 | (0.97 | ) | 674 | |||||||||||||||||||||||||||||||||||||||||||||||||||||
10/1/13 to 9/30/14 | 15.39 | (0.06 | ) | 2.27 | 2.21 | — | (0.44 | ) | (0.44 | ) | 1.77 | 17.16 | 14.48 | 1,988,290 | 2.36 | (11) | 2.36 | (0.38 | ) | 227 | |||||||||||||||||||||||||||||||||||||||||||||||||||||||||
10/1/12 to 9/30/13 | 13.34 | — | 2.07 | 2.07 | (0.02 | ) | — | (0.02 | ) | 2.05 | 15.39 | 15.55 | 1,307,857 | 2.37 | (11) | 2.37 | 0.02 | 140 | |||||||||||||||||||||||||||||||||||||||||||||||||||||||||||
10/1/11 to 9/30/12 | 11.62 | 0.01 | 1.72 | 1.73 | (0.01 | ) | — | (0.01 | ) | 1.72 | 13.34 | 14.91 | 767,602 | 2.38 | 2.39 | 0.09 | 297 | ||||||||||||||||||||||||||||||||||||||||||||||||||||||||||||
Class I | |||||||||||||||||||||||||||||||||||||||||||||||||||||||||||||||||||||||||||||
10/1/15 to 9/30/16 | $ | 12.19 | 0.02 | 0.10 | 0.12 | — | — | — | 0.12 | $ | 12.31 | 0.98 | % | $ | 282,818 | 1.29 | %(7)(12) | 1.33 | % | 0.16 | % | 229 | % | ||||||||||||||||||||||||||||||||||||||||||||||||||||||
10/1/14 to 9/30/15 | 17.42 | 0.01 | (1.80 | ) | (1.79 | ) | (0.02 | ) | (3.42 | ) | (3.44 | ) | (5.23 | ) | 12.19 | (12.57 | ) | 594,460 | 1.35 | (11) | 1.35 | 0.04 | 674 | ||||||||||||||||||||||||||||||||||||||||||||||||||||||
10/1/13 to 9/30/14 | 15.54 | 0.10 | 2.30 | 2.40 | (0.08 | ) | (0.44 | ) | (0.52 | ) | 1.88 | 17.42 | 15.61 | 3,840,271 | 1.36 | (11) | 1.36 | 0.62 | 227 | ||||||||||||||||||||||||||||||||||||||||||||||||||||||||||
10/1/12 to 9/30/13 | 13.45 | 0.15 | 2.08 | 2.23 | (0.14 | ) | — | (0.14 | ) | 2.09 | 15.54 | 16.75 | 2,580,005 | 1.37 | (11) | 1.37 | 1.02 | 140 | |||||||||||||||||||||||||||||||||||||||||||||||||||||||||||
10/1/11 to 9/30/12 | 11.71 | 0.14 | 1.72 | 1.86 | (0.12 | ) | — | (0.12 | ) | 1.74 | 13.45 | 15.98 | 1,479,042 | 1.39 | 1.39 | 1.10 | 297 | ||||||||||||||||||||||||||||||||||||||||||||||||||||||||||||
Class R6 | |||||||||||||||||||||||||||||||||||||||||||||||||||||||||||||||||||||||||||||
10/1/15 to 9/30/16 | $ | 12.20 | 0.06 | 0.08 | 0.14 | — | — | — | 0.14 | $ | 12.34 | 1.15 | % | $ | 182 | 1.10 | %(7)(12) | 1.25 | % | 0.49 | % | 229 | % | ||||||||||||||||||||||||||||||||||||||||||||||||||||||
11/12/14(6) to 9/30/15 | 17.20 | 0.01 | (1.57 | ) | (1.56 | ) | (0.02 | ) | (3.42 | ) | (3.44 | ) | (5.00 | ) | 12.20 | (11.39 | )(4) | 89 | 1.28 | (3)(11) | 1.28 | (3) | 0.10 | (3) | 674 | ||||||||||||||||||||||||||||||||||||||||||||||||||||
| Global Equity | |||||||||||||||||||||||||||||||||||||||||||||||||||||||||||||||||||||||||||||
Trend Fund | |||||||||||||||||||||||||||||||||||||||||||||||||||||||||||||||||||||||||||||
Class A | |||||||||||||||||||||||||||||||||||||||||||||||||||||||||||||||||||||||||||||
10/1/15 to 9/30/16 | $ | 9.76 | (0.06 | ) | 0.24 | 0.18 | — | — | — | 0.18 | $ | 9.94 | 1.84 | % | $ | 8,351 | 1.77 | %(12) | 1.79 | % | (0.60 | )% | 282 | % | |||||||||||||||||||||||||||||||||||||||||||||||||||||
10/1/14 to 9/30/15 | 12.42 | (0.03 | ) | (1.48 | ) | (1.51 | ) | (0.07 | ) | (1.08 | ) | (1.15 | ) | (2.66 | ) | 9.76 | (13.21 | ) | 18,523 | 1.68 | (11) | 1.68 | (0.23 | ) | 614 | ||||||||||||||||||||||||||||||||||||||||||||||||||||
10/1/13 to 9/30/14 | 11.76 | 0.07 | 0.91 | 0.98 | (0.02 | ) | (0.30 | ) | (0.32 | ) | 0.66 | 12.42 | 8.43 | 75,879 | 1.66 | (10) | 1.65 | 0.55 | 205 | ||||||||||||||||||||||||||||||||||||||||||||||||||||||||||
10/1/12 to 9/30/13 | 10.56 | 0.04 | 1.26 | 1.30 | (0.06 | ) | (0.04 | ) | (0.10 | ) | 1.20 | 11.76 | 12.32 | 56,689 | 1.75 | (10) | 1.71 | 0.33 | 194 | ||||||||||||||||||||||||||||||||||||||||||||||||||||||||||
10/1/11 to 9/30/12 | 9.42 | 0.08 | 1.12 | 1.20 | (0.06 | ) | — | (0.06 | ) | 1.14 | 10.56 | 12.75 | 27,699 | 1.75 | 1.78 | 0.83 | 258 | ||||||||||||||||||||||||||||||||||||||||||||||||||||||||||||
Class C | |||||||||||||||||||||||||||||||||||||||||||||||||||||||||||||||||||||||||||||
10/1/15 to 9/30/16 | $ | 9.59 | (0.13 | ) | 0.23 | 0.10 | — | — | — | 0.10 | $ | 9.69 | 1.04 | % | $ | 11,267 | 2.52 | %(12) | 2.54 | % | (1.35 | )% | 282 | % | |||||||||||||||||||||||||||||||||||||||||||||||||||||
10/1/14 to 9/30/15 | 12.24 | (0.09 | ) | (1.48 | ) | (1.57 | ) | — | (1.08 | ) | (1.08 | ) | (2.65 | ) | 9.59 | (13.88 | ) | 22,376 | 2.41 | (11) | 2.43 | (0.87 | ) | 614 | |||||||||||||||||||||||||||||||||||||||||||||||||||||
10/1/13 to 9/30/14 | 11.64 | (0.02 | ) | 0.92 | 0.90 | — | (0.30 | ) | (0.30 | ) | 0.60 | 12.24 | 7.69 | 72,013 | 2.37 | (10) | 2.40 | (0.17 | ) | 205 | |||||||||||||||||||||||||||||||||||||||||||||||||||||||||
10/1/12 to 9/30/13 | 10.50 | (0.05 | ) | 1.25 | 1.20 | (0.02 | ) | (0.04 | ) | (0.06 | ) | 1.14 | 11.64 | 11.52 | 44,239 | 2.48 | (10) | 2.46 | (0.42 | ) | 194 | ||||||||||||||||||||||||||||||||||||||||||||||||||||||||
10/1/11 to 9/30/12 | 9.40 | — | (5) | 1.12 | 1.12 | (0.02 | ) | — | (0.02 | ) | 1.10 | 10.50 | 12.04 | 21,051 | 2.50 | 2.53 | 0.01 | 258 | |||||||||||||||||||||||||||||||||||||||||||||||||||||||||||
Class I | |||||||||||||||||||||||||||||||||||||||||||||||||||||||||||||||||||||||||||||
10/1/15 to 9/30/16 | $ | 9.79 | (0.04 | ) | 0.25 | 0.21 | — | — | — | 0.21 | $ | 10.00 | 2.15 | % | $ | 4,312 | 1.51 | %(12) | 1.52 | % | (0.40 | )% | 282 | % | |||||||||||||||||||||||||||||||||||||||||||||||||||||
10/1/14 to 9/30/15 | 12.47 | — | (5) | (1.50 | ) | (1.50 | ) | (0.10 | ) | (1.08 | ) | (1.18 | ) | (2.68 | ) | 9.79 | (13.06 | ) | 15,998 | 1.43 | (11) | 1.43 | 0.01 | 614 | |||||||||||||||||||||||||||||||||||||||||||||||||||||
10/1/13 to 9/30/14 | 11.80 | 0.10 | 0.92 | 1.02 | (0.05 | ) | (0.30 | ) | (0.35 | ) | 0.67 | 12.47 | 8.68 | 99,642 | 1.44 | (10) | 1.41 | 0.80 | 205 | ||||||||||||||||||||||||||||||||||||||||||||||||||||||||||
10/1/12 to 9/30/13 | 10.58 | 0.07 | 1.25 | 1.32 | (0.06 | ) | (0.04 | ) | (0.10 | ) | 1.22 | 11.80 | 12.59 | 38,889 | 1.50 | (10) | 1.46 | 0.58 | 194 | ||||||||||||||||||||||||||||||||||||||||||||||||||||||||||
10/1/11 to 9/30/12 | 9.42 | 0.09 | 1.14 | 1.23 | (0.07 | ) | — | (0.07 | ) | 1.16 | 10.58 | 13.15 | 19,112 | 1.50 | 1.52 | 0.90 | 258 | ||||||||||||||||||||||||||||||||||||||||||||||||||||||||||||
The footnote legend is at the end of the Financial Highlights
See Notes to Financial Statements
47
Table of Contents
VIRTUS OPPORTUNITIES TRUST
FINANCIAL HIGHLIGHTS
SELECTED PER SHARE DATA AND RATIOS FOR A SHARE OUTSTANDING
THROUGHOUT EACH PERIOD
| Net Asset Value, Beginning of Period | Net Investment Income (Loss)(2) | Net Realized and Unrealized Gain (Loss) | Total from Investment Operations | Dividends from Net Investment Income | Distributions from Net Realized Gains | Total Distributions | Change in Net Asset Value | Net Asset Value, End of Period | Total Return(1) | Net Assets, End of Period (In thousands) | Ratio of Net Expenses to Average Net Assets(8) | Ratio of Gross Expenses to Average Net Assets (before waivers and reimburse ments)(8) | Ratio of Net Investment Income (Loss) to Average Net Assets | Portfolio Turnover Rate | ||||||||||||||||||||||||||||||||||||||||||||||||||||||||||||||
Herzfeld Fund | |||||||||||||||||||||||||||||||||||||||||||||||||||||||||||||||||||||||||||||
Class A | |||||||||||||||||||||||||||||||||||||||||||||||||||||||||||||||||||||||||||||
10/1/15 to 9/30/16 | $ | 9.91 | 0.34 | 1.20 | 1.54 | (0.43 | ) | (0.10 | ) | (0.53 | ) | 1.01 | $ | 10.92 | 16.04 | % | $ | 11,060 | 1.61 | %(9)(12) | 1.74 | % | 3.33 | % | 53 | % | |||||||||||||||||||||||||||||||||||||||||||||||||||
10/1/14 to 9/30/15 | 11.37 | 0.35 | (1.12 | ) | (0.77 | ) | (0.37 | ) | (0.32 | ) | (0.69 | ) | (1.46 | ) | 9.91 | (7.17 | ) | 8,324 | 1.60 | 1.73 | 3.20 | 57 | |||||||||||||||||||||||||||||||||||||||||||||||||||||||
10/1/13 to 9/30/14 | 10.45 | 0.34 | 1.02 | 1.36 | (0.36 | ) | (0.08 | ) | (0.44 | ) | 0.92 | 11.37 | 13.21 | 9,212 | 1.60 | 1.93 | 3.04 | 53 | |||||||||||||||||||||||||||||||||||||||||||||||||||||||||||
10/1/12 to 9/30/13 | 10.21 | 0.33 | 0.18 | 0.51 | (0.26 | ) | (0.01 | ) | (0.27 | ) | 0.24 | 10.45 | 5.10 | 2,917 | 1.60 | 2.60 | 3.13 | 22 | |||||||||||||||||||||||||||||||||||||||||||||||||||||||||||
9/5/12(6) to 9/30/12 | 10.00 | 0.04 | 0.17 | 0.21 | — | — | — | 0.21 | 10.21 | 2.10 | (4) | 105 | 1.60 | (3) | 37.91 | (3) | 5.93 | 3 | (4) | ||||||||||||||||||||||||||||||||||||||||||||||||||||||||||
Class C | |||||||||||||||||||||||||||||||||||||||||||||||||||||||||||||||||||||||||||||
10/1/15 to 9/30/16 | $ | 9.87 | 0.27 | 1.19 | 1.46 | (0.35 | ) | (0.10 | ) | (0.45 | ) | 1.01 | $ | 10.88 | 15.22 | % | $ | 15,568 | 2.36 | %(9)(12) | 2.49 | % | 2.61 | % | 53 | % | |||||||||||||||||||||||||||||||||||||||||||||||||||
10/1/14 to 9/30/15 | 11.34 | 0.26 | (1.11 | ) | (0.85 | ) | (0.30 | ) | (0.32 | ) | (0.62 | ) | (1.47 | ) | 9.87 | (7.94 | ) | 14,761 | 2.35 | 2.48 | 2.39 | 57 | |||||||||||||||||||||||||||||||||||||||||||||||||||||||
10/1/13 to 9/30/14 | 10.43 | 0.26 | 1.01 | 1.27 | (0.28 | ) | (0.08 | ) | (0.36 | ) | 0.91 | 11.34 | 12.34 | 10,624 | 2.35 | 2.70 | 2.35 | 53 | |||||||||||||||||||||||||||||||||||||||||||||||||||||||||||
10/1/12 to 9/30/13 | 10.21 | 0.25 | 0.19 | 0.44 | (0.21 | ) | (0.01 | ) | (0.22 | ) | 0.22 | 10.43 | 4.36 | 4,942 | 2.35 | 3.25 | 2.40 | 22 | |||||||||||||||||||||||||||||||||||||||||||||||||||||||||||
9/5/12(6) to 9/30/12 | 10.00 | 0.03 | 0.18 | 0.21 | — | — | — | 0.21 | 10.21 | 2.10 | (4) | 102 | 2.35 | (3) | 38.62 | (3) | 5.21 | 3 | (4) | ||||||||||||||||||||||||||||||||||||||||||||||||||||||||||
Class I | |||||||||||||||||||||||||||||||||||||||||||||||||||||||||||||||||||||||||||||
10/1/15 to 9/30/16 | $ | 9.92 | 0.37 | 1.21 | 1.58 | (0.46 | ) | (0.10 | ) | (0.56 | ) | 1.02 | $ | 10.94 | 16.40 | % | $ | 20,511 | 1.36 | %(9)(12) | 1.49 | % | 3.59 | % | 53 | % | |||||||||||||||||||||||||||||||||||||||||||||||||||
10/1/14 to 9/30/15 | 11.39 | 0.37 | (1.12 | ) | (0.75 | ) | (0.40 | ) | (0.32 | ) | (0.72 | ) | (1.47 | ) | 9.92 | (7.01 | ) | 15,148 | 1.35 | 1.47 | 3.39 | 57 | |||||||||||||||||||||||||||||||||||||||||||||||||||||||
10/1/13 to 9/30/14 | 10.46 | 0.38 | 1.01 | 1.39 | (0.38 | ) | (0.08 | ) | (0.46 | ) | 0.93 | 11.39 | 13.54 | 3,441 | 1.35 | 1.71 | 3.40 | 53 | |||||||||||||||||||||||||||||||||||||||||||||||||||||||||||
10/1/12 to 9/30/13 | 10.21 | 0.09 | 0.46 | 0.55 | (0.29 | ) | (0.01 | ) | (0.30 | ) | 0.25 | 10.46 | 5.41 | 1,765 | 1.35 | 3.71 | 0.86 | 22 | |||||||||||||||||||||||||||||||||||||||||||||||||||||||||||
9/5/12(6) to 9/30/12 | 10.00 | 0.03 | 0.18 | 0.21 | — | — | — | 0.21 | 10.21 | 2.10 | (4) | 1,017 | 1.35 | (3) | 38.61 | (3) | 4.39 | 3 | (4) | ||||||||||||||||||||||||||||||||||||||||||||||||||||||||||
| Multi-Asset Trend | |||||||||||||||||||||||||||||||||||||||||||||||||||||||||||||||||||||||||||||
Fund | |||||||||||||||||||||||||||||||||||||||||||||||||||||||||||||||||||||||||||||
Class A | |||||||||||||||||||||||||||||||||||||||||||||||||||||||||||||||||||||||||||||
10/1/15 to 9/30/16 | $ | 9.94 | (0.01 | ) | 0.39 | 0.38 | (0.01 | ) | — | (0.01 | ) | 0.37 | $ | 10.31 | 3.82 | % | $ | 29,798 | 1.61 | %(11)(12) | 1.61 | % | (0.07 | )% | 223 | % | |||||||||||||||||||||||||||||||||||||||||||||||||||
10/1/14 to 9/30/15 | 11.85 | (0.02 | ) | (0.92 | ) | (0.94 | ) | (0.04 | ) | (0.93 | ) | (0.97 | ) | (1.91 | ) | 9.94 | (8.58 | ) | 55,214 | 1.62 | (11) | 1.62 | (0.15 | ) | 519 | ||||||||||||||||||||||||||||||||||||||||||||||||||||
10/1/13 to 9/30/14 | 11.28 | 0.10 | 0.69 | 0.79 | (0.07 | ) | (0.15 | ) | (0.22 | ) | 0.57 | 11.85 | 6.97 | 143,765 | 1.62 | (11) | 1.62 | 0.83 | 337 | ||||||||||||||||||||||||||||||||||||||||||||||||||||||||||
10/1/12 to 9/30/13 | 10.67 | 0.06 | 0.62 | 0.68 | (0.05 | ) | (0.02 | ) | (0.07 | ) | 0.61 | 11.28 | 6.39 | 114,697 | 1.64 | (11) | 1.64 | 0.51 | 275 | ||||||||||||||||||||||||||||||||||||||||||||||||||||||||||
10/1/11 to 9/30/12 | 9.69 | 0.09 | 0.98 | 1.07 | (0.09 | ) | — | (0.09 | ) | 0.98 | 10.67 | 11.08 | 66,122 | 1.73 | 1.70 | 0.84 | 211 | ||||||||||||||||||||||||||||||||||||||||||||||||||||||||||||
Class C | |||||||||||||||||||||||||||||||||||||||||||||||||||||||||||||||||||||||||||||
10/1/15 to 9/30/16 | $ | 9.80 | (0.08 | ) | 0.38 | 0.30 | — | — | — | 0.30 | $ | 10.10 | 3.06 | % | $ | 80,962 | 2.36 | %(11)(12) | 2.36 | % | (0.80 | )% | 223 | % | |||||||||||||||||||||||||||||||||||||||||||||||||||||
10/1/14 to 9/30/15 | 11.73 | (0.09 | ) | (0.91 | ) | (1.00 | ) | — | (0.93 | ) | (0.93 | ) | (1.93 | ) | 9.80 | (9.23 | ) | 139,223 | 2.36 | (11) | 2.37 | (0.89 | ) | 519 | |||||||||||||||||||||||||||||||||||||||||||||||||||||
10/1/13 to 9/30/14 | 11.19 | 0.01 | 0.68 | 0.69 | — | (0.15 | ) | (0.15 | ) | 0.54 | 11.73 | 6.15 | 331,980 | 2.35 | (11) | 2.37 | 0.09 | 337 | |||||||||||||||||||||||||||||||||||||||||||||||||||||||||||
10/1/12 to 9/30/13 | 10.60 | (0.02 | ) | 0.63 | 0.61 | — | (0.02 | ) | (0.02 | ) | 0.59 | 11.19 | 5.71 | 230,459 | 2.37 | (11) | 2.39 | (0.23 | ) | 275 | |||||||||||||||||||||||||||||||||||||||||||||||||||||||||
10/1/11 to 9/30/12 | 9.66 | 0.02 | 0.96 | 0.98 | (0.04 | ) | — | (0.04 | ) | 0.94 | 10.60 | 10.13 | 131,330 | 2.45 | 2.45 | 0.16 | 211 | ||||||||||||||||||||||||||||||||||||||||||||||||||||||||||||
Class I | |||||||||||||||||||||||||||||||||||||||||||||||||||||||||||||||||||||||||||||
10/1/15 to 9/30/16 | $ | 9.99 | 0.02 | 0.38 | 0.40 | (0.05 | ) | — | (0.05 | ) | 0.35 | $ | 10.34 | 3.97 | % | $ | 28,522 | 1.36 | %(11)(12) | 1.36 | % | 0.16 | % | 223 | % | ||||||||||||||||||||||||||||||||||||||||||||||||||||
10/1/14 to 9/30/15 | 11.88 | 0.01 | (0.91 | ) | (0.90 | ) | (0.06 | ) | (0.93 | ) | (0.99 | ) | (1.89 | ) | 9.99 | (8.36 | ) | 73,528 | 1.36 | (11) | 1.36 | 0.11 | 519 | ||||||||||||||||||||||||||||||||||||||||||||||||||||||
10/1/13 to 9/30/14 | 11.31 | 0.13 | 0.69 | 0.82 | (0.10 | ) | (0.15 | ) | (0.25 | ) | 0.57 | 11.88 | 7.20 | 316,599 | 1.37 | (11) | 1.37 | 1.06 | 337 | ||||||||||||||||||||||||||||||||||||||||||||||||||||||||||
10/1/12 to 9/30/13 | 10.69 | 0.08 | 0.63 | 0.71 | (0.07 | ) | (0.02 | ) | (0.09 | ) | 0.62 | 11.31 | 6.70 | 248,984 | 1.39 | (11) | 1.39 | 0.74 | 275 | ||||||||||||||||||||||||||||||||||||||||||||||||||||||||||
10/1/11 to 9/30/12 | 9.71 | 0.12 | 0.96 | 1.08 | (0.10 | ) | — | (0.10 | ) | 0.98 | 10.69 | 11.24 | 146,634 | 1.49 | 1.46 | 1.17 | 211 | ||||||||||||||||||||||||||||||||||||||||||||||||||||||||||||
The footnote legend is at the end of the Financial Highlights
See Notes to Financial Statements
48
Table of Contents
VIRTUS OPPORTUNITIES TRUST
FINANCIAL HIGHLIGHTS
SELECTED PER SHARE DATA AND RATIOS FOR A SHARE OUTSTANDING
THROUGHOUT EACH PERIOD
| Net Asset Value, Beginning of Period | Net Investment Income (Loss)(2) | Net Realized and Unrealized Gain (Loss) | Total from Investment Operations | Dividends from Net Investment Income | Distributions from Net Realized Gains | Total Distributions | Change in Net Asset Value | Net Asset Value, End of Period | Total Return(1) | Net Assets End of Period (in thousands) | Ratio of Net Expenses to Average Net Assets(8) | Ratio of Gross Expenses to Average Net Assets (before waivers and reimburse ments)(8) | Ratio of Net Investment Income (Loss) to Average Net Assets | Portfolio Turnover Rate | ||||||||||||||||||||||||||||||||||||||||||||||||||||||||||||||
Sector Trend Fund | |||||||||||||||||||||||||||||||||||||||||||||||||||||||||||||||||||||||||||||
Class A | |||||||||||||||||||||||||||||||||||||||||||||||||||||||||||||||||||||||||||||
10/1/15 to 9/30/16 | $ | 11.00 | 0.11 | 0.26 | 0.37 | (0.08 | ) | — | (0.08 | ) | 0.29 | $ | 11.29 | 3.36 | % | $ | 131,389 | 1.05 | %(12) | 1.05 | % | 1.00 | % | 337 | % | ||||||||||||||||||||||||||||||||||||||||||||||||||||
10/1/14 to 9/30/15 | 15.21 | 0.05 | (0.71 | ) | (0.66 | ) | (0.05 | ) | (3.50 | ) | (3.55 | ) | (4.21 | ) | 11.00 | (6.19 | ) | 156,759 | 0.98 | 0.98 | 0.39 | 576 | |||||||||||||||||||||||||||||||||||||||||||||||||||||||
10/1/13 to 9/30/14 | 13.87 | 0.15 | 2.25 | 2.40 | (0.13 | ) | (0.93 | ) | (1.06 | ) | 1.34 | 15.21 | 17.81 | 316,571 | 0.98 | 0.98 | 1.02 | 129 | |||||||||||||||||||||||||||||||||||||||||||||||||||||||||||
10/1/12 to 9/30/13 | 12.15 | 0.17 | 2.11 | 2.28 | (0.17 | ) | (0.39 | ) | (0.56 | ) | 1.72 | 13.87 | 19.63 | 257,492 | 1.00 | 1.00 | 1.29 | 123 | |||||||||||||||||||||||||||||||||||||||||||||||||||||||||||
10/1/11 to 9/30/12 | 10.67 | 0.14 | 1.68 | 1.82 | (0.12 | ) | (0.22 | ) | (0.34 | ) | 1.48 | 12.15 | 17.51 | 199,268 | 1.02 | 1.02 | 1.22 | 190 | |||||||||||||||||||||||||||||||||||||||||||||||||||||||||||
Class C | |||||||||||||||||||||||||||||||||||||||||||||||||||||||||||||||||||||||||||||
10/1/15 to 9/30/16 | $ | 10.76 | 0.03 | 0.25 | 0.28 | — | — | — | 0.28 | $ | 11.04 | 2.60 | % | $ | 167,265 | 1.80 | %(12) | 1.80 | % | 0.24 | % | 337 | % | ||||||||||||||||||||||||||||||||||||||||||||||||||||||
10/1/14 to 9/30/15 | 15.02 | (0.04 | ) | (0.69 | ) | (0.73 | ) | (0.02 | ) | (3.51 | ) | (3.53 | ) | (4.26 | ) | 10.76 | (6.86 | ) | 206,556 | 1.74 | 1.74 | (0.34 | ) | 576 | |||||||||||||||||||||||||||||||||||||||||||||||||||||
10/1/13 to 9/30/14 | 13.73 | 0.04 | 2.21 | 2.25 | (0.03 | ) | (0.93 | ) | (0.96 | ) | 1.29 | 15.02 | 16.89 | 296,160 | 1.73 | 1.73 | 0.28 | 129 | |||||||||||||||||||||||||||||||||||||||||||||||||||||||||||
10/1/12 to 9/30/13 | 12.03 | 0.07 | 2.10 | 2.17 | (0.08 | ) | (0.39 | ) | (0.47 | ) | 1.70 | 13.73 | 18.80 | 217,861 | 1.74 | 1.75 | 0.57 | 123 | |||||||||||||||||||||||||||||||||||||||||||||||||||||||||||
10/1/11 to 9/30/12 | 10.56 | 0.06 | 1.67 | 1.73 | (0.04 | ) | (0.22 | ) | (0.26 | ) | 1.47 | 12.03 | 16.60 | 157,461 | 1.75 | 1.77 | 0.53 | 190 | |||||||||||||||||||||||||||||||||||||||||||||||||||||||||||
Class I | |||||||||||||||||||||||||||||||||||||||||||||||||||||||||||||||||||||||||||||
10/1/15 to 9/30/16 | $ | 11.02 | 0.13 | 0.27 | 0.40 | (0.14 | ) | — | (0.14 | ) | 0.26 | $ | 11.28 | 3.65 | % | $ | 102,905 | 0.80 | %(12) | 0.80 | % | 1.21 | % | 337 | % | ||||||||||||||||||||||||||||||||||||||||||||||||||||
10/1/14 to 9/30/15 | 15.21 | 0.08 | (0.71 | ) | (0.63 | ) | (0.05 | ) | (3.51 | ) | (3.56 | ) | (4.19 | ) | 11.02 | (5.90 | ) | 169,977 | 0.73 | 0.73 | 0.65 | 576 | |||||||||||||||||||||||||||||||||||||||||||||||||||||||
10/1/13 to 9/30/14 | 13.87 | 0.19 | 2.25 | 2.44 | (0.17 | ) | (0.93 | ) | (1.10 | ) | 1.34 | 15.21 | 18.08 | 313,147 | 0.73 | 0.73 | 1.29 | 129 | |||||||||||||||||||||||||||||||||||||||||||||||||||||||||||
10/1/12 to 9/30/13 | 12.15 | 0.20 | 2.11 | 2.31 | (0.20 | ) | (0.39 | ) | (0.59 | ) | 1.72 | 13.87 | 19.92 | 173,096 | 0.75 | 0.75 | 1.56 | 123 | |||||||||||||||||||||||||||||||||||||||||||||||||||||||||||
10/1/11 to 9/30/12 | 10.67 | 0.17 | 1.68 | 1.85 | (0.15 | ) | (0.22 | ) | (0.37 | ) | 1.48 | 12.15 | 17.71 | 122,198 | 0.77 | 0.77 | 1.53 | 190 | |||||||||||||||||||||||||||||||||||||||||||||||||||||||||||
Footnote Legend
| (1) | Sales charges, where applicable, are not reflected in the total return calculation. |
| (2) | Computed using average shares outstanding. |
| (3) | Annualized. |
| (4) | Not annualized. |
| (5) | Amount is less than $0.005. |
| (6) | Inception date. |
| (7) | Due to a change in expense cap, the ratio shown is a blended expense ratio. |
| (8) | The Funds will also indirectly bear their prorated share of expenses of the underlying funds in which they invest. Such expenses are not included in the calculation of this ratio. |
| (9) | Earnings credits from custodian were not material, as reflected in the Statements of Operations, and had no impact on Financial Highlights. |
| (10) | See Note 3C in the Notes to Financial Statements for information on recapture of expense previously waived. |
| (11) | The Fund is currently under its expense limitation. |
| (12) | Net expense ratios include extraordinary proxy expenses. |
See Notes to Financial Statements
49
Table of Contents
VIRTUS OPPORTUNITIES TRUST
SEPTEMBER 30, 2016
| Note | 1. Organization |
Virtus Opportunities Trust (the “Trust”) is organized as a Delaware statutory trust and is registered under the Investment Company Act of 1940, as amended (“1940 Act”), as an open-end management investment company.
As of the date of this report, 31 funds of the Trust are offered for sale, of which six (each a “Fund”) are reported in this annual report.
The Funds’ investment objectives are outlined in each Fund’s summary page. There is no guarantee that a Fund will achieve its objective(s).
All of the Funds offer Class A shares, Class C shares, and Class I shares. The Equity Trend Fund now offers Class R6 shares. Class A shares are sold with a front-end sales charge of up to 5.75% with some exceptions. Generally, Class A shares are not subject to any charges by the Funds when redeemed; however, a 0.50% – 1% contingent deferred sales charge (“CDSC”) may be imposed on certain redemptions made within a certain period following purchases on which a finder’s fee has been paid. The period for which such CDSC applies for the Funds is 18 months. The CDSC period begins on the last day of the month preceding the month in which the purchase was made.
Class C shares are generally sold with a 1% CDSC, applicable if redeemed within one year of purchase. Class I shares and Class R6 shares are sold without a front-end sales charge or CDSC. Class R6 shares are only available to participants in employer-sponsored retirement plans, such as 401(k) plans, profit sharing plans, defined benefit plans and other employer directed plans. Class R6 shares do not carry sales commissions or pay Rule 12b-1 fees. No compensation, administrative payments, sub-transfer agency payments or service payments are paid to brokers or other entities from fund assets or the Distributor’s or an affiliate’s resources on sales of or investments in Class R6 Shares.
Virtus Mutual Funds may impose an annual fee on accounts having balances of less than $2,500. The small account fee may be waived in certain circumstances, as disclosed in the prospectuses and/or statements of additional information. The fees collected will be used to offset certain expenses of the Funds. These fees are reflected as “Low Balance Account Fees” in each Fund’s Statements of Operations for the period, as applicable.
Each class of shares has identical voting, dividend, liquidation and other rights and the same terms and conditions, except that each Class bears different distribution and/or service fees under a Board-approved Rule 12b-1 and/or shareholder servicing plan (“12b-1 Plan”) and has exclusive voting rights with respect to such plans. Class I shares and Class R6 shares are not subject to a 12b-1 Plan. Income and other expenses as well as realized and unrealized gains and losses of each Fund are borne pro rata by the holders of each class of shares.
| Note | 2. Significant Accounting Policies |
The following is a summary of significant accounting policies consistently followed by the Trust in the preparation of its financial statements. The preparation of financial statements in conformity with accounting principles generally accepted in the United States of America requires management to make estimates and assumptions that affect the reported amounts of assets and liabilities, and disclosure of contingent assets and liabilities at the date of the financial statements and the reported amounts of increases and decreases in net assets from operations during the reporting period. Actual results could differ from those estimates and those differences could be significant.
| A. | Security Valuation |
Security valuation procedures for each Fund, which include nightly price variance as well as back-testing such as bi-weekly unchanged price, monthly secondary source and transaction analysis, have been approved by the Board of Trustees (the “Board”, or the “Trustees”). All internally fair valued securities are approved by a valuation committee (the “Valuation Committee”) appointed by the Board. The Valuation Committee is comprised of certain members of management as identified to the Board and convenes independently from portfolio management. All internally fair valued securities are updated daily and reviewed in detail by the Valuation Committee monthly unless changes occur within the period. The Valuation Committee reviews the validity of the model inputs and any changes to the model. Quarterly fair valuations are reviewed by the Board.
Each Fund utilizes a fair value hierarchy which prioritizes the inputs to valuation techniques used to measure fair value into three broad levels. The Funds’ policy is to recognize transfers between levels at the end of the reporting period.
| • Level 1 – | quoted prices in active markets for identical securities (security types generally include listed equities). |
| • Level 2 – | prices determined using other significant observable inputs (including quoted prices for similar securities, interest rates, prepayment speeds, credit risk, etc.). |
| • Level 3 – | prices determined using significant unobservable inputs (including the Valuation Committee’s own assumptions in determining the fair value of investments). |
A description of the valuation techniques applied to a Fund’s major categories of assets and liabilities measured at fair value on a recurring basis is as follows:
Equity securities are valued at the official closing price (typically last sale) on the exchange on which the securities are primarily traded or, if no closing price is available, at the last bid price and are categorized as Level 1 in the hierarchy. Restricted equity securities and private placements that are not widely traded, are illiquid, or are internally fair valued by the Valuation Committee, are generally categorized as Level 3 in the hierarchy.
Certain non-U.S. securities may be fair valued in cases where closing prices are not readily available or are deemed not reflective of readily available market prices. For example, significant events (such as movement in the U.S. securities market, or other regional and local developments) may occur between the time that non-U.S. markets close (where the security is principally traded) and the time that a Fund calculates its net asset value (“NAV”) (at the close of regular trading on the New York Stock Exchange (“NYSE”), generally 4 p.m. Eastern time) that may impact the value of securities traded in these non-U.S. markets. In such cases the Fund fair values non-U.S. securities using an independent pricing service which considers the correlation of the trading patterns of the non-U.S. security to the intraday trading in the U.S. markets for investments such as ADRs, financial futures, ETFs, and certain indexes, as well as prices for similar securities. Such fair valuations are categorized as Level 2 in the hierarchy. Because the frequency of significant events is not predictable, fair valuation of certain non-U.S. common stocks may occur on a frequent basis.
50
Table of Contents
VIRTUS OPPORTUNITIES TRUST
NOTES TO FINANCIAL STATEMENTS (Continued)
SEPTEMBER 30, 2016
Debt securities, including restricted securities, are valued based on evaluated quotations received from independent pricing services or from dealers who make markets in such securities. For most bond types, the pricing service utilizes matrix pricing which considers one or more of the following factors: yield or price of bonds of comparable quality, coupon, maturity, current cash flows, type, and current day trade information, as well as dealer-supplied prices. These valuations are generally categorized as Level 2 in the hierarchy. Structured debt instruments such as mortgage-backed and asset-backed securities may also incorporate collateral analysis and utilize cash flow models for valuation and are generally categorized as Level 2 in the hierarchy. Pricing services do not provide pricing for all securities and therefore indicative bids from dealers are utilized which are based on pricing models used by market makers in the security and are generally categorized as Level 2 in the hierarchy. Debt securities that are not widely traded, are illiquid, or are internally fair valued by the Valuation Committee, are generally categorized as Level 3 in the hierarchy.
Listed derivatives that are actively traded are valued based on quoted prices from the exchange and are categorized as Level 1 in the hierarchy. Over-the-counter derivative contracts, which include forward currency contracts and equity-linked instruments, do not require material subjectivity as pricing inputs are observed from actively quoted markets and are categorized as Level 2 in the hierarchy.
Investments in open-end mutual funds are valued at NAV. Investments in closed-end funds and ETFs are valued as of the close of regular trading on the NYSE each business day. Both are categorized as Level 1 in the hierarchy.
A summary of the inputs used to value the Funds’ net assets by each major security type is disclosed at the end of the Schedule of Investments for each Fund. The inputs or methodologies used for valuing securities are not necessarily an indication of the risk associated with investing in those securities.
| B. | Security Transactions and Investment Income |
Security transactions are recorded on the trade date. Realized gains and losses from sales of securities are determined on the identified cost basis. Dividend income is recognized on the ex-dividend date or, in the case of certain foreign securities, as soon as a Fund is notified. Interest income is recorded on the accrual basis. Each Fund amortizes premiums and accretes discounts using the effective interest method. Any distributions from underlying funds are recorded in accordance with the character of the distributions as designated by the underlying funds.
| C. | Income Taxes |
Each Fund is treated as a separate taxable entity. It is the intention of each Fund to comply with the requirements of Subchapter M of the Internal Revenue Code and to distribute substantially all of its taxable income to its shareholders. Therefore, no provision for federal income taxes or excise taxes has been made.
Certain Funds may be subject to foreign taxes on income, gains on investments or currency repatriation, a portion of which may be recoverable. Each Fund will accrue such taxes and recoveries as applicable based upon current interpretations of the tax rules and regulations that exist in the markets in which it invests.
Management of the Funds has concluded that there are no significant uncertain tax positions that would require recognition in the financial statements. As of September 30, 2016, the tax years that remain subject to examination by the major tax jurisdictions under the statute of limitations are from the year 2013 forward (with limited exceptions).
| D. | Distributions to Shareholders |
Distributions are recorded by each Fund on the ex-dividend date. Income and capital gain distributions are determined in accordance with income tax regulations which may differ from accounting principles generally accepted in the United States of America. These differences may include the treatment of non-taxable dividends, market premium and discount, non-deductible expenses, expiring capital loss carryovers, foreign currency gain or loss, gain or loss on futures contracts, partnerships, operating losses and losses deferred due to wash sales. Permanent book and tax basis differences relating to shareholder distributions will result in reclassifications to capital paid in on shares of beneficial interest.
| E. | Expenses |
Expenses incurred together by a fund and other affiliated mutual funds are allocated in proportion to the net assets of each such fund, except where allocation of direct expense to each fund or an alternative allocation method can be more appropriately used.
In addition to the net annual operating expenses that a fund bears directly, the shareholders of a fund indirectly bear the pro-rata expenses of any underlying mutual funds in which the fund invests.
| F. | Foreign Currency Translation |
Non-U.S. investment securities and other assets and liabilities denominated in foreign currencies are translated into U.S. dollar amounts at the foreign currency exchange rate effective at the end of the reporting period. Cost of investments is translated at the currency exchange rate effective at the trade date. The gain or loss resulting from a change in currency exchange rates between the trade and settlement date of a portfolio transaction is treated as a gain or loss on foreign currency. Likewise, the gain or loss resulting from a change in currency exchange rates between the date income is accrued and the date it is paid is treated as a gain or loss on foreign currency. The Funds do not isolate that portion of the results of operations arising from changes in foreign exchange rates on investments from the fluctuations arising from changes in the market prices of securities held. Such fluctuations are included with the net realized and unrealized gain or loss on investments.
| G. | Securities Lending |
Certain Funds may loan securities to qualified brokers through an agreement with Brown Brothers Harriman (“BBH”), as a third party lending agent. Under the terms of agreement, when doing so the Fund is required to maintain collateral with a market value not less than 100% of the market value of loaned securities. Collateral is adjusted daily in connection with changes in the market value of securities on loan. Collateral may consist of cash and securities issued by the U.S. Government or its agencies. Cash collateral is invested in a short-term money market fund. Dividends earned on the collateral and premiums paid by the broker are recorded as income by the Fund net of fees and rebates charged by BBH for its
51
Table of Contents
VIRTUS OPPORTUNITIES TRUST
NOTES TO FINANCIAL STATEMENTS (Continued)
SEPTEMBER 30, 2016
services as securities lending agent and in connection with this securities lending program. Lending portfolio securities involves a risk of delay in the recovery of the loaned securities or in the declining value of the collateral.
At September 30, 2016, none of the Funds had securities on loan.
| H. | Earnings Credit and Interest |
Through arrangements with each Fund’s custodian, each Fund either receives an earnings credit or interest on agreed upon target un-invested cash balances to reduce each Fund’s custody expenses. The credits are reflected as “Earnings credit from Custodian” and the interest is reflected under “Interest income” in each Fund’s Statements of Operations for the period, as applicable.
| Note | 3. Investment Advisory Fees and Related Party Transactions |
($ reported in thousands except as noted)
| A. | Adviser |
Virtus Investment Advisers, Inc. (the “Adviser”), an indirect wholly owned subsidiary of Virtus Investment Partners, Inc. (“Virtus”), is the adviser to the Trust. The Adviser manages the Funds’ investment programs and general operations of the Funds, including oversight of the Funds’ subadvisers.
As compensation for its services to the Funds, the Adviser is entitled to a fee based upon the following annual rates as a percentage of the average daily net assets (except as otherwise noted) of the following Funds:
| First $2 Billion | $2+ Billion through $4 Billion | $4+ Billion | ||||||||||
Global Equity Trend Fund | 1.00 | % | 0.95 | % | 0.90 | % | ||||||
Multi-Asset Trend Fund | 1.00 | 0.95 | 0.90 | |||||||||
| First $1 Billion | $1+ Billion | |||||||||||
Herzfeld Fund | 1.00 | 0.95 | ||||||||||
Sector Trend Fund | 0.45 | 0.40 | ||||||||||
| First $4 Billion | $4+ Billion | |||||||||||
Equity Trend Fund | 1.00 | % | 0.95 | % | ||||||||
Alternatives Diversifier Fund – the Adviser has discontinued charging an advisory fee.
| B. | Subadvisers |
Thomas J. Herzfeld Advisors, Inc. serves as the subadviser (“subadviser”) to Virtus Herzfeld Fund, managing the investments of that Fund for which the subadviser is paid a fee by the Adviser. Prior to September 7, 2016, Euclid Advisors LLC served as a subadviser to the remaining Funds; since that date those Funds do not have a subadviser.
| C. | Expense Limits and Fee Waivers |
The Adviser has contractually agreed to limit certain Funds’ total operating expenses (excluding interest, taxes, extraordinary expenses and acquired fund fees and expenses, if any), so that such expenses do not exceed the percentages of the Fund’s average daily net asset values as listed below through January 31, 2017.
| Class A | Class C | Class I | Class R6 | |||||||||||||
Equity Trend Fund* | 1.42 | % | 2.02 | % | 1.24 | % | 1.03 | % | ||||||||
Global Equity Trend Fund | 1.75 | 2.50 | 1.50 | — | ||||||||||||
Herzfeld Fund | 1.60 | 2.35 | 1.35 | — | ||||||||||||
Multi-Asset Trend Fund† | 1.75 | 2.50 | 1.50 | — | ||||||||||||
| † | expenses are currently below the cap level. |
| * | Effective February 8, 2016. For the period of October 1, 2015, through February 5, 2016, the expense caps were as follows for Class A, Class C, Class I, and Class R6, respectively: 1.70%, 2.45%, 1.45%, and 1.38%. |
| D. | Expense Recapture |
For certain Funds, the Adviser may recapture operating expenses waived or reimbursed under these arrangements, within three years after the date on which such waiver or reimbursement occurred. A Fund must pay its ordinary operating expenses before the Adviser is entitled to any reimbursement and must remain in compliance with any applicable expense limitations or, if none, the expense limitation in effect at the time of the waiver or reimbursement. All or a portion of the following Adviser reimbursed expenses may be recaptured as follows:
| Fiscal Year Ended | ||||||||||||||||
| 2017 | 2018 | 2019 | Total | |||||||||||||
Equity Trend Fund | $ | — | $ | — | $ | 1,475 | $ | 1,475 | ||||||||
Global Equity Trend Fund | — | — | 7 | | 7 | | ||||||||||
Herzfeld Fund | 56 | 40 | 55 | 151 | ||||||||||||
| E. | Distributor |
VP Distributors, LLC (“VP Distributors”), an indirect wholly owned subsidiary of Virtus, serves as the distributor of each Fund’s shares. VP Distributors has advised the Funds that for the fiscal year (the “period”) ended September 30, 2016, it retained net commissions of $37 of Class A shares and deferred sales charges of $36 and $91 for Class A shares and Class C shares, respectively.
52
Table of Contents
VIRTUS OPPORTUNITIES TRUST
NOTES TO FINANCIAL STATEMENTS (Continued)
SEPTEMBER 30, 2016
In addition, each Fund pays VP Distributors distribution and/or service fees under a 12b-1 Plan as a percentage of the average daily net assets of each respective class at the annual rates of 0.25%(1) for Class A shares and 1.00%(1)(2) for Class C shares. Class I shares and Class R6 shares are not subject to a 12b-1 Plan.
Under certain circumstances, shares of certain Virtus Mutual Funds may be exchanged for shares of the same class of certain other Virtus Mutual Funds on the basis of the relative NAV per share at the time of the exchange. On exchanges with share classes that carry a CDSC, the CDSC schedule of the original shares purchased continues to apply.
| (1) | The Funds invest in ETFs. In addition to the fees listed the Funds bear their proportionate shares of any distribution and shareholder servicing fees of the ETFs. |
| (2) | The Funds’ distributor has contractually agreed to waive its 12b-1 fees applicable to Class C shares to the extent that the Funds’ investments in underlying ETFs with their own 12b-1 fees would otherwise cause the total 12b-1 fees paid directly or indirectly by the Fund to exceed the limits set forth in applicable law or regulation. |
| F. | Administrator and Transfer Agent |
Virtus Fund Services, LLC, an indirect wholly owned subsidiary of Virtus, serves as the administrator and transfer agent to the Funds.
For the period ended September 30, 2016, the Funds incurred administration fees from the Trust totaling $2,070 which are included in the Statements of Operations.
For the period ended September 30, 2016, the Funds incurred transfer agent fees from the Trust totaling $2,741 which are included in the Statements of Operations. A portion of these fees was paid to outside entities that also provide services to the Trust.
| G. | Affiliated Shareholders |
At September 30, 2016, Virtus and its affiliates held shares of certain Funds which may be redeemed at any time that aggregated the following:
| Shares | Aggregate Net Asset Value | |||||||
Equity Trend Fund | ||||||||
Class R6 | 14,720 | $ | 182 | |||||
Herzfeld Fund | ||||||||
Class A | 11,982 | 131 | ||||||
Class C | 11,670 | 127 | ||||||
Class I | 96,718 | 1,058 | ||||||
| H. | Investments in Affiliates |
A summary of the Alternatives Diversifier Fund’s total long-term and short-term purchases and sales of the Class I shares of the affiliated underlying funds(1) during the period ended September 30, 2016, is as follows:
| Value, beginning of period | Purchases(2) | Sales Proceeds | ||||||||||
Virtus Global Infrastructure Fund | $ | 15,334 | $ | 3,658 | $ | 9,850 | ||||||
Virtus Global Real Estate Securities Fund | 7,542 | 188 | 3,200 | |||||||||
Virtus International Real Estate Securities Fund | 7,707 | 3,138 | 5,500 | |||||||||
Virtus Real Estate Securities Fund | 7,189 | 3,681 | 5,830 | |||||||||
Virtus Senior Floating Rate Fund | 12,164 | 2,487 | 10,075 | |||||||||
|
|
|
|
|
| |||||||
| $ | 49,936 | $ | 13,152 | $ | 34,455 | |||||||
|
|
|
|
|
| |||||||
| Value, end of period | Dividend Income | Distributions of Realized Gains | ||||||||||
Virtus Global Infrastructure Fund | $ | 9,734 | $ | 253 | $ | 605 | ||||||
Virtus Global Real Estate Securities Fund | 5,143 | 91 | 97 | |||||||||
Virtus International Real Estate Securities Fund | 5,564 | 88 | — | |||||||||
Virtus Real Estate Securities Fund | 4,375 | 94 | 1,236 | |||||||||
Virtus Senior Floating Rate Fund | 4,486 | 237 | — | |||||||||
|
|
|
|
|
| |||||||
| $ | 29,302 | $ | 763 | $ | 1,938 | |||||||
|
|
|
|
|
| |||||||
| (1) | The Alternatives Diversifier Fund does not invest in the underlying funds for the purpose of exercising management or control; however, investments made by the Fund within each of its principal investment strategies may represent a significant portion of an underlying fund’s net assets. At September 30, 2016, the Fund was the owner of record of approximately 16% of Virtus International Real Estate Securities Fund. |
| (2) | Includes reinvested dividends from income and capital gain distributions. |
53
Table of Contents
VIRTUS OPPORTUNITIES TRUST
NOTES TO FINANCIAL STATEMENTS (Continued)
SEPTEMBER 30, 2016
| I. | Trustee Compensation |
The Trust provides a deferred compensation plan for its Trustees who receive compensation from the Trust. Under the deferred compensation plan, Trustees may elect to defer all or a portion of their compensation. Amounts deferred are retained by the Trust, and then, to the extent permitted by the 1940 Act, in turn, may be invested in the shares of affiliated or unaffiliated mutual funds selected by the participating Trustees. Investments in such instruments are included in “Other Assets” on the Statement of Assets and Liabilities at September 30, 2016.
| Note | 4. Purchases and Sales of Securities |
($ reported in thousands)
Purchases and sales of securities (excluding U.S. Government and agency securities, and short-term securities) during the period ended September 30, 2016, were as follows:
| Purchases | Sales | |||||||
Alternatives Diversifier Fund | $ | 35,711 | $ | 61,646 | ||||
Equity Trend Fund | 2,676,708 | 2,758,568 | ||||||
Global Equity Trend Fund | 77,327 | 73,613 | ||||||
Herzfeld Fund | 21,684 | 22,996 | ||||||
Multi-Asset Trend Fund | 346,120 | 383,133 | ||||||
Sector Trend Fund | 1,475,298 | 1,199,981 | ||||||
There were no purchases or sales of long-term U.S. Government and agency securities for the Funds during the period ended September 30, 2016.
| Note | 5. Borrowings |
($ reported in thousands)
On June 29, 2016, the Funds and other affiliated funds renewed a $50,000 secured line of credit. The Credit Agreement (the “Agreement”) is with a commercial bank (the “Bank”) that allows the Funds to borrow cash from the Bank to manage large unexpected redemptions and trade fails, up to a limit of one-third or one-fifth of each Fund’s total net assets in accordance with the Agreement. The Agreement has a term of 364 days and is renewable by the Funds with the Bank’s consent. Interest is charged at the higher of the LIBOR (London Interbank Offered Rate) or the Federal Funds rate plus an additional percentage rate on the amount borrowed. Commitment fees are charged on the undrawn balance. The Funds and other affiliated funds are individually, and not jointly, liable for their particular advances, if any, under the line of credit. The Bank has the ability to require repayment of outstanding borrowings under the Agreement upon certain circumstances such as an event of default.
From February 17, 2016, to February 29, 2016, the Herzfeld Fund made borrowings. The average daily borrowings under the Agreement and the weighted daily average interest rate were $407 and 1.43%, respectively. No other Funds made borrowings during the period and no Fund had any outstanding borrowings as of September 30, 2016.
54
Table of Contents
VIRTUS OPPORTUNITIES TRUST
NOTES TO FINANCIAL STATEMENTS (Continued)
SEPTEMBER 30, 2016
| Note | 6. Capital Share Transactions |
(reported in thousands)
Transactions in shares of capital stock, during the periods ended as indicated below, were as follows:
| Alternatives Diversifier Fund | Equity Trend Fund | |||||||||||||||||||||||||||||||
| Year Ended September 30, 2016 | Year Ended September 30, 2015 | Year Ended September 30, 2016 | Year Ended September 30, 2015 | |||||||||||||||||||||||||||||
| SHARES | AMOUNT | SHARES | AMOUNT | SHARES | AMOUNT | SHARES | AMOUNT | |||||||||||||||||||||||||
Class A | ||||||||||||||||||||||||||||||||
| Sale of shares | 233 | $ | 2,463 | 240 | $ | 2,652 | 1,506 | $ | 18,086 | 14,875 | $ | 216,781 | ||||||||||||||||||||
| Reinvestment of distributions | 13 | 130 | 55 | 607 | — | — | 26,015 | 358,962 | ||||||||||||||||||||||||
| Plan of Reorganization (Note 12) | — | — | — | — | 7,287 | 82,432 | — | — | ||||||||||||||||||||||||
| Shares repurchased | (1,026 | ) | (10,360 | ) | (1,209 | ) | (13,179 | ) | (31,626 | ) | (378,691 | ) | (115,604 | ) | (1,560,522 | ) | ||||||||||||||||
|
|
|
|
|
|
|
|
|
|
|
|
|
|
|
| |||||||||||||||||
| Net Increase / (Decrease) | (780 | ) | $ | (7,767 | ) | (914 | ) | $ | (9,920 | ) | (22,833 | ) | $ | (278,173 | ) | (74,714 | ) | $ | (984,779 | ) | ||||||||||||
|
|
|
|
|
|
|
|
|
|
|
|
|
|
|
| |||||||||||||||||
| Class C | ||||||||||||||||||||||||||||||||
| Sale of shares | 46 | $ | 462 | 75 | $ | 825 | 1,455 | $ | 17,143 | 16,872 | $ | 238,376 | ||||||||||||||||||||
| Reinvestment of distributions | 8 | 78 | 28 | 309 | — | — | 24,034 | 325,886 | ||||||||||||||||||||||||
| Plan of Reorganization (Note 12) | — | — | — | — | 11,669 | 128,740 | — | — | ||||||||||||||||||||||||
| Shares repurchased | (817 | ) | (8,227 | ) | (904 | ) | (9,720 | ) | (40,364 | ) | (472,517 | ) | (93,877 | ) | (1,233,046 | ) | ||||||||||||||||
|
|
|
|
|
|
|
|
|
|
|
|
|
|
|
| |||||||||||||||||
| Net Increase / (Decrease) | (763 | ) | $ | (7,687 | ) | (801 | ) | $ | (8,586 | ) | (27,240 | ) | $ | (326,634 | ) | (52,971 | ) | $ | (668,784 | ) | ||||||||||||
|
|
|
|
|
|
|
|
|
|
|
|
|
|
|
| |||||||||||||||||
| Class I | ||||||||||||||||||||||||||||||||
| Sale of shares | 386 | $ | 3,967 | 1,229 | $ | 13,567 | 4,635 | $ | 56,183 | 39,668 | $ | 574,419 | ||||||||||||||||||||
| Reinvestment of distributions | 16 | 153 | 62 | 681 | — | — | 37,699 | 521,659 | ||||||||||||||||||||||||
| Plan of Reorganization (Note 12) | — | — | — | — | 11,946 | 135,785 | — | — | ||||||||||||||||||||||||
| Shares repurchased | (1,648 | ) | (16,568 | ) | (2,472 | ) | (26,891 | ) | (42,372 | ) | (509,713 | ) | (248,990 | ) | (3,469,826 | ) | ||||||||||||||||
|
|
|
|
|
|
|
|
|
|
|
|
|
|
|
| |||||||||||||||||
| Net Increase / (Decrease) | (1,246 | ) | $ | (12,448 | ) | (1,181 | ) | $ | (12,643 | ) | (25,791 | ) | $ | (317,745 | ) | (171,623 | ) | $ | (2,373,748 | ) | ||||||||||||
|
|
|
|
|
|
|
|
|
|
|
|
|
|
|
| |||||||||||||||||
| Class R6 | ||||||||||||||||||||||||||||||||
| Sale of shares | — | $ | — | — | $ | — | — | $ | — | 6 | $ | 100 | ||||||||||||||||||||
| Reinvestment of distributions | — | — | — | — | — | — | 1 | 20 | ||||||||||||||||||||||||
| Plan of Reorganization (Note 12) | — | — | — | — | 7 | 85 | — | (1) | — | (2) | ||||||||||||||||||||||
| Shares repurchased | — | — | — | — | — | — | — | (1) | — | (2) | ||||||||||||||||||||||
|
|
|
|
|
|
|
|
|
|
|
|
|
|
|
| |||||||||||||||||
| Net Increase / (Decrease) | — | $ | — | — | $ | — | 7 | $ | 85 | 7 | $ | 120 | ||||||||||||||||||||
|
|
|
|
|
|
|
|
|
|
|
|
|
|
|
| |||||||||||||||||
| Global Equity Trend Fund | ||||||||||||||||||||||||||||||||
| Year Ended September 30, 2016 | Year Ended September 30, 2015 | |||||||||||||||||||||||||||||||
| SHARES | AMOUNT | SHARES | AMOUNT | |||||||||||||||||||||||||||||
| Class A | ||||||||||||||||||||||||||||||||
| Sale of shares | 107 | $ | 1,027 | 1,197 | $ | 13,144 | ||||||||||||||||||||||||||
| Reinvestment of distributions | — | — | 509 | 5,652 | ||||||||||||||||||||||||||||
| Shares repurchased | (1,165 | ) | (11,255 | ) | (5,916 | ) | (64,685 | ) | ||||||||||||||||||||||||
|
|
|
|
|
|
|
| |||||||||||||||||||||||||
| Net Increase / (Decrease) | (1,058 | ) | $ | (10,228 | ) | (4,210 | ) | $ | (45,889 | ) | ||||||||||||||||||||||
|
|
|
|
|
|
|
| |||||||||||||||||||||||||
| Class C | ||||||||||||||||||||||||||||||||
| Sale of shares | 80 | $ | 754 | 635 | $ | 6,902 | ||||||||||||||||||||||||||
| Reinvestment of distributions | — | — | 584 | 6,384 | ||||||||||||||||||||||||||||
| Shares repurchased | (1,251 | ) | (11,728 | ) | (4,770 | ) | (49,901 | ) | ||||||||||||||||||||||||
|
|
|
|
|
|
|
| |||||||||||||||||||||||||
| Net Increase / (Decrease) | (1,171 | ) | $ | (10,974 | ) | (3,551 | ) | $ | (36,615 | ) | ||||||||||||||||||||||
|
|
|
|
|
|
|
| |||||||||||||||||||||||||
| Class I | ||||||||||||||||||||||||||||||||
| Sale of shares | 97 | $ | 932 | 992 | $ | 11,048 | ||||||||||||||||||||||||||
| Reinvestment of distributions | — | — | 631 | 7,036 | ||||||||||||||||||||||||||||
| Shares repurchased | (1,299 | ) | (12,406 | ) | (7,982 | ) | (88,214 | ) | ||||||||||||||||||||||||
|
|
|
|
|
|
|
| |||||||||||||||||||||||||
| Net Increase / (Decrease) | (1,202 | ) | $ | (11,474 | ) | (6,359 | ) | $ | (70,130 | ) | ||||||||||||||||||||||
|
|
|
|
|
|
|
| |||||||||||||||||||||||||
| (1) | Amount is less than 500. |
| (2) | Amount is less than $500. |
55
Table of Contents
VIRTUS OPPORTUNITIES TRUST
NOTES TO FINANCIAL STATEMENTS (Continued)
SEPTEMBER 30, 2016
| Herzfeld Fund | Multi-Asset Trend Fund | |||||||||||||||||||||||||||||||
| Year Ended September 30, 2016 | Year Ended September 30, 2015 | Year Ended September 30, 2016 | Year Ended September 30, 2015 | |||||||||||||||||||||||||||||
| SHARES | AMOUNT | SHARES | AMOUNT | SHARES | AMOUNT | SHARES | AMOUNT | |||||||||||||||||||||||||
| Class A | ||||||||||||||||||||||||||||||||
| Sale of shares | 517 | $ | 5,537 | 612 | $ | 6,823 | 214 | $ | 2,114 | 1,899 | $ | 20,815 | ||||||||||||||||||||
| Reinvestment of distributions | 41 | 422 | 47 | 506 | 4 | 39 | 1,017 | 11,007 | ||||||||||||||||||||||||
| Shares repurchased | (386 | ) | (3,948 | ) | (628 | ) | (6,901 | ) | (2,880 | ) | (28,405 | ) | (9,493 | ) | (100,593 | ) | ||||||||||||||||
|
|
|
|
|
|
|
|
|
|
|
|
|
|
|
| |||||||||||||||||
| Net Increase / (Decrease) | 172 | $ | 2,011 | 31 | $ | 428 | (2,662 | ) | $ | (26,252 | ) | (6,577 | ) | $ | (68,771 | ) | ||||||||||||||||
|
|
|
|
|
|
|
|
|
|
|
|
|
|
|
| |||||||||||||||||
| Class C | ||||||||||||||||||||||||||||||||
| Sale of shares | 347 | $ | 3,484 | 967 | $ | 10,722 | 312 | $ | 3,029 | 2,972 | $ | 31,920 | ||||||||||||||||||||
| Reinvestment of distributions | 67 | 677 | 63 | 671 | — | — | 2,252 | 24,117 | ||||||||||||||||||||||||
| Shares repurchased | (478 | ) | (4,756 | ) | (472 | ) | (5,142 | ) | (6,498 | ) | (63,239 | ) | (19,312 | ) | (202,149 | ) | ||||||||||||||||
|
|
|
|
|
|
|
|
|
|
|
|
|
|
|
| |||||||||||||||||
| Net Increase / (Decrease) | (64 | ) | $ | (595 | ) | 558 | $ | 6,251 | (6,186 | ) | $ | (60,210 | ) | (14,088 | ) | $ | (146,112 | ) | ||||||||||||||
|
|
|
|
|
|
|
|
|
|
|
|
|
|
|
| |||||||||||||||||
| Class I | ||||||||||||||||||||||||||||||||
| Sale of shares | 1,886 | $ | 19,264 | 1,671 | $ | 18,514 | 471 | $ | 4,647 | 3,215 | $ | 35,797 | ||||||||||||||||||||
| Reinvestment of distributions | 118 | 1,200 | 52 | 553 | 22 | 217 | 1,924 | 20,908 | ||||||||||||||||||||||||
| Shares repurchased | (1,656 | ) | (16,578 | ) | (499 | ) | (5,352 | ) | (5,099 | ) | (50,439 | ) | (24,418 | ) | (262,867 | ) | ||||||||||||||||
|
|
|
|
|
|
|
|
|
|
|
|
|
|
|
| |||||||||||||||||
| Net Increase / (Decrease) | 348 | $ | 3,886 | 1,224 | $ | 13,715 | (4,606 | ) | $ | (45,575 | ) | (19,279 | ) | $ | (206,162 | ) | ||||||||||||||||
|
|
|
|
|
|
|
|
|
|
|
|
|
|
|
| |||||||||||||||||
| Sector Trend Fund | ||||||||||||||||||||||||||||||||
| Year Ended September 30, 2016 | Year Ended September 30, 2015 | |||||||||||||||||||||||||||||||
| SHARES | AMOUNT | SHARES | AMOUNT | |||||||||||||||||||||||||||||
| Class A | ||||||||||||||||||||||||||||||||
| Sale of shares | 3,103 | $ | 34,166 | 11,512 | $ | 142,000 | ||||||||||||||||||||||||||
| Reinvestment of distributions | 78 | 850 | 5,546 | 66,431 | ||||||||||||||||||||||||||||
| Shares repurchased | (5,799 | ) | (63,594 | ) | (23,619 | ) | (281,323 | ) | ||||||||||||||||||||||||
|
|
|
|
|
|
|
| |||||||||||||||||||||||||
| Net Increase / (Decrease) | (2,618 | ) | $ | (28,578 | ) | (6,561 | ) | $ | (72,892 | ) | ||||||||||||||||||||||
|
|
|
|
|
|
|
| |||||||||||||||||||||||||
| Class C | ||||||||||||||||||||||||||||||||
| Sale of shares | 3,892 | $ | 42,476 | 9,549 | $ | 113,509 | ||||||||||||||||||||||||||
| Reinvestment of distributions | — | — | 4,741 | 55,847 | ||||||||||||||||||||||||||||
| Shares repurchased | (7,943 | ) | (85,320 | ) | (14,803 | ) | (171,575 | ) | ||||||||||||||||||||||||
|
|
|
|
|
|
|
| |||||||||||||||||||||||||
| Net Increase / (Decrease) | (4,051 | ) | $ | (42,844 | ) | (513 | ) | $ | (2,219 | ) | ||||||||||||||||||||||
|
|
|
|
|
|
|
| |||||||||||||||||||||||||
| Class I | ||||||||||||||||||||||||||||||||
| Sale of shares | 4,289 | $ | 46,797 | 19,340 | $ | 231,425 | ||||||||||||||||||||||||||
| Reinvestment of distributions | 121 | 1,318 | 5,015 | 60,118 | ||||||||||||||||||||||||||||
| Shares repurchased | (10,715 | ) | (117,242 | ) | (29,519 | ) | (353,739 | ) | ||||||||||||||||||||||||
|
|
|
|
|
|
|
| |||||||||||||||||||||||||
| Net Increase / (Decrease) | (6,305 | ) | $ | (69,127 | ) | (5,164 | ) | $ | (62,196 | ) | ||||||||||||||||||||||
|
|
|
|
|
|
|
| |||||||||||||||||||||||||
56
Table of Contents
VIRTUS OPPORTUNITIES TRUST
NOTES TO FINANCIAL STATEMENTS (Continued)
SEPTEMBER 30, 2016
| Note | 7. 10% Shareholders |
As of September 30, 2016, certain Funds had individual shareholder account(s) and/or omnibus shareholder account(s) (comprised of a group of individual shareholders), which individually amounted to more than 10% of the total shares outstanding of each such Fund as detailed below.
| % of Shares Outstanding | Number of Accounts | |||||||
Alternatives Diversifier Fund | 12 | % | 1 | |||||
Global Equity Trend Fund | 15 | 1 | ||||||
Herzfeld Fund | 66 | 5 | ||||||
Multi-Asset Trend Fund | 21 | 1 | ||||||
* Includes affiliated shareholder accounts.
| Note | 8. Credit Risk and Asset Concentration |
Certain Funds may invest a high percentage of their assets in specific sectors of the market in their pursuit of their investment objectives. Fluctuations in these sectors of concentration may have a greater impact on a Fund, positive or negative, than if a Fund did not concentrate its investments in such sectors. At September 30, 2016, the Funds did not invest a high percentage of their assets in specific sectors.
| Note | 9. Indemnifications |
Under the Trust’s organizational documents, its Trustees and officers are indemnified against certain liabilities arising out of the performance of their duties to the Funds. Each Trustee has entered into an indemnification agreement with the Trust. In addition, in the normal course of business, the Funds enter into contracts that provide a variety of indemnifications to other parties. The Funds’ maximum exposure under these arrangements is unknown as this would involve future claims that may be made against the Funds and that have not occurred. However, the Funds have not had prior claims or losses pursuant to these arrangements and expect the risk of loss to be remote.
| Note | 10. Federal Income Tax Information |
($ reported in thousands)
At September 30, 2016, federal tax cost and aggregate gross unrealized appreciation (depreciation) of securities held by the Funds were as follows:
| Federal Tax Cost | Unrealized Appreciation | Unrealized (Depreciation) | Net Unrealized Appreciation (Depreciation) | |||||||||||||
Alternatives Diversifier Fund | $ | 75,793 | $ | 7,375 | $ | (24,827 | ) | $ | (17,452 | ) | ||||||
Equity Trend Fund | 865,765 | 93,316 | (14,309 | ) | 79,007 | |||||||||||
Global Equity Trend Fund | 21,828 | 2,105 | (206 | ) | 1,899 | |||||||||||
Herzfeld Fund | 46,079 | 1,826 | (1,283 | ) | 543 | |||||||||||
Multi-Asset Trend Fund | 123,261 | 11,525 | (774 | ) | 10,751 | |||||||||||
Sector Trend Fund | 378,753 | 24,548 | (5,454 | ) | 19,094 | |||||||||||
Certain Funds have capital loss carryovers available to offset future realized capital gains, through the indicated expiration dates shown below:
| 2018 | No Expiration | Total | ||||||||||||||||||||||
| Short-Term | Long-Term | Short-Term | Long-Term | Short-Term | Long-Term | |||||||||||||||||||
Alternatives Diversifier Fund | $ | 49,187 | $ | — | $ | — | $ | — | $ | 49,187 | $ | — | ||||||||||||
Equity Trend Fund | — | — | 533,867 | — | 533,867 | — | ||||||||||||||||||
Global Equity Trend Fund | — | — | 12,017 | 42 | 12,017 | 42 | ||||||||||||||||||
Herzfeld Fund | — | — | 489 | — | 489 | — | ||||||||||||||||||
Multi-Asset Trend Fund | — | — | 28,586 | — | 28,586 | — | ||||||||||||||||||
Sector Trend Fund | 1,080 | — | 36,964 | 1,695 | 38,044 | 1,695 | ||||||||||||||||||
The Trust may not realize the benefit of these losses to the extent each Fund does not realize gains on investments prior to the expiration of the capital loss carryovers.
Under the Regulated Investment Company Modernization Act of 2010 (the “Act”), net capital losses recognized for tax years beginning after December 22, 2010, may be carried forward indefinitely, and their character is retained as short-term and/or long-term losses. Previously, net capital losses were carried forward for eight years and treated as short-term losses. As a transition rule, the Act requires that post-enactment net capital losses be used before pre-enactment net capital losses.
For the period ended September 30, 2016, the following Funds utilized losses deferred in prior years against current year capital gains:
Alternatives Diversifier Fund | $ | 2,742 |
57
Table of Contents
VIRTUS OPPORTUNITIES TRUST
NOTES TO FINANCIAL STATEMENTS (Continued)
SEPTEMBER 30, 2016
Capital losses realized after October 31, and certain late year ordinary losses may be deferred and treated as occurring on the first day of the following fiscal year. For the fiscal year ended September 30, 2016, the Funds deferred and recognized post-October losses as follows:
| Late Year Ordinary Losses Deferred | Late Year Ordinary Losses Recognized | Capital Loss Deferred | Capital Loss Recognized | |||||||||||||
Alternatives Diversifier Fund | $ | — | $ | — | $ | 2,389 | $ | 2,312 | ||||||||
Equity Trend Fund | 1,663 | 9,400 | 57,335 | 386,068 | ||||||||||||
Global Equity Trend Fund | 207 | 705 | 2,051 | 12,067 | ||||||||||||
Herzfeld Fund | — | — | 929 | 327 | ||||||||||||
Multi-Asset Trend Fund | 529 | 2,881 | 5,942 | 28,669 | ||||||||||||
Sector Trend Fund | — | — | 22,188 | 42,927 | ||||||||||||
| (1) | Amount is less than $500. |
The components of distributable earnings on a tax basis (excluding unrealized appreciation (depreciation) which are disclosed above) consist of the following:
| Undistributed Ordinary Income | Undistributed Long-Term Capital Gains | |||||||
Alternatives Diversifier Fund | $ | 316 | $ | — | ||||
Equity Trend Fund | — | — | ||||||
Global Equity Trend Fund | — | — | ||||||
Herzfeld Fund | 5 | — | ||||||
Multi-Asset Trend Fund | — | — | ||||||
Sector Trend Fund | 2,144 | — | ||||||
The differences between the book and tax basis components of distributable earnings relate principally to the timing of recognition of income and gains for federal income tax purposes. Short-term gain distributions reported in the Statements of Changes in Net Assets, if any, are reported as ordinary income for federal tax purposes. Distributions are determined on a tax basis and may differ from net investment income and realized capital gains for financial reporting purposes.
The tax character of dividends and distributions paid during the years ended September 30, 2016, and 2015, was as follows:
| 2016 | 2015 | |||||||||||||||||||||||
| Ordinary income | Long-Term Capital Gains | Total | Ordinary income | Long-Term Capital Gains | Total | |||||||||||||||||||
Alternatives Diversifier Fund | $ | 414 | $ | — | $ | 414 | $ | 2,015 | $ | — | $ | 2,015 | ||||||||||||
Equity Trend Fund | — | — | — | 360,775 | 1,049,270 | 1,410,045 | ||||||||||||||||||
Global Equity Trend Fund | — | — | — | 5,789 | 13,389 | 19,178 | ||||||||||||||||||
Herzfeld Fund | 1,846 | 460 | 2,306 | 1,424 | 315 | 1,739 | ||||||||||||||||||
Multi-Asset Trend Fund | 285 | — | 285 | 18,666 | 40,699 | 59,365 | ||||||||||||||||||
Sector Trend Fund | 2,635 | — | 2,635 | 41,833 | 170,484 | 212,317 | ||||||||||||||||||
| Note | 11. Reclassifications of Capital Accounts |
($ reported in thousands)
For financial reporting purposes, book basis capital accounts are adjusted to reflect the tax character of permanent book/tax differences. Permanent reclassifications can arise from differing treatment of certain income and gain transactions, nondeductible current year net operating losses, expiring capital loss carryovers and investments in passive foreign investment companies. The reclassifications have no impact on the net assets or net asset value of the Funds. As of September 30, 2016, the Funds recorded reclassifications to increase (decrease) the accounts as listed below:
| Capital Paid in on Shares of Beneficial Interest | Undistributed Net Investment Income (Loss) | Accumulated Net Realized Gain (Loss) | ||||||||||
Alternatives Diversifier Fund | $ | 20 | $ | (77 | ) | $ | 57 | |||||
Equity Trend Fund | 138,232 | 10,672 | (148,904 | ) | ||||||||
Global Equity Trend Fund | (816 | ) | 816 | — | ||||||||
Herzfeld Fund | — | 417 | (417 | ) | ||||||||
Multi-Asset Trend Fund | (3,194 | ) | 3,134 | 60 | ||||||||
| Note | 12. Plans of Reorganization |
| A. | On October 22, 2015, the Board of Trustees of Virtus Opportunities Trust approved an Agreement and Plan of Reorganization (the “Plan”) with respect to Virtus Dynamic Trend Fund (the “Merged Fund”), a series of Virtus Opportunities Trust, and Virtus Equity Trend Fund (the “Acquiring Fund”), a series of Virtus Opportunities Trust, which provided for the transfer of all of the assets of the Merged Fund for shares of the Acquiring Fund and the assumption of the liabilities of the Merged Fund. The purpose of the transaction was to eliminate the offering of overlapping Funds with similar investment objectives and similar investment strategies within the Virtus Mutual Fund Complex, while simultaneously creating |
58
Table of Contents
VIRTUS OPPORTUNITIES TRUST
NOTES TO FINANCIAL STATEMENTS (Continued)
SEPTEMBER 30, 2016
| economies of scale for the surviving Funds that were intended to lower Fund expenses. For financial reporting purposes, assets received and shares issued by the Acquiring Fund were recorded at fair value; however, the cost basis of the investments received from the Merged Fund was carried forward to align ongoing reporting of the Acquiring Fund’s realized and unrealized gains and losses with amounts distributable to shareholders for tax purposes. |
On January 15, 2016, Class B shares were converted into Class A shares in the Merged Fund.
The acquisition was accomplished by a tax-free exchange of shares on February 5, 2016. The share transactions associated with the merger are as follows:
Merged Fund | Shares Outstanding | Acquiring Fund | Shares Converted | Merged Fund | ||||||||||||||||||
Virtus Dynamic Trend Fund | Class | A | 9,028 | Virtus Equity Trend Fund | Class | A | 7,287 | $ | 82,432 | |||||||||||||
| C | 15,688 | C | 11,669 | 128,740 | ||||||||||||||||||
| I | 14,645 | I | 11,946 | 135,785 | ||||||||||||||||||
| R | 9 | R | 7 | 85 | ||||||||||||||||||
The net assets and net unrealized appreciation (depreciation) immediately before the acquisition were as follows:
Merged Fund | Net | Unrealized | Acquiring | Net | ||||||||
| Virtus Dynamic Trend Fund | $ | 347,042 | $ | 1,481 | Virtus Equity Trend Fund | $1,271,368 | ||||||
Assuming the acquisition had been completed on October 1, 2015, the Virtus Equity Trend Fund results of operations for the period ended September 30, 2016, would have been as follows:
Net investment income (loss) | $ | 2,270 | (a) | |
Net gain (loss) on investments | (13,042 | )(b) | ||
|
| |||
Net increase (decrease) in assets from operations | $ | (10,772 | ) |
| (a) | $(3,505), as reported in the Statement of Operations, plus $5,775 Net Investment Income from Virtus Dynamic Trend Fund pre-merger. |
| (b) | $16,480, as reported in the Statement of Operations, plus $(29,522) Net Realized and Unrealized Gain (Loss) on Investments from Virtus Dynamic Trend Fund pre-merger. |
Because the combined Funds have been managed as an integrated single Fund since the completion date it is also not feasible to separate the income/(losses) and gains/(losses) of the merged Virtus Dynamic Trend Fund that have been included in the acquiring Virtus Equity Trend Fund Statement of Operations since February 5, 2016.
| Note | 13. Illiquid and Restricted Securities |
Investments are generally considered illiquid if they cannot be disposed of within seven days in the ordinary course of business at the approximate amount at which such securities have been valued by a Fund. Additionally, the following information is also considered in determining liquidity: the frequency of trades and quotes for the investment, whether the investment is listed for trading on a recognized domestic exchange and/or whether two or more brokers are willing to purchase or sell the security at a comparable price, the extent of market making activity in the investment and the nature of the market for investment. Illiquid securities are footnoted as such at the end of each Fund’s Schedule of Investments, where applicable. However, a portion of such footnoted securities could be liquid where it is determined that some, though not all, of the position could be disposed of within seven days in the ordinary course of business at the approximate amount at which such securities have been valued by the applicable Fund.
Restricted securities are illiquid securities, as defined above, not registered under the Securities Act of 1933, as amended (the “1933 Act”). Generally, 144A securities are excluded from this category, except where defined as illiquid.
Each Fund will bear any costs, including those involved in registration under the 1933 Act, in connection with the disposition of such securities.
At September 30, 2016, the Funds did not hold any securities that were illiquid.
| Note | 14. Exemptive Order |
On August 23, 2010, the SEC issued an amended order under Section 12(d)(1)(J) of the 1940 Act granting an exemption from Sections 12(d)(1)(A) and (B) of the 1940 Act and under Sections 6(c) and 17(b) of the 1940 Act granting an exemption from Section 17(a) of the 1940 Act, which permits the Trust to invest in other affiliated and unaffiliated funds, including exchange-traded funds, in each case subject to certain conditions.
| Note | 15. Regulatory Matters and Litigation |
From time to time, the Trust, the Adviser and/or Subadviser(s) and/or their affiliates may be involved in litigation and arbitration as well as examinations and investigations by various regulatory bodies, including the SEC, involving compliance with, among other things, securities laws, client investment guidelines, laws governing the activities of broker-dealers and other laws and regulations affecting their products and other activities. At this time, the Adviser believes that the outcomes of such matters are not likely, either individually or in the aggregate, to be material to these financial statements.
59
Table of Contents
VIRTUS OPPORTUNITIES TRUST
NOTES TO FINANCIAL STATEMENTS (Continued)
SEPTEMBER 30, 2016
On February 20, 2015, a putative class action complaint (In re Virtus Investment Partners, Inc. Securities Litigation; formerly styled as Tom Cummins v. Virtus Investment Partners Inc. et al.) alleging violation of the federal securities laws was filed by an individual shareholder against Virtus and certain of its officers (the “defendants”) in the United States District Court for the Southern District of New York. On August 21, 2015, the lead plaintiff filed a Consolidated Class Action Complaint (the “Consolidated Complaint”) amending the originally filed complaint and adding the Trust as a defendant. The Consolidated Complaint was purportedly filed on behalf of all purchasers of Virtus common stock between January 25, 2013 and May 11, 2015 (the “Class Period”). The Consolidated Complaint alleges that during the Class Period, the defendants disseminated materially false and misleading statements and concealed material adverse facts relating to certain funds previously subadvised by F-Squared Investments, Inc. and/or its affiliates (“F-Squared”). The plaintiff seeks to recover unspecified damages. A motion to dismiss the Consolidated Complaint was filed on behalf of the defendants on October 21, 2015. Pursuant to an Opinion & Order (“Order”) filed on July 1, 2016, the court granted in part and denied in part the defendants’ motion to dismiss. Although the Order narrows the scope of the claims asserted, claims under Sections 10(b) and 20(a) of the Exchange Act and Rule 10b-5 thereunder survive the motion. The defendants filed an Answer to the Consolidated Complaint on August 5, 2016. Virtus and its affiliates, including the Adviser, believe that the suit is without merit and intend to defend it vigorously. The Trust believes that the risk of loss to the Funds as a result of this suit is remote. The Adviser does not believe that the suit will have any impact on its ability to provide services to the Funds.
On May 8, 2015, a putative class action complaint (Mark Youngers v. Virtus Investment Partners, Inc. et al.) alleging violations of certain provisions of the federal securities laws was filed in the United States District Court for the Central District of California. The complaint, which was purportedly filed on behalf of purchasers of certain Virtus Funds previously subadvised by F-Squared between May 8, 2010 and December 22, 2014, inclusive (the “Class Period”), alleged claims against Virtus, certain Virtus officers and affiliates (including the Adviser, Euclid Advisors LLC (“Euclid”) and VP Distributors, LLC), the trustees and certain officers of the Trust, and certain other parties (the “defendants”). The complaint alleges that during the Class Period the defendants disseminated materially false and misleading statements and concealed or omitted material facts necessary to make the statements made not misleading. On October 1, 2015, the plaintiff filed a First Amended Class Action Complaint which, among other things, added a derivative claim for breach of fiduciary duty on behalf of the Trust. On October 19, 2015, the United States District Court for the Central District of California entered an order transferring the action to the Southern District of New York. On January 4, 2016, Plaintiffs filed a Second Amended Complaint. Motions to dismiss were filed on behalf of Virtus, its officers and affiliates and the independent trustees on February 1, 2016. An Opinion & Order (“Order”) granting in part and denying in part the defendants’ motions to dismiss was issued on July 1, 2016. The Order dismissed all claims against the Adviser, Euclid, the independent trustees and certain of the other individual defendants and narrowed the claims asserted against the remaining defendants. The remaining defendants filed an Answer to the Second Amended Complaint on August 5, 2016. The defendants filed a motion to certify an interlocutory appeal of the July 1, 2016 order to the Court of Appeals for the Second Circuit on August 26, 2016. Oral argument on the motion is scheduled for October 7, 2016. Virtus and its affiliates, including the Adviser, believe that the suit has no basis in law or fact and intend to defend it vigorously. The Trust believes that the risk of loss to the Funds as a result of this suit is remote. The Adviser does not believe that the suit will have any impact on its ability to provide services to the Funds.
| Note | 16. Subsequent Events |
Management has evaluated the impact of all subsequent events on the Funds through the date the financial statements were issued, and has determined that there are no subsequent events requiring recognition or disclosure in these financial statements.
60
Table of Contents

REPORT OF INDEPENDENT REGISTERED PUBLIC ACCOUNTING FIRM
To the Board of Trustees of
Virtus Opportunities Trust and
Shareholders of the Funds:
In our opinion, the accompanying statements of assets and liabilities, including the schedules of investments, and the related statements of operations and of changes in net assets and the financial highlights present fairly, in all material respects, the financial position of the Virtus Alternatives Diversifier Fund, Virtus Equity Trend Fund, Virtus Global Equity Trend Fund, Virtus Herzfeld Fund, Virtus Multi-Asset Trend Fund, and Virtus Sector Trend Fund (constituting funds within Virtus Opportunities Trust, hereafter referred to as the “Funds”) at September 30, 2016, the results of their operations for the year then ended, the changes in each of their net assets for each of the two years in the period then ended and the financial highlights for each of the periods indicated, in conformity with accounting principles generally accepted in the United States of America. These financial statements and financial highlights (hereafter referred to as “financial statements”) are the responsibility of the Funds’ management. Our responsibility is to express an opinion on these financial statements based on our audits. We conducted our audits of these financial statements in accordance with the standards of the Public Company Accounting Oversight Board (United States). Those standards require that we plan and perform the audit to obtain reasonable assurance about whether the financial statements are free of material misstatement. An audit includes examining, on a test basis, evidence supporting the amounts and disclosures in the financial statements, assessing the accounting principles used and significant estimates made by management, and evaluating the overall financial statement presentation. We believe that our audits, which included confirmation of securities at September 30, 2016 by correspondence with the custodian and brokers, and transfer agent of the investee funds, provide a reasonable basis for our opinion.

Philadelphia, Pennsylvania
November 22, 2016
61
Table of Contents
VIRTUS OPPORTUNITIES TRUST
SEPTEMBER 30, 2016
For the fiscal year ended September 30, 2016, the Funds make the following disclosures for federal income tax purposes. Below is listed the percentages, or the maximum amount allowable, of its ordinary income dividends (“QDI”) to qualify for the lower tax rates applicable to individual shareholders, and the percentage of ordinary income dividends earned by the Funds which qualifies for the dividends received deduction (“DRD”) for corporate shareholders. The actual percentage of QDI and DRD for the calendar year will be designated in year-end tax statements. The Funds designate the amounts below as long-term capital gains dividends (“LTCG”) taxable at a 20% rate, or lower depending on the shareholder’s income ($ reported in thousands). LTCG amounts, if subsequently different, will be designated in the next annual report.
Fund | QDI | DRD | LTCG | |||||||||
Alternatives Diversifier Fund | 100 | % | 100 | % | $ | — | ||||||
Equity Trend Fund | — | — | — | |||||||||
Global Equity Trend Fund | — | — | — | |||||||||
Herzfeld Fund | 34 | 14 | — | |||||||||
Multi-Asset Trend Fund | — | — | — | |||||||||
Sector Trend Fund | 100 | 100 | — | |||||||||
For the fiscal year ended September 30, 2016, certain Funds are disclosing the following information pursuant to notice requirements of Section 853(a) and 855(d) of the Internal Revenue Code, as amended, and the Treasury Regulations thereunder ($ reported in thousands):
| Foreign Source Income Recognized | Foreign Taxes Paid on Foreign Source Income | |||||||
Alternatives Diversifier Fund | $ | 88 | $ | 7 | ||||
Herzfeld Fund | 147 | 9 | ||||||
62
Table of Contents
RESULTS OF SHAREHOLDER MEETING
VIRTUS OPPORTUNITIES TRUST
MAY 19, 2016 (Unaudited)
At a special meeting of shareholders of all series of Virtus Equity Trust, Virtus Insight Trust and Virtus Opportunities Trust, held on May 19, 2016, shareholders of Virtus Opportunities Trust (the “Trust”) voted on the following proposals:
Proposal 1.
| Number of Eligible Votes: | ||||||||||||
| FOR | AGAINST | ABSTAIN | ||||||||||
To elect six Trustees to serve on the Board of Trustees until the next meeting of shareholders at which Trustees are elected. | ||||||||||||
George R. Aylward | 1,145,056,198.477 | 24,756,597.221 | 0 | |||||||||
Thomas J. Brown | 1,144,160,222.050 | 25,652,573.650 | 0 | |||||||||
Donald C. Burke | 1,145,758,834.912 | 24,053,960.790 | 0 | |||||||||
Roger A. Gelfenbien | 1,144,297,795.833 | 25,514,999.865 | 0 | |||||||||
John R. Mallin | 1,144,938,076.292 | 24,874,719.410 | 0 | |||||||||
Hassell H. McClellan | 1,143,864,433.134 | 25,948,362.566 | 0 | |||||||||
Shareholders of the Trust voted to approve the above proposal.
Proposal 2.
| Number of Eligible Votes: | ||||||||||||
| FOR | AGAINST | ABSTAIN | ||||||||||
To approve a proposal to permit Virtus Investment Advisers, Inc., as the investment adviser to all the Funds, to hire and replace subadvisers or to modify subadvisory agreements without shareholder approval. | ||||||||||||
Virtus CA Tax Exempt Bond Fund | 1,258,194.893 | 91,895.368 | 41,271.245 | |||||||||
Virtus Emerging Markets Debt Fund | 3,015,152.206 | 198.283 | 0 | |||||||||
Virtus Emerging Markets Equity Income Fund | 3,672,832.400 | 0 | 0 | |||||||||
Virtus Emerging Markets Opportunities Fund | 620,793,093.034 | 25,302,093.728 | 9,306,937.262 | |||||||||
Virtus Emerging Markets Small-Cap Fund | 494,281.793 | 0 | 0 | |||||||||
Virtus Essential Resources Fund | 504,931.913 | 0 | 0 | |||||||||
Virtus Foreign Opportunities Fund | 27,726,679.250 | 666,663.374 | 564,703.507 | |||||||||
Virtus Greater European Opportunities Fund | 818,457.900 | 37,502.974 | 15,676.215 | |||||||||
Virtus International Small-Cap Fund | 3,074,638.276 | 5,991.041 | 10,261.000 | |||||||||
Virtus International Wealth Masters Fund | 518,044.295 | 0 | 0 | |||||||||
Virtus Low Duration Income Fund | 10,449,114.393 | 779,684.940 | 311,840.943 | |||||||||
Virtus Multi-Sector Intermediate Bond Fund | 11,147,670.008 | 724,253.699 | 406,427.672 | |||||||||
Virtus Multi-Sector Short Term Bond Fund | 618,834,424.483 | 21,316,032.964 | 14,819,955.463 | |||||||||
Shareholders of the Funds listed above voted to approve the above proposal.
Proposal 6.
| Number of Eligible Votes: | ||||||||||||
| FOR | AGAINST | ABSTAIN | ||||||||||
To approve a proposal to amend the fundamental restrictions of the Fundamental Restriction Funds with respect to loans. | ||||||||||||
Virtus Foreign Opportunities Fund | 27,568,524.708 | 741,409.046 | 648,118.377 | |||||||||
Virtus Multi-Sector Short Term Bond Fund | 615,281,810.614 | 22,749,361.497 | 16,939,237.795 | |||||||||
Shareholders of the Funds listed above voted to approve the above proposal.
63
Table of Contents
RESULTS OF SHAREHOLDER MEETING
VIRTUS OPPORTUNITIES TRUST
JULY 18, 2016 (Unaudited)
At a special meeting of shareholders of Virtus Global Equity Trend Fund, Virtus Global Opportunities Fund, Virtus Herzfeld Fund, Virtus International Equity Fund, Virtus Low Volatility Equity Fund, Virtus Real Estate Securities Fund, Virtus Sector Trend Fund, Virtus Wealth Masters Fund, Virtus Alternatives Diversifier Fund, Virtus Equity Trend Fund, Virtus Multi-Asset Trend Fund and Virtus Tax-Exempt Bond Fund, held on July 18, 2016, shareholders of the Funds voted on the following proposals:
Proposal 2.
| Number of Eligible Votes: | ||||||||||||
| FOR | AGAINST | ABSTAIN | ||||||||||
To approve a proposal to permit Virtus Investment Advisers, Inc., as the investment adviser to all the Funds, to hire and replace subadvisers or to modify subadvisory agreements without shareholder approval. | ||||||||||||
Virtus Global Equity Trend Fund | 2,071,338.688 | 221,721.989 | 61,016.655 | |||||||||
Virtus Global Opportunities Fund | 6,475,669.315 | 399,601.579 | 221,211.057 | |||||||||
Virtus Herzfeld Fund | 2,285,754.412 | 134,756.871 | 89,510.278 | |||||||||
Virtus International Equity Fund | 347,976.498 | 45,434.960 | 4,980.529 | |||||||||
Virtus Low Volatility Equity Fund | 234,510.520 | 7,334.000 | 90,835.796 | |||||||||
Virtus Real Estate Securities Fund | 14,196,247.698 | 691,146.713 | 476,502.196 | |||||||||
Virtus Sector Trend Fund | 14,380,526.646 | 1,274,297.224 | 1,097,176.679 | |||||||||
Virtus Wealth Masters Fund | 2,759,756.937 | 182,003.481 | 154,822.394 | |||||||||
Virtus Alternatives Diversifier Fund | 2,054,425.037 | 135,901.800 | 177,500.739 | |||||||||
Virtus Equity Trend Fund | 47,080,228.694 | 3,814,318.119 | 2,960,680.324 | |||||||||
Virtus Multi-Asset Trend Fund | 7,428,521.065 | 660,946.728 | 521,389.418 | |||||||||
Virtus Tax-Exempt Bond Fund | 7,423,225.114 | 802,129.342 | 492,588.498 | |||||||||
Shareholders of Virtus Global Equity Trend Fund, Virtus Global Opportunities Fund, Virtus Herzfeld Fund, Virtus International Equity Fund, Virtus Low Volatility Equity Fund, Virtus Real Estate Securities Fund, Virtus Sector Trend Fund and Virtus Wealth Masters Fund voted to approve the above proposal. Shareholders of Virtus Alternatives Diversifier Fund, Virtus Equity Trend Fund, Virtus Multi-Asset Trend Fund and Virtus Tax-Exempt Bond Fund did not approve the above proposal.
Proposal 6.
| Number of Eligible Votes: | ||||||||||||
| FOR | AGAINST | ABSTAIN | ||||||||||
To approve a proposal to amend the fundamental restrictions of the Fundamental Restriction Funds with respect to loans. | ||||||||||||
Virtus Sector Trend Fund | 14,250,883.760 | 1,251,197.022 | 1,249,922.768 | |||||||||
Virtus Real Estate Securities Fund | 13,928,178.018 | 864,726.603 | 570,992.984 | |||||||||
Shareholders of Virtus Sector Trend Fund voted to approve the above proposal. Shareholders of Virtus Real Estate Securities Fund did not approve the above proposal.
Proposal 7.
| Number of Eligible Votes: | ||||||||||||
| FOR | AGAINST | ABSTAIN | ||||||||||
To approve a proposal to amend the fundamental restrictions of the Fundamental Restriction Funds with respect to loans. | ||||||||||||
Virtus Multi-Sector Short Term Bond Fund | 238,431,276.605 | 411,212,271.419 | 20,011,935.573 | |||||||||
Virtus Real Estate Securities Fund | 9,635,396.247 | 5,113,977.185 | 614,521.174 | |||||||||
Virtus Sector Trend Fund | 9,706,807.226 | 5,648,494.88 | 1,396,703.437 | |||||||||
Shareholders of the Funds listed above did not approve the above proposal.
64
Table of Contents
Information pertaining to the trustees and officers of the Trust as of September 30, 2016, is set forth below. The statement of additional information (SAI) includes additional information about the trustees and is available without charge, upon request, by calling (800) 243-1574. The address of each individual, unless otherwise noted, is 100 Pearl Street, Hartford, CT 06103-4506. There is no stated term of office for trustees of the Trust.
Independent Trustees
| Name, Year of Birth, Year Elected and Number of Funds Overseen | Principal Occupation(s) During Past 5 Years and Other Directorships Held by Trustee | |
| Thomas J. Brown YOB: 1945 Elected: 2016 65 Portfolios | Retired. Trustee (since 2016), Virtus Mutual Fund Complex (52 portfolios) and Virtus Alternative Solutions Trust (4 portfolios); Trustee (since 2011), Virtus Variable Insurance Trust (9 portfolios); Director (since 2010), D’Youville Senior Care Center; and Director (since 2005), VALIC Company Funds (49 portfolios). | |
| Burke, Donald C. YOB: 1961 Elected: 2016 69 Portfolios | Retired. Trustee (since 2016), Virtus Mutual Fund Complex (52 portfolios), Virtus Variable Insurance Trust (9 portfolios) and Virtus Alternative Solutions Trust (4 portfolios); Director (since 2014) closed-end funds managed by Duff & Phelps Investment Management Co. (4 funds); Director, Avista Corp. (energy company) (since 2011); Trustee, Goldman Sachs Fund Complex (2010 to 2014); and Director, BlackRock Luxembourg and Cayman Funds (2006 to 2010). | |
Roger A. Gelfenbien YOB: 1943 Elected: 2016 65 Portfolios | Retired. Trustee (since 2016), Virtus Mutual Fund Complex (52 portfolios) and Virtus Alternative Solutions Trust (4 portfolios); Trustee (since 2000), Virtus Variable Insurance Trust (9 portfolios); and Director (since 1999), USAllianz Variable Insurance Product Trust (42 portfolios). | |
| John R. Mallin YOB: 1950 Elected: 2016 65 Portfolios | Partner/Attorney (since 2003), McCarter & English LLP (law firm), Real Property Practice Group; and Member (since 2014), Counselors of Real Estate. Trustee (since 2016), Virtus Mutual Fund Complex (52 portfolios) and Virtus Alternative Solutions Trust (4 portfolios); Director (since 2013), Horizon, Inc. (non-profit); and Trustee (since 1999), Virtus Variable Insurance Trust (9 portfolios). | |
McClellan, Hassell H. YOB: 1945 Elected: 2015 65 Portfolios | Retired (since 2013); and Professor (1984 to 2013), Wallace E. Carroll School of Management, Boston College. Trustee (since 2016), Virtus Alternative Solutions Trust (4 portfolios); Trustee (since 2015), Virtus Mutual Fund Complex (52 portfolios); and Director (since 2010), Barnes Group, Inc. (diversified global components manufacturer and logistical services company); Trustee, Virtus Variable Insurance Trust (9 portfolios) (since 2008); and Trustee, John Hancock Fund Complex (since 2000) (collectively, 228 portfolios). | |
| McLoughlin, Philip YOB: 1946 Elected: 1999 74 Portfolios | Retired. Director and Chairman (since 2016), The Zweig Fund and Virtus Global Dividend & Income Fund Inc.; Trustee and Chairman (since 2013), Virtus Alternative Solutions Trust (4 portfolios); Trustee/Director and Chairman (since 2011), Virtus Closed-End Funds (3 funds); Chairman and Trustee (since 2003), Virtus Variable Insurance Trust (9 portfolios); Director (since 1995), closed-end funds managed by Duff & Phelps Investment Management Co. (4 funds); Director (since 1991) and Chairman (since 2010), Lazard World Trust Fund (closed-end investment firm in Luxembourg); and Trustee (since 1989) and Chairman (since 2002), Virtus Mutual Fund Complex (52 portfolios). | |
McNamara, Geraldine M. YOB: 1951 Elected: 2001 69 Portfolios | Retired. Trustee (since 2016) Virtus Alternative Solutions Trust (4 portfolios); Trustee (since 2015), Virtus Variable Insurance Trust (9 portfolios); Director (since 2003), closed-end funds managed by Duff & Phelps Investment Management Co. (4 funds); and Trustee (since 2001), Virtus Mutual Fund Complex (52 portfolios). | |
| Oates, James M. YOB: 1946 Elected: 2000 70 Portfolios | Managing Director (since 1994), Wydown Group (consulting firm). Director (since 2016), The Zweig Fund and Virtus Global Dividend & Income Fund Inc.; Trustee (since 2016) Virtus Variable Insurance Trust (9 portfolios); Trustee/Director (since 2013), Virtus Closed-End Funds (3 funds); Trustee (since 2013), Virtus Alternative Solutions Trust (4 portfolios); Chairman and Trustee (since 2005), John Hancock Fund Complex (228 portfolios); Director (2002 to 2014), New Hampshire Trust Company; Chairman (since 2000), Emerson Investment Management, Inc.; Non-Executive Chairman (2000 to 2014), Hudson Castle Group, Inc. (formerly IBEX Capital Markets, Inc.) (financial services) Chairman and Director (1999 to 2014), Connecticut River Bank; Director (since 1996), Stifel Financial; and Trustee (since 1987), Virtus Mutual Fund Complex (52 portfolios). | |
Segerson, Richard E. YOB: 1948 Elected: 2000 65 Portfolios | Retired; and Managing Director (1998 to 2013), Northway Management Company. Trustee (since 2016) Virtus Alternative Solutions Trust (4 portfolios) and Virtus Variable Insurance Trust (9 portfolios); and Trustee (since 1983), Virtus Mutual Fund Complex (52 portfolios). | |
| Verdonck, Ferdinand L.J. YOB: 1942 Elected: 2005 65 Portfolios | Vice Chairman (since 2014), Affirmed Therapeutics (biotechnology); Director (1998 to 2015), The J.P. Morgan Continental European Investment Trust; Director (2005 to 2013), Galapagos N.V. (biotechnology); Director (1998 to 2015) Groupe SNEF; and Mr. Verdonck is also a director of several non-U.S. companies. Trustee (since 2016) Virtus Variable Insurance Trust (9 portfolios) and Virtus Alternative Solutions Trust (4 portfolios); and Trustee (since 2002), Virtus Mutual Fund Complex (52 portfolios). | |
65
Table of Contents
FUND MANAGEMENT TABLES (Continued)
Interested Trustee
The individual listed below is an “interested person” of the Trust, as defined in Section 2(a)(19) of the 1940 Act, as amended, and the rules and regulations thereunder.
| Name, Year of Birth, Year Elected and Number of Funds Overseen | Principal Occupation(s) During Past 5 Years and Other Directorships Held by Trustee | |
Aylward, George R.* Trustee and President YOB: 1964 Elected: 2006 70 Portfolios | Director, President and Chief Executive Officer (since 2008), Virtus Investment Partners, Inc. and/or certain of its subsidiaries; various senior officer positions with Virtus affiliates (since 2005). Chairman and Trustee (since 2015), Virtus ETF Trust II; Trustee and President (since 2013), Virtus Alternative Solutions Trust (4 portfolios); Director (since 2013), Virtus Global Funds, PLC (2 portfolios); Trustee (since 2012) and President (since 2010), Virtus Variable Insurance Trust (9 portfolios); Trustee and President (since 2011), Virtus Closed-End Funds (3 funds); Trustee (since 2006), Virtus Mutual Funds (52 portfolios); and Director, President and Chief Executive Officer (since 2006), The Zweig Fund and Virtus Global Dividend & Income Fund Inc. | |
Officers
Name, Address and Year of Birth | Position(s) Held with Trust and Length of Time Served | Principal Occupation(s) During Past 5 Years | ||
Bradley, W. Patrick YOB: 1972 | Executive Vice President (since 2016); Senior Vice President (2013 to 2016); Vice President (2011 to 2013); Chief Financial Officer and Treasurer (since 2006). | Executive Vice President, Fund Services (since 2016), Senior Vice President, Fund Services (2010 to 2016), Virtus Investment Partners, Inc. and/or certain of its subsidiaries; various officer positions (since 2006) with Virtus affiliates; Executive Vice President (since 2016), Senior Vice President (2013 to 2016), Vice President (2011 to 2013), Chief Financial Officer and Treasurer (since 2004), Virtus Variable Insurance Trust; Executive Vice President (since 2016), Senior Vice President (2013 to 2016), Vice President (2011 to 2013), Chief Financial Officer and Treasurer (since 2006), Virtus Mutual Fund Complex; Executive Vice President (since 2016), Senior Vice President (2013 to 2016), Vice President (2012 to 2013) and Treasurer (Chief Financial Officer) (since 2007), The Zweig Fund and Virtus Global Dividend & Income Fund Inc.; Executive Vice President (since 2016), Senior Vice President (2013 to 2016), Vice President (2011 to 2013), Chief Financial Officer and Treasurer (since 2011), Virtus Closed-End Funds; Vice President and Assistant Treasurer (since 2011), Duff & Phelps Global Utility Income Fund Inc.; Director (since 2013), Virtus Global Funds, PLC; and Executive Vice President (since 2016), Senior Vice President, Chief Financial Officer and Treasurer (2013 to 2016), Virtus Alternative Solutions Trust. | ||
Carr, Kevin J. YOB: 1954 | Senior Vice President (since 2013); Vice President (2005 to 2013); Chief Legal Officer, Counsel and Secretary (since 2005). | Senior Vice President (since 2009), Vice President, Counsel and Secretary (2008 to 2009), Virtus Investment Partners, Inc. and/or certain of its subsidiaries; various senior officer positions (since 2005) with Virtus affiliates; Senior Vice President (since 2013), Vice President (2005 to 2013), Chief Legal Officer, Counsel and Secretary (since 2005), Virtus Mutual Fund Complex; Senior Vice President (2013 to 2014), Vice President (2012 to 2013) and Assistant Secretary (since 2012), Secretary and Chief Legal Officer (2005 to 2012), The Zweig Fund and Virtus Global Dividend & Income Fund Inc.; Assistant Secretary (since 2013), Vice President, Chief Legal Officer, Counsel and Secretary (2010 to 2013), Virtus Variable Insurance Trust; Vice President and Assistant Secretary (since 2011), Duff & Phelps Global Utility Income Fund Inc.; Senior Vice President and Assistant Secretary (2013 to 2014), Vice President and Assistant Secretary (2012 to 2013), Vice President, Chief Legal Officer, Counsel and Secretary (2011 to 2012), Virtus Closed-End Funds; and Assistant Secretary (since 2013), Virtus Alternative Solutions Trust. | ||
Engberg, Nancy J. YOB: 1956 | Vice President and Chief Compliance Officer since 2011. | Vice President (since 2008) and Chief Compliance Officer (2008 to 2011 and since 2016), Virtus Investment Partners, Inc. and/or certain of its subsidiaries; various officer positions (since 2003) with Virtus affiliates; Vice President and Chief Compliance Officer (since 2011), Virtus Mutual Fund Complex; Vice President (since 2010) and Chief Compliance Officer (since 2011), Virtus Variable Insurance Trust; Vice President and Chief Compliance Officer (since 2011), Virtus Closed-End Funds; Vice President and Chief Compliance Officer (since 2012), The Zweig Fund and Virtus Global Dividend & Income Fund Inc.; Vice President and Chief Compliance Officer (since 2013), Virtus Alternative Solutions Trust; Chief Compliance Officer (since 2015), ETFis Series Trust I; and Chief Compliance Officer (since 2015), Virtus ETF Trust II. | ||
Waltman, Francis G. YOB: 1962 | Executive Vice President (since 2013); Senior Vice President (2008-2013). | Executive Vice President, Product Development (since 2009), Virtus Investment Partners, Inc. and/or certain of its subsidiaries; various senior officer positions (since 2006) with Virtus affiliates; Executive Vice President (since 2013), Senior Vice President (2008 to 2013), Virtus Mutual Fund Complex; Executive Vice President (since 2013), Senior Vice President (2010 to 2013), Virtus Variable Insurance Trust; Executive Vice President (since 2013), Senior Vice President (2011 to 2013), Virtus Closed-End Funds; Director (since 2013), Virtus Global Funds PLC; and Executive Vice President (since 2013), Virtus Alternative Solutions Trust. | ||
66
Table of Contents
Virtus Alternatives Diversifier Fund, Virtus Equity Trend Fund, Virtus Global Equity Trend Fund, Virtus Multi-Asset Trend Fund and Virtus Sector Trend Fund, each a series of Virtus Opportunities Trust
Supplement dated September 7, 2016 to the Summary and Statutory Prospectuses dated January 28, 2016
IMPORTANT NOTICETO INVESTORS
As approved by the Board of Trustees of Virtus Opportunities Trust, effective September 7, 2016, the funds’ current subadviser, Euclid Advisors LLC (“Euclid”) is removed as subadviser. Accordingly, effective September 7, 2016, all references to Euclid as subadviser to the funds, and to David Dickerson, Carlton Neel and Amy Robinson as portfolio managers, are hereby removed from the funds’ prospectuses. Virtus Investment Advisers, Inc., the funds’ investment adviser, will continue to serve as investment adviser and will be responsible for the day-to-day management of the funds.
Additional disclosure changes resulting from the removal of the subadviser are described below and are also effective September 7, 2016.
Virtus Alternatives Diversifier Fund
The disclosure under “Portfolio Management” in the summary prospectuses and in the summary section of the statutory prospectus is hereby replaced with the following:
| > | Warun Kumar, Senior Managing Director and Portfolio Manager at VIA, is a manager of the fund. Mr. Kumar has served as a Portfolio Manager of the fund since September 2016. |
Virtus Equity Trend Fund, Virtus Global Equity Trend Fund, Virtus Multi-Asset Trend Fund and Virtus Sector Trend Fund
The disclosure under “Portfolio Management” in the summary prospectuses and in the summary section of the statutory prospectus is hereby replaced with the following:
| > | Michael Davis, a Managing Director at VIA is a manager of the fund. Mr. Davis has served as a Portfolio Manager of the fund since September 2016. |
| > | Brendan R. Finneran, Managing Director and Equity Trader at VIA, is a manager of the fund. Mr. Finneran has served as a Portfolio Manager of the fund since September 2016. |
| > | Robert F. Hofeman, Jr., Managing Director and Equity Trader at VIA, is a manager of the fund. Mr. Hofeman has served as a Portfolio Manager of the fund since September 2016. |
| > | Warun Kumar, Senior Managing Director and Portfolio Manager at VIA, is a manager of the fund. Mr. Kumar has served as a Portfolio Manager of the fund since May 2015. |
All Funds
Under “The Adviser” on page 179 of the statutory prospectus, the following disclosure replaces the second sentence of the third paragraph: “For Virtus Alternatives Diversifier Fund, Virtus Equity Trend Fund, Virtus Global Equity Trend Fund, Virtus Multi-Asset Trend Fund and Virtus Sector Trend Fund, VIA is responsible for the day-to-day management of the fund’s investments and manages the investments of the fund to conform with its investment policies as described in this prospectus.”
Additionally, the table in this section is hereby amended by deleting the rows for Virtus Alternatives Diversifier Fund, Virtus Equity Trend Fund, Virtus Global Equity Trend Fund, Virtus Multi-Asset Trend Fund and Virtus Sector Trend Fund.
Under “The Subadvisers” on page 182 of the statutory prospectus, the table showing subadvisory fees is hereby amended by deleting the rows for Virtus Alternatives Diversifier Fund, Virtus Equity Trend Fund, Virtus Global Equity Trend Fund, Virtus Multi-Asset Trend Fund and Virtus Sector Trend Fund.
Table of Contents
In the section “Portfolio Management” on page 188 of the statutory prospectus, the section under the subheading “VIA” is hereby replaced in its entirety with the following:
| Virtus Alternatives Diversifier Fund | Warun Kumar (since September 2016) | |
| Virtus Equity Trend Fund | Michael Davis (since September 2016) Brendan R. Finneran (since September 2016) Robert F. Hofeman, Jr. (since September 2016) Warun Kumar (since May 2015) | |
| Virtus Global Equity Trend Fund | Michael Davis (since September 2016) Brendan R. Finneran (since September 2016) Robert F. Hofeman, Jr. (since September 2016) Warun Kumar (since May 2015) | |
| Virtus Multi-Asset Trend Fund | Michael Davis (since September 2016) Brendan R. Finneran (since September 2016) Robert F. Hofeman, Jr. (since September 2016) Warun Kumar (since May 2015) | |
| Virtus Sector Trend Fund | Michael Davis (since September 2016) Brendan R. Finneran (since September 2016) Robert F. Hofeman, Jr. (since September 2016) Warun Kumar (since May 2015) |
Michael Davis. Mr. Davis is a Managing Director at Virtus Investment Advisers (since 2014) and has over 15 years of experience in the financial services industry, including investment management and capital markets. Prior to joining Virtus in 2014, he was a founding partner of Varick Asset Management, an independent alternative manager focused on the development of innovative portfolio solutions and investment strategies. Before forming Varick, Mr. Davis worked in the institutional asset management division of Barclays Capital, focused on quantitative and derivative-based investment strategies. Prior to Barclays, he worked in the derivative structuring group at Lehman Brothers. Mr. Davis started his career at Merrill Lynch in the asset-backed finance business.
Brendan R. Finneran. Mr. Finneran serves as Managing Director and Equity Trader at VIA (since September 2016) and has served in the same capacity at Rampart Investment Management Company, LLC, an affiliate of VIA (since July 2008) Mr. Finneran has 12 years of investment experience. Prior to Rampart, he was trader and operations manager at Andover Capital Advisors (2003 to 2008), where he was responsible for operational account management (processing and settlement) for all equity, option, bond, bank debt, CDS and swap trades. Prior to Andover Capital Advisors, Mr. Finneran held various positions at Cone Jacquards and Robert Fleming as Account Manager.
Robert F. Hofeman, Jr. Mr. Hofeman serves as Managing Director and Equity Trader at VIA (since September 2016) and has served in the same capacity at Rampart Investment Management Company, LLC, an affiliate of VIA (since May 2012). Mr. Hofeman has more than 12 years of investment experience. Prior to Rampart, he was an equity trading consultant for Linedata (2010 to 2012) where he translated buy-side business processes to the technology staff. Previously, Mr. Hofeman was a vice president of Evergreen Investments (2007 to 2009), where he traded stocks, options and futures, and was the primary trader at Ironwood Investment Management, LLC (2002 to 2007), focusing on small cap stocks and assisting with the research processes.
Warun Kumar. Mr. Kumar is Senior Managing Director and Portfolio Manager at VIA (since April 2015), and Portfolio Manager at Virtus Alternative Investment Advisers, Inc., an affiliate of VIA (since May 2014). He also serves as the Chief Investment Officer for Rampart Investment Management LLC, an affiliate of VIA (since October 2015). Before joining Virtus, Mr. Kumar was founder and managing partner of Varick Asset Management, an independent alternative manager focused on the development of innovative portfolio solutions and investment strategies for high net worth investors and institutional clients (2010 to 2014). Prior to forming Varick, Mr. Kumar was the U.S. head of Barclays Capital Fund Solutions, where he led the investment committee and managed business expansion throughout the Americas (2007 to 2010). Mr. Kumar’s investment management career began at Volaris Advisors, where he was a partner and headed the derivative advisory business. In addition to these roles, Mr. Kumar has held senior positions in the capital markets divisions of Lehman Brothers and Robertson Stephens, and was a founding partner of Sigma Advisors, an alternative investment advisory firm. Mr. Kumar began his financial services career in 1993 as a member of JP Morgan’s equity derivatives business.
All other disclosure concerning the fund, including fees and expenses, remains unchanged from the prospectuses dated January 28, 2016.
Investors should retain this supplement with the Prospectuses for future reference.
VOT 8020/AltDivTrendFundsVIAChanges (9/2016)
Table of Contents
VIRTUS OPPORTUNITIES TRUST
101 Munson Street
Greenfield, MA 01301-9668
Trustees
George R. Aylward
Thomas J. Brown
Donald C. Burke
Roger A. Gelfenbein
John R. Mallin
Hassell H. McClellan
Philip R. McLoughlin, Chairman
Geraldine M. McNamara
James M. Oates
Richard E. Segerson
Ferdinand L.J. Verdonck
Officers
George R. Aylward, President
Francis G. Waltman, Executive Vice President
W. Patrick Bradley, Executive Vice President, Chief Financial Officer and Treasurer
Kevin J. Carr, Senior Vice President, Chief Legal Officer, Counsel and Secretary
Nancy J. Engberg, Vice President and Chief Compliance Officer
Investment Adviser
Virtus Investment Advisers, Inc.
100 Pearl Street
Hartford, CT 06103-4506
Principal Underwriter
VP Distributors, LLC
100 Pearl Street
Hartford, CT 06103-4506
Administrator and Transfer Agent
Virtus Fund Services, LLC
100 Pearl Street
Hartford, CT 06103-4506
Custodian
JPMorgan Chase Bank, NA
1 Chase Manhattan Plaza
New York, NY 10005-1401
Independent Registered Public
Accounting Firm
PricewaterhouseCoopers LLP
2001 Market Street
Philadelphia, PA 19103-7042
How to Contact Us
Mutual Fund Services | 1-800-243-1574 | |
Adviser Consulting Group | 1-800-243-4361 | |
Website | Virtus.com |
Important Notice to Shareholders
The Securities and Exchange Commission has modified mailing regulations for semiannual and annual shareholder fund reports to allow mutual fund companies to send a single copy of these reports to shareholders who share the same mailing address. If you would like additional copies, please call Mutual Fund Services at 1-800-243-1574.
Table of Contents
| ||
P.O. Box 9874 Providence, RI 02940-8074 |

For more information about Virtus Mutual Funds,
please call your financial representative, or contact us
at 1-800-243-1574 or Virtus.com
| 8454 | 11-16 |
Table of Contents

ANNUAL REPORT
Virtus Multi-Sector Short Term Bond Fund
September 30, 2016
TRUST NAME: VIRTUS OPPORTUNITIES TRUST
Not FDIC Insured
No Bank Guarantee
May Lose Value

Table of Contents
Virtus Multi-Sector Short Term Bond Fund
(“Multi-Sector Short Term Bond Fund”)
| 1 | ||||
| 2 | ||||
| 4 | ||||
| 6 | ||||
| 9 | ||||
| 39 | ||||
| 40 | ||||
| 41 | ||||
| 42 | ||||
| 46 | ||||
| 58 | ||||
| 59 | ||||
| 60 | ||||
| 62 |
PROXY VOTING PROCEDURES AND VOTING RECORD (FORM N-PX)
The subadviser votes proxies relating to portfolio securities in accordance with procedures that have been approved by the Board of Trustees of the Trust (“Trustees,” or the “Board”). You may obtain a description of these procedures, along with information regarding how the Fund voted proxies during the most recent 12-month period ended June 30, free of charge, by calling toll-free 1-800-243-1574. This information is also available through the Securities and Exchange Commission’s (the “SEC”) website at http://www.sec.gov.
FORM N-Q INFORMATION
The Trust files a complete schedule of portfolio holdings for the Fund with the SEC for the first and third quarters of each fiscal year on Form N-Q. Form N-Q is available on the SEC’s website at http://www.sec.gov. Form N-Q may be reviewed and copied at the SEC’s Public Reference Room. Information on the operation of the SEC’s Public Reference Room can be obtained by calling toll-free 1-800-SEC-0330.
This report is not authorized for distribution to prospective investors in the Virtus Multi-Sector Short Term Bond Fund unless preceded or accompanied by an effective prospectus which includes information concerning the sales charge, the Fund’s record and other pertinent information.
Table of Contents
To My Fellow Shareholders of Virtus Mutual Funds:
 | I am pleased to present this annual report that reviews the performance of your fund for the 12 months ended September 30, 2016.
During the first half of the fiscal year, global equity markets were challenged by falling oil prices, China’s slowdown, and concerns over the Federal Reserve’s (“the Fed”) first rate hike in nine years, which occurred in December 2015. Equities plummeted in early 2016, but stabilizing oil prices and the Fed’s softened stance on further rate hikes for 2016 sparked a rally in mid-February that lasted until June. The U.K.’s June 23 “Brexit” decision to leave the European Union triggered a selloff that was largely short-lived. Calm was restored by better-than-expected corporate earnings, an improving global economic picture, and reassurance that the world’s central banks would continue to provide monetary stimulus. By | |
the end of September, U.S. equity markets had recovered much of their losses, and the 12-month period was positive for many asset classes.
For the 12 months ended September 30, 2016, U.S. small-cap stocks kept pace with U.S. large-cap stocks, as measured by the 15.47% and 15.43% returns of the Russell 2000® Index and S&P 500® Index, respectively. Within international equities, emerging markets significantly outperformed their developed peers, with the MSCI Emerging Markets Index (net) up 16.78%, while the MSCI EAFE® Index (net) returned 6.52%.
Demand for U.S. Treasuries remained strong, driven by foreign investors seeking safe havens and yield in light of the negative interest rate environment in many international economies. On September 30, 2016, the benchmark 10-year U.S. Treasury yielded 1.60% compared with 2.06% one year earlier. For the 12 months ended September 30, 2016, the broader U.S. fixed income market, as represented by the Bloomberg Barclays U.S. Aggregate Bond Index, which tracks Treasuries and other investment-grade debt securities, gained 5.19%, while non-investment grade bonds rose 12.73%, as measured by the Bloomberg Barclays U.S. Corporate High Yield Bond Index.
The strength of the global economy will likely remain a leading concern for markets in the months ahead, and investors will watch with great interest the actions of the Fed and other major central banks. The U.S. economy’s continued growth, as evidenced by recent strong jobs, housing, and consumer spending data, should give investors reason for optimism, but future market direction will be determined largely by the ability of corporations to continue to produce robust earnings.
Market uncertainty is an ever-present reminder of the importance of portfolio diversification, including exposure to both traditional and alternative asset classes. While diversification cannot guarantee a profit or prevent a loss, owning a variety of asset classes may cushion your portfolio against inevitable market fluctuations. Your financial advisor can help you ensure that your portfolio is adequately diversified across asset classes and investment strategies.
As always, thank you for entrusting Virtus with your assets. Should you have questions about your account or require assistance, please visit our website at Virtus.com, or call our customer service team at 1-800-243-1574. We appreciate your business and remain committed to your long-term financial success. | ||
Sincerely,
George R. Aylward President, Virtus Mutual Funds
October 2016
Performance data quoted represents past results. Past performance is no guarantee of future results, and current performance may be higher or lower than the performance shown above. | ||

1
Table of Contents
VIRTUS MULTI-SECTOR SHORT TERM BOND FUND
DISCLOSURE OF FUND EXPENSES (Unaudited)
FOR THE SIX-MONTH PERIOD OF APRIL 1, 2016 TO SEPTEMBER 30, 2016
We believe it is important for you to understand the impact of costs on your investment. All mutual funds have operating expenses. As a shareholder of the Virtus Multi-Sector Short Term Bond Fund (the “Fund”) you may incur two types of costs: (1) transaction costs, including sales charges on purchases of Class A shares and contingent deferred sales charges on Class B and Class T shares; and (2) ongoing costs, including investment advisory fees, distribution and service fees, and other expenses. Class C shares are sold without a sales charge. Class I shares are sold without a sales charge and do not incur distribution and service fees. For further information regarding applicable sales charges, see Note 1 in the Notes to Financial Statements. These examples are intended to help you understand your ongoing costs (in dollars) of investing in the Fund and to compare these costs with the ongoing costs of investing in other mutual funds. These examples are based on an investment of $1,000 invested at the beginning of the period and held for the entire six-month period. The following Expense Table illustrates your Fund’s costs in two ways.
Actual Expenses
The first section of the accompanying table provides information about actual account values and actual expenses. You may use the information in this section, together with the amount you invested, to estimate the expenses that you paid over the period. Simply divide your account value by $1,000 (for example, an $8,600 account value divided by $1,000 = 8.6), then multiply the result by the number in the first section under the heading “Expenses Paid During Period” to estimate the expenses you paid on your account during the period.
Hypothetical Example for Comparison Purposes
The second section of the accompanying table provides information about hypothetical account values and hypothetical expenses based on the Fund’s actual expense ratio and an assumed rate of return of 5% per year before expenses, which is not your Fund’s actual return. The hypothetical account values and expenses may not be used to estimate the actual ending account balance or expenses you paid for the period. You may use this information to compare the ongoing costs of investing in your Fund and other funds. To do so, compare these 5% hypothetical examples with the 5% hypothetical examples that appear in the shareholder reports of the other funds.
Please note that the expenses shown in the accompanying table are meant to highlight your ongoing costs only and do not reflect any transactional costs, such as sales charges or contingent deferred sales charges. Therefore, the second section of the accompanying table is useful in comparing ongoing costs only, and will not help you determine the relative total costs of owning different funds. In addition, if these transactional costs were included, your costs would have been higher. The calculations assume no shares were bought or sold during the period. Your actual costs may have been higher or lower, depending on the amount of your investment and the timing of any purchases or redemptions.
2
Table of Contents
VIRTUS MULTI-SECTOR SHORT TERM BOND FUND
DISCLOSURE OF FUND EXPENSES (Unaudited) (Continued)
FOR THE SIX-MONTH PERIOD OF APRIL 1, 2016 TO SEPTEMBER 30, 2016
| Expense Table | ||||||||||||||||
| Beginning Account Value April 1, 2016 | Ending Account Value September 30, 2016 | Annualized Expense Ratio | Expenses Paid During Period* | |||||||||||||
Actual | ||||||||||||||||
| Class A | $ | 1,000.00 | $ | 1,043.00 | 1.01 | % | $ | 5.16 | ||||||||
| Class B | 1,000.00 | 1,040.70 | 1.51 | 7.70 | ||||||||||||
| Class C | 1,000.00 | 1,041.10 | 1.26 | 6.43 | ||||||||||||
| Class T | 1,000.00 | 1,040.80 | 1.76 | 8.98 | ||||||||||||
| Class I | 1,000.00 | 1,044.30 | 0.76 | 6.44 | ||||||||||||
Hypothetical (5% return before expenses) |
| |||||||||||||||
| Class A | 1,000.00 | 1,019.95 | 1.01 | 5.10 | ||||||||||||
| Class B | 1,000.00 | 1,017.45 | 1.51 | 7.62 | ||||||||||||
| Class C | 1,000.00 | 1,018.70 | 1.26 | 6.36 | ||||||||||||
| Class T | 1,000.00 | 1,016.20 | 1.76 | 8.87 | ||||||||||||
| Class I | 1,000.00 | 1,018.70 | 0.76 | 6.36 | ||||||||||||
| * | Expenses are equal to the Fund’s annualized expense ratio, which is net of waived fees and reimbursed expenses, if applicable, multiplied by the average account value over the period, multiplied by the number of days (183) expenses were accrued in the most recent fiscal half-year, then divided by 366 to reflect the one-half year period. |
| The Fund may invest in other funds, and the annualized expense ratios noted above do not reflect fees and expenses associated with the underlying funds. If such fees and expenses were included, the expenses would have been higher. |
| You can find more information about the Fund’s expenses in the Financial Statements section that follows. For additional information on operating expenses and other shareholder costs, refer to the prospectus. |
3
Table of Contents
VIRTUS MULTI-SECTOR SHORT TERM BOND FUND
SEPTEMBER 30, 2016 (Unaudited)
Bank of Japan (“BOJ”)
The Bank of Japan is the Japanese Central Bank.
BofA Merrill Lynch 1–3 Year A–BBB US Corporate Index
The BofA Merrill Lynch 1–3 Year A–BBB US Corporate Index measures performance of U.S. investment grade corporate bond issues rated “BBB” and “A” by Standard & Poor’s/Moody’s with maturities between one and three years. The index is calculated on a total return basis. The index is unmanaged, its returns do not reflect any fees, expenses, or sales charges and it is not available for direct investment.
Bloomberg Barclays U.S. Aggregate Bond Index
The Bloomberg Barclays U.S. Aggregate Bond Index measures the U.S. investment-grade fixed-rate bond market. The index is calculated on a total return basis. The index is unmanaged, its returns do not reflect any fees, expenses, or sales charges, and it is not available for direct investment.
Bloomberg Barclays U.S. Corporate High Yield Bond Index
The Bloomberg Barclays U.S. Corporate High Yield Bond Index measures the U.S. dollar-denominated, high yield, fixed-rate corporate bond market. The index is calculated on a total return basis. The index is unmanaged, its returns do not reflect any fees, expenses, or sales charges, and it is not available for direct investment.
European Central Bank (“ECB”)
The European Central Bank (ECB) is responsible for conducting monetary policy for the eurozone. The ECB was established as the core of the Eurosystem and the European System of Central Banks (ESCB). The ESCB comprises the ECB and the national central banks (NCBs) of all 17 European Union Member States whether they have adopted the Euro or not.
Exchange-Traded Funds (ETF)
An open-end fund that is traded on a stock exchange. Most ETFs have a portfolio of stocks or bonds that track a specific market index.
Federal Reserve (the “Fed”)
The Central Bank of the United States, responsible for controlling the money supply, interest rates and credit with the goal of keeping the U.S. economy and currency stable. Governed by a seven-member board, the system includes 12 regional Federal Reserve Banks, 25 branches and all national and state banks that are part of the system.
MSCI EAFE® Index (net)
The MSCI EAFE® Index (net) is a free float-adjusted market capitalization-weighted index that measures developed foreign market equity performance, excluding the U.S. and Canada. The index is calculated on a total return basis with net dividends reinvested. The index is unmanaged, its returns do not reflect any fees, expenses, or sales charges, and is not available for direct investment.
MSCI Emerging Markets Index (net)
The MSCI Emerging Markets Index (net) is a free float-adjusted market capitalization-weighted index designed to measure equity market performance in the global emerging markets. The
4
Table of Contents
VIRTUS MULTI-SECTOR SHORT TERM BOND FUND
KEY INVESTMENT TERMS (Continued)
SEPTEMBER 30, 2016 (Unaudited)
index is calculated on a total return basis with net dividends reinvested. The index is unmanaged, its returns do not reflect any fees, expenses, or sales charges, and is not available for direct investment.
Real Estate Investment Trust (REIT)
A publicly traded company that owns, develops, and operates income-producing real estate such as apartments, office buildings, hotels, shopping centers, and other commercial properties.
Russell 2000® Index
The Russell 2000® Index is a market capitalization-weighted index of the 2,000 smallest companies in the Russell Universe, which comprises the 3,000 largest U.S. companies. The index is calculated on a total return basis with dividends reinvested. The index is unmanaged, its returns do not reflect any fees, expenses, or sales charges, and is not available for direct investment.
S&P 500® Index
The S&P 500® Index is a free-float market capitalization-weighted index of 500 of the largest U.S. companies. The index is calculated on a total return basis with dividends reinvested. The index is unmanaged, its returns do not reflect any fees, expenses, or sales charges, and it is not available for direct investment.
5
Table of Contents
MULTI-SECTOR SHORT TERM BOND FUND
Portfolio Manager Commentary by Newfleet Asset Management, LLC | Ticker Symbols: Class A: NARAX Class B: PBARX Class C: PSTCX Class T: PMSTX Class I: PIMSX |
| ⬛ | The Fund is diversified and has an investment objective of providing high current income while attempting to limit changes in the Fund’s net asset value per share caused by interest rate changes. |
| ⬛ | For the fiscal year ended September 30, 2016, the Fund’s Class A shares at NAV returned 4.90%; Class B shares returned 4.41%; Class C shares returned 4.58%; Class T shares returned 4.29%; and Class I shares returned 4.94%*. For the same period, the Bloomberg Barclays U.S. Aggregate Bond Index, a broad-based fixed income index, returned 5.19%; and the BofA Merrill Lynch 1–3 Year A–BBB US Corporate Index, the Fund’s style-specific index appropriate for comparison, returned 2.63%. |
*See footnote 7 on page 8
All performance figures assume reinvestment of distributions and exclude the effect of sales charges. Past performance is no guarantee of future results, and current performance may be higher or lower than the performance shown.
How did the market perform during the Fund’s fiscal year?
| ⬛ | Most fixed income spread sectors outperformed U.S. Treasuries during the fiscal year. The U.S. Federal Reserve’s (“the Fed”) dovish stance in mid-February sparked a rally that turned around a volatile time period that began with fresh concerns over China, plummeting oil prices, and fears that the Fed had raised rates too soon. |
| ⬛ | Late in June volatility returned briefly with fallout from the U.K.’s unexpected decision to leave the European Union (”Brexit”). Bond yields in the U.S., Japan, and across Europe fell to historic lows in early July as investors fled to the safety of bonds on global growth concerns fueled by the June 23 Brexit decision. Markets recovered rather quickly however from the initial shock. Easing by major |
central banks and a weaker U.S. dollar helped to improve global risk sentiment and stabilize markets. |
| ⬛ | September brought heightened concerns over the ability and willingness of global central banks to fight chronic low inflation and weak growth as the decision by the European Central Bank (“ECB”) to leave interest rates and its stimulus program unchanged was a precipitating factor in a widespread market sell-off, reinforced by fears that the Bank of Japan (“BOJ”) had run out of quantitative easing tools. Hawkish signals from the Fed added to the volatility. The BOJ subsequently decided not to reduce interest rates further but to shift its focus to stabilizing rates for longer maturity government bonds. This bolstered market sentiment, as did the Fed’s eventual decision to stand pat at its September monetary policy meeting. |
| ⬛ | Over the last 12 months, U.S. Treasury yields increased for shorter term bonds while yields decreased for intermediate to longer term bonds. |
What factors affected the Fund’s performance during its fiscal year?
| ⬛ | The underperformance of U.S. Treasuries relative to most fixed income spread sectors was the key driver of the Fund’s outperformance for the fiscal year. |
| ⬛ | The Fund’s allocation to corporate high yield and emerging market high yield securities were the largest positive contributors to performance for the fiscal year. |
| ⬛ | The Fund’s allocation to asset-backed securities and commercial mortgage-backed securities detracted from performance. |
The preceding information is the opinion of portfolio management only through the end of the period stated on the cover. Any such opinions are subject to change at any time based upon market or other conditions and should
For information regarding the indexes and certain investment terms, see the Key Investment Terms on page 4.
6
Table of Contents
| MULTI-SECTOR SHORT TERM BOND FUND (Continued) |
not be relied upon as investment advice. Past performance is no guarantee of future results, and there is no guarantee that market forecasts will be realized.
There is no guarantee that the Fund will meet its objective.
Credit & Interest: Debt securities are subject to various risks, the most prominent of which are credit and interest rate risk. The issuer of a debt security may fail to make interest and/or principal payments. Values of debt securities may rise or fall in response to changes in interest rates, and this risk may be enhanced with longer-term maturities.
Foreign & Emerging Markets: Investing internationally, especially in emerging markets, involves additional risks such as currency, political, accounting, economic, and market risk.
High Yield-High Risk Fixed Income Securities: There is a greater level of credit risk and price volatility involved with high yield securities than investment grade securities.
ABS/MBS: Changes in interest rates can cause both extension and prepayment risks for asset- and mortgage-backed securities. These securities are also subject to risks associated with the repayment of underlying collateral.
Bank Loans: Loans may be unsecured or not fully collateralized, may be subject to restrictions on resale and/or trade infrequently on the secondary market. Loans can carry significant credit and call risk, can be difficult to value and have longer settlement times than other investments, which can make loans relatively illiquid at times.
Prospectus: For additional information on risks, please see the Fund’s prospectus.
| Asset Allocations | ||||||||
The following table presents the portfolio holdings within certain sectors as a percentage of total investments as of September 30, 2016.
|
| |||||||
Corporate Bonds and Notes | 35 | % | ||||||
Financials | 13 | % | ||||||
Energy | 6 | |||||||
Industrials | 4 | |||||||
All other Corporate Bonds and Notes | 12 | |||||||
Mortgage-Backed Securities | 25 | |||||||
Asset-Backed Securities | 19 | |||||||
Loan Agreements | 12 | |||||||
Foreign Government Securities | 6 | |||||||
Other | 3 | |||||||
|
| |||||||
Total | 100 | % | ||||||
|
| |||||||
For information regarding the indexes and certain investment terms, see the Key Investment Terms on page 4.
7
Table of Contents
| MULTI-SECTOR SHORT TERM BOND FUND (Continued) |
| Average Annual Total Returns1 for periods ended 9/30/16 | ||||||||||||||||||||
| 1 Year | 5 Years | 10 Years | Since Inception | Inception Date | ||||||||||||||||
| Class A Shares at NAV2 | 4.90 | % | 3.96 | % | 4.68 | % | — | — | ||||||||||||
| Class A Shares at POP3,4 | 2.54 | 3.49 | 4.44 | — | — | |||||||||||||||
| Class B Shares at NAV2 | 4.41 | 3.42 | 4.16 | — | — | |||||||||||||||
| Class B Shares with CDSC4 | 2.91 | 3.42 | 4.16 | — | — | |||||||||||||||
| Class C Shares at NAV2 | 4.58 | 3.70 | 4.41 | �� | — | — | ||||||||||||||
| Class T Shares at NAV2 and with CDSC4 | 4.29 | 3.19 | 3.90 | — | — | |||||||||||||||
| Class I Shares at NAV2,7 | 4.94 | 4.17 | — | 5.31 | % | 6/6/08 | ||||||||||||||
| Bloomberg Barclays U.S. Aggregate Bond Index | 5.19 | 3.08 | 4.79 | 4.585 | — | |||||||||||||||
| BofA Merrill Lynch 1–3 Year A–BBB US Corporate Index | 2.63 | 2.50 | 3.60 | 3.285 | — | |||||||||||||||
Fund Expense Ratios6: A Shares: 0.97%; B Shares: 1.47%; C Shares: 1.22%; T Shares: 1.72%; I Shares: 0.72%.
All returns represent past performance which is no guarantee of future results. Current performance may be higher or lower than the performance shown. The investment return and principal value of an investment will fluctuate so that an investor’s shares, when redeemed, may be worth more or less than their original cost. The above table and graph below do not reflect the deduction of taxes that a shareholder would pay on fund distributions or the redemption of fund shares. Please visit Virtus.com for performance data current to the most recent month-end.
| 1 | Total returns are historical and include changes in share price and the reinvestment of both dividends and capital gain distributions. |
| 2 | “NAV” (Net Asset Value) total returns do not include the effect of any sales charge. |
| 3 | “POP” (Public Offering Price) total returns include the effect of the maximum front-end 2.25% sales charge. |
| 4 | CDSC (Contingent Deferred Sales Charge) is applied to redemptions of certain classes of shares that do not have a sales charge applied at the time of purchase. CDSC charges for Class B shares decline from 2% to 0% over a three-year period. CDSC charges for certain redemptions of Class A shares made within 18 months of purchase in which a finder’s fee was paid and all redemptions of Class T shares are 1% within the first year and 0% thereafter. |
| 5 | The since inception index returns are from the inception date of Class I shares. |
| 6 | The expense ratios of the Fund are set forth according to the prospectus for the Fund effective January 28, 2016, as supplemented and revised, and may differ from the expense ratios disclosed in the Financial Highlights tables in this report. See the Financial Highlights for more current expense ratios. |
| 7 | Total Return for the report period presented in the table differs from the return in the Financial Highlights. The total return presented in the above table is calculated based on the NAV at which shareholder transactions were processed. The total return presented in the Financial Highlights section of the report is calculated in the same manner, but also takes into account certain adjustments that are necessary under generally accepted accounting principals required in the annual report and semiannual report. |
Growth of $10,000 for periods ended 9/30
This chart assumes an initial investment of $10,000 made on September 30, 2006, for Class A, Class B, Class C and Class T shares including any applicable sales charges or fees. Performance assumes reinvestment of dividends and capital gain distributions.
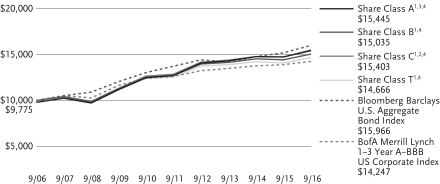
The indexes are unmanaged and not available for direct investment; therefore, their performance does not reflect the expenses associated with active management of an actual portfolio.
8
Table of Contents
VIRTUS MULTI-SECTOR SHORT TERM BOND FUND
SEPTEMBER 30, 2016
($ reported in thousands)
| PAR VALUE | VALUE | |||||||
| U.S. GOVERNMENT SECURITIES—1.3% | ||||||||
U.S. Treasury Note | ||||||||
1.375%, 1/31/21 | $ | 23,135 | $ | 23,388 | ||||
1.250%, 3/31/21 | 60,800 | 61,118 | ||||||
1.625%, 2/15/26 | 12,600 | 12,631 | ||||||
| TOTAL U.S. GOVERNMENT SECURITIES (Identified Cost $96,990) | 97,137 | |||||||
| MUNICIPAL BONDS—0.1% | ||||||||
| Virginia—0.1% | ||||||||
Tobacco Settlement Financing Corp. Series A-1, Taxable 6.706%, 6/1/46 | 4,635 | 3,981 | ||||||
| TOTAL MUNICIPAL BONDS (Identified Cost $4,307) | 3,981 | |||||||
| FOREIGN GOVERNMENT SECURITIES—5.7% | ||||||||
Argentine Republic | ||||||||
144A 6.250%, 4/22/19(3) | 7,200 | 7,636 | ||||||
144A 7.500%, 4/22/26(3) | 12,545 | 14,157 | ||||||
7.875%, 6/15/27(3) | 5,000 | 5,359 | ||||||
Series NY, 8.280%, 12/31/33 | 24,360 | 28,075 | ||||||
Bolivarian Republic of Venezuela | ||||||||
RegS 7.000%, 12/1/18(4) | 20,999 | 14,846 | ||||||
RegS 7.750%, 10/13/19(4) | 19,501 | 12,081 | ||||||
Democratic Socialist Republic of Sri Lanka 144A 6.000%, 1/14/19(3) | 17,450 | 18,042 | ||||||
Federative Republic of Brazil 8.500%, 1/5/24 | 37,050 | BRL | 10,524 | |||||
Treasury Note Series F, 10.000%, 1/1/25 | 37,510 | BRL | 10,958 | |||||
6.000%, 4/7/26 | 10,400 | 11,544 | ||||||
10.250%, 1/10/28 | 13,095 | BRL | 4,087 | |||||
Mongolia | ||||||||
RegS 5.125%, 12/5/22(4) | 4,455 | 3,932 | ||||||
| PAR VALUE | VALUE | |||||||
| FOREIGN GOVERNMENT SECURITIES (continued) | ||||||||
144A 5.125%, 12/5/22(3) | $ | 4,855 | $ | 4,285 | ||||
Provincia de Buenos Aires Argentina 144A 5.750%, 6/15/19(3) | 5,795 | 6,024 | ||||||
Republic of Chile 5.500%, 8/5/20 | 11,647,000 | CLP | 18,840 | |||||
Republic of Colombia | ||||||||
Treasury Note, Series B, 11.250%, 10/24/18 | 21,072,000 | COP | 7,992 | |||||
9.850%, 6/28/27 | 41,350,000 | COP | 17,498 | |||||
Republic of Indonesia Series FR56, 8.375%, 9/15/26 | 386,635,000 | IDR | 32,291 | |||||
Republic of Kazakhstan 144A 5.125%, 7/21/25(3) | 6,495 | 7,320 | ||||||
Republic of Panama 3.875%, 3/17/28 | 10,455 | 11,318 | ||||||
Republic of Romania 144A 6.750%, 2/7/22(3) | 7,000 | 8,442 | ||||||
Republic of South Africa | ||||||||
Series R203, 8.250%, 9/15/17 | 134,520 | ZAR | 9,875 | |||||
Series R208, 6.750%, 3/31/21 | 111,235 | ZAR | 7,718 | |||||
Republic of Turkey | ||||||||
9.000%, 3/8/17 | 30,355 | TRY | 10,167 | |||||
5.625%, 3/30/21 | 16,375 | 17,439 | ||||||
6.250%, 9/26/22 | 25,545 | 28,100 | ||||||
4.875%, 10/9/26 | 6,820 | 6,957 | ||||||
Russian Federation 144A 7.850%, 3/10/18(3) | 1,005,000 | RUB | 15,816 | |||||
State of Qatar 144A 3.250%, 6/2/26(3) | 11,745 | 11,939 | ||||||
Sultanate of Oman | ||||||||
144A 3.625%, 6/15/21(3) | 9,610 | 9,701 | ||||||
144A 4.750%, 6/15/26(3) | 5,295 | 5,314 | ||||||
See Notes to Financial Statements
9
Table of Contents
VIRTUS MULTI-SECTOR SHORT TERM BOND FUND
SCHEDULE OF INVESTMENTS (Continued)
SEPTEMBER 30, 2016
($ reported in thousands)
| PAR VALUE | VALUE | |||||||
| FOREIGN GOVERNMENT SECURITIES (continued) | ||||||||
United Mexican States Series M, 6.500%, 6/9/22 | 512,474 | MXN | $ | 27,296 | ||||
| TOTAL FOREIGN GOVERNMENT SECURITIES (Identified Cost $414,800) | 405,573 | |||||||
| MORTGAGE-BACKED SECURITIES—25.1% | ||||||||
| Agency—5.0% | ||||||||
FHLMC 3.500%, 4/1/46 | $ | 24,048 | 25,370 | |||||
FNMA | ||||||||
5.500%, 1/1/17 | 3 | 3 | ||||||
6.000%, 5/1/17 | 2 | 2 | ||||||
4.500%, 4/1/18 | 46 | 47 | ||||||
5.000%, 10/1/19 | 179 | 185 | ||||||
5.500%, 2/1/20 | 49 | 50 | ||||||
5.500%, 3/1/20 | 17 | 17 | ||||||
5.500%, 3/1/20 | 11 | 11 | ||||||
5.500%, 3/1/20 | 28 | 29 | ||||||
5.500%, 3/1/20 | 56 | 58 | ||||||
5.500%, 4/1/20 | 138 | 145 | ||||||
5.000%, 6/1/20 | 240 | 251 | ||||||
4.000%, 8/1/25 | 8,325 | 8,753 | ||||||
3.000%, 6/1/27 | 908 | 955 | ||||||
2.500%, 5/1/28 | 14,346 | 14,907 | ||||||
3.000%, 10/1/30 | 34,860 | 36,633 | ||||||
3.000%, 10/1/30 | 24,894 | 26,155 | ||||||
2.500%, 2/1/31 | 39,997 | 41,469 | ||||||
3.000%, 2/1/31 | 15,326 | 16,106 | ||||||
6.000%, 12/1/32 | 36 | 41 | ||||||
5.500%, 2/1/33 | 47 | 54 | ||||||
5.500%, 5/1/34 | 271 | 306 | ||||||
6.000%, 8/1/34 | 195 | 227 | ||||||
5.500%, 11/1/34 | 148 | 166 | ||||||
5.500%, 11/1/34 | 138 | 155 | ||||||
6.000%, 11/1/34 | 141 | 162 | ||||||
5.500%, 12/1/34 | 101 | 115 | ||||||
5.500%, 1/1/35 | 243 | 277 | ||||||
5.500%, 7/1/37 | 3 | 4 | ||||||
6.000%, 7/1/37 | 34 | 39 | ||||||
6.000%, 4/1/38 | 147 | 168 | ||||||
5.000%, 12/1/39 | 5,341 | 5,987 | ||||||
4.500%, 4/1/40 | 7,173 | 7,882 | ||||||
5.000%, 8/1/40 | 10,700 | 11,920 | ||||||
4.000%, 10/1/40 | 133 | 142 | ||||||
4.000%, 3/1/41 | 4,989 | 5,377 | ||||||
| PAR VALUE | VALUE | |||||||
| Agency (continued) | ||||||||
4.500%, 5/1/41 | $ | 4,860 | $ | 5,332 | ||||
3.500%, 4/1/42 | 10,446 | 11,064 | ||||||
3.000%, 3/1/43 | 53,775 | 56,101 | ||||||
3.000%, 5/1/43 | 15,633 | 16,290 | ||||||
4.000%, 10/1/44 | 24,662 | 26,495 | ||||||
3.500%, 12/1/45 | 23,492 | 24,785 | ||||||
3.500%, 1/1/46 | 11,114 | 11,726 | ||||||
GNMA | ||||||||
6.500%, 11/15/31 | 19 | 22 | ||||||
6.500%, 2/15/32 | 22 | 25 | ||||||
|
| |||||||
| 356,008 | ||||||||
|
| |||||||
| Non-Agency—20.1% | ||||||||
A-10 Securitization LLC 13-1, A 144A 2.400%, 11/15/25(3) | 56 | 56 | ||||||
ABN AMRO Mortgage Corp. 02-9, M 5.750%, 12/25/32 | 561 | 539 | ||||||
Access Point Financial, Inc. 15-A, A 144A 2.610%, 4/15/20(3) | 4,578 | 4,575 | ||||||
Agate Bay Mortgage Trust 13-1, 144A 3.500%, 7/25/43(2)(3) | 4,945 | 5,080 | ||||||
American Homes 4 Rent 15-SFR1, A 144A 3.467%, 4/17/52(3) | 11,880 | 12,653 | ||||||
Americold LLC Trust 10-ARTA, A1 144A 3.847%, 1/14/29(3) | 7,071 | 7,389 | ||||||
Ameriquest Mortgage Securities, Inc. 03-10, AF6 5.210%, 11/25/33(2) | 616 | 634 | ||||||
Asset Backed Funding Certificates 05-AQ1, A6 4.780%, 6/25/35(2) | 2,024 | 2,083 | ||||||
Aventura Mall Trust 13-AVM, A 144A 3.743%, 12/5/32(2)(3) | 10,350 | 11,121 | ||||||
Banc of America Commercial Mortgage Trust 07-2, A4 5.791%, 4/10/49(2) | 10,813 | 10,869 | ||||||
See Notes to Financial Statements
10
Table of Contents
VIRTUS MULTI-SECTOR SHORT TERM BOND FUND
SCHEDULE OF INVESTMENTS (Continued)
SEPTEMBER 30, 2016
($ reported in thousands)
| PAR VALUE | VALUE | |||||||
| MORTGAGE-BACKED SECURITIES (continued) | ||||||||
| Non-Agency (continued) | ||||||||
Banc of America Funding Trust | ||||||||
04-4, 3A1 4.750%, 10/25/19 | $ | 1,474 | $ | 1,450 | ||||
04-B, 2A1 2.886%, 11/20/34(2) | 676 | 664 | ||||||
05-1, 1A1 5.500%, 2/25/35 | 433 | 434 | ||||||
06-2, 3A1 6.000%, 3/25/36 | 2,130 | 2,193 | ||||||
16- R1, A1 144A | 7,029 | 6,983 | ||||||
Banc of America Mortgage Trust | ||||||||
04-7, 6A3 4.500%, 8/25/19 | 511 | 509 | ||||||
04-11, 5A1 6.500%, 8/25/32 | 819 | 825 | ||||||
04-11, 2A1 5.750%, 1/25/35 | 1,371 | 1,390 | ||||||
05-3, 1A15 5.500%, 4/25/35 | 1,508 | 1,518 | ||||||
Bank of America (Countrywide) Asset-Backed Certificates 05-1, AF5A 5.148%, 7/25/35(2) | 11,078 | 10,985 | ||||||
Bank of America (Merrill Lynch – Countrywide) Alternative Loan Trust 04-22CB, 1A1 6.000%, 10/25/34 | 21,773 | 23,279 | ||||||
Bank of America (Merrill Lynch – Countrywide) Asset-Backed Certificates | ||||||||
04-10, AF6 4.485%, 12/25/34(2) | 404 | 416 | ||||||
05-12, 2A3 5.069%, 2/25/36(2) | 1,243 | 1,247 | ||||||
| PAR VALUE | VALUE | |||||||
| Non-Agency (continued) | ||||||||
Bank of America (Merrill Lynch – Countrywide) Home Loan Mortgage Pass-Through-Trust | ||||||||
04-6, 1A2 3.018%, 5/25/34(2) | $ | 1,350 | $ | 1,337 | ||||
04-4, A6 5.500%, 5/25/34 | 1,008 | 1,019 | ||||||
Bank of America (Merrill Lynch) Mortgage Investors, Inc. 98-C1, B 6.750%, 11/15/26(2) | 9,072 | 9,206 | ||||||
Bank of America (Merrill Lynch) Investors Series 04-A4, A1 2.855%, 8/25/34(2) | 1,523 | 1,541 | ||||||
Barclays (Lehman Brothers) – UBS Commercial Mortgage Trust | ||||||||
07-C2, A3 5.430%, 2/15/40 | 3,857 | 3,888 | ||||||
07-C6, A4 5.858%, 7/15/40(2) | 12,864 | 13,022 | ||||||
07-C7, A3 5.866%, 9/15/45(2) | 10,626 | 11,008 | ||||||
Bayview Commercial Asset Trust 08-1, A3 144A 2.025%, | 22,486 | 21,959 | ||||||
Bayview Financial Acquisition Trust | ||||||||
07-A, 1A2 6.205%, 5/28/37(2) | 6,067 | 6,291 | ||||||
06-A, 1A4 6.087%, 2/28/41(2) | 16,408 | 16,760 | ||||||
BCRR Trust 09-1, 2A 144A 5.858%, 7/17/40(2)(3) | 2,667 | 2,667 | ||||||
Citigroup – Deutsche Bank Commercial Mortgage Trust 07-CD4, A4 5.322%, 12/11/49 | 1,943 | 1,951 | ||||||
See Notes to Financial Statements
11
Table of Contents
VIRTUS MULTI-SECTOR SHORT TERM BOND FUND
SCHEDULE OF INVESTMENTS (Continued)
SEPTEMBER 30, 2016
($ reported in thousands)
| PAR VALUE | VALUE | |||||||
| MORTGAGE-BACKED SECURITIES (continued) | ||||||||
| Non-Agency (continued) | ||||||||
Citigroup Commercial Mortgage Trust | ||||||||
16-A Smpl A 2.228%, 9/10/31 | $ | 3,555 | $ | 3,555 | ||||
07-C6, A1A 5.900%, 12/10/49(2) | 26,033 | 26,515 | ||||||
07-C6, A4 5.900%, 12/10/49(2) | 388 | 395 | ||||||
08-C7, AM 6.333%, 12/10/49(2) | 12,335 | 12,759 | ||||||
10-RR3, MLSR 144A 5.810%, 6/14/50(2)(3) | 3,337 | 3,366 | ||||||
Citigroup Mortgage Loan Trust, Inc. | ||||||||
03-UP3, A2 7.000%, 9/25/33 | 673 | 697 | ||||||
04-UST1, A3 2.704%, 8/25/34(2) | 1,358 | 1,359 | ||||||
04-NCM2, 2CB2 6.750%, 8/25/34 | 10,707 | 11,156 | ||||||
14-A, A 144A 4.000%, | 11,435 | 11,873 | ||||||
05-5, 2A3 5.000%, 8/25/35 | 443 | 443 | ||||||
15-PS1, 144A 3.750%, | 9,916 | 10,259 | ||||||
15-A, A1 144A 3.500%, | 4,327 | 4,415 | ||||||
Colony American Finance Ltd. 15-1 144A 2.896%, 10/15/47(3) | 10,871 | 11,003 | ||||||
Colony Multi-Family Mortgage Trust 14-1, A 144A 2.543%, 4/20/50(3) | 13,595 | 13,556 | ||||||
COLT Mortgage Loan Trust Funding LLC | ||||||||
16-1 A1, 144A 3.000%, 5/25/46(3) | 5,905 | 5,955 | ||||||
16-2, A1 144A 2.750%, | 14,770 | 14,856 | ||||||
Commercial Mortgage Lease-Backed Certificates 01-CMB, 1 144A 7.471%, 6/20/31(2)(3) | 4,080 | 4,625 | ||||||
| PAR VALUE | VALUE | |||||||
| Non-Agency (continued) | ||||||||
Commercial Mortgage Trust | ||||||||
10-C1, D 144A 6.323%, 7/10/46(2)(3) | $ | 6,669 | $ | 7,329 | ||||
07-GG11, AM 5.867%, 12/10/49(2) | 19,989 | 20,631 | ||||||
Credit Suisse Commercial Mortgage Trust | ||||||||
07-C1, A1A 5.361%, 2/15/40 | 19,589 | 19,672 | ||||||
14-LVR2, A2 144A 3.855%, 4/25/44(2)(3) | 11,018 | 11,426 | ||||||
07-C2, A3 5.542%, 1/15/49(2) | 638 | 639 | ||||||
Credit Suisse Commercial Mortgage-Backed Trust 07-C5, A1AM 5.870%, 9/15/40(2) | 21,039 | 19,330 | ||||||
Credit Suisse First Boston Mortgage Securities Corp. | ||||||||
03-27, 5A3 5.250%, 11/25/33 | 1,414 | 1,429 | ||||||
04-8, 7A1 6.000%, 12/25/34 | 5,438 | 5,693 | ||||||
13-HYB1, A16,144A 3.017%, 4/25/43(2)(3) | 6,095 | 6,105 | ||||||
Credit Suisse Mortgage Capital Trust 16-BDWN, A 144A 3.408%, 2/15/29(2)(3) | 2,975 | 2,975 | ||||||
Deutsche Bank – UBS Mortgage Trust 11-LC3A, D 144A 5.510%, 8/10/44(2)(3) | 6,306 | 6,613 | ||||||
Freddie Mac Structured Agency Credit Risk Debt Notes 16-DNA2, M2 2.725%, 10/25/28(2) | 4,705 | 4,782 | ||||||
GAHR Commercial Mortgage Trust 15-NRF, CFX 144A 3.495%, 12/15/34(2)(3) | 16,875 | 17,184 | ||||||
See Notes to Financial Statements
12
Table of Contents
VIRTUS MULTI-SECTOR SHORT TERM BOND FUND
SCHEDULE OF INVESTMENTS (Continued)
SEPTEMBER 30, 2016
($ reported in thousands)
| PAR VALUE | VALUE | |||||||
| MORTGAGE-BACKED SECURITIES (continued) | ||||||||
| Non-Agency (continued) | ||||||||
GMAC Mortgage Corp. Loan Trust | ||||||||
04-AR1, 12A 3.441%, 6/25/34(2) | $ | 6,212 | $ | 6,282 | ||||
05-AR1, 5A 3.287%, 3/18/35(2) | 2,270 | 2,226 | ||||||
Goldman Sachs Mortgage Securities Trust | ||||||||
07-GG10, A4 5.988%, 8/10/45(2) | 18,265 | 18,541 | ||||||
07-GG10, A1A 5.988%, 8/10/45(2) | 2,957 | 3,008 | ||||||
GSAA Home Equity Trust | ||||||||
05-1, AF4 5.619%, 11/25/34(2) | 452 | 467 | ||||||
05-12, AF3W 4.999%, 9/25/35(2) | 4,153 | 4,201 | ||||||
GSR Mortgage Loan Trust 06-1F, 2A4 6.000%, 2/25/36 | 897 | 787 | ||||||
Hilton USA Trust 13-HLT, EFX 144A 5.609%, 11/5/30(2)(3) | 21,980 | 22,014 | ||||||
Home Equity Loan Trust | ||||||||
06-HI1, M1 6.010%, 2/25/36(2) | 1,088 | 1,093 | ||||||
07-HSA3, AI4 6.110%, 6/25/37(2) | 9,928 | 9,988 | ||||||
IMC Home Equity Loan Trust 97-5, A9 7.310%, 11/20/28 | 2,447 | 2,454 | ||||||
Jefferies Resecuritization Trust | ||||||||
14-R1, 1A1 144A 4.000%, 12/27/37(3) | 5,652 | 5,651 | ||||||
14-R1, 2A1 144A 4.000%, 12/27/37(3) | 4,043 | 4,037 | ||||||
JPMorgan Chase (Bear Stearns) Adjustable Rate Mortgage Trust 04-10, 14A1 3.018%, 1/25/35(2) | 1,383 | 1,352 | ||||||
| PAR VALUE | VALUE | |||||||
| Non-Agency (continued) | ||||||||
JPMorgan Chase (Bear Stearns) Commercial Mortgage Securities Trust | ||||||||
06-PW14, AM 5.243%, 12/11/38 | $ | 5,000 | $ | 5,005 | ||||
07- PW17, A4 5.694%, 6/11/50(2) | 19,697 | 20,238 | ||||||
07-PW18, AM, 6.084%, 6/11/50(2) | 12,400 | 12,820 | ||||||
JPMorgan Chase (Washington Mutual) Mortgage Pass-Through Certificates Trust | ||||||||
04-CB1, 5A 5.000%, 6/25/19 | 742 | 751 | ||||||
03-AR6, A1 2.901%, 6/25/33(2) | 860 | 856 | ||||||
03-AR4, 2A1 2.591%, 8/25/33(2) | 265 | 260 | ||||||
04-CB1, 2A 5.000%, 6/25/34 | 2,627 | 2,671 | ||||||
JPMorgan Chase Commercial Mortgage Securities Trust | ||||||||
09-IWST, A1 144A 4.314%, 12/5/27(3) | 4,586 | 4,775 | ||||||
10-CNTR, A2 144A 4.311%, 8/5/32(3) | 7,503 | 8,072 | ||||||
15-SGP, B 144A 3.274%, | 13,925 | 13,949 | ||||||
11-C4, A3 144A 4.106%, | 1,895 | 1,970 | ||||||
06-LDP9, AM 5.372%, 5/15/47 | 24,850 | 24,927 | ||||||
14- C22, A4 3.801%, 9/15/47 | 16,998 | 18,557 | ||||||
07-LDPX, AM 5.464%, 1/15/49(2) | 19,391 | 19,010 | ||||||
07-LD12, A4 5.882%, 2/15/51(2) | 15,899 | 16,246 | ||||||
JPMorgan Chase Mortgage Trust | ||||||||
14-2, 2A2 144A 3.500%, | 10,654 | 10,960 | ||||||
See Notes to Financial Statements
13
Table of Contents
VIRTUS MULTI-SECTOR SHORT TERM BOND FUND
SCHEDULE OF INVESTMENTS (Continued)
SEPTEMBER 30, 2016
($ reported in thousands)
| PAR VALUE | VALUE | |||||||
| MORTGAGE-BACKED SECURITIES (continued) | ||||||||
| Non-Agency (continued) | ||||||||
06-A2, 4A1 3.183%, 8/25/34(2) | $ | 1,594 | $ | 1,597 | ||||
04-A4, 2A1 3.032%, 9/25/34(2) | 5,507 | 5,574 | ||||||
05-A1, 4A1 3.156%, 2/25/35(2) | 713 | 718 | ||||||
05-A2, 4A1 2.670%, 4/25/35(2) | 942 | 924 | ||||||
05-A4, 3A1 2.799%, 7/25/35(2) | 4,175 | 4,122 | ||||||
06-A6, 3A3L 3.229%, 10/25/36(2) | 1,499 | 1,278 | ||||||
14-1, 1A1 144A 4.000%, | 21,482 | 22,663 | ||||||
16-1, M2 144A 3.750%, | 17,266 | 17,837 | ||||||
15-4, 1A4 144A 3.500%, | 11,578 | 11,965 | ||||||
16-2, M2 144A 3.750%, | 17,079 | 17,685 | ||||||
16-1, A3 144A 3.500%, 5/25/46(3) | 13,946 | 14,404 | ||||||
11-C4, A4, 144A 4.388%, | 5,175 | 5,644 | ||||||
JPMorgan Chase Trust | ||||||||
15-1, AM1 144A 2.661%, 12/25/44(2)(3) | 19,626 | 19,579 | ||||||
15-5, A2 144A 2.892%, | 18,593 | 18,892 | ||||||
JPMorgan Mortgage Trust | ||||||||
14-OAK4, A16 144A 4.000%, 9/25/44(2)(3) | 6,173 | 6,344 | ||||||
16-1, A3 144A 3.500%, | 6,980 | 7,243 | ||||||
Key Commercial Mortgage Securities Trust 07-SL1, B 144A 5.897%, 12/15/40(2)(3) | 5,344 | 5,355 | ||||||
MASTR Adjustable Rate Mortgages Trust 04-12, 3A1 3.237%, 11/25/34(2) | 992 | 982 | ||||||
| PAR VALUE | VALUE | |||||||
| Non-Agency (continued) | ||||||||
MASTR Alternative Loan Trust | ||||||||
04-7, 4A1 4.500%, 7/25/19 | $ | 1,833 | $ | 1,848 | ||||
03-8, 2A1 5.750%, 11/25/33 | 5,261 | 5,432 | ||||||
04-4, 6A1 5.500%, 4/25/34 | 2,765 | 2,860 | ||||||
04-6, 7A1 6.000%, 7/25/34 | 5,532 | 5,395 | ||||||
04-7, 9A1 6.000%, 8/25/34 | 12,822 | 13,232 | ||||||
05-2, 2A1 6.000%, 1/25/35 | 3,301 | 3,411 | ||||||
05-2, 1A1 6.500%, 3/25/35 | 9,371 | 9,653 | ||||||
MASTR Asset Securitization Trust 05-1, 1A1 5.000%, 5/25/20 | 407 | 410 | ||||||
Mill City Mortgage Trust | ||||||||
15-1, A3 144A 3.000%, | 11,900 | 12,031 | ||||||
16-1, A1 144A 2.500%, | 4,204 | 4,227 | ||||||
Morgan Stanley – Bank of America (Merrill Lynch) Trust 13-C13, AS 4.266%, 11/15/46 | 1,735 | 1,926 | ||||||
Morgan Stanley Capital Barclays Bank Trust 16-Mart, A 144A 2.200%, 9/13/31(3) | 12,395 | 12,412 | ||||||
Morgan Stanley Capital I Trust | ||||||||
08-T29, AM 6.477%, 1/11/43(2) | 1,610 | 1,682 | ||||||
07-IQ14, A4 5.692%, 4/15/49(2) | 17,390 | 17,579 | ||||||
07-IQ14, AM 5.865%, 4/15/49(2) | 15,932 | 15,410 | ||||||
07- LQ16, A4 5.809%, 12/12/49 | 16,735 | 17,208 | ||||||
See Notes to Financial Statements
14
Table of Contents
VIRTUS MULTI-SECTOR SHORT TERM BOND FUND
SCHEDULE OF INVESTMENTS (Continued)
SEPTEMBER 30, 2016
($ reported in thousands)
| PAR VALUE | VALUE | |||||||
| MORTGAGE-BACKED SECURITIES (continued) | ||||||||
| Non-Agency (continued) | ||||||||
Morgan Stanley Mortgage Loan Trust | ||||||||
04-2AR, 3A 2.643%, 2/25/34(2) | $ | 1,384 | $ | 1,377 | ||||
04-2AR, 4A 2.701%, 2/25/34(2) | 1,067 | 1,073 | ||||||
Morgan Stanley Residential Mortgage Loan Trust 14-1A, A1 144A 2.973%, 6/25/44(2)(3) | 6,637 | 6,727 | ||||||
Motel 6 Trust | ||||||||
15-MTL6, B 144A 3.298%, | 7,775 | 7,769 | ||||||
15-MTL6, D 144A 4.532%, | 1,500 | 1,505 | ||||||
New Residential Mortgage Loan Trust | ||||||||
16-2A, A1 144A 3.750%, 11/25/35(2)(3) | 11,240 | 11,675 | ||||||
14-1A, A 144A 3.750%, | 16,471 | 17,120 | ||||||
14-2A, 3A 144A 3.750%, | 1,869 | 1,941 | ||||||
14-3A, AFX3 144A 3.750%, 11/25/54(2)(3) | 15,115 | 15,644 | ||||||
15-2A, A1 144A 3.750%, | 11,019 | 11,480 | ||||||
16-1A, A1 144A 3.750%, | 9,459 | 9,802 | ||||||
16-3A, A1 144A 3.750%, | 9,755 | 10,176 | ||||||
Nomura Asset Acceptance Corp. 04-R3, A1 144A 6.500%, | 6,882 | 6,772 | ||||||
Novastar Mortgage Funding Trust Series 04-4, M5 2.250%, | 3,556 | 3,471 | ||||||
Residential Accredit Loans, Inc. 05-QS1, A5 5.500%, 1/25/35 | 778 | 777 | ||||||
Residential Asset Mortgage Products Trust 05-SL2, A4 7.500%, 2/25/32 | 1,837 | 1,858 | ||||||
| PAR VALUE | VALUE | |||||||
| Non-Agency (continued) | ||||||||
Residential Asset Mortgage Products, Inc. | ||||||||
04-SL2, A3 7.000%, 10/25/31 | $ | 1,780 | $ | 1,850 | ||||
04-SL1, A8 6.500%, 11/25/31 | 2,133 | 2,161 | ||||||
04-SL4, A3 6.500%, 7/25/32 | 1,231 | 1,247 | ||||||
03-RS8, AI7 5.015%, 9/25/33(2) | 303 | 306 | ||||||
Residential Asset Securitization Trust | ||||||||
03-A11, A9 5.750%, 11/25/33 | 2,473 | 2,508 | ||||||
04-A1, A5 5.500%, 4/25/34 | 11,293 | 11,335 | ||||||
Residential Funding Mortgage Securities I, Inc. 06-S12, 1A1 5.500%, 12/25/21 | 733 | 741 | ||||||
Sequoia Mortgage Trust | ||||||||
13-1, 1A1 1.450%, | 2,372 | 2,304 | ||||||
14-2, A1 144A 4.000%, | 7,590 | 7,895 | ||||||
14-3, A9 144A 3.750%, | 15,981 | 16,590 | ||||||
14-4, A6 144A 3.500%, | 16,870 | 17,373 | ||||||
15-1, A1 144A 3.500%, | 8,281 | 8,514 | ||||||
Structured Adjustable Rate Mortgage Loan Trust | ||||||||
04-4, 3A4 2.993%, 4/25/34(2) | 2,142 | 2,111 | ||||||
04-4, 3A2 2.993%, 4/25/34(2) | 2,776 | 2,755 | ||||||
04-4, 3A1 2.993%, 4/25/34(2) | 628 | 617 | ||||||
04-5, 3A2 2.938%, 5/25/34(2) | 1,250 | 1,264 | ||||||
04-14, 7A 2.938%, 10/25/34(2) | 10,929 | 10,894 | ||||||
See Notes to Financial Statements
15
Table of Contents
VIRTUS MULTI-SECTOR SHORT TERM BOND FUND
SCHEDULE OF INVESTMENTS (Continued)
SEPTEMBER 30, 2016
($ reported in thousands)
| PAR VALUE | VALUE | |||||||
| MORTGAGE-BACKED SECURITIES (continued) | ||||||||
| Non-Agency (continued) | ||||||||
Structured Asset Securities Corp. 03-AL1, A 144A 3.357%, | $ | 7,345 | $ | 7,231 | ||||
Structured Asset Securities Corp. Mortgage-Pass-Through Certificates | ||||||||
02-AL1, A3 3.450%, 2/25/32 | 8,887 | 8,811 | ||||||
03-30, 2A1 5.063%, 10/25/33(2) | 2,798 | 2,844 | ||||||
03-33H, 1A1 5.500%, 10/25/33 | 3,660 | 3,733 | ||||||
03-34A, 6A 3.125%, 11/25/33(2) | 2,555 | 2,512 | ||||||
04-15, 3A3 5.500%, 9/25/34 | 1,895 | 1,907 | ||||||
Towd Point Mortgage Trust | ||||||||
15-1, A2 144A 3.250%, | 8,961 | 9,106 | ||||||
15-3, A1B 144A 3.000%, | 5,324 | 5,436 | ||||||
16-1, A1B, 144A 2.750%, | 8,711 | 8,849 | ||||||
15-5, A1B 144A 2.750%, | 7,524 | 7,606 | ||||||
15-5, A2 144A 3.500%, | 3,901 | 3,943 | ||||||
16-3, A1 144A 2.250%, | 8,141 | 8,137 | ||||||
16-2, A1 144A 3.000%, | 8,468 | 8,644 | ||||||
16-4, A1 144A 2.250%, | 10,905 | 10,951 | ||||||
15-2, 1M1 144A 3.250%, 11/25/60(2)(3) | 6,878 | 6,707 | ||||||
Vericrest Opportunity Loan Transfer | ||||||||
15-NP11, A1 144A 3.625%, 7/25/45(2)(3) | 5,935 | 5,951 | ||||||
16-NPL9, A1 144A 3.500%, 9/25/46(2)(3) | 8,380 | 8,379 | ||||||
15-NPL3, A1 144A 3.375%, 10/25/58(2)(3) | 10,762 | 10,740 | ||||||
| PAR VALUE | VALUE | |||||||
| Non-Agency (continued) | ||||||||
Vericrest Opportunity Loan Trust | ||||||||
16-NPL8, A1 144A 3.500%, 7/25/46(2)(3) | $ | 1,260 | $ | 1,261 | ||||
14-NP10, A1 144A 3.375%, 10/25/54(2)(3) | 1,656 | 1,655 | ||||||
14-NPL9, A1 144A 3.375%, 11/25/54(2)(3) | 5,862 | 5,858 | ||||||
15-NPL4, A1 144A 3.500%, 2/25/55(2)(3) | 2,991 | 2,993 | ||||||
Wells Fargo (Wachovia Bank) Commercial Mortgage Trust | ||||||||
07-C30, A5 5.342%, 12/15/43 | 19,765 | 19,891 | ||||||
07-C30, AM 5.383%, 12/15/43 | 25,695 | 25,925 | ||||||
07-C31, A4 5.509%, 4/15/47 | 4,505 | 4,546 | ||||||
07-31, AM 5.591%, 4/15/47(2) | 34,000 | 34,455 | ||||||
07-C32, A3 5.889%, 6/15/49(2) | 7,432 | 7,555 | ||||||
07-C33, A5 6.158%, 2/15/51(2) | 1,265 | 1,298 | ||||||
Wells Fargo – Royal Bank of Scotland plc Commercial Mortgage Trust 11-C5, C 144A 5.866%, 11/15/44(2)(3) | 2,425 | 2,683 | ||||||
Wells Fargo Mortgage Backed Securities Trust | ||||||||
06-17, A1 5.500%, 11/25/21 | 114 | 115 | ||||||
03-G, A1 2.895%, 6/25/33(2) | 1,227 | 1,230 | ||||||
03-J, 5A1 2.972%, 10/25/33(2) | 388 | 391 | ||||||
04-4, A9 5.500%, 5/25/34 | 1,672 | 1,705 | ||||||
04-U, A1 3.034%, 10/25/34(2) | 1,036 | 1,030 | ||||||
04-Z, 2A1 2.855%, 12/25/34(2) | 5,215 | 5,305 | ||||||
See Notes to Financial Statements
16
Table of Contents
VIRTUS MULTI-SECTOR SHORT TERM BOND FUND
SCHEDULE OF INVESTMENTS (Continued)
SEPTEMBER 30, 2016
($ reported in thousands)
| PAR VALUE | VALUE | |||||||
| MORTGAGE-BACKED SECURITIES (continued) | ||||||||
| Non-Agency (continued) | ||||||||
04-CC, A1 2.859%, 1/25/35(2) | $ | 2,348 | $ | 2,363 | ||||
05-12, 1A1 5.500%, 11/25/35 | 3,172 | 3,208 | ||||||
05-14, 2A1 5.500%, 12/25/35 | 2,485 | 2,569 | ||||||
07-16, 1A1 6.000%, 12/28/37 | 2,662 | 2,750 | ||||||
07-AR10, 2A1 6.162%, | 3,099 | 2,989 | ||||||
|
| |||||||
| 1,441,720 | ||||||||
| TOTAL MORTGAGE-BACKED SECURITIES | ||||||||
| (Identified Cost $1,776,822) | 1,797,728 | |||||||
| ASSET-BACKED SECURITIES—18.8% | ||||||||
American Credit Acceptance Receivables Trust | ||||||||
14-3, C 144A 3.430%, 6/10/20(3) | 19,200 | 19,314 | ||||||
16- 1A, B 144A 4.240%, | 7,500 | 7,776 | ||||||
AmeriCredit Automobile Receivables Trust | ||||||||
12-3, D 3.030%, 7/9/18 | 19,144 | 19,175 | ||||||
12-4, D 2.680%, 10/9/18 | 7,150 | 7,159 | ||||||
14-2, C 2.180%, 6/8/20 | 19,450 | 19,634 | ||||||
14-1, D 2.540%, 6/8/20 | 18,320 | 18,557 | ||||||
15-3, C 2.730%, 3/8/21 | 9,730 | 9,927 | ||||||
Applebee’s LLC 14-1, A2 144A 4.277%, 9/5/44(3) | 25,168 | 25,579 | ||||||
Arbys Funding LLC 15-1A, A2 144A 4.969%, 10/30/45(3) | 5,955 | 6,074 | ||||||
Ascentium Equipment Receivables 15-A1, B 144A 2.260%, 6/10/21(3) | 5,400 | 5,457 | ||||||
| PAR VALUE | VALUE | |||||||
| ASSET-BACKED SECURITIES (continued) | ||||||||
Associates Manufactured Housing Pass-Through Certificates 96-1, B1 8.000%, 3/15/27(2) | $ | 974 | $ | 1,006 | ||||
Avis Budget Rental Car Funding LLC | ||||||||
(AESOP) 12-3A, A 144A 2.100%, 3/20/19(3) | 23,085 | 23,152 | ||||||
(AESOP) 13-2A, A 144A 2.970%, 2/20/20(3) | 2,635 | 2,687 | ||||||
(AESOP) 16-1A, A 144A 2.990%, 6/20/22(3) | 18,500 | 18,978 | ||||||
BankAmerica Manufactured Housing Contract Trust 98-1, B1 7.810%, 8/10/25(2) | 1,150 | 1,171 | ||||||
Barclays (Lehman Brothers) Manufactured Housing Contract Trust 01-B, A3 4.350%, 4/15/40 | 2,247 | 2,289 | ||||||
BCC Funding VIII LLC | ||||||||
14-A, B 144A 3.123%, 8/20/20(3) | 2,799 | 2,796 | ||||||
14-1A, C 144A 4.216%, | 5,519 | 5,519 | ||||||
BCC Funding XIII LLC 144A, Series 16-1, Class D 4.780%, 8/22/22(3) | 5,392 | 5,392 | ||||||
BXG Receivables Note Trust | ||||||||
10-A, A 144A 5.100%, 3/2/26(3) | 1,026 | 1,036 | ||||||
12-A, A 144A 2.660%, 12/2/27(3) | 3,105 | 3,094 | ||||||
13-A, A 144A 3.010%, 12/4/28(3) | 6,248 | 6,313 | ||||||
15-A, A 144A 2.880%, 5/2/30(3) | 2,566 | 2,543 | ||||||
See Notes to Financial Statements
17
Table of Contents
VIRTUS MULTI-SECTOR SHORT TERM BOND FUND
SCHEDULE OF INVESTMENTS (Continued)
SEPTEMBER 30, 2016
($ reported in thousands)
| PAR VALUE | VALUE | |||||||
| ASSET-BACKED SECURITIES (continued) | ||||||||
California Republic Auto Receivables Trust | ||||||||
13-1, B 144A 2.240%, 1/15/19(3) | $ | 11,600 | $ | 11,664 | ||||
14-2, B 2.340%, 4/15/20 | 7,090 | 7,182 | ||||||
15-3, B 2.700%, 9/15/21 | 3,705 | 3,774 | ||||||
16-1, B 3.430%, 2/15/22 | 4,615 | 4,768 | ||||||
Capital Auto Receivables Asset Trust | ||||||||
13-1, C 1.740%, 10/22/18 | 4,654 | 4,659 | ||||||
15-2, C 2.670%, 8/20/20 | 7,250 | 7,326 | ||||||
16-3, C 2.350%, 9/20/21 | 8,935 | 8,940 | ||||||
CarFinance Capital Auto Trust | ||||||||
13-1A, B 144A 2.750%, 11/15/18(3) | 1,617 | 1,624 | ||||||
13-A1, C 144A 3.450%, 3/15/19(3) | 2,210 | 2,230 | ||||||
13-2A, B 144A 3.150%, 8/15/19(3) | 8,162 | 8,213 | ||||||
14-1A, B 144A 2.720%, 4/15/20(3) | 5,550 | 5,585 | ||||||
14-2A, B 144A 2.640%, 11/16/20(3) | 3,455 | 3,478 | ||||||
14-2A, C 144A 3.240%, 11/16/20(3) | 2,765 | 2,779 | ||||||
15-A1, B 144A 2.910%, 6/15/21(3) | 6,000 | 6,048 | ||||||
CarMax Auto Owner Trust | ||||||||
14-2, B 1.880%, 11/15/19 | 1,000 | 1,008 | ||||||
15-2, C 2.390%, 3/15/21 | 2,275 | 2,308 | ||||||
CarNow Auto Receivables Trust | ||||||||
14-1A, D 144A 4.160%, 11/15/18(3) | 3,000 | 3,020 | ||||||
14-1A, E 144A 5.530%, 1/15/20(3) | 8,350 | 8,365 | ||||||
| PAR VALUE | VALUE | |||||||
| ASSET-BACKED SECURITIES (continued) | ||||||||
15-2,C 144A 3.880%, 4/15/20(3) | $ | 6,205 | $ | 6,239 | ||||
CCG Receivables Trust 14-1, B 144A 2.150%, 11/15/21(3) | 5,080 | 5,097 | ||||||
Centre Point Funding LLC 12-2A, 1 144A 2.610%, 8/20/21(3) | 11,207 | 11,120 | ||||||
Cheesecake Restaurant Holdings, Inc. 13-1A, A2 144A 4.474%, 3/20/43(3) | 19,921 | 19,973 | ||||||
Citi Held For Asset Issuance 15-PM3, B 144A 4.310%, | 24,650 | 24,693 | ||||||
Conn Funding II LP 144A, 16-B, A 3.730%, 10/15/18(3) | 13,315 | 13,314 | ||||||
Consumer Installment Loan Trust 16-LD1, A 144A 3.960%, | 4,299 | 4,319 | ||||||
CPS Auto Receivables Trust | ||||||||
16-C, B 144A 2.480%, 9/15/20(3) | 3,000 | 3,027 | ||||||
16-B, 144A 3.180%, 9/15/20(3) | 4,500 | 4,599 | ||||||
DB Master Finance LLC | ||||||||
15-1A, A2I 144A 3.262%, | 4,925 | 4,951 | ||||||
15-A1, A2II 144A 3.980%, 2/20/45(3) | 13,807 | 14,114 | ||||||
Diamond Resorts Owner Trust 14-1, A 144A 2.540%, 5/20/27(3) | 8,322 | 8,333 | ||||||
Direct Capital Funding IV LLC 13-A1, C 144A 4.830%, 11/20/20(3) | 5,000 | 5,010 | ||||||
DRB Prime Student Loan Trust 15-D, A3 144A 2.500%, 1/25/36(3) | 5,665 | 5,689 | ||||||
See Notes to Financial Statements
18
Table of Contents
VIRTUS MULTI-SECTOR SHORT TERM BOND FUND
SCHEDULE OF INVESTMENTS (Continued)
SEPTEMBER 30, 2016
($ reported in thousands)
| PAR VALUE | VALUE | |||||||
| ASSET-BACKED SECURITIES (continued) | ||||||||
Drive Auto Receivables Trust | ||||||||
15-DA, B 144A 2.590%, | $ | 3,920 | $ | 3,940 | ||||
16-AA, B 144A 3.170%, 5/15/20(3) | 7,310 | 7,412 | ||||||
15-AA, C 144A 3.060%, 5/17/21(3) | 23,685 | 23,891 | ||||||
15-AA, D 144A 4.120%, 7/15/22(3) | 13,120 | 13,459 | ||||||
Drug Royalty II LP 1 14-1, A2 144A 3.484%, 7/15/23(3) | 16,148 | 15,910 | ||||||
Drug Royalty III LP 1 16-1A, A 144A 3.979%, 4/15/27(3) | 4,376 | 4,358 | ||||||
DT Auto Owner Trust | ||||||||
14-1A, C 144A 2.640%, | 3,827 | 3,833 | ||||||
14-2A, C 144A 2.460%, 1/15/20(3) | 7,017 | 7,036 | ||||||
16-1A, B 144A 2.790%, 5/15/20(3) | 5,200 | 5,249 | ||||||
14-3A, C 144A 3.040%, 9/15/20(3) | 10,090 | 10,183 | ||||||
15-1A, C 144A 2.870%, | 7,000 | 7,063 | ||||||
15-3A, C 144A 3.250%, 7/15/21(3) | 2,285 | 2,312 | ||||||
14-3A, D 144A 4.470%, | 4,180 | 4,268 | ||||||
16-2A, C 144A 3.670%, 1/17/22(3) | 8,555 | 8,741 | ||||||
16-3A C,144A 3.150%, 3/15/22(3) | 8,485 | 8,558 | ||||||
16-4A C,144A 2.740%, | 12,785 | 12,783 | ||||||
Exeter Automobile Receivables Trust | ||||||||
12-2A, C 144A 3.060%, 7/16/18(3) | 4,650 | 4,664 | ||||||
13-2A, B 144A 3.090%, 7/16/18(3) | 473 | 473 | ||||||
14-1A, B 144A 2.420%, 1/15/19(3) | 5,006 | 5,010 | ||||||
13-1A, C 144A 3.520%, 2/15/19(3) | 18,289 | 18,393 | ||||||
| PAR VALUE | VALUE | |||||||
| ASSET-BACKED SECURITIES (continued) | ||||||||
14-1A, C 144A 3.570%, 7/15/19(3) | $ | 15,830 | $ | 15,973 | ||||
14-2A, C 144A 3.260%, 12/16/19(3) | 14,615 | 14,772 | ||||||
15-A1, C 144A 4.100%, 12/15/20(3) | 15,930 | 16,192 | ||||||
15-2A, C 144A 3.900%, 3/15/21(3) | 18,705 | 18,943 | ||||||
14-3A, D 144A 5.690%, 4/15/21(3) | 15,995 | 16,364 | ||||||
15-3A, D 144A 6.550%, 10/17/22(3) | 3,375 | 3,462 | ||||||
Fairway Outdoor Funding LLC 12-1A, A2 144A 4.212%, 10/15/42(3) | 20,255 | 20,457 | ||||||
First Investors Auto Owner Trust 15-1A, C 144A 2.710%, 6/15/21(3) | 5,000 | 5,040 | ||||||
Flagship Credit Auto Trust | ||||||||
16-1, A 144A 2.770%, 12/15/20(3) | 4,930 | 4,978 | ||||||
14-2, D 144A 5.210%, 2/15/21(3) | 9,560 | 9,691 | ||||||
15-1, D 144A 5.260%, 7/15/21(3) | 3,565 | 3,632 | ||||||
15-2, C 144A 4.080%, 12/15/21(3) | 6,495 | 6,501 | ||||||
16-2, B 144A 3.840%, 9/15/22(3) | 4,175 | 4,353 | ||||||
16-3, D 144A 3.890%, 11/15/22(3) | 5,900 | 5,879 | ||||||
Foundation Finance Trust 16-1A, A 144A 3.960%, 6/15/35(3) | 3,622 | 3,617 | ||||||
Foursight Capital Automobile Receivables Trust | ||||||||
16-1 A2, 144A 2.870%, 10/15/21(3) | 7,865 | 7,922 | ||||||
14-1, B 144A 3.560%, 11/22/21(3) | 4,704 | 4,717 | ||||||
15-1, B 144A 4.120%, 9/15/22(3) | 5,589 | 5,653 | ||||||
GLS Auto Receivables Trust 16-1A, B 144A 4.390%, 1/15/21(3) | 10,500 | 10,745 | ||||||
See Notes to Financial Statements
19
Table of Contents
VIRTUS MULTI-SECTOR SHORT TERM BOND FUND
SCHEDULE OF INVESTMENTS (Continued)
SEPTEMBER 30, 2016
($ reported in thousands)
| PAR VALUE | VALUE | |||||||
| ASSET-BACKED SECURITIES (continued) | ||||||||
Gold Key Resorts LLC 14-A, A 144A 3.220%, 3/17/31(3) | $ | 7,861 | $ | 7,885 | ||||
Greater Capital Association of Realtors 15-1A, C 9.790%, 10/15/25 | 8,195 | 8,363 | ||||||
Hertz Vehicle Financing LLC | ||||||||
11-1A, A2 144A 3.290%, | 14,960 | 15,033 | ||||||
15-2A, A 144A 2.020%, 9/25/19(3) | 4,845 | 4,824 | ||||||
16 -1A, A144A 2.320%, 3/25/20(3) | 8,800 | 8,844 | ||||||
Hilton Grand Vacations Trust | ||||||||
13-A, A 144A 2.280%, 1/25/26(3) | 7,117 | 7,089 | ||||||
14-AA, A 144A 1.770%, | 9,809 | 9,736 | ||||||
Hyundai Auto Receivables Trust | ||||||||
14-B, D 2.510%, 12/15/20 | 9,675 | 9,729 | ||||||
15-A, D 2.730%, 6/15/21 | 8,950 | 9,028 | ||||||
IndyMac Manufactured Housing Contract 98-1, A3 6.370%, 9/25/28 | 854 | 873 | ||||||
LEAF Receivables Funding 10 LLC | ||||||||
15-1, D 144A 3.740%, 5/17/21(3) | 800 | 795 | ||||||
15-1, E1 144A 5.210%, 7/15/21(3) | 4,500 | 4,493 | ||||||
LEAF Receivables Funding 11 LLC 16-1, E1 144A 5.500%, 4/15/23(3) | 5,000 | 4,978 | ||||||
LEAF Receivables Funding 9 LLC | ||||||||
13-1,E2 C 144A 3.460%, | 6,850 | 6,844 | ||||||
13-1, D 144A 5.110%, 9/15/21(3) | 1,186 | 1,208 | ||||||
| PAR VALUE | VALUE | |||||||
| ASSET-BACKED SECURITIES (continued) | ||||||||
Leaf Receivables Funding 9 LLC 10 LLC 15-1, E2 144A 6.000%, 6/15/23(3) | $ | 2,455 | $ | 2,405 | ||||
LEAF Receivables Funding 9 LLC 11 LLC 16-1, E2 144A 6.000%, 6/15/24(3) | 4,170 | 3,887 | ||||||
Marriott Vacation Club Owner Trust | ||||||||
12-1A, A 144A 2.510%, 5/20/30(3) | 12,419 | 12,505 | ||||||
10-1A, A 144A 3.540%, | 374 | 380 | ||||||
10-1A, B 144A 4.520%, | 730 | 744 | ||||||
MVW Owner Trust | ||||||||
15-1A, B 144A 2.960%, | 1,607 | 1,619 | ||||||
16-1A, A 144A 2.250%, | 6,765 | 6,750 | ||||||
National City Mortgage Capital Trust 08-1, 2A1 6.000%, 3/25/38 | 1,717 | 1,784 | ||||||
NCF Dealer Floorplan Master Trust 16-1A, A 144A 3.782%, | 9,000 | 8,836 | ||||||
OneMain Direct Auto Receivables Trust 16-1A, B 144A 2.760%, 5/15/21(3) | 5,000 | 5,024 | ||||||
OneMain Financial Issuance Trust | ||||||||
14-1A, A 144A 2.430%, 6/18/24(3) | 10,143 | 10,152 | ||||||
15-2A, A 144A 2.570%, 7/18/25(3) | 19,675 | 19,744 | ||||||
15-A, A 144A 3.190%, 3/18/26(3) | 26,301 | 26,568 | ||||||
Orange Lake Timeshare Trust | ||||||||
12-AA, A 144A 3.450%, 3/10/27(3) | 3,441 | 3,485 | ||||||
15-AA, A 144A 2.880%, 9/8/27(3) | 6,647 | 6,700 | ||||||
See Notes to Financial Statements
20
Table of Contents
VIRTUS MULTI-SECTOR SHORT TERM BOND FUND
SCHEDULE OF INVESTMENTS (Continued)
SEPTEMBER 30, 2016
($ reported in thousands)
| PAR VALUE | VALUE | |||||||
| ASSET-BACKED SECURITIES (continued) | ||||||||
14-AA, A 144A 2.290%, 7/9/29(3) | $ | 2,963 | $ | 2,948 | ||||
Prestige Auto Receivables Trust 14-1A, C 144A 2.390%, 5/15/20(3) | 7,000 | 6,973 | ||||||
Santander Drive Auto Receivables Trust | ||||||||
12-6, C 1.940%, 3/15/18 | 245 | 245 | ||||||
12-5, C 2.700%, 8/15/18 | 766 | 767 | ||||||
12-6, D 2.520%, 9/17/18 | 17,455 | 17,538 | ||||||
13-1, D 2.270%, 1/15/19 | 21,925 | 22,092 | ||||||
13-3, C 1.810%, 4/15/19 | 5,400 | 5,412 | ||||||
14-3, C 2.130%, 8/17/20 | 16,400 | 16,487 | ||||||
16-2, B 2.080%, 2/16/21 | 8,250 | 8,309 | ||||||
Security National Automotive Acceptance Company Receivables Trust 14-1A, C 144A 2.210%, 1/15/20(3) | 8,382 | 8,397 | ||||||
Sierra Timeshare Receivables Funding LLC | ||||||||
12-2A, B 144A 3.420%, 3/20/29(3) | 1,719 | 1,726 | ||||||
12-3A, A 144A 1.870%, | 6,507 | 6,464 | ||||||
13-1A, A 144A 1.590%, | 2,386 | 2,376 | ||||||
14-1A, A 144A 2.070%, 3/20/30(3) | 2,342 | 2,330 | ||||||
14-2A, A 144A 2.050%, 6/20/31(3) | 3,356 | 3,358 | ||||||
16-1A, A 144A 3.080%, 3/21/33(3) | 8,115 | 8,256 | ||||||
16-2A, A 144A 2.330%, 7/20/33(3) | 8,129 | 8,130 | ||||||
Silverleaf Finance LLC | ||||||||
XVII 13-A, A 144A 2.680%, 3/16/26(3) | 2,835 | 2,812 | ||||||
| PAR VALUE | VALUE | |||||||
| ASSET-BACKED SECURITIES (continued) | ||||||||
XVIII 14-A, A 144A 2.810%, 1/15/27(3) | $ | 2,050 | $ | 2,031 | ||||
Silverleaf Finance XV LLC 12-D, A 144A 3.000%, 3/17/25(3) | 3,046 | 3,048 | ||||||
Skopos Auto Receivables Trust 15-2A, A 144A 3.550%, 2/15/20(3) | 3,765 | 3,767 | ||||||
SLM Private Education Loan Trust | ||||||||
13-B, A2A 144A 1.850%, | 4,500 | 4,497 | ||||||
13-C, A2A 144A 2.940%, 10/15/31(3) | 5,000 | 5,102 | ||||||
SoFi Professional Loan Program LLC | ||||||||
14-B, A2 144A 2.550%, 8/27/29(3) | 1,083 | 1,099 | ||||||
15-A, A2 144A 2.420%, 3/25/30(3) | 4,362 | 4,415 | ||||||
16-A, A2 144A 2.760%, | 2,143 | 2,196 | ||||||
SolarCity LMC Series III LLC 14-2, A 144A 4.020%, 7/20/44(3) | 8,027 | 7,556 | ||||||
Structured Asset Securities Corp. Mortgage Pass-Through Certificates 01-SB1, A2 3.375%, 8/25/31 | 1,538 | 1,521 | ||||||
SVO VOI Mortgage Corp. 12-AA, A 144A 2.000%, 9/20/29(3) | 8,041 | 7,955 | ||||||
Taco Bell Funding LLC 16-1A, A21 144A 3.832%, 5/25/46(3) | 16,945 | 17,183 | ||||||
TCF Auto Receivables Owner Trust | ||||||||
14-1A, B 144A 2.330%, 5/15/20(3) | 1,733 | 1,736 | ||||||
14-1A, C 144A 3.120%, 4/15/21(3) | 2,035 | 2,049 | ||||||
Tidewater Auto Receivables Trust | ||||||||
14-AA, C 144A 2.560%, 8/15/19(3) | 3,500 | 3,511 | ||||||
See Notes to Financial Statements
21
Table of Contents
VIRTUS MULTI-SECTOR SHORT TERM BOND FUND
SCHEDULE OF INVESTMENTS (Continued)
SEPTEMBER 30, 2016
($ reported in thousands)
| PAR VALUE | VALUE | |||||||
| ASSET-BACKED SECURITIES (continued) | ||||||||
16-AA, B 144A 3.130%, 3/15/20(3) | $ | 7,393 | $ | 7,506 | ||||
Trip Rail Master Funding LLC | ||||||||
11-1A, A1A 144A 4.370%, 7/15/41(3) | 11,738 | 12,021 | ||||||
14-1A, A1 144A 2.863%, | 9,635 | 9,594 | ||||||
U-Haul S Fleet LLC 10-BT1A, 1 144A 4.899%, 10/25/23(3) | 31,497 | 31,869 | ||||||
United Auto Credit Securitization Trust | ||||||||
16-1, B 144A 2.730%, 5/15/18(3) | 4,880 | 4,901 | ||||||
16-2, C 144A 2.480%, 3/10/20(3) | 9,425 | 9,431 | ||||||
Volvo Financial Equipment LLC 14-1A, C 144A 1.940%, | 6,000 | 6,016 | ||||||
VSE VOI Mortgage LLC 16-A, A 144A 2.540%, 7/20/33(3) | 7,955 | 7,980 | ||||||
Welk Resorts LLC | ||||||||
13-AA, A 144A 3.100%, 3/15/29(3) | 3,382 | 3,416 | ||||||
15-AA, A 144A 2.790%, 6/16/31(3) | 5,656 | 5,662 | ||||||
Wendy’s Funding LLC | ||||||||
15-1A, A2II 144A 3.371%, 6/15/45(3) | 5,360 | 5,384 | ||||||
15-1A, A2II 144A 4.080%, 6/15/45(3) | 20,164 | 20,477 | ||||||
Westgate Resorts LLC 16-1A, A 144A 3.500%, 12/20/28(3) | 7,104 | 7,109 | ||||||
Westlake Automobile Receivables Trust | ||||||||
14-1A, C 144A 1.700%, | 1,538 | 1,538 | ||||||
15-1A, C 144A 2.290%, | 8,500 | 8,537 | ||||||
16-2A C, 144A 2.830%, 5/17/21(3) | 3,190 | 3,230 | ||||||
| PAR VALUE | VALUE | |||||||
| ASSET-BACKED SECURITIES (continued) | ||||||||
15-3A, D,144A 4.400%, 5/17/21(3) | $ | 10,000 | $ | 10,184 | ||||
| TOTAL ASSET-BACKED SECURITIES | ||||||||
| (Identified Cost $1,333,454) | 1,341,950 | |||||||
| CORPORATE BONDS AND NOTES—34.6% | ||||||||
| Consumer Discretionary—2.6% | ||||||||
Alibaba Group Holding Ltd. 2.500%, 11/28/19 | 6,600 | 6,732 | ||||||
Caesars Entertainment Operating Co., Inc. 9.000%, 2/15/20(15) | 3,625 | 3,752 | ||||||
CCO Holdings LLC 144A 5.500%, 5/1/26(3) | 6,820 | 7,161 | ||||||
Clear Channel Worldwide Holdings, Inc. Series B 7.625%, 3/15/20 | 18,230 | 18,162 | ||||||
Columbus Cable Barbados Ltd. Series B,144A 7.375%, 3/30/21(3) | 5,990 | 6,378 | ||||||
Delphi Automotive plc | 15,000 | 15,532 | ||||||
Diamond Resorts International, Inc. 144A 7.750%, 9/1/23(3) | 590 | 594 | ||||||
Hanesbrands, Inc. 144A 4.625%, 5/15/24(3) | 5,830 | 6,012 | ||||||
Hyundai Capital America 144A 2.125%, 10/2/17(3) | 2,940 | 2,955 | ||||||
International Game Technology plc | ||||||||
144A 5.625%, 2/15/20(3) | 3,245 | 3,460 | ||||||
144A 6.250%, 2/15/22(3) | 5,190 | 5,550 | ||||||
Landry’s, Inc. 144A | 7,530 | 7,908 | ||||||
M/I Homes, Inc. | 4,675 | 4,920 | ||||||
See Notes to Financial Statements
22
Table of Contents
VIRTUS MULTI-SECTOR SHORT TERM BOND FUND
SCHEDULE OF INVESTMENTS (Continued)
SEPTEMBER 30, 2016
($ reported in thousands)
| PAR VALUE | VALUE | |||||||
| CORPORATE BONDS AND NOTES (continued) | ||||||||
| Consumer Discretionary (continued) | ||||||||
Marriott International, Inc. Series N, | $ | 13,545 | $ | 14,130 | ||||
MGM Growth Properties Operating Partnership LP (MGP Finance Co-Issuer, Inc.) 144A | 1,740 | 1,887 | ||||||
Newell Brands, Inc. | ||||||||
3.150%, 4/1/21 | 1,925 | 2,006 | ||||||
3.850%, 4/1/23 | 825 | 878 | ||||||
4.200%, 4/1/26 | 1,665 | 1,814 | ||||||
QVC, Inc. | 12,765 | 13,088 | ||||||
Scientific Games International, Inc. 144A 7.000%, 1/1/22(3) | 5,625 | 5,977 | ||||||
SFR (Numericable) Group S.A. | ||||||||
144A 6.000%, 5/15/22(3) | 4,580 | 4,689 | ||||||
144A 7.375%, 5/1/26(3) | 7,075 | 7,241 | ||||||
Toll Brothers Finance Corp. | ||||||||
4.000%, 12/31/18 | 5,080 | 5,277 | ||||||
6.750%, 11/1/19 | 9,716 | 10,979 | ||||||
5.625%, 1/15/24 | 915 | 981 | ||||||
4.875%, 11/15/25 | 8,520 | 8,754 | ||||||
TRI Pointe Group, Inc. | ||||||||
4.375%, 6/15/19 | 13,872 | 14,340 | ||||||
4.875%, 7/1/21 | 3,740 | 3,843 | ||||||
Wyndham Worldwide Corp. | 2,960 | 2,991 | ||||||
|
| |||||||
| 187,991 | ||||||||
|
| |||||||
| Consumer Staples—0.3% | ||||||||
ESAL GmbH 144A | 8,600 | 8,385 | ||||||
Whole Foods Market, Inc. 144A | 14,325 | 15,567 | ||||||
|
| |||||||
| 23,952 | ||||||||
|
| |||||||
| PAR VALUE | VALUE | |||||||
| Energy—5.9% | ||||||||
Afren plc 144A | $ | 4,674 | $ | 18 | ||||
Alberta Energy Co., Ltd. | 8,110 | 9,592 | ||||||
Anadarko Petroleum Corp. | ||||||||
4.850%, 3/15/21 | 3,845 | 4,146 | ||||||
5.550%, 3/15/26 | 5,455 | 6,209 | ||||||
Antero Resources Corp. | 6,835 | 6,997 | ||||||
Blue Racer Midstream LLC 144A 6.125%, 11/15/22(3) | 4,595 | 4,515 | ||||||
Carrizo Oil & Gas, Inc. | 4,150 | 4,129 | ||||||
Cheniere Corpus Christi Holdings LLC 144A | 3,795 | 4,118 | ||||||
Cimarex Energy Co. | 11,490 | 12,007 | ||||||
CNOOC Finance Propriety Ltd. | 5,800 | 5,911 | ||||||
Concho Resources, Inc. | 9,345 | 9,684 | ||||||
Continental Resources, Inc. | ||||||||
5.000%, 9/15/22 | 5,035 | 5,035 | ||||||
4.500%, 4/15/23 | 3,035 | 2,929 | ||||||
Ecopetrol S.A. | 20,920 | 22,568 | ||||||
Enbridge Energy Partners LP | 3,930 | 4,149 | ||||||
Encana Corp. | 7,960 | 7,976 | ||||||
Energy Transfer Partners LP | 4,855 | 5,263 | ||||||
EP Energy LLC (Everest Acquisition Finance, Inc.) | 11,345 | 8,112 | ||||||
See Notes to Financial Statements
23
Table of Contents
VIRTUS MULTI-SECTOR SHORT TERM BOND FUND
SCHEDULE OF INVESTMENTS (Continued)
SEPTEMBER 30, 2016
($ reported in thousands)
| PAR VALUE | VALUE | |||||||
| CORPORATE BONDS AND NOTES (continued) | ||||||||
| Energy (continued) | ||||||||
FTS International, Inc. | $ | 2,245 | $ | 870 | ||||
KazMunayGas National Co. 144A 6.375%, 4/9/21(3) | 4,800 | 5,310 | ||||||
Kinder Morgan, Inc. 144A | 20,300 | 22,426 | ||||||
Kunlun Energy Co., Ltd. 144A | 5,000 | 5,102 | ||||||
Linn Energy LLC | 9,980 | 2,595 | ||||||
Lukoil OAO International Finance BV 144A | 6,000 | 6,089 | ||||||
Midcontinent Express Pipeline LLC 144A | 3,500 | 3,675 | ||||||
MPLX LP | 11,935 | 12,341 | ||||||
Newfield Exploration Co. | 7,925 | 8,123 | ||||||
NGL Energy Partners LP | 18,475 | 17,459 | ||||||
Occidental Petroleum Corp. | ||||||||
2.600%, 4/15/22 | 885 | 904 | ||||||
3.400%, 4/15/26 | 725 | 767 | ||||||
Pacific Exploration and Production Corp. 144A | 13,565 | 2,577 | ||||||
Petrobras Global Finance BV | ||||||||
8.375%, 5/23/21 | 13,005 | 14,282 | ||||||
8.750%, 5/23/26 | 405 | 448 | ||||||
Petroleos de Venezuela S.A | ||||||||
RegS | 24,234 | 20,962 | ||||||
144A 6.000%, 5/16/24(3) | 12,980 | 5,563 | ||||||
| PAR VALUE | VALUE | |||||||
| Energy (continued) | ||||||||
Petroleos Mexicanos | ||||||||
4.875%, 1/24/22 | $ | 16,470 | $ | 16,758 | ||||
144A 6.875%, 8/4/26(3) | 13,475 | 15,192 | ||||||
PHI, Inc. | 6,275 | 6,071 | ||||||
Pride International, Inc. | 4,065 | 4,421 | ||||||
QEP Resources, Inc. | ||||||||
6.875%, 3/1/21 | 5,220 | 5,481 | ||||||
5.250%, 5/1/23 | 9,530 | 9,435 | ||||||
Range Resources Corp. | ||||||||
144A 5.000%, 8/15/22(3) | 3,730 | 3,730 | ||||||
144A 5.000%, 3/15/23(3) | 8,025 | 7,885 | ||||||
Regency Energy Partners LP | 17,910 | 18,905 | ||||||
Sabine Oil & Gas Corp. | 9,035 | 168 | ||||||
Sabine Pass Liquefaction LLC | ||||||||
5.625%, 2/1/21 | 8,000 | 8,510 | ||||||
6.250%, 3/15/22 | 8,415 | 9,214 | ||||||
Sinopec Capital Ltd. 144A | 11,750 | 11,766 | ||||||
Southern Gas Corridor CJSC 144A | 6,435 | 7,226 | ||||||
Sunoco LP 144A | 16,520 | 17,057 | ||||||
Transocean, Inc. | ||||||||
6.800%, 12/15/16 | 9,280 | 9,335 | ||||||
144A 9.000%, 7/15/23(3) | 3,680 | 3,597 | ||||||
6.800%, 3/15/38 | 7,800 | 5,187 | ||||||
YPF S.A. 144A 8.500%, 3/23/21(3) | 7,000 | 7,829 | ||||||
|
| |||||||
| 420,618 | ||||||||
|
| |||||||
See Notes to Financial Statements
24
Table of Contents
VIRTUS MULTI-SECTOR SHORT TERM BOND FUND
SCHEDULE OF INVESTMENTS (Continued)
SEPTEMBER 30, 2016
($ reported in thousands)
| PAR VALUE | VALUE | |||||||
| CORPORATE BONDS AND NOTES (continued) | ||||||||
| Financials—12.6% | ||||||||
ABN AMRO Bank N.V. 144A 4.250%, 2/2/17(3) | $ | 4,425 | $ | 4,466 | ||||
AerCap Ireland Capital Ltd. (Aercap Global Aviation Trust) 3.950%, 2/1/22 | 3,670 | 3,757 | ||||||
Air Lease Corp. 2.625%, 9/4/18 | 5,495 | 5,545 | ||||||
Akbank TAS 144A 7.500%, | 33,705 | TRY | 10,709 | |||||
Ally Financial, Inc. | ||||||||
4.250%, 4/15/21 | 10,530 | 10,727 | ||||||
5.750%, 11/20/25 | 7,090 | 7,445 | ||||||
Ares Capital Corp. | ||||||||
4.875%, 11/30/18 | 1,545 | 1,613 | ||||||
3.875%, 1/15/20 | 4,286 | 4,436 | ||||||
3.625%, 1/19/22 | 4,475 | 4,508 | ||||||
Australia & New Zealand Banking Group Ltd. 144A | 14,195 | 15,076 | ||||||
Aviation Capital Group Corp. 144A | 4,415 | 4,470 | ||||||
Banco de Credito del Peru 144A 4.250%, 4/1/23(3) | 15,500 | 16,604 | ||||||
Bank of America Corp. | ||||||||
2.000%, 1/11/18 | 14,905 | 14,973 | ||||||
5.490%, 3/15/19 | 2,868 | 3,099 | ||||||
4.450%, 3/3/26 | 10,475 | 11,249 | ||||||
Bank of Baroda 144A | 11,775 | 12,576 | ||||||
Bank of India | ||||||||
144A 3.250%, 4/18/18(3) | 10,470 | 10,672 | ||||||
144A 3.625%, 9/21/18(3) | 10,200 | 10,384 | ||||||
Barclays Bank plc 144A | 13,130 | 13,729 | ||||||
Barclays plc | 10,345 | 10,399 | ||||||
| PAR VALUE | VALUE | |||||||
| Financials (continued) | ||||||||
BBVA Banco Continental S.A. RegS | $ | 16,280 | $ | 17,867 | ||||
Berkshire Hathaway, Inc. | 1,695 | 1,762 | ||||||
Blackstone Holdings Finance Co. LLC 144A | 7,105 | 8,053 | ||||||
Bonos del Banco Central de Chile En Pesos | 4,570,000 | CLP | 7,237 | |||||
Capital One N.A. | 5,000 | 5,079 | ||||||
Citigroup, Inc. | ||||||||
5.500%, 2/15/17 | 11,730 | 11,906 | ||||||
4.600%, 3/9/26 | 10,445 | 11,162 | ||||||
Comerica Bank, Inc. | 5,940 | 5,974 | ||||||
Corp Financiera de Desarrollo SA 144A | 10,000 | 11,034 | ||||||
Corpbanca SA 144A | 4,000 | 4,175 | ||||||
Discover Bank | 1,750 | 2,019 | ||||||
Drawbridge Special Opportunities Fund LP 144A | 14,685 | 14,114 | ||||||
Fidelity National Financial, Inc. | 6,475 | 6,658 | ||||||
Fifth Third Bancorp | 6,745 | 6,996 | ||||||
First Tennessee Bank N.A. | 4,500 | 4,560 | ||||||
Ford Motor Credit Co. LLC | 10,000 | 10,496 | ||||||
FS Investment Corp. 4.250%, 1/15/20 | 7,725 | 7,923 | ||||||
See Notes to Financial Statements
25
Table of Contents
VIRTUS MULTI-SECTOR SHORT TERM BOND FUND
SCHEDULE OF INVESTMENTS (Continued)
SEPTEMBER 30, 2016
($ reported in thousands)
| PAR VALUE | VALUE | |||||||
| CORPORATE BONDS AND NOTES (continued) | ||||||||
| Financials (continued) | ||||||||
General Motors Financial Co., Inc. | ||||||||
3.500%, 7/10/19 | $ | 9,715 | $ | 10,014 | ||||
4.200%, 3/1/21 | 7,300 | 7,690 | ||||||
Genworth Holdings, Inc. | 6,910 | 6,634 | ||||||
Goldman Sachs Group, Inc. (The) | ||||||||
2.350%, 11/15/21 | 4,425 | 4,416 | ||||||
4.250%, 10/21/25 | 24,315 | 25,604 | ||||||
Guanay Finance Ltd. 144A | 26,442 | 27,004 | ||||||
HBOS plc 144A 6.750%, 5/21/18(3) | 685 | 732 | ||||||
HSBC USA, Inc. 2.625%, 9/24/18 | 19,485 | 19,829 | ||||||
Huntington Bancshares, Inc. 7.000%, 12/15/20 | 17,065 | 19,834 | ||||||
Hutchison Whampoa International Ltd. Series 12 144A 6.000%(2)(3)(6)(7) | 13,210 | 13,474 | ||||||
ICAHN Enterprises LP 5.875%, 2/1/22 | 12,875 | 12,424 | ||||||
ICAHN Enterprises LP (ICAHN Enterprises Finance Corp.) 3.500%, 3/15/17 | 965 | 969 | ||||||
ICICI Bank Ltd. | ||||||||
RegS 4.700%, 2/21/18(4) | 13,000 | 13,446 | ||||||
144A 4.000%, 3/18/26(3) | 6,505 | 6,748 | ||||||
Industrial & Commercial Bank of China Ltd. 3.231%, 11/13/19 | 6,275 | 6,535 | ||||||
International Lease Finance Corp. | 7,635 | 7,816 | ||||||
iStar Financial, Inc. | ||||||||
4.875%, 7/1/18 | 12,250 | 12,357 | ||||||
5.000%, 7/1/19 | 6,210 | 6,217 | ||||||
| PAR VALUE | VALUE | |||||||
| Financials (continued) | ||||||||
Jefferies Group LLC | ||||||||
5.125%, 4/13/18 | $ | 6,541 | $ | 6,829 | ||||
6.875%, 4/15/21 | 3,725 | 4,346 | ||||||
JPMorgan Chase & Co. | ||||||||
6.125%, 6/27/17 | 8,850 | 9,148 | ||||||
2.295%, 8/15/21 | 4,495 | 4,505 | ||||||
JPMorgan Chase Bank N.A. 1.650%, 9/23/19 | 8,805 | 8,826 | ||||||
Lazard Group LLC 4.250%, 11/14/20 | 7,765 | 8,326 | ||||||
Lincoln National Corp. | ||||||||
8.750%, 7/1/19 | 15,040 | 17,702 | ||||||
6.050%, 4/20/67(2)(7) | 2,885 | 2,221 | ||||||
Macquarie Group Ltd. | ||||||||
144A 3.000%, 12/3/18(3) | 4,870 | 4,981 | ||||||
144A 6.000%, 1/14/20(3) | 10,950 | 12,106 | ||||||
Mitsubishi UFJ Financial Group, Inc. | 2,500 | 2,572 | ||||||
Morgan Stanley | ||||||||
144A 10.090%, 5/3/17(3) | 22,595 | BRL | 6,833 | |||||
4.350%, 9/8/26 | 20,295 | 21,679 | ||||||
MUFG Union Bank N.A. 2.625%, 9/26/18 | 2,700 | 2,750 | ||||||
Navient Corp. | 3,620 | 3,618 | ||||||
New York Life Global Funding 144A 1.950%, 2/11/20(3) | 2,855 | 2,890 | ||||||
Phosagro OAO (Phosagro Bond Funding Ltd.) 144A 4.204%, 2/13/18(3)(5) | 7,800 | 7,986 | ||||||
PNC Funding Corp. 5.625%, 2/1/17 | 3,130 | 3,175 | ||||||
Prudential Financial, Inc. 8.875%, 6/15/38(2)(7) | 11,200 | 12,432 | ||||||
QBE Insurance Group Ltd. 144A 2.400%, 5/1/18(3) | 7,750 | 7,792 | ||||||
See Notes to Financial Statements
26
Table of Contents
VIRTUS MULTI-SECTOR SHORT TERM BOND FUND
SCHEDULE OF INVESTMENTS (Continued)
SEPTEMBER 30, 2016
($ reported in thousands)
| PAR VALUE | VALUE | |||||||
| CORPORATE BONDS AND NOTES (continued) | ||||||||
| Financials (continued) | ||||||||
Regions Bank | $ | 2,369 | $ | 2,579 | ||||
Russian Agricultural Bank OJSC (RSHB Capital SA) | ||||||||
144A 5.298%, 12/27/17(3) | 13,655 | 14,016 | ||||||
144A 5.100%, 7/25/18(3)(5) | 8,750 | 8,995 | ||||||
S&P Global, Inc. 3.300%, 8/14/20 | 15,097 | 15,849 | ||||||
Santander Holdings USA, Inc. | ||||||||
2.700%, 5/24/19 | 10,650 | 10,782 | ||||||
2.650%, 4/17/20 | 7,540 | 7,586 | ||||||
SBA Tower Trust | ||||||||
144A 2.933%, 12/15/17(3) | 13,275 | 13,349 | ||||||
144A 3.156%, 10/15/20(3) | 6,050 | 6,109 | ||||||
Sberbank of Russia (Sberbank CapItal SA) | 7,000 | 7,562 | ||||||
Springleaf Finance Corp. 5.250%, 12/15/19 | 9,585 | 9,813 | ||||||
State Street Corp. 4.956%, | 24,025 | 25,081 | ||||||
SunTrust Bank, Inc. | ||||||||
6.000%, 9/11/17 | 4,925 | 5,125 | ||||||
5.450%, 12/1/17 | 3,750 | 3,908 | ||||||
TIAA Asset Management Finance Co. LLC 144A 2.950%, 11/1/19(3) | 2,850 | 2,936 | ||||||
Toronto-Dominion Bank (The) | 11,005 | 11,137 | ||||||
Trinity Acquisition plc | ||||||||
3.500%, 9/15/21 | 1,485 | 1,548 | ||||||
4.400%, 3/15/26 | 9,145 | 9,583 | ||||||
Turkiye Garanti Bankasi AS 144A 4.750%, 10/17/19(3) | 8,500 | 8,587 | ||||||
| PAR VALUE | VALUE | |||||||
| Financials (continued) | ||||||||
Turkiye Is Bankasi 144A 3.750%, 10/10/18(3) | $ | 12,630 | $ | 12,507 | ||||
Turkiye Vakiflar Bankasi Tao 144A 3.750%, 4/15/18(3) | 4,000 | 3,970 | ||||||
UBS Group Funding Jersey Ltd. 144A 2.650%, 2/1/22(3) | 8,475 | 8,458 | ||||||
Vnesheconombank (VEB Finance plc) 144A 6.902%, 7/9/20(3) | 16,000 | 17,400 | ||||||
Wells Fargo & Co. (Wachovia Corp.) 5.625%, 10/15/16 | 2,500 | 2,503 | ||||||
Willis North America, Inc. | 4,960 | 5,068 | ||||||
XLIT Ltd. Series E, 2.300%, 12/15/18 | 9,730 | 9,845 | ||||||
Zions Bancorp 4.500%, 3/27/17 | 12,675 | 12,788 | ||||||
|
| |||||||
| 902,996 | ||||||||
|
| |||||||
| Health Care—2.4% | ||||||||
AbbVie, Inc. | ||||||||
2.500%, 5/14/20 | 11,705 | 11,949 | ||||||
3.200%, 11/6/22 | 1,940 | 2,020 | ||||||
Actavis Capital S.a.r.l. | ||||||||
(Actavis Funding) 3.000%, 3/12/20 | 2,825 | 2,912 | ||||||
(Actavis Funding) 3.450%, 3/15/22 | 3,815 | 4,005 | ||||||
Alere, Inc. 6.500%, 6/15/20 | 6,175 | 6,206 | ||||||
Community Health Systems, Inc. | 4,790 | 4,754 | ||||||
Concordia Healthcare Corp. 144A 7.000%, 4/15/23(3) | 1,510 | 974 | ||||||
Endo Finance LLC 144A | 720 | 659 | ||||||
Express Scripts Holding Co. | 2,330 | 2,449 | ||||||
See Notes to Financial Statements
27
Table of Contents
VIRTUS MULTI-SECTOR SHORT TERM BOND FUND
SCHEDULE OF INVESTMENTS (Continued)
SEPTEMBER 30, 2016
($ reported in thousands)
| PAR VALUE | VALUE | |||||||
| CORPORATE BONDS AND NOTES (continued) | ||||||||
| Health Care (continued) | ||||||||
Forest Laboratories LLC 144A | $ | 13,430 | $ | 14,154 | ||||
Fresenius U.S. Finance II, Inc. 144A 4.500%, 1/15/23(3) | 2,590 | 2,713 | ||||||
HCA, Inc. 6.500%, 2/15/20 | 19,575 | 21,679 | ||||||
inVentiv Health, Inc. 144A 9.000%, 1/15/18(3) | 8,625 | 8,873 | ||||||
Mylan NV | ||||||||
144A 3.000%, 12/15/18(3) | 5,360 | 5,478 | ||||||
144A 3.150%, 6/15/21(3) | 4,065 | 4,142 | ||||||
Owens & Minor, Inc. 3.875%, 9/15/21 | 2,485 | 2,570 | ||||||
Quintiles Transnational Corp. | 4,175 | 4,311 | ||||||
Shire Acquisitions Investments Ireland Dac | ||||||||
1.900%, 9/23/19 | 3,555 | 3,558 | ||||||
2.400%, 9/23/21 | 5,720 | 5,736 | ||||||
Tenet Healthcare Corp. | ||||||||
4.750%, 6/1/20 | 4,650 | 4,743 | ||||||
4.153%, 6/15/20(2) | 4,045 | 4,086 | ||||||
6.000%, 10/1/20 | 9,560 | 10,134 | ||||||
8.125%, 4/1/22 | 6,595 | 6,628 | ||||||
Teva Pharmaceutical Finance Netherlands III BV | ||||||||
2.200%, 7/21/21 | 2,670 | 2,665 | ||||||
2.800%, 7/21/23 | 2,640 | 2,648 | ||||||
Universal Health Services, Inc. 144A 4.750%, 8/1/22(3) | 4,515 | 4,662 | ||||||
Valeant Pharmaceuticals International, Inc. 144A 5.375%, 3/15/20(3) | 3,060 | 2,846 | ||||||
Zimmer Biomet Holdings, Inc. 3.150%, 4/1/22 | 17,905 | 18,524 | ||||||
| PAR VALUE | VALUE | |||||||
| Health Care (continued) | ||||||||
Zoetis, Inc. | $ | 2,780 | $ | 2,906 | ||||
|
| |||||||
| 168,984 | ||||||||
|
| |||||||
| Industrials—3.6% | ||||||||
ADT Corp. (The) 6.250%, 10/15/21 | 13,700 | 14,967 | ||||||
Air Canada Pass-Through-Trust 13-1, B 144A 5.375%, 5/15/21(3) | 19,071 | 19,643 | ||||||
America West Airlines Pass-Through-Trust 01-1, G | 40,537 | 44,033 | ||||||
BAE Systems Holdings, Inc. 144A 2.850%, 12/15/20(3) | 4,655 | 4,765 | ||||||
Bombardier, Inc. 144A 4.750%, 4/15/19(3) | 15,692 | 15,339 | ||||||
British Airways Pass-Through-Trust 13-1, B 144A 5.625%, 6/20/20(3) | 9,654 | 10,161 | ||||||
Cemex Finance LLC 144A 6.000%, 4/1/24(3) | 7,110 | 7,305 | ||||||
Continental Airlines Pass-Through-Trust | ||||||||
99-1, A 6.545%, 2/2/19 | 8,163 | 8,658 | ||||||
99-2, C2 AMBC | 8,696 | 9,153 | ||||||
00-1, A1 8.048%, 11/1/20 | 4,270 | 4,772 | ||||||
01-1, A1 6.703%, 6/15/21 | 4,878 | 5,238 | ||||||
Hawaiian Airlines Pass-Through Certificates 13-1B, | 6,905 | 6,913 | ||||||
JBS Investments GmbH 144A 7.250%, 4/3/24(3) | 1,535 | 1,570 | ||||||
Masco Corp. | 18,385 | 20,959 | ||||||
See Notes to Financial Statements
28
Table of Contents
VIRTUS MULTI-SECTOR SHORT TERM BOND FUND
SCHEDULE OF INVESTMENTS (Continued)
SEPTEMBER 30, 2016
($ reported in thousands)
| PAR VALUE | VALUE | |||||||
| CORPORATE BONDS AND NOTES (continued) | ||||||||
| Industrials (continued) | ||||||||
Penske Truck Leasing Co. LP RegS | $ | 3,470 | $ | 3,520 | ||||
Penske Truck Leasing Co., LP 144A 3.375%, 2/1/22(3) | 8,365 | 8,700 | ||||||
SCF Capital Ltd. 144A 5.375%, 6/16/23(3) | 8,460 | 8,849 | ||||||
Toledo Edison Co. (The) | 224 | 254 | ||||||
U.S. Airways Pass-Through-Trust 12-2, C | 13,180 | 13,526 | ||||||
UAL Pass-Through-Trust 07-01, A 6.636%, 7/2/22 | 22,898 | 24,386 | ||||||
United Airlines Pass-Through Trust 14-1, B | 4,800 | 4,907 | ||||||
United Rentals North America, Inc. | 13,600 | 13,940 | ||||||
Virgin Australia Trust 13-1A 144A 5.000%, 10/23/23(3) | 8,531 | 8,851 | ||||||
|
| |||||||
| 260,409 | ||||||||
|
| |||||||
| Information Technology—0.8% | ||||||||
Diamond 1 Finance Corp. (Diamond 2 Finance Corp.) 144A 5.450%, 6/15/23(3) | 3,715 | 3,979 | ||||||
Dun & Bradstreet Corp. (The) | ||||||||
3.250%, 12/1/17 | 12,110 | 12,307 | ||||||
4.000%, 6/15/20 | 4,660 | 4,863 | ||||||
Electronic Arts, Inc. | 2,265 | 2,407 | ||||||
Hewlett Packard Enterprise Co. | ||||||||
144A 2.850%, 10/5/18(3) | 9,690 | 9,873 | ||||||
144A 3.600%, 10/15/20(3) | 1,845 | 1,936 | ||||||
| PAR VALUE | VALUE | |||||||
| Information Technology (continued) | ||||||||
Microsoft Corp. | $ | 4,475 | $ | 4,470 | ||||
NXP BV (NXP Funding LLC) | ||||||||
144A 4.125%, 6/1/21(3) | 7,100 | 7,606 | ||||||
144A 4.625%, 6/1/23(3) | 4,675 | 5,125 | ||||||
Oracle Corp. | ||||||||
1.900%, 9/15/21 | 3,530 | 3,539 | ||||||
2.400%, 9/15/23 | 4,315 | 4,351 | ||||||
|
| |||||||
| 60,456 | ||||||||
|
| |||||||
| Materials—2.0% | ||||||||
Air Liquide Finance SA 144A 1.750%, 9/27/21(3) | 3,000 | 2,992 | ||||||
Airgas, Inc. | 890 | 924 | ||||||
Allegheny Technologies, Inc. | 7,245 | 7,788 | ||||||
Ardagh Packaging Finance plc | ||||||||
144A 6.250%, 1/31/19(3) | 2,705 | 2,776 | ||||||
144A 4.625%, 5/15/23(3) | 7,340 | 7,386 | ||||||
Cemex SAB de CV RegS | 5,200 | 5,525 | ||||||
CRH America, Inc. | 4,770 | 5,277 | ||||||
Fortescue Metals Group (FMG) Resources August 2006 Pty Ltd. 144A 9.750%, 3/1/22(3) | 6,820 | 7,945 | ||||||
Freeport-McMoRan Copper & Gold, Inc. | ||||||||
3.550%, 3/1/22 | 3,070 | 2,809 | ||||||
3.875%, 3/15/23 | 7,645 | 6,957 | ||||||
Gerdau Holdings, Inc. 144A 7.000%, 1/20/20(3) | 7,630 | 8,221 | ||||||
Gerdau Trade, Inc. 144A 5.750%, 1/30/21(3) | 1,700 | 1,770 | ||||||
See Notes to Financial Statements
29
Table of Contents
VIRTUS MULTI-SECTOR SHORT TERM BOND FUND
SCHEDULE OF INVESTMENTS (Continued)
SEPTEMBER 30, 2016
($ reported in thousands)
| PAR VALUE | VALUE | |||||||
| CORPORATE BONDS AND NOTES (continued) | ||||||||
| Materials (continued) | ||||||||
INEOS Group Holdings S.A. 144A 5.875%, 2/15/19(3) | $ | 5,870 | $ | 6,009 | ||||
Novelis Corp. 144A 6.250%, 8/15/24(3) | 605 | 644 | ||||||
Office Cherifien des Phosphates S.A. (OCP) 144A 5.625%, 4/25/24(3) | 17,090 | 18,562 | ||||||
Packaging Corp. of America | 7,215 | 7,630 | ||||||
Reynolds Group Issuer, Inc. | ||||||||
5.750%, 10/15/20 | 12,945 | 13,366 | ||||||
144A 4.127%, 7/15/21(2)(3) | 3,100 | 3,154 | ||||||
144A 5.125%, 7/15/23(3) | 1,600 | 1,654 | ||||||
144A 7.000%, 7/15/24(3) | 110 | 118 | ||||||
Teck Resources Ltd. 144A 8.000%, 6/1/21(3) | 1,570 | 1,721 | ||||||
United States Steel Corp. | 941 | 941 | ||||||
Vale Overseas Ltd. | 7,475 | 7,845 | ||||||
Vedanta Resources plc 144A 6.000%, 1/31/19(3) | 17,325 | 17,282 | ||||||
|
| |||||||
| 139,296 | ||||||||
|
| |||||||
| Real Estate—1.5% | ||||||||
American Campus Communities Operating Partnership LP | 2,040 | 2,124 | ||||||
Brixmor Operating Partnership LP | 5,570 | 5,839 | ||||||
Developers Diversified Realty Corp. | ||||||||
3.400%, 10/1/20 | 11,735 | 12,230 | ||||||
3.950%, 7/1/22 | 8,175 | 8,665 | ||||||
| PAR VALUE | VALUE | |||||||
| Real Estate (continued) | ||||||||
Government Properties Income Trust | $ | 2,905 | $ | 2,976 | ||||
HCP, Inc. 3.750%, 2/1/19 | 4,035 | 4,177 | ||||||
Kimco Realty Corp. | 10,605 | 11,173 | ||||||
MPT Operating Partnership LP (MPT Finance Corp.) | 1,150 | 1,199 | ||||||
Select Income REIT | 18,910 | 19,002 | ||||||
Senior Housing Properties Trust | 6,685 | 6,740 | ||||||
Ventas Realty LP (Ventas Capital Corp.) | ||||||||
4.000%, 4/30/19 | 7,100 | 7,459 | ||||||
2.700%, 4/1/20 | 2,948 | 3,021 | ||||||
Welltower, Inc. | 4,100 | 4,311 | ||||||
West Europe Finance LLC 144A 3.250%, 10/5/20(3) | 19,265 | 20,073 | ||||||
|
| |||||||
| 108,989 | ||||||||
|
| |||||||
| Telecommunication Services—1.8% | ||||||||
Altice Financing S.A. 144A 6.625%, 2/15/23(3) | 10,620 | 10,939 | ||||||
AT&T, Inc. | ||||||||
5.800%, 2/15/19 | 11,000 | 12,065 | ||||||
2.800%, 2/17/21 | 7,200 | 7,409 | ||||||
4.125%, 2/17/26 | 6,955 | 7,520 | ||||||
CenturyLink, Inc. | ||||||||
Series T 5.800%, 3/15/22 | 13,410 | 13,795 | ||||||
Series Y 7.500%, 4/1/24 | 5,185 | 5,548 | ||||||
Crown Castle International Corp. | 870 | 908 | ||||||
See Notes to Financial Statements
30
Table of Contents
VIRTUS MULTI-SECTOR SHORT TERM BOND FUND
SCHEDULE OF INVESTMENTS (Continued)
SEPTEMBER 30, 2016
($ reported in thousands)
| PAR VALUE | VALUE | |||||||
| CORPORATE BONDS AND NOTES (continued) | ||||||||
| Telecommunication Services (continued) | ||||||||
Crown Castle Towers LLC | ||||||||
144A 6.113%, 1/15/20(3) | $ | 5,900 | $ | 6,539 | ||||
144A 3.222%, 5/15/22(3) | 3,000 | 3,093 | ||||||
Digicel Group Ltd. 144A | 10,365 | 9,056 | ||||||
Frontier Communications Corp. | ||||||||
8.500%, 4/15/20 | 3,200 | 3,472 | ||||||
8.875%, 9/15/20 | 3,380 | 3,659 | ||||||
10.500%, 9/15/22 | 3,650 | 3,883 | ||||||
Sprint Communications, Inc. 6.000%, 11/15/22 | 14,060 | 13,234 | ||||||
Sprint Corp. 7.250%, 9/15/21 | 4,080 | 4,121 | ||||||
T-Mobile USA, Inc. 6.542%, 4/28/20 | 7,905 | 8,182 | ||||||
Telefonica Emisiones SAU 3.192%, 4/27/18 | 2,805 | 2,871 | ||||||
Windstream Corp. 7.750%, 10/15/20 | 12,125 | 12,428 | ||||||
|
| |||||||
| 128,722 | ||||||||
|
| |||||||
| Utilities—1.1% | ||||||||
AmeriGas Partners LP 7.000%, 5/20/22 | 9,275 | 9,855 | ||||||
Dominion Resources, Inc. | 1,760 | 1,806 | ||||||
Exelon Corp. | 18,845 | 19,520 | ||||||
Korea Western Power Co., Ltd. 144A | 9,800 | 9,889 | ||||||
Majapahit Holding BV 144A 7.750%, 1/20/20(3) | 8,800 | 10,142 | ||||||
| PAR VALUE | VALUE | |||||||
| Utilities (continued) | ||||||||
State Grid Overseas Investment Ltd. | ||||||||
144A 1.750%, 5/22/18(3) | $ | 5,000 | $ | 5,011 | ||||
144A 2.750%, 5/7/19(3) | 9,370 | 9,635 | ||||||
Talen Energy Supply LLC 144A 4.625%, 7/15/19(3) | 10,340 | 9,771 | ||||||
|
| |||||||
| 75,629 | ||||||||
| TOTAL CORPORATE BONDS AND NOTES | ||||||||
| (Identified Cost $2,452,270) | 2,478,042 | |||||||
| LOAN AGREEMENTS(2)—11.6% | ||||||||
| Consumer Discretionary—3.6% | ||||||||
Altice U.S. Finance I Corp. | 12,806 | 12,922 | ||||||
Aristocrat Leisure Ltd. Tranche B-1 | 8,791 | 8,836 | ||||||
Aspen Merger Sub (Coinstar), Inc. | 3,897 | 3,920 | ||||||
Boyd Gaming Corp. | ||||||||
Tranche B, | 2,303 | 2,321 | ||||||
Tranche B-2 | 4,156 | 4,193 | ||||||
Caesars Entertainment Operating Co., Inc. | ||||||||
Tranche B-4, | 3,616 | 4,171 | ||||||
Tranche B-6, | 3,861 | 4,237 | ||||||
Caesars Entertainment Resort Properties LLC | 11,460 | 11,456 | ||||||
Caesars Growth Properties Holdings LLC Tranche B, First Lien, | 4,252 | 4,209 | ||||||
See Notes to Financial Statements
31
Table of Contents
VIRTUS MULTI-SECTOR SHORT TERM BOND FUND
SCHEDULE OF INVESTMENTS (Continued)
SEPTEMBER 30, 2016
($ reported in thousands)
| PAR VALUE | VALUE | |||||||
| LOAN AGREEMENTS (continued) | ||||||||
| Consumer Discretionary (continued) | ||||||||
CDS U.S. Intermediate Holdings, Inc. First Lien, | $ | 5,679 | $ | 5,694 | ||||
Cengage Learning, Inc. | 4,771 | 4,775 | ||||||
Charter Communications Operating LLC (CCO Safari LLC) | ||||||||
Tranche E, 3.000%, 7/1/20 | 6,289 | 6,316 | ||||||
Tranche F, 3.000%, 1/3/21 | 14,232 | 14,292 | ||||||
Tranche I, 3.500%, 1/24/23 | 2,865 | 2,887 | ||||||
CityCenter Holdings LLC Tranche B, | 5,909 | 5,958 | ||||||
CSC Holdings, Inc. | 16,706 | 16,778 | ||||||
Delta 2 (Lux) S.a.r.l. Tranche B-3, | 7,421 | 7,443 | ||||||
Diamond Resorts International, Inc. | 827 | 824 | ||||||
El Dorado Resorts, Inc. | 2,743 | 2,757 | ||||||
Harbor Freight Tools USA, Inc. | 17,779 | 17,901 | ||||||
Hilton Worldwide Finance LLC | ||||||||
Tranche B-1 | 1,136 | 1,144 | ||||||
Tranche B-2 | 11,610 | 11,696 | ||||||
Intelsat Jackson Holdings S.A. Tranche B-2, | 7,912 | 7,544 | ||||||
Las Vegas Sands LLC Tranche B, | 6,802 | 6,848 | ||||||
| PAR VALUE | VALUE | |||||||
| Consumer Discretionary (continued) | ||||||||
Libbey Glass, Inc. | $ | 5,625 | $ | 5,649 | ||||
MGM Growth Properties | 7,130 | 7,204 | ||||||
Nexstar Broadcasting, Inc. | 347 | 349 | ||||||
PetSmart, Inc. Tranche B-1, | 17,463 | 17,518 | ||||||
Scientific Games International, Inc. | ||||||||
6.000%, 10/18/20 | 2,764 | 2,776 | ||||||
Tranche B-2, | 3,366 | 3,377 | ||||||
Seminole Tribe of Florida, Inc. | 6,742 | 6,775 | ||||||
ServiceMaster Co. LLC (The) | 8,334 | 8,429 | ||||||
Sinclair Television Group, Inc. Tranche B-1, | 11,514 | 11,594 | ||||||
Six Flags Theme Parks, Inc. Tranche B, | 4,979 | 5,023 | ||||||
Station Casinos LLC Tranche B, | 6,346 | 6,398 | ||||||
Tribune Media Co. Tranche B, | 6,912 | 6,978 | ||||||
UFC Holdings LLC First Lien | 8,331 | 8,417 | ||||||
|
| |||||||
| 259,609 | ||||||||
|
| |||||||
| Consumer Staples—1.6% | ||||||||
Albertson’s LLC | ||||||||
Tranche B-4, | 15,996 | 16,139 | ||||||
Tranche B-5, | 2,172 | 2,196 | ||||||
See Notes to Financial Statements
32
Table of Contents
VIRTUS MULTI-SECTOR SHORT TERM BOND FUND
SCHEDULE OF INVESTMENTS (Continued)
SEPTEMBER 30, 2016
($ reported in thousands)
| PAR VALUE | VALUE | |||||||
| LOAN AGREEMENTS (continued) | ||||||||
| Consumer Staples (continued) | ||||||||
ARAMARK Corp. | ||||||||
Tranche E, | $ | 11,971 | $ | 12,060 | ||||
Tranche F, 3.338%, 2/24/21 | 14,483 | 14,592 | ||||||
Charger OpCo B.V. (Oak Tea, Inc.) Tranche B-1, | 3,106 | 3,131 | ||||||
Chobani LLC | 2,550 | 2,537 | ||||||
Coty, Inc. Tranche B, | 2,748 | 2,784 | ||||||
Dell International, Inc. Tranche B | 13,017 | 13,110 | ||||||
Galleria Co. Tranche B, | 5,523 | 5,556 | ||||||
Hostess Brands LLC Tranche B, First Lien, | 13,596 | 13,711 | ||||||
Kronos | ||||||||
First Lien, | 21,860 | 21,960 | ||||||
Second Lien, | 5,611 | 5,721 | ||||||
Pinnacle Foods Finance LLC | 986 | 995 | ||||||
|
| |||||||
| 114,492 | ||||||||
|
| |||||||
| Energy—0.2% | ||||||||
EP Energy LLC | 4,868 | 4,788 | ||||||
Paragon Offshore Finance Co. | 9,933 | 2,502 | ||||||
Seadrill Operating LP | 8,815 | 4,426 | ||||||
|
| |||||||
| 11,716 | ||||||||
|
| |||||||
| Financials—0.6% | ||||||||
Asurion LLC Tranche B-4, | 6,201 | 6,241 | ||||||
| PAR VALUE | VALUE | |||||||
| Financials (continued) | ||||||||
Clipper Acquisitions Corp. Tranche B, | $ | 6,141 | $ | 6,133 | ||||
Delos Finance S.a.r.l. | 16,529 | 16,667 | ||||||
iStar Financial, Inc. | 3,209 | 3,247 | ||||||
TransUnion LLC Tranche B-2, | 10,070 | 10,117 | ||||||
|
| |||||||
| 42,405 | ||||||||
|
| |||||||
| Health Care—1.2% | ||||||||
American Renal Holdings, Inc. Tranche B, First Lien, | 8,946 | 8,957 | ||||||
Change Healthcare Holdings, Inc. Tranche B-2, | 5,222 | 5,238 | ||||||
Community Health Systems, Inc. (CHS) Tranche F, | 7,911 | 7,879 | ||||||
Endo Luxembourg Finance Co. S.a.r.l. Tranche B, | 5,529 | 5,524 | ||||||
Envision Healthcare Corp. | 6,541 | 6,556 | ||||||
InVentiv Health, Inc. | ||||||||
Tranche B-4, | 8,750 | 8,775 | ||||||
Tranche B 0.000%, 9/29/23(12) | 5,363 | 5,385 | ||||||
MPH Acquisition Holdings LLC | 3,494 | 3,543 | ||||||
Quintiles Transnational Corp. Tranche B, | 2,446 | 2,450 | ||||||
Quorum Health Corp. | 6,311 | 6,134 | ||||||
See Notes to Financial Statements
33
Table of Contents
VIRTUS MULTI-SECTOR SHORT TERM BOND FUND
SCHEDULE OF INVESTMENTS (Continued)
SEPTEMBER 30, 2016
($ reported in thousands)
| PAR VALUE | VALUE | |||||||
| LOAN AGREEMENTS (continued) | ||||||||
| Health Care (continued) | ||||||||
RPI Finance Trust Tranche B-4, 3.588%, 11/9/20 | $ | 5,862 | $ | 5,897 | ||||
Team Health, Inc. Tranche B, | 7,571 | 7,623 | ||||||
U.S. Renal Care, Inc. First Lien, | 3,138 | 3,020 | ||||||
Valeant Pharmaceuticals International, Inc. Series D-2, Tranche B, | 11,801 | 11,827 | ||||||
|
| |||||||
| 88,808 | ||||||||
|
| |||||||
| Industrials—1.2% | ||||||||
Air Canada 0.000%, 9/21/23(12) | 3,125 | 3,136 | ||||||
American Airlines, Inc. | ||||||||
3.250%, 6/27/20 | 5,991 | 6,011 | ||||||
3.250%, 10/10/21 | 10,886 | 10,921 | ||||||
Tranche B, | 16,065 | 16,128 | ||||||
AWAS Finance Luxembourg S.A. | 6,808 | 6,843 | ||||||
Brock Holdings III, Inc. First Lien, | 7,025 | 6,965 | ||||||
Husky Injection Molding Systems Ltd. | 5,186 | 5,185 | ||||||
McGraw-Hill Global Education Holdings LLC Tranche B, First Lien, | 10,813 | 10,899 | ||||||
U.S. Airways, Inc. Tranche B-1, | 6,695 | 6,711 | ||||||
| PAR VALUE | VALUE | |||||||
| Industrials (continued) | ||||||||
United Airlines, Inc. (f/k/a Continental Airlines, Inc.) Tranche B-1, | $ | 4,721 | $ | 4,751 | ||||
Waste Industries | 9,800 | 9,856 | ||||||
|
| |||||||
| 87,406 | ||||||||
|
| |||||||
| Information Technology—1.3% | ||||||||
Abacus Innovations Corp.(Leidos, Inc.) | 5,366 | 5,404 | ||||||
Blackboard, Inc. Tranche B-4 | 7,410 | 7,364 | ||||||
First Data Corp. | ||||||||
Tranche 2021 | 27,586 | 27,822 | ||||||
Tranche 2022 | 6,007 | 6,049 | ||||||
Infinity Acquisition Ltd. | 6,018 | 5,755 | ||||||
Mitchell International, Inc. | ||||||||
4.500%, 10/13/20 | 4,981 | 4,988 | ||||||
Second Lien, | 4,763 | 4,669 | ||||||
NXP BV Tranche F | 6,743 | 6,782 | ||||||
On Semiconductor | 3,399 | 3,419 | ||||||
Presidio, Inc. Refinancing, | 8,441 | 8,451 | ||||||
Press Ganey Holdings, Inc. | 911 | 913 | ||||||
SS&C European Holdings S.a.r.l. | ||||||||
Tranche A-1, | 849 | 851 | ||||||
Tranche A-2, | 1,317 | 1,320 | ||||||
Tranche B-2, | 629 | 634 | ||||||
See Notes to Financial Statements
34
Table of Contents
VIRTUS MULTI-SECTOR SHORT TERM BOND FUND
SCHEDULE OF INVESTMENTS (Continued)
SEPTEMBER 30, 2016
($ reported in thousands)
| PAR VALUE | VALUE | |||||||
| LOAN AGREEMENTS (continued) | ||||||||
| Information Technology (continued) | ||||||||
Tranche B-1, | $ | 5,059 | $ | 5,105 | ||||
Western Digital Corp. Tranche B-1, | 4,782 | 4,838 | ||||||
|
| |||||||
| 94,364 | ||||||||
|
| |||||||
| Materials—0.5% | ||||||||
Berry Plastics Corp. Tranche H, 3.750%, 10/1/22 | 7,493 | 7,527 | ||||||
CPI Acquisition, Inc. First Lien, 5.500%, 8/17/22 | 7,121 | 6,975 | ||||||
Fortescue Metals Group (FMG) Resources Property Ltd. 3.750%, 6/30/19 | 5,107 | 5,108 | ||||||
Huntsman International LLC Tranche 16-B, 4.250%, 4/1/23 | 3,904 | 3,937 | ||||||
INEOS U.S. Finance LLC Tranche 2022, 4.250%, 3/31/22 | 5,682 | 5,714 | ||||||
PolyOne Corp. Tranche B-1, 3.500%, 11/11/22 | 6,839 | 6,916 | ||||||
|
| |||||||
| 36,177 | ||||||||
|
| |||||||
| Real Estate—0.3% | ||||||||
Capital Automotive LP | ||||||||
Tranche B-1, 4.000%, 4/10/19 | 2,566 | 2,588 | ||||||
Second Lien, 6.000%, 4/30/20 | 6,047 | 6,108 | ||||||
ESH Hospitality, Inc. 3.750%, 8/30/23 | 2,497 | 2,519 | ||||||
Realogy Group LLC 3.750%, 7/20/22 | 9,141 | 9,263 | ||||||
|
| |||||||
| 20,478 | ||||||||
|
| |||||||
| PAR VALUE | VALUE | |||||||
| Telecommunication Services—0.3% | ||||||||
Level 3 Financing, Inc. | ||||||||
Tranche B-III, 4.000%, 8/1/19 | $ | 6,319 | $ | 6,358 | ||||
Tranche B-II, 3.500%, 5/31/22 | 5,842 | 5,883 | ||||||
UPC Financing Partnership 4.080%, 8/31/24 | 5,560 | 5,588 | ||||||
|
| |||||||
| 17,829 | ||||||||
|
| |||||||
| Utilities—0.8% | ||||||||
Calpine Construction Finance Co. LP Tranche B-1, 3.090%, 5/3/20 | 8,257 | 8,210 | ||||||
Dynegy Finance IV, Inc. 5.000%, 6/27/23 | 9,128 | 9,213 | ||||||
Energy Future Holdings Corp. | ||||||||
5.000%, 10/31/17(10) | 6,017 | 6,070 | ||||||
Tranche C 5.000%, 10/31/17(10) | 1,373 | 1,385 | ||||||
NRG Energy, Inc. 3.500%, 6/30/23 | 17,777 | 17,840 | ||||||
State of Santa Catarina (The) 4.000%, 12/27/22 | 12,561 | 11,318 | ||||||
Texas Competitive Electric Holdings Co. LLC 2017 Extended, | ||||||||
4.998%, 10/10/17(10) | 5,925 | 1,723 | ||||||
|
| |||||||
| 55,759 | ||||||||
| TOTAL LOAN AGREEMENTS (Identified Cost $839,570) | 829,043 | |||||||
| SHARES | ||||||||
| PREFERRED STOCKS—1.0% | ||||||||
| Energy—0.1% | ||||||||
PTT Exploration & Production PCL 144A, 4.875%(2)(3) | 8,645 | (8) | 8,812 | |||||
|
| |||||||
See Notes to Financial Statements
35
Table of Contents
VIRTUS MULTI-SECTOR SHORT TERM BOND FUND
SCHEDULE OF INVESTMENTS (Continued)
SEPTEMBER 30, 2016
($ reported in thousands)
| SHARES | VALUE | |||||||
| PREFERRED STOCKS (continued) | ||||||||
| Financials—0.9% | ||||||||
Banco Bilbao Vizcaya Argentaria S.A. International S.A. Unipersonal | 2,295 | (8) | $ | 2,289 | ||||
Bank of New York Mellon Corp. (The) Series E, 4.950%(2) | 12,070 | (8) | 12,312 | |||||
Citigroup, Inc. | 17,805 | 19,201 | ||||||
JPMorgan Chase & Co. | 3,985 | (8) | 4,050 | |||||
Wells Fargo & Co. | 16,155 | (8) | 16,884 | |||||
XLIT Ltd. Series E, 6.50%(2) | 12,790 | (8) | 9,591 | |||||
|
| |||||||
| 64,327 | ||||||||
| TOTAL PREFERRED STOCKS (Identified Cost $74,582) | 73,139 | |||||||
| AFFILIATED MUTUAL FUND—1.0% | ||||||||
Virtus Credit Opportunities Fund Class R6(11) | 6,989,143 | 68,703 | ||||||
| TOTAL AFFILIATED MUTUAL FUND (Identified Cost $69,865) | 68,703 | |||||||
| TOTAL LONG TERM INVESTMENTS—99.2% | ||||||||
| (Identified Cost $7,062,660) | 7,095,296 | (14) | ||||||
| TOTAL INVESTMENTS—99.2% (Identified Cost $7,062,660) | 7,095,296 | (1) | ||||||
Other assets and liabilities, net—0.8% |
| 57,032 | ||||||
|
| |||||||
| NET ASSETS—100.0% | $ | 7,152,328 | ||||||
|
| |||||||
Abbreviations:
| FHLMC | Federal Home Loan Mortgage Corporation (“Freddie Mac”). |
| FNMA | Federal National Mortgage Association (“Fannie Mae”). |
| GNMA | Government National Mortgage Association (“Ginnie Mae”) |
| REIT | Real Estate Investment Trust |
FOOTNOTE LEGEND:
| (1) | Federal Income Tax Information: For tax information at September 30, 2016, see Note 10 Federal Income Tax Information in the Notes to Financial Statements. |
| (2) | Variable or step coupon security; interest rate shown reflects the rate in effect at September 30, 2016. |
| (3) | Security exempt from registration under Rule 144A of the Securities Act of 1933. These securities may be resold in transactions exempt from registration, normally to qualified institutional buyers. At September 30, 2016, these securities amounted to a value of $2,839,881 or 39.7% of net assets. |
| (4) | Regulation S security. Security is offered and sold outside of the United States, therefore, it is exempt from registration with the SEC under Rules 903 and 904 of the Securities Act of 1933. |
| (5) | This Note was issued for the sole purpose of funding a loan agreement between the issuer and the borrower. As the credit risk for this security lies solely with the borrower, the name represented here is that of the borrower. |
| (6) | No contractual maturity date. |
| (7) | Interest payments may be deferred. |
| (8) | Value shown as par value. |
| (9) | Security in default no interest payments are being received during bankruptcy proceedings. |
| (10) | Security in default, interest payments are being received during the bankruptcy proceedings. |
| (11) | Shares of this fund are publicly offered and its prospectus and annual report are publicly available. |
| (12) | This loan will settle after September 30, 2016, at which time the interest rate, based on the London Interbank Offered Rate (“LIBOR”) and the agreed upon spread on trade date, will be reflected. |
| (13) | Illiquid security. |
| (14) | All or a portion of the Fund’s assets have been segregated for delayed delivery security. |
| (15) | Security in default, a portion of the interest payments are being received during the bankruptcy proceedings. |
Foreign Currencies:
| BRL | Brazilian Real |
| CLP | Chilean Peso |
| COP | Colombian Peso |
See Notes to Financial Statements
36
Table of Contents
VIRTUS MULTI-SECTOR SHORT TERM BOND FUND
SCHEDULE OF INVESTMENTS (Continued)
SEPTEMBER 30, 2016
($ reported in thousands)
| IDR | Indonesian Rupiah |
| MXN | Mexican Peso |
| TRY | Turkish Lira |
| ZAR | South African Rand |
| RUB | Russian Ruble |
| Country Weightings† (Unaudited) | ||||
United States | 80 | % | ||
Turkey | 2 | |||
Australia | 1 | |||
Brazil | 1 | |||
Canada | 1 | |||
India | 1 | |||
Luxembourg | 1 | |||
Other | 13 | |||
Total | 100 | % | ||
| † | % of total investments as of September 30, 2016 |
The following table provides a summary of inputs used to value the Fund’s investments as of September 30, 2016 (See Security Valuation Note 2A in the Notes to Financial Statements):
| Total Value at September 30, 2016 | Level 1 Quoted Prices | Level 2 Significant Observable Inputs | Level 3 Significant Unobservable Inputs | |||||||||||||
Debt Securities: | ||||||||||||||||
Asset-Backed Securities | $ | 1,341,950 | $ | — | $ | 1,333,587 | $ | 8,363 | ||||||||
Corporate Bonds and Notes | 2,478,042 | — | 2,475,447 | 2,595 | ||||||||||||
Foreign Government Securities | 405,573 | — | 405,573 | — | ||||||||||||
Loan Agreements | 829,043 | — | 817,725 | 11,318 | ||||||||||||
Mortgage-Backed Securities | 1,797,728 | — | 1,797,728 | — | ||||||||||||
Municipal Bonds | 3,981 | — | 3,981 | — | ||||||||||||
U.S. Government Securities | 97,137 | — | 97,137 | — | ||||||||||||
Equity Securities: | ||||||||||||||||
Affiliated Mutual Fund | 68,703 | 68,703 | — | — | ||||||||||||
Preferred Stocks | 73,139 | — | 73,139 | — | ||||||||||||
|
|
|
|
|
|
|
| |||||||||
Total Investments | $ | 7,095,296 | $ | 68,703 | $ | 7,004,317 | $ | 22,276 | ||||||||
|
|
|
|
|
|
|
| |||||||||
There were no transfers between Level 1 and Level 2 related to securities held at September 30, 2016.
See Notes to Financial Statements
37
Table of Contents
VIRTUS MULTI-SECTOR SHORT TERM BOND FUND
SCHEDULE OF INVESTMENTS (Continued)
SEPTEMBER 30, 2016
($ reported in thousands)
The following is a reconciliation of assets of the Fund for Level 3 investments for which significant unobservable inputs were used to determine fair value.
| Total | Asset- Backed Securities | Corporate Bonds and Notes | Loan Agreements | |||||||||||||
Investments in Securities | ||||||||||||||||
Balance as of September 30, 2015: | $ | 24,541 | $ | 12,296 | $ | — | $ | 12,245 | ||||||||
Accrued discount/(premium) | (120 | ) | — | — | (120 | ) | ||||||||||
Realized gain (loss) | (77 | ) | 7 | — | (84 | ) | ||||||||||
Change in unrealized appreciation/(depreciation)(c) | 827 | 181 | — | 646 | ||||||||||||
Purchases | — | — | — | — | ||||||||||||
Sales(b) | (5,490 | ) | (4,121 | ) | — | (1,369 | ) | |||||||||
Transfers into Level 3(a) | 2,595 | (d) | — | 2,595 | (d) | — | ||||||||||
Transfers from Level 3(a) | — | — | — | — | ||||||||||||
|
|
|
|
|
|
|
| |||||||||
Balance as of September 30, 2016 | $ | 22,276 | (e) | $ | 8,363 | (e) | $ | 2,595 | (e) | $ | 11,318 | (e) | ||||
|
|
|
|
|
|
|
| |||||||||
| (a) | “Transfers into and/or from” represent the ending value as of September 30, 2016, for any investment security where a change in the pricing level occurred from the beginning to the end of the period. |
| (b) | Includes paydown on securities. |
| (c) | Included in the related net change in unrealized appreciation/(depreciation) in the Statement of Operations. The change in unrealized appreciation/(depreciation) on investments still held as of September 30, 2016 was $985. |
| (d) | The transfers into Level 3 are due to a decrease in trading activities at period end. |
| (e) | The Fund’s investments that are categorized as Level 3 were valued utilizing third party pricing information without adjustment. Such valuations are based on unobservable inputs. A significant change in third party information could result in a significantly lower or higher value of Level 3 investments. |
None of the securities in this table are fair valued.
See Notes to Financial Statements
38
Table of Contents
VIRTUS MULTI-SECTOR SHORT TERM BOND FUND
STATEMENT OF ASSETS AND LIABILITIES
SEPTEMBER 30, 2016
(Reported in thousands except shares and per share amounts)
Assets | ||||
Investment in unaffiliated securities at value(1) | $ | 7,026,593 | ||
Investment in affiliated securities at value(2) | 68,703 | |||
Foreign currency at value(3) | — | (4) | ||
Cash | 32,134 | |||
Receivables | ||||
Investment securities sold | 43,195 | |||
Fund shares sold | 17,668 | |||
Dividends and interest receivable | 53,120 | |||
Prepaid expenses | 193 | |||
Prepaid trustee retainer | 147 | |||
Other assets | 95 | |||
|
| |||
Total assets | 7,241,848 | |||
|
| |||
Liabilities | ||||
Payables | ||||
Fund shares repurchased | 22,778 | |||
Investment securities purchased | 59,443 | |||
Dividend distributions | 1,024 | |||
Investment advisory fees | 2,729 | |||
Distribution and service fees | 1,211 | |||
Administration fees | 710 | |||
Transfer agent fees and expenses | 1,137 | |||
Trustee deferred compensation plan | 95 | |||
Trustees’ fees and expenses | 70 | |||
Professional fees | 46 | |||
Other accrued expenses | 277 | |||
|
| |||
Total liabilities | 89,520 | |||
|
| |||
Net Assets | $ | 7,152,328 | ||
|
| |||
Net Assets Consist of: | ||||
Capital paid in on shares of beneficial interest | $ | 7,212,310 | ||
Accumulated undistributed net investment income (loss) | 13,224 | |||
Accumulated undistributed net realized gain (loss) | (105,889 | ) | ||
Net unrealized appreciation (depreciation) on investments | 32,683 | |||
|
| |||
Net Assets | $ | 7,152,328 | ||
|
| |||
Class A | ||||
Net asset value (net assets/shares outstanding) per share | $ | 4.78 | ||
Maximum offering price per share NAV/(1–2.25%) | $ | 4.89 | ||
Shares of beneficial interest outstanding, no par value, unlimited authorization | 273,614,622 | |||
Net Assets | $ | 1,307,484 | ||
Class B | ||||
Net asset value (net assets/shares outstanding) and offering price per share | $ | 4.75 | ||
Shares of beneficial interest outstanding, no par value, unlimited authorization | 22,717 | |||
Net Assets | $ | 108 | ||
Class C | ||||
Net asset value (net assets/shares outstanding) and offering price per share | $ | 4.84 | ||
Shares of beneficial interest outstanding, no par value, unlimited authorization | 273,004,072 | |||
Net Assets | $ | 1,321,202 | ||
Class T | ||||
Net asset value (net assets/shares outstanding) and offering price per share | $ | 4.83 | ||
Shares of beneficial interest outstanding, no par value, unlimited authorization | 101,528,260 | |||
Net Assets | $ | 489,924 | ||
Class I | ||||
Net asset value (net assets/shares outstanding) and offering price per share | $ | 4.78 | ||
Shares of beneficial interest outstanding, no par value, unlimited authorization | 843,089,081 | |||
Net Assets | $ | 4,033,610 | ||
(1) Investment in unaffiliated securities at cost | $ | 6,992,795 | ||
(2) Investment in affiliated securities at cost | 69,865 | |||
(3) Foreign currency at cost | — | (4) | ||
(4) Amount is less than $500. |
See Notes to Financial Statements
39
Table of Contents
VIRTUS MULTI-SECTOR SHORT TERM BOND FUND
YEAR ENDED SEPTEMBER 30, 2016
($ reported in thousands)
| Investment Income | ||||
Dividends | $ | 932 | ||
Dividends from affiliated fund | 2,610 | |||
Interest | 300,142 | |||
Foreign taxes withheld | (192 | ) | ||
|
| |||
Total investment income | 303,492 | |||
|
| |||
| Expenses | ||||
Investment advisory fees | 34,064 | |||
Service fees, Class A | 3,556 | |||
Distribution and service fees, Class B | 1 | |||
Distribution and service fees, Class C | 6,738 | |||
Distribution and service fees, Class T | 5,270 | |||
Administration fees | 9,105 | |||
Transfer agent fees and expenses | 8,203 | |||
Registration fees | 277 | |||
Printing fees and expenses | 1,390 | |||
Custodian fees | 139 | |||
Professional fees | 157 | |||
Trustees’ fees and expenses | 629 | |||
Miscellaneous expenses | 791 | |||
|
| |||
Total expenses | 70,320 | |||
Less expenses reimbursed and/or waived by investment adviser | (305 | ) | ||
Earnings credit from custodian | (58 | ) | ||
Low balance account fees | (1 | ) | ||
|
| |||
Net expenses | 69,956 | |||
|
| |||
| Net investment income (loss) | 233,536 | |||
|
| |||
| Net Realized and Unrealized Gain (Loss) on Investments | ||||
Net realized gain (loss) on unaffiliated investments | (49,665 | ) | ||
Net realized gain (loss) on foreign currency transactions | (478 | ) | ||
Net change in unrealized appreciation (depreciation) on unaffiliated investments | 153,322 | |||
Net change in unrealized appreciation (depreciation) on affiliated investments | 425 | |||
Net change in unrealized appreciation (depreciation) on foreign currency translation | 254 | |||
|
| |||
| Net gain (loss) on investments | 103,858 | |||
|
| |||
| Net increase (decrease) in net assets resulting from operations | $ | 337,394 | ||
|
|
See Notes to Financial Statements
40
Table of Contents
VIRTUS MULTI-SECTOR SHORT TERM BOND FUND
STATEMENTS OF CHANGES IN NET ASSETS
(Reported in thousands)
| Year Ended September 30, 2016 | Year Ended September 30, 2015 | |||||||
| INCREASE/(DECREASE) IN NET ASSETS | ||||||||
| From Operations | ||||||||
Net investment income (loss) | $ | 233,536 | $ | 269,183 | ||||
Net realized gain (loss) | (50,143 | ) | (127,914 | ) | ||||
Net change in unrealized appreciation (depreciation) | 154,001 | (150,759 | ) | |||||
|
|
|
| |||||
| Increase (decrease) in net assets resulting from operations | 337,394 | (9,490 | ) | |||||
|
|
|
| |||||
| From Distributions to Shareholders | ||||||||
Net investment income, Class A | (40,862 | ) | (42,497 | ) | ||||
Net investment income, Class B | (4 | ) | (18 | ) | ||||
Net investment income, Class C | (34,858 | ) | (34,290 | ) | ||||
Net investment income, Class T | (11,050 | ) | (10,794 | ) | ||||
Net investment income, Class I | (122,921 | ) | (119,152 | ) | ||||
Return of capital Class A | — | (8,732 | ) | |||||
Return of capital Class B | — | (4 | ) | |||||
Return of capital Class C | — | (7,997 | ) | |||||
Return of capital Class T | — | (3,261 | ) | |||||
Return of capital Class I | — | (22,250 | ) | |||||
|
|
|
| |||||
| Decrease in net assets from distributions to shareholders | (209,695 | ) | (248,995 | ) | ||||
|
|
|
| |||||
| From Share Transactions | ||||||||
| Sale of shares | ||||||||
Class A (56,640 and 91,590 shares, respectively) | 265,248 | 438,116 | ||||||
Class B (0 and 9 shares, respectively) | — | 45 | ||||||
Class C (47,747 and 82,833 shares, respectively) | 226,847 | 401,212 | ||||||
Class T (6,103 and 9,811 shares, respectively) | 28,792 | 47,392 | ||||||
Class I (259,826 and 269,095 shares, respectively) | 1,217,904 | 1,287,295 | ||||||
| Reinvestment of distributions | ||||||||
Class A (8,038 and 9,714 shares, respectively) | 37,677 | 46,369 | ||||||
Class B (1 and 4 shares, respectively) | 4 | 21 | ||||||
Class C (7,272 and 8,562 shares, respectively) | 34,521 | 41,374 | ||||||
Class T (1,526 and 1,870 shares, respectively) | 7,223 | 9,014 | ||||||
Class I (22,702 and 25,004 shares, respectively) | 106,611 | 119,514 | ||||||
| Shares repurchased | ||||||||
Class A (127,042 and 157,118 shares, respectively) | (594,535 | ) | (750,068 | ) | ||||
Class B (60 and 227 shares, respectively) | (280 | ) | (1,080 | ) | ||||
Class C (89,555 and 135,370 shares, respectively) | (424,109 | ) | (654,153 | ) | ||||
Class T (29,391 and 35,882 shares, respectively) | (138,732 | ) | (172,911 | ) | ||||
Class I (311,788 and 406,378 shares, respectively) | (1,457,914 | ) | (1,940,913 | ) | ||||
|
|
|
| |||||
| Increase (decrease) in net assets from share transactions | (690,743 | ) | (1,128,773 | ) | ||||
|
|
|
| |||||
| Net increase (decrease) in net assets | (563,044 | ) | (1,387,258 | ) | ||||
| Net Assets | ||||||||
Beginning of period | 7,715,372 | 9,102,630 | ||||||
|
|
|
| |||||
| End of period | $ | 7,152,328 | $ | 7,715,372 | ||||
|
|
|
| |||||
Accumulated undistributed net investment income (loss) at end of period | $ | 13,224 | $ | (3,391 | ) | |||
See Notes to Financial Statements
41
Table of Contents
VIRTUS MULTI-SECTOR SHORT TERM BOND FUND
SELECTED PER SHARE DATA AND RATIOS FOR A SHARE OUTSTANDING
THROUGHOUT EACH PERIOD
| Net Asset Value, Beginning of Period | Net Investment Income (Loss)(2) | Capital Gain Distributions Received from Affiliated Funds | Net Realized and Unrealized Gain (Loss) | Total from Investment Operations | Dividends from Net Investment Income | Distributions from Net Realized Gains | Return of Capital | |||||||||||||||||||||||||||||||||
Class A | ||||||||||||||||||||||||||||||||||||||||
| 10/1/15 to 9/30/16 | $ | 4.69 | 0.15 | — | 0.08 | 0.23 | (0.14 | ) | — | — | ||||||||||||||||||||||||||||||
| 10/1/14 to 9/30/15 | 4.84 | 0.15 | — | (0.16 | ) | (0.01 | ) | (0.11 | ) | — | (0.03 | ) | ||||||||||||||||||||||||||||
| 10/1/13 to 9/30/14 | 4.85 | 0.16 | — | (0.01 | ) | 0.15 | (0.16 | ) | — | (4) | — | (4) | ||||||||||||||||||||||||||||
| 10/1/12 to 9/30/13 | 4.94 | 0.18 | — | (0.09 | ) | 0.09 | (0.18 | ) | — | — | (4) | |||||||||||||||||||||||||||||
| 10/1/11 to 9/30/12 | 4.67 | 0.21 | — | 0.27 | 0.48 | (0.21 | ) | — | — | (4) | ||||||||||||||||||||||||||||||
Class B | ||||||||||||||||||||||||||||||||||||||||
| 10/1/15 to 9/30/16 | $ | 4.66 | 0.12 | — | 0.08 | 0.20 | (0.11 | ) | — | — | ||||||||||||||||||||||||||||||
| 10/1/14 to 9/30/15 | 4.81 | 0.13 | — | (0.16 | ) | (0.03 | ) | (0.09 | ) | — | (0.03 | ) | ||||||||||||||||||||||||||||
| 10/1/13 to 9/30/14 | 4.82 | 0.14 | — | (0.02 | ) | 0.12 | (0.13 | ) | — | (4) | — | (4) | ||||||||||||||||||||||||||||
| 10/1/12 to 9/30/13 | 4.91 | 0.16 | — | (0.09 | ) | 0.07 | (0.16 | ) | — | — | (4) | |||||||||||||||||||||||||||||
| 10/1/11 to 9/30/12 | 4.65 | 0.18 | — | 0.27 | 0.45 | (0.19 | ) | — | — | (4) | ||||||||||||||||||||||||||||||
Class C | ||||||||||||||||||||||||||||||||||||||||
| 10/1/15 to 9/30/16 | $ | 4.75 | 0.14 | — | 0.07 | 0.21 | (0.12 | ) | — | — | ||||||||||||||||||||||||||||||
| 10/1/14 to 9/30/15 | 4.89 | 0.14 | — | (0.15 | ) | (0.01 | ) | (0.10 | ) | — | (0.03 | ) | ||||||||||||||||||||||||||||
| 10/1/13 to 9/30/14 | 4.90 | 0.15 | — | (0.02 | ) | 0.13 | (0.14 | ) | — | (4) | — | (4) | ||||||||||||||||||||||||||||
| 10/1/12 to 9/30/13 | 4.99 | 0.17 | — | (0.09 | ) | 0.08 | (0.17 | ) | — | — | (4) | |||||||||||||||||||||||||||||
| 10/1/11 to 9/30/12 | 4.72 | 0.20 | — | 0.27 | 0.47 | (0.20 | ) | — | — | (4) | ||||||||||||||||||||||||||||||
The footnote legend is at the end of the financial highlights
See Notes to Financial Statements
42
Table of Contents
VIRTUS MULTI-SECTOR SHORT TERM BOND FUND
SELECTED PER SHARE DATA AND RATIOS FOR A SHARE OUTSTANDING
THROUGHOUT EACH PERIOD
| Total Distributions | Change in Net Asset Value | Net Asset Value, End of Period | Total Return(1) | Net Assets, End of Period (000’s) | Ratio of Expenses to Average Net Assets(3) | Ratio of Gross Expenses to Average Net Assets | Ratio of Net Investment Income to Average Net Assets | Portfolio Turnover Rate | ||||||||||||||||||||||||||||||||||||
| (0.14) | 0.09 | $ | 4.78 | 4.90 | % | $ | 1,307,484 | 1.00 | %(5)(6) | 1.01 | % | 3.19 | % | 53 | % | |||||||||||||||||||||||||||||
| (0.14) | (0.15 | ) | 4.69 | (0.23 | ) | 1,575,629 | 0.97 | 0.97 | 3.15 | 37 | ||||||||||||||||||||||||||||||||||
| (0.16) | (0.01 | ) | 4.84 | 3.03 | 1,894,633 | 0.99 | 0.99 | 3.30 | 39 | |||||||||||||||||||||||||||||||||||
| (0.18) | (0.09 | ) | 4.85 | 1.84 | 3,574,450 | 0.99 | 0.99 | 3.65 | 49 | |||||||||||||||||||||||||||||||||||
| (0.21) | 0.27 | 4.94 | 10.58 | 3,038,093 | 1.01 | 1.01 | 4.31 | 52 | ||||||||||||||||||||||||||||||||||||
| (0.11) | 0.09 | $ | 4.75 | 4.41 | % | $ | 108 | 1.49 | %(5)(6) | 1.50 | % | 2.64 | % | 53 | % | |||||||||||||||||||||||||||||
| (0.12) | (0.15 | ) | 4.66 | (0.73 | ) | 382 | 1.46 | 1.47 | 2.67 | 37 | ||||||||||||||||||||||||||||||||||
| (0.13) | (0.01 | ) | 4.81 | 2.53 | 1,421 | 1.49 | 1.49 | 2.80 | 39 | |||||||||||||||||||||||||||||||||||
| (0.16) | (0.09 | ) | 4.82 | 1.34 | 2,572 | 1.49 | 1.49 | 3.17 | 49 | |||||||||||||||||||||||||||||||||||
| (0.19) | 0.26 | 4.91 | 9.87 | 3,590 | 1.51 | 1.51 | 3.86 | 52 | ||||||||||||||||||||||||||||||||||||
| (0.12) | 0.09 | $ | 4.84 | 4.58 | % | $ | 1,321,202 | 1.25 | %(5)(6) | 1.26 | % | 2.94 | % | 53 | % | |||||||||||||||||||||||||||||
| (0.13) | (0.14 | ) | 4.75 | (0.27 | ) | 1,460,120 | 1.22 | 1.22 | 2.90 | 37 | ||||||||||||||||||||||||||||||||||
| (0.14) | (0.01 | ) | 4.89 | 2.73 | 1,720,245 | 1.24 | 1.24 | 3.03 | 39 | |||||||||||||||||||||||||||||||||||
| (0.17) | (0.09 | ) | 4.90 | 1.56 | 1,567,725 | 1.24 | 1.24 | 3.40 | 49 | |||||||||||||||||||||||||||||||||||
| (0.20) | 0.27 | 4.99 | 10.19 | 1,067,276 | 1.27 | 1.27 | 4.04 | 52 | ||||||||||||||||||||||||||||||||||||
The footnote legend is at the end of the financial highlights
See Notes to Financial Statements
43
Table of Contents
VIRTUS MULTI-SECTOR SHORT TERM BOND FUND
FINANCIAL HIGHLIGHTS (Continued)
SELECTED PER SHARE DATA AND RATIOS FOR A SHARE OUTSTANDING
THROUGHOUT EACH PERIOD
| Net Asset Value, Beginning of Period | Net Investment Income (Loss)(2) | Capital Gain Distributions Received from Affiliated Funds | Net Realized and Unrealized Gain (Loss) | Total from Investment Operations | Dividends from Net Investment Income | Distributions from Net Realized Gains | Return of Capital | |||||||||||||||||||||||||||||||||
Class T | ||||||||||||||||||||||||||||||||||||||||
| 10/1/15 to 9/30/16 | $ | 4.73 | 0.12 | — | 0.08 | 0.20 | (0.10 | ) | — | — | ||||||||||||||||||||||||||||||
| 10/1/14 to 9/30/15 | 4.88 | 0.12 | — | (0.17 | ) | (0.05 | ) | (0.07 | ) | — | (0.03 | ) | ||||||||||||||||||||||||||||
| 10/1/13 to 9/30/14 | 4.89 | 0.12 | — | (0.01 | ) | 0.11 | (0.12 | ) | — | (4) | — | (4) | ||||||||||||||||||||||||||||
| 10/1/12 to 9/30/13 | 4.98 | 0.14 | — | (0.09 | ) | 0.05 | (0.14 | ) | — | — | (4) | |||||||||||||||||||||||||||||
| 10/1/11 to 9/30/12 | 4.71 | 0.17 | — | 0.28 | 0.45 | (0.18 | ) | — | — | (4) | ||||||||||||||||||||||||||||||
Class I | ||||||||||||||||||||||||||||||||||||||||
| 10/1/15 to 9/30/16 | $ | 4.69 | 0.16 | — | 0.08 | 0.24 | (0.15 | ) | — | — | ||||||||||||||||||||||||||||||
| 10/1/14 to 9/30/15 | 4.84 | 0.16 | — | (0.16 | ) | — | (0.12 | ) | — | (0.03 | ) | |||||||||||||||||||||||||||||
| 10/1/13 to 9/30/14 | 4.85 | 0.17 | — | (0.01 | ) | 0.16 | (0.17 | ) | — | (4) | — | (4) | ||||||||||||||||||||||||||||
| 10/1/12 to 9/30/13 | 4.94 | 0.19 | — | (0.09 | ) | 0.10 | (0.19 | ) | — | — | (4) | |||||||||||||||||||||||||||||
| 10/1/11 to 9/30/12 | 4.68 | 0.22 | — | 0.27 | 0.49 | (0.23 | ) | — | — | (4) | ||||||||||||||||||||||||||||||
See Notes to Financial Statements
44
Table of Contents
VIRTUS MULTI-SECTOR SHORT TERM BOND FUND
FINANCIAL HIGHLIGHTS (Continued)
SELECTED PER SHARE DATA AND RATIOS FOR A SHARE OUTSTANDING
THROUGHOUT EACH PERIOD
| Total Distributions | Change in Net Asset Value | Net Asset Value, End of Period | Total Return(1) | Net Assets, End of Period (000’s) | Ratio of Expenses to Average Net Assets(3) | Ratio of Gross Expenses to Average Net Assets | Ratio of Net Investment Income to Average Net Assets | Portfolio Turnover Rate | ||||||||||||||||||||||||||||||||
| (0.10) | 0.10 | $ | 4.83 | 4.29 | % | $ | 489,924 | 1.75 | %(5)(6) | 1.76 | % | 2.44 | % | 53 | % | |||||||||||||||||||||||||
(0.10) | (0.15 | ) | 4.73 | (0.98 | ) | 583,694 | 1.72 | 1.72 | 2.40 | 37 | ||||||||||||||||||||||||||||||
| (0.12) | (0.01 | ) | 4.88 | 2.23 | 719,840 | 1.74 | 1.74 | 2.53 | 39 | |||||||||||||||||||||||||||||||
| (0.14) | (0.09 | ) | 4.89 | 1.06 | 751,220 | 1.74 | 1.74 | 2.91 | 49 | |||||||||||||||||||||||||||||||
| (0.18) | 0.27 | 4.98 | 9.67 | 704,225 | 1.76 | 1.76 | 3.56 | 52 | ||||||||||||||||||||||||||||||||
| (0.15) | 0.09 | $ | 4.78 | 5.16 | % | $ | 4,033,610 | 0.75 | %(5)(6) | 0.76 | % | 3.44 | % | 53 | % | |||||||||||||||||||||||||
(0.15) | (0.15 | ) | 4.69 | 0.02 | 4,095,547 | 0.72 | 0.72 | 3.40 | 37 | |||||||||||||||||||||||||||||||
| (0.17) | (0.01 | ) | 4.84 | 3.28 | 4,766,491 | 0.74 | 0.74 | 3.51 | 39 | |||||||||||||||||||||||||||||||
| (0.19) | (0.09 | ) | 4.85 | 2.09 | 2,418,863 | 0.74 | 0.74 | 3.90 | 49 | |||||||||||||||||||||||||||||||
| (0.23) | 0.26 | 4.94 | 10.62 | 1,606,957 | 0.77 | 0.77 | 4.55 | 52 | ||||||||||||||||||||||||||||||||
Footnote Legend
| (1) | Sales charges, where applicable, are not reflected in the total return calculation. |
| (2) | Computed using average shares outstanding. |
| (3) | The Fund may invest in other funds and the annualized expense ratios do not reflect fees and expenses associated with the underlying funds. |
| (4) | Amount is less than $0.005. |
| (5) | For the period ended September 30, 2016, the ratio of net expenses includes the effect of the earnings credit from Custodian reflected in the Statement of Operations and had no impact on the Financial Highlights. |
| (6) | Net expense ratio includes extraordinary proxy expenses. |
See Notes to Financial Statements
45
Table of Contents
VIRTUS MULTI-SECTOR SHORT TERM BOND FUND
SEPTEMBER 30, 2016
Note 1. Organization
Virtus Opportunities Trust (the “Trust”) is organized as a Delaware statutory trust and is registered under the Investment Company Act of 1940, as amended (“1940 Act”), as an open-end management investment company.
As of the date of this report, 31 funds of the Trust are offered for sale, of which the Virtus Multi-Sector Short Term Bond Fund (the “Fund”) is reported in this annual report. The Fund’s investment objective is outlined in the Fund Summary Page. There is no guarantee the Fund will achieve its objective.
The Fund offers Class A shares, Class C shares, Class T shares and Class I shares. Class B shares are no longer available for purchase by new or existing shareholders, except by existing shareholders through Qualifying Transactions. (For information regarding Qualifying Transactions refer to the Trust’s prospectus.)
Class A shares are sold with a front-end sales charge of up to 2.25%. Generally, Class A shares are not subject to any charges by the Fund when redeemed; however, a 0.50% contingent deferred sales charge (“CDSC”) may be imposed on certain redemptions made within a certain period following purchases on which a finder’s fee has been paid. The period for which the CDSC applies for the Fund is 18 months. The CDSC period begins on the last day of the month preceding the month in which the purchase was made.
Class B shares generally were sold with a CDSC which declines from 2% to zero depending on the period of time the shares are held. Class C shares are sold without a sales charge. Class T shares are sold with a 1% CDSC, applicable if redeemed within one year of purchase. Class I shares are sold without a front-end sales charge or CDSC.
Virtus Mutual Funds may impose an annual fee on accounts having balances of less than $2,500. The small account fee may be waived in certain circumstances, as disclosed in the prospectuses and/or statements of additional information. The fees collected will be used to offset certain expenses of the fund. These fees are reflected as “Low Balance Account Fees” in the Fund’s Statement of Operations for the period, as applicable.
Each class of shares has identical voting, dividend, liquidation and other rights and the same terms and conditions, except that each class bears different distribution and/or service fees under a Board-approved Rule 12b-1 and/or shareholder service plan (“12b-1 plan”) and has exclusive voting rights with respect to such plans. Class I shares are not subject to a 12b-1 plan. Income and other expenses as well as realized and unrealized gains and losses of the Fund are borne pro rata by the holders of each class of shares.
Note 2. Significant Accounting Policies
The following is a summary of significant accounting policies consistently followed by the Trust in the preparation of its financial statements. The preparation of financial statements in conformity with accounting principles generally accepted in the United States of America requires management to make estimates and assumptions that affect the reported amounts of assets and liabilities, disclosure of contingent assets and liabilities at the date of the financial statements and the reported amounts of increases and decreases in net assets from operations during the reporting period. Actual results could differ from those estimates and those differences could be significant.
46
Table of Contents
VIRTUS MULTI-SECTOR SHORT TERM BOND FUND
NOTES TO FINANCIAL STATEMENTS (Continued)
SEPTEMBER 30, 2016
| A. | Security Valuation |
Security valuation procedures for the Fund, which include nightly price variance, as well as back-testing such as bi-weekly unchanged price, monthly secondary source and transaction analysis, have been approved by the Board of Trustees (the “Board”, or the “Trustees”). All internally fair valued securities are approved by a valuation committee (the “Valuation Committee”) appointed by the Board. The Valuation Committee is comprised of certain members of management as identified to the Board and convenes independently from portfolio management. All internally fair valued securities are updated daily and reviewed in detail by the Valuation Committee monthly unless changes occur within the period. The Valuation Committee reviews the validity of the model inputs and any changes to the model. Quarterly fair valuations are reviewed by the Board.
The Fund utilizes a fair value hierarchy which prioritizes the inputs to valuation techniques used to measure fair value into three broad levels. It is the Fund’s policy to recognize transfers at the end of reporting period.
| • Level 1 – | quoted prices in active markets for identical securities (security types generally include listed equities). |
| • Level 2 – | prices determined using other significant observable inputs (including quoted prices for similar securities, interest rates, prepayment speeds, credit risk, etc.). |
| • Level 3 – | prices determined using significant unobservable inputs (including the Valuation Committee’s own assumptions in determining the fair value of investments). |
A description of the valuation techniques applied to the Fund’s major categories of assets and liabilities measured at fair value on a recurring basis is as follows:
Equity securities are valued at the official closing price (typically last sale) on the exchange on which the securities are primarily traded or, if no closing price is available, at the last bid price and are categorized as Level 1 in the hierarchy. Restricted equity securities and private placements that are not widely traded, are illiquid, or are internally fair valued by the Valuation Committee, are generally categorized as Level 3 in the hierarchy.
Certain non-U.S. securities may be fair valued in cases where closing prices are not readily available or are deemed not reflective of readily available market prices. For example, significant events (such as movement in the U.S. securities market, or other regional and local developments) may occur between the time that non-U.S. markets close (where the security is principally traded) and the time that the Fund calculates its net asset value (“NAV”) (at the close of regular trading on the New York Stock Exchange (“NYSE”), generally 4 p.m. Eastern time) that may impact the value of securities traded in these non-U.S. markets. In such cases the Fund fair values non-U.S. securities using an independent pricing service which considers the correlation of the trading patterns of the non-U.S. security to the intraday trading in the U.S. markets for investments such as American Depositary Receipts, financial futures, ETFs, and certain indexes, as well as prices for similar securities. Such fair valuations are categorized as Level 2 in the hierarchy. Because the frequency of significant events is not predictable, fair valuation of certain non-U.S. common stocks may occur on a frequent basis.
47
Table of Contents
VIRTUS MULTI-SECTOR SHORT TERM BOND FUND
NOTES TO FINANCIAL STATEMENTS (Continued)
SEPTEMBER 30, 2016
Debt securities, including restricted securities, are valued based on evaluated quotations received from independent pricing services or from dealers who make markets in such securities. For most bond types, the pricing service utilizes matrix pricing that considers one or more of the following factors: yield or price of bonds of comparable quality, coupon, maturity, current cash flows, type, and current day trade information, as well as dealer-supplied prices. These valuations are generally categorized as Level 2 in the hierarchy. Structured debt instruments such as mortgage-backed and asset-backed securities may also incorporate collateral analysis and utilize cash flow models for valuation and are generally categorized as Level 2 in the hierarchy. Pricing services do not provide pricing for all securities and therefore indicative bids from dealers are utilized which are based on pricing models used by market makers in the security and are generally categorized as Level 2 in the hierarchy. Debt securities that are not widely traded, are illiquid, or are internally fair valued by the Valuation Committee, are generally categorized as Level 3 in the hierarchy.
Listed derivatives that are actively traded are valued based on quoted prices from the exchange and are categorized as Level 1 in the hierarchy. Over-the-counter derivative contracts, which include forward currency contracts and equity-linked instruments, do not require material subjectivity as pricing inputs are observed from actively quoted markets and are categorized as Level 2 in the hierarchy.
Investments in open-end mutual funds are valued at NAV. Investments in closed-end funds are valued as of the close of regular trading on the NYSE each business day. Both are categorized as Level 1 in the hierarchy.
A summary of the inputs used to value the Fund’s net assets by each major security type is disclosed at the end of the Schedule of Investments for the Fund. The inputs or methodologies used for valuing securities are not necessarily an indication of the risk associated with investing in those securities.
| B. | Security Transactions and Investment Income |
Security transactions are recorded on the trade date. Realized gains and losses from the sale of securities are determined on the identified cost basis. Dividend income is recognized on the ex-dividend date or, in the case of certain foreign securities, as soon as the Fund is notified. Interest income is recorded on the accrual basis. The Fund amortizes premiums and accretes discounts using the effective interest method. Any distributions from underlying funds are recorded in accordance with the character of the disbursements as designated by the underlying fund.
| C. | Income Taxes |
The Fund is treated as a separate taxable entity. It is the intention of the Fund to comply with the requirements of Subchapter M of the Internal Revenue Code and to distribute substantially all of its taxable income to its shareholders. Therefore, no provision for federal income taxes or excise taxes has been made.
The Fund may be subject to foreign taxes on income, gains on investments or currency repatriation, a portion of which may be recoverable. The Fund will accrue such taxes and recoveries as applicable based upon current interpretations of the tax rules and regulations that exist in the markets in which it invests.
Management of the Fund has concluded that there are no significant uncertain tax positions that would require recognition in the financial statements. As of September 30, 2016, the
48
Table of Contents
VIRTUS MULTI-SECTOR SHORT TERM BOND FUND
NOTES TO FINANCIAL STATEMENTS (Continued)
SEPTEMBER 30, 2016
tax years that remain subject to examination by the major tax jurisdictions under the statute of limitations are from the year 2013 forward (with limited exceptions).
| D. | Distributions to Shareholders |
Distributions are recorded by the Fund on the ex-dividend date. Income distributions are recorded daily. Income and capital gain distributions are determined in accordance with income tax regulations that may differ from accounting principles generally accepted in the United States of America. These differences may include the treatment of non-taxable dividends, market premium and discount, non-deductible expenses, expiring capital loss carryovers, foreign currency gain or loss, gain or loss on futures contracts, partnerships, operating losses and losses deferred due to wash sales. Permanent book and tax basis differences relating to shareholder distributions will result in reclassifications to capital paid in on shares of beneficial interest.
| E. | Expenses |
Expenses incurred together by the Fund and other affiliated mutual funds are allocated in proportion to the net assets of each such fund, except where allocation of direct expense to each fund or an alternative allocation method can be more appropriately used.
In addition to the net annual operating expenses that the Fund bears directly, the shareholders of the Fund indirectly bear the Fund’s pro rata expenses of any underlying mutual funds in which the Fund invests.
| F. | Foreign Currency Translation |
Non-U.S. investment securities and other assets and liabilities denominated in foreign currencies are translated into U.S. dollar amounts at the foreign currency exchange rate effective at the end of the reporting period. Cost of investments is translated at the currency exchange rate effective at the trade date. The gain or loss resulting from a change in currency exchange rates between the trade and settlement date of a portfolio transaction is treated as a gain or loss on foreign currency. Likewise, the gain or loss resulting from a change in currency exchange rates between the date income is accrued and the date it is paid is treated as a gain or loss on foreign currency. The Fund does not isolate that portion of the results of operations arising from changes in foreign exchange rates on investments from the fluctuations arising from changes in the market prices of securities held. Such fluctuations are included with the net realized and unrealized gain or loss on investments.
| G. | When-issued Purchases and Forward Commitments (Delayed Delivery) |
The Fund may engage in when-issued or forward commitment transactions. Securities purchased on a when-issued or forward commitment basis are also known as delayed delivery transactions. Delayed delivery transactions involve a commitment by a fund to purchase or sell a security at a future date, ordinarily up to 90 days later. When-issued or forward commitments enable a fund to lock in what is believed to be an attractive price or yield on a particular security for a period of time, regardless of future changes in interest rates. The Fund records when-issued and delayed delivery securities on the trade date. The Fund maintains collateral for the securities purchased. Securities purchased on a when-issued or delayed delivery basis begin earning interest on the settlement date.
49
Table of Contents
VIRTUS MULTI-SECTOR SHORT TERM BOND FUND
NOTES TO FINANCIAL STATEMENTS (Continued)
SEPTEMBER 30, 2016
| H. | Loan Agreements |
The Fund may invest in direct debt instruments which are interests in amounts owed by a corporate, governmental, or other borrower to lenders or lending syndicates. Loan agreements are generally non-investment grade and often involve borrowers that are highly leveraged. The Fund may invest in obligations of borrowers who are in bankruptcy proceedings. Loan agreements are typically senior in the corporate capital structure of the borrower. A loan is often administered by a bank or other financial institution (the “lender”) that acts as agent for all holders. The agent administers the terms of the loan, as specified in the loan agreement. The Fund’s investments in loans may be in the form of participations in loans or assignments of all or a portion of loans from third parties. When investing in loan participations, the Fund has the right to receive payments of principal, interest and any fees to which it is entitled only from the lender selling the loan participation and only upon receipt by the lender of payments from the borrower. The Fund generally has no right to enforce compliance with the terms of the loan agreement with the borrower. As a result, the Fund may be subject to the credit risk of both the borrower and the lender that is selling the loan agreement. When the Fund purchases assignments from lenders it acquires direct rights against the borrower on the loan.
The Fund may invest in multiple series or tranches of a loan, which may have varying terms and carry different associated risks. Loan agreements may involve foreign borrowers, and investments may be denominated in foreign currencies. Direct indebtedness of emerging countries involves a risk that the government entities responsible for the repayment of the debt may be unable, or unwilling, to pay the principal and interest when due.
The loan agreements have floating rate loan interests which generally pay interest at rates that are periodically determined by reference to a base lending rate plus a premium. The base lending rates are generally LIBOR (London Interbank Offered Rate), the prime rate offered by one or more U.S. banks or the certificate of deposit rate. When a loan agreement is purchased the Fund may pay an assignment fee. On an ongoing basis, the Fund may receive a commitment fee based on the undrawn portion of the underlying line of credit portion of a loan agreement. Prepayment penalty fees are received upon the prepayment of a loan agreement by a borrower. Prepayment penalty, facility, commitment, consent and amendment fees are recorded to income as earned or paid.
At September 30, 2016, all loan agreements held by the Fund are assignment loans.
| I. | Earnings Credit and Interest |
Through arrangements with the Fund’s custodian, the Fund either receives an earnings credit or interest on agreed upon target un-invested cash balances to reduce the Fund’s custody expenses. The credits are reflected as “Earnings credit from Custodian” and the interest is reflected under “Interest income” in the Fund’s Statements of Operations for the period, as applicable.
50
Table of Contents
VIRTUS MULTI-SECTOR SHORT TERM BOND FUND
NOTES TO FINANCIAL STATEMENTS (Continued)
SEPTEMBER 30, 2016
Note 3. Investment Advisory Fees and Related Party Transactions
($ reported in thousands except as noted)
| A. | Adviser |
Virtus Investment Advisers, Inc. (the “Adviser”), an indirect, wholly owned subsidiary of Virtus Investment Partners, Inc. (“Virtus”), is the adviser to the Trust. The Adviser manages the Fund’s investment program and general operations of the Fund, including oversight of the Fund’s subadviser.
As compensation for its services to the Fund, the Adviser is entitled to a fee based upon the following annual rates as a percentage of the average daily net assets of the Fund:
First $1 Billion | $1+ Billion – | $2+ Billion – 10 Billion | $10+ Billion | |||
| 0.55% | 0.50% | 0.45% | 0.425% |
During the period covered by these financial statements, the Fund invested a portion of its assets in Virtus Credit Opportunities Fund, an affiliated mutual fund. In order to avoid any duplication of advisory fees, the Adviser has voluntarily waived its advisory fees in an amount equal to that which would otherwise be paid by the Fund on the assets invested in the Credit Opportunities Fund. For the period covered by these financial statements, the waiver amounted to $305. This waiver is in addition to the expense limitation and/or fee waiver covered elsewhere in these financial statements and is included in the Statement of Operations in “expenses reimbursed and/or waived by the investment adviser”.
| B. | Subadviser |
Newfleet Asset Management, LLC (the “Subadviser”), an indirect, wholly owned subsidiary of Virtus, is the subadviser to the Fund. The subadviser manages the investments of the Fund for which the Subadviser is paid a fee by the Adviser.
| C. | Expense Limitations |
The Adviser has contractually agreed to limit the Fund’s total operating expenses (excluding dividend and interest expenses, taxes, brokerage commissions, leverage expenses, extraordinary expenses and acquired fund fees and expenses, if any) so that such expenses do not exceed, on an annualized basis, the following percentages of the Fund’s average net asset values: 1.10% for Class A shares, 1.60% for Class B shares, 1.35% for Class C shares, 1.85% for Class T shares, and 0.85% for Class I shares through January 31, 2017. The Fund is currently below its expense cap.
| D. | Distributor |
VP Distributors, LLC (“VP Distributors”), an indirect wholly owned subsidiary of Virtus, serves as the distributor of the Fund’s shares. VP Distributors has advised the Fund that for the fiscal year (the “period”) ended September 30, 2016, it retained net commissions of $21 for Class A shares and deferred sales charges of $26, $0, $1 and $22 for Class A shares, Class B shares, Class C shares and Class T shares, respectively.
51
Table of Contents
VIRTUS MULTI-SECTOR SHORT TERM BOND FUND
NOTES TO FINANCIAL STATEMENTS (Continued)
SEPTEMBER 30, 2016
In addition, the Fund pays VP Distributors distribution and/or service fees under a 12b-1 plan as a percentage of the average daily net assets of each respective class, at the annual rate of 0.25% for Class A shares, 0.75% for Class B shares, 0.50% for Class C shares, and 1.00% for Class T shares. Class I shares are not subject to a 12b-1 plan.
Under certain circumstances, shares of certain Virtus Mutual Funds may be exchanged for shares of the same class of certain other Virtus Mutual Funds on the basis of the relative NAV per share at the time of the exchange. On exchanges with share classes that carry a CDSC, the CDSC schedule of the original shares purchased continues to apply.
| E. | Administrator and Transfer Agent |
Virtus Fund Services LLC, an indirect wholly owned subsidiary of Virtus, serves as the administrator and transfer agent to the Fund.
For the period ended September 30, 2016, the Fund incurred administration fees totaling $7,075 which are included in the Statement of Operations.
For the period ended September 30, 2016, the Fund incurred transfer agent fees totaling $8,080 which are included in the Statement of Operations. A portion of these fees is paid to outside entities that also provide services to the Trust.
| F. | Affiliated Shareholders |
At September 30, 2016, Virtus and its affiliates, and the retirement plans of Virtus and its affiliates, held shares of the Fund which may be redeemed at any time that aggregated to the following:
| Shares | Aggregate Net Asset Value | |||||||
Class I Shares | 761,105 | $ | 3,638 | |||||
| G. | Investments in Affiliates |
A summary of the Fund’s total long-term and short-term purchases and sales of an affiliated fund Virtus Credit Opportunities Fund, during the period ended September 30, 2016, is as follows:
| Value, beginning of period | Purchases | Sales Proceeds | Value, end of period | Dividend Income | Distributions of Realized Gains | |||||||||||||||||||
Virtus Credit Opportunities Fund | $ | 67,751 | $ | 527 | $ | — | $ | 68,703 | $ | 2,610 | $ | — | ||||||||||||
The Fund does not invest in the underlying fund for the purpose of exercising management or control; however the investments made by the Fund within each of its principal investment strategies may represent a significant portion of the underlying fund’s net assets. At September 30, 2016, the Fund was the owner of record of approximately 72% of the Virtus Credit Opportunities Fund.
| H. | Trustee Compensation |
The Trust provides a deferred compensation plan for its Trustees who receive compensation from the Trust. Under the deferred compensation plan, Trustees may elect to defer all or a portion of their compensation. Amounts deferred are retained by the
52
Table of Contents
VIRTUS MULTI-SECTOR SHORT TERM BOND FUND
NOTES TO FINANCIAL STATEMENTS (Continued)
SEPTEMBER 30, 2016
Trust, and then, to the extent permitted by the 1940 Act, in turn, may be invested in the shares of affiliated or unaffiliated mutual funds selected by the participating Trustees. Investments in such instruments are included in “Other Assets” on the Statement of Assets and Liabilities at September 30, 2016.
Note 4. Purchases and Sales of Securities
($ reported in thousands)
Purchases and sales of securities for the Fund (excluding U.S. Government and agency securities, and short-term securities) during the period ended September 30, 2016, were as follows:
| Purchases | Sales | |||||||
| $ | 3,279,174 | $ | 4,105,071 | |||||
Purchases and sales of long-term U.S. Government and agency securities for the Fund during the period ended September 30, 2016, were as follows:
| Purchases | Sales | |||||||
| $ | 499,316 | $ | 350,698 | |||||
Note 5. Borrowings
($ reported in thousands)
On June 29, 2016, the Fund and other affiliated funds renewed a $50,000 secured line of credit. The Credit Agreement (the “Agreement”) is with a commercial bank (the “Bank”) that allows the Fund to borrow cash from the Bank to manage large unexpected redemptions and trade fails, up to a limit of one-third of the Fund’s total net assets in accordance with the Agreement. The agreement has a term of 364 days and is renewable by the Fund with the Bank’s consent. Interest is charged at the higher of the LIBOR (London Interbank Offered Rate) or the Federal Funds rate plus an additional percentage rate on the amount borrowed. Commitment fees are charged on the undrawn balance. The Fund and other affiliated funds are individually, and not jointly, liable for their particular advances, if any, under the line of credit. The Bank has the ability to require repayment of outstanding borrowings under the Agreement upon certain circumstances such as an event of default.
The Fund had no outstanding borrowings at any time during the period ended September 30, 2016.
Note 6. 10% Shareholders
As of September 30, 2016, the Fund had individual shareholder account(s) and/or omnibus shareholder account(s) (comprised of a group of individual shareholders), which individually amounted to more than 10% of the total shares outstanding of the Fund as detailed below.
| % of Shares Outstanding | Number of Accounts | |||||||
| 32 | % | 2* | ||||||
| * |
53
Table of Contents
VIRTUS MULTI-SECTOR SHORT TERM BOND FUND
NOTES TO FINANCIAL STATEMENTS (Continued)
SEPTEMBER 30, 2016
Note 7. Credit Risk and Asset Concentrations
In countries with limited or developing markets, investments may present greater risks than in more developed markets and the prices of such investments may be volatile. The consequences of political, social or economic changes in these markets may have disruptive effects on the market prices of these investments and the income they generate, as well as the Fund’s ability to repatriate such amounts.
High-yield/high-risk securities typically entail greater price volatility and/or principal and interest rate risk. There is a greater chance that an issuer will not be able to make principal and interest payments on time. Analysis of the creditworthiness of issuers of high-yield/high-risk securities may be complex, and as a result it, may be more difficult for the Adviser and/or Subadviser to accurately predict risk.
The Fund may invest a high percentage of its assets in specific sectors of the market in the pursuit of its investment objective. Fluctuations in these sectors of concentration may have a greater impact on the Fund, positive or negative, than if the Fund did not concentrate its investments in such sectors.
Note 8. Illiquid and Restricted Securities
Investments generally are considered illiquid if they cannot be disposed of in seven days in the ordinary course of business at the approximate amount at which such securities have been valued by the Fund. Additionally, the following information is also considered in determining illiquidity: the frequency of trades and quotes for the investment, whether the investment is listed for trading on a recognized domestic exchange and/or whether two or more brokers are willing to purchase or sell the security at a comparable price, the extent of market making activity in the investment and the nature of the market for investment. Illiquid securities are footnoted as such at the end of the Fund’s Schedule of Investments where applicable. However, a portion of such footnoted securities could be liquid where the Subadviser determines that some, though not all, of the position could be disposed of within seven days in the ordinary course of business at the approximate amount at which such securities have been valued by the Fund.
Restricted securities are illiquid securities, as defined above, not registered under the Securities Act of 1933, as amended (the “1933 Act”). Generally, 144A securities are excluded from this category, except where defined as illiquid.
The Fund will bear any costs, including those involved in registration under the 1933 Act, in connection with the disposition of such securities.
The Fund held securities considered to be illiquid at September 30, 2016 with an aggregate value of $168 representing 0.00% of the Fund’s net assets.
At September 30, 2016, the Fund did not hold any securities that are both illiquid and restricted.
Note 9. Indemnifications
Under the Trust’s organizational documents, its Trustees and officers are indemnified against certain liabilities arising out of the performance of their duties to the Fund. Each Trustee has also entered into an indemnification agreement with the Trust. In addition, in the normal course of business the Fund enters into contracts that provide a variety of indemnifications to other parties. The Fund’s maximum exposure under these arrangements
54
Table of Contents
VIRTUS MULTI-SECTOR SHORT TERM BOND FUND
NOTES TO FINANCIAL STATEMENTS (Continued)
SEPTEMBER 30, 2016
is unknown as this would involve future claims that may be made against the Fund and that have not occurred. However, the Fund has not had prior claims or losses pursuant to these arrangements and expects the risk of loss to be remote.
Note 10. Federal Income Tax Information
($ reported in thousands)
At September 30, 2016, federal tax cost and aggregate gross unrealized appreciation (depreciation) of securities held by the Fund were as follows:
Federal | Unrealized | Unrealized | Net Unrealized | |||
$7,064,261 | $152,047 | $(121,012) | $31,035 |
The Fund has capital loss carryovers available to offset future realized gains as follows:
No Expiration | Total | |||
Short-Term | Long-Term | |||
$49,295 | $25,236 | $74,531 | ||
Under the Regulated Investment Company Modernization Act of 2010 (the “Act”), net capital losses recognized for tax years beginning after December 22, 2010, may be carried forward indefinitely, and their character is retained as short-term and/or long-term losses.
Capital losses realized after October 31 and certain late year losses may be deferred and treated as occurring on the first day of the following fiscal year. For the fiscal year ended September 30, 2016, the Fund deferred and recognized qualified late year losses as follows:
Late Year | Late Year | Capital | Capital | |||
| $— | $— | $30,985 | $56,744 |
The components of distributable earnings on a tax basis (excluding unrealized appreciation (depreciation) (which are disclosed above) consist of the following:
Undistributed | Undistributed | |
| $14,452 | $— |
The differences between the book and tax basis components of distributable earnings relate principally to the timing of recognition of income and gains for federal income tax purposes. Short-term gain distributions reported in the Statements of Changes in Net Assets, if any, are reported as ordinary income for federal tax purposes. Distributions are determined on a tax basis and may differ from net investment income and realized capital gains for financial reporting purposes.
55
Table of Contents
VIRTUS MULTI-SECTOR SHORT TERM BOND FUND
NOTES TO FINANCIAL STATEMENTS (Continued)
SEPTEMBER 30, 2016
The tax character of dividends and distributions paid during the years ended September 30, 2016 and 2015 was as follows:
| Year Ended | ||||||||
| 2016 | 2015 | |||||||
Ordinary Income | $ | 209,695 | $ | 206,751 | ||||
Long-Term Capital Gains | — | — | ||||||
Return of Capital | — | 42,244 | ||||||
|
|
|
| |||||
Total | $ | 209,695 | $ | 248,995 | ||||
|
|
|
| |||||
Note 11. Reclassifications of Capital Accounts
($ reported in thousands)
For financial reporting purposes, book basis capital accounts are adjusted to reflect the tax character of permanent book/tax differences. Permanent reclassifications can arise from differing treatment of certain income and gain transactions, nondeductible current year net operating losses, expiring capital loss carryovers and investments in passive foreign investment companies. The reclassifications have no impact on the net assets or net asset value of the Fund. As of September 30, 2016, the Fund recorded reclassifications to increase (decrease) the accounts as listed below:
Capital Paid in | Undistributed | Accumulated | ||
| $— | $(7,227) | $7,227 |
Note 12. Regulatory Matters and Litigation
From time to time, the Trust, the Adviser and/or Subadvisers and/or their affiliates may be involved in litigation and arbitration as well as examinations and investigations by various regulatory bodies, including the SEC, involving compliance with, among other things, securities laws, client investment guidelines, laws governing the activities of broker-dealers and other laws and regulations affecting their products and other activities. At this time, the Adviser believes that the outcomes of such matters are not likely, either individually or in the aggregate, to be material to these financial statements.
On February 20, 2015, a putative class action complaint (In re Virtus Investment Partners, Inc. Securities Litigation; formerly styled as Tom Cummins v. Virtus Investment Partners Inc. et al.) alleging violation of the federal securities laws was filed by an individual shareholder against Virtus and certain of its officers (the “defendants”) in the United States District Court for the Southern District of New York. On August 21, 2015, the lead plaintiff filed a Consolidated Class Action Complaint (the “Consolidated Complaint”) amending the originally filed complaint and adding the Trust as a defendant. The Consolidated Complaint was purportedly filed on behalf of all purchasers of Virtus common stock between January 25, 2013 and May 11, 2015 (the “Class Period”). The Consolidated Complaint alleges that during the Class Period, the defendants disseminated materially false and misleading statements and concealed material adverse facts relating to certain funds previously subadvised by F-Squared Investments, Inc. and/or its affiliates (“F-Squared”). The plaintiff seeks to recover unspecified damages. A motion to dismiss the Consolidated
56
Table of Contents
VIRTUS MULTI-SECTOR SHORT TERM BOND FUND
NOTES TO FINANCIAL STATEMENTS (Continued)
SEPTEMBER 30, 2016
Complaint was filed on behalf of the defendants on October 21, 2015. Pursuant to an Opinion & Order (“Order”) filed on July 1, 2016, the court granted in part and denied in part the defendants’ motion to dismiss. Although the Order narrows the scope of the claims asserted, claims under Sections 10(b) and 20(a) of the Exchange Act and Rule 10b-5 thereunder survive the motion. The defendants filed an Answer to the Consolidated Complaint on August 5, 2016. Virtus and its affiliates, including the Adviser, believe that the suit is without merit and intend to defend it vigorously. The Trust believes that the risk of loss to the Fund as a result of this suit is remote. The Adviser does not believe that the suit will have any impact on its ability to provide services to the Fund.
On May 8, 2015, a putative class action complaint (Mark Youngers v. Virtus Investment Partners, Inc. et al.) alleging violations of certain provisions of the federal securities laws was filed in the United States District Court for the Central District of California. The complaint, which was purportedly filed on behalf of purchasers of certain Virtus Funds previously subadvised by F-Squared between May 8, 2010 and December 22, 2014, inclusive (the “Class Period”), alleged claims against Virtus, certain Virtus officers and affiliates (including the Adviser, Euclid Advisors LLC (“Euclid”) and VP Distributors, LLC), the trustees and certain officers of the Trust, and certain other parties (the “defendants”). The complaint alleges that during the Class Period the defendants disseminated materially false and misleading statements and concealed or omitted material facts necessary to make the statements made not misleading. On October 1, 2015, the plaintiff filed a First Amended Class Action Complaint which, among other things, added a derivative claim for breach of fiduciary duty on behalf of the Trust. On October 19, 2015, the United States District Court for the Central District of California entered an order transferring the action to the Southern District of New York. On January 4, 2016, Plaintiffs filed a Second Amended Complaint. Motions to dismiss were filed on behalf of Virtus, its officers and affiliates and the independent trustees on February 1, 2016. An Opinion & Order (“Order”) granting in part and denying in part the defendants’ motions to dismiss was issued on July 1, 2016. The Order dismissed all claims against the Adviser, Euclid, the independent trustees and certain of the other individual defendants and narrowed the claims asserted against the remaining defendants. The remaining defendants filed an Answer to the Second Amended Complaint on August 5, 2016. The defendants filed a motion to certify an interlocutory appeal of the July 1, 2016 order to the Court of Appeals for the Second Circuit on August 26, 2016. Oral argument on the motion is scheduled for October 7, 2016. Virtus and its affiliates, including the Adviser, believe that the suit has no basis in law or fact and intend to defend it vigorously. The Trust believes that the risk of loss to the Fund as a result of this suit is remote. The Adviser does not believe that the suit will have any impact on its ability to provide services to the Fund.
Note 13. Subsequent Events
Management has evaluated the impact of all subsequent events on the Fund through the date the financial statements were issued, and has determined that the following subsequent event requires recognition or disclosure in the financial statements.
Effective November 3, 2016, the Fund began offering Class R6 shares.
57
Table of Contents

Report of Independent Registered Public
Accounting Firm
To the Board of Trustees of
Virtus Opportunities Trust and Shareholders of
Virtus Multi-Sector Short Term Bond Fund:
In our opinion, the accompanying statement of assets and liabilities, including the schedule of investments, and the related statements of operations and of changes in net assets and the financial highlights present fairly, in all material respects, the financial position of the Virtus Multi-Sector Short Term Bond Fund (one of the funds constituting Virtus Opportunities Trust, hereafter referred to as the “Fund”) at September 30, 2016, the results of its operations for the year then ended, the changes in its net assets for each of the two years in the period then ended and the financial highlights for each of the five years in the period then ended, in conformity with accounting principles generally accepted in the United States of America. These financial statements and financial highlights (hereafter referred to as “financial statements”) are the responsibility of the Fund’s management. Our responsibility is to express an opinion on these financial statements based on our audits. We conducted our audits of these financial statements in accordance with the standards of the Public Company Accounting Oversight Board (United States). Those standards require that we plan and perform the audit to obtain reasonable assurance about whether the financial statements are free of material misstatement. An audit includes examining, on a test basis, evidence supporting the amounts and disclosures in the financial statements, assessing the accounting principles used and significant estimates made by management, and evaluating the overall financial statement presentation. We believe that our audits, which included confirmation of securities at September 30, 2016 by correspondence with the custodian, brokers, and transfer agent of the investee funds, provide a reasonable basis for our opinion.

Philadelphia, Pennsylvania
November 22, 2016
58
Table of Contents
VIRTUS MULTI-SECTOR SHORT TERM BOND FUND
SEPTEMBER 30, 2016 (Unaudited)
For the fiscal year ended September 30, 2016, the Fund makes the following disclosures for federal income tax purposes. Below is listed the percentage, or the maximum amount allowable, of its ordinary income dividends (“QDI”) to qualify for the lower tax rates applicable to individual shareholders, and the percentage of ordinary income dividends earned by the Fund which qualifies for the dividends received deduction (“DRD”) for corporate shareholders. The actual percentage of QDI and DRD for the calendar year will be designated in year-end tax statements. The Fund designates the amount below as long-term capital gains dividends (“LTCG”) taxable at a 20% rate, or lower depending on the shareholder’s income ($ reported in thousands). LTCG amount, if subsequently different, will be designated in the next annual report.
QDI | DRD | LTCG | ||
| —% | —% | $— |
59
Table of Contents
RESULTS OF SHAREHOLDER MEETING
VIRTUS OPPORTUNITIES TRUST
MAY 19, 2016 (Unaudited)
At a special meeting of shareholders of all series of Virtus Equity Trust, Virtus Insight Trust and Virtus Opportunities Trust, held on May 19, 2016, shareholders of Virtus Opportunities Trust (the “Trust”) voted on the following proposals:
Proposal 1.
| Number of Eligible Votes: | ||||||||||||
| FOR | AGAINST | ABSTAIN | ||||||||||
To elect six Trustees to serve on the Board of Trustees until the next meeting of shareholders at which Trustees are elected. | ||||||||||||
George R. Aylward | 1,145,056,198.477 | 24,756,597.221 | 0 | |||||||||
Thomas J. Brown | 1,144,160,222.050 | 25,652,573.650 | 0 | |||||||||
Donald C. Burke | 1,145,758,834.912 | 24,053,960.790 | 0 | |||||||||
Roger A. Gelfenbien | 1,144,297,795.833 | 25,514,999.865 | 0 | |||||||||
John R. Mallin | 1,144,938,076.292 | 24,874,719.410 | 0 | |||||||||
Hassell H. McClellan | 1,143,864,433.134 | 25,948,362.566 | 0 | |||||||||
Shareholders of the Trust voted to approve the above proposal.
Proposal 2.
| Number of Eligible Votes: | ||||||||||||
| FOR | AGAINST | ABSTAIN | ||||||||||
To approve a proposal to permit Virtus Investment Advisers, Inc., as the investment adviser to all the Funds, to hire and replace subadvisers or to modify subadvisory agreements without shareholder approval. | ||||||||||||
Virtus CA Tax Exempt Bond Fund | 1,258,194.893 | 91,895.368 | 41,271.245 | |||||||||
Virtus Emerging Markets Debt Fund | 3,015,152.206 | 198.283 | 0 | |||||||||
Virtus Emerging Markets Equity Income Fund | 3,672,832.400 | 0 | 0 | |||||||||
Virtus Emerging Markets Opportunities Fund | 620,793,093.034 | 25,302,093.728 | 9,306,937.262 | |||||||||
Virtus Emerging Markets Small-Cap Fund | 494,281.793 | 0 | 0 | |||||||||
Virtus Essential Resources Fund | 504,931.913 | 0 | 0 | |||||||||
Virtus Foreign Opportunities Fund | 27,726,679.250 | 666,663.374 | 564,703.507 | |||||||||
Virtus Greater European Opportunities Fund | 818,457.900 | 37,502.974 | 15,676.215 | |||||||||
Virtus International Small-Cap Fund | 3,074,638.276 | 5,991.041 | 10,261.000 | |||||||||
Virtus International Wealth Masters Fund | 518,044.295 | 0 | 0 | |||||||||
Virtus Low Duration Income Fund | 10,449,114.393 | 779,684.940 | 311,840.943 | |||||||||
Virtus Multi-Sector Intermediate Bond Fund | 11,147,670.008 | 724,253.699 | 406,427.672 | |||||||||
Virtus Multi-Sector Short Term Bond Fund | 618,834,424.483 | 21,316,032.964 | 14,819,955.463 | |||||||||
Shareholders of the Funds listed above voted to approve the above proposal.
60
Table of Contents
RESULTS OF SHAREHOLDER MEETING (Continued)
VIRTUS OPPORTUNITIES TRUST
MAY 19, 2016 (Unaudited)
Proposal 6.
| Number of Eligible Votes: | ||||||||||||
| FOR | AGAINST | ABSTAIN | ||||||||||
To approve a proposal to amend the fundamental restrictions of the Fundamental Restriction Funds with respect to loans. | ||||||||||||
Virtus Foreign Opportunities Fund | 27,568,524.708 | 741,409.046 | 648,118.377 | |||||||||
Virtus Multi-Sector Short Term Bond Fund | 615,281,810.614 | 22,749,361.497 | 16,939,237.795 | |||||||||
Shareholders of the Funds listed above voted to approve the above proposal.
61
Table of Contents
FUND MANAGEMENT TABLES (UNAUDITED)
Information pertaining to the Trustees and officers of the Trust as of September 30, 2016, is set forth below. The statement of additional information (SAI) includes additional information about the Trustees and is available without charge, upon request, by calling (800) 243-1574. The address of each individual, unless otherwise noted, is 100 Pearl Street, Hartford, CT 06103-4506. There is no stated term of office for Trustees of the Trust.
Independent Trustees
| Name, Year of Birth, Year Elected and Number of Funds Overseen | Principal Occupation(s) Other Directorships Held by Trustee | |
Thomas J. Brown YOB: 1945 Elected: 2016 65 Portfolios | Retired. Trustee (since 2016), Virtus Mutual Fund Complex (52 portfolios) and Virtus Alternative Solutions Trust (4 portfolios); Trustee (since 2011), Virtus Variable Insurance Trust (9 portfolios); Director (since 2010), D’Youville Senior Care Center; and Director (since 2005), VALIC Company Funds (49 portfolios). | |
Burke, Donald C. YOB: 1961 Elected: 2016 69 Portfolios | Retired. Trustee (since 2016), Virtus Mutual Fund Complex (52 portfolios), Virtus Variable Insurance Trust (9 portfolios) and Virtus Alternative Solutions Trust (4 portfolios); Director (since 2014) closed-end funds managed by Duff & Phelps Investment Management Co. (4 funds); Director, Avista Corp. (energy company) (since 2011); Trustee, Goldman Sachs Fund Complex (2010 to 2014); and Director, BlackRock Luxembourg and Cayman Funds (2006 to 2010). | |
Roger A. Gelfenbien YOB: 1943 Elected: 2016 65 Portfolios | Retired. Trustee (since 2016), Virtus Mutual Fund Complex (52 portfolios) and Virtus Alternative Solutions Trust (4 portfolios); Trustee (since 2000), Virtus Variable Insurance Trust (9 portfolios); and Director (since 1999), USAllianz Variable Insurance Product Trust (42 portfolios). | |
John R. Mallin YOB: 1950 Elected: 2016 65 Portfolios | Partner/Attorney (since 2003), McCarter & English LLP (law firm), Real Property Practice Group; and Member (since 2014), Counselors of Real Estate. Trustee (since 2016), Virtus Mutual Fund Complex (52 portfolios) and Virtus Alternative Solutions Trust (4 portfolios); Director (since 2013), Horizon, Inc. (non-profit); and Trustee (since 1999), Virtus Variable Insurance Trust (9 portfolios). | |
McClellan, Hassell H. YOB: 1945 Elected: 2015 65 Portfolios | Retired (since 2013); and Professor (1984 to 2013), Wallace E. Carroll School of Management, Boston College. Trustee (since 2016), Virtus Alternative Solutions Trust (4 portfolios); Trustee (since 2015), Virtus Mutual Fund Complex (52 portfolios); and Director (since 2010), Barnes Group, Inc. (diversified global components manufacturer and logistical services company); Trustee, Virtus Variable Insurance Trust (9 portfolios) (since 2008); and Trustee, John Hancock Fund Complex (since 2000) (collectively, 228 portfolios). | |
McLoughlin, Philip YOB: 1946 Elected: 1999 74 Portfolios | Retired. Director and Chairman (since 2016), The Zweig Fund and Virtus Global Dividend & Income Fund Inc.; Trustee and Chairman (since 2013), Virtus Alternative Solutions Trust (4 portfolios); Trustee/Director and Chairman (since 2011), Virtus Closed-End Funds (3 funds); Chairman and Trustee (since 2003), Virtus Variable Insurance Trust (9 portfolios); Director (since 1995), closed-end funds managed by Duff & Phelps Investment Management Co. (4 funds); Director (since 1991) and Chairman (since 2010), Lazard World Trust Fund (closed-end investment firm in Luxembourg); and Trustee (since 1989) and Chairman (since 2002), Virtus Mutual Fund Complex (52 portfolios). | |
McNamara, Geraldine M. YOB: 1951 Elected: 2001 69 Portfolios | Retired. Trustee (since 2016) Virtus Alternative Solutions Trust (4 portfolios); Trustee (since 2015), Virtus Variable Insurance Trust (9 portfolios); Director (since 2003), closed-end funds managed by Duff & Phelps Investment Management Co. (4 funds); and Trustee (since 2001), Virtus Mutual Fund Complex (52 portfolios). |
62
Table of Contents
FUND MANAGEMENT TABLES (UNAUDITED) (Continued)
Independent Trustees (Continued)
| Name, Year of Birth, Year Elected and Number of Funds Overseen | Principal Occupation(s) Other Directorships Held by Trustee | |
Oates, James M. YOB: 1946 Elected: 2000 70 Portfolios | Managing Director (since 1994), Wydown Group (consulting firm). Director (since 2016), The Zweig Fund and Virtus Global Dividend & Income Fund Inc.; Trustee (since 2016) Virtus Variable Insurance Trust (9 portfolios); Trustee/Director (since 2013), Virtus Closed-End Funds (3 funds); Trustee (since 2013), Virtus Alternative Solutions Trust (4 portfolios); Chairman and Trustee (since 2005), John Hancock Fund Complex (228 portfolios); Director (2002 to 2014), New Hampshire Trust Company; Chairman (since 2000), Emerson Investment Management, Inc.; Non-Executive Chairman (2000 to 2014), Hudson Castle Group, Inc. (formerly IBEX Capital Markets, Inc.) (financial services) Chairman and Director (1999 to 2014), Connecticut River Bank; Director (since 1996), Stifel Financial; and Trustee (since 1987), Virtus Mutual Fund Complex (52 portfolios). | |
Segerson, Richard E. YOB: 1948 Elected: 2000 65 Portfolios | Retired; and Managing Director (1998 to 2013), Northway Management Company. Trustee (since 2016) Virtus Alternative Solutions Trust (4 portfolios) and Virtus Variable Insurance Trust (9 portfolios); and Trustee (since 1983), Virtus Mutual Fund Complex (52 portfolios). | |
Verdonck, Ferdinand L.J. YOB: 1942 Elected: 2005 65 Portfolios | Vice Chairman (since 2014), Affirmed Therapeutics (biotechnology); Director (1998 to 2015), The J.P. Morgan Continental European Investment Trust; Director (2005 to 2013), Galapagos N.V. (biotechnology); Director (1998 to 2015) Groupe SNEF; and Mr. Verdonck is also a director of several non-U.S. companies. Trustee (since 2016) Virtus Variable Insurance Trust (9 portfolios) and Virtus Alternative Solutions Trust (4 portfolios); and Trustee (since 2002), Virtus Mutual Fund Complex (52 portfolios). |
Interested Trustee
The individual listed below is an “interested person” of the Trust, as defined in Section 2(a)(19) of the 1940 Act, as amended, and the rules and regulations thereunder.
| Name, Year of Birth, Year Elected and Number of Funds Overseen | Principal Occupation(s) During Past 5 Years and | |
Aylward, George R.* Trustee and President YOB: 1964 Elected: 2006 70 Portfolios | Director, President and Chief Executive Officer (since 2008), Virtus Investment Partners, Inc. and/or certain of its subsidiaries; various senior officer positions with Virtus affiliates (since 2005). Chairman and Trustee (since 2015), Virtus ETF Trust II; Trustee and President (since 2013), Virtus Alternative Solutions Trust (4 portfolios); Director (since 2013), Virtus Global Funds, PLC (2 portfolios); Trustee (since 2012) and President (since 2010), Virtus Variable Insurance Trust (9 portfolios); Trustee and President (since 2011), Virtus Closed-End Funds (3 funds); Trustee (since 2006), Virtus Mutual Funds (52 portfolios); and Director, President and Chief Executive Officer (since 2006), The Zweig Fund and Virtus Global Dividend & Income Fund Inc. |
63
Table of Contents
FUND MANAGEMENT TABLES (UNAUDITED) (Continued)
Officers of the Trust Who Are Not Trustees
Name, Address and Year of Birth | Position(s) Held with Time Served | Principal Occupation(s) During Past 5 Years | ||
Bradley, W. Patrick YOB: 1972 | Executive Vice President (since 2016); Senior Vice President (2013 to 2016); Vice President (2011 to 2013); Chief Financial Officer and Treasurer (since 2006). | Executive Vice President, Fund Services (since 2016), Senior Vice President, Fund Services (2010 to 2016), Virtus Investment Partners, Inc. and/or certain of its subsidiaries; various officer positions (since 2006) with Virtus affiliates; Executive Vice President (since 2016), Senior Vice President (2013 to 2016), Vice President (2011 to 2013), Chief Financial Officer and Treasurer (since 2004), Virtus Variable Insurance Trust; Executive Vice President (since 2016), Senior Vice President (2013 to 2016), Vice President (2011 to 2013), Chief Financial Officer and Treasurer (since 2006), Virtus Mutual Fund Complex; Executive Vice President (since 2016), Senior Vice President (2013 to 2016), Vice President (2012 to 2013) and Treasurer (Chief Financial Officer) (since 2007), The Zweig Fund and Virtus Global Dividend & Income Fund Inc.; Executive Vice President (since 2016), Senior Vice President (2013 to 2016), Vice President (2011 to 2013), Chief Financial Officer and Treasurer (since 2011), Virtus Closed-End Funds; Vice President and Assistant Treasurer (since 2011), Duff & Phelps Global Utility Income Fund Inc.; Director (since 2013), Virtus Global Funds, PLC; and Executive Vice President (since 2016), Senior Vice President, Chief Financial Officer and Treasurer (2013 to 2016), Virtus Alternative Solutions Trust. | ||
Carr, Kevin J. YOB: 1954 | Senior Vice President (since 2013); Vice President (2005 to 2013); Chief Legal Officer, Counsel and Secretary (since 2005). | Senior Vice President (since 2009), Vice President, Counsel and Secretary (2008 to 2009), Virtus Investment Partners, Inc. and/or certain of its subsidiaries; various senior officer positions (since 2005) with Virtus affiliates; Senior Vice President (since 2013), Vice President (2005 to 2013), Chief Legal Officer, Counsel and Secretary (since 2005), Virtus Mutual Fund Complex; Senior Vice President (2013 to 2014), Vice President (2012 to 2013) and Assistant Secretary (since 2012), Secretary and Chief Legal Officer (2005 to 2012), The Zweig Fund and Virtus Global Dividend & Income Fund Inc.; Assistant Secretary (since 2013), Vice President, Chief Legal Officer, Counsel and Secretary (2010 to 2013), Virtus Variable Insurance Trust; Vice President and Assistant Secretary (since 2011), Duff & Phelps Global Utility Income Fund Inc.; Senior Vice President and Assistant Secretary (2013 to 2014), Vice President and Assistant Secretary (2012 to 2013), Vice President, Chief Legal Officer, Counsel and Secretary (2011 to 2012), Virtus Closed-End Funds; and Assistant Secretary (since 2013), Virtus Alternative Solutions Trust. |
64
Table of Contents
FUND MANAGEMENT TABLES (UNAUDITED) (Continued)
Officers of the Trust Who Are Not Trustees (Continued)
Name, Address and Year of Birth | Position(s) Held with Time Served | Principal Occupation(s) During Past 5 Years | ||
Engberg, Nancy J. YOB: 1956 | Vice President and Chief Compliance Officer since 2011. | Vice President (since 2008) and Chief Compliance Officer (2008 to 2011 and since 2016), Virtus Investment Partners, Inc. and/or certain of its subsidiaries; various officer positions (since 2003) with Virtus affiliates; Vice President and Chief Compliance Officer (since 2011), Virtus Mutual Fund Complex; Vice President (since 2010) and Chief Compliance Officer (since 2011), Virtus Variable Insurance Trust; Vice President and Chief Compliance Officer (since 2011), Virtus Closed-End Funds; Vice President and Chief Compliance Officer (since 2012), The Zweig Fund and Virtus Global Dividend & Income Fund Inc.; Vice President and Chief Compliance Officer (since 2013), Virtus Alternative Solutions Trust; Chief Compliance Officer (since 2015), ETFis Series Trust I; and Chief Compliance Officer (since 2015), Virtus ETF Trust II. | ||
Waltman, Francis G. YOB: 1962 | Executive Vice President (since 2013); Senior Vice President (2008-2013). | Executive Vice President, Product Development (since 2009), Virtus Investment Partners, Inc. and/or certain of its subsidiaries; various senior officer positions (since 2006) with Virtus affiliates; Executive Vice President (since 2013), Senior Vice President (2008 to 2013), Virtus Mutual Fund Complex; Executive Vice President (since 2013), Senior Vice President (2010 to 2013), Virtus Variable Insurance Trust; Executive Vice President (since 2013), Senior Vice President (2011 to 2013), Virtus Closed-End Funds; Director (since 2013), Virtus Global Funds PLC; and Executive Vice President (since 2013), Virtus Alternative Solutions Trust. |
65
Table of Contents
VIRTUS OPPORTUNITIES TRUST
101 Munson Street
Greenfield, MA 01301-9668
Trustees
George R. Aylward
Thomas J. Brown
Donald C. Burke
Roger A. Gelfenbein
John R. Mallin
Hassell H. McClellan
Philip R. McLoughlin, Chairman
Geraldine M. McNamara
James M. Oates
Richard E. Segerson
Ferdinand L.J. Verdonck
Officers
George R. Aylward, President
Francis G. Waltman, Executive Vice President
W. Patrick Bradley, Executive Vice President, Chief Financial Officer and Treasurer
Kevin J. Carr, Senior Vice President, Chief Legal Officer, Counsel and Secretary
Nancy J. Engberg, Vice President and Chief Compliance Officer
Investment Adviser
Virtus Investment Advisers, Inc.
100 Pearl Street
Hartford, CT 06103-4506
Principal Underwriter
VP Distributors, LLC
100 Pearl Street
Hartford, CT 06103-4506
Administrator and Transfer Agent
Virtus Fund Services, LLC
100 Pearl Street
Hartford, CT 06103-4506
Custodian
JPMorgan Chase Bank, NA
1 Chase Manhattan Plaza
New York, NY 10005-1401
Independent Registered Public
Accounting Firm
PricewaterhouseCoopers LLP
2001 Market Street
Philadelphia, PA 19103-7042
How to Contact Us
Mutual Fund Services | 1-800-243-1574 | |||
Adviser Consulting Group | 1-800-243-4361 | |||
Website | Virtus.com |
Important Notice to Shareholders
The Securities and Exchange Commission has modified mailing regulations for semiannual and annual shareholder fund reports to allow mutual fund companies to send a single copy of these reports to shareholders who share the same mailing address. If you would like additional copies, please call Mutual Fund Services at 1-800-243-1574.
Table of Contents
For more information about
Virtus Mutual Funds, please call
your financial representative, or
contact us at 1-800-243-1574
or Virtus.com
| 8010 | 11-16 |

P.O. Box 9874
Providence, RI 02940-8074
Table of Contents

ANNUAL REPORT
Virtus Emerging Markets Debt Fund
Virtus Emerging Markets Equity Income Fund*
Virtus Emerging Markets Small-Cap Fund*
Virtus Global Infrastructure Fund*
Virtus Global Opportunities Fund
Virtus Global Real Estate Securities Fund*
Virtus Greater European Opportunities Fund
Virtus International Equity Fund*
Virtus International Real Estate Securities Fund
Virtus International Small-Cap Fund
Virtus International Wealth Masters Fund
September 30, 2016 TRUST NAME: VIRTUS OPPORTUNITIES TRUST * Prospectus and Statement of Additional Information (“SAI”) supplements applicable to these Funds appear |
 |
Not FDIC Insured
No Bank Guarantee
May Lose Value
Table of Contents
Proxy Voting Procedures and Voting Record (Form N-PX)
The subadvisers vote proxies relating to portfolio securities in accordance with procedures that have been approved by the Board of Trustees of the Trust (“Trustees,” or the “Board”). You may obtain a description of these procedures, along with information regarding how the Funds voted proxies during the most recent 12-month period ended June 30, free of charge, by calling toll-free 1-800-243-1574. This information is also available through the Securities and Exchange Commission’s (the “SEC”) website at http://www.sec.gov.
Form N-Q Information
The Trust files a complete schedule of portfolio holdings for each Fund with the SEC for the first and third quarters of each fiscal year on Form N-Q. Form N-Q is available on the SEC’s website at http://www.sec.gov. Form N-Q may be reviewed and copied at the SEC’s Public Reference Room. Information on the operation of the SEC’s Public Reference Room can be obtained by calling toll-free 1-800-SEC-0330.
This report is not authorized for distribution to prospective investors in the Funds presented in this book unless preceded or accompanied by an effective prospectus which includes information concerning the sales charge, each Fund’s record and other pertinent information.
Table of Contents
To My Fellow Shareholders of Virtus Mutual Funds:
 | I am pleased to present this annual report that reviews the performance of your fund for the 12 months ended September 30, 2016.
During the first half of the fiscal year, global equity markets were challenged by falling oil prices, China’s slowdown, and concerns over the Federal Reserve’s (“the Fed”) first rate hike in nine years, which occurred in December 2015. Equities plummeted in early 2016, but stabilizing oil prices and the Fed’s softened stance on further rate hikes for 2016 sparked a rally in mid-February that lasted until June. The U.K.’s June 23 “Brexit” decision to leave the European Union triggered a selloff that was largely | |
short-lived. Calm was restored by better-than-expected corporate earnings, an improving global economic picture, and reassurance that the world’s central banks would continue to provide monetary stimulus. By the end of September, U.S. equity markets had recovered much of their losses, and the 12-month period was positive for many asset classes.
For the 12 months ended September 30, 2016, U.S. small-cap stocks kept pace with U.S. large-cap stocks, as measured by the 15.47% and 15.43% returns of the Russell 2000® Index and S&P 500® Index, respectively. Within international equities, emerging markets significantly outperformed their developed peers, with the MSCI Emerging Markets Index (net) up 16.78%, while the MSCI EAFE® Index (net) returned 6.52%.
Demand for U.S. Treasuries remained strong, driven by foreign investors seeking safe havens and yield in light of the negative interest rate environment in many international economies. On September 30, 2016, the benchmark 10-year U.S. Treasury yielded 1.60% compared with 2.06% one year earlier. For the 12 months ended September 30, 2016, the broader U.S. fixed income market, as represented by the Bloomberg Barclays U.S. Aggregate Bond Index, which tracks Treasuries and other investment-grade debt securities, gained 5.19%, while non-investment grade bonds rose 12.73%, as measured by the Bloomberg Barclays U.S. Corporate High Yield Bond Index.
The strength of the global economy will likely remain a leading concern for markets in the months ahead, and investors will watch with great interest the actions of the Fed and other major central banks. The U.S. economy’s continued growth, as evidenced by recent strong jobs, housing, and consumer spending data, should give investors reason for optimism, but future market direction will be determined largely by the ability of corporations to continue to produce robust earnings.
Market uncertainty is an ever-present reminder of the importance of portfolio diversification, including exposure to both traditional and alternative asset classes. While diversification cannot guarantee a profit or prevent a loss, owning a variety of asset classes may cushion your portfolio against inevitable market fluctuations. Your financial advisor can help you ensure that your portfolio is adequately diversified across asset classes and investment strategies.
As always, thank you for entrusting Virtus with your assets. Should you have questions about your account or require assistance, please visit our website at Virtus.com, or call our customer service team at 1-800-243-1574. We appreciate your business and remain committed to your long-term financial success.
Sincerely,
George R. Aylward President, Virtus Mutual Funds
October 2016 | ||

Performance data quoted represents past results. Past performance is no guarantee of future results, and current performance may be higher or lower than the performance shown above.
1
Table of Contents
VIRTUS OPPORTUNITIES TRUST
Disclosure of Fund Expenses (Unaudited)
For the six-month period of April 1, 2016 to September 30, 2016
We believe it is important for you to understand the impact of costs on your investment. All mutual funds have operating expenses. As a shareholder of a Virtus Opportunities Trust Fund (each, a “Fund”), you may incur two types of costs: (1) transaction costs, including sales charges on purchases of Class A shares and contingent deferred sales charges on Class B and Class C shares; and (2) ongoing costs, including investment advisory fees, distribution and service fees, and other expenses. Class I shares and Class R6 shares are sold without sales charges and do not incur distribution and service fees. For further information regarding applicable sales charges, see Note 1 in the Notes to Financial Statements. These examples are intended to help you understand your ongoing costs (in dollars) of investing in a Fund and to compare these costs with the ongoing costs of investing in other mutual funds. These examples are based on an investment of $1,000 invested at the beginning of the period and held for the entire six-month period. The following Expense Table illustrates your Fund’s costs in two ways.
Actual Expenses
The first section of the accompanying table provides information about actual account values and actual expenses. You may use the information in this section, together with the amount you invested, to estimate the expenses that you paid over the period. Simply divide your account value by $1,000 (for example, an $8,600 account value divided by $1,000 = 8.6), then multiply the result by the number in the first section under the heading “Expenses Paid During Period” to estimate the expenses you paid on your account during the period.
Hypothetical Example for Comparison Purposes
The second section of the accompanying table provides information about hypothetical account values and hypothetical expenses based on each Fund’s actual expense ratio and an assumed rate of return of 5% per year before expenses, which is not your Fund’s actual return. The hypothetical account values and expenses may not be used to estimate the actual ending account balance or expenses you paid for the period. You may use this information to compare the ongoing costs of investing in your Fund and other funds. To do so, compare these 5% hypothetical examples with the 5% hypothetical examples that appear in the shareholder reports of the other funds.
Please note that the expenses shown in the accompanying table are meant to highlight your ongoing costs only and do not reflect any transactional costs, such as sales charges or contingent deferred sales charges. Therefore, the second section of the accompanying table is useful in comparing ongoing costs only, and will not help you determine the relative total costs of owning different funds. In addition, if these transactional costs were included, your costs would have been higher. The calculations assume no shares were bought or sold during the period. Your actual costs may have been higher or lower, depending on the amount of your investment and the timing of any purchases or redemptions.
| Expense Table | ||||||||||||||||
| Beginning Account Value April 1, 2016 | Ending Account Value September 30, 2016 | Annualized Expense Ratio | Expenses Paid During Period* | |||||||||||||
Emerging Markets Debt Fund |
| |||||||||||||||
Actual |
| |||||||||||||||
Class A | $ | 1,000.00 | $ | 1,102.30 | 1.37 | % | $ | 7.20 | ||||||||
Class C | 1,000.00 | 1,098.30 | 2.11 | 11.07 | ||||||||||||
Class I | 1,000.00 | 1,105.00 | 1.11 | 5.84 | ||||||||||||
Hypothetical (5% return before expenses) |
| |||||||||||||||
Class A | 1,000.00 | 1,018.15 | 1.37 | 6.91 | ||||||||||||
Class C | 1,000.00 | 1,014.45 | 2.11 | 10.63 | ||||||||||||
Class I | 1,000.00 | 1,019.45 | 1.11 | 5.60 | ||||||||||||
Emerging Markets Equity Income Fund |
| |||||||||||||||
Actual |
| |||||||||||||||
Class A | $ | 1,000.00 | $ | 1,091.90 | 1.77 | % | $ | 9.26 | ||||||||
Class C | 1,000.00 | 1,086.60 | 2.53 | 13.20 | ||||||||||||
Class I | 1,000.00 | 1,092.40 | 1.52 | 7.95 | ||||||||||||
Hypothetical (5% return before expenses) |
| |||||||||||||||
Class A | 1,000.00 | 1,016.15 | 1.77 | 8.92 | ||||||||||||
Class C | 1,000.00 | 1,012.35 | 2.53 | 12.73 | ||||||||||||
Class I | 1,000.00 | 1,017.40 | 1.52 | 7.67 | ||||||||||||
Emerging Markets Small-Cap Fund |
| |||||||||||||||
Actual |
| |||||||||||||||
Class A | $ | 1,000.00 | $ | 1,135.70 | 1.87 | % | $ | 9.98 | ||||||||
Class C | 1,000.00 | 1,131.20 | 2.61 | 13.91 | ||||||||||||
Class I | 1,000.00 | 1,136.80 | 1.61 | 8.60 | ||||||||||||
Hypothetical (5% return before expenses) |
| |||||||||||||||
Class A | 1,000.00 | 1,015.65 | 1.87 | 9.42 | ||||||||||||
Class C | 1,000.00 | 1,011.95 | 2.61 | 13.13 | ||||||||||||
Class I | 1,000.00 | 1,016.95 | 1.61 | 8.12 | ||||||||||||
Global Infrastructure Fund |
| |||||||||||||||
Actual |
| |||||||||||||||
Class A | $ | 1,000.00 | $ | 1,066.20 | 1.35 | % | $ | 6.97 | ||||||||
Class C | 1,000.00 | 1,062.40 | 2.10 | 10.83 | ||||||||||||
Class I | 1,000.00 | 1,067.50 | 1.10 | 5.69 | ||||||||||||
Hypothetical (5% return before expenses) |
| |||||||||||||||
Class A | 1,000.00 | 1,018.25 | 1.35 | 6.81 | ||||||||||||
Class C | 1,000.00 | 1,014.50 | 2.10 | 10.58 | ||||||||||||
Class I | 1,000.00 | 1,019.50 | 1.10 | 5.55 | ||||||||||||
Global Opportunities Fund |
| |||||||||||||||
Actual |
| |||||||||||||||
Class A | $ | 1,000.00 | $ | 1,052.30 | 1.49 | % | $ | 7.64 | ||||||||
Class B | 1,000.00 | 1,048.00 | 2.24 | 11.47 | ||||||||||||
Class C | 1,000.00 | 1,048.30 | 2.24 | 11.47 | ||||||||||||
Class I | 1,000.00 | 1,053.10 | 1.24 | 6.36 | ||||||||||||
Hypothetical (5% return before expenses) |
| |||||||||||||||
Class A | 1,000.00 | 1,017.55 | 1.49 | 7.52 | ||||||||||||
Class B | 1,000.00 | 1,013.80 | 2.24 | 11.28 | ||||||||||||
Class C | 1,000.00 | 1,013.80 | 2.24 | 11.28 | ||||||||||||
Class I | 1,000.00 | 1,018.80 | 1.24 | 6.26 | ||||||||||||
Global Real Estate Securities Fund |
| |||||||||||||||
Actual |
| |||||||||||||||
Class A | $ | 1,000.00 | $ | 1,038.00 | 1.42 | % | $ | 7.23 | ||||||||
Class C | 1,000.00 | 1,033.80 | 2.17 | 11.03 | ||||||||||||
Class I | 1,000.00 | 1,039.20 | 1.17 | 5.96 | ||||||||||||
Hypothetical (5% return before expenses) |
| |||||||||||||||
Class A | 1,000.00 | 1,017.90 | 1.42 | 7.16 | ||||||||||||
Class C | 1,000.00 | 1,014.15 | 2.17 | 10.93 | ||||||||||||
Class I | 1,000.00 | 1,019.15 | 1.17 | 5.91 | ||||||||||||
2
Table of Contents
VIRTUS OPPORTUNITIES TRUST
Disclosure of Fund Expenses (Unaudited) (Continued)
For the six-month period of April 1, 2016 to September 30, 2016
| Expense Table | ||||||||||||||||
| Beginning Account Value April 1, 2016 | Ending Account Value September 30, 2016 | Annualized Expense Ratio | Expenses Paid During Period* | |||||||||||||
Greater European Opportunities Fund |
| |||||||||||||||
Actual |
| |||||||||||||||
Class A | $ | 1,000.00 | $993.70 | 1.48 | % | $ | 7.38 | |||||||||
Class C | 1,000.00 | 989.80 | 2.25 | 11.19 | ||||||||||||
Class I | 1,000.00 | 994.40 | 1.23 | 6.13 | ||||||||||||
Hypothetical (5% return before expenses) |
| |||||||||||||||
Class A | 1,000.00 | 1,017.60 | 1.48 | 7.47 | ||||||||||||
Class C | 1,000.00 | 1,013.75 | 2.25 | 11.33 | ||||||||||||
Class I | 1,000.00 | 1,018.85 | 1.23 | 6.21 | ||||||||||||
International Equity Fund |
| |||||||||||||||
Actual |
| |||||||||||||||
Class A | $ | 1,000.00 | $ | 1,054.70 | 1.53 | % | $ | 7.86 | ||||||||
Class C | 1,000.00 | 1,050.60 | 2.27 | 11.64 | ||||||||||||
Class I | 1,000.00 | 1,056.00 | 1.27 | 6.53 | ||||||||||||
Hypothetical (5% return before expenses) |
| |||||||||||||||
Class A | 1,000.00 | 1,017.35 | 1.53 | 7.72 | ||||||||||||
Class C | 1,000.00 | 1,013.65 | 2.27 | 11.43 | ||||||||||||
Class I | 1,000.00 | 1,018.65 | 1.27 | 6.41 | ||||||||||||
International Real Estate Securities Fund |
| |||||||||||||||
Actual |
| |||||||||||||||
Class A | $ | 1,000.00 | $ | 1,032.80 | 1.53 | % | $ | 7.78 | ||||||||
Class C | 1,000.00 | 1,028.50 | 2.28 | 11.56 | ||||||||||||
Class I | 1,000.00 | 1,034.20 | 1.28 | 6.51 | ||||||||||||
Hypothetical (5% return before expenses) |
| |||||||||||||||
Class A | 1,000.00 | 1,017.35 | 1.53 | 7.72 | ||||||||||||
Class C | 1,000.00 | 1,013.60 | 2.28 | 11.48 | ||||||||||||
Class I | 1,000.00 | 1,018.60 | 1.28 | 6.46 | ||||||||||||
International Small-Cap Fund |
| |||||||||||||||
Actual |
| |||||||||||||||
Class A | $ | 1,000.00 | $ | 1,143.70 | 1.61 | % | $ | 8.63 | ||||||||
Class C | 1,000.00 | 1,140.30 | 2.36 | 12.63 | ||||||||||||
Class I | 1,000.00 | 1,145.30 | 1.36 | 7.29 | ||||||||||||
Class R6 | 1,000.00 | 1,145.30 | 1.27 | 6.81 | ||||||||||||
Hypothetical (5% return before expenses) |
| |||||||||||||||
Class A | 1,000.00 | 1,016.95 | 1.61 | 8.12 | ||||||||||||
Class C | 1,000.00 | 1,013.20 | 2.36 | 11.88 | ||||||||||||
Class I | 1,000.00 | 1,018.20 | 1.36 | 6.86 | ||||||||||||
Class R6 | 1,000.00 | 1,018.65 | 1.27 | 6.41 | ||||||||||||
International Wealth Masters Fund |
| |||||||||||||||
Actual | ||||||||||||||||
Class A | $ | 1,000.00 | $ | 1,040.80 | 1.57 | % | $ | 8.03 | ||||||||
Class C | 1,000.00 | 1,035.80 | 2.32 | 11.84 | ||||||||||||
Class I | 1,000.00 | 1,041.70 | 1.32 | 6.76 | ||||||||||||
Hypothetical (5% return before expenses) |
| |||||||||||||||
Class A | 1,000.00 | 1,017.15 | 1.57 | 7.92 | ||||||||||||
Class C | 1,000.00 | 1,013.40 | 2.32 | 11.68 | ||||||||||||
Class I | 1,000.00 | 1,018.40 | 1.32 | 6.66 | ||||||||||||
| * | Expenses are equal to the relevant Fund’s annualized expense ratio, which is net of waived fees and reimbursed expenses, if applicable, multiplied by the average account value over the period, multiplied by the number of days (183) expenses were accrued in the most recent fiscal half-year, then divided by 366 to reflect the one-half year period. |
For Funds which may invest in other funds, the annualized expense ratios noted above do not reflect fees and expenses associated with the underlying funds. If such fees and expenses had been included, the expenses would have been higher.
You can find more information about the Funds’ expenses in the Financial Statements section that follows. For additional information on operating expenses and other shareholder costs, refer to the prospectus.
3
Table of Contents
American Depositary Receipt (ADR)
Represents shares of foreign companies traded in U.S. dollars on U.S. exchanges that are held by a U.S. bank or a trust. Foreign companies use ADRs in order to make it easier for Americans to buy their shares.
Bank of Japan
The Bank of Japan is the Japanese central bank.
Bloomberg Barclays U.S. Aggregate Bond Index
The Bloomberg Barclays U.S. Aggregate Bond Index measures the U.S. investment-grade fixed-rate bond market. The index is calculated on a total return basis. The index is unmanaged, its returns do not reflect any fees, expenses, or sales charges, and it is not available for direct investment.
Bloomberg Barclays U.S. Corporate High Yield Bond Index
The Bloomberg Barclays U.S. Corporate High Yield Bond Index measures the U.S. dollar-denominated, high yield, fixed-rate corporate bond market. The index is calculated on a total return basis. The index is unmanaged, its returns do not reflect any fees, expenses, or sales charges, and it is not available for direct investment.
Brexit
A combination of the words “Britain” and “exit” which refers to Britain’s withdrawal form the European Union.
European Central Bank (“ECB”)
The European Central Bank (ECB) is responsible for conducting monetary policy for the euro area. The ECB was established as the core of the Eurosystem and the European System of Central Banks (ESCB). The ESCB comprises the ECB and the National Central Banks (NCBs) of all 17 EU Member States whether they have adopted the Euro or not.
European Union (“EU”)
The European Union (“EU”) is a unique economic and political union of 28 European countries. The EU was created in the aftermath of the Second World War that has become a single market for goods and services and it created the single currency the euro.
Exchange-Traded Funds (ETF)
An open-end fund that is traded on a stock exchange. Most ETFs have a portfolio of stocks or bonds that track a specific market index.
Federal Reserve (the “Fed”)
The Central Bank of the United States, responsible for controlling the money supply, interest rates and credit with the goal of keeping the U.S. economy and currency stable. Governed by a seven-member board, the system includes 12 regional Federal Reserve Banks, 25 branches and all national and state banks that are part of the system.
FTSE Developed Core Infrastructure 50/50 Index (net)
The FTSE Developed Core Infrastructure 50/50 Index (net) is a free float-adjusted market capitalization weighted index that gives participants an industry-defined interpretation of infrastructure and adjust the exposure to certain infrastructure sub-sectors. The constituent weights for the index are 50% Utilities, 30% Transportation including capping of 7.5% for railroads/railways and a 20% mix of other sectors including pipelines, satellites and telecommunication towers. The index is calculated on a total return basis with net dividends reinvested. The index is unmanaged, its returns do not reflect any fees, expenses, or sales charges, and is not available for direct investment.
FTSE EPRA/NAREIT Developed Rental ex U.S. Index (net)
The FTSE EPRA/NAREIT Developed Rental ex U.S. Index (net) is a free-float market capitalization-weighted index measuring international real estate securities, which meet minimum size, liquidity and investment focus criteria. The index is a sub-set of the FTSE EPRA/NAREIT Investment Focus Index Series, which separates the existing constituents into both Rental and Non-Rental Indices. A company is classified as Rental if the rental revenue from properties is greater than or equal to 70% of total revenue. The classification is based on revenue sources as disclosed in the latest published financial statement. The index is calculated on a total return basis with net dividends reinvested. The index is unmanaged, its returns do not reflect any fees, expenses, or sales charges, and it is not available for direct investment.
4
Table of Contents
KEY INVESTMENT TERMS (Continued)
FTSE EPRA/NAREIT Developed Rental Index (net)
The FTSE EPRA/NAREIT Developed Rental Index (net) is a free-float market capitalization-weighted index measuring global real estate securities, which meet minimum size, liquidity and investment focus criteria. The index is a sub-set of the FTSE EPRA/NAREIT Investment Focus Index Series, which separates the existing constituents into both Rental and Non-Rental Indices. A company is classified as Rental if the rental revenue from properties is greater than or equal to 70% of total revenue. The classification is based on revenue sources as disclosed in the latest published financial statement. The index is calculated on a total return basis with net dividends reinvested. The index is unmanaged, its returns do not reflect any fees, expenses, or sales charges, and it is not available for direct investment.
Global Industry Classification Standard (GICS)
The Global Industry Classification Standard (GICS) is a standardized classification system for equities that was developed by, and is the exclusive property and a service mark of, MSCI Inc. (MSCI) and Standard & Poor’s, a division of the McGraw-Hill Companies, Inc. (S&P). As of September 1, 2016, the GICS structure comprises 11 sectors, 24 industry groups, 68 industries, and 157 subindustries.
Global Infrastructure Linked Benchmark
The Global Infrastructure Linked Benchmark consists of the MSCI World Infrastructure Sector Capped Index, a market capitalization weighted index that measures performance of global infrastructure companies by capturing broad and diversified opportunities across telecommunication, utilities, energy, transportation and social infrastructure sectors. The telecommunication infrastructure and utilities sector each represent one-third of the index weight, while energy, transportation and social infrastructure sectors have a combined weight of the remaining one-third of the index. The index is calculated on a total return basis with net dividends reinvested. The index is unmanaged, its returns do not reflect any fees, expenses, or sales charges, and it is not available for direct investment. Performance of the Global Infrastructure Linked Benchmark prior to 9/1/2008 represents an allocation consisting of 65% MSCI USA/Utilities Index, 20% MSCI World Telecom Services Index, and 15% MSCI World ex USA/Utilities Index.
Gross Domestic Product (GDP)
The gross domestic product (GDP) represents the market value of all goods and services produced by the economy during the period measured, including personal consumption, government purchases, private inventories, paid-in construction costs and the foreign trade balance.
In Specie
In Specie is a phrase describing the distribution of an asset in its present form, rather than selling it and distributing the cash. In specie distribution is made when cash is not readily available, or allocating the physical asset is the better alternative.
JPMorgan Corporate Emerging Markets Bond Index (CEMBI)
The JPMorgan Corporate Emerging Markets Bond Index (CEMBI) is a global, liquid corporate emerging markets benchmark that tracks U.S. dollar-denominated corporate bonds issued by emerging markets entities. The index is unmanaged, its returns do not reflect any fees, expenses, or sales charges, and it is not available for direct investment.
JPMorgan Emerging Markets Bond Global Diversified Index (EMBI Global Diversified)
The JPMorgan Emerging Markets Bond Global Diversified Index (EMBI Global Diversified) is a uniquely-weighted version of the JPMorgan EMBI Global Index. The index limits the weights of those countries with larger debt stock by only including specified portions of these countries’ eligible current face amounts of debt outstanding. The countries covered in the EMBI Global Diversified Index are identical to those covered by the EMBI Global Index. The EMBI Global Index tracks total returns for U.S. dollar-denominated debt instruments issued by emerging market sovereign and quasi-sovereign entities: Brady bonds, loans, Eurobonds. The index is unmanaged, its returns do not reflect any fees, expenses, or sales charges, and it is not available for direct investment.
JPMorgan Government Bond Index-Emerging Markets (GBI-EM)
The GBI-EM is the first comprehensive, global local emerging markets index, and consists of regularly traded, liquid fixed rate, domestic currency government bonds. The index is unmanaged, its returns do not reflect any fees, expenses, or sales charges, and it is not available for direct investment.
5
Table of Contents
KEY INVESTMENT TERMS (Continued)
MSCI All Country World ex U.S. Small Cap Index (net)
The MSCI All Country World Index ex U.S. Small Cap Index (net) is a free float-adjusted market capitalization-weighted index that measures small cap equity performance of developed and emerging markets, excluding the U.S. The index is calculated on a total return basis with net dividends reinvested. The index is unmanaged, its returns do not reflect any fees, expenses, or sales charges, and it is not available for direct investment.
MSCI All Country World Index (net)
The MSCI All Country World Index (net) is a free float-adjusted market capitalization-weighted index that measures equity performance of developed and emerging markets. The index is calculated on a total return basis with net dividends reinvested. The index is unmanaged, its returns do not reflect any fees, expenses, or sales charges, and it is not available for direct investment.
MSCI EAFE® Index (net)
The MSCI EAFE® (Europe, Australasia, Far East) Index (net) is a free float-adjusted market capitalization-weighted index that measures developed foreign market equity performance, excluding the U.S. and Canada. The index is calculated on a total return basis with net dividends reinvested. The index is unmanaged, its returns do not reflect any fees, expenses, or sales charges, and it is not available for direct investment.
MSCI Emerging Markets Index (net)
The MSCI Emerging Markets Index (net) is a free float-adjusted market capitalization-weighted index designed to measure equity market performance in the global emerging markets. The index is calculated on a total return basis with net dividends reinvested. The index is unmanaged, its returns do not reflect any fees, expenses, or sales charges, and it is not available for direct investment.
MSCI Emerging Markets Small Cap Index (net)
The MSCI Emerging Markets Small Cap Index (net) is a free float-adjusted market capitalization-weighted index designed to measure small cap equity market performance in the global emerging markets. The index is calculated on a total return basis with net dividends reinvested. The index is unmanaged, its returns do not reflect any fees, expenses, or sales charges, and it is not available for direct investment.
MSCI Europe Index (net)
The MSCI Europe Index (net) is a free float-adjusted market capitalization weighted index that measures equity market performance of the developed markets in Europe. The index is calculated on a total return basis with net dividends reinvested. The index is unmanaged, its returns do not reflect any fees, expenses, or sales charges, and it is not available for direct investment.
MSCI World Index (net)
The MSCI World Index (net) is a free float-adjusted market capitalization-weighted index that measures developed global market equity performance. The index is calculated on a total return basis with net dividends reinvested. The index is unmanaged, its returns do not reflect any fees, expenses, or sales charges, and it is not available for direct investment.
MSCI World Infrastructure Sector Capped Index (net)
The MSCI World Infrastructure Sector Capped Index (net) is a market capitalization weighted index that measures performance of global infrastructure companies by capturing broad and diversified opportunities across telecommunication, utilities, energy, transportation and social infrastructure sectors. The telecommunication infrastructure and utilities sector each represent one-third of the index weight, while energy, transportation and social infrastructure sectors have a combined weight of the remaining one-third of the index. The index is calculated on a total return basis with net dividends reinvested. The index is unmanaged, its returns do not reflect any fees, expenses, or sales charges, and is not available for direct investment.
Organization of the Petroleum Exporting Countries (OPEC)
The Organization of the Petroleum Exporting Countries was originally organized in September 1960 with 5 member countries and there are currently 12 member countries. The organization’s objective is to co-ordinate and unify petroleum policies among member countries, in order to secure fair and stable prices for petroleum producers; an efficient, economic and regular supply of petroleum to consuming nations; and a fair return on capital to those investing in the industry.
6
Table of Contents
KEY INVESTMENT TERMS (Continued)
Real Estate Investment Trust (REIT)
A publicly traded company that owns, develops and operates income-producing real estate such as apartments, office buildings, hotels, shopping centers and other commercial properties.
Russell 2000® Index
The Russell 2000® Index is a market capitalization-weighted index of the 2,000 smallest companies in the Russell Universe, which comprises the 3,000 largest U.S. companies. The index is calculated on a total return basis with dividends reinvested. The index is unmanaged, its returns do not reflect any fees, expenses, or sales charges, and it is not available for direct investment.
S&P 500® Index
The S&P 500® Index is a free-float market capitalization-weighted index of 500 of the largest U.S. companies. The index is calculated on a total return basis with dividends reinvested. The index is unmanaged, its returns do not reflect any fees, expenses, or sales charges, and it is not available for direct investment.
Sponsored ADR (American Depositary Receipt)
An ADR which is issued with the cooperation of the company whose stock will underlie the ADR. Sponsored ADRs generally carry the same rights normally given to stockholders, such as voting rights. ADRs must be sponsored to be able to trade on a major U.S. exchange such as the New York Stock Exchange (“NYSE”).
U.S. Dollar Spot Index
The U.S. Dollar Spot Index tracks the strength of the U.S. dollar against a basket of foreign currencies (euro, yen, British pound, Canadian dollar, Swedish krona, and Swiss franc) on a weighted average basis.
7
Table of Contents
Fund Summary | Ticker Symbols: Class A: VEDAX Class C: VEDCX Class I: VIEDX |
Portfolio Manager Commentary by Newfleet Asset Management, LLC
| ¢ | The Fund is diversified and has an investment objective of total return from current income and capital appreciation. |
| ¢ | For the fiscal year ended September 30, 2016, the Fund’s Class A shares at NAV returned 15.58%, Class C shares returned 14.60%, and Class I shares returned 15.88%. For the same period, the Bloomberg Barclays U.S. Aggregate Bond Index, a broad-based fixed income index, returned 5.19%, and the JPMorgan Emerging Markets Bond Global Diversified Index, the Fund’s style-specific benchmark appropriate for comparison, returned 16.20%. |
All performance figures assume reinvestment of distributions and exclude the effect of sales charges. Past performance is no guarantee of future results, and current performance may be higher or lower than the performance shown above.
How did the markets perform during the Fund’s fiscal year?
Emerging market (EM) dollar-denominated debt returns outperformed several key domestic fixed income sectors including the U.S. investment grade corporate, U.S. high yield corporate, and intermediate U.S. Treasury sectors during the fiscal year ended September 30, 2016. EM sovereign dollar-denominated debt, as represented by the J.P. Morgan Emerging Markets Bond Global Diversified Index (EMBI), returned 16.20% for the period. EM dollar-denominated corporate debt, as represented by the J.P. Morgan Corporate Emerging Markets Bond Index Diversified Index (CEMBI), returned 12.53% for the period while local market returns, as measured by the J.P. Morgan GBI-EM Diversified Index, returned 14.48%.
EM debt market returns were positively impacted by the stabilization of China’s economic growth and other higher frequency economic data points and a rebound in commodity prices. China’s economy continued its transformation from investment to consumption, and growth continued to adjust to more sustainable levels. Meanwhile, the decline in commodity prices that characterized much of 2015 began to abate as supply and demand factors began
to rebalance. Importantly, oil markets underwent a substantial favorable adjustment over the year, which supported the credit profile of several key emerging markets economies.
In addition to the stabilization seen in China’s economy and improvement in key commodity markets, the U.S. Federal Reserve (“the Fed”) proved to be more “dovish” than market expectations. This boosted sentiment towards the asset class. The improvement in Brazil’s political environment and the return of Argentina to the international credit markets also contributed to positive sentiment in EM fixed income.
Within the EMBI sovereign universe, which focuses on government-issued bonds, the high yield and longer-duration segments outperformed with gains particularly strong in the Latin America and Africa regions, including Argentina, Venezuela, Ecuador, and Zambia. Meanwhile, several higher quality issuers in Central and Eastern Europe underperformed, including Latvia, Lithuania, and Poland. The CEMBI corporate universe experienced similar trends to the sovereign index with relative outperformance in the Latin America and Africa regions.
What factors affected the Fund’s performance during its fiscal year?
The Fund’s overall net return performance slightly underperformed relative to its style-specific benchmark. Country exposure to Venezuela, Argentina, and Brazil and exposure to longer-duration assets contributed positively to the Fund’s relative performance. The move during the period to increase the Fund’s allocation to sovereign issuers versus corporate issuers also helped performance. The Fund’s exposure to local currency-denominated investments during the period was largely neutral to relative performance.
The timing of certain EM corporate credit sales detracted from the Fund’s overall performance during the period. In addition, the Fund held some EM corporate securities that became distressed during the period which negatively impacted relative performance.
The preceding information is the opinion of portfolio management. Any such opinions are subject to change at any time based upon market or other conditions and should not be relied upon as investment
advice. Past performance is no guarantee of future results, and there is no guarantee that market forecasts will be realized.
There is no guarantee that the Fund will meet its objective.
| Asset Allocation | ||||||||
The following table presents asset allocations within certain sectors and as a percentage of total investments as of September 30, 2016.
|
| |||||||
Corporate Bonds and Notes | 54 | % | ||||||
Energy | 19 | % | ||||||
Financials | 15 | |||||||
Industrials | 5 | |||||||
Materials | 4 | |||||||
All other Corporate Bonds | 11 | |||||||
Foreign Government Securities | 43 | |||||||
Other (includes short-term investments) | 3 | |||||||
|
| |||||||
Total | 100 | % | ||||||
|
| |||||||
Credit & Interest: Debt securities are subject to various risks, the most prominent of which are credit and interest rate risk. The issuer of a debt security may fail to make interest and/or principal payments. Values of debt securities may rise or fall in response to changes in interest rates, and this risk may be enhanced with longer-term maturities.
Foreign & Emerging Markets: Investing internationally, especially in emerging markets, involves additional risks such as currency, political, accounting, economic, and market risk.
High Yield-High Risk Fixed Income Securities: There is a greater level of credit risk and price volatility involved with high yield securities than investment grade securities.
Prospectus: For additional information on risks, please see the Fund’s prospectus.
For information regarding the indexes and certain investment terms, see the Key Investment Terms starting on page 4.
8
Table of Contents
Emerging Markets Debt Fund (Continued)
| Average Annual Total Returns1 for periods ended 9/30/16 | ||||||||||||
| 1 year | Since Inception | Inception Date | ||||||||||
| Class A Shares at NAV2 | 15.58 | % | 3.21 | % | 9/5/12 | |||||||
| Class A Shares at POP3,4 | 11.25 | 2.25 | 9/5/12 | |||||||||
| Class C Shares at NAV2 and with CDSC4 | 14.60 | 2.43 | 9/5/12 | |||||||||
| Class I Shares at NAV | 15.88 | 3.47 | 9/5/12 | |||||||||
| Bloomberg Barclays U.S. Aggregate Bond Index | 5.19 | 2.57 | 5 | — | ||||||||
| JPMorgan Emerging Markets Bond Global Diversified Index | 16.20 | 5.19 | 5 | — | ||||||||
Fund Expense Ratios6: A Shares: Gross 1.49%, Net 1.36%; C Shares: Gross 2.24%, Net 2.11%; I Shares: Gross 1.24%, Net 1.11%.
All returns represent past performance which is no guarantee of future results. Current performance may be higher or lower than the performance shown. The investment return and principal value of an investment will fluctuate so that an investor’s shares, when redeemed, may be worth more or less than their original cost. The above table and graph below do not reflect the deduction of taxes that a shareholder would pay on fund distributions or the redemption of shares. Please visit Virtus.com for performance data current to the most recent month-end.
| 1 | Total returns are historical and include changes in share price and the reinvestment of both dividends and capital gains distributions. |
| 2 | “NAV” (Net Asset Value) total returns do not include the effect of any sales charge. |
| 3 | “POP” (Public Offering Price) total returns include the effect of the maximum front-end 3.75% sales charge. |
| 4 | “CDSC” (Contingent Deferred Sales Charge) is applied to redemptions of certain classes of shares that do not have a sales charge applied at the time of purchase. CDSC charges for certain redemptions of Class A shares made within 18 months of purchase in which a finder’s fee was paid and all redemptions of Class C shares within the first year are 1% and 0% thereafter. |
| 5 | The since inception index returns are from the Fund’s inception date. |
| 6 | The expense ratios of the Fund are set forth according to the prospectus for the Fund effective January 28, 2016, as supplemented and revised, and may differ from the expense ratios disclosed in the Financial Highlights tables in this report. See the Financial Highlights for more current expense ratios. Net Expense: Expenses reduced by the contractual fee waiver in effect through January 31, 2017. Gross Expense: Does not reflect the effect of the fee waiver. |
Growth of $10,000 For periods ended 9/30
This chart assumes an initial investment of $10,000 made on September 5, 2012 (inception date of the Fund), for Class A, Class C, and Class I shares including any applicable sales charges or fees. Performance assumes reinvestment of dividends and capital gain distributions.
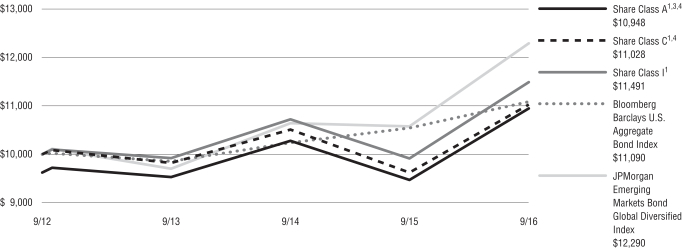
The indexes are unmanaged and not available for direct investment; therefore, their performance does not reflect the expenses associated with active management of an actual portfolio.
For information regarding the indexes and certain investment terms, see the Key Investment Terms starting on page 4.
9
Table of Contents
Emerging Markets Equity Income Fund
Fund Summary | Ticker Symbols: Class A: VEIAX Class C: VEICX Class I: VEIIX |
Portfolio Manager Commentary by
KBI Global Investors (North America) Ltd.
| ¢ | The Fund is diversified and has investment objectives of capital appreciation and income. |
| ¢ | For the fiscal year ended September 30, 2016, the Fund’s Class A shares at NAV returned 12.42%, Class C shares returned 11.54%, and Class I shares returned 12.69%. For the same period, the MSCI Emerging Markets Index (net), which serves as the Fund’s broad-based and style-specific benchmark appropriate for comparison, returned 16.78%. |
All performance figures assume reinvestment of distributions and exclude the effect of sales charges. Past performance is no guarantee of future results, and current performance may be higher or lower than the performance shown above.
1) How did the markets perform during the Fund’s fiscal year?
During the Fund’s fiscal year, global stock markets had strong gains, bond yields continued to trend lower, and commodity prices were generally higher. Emerging market equities were particularly strong, returning 16.78%, as measured by the MSCI Emerging Markets Index, in U.S. dollars (USD), outperforming by a significant margin their developed world counterparts, which returned 11.4%, as measured by the MSCI World Index (net).
The extraordinary easy monetary policy pursued by central banks globally since 2008 continued throughout the period. More recently, this journey has resulted in increasingly negative interest rates and bond yields around the globe. Indeed, the U.S. Federal Reserve’s decision to raise interest rates last December, even if repeated in coming months, is looking more and more like an anomaly in this overall context. Low rates and yields have become the new normal. Emerging markets have benefited from this environment. Generally stronger performance from commodities and better-than-feared data from China in particular also helped emerging market equities to outperform.
Latin American equities received a boost from Brazil’s strong stock market gains, as growing expectations of improved earnings and economic growth
continued to support the recovery there. Europe, the Middle East, and Africa (“EMEA”) was the relative laggard over the period as South African equities struggled after the central bank raised its benchmark repurchase rate to avert a pick-up in inflation expectations.
2) What factors affected the Fund’s performance during its fiscal year?
In constructing the portfolio, we seek to ensure that all excess value is delivered through security selection rather than through regional or sector bets. This is due to our conviction that the characteristics exhibited by companies and managements that are committed to paying and growing their dividends are powerful indicators of a company’s future health and profitability. Style factors do inevitably have an impact.
The Fund underperformed the benchmark during the fiscal year. Our key style biases were all out of favor over that period: specifically value, high yield, and mid-cap stocks. At an overall level for emerging markets, growth outperformed value during the period. This acted as a headwind for our strategy, which inherently has a value tilt. One of the key market inefficiencies that we exploit is the under-pricing by investors of the earnings growth delivered by higher payout companies. While value did outperform by a considerable margin in Latin America, this was not enough to counteract the performance of growth stocks in the rest of the emerging markets regions.
High yielding stocks underperformed during the period and within that extremely low yielding, and even zero yielding, companies accounted for much of the benchmark’s return during period. These stocks are especially concentrated in the software & services sector in China and India, and also in the hardware & technology sector in Korea. The Fund has exposure to these sectors but is not invested in stocks which are not high yielding enough to meet our criteria and which are trading on extremely high multiples. This resulted in relative stock selection detracting from performance, especially in the software & services and technology & hardware industries. In terms of countries, China, India, and Korea were the countries where our stock selection detracted relative to the benchmark. South Africa was a negative contributor,
driven in part by our underweight position in a media stock with technology exposure.
At the industry level, the strongest positive contributors during the period were food and consumer staples retailing, pharmaceuticals and biotechnology, real estate (especially in China), and transportation (especially in Malaysia). At the country level, Brazil, Malaysia, and Mexico were the strongest contributors to performance, leading to outperformance of the Latin American region over the period.
The preceding information is the opinion of portfolio management. Any such opinions are subject to change based upon market or other conditions and should not be relied upon as investment advice. Past performance is no guarantee of future results, and there is no guarantee that market forecasts will be realized.
There is no guarantee that the Fund will meet its objectives.
| Asset Allocation | ||||
The following table presents asset allocations within certain sectors and as a percentage of total investments as of September 30, 2016.
|
| |||
Financials | 31 | % | ||
Information Technology | 23 | |||
Consumer Discretionary | 9 | |||
Industrials | 8 | |||
Materials | 7 | |||
Energy | 6 | |||
Telecommunication Services | 5 | |||
Other | 11 | |||
|
| |||
Total | 100 | % | ||
|
| |||
Equity Securities: The market price of equity securities may be adversely affected by financial market, industry, or issuer-specific events. Focus on a particular style or on small or medium-sized companies may enhance that risk.
Foreign & Emerging Markets: Investing internationally, especially in emerging markets, involves additional risks such as currency, political, accounting, economic, and market risk.
For information regarding the indexes and certain investment terms, see the Key Investment Terms starting on page 4.
10
Table of Contents
| Emerging Markets Equity Income Fund (Continued) | ||
Geographic Concentration: A fund that focuses its investments in a particular geographic location will be highly sensitive to financial, economic, political, and other developments affecting the fiscal stability of that location.
Industry/Sector Concentration: A fund that focuses its investments in a particular industry or sector will be more sensitive to conditions that affect that industry or sector than a non-concentrated fund.
Prospectus: For additional information on risks, please see the Fund’s prospectus.
For information regarding the indexes and certain investment terms, see the Key Investment Terms starting on page 4.
11
Table of Contents
Emerging Markets Equity Income Fund (Continued)
| Average Annual Total Returns1 for periods ended 9/30/16 | ||||||||||||
| 1 year | Since Inception | Inception Date | ||||||||||
| Class A Shares at NAV2 | 12.42 | % | -0.02 | % | 9/5/12 | |||||||
| Class A Shares at POP3,4 | 5.96 | -1.47 | 9/5/12 | |||||||||
| Class C Shares at NAV2 and with CDSC4 | 11.54 | -0.79 | 9/5/12 | |||||||||
| Class I Shares at NAV | 12.69 | 0.22 | 9/5/12 | |||||||||
| MSCI Emerging Markets Index (net)* | 16.78 | 1.47 | 5 | — | ||||||||
S&P 500® Index* | 15.43 | 13.67 | 5 | | — | | ||||||
Fund Expense Ratios6: A Shares: Gross 1.78%, Net 1.77%; C Shares: Gross 2.53%, Net 2.52%; I Shares: Gross 1.53%, Net 1.52%.
All returns represent past performance which is no guarantee of future results. Current performance may be higher or lower than the performance shown. The investment return and principal value of an investment will fluctuate so that an investor’s shares, when redeemed, may be worth more or less than their original cost. The above table and graph below do not reflect the deduction of taxes that a shareholder would pay on fund distributions or the redemption of shares. Please visit Virtus.com for performance data current to the most recent month-end.
| 1 | Total returns are historical and include changes in share price and the reinvestment of both dividends and capital gains distributions. |
| 2 | “NAV” (Net Asset Value) total returns do not include the effect of any sales charge. |
| 3 | “POP” (Public Offering Price) total returns include the effect of the maximum front-end 5.75% sales charge. |
| 4 | “CDSC” (Contingent Deferred Sales Charge) is applied to redemptions of certain classes of shares that do not have a sales charge applied at the time of purchase. CDSC charges for certain redemptions of Class A shares made within 18 months of purchase in which a finder’s fee was paid and all redemptions of Class C shares within the first year are 1% and 0% thereafter. |
| 5 | The since inception index returns are from the Fund’s inception date. |
| 6 | The expense ratios of the Fund are set forth according to the prospectus for the Fund effective January 28, 2016, as supplemented and revised through September 30, 2016, and may differ from the expense ratios disclosed in the Financial Highlights tables in this report. See the Financial Highlights for more current expense ratios. Net Expense: Expenses reduced by the contractual fee waiver in effect through January 31, 2017. Gross Expense: Does not reflect the effect of the fee waiver. |
| * | The MSCI Emerging Markets Index (net) is an appropriate Broad Based Index. The Fund is no longer using the S&P 500® Index. |
Growth of $10,000 For periods ended 9/30
This chart assumes an initial investment of $10,000 made on September 5, 2012 (inception date of the Fund), for Class A, Class C, and Class I shares including any applicable sales charges or fees. Performance assumes reinvestment of dividends and capital gain distributions.
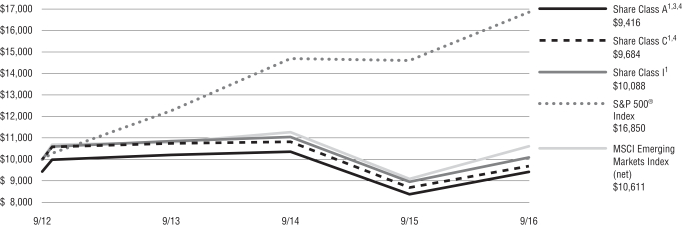
The indexes are unmanaged and not available for direct investment; therefore, their performance does not reflect the expenses associated with active management of an actual portfolio.
For information regarding the indexes and certain investment terms, see the Key Investment Terms starting on page 4.
12
Table of Contents
Emerging Markets Small-Cap Fund
Fund Summary | Ticker Symbols: Class A: VAESX Class C: VCESX Class I: VIESX |
Portfolio Manager Commentary by Kayne Anderson Rudnick Investment Management, LLC
| ¢ | The Fund is diversified and has an investment objective of capital appreciation. |
| ¢ | For the fiscal year ended September 30, 2016, the Fund’s Class A shares at NAV returned 20.66%, Class C shares returned 19.62%, and Class I shares returned 20.82%. For the same period, the S&P 500® Index, a broad-based equity index, returned 15.43%, and the MSCI Emerging Markets Small Cap Index (net), the Fund’s style-specific benchmark appropriate for comparison, returned 12.65%. |
All performance figures assume reinvestment of distributions and exclude the effect of sales charges. Past performance is no guarantee of future results, and current performance may be higher or lower than the performance shown above.
How did the markets perform during the Fund’s fiscal year?
Following the sharp sell-off in the calendar third quarter of 2015 (the Fund’s fiscal fourth quarter), global equity markets rallied in the fourth quarter of 2015. Selling resumed early in the first quarter of 2016 over global growth concerns. As the global economic growth outlook stabilized, and concerns over central bank tightening (primarily by the U.S. Federal Reserve) waned, global equities advanced substantially over the last two quarters.
Following dismal performance over the last few years, materials was the best performing equity sector over the last year as global commodity prices finally showed signs of stabilization. Because of this, countries where natural resources make up a large part of the economy, such as Brazil, Russia, and South Africa, performed strongly. The notable underperformer was South Korea, where small-cap stocks declined slightly in an otherwise strong market.
What factors affected the Fund’s performance during its fiscal year?
The Fund outperformed the benchmark by a significant margin over the year, mainly driven by stock selection. Our geographic weighting provided
some tailwind, mainly driven by our overweight position in Brazil. In terms of sectors, our stock selection in industrials helped performance, but our significant overweight in consumer staples was a drag as that sector underperformed.
Looking at individual stocks, the largest positive contributor to performance was Tegma Gestao Logistica, a transportation logistics company in Brazil. Its primary business is transporting new cars from automotive production facilities to dealerships throughout the country. Last year, Tegma was our largest detractor from performance as the Brazilian auto industry, and the country overall, deteriorated from simply bad into a genuine crisis. Over the last 12 months, we saw some signs of stabilization in Brazil on many fronts, and there is optimism that the automotive industry may resume growth next year. Tegma also took important steps over this time to strengthen its balance sheet and improve its cost structure.
The largest detractor from performance over the last year was Autohome. The company, which is listed in the U.S., is the leading online destination for automobile consumers in China. The shares have been under pressure for two primary reasons. First, management continues to invest in their new car transaction business at the expense of current margins. Second, there has been significant management and shareholder turnover as the controlling shareholder, Australian-listed Telstra, sold most of their stake to Ping An, a Chinese-listed insurance company, who subsequently replaced senior management. Collectively, this has created uncertainty with investors, which generally leads to lower stock prices. While we are frustrated with some of the actions taking place at the management and ownership level, the core business at Autohome continued to perform well at the Fund’s fiscal year end. We believe that the strength of the core business will ultimately drive the overall profitability of the business and the stock in the long run and therefore continued to hold our position at the Fund’s fiscal year end.
The preceding information is the opinion of portfolio management. Any such opinions are subject to change at any time based upon market or other conditions and should not be relied upon as investment advice. Past performance is no guarantee of future
results, and there is no guarantee that market forecasts will be realized.
There is no guarantee that the Fund will meet its objective.
| Asset Allocation | ||||
The following table presents asset allocations within certain sectors and as a percentage of total investments as of September 30, 2016.
|
| |||
Industrials | 27 | % | ||
Consumer Staples | 23 | |||
Financials | 17 | |||
Materials | 12 | |||
Consumer Discretionary | 10 | |||
Information Technology | 9 | |||
Energy | 1 | |||
Other (includes short-term investments) | 1 | |||
|
| |||
Total | 100 | % | ||
|
| |||
Equity Securities: The market price of equity securities may be adversely affected by financial market, industry, or issuer-specific events. Focus on a particular style or on small or medium-sized companies may enhance that risk.
Foreign & Emerging Markets: Investing internationally, especially in emerging markets, involves additional risks such as currency, political, accounting, economic, and market risk.
Industry/Sector Concentration: A fund that focuses its investments in a particular industry or sector will be more sensitive to conditions that affect that industry or sector than a non-concentrated fund.
Limited Number of Investments: Because the Fund has a limited number of securities, it may be more susceptible to factors adversely affecting its securities than a less concentrated fund.
Prospectus: For additional information on risks, please see the Fund’s prospectus.
For information regarding the indexes and certain investment terms, see the Key Investment Terms starting on page 4.
13
Table of Contents
Emerging Markets Small-Cap Fund (Continued)
| Average Annual Total Returns1 for periods ended 9/30/16 | ||||||||||||
| 1 year | Since Inception | Inception Date | ||||||||||
| Class A Shares at NAV2 | 20.66 | % | -0.59 | % | 12/17/13 | |||||||
| Class A Shares at POP3,4 | 13.72 | -2.68 | 12/17/13 | |||||||||
| Class C Shares at NAV2 and with CDSC4 | 19.62 | -1.34 | 12/17/13 | |||||||||
| Class I Shares at NAV | 20.82 | -0.36 | 12/17/13 | |||||||||
| S&P 500® Index | 15.43 | 9.59 | 5 | — | ||||||||
| MSCI Emerging Markets Small Cap Index (net) | 12.65 | 1.57 | 5 | — | ||||||||
Fund Expense Ratios6: A Shares: Gross 3.63%, Net 1.86%; C Shares: Gross 4.38%, Net 2.61%; I Shares: Gross 3.38%, Net 1.61%.
All returns represent past performance which is no guarantee of future results. Current performance may be higher or lower than the performance shown. The investment return and principal value of an investment will fluctuate so that an investor’s shares, when redeemed, may be worth more or less than their original cost. The above table and graph below do not reflect the deduction of taxes that a shareholder would pay on fund distributions or the redemption of shares. Please visit Virtus.com for performance data current to the most recent month-end.
| 1 | Total returns are historical and include changes in share price and the reinvestment of both dividends and capital gains distributions. |
| 2 | “NAV” (Net Asset Value) total returns do not include the effect of any sales charge. |
| 3 | “POP” (Public Offering Price) total returns include the effect of the maximum front-end 5.75% sales charge. |
| 4 | “CDSC” (Contingent Deferred Sales Charge) is applied to redemptions of certain classes of shares that do not have a sales charge applied at the time of purchase. CDSC charges for certain redemptions of Class A shares made within 18 months of purchase in which a finder’s fee was paid and all redemptions of Class C shares within the first year are 1% and 0% thereafter. |
| 5 | The since inception index returns are from the Fund’s inception date. |
| 6 | The expense ratios of the Fund are set forth according to the prospectus for the Fund effective January 28, 2016, as supplemented and revised, and may differ from the expense ratios disclosed in the Financial Highlights tables in this report. See the Financial Highlights for more current expense ratios. Net Expense: Expenses reduced by the contractual fee waiver in effect through January 31, 2017. Gross Expense: Does not reflect the effect of the fee waiver. |
Growth of $10,000 For periods ended 9/30
This chart assumes an initial investment of $10,000 made on December 17, 2013 (inception date of the Fund), for Class A, Class C, and Class I shares including any applicable sales charges or fees. Performance assumes reinvestment of dividends and capital gain distributions.
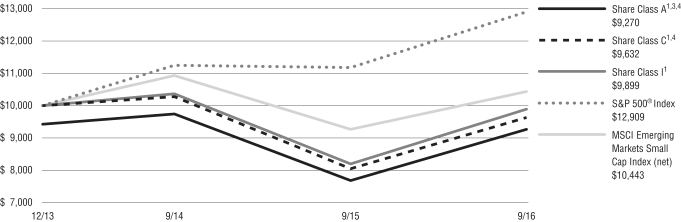
The indexes are unmanaged and not available for direct investment; therefore, their performance does not reflect the expenses associated with active management of an actual portfolio.
For information regarding the indexes and certain investment terms, see the Key Investment Terms starting on page 4.
14
Table of Contents
Fund Summary | Ticker Symbols: Class A: PGUAX Class C: PGUCX Class I: PGIUX |
Portfolio Manager Commentary by Duff & Phelps Investment Management Co.
| ⬛ | The Fund is diversified and has investment objectives of both capital appreciation and current income. |
| ⬛ | For the fiscal year ended September 30, 2016, the Fund’s Class A shares at NAV returned 14.79%, Class C shares returned 13.94%, and Class I shares returned 15.07%. For the same period, the S&P 500® Index, a broad-based equity index returned 15.43%, and the Global Infrastructure Linked Benchmark, the Fund’s style-specific benchmark appropriate for comparison, returned 13.61%. |
All performance figures assume reinvestment of distributions and exclude the effect of sales charges. Past performance is no guarantee of future results, and current performance may be higher or lower than the performance shown above.
How did the markets perform during the Fund’s fiscal year?
For the 12 months ended September 30, 2016, developed world equity markets posted strong returns even though there were multiple challenges. Stocks managed to move forward despite tepid economic outlooks across the world, widespread political election uncertainties, and more recently, concerns about the stability of the European banking sector. Market volatility over the period was enhanced by a short-lived, broad-based sell-off triggered by the U.K.’s “Brexit” vote, and was followed by a strong relief rally as global central banks reiterated intentions to continue with monetary easing policies.
In Europe, most stock markets finished the fiscal year in positive territory with Italy a notable exception. Italian stocks were negatively impacted by concerns over a constitutional referendum (a vote is currently scheduled for early December) in which voters will decide the future structure of the government. The current prime minister, viewed by many as constructive toward commerce and markets, has pledged to resign if the reform measures are rejected.
U.S. stock markets ended the fiscal year among the strongest performers in the developed world. After a volatile first half in which the Federal Reserve (“the Fed”) raised the targeted Fed funds rate by 25 basis points, U.S. stocks moved upward as expectations for further Fed rate hikes diminished, Brexit fears were forgotten, and the OPEC oil cartel reached an agreement on oil production cuts.
What factors affected the Fund’s performance during its fiscal year?
Similar to broader equity markets, the sectors in which the Fund invests experienced significant volatility over the course of the fiscal year. While the Fund was outpaced somewhat by the broad U.S. equity market, as measured by the S&P 500® Index, the Fund did outperform its style-specific benchmark, the Global Infrastructure Linked Benchmark, for the year ended September 30, 2016. The Fund’s outperformance of the style benchmark can be partially attributed to the defensive sectors in which we invest being supported by the “lower-for-longer” interest rate policies instituted by central banks across the developed world.
The primary contributor to the Fund’s outperformance versus the benchmark was stock selection in utilities and transportation. Utilities in several countries were buoyed by accommodative central bank policies. The Fund was overweight U.S. utilities, which sold off prior to the Fed’s December rate hike, but rebounded strongly during the second quarter when investors sensed a less hawkish Fed. However, utilities lost ground during the final quarter as investors rotated out of defensive names due to strong relative performance and the return of rising interest rate concerns.
Transportation, which was the Fund’s largest overweight, was also its top performing sector during the year. Strong stock selection contributed to the sector’s outperformance versus the benchmark. Transportation stocks were driven upward by growing air passenger demand and toll road usage. Air passenger growth was particularly strong in Australia and New Zealand as a result of an expansion in the number of planes and routes to mainland China. However, in Europe we have recently turned more cautious on Northern hub airports as passenger loads have been adversely impacted by terrorism concerns.
Communications was a slight detractor to performance versus the benchmark over the course of the fiscal year mainly due to exposure to the satellite companies. We had a large underweight in the sector, driven by concerns around the wireless market for U.S. integrated telecommunications companies, uncertainty surrounding the impact of the eurozone economy on European telecommunications fundamentals, and stock valuations.
Energy sector performance had a neutral impact on relative performance over the course of the year. Weak stock selection was offset by an overweight sector allocation. After a dismal start, energy was the Fund’s best performing sector over the final three quarters as oil prices stabilized and the stocks reacted positively to the OPEC oil production cuts agreed to in September.
Also contributing positively to the Fund’s outperformance versus the benchmark was the social services sector. The Fund does not have an allocation to health care or educational stocks, as we do not believe they meet our investment criteria for revenue visibility, dividend yield, and geographic diversification. Social services stocks posted positive returns, but they significant lagged those of the four sectors in which the Fund does invest.
The preceding information is the opinion of portfolio management. Any such opinions are subject to change at any time based upon market or other conditions and should not be relied upon as investment advice. Past performance is no guarantee of future results, and there is no guarantee that market forecasts will be realized.
There is no guarantee that the Fund will meet its objectives.
For information regarding the indexes and certain investment terms, see the Key Investment Terms starting on page 4.
15
Table of Contents
| Global Infrastructure Fund (Continued) |
| Asset Allocation | ||||
The following table presents asset allocations within certain sectors and as a percentage of total investments as of September 30, 2016.
|
| |||
Utilities | 37 | % | ||
Energy | 26 | |||
Telecommunication Services | 16 | |||
Industrials | 15 | |||
Financials | 6 | |||
|
| |||
Total | 100 | % | ||
|
| |||
Equity Securities: The market price of equity securities may be adversely affected by financial market, industry, or issuer-specific events. Focus on a particular style or on small or medium-sized companies may enhance that risk.
Foreign Investing: Investing internationally involves additional risks such as currency, political, accounting, economic, and market risk.
Industry/Sector Concentration: A fund that focuses its investments in a particular industry or sector will be more sensitive to conditions that affect that industry or sector than a non-concentrated fund.
Income: Income received from the Fund may vary widely over the short- and long-term.
Prospectus: For additional information on risks, please see the Fund’s prospectus.
For information regarding the indexes and certain investment terms, see the Key Investment Terms starting on page 4.
16
Table of Contents
Global Infrastructure Fund (Continued)
| Average Annual Total Returns1 for periods ended 9/30/16 | ||||||||||||||||||||
| 1 year | 5 years | 10 years | Since Inception | Inception Date | ||||||||||||||||
| Class A Shares at NAV2 | 14.79 | % | 10.23 | % | 6.78 | % | — | — | ||||||||||||
| Class A Shares at POP3,4 | 8.19 | 8.93 | 6.15 | — | — | |||||||||||||||
| Class C Shares at NAV2 and with CDSC4 | 13.94 | 9.43 | 6.00 | — | — | |||||||||||||||
| Class I Shares at NAV | 15.07 | 10.52 | — | 5.16 | % | 6/6/08 | ||||||||||||||
| S&P 500® Index* | 15.43 | 16.37 | 7.24 | 8.09 | 5 | — | ||||||||||||||
| Global Infrastructure Linked Benchmark | 13.61 | 8.90 | 5.37 | 3.41 | 5 | — | ||||||||||||||
| FTSE Developed Core Infrastructure 50/50 Index (net) | 14.65 | 11.79 | — | — | — | |||||||||||||||
| MSCI World Infrastructure Sector Capped Index (net)* | 13.61 | 8.90 | 5.05 | 3.18 | 5 | — | ||||||||||||||
Fund Expense Ratios6: A Shares: 1.22%; C Shares: 1.97%, I Shares: 0.97%.
All returns represent past performance which is no guarantee of future results. Current performance may be higher or lower than the performance shown. The investment return and principal value of an investment will fluctuate so that an investor’s shares, when redeemed, may be worth more or less than their original cost. The above table and graph below do not reflect the deduction of taxes that a shareholder would pay on fund distributions or the redemption of shares. Please visit Virtus.com for performance data current to the most recent month-end.
| 1 | Total returns are historical and include changes in share price and the reinvestment of both dividends and capital gains distributions. |
| 2 | “NAV” (Net Asset Value) total returns do not include the effect of any sales charge. |
| 3 | “POP” (Public Offering Price) total returns include the effect of the maximum front-end 5.75% sales charge. |
| 4 | “CDSC” (Contingent Deferred Sales Charge) is applied to redemptions of certain classes of shares that do not have a sales charge applied at the time of purchase. CDSC charges for certain redemptions of Class A shares made within 18 months of purchase in which a finder’s fee was paid and all redemptions of Class C shares within the first year are 1% and 0% thereafter. |
| 5 | The since inception returns are from Class I inception date (6/6/08). |
| 6 | The expense ratios of the Fund are set forth according to the prospectus for the Fund effective January 28, 2016, as supplemented and revised, and may differ from the expense ratios disclosed in the Financial Highlights tables in this report. See the Financial Highlights for more current expense ratios. |
| * | The MSCI World Infrastructure Sector Capped Index (net) is an appropriate Broad Based Index. The Fund is no longer using the S&P 500® Index. |
Growth of $10,000 For periods ended 9/30
This chart assumes an initial investment of $10,000 made on September 30, 2006, for Class A and Class C shares including any applicable sales charges or fees. Performance assumes reinvestment of dividends and capital gain distributions.
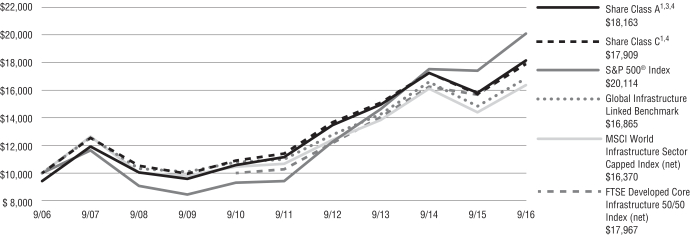
The indexes are unmanaged and not available for direct investment; therefore, their performance does not reflect the expenses associated with active management of an actual portfolio.
For information regarding the indexes and certain investment terms, see the Key Investment Terms starting on page 4.
17
Table of Contents
Fund Summary | Ticker Symbols: Class A: NWWOX Class B: WWOBX Class C: WWOCX Class I: WWOIX |
Portfolio Manager Commentary by Vontobel Asset Management, Inc.
| ¢ | The Fund is diversified and has an investment objective of capital appreciation. |
| ¢ | For the fiscal year ended September 30, 2016, the Fund’s Class A shares at NAV returned 11.38%, Class B shares returned 10.60%, Class C shares returned 10.57%, and Class I shares returned 11.65%. For the same period, the S&P 500® Index, a broad-based equity index, returned 15.43%, and the MSCI All Country World Index (net), the Fund’s style-specific benchmark appropriate for comparison, returned 11.96%. |
All performance figures assume reinvestment of distributions and exclude the effect of sales charges. Past performance is no guarantee of future results, and current performance may be higher or lower than the performance shown above.
How did the market perform during the Fund’s fiscal year?
During the fiscal year ended September 30, 2016, the MSCI AC World Index (total return net dividends) was positive in the first quarter, flat in the second and third quarters, and positive in the fourth quarter.
The S&P 500® Index advanced in the fourth quarter of 2015, driven by a recovery in large-cap equities. Following strong October and November U.S. labor reports, the Federal Reserve (“Fed”) raised interest rates by 25 basis points, the first time since 2006. The S&P 500® Index got off to a volatile start in 2016 as fears of slowed global growth and weakness in China weighed on investor sentiment. U.S. equities began the second quarter of 2016 on a promising note due to improving macroeconomic data, specifically an upgrade to GDP growth. On June 23, the U.K.’s unexpected vote to exit the European Union (“Brexit”) shocked financial markets, prompting increased volatility with a sell-off in global risk assets, rallies in safe-haven assets, and a sharp decline in the British pound against its major trading currencies. However, most global equity market indices recovered some of their losses in the few trading days after the Brexit decision. Optimism about U.S. economic improvement helped fuel markets during the third quarter of 2016. The Fed opted not to
tighten at its September meeting, but left the door open for an increase before year-end.
In the fourth quarter of 2015, the European Central Bank (“ECB”) announced monetary stimulus and cut its deposit rate by 0.10% to -0.3%, which was on the lower end of expectations and disappointed markets. European economic data was generally encouraging over the period. In the first quarter of 2016, the ECB announced a stimulus package that lowered its main policy rates and expanded its asset purchase program. While the package exceeded investors’ expectations, ECB President Mario Draghi hinted that future rate hikes were unlikely to be forthcoming, which drove European stocks down. Economic data signaled that the eurozone economy was continuing to grow, albeit slowly. In the second quarter of 2016, the European equity markets gained momentum with a weaker euro, encouraging macroeconomic data, and hopes for a new debt deal with Greece, although investors remained uncertain about the outcome of the U.K.’s referendum on European Union membership. In the three months after the unexpected “Brexit” vote outcome, European markets were bolstered by a rapid recovery from the sell-off and a generally optimistic second quarter reporting season.
After posting positive returns in October 2015, emerging market equities declined in November and December, ending in slightly positive territory for the fourth quarter of 2015. Volatility continued in emerging markets, as the asset class faced headwinds due to slowing growth, earnings pressure, U.S. dollar strength, a collapse in commodity prices and concerns over the Chinese economy. Emerging market equities rebounded in early 2016, driven by stronger commodity prices, a sharp rise in many emerging market currencies, and lower expectations for U.S. interest rate increases. The rally reversed in May as investors digested waning commodities prices, the prospect of a U.S. rate hike, and the potential impact of a change in government in Brazil after President Dilma Rousseff was suspended from office. Emerging markets rebounded in the third quarter as lower-than-expected interest rates in the United States continued to support demand for higher-yielding assets in the emerging world. Improved capital flows helped some emerging market currencies recover lost ground relative to the U.S. dollar, and stabilizing commodity prices helped a
number of markets during the final months of the fiscal year.
What factors affected the Fund’s performance during its fiscal year?
The following discussion highlights the specific stocks that provided the largest contributions to the Fund’s absolute performance and those that were the largest detractors during the fiscal year. As bottom-up stock pickers, we hope that investors find this useful and gain a greater understanding of how we invest their capital.
Stocks that Helped Absolute Performance
| ¢ | Philip Morris International (“PMI”) (U.S.) —Investors were drawn to the company which continued to perform well. PMI produces and sells cigarettes under brands such as Marlboro and L&M. In our opinion, the company has strong pricing power, leading brands, consistent constant currency earnings growth, opportunities for cost savings, and a large dividend. The company is also behind next generation products such as its heat-not-burn device, iQos. |
| ¢ | Amazon (U.S.) — The company performed well and continued to reach new highs as it has exhibited strong results across its three main segments. Firstly, in North America, revenue growth accelerated to 28% in second quarter 2016, while international growth picked up to 30% year-over-year. We believe the main reason is the success of Amazon Prime, which is driving higher frequency of ordering, higher transaction value, and lower churn. We are also seeing better-than-expected margin expansion due to a higher contribution of sales from third-party products, which is also being fueled by increasing availability on Prime and FBA (“fulfilled by Amazon”). Amazon Web Services’ (AWS) revenue growth has remained strong at 58% and operating margins at a record 30%. The penetration into enterprises is still in its early stage and AWS has an advantage in the development of applications, reliability, security and relationships with enterprises. Overall, the operating leverage and margin expansion story are now becoming more evident even after allowing Amazon room for further investment to strengthen its competitive advantage. For 20 years, Amazon has doggedly built its marquee brand into the |
For information regarding the indexes and certain investment terms, see the Key Investment Terms starting on page 4.
18
Table of Contents
| Global Opportunities Fund (Continued) |
quintessential name in e-commerce. Consumers worldwide flock to Amazon.com for the widest selection anywhere, the lowest-cost products, the convenience of free shipping, product reviews, and more. |
Stocks that Hurt Absolute Performance
| ¢ | Wells Fargo (U.S.) — The company’s stock declined significantly after it was announced in early September that the company had reached a $190 million settlement with the regulators because some of their employees had opened accounts for clients without the clients’ authorization. Employees that were engaged in these unauthorized account openings were let go by the company when the management became aware of what took place. A key point of this case is that we see the unauthorized account opening as a failure of compliance oversight internally. As the company made little income from these activities, the primary benefit appears to have been to employees in reaching performance goals. As a result, we feel it was a genuine oversight by management as opposed to an encouraged or tolerated practice designed to profit the bank at the cost of customers. The amount of the fine is small at $190 million compared to the company’s net income that is running at over $20 billion a year. Our main concern is whether this will have a lasting reputational damage to the company. While we believe Wells Fargo will remain under the spotlight over the coming few weeks, we do not feel, as of the end of the Fund’s fiscal year that the unauthorized account opening problem will have a material impact on customer behavior. As a result, we do not anticipate the bank’s long-term earnings or value have been damaged, despite the negative headlines. We remained holders of Wells Fargo as of the end of the Fund’s fiscal year. The company’s shares have been trading at a price-to-earnings (“P/E”) discount to its regional bank peers and it offers an attractive dividend yield of 3.5%. We are monitoring developments closely, including the Department of Justice’s investigation of the situation. We may react to any further developments if we have reason to believe the sustainability of Wells Fargo’s franchise will be potentially impacted over the longer term. |
We believe Wells Fargo has been one of the world’s best-run major banks. Company management steered a sensible lending business that remained on a solid financial footing throughout the 2008-2009 banking crisis. It has a very strong core deposit franchise and benefits from economies of scale. The bank is expected to earn a return on tangible equity of about 14% this year, which is among the highest in the industry.
| ¢ | Cognizant Technology Solutions (U.S.) — Cognizant is an information technology company that provides solutions for software development and maintenance. The company guided for weaker 2016 revenue growth, which weighed on its share price. |
The preceding information is the opinion of portfolio management. Any such opinions are subject to change at any time based upon market or other conditions and should not be relied upon as investment advice. Past performance is no guarantee of future results, and there is no guarantee that market forecasts will be realized.
There is no guarantee that the Fund will meet its objective.
| Asset Allocation | ||||
The following table presents asset allocations within certain sectors and as a percentage of total investments as of September 30, 2016.
|
| |||
Consumer Staples | 30 | % | ||
Information Technology | 23 | |||
Financials | 17 | |||
Consumer Discretionary | 16 | |||
Health Care | 12 | |||
Materials | 2 | |||
|
| |||
Total | 100 | % | ||
|
| |||
Equity Securities: The market price of equity securities may be adversely affected by financial market, industry, or issuer-specific events. Focus on a particular style or on small or medium-sized companies may enhance that risk.
Foreign & Emerging Markets: Investing internationally, especially in emerging markets, involves additional risks such as currency, political, accounting, economic, and market risk.
Industry/Sector Concentration: A fund that focuses its investments in a particular industry or sector will be more sensitive to conditions that affect that industry or sector than a non-concentrated fund.
Geographic Concentration: A fund that focuses its investments in a particular geographic location will be highly sensitive to financial, economic, political, and other developments affecting the fiscal stability of that location.
Prospectus: For additional information on risks, please see the Fund’s prospectus.
For information regarding the indexes and certain investment terms, see the Key Investment Terms starting on page 4.
19
Table of Contents
Global Opportunities Fund (Continued)
| Average Annual Total Returns1 for periods ended 9/30/16 | ||||||||||||||||||||
| 1 year | 5 years | 10 years | Since Inception | Inception Date | ||||||||||||||||
| Class A Shares at NAV2 | 11.38 | % | 12.06 | % | 4.53 | % | — | — | ||||||||||||
| Class A Shares at POP3,4 | 4.98 | 10.74 | 3.91 | — | — | |||||||||||||||
| Class B Shares at NAV2 | 10.60 | 11.24 | 3.77 | — | — | |||||||||||||||
| Class B Shares with CDSC4 | 6.60 | 11.24 | 3.77 | — | — | |||||||||||||||
| Class C Shares at NAV2 and with CDSC4 | 10.57 | 11.25 | 3.75 | — | — | |||||||||||||||
| Class I Shares at NAV | 11.65 | — | — | 10.23 | % | 8/8/12 | ||||||||||||||
| S&P 500® Index | 15.43 | 16.37 | 7.24 | 13.49 | 5 | — | ||||||||||||||
| MSCI AC World Index (net) | 11.96 | 10.63 | 4.34 | 8.71 | 5 | — | ||||||||||||||
Fund Expense Ratios6: A Shares: 1.45%; B Shares: 2.20%; C Shares: 2.20%; I Shares: 1.20%.
All returns represent past performance which is no guarantee of future results. Current performance may be higher or lower than the performance shown. The investment return and principal value of an investment will fluctuate so that an investor’s shares, when redeemed, may be worth more or less than their original cost. The above table and graph below do not reflect the deduction of taxes that a shareholder would pay on fund distributions or the redemption of shares. Please visit Virtus.com for performance data current to the most recent month-end.
| 1 | Total returns are historical and include changes in share price and the reinvestment of both dividends and capital gains distributions. |
| 2 | “NAV” (Net Asset Value) total returns do not include the effect of any sales charge. |
| 3 | “POP” (Public Offering Price) total returns include the effect of the maximum front-end 5.75% sales charge. |
| 4 | “CDSC” (Contingent Deferred Sales Charge) is applied to redemptions of certain classes of shares that do not have a sales charge applied at the time of purchase. CDSC charges for B shares decline from 5% to 0% over a five year period. CDSC charges for certain redemptions of Class A shares made within 18 months of purchase in which a finder’s fee was paid and all redemptions of Class C shares within the first year are 1% and 0% thereafter. |
| 5 | The since inception index returns are from Class I inception date (8/8/12). |
| 6 | The expense ratios of the Fund are set forth according to the prospectus for the Fund effective January 28, 2016, as supplemented and revised, and may differ from the expense ratios disclosed in the Financial Highlights tables in this report. See the Financial Highlights for more current expense ratios. |
Growth of $10,000 For periods ended 9/30
This chart assumes an initial investment of $10,000 made on September 30, 2006, for Class A, Class B, and Class C shares including any applicable sales charges or fees. Performance assumes reinvestment of dividends and capital gain distributions.
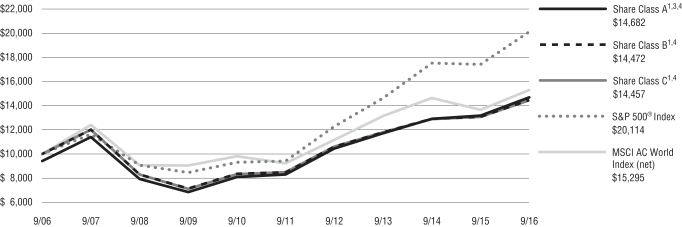
The indexes are unmanaged and not available for direct investment; therefore, their performance does not reflect the expenses associated with active management of an actual portfolio.
For information regarding the indexes and certain investment terms, see the Key Investment Terms starting on page 4.
20
Table of Contents
Global Real Estate Securities Fund
Fund Summary | Ticker Symbols: Class A: VGSAX Class C: VGSCX Class I: VGISX |
Portfolio Manager Commentary by Duff & Phelps Investment Management Co.
| ¢ | The Fund is diversified and has a primary investment objective of long-term capital appreciation, with a secondary investment objective of income. |
| ¢ | For the fiscal year ended September 30, 2016, the Fund’s Class A shares at NAV returned 13.75%, Class C shares returned 12.89%, and Class I shares returned 14.06%. For the same period, the S&P 500® Index, a broad-based equity index, returned 15.43%, and the FTSE EPRA/NAREIT Developed Rental Index (net), the Fund’s style specific benchmark appropriate for comparison, returned 16.48%. |
All performance figures assume reinvestment of distributions and exclude the effect of sales charges. Past performance is no guarantee of future results, and current performance may be higher or lower than the performance shown above.
How did the markets perform during the Fund’s fiscal year?
The performance of global real estate equities outperformed global equities as demonstrated by the 16.5% increase in the FTSE EPRA/NAREIT Developed Rental Index (net) versus the 11.4% increase in the MSCI World Index, both expressed in U.S. dollar terms. Global real estate equities also outperformed U.S. equities during the period, but by a smaller margin, as represented by the 15.4% increase in the S&P 500® Index during the fiscal year.
In many ways the macro environment during the Fund’s fiscal year came full circle. While global central banks remained rather dovish over the course of the fiscal year, at the outset in December 2015, the U.S. Federal Reserve (“the Fed”) announced an increase in the target range for the federal funds rate to 0.25% to 0.50% after seven years in the 0% to 0.25% range. While admittedly this was a small move, it was the first time the Fed increased rates in over nine years. At that time the Fed also appeared to be signaling that several more rate increases would be coming in the next year.
The likelihood of further rate increases quickly faded as policy uncertainty out of China and concerns
regarding global economic growth sent global equity markets into a tailspin in early 2016. Also of note during the first quarter of 2016 were further monetary policy actions by the Bank of Japan (“BOJ”) and European Central Bank (“ECB”) seeking to stimulate economic growth and inflation. The BOJ embraced for the first time a negative interest rate policy and the ECB extended its negative interest rate policy.
During the second quarter of 2016, voters in the U.K. delivered a shocking result on June 23 to leave the European Union. Despite polls indicating that the result would be close, very few observers actually believed that the “Brexit” camp would carry the day. Volatility in the global equity and currency markets spiked dramatically following the vote, with the British pound falling 11.1% in the first two days. The U.K. political situation also became more uncertain as Prime Minister Cameron announced his resignation, and Theresa May was appointed as his successor on July 11. It became apparent that Article 50, a two-year negotiating process for the U.K. to leave the E.U., would not be engaged anytime soon. As of the Fund’s fiscal year end, the ultimate implications of Brexit on the U.K. and the broader European Union remain very uncertain and it was expected to take months, if not years, to gain greater clarity. In the meantime, U.K. risk premiums increased and the British pound experienced increased pressure.
As the Fund’s fiscal year came to a close, the Fed appeared once again to be contemplating an increase in the federal funds rate after not raising it since December 2015. Based on the rhetoric leading up to their respective September policy meetings and the meetings themselves, major global central banks seemed to be questioning to varying degrees the efficacy of current monetary policy to achieve their medium-term inflation goals. More than ever, central bankers appeared to be indicating that it will be difficult to achieve their inflation goals without an assist from fiscal policy and structural economic reforms.
Taking a closer look at the performance of individual countries represented within the benchmark FTSE EPRA/NAREIT Developed Rental Index, the five top performers during the fiscal year on a total return basis measured in U.S. dollars were New Zealand, Hong Kong, Norway, Japan, and Singapore. Sweden,
Australia, Belgium, Germany, Finland, Switzerland, Canada, the U.S., and France also outperformed the overall benchmark during the period, demonstrating the breadth of country outperformance.
The five bottom-performing countries in the benchmark during the fiscal year were the U.K., Italy, Spain, Ireland, and Austria. However, the U.K. and Italy were the only countries to deliver a negative total return for the period. Heading into the evening results of the U.K.’s Brexit vote on June 23, both countries had already produced negative fiscal year-to-date total returns. These negative returns widened over the balance of the fiscal year, particularly for the U.K. following the surprise outcome to leave the European Union.
During the Fund’s fiscal year, while the movement of the U.S. dollar was relatively benign and depreciated only slightly, as measured by the basket of currencies in the U.S. Dollar Spot Index, the barbell of performance across the globe was notable. The yen significantly appreciated, along with the Australian dollar, Norwegian krone, and Singapore dollar. On the other hand, as a result of the Brexit vote outcome and noise from the U.S. elections, the British pound and Mexican peso experienced double-digit declines in value versus the U.S. dollar.
Thematically, real estate companies remained active on the capital raising front, particularly in the U.S., Europe ex the U.K., and Japan as they looked to fund redevelopment, development, and acquisitions of recently acquired companies or portfolios of assets. In addition, it was a common occurrence for companies to lock in long-term, inexpensive fixed rate debt. Portfolio pruning and asset recycling were additional sources of capital and more evident in the U.S. than in other markets, as is often the case. We also witnessed ongoing mergers and acquisition activity. Our global travels during the period brought us to numerous countries and cities in the U.S., Europe, and Asia Pacific regions and were helpful in providing timely updates on the space and asset markets in each locale. Additionally, quality time was spent visiting existing REIT holdings in the Fund and conducting due diligence on potential new investment opportunities. At a high level, the strong appetite for high-quality commercial real estate from a wide and deep pool of institutional capital sources was evident across most locations as reflected in recent asset market pricing trends.
For information regarding the indexes and certain investment terms, see the Key Investment Terms starting on page 4.
21
Table of Contents
| Global Real Estate Securities Fund (Continued) |
Within the real estate space market, trends were more varied, but notably robust for global industrial and data center real estate, German residential, and Stockholm office space. Paris, Oslo, Madrid, and Sydney office space showed signs of a pick up as well. The Hong Kong retail space continued to experience softer demand at the higher end, as mainland China shoppers looked elsewhere, while local based retail non-discretionary shopping remained more resilient. The real estate market in Tokyo remained very vibrant with numerous large-scale urban redevelopment projects underway across many of the key wards of the city, like Shibuya, the Nihonbashi district in the Chuo ward, and Shinagawa. Nonetheless, the overall real estate space markets, with the exception of modern warehouse sectors, remained fairly tepid given a more challenging macro-economic landscape.
From our time spent in London, it was difficult to detect negative ramifications from the fallout of the Brexit vote. On the contrary, the anecdotal observations were positive as it related to tourist activity and retail spending, both of which have benefited from the dramatic fall in the British pound since the June vote. However, based on the limited amount of commercial real estate transaction activity since the vote, we know there has been a small negative impact to real estate values, particularly city-oriented offices, and that rental levels have softened a bit. While we have yet to witness a Brexit-related benefit to other cities, it could be an incremental future demand driver for the likes of Paris, Frankfurt, Dublin, and New York should possible relocations from London occur. For the time being, decision making, as it relates to London office space, has slowed. On the whole, new office development would be needed in any of the European cities mentioned to accommodate a significant move, were it to occur, from London.
After the market closed on August 31, real estate became the eleventh sector of the Global Industry Classification Standard (“GICS”) — the first sector added since the classification system was created in 1999. Importantly, we believe this decision reflects the views of industry participants that real estate is a separate asset class with distinct investment characteristics, particularly relative to other financial companies.
What factors affected the Fund’s performance during its fiscal year?
For the one-year period ended September 30, 2016, the Fund demonstrated solid performance yet lagged its style-specific benchmark. Security selection and country allocation both detracted from Fund performance.
On the whole, global central banks remained dovish throughout the fiscal year and global bonds rallied. In particular, while early in the Fund’s fiscal year, the Fed was predicting three to four staggered increases in the federal funds rate over the course of 2016, but did not raise rates further after December 2015. As a result, any portfolio management steps taken to position for such moves, while one could suggest were prudent, were, in fact, premature. For example, in the U.S., the best performing property sector was freestanding retail, a property sector with the longest lease durations, and the most bond-like in the benchmark.
Combining country allocation and security selection, the top positive contributors to the Fund’s relative performance were Germany, which benefited from an overweight allocation and selection of a Berlin-based apartment owner/operator; Norway, as a result of our overweight allocation to two outperforming office-focused owner/operator properties; and the Netherlands. From a country allocation perspective, the most significant positive contributors to relative performance were overweight allocations to Germany and Norway, as well as an underweight allocation to the Netherlands. At the security level, the most significant positive contributors were the Fund’s overweight positions in a mid-cap U.S. industrial REIT with a national portfolio; a mid-cap U.K. self-storage REIT with exposure to the U.K. and Paris; and a mid-cap U.S. office REIT with a focus in the southeast.
Combining country allocation and security selection, the top detractors to relative performance during the fiscal year were the U.S., where bond-like freestanding retail was the best performing sector; Japan which saw the yen appreciate materially; and Singapore, where a global logistics REIT with a significant mainland China portfolio lagged. From a country allocation perspective, the most significant detractors from relative performance were modest overweight allocations to the U.K. and underweight
exposures to Japan and Australia. At the security level, the most significant detractors were our overweight positions to two mid-cap U.S. lodging REITs and a U.S. apartment REIT with a West Coast focus.
The preceding information is the opinion of portfolio management. Any such opinions are subject to change at any time based upon market or other conditions and should not be relied upon as investment advice. Past performance is no guarantee of future results, and there is no guarantee that market forecasts will be realized.
There is no guarantee that the Fund will meet its objectives.
| Asset Allocation | ||||
The following table presents asset allocations within certain sectors and as a percentage of total investments as of September 30, 2016.
|
| |||
Retail REITs | 23 | % | ||
Office REITs | 17 | |||
Real Estate Operating Companies | 14 | |||
Diversified REITs | 14 | |||
Residential REITs | 11 | |||
Specialized REITs | 11 | |||
Health Care REITs | 4 | |||
Other (includes short-term investments) | 6 | |||
|
| |||
Total | 100 | % | ||
|
| |||
Equity Securities: The market price of equity securities may be adversely affected by financial market, industry, or issuer-specific events. Focus on a particular style or on small or medium-sized companies may enhance that risk.
Industry/Sector Concentration: A fund that focuses its investments in a particular industry or sector will be more sensitive to conditions that affect that industry or sector than a non-concentrated fund.
Real Estate: The Fund may be negatively affected by factors specific to the real estate market, including interest rates, leverage, property, and management.
Foreign & Emerging Markets: Investing internationally, especially in emerging markets, involves additional risks such as currency, political, accounting, economic, and market risk.
Prospectus: For additional information on risks, please see the Fund’s prospectus.
For information regarding the indexes and certain investment terms, see the Key Investment Terms starting on page 4.
22
Table of Contents
Global Real Estate Securities Fund (Continued)
| Average Annual Total Returns1 for periods ended 9/30/16 | ||||||||||||||||
| 1 year | 5 years | Since Inception | Inception Date | |||||||||||||
| Class A Shares at NAV2 | 13.75 | % | 13.24 | % | 20.33 | % | 3/2/09 | |||||||||
| Class A Shares at POP3,4 | 7.21 | 11.91 | 19.39 | 3/2/09 | ||||||||||||
| Class C Shares at NAV2 and with CDSC4 | 12.89 | 12.38 | 19.44 | 3/2/09 | ||||||||||||
| Class I Shares at NAV | 14.06 | 13.52 | 20.65 | 3/2/09 | ||||||||||||
| S&P 500® Index | 15.43 | 16.37 | 18.55 | 5 | — | |||||||||||
| FTSE EPRA/NAREIT Developed Rental Index (net) | 16.48 | 12.96 | 20.45 | 5 | — | |||||||||||
Fund Expense Ratios6: A Shares: Gross 1.50%, Net 1.40%; C Shares: Gross 2.25%, Net 2.15%; I Shares: Gross 1.25%, Net 1.15%.
All returns represent past performance which is no guarantee of future results. Current performance may be higher or lower than the performance shown. The investment return and principal value of an investment will fluctuate so that an investor’s shares, when redeemed, may be worth more or less than their original cost. The above table and graph below do not reflect the deduction of taxes that a shareholder would pay on fund distributions or the redemption of shares. Please visit Virtus.com for performance data current to the most recent month-end.
| 1 | Total returns are historical and include changes in share price and the reinvestment of both dividends and capital gains distributions. |
| 2 | “NAV” (Net Asset Value) total returns do not include the effect of any sales charge. |
| 3 | “POP” (Public Offering Price) total returns include the effect of the maximum front-end 5.75% sales charge. |
| 4 | “CDSC” (Contingent Deferred Sales Charge) is applied to redemptions of certain classes of shares that do not have a sales charge applied at the time of purchase. CDSC charges for certain redemptions of Class A shares made within 18 months of purchase in which a finder’s fee was paid and all redemptions of Class C shares within the first year are 1% and 0% thereafter. |
| 5 | The since inception index returns are from the Fund’s inception date. |
| 6 | The expense ratios of the Fund are set forth according to the prospectus for the Fund effective January 28, 2016, as supplemented and revised, and may differ from the expense ratios disclosed in the Financial Highlights tables in this report. See the Financial Highlights for more current expense ratios. Net Expense: Expenses reduced by the contractual fee waiver in effect through January 31, 2017. Gross Expense: Does not reflect the effect of the fee waiver. |
Growth of $10,000 For periods ended 9/30
This chart assumes an initial investment of $10,000 made on March 2, 2009 (inception date of the Fund), for Class A, Class C, and Class I shares including any applicable sales charges or fees. Performance assumes reinvestment of dividends and capital gain distributions.
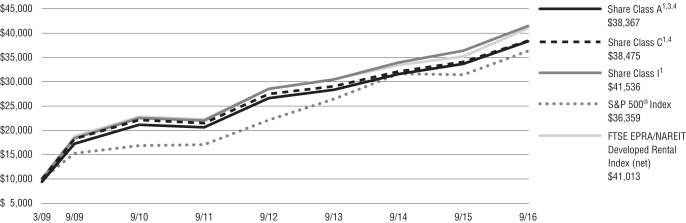
The indexes are unmanaged and not available for direct investment; therefore, their performance does not reflect the expenses associated with active management of an actual portfolio.
For information regarding the indexes and certain investment terms, see the Key Investment Terms starting on page 4.
23
Table of Contents
Greater European Opportunities Fund
Fund Summary | Ticker Symbols: Class A: VGEAX Class C: VGECX Class I: VGEIX |
Portfolio Manager Commentary by Vontobel Asset Management, Inc.
| ¢ | The Fund is diversified and has an investment objective of long-term capital appreciation. |
| ¢ | For the fiscal year ended September 30, 2016, the Fund’s Class A shares at NAV returned 4.99%, Class C shares returned 4.21%, and Class I shares returned 5.22%. For the same period, the MSCI Europe Index (net), which serves as the Fund’s broad-based and style-specific benchmark appropriate for comparison, returned 2.49%. |
All performance figures assume reinvestment of distributions and exclude the effect of sales charges. Past performance is no guarantee of future results, and current performance may be higher or lower than the performance shown above.
How did the markets perform during the Fund’s fiscal year?
During the fiscal year ended September 30, 2016, the MSCI Europe Index, in U.S. dollar terms, was positive in the first quarter, negative in the second and third quarters, and positive in the fourth quarter.
In the fourth quarter of 2015, the European Central Bank (“ECB”) announced stimulus and cut its deposit rate by 0.10% to -0.3%, which was on the lower end of expectations and disappointed markets. European economic data was generally encouraging over the period. In the first quarter of 2016, the ECB announced a stimulus package that lowered its main policy rates and expanded its asset purchase program. While the package exceeded investors’ expectations, ECB President Mario Draghi hinted that future rate hikes were unlikely to be forthcoming, which drove European stocks down. Economic data signaled that the eurozone economy is continuing to grow, albeit slowly. In the second quarter of 2016, European equity markets gained momentum with a weaker euro, encouraging macroeconomic data, and hopes for a new debt deal with Greece, although investors remained uncertain about the outcome of the U.K.’s referendum on European Union (EU) membership. Following the U.K.’s unexpected decision in late June to exit the European Union (“Brexit”), European markets were bolstered by a rapid recovery from the initial sell-off and a generally optimistic second quarter reporting season.
What factors affected the Fund’s performance during its fiscal year?
The following discussion highlights specific stocks that provided the largest contributions to the Fund’s absolute performance and those that were the largest detractors during the fiscal year. As bottom-up stock pickers, we hope that investors find this useful and gain a greater understanding of how we invest their capital.
Stocks that Helped Absolute Performance
| ¢ | Philip Morris International (“PMI”) (U.S.) — Investors were drawn to the company which continues to perform well. PMI produces and sells cigarettes under brands such as Marlboro and L&M. In our opinion, as of the end of the Fund’s fiscal year, the company still had strong pricing power, leading brands, consistent constant currency earnings growth, opportunities for cost savings, and a large dividend. The company is also behind next generation products such as its heat-not-burn device, iQos. |
| ¢ | British American Tobacco (“BAT”) (U.K.) — With its stability and consistency of earnings, BAT was a top contributor to the Fund’s performance. While based in the U.K., its earnings come from outside of it. Currency, after years of being a headwind, turned into a tailwind due to favorable currency translation as BAT reports its earnings in British pounds. The company also reported solid numbers for the first quarter of 2016, again, highlighting its strong business model even in volatile markets. BAT is one of the world’s largest tobacco companies with market leadership in more than 50 of the 180 markets in which it operates. Nearly 60% of the company’s revenue and over 70% of volumes are typically generated from emerging markets. It has great global brands including Dunhill, Kent, Lucky Strike, Pall Mall, and Rothmans. As of the end of the Fund’s fiscal year, we continued to believe that the company should be able to deliver consistent high single-digit earnings growth in constant currencies as it has strong pricing power, and opportunities to increase margins through cost saving measures, while paying a very hefty dividend. |
Stocks that Hurt Absolute Performance
| ¢ | Barratt Developments (U.K.) — One of the largest property development companies in the U.K., the company’s stock price came under pressure following the Brexit vote. We sold out of the position due to the uncertainty created by the Brexit situation. |
| ¢ | Lloyds Banking Group (U.K.) — Following the Brexit referendum, Lloyds’ stock sold off in the last few days of June, as the resulting uncertainty raised the chances that the U.K. will slide into a recession. As of the end of the Fund’s fiscal year, we continued to like Lloyds’ competitive position in the concentrated U.K. banking market. As the largest U.K. retail bank, Lloyds enjoys substantial economies of scale, with operations comprised of simple retail and commercial businesses. However, we expect the macroeconomic environment to be challenging, as both consumer and business confidence will suffer from the uncertainty surrounding the U.K.’s relationship with the European Union. |
The preceding information is the opinion of portfolio management. Any such opinions are subject to change at any time based upon market or other conditions and should not be relied upon as investment advice. Past performance is no guarantee of future results, and there is no guarantee that market forecasts will be realized.
There is no guarantee that the Fund will meet its objective.
| Asset Allocation | ||||
The following table presents asset allocations within certain sectors and as a percentage of total investments as of September 30, 2016.
|
| |||
Consumer Staples | 42 | % | ||
Health Care | 16 | |||
Consumer Discretionary | 12 | |||
Information Technology | 10 | |||
Industrials | 9 | |||
Financials | 5 | |||
Materials | 4 | |||
Other (includes short-term investments) | 2 | |||
|
| |||
Total | 100 | % | ||
|
| |||
For information regarding the indexes and certain investment terms, see the Key Investment Terms starting on page 4.
24
Table of Contents
| Greater European Opportunities Fund (Continued) |
Equity Securities: The market price of equity securities may be adversely affected by financial market, industry, or issuer-specific events. Focus on a particular style or on small or medium-sized companies may enhance that risk.
Industry/Sector Concentration: A fund that focuses its investments in a particular industry or sector will be more sensitive to conditions that affect that industry or sector than a non-concentrated fund.
Foreign Investing: Investing internationally involves additional risks such as currency, political, accounting, economic, and market risk.
Geographic Concentration: A fund that focuses its investments in a particular geographic location will be highly sensitive to financial, economic, political, and other developments affecting the fiscal stability of that location.
Prospectus: For additional information on risks, please see the Fund’s prospectus.
For information regarding the indexes and certain investment terms, see the Key Investment Terms starting on page 4.
25
Table of Contents
Greater European Opportunities Fund (Continued)
| Average Annual Total Returns1 for periods ended 9/30/16 | ||||||||||||||||
| 1 year | 5 years | Since Inception | Inception Date | |||||||||||||
| Class A Shares at NAV2 | 4.99 | % | 9.12 | % | 10.78 | % | 4/21/09 | |||||||||
| Class A Shares at POP3,4 | -1.04 | 7.83 | 9.90 | 4/21/09 | ||||||||||||
| Class C Shares at NAV2 and with CDSC4 | 4.21 | 8.31 | 9.96 | 4/21/09 | ||||||||||||
| Class I Shares at NAV | 5.22 | 9.37 | 11.05 | 4/21/09 | ||||||||||||
| MSCI Europe Index (net)* | 2.49 | 7.46 | 8.98 | 5 | — | |||||||||||
| S&P 500® Index* | 15.43 | 16.37 | 15.83 | 5 | — | |||||||||||
Fund Expense Ratios6: A Shares: Gross 1.89%, Net 1.45%; C Shares: Gross 2.64%, Net 2.20%; I Shares: Gross 1.64%, Net 1.20%.
All returns represent past performance which is no guarantee of future results. Current performance may be higher or lower than the performance shown. The investment return and principal value of an investment will fluctuate so that an investor’s shares, when redeemed, may be worth more or less than their original cost. The above table and graph below do not reflect the deduction of taxes that a shareholder would pay on fund distributions or the redemption of shares. Please visit Virtus.com for performance data current to the most recent month-end.
| 1 | Total returns are historical and include changes in share price and the reinvestment of both dividends and capital gains distributions. |
| 2 | “NAV” (Net Asset Value) total returns do not include the effect of any sales charge. |
| 3 | “POP” (Public Offering Price) total returns include the effect of the maximum front-end 5.75% sales charge. |
| 4 | “CDSC” (Contingent Deferred Sales Charge) is applied to redemptions of certain classes of shares that do not have a sales charge applied at the time of purchase. CDSC charges for certain redemptions of Class A shares made within 18 months of purchase in which a finder’s fee was paid and all redemptions of Class C shares within the first year are 1% and 0% thereafter. |
| 5 | The since inception index returns are from the Fund’s inception date. |
| 6 | The expense ratios of the Fund are set forth according to the prospectus for the Fund effective January 28, 2016, as supplemented and revised, and may differ from the expense ratios disclosed in the Financial Highlights tables in this report. See the Financial Highlights for more current expense ratios. Net Expense: Expenses reduced by the contractual fee waiver in effect thru January 31, 2017. Gross Expense: Does not reflect the effect of the fee waiver. |
| * | The MSCI Europe Index (net) is an appropriate Broad Based Index. The Fund is no longer using the S&P 500® Index. |
Growth of $10,000 For periods ended 9/30
This chart assumes an initial investment of $10,000 made on April 21, 2009 (inception date of the Fund), for Class A, Class C, and Class I shares including any applicable sales charges or fees. Performance assumes reinvestment of dividends and capital gain distributions.
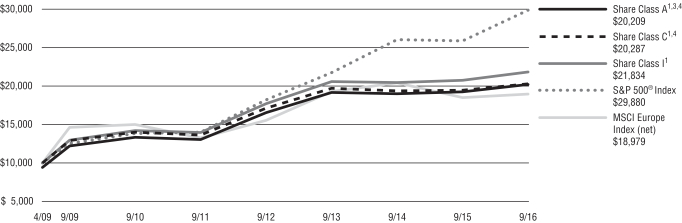
The indexes are unmanaged and not available for direct investment; therefore, their performance does not reflect the expenses associated with active management of an actual portfolio.
For information regarding the indexes and certain investment terms, see the Key Investment Terms starting on page 4.
26
Table of Contents
Fund Summary | Ticker Symbols: Class A: VIEAX Class C: VIECX Class I: VIIEX |
Portfolio Manager Commentary by Duff & Phelps Investment Management Co.
| ⬛ | The Fund is diversified and has an investment objective of long-term capital appreciation. |
| ⬛ | For the fiscal year ended September 30, 2016, the Fund’s Class A shares at NAV returned 4.64%, Class C shares returned 3.85%, and Class I shares returned 4.89%. For the same period, the MSCI EAFE® Index (net), which serves as the Fund’s broad-based and style-specific benchmark appropriate for comparison, returned 6.52%. |
All performance figures assume reinvestment of distributions and exclude the effect of sales charges. Past performance is no guarantee of future results, and current performance may be higher or lower than the performance shown above.
How did the markets perform during the Fund’s fiscal year?
Developed international stock markets, as represented by the MSCI EAFE® Index (net), increased 6.5% during the Fund’s fiscal year. It was a volatile period, with market appreciation in the fall of 2015 giving way to year-end concerns over the appreciating U.S. dollar. Then, in early 2016, China’s economic outlook and its rapidly falling foreign currency reserves became a big issue for the market, which led the Index to a 15.4% decline by February 12. The Chinese government intervened in the foreign currency market after the Chinese New Year, forcing the yuan to appreciate in the middle of February; by March 31, it had appreciated 2% in six weeks. The Chinese government’s intervention stabilized global equity markets, leading the Index to appreciate 16% from early spring through the fall of 2016, interrupted only by volatile trading around the U.K.’s vote in late June on whether to stay or leave (“Brexit”) the European Union.
On a country basis, New Zealand was the top performing non-U.S. developed stock market within the MSCI EAFE® Index, up 56% in U.S. dollars, followed by Hong Kong and Australia, both up about 19%. Italy declined by 21% and Israel dropped 8%. On a sector basis, the top performer was materials, up 21%, followed by technology which rose 17%. At the other end of the spectrum, financials were down 8%, while healthcare only gained 0.6%.
What factors affected the Fund’s performance during its fiscal year?
For the fiscal year ended September 30, 2016, the Fund generated positive returns, though it underperformed its primary benchmark. Country allocation detracted from performance, though strong stock selection and prudent sector allocation made positive contributions.
In terms of country allocation, Japan, Norway, and China added value to the Fund, while Canada, Israel, and Hong Kong detracted from performance. The Fund outperformed in Japan with telecoms KDDI and NTT beneficiaries of the big data trend, Sony, and motor manufacturer Nidec all adding about one percentage point each to the cumulative return. Being dramatically overweight Norway, plus strong performance from Marine Harvest and Statoil contributed to performance. China is not part of the MSCI EAFE® Index, yet the Fund’s two Chinese investments combined for a 34% return. Valeant hobbled Canadian returns, Teva diminished Israeli results, and Li & Fung soured gains in Hong Kong.
The sectors that contributed the most to the Fund’s relative performance were telecommunications, technology, and consumer discretionary. Strong stock selection in each of these sectors, along with overweights versus the Index, also contributed to performance. The sectors that detracted from performance were health care, real estate (a new sector, as of September), and industrials. Stock selection was the main culprit, while allocation effects were also not helpful. Carrying a little more cash than normal cost the Fund about one percent in performance versus the Index.
Telecommunications companies benefited as the conduit for all the big data mentioned above. With the movement from 3G to 4G to 5G, consumers, businesses, and governments have consumed more and more data on the go. The true beauty of it is that capital expenditures for the telecommunications companies are relatively low, as such expenditures are mostly for software. Customers demonstrated a willingness and ability to pay up to be tied to the network on the go. KDDI and NTT were beneficiaries of this trend.
Select consumer discretionary companies including Sony, WPP, and Ctrip have had a dominating presence in their respective markets. The quality of their products and services led customers to them as “must have” providers of brands and benefits. All contributed positively to the Fund’s performance.
Health care remained under pressure as highly profitable pharmaceutical companies came under the microscope for cost reduction.
The preceding information is the opinion of portfolio management. Any such opinions are subject to change at any time based upon market or other conditions and should not be relied upon as investment advice. Past performance is no guarantee of future results, and there is no guarantee that market forecasts will be realized.
There is no guarantee that the Fund will meet its objective.
| Asset Allocation | ||||
The following table presents asset allocations within certain sectors and as a percentage of total investments as of September 30, 2016.
|
| |||
Consumer Discretionary | 19 | % | ||
Information Technology | 15 | |||
Consumer Staples | 10 | |||
Health Care | 10 | |||
Telecommunication Services | 9 | |||
Industrials | 9 | |||
Materials | 9 | |||
Other | 19 | |||
|
| |||
Total | 100 | % | ||
|
| |||
Equity Securities: The market price of equity securities may be adversely affected by financial market, industry, or issuer-specific events. Focus on a particular style or on small or medium-sized companies may enhance that risk.
Foreign & Emerging Markets: Investing internationally, especially in emerging markets, involves additional risks such as currency, political, accounting, economic, and market risk.
Derivatives: Investments in derivatives such as futures, options, forwards, and swaps may increase volatility or cause a loss greater than the principal investment.
Geographic Concentration: A fund that focuses its investments in a particular geographic location will be highly sensitive to financial, economic, political, and other developments affecting the fiscal stability of that location.
Prospectus: For additional information on risks, please see the Fund’s prospectus.
For information regarding the indexes and certain investment terms, see the Key Investment Terms starting on page 4.
27
Table of Contents
International Equity Fund (Continued)
| Average Annual Total Returns1 for periods ended 9/30/16 | ||||||||||||||||
| 1 year | 5 years | Since Inception | Inception Date | |||||||||||||
| Class A Shares at NAV2 | 4.64 | % | 6.12 | % | 4.83 | % | 9/16/10 | |||||||||
| Class A Shares at POP3,4 | -1.38 | 4.87 | 3.81 | 9/16/10 | ||||||||||||
| Class C Shares at NAV2 and with CDSC4 | 3.85 | 5.27 | 3.99 | 9/16/10 | ||||||||||||
| Class I Shares at NAV | 4.89 | 6.32 | 5.03 | 9/16/10 | ||||||||||||
| MSCI EAFE® Index (net)* | 6.52 | 7.39 | 4.79 | 5 | — | |||||||||||
| S&P 500® Index* | 15.43 | 16.37 | 13.86 | 5 | — | |||||||||||
Fund Expense Ratios6: A Shares: Gross 2.28%, Net 1.51%; C Shares: Gross 3.03%, Net 2.26%; I Shares: Gross 2.03%, Net 1.26%.
All returns represent past performance which is no guarantee of future results. Current performance may be higher or lower than the performance shown. The investment return and principal value of an investment will fluctuate so that an investor’s shares, when redeemed, may be worth more or less than their original cost. The above table and graph below do not reflect the deduction of taxes that a shareholder would pay on fund distributions or the redemption of shares. Please visit Virtus.com for performance data current to the most recent month-end.
| 1 | Total returns are historical and include changes in share price and the reinvestment of both dividends and capital gains distributions. |
| 2 | “NAV” (Net Asset Value) total returns do not include the effect of any sales charge. |
| 3 | “POP” (Public Offering Price) total returns include the effect of the maximum front-end 5.75% sales charge. |
| 4 | “CDSC” (Contingent Deferred Sales Charge) is applied to redemptions of certain classes of shares that do not have a sales charge applied at the time of purchase. CDSC charges for certain redemptions of Class A shares made within 18 months of purchase in which a finder’s fee was paid and all redemptions of Class C shares within the first year are 1% and 0% thereafter. |
| 5 | The since inception index returns are from the Fund’s inception date. |
| 6 | The expense ratios of the Fund are set forth according to the prospectus for the Fund effective January 28, 2016, as supplemented and revised, and may differ from the expense ratios disclosed in the Financial Highlights tables in this report. See the Financial Highlights for more current expense ratios. Net Expense: Expenses reduced by the contractual fee waiver in effect through January 31, 2017. Gross Expense: Does not reflect the effect of the fee waiver. |
| * | The MSCI EAFE® Index (net) is an appropriate Broad Based Index. The Fund is no longer using the S&P 500® Index. |
Growth of $10,000 For periods ended 9/30
This chart assumes an initial investment of $10,000 made on September 16, 2010 (inception date of the Fund), for Class A, Class C, and Class I shares including any applicable sales charges or fees. Performance assumes reinvestment of dividends and capital gain distributions.
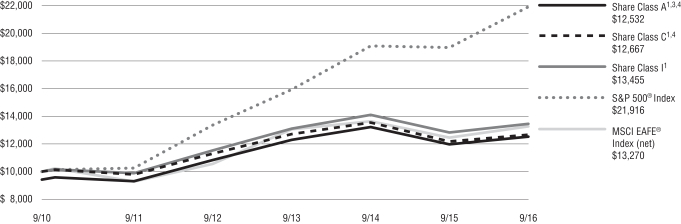
The indexes are unmanaged and not available for direct investment; therefore, their performance does not reflect the expenses associated with active management of an actual portfolio.
For information regarding the indexes and certain investment terms, see the Key Investment Terms starting on page 4.
28
Table of Contents
International Real Estate Securities Fund
Fund Summary | Ticker Symbols: Class A: PXRAX Class C: PXRCX Class I: PXRIX |
Portfolio Manager Commentary by Duff & Phelps Investment Management Co.
| ⬛ | The Fund is diversified and has a primary investment objective of long-term capital appreciation, with a secondary investment objective of income. |
| ⬛ | For the fiscal year ended September 30, 2016, the Fund’s Class A shares at NAV returned 10.47%, Class C shares returned 9.69%, and Class I shares returned 10.72%. For the same period, the S&P 500® Index, a broad-based equity index, returned 15.43%, and the FTSE EPRA/NAREIT Developed Rental ex U.S. Index (net), the Fund’s style-specific benchmark appropriate for comparison, returned 13.34%. |
All performance figures assume reinvestment of distributions and exclude the effect of sales charges. Past performance is no guarantee of future results, and current performance may be higher or lower than the performance shown above.
How did the markets perform during the Fund’s fiscal year?
During the Fund’s fiscal year, international real estate equities outperformed international equities as demonstrated by the 13.3% increase in the FTSE/EPRA NAREIT Developed Rental ex U.S. Index versus the 6.5% increase in the MSCI EAFE® Index, both expressed in U.S. dollar terms. International real estate equities trailed the performance of U.S. equities during the period, as represented by the 15.4% increase in the S&P 500® Index during the fiscal year.
In many ways the macro environment during the Fund’s fiscal year came full circle. While global central banks remained rather dovish over the course of the fiscal year, at the outset in December 2015, the U.S. Federal Reserve (“the Fed”) announced an increase in the target range for the federal funds rate to 0.25% to 0.50% after seven years in the 0% to 0.25% range. While admittedly this was a small move, it was the first time the Fed increased rates in over nine years. At that time the Fed also appeared to be signaling that several more rate increases would be coming in the next year.
The likelihood of further rate increases quickly faded as policy uncertainty out of China and concerns regarding global economic growth sent global equity markets into a tailspin in early 2016. Also of note during the first quarter of 2016 were further
monetary policy actions by the Bank of Japan (“BOJ”) and European Central Bank (“ECB”) seeking to stimulate economic growth and inflation. The BOJ embraced for the first time a negative interest rate policy and the ECB extended its negative interest rate policy.
During the second quarter of 2016, voters in the U.K. delivered a shocking result on June 23 to leave the European Union. Despite polls indicating that the result would be close, very few observers actually believed that the “Brexit” camp would carry the day. Volatility in the global equity and currency markets spiked dramatically following the vote, with the British pound falling 11.1% in the first two days. The U.K. political situation also became more uncertain as Prime Minister Cameron announced his resignation, and Theresa May was appointed as his successor on July 11. It became apparent that Article 50, a two-year negotiating process for the U.K. to leave the EU, would not be engaged anytime soon. As of the Fund’s fiscal year-end, the ultimate implications of Brexit on the U.K. and the broader European Union remained very uncertain and it was expected to take months, if not years, to gain greater clarity. In the meantime, U.K. risk premiums increased and the British pound experienced increased pressure.
As the Fund’s fiscal year came to a close, the Fed appeared once again to be contemplating an increase in the federal funds rate after not raising it since December 2015. Based on the rhetoric leading up to their respective September policy meetings and the meetings themselves, major global central banks seemed to be questioning to varying degrees the efficacy of current monetary policy to achieve their medium-term inflation goals. More than ever, central bankers appeared to be indicating that it will be difficult to achieve their inflation goals without an assist from fiscal policy and structural economic reforms.
Taking a closer look at the performance of individual countries represented within the FTSE/EPRA NAREIT Developed Rental ex US Index, the five top performers during the fiscal year on a total return basis measured in U.S. dollars were New Zealand, Hong Kong, Norway, Japan, and Singapore. Sweden, Australia, Belgium, Germany, Finland, Switzerland, Canada, and France also outperformed the overall benchmark during the period, demonstrating the breadth of country outperformance.
The five bottom-performing countries in the benchmark during the fiscal year were the U.K., Italy,
Spain, Ireland, and Austria. However, the U.K. and Italy were the only countries to deliver a negative total return for the period. Heading into the evening results of the U.K.’s Brexit vote on June 23, both countries had already produced negative fiscal year-to-date total returns. These negative returns widened over the balance of the fiscal year, particularly for the U.K. following the surprise outcome to leave the European Union.
During the Fund’s fiscal year, while the movement of the U.S. dollar was relatively benign and depreciated only slightly as measured by the basket of currencies in the U.S. Dollar Spot Index, the barbell of performance across the globe was notable. The yen significantly appreciated, along with the Australian dollar, Norwegian krone, and Singapore dollar. On the other hand, as a result of the Brexit vote outcome and the noise from the U.S. elections, the British pound and Mexican peso experienced double-digit declines in value versus the U.S. dollar.
Thematically, real estate companies remained active on the capital raising front, particularly in Europe (excluding the U.K.) and Japan as they looked to fund redevelopment, development, and acquisitions of recently acquired companies or portfolios of assets. In addition, it was a common occurrence for companies to lock in long-term, inexpensive fixed rate debt. Portfolio pruning and asset recycling were additional sources of capital and more evident in the U.S. than in other markets, as is often the case. We also witnessed ongoing mergers and acquisition activity. Our global travels during the period brought us to numerous countries and cities in Europe and Asia Pacific regions and were helpful in providing timely updates on the space and asset markets in each locale. Additionally, quality time was spent visiting existing REIT holdings in the Fund and conducting due diligence on potential new investment opportunities. At a high level, the strong appetite for high-quality commercial real estate from a wide and deep pool of institutional capital sources was evident across most locations as reflected in recent asset market pricing trends.
Within the real estate space market, trends were more varied, but notably robust for global industrial and data center real estate, German residential and Stockholm office space. Paris, Oslo, Madrid, and Sydney office space have been showing signs of a pick up as well. The Hong Kong retail space continued to experience softer demand at the higher
For information regarding the indexes and certain investment terms, see the Key Investment Terms starting on page 4.
29
Table of Contents
| International Real Estate Securities Fund (Continued) |
end, as Mainland China shoppers looked elsewhere, while local based retail non-discretionary shopping remained more resilient. The real estate market in Tokyo remained very vibrant with numerous large-scale urban redevelopment projects underway across many of the key wards of the city, like Shibuya, the Nihonbashi district in the Chuo ward, and Shinagawa. Nonetheless, the overall real estate space markets, with the exception of modern warehouse sectors, remain fairly tepid given a more challenging macro-economic landscape.
From our time spent in London, it was difficult to detect negative ramifications from the fallout of the Brexit vote. On the contrary, the anecdotal observations were positive as it related to tourist activity and retail spending, both of which have benefited from the dramatic fall in the British pound since the June vote. However, based on the limited amount of commercial real estate transaction activity since the vote, we know there has been a small negative impact to real estate values, particularly city- oriented offices, and that rental levels have softened a bit. While we have yet to witness a Brexit-related benefit to other cities, it could be an incremental future demand driver for the likes of Paris, Frankfurt, Dublin and New York should possible relocations from London occur. On the whole, new office development would be needed in any of the European cities mentioned to accommodate a significant move, were it to occur, from London. For the time being, decision making, as it relates to London office space, has slowed.
After the market closed on August 31, real estate became the eleventh sector of the Global Industry Classification Standard (“GICS”) — the first sector added since the classification system was created in 1999. Importantly, we believe this decision reflects the views of industry participants that real estate is a separate asset class with distinct investment characteristics, particularly relative to other financial companies.
What factors affected the Fund’s performance during its fiscal year?
For the one-year period ended September 30, 2016, the Fund demonstrated solid performance yet lagged its style-specific benchmark. Security selection made positive contributions to relative performance, while country allocation detracted from relative performance.
Based on both country allocation and security selection, the top positive contributors to performance for the fiscal year were Germany, the U.K., and Norway. From a country allocation perspective, the Fund’s overweight exposures to Norway and Germany were the most positive drivers
of performance. The Norwegian economy and commercial real estate market benefited from the improvement in the price of oil and fiscal stimulus provided by the government. Additionally, the performance of one of the listed Norwegian companies in the portfolio benefited from a creeping takeover of the company by one of the wealthiest individuals in Norway. German apartment real estate companies continued to be well bid over the year as investors remained attracted to the stable growth profiles these companies offer in an overall low yield environment.
At the security level, our overweight exposure to a U.K.-based owner/operator of U.K. and Parisian self-storage properties was the largest positive contributor to performance. The company continued to deliver favorable operating results, which reinforced its multi-year structural growth story. The next most positive security contributor was a small-cap German apartment owner/operator with a focus on Berlin. This company was added to the portfolio late in the third quarter of 2015 after extensive on-the-ground due diligence with the management team.
Based on country allocation and security selection combined, the largest detractors to performance for the fiscal year were Japan, Singapore, and Australia. From a country allocation viewpoint, our overweight exposure to the U.K. was the largest detractor from performance. However the negative allocation impact was eliminated by positive security selection, which produced an overall positive total contribution from the U.K. for the period. The U.K. delivered the worst country performance during the fiscal year driven by the fall-off in U.K. REIT shares and the drop in the British pound following the surprising Brexit vote outcome. Our underweight exposure to Japan was the second largest drag on country allocation performance during the period. Japan delivered one of the better U.S. dollar-based returns during the fiscal year, as Japanese REIT shares benefited from a significant strengthening in the yen relative to the U.S. dollar.
At the security level, our overweight exposure to a Singapore-listed owner/operator of modern logistic warehouse real estate was the largest negative contributor for the fiscal year. Given this company’s significant asset exposure to mainland China and the negative sentiment surrounding future economic growth in China, as well as the performance of the Chinese yuan and pockets of oversupply of industrial space in certain tier two and three cities, the shares underperformed its Singapore-listed peers. The second largest security-level detractor during the
period was our overweight exposure to a Japanese lodging/residential REIT focused on budget-oriented hotels and apartments primarily in the Tokyo area. The company delivered disappointing earnings results during the third quarter of 2016 and materially revised downward its future hotel operating results guidance. At the margin it appears the strength of the Japanese yen has had a negative impact on lodging demand and new supply is impacting hotel pricing.
The preceding information is the opinion of portfolio management. Any such opinions are subject to change at any time based upon market or other conditions and should not be relied upon as investment advice. Past performance is no guarantee of future results, and there is no guarantee that market forecasts will be realized.
There is no guarantee that the Fund will meet its objectives.
| Asset Allocation | ||||
The following table presents asset allocations within certain sectors and as a percentage of total investments as of September 30, 2016.
|
| |||
Real Estate Operating Companies | 35 | % | ||
Retail REITs | 25 | |||
Diversified REITs | 25 | |||
Office REITs | 9 | |||
Specialized REITs | 3 | |||
Industrial REITs | 2 | |||
Residential REITs | 1 | |||
|
| |||
Total | 100 | % | ||
|
| |||
Equity Securities: The market price of equity securities may be adversely affected by financial market, industry, or issuer-specific events. Focus on a particular style or on small or medium-sized companies may enhance that risk.
Industry/Sector Concentration: A fund that focuses its investments in a particular industry or sector will be more sensitive to conditions that affect that industry or sector than a non-concentrated fund.
Real Estate: The Fund may be negatively affected by factors specific to the real estate market, including interest rates, leverage, property, and management.
Foreign Investing: Investing internationally involves additional risks such as currency, political, accounting, economic, and market risk.
Prospectus: For additional information on risks, please see the Fund’s prospectus.
For information regarding the indexes and certain investment terms, see the Key Investment Terms starting on page 4.
30
Table of Contents
International Real Estate Securities Fund (Continued)
| Average Annual Total Returns1 for periods ended 9/30/16 | ||||||||||||||||
| 1 year | 5 years | Since Inception | Inception Date | |||||||||||||
| Class A Shares at NAV2 | 10.47 | % | 11.02 | % | 1.66 | % | 10/1/07 | |||||||||
| Class A Shares at POP3,4 | 4.12 | 9.72 | 0.99 | 10/1/07 | ||||||||||||
| Class C Shares at NAV2 and with CDSC4 | 9.69 | 10.21 | 0.90 | 10/1/07 | ||||||||||||
| Class I Shares at NAV | 10.72 | 11.33 | 1.91 | 10/1/07 | ||||||||||||
| S&P 500® Index | 15.43 | 16.37 | 6.10 | 5 | — | |||||||||||
| FTSE EPRA/NAREIT Developed Rental ex U.S. Index (net) | 13.34 | 10.67 | 0.88 | 5 | — | |||||||||||
Fund Expense Ratios6: A Shares: Gross 1.78%, Net 1.50%; C Shares: Gross 2.53%, Net 2.25%; I Shares: Gross 1.53%, Net 1.25%.
All returns represent past performance which is no guarantee of future results. Current performance may be higher or lower than the performance shown. The investment return and principal value of an investment will fluctuate so that an investor’s shares, when redeemed, may be worth more or less than their original cost. The above table and graph below do not reflect the deduction of taxes that a shareholder would pay on fund distributions or the redemption of shares. Please visit Virtus.com for performance data current to the most recent month-end.
| 1 | Total returns are historical and include changes in share price and the reinvestment of both dividends and capital gains distributions. |
| 2 | “NAV” (Net Asset Value) total returns do not include the effect of any sales charge. |
| 3 | “POP” (Public Offering Price) total returns include the effect of the maximum front-end 5.75% sales charge. |
| 4 | “CDSC” (Contingent Deferred Sales Charge) is applied to redemptions of certain classes of shares that do not have a sales charge applied at the time of purchase. CDSC charges for certain redemptions of Class A shares made within 18 months of purchase in which a finder’s fee was paid and all redemptions of Class C shares within the first year are 1% and 0% thereafter. |
| 5 | The since inception index returns are from the Fund’s inception date. |
| 6 | The expense ratios of the Fund are set forth according to the prospectus for the Fund effective January 28, 2016, as supplemented and revised, and may differ from the expense ratios disclosed in the Financial Highlights tables in this report. See the Financial Highlights for more current expense ratios. Net Expense: Expenses reduced by the contractual fee waiver in effect through January 31, 2017. Gross Expense: Does not reflect the effect of the fee waiver. |
Growth of $10,000 For periods ended 9/30
This chart assumes an initial investment of $10,000 made on October 1, 2007 (inception date of the Fund), for Class A, Class C, and Class I shares including any applicable sales charges or fees. Performance assumes reinvestment of dividends and capital gain distributions.
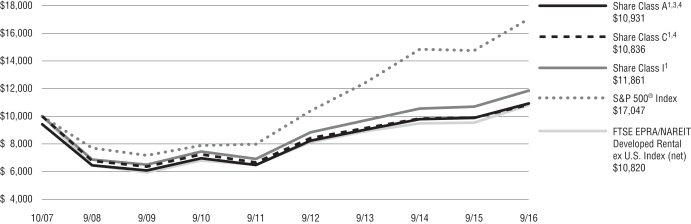
The indexes are unmanaged and not available for direct investment; therefore, their performance does not reflect the expenses associated with active management of an actual portfolio.
For information regarding the indexes and certain investment terms, see the Key Investment Terms starting on page 4.
31
Table of Contents
Fund Summary | Ticker Symbols: Class A: VISAX Class C: VCISX Class I: VIISX Class R6: VRISX |
Portfolio Manager Commentary by Kayne Anderson Rudnick Investment Management, LLC
| ¢ | The Fund is diversified and has an investment objective of capital appreciation. |
| ¢ | For the fiscal year ended September 30, 2016, the Fund’s Class A shares at NAV returned 24.58%, Class C shares returned 23.76%, Class I shares returned 24.94%, and Class R6 shares returned 25.06%. For the same period, the MSCI All Country World ex U.S. Small Cap Index (net), which serves as the Fund’s broad-based and style-specific benchmark appropriate for comparison, returned 13.38%. |
All performance figures assume reinvestment of distributions and exclude the effect of sales charges. Past performance is no guarantee of future results, and current performance may be higher or lower than the performance shown above.
How did the markets perform during the Fund’s fiscal year?
Following the sharp sell-off in the calendar third quarter of 2015 (the Fund’s fiscal fourth quarter), global equity markets rallied in the fourth quarter of 2015. Selling resumed early in the first quarter of 2016 over global growth concerns. As the global economic growth outlook stabilized, and concerns over central bank tightening (primarily by the U.S. Federal Reserve) waned, global equities advanced substantially over the last two quarters.
Following dismal performance over the last few years, materials was the best performing equity sector over the last year as global commodity prices finally showed signs of stabilization. Because of this, countries where natural resources make up a large part of the economy, such as Brazil, Russia, South Africa, and Canada, performed strongly. Europe underperformed due to the U.K. vote to leave the European Union and fears over a potential debt crisis appearing in Greece and Italy yet again.
What factors affected the Fund’s performance during its fiscal year?
The Fund outperformed the benchmark by a significant margin over the year, mainly driven by stock selection. In addition to stock selection, our geographic weighting, which was a significant
headwind to performance in the prior year, provided a tailwind. This was driven by strong stock selection in Latin America and strong stock selection and our underweight position in European stocks which, overall, underperformed.
In terms of individual stocks, the largest positive contributor to performance was Tegma Gestao Logistica, a transportation logistics company in Brazil. Its primary business is transporting new cars from automotive production facilities to dealerships throughout the country. Last year, Tegma was our largest detractor from performance as the Brazilian auto industry, and the country overall, deteriorated from simply bad into a genuine crisis. Over the last 12 months, we saw some signs of stabilization in Brazil on many fronts, including optimism that the automotive industry may resume growth next year. Tegma also took important steps over this time to strengthen its balance sheet and improve its cost structure.
The largest detractor from performance over the last year was Autohome. The company, which is listed in the U.S., is the leading online destination for automobile consumers in China. The shares have been under pressure for two primary reasons. First, management has continued to invest in their new car transaction business at the expense of current margins. Second, there has been significant management and shareholder turnover as the controlling shareholder, Australian-listed Telstra, sold most of their stake to Ping An, a Chinese-listed insurance company, who subsequently replaced senior management. Collectively, this has created uncertainty with investors, which generally leads to lower stock prices. While we are frustrated with some of the actions taking place at the management and ownership level, the core business at Autohome has continued to perform well. We believe that the strength of the core business will ultimately drive the overall profitability of the business and the stock in the long run and, therefore, as of the Fund’s fiscal year end we continued to hold our position.
The preceding information is the opinion of portfolio management. Any such opinions are subject to change at any time based upon market and or other conditions and should not be relied upon as investment advice. Past performance is no guarantee of future results, and there is no guarantee market forecasts will be realized.
There is no guarantee that the Fund will meet its objective.
| Asset Allocation | ||||
The following table presents asset allocations within certain sectors and as a percentage of total investments as of September 30, 2016.
|
| |||
Information Technology | 26 | % | ||
Industrials | 24 | |||
Financials | 13 | |||
Consumer Staples | 10 | |||
Materials | 9 | |||
Health Care | 8 | |||
Consumer Discretionary | 7 | |||
Other (includes securities lending collateral) | 3 | |||
|
| |||
Total | 100 | % | ||
|
| |||
Equity Securities: The market price of equity securities may be adversely affected by financial market, industry, or issuer-specific events. Focus on a particular style or on small or medium-sized companies may enhance that risk.
Foreign & Emerging Markets: Investing internationally, especially in emerging markets, involves additional risks such as currency, political, accounting, economic, and market risk.
Limited Number of Investments: Because the Fund has a limited number of securities, it may be more susceptible to factors adversely affecting its securities than a less concentrated fund.
Industry/Sector Concentration: A fund that focuses its investments in a particular industry or sector will be more sensitive to conditions that affect that industry or sector than a non-concentrated fund.
Prospectus: For additional information on risks, please see the Fund’s prospectus.
For information regarding the indexes and certain investment terms, see the Key Investment Terms starting on page 4.
32
Table of Contents
International Small-Cap Fund (Continued)
| Average Annual Total Returns1 for periods ended 9/30/16 | ||||||||||||
| 1 year | Since Inception | Inception Date | ||||||||||
| Class A Shares at NAV2 | 24.58 | % | 11.31 | % | 9/5/12 | |||||||
| Class A Shares at POP3,4 | 17.42 | 9.70 | 9/5/12 | |||||||||
| Class C Shares at NAV2 and with CDSC4 | 23.76 | 10.50 | 9/5/12 | |||||||||
| Class I Shares at NAV | 24.94 | 11.59 | 9/5/12 | |||||||||
| Class R6 Shares at NAV | 25.06 | 6.22 | 11/12/14 | |||||||||
| MSCI AC World ex U.S. Small Cap Index (net)* | 13.38 | — | 6 | — | ||||||||
| S&P 500® Index* | 15.43 | — | 5 | — | ||||||||
Fund Expense Ratios7: A Shares: Gross 1.75%, Net 1.61%; C Shares: Gross 2.50%, Net 2.36%; I Shares: Gross 1.50%, Net 1.36%; R6 Shares: Gross 1.41%, Net 1.27%.
All returns represent past performance which is no guarantee of future results. Current performance may be higher or lower than the performance shown. The investment return and principal value of an investment will fluctuate so that an investor’s shares, when redeemed, may be worth more or less than their original cost. The above table and graph below do not reflect the deduction of taxes that a shareholder would pay on fund distributions or the redemption of shares. Please visit Virtus.com for performance data current to the most recent month-end.
| 1 | Total returns are historical and include changes in share price and the reinvestment of both dividends and capital gains distributions. |
| 2 | “NAV” (Net Asset Value) total returns do not include the effect of any sales charge. |
| 3 | “POP” (Public Offering Price) total returns include the effect of the maximum front-end 5.75% sales charge. |
| 4 | “CDSC” (Contingent Deferred Sales Charge) is applied to redemptions of certain classes of shares that do not have a sales charge applied at the time of purchase. CDSC charges for certain redemptions of Class A shares made within 18 months of purchase in which a finder’s fee was paid and all redemptions of Class C shares within the first year are 1% and 0% thereafter. |
| 5 | The index returned 5.56% for Class R6 shares and 13.67% for Class A, C, and I shares from the inception date of the respective share class. |
| 6 | The index returned 4.88% for Class R6 shares and 8.71% for Class A, C, and I shares from the inception date of the respective share class. |
| 7 | The expense ratios of the Fund are set forth according to the prospectus for the Fund effective January 28, 2016, as supplemented and revised, and may differ from the expense ratios disclosed in the Financial Highlights tables in this report. See the Financial Highlights for more current expense ratios. Net Expense: Expenses reduced by the contractual fee waiver in effect through January 31, 2017. Gross Expense: Does not reflect the effect of the fee waiver. |
| * | The MSCI AC World ex U.S. Small Cap Index (net) is an appropriate Broad Based Index. The Fund no longer uses the S&P 500® Index. |
Growth of $10,000 For periods ended 9/30
This chart assumes an initial investment of $10,000 made on September 5, 2012 (inception date of the Fund), for Class A, Class C, and Class I shares including any applicable sales charges or fees. Performance assumes reinvestment of dividends and capital gain distributions.
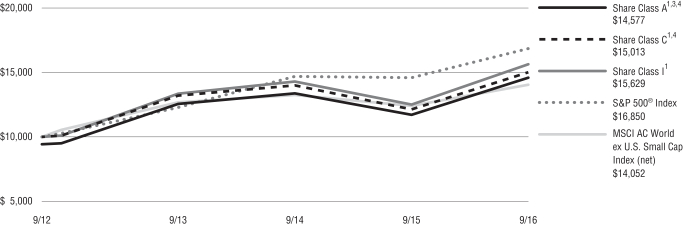
The indexes are unmanaged and not available for direct investment; therefore, their performance does not reflect the expenses associated with active management of an actual portfolio.
For information regarding the indexes and certain investment terms, see the Key Investment Terms starting on page 4.
33
Table of Contents
International Wealth Masters Fund
Fund Summary | Ticker Symbols: Class A: VIWAX Class C: VIWCX Class I: VWIIX |
Portfolio Manager Commentary by Horizon Asset Management, LLC
| ¢ | The Fund is diversified and has an investment objective of capital appreciation. |
| ¢ | For the fiscal year ended September 30, 2016, the Fund’s Class A shares at NAV returned 10.29%, Class C shares returned 9.39%, and Class I shares returned 10.62%. For the same period, the S&P 500® Index, a broad-based equity index, returned 15.43%, and the MSCI EAFE® Index (net), the Fund’s style-specific benchmark appropriate for comparison, returned 6.52%. |
All performance figures assume reinvestment of distributions and exclude the effect of sales charges. Past performance is no guarantee of future results, and current performance may be higher or lower than the performance shown above.
How did the markets perform during the Fund’s fiscal year?
Global markets tumbled at the beginning of 2016, as many of the stocks that had appreciated dramatically in 2015 fell significantly after they reported financial results and provided their outlooks for 2016. Markets rebounded, only to fall again in late June following the unexpected result of the “Brexit” referendum whereby the United Kingdom voted to exit the European Union. U.S. markets recovered swiftly and moved higher, while global markets largely recovered but did not return to the highs reached in late 2015.
What factors affected the Fund’s performance during its fiscal year?
The Fund invests in non-U.S., exchange-listed companies that are owned and operated by some of the wealthiest, most successful investors, business executives, and entrepreneurs in the world (“owner-operators”), and allows investors to leverage the business acumen of these highly-skilled individuals.
The Fund outperformed its benchmark, the MSCI EAFE® Index, during the 12 months ended September 30, 2016. Though assets continued to flow from actively managed funds toward passively managed funds, this trend appears to have been less pronounced in international funds than in U.S. funds. In fact, in the first half of the fiscal year, U.S. mutual
funds focused on developed markets (non-U.S.) and emerging markets experienced net inflows.
At the sector level, financials and materials were the largest contributors to relative returns, while industrials and energy were the largest detractors.
At the stock level, the five largest contributors to relative performance (and their owner-operators) were Glencore plc (Ivan Glasenberg); Fortescue Metals Group Ltd. (Andrew Forrest); Taisho Pharmaceutical Holdings Co., Ltd. (Shoji Uehara); Konami Holdings Corp. (Kagemasa Kozuki); and ArcelorMittal SA (Lakshmi Mittal). The five largest detractors from relative performance (and their owner-operators) were Sports Direct International plc (Michael Ashley); Genel Energy PLC (Nathaniel Rothschild); EasyJet plc (Stelios Haji-Ioannou); TalkTalk Telecom Group PLC (Charles Dunstone); and OCI NV (Nassef Sawiris).
The preceding information is the opinion of portfolio management. Any such opinions are subject to change at any time based upon market or other conditions and should not be relied upon as investment advice. Past performance is no guarantee of future results, and there is no guarantee that market forecasts will be realized.
There is no guarantee the Fund will meet its objective.
| Asset Allocation | ||||
The following table presents asset allocations within certain sectors and as a percentage of total investments as of September 30, 2016.
|
| |||
Consumer Discretionary | 29 | % | ||
Industrials | 13 | |||
Consumer Staples | 13 | |||
Information Technology | 11 | |||
Financials | 9 | |||
Materials | 7 | |||
Real Estate | 5 | |||
Other (includes securities lending collateral) | 13 | |||
|
| |||
Total | 100 | % | ||
|
| |||
Equity Securities: The market price of equity securities may be adversely affected by financial market, industry, or issuer-specific events. Focus on a particular style or on small or medium-sized companies may enhance that risk.
Industry/Sector Concentration: A fund that focuses its investments in a particular industry or sector will be more sensitive to conditions that affect that industry or sector than a non-concentrated fund.
Foreign Investing: Investing internationally involves additional risks such as currency, political, accounting, economic, and market risk.
Prospectus: For additional information on risks, please see the Fund’s prospectus.
For information regarding the indexes and certain investment terms, see the Key Investment Terms starting on page 4.
34
Table of Contents
International Wealth Masters Fund (Continued)
| Average Annual Total Returns1 for periods ended 9/30/16 | ||||||||||||
| 1 year | Since Inception | Inception Date | ||||||||||
| Class A Shares at NAV2 | 10.29 | % | 2.64 | % | 11/17/14 | |||||||
| Class A Shares at POP3,4 | 3.94 | -0.56 | 11/17/14 | |||||||||
| Class C Shares at NAV2 and with CDSC4 | 9.39 | 1.85 | 11/17/14 | |||||||||
| Class I Shares at NAV2 | 10.62 | 2.92 | 11/17/14 | |||||||||
| S&P 500® Index | 15.43 | 5.51 | 5 | — | ||||||||
| MSCI EAFE® Index (net) | 6.52 | -0.37 | 5 | — | ||||||||
Fund Expense Ratios6: A Shares: Gross 3.84%, Net 1.55%; C Shares: Gross 4.59%, Net 2.30%; I Shares: Gross 3.59%, Net 1.30%.
All returns represent past performance which is no guarantee of future results. Current performance may be higher or lower than the performance shown. The investment return and principal value of an investment will fluctuate so that an investor’s shares, when redeemed, may be worth more or less than their original cost. The above table and graph below do not reflect the deduction of taxes that a shareholder would pay on fund distributions or the redemption of shares. Please visit Virtus.com for performance data current to the most recent month-end.
| 1 | Total returns are historical and include changes in share price and the reinvestment of both dividends and capital gains distributions. |
| 2 | “NAV” (Net Asset Value) total returns do not include the effect of any sales charge. |
| 3 | “POP” (Public Offering Price) total returns include the effect of the maximum front-end 5.75% sales charge. |
| 4 | “CDSC” (Contingent Deferred Sales Charge) is applied to redemptions of certain classes of shares that do not have a sales charge applied at the time of purchase. CDSC charges for certain redemptions of Class A shares made within 18 months of purchase in which a finder’s fee was paid and all redemptions of Class C shares within the first year are 1% and 0% thereafter. |
| 5 | The since inception index returns are from the Fund’s inception date. |
| 6 | The expense ratios of the Fund are set forth according to the prospectus for the Fund effective January 28, 2016, as supplemented and revised, and may differ from the expense ratios disclosed in the Financial Highlights tables in this report. See the Financial Highlights for more current expense ratios. Net Expense: Expenses reduced by the contractual fee waiver in effect through January 31, 2017. Gross Expense: Does not reflect the effect of the fee waiver. |
Growth of $10,000 For periods ended 9/30
This chart assumes an initial investment of $10,000 made on November 17, 2014 (inception date of the Fund), for Class A, Class C, and Class I shares including any applicable sales charges or fees. Performance assumes reinvestment of dividends and capital gain distributions.
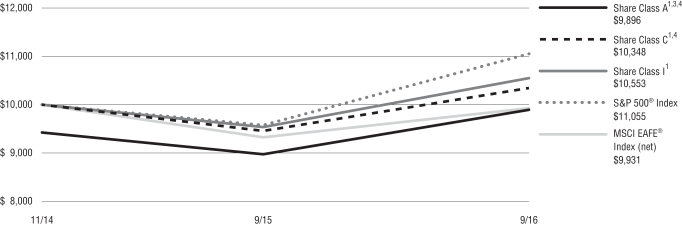
The indexes are unmanaged and not available for direct investment; therefore, their performance does not reflect the expenses associated with active management of an actual portfolio.
For information regarding the indexes and certain investment terms, see the Key Investment Terms starting on page 4.
35
Table of Contents
VIRTUS EMERGING MARKETS DEBT FUND
SCHEDULE OF INVESTMENTS
SEPTEMBER 30, 2016
($ reported in thousands)
| PAR VALUE | VALUE | |||||||
| FOREIGN GOVERNMENT SECURITIES—42.0% | ||||||||
Arab Republic of Egypt 144A | $ | 200 | $ | 190 | ||||
Argentine Republic | ||||||||
144A 9.125%, 3/16/24(3) | 150 | 168 | ||||||
144A 7.500%, 4/22/26(3) | 300 | 339 | ||||||
144A 7.875%, 6/15/27(3) | 150 | 161 | ||||||
Series NY, | 336 | 388 | ||||||
144A 7.125%, | 150 | 159 | ||||||
Bermuda RegS | 200 | 221 | ||||||
Bolivarian Republic of Venezuela | ||||||||
RegS 7.750%, 10/13/19(4) | 140 | 87 | ||||||
RegS 7.650%, 4/21/25(4) | 285 | 138 | ||||||
9.375%, 1/13/34 | 325 | 170 | ||||||
City of Buenos Aires 144A | 250 | 273 | ||||||
Dominican Republic | ||||||||
144A 5.875%, 4/18/24(3) | 100 | 109 | ||||||
144A 6.875%, 1/29/26(3) | 100 | 116 | ||||||
144A 6.850%, 1/27/45(3) | 100 | 112 | ||||||
Federative Republic of Brazil | ||||||||
Treasury Note Series F, | 280 | BRL | 82 | |||||
6.000%, 4/7/26 | 400 | 444 | ||||||
5.625%, 1/7/41 | 300 | 299 | ||||||
Hungary | ||||||||
5.375%, 2/21/23 | 146 | 167 | ||||||
5.375%, 3/25/24 | 180 | 209 | ||||||
Islamic Republic of Pakistan 144A | 200 | 223 | ||||||
Kingdom of Bahrain 144A | 200 | 167 | ||||||
Kingdom of Morocco 144A | 200 | 229 | ||||||
Lebanese Republic | 200 | 197 | ||||||
Mongolia 144A | 200 | 215 | ||||||
Paraguay Government International Bond 144A | 200 | 212 | ||||||
Philippine Government International Bond | 200 | 291 | ||||||
Republic of Argentina | 150 | 107 | ||||||
Republic of Armenia 144A | 200 | 213 | ||||||
Republic of Chile | 70,000 | CLP | 113 | |||||
Republic of Colombia | ||||||||
Treasury Note, Series B, | 100,000 | COP | 38 | |||||
6.125%, 1/18/41 | 100 | 121 | ||||||
Republic of Costa Rica 144A | 200 | 214 | ||||||
Republic of Cote d’Ivoire 144A | 200 | 209 | ||||||
| PAR VALUE | VALUE | |||||||
| FOREIGN GOVERNMENT SECURITIES—continued | ||||||||
Republic of El Salvador | ||||||||
144A 6.375%, 1/18/27(3) | $ | 155 | $ | 157 | ||||
144A 7.650%, 6/15/35(3) | 70 | 74 | ||||||
Republic of Ghana RegS | 200 | 234 | ||||||
Republic of Guatemala 144A | 200 | 209 | ||||||
Republic of Indonesia | ||||||||
Series FR63, | 624,000 | IDR | 45 | |||||
Series FR56, | 1,566,000 | IDR | 131 | |||||
144A 5.125%, 1/15/45(3) | 200 | 228 | ||||||
Republic of Iraq RegS | 250 | 204 | ||||||
Republic of Kazakhstan 144A | 200 | 210 | ||||||
Republic of Kenya 144A | 200 | 196 | ||||||
Republic of Panama | ||||||||
3.750%, 3/16/25 | 200 | 216 | ||||||
3.875%, 3/17/28 | 200 | 216 | ||||||
Republic of Peru | 280 | 320 | ||||||
Republic of Poland Series 1021, | 300 | PLN | 91 | |||||
Republic of Romania | ||||||||
144A 6.750%, 2/7/22(3) | 150 | 181 | ||||||
RegS 4.875%, 1/22/24(4) | 100 | 114 | ||||||
RegS 6.125%, 1/22/44(4) | 120 | 162 | ||||||
Republic of South Africa | ||||||||
Series R203, | 758 | ZAR | 56 | |||||
Series R208, | 1,470 | ZAR | 102 | |||||
Republic of Sri Lanka | ||||||||
144A 5.875%, 7/25/22(3) | 200 | 206 | ||||||
144A 6.850%, 11/3/25(3) | 200 | 215 | ||||||
144A 6.825%, 7/18/26(3) | 200 | 216 | ||||||
Republic of Turkey | ||||||||
5.125%, 3/25/22 | 200 | 208 | ||||||
7.375%, 2/5/25 | 120 | 142 | ||||||
4.875%, 10/9/26 | 200 | 204 | ||||||
6.750%, 5/30/40 | 225 | 263 | ||||||
6.625%, 2/17/45 | 200 | 234 | ||||||
Republic of Uruguay | 400 | (7) | 415 | |||||
Socialist Republic of Vietnam RegS | 200 | 212 | ||||||
South Africa Government International Bond | 200 | 201 | ||||||
State of Qatar 144A | 200 | 203 | ||||||
Sultanate of Oman 144A | 200 | 201 | ||||||
Ukraine 144A | 160 | 151 | ||||||
| PAR VALUE | VALUE | |||||||
| FOREIGN GOVERNMENT SECURITIES—continued | ||||||||
United Mexican States | ||||||||
Series M, | 614 | MXN | $ | 33 | ||||
4.750%, 3/8/44 | $ | 150 | 156 | |||||
| TOTAL FOREIGN GOVERNMENT SECURITIES (Identified Cost $12,345) | 12,787 | |||||||
| CORPORATE BONDS AND NOTES—52.1% | ||||||||
| Argentina—0.3% | ||||||||
YPF S.A. 144A | 90 | 101 | ||||||
|
| |||||||
| Azerbaijan—1.4% | ||||||||
Southern Gas Corridor CJSC 144A | 200 | 224 | ||||||
State Oil Co. (Republic of Azerbaijan) | 200 | 198 | ||||||
|
| |||||||
| 422 | ||||||||
|
| |||||||
| Barbados—0.7% | ||||||||
Columbus Cable Barbados Ltd. Series B,144A | 200 | 213 | ||||||
|
| |||||||
| Brazil—4.0% | ||||||||
BRF SA | 400 | BRL | 114 | |||||
JBS Investments GmbH 144A | 200 | 204 | ||||||
Odebrecht Offshore Drilling Finance Ltd. 144A | 171 | 32 | ||||||
Petrobras Global Finance BV | ||||||||
3.000%, 1/15/19 | 80 | 78 | ||||||
5.375%, 1/27/21 | 290 | 287 | ||||||
8.375%, 5/23/21 | 60 | 66 | ||||||
8.750%, 5/23/26 | 240 | 266 | ||||||
6.750%, 1/27/41 | 100 | 87 | ||||||
Vale Overseas Ltd. | 70 | 73 | ||||||
|
| |||||||
| 1,207 | ||||||||
|
| |||||||
| Canada—0.2% | ||||||||
Eldorado Gold Corp. 144A | 45 | 46 | ||||||
|
| |||||||
| Chile—2.8% | ||||||||
Guanay Finance Ltd. 144A | 218 | 222 | ||||||
Inversiones CMPC S.A. 144A | 200 | 209 | ||||||
Transelec S.A. 144A | 200 | 210 | ||||||
VTR Finance BV 144A | 200 | 208 | ||||||
|
| |||||||
| 849 | ||||||||
|
| |||||||
See Notes to Financial Statements
36
Table of Contents
VIRTUS EMERGING MARKETS DEBT FUND
SCHEDULE OF INVESTMENTS (Continued)
SEPTEMBER 30, 2016
($ reported in thousands)
| PAR VALUE | VALUE | |||||||
| China—3.5% | ||||||||
Bank of China Ltd. 144A | $ | 200 | $ | 216 | ||||
BOC Aviation Pte Ltd. | 200 | 209 | ||||||
Kunlun Energy Co., Ltd. 144A 3.750%, 5/13/25(3) | 200 | 209 | ||||||
State Grid Overseas Investment Ltd. 144A | 200 | 221 | ||||||
Tencent Holdings Ltd. 144A | 200 | 214 | ||||||
|
| |||||||
| 1,069 | ||||||||
|
| |||||||
| Colombia—2.1% | ||||||||
Bancolombia S.A. | 100 | 104 | ||||||
Ecopetrol S.A. | ||||||||
5.875%, 9/18/23 | 200 | 216 | ||||||
5.375%, 6/26/26 | 70 | 73 | ||||||
GrupoSura Finance S.A. 144A | 200 | 212 | ||||||
Pacific Rubiales Energy Corp. 144A | 200 | 38 | ||||||
|
| |||||||
| 643 | ||||||||
|
| |||||||
| El Salvador—0.6% | ||||||||
AES El Salvador Trust II 144A | 200 | 190 | ||||||
|
| |||||||
| Hong Kong—0.7% | ||||||||
Bank of China Hong Kong Ltd. 144A | 200 | 221 | ||||||
|
| |||||||
| India—2.3% | ||||||||
Bharti Airtel International Netherlands BV 144A | 200 | 218 | ||||||
ICICI Bank Ltd. Dubai 144A | 200 | 207 | ||||||
Reliance Holdings USA, Inc. 144A | 250 | 282 | ||||||
|
| |||||||
| 707 | ||||||||
|
| |||||||
| Indonesia—4.0% | ||||||||
Pelabuhan Indonesia II PT 144A | 200 | 204 | ||||||
Pertamina Persero PT | ||||||||
144A 4.875%, 5/3/22(3) | 200 | 216 | ||||||
144A 6.000%, 5/3/42(3) | 275 | 303 | ||||||
144A 5.625%, 5/20/43(3) | 200 | 211 | ||||||
Perusahaan Listrik Negara PT 144A | 250 | 279 | ||||||
|
| |||||||
| 1,213 | ||||||||
|
| |||||||
| PAR VALUE | VALUE | |||||||
| Jamaica—0.6% | ||||||||
Digicel Group Ltd. 144A | $ | 200 | $ | 175 | ||||
|
| |||||||
| Kazakhstan—1.4% | ||||||||
Development Bank of Kazakhstan OJSC 144A | 200 | 196 | ||||||
KazMunayGas National Co. 144A | 200 | 221 | ||||||
|
| |||||||
| 417 | ||||||||
|
| |||||||
| Mexico—7.8% | ||||||||
Alfa SAB de CV 144A | 200 | 213 | ||||||
Alpek SA de C.V. 144A | 200 | 214 | ||||||
America Movil SAB de C.V. | 2,000 | MXN | 100 | |||||
Banco Bilbao Vizcaya Argentaria Bancomer S.A. 144A | 150 | 168 | ||||||
Banco Santander Mexico SA 144A | 200 | 211 | ||||||
Cemex SAB de C.V. 144A | 200 | 213 | ||||||
Fermaca Enterprises S de RL de CV 144A | 191 | 195 | ||||||
Fomento Economico Mexicano SAB de CV | 150 | 150 | ||||||
Grupo Televisa SAB | 2,000 | MXN | 89 | |||||
Grupo Televisa Sab | 200 | 220 | ||||||
Petroleos Mexicanos | ||||||||
4.250%, 1/15/25 | 100 | 97 | ||||||
144A 6.875%, 8/4/26(3) | 205 | 231 | ||||||
6.375%, 1/23/45 | 100 | 96 | ||||||
5.625%, 1/23/46 | 200 | 175 | ||||||
|
| |||||||
| 2,372 | ||||||||
|
| |||||||
| Morocco—0.7% | ||||||||
Office Cherifien des Phosphates S.A. (OCP) 144A | 200 | 217 | ||||||
|
| |||||||
| Netherlands—0.7% | ||||||||
GTH Finance BV 144A | 200 | 218 | ||||||
|
| |||||||
| Peru—2.1% | ||||||||
Banco de Credito del Peru | ||||||||
144A 5.375%, | 100 | 110 | ||||||
144A 6.125%, | 100 | 111 | ||||||
Banco Internacional del Peru SAA 144A | 100 | 111 | ||||||
| PAR VALUE | VALUE | |||||||
| Peru—continued | ||||||||
Banco Internacional del Peru SAA Interbank 144A | $ | 100 | $ | 111 | ||||
Transportadora de Gas del Peru SA 144A | 200 | 208 | ||||||
|
| |||||||
| 651 | ||||||||
|
| |||||||
| Poland—0.7% | ||||||||
PKO Finance AB 144A | 200 | 216 | ||||||
|
| |||||||
| Qatar—0.7% | ||||||||
Ooredoo International Finance Ltd. 144A | 200 | 207 | ||||||
|
| |||||||
| Russia—4.4% | ||||||||
AHML Finance Ltd. 144A | 5,000 | RUB | 78 | |||||
Gazprom OAO (Gaz Capital S.A.) | ||||||||
144A 6.000%, | 200 | 217 | ||||||
144A 4.950%, | 200 | 201 | ||||||
Lukoil OAO International Finance BV 144A | 200 | 207 | ||||||
Metalloinvest Finance Ltd. 144A | 200 | 211 | ||||||
SCF Capital Ltd. 144A | 200 | 209 | ||||||
Severstal OAO Via Steel Capital SA 144A | 200 | 219 | ||||||
|
| |||||||
| 1,342 | ||||||||
|
| |||||||
| Singapore—0.7% | ||||||||
Oversea-Chinese Banking Corp., Ltd. 144A | 200 | 209 | ||||||
|
| |||||||
| South Africa—1.3% | ||||||||
Eskom Holdings SOC Ltd. 144A | 200 | 206 | ||||||
Transnet SOC Ltd. 144A | 200 | 194 | ||||||
|
| |||||||
| 400 | ||||||||
|
| |||||||
| Sultanate of Oman—0.6% | ||||||||
Lamar Funding Ltd. 144A | 200 | 190 | ||||||
|
| |||||||
| Supranational—2.1% | ||||||||
Africa Finance Corp. 144A | 200 | 209 | ||||||
Corp Andina de Fomento | 200 | 222 | ||||||
See Notes to Financial Statements
37
Table of Contents
VIRTUS EMERGING MARKETS DEBT FUND
SCHEDULE OF INVESTMENTS (Continued)
SEPTEMBER 30, 2016
($ reported in thousands)
| PAR VALUE | VALUE | |||||||
| Supranational—continued | ||||||||
Eurasian Development Bank 144A | $ | 200 | $ | 210 | ||||
|
| |||||||
| 641 | ||||||||
|
| |||||||
| Trinidad and Tobago—0.2% | ||||||||
Petroleum Co. of Trinidad & Tobago Ltd. RegS | 50 | 49 | ||||||
|
| |||||||
| Turkey—1.3% | ||||||||
Akbank Tas 144A | 200 | 196 | ||||||
Turkiye Is Bankasi A.S 144A | 200 | 210 | ||||||
|
| |||||||
| 406 | ||||||||
|
| |||||||
| Ukraine—1.1% | ||||||||
Oschadbank Via Ssb #1 plc RegS | 200 | 194 | ||||||
Ukreximbank Via Biz Finance plc 144A | 150 | 147 | ||||||
|
| |||||||
| 341 | ||||||||
|
| |||||||
| United Arab Emirates—1.0% | ||||||||
DP World Ltd. 144A | 250 | 289 | ||||||
|
| |||||||
| United Kingdom—0.4% | ||||||||
EnQuest plc 144A | 200 | 105 | ||||||
|
| |||||||
| United States—0.1% | ||||||||
Parker Drilling Co. | 50 | 39 | ||||||
|
| |||||||
| Venezuela—1.6% | ||||||||
Petroleos de Venezuela SA | ||||||||
RegS 8.500%, 11/2/17(4) | 243 | 210 | ||||||
144A 6.000%, 5/16/24(3) | 555 | 238 | ||||||
Petroleos de Venezuela SA RegS | 100 | 42 | ||||||
|
| |||||||
| 490 | ||||||||
| TOTAL CORPORATE BONDS AND NOTES (Identified Cost $16,001) | 15,855 | |||||||
| LOAN AGREEMENTS(2)—0.1% | ||||||||
| Consumer Discretionary—0.1% | ||||||||
Delta 2 (Lux) S.a.r.l. Tranche B-3, | 47 | 47 | ||||||
| TOTAL LOAN AGREEMENTS (Identified Cost $47) | 47 | |||||||
| SHARES | VALUE | |||||||
| PREFERRED STOCK—0.7% | ||||||||
| Energy—0.7% | ||||||||
PTT Exploration & Production PCL 144A, 4.875%(2)(3) | 200 | (8) | $ | 204 | ||||
| TOTAL PREFERRED STOCK (Identified Cost $201) | 204 | |||||||
| EXCHANGE-TRADED FUND—0.5% | ||||||||
iShares JPMorgan Emerging Markets Bond Index Fund(10) | 1,400 | 164 | ||||||
| TOTAL EXCHANGE-TRADED FUND (Identified Cost $165) | 164 | |||||||
| TOTAL LONG TERM INVESTMENTS—95.4% | ||||||||
| (Identified Cost $28,759) | 29,057 | |||||||
| SHORT-TERM INVESTMENT—1.4% | ||||||||
| Money Market Mutual Fund—1.4% | ||||||||
JPMorgan U.S. Government Money Market Fund – Institutional Shares (seven-day effective yield 0.360%)(10) | 411,876 | 412 | ||||||
| TOTAL SHORT-TERM INVESTMENT (Identified Cost $412) | 412 | |||||||
| TOTAL INVESTMENTS—96.8% | ||||||||
| (Identified Cost $29,171) | 29,469 | (1) | ||||||
Other assets and liabilities, net—3.2% |
| 975 | ||||||
|
| |||||||
| NET ASSETS—100.0% | $ | 30,444 | ||||||
|
| |||||||
Footnote Legend:
| (1) | Federal Income Tax Information: For tax information at September 30, 2016, see Note 10 Federal Income Tax Information in the Notes to Financial Statements. |
| (2) | Variable or step coupon security; interest rate shown reflects the rate in effect at September 30, 2016. |
| (3) | Security exempt from registration under Rule 144A of the Securities Act of 1933. These securities may be resold in transactions exempt from registration, normally to qualified institutional buyers. At September 30, 2016, these securities amounted to a value of $18,364 or 60.3% of net assets. |
| (4) | Regulation S security. Security is offered and sold outside of the United States, therefore, it is exempt from registration with the SEC under Rules 903 and 904 of the Securities Act of 1933. |
| (5) | This Note was issued for the sole purpose of funding a loan agreement between the issuer and the borrower. As the credit risk for this security lies solely with the borrower, the name represented here is that of the borrower. |
| (6) | Interest payments may be deferred. |
| (7) | Principal amount is adjusted pursuant to the change in the Index. |
| (8) | Value shown as par value. |
| (9) | Security in default, no interest payments are being received. |
| (10) | Shares of these funds are publicly offered and the prospectus and annual reports of each are publicly available. |
Foreign Currencies:
| BRL | Brazilian Real |
| CLP | Chilean Peso |
| COP | Colombian Peso |
| IDR | Indonesian Rupiah |
| MXN | Mexican Peso |
| PLN | Polish Zloty |
| RUB | Russian Ruble |
| ZAR | South African Rand |
| Country Weightings (Unaudited)† | ||||
Mexico | 9 | % | ||
Brazil | 7 | |||
Argentina | 6 | |||
Indonesia | 5 | |||
Turkey | 5 | |||
China | 4 | |||
Russia | 4 | |||
Other | 60 | |||
Total | 100 | % | ||
† % of total investments as of September 30, 2016 |
| |||
Security abbreviation definitions are located under the Key Investment Terms starting on page 4.
See Notes to Financial Statements
38
Table of Contents
VIRTUS EMERGING MARKETS DEBT FUND
SCHEDULE OF INVESTMENTS (Continued)
SEPTEMBER 30, 2016
($ reported in thousands)
The following table provides a summary of inputs used to value the Fund’s investments as of September 30, 2016 (See Security Valuation Note 2A in the Notes to Financial Statements):
| Total Value at September 30, 2016 | Level 1 Quoted Prices | Level 2 Significant Observable Inputs | Level 3 Significant Unobservable Inputs | |||||||||||||
Debt Securities: | ||||||||||||||||
Corporate Bonds and Notes | $ | 15,855 | $ | — | $ | 15,817 | $ | 38 | ||||||||
Foreign Government Securities | 12,787 | — | 12,787 | — | ||||||||||||
Loan Agreements | 47 | — | 47 | — | ||||||||||||
Equity Securities: | ||||||||||||||||
Preferred Stock | 204 | — | 204 | — | ||||||||||||
Exchange-Traded Fund | 164 | 164 | — | — | ||||||||||||
Short-Term Investments | 412 | 412 | — | — | ||||||||||||
|
|
|
|
|
|
|
| |||||||||
Total Investments | $ | 29,469 | $ | 576 | $ | 28,855 | $ | 38 | ||||||||
|
|
|
|
|
|
|
| |||||||||
There were no transfers between Level 1 and Level 2 related to securities held at September 30, 2016.
The following is a reconciliation of assets of the Fund for Level 3 investments for which significant unobservable inputs were used to determine fair value.
| Total | Corporate Bonds and Notes | |||||||
Investments in Securities | ||||||||
Balance as of September 30, 2015: | $ | — | $ | — | ||||
Accrued discount/(premium) | — | — | ||||||
Realized gain (loss) | — | — | ||||||
Change in unrealized appreciation (depreciation) | — | — | ||||||
Purchases | — | — | ||||||
Sales(b) | — | — | ||||||
Transfers into Level 3(a)(c) | 38 | 38 | ||||||
Transfers from Level 3(a) | — | — | ||||||
|
|
|
| |||||
Balance as of September 30, 2016 | $ | 38 | $ | 38 | ||||
|
|
|
| |||||
| (a) | “Transfers into and/or from” represent the ending value as of September 30, 2016, for any investment security where a change in the pricing level occurred from the beginning to the end of the period. |
| (b) | Includes paydowns on securities, if applicable. |
| (c) | The transfers into Level 3 are due to a decrease in trading activities at period end. |
None of the securities in this table are internally fair valued. The Fund’s investments that are categorized as Level 3 were valued utilizing third party pricing information without adjustment. Such valuations are based on unobservable inputs. A significant change in third party information inputs could result in a significantly lower or higher value of such Level 3 investments.
See Notes to Financial Statements
39
Table of Contents
VIRTUS EMERGING MARKETS EQUITY INCOME FUND
SCHEDULE OF INVESTMENTS
SEPTEMBER 30, 2016
($ reported in thousands)
| SHARES | VALUE | |||||||
| PREFERRED STOCKS—4.5% | ||||||||
| Consumer Staples—0.4% | ||||||||
Companhia Brasileira de Distribuicao Grupo Pao de Acucar 0.31% (Brazil) | 7,400 | $ | 122 | |||||
|
| |||||||
| Financials—1.9% | ||||||||
Banco Bradesco S.A. 5.84% (Brazil) | 41,320 | 380 | ||||||
Bancolombia SA 3.11% (Colombia) | 8,053 | 78 | ||||||
Itausa Investimentos Itau S.A. 3.96% (Brazil) | 56,470 | 146 | ||||||
|
| |||||||
| 604 | ||||||||
|
| |||||||
| Materials—1.1% | ||||||||
Braskem SA, Class A 10.31% (Brazil) | 21,300 | 164 | ||||||
Suzano Papel e Celulose S.A. Class A (Brazil) | 60,600 | 196 | ||||||
|
| |||||||
| 360 | ||||||||
|
| |||||||
| Telecommunication Services—0.2% | ||||||||
Telefonica Brasil SA (Brazil) | 4,000 | 58 | ||||||
|
| |||||||
| Utilities—0.9% | ||||||||
Companhia Energetica de Minas Gerais 5.68% (Brazil) | 26,900 | 71 | ||||||
Companhia Paranaense de Energia, Class B 3.72% (Brazil) | 19,200 | 200 | ||||||
|
| |||||||
| 271 | ||||||||
| TOTAL PREFERRED STOCKS (Identified Cost $1,027) | 1,415 | |||||||
| COMMON STOCKS—92.9% | ||||||||
| Consumer Discretionary—8.4% | ||||||||
Astra International Tbk PT (Indonesia) | 577,000 | 366 | ||||||
Bajaj Auto Ltd. (India) | 5,249 | 223 | ||||||
Coway Co., Ltd. (South Korea) | 2,145 | 186 | ||||||
Dongfeng Motor Group Co., Ltd. Class H (China) | 142,000 | 143 | ||||||
Ford Otomotiv Sanayi AS (Turkey) | 9,264 | 98 | ||||||
Foschini Group Ltd. (The) (South Africa) | 6,534 | 66 | ||||||
Gome Electrical Appliances Holding Ltd. (China) | 606,000 | 75 | ||||||
Home Product Center PCL (Thailand) | 437,600 | 127 | ||||||
Kangwon Land, Inc. (South Korea) | 7,311 | 261 | ||||||
Kia Motors Corp. (South Korea) | 6,128 | 235 | ||||||
Lojas Renner S.A. (Brazil) | 19,300 | 146 | ||||||
Merida Industry Co. Ltd. (Taiwan) | 55,000 | 261 | ||||||
Steinhoff International Holdings NV (Netherlands) | 40,111 | 230 | ||||||
Truworths International Ltd. (South Africa) | 20,255 | 105 | ||||||
| SHARES | VALUE | |||||||
| Consumer Discretionary—continued | ||||||||
Tsogo Sun Holdings Ltd. (South Africa) | 45,862 | $ | 104 | |||||
|
| |||||||
| 2,626 | ||||||||
|
| |||||||
| Consumer Staples—4.5% | ||||||||
Ambev SA (Brazil) | 39,800 | 243 | ||||||
BRF SA (Brazil) | 6,000 | 103 | ||||||
Fomento Economico Mexicano S.A.B. de CV (Mexico) | 22,300 | 205 | ||||||
Hindustan Unilever Ltd. (India) | 13,214 | 173 | ||||||
KT&G Corp. (South Korea) | 3,312 | 377 | ||||||
Spar Group Ltd. (The) (South Africa) | 10,616 | 149 | ||||||
Want Want China Holdings Ltd. (China) | 219,000 | 136 | ||||||
|
| |||||||
| 1,386 | ||||||||
|
| |||||||
| Energy—5.8% | ||||||||
China Petroleum & Chemical Corp. Class H (China) | 157,800 | 116 | ||||||
Cosan S.A. Industria e Comercio (Brazil) | 16,500 | 191 | ||||||
Formosa Petrochemical Corp. (Taiwan) | 48,000 | 144 | ||||||
Gazprom PAO (Gazstream S.A.) Sponsored ADR (Russia) | 83,152 | 352 | ||||||
Lukoil PJSC Sponsored ADR (Russia) | 2,417 | 118 | ||||||
Rosneft OJSC GDR (Russia) | 21,876 | 121 | ||||||
Sasol Ltd. (South Africa) | 5,285 | 145 | ||||||
Tatneft PAO Sponsored ADR (Russia) | 5,150 | 159 | ||||||
Thai Oil Public Co. Ltd. (Thailand) | 137,200 | 272 | ||||||
Ultrapar Participacoes S.A. (Brazil) | 8,300 | 184 | ||||||
|
| |||||||
| 1,802 | ||||||||
|
| |||||||
| Financials—27.9% | ||||||||
Agricultural Bank of China Ltd. Class H (China) | 835,000 | 360 | ||||||
Aldar Properties PJSC (United Arab Emirates) | 246,117 | 179 | ||||||
AMMB Holdings Bhd (Malaysia) | 58,300 | 58 | ||||||
Banco de Chile (Chile) | 883,756 | 99 | ||||||
Banco do Brasil S.A. (Brazil) | 29,700 | 210 | ||||||
Banco Santander Chile SA (Chile) | 2,722,312 | 141 | ||||||
Bank of China Ltd. Class H (China) | 1,462,000 | 675 | ||||||
Barclays Africa Group Ltd. (South Africa) | 24,339 | 268 | ||||||
BM&F Bovespa S.A. (Brazil) | 19,700 | 102 | ||||||
Chailease Holding Co. Ltd. (Cayman Islands) | 102,000 | 182 | ||||||
China Construction Bank Corp. Class H (China) | 1,538,000 | 1,155 | ||||||
China Everbright Bank Co., Ltd. Class H (China) | 486,000 | 228 | ||||||
China Everbright Ltd. (China) | 128,000 | 264 | ||||||
Commercial Bank QSC (The) (Qatar) | 9,112 | 96 | ||||||
| SHARES | VALUE | |||||||
| Financials—continued | ||||||||
Dongbu Insurance Co., Ltd. (South Korea) | 5,212 | $ | 324 | |||||
Dubai Islamic Bank PJSC (United Arab Emirates) | 67,324 | 99 | ||||||
Emlak Konut Gayrimenkul Yatirim Ortakligi AS (Turkey) | 161,434 | 164 | ||||||
First Gulf Bank PJSC (United Arab Emirates) | 39,886 | 128 | ||||||
FirstRand Ltd. (South Africa) | 102,863 | 356 | ||||||
Fubon Financial Holding Co., Ltd. (Taiwan) | 175,000 | 260 | ||||||
Gentera S.A.B de CV (Mexico) | 62,800 | 113 | ||||||
Guangzhou R&F Properties Co., Ltd. Class H (China) | 112,800 | 179 | ||||||
Highwealth Construction Corp. (Taiwan) | 168,000 | 260 | ||||||
Hyundai Marine & Fire Insurance Co., Ltd. (South Korea) | 11,699 | 386 | ||||||
Industrial & Commercial Bank of China Ltd. Class H (China) | 1,573,000 | 998 | ||||||
Liberty Holdings Ltd. (South Africa) | 17,343 | 147 | ||||||
MMI Holdings Ltd. (South Africa) | 36,401 | 59 | ||||||
OTP Bank plc (Hungary) | 4,570 | 120 | ||||||
Ping An Insurance Group Co. of China Ltd. Class H (China) | 62,500 | 328 | ||||||
Porto Seguro S.A. (Brazil) | 12,500 | 115 | ||||||
Shimao Property Holdings Ltd. (China) | 127,500 | 174 | ||||||
Standard Bank Group Ltd. (South Africa) | 21,606 | 222 | ||||||
Sunac China Holdings Ltd. (China) | 132,000 | 96 | ||||||
Turkiye Is Bankasi Class C (Turkey) | 78,026 | 124 | ||||||
|
| |||||||
| 8,669 | ||||||||
|
| |||||||
| Health Care—2.2% | ||||||||
China Medical System Holdings Ltd. (China) | 189,000 | 319 | ||||||
Richter Gedeon Nyrt (Hungary) | 7,766 | 158 | ||||||
Sinopharm Group Co., Ltd. | 41,200 | 200 | ||||||
|
| |||||||
| 677 | ||||||||
|
| |||||||
| Industrials—7.9% | ||||||||
Air China Ltd. Class H (China) | 214,000 | 145 | ||||||
AirAsia BHD (Malaysia) | 270,300 | 183 | ||||||
Bidvest Group Ltd. (The) (South Africa) | 11,577 | 136 | ||||||
China Conch Venture Holdings Ltd. (China) | 106,000 | 207 | ||||||
Grupo Aeroportuario del Pacifico SAB de C.V. Class B (Mexico) | 19,400 | 184 | ||||||
LG Corp. (South Korea) | 4,319 | 255 | ||||||
Pegatron Corp. (Taiwan) | 131,000 | 339 | ||||||
Shanghai Industrial Holdings Ltd. (China) | 101,000 | 292 | ||||||
Sinopec Engineering Group Co., Ltd. Class H (China) | 199,000 | 172 | ||||||
See Notes to Financial Statements
40
Table of Contents
VIRTUS EMERGING MARKETS EQUITY INCOME FUND
SCHEDULE OF INVESTMENTS (Continued)
SEPTEMBER 30, 2016
($ reported in thousands)
| SHARES | VALUE | |||||||
| Industrials—continued | ||||||||
TAV Havalimanlari Holding AS (Turkey) | 22,507 | $ | 93 | |||||
United Tractors Tbk PT (Indonesia) | 163,300 | 223 | ||||||
Weg SA (Brazil) | 13,300 | 73 | ||||||
Zhejiang Expressway Co., Ltd. Class H (China) | 160,000 | 170 | ||||||
|
| |||||||
| 2,472 | ||||||||
|
| |||||||
| Information Technology—22.9% | ||||||||
Advanced Semiconductor Engineering, Inc. (Taiwan) | 230,000 | 276 | ||||||
Asustek Computer, Inc. (Taiwan) | 36,000 | 322 | ||||||
Catcher Technology Co., Ltd. (Taiwan) | 63,000 | 516 | ||||||
Compal Electronics, Inc. (Taiwan) | 344,000 | 213 | ||||||
Delta Electronics Thailand PCL (Thailand) | 97,100 | 223 | ||||||
Foxconn Technology CO Ltd. (Taiwan) | 52,520 | 155 | ||||||
HCL Technologies Ltd. (India) | 64,727 | 779 | ||||||
Hon Hai Precision Industry Co., Ltd. (Taiwan) | 102,190 | 259 | ||||||
Infosys Ltd. (India) | 55,660 | 866 | ||||||
Lite-On Technology Corp. (Taiwan) | 105,473 | 152 | ||||||
NCSoft Corp. (South Korea) | 257 | 69 | ||||||
NetEase, Inc. ADR (China) | 2,086 | 502 | ||||||
Powertech Technology, Inc. (Taiwan) | 97,000 | 252 | ||||||
Simplo Technology Co. Ltd. (Taiwan) | 66,000 | 218 | ||||||
Taiwan Semiconductor Manufacturing Co., Ltd. (Taiwan) | 177,000 | 1,040 | ||||||
Tata Consultancy Services Ltd. (India) | 13,053 | 477 | ||||||
TOTVS S.A. (Brazil) | 6,100 | 58 | ||||||
Travelsky Technology Ltd. Class H (China) | 98,000 | 234 | ||||||
Vanguard International Semiconductor Corp. (Taiwan) | 77,000 | 145 | ||||||
| SHARES | VALUE | |||||||
| Information Technology—continued | ||||||||
Wipro Ltd. (India) | 22,533 | $ | 162 | |||||
Wistron Corp. (Taiwan) | 8,644 | 6 | ||||||
WPG Holdings Ltd. (Taiwan) | 178,000 | 211 | ||||||
|
| |||||||
| 7,135 | ||||||||
|
| |||||||
| Materials—5.4% | ||||||||
Anhui Conch Cement Co., Ltd. Class H (China) | 63,000 | 174 | ||||||
Cementos Argos S.A. (Colombia) | 33,003 | 131 | ||||||
Grupo Mexico S.A.B. de C.V. Series B (Mexico) | 44,300 | 108 | ||||||
Hyosung Corp. (South Korea) | 2,034 | 242 | ||||||
IRPC PCL (Thailand) | 525,600 | 74 | ||||||
Mondi Ltd. (South Africa) | 9,841 | 207 | ||||||
PTT Global Chemical PCL (Thailand) | 208,200 | 355 | ||||||
Siam Cement Public Co. Ltd. (Thailand) | 15,600 | 234 | ||||||
Sibanye Gold Ltd. (South Africa) | 47,306 | 171 | ||||||
|
| |||||||
| 1,696 | ||||||||
|
| |||||||
| Telecommunication Services—5.2% | ||||||||
America Movil S.A.B. de C.V. Class C Series L (Mexico) | 174,800 | 100 | ||||||
China Communications Services Corp. Ltd. Series H (China) | 418,000 | 262 | ||||||
China Mobile Ltd. (China) | 51,000 | 627 | ||||||
MTN Group Ltd. (South Africa) | 11,218 | 96 | ||||||
SK Telecom Co., Ltd. (South Korea) | 1,207 | 247 | ||||||
Telkom SA SOC Ltd. (South Africa) | 33,186 | 146 | ||||||
Vodacom Group Ltd. (South Africa) | 11,105 | 125 | ||||||
|
| |||||||
| 1,603 | ||||||||
|
| |||||||
| Utilities—2.7% | ||||||||
China Power International Development Ltd. (China) | 484,000 | 187 | ||||||
China Resources Power Holdings Co., Ltd. (China) | 94,000 | 163 | ||||||
| SHARES | VALUE | |||||||
| Utilities—continued | ||||||||
Interconexion Electrica SA ESP (Colombia) | 18,890 | $ | 64 | |||||
Korea Electric Power Corp. (South Korea) | 8,463 | 415 | ||||||
|
| |||||||
| 829 | ||||||||
| TOTAL COMMON STOCKS (Identified Cost $26,646) | 28,895 | |||||||
| TOTAL LONG TERM INVESTMENTS—97.4% | ||||||||
| (Identified Cost $27,673) | 30,310 | |||||||
| TOTAL INVESTMENTS—97.4% (Identified Cost $27,673) | 30,310 | (1) | ||||||
Other assets and liabilities, net—2.6% |
| 806 | ||||||
|
| |||||||
| NET ASSETS—100.0% | $ | 31,116 | ||||||
|
| |||||||
Abbreviations:
| ADR | American Depositary Receipt |
| GDR | Global Depositary Receipt |
Footnote Legend:
| (1) | Federal Income Tax Information: For tax information at September 30, 2016, see Note 10 Federal Income Tax Information in the Notes to Financial Statements. |
| Country Weightings (Unaudited)† | ||||
China | 28 | % | ||
Taiwan | 17 | |||
South Korea | 10 | |||
Brazil | 9 | |||
India | 9 | |||
South Africa | 8 | |||
Thailand | 4 | |||
Other | 15 | |||
Total | 100 | % | ||
† % of total investments as of September 30, 2016 |
| |||
The following table provides a summary of inputs used to value the Fund’s investments as of September 30, 2016 (See Security Valuation Note 2A in the Notes to Financial Statements):
| Total Value at September 30, 2016 | Level 1 Quoted Prices | Level 2 Significant Observable Inputs | ||||||||||
Equity Securities: | ||||||||||||
Common Stocks | $ | 28,895 | $ | 7,309 | $ | 21,586 | ||||||
Preferred Stocks | 1,415 | 1,415 | — | |||||||||
|
|
|
|
|
| |||||||
Total Investments | $ | 30,310 | $ | 8,724 | $ | 21,586 | ||||||
|
|
|
|
|
| |||||||
There are no Level 3 (significant unobservable inputs) priced securities.
There were no transfers between Level 1 and Level 2 related to securities held at September 30, 2016.
Security abbreviation definitions are located under the Key Investment Terms starting on page 4.
See Notes to Financial Statements
41
Table of Contents
VIRTUS EMERGING MARKETS SMALL-CAP FUND
SCHEDULE OF INVESTMENTS
SEPTEMBER 30, 2016
($ reported in thousands)
| SHARES | VALUE | |||||||
| PREFERRED STOCK—0.8% | ||||||||
| Consumer Discretionary—0.8% | ||||||||
Whirlpool SA (Brazil) | 38,964 | $ | 41 | |||||
| TOTAL PREFERRED STOCK (Identified Cost $29) | 41 | |||||||
| COMMON STOCKS—95.7% | ||||||||
| Consumer Discretionary—8.9% | ||||||||
Ace Hardware Indonesia Tbk PT (Indonesia) | 1,498,000 | 100 | ||||||
Goldlion Holdings Ltd. (Hong Kong) | 259,000 | 104 | ||||||
Pico Far East Holdings Ltd. (Hong Kong) | 706,780 | 213 | ||||||
Whirlpool SA (Brazil) | 20,161 | 20 | ||||||
|
| |||||||
| 437 | ||||||||
|
| |||||||
| Consumer Staples—22.4% | ||||||||
AVI Ltd. (South Africa) | 23,910 | 164 | ||||||
Compania Cervecerias Unidas SA Sponsored ADR (Chile) | 6,200 | 125 | ||||||
Embotelladora Andina ADR S.A. Class-B (Chile) | 2,300 | 52 | ||||||
Heineken Malaysia Bhd (Malaysia) | 32,200 | 138 | ||||||
Oldtown Bhd (Malaysia) | 322,750 | 155 | ||||||
Pinar SUT Mamulleri Sanayii AS (Turkey) | 22,800 | 110 | ||||||
Premier Marketing PCL (Thailand) | 643,000 | 167 | ||||||
Union de Cervecerias Peruanas Backus y Johnston SAA (Peru) | 10,800 | 50 | ||||||
Wawel SA (Poland) | 592 | 139 | ||||||
|
| |||||||
| 1,100 | ||||||||
|
| |||||||
| Energy—1.1% | ||||||||
Qualitech PCL (Thailand) | 200,000 | 52 | ||||||
|
| |||||||
| Financials—16.1% | ||||||||
ARA Asset Management Ltd. (Singapore) | 156,880 | 156 | ||||||
BFI Finance Indonesia Tbk PT (Indonesia) | 779,000 | 197 | ||||||
Credit Analysis & Research Ltd. (India) | 7,900 | 161 | ||||||
Equity Group Holdings Ltd. (Kenya) | 220,600 | 67 | ||||||
Korea Ratings Corp. (South Korea) | 3,130 | 117 | ||||||
Tisco Financial Group PCL (Thailand) | 61,700 | 94 | ||||||
|
| |||||||
| 792 | ||||||||
|
| |||||||
| Industrials—26.0% | ||||||||
Freight Management Holdings Bhd (Malaysia) | 218,729 | 62 | ||||||
Hy-Lok Corp. (South Korea) | 5,000 | 99 | ||||||
Lumax International Corp., Ltd. (Taiwan) | 163,800 | 252 | ||||||
Prosegur Cia de Seguridad SA (Spain) | 15,700 | 110 | ||||||
| SHARES | VALUE | |||||||
| Industrials—(continued) | ||||||||
S-1 Corp. (South Korea) | 1,950 | $ | 180 | |||||
Sinmag Equipment Corp. (Taiwan) | 26,520 | 120 | ||||||
Taiwan Secom Co., Ltd. (Taiwan) | 58,874 | 171 | ||||||
Tegma Gestao Logistica (Brazil)(2) | 74,000 | 188 | ||||||
Turk Traktor Ve Ziraat Makineleri AS (Turkey) | 3,600 | 98 | ||||||
|
| |||||||
| 1,280 | ||||||||
|
| |||||||
| Information Technology—9.0% | ||||||||
Autohome, Inc. ADR (China)(2) | 6,300 | 153 | ||||||
Cartrack Holdings Ltd. (South Africa) | 71,600 | 52 | ||||||
EClerx Services Ltd. (India) | 4,933 | 112 | ||||||
Yandex N.V. Class A (Russia)(2) | 6,000 | 126 | ||||||
|
| |||||||
| 443 | ||||||||
|
| |||||||
| Materials—12.2% | ||||||||
Enaex SA (Chile) | 4,800 | 50 | ||||||
KPX Chemical Co. Ltd. (South Korea) | 2,615 | 143 | ||||||
Transpaco Ltd. (South Africa)(3) | 107,500 | 211 | ||||||
Yung Chi Paint & Varnish Manufacturing Co. Ltd. (Taiwan) | 82,000 | 198 | ||||||
|
| |||||||
| 602 | ||||||||
| TOTAL COMMON STOCKS (Identified Cost $4,658) | 4,706 | |||||||
| TOTAL LONG TERM INVESTMENTS—96.5% | ||||||||
| (Identified Cost $4,687) | 4,747 | |||||||
| SHORT-TERM INVESTMENT—1.1% | ||||||||
| Money Market Mutual Fund—1.1% | ||||||||
JPMorgan U.S. Government Money Market Fund – Institutional Shares (seven-day effective yield 0.360%)(4) | 52,369 | 52 | ||||||
| TOTAL SHORT-TERM INVESTMENT (Identified Cost $52) | 52 | |||||||
| TOTAL INVESTMENTS—97.6% (Identified Cost $4,739) | 4,799 | (1) | ||||||
Other assets and liabilities, net—2.4% |
| 120 | ||||||
|
| |||||||
| NET ASSETS—100.0% | $ | 4,919 | ||||||
|
| |||||||
Abbreviation:
| ADR | American Depositary Receipt |
Footnote Legend:
| (1) | Federal Income Tax Information: For tax information at September 30, 2016, see Note 10 Federal Income Tax Information in the Notes to Financial Statements. |
| (2) | Non-income producing. |
| (3) | Illiquid security. |
| (4) | Shares of this fund are publicly offered and its prospectus and annual report are publicly available. |
| Country Weightings (Unaudited)† | ||||
Taiwan | 15 | % | ||
South Korea | 11 | |||
South Africa | 9 | |||
Hong Kong | 7 | |||
Malaysia | 7 | |||
Thailand | 7 | |||
Indonesia | 6 | |||
Other | 38 | |||
Total | 100 | % | ||
† % of total investments as of September 30, 2016 |
| |||
The following table provides a summary of inputs used to value the Fund’s investments as of September 30, 2016 (See Security Valuation Note 2A in the Notes to Financial Statements):
| Total Value at September 30, 2016 | Level 1 Quoted Prices | Level 2 Significant Observable Inputs | ||||||||||
Equity Securities: | ||||||||||||
Common Stocks | $ | 4,706 | $ | 2,501 | $ | 2,205 | ||||||
Preferred Stock | 41 | 41 | — | |||||||||
Short-Term Investments | 52 | 52 | — | |||||||||
|
|
|
|
|
| |||||||
Total Invest | $ | 4,799 | $ | 2,594 | $ | 2,205 | ||||||
|
|
|
|
|
| |||||||
There are no Level 3 (significant unobservable inputs) priced securities.
Securities held by the Fund with an end of period value of $453 were transferred from Level 1 to Level 2, and securities with an end of period value of $377 were transferred from Level 2 to Level 1, based on our valuation procedures for non-U.S. securities.
(See Note 2A in the Notes to Financial Statements for more information.)
Security abbreviation definitions are located under the Key Investment Terms starting on page 4.
See Notes to Financial Statements
42
Table of Contents
VIRTUS GLOBAL INFRASTRUCTURE FUND
SCHEDULE OF INVESTMENTS
SEPTEMBER 30, 2016
($ reported in thousands)
| SHARES | VALUE | |||||||
| COMMON STOCKS—99.1% | ||||||||
| Energy—25.7% | ||||||||
Enbridge, Inc. (Canada) | 120,725 | $ | 5,340 | |||||
Inter Pipeline Ltd. (Canada) | 44,765 | 945 | ||||||
Kinder Morgan, Inc. (United States) | 247,945 | 5,735 | ||||||
Koninklijke Vopak N.V. (Netherlands) | 16,660 | 875 | ||||||
ONEOK, Inc. (United States) | 28,100 | 1,444 | ||||||
Pembina Pipeline Corp. (Canada) | 56,325 | 1,717 | ||||||
Plains GP Holdings LP Class A (United States) | 82,780 | 1,071 | ||||||
Spectra Energy Corp. (United States) | 87,440 | 3,738 | ||||||
Tallgrass Energy GP LP (United States) | 39,350 | 946 | ||||||
Targa Resources Corp. (United States) | 29,470 | 1,447 | ||||||
TransCanada Corp. (Canada) | 111,170 | 5,287 | ||||||
Williams Cos., Inc. (The) (United States) | 91,535 | 2,813 | ||||||
|
| |||||||
| 31,358 | ||||||||
|
| |||||||
| Financials—5.9% | ||||||||
American Tower Corp. (United States) | 30,990 | 3,512 | ||||||
Crown Castle International Corp. (United States) | 39,310 | 3,703 | ||||||
|
| |||||||
| 7,215 | ||||||||
|
| |||||||
| Industrials—14.3% | ||||||||
Abertis Infraestructuras SA (Spain) | 114,550 | 1,784 | ||||||
Aena SA (Spain)(2) | 8,530 | 1,258 | ||||||
Atlantia SpA (Italy) | 102,541 | 2,602 | ||||||
Auckland International Airport Ltd. (New Zealand) | 391,319 | 2,097 | ||||||
Ferrovial SA (Spain) | 62,640 | 1,333 | ||||||
Flughafen Zuerich AG (Switzerland) | 6,940 | 1,356 | ||||||
Sydney Airport (Australia) | 361,900 | 1,940 | ||||||
Transurban Group (Australia) | 441,145 | 3,855 | ||||||
Vinci SA (France) | 16,395 | 1,255 | ||||||
|
| |||||||
| 17,480 | ||||||||
|
| |||||||
| Telecommunication Services—16.2% | ||||||||
AT&T, Inc. (United States) | 111,790 | 4,540 | ||||||
BCE, Inc. (Canada) | 22,445 | 1,036 | ||||||
BT Group plc (United Kingdom) | 244,810 | 1,234 | ||||||
Deutsche Telekom AG Registered Shares (Germany) | 117,450 | 1,969 | ||||||
Nippon Telegraph & Telephone Corp. ADR (Japan) | 37,225 | 1,705 | ||||||
Singapore Telecommunications Ltd. (Singapore) | 631,100 | 1,846 | ||||||
TELUS Corp. (Canada) | 43,810 | 1,446 | ||||||
Verizon Communications, Inc. (United States) | 56,844 | 2,955 | ||||||
Vodafone Group plc Sponsored ADR (United Kingdom) | 102,206 | 2,979 | ||||||
|
| |||||||
| 19,710 | ||||||||
|
| |||||||
| SHARES | VALUE | |||||||
| Utilities—37.0% | ||||||||
ALLETE, Inc. (United States) | 20,270 | $ | 1,209 | |||||
American Electric Power Co., Inc. (United States) | 22,185 | 1,425 | ||||||
American Water Works Co., Inc. (United States) | 33,940 | 2,540 | ||||||
APA Group (Australia) | 171,330 | 1,122 | ||||||
Aqua America, Inc. (United States) | 36,735 | 1,120 | ||||||
Atmos Energy Corp. (United States) | 23,745 | 1,768 | ||||||
Black Hills Corp. (United States) | 19,950 | 1,221 | ||||||
CMS Energy Corp. (United States) | 41,230 | 1,732 | ||||||
Dominion Resources, Inc. (United States) | 20,960 | 1,557 | ||||||
DTE Energy Co. (United States) | 17,455 | 1,635 | ||||||
Edison International (United States) | 21,220 | 1,533 | ||||||
Emera, Inc. (Canada) | 24,965 | 900 | ||||||
Eversource Energy (United States) | 26,635 | 1,443 | ||||||
Hera SpA (Italy) | 407,855 | 1,099 | ||||||
Iberdrola SA (Spain) | 216,935 | 1,475 | ||||||
National Grid plc (United Kingdom) | 245,940 | 3,481 | ||||||
NextEra Energy, Inc. (United States) | 37,120 | 4,541 | ||||||
NiSource, Inc. (United States) | 50,620 | 1,220 | ||||||
ONE Gas, Inc. (United States) | 15,225 | 942 | ||||||
Scottish & Southern Energy plc (United Kingdom) | 62,110 | 1,262 | ||||||
Sempra Energy (United States) | 28,565 | 3,062 | ||||||
SevernTrent plc (United Kingdom) | 38,770 | 1,259 | ||||||
Snam Rete Gas SpA (Italy) | 196,995 | 1,092 | ||||||
South Jersey Industries, Inc. (United States) | 31,611 | 934 | ||||||
Spire, Inc. (United States) | 21,300 | 1,358 | ||||||
Vectren Corp. (United States) | 29,550 | 1,483 | ||||||
Veolia Environnement SA (France) | 52,770 | 1,215 | ||||||
WEC Energy Group, Inc. (United States) | 23,315 | 1,396 | ||||||
|
| |||||||
| 45,024 | ||||||||
| TOTAL COMMON STOCKS (Identified Cost $112,457) | 120,787 | |||||||
| TOTAL LONG TERM INVESTMENTS—99.1% | ||||||||
| (Identified Cost $112,457) | 120,787 | |||||||
| TOTAL INVESTMENTS—99.1% (Identified Cost $112,457) | 120,787 | (1) | ||||||
Other assets and liabilities, net—0.9% |
| 1,033 | ||||||
|
| |||||||
| NET ASSETS—100.0% | $ | 121,820 | ||||||
|
| |||||||
Abbreviation:
| ADR | American Depositary Receipt |
Footnote Legend:
| (1) | Federal Income Tax Information: For tax information at September 30, 2016, see Note 10 Federal Income Tax Information in the Notes to Financial Statements. |
| (2) | Security exempt from registration under Rule 144A of the Securities Act of 1933. These securities may be resold in transactions exempt from registration, normally to qualified institutional buyers. At September 30, 2016, these securities amounted to a value of $1,258 or 1.0% of net assets. |
| Country Weightings (Unaudited)† | ||||
United States | 53 | % | ||
Canada | 14 | |||
United Kingdom | 8 | |||
Australia | 6 | |||
Spain | 5 | |||
Italy | 4 | |||
France | 2 | |||
Other | 8 | |||
Total | 100 | % | ||
† % of total investments as of September 30, 2016 |
| |||
The following table provides a summary of inputs used to value the Fund’s investments as of September 30, 2016 (See Security Valuation Note 2A in the Notes to Financial Statements):
| Total Value at September 30, 2016 | Level 1 Quoted Prices | Level 2 Significant Observable Inputs | ||||||||||
Equity Securities: | ||||||||||||
Common Stocks | $ | 120,787 | $ | 109,926 | $ | 10,861 | ||||||
|
|
|
|
|
| |||||||
Total Investments | $ | 120,787 | $ | 109,926 | $ | 10,861 | ||||||
|
|
|
|
|
| |||||||
There are no Level 3 (significant unobservable inputs) priced securities.
There were no transfers between Level 1 and Level 2 related to securities held at September 30, 2016.
Security abbreviation definitions are located under the Key Investment Terms starting on page 4.
See Notes to Financial Statements
43
Table of Contents
VIRTUS GLOBAL OPPORTUNITIES FUND
SCHEDULE OF INVESTMENTS
SEPTEMBER 30, 2016
($ reported in thousands)
| SHARES | VALUE | |||||||
| COMMON STOCKS—99.6% | ||||||||
| Consumer Discretionary—15.8% | ||||||||
Alimentation Couche -Tard, Inc. Class B (Canada) | 72,865 | $ | 3,531 | |||||
Amazon.com, Inc. (United States)(2) | 8,142 | 6,817 | ||||||
Dollar Tree, Inc. (United States)(2) | 26,984 | 2,130 | ||||||
Naspers Ltd. Class N (South Africa) | 14,991 | 2,595 | ||||||
NIKE, Inc. Class B (United States) | 63,465 | 3,341 | ||||||
Priceline Group, Inc. (The) (United States)(2) | 2,496 | 3,673 | ||||||
Starbucks Corp. (United States) | 59,665 | 3,230 | ||||||
TJX Cos., Inc. (The) (United States) | 35,486 | 2,654 | ||||||
|
| |||||||
| 27,971 | ||||||||
|
| |||||||
| Consumer Staples—30.4% | ||||||||
Altria Group, Inc. (United States) | 112,712 | 7,127 | ||||||
Anheuser-Busch InBev N.V. (Belgium) | 27,315 | 3,578 | ||||||
British American Tobacco plc (United Kingdom) | 125,004 | 7,988 | ||||||
Casey’s General Stores, Inc. (United States) | 18,586 | 2,233 | ||||||
Coca-Cola Co. (The) (United States) | 114,363 | 4,840 | ||||||
Nestle S.A. Registered Shares (Switzerland) | 55,744 | 4,392 | ||||||
Philip Morris International, Inc. (United States) | 71,678 | 6,968 | ||||||
Reckitt Benckiser Group plc (United Kingdom) | 75,771 | 7,135 | ||||||
Reynolds American, Inc. (United States) | 93,886 | 4,427 | ||||||
SABMiller plc (United Kingdom) | 15,939 | 929 | ||||||
Unilever N.V. CVA (Netherlands) | 92,280 | 4,258 | ||||||
|
| |||||||
| 53,875 | ||||||||
|
| |||||||
| Financials—17.0% | ||||||||
American Tower Corp. (United States) | 30,905 | 3,502 | ||||||
Berkshire Hathaway, Inc. Class B (United States)(2) | 35,004 | 5,057 | ||||||
Housing Development Finance Corp. (India) | 263,341 | 5,524 | ||||||
Housing Development Finance Corp. Bank Ltd. (India) | 339,815 | 6,507 | ||||||
Housing Development Finance Corp. Bank Ltd. ADR (India) | 4,996 | 359 | ||||||
M&T Bank Corp. (United States) | 23,695 | 2,751 | ||||||
Wells Fargo & Co. (United States) | 147,596 | 6,536 | ||||||
|
| |||||||
| 30,236 | ||||||||
|
| |||||||
| Health Care—12.4% | ||||||||
Abbott Laboratories (United States) | 77,816 | 3,291 | ||||||
Bristol-Myers Squibb Co. (United States) | 43,288 | 2,334 | ||||||
| SHARES | VALUE | |||||||
| Health Care—continued | ||||||||
Celgene Corp. (United States)(2) | 35,138 | $ | 3,673 | |||||
Medtronic plc (United States) | 36,027 | 3,113 | ||||||
Roche Holding AG (Switzerland) | 20,750 | 5,147 | ||||||
UnitedHealth Group, Inc. (United States) | 31,754 | 4,446 | ||||||
|
| |||||||
| 22,004 | ||||||||
|
| |||||||
| Information Technology—22.4% | ||||||||
Alibaba Group Holding Ltd. Sponsored ADR (China)(2) | 26,740 | 2,829 | ||||||
Alphabet, Inc. Class C (United States)(2) | 9,974 | 7,753 | ||||||
Cognizant Technology Solutions Corp. Class A (United States)(2) | 57,843 | 2,760 | ||||||
Facebook, Inc. Class A (United States)(2) | 21,184 | 2,717 | ||||||
MasterCard, Inc. Class A (United States) | 69,785 | 7,102 | ||||||
PayPal Holdings, Inc. (United States)(2) | 85,113 | 3,487 | ||||||
SAP SE (Germany) | 45,853 | 4,168 | ||||||
Tencent Holdings Ltd. (China) | 81,417 | 2,264 | ||||||
Visa, Inc. Class A (United States) | 81,651 | 6,752 | ||||||
|
| |||||||
| 39,832 | ||||||||
|
| |||||||
| Materials—1.6% | ||||||||
Martin Marietta Materials, Inc. (United States) | 15,786 | 2,827 | ||||||
| TOTAL COMMON STOCKS (Identified Cost $135,196) | 176,745 | |||||||
| TOTAL LONG TERM INVESTMENTS—99.6% | ||||||||
| (Identified Cost $135,196) | 176,745 | |||||||
| TOTAL INVESTMENTS—99.6% (Identified Cost $135,196) | 176,745 | (1) | ||||||
Other assets and liabilities, net—0.4% |
| 706 | ||||||
|
| |||||||
| NET ASSETS—100.0% | $ | 177,451 | ||||||
|
| |||||||
Abbreviation:
| ADR | American Depositary Receipt |
Footnote Legend:
| (1) | Federal Income Tax Information: For tax information at September 30, 2016, see Note 10 Federal Income Tax Information in the Notes to Financial Statements. |
| (2) | Non-income producing. |
| Country Weightings (Unaudited)† | ||||
United States | 65 | % | ||
United Kingdom | 9 | |||
India | 7 | |||
Switzerland | 6 | |||
Netherlands | 3 | |||
Germany | 2 | |||
Belgium | 2 | |||
Other | 6 | |||
Total | 100 | % | ||
† % of total investments as of September 30, 2016 |
| |||
The following table provides a summary of inputs used to value the Fund’s investments as of September 30, 2016 (See Security Valuation Note 2A in the Notes to Financial Statements):
| Total Value at September 30, 2016 | Level 1 Quoted Prices | Level 2 Significant Observable Inputs | ||||||||||
Equity Securities: | ||||||||||||
Common Stocks | $ | 176,745 | $ | 162,451 | $ | 14,294 | ||||||
|
|
|
|
|
| |||||||
Total Investments | $ | 176,745 | $ | 162,451 | $ | 14,294 | ||||||
|
|
|
|
|
| |||||||
There are no Level 3 (significant unobservable inputs) priced securities.
There were no transfers between Level 1 and Level 2 related to securities held at September 30, 2016.
Security abbreviation definitions are located under the Key Investment Terms starting on page 4.
See Notes to Financial Statements
44
Table of Contents
VIRTUS GLOBAL REAL ESTATE SECURITIES FUND
SCHEDULE OF INVESTMENTS
SEPTEMBER 30, 2016
($ reported in thousands)
| SHARES | VALUE | |||||||
| COMMON STOCKS—97.3% | ||||||||
| Australia—5.0% | ||||||||
Dexus Property Group | 236,339 | $ | 1,661 | |||||
GPT Group (The) | 209,900 | 818 | ||||||
GPT Group (The) – In Specie(2)(3)(5) | 13,566 | — | ||||||
National Storage REIT | 807,000 | 995 | ||||||
Scentre Group | 898,389 | 3,243 | ||||||
Westfield Corp. | 401,350 | 3,003 | ||||||
|
| |||||||
| 9,720 | ||||||||
|
| |||||||
| Austria—0.4% | ||||||||
Atrium European Real Estate Ltd. | 168,000 | 749 | ||||||
|
| |||||||
| Canada—3.2% | ||||||||
Allied Properties Real Estate Investment Trust | 70,385 | 2,021 | ||||||
Canadian Real Estate Investment Trust | 30,475 | 1,093 | ||||||
First Capital Realty, Inc. | 43,880 | 735 | ||||||
RioCan Real Estate Investment Trust | 115,362 | 2,394 | ||||||
|
| |||||||
| 6,243 | ||||||||
|
| |||||||
| Finland—0.9% | ||||||||
Citycon OYJ | 695,232 | 1,770 | ||||||
|
| |||||||
| France—1.8% | ||||||||
Klepierre | 54,120 | 2,480 | ||||||
Mercialys SA | 45,150 | 1,086 | ||||||
|
| |||||||
| 3,566 | ||||||||
|
| |||||||
| Germany—5.0% | ||||||||
ADO Properties SA(4) | 61,542 | 2,461 | ||||||
Deutsche Wohnen AG | 56,075 | 2,038 | ||||||
LEG Immobilien AG | 9,304 | 891 | ||||||
TLG Immobilien AG | 44,400 | 1,002 | ||||||
Vonovia SE | 90,848 | 3,440 | ||||||
|
| |||||||
| 9,832 | ||||||||
|
| |||||||
| Hong Kong—1.8% | ||||||||
Hysan Development Co. Ltd. | 106,000 | 499 | ||||||
Link REIT (The) | 425,504 | 3,141 | ||||||
|
| |||||||
| 3,640 | ||||||||
|
| |||||||
| Italy—0.2% | ||||||||
Beni Stabili SpA | 738,062 | 440 | ||||||
|
| |||||||
| Japan—6.9% | ||||||||
GLP J-REIT | 1,127 | 1,501 | ||||||
Hulic Co., Ltd. | 164,900 | 1,685 | ||||||
Industrial & Infrastructure Fund Investment Corp. | 142 | 723 | ||||||
Invincible Investment Corp. | 1,915 | 1,072 | ||||||
Japan Real Estate Investment Corp. | 218 | 1,304 | ||||||
Kenedix Office Investment Corp. | 231 | 1,420 | ||||||
Kenedix Retail REIT Corp. | 375 | 889 | ||||||
| SHARES | VALUE | |||||||
| Japan—continued | ||||||||
LaSalle Logiport REIT(2) | 1,336 | $ | 1,418 | |||||
Nippon Building Fund, Inc. | 217 | 1,375 | ||||||
Nippon Prologis REIT, Inc. | 372 | 941 | ||||||
United Urban Investment Corp. | 688 | 1,251 | ||||||
|
| |||||||
| 13,579 | ||||||||
|
| |||||||
| Mexico—0.4% | ||||||||
PLA Administradora Industrial S de Rl de CV | 60,722 | 101 | ||||||
Prologis Property Mexico SA de CV | 367,800 | 603 | ||||||
|
| |||||||
| 704 | ||||||||
|
| |||||||
| Netherlands—2.5% | ||||||||
Unibail-Rodamco SE | 17,948 | 4,839 | ||||||
|
| |||||||
| Norway—0.6% | ||||||||
Entra ASA(4) | 97,500 | 1,091 | ||||||
|
| |||||||
| Singapore—0.8% | ||||||||
CapitaLand Mall Trust | 432,450 | 689 | ||||||
Global Logistic Properties Ltd. | 649,500 | 896 | ||||||
|
| |||||||
| 1,585 | ||||||||
|
| |||||||
| Spain—1.2% | ||||||||
Axiare Patrimonio SOCIMI SA | 138,689 | 1,836 | ||||||
Hispania Activos Inmobiliarios Socimi SA | 40,318 | 540 | ||||||
|
| |||||||
| 2,376 | ||||||||
|
| |||||||
| Sweden—0.8% | ||||||||
Castellum AB | 104,410 | 1,564 | ||||||
|
| |||||||
| United Kingdom—5.4% | ||||||||
Big Yellow Group plc | 102,728 | 1,038 | ||||||
British Land Co. plc | 148,500 | 1,217 | ||||||
Derwent London plc | 28,910 | 975 | ||||||
Great Portland Estates plc | 65,276 | 535 | ||||||
Hammerson plc | 190,420 | 1,449 | ||||||
Land Securities Group plc | 108,131 | 1,483 | ||||||
Safestore Holdings plc | 213,557 | 1,066 | ||||||
SEGRO plc | 205,690 | 1,210 | ||||||
Unite Group plc (The) | 200,400 | 1,648 | ||||||
|
| |||||||
| 10,621 | ||||||||
|
| |||||||
| United States—60.4% | ||||||||
American Campus Communities, Inc. | 36,738 | 1,869 | ||||||
American Homes 4 Rent Class A | 69,050 | 1,494 | ||||||
Apartment Investment & Management Co. Class A | 29,100 | 1,336 | ||||||
AvalonBay Communities, Inc. | 16,865 | 2,999 | ||||||
Boston Properties, Inc. | 11,328 | 1,544 | ||||||
Brixmor Property Group, Inc. | 118,633 | 3,297 | ||||||
Coresite Realty Corp. | 28,300 | 2,095 | ||||||
Cousins Properties, Inc. | 111,400 | 1,163 | ||||||
CubeSmart | 124,775 | 3,401 | ||||||
CyrusOne, Inc. | 19,000 | 904 | ||||||
DCT Industrial Trust, Inc. | 96,298 | 4,675 | ||||||
| SHARES | VALUE | |||||||
| United States—continued | ||||||||
Digital Realty Trust, Inc. | 51,150 | $ | 4,968 | |||||
Douglas Emmett, Inc. | 85,695 | 3,139 | ||||||
Duke Realty Corp. | 158,900 | 4,343 | ||||||
Equinix, Inc. | 7,900 | 2,846 | ||||||
Equity Lifestyle Properties, Inc. | 23,746 | 1,833 | ||||||
Equity Residential | 40,815 | 2,626 | ||||||
Essex Property Trust, Inc. | 25,604 | 5,702 | ||||||
Extra Space Storage, Inc. | 39,245 | 3,117 | ||||||
Federal Realty Investment Trust | 19,700 | 3,032 | ||||||
General Growth Properties, Inc. | 105,219 | 2,904 | ||||||
Healthcare Realty Trust, Inc. | 57,321 | 1,952 | ||||||
Healthcare Trust of America, Inc. Class A | 87,800 | 2,864 | ||||||
Highwoods Properties, Inc. | 60,460 | 3,151 | ||||||
Host Hotels & Resorts, Inc. | 77,908 | 1,213 | ||||||
Kilroy Realty Corp. | 60,775 | 4,215 | ||||||
Paramount Group, Inc. | 151,440 | 2,482 | ||||||
Pebblebrook Hotel Trust | 36,509 | 971 | ||||||
Prologis, Inc. | 85,298 | 4,567 | ||||||
Public Storage | 17,022 | 3,798 | ||||||
Regency Centers Corp. | 45,650 | 3,537 | ||||||
RLJ Lodging Trust | 66,550 | 1,400 | ||||||
Simon Property Group, Inc. | 51,231 | 10,605 | ||||||
Store Capital Corp. | 113,672 | 3,350 | ||||||
Sun Communities, Inc. | 35,250 | 2,766 | ||||||
Tanger Factory Outlet Centers | 79,750 | 3,107 | ||||||
Ventas, Inc. | 38,872 | 2,746 | ||||||
Vornado Realty Trust | 48,600 | 4,919 | ||||||
Welltower, Inc. | 21,419 | 1,602 | ||||||
|
| |||||||
| 118,532 | ||||||||
| TOTAL COMMON STOCKS (Identified Cost $172,553) | 190,851 | |||||||
| TOTAL LONG TERM INVESTMENTS—97.3% | ||||||||
| (Identified Cost $172,553) | 190,851 | |||||||
| SHORT-TERM INVESTMENT—1.2% | ||||||||
| Money Market Mutual Fund—1.2% | ||||||||
JPMorgan U.S. Government Money Market Fund – Institutional Shares (seven-day effective yield 0.360%)(6) | 2,293,683 | 2,294 | ||||||
| TOTAL SHORT-TERM INVESTMENT (Identified Cost $2,294) | 2,294 | |||||||
| TOTAL INVESTMENTS—98.5% (Identified Cost $174,847) | 193,145 | (1) | ||||||
Other assets and liabilities, net—1.5% |
| 2,930 | ||||||
|
| |||||||
| NET ASSETS—100.0% | $ | 196,075 | ||||||
|
| |||||||
Abbreviation:
| REIT | Real Estate Investment Trust |
Security abbreviation definitions are located under the Key Investment Terms starting on page 4.
See Notes to Financial Statements
45
Table of Contents
VIRTUS GLOBAL REAL ESTATE SECURITIES FUND
SCHEDULE OF INVESTMENTS (Continued)
SEPTEMBER 30, 2016
($ reported in thousands)
Footnote Legend:
| (1) | Federal Income Tax Information: For tax information at September 30, 2016, see Note 10 Federal Income Tax Information in the Notes to Financial Statements. |
| (2) | Non-income producing. |
| (3) | Illiquid security. |
| (4) | Security exempt from registration under Rule 144A of the Securities Act of 1933. These securities may be resold in transactions exempt from registration, normally to qualified institutional buyers. At September 30, 2016, these securities amounted to a value of $3,552 or 1.8% of net assets. |
| (5) | Security valued at fair value as determined in good faith by or under the direction of the Trustees. This security is disclosed as a level 3 security in the disclosure table located after the Schedule of Investments. |
| (6) | Shares of this fund are publicly offered and its prospectus and annual report are publicly available. |
| Country Weightings (Unaudited)† | ||||
United States | 63 | % | ||
Japan | 7 | |||
United Kingdom | 5 | |||
Germany | 5 | |||
Australia | 5 | |||
Canada | 3 | |||
Netherlands | 3 | |||
Other | 9 | |||
Total | 100 | % | ||
† % of total investments as of September 30, 2016 |
| |||
The following table provides a summary of inputs used to value the Fund’s investments as of September 30, 2016 (See Security Valuation Note 2A in the Notes to Financial Statements):
| Total Value at September 30, 2016 | Level 1 Quoted Prices | Level 2 Significant Observable Inputs | Level 3 Significant Unobservable Inputs | |||||||||||||
Equity Securities: | ||||||||||||||||
Common Stocks | $ | 190,851 | $ | 162,328 | $ | 28,523 | $ | 0 | * | |||||||
Short-Term Investments | 2,294 | 2,294 | — | — | ||||||||||||
|
|
|
|
|
|
|
| |||||||||
Total Investments | $ | 193,145 | $ | 164,622 | $ | 28,523 | $ | 0 | * | |||||||
|
|
|
|
|
|
|
| |||||||||
| * | Includes internally fair valued security currently priced at zero ($0). |
There were no transfers between Level 1 and Level 2 related to securities held at September 30, 2016.
See Notes to Financial Statements
46
Table of Contents
VIRTUS GREATER EUROPEAN OPPORTUNITIES FUND
SCHEDULE OF INVESTMENTS
SEPTEMBER 30, 2016
($ reported in thousands)
| SHARES | VALUE | |||||||
| PREFERRED STOCK—0.5% | ||||||||
| Health Care—0.5% | ||||||||
Grifols SA Class B | 7,005 | $ | 112 | |||||
| TOTAL PREFERRED STOCK (Identified Cost $118) | 112 | |||||||
| COMMON STOCKS—94.8% | ||||||||
| Consumer Discretionary—12.0% | ||||||||
Domino’s Pizza Group plc (United Kingdom) | 75,080 | 364 | ||||||
Hermes International SA (France) | 1,477 | 601 | ||||||
Paddy Power Betfair plc (Ireland) | 3,451 | 390 | ||||||
Persimmon plc (United Kingdom) | 4,849 | 114 | ||||||
Priceline Group, Inc. (The) (United States)(2) | 678 | 998 | ||||||
Sodexo SA (France) | 1,982 | 236 | ||||||
|
| |||||||
| 2,703 | ||||||||
|
| |||||||
| Consumer Staples—39.8% | ||||||||
Anheuser-Busch InBev N.V. (Belgium) | 4,977 | 652 | ||||||
British American Tobacco plc (United Kingdom) | 22,801 | 1,457 | ||||||
Chocoladefabrike Lindt & Spruengli AG (Switzerland) | 43 | 249 | ||||||
Diageo plc (United Kingdom) | 9,152 | 262 | ||||||
Heineken N.V. (Netherlands) | 5,091 | 448 | ||||||
Imperial Brands plc (United Kingdom) | 13,922 | 717 | ||||||
L’Oreal SA (France) | 2,038 | 385 | ||||||
Nestle S.A. Registered Shares (Switzerland) | 13,509 | 1,064 | ||||||
Pernod-Ricard SA (France) | 2,410 | 285 | ||||||
Philip Morris International, Inc. (United States) | 11,197 | 1,089 | ||||||
Reckitt Benckiser Group plc (United Kingdom) | 11,936 | 1,124 | ||||||
SABMiller plc (United Kingdom) | 3,775 | 220 | ||||||
Unilever N.V. CVA (Netherlands) | 22,373 | 1,032 | ||||||
|
| |||||||
| 8,984 | ||||||||
|
| |||||||
| Financials—4.8% | ||||||||
ABN AMRO Group N.V. CVA (Netherlands)(3) | 11,315 | 234 | ||||||
Lloyds Banking Group plc (United Kingdom) | 147,058 | 104 | ||||||
Reinet Investments SCA (Luxembourg) | 7,486 | 156 | ||||||
Svenska Handelsbanken AB Class A (Sweden) | 17,841 | 245 | ||||||
UBS Group AG Registered Shares (Switzerland) | 24,847 | 338 | ||||||
|
| |||||||
| 1,077 | ||||||||
|
| |||||||
| Health Care—15.1% | ||||||||
Coloplast A/S Class B (Denmark) | 4,636 | 360 | ||||||
Essilor International SA (France) | 4,321 | 557 | ||||||
Fresenius Medical Care AG & Co. KGaA (Germany) | 6,054 | 529 | ||||||
Grifols SA (Spain) | 20,053 | 432 | ||||||
Novo Nordisk A/S Class B (Denmark) | 12,690 | 527 | ||||||
Roche Holding AG (Switzerland) | 4,017 | 997 | ||||||
|
| |||||||
| 3,402 | ||||||||
|
| |||||||
| SHARES | VALUE | |||||||
| Industrials—8.4% | ||||||||
Aena SA (Spain)(3) | 3,082 | $ | 455 | |||||
Bureau Veritas SA (France) | 16,141 | 346 | ||||||
DCC plc (Ireland) | 2,540 | 231 | ||||||
DKSH Holding AG (Switzerland) | 3,513 | 258 | ||||||
Flughafen Zuerich AG (Switzerland) | 1,880 | 367 | ||||||
Vinci SA (France) | 3,030 | 232 | ||||||
|
| |||||||
| 1,889 | ||||||||
|
| |||||||
| Information Technology—9.5% | ||||||||
Accenture plc Class A (United States) | 5,652 | 691 | ||||||
Amadeus IT Holding SA Class A (Spain) | 8,790 | 439 | ||||||
SAP SE (Germany) | 11,127 | 1,011 | ||||||
|
| |||||||
| 2,141 | ||||||||
|
| |||||||
| Materials—4.1% | ||||||||
Air Liquide SA (France) | 4,910 | 527 | ||||||
HeidelbergCement AG (Germany) | 2,098 | 198 | ||||||
Randgold Resources Ltd. (United Kingdom) | 1,143 | 115 | ||||||
Randgold Resources Ltd. ADR (United Kingdom) | 900 | 90 | ||||||
|
| |||||||
| 930 | ||||||||
|
| |||||||
| Real Estate—1.1% | ||||||||
Unibail-Rodamco SE (Netherlands) | 969 | 261 | ||||||
| TOTAL COMMON STOCKS (Identified Cost $17,439) | 21,387 | |||||||
| TOTAL LONG TERM INVESTMENTS—95.3% | ||||||||
| (Identified Cost $17,557) | 21,499 | |||||||
| SECURITIES LENDING COLLATERAL—0.0% | ||||||||
INVESCO Trust Short-Term Investments Liquid Assets Portfolio (The) – Institutional Shares (seven-day effective yield 0.390%) (United States)(4)(5) | 14,872 | 15 | ||||||
| TOTAL SECURITIES LENDING COLLATERAL (Identified Cost $15) | 15 | |||||||
| SHORT-TERM INVESTMENT—0.5% | ||||||||
| Money Market Mutual Fund—0.5% | ||||||||
JPMorgan U.S. Government Money Market Fund – Institutional Shares (seven-day effective yield 0.360%)(4) | 110,821 | 111 | ||||||
| TOTAL SHORT-TERM INVESTMENT (Identified Cost $111) | 111 | |||||||
| TOTAL INVESTMENTS—95.8% (Identified Cost $17,683) | 21,625 | (1) | ||||||
Other assets and liabilities, net—4.2% |
| 924 | ||||||
|
| |||||||
| NET ASSETS—100.0% | $ | 22,549 | ||||||
|
| |||||||
Abbreviation:
| ADR | American Depositary Receipt |
Footnote Legend:
| (1) | Federal Income Tax Information: For tax information at September 30, 2016, see Note 10 Federal Income Tax Information in the Notes to Financial Statements. |
| (2) | Non-income producing. |
| (3) | Security exempt from registration under Rule 144A of the Securities Act of 1933. These securities may be resold in transactions exempt from registration, normally to qualified institutional buyers. At September 30, 2016, these securities amounted to a value of $689 or 3.1% of net assets. |
| (4) | Shares of this fund are publicly offered and its prospectus and annual report are publicly available. |
| (5) | Represents security purchased with cash collateral received for securities on loan. |
| Country Weightings (Unaudited)† | ||||
United Kingdom | 21 | % | ||
Switzerland | 15 | |||
France | 15 | |||
United States | 13 | |||
Netherlands | 9 | |||
Germany | 8 | |||
Spain | 7 | |||
Other | 12 | |||
Total | 100 | % | ||
† % of total investments as of September 30, 2016 |
| |||
The following table provides a summary of inputs used to value the Fund’s investments as of September 30, 2016 (See Security Valuation Note 2A in the Notes to Financial Statements):
| Total Value at September 30, 2016 | Level 1 Quoted Prices | |||||||
Equity Securities: | ||||||||
Common Stocks | $ | 21,387 | $ | 21,387 | ||||
Preferred Stock | 112 | 112 | ||||||
Securities Lending Collateral | 15 | 15 | ||||||
Short-Term Investments | 111 | 111 | ||||||
|
|
|
| |||||
Total Investments | $ | 21,625 | $ | 21,625 | ||||
|
|
|
| |||||
There are no Level 2 (significant observable inputs) or Level 3 (significant unobservable inputs) priced securities.
There were no transfers between Level 1 and Level 2 related to securities held at September 30, 2016.
Security abbreviation definitions are located under the Key Investment Terms starting on page 4.
See Notes to Financial Statements
47
Table of Contents
VIRTUS INTERNATIONAL EQUITY FUND
SCHEDULE OF INVESTMENTS
SEPTEMBER 30, 2016
($ reported in thousands)
| SHARES | VALUE | |||||||
| COMMON STOCKS—90.4% | ||||||||
| Consumer Discretionary—17.3% | ||||||||
Ashtead Group plc (United Kingdom) | 7,050 | $ | 116 | |||||
Bridgestone Corp. (Japan) | 2,905 | 107 | ||||||
Ctrip.Com International Ltd. ADR (China)(2) | 2,120 | 99 | ||||||
Fuji Heavy Industries Ltd. (Japan) | 2,875 | 108 | ||||||
RELX plc (United Kingdom) | 7,245 | 137 | ||||||
Sony Corp. Sponsored ADR (Japan) | 4,675 | 155 | ||||||
WPP plc (United Kingdom) | 6,170 | 145 | ||||||
|
| |||||||
| 867 | ||||||||
|
| |||||||
| Consumer Staples—8.9% | ||||||||
British American Tobacco plc (United Kingdom) | 2,345 | 150 | ||||||
Heineken N.V. (Netherlands) | 1,600 | 140 | ||||||
Marine Harvest ASA Sponsored ADR (Norway) | 8,750 | 157 | ||||||
|
| |||||||
| 447 | ||||||||
|
| |||||||
| Energy—5.1% | ||||||||
Statoil ASA (Norway) | 7,655 | 128 | ||||||
Technip SA (France) | 2,070 | 127 | ||||||
|
| |||||||
| 255 | ||||||||
|
| |||||||
| Financials—7.5% | ||||||||
American International Group, Inc. (United States) | 2,215 | 131 | ||||||
DBS Group Holdings Ltd. (Singapore) | 8,895 | 101 | ||||||
ORIX Corp. (Japan) | 9,885 | 146 | ||||||
|
| |||||||
| 378 | ||||||||
|
| |||||||
| Health Care—8.8% | ||||||||
Allergan plc (Ireland)(2) | 795 | 183 | ||||||
Icon plc (Ireland)(2) | 1,550 | 120 | ||||||
Shire plc ADR (United Kingdom) | 720 | 140 | ||||||
|
| |||||||
| 443 | ||||||||
|
| |||||||
| SHARES | VALUE | |||||||
| Industrials—8.2% | ||||||||
Airbus Group SE (France) | 1,985 | $ | 120 | |||||
IMAX Corp. (Canada)(2) | 4,055 | 117 | ||||||
Nidec Corp. (Japan) | 1,890 | 175 | ||||||
|
| |||||||
| 412 | ||||||||
|
| |||||||
| Information Technology—13.5% | ||||||||
Broadcom Ltd. (Singapore) | 835 | 144 | ||||||
Check Point Software Technologies Ltd. (Israel)(2) | 1,305 | 101 | ||||||
NXP Semiconductors NV (Netherlands)(2) | 1,390 | 142 | ||||||
SAP SE Sponsored ADR (Germany) | 1,685 | 154 | ||||||
Tencent Holdings Ltd. (China) | 4,955 | 138 | ||||||
|
| |||||||
| 679 | ||||||||
|
| |||||||
| Materials—7.7% | ||||||||
Agnico Eagle Mines Ltd. (Canada) | 3,785 | 205 | ||||||
Randgold Resources Ltd. (United Kingdom) | 1,780 | 180 | ||||||
|
| |||||||
| 385 | ||||||||
|
| |||||||
| Real Estate—2.7% | ||||||||
Unibail-Rodamco SE (Netherlands) | 500 | 135 | ||||||
|
| |||||||
| Telecommunication Services—8.4% | ||||||||
KDDI Corp. (Japan) | 5,315 | 165 | ||||||
Nippon Telegraph & Telephone Corp. ADR (Japan) | 2,640 | 121 | ||||||
Spark New Zealand Ltd. (New Zealand) | 51,296 | 135 | ||||||
|
| |||||||
| 421 | ||||||||
|
| |||||||
| SHARES | VALUE | |||||||
| Utilities—2.3% | ||||||||
Korea Electric Power Corp. (South Korea) | 2,330 | $ | 114 | |||||
| TOTAL COMMON STOCKS (Identified Cost $3,776) | 4,536 | |||||||
| TOTAL LONG TERM INVESTMENTS—90.4% | ||||||||
| (Identified Cost $3,776) | 4,536 | |||||||
| TOTAL INVESTMENTS—90.4% (Identified Cost $3,776) | 4,536 | (1) | ||||||
Other assets and liabilities, net—9.6% |
| 483 | ||||||
|
| |||||||
| NET ASSETS—100.0% | $ | 5,019 | ||||||
|
| |||||||
Abbreviation:
| ADR | American Depositary Receipt |
Footnote Legend:
| (1) | Federal Income Tax Information: For tax information at September 30, 2016, see Note 10 Federal Income Tax Information in the Notes to Financial Statements. |
| (2) | Non-income producing. |
| Country Weightings (Unaudited)† | ||||
Japan | 22 | % | ||
United Kingdom | 19 | |||
Netherlands | 9 | |||
Canada | 7 | |||
Ireland | 7 | |||
Norway | 6 | |||
France | 5 | |||
Other | 25 | |||
Total | 100 | % | ||
† % of total investments as of September 30, 2016 |
| |||
The following table provides a summary of inputs used to value the Fund’s investments as of September 30, 2016 (See Security Valuation Note 2A in the Notes to Financial Statements):
| Total Value at September 30, 2016 | Level 1 Quoted Prices | Level 2 Significant Observable Inputs | ||||||||||
Equity Securities: | ||||||||||||
Common Stocks | $ | 4,536 | $ | 3,348 | $ | 1,188 | ||||||
|
|
|
|
|
| |||||||
Total Investments | $ | 4,536 | $ | 3,348 | $ | 1,188 | ||||||
|
|
|
|
|
| |||||||
There are no Level 3 (significant unobservable inputs) priced securities.
There were no transfers between Level 1 and Level 2 related to securities held at September 30, 2016.
Security abbreviation definitions are located under the Key Investment Terms starting on page 4.
See Notes to Financial Statements
48
Table of Contents
VIRTUS INTERNATIONAL REAL ESTATE SECURITIES FUND
SCHEDULE OF INVESTMENTS
SEPTEMBER 30, 2016
($ reported in thousands)
| SHARES | VALUE | |||||||
| COMMON STOCKS—97.5% | ||||||||
| Australia—13.1% | ||||||||
Dexus Property Group | 107,518 | $ | 756 | |||||
GPT Group (The) | 108,300 | 422 | ||||||
GPT Group (The) – In | 588,920 | — | ||||||
National Storage REIT | 291,000 | 359 | ||||||
Scentre Group | 422,171 | 1,524 | ||||||
Westfield Corp. | 203,473 | 1,522 | ||||||
|
| |||||||
| 4,583 | ||||||||
|
| |||||||
| Austria—0.6% | ||||||||
Atrium European Real Estate Ltd. | 44,000 | 196 | ||||||
|
| |||||||
| Canada—8.1% | ||||||||
Allied Properties Real Estate Investment Trust | 31,565 | 907 | ||||||
Canadian Real Estate Investment Trust | 13,695 | 491 | ||||||
First Capital Realty, Inc. | 20,205 | 338 | ||||||
RioCan Real Estate Investment Trust | 53,550 | 1,111 | ||||||
|
| |||||||
| 2,847 | ||||||||
|
| |||||||
| Finland—2.5% | ||||||||
Citycon OYJ | 349,291 | 889 | ||||||
|
| |||||||
| France—4.8% | ||||||||
Klepierre | 25,956 | 1,190 | ||||||
Mercialys SA | 21,200 | 510 | ||||||
|
| |||||||
| 1,700 | ||||||||
|
| |||||||
| Germany—11.0% | ||||||||
ADO Properties SA(4) | 15,322 | 613 | ||||||
Deutsche Wohnen AG | 26,475 | 962 | ||||||
LEG Immobilien AG | 4,511 | 432 | ||||||
TLG Immobilien AG | 8,000 | 180 | ||||||
Vonovia SE | 43,945 | 1,664 | ||||||
|
| |||||||
| 3,851 | ||||||||
|
| |||||||
| Hong Kong—5.1% | ||||||||
Hysan Development Co. Ltd. | 55,000 | 259 | ||||||
Link REIT (The) | 206,441 | 1,524 | ||||||
|
| |||||||
| 1,783 | ||||||||
|
| |||||||
| Italy—0.5% | ||||||||
Beni Stabili SpA | 285,164 | 170 | ||||||
|
| |||||||
| Japan—18.8% | ||||||||
GLP J-REIT | 527 | 702 | ||||||
Hulic Co., Ltd. | 76,500 | 782 | ||||||
Industrial & Infrastructure Fund Investment Corp. | 76 | 387 | ||||||
Invincible Investment Corp. | 965 | 540 | ||||||
Japan Real Estate Investment Corp. | 111 | 664 | ||||||
Kenedix Office Investment Corp. | 111 | 682 | ||||||
Kenedix Retail REIT Corp. | 159 | 377 | ||||||
LaSalle Logiport REIT(2) | 630 | 669 | ||||||
Nippon Building Fund, Inc. | 111 | 703 | ||||||
| SHARES | VALUE | |||||||
| Japan—continued | ||||||||
Nippon Prologis REIT, Inc. | 190 | $ | 480 | |||||
United Urban Investment Corp. | 332 | 604 | ||||||
|
| |||||||
| 6,590 | ||||||||
|
| |||||||
| Mexico—1.2% | ||||||||
PLA Administradora Industrial S de Rl de CV | 49,852 | 83 | ||||||
Prologis Property Mexico SA de CV | 207,200 | 340 | ||||||
|
| |||||||
| 423 | ||||||||
|
| |||||||
| Netherlands—6.4% | ||||||||
Unibail-Rodamco SE | 8,260 | 2,227 | ||||||
|
| |||||||
| Norway—1.8% | ||||||||
Entra ASA(4) | 58,000 | 649 | ||||||
|
| |||||||
| Singapore—2.5% | ||||||||
CapitaLand Mall Trust | 211,650 | 337 | ||||||
Global Logistic Properties Ltd. | 381,000 | 526 | ||||||
|
| |||||||
| 863 | ||||||||
|
| |||||||
| Spain—3.4% | ||||||||
Axiare Patrimonio SOCIMI SA | 68,858 | 912 | ||||||
Hispania Activos Inmobiliarios Socimi SA | 20,327 | 272 | ||||||
|
| |||||||
| 1,184 | ||||||||
|
| |||||||
| Sweden—2.1% | ||||||||
Castellum AB | 50,199 | 752 | ||||||
|
| |||||||
| United Kingdom—15.6% | ||||||||
Big Yellow Group plc | 50,288 | 508 | ||||||
British Land Co. plc | 70,605 | 579 | ||||||
Derwent London plc | 14,246 | 480 | ||||||
Great Portland Estates plc | 30,018 | 246 | ||||||
Hammerson plc | 103,209 | 785 | ||||||
Land Securities Group plc | 61,885 | 849 | ||||||
Safestore Holdings plc | 108,376 | 541 | ||||||
SEGRO plc | 109,057 | 642 | ||||||
Unite Group plc (The) | 101,700 | 836 | ||||||
|
| |||||||
| 5,466 | ||||||||
| TOTAL COMMON STOCKS (Identified Cost $25,038) | 34,173 | |||||||
| TOTAL LONG TERM INVESTMENTS—97.5% | ||||||||
| (Identified Cost $25,038) | 34,173 | |||||||
| TOTAL INVESTMENTS—97.5% (Identified Cost $25,038) | 34,173 | (1) | ||||||
Other assets and liabilities, net—2.5% |
| 861 | ||||||
|
| |||||||
| NET ASSETS—100.0% | $ | 35,034 | ||||||
|
| |||||||
Abbreviation:
| REIT | Real Estate Investment Trust |
Footnote Legend:
| (1) | Federal Income Tax Information: For tax information at September 30, 2016, see Note 10 Federal Income Tax Information in the Notes to Financial Statements. |
| (2) | Non-income producing. |
| (3) | Illiquid security. |
| (4) | Security exempt from registration under Rule 144A of the Securities Act of 1933. These securities may be resold in transactions exempt from registration, normally to qualified institutional buyers. At September 30, 2016, these securities amounted to a value of $1,262 or 3.6% of net assets. |
| (5) | Security valued at fair value as determined in good faith by or under the direction of the Trustees. This security is disclosed as a level 3 security in the disclosure table located after the Schedule of Investments. |
| Country Weightings (Unaudited)† | ||||
Japan | 19 | % | ||
United Kingdom | 16 | |||
Australia | 14 | |||
Germany | 11 | |||
Canada | 8 | |||
Netherlands | 7 | |||
Hong Kong | 5 | |||
Other | 20 | |||
Total | 100 | % | ||
† % of total investments as of September 30, 2016 |
| |||
Security abbreviation definitions are located under the Key Investment Terms starting on page 4.
See Notes to Financial Statements
49
Table of Contents
VIRTUS INTERNATIONAL REAL ESTATE SECURITIES FUND
SCHEDULE OF INVESTMENTS (Continued)
SEPTEMBER 30, 2016
($ reported in thousands)
The following table provides a summary of inputs used to value the Fund’s investments as of September 30, 2016 (See Security Valuation Note 2A in the Notes to Financial Statements):
| Total Value at September 30, 2016 | Level 1 Quoted Prices | Level 2 Significant Observable Inputs | Level 3 Significant Unobservable Inputs | |||||||||||||
Equity Securities: | ||||||||||||||||
Common Stocks | $ | 34,173 | $ | 20,355 | $ | 13,818 | $ | 0 | * | |||||||
|
|
|
|
|
|
|
| |||||||||
Total Investments | $ | 34,173 | $ | 20,355 | $ | 13,818 | $ | 0 | * | |||||||
|
|
|
|
|
|
|
| |||||||||
| * | Includes internally fair valued security currently priced at zero ($0). |
There were no transfers between Level 1 and Level 2 related to securities held at September 30, 2016.
See Notes to Financial Statements
50
Table of Contents
VIRTUS INTERNATIONAL SMALL-CAP FUND
SCHEDULE OF INVESTMENTS
SEPTEMBER 30, 2016
($ reported in thousands)
| SHARES | VALUE | |||||||
| PREFERRED STOCK—0.1% | ||||||||
| Consumer Discretionary—0.1% | ||||||||
Whirlpool SA (Brazil) | 42,618 | $ | 45 | |||||
| TOTAL PREFERRED STOCK (Identified Cost $34) | 45 | |||||||
| COMMON STOCKS—97.2% | ||||||||
| Consumer Discretionary—6.5% | ||||||||
Goldlion Holdings Ltd. (Hong Kong) | 2,990,600 | 1,197 | ||||||
Pico Far East Holdings Ltd. (Hong Kong) | 4,217,668 | 1,270 | ||||||
REA Group Ltd. (Australia) | 9,220 | 401 | ||||||
|
| |||||||
| 2,868 | ||||||||
|
| |||||||
| Consumer Staples—9.3% | ||||||||
Heineken Malaysia Bhd (Malaysia) | 186,000 | 799 | ||||||
Oldtown Bhd (Malaysia) | 1,797,550 | 866 | ||||||
Premier Marketing PCL (Thailand) | 4,939,029 | 1,283 | ||||||
Wawel SA (Poland) | 4,786 | 1,126 | ||||||
|
| |||||||
| 4,074 | ||||||||
|
| |||||||
| Energy—2.7% | ||||||||
Pason Systems, Inc. (Canada) | 47,500 | 608 | ||||||
Schoeller-Bleckmann Oilfield Equipment AG (Austria) | 8,578 | 568 | ||||||
|
| |||||||
| 1,176 | ||||||||
|
| |||||||
| Financials—12.5% | ||||||||
ARA Asset Management Ltd. (Singapore) | 1,071,716 | 1,063 | ||||||
Euler Hermes SA (France) | 20,000 | 1,700 | ||||||
Euroz Ltd. (Australia) | 2,159,263 | 1,658 | ||||||
Korea Ratings Corp. (South Korea) | 28,868 | 1,083 | ||||||
|
| |||||||
| 5,504 | ||||||||
|
| |||||||
| Health Care—7.8% | ||||||||
Haw Par Corp. Ltd. (Singapore) | 71,719 | 475 | ||||||
Software Service, Inc. (Japan) | 19,853 | 843 | ||||||
WIN-Partners Co. Ltd. (Japan) | 133,010 | 2,125 | ||||||
|
| |||||||
| 3,443 | ||||||||
|
| |||||||
| Industrials—23.6% | ||||||||
AIT Corp. (Japan) | 158,200 | 1,368 | ||||||
Amadeus Fire AG (Germany) | 5,695 | 408 | ||||||
Asiakastieto Group Oyj (Finland) | 57,200 | 1,169 | ||||||
Expeditors International of Washington, Inc. (United States) | 12,200 | 629 | ||||||
Howden Joinery Group plc (United Kingdom) | 109,000 | 611 | ||||||
Interworks, Inc. (Japan) | 35,000 | 394 | ||||||
Lumax International Corp., Ltd. (Taiwan) | 1,464,159 | 2,249 | ||||||
Rotork plc (United Kingdom) | 431,154 | 1,180 | ||||||
| SHARES | VALUE | |||||||
| Industrials—continued | ||||||||
Tegma Gestao Logistica (Brazilcontinued(2) | 624,126 | $ | 1,583 | |||||
WABCO Holdings, Inc. (United States)(2) | 6,850 | 778 | ||||||
|
| |||||||
| 10,369 | ||||||||
|
| |||||||
| Information Technology—25.7% | ||||||||
Alten SA (France) | 11,000 | 769 | ||||||
Auto Trader Group plc (United Kingdom) | 216,200 | 1,136 | ||||||
Autohome, Inc. ADR (China)(2) | 62,200 | 1,508 | ||||||
Bouvet ASA (Norway) | 80,245 | 1,205 | ||||||
carsales.com Ltd. (Australia) | 41,467 | 381 | ||||||
Computer Modelling Group Ltd. (Canada) | 76,500 | 572 | ||||||
Firstlogic, Inc. (Japan) | 37,600 | 589 | ||||||
Kakaku.com Inc. (Japan) | 26,000 | 471 | ||||||
Pro-Ship, Inc. (Japan)(3) | 112,200 | 1,441 | ||||||
Rightmove plc (United Kingdom) | 16,800 | 919 | ||||||
Scout24 AG (Germany)(2) | 57,775 | 1,947 | ||||||
Societe Pour L’informatique Industrielle (France) | 21,070 | 350 | ||||||
|
| |||||||
| 11,288 | ||||||||
|
| |||||||
| Materials—9.1% | ||||||||
KPX Chemical Co. Ltd. (South Korea) | 19,894 | 1,089 | ||||||
Rimoni Industries Ltd. (Israel) | 89,509 | 903 | ||||||
Transpaco Ltd. (South Africa)(6) | 910,699 | 1,792 | ||||||
Victrex plc (United Kingdom) | 11,800 | 240 | ||||||
|
| |||||||
| 4,024 | ||||||||
| TOTAL COMMON STOCKS (Identified Cost $41,436) | 42,746 | |||||||
| TOTAL LONG TERM INVESTMENTS—97.3% | ||||||||
| (Identified Cost $41,470) | 42,791 | |||||||
| SECURITIES LENDING COLLATERAL—0.3% | ||||||||
INVESCO Trust Short-Term Investments Liquid Assets Portfolio (The) – Institutional Shares (seven-day effective yield 0.390%) (United States)(4)(5) | 134,250 | 134 | ||||||
| TOTAL SECURITIES LENDING COLLATERAL (Identified Cost $134) | 134 | |||||||
| TOTAL INVESTMENTS—97.6% (Identified Cost $41,604) | 42,925 | (1) | ||||||
Other assets and liabilities, net—2.4% |
| 1,061 | ||||||
|
| |||||||
| NET ASSETS—100.0% | $ | 43,986 | ||||||
|
| |||||||
Abbreviation:
| ADR | American Depositary Receipt |
Footnote Legend:
| (1) | Federal Income Tax Information: For tax information at September 30, 2016, see Note 10 Federal Income Tax Information in the Notes to Financial Statements. |
| (2) | Non-income producing. |
| (3) | All or a portion of security is on loan. |
| (4) | Represents security purchased with cash collateral received for securities on loan. |
| (5) | Shares of this fund are publicly offered and its prospectus and annual report are publicly available. |
| (6) | Illiquid security. |
| Country Weightings (Unaudited)† | ||||
Japan | 17 | % | ||
United Kingdom | 9 | |||
France | 7 | |||
Australia | 6 | |||
Hong Kong | 6 | |||
Germany | 5 | |||
Taiwan | 5 | |||
Other | 45 | |||
Total | 100 | % | ||
† % of total investments as of September 30, 2016 |
| |||
Security abbreviation definitions are located under the Key Investment Terms starting on page 4.
See Notes to Financial Statements
51
Table of Contents
VIRTUS INTERNATIONAL SMALL-CAP FUND
SCHEDULE OF INVESTMENTS (Continued)
SEPTEMBER 30, 2016
($ reported in thousands)
The following table provides a summary of inputs used to value the Fund’s investments as of September 30, 2016 (See Security Valuation Note 2A in the Notes to Financial Statements):
| Total Value at September 30, 2016 | Level 1 Quoted Prices | Level 2 Significant Observable Inputs | ||||||||||
Equity Securities: | ||||||||||||
Common Stocks | $ | 42,746 | $ | 24,232 | $ | 18,514 | ||||||
Preferred Stock | 45 | 45 | — | |||||||||
Securities Lending | 134 | 134 | — | |||||||||
|
|
|
|
|
| |||||||
Total Investments | $ | 42,925 | $ | 24,411 | $ | 18,514 | ||||||
|
|
|
|
|
| |||||||
There are no Level 3 (significant unobservable inputs) priced securities.
Securities held by the Fund with an end of period value of $2,146 were transferred from Level 1 to Level 2, and securities with an end of period value of $2,530 were transferred from Level 2 to Level 1, based on our valuation procedures for non-U.S. securities.
(See Note 2A in the Notes to Financial Statements for more information.)
See Notes to Financial Statements
52
Table of Contents
VIRTUS INTERNATIONAL WEALTH MASTERS FUND
SCHEDULE OF INVESTMENTS
SEPTEMBER 30, 2016
($ reported in thousands)
| SHARES | VALUE | |||||||
| COMMON STOCKS—99.4% | ||||||||
| Consumer Discretionary—29.6% | ||||||||
Altice NV Class A(2) | 1,929 | $ | 35 | |||||
Autogrill S.p.A | 818 | 7 | ||||||
Autoneum Holding AG | 84 | 23 | ||||||
Axel Springer SE | 527 | 27 | ||||||
Bayerische Motoren Werke AG | 333 | 28 | ||||||
Benesse Holdings, Inc. | 1,420 | 36 | ||||||
Brembo S.p.A | 119 | 7 | ||||||
Brunello Cucinelli S.p.A | 342 | 7 | ||||||
Carnival plc | 918 | 45 | ||||||
Chow Tai Fook Jewellery Group Ltd. | 9,600 | 7 | ||||||
Christian Dior SE | 82 | 15 | ||||||
Compagnie Financiere Richemont SA Registered Shares | 396 | 24 | ||||||
Continental AG | 130 | 27 | ||||||
Crown Resorts Ltd. | 2,123 | 21 | ||||||
CTS Eventim AG & Co. KGaA | 808 | 29 | ||||||
Daily Mail & General Trust plc Class A | 4,452 | 43 | ||||||
De’ Longhi | 288 | 7 | ||||||
Dixons Carphone plc | 8,848 | 42 | ||||||
Domino’s Pizza Enterprises Ltd. | 399 | 22 | ||||||
Don Quijote Holdings Co., Ltd. | 1,050 | 38 | ||||||
Dufry AG(2) | 199 | 25 | ||||||
Dunelm Group plc | 3,718 | 41 | ||||||
Fast Retailing Co., Ltd. | 114 | 37 | ||||||
Fielmann AG | 341 | 28 | ||||||
Forbo Holding AG Registered Shares | 17 | 23 | ||||||
Galaxy Entertainment Group Ltd. | 1,790 | 7 | ||||||
Genting Singapore plc | 13,000 | 7 | ||||||
Geox SPA | 2,845 | 7 | ||||||
Global Brands Group Holding Ltd.(2) | 62,000 | 6 | ||||||
Harvey Norman Holdings Ltd. | 5,577 | 22 | ||||||
Heiwa Corp. | 1,625 | 36 | ||||||
Hennes & Mauritz AB Class B | 376 | 11 | ||||||
Hermes International SA | 35 | 14 | ||||||
Hikari Tsushin, Inc. | 410 | 38 | ||||||
Inditex SA | 421 | 16 | ||||||
Jardine Cycle & Carriage Ltd. | 228 | 7 | ||||||
JCDecaux SA | 429 | 14 | ||||||
Kering | 73 | 15 | ||||||
L’Occitane International SA | 7,000 | 14 | ||||||
Li & Fung Ltd. | 13,700 | 7 | ||||||
Luxottica Group S.p.A | 145 | 7 | ||||||
LVMH Moet Hennessy Louis Vuitton SA | 86 | 15 | ||||||
M6-Metropole Television SA | 812 | 15 | ||||||
Man Wah Holdings Ltd. | 9,400 | 6 | ||||||
Mediaset S.p.A. | 2,264 | 7 | ||||||
Mekonomen AB | 548 | 11 | ||||||
Melco Crown Entertainment Ltd. ADR | 458 | 7 | ||||||
Melco International Development Ltd. | 5,200 | 7 | ||||||
Melia Hotels International SA | 1,245 | 15 | ||||||
Merlin Entertainment plc(3) | 6,796 | 39 | ||||||
MGM China Holdings Ltd. | 4,000 | 7 | ||||||
Moncler SPA | 392 | 7 | ||||||
Nitori Co., Ltd. | 335 | 40 | ||||||
Numericable-SFR | 480 | 14 | ||||||
Ocado Group plc(2)(4) | 12,642 | 43 | ||||||
| SHARES | VALUE | |||||||
| Consumer Discretionary—continued | ||||||||
Plastic Omnium SA | 450 | $ | 15 | |||||
Prada S.p.A | 2,000 | 6 | ||||||
Premier Investments Ltd. | 1,741 | 21 | ||||||
PT Multimedia Servicos de Telecomunicacoes e Multimedia SGPS SA | 534 | 4 | ||||||
Publicis Groupe SA | 192 | 14 | ||||||
Rakuten, Inc. | 2,750 | 36 | ||||||
Royal Caribbean Cruises Ltd. | 84 | 6 | ||||||
Salvatore Ferragamo S.p.A | 290 | 7 | ||||||
Sands China Ltd. | 1,550 | 7 | ||||||
Sankyo Co., Ltd. | 1,075 | 37 | ||||||
Sega Sammy Holdings, Inc. | 2,640 | 38 | ||||||
Seven West Media Ltd. | 40,171 | 23 | ||||||
Shangri-La Asia Ltd. | 6,100 | 7 | ||||||
Shimanura Co., Ltd. | 317 | 38 | ||||||
SJM Holdings Ltd. | 9,200 | 7 | ||||||
Sodexo SA | 124 | 15 | ||||||
Sports Direct International plc(2) | 11,259 | 42 | ||||||
Start Today Co., Ltd. | 2,175 | 37 | ||||||
Steinhoff International Holdings NV | 4,873 | 28 | ||||||
Swatch Group AG (The) | 84 | 24 | ||||||
Techtronics Industries Co., Ltd. | 1,800 | 7 | ||||||
Television Francaise 1 | 1,482 | 14 | ||||||
Tod’s S.p.A | 131 | 7 | ||||||
Universal Entertainment Corp.(2) | 1,310 | 39 | ||||||
Vivendi | 735 | 15 | ||||||
Wynn Macau Ltd. | 3,900 | 6 | ||||||
Yue Yuen Industrial Holdings Ltd. | 1,650 | 7 | ||||||
|
| |||||||
| 1,612 | ||||||||
|
| |||||||
| Consumer Staples—12.7% | ||||||||
AAK AB | 145 | 11 | ||||||
Anheuser-Busch InBev N.V. | 433 | 57 | ||||||
Associated British Foods plc | 1,201 | 40 | ||||||
Axfood AB | 611 | 11 | ||||||
Barry Callebaut AG | 18 | 24 | ||||||
Beiersdorf AG | 296 | 28 | ||||||
Carrefour SA | 559 | 14 | ||||||
Casino Guichard Perrachon SA | 303 | 15 | ||||||
Cosmos Pharmaceutical Corp. | 186 | 40 | ||||||
Dairy Farm International Holdings Ltd. | 1,000 | 7 | ||||||
Davide Campari-Milano S.p.A | 642 | 7 | ||||||
First Resources Ltd. | 5,200 | 7 | ||||||
Golden Agri-Resources Ltd. | 27,000 | 7 | ||||||
Heineken Holding NV | 446 | 36 | ||||||
Henkel AG & KGaA | 238 | 28 | ||||||
Jeronimo Martins SPGS SA | 227 | 4 | ||||||
Kose Corp. | 368 | 38 | ||||||
L’Oreal SA | 78 | 15 | ||||||
Marine Harvest ASA | 342 | 6 | ||||||
MARR SpA | 348 | 7 | ||||||
Metro AG | 926 | 27 | ||||||
Orkla ASA | 604 | 6 | ||||||
Pernod-Ricard SA | 123 | 14 | ||||||
Pola Orbis Holdings, Inc. | 427 | 38 | ||||||
Rallye SA | 895 | 15 | ||||||
Remy Cointreau SA | 172 | 15 | ||||||
Sonae SGPS SA | 4,917 | 4 | ||||||
Sugi Holdings Co., Ltd. | 700 | 38 | ||||||
Sundrug Co., Ltd. | 455 | 38 | ||||||
Suntory Beverage & Food Ltd | 875 | 38 | ||||||
| SHARES | VALUE | |||||||
| Consumer Staples—continued | ||||||||
Unicharm Corp. | 1,500 | $ | 39 | |||||
WH Group Ltd.(3) | 8,400 | 7 | ||||||
Wilmar International Ltd. | 3,100 | 7 | ||||||
|
| |||||||
| 688 | ||||||||
|
| |||||||
| Energy—3.7% | ||||||||
Akastor ASA(2) | 5,359 | 6 | ||||||
Aker BP ASA(2) | 409 | 7 | ||||||
Aker Solutions ASA(2) | 1,378 | 6 | ||||||
Avance Gas Holding Ltd.(3) | 2,693 | 6 | ||||||
BW LPG Ltd.(3) | 2,341 | 7 | ||||||
Delek Group Ltd. | 39 | 8 | ||||||
Galp Energia SGPS SA | 272 | 4 | ||||||
Genel Energy plc(2) | 35,323 | 44 | ||||||
Petrofac Ltd. | 3,873 | 45 | ||||||
Saras S.p.A | 4,310 | 7 | ||||||
Seadrill Ltd.(2)(4) | 2,742 | 6 | ||||||
Ship Finance International Ltd. | 391 | 6 | ||||||
Tecnicas Reunidas SA | 415 | 16 | ||||||
Tenaris SA ADR | 259 | 7 | ||||||
Transocean Ltd.(2) | 2,540 | 27 | ||||||
|
| |||||||
| 202 | ||||||||
|
| |||||||
| Financials—8.7% | ||||||||
ACOM Co. Ltd.(2) | 7,500 | 35 | ||||||
Ashmore Group plc | 9,402 | 43 | ||||||
Assicurazioni Generali S.p.A | 535 | 6 | ||||||
Banca Mediolanum SPA | 996 | 7 | ||||||
Banco Santander SA | 3,374 | 15 | ||||||
Bank Hapoalim BM | 1,310 | 7 | ||||||
Bank of East Asia Ltd. | 1,600 | 6 | ||||||
Bankinter SA | 2,047 | 15 | ||||||
China LNG Group Ltd. | 238,000 | 7 | ||||||
City Developments Ltd. | 1,100 | 7 | ||||||
Emperor International Group Ltd. | 66,000 | 7 | ||||||
First Pacific Co., Ltd. | 9,300 | 7 | ||||||
Goldin Financial Holdings | 11,800 | 7 | ||||||
Groupe Bruxelles Lambert SA | 630 | 56 | ||||||
Industrivarden AB A Shares | 554 | 11 | ||||||
Kingston Financial Group Ltd. | 17,500 | 7 | ||||||
Matsui Securities Co., Ltd. | 4,015 | 33 | ||||||
Oversea-Chinese Banking Corp. | 1,100 | 7 | ||||||
Pargesa Holding SA | 347 | 24 | ||||||
Partners Group Holding AG | 46 | 23 | ||||||
Platinum Asset Management Ltd. | 5,688 | 22 | ||||||
Reinet Investments SCA | 19,506 | 42 | ||||||
Schroders plc | 1,174 | 41 | ||||||
Svenska Handelsbanken AB Class A | 782 | 11 | ||||||
United Overseas Bank Ltd. | 515 | 7 | ||||||
Wendel | 125 | 15 | ||||||
Wharf Holdings Ltd. (The) | 925 | 7 | ||||||
|
| |||||||
| 475 | ||||||||
|
| |||||||
| Health Care—4.4% | ||||||||
BioMerieux | 95 | 14 | ||||||
Cyberdyne Inc.(2)(4) | 2,400 | 38 | ||||||
DiaSorin S.p.A | 106 | 7 | ||||||
Eurofins Scientific SE | 32 | 15 | ||||||
Galenica AG Registered Shares | 20 | 21 | ||||||
Getinge AB B Shares | 560 | 11 | ||||||
Ipsen SA | 212 | 15 | ||||||
See Notes to Financial Statements
53
Table of Contents
VIRTUS INTERNATIONAL WEALTH MASTERS FUND
SCHEDULE OF INVESTMENTS (Continued)
SEPTEMBER 30, 2016
($ reported in thousands)
| SHARES | VALUE | |||||||
| Health Care—continued | ||||||||
Rhoen-Klinikum AG | 898 | $ | 27 | |||||
Roche Holding AG | 93 | 23 | ||||||
Straumann Holding AG | 59 | 23 | ||||||
Taisho Pharmaceutical Holdings Co., Ltd. | 370 | 38 | ||||||
Taro Pharmaceutical Industries Ltd.(2) | 66 | 7 | ||||||
|
| |||||||
| 239 | ||||||||
|
| |||||||
| Industrials—13.6% | ||||||||
Abertis Infraestructuras SA | 994 | 16 | ||||||
ACS Actividades de Construccion y Servicios SA | 532 | 16 | ||||||
Alfa Laval AB | 688 | 11 | ||||||
Alstom SA(2) | 541 | 14 | ||||||
ANDRITZ AG | 520 | 28 | ||||||
Assa Abloy AB B Shares | 535 | 11 | ||||||
Bollore SA | 4,157 | 14 | ||||||
Bouygues SA | 445 | 15 | ||||||
Cargotec Oyj B Shares | 674 | 31 | ||||||
Cheung Kong Infrastructure Holdings Ltd. | 790 | 7 | ||||||
CK Hutchison Holdings Ltd. | 550 | 7 | ||||||
Dassault Aviation SA | 12 | 13 | ||||||
easyJet plc | 3,118 | 41 | ||||||
Ferrovial SA | 752 | 16 | ||||||
Fomento de Construcciones y Contratas SA(2) | 1,573 | 15 | ||||||
Indutrade AB | 504 | 11 | ||||||
Jardine Matheson Holdings Ltd. | 118 | 7 | ||||||
Jardine Strategic Holdings Ltd. | 218 | 7 | ||||||
Kloeckner & Co. AG(2) | 2,217 | 27 | ||||||
Kone Oyj Class B | 591 | 30 | ||||||
Kuehne & Nagel International AG | 163 | 24 | ||||||
Nidec Corp. | 410 | 38 | ||||||
Noble Group Ltd.(2) | 69,800 | 8 | ||||||
Nordex SE(2) | 966 | 29 | ||||||
NWS Holdings Ltd. | 4,000 | 7 | ||||||
Obrascon Huarte Lain SA | 4,452 | 18 | ||||||
OC Oerlikon Corp. AG Registered Shares | 2,388 | 24 | ||||||
Orient Overseas International Ltd. | 1,800 | 6 | ||||||
Prosegur Cia de Seguridad SA | 2,358 | 16 | ||||||
Regus plc | 11,861 | 40 | ||||||
Rieter Holding AG | 116 | 24 | ||||||
Ryanair Holdings plc-SP ADR | 551 | 41 | ||||||
Salini Impregilo S.p.A | 2,498 | 7 | ||||||
Securitas AB Class B | 655 | 11 | ||||||
Seven Group Holdings Ltd. | 3,486 | 23 | ||||||
SGL Carbon SE(2)(4) | 2,321 | 27 | ||||||
SGS SA Registered Shares | 11 | 25 | ||||||
Skanska AB Class B | 463 | 11 | ||||||
Sulzer AG | 230 | 24 | ||||||
|
| |||||||
| 740 | ||||||||
|
| |||||||
| Information Technology—11.2% | ||||||||
Check Point Software Technologies Ltd.(2) | 100 | 8 | ||||||
COLOPL, Inc. | 2,460 | 38 | ||||||
Dassault Systemes | 165 | 14 | ||||||
Gree, Inc. | 6,500 | 37 | ||||||
GungHo Online Entertainment ,Inc. | 15,900 | 39 | ||||||
Hexagon AB B Shares | 258 | 11 | ||||||
| SHARES | VALUE | |||||||
| Information Technology—continued | ||||||||
Keyence Corp. | 52 | $ | 38 | |||||
Konami Corp. | 1,000 | 39 | ||||||
Lenovo Group Ltd. | 10,400 | 7 | ||||||
Mixi, Inc. | 1,060 | 38 | ||||||
Nexon Co., Ltd. | 2,490 | 39 | ||||||
Obic Business Consultants Co., Ltd. | 785 | 38 | ||||||
Obic Co., Ltd. | 721 | 38 | ||||||
Otsuka Corp. | 780 | 37 | ||||||
Renishaw plc | 1,201 | 41 | ||||||
SAP SE | 305 | 28 | ||||||
Silverlake Axis Ltd. | 14,300 | 7 | ||||||
Square Enix Holdings Co., Ltd. | 1,140 | 39 | ||||||
United Internet AG Registered Shares | 626 | 28 | ||||||
VTech Holdings Ltd. | 572 | 7 | ||||||
Yahoo Japan Corp. | 9,200 | 37 | ||||||
|
| |||||||
| 608 | ||||||||
|
| |||||||
| Materials—7.2% | ||||||||
APERAM SA | 815 | 37 | ||||||
ArcelorMittal(2) | 6,258 | 38 | ||||||
EMS-Chemie Holding AG | 44 | 24 | ||||||
Evolution Mining Ltd. | 11,968 | 23 | ||||||
Fortescue Metals Group Ltd. | 5,874 | 22 | ||||||
Frutarom Industries Ltd. | 154 | 8 | ||||||
Glencore International plc(2) | 16,309 | 45 | ||||||
HeidelbergCement AG | 300 | 28 | ||||||
Hexpol AB | 1,233 | 11 | ||||||
Holcim Ltd. Registered Shares | 444 | 24 | ||||||
Holmen AB B Shares | 311 | 11 | ||||||
Imerys SA | 203 | 15 | ||||||
Israel Corp. Ltd. (The)(2) | 45 | 7 | ||||||
OCI NV(2) | 2,259 | 33 | ||||||
Pact Group Holdings Ltd. | 4,509 | 22 | ||||||
Vicat | 227 | 15 | ||||||
Wacker Chemie AG | 335 | 28 | ||||||
|
| |||||||
| 391 | ||||||||
|
| |||||||
| Real Estate—4.9% | ||||||||
Abacus Property Group | 10,114 | 22 | ||||||
Champion REIT | 11,800 | 7 | ||||||
Cheung Kong Property Holdings Ltd. | 950 | 7 | ||||||
Fonciere Des Regions | 159 | 15 | ||||||
Fortune REIT | 5,400 | 7 | ||||||
Hang Lung Group Ltd. | 1,800 | 7 | ||||||
Hang Lung Properties Ltd. | 3,000 | 7 | ||||||
Henderson Land Development Co., Ltd. | 1,111 | 6 | ||||||
Hongkong Land Holdings Ltd. | 1,000 | 7 | ||||||
Hufvudstaden AB A Shares | 627 | 11 | ||||||
Hysan Development Co. Ltd. | 1,450 | 7 | ||||||
Inmobiliaria Colonial SA | 2,080 | 15 | ||||||
Intu Properties plc | 11,153 | 43 | ||||||
Kerry Properties Ltd. | 2,100 | 7 | ||||||
Lundbergforetagen AB Class B | 168 | 11 | ||||||
New World Development Co., Ltd. | 5,200 | 7 | ||||||
Scentre Group | 6,285 | 23 | ||||||
Sino Land Co., Ltd. | 4,000 | 7 | ||||||
Sun Hung Kai Properties Ltd. | 450 | 7 | ||||||
United Overseas Land Ltd. | 1,720 | 7 | ||||||
Westfield Corp. | 2,961 | 22 | ||||||
| SHARES | VALUE | |||||||
| Real Estate—continued | ||||||||
Wheelock & Co., Ltd. | 1,105 | $ | 6 | |||||
Yanlord Land Group Ltd. | 6,900 | 7 | ||||||
|
| |||||||
| 265 | ||||||||
|
| |||||||
| Telecommunication Services—2.5% | ||||||||
HKT Trust & HKT Ltd. | 5,000 | 7 | ||||||
Iliad SA | 69 | 14 | ||||||
PCCW Ltd. | 10,900 | 7 | ||||||
Smartone Telecommunications Holdings Ltd. | 4,200 | 7 | ||||||
Softbank Corp. | 571 | 37 | ||||||
Talktalk Telecom Group plc | 15,604 | 41 | ||||||
TPG Telecom Ltd. | 3,328 | 22 | ||||||
|
| |||||||
| 135 | ||||||||
|
| |||||||
| Utilities—0.9% | ||||||||
CLP Holdings Ltd. | 639 | 6 | ||||||
Engie SA | 951 | 15 | ||||||
Hong Kong & China Gas Co., Ltd. | 3,685 | 7 | ||||||
Kenon Holdings Ltd.(2) | 705 | 8 | ||||||
Rubis SCA | 161 | 15 | ||||||
|
| |||||||
| 51 | ||||||||
| TOTAL COMMON STOCKS (Identified Cost $5,257) | 5,406 | |||||||
| TOTAL LONG TERM INVESTMENTS—99.4% | ||||||||
| (Identified Cost $5,257) | 5,406 | |||||||
| SECURITIES LENDING COLLATERAL—1.6% | ||||||||
INVESCO Trust Short-Term Investments Liquid Assets Portfolio (The) – Institutional Shares (seven-day effective yield 0.390%)(5)(6) | 86,289 | 86 | ||||||
| TOTAL SECURITIES LENDING COLLATERAL (Identified Cost $86) | 86 | |||||||
| TOTAL INVESTMENTS—101.0% (Identified Cost $5,343) | 5,492 | (1) | ||||||
Other assets and liabilities, net—(1.0)% |
| (56 | ) | |||||
|
| |||||||
| NET ASSETS—100.0% | $ | 5,436 | ||||||
|
| |||||||
Abbreviations:
| ADR | American Depositary Receipt |
| REIT | Real Estate Investment Trust |
Footnote Legend:
| (1) | Federal Income Tax Information: For tax information at September 30, 2016, see Note 10 Federal Income Tax Information in the Notes to Financial Statements. |
| (2) | Non-income producing. |
| (3) | Security exempt from registration under Rule 144A of the Securities Act of 1933. These securities may be resold in transactions exempt from registration, normally to qualified institutional buyers. At September 30, 2016, these securities amounted to a value of $59 or 1.1% of net assets. |
Security abbreviation definitions are located under the Key Investment Terms starting on page 4.
See Notes to Financial Statements
54
Table of Contents
VIRTUS INTERNATIONAL WEALTH MASTERS FUND
SCHEDULE OF INVESTMENTS (Continued)
SEPTEMBER 30, 2016
($ reported in thousands)
| (4) | All or a portion of security is on loan. |
| (5) | Represents security purchased with cash collateral received for securities on loan. |
| (6) | Shares of this fund are publicly offered and the prospectus and annual report are publicly available. |
| Country Weightings (Unaudited)† | ||||
Japan | 25 | % | ||
United Kingdom | 15 | |||
France | 9 | |||
Germany | 9 | |||
Switzerland | 8 | |||
Hong Kong | 6 | |||
Australia | 6 | |||
Other | 22 | |||
Total | 100 | % | ||
† % of total investments as of September 30, 2016 |
| |||
The following table provides a summary of inputs used to value the Fund’s investments as of September 30, 2016 (See Security Valuation Note 2A in the Notes to Financial Statements):
| Total Value at September 30, 2016 | Level 1 Quoted Prices | Level 2 Significant Observable Inputs | ||||||||||
Equity Securities: | ||||||||||||
Common Stocks | $ | 5,406 | $ | 3,315 | $ | 2,091 | ||||||
Securities Lending | 86 | 86 | — | |||||||||
|
|
|
|
|
| |||||||
Total Investments | $ | 5,492 | $ | 3,401 | $ | 2,091 | ||||||
|
|
|
|
|
| |||||||
There are no Level 3 (significant unobservable inputs) priced securities.
Securities held by the Fund with an end of period value of $113 were transferred from Level 1 to Level 2, and securities with an end of period value of $14 were transferred from Level 2 to Level 1, based on our valuation procedures for non-U.S. securities. (See Note 2A in the Notes to Financial Statements for more information.)
See Notes to Financial Statements
55
Table of Contents
VIRTUS OPPORTUNITIES TRUST
STATEMENTS OF ASSETS AND LIABILITIES
SEPTEMBER 30, 2016
($ reported in thousands except shares and per share amounts)
|
|
|
|
|
| |||||||
| Emerging Markets Debt Fund | Emerging Markets Equity Income Fund | Emerging Markets Small-Cap Fund | ||||||||||
| Assets | ||||||||||||
Investment in securities at value(1) | $ | 29,469 | $ | 30,310 | $ | 4,799 | ||||||
Foreign currency at value(2) | — | (3) | 203 | — | (3) | |||||||
Cash | 745 | 593 | 147 | |||||||||
Receivables | ||||||||||||
Investment securities sold | 3 | — | — | |||||||||
Fund shares sold | — | 10 | — | (3) | ||||||||
Receivable from adviser | — | — | 2 | |||||||||
Dividends and interest receivable | 456 | 54 | 9 | |||||||||
Tax reclaims | — | — | (3) | — | ||||||||
Prepaid trustee retainer | 1 | 1 | — | (3) | ||||||||
Prepaid expenses | 27 | 28 | 11 | |||||||||
Other assets | — | (3) | — | (3) | — | (3) | ||||||
|
|
|
|
|
| |||||||
Total assets | 30,701 | 31,199 | 4,968 | |||||||||
|
|
|
|
|
| |||||||
| Liabilities | ||||||||||||
Payables | ||||||||||||
Fund shares repurchased | 1 | 13 | — | |||||||||
Foreign capital gain taxes payable | — | — | 4 | |||||||||
Investment securities purchased | 200 | — | 14 | |||||||||
Investment advisory fees | 11 | 8 | — | |||||||||
Distribution and service fees | — | (3) | 1 | — | (3) | |||||||
Administration fees | 4 | 4 | 1 | |||||||||
Transfer agent fees and expenses | 1 | 6 | — | (3) | ||||||||
Trustees’ fees and expenses | — | (3) | — | (3) | — | (3) | ||||||
Professional fees | 37 | 26 | 26 | |||||||||
Trustee deferred compensation plan | — | (3) | — | (3) | — | (3) | ||||||
Other accrued expenses | 3 | 25 | 4 | |||||||||
|
|
|
|
|
| |||||||
Total liabilities | 257 | 83 | 49 | |||||||||
|
|
|
|
|
| |||||||
| Net Assets | $ | 30,444 | $ | 31,116 | $ | 4,919 | ||||||
|
|
|
|
|
| |||||||
| Net Assets Consist of: | ||||||||||||
Capital paid in on shares of beneficial interest | $ | 32,402 | $ | 42,033 | $ | 5,380 | ||||||
Accumulated undistributed net investment income (loss) | 71 | 311 |
|
95 |
| |||||||
Accumulated undistributed net realized gain (loss) | (2,327 | ) | (13,867 | ) | (611 | ) | ||||||
Net unrealized appreciation (depreciation) on investments | 298 | 2,639 |
|
55 |
| |||||||
|
|
|
|
|
| |||||||
| Net Assets | $ | 30,444 | $ | 31,116 | $ | 4,919 | ||||||
|
|
|
|
|
| |||||||
| Class A | ||||||||||||
Net asset value (net assets/shares outstanding) per share | �� | $ | 9.45 | $ | 9.03 | $ | 9.29 | |||||
Maximum offering price per share NAV/(1–3.75%) | $ | 9.82 | $ | — | $ | — | ||||||
Maximum offering price per share NAV/(1–5.75%) | $ | — | $ | 9.58 | $ | 9.86 | ||||||
Shares of beneficial interest outstanding, no par value, unlimited authorization | 91,384 | 96,401 | 41,076 | |||||||||
Net Assets | $ | 864 | $ | 870 | $ | 382 | ||||||
| Class C | ||||||||||||
Net asset value (net assets/shares outstanding) and offering price per share | $ | 9.44 | $ | 8.98 | $ | 9.31 | ||||||
Shares of beneficial interest outstanding, no par value, unlimited authorization | 39,962 | 70,961 | 12,599 | |||||||||
Net Assets | $ | 377 | $ | 638 | $ | 117 | ||||||
| Class I | ||||||||||||
Net asset value (net assets/shares outstanding) and offering price per share | $ | 9.45 | $ | 9.04 | $ | 9.31 | ||||||
Shares of beneficial interest outstanding, no par value, unlimited authorization | 3,091,724 | 3,275,181 | 474,589 | |||||||||
Net Assets | $ | 29,203 | $ | 29,608 | $ | 4,420 | ||||||
(1) Investment in securities at cost | $ | 29,171 | $ | 27,673 | $ | 4,739 | ||||||
(2) Foreign currency at cost | $ | — | (3) | $ | 201 | $ | — | (3) | ||||
(3) Amount is less than $500. | ||||||||||||
See Notes to Financial Statements
56
Table of Contents
VIRTUS OPPORTUNITIES TRUST
STATEMENTS OF ASSETS AND LIABILITIES (Continued)
SEPTEMBER 30, 2016
($ reported in thousands except shares and per share amounts)
|
|
|
| |||||
| Global Infrastructure Fund | Global Opportunities Fund | |||||||
| Assets | ||||||||
Investment in securities at value(1) | $ | 120,787 | $ | 176,745 | ||||
Cash | 1,000 | 829 | ||||||
Receivables | ||||||||
Investment securities sold | — | 8,050 | ||||||
Fund shares sold | 176 | 82 | ||||||
Dividends and interest receivable | 180 | 276 | ||||||
Tax reclaims | 51 | 192 | ||||||
Prepaid trustee retainer | 3 | 4 | ||||||
Prepaid expenses | 17 | 33 | ||||||
Other assets | 2 | 2 | ||||||
|
|
|
| |||||
Total assets | 122,216 | 186,213 | ||||||
|
|
|
| |||||
| Liabilities | ||||||||
Payables | ||||||||
Fund shares repurchased | 212 | 99 | ||||||
Investment securities purchased | — | 8,398 | ||||||
Foreign capital gain taxes payable | — | — | (2) | |||||
Investment advisory fees | 65 | 125 | ||||||
Distribution and service fees | 35 | 42 | ||||||
Administration fees | 13 | 18 | ||||||
Transfer agent fees and expenses | 25 | 36 | ||||||
Trustees’ fees and expenses | 1 | 2 | ||||||
Professional fees | 29 | 33 | ||||||
Trustee deferred compensation plan | 2 | 2 | ||||||
Other accrued expenses | 14 | 7 | ||||||
|
|
|
| |||||
Total liabilities | 396 | 8,762 | ||||||
|
|
|
| |||||
| Net Assets | $ | 121,820 | $ | 177,451 | ||||
|
|
|
| |||||
| Net Assets Consist of: | ||||||||
Capital paid in on shares of beneficial interest | $ | 110,814 | $ | 134,724 | ||||
Accumulated undistributed net investment income (loss) | (5 | ) | 555 | |||||
Accumulated undistributed net realized gain (loss) | 2,685 | 629 | ||||||
Net unrealized appreciation (depreciation) on investments | 8,326 | 41,543 | ||||||
|
|
|
| |||||
| Net Assets | $ | 121,820 | $ | 177,451 | ||||
|
|
|
| |||||
| Class A | ||||||||
Net asset value (net assets/shares outstanding) per share | $ | 14.22 | $ | 13.69 | ||||
Maximum offering price per share NAV/(1–5.75%) | $ | 15.09 | $ | 14.53 | ||||
Shares of beneficial interest outstanding, no par value, unlimited authorization | 3,596,714 | 7,738,199 | ||||||
Net Assets | $ | 51,148 | $ | 105,967 | ||||
| Class B | ||||||||
Net asset value (net assets/shares outstanding) and offering price per share | $ | — | $ | 12.00 | ||||
Shares of beneficial interest outstanding, no par value, unlimited authorization | — | 21,618 | ||||||
Net Assets | $ | — | $ | 259 | ||||
| Class C | ||||||||
Net asset value (net assets/shares outstanding) and offering price per share | $ | 14.17 | $ | 11.93 | ||||
Shares of beneficial interest outstanding, no par value, unlimited authorization | 2,090,597 | 1,934,123 | ||||||
Net Assets | $ | 29,616 | $ | 23,070 | ||||
| Class I | ||||||||
Net asset value (net assets/shares outstanding) and offering price per share | $ | 14.23 | $ | 13.69 | ||||
Shares of beneficial interest outstanding, no par value, unlimited authorization | 2,884,833 | 3,516,743 | ||||||
Net Assets | $ | 41,056 | $ | 48,155 | ||||
(1) Investment in securities at cost | $ | 112,457 | $ | 135,196 | ||||
(2) Amount is less than $500. | ||||||||
See Notes to Financial Statements
57
Table of Contents
VIRTUS OPPORTUNITIES TRUST
STATEMENTS OF ASSETS AND LIABILITIES (Continued)
SEPTEMBER 30, 2016
($ reported in thousands except shares and per share amounts)
|
|
|
|
|
| |||||||
| Global Real Estate Securities Fund | Greater European Opportunities Fund | International Equity Fund | ||||||||||
| Assets | ||||||||||||
Investment in securities at value(1)(2) | $ | 193,145 | $ | 21,625 | $ | 4,536 | ||||||
Cash | 2,000 | 750 | 313 | |||||||||
Receivables | ||||||||||||
Investment securities sold | 635 | 15 | 406 | |||||||||
Fund shares sold | 798 | 410 | 2 | |||||||||
Receivable from adviser | — | — | 7 | |||||||||
Dividends and interest receivable | 652 | 19 | 12 | |||||||||
Tax reclaims | 20 | 70 | 11 | |||||||||
Securities lending receivable | — | — | (3) | — | (3) | |||||||
Prepaid trustee retainer | 4 | 1 | — | (3) | ||||||||
Prepaid expenses | 32 | 16 | 28 | |||||||||
Other assets | 3 | — | (3) | — | (3) | |||||||
|
|
|
|
|
| |||||||
Total assets | 197,289 | 22,906 | 5,315 | |||||||||
|
|
|
|
|
| |||||||
| Liabilities | ||||||||||||
Collateral on securities loaned | — | 15 | — | |||||||||
Payables | ||||||||||||
Fund shares repurchased | 226 | 100 | 14 | |||||||||
Investment securities purchased | 750 | 186 | 239 | |||||||||
Investment advisory fees | 104 | 8 | — | |||||||||
Distribution and service fees | 25 | 4 | 1 | |||||||||
Administration fees | 20 | 3 | 1 | |||||||||
Transfer agent fees and expenses | 32 | 8 | 1 | |||||||||
Trustees’ fees and expenses | 2 | — | (3) | — | (3) | |||||||
Professional fees | 29 | 29 | 35 | |||||||||
Trustee deferred compensation plan | 3 | — | (3) | — | (3) | |||||||
Other accrued expenses | 23 | 4 | 5 | |||||||||
|
|
|
|
|
| |||||||
Total liabilities | 1,214 | 357 | 296 | |||||||||
|
|
|
|
|
| |||||||
| Net Assets | $ | 196,075 | $ | 22,549 | $ | 5,019 | ||||||
|
|
|
|
|
| |||||||
| Net Assets Consist of: | ||||||||||||
Capital paid in on shares of beneficial interest | $ | 176,740 | $ | 19,221 | $ | 5,655 | ||||||
Accumulated undistributed net investment income (loss) | 1,281 | 273 |
|
(14 |
) | |||||||
Accumulated undistributed net realized gain (loss) | (243 | ) | (886 | ) | (1,380 | ) | ||||||
Net unrealized appreciation (depreciation) on investments | 18,297 | 3,941 |
|
758 |
| |||||||
|
|
|
|
|
| |||||||
| Net Assets | $ | 196,075 | $ | 22,549 | $ | 5,019 | ||||||
|
|
|
|
|
| |||||||
| Class A | ||||||||||||
Net asset value (net assets/shares outstanding) per share | $ | 28.97 | $ | 15.86 | $ | 10.22 | ||||||
Maximum offering price per share NAV/(1–5.75%) | $ | 30.74 | $ | 16.83 | $ | 10.84 | ||||||
Shares of beneficial interest outstanding, no par value, unlimited authorization | 2,350,023 | 716,369 | 137,122 | |||||||||
Net Assets | $ | 68,087 | $ | 11,364 | $ | 1,402 | ||||||
| Class C | ||||||||||||
Net asset value (net assets/shares outstanding) and offering price per share | $ | 28.41 | $ | 15.58 | $ | 9.97 | ||||||
Shares of beneficial interest outstanding, no par value, unlimited authorization | 477,252 | 147,025 | 96,992 | |||||||||
Net Assets | $ | 13,560 | $ | 2,292 | $ | 967 | ||||||
| Class I | ||||||||||||
Net asset value (net assets/shares outstanding) and offering price per share | $ | 29.19 | $ | 15.91 | $ | 10.19 | ||||||
Shares of beneficial interest outstanding, no par value, unlimited authorization | 3,920,207 | 558,796 | 260,073 | |||||||||
Net Assets | $ | 114,428 | $ | 8,893 | $ | 2,650 | ||||||
(1) Investment in securities at cost | $ | 174,847 | $ | 17,683 | $ | 3,776 | ||||||
(2) Market value of securities on loan | $ | — | $ | 14 | $ | — | ||||||
(3) Amount is less than $500. | ||||||||||||
See Notes to Financial Statements
58
Table of Contents
VIRTUS OPPORTUNITIES TRUST
STATEMENTS OF ASSETS AND LIABILITIES (Continued)
SEPTEMBER 30, 2016
($ reported in thousands except shares and per share amounts)
|
|
|
|
|
| |||||||
| International Real Estate Securities Fund | International Small-Cap Fund | International Wealth Masters Fund | ||||||||||
| Assets | ||||||||||||
Investment in securities at value(1)(3) | $ | 34,173 | $ | 42,925 | $ | 5,492 | ||||||
Foreign currency at value(2) | — | — | (4) | — | ||||||||
Cash | 880 | 1,386 | 12 | |||||||||
Receivables | ||||||||||||
Investment securities sold | — | 72 | 309 | |||||||||
Fund shares sold | 12 | 3 | 2 | |||||||||
Receivable from adviser | — | — | 3 | |||||||||
Dividends and interest receivable | 82 | 73 | 12 | |||||||||
Tax reclaims | 19 | 11 | 6 | |||||||||
Securities lending receivable | — | — | (4) | 1 | ||||||||
Prepaid trustee retainer | 1 | 1 | — | (4) | ||||||||
Prepaid expenses | 28 | 38 | 30 | |||||||||
Other assets | — | (4) | 1 | — | (4) | |||||||
|
|
|
|
|
| |||||||
Total assets | 35,195 | 44,510 | 5,867 | |||||||||
|
|
|
|
|
| |||||||
| Liabilities | ||||||||||||
Collateral on securities loaned | — | 134 | 86 | |||||||||
Payables | ||||||||||||
Fund shares repurchased | 60 | 42 | 5 | |||||||||
Investment securities purchased | 27 | 274 | 307 | |||||||||
Investment advisory fees | 9 | 26 | — | |||||||||
Distribution and service fees | 4 | 1 | — | (4) | ||||||||
Administration fees | 4 | 5 | 1 | |||||||||
Transfer agent fees and expenses | 7 | 7 | — | (4) | ||||||||
Trustees’ fees and expenses | — | (4) | — | (4) | — | (4) | ||||||
Professional fees | 28 | 26 | 29 | |||||||||
Trustee deferred compensation plan | — | (4) | 1 | — | (4) | |||||||
Other accrued expenses | 22 | 8 | 3 | |||||||||
|
|
|
|
|
| |||||||
Total liabilities | 161 | 524 | 431 | |||||||||
|
|
|
|
|
| |||||||
| Net Assets | $ | 35,034 | $ | 43,986 | $ | 5,436 | ||||||
|
|
|
|
|
| |||||||
| Net Assets Consist of: | ||||||||||||
Capital paid in on shares of beneficial interest | $ | 36,151 | $ | 44,498 | $ | 5,312 | ||||||
Accumulated undistributed net investment income (loss) | (582 | ) | 469 |
|
50 |
| ||||||
Accumulated undistributed net realized gain (loss) | (9,668 | ) | (2,302 | ) | (75 | ) | ||||||
Net unrealized appreciation (depreciation) on investments | 9,133 | 1,321 |
|
149 |
| |||||||
|
|
|
|
|
| |||||||
| Net Assets | $ | 35,034 | $ | 43,986 | $ | 5,436 | ||||||
|
|
|
|
|
| |||||||
| Class A | ||||||||||||
Net asset value (net assets/shares outstanding) per share | $ | 7.25 | $ | 13.01 | $ | 10.21 | ||||||
Maximum offering price per share NAV/(1–5.75%) | $ | 7.69 | $ | 13.80 | $ | 10.83 | ||||||
Shares of beneficial interest outstanding, no par value, unlimited authorization | 1,197,229 | 152,516 | 22,773 | |||||||||
Net Assets | $ | 8,680 | $ | 1,985 | $ | 232 | ||||||
| Class C | ||||||||||||
Net asset value (net assets/shares outstanding) and offering price per share | $ | 7.21 | $ | 12.92 | $ | 10.13 | ||||||
Shares of beneficial interest outstanding, no par value, unlimited authorization | 278,237 | 113,383 | 11,335 | |||||||||
Net Assets | $ | 2,006 | $ | 1,465 | $ | 115 | ||||||
| Class I | ||||||||||||
Net asset value (net assets/shares outstanding) and offering price per share | $ | 7.26 | $ | 13.04 | $ | 10.24 | ||||||
Shares of beneficial interest outstanding, no par value, unlimited authorization | 3,353,821 | 3,099,596 | 497,182 | |||||||||
Net Assets | $ | 24,348 | $ | 40,424 | $ | 5,089 | ||||||
| Class R6 | ||||||||||||
Net asset value (net assets/shares outstanding) and offering price per share | $ | — | $ | 13.03 | $ | — | ||||||
Shares of beneficial interest outstanding, no par value, unlimited authorization | — | 8,599 | — | |||||||||
Net Assets | $ | — | $ | 112 | $ | — | ||||||
(1) Investment in securities at cost | $ | 25,038 | $ | 41,604 | $ | 5,343 | ||||||
(2) Foreign currency at cost | — | — | (4) | — | ||||||||
(3) Market value of securities on loan | $ | — | $ | 128 | $ | 82 | ||||||
(4) Amount is less than $500. | ||||||||||||
See Notes to Financial Statements
59
Table of Contents
VIRTUS OPPORTUNITIES TRUST
YEAR ENDED SEPTEMBER 30, 2016
($ reported in thousands)
|
|
|
|
|
| |||||||
| Emerging Markets Debt Fund | Emerging Markets Equity Income Fund | Emerging Markets Small-Cap Fund | ||||||||||
| Investment Income | ||||||||||||
Dividends | $ | 3 | $ | 1,282 | $ | 203 | ||||||
Dividends from affiliated funds | 4 | — | — | |||||||||
Interest | 1,755 | — | (1) | — | (1) | |||||||
Security lending, net of fees | — | — | (1) | — | ||||||||
Foreign taxes withheld | (1 | ) | (149 | ) | (21 | ) | ||||||
|
|
|
|
|
| |||||||
Total investment income | 1,761 | 1,133 | 182 | |||||||||
|
|
|
|
|
| |||||||
| Expenses | ||||||||||||
Investment advisory fees | 209 | 348 | 54 | |||||||||
Service fees, Class A | 2 | 2 | 1 | |||||||||
Distribution and service fees, Class C | 4 | 6 | 1 | |||||||||
Administration fees | 36 | 42 | 6 | |||||||||
Transfer agent fees and expenses | 15 | 38 | 5 | |||||||||
Interest expense and fees | — | 1 | — | |||||||||
Registration fees | 44 | 47 | 44 | |||||||||
Printing fees and expenses | 8 | 9 | 2 | |||||||||
Custodian fees | 3 | 78 | 11 | |||||||||
Professional fees | 38 | 52 | 34 | |||||||||
Trustees’ fees and expenses | 3 | 3 | — | (1) | ||||||||
Miscellaneous expenses | 4 | 6 | 3 | |||||||||
|
|
|
|
|
| |||||||
Total expenses | 366 | 632 |
|
161 |
| |||||||
Less expenses reimbursed and/or waived by investment adviser | (51 | ) | (124 | ) | (87 | ) | ||||||
Earnings credit from custodian | (2 | ) | — | (1) | — | (1) | ||||||
Low balance account fees | — | — | (1) | — | ||||||||
|
|
|
|
|
| |||||||
Net expenses | 313 | 508 | 74 | |||||||||
|
|
|
|
|
| |||||||
Net investment income (loss) | 1,448 | 625 | 108 | |||||||||
|
|
|
|
|
| |||||||
| Net Realized and Unrealized Gain (Loss) on Investments | ||||||||||||
Net realized gain (loss) on unaffiliated investments | (462 | ) | (5,932 | ) | (550 | ) | ||||||
Net realized gain (loss) on affiliated investments | (5 | ) | — | — | ||||||||
Net realized gain (loss) on foreign currency transactions | (7 | ) | (6 | ) | (1 | ) | ||||||
Net change in unrealized appreciation (depreciation) on unaffiliated investments | 3,184 | 8,500 | 1,297 | |||||||||
Net change in unrealized appreciation (depreciation) on affiliated investments | 3 | — | — | |||||||||
Net change in unrealized appreciation (depreciation) on foreign currency translation | 2 | (2 | ) | (5 | ) | |||||||
|
|
|
|
|
| |||||||
| Net gain (loss) on investments | 2,715 | 2,560 | 741 | |||||||||
|
|
|
|
|
| |||||||
Net increase (decrease) in net assets resulting from operations | $ | 4,163 | $ | 3,185 | $ | 849 | ||||||
|
|
|
|
|
| |||||||
(1) Amount is less than $500.
See Notes to Financial Statements
60
Table of Contents
VIRTUS OPPORTUNITIES TRUST
STATEMENTS OF OPERATIONS (Continued)
YEAR ENDED SEPTEMBER 30, 2016
($ reported in thousands)
|
|
|
| |||||
| Global Infrastructure Fund | Global Opportunities Fund | |||||||
| Investment Income | ||||||||
Dividends | $ | 4,669 | $ | 3,123 | ||||
Interest | — | (1) | — | |||||
Security lending, net of fees | — | 1 | ||||||
Foreign taxes withheld | (281 | ) | (81 | ) | ||||
|
|
|
| |||||
Total investment income | 4,388 | 3,043 | ||||||
|
|
|
| |||||
| Expenses | ||||||||
Investment advisory fees | 820 | 1,392 | ||||||
Service fees, Class A | 136 | 246 | ||||||
Distribution and service fees, Class B | — | 4 | ||||||
Distribution and service fees, Class C | 328 | 200 | ||||||
Administration fees | 159 | 206 | ||||||
Transfer agent fees and expenses | 185 | 224 | ||||||
Registration fees | 66 | 69 | ||||||
Printing fees and expenses | 39 | 51 | ||||||
Custodian fees | 38 | 9 | ||||||
Professional fees | 33 | 39 | ||||||
Trustees’ fees and expenses | 13 | 15 | ||||||
Miscellaneous expenses | 13 | 15 | ||||||
|
|
|
| |||||
Total expenses | 1,830 | 2,470 | ||||||
Earnings credit from custodian | (5 | ) | (9 | ) | ||||
Low balance account fees | — | (1) | (5 | ) | ||||
|
|
|
| |||||
Net expenses | 1,825 | 2,456 | ||||||
|
|
|
| |||||
Net investment income (loss) | 2,563 | 587 | ||||||
|
|
|
| |||||
| Net Realized and Unrealized Gain (Loss) on Investments | ||||||||
Net realized gain (loss) on investments | 3,988 | 2,497 | ||||||
Net realized gain (loss) on foreign currency transactions | (4 | ) | (4 | ) | ||||
Net change in unrealized appreciation (depreciation) on investments | 9,673 | 14,094 | ||||||
Net change in unrealized appreciation (depreciation) on foreign currency translation | 8 | 4 | ||||||
Net change in foreign taxes on unrealized capital gains | — | 11 | ||||||
|
|
|
| |||||
| Net gain (loss) on investments | 13,665 | 16,602 | ||||||
|
|
|
| |||||
Net increase (decrease) in net assets resulting from operations | $ | 16,228 | $ | 17,189 | ||||
|
|
|
| |||||
(1) Amount is less than $500.
See Notes to Financial Statements
61
Table of Contents
VIRTUS OPPORTUNITIES TRUST
STATEMENTS OF OPERATIONS (Continued)
YEAR ENDED SEPTEMBER 30, 2016
($ reported in thousands)
|
|
|
|
|
| |||||||
| Global Real Estate Securities Fund | Greater European Opportunities Fund | International Equity Fund | ||||||||||
| Investment Income | ||||||||||||
Dividends | $ | 3,898 | $ | 748 | $ | 121 | ||||||
Interest | — | (1) | — | — | ||||||||
Security lending, net of fees | — | 1 | 3 | |||||||||
Foreign taxes withheld | (162 | ) | (53 | ) | (11 | ) | ||||||
|
|
|
|
|
| |||||||
Total investment income | 3,736 | 696 | 113 | |||||||||
|
|
|
|
|
| |||||||
| Expenses | ||||||||||||
Investment advisory fees | 1,091 | 225 | 55 | |||||||||
Service fees, Class A | 126 | 34 | 4 | |||||||||
Distribution and service fees, Class C | 105 | 18 | 13 | |||||||||
Administration fees | 162 | 34 | 8 | |||||||||
Transfer agent fees and expenses | 201 | 53 | 10 | |||||||||
Interest expense and fees | — | 1 | — | |||||||||
Registration fees | 61 | 43 | 39 | |||||||||
Printing fees and expenses | 40 | 13 | 5 | |||||||||
Custodian fees | 47 | 7 | 20 | |||||||||
Professional fees | 33 | 31 | 36 | |||||||||
Trustees’ fees and expenses | 11 | 2 | 1 | |||||||||
Miscellaneous expenses | 11 | 7 | 4 | |||||||||
|
|
|
|
|
| |||||||
Total expenses | 1,888 | 468 | 195 | |||||||||
Less expenses reimbursed and/or waived by investment adviser | (164 | ) | (92 | ) | (96 | ) | ||||||
Earnings credit from custodian | (4 | ) | (2 | ) | (1 | ) | ||||||
|
|
|
|
|
| |||||||
Net expenses | 1,720 | 374 | 98 | |||||||||
|
|
|
|
|
| |||||||
Net investment income (loss) | 2,016 | 322 | 15 | |||||||||
|
|
|
|
|
| |||||||
| Net Realized and Unrealized Gain (Loss) on Investments | ||||||||||||
Net realized gain (loss) on investments | 683 | (683 | ) | (413 | ) | |||||||
Net realized gain (loss) on foreign currency transactions | (9 | ) | 2 | (1 | ) | |||||||
Net change in unrealized appreciation (depreciation) on investments | 12,064 | 1,592 | 663 | |||||||||
Net change in unrealized appreciation (depreciation) on foreign currency translation | (1 | ) | 1 | (1 | ) | |||||||
|
|
|
|
|
| |||||||
| Net gain (loss) on investments | 12,737 | 912 | 248 | |||||||||
|
|
|
|
|
| |||||||
Net increase (decrease) in net assets resulting from operations | $ | 14,753 | $ | 1,234 | $ | 263 | ||||||
|
|
|
|
|
| |||||||
(1) Amount is less than $500.
See Notes to Financial Statements
62
Table of Contents
VIRTUS OPPORTUNITIES TRUST
STATEMENTS OF OPERATIONS (Continued)
YEAR ENDED SEPTEMBER 30, 2016
($ reported in thousands)
|
|
|
|
|
| |||||||
| International Real Estate Securities Fund | International Small-Cap Fund | International Wealth Masters Fund | ||||||||||
| Investment Income | ||||||||||||
Dividends | $ | 1,301 | $ | 1,503 | $ | 127 | ||||||
Interest | — | — | (1) | — | (1) | |||||||
Security lending, net of fees | — | — | (1) | 7 | ||||||||
Foreign taxes withheld | (120 | ) | (137 | ) | (15 | ) | ||||||
|
|
|
|
|
| |||||||
Total investment income | 1,181 | 1,366 | 119 | |||||||||
|
|
|
|
|
| |||||||
| Expenses | ||||||||||||
Investment advisory fees | 369 | 412 | 46 | |||||||||
Service fees, Class A | 27 | 5 | — | (1) | ||||||||
Distribution and service fees, Class C | 22 | 14 | 1 | |||||||||
Administration fees | 47 | 52 | 7 | |||||||||
Transfer agent fees and expenses | 59 | 64 | 3 | |||||||||
Registration fees | 45 | 61 | 50 | |||||||||
Printing fees and expenses | 15 | 14 | 2 | |||||||||
Custodian fees | 44 | 19 | 15 | |||||||||
Professional fees | 30 | 33 | 39 | |||||||||
Trustees’ fees and expenses | 3 | 3 | — | (1) | ||||||||
Miscellaneous expenses | 6 | 11 | 4 | |||||||||
|
|
|
|
|
| |||||||
Total expenses | 667 | 688 | 167 | |||||||||
Less expenses reimbursed and/or waived by investment adviser | (152 | ) | (108 | ) | (98 | ) | ||||||
Earnings credit from custodian | (1 | ) | (3 | ) | — | (1) | ||||||
|
|
|
|
|
| |||||||
Net expenses | 514 | 577 | 69 | |||||||||
|
|
|
|
|
| |||||||
Net investment income (loss) | 667 | 789 | 50 | |||||||||
|
|
|
|
|
| |||||||
| Net Realized and Unrealized Gain (Loss) on Investments | ||||||||||||
Net realized gain (loss) on investments | 805 | (2,264 | ) | (67 | ) | |||||||
Net realized gain (loss) on foreign currency transactions | (3 | ) | 20 | — | (1) | |||||||
Net change in unrealized appreciation (depreciation) on investments | 1,835 | 10,315 | 529 | |||||||||
Net change in unrealized appreciation (depreciation) on foreign currency translation | — | (1) | 3 | — | (1) | |||||||
|
|
|
|
|
| |||||||
| Net gain (loss) on investments | 2,637 | 8,074 | 462 | |||||||||
|
|
|
|
|
| |||||||
Net increase (decrease) in net assets resulting from operations | $ | 3,304 | $ | 8,863 | $ | 512 | ||||||
|
|
|
|
|
| |||||||
(1) Amount is less than $500.
See Notes to Financial Statements
63
Table of Contents
VIRTUS OPPORTUNITIES TRUST
STATEMENTS OF CHANGES IN NET ASSETS
($ reported in thousands)
|
|
|
| |||||||||||||
| Emerging Markets Debt Fund | Emerging Markets Equity Income Fund | |||||||||||||||
| Year Ended September 30, 2016 | Year Ended September 30, 2015 | Year Ended September 30, 2016 | Year Ended September 30, 2015 | |||||||||||||
| INCREASE/(DECREASE) IN NET ASSETS | ||||||||||||||||
| From Operations | ||||||||||||||||
Net investment income (loss) | $ | 1,448 | $ | 1,469 | $ | 625 | $ | 1,466 | ||||||||
Net realized gain (loss) | (474 | ) | (1,824 | ) | (5,938 | ) | (7,612 | ) | ||||||||
Net change in unrealized appreciation (depreciation) | 3,189 | (1,965 | ) | 8,498 | (6,273 | ) | ||||||||||
|
|
|
|
|
|
|
| |||||||||
Increase (decrease) in net assets resulting from operations | 4,163 | (2,320 | ) | 3,185 | (12,419 | ) | ||||||||||
|
|
|
|
|
|
|
| |||||||||
| From Distributions to Shareholders | ||||||||||||||||
Net investment income, Class A | (32 | ) | (30 | ) | (25 | ) | (22 | ) | ||||||||
Net investment income, Class C | (16 | ) | (20 | ) | (15 | ) | (11 | ) | ||||||||
Net investment income, Class I | (1,230 | ) | (1,082 | ) | (1,133 | ) | (1,735 | ) | ||||||||
Net realized short-term gains, Class A | — | — | — | (6 | ) | |||||||||||
Net realized short-term gains, Class C | — | — | — | (4 | ) | |||||||||||
Net realized short-term gains, Class I | — | — | — | (397 | ) | |||||||||||
Tax return of capital, Class A | — | (7 | ) | — | — | |||||||||||
Tax return of capital, Class C | — | (6 | ) | — | — | |||||||||||
Tax return of capital, Class I | — | (226 | ) | — | — | |||||||||||
|
|
|
|
|
|
|
| |||||||||
Decrease in net assets from distributions to shareholders | (1,278 | ) | (1,371 | ) | (1,173 | ) | (2,175 | ) | ||||||||
|
|
|
|
|
|
|
| |||||||||
| From Share Transactions (See Note 6) | ||||||||||||||||
Change in net assets from share transactions, Class A | 67 | (159 | ) | 53 | (271 | ) | ||||||||||
Change in net assets from share transactions, Class C | (229 | ) | (137 | ) | (55 | ) | 10 | |||||||||
Change in net assets from share transactions, Class I | 1,145 | (2,659 | ) | (14,355 | ) | (24,438 | ) | |||||||||
|
|
|
|
|
|
|
| |||||||||
Increase (decrease) in net assets from share transactions | 983 | (2,955 | ) | (14,357 | ) | (24,699 | ) | |||||||||
|
|
|
|
|
|
|
| |||||||||
Net increase (decrease) in net assets | 3,868 | (6,646 | ) | (12,345 | ) | (39,293 | ) | |||||||||
| Net Assets | ||||||||||||||||
Beginning of period | 26,576 | 33,222 | 43,461 | 82,754 | ||||||||||||
|
|
|
|
|
|
|
| |||||||||
End of period | $ | 30,444 | $ | 26,576 | $ | 31,116 | $ | 43,461 | ||||||||
|
|
|
|
|
|
|
| |||||||||
Accumulated undistributed net investment income (loss) at end of period | 71 | $ | (19 | ) | 311 | $ | 860 | |||||||||
See Notes to Financial Statements
64
Table of Contents
VIRTUS OPPORTUNITIES TRUST
STATEMENTS OF CHANGES IN NET ASSETS (Continued)
($ reported in thousands)
|
| |||||||
| Emerging Markets Small-Cap Fund | ||||||||
| Year Ended September 30, 2016 | Year Ended September 30, 2015 | |||||||
| INCREASE/(DECREASE) IN NET ASSETS | ||||||||
| From Operations | ||||||||
Net investment income (loss) | $ | 108 | $ | 82 | ||||
Net realized gain (loss) | (551 | ) | (47 | ) | ||||
Net change in unrealized appreciation (depreciation) | 1,292 | (1,174 | ) | |||||
|
|
|
| |||||
Increase (decrease) in net assets resulting from operations | 849 | (1,139 | ) | |||||
|
|
|
| |||||
| From Distributions to Shareholders | ||||||||
Net investment income, Class A | (6 | ) | (3 | ) | ||||
Net investment income, Class C | — | (1) | (1 | ) | ||||
Net investment income, Class I | (83 | ) | (60 | ) | ||||
Net realized short-term gains, Class A | — | (5 | ) | |||||
Net realized short-term gains, Class C | — | (3 | ) | |||||
Net realized short-term gains, Class I | — | (102 | ) | |||||
|
|
|
| |||||
Decrease in net assets from distributions to shareholders | (89 | ) | (174 | ) | ||||
|
|
|
| |||||
| From Share Transactions (See Note 6) | ||||||||
Change in net assets from share transactions, Class A | (6 | ) | 210 | |||||
Change in net assets from share transactions, Class C | (31 | ) | 8 | |||||
Change in net assets from share transactions, Class I | (135 | ) | 1,570 | |||||
|
|
|
| |||||
Increase (decrease) in net assets from share transactions | (172 | ) | 1,788 | |||||
|
|
|
| |||||
Net increase (decrease) in net assets | 588 | 475 | ||||||
| Net Assets | ||||||||
Beginning of period | 4,331 | 3,856 | ||||||
|
|
|
| |||||
End of period | $ | 4,919 | $ | 4,331 | ||||
|
|
|
| |||||
Accumulated undistributed net investment income (loss) at end of period | 95 | $ | 77 | |||||
(1) Amount is less than $500.
See Notes to Financial Statements
65
Table of Contents
VIRTUS OPPORTUNITIES TRUST
STATEMENTS OF CHANGES IN NET ASSETS (Continued)
($ reported in thousands)
|
|
|
| |||||||||||||
| Global Infrastructure Fund | Global Opportunities Fund | |||||||||||||||
| Year Ended September 30, 2016 | Year Ended September 30, 2015 | Year Ended September 30, 2016 | Year Ended September 30, 2015 | |||||||||||||
| INCREASE/(DECREASE) IN NET ASSETS | ||||||||||||||||
| From Operations | ||||||||||||||||
Net investment income (loss) | $ | 2,563 | $ | 4,013 | $ | 587 | $ | 461 | ||||||||
Net realized gain (loss) | 3,984 | 8,505 | 2,493 | 587 | ||||||||||||
Net change in unrealized appreciation (depreciation) | 9,681 | (28,061 | ) | 14,109 | 1,200 | |||||||||||
|
|
|
|
|
|
|
| |||||||||
Increase (decrease) in net assets resulting from operations | 16,228 | (15,543 | ) | 17,189 | 2,248 | |||||||||||
|
|
|
|
|
|
|
| |||||||||
| From Distributions to Shareholders | ||||||||||||||||
Net investment income, Class A | (1,232 | ) | (1,851 | ) | (223 | ) | (458 | ) | ||||||||
Net investment income, Class B | — | — | — | (1 | ) | |||||||||||
Net investment income, Class C | (502 | ) | (809 | ) | — | (9 | ) | |||||||||
Net investment income, Class I | (982 | ) | (1,738 | ) | (202 | ) | (230 | ) | ||||||||
Net realized long-term gains, Class A | (3,613 | ) | (600 | ) | — | — | ||||||||||
Net realized long-term gains, Class C | (2,361 | ) | (301 | ) | — | — | ||||||||||
Net realized long-term gains, Class I | (2,645 | ) | (524 | ) | — | — | ||||||||||
|
|
|
|
|
|
|
| |||||||||
Decrease in net assets from distributions to shareholders | (11,335 | ) | (5,823 | ) | (425 | ) | (698 | ) | ||||||||
|
|
|
|
|
|
|
| |||||||||
| From Share Transactions (See Note 6) | ||||||||||||||||
Change in net assets from share transactions, Class A | (11,912 | ) | 8,660 | 8,029 | 8,610 | |||||||||||
Change in net assets from share transactions, Class B | — | — | (254 | ) | (191 | ) | ||||||||||
Change in net assets from share transactions, Class C | (12,563 | ) | 20,385 | 6,766 | 11,375 | |||||||||||
Change in net assets from share transactions, Class I | (10,903 | ) | 2,074 | 5,368 | 3,672 | |||||||||||
|
|
|
|
|
|
|
| |||||||||
Increase (decrease) in net assets from share transactions | (35,378 | ) | 31,119 | 19,909 | 23,466 | |||||||||||
|
|
|
|
|
|
|
| |||||||||
Net increase (decrease) in net assets | (30,485 | ) | 9,753 | 36,673 | 25,016 | |||||||||||
| Net Assets | ||||||||||||||||
Beginning of period | 152,305 | 142,552 | 140,778 | 115,762 | ||||||||||||
|
|
|
|
|
|
|
| |||||||||
End of period | $ | 121,820 | $ | 152,305 | $ | 177,451 | $ | 140,778 | ||||||||
|
|
|
|
|
|
|
| |||||||||
Accumulated undistributed net investment income (loss) at end of period | $ | (5 | ) | $ | 152 | $ | 555 | $ | 398 | |||||||
See Notes to Financial Statements
66
Table of Contents
VIRTUS OPPORTUNITIES TRUST
STATEMENTS OF CHANGES IN NET ASSETS (Continued)
($ reported in thousands)
|
|
|
| |||||||||||||
| Global Real Estate Securities Fund | Greater European Opportunities Fund | |||||||||||||||
| Year Ended September 30, 2016 | Year Ended September 30, 2015 | Year Ended September 30, 2016 | Year Ended September 30, 2015 | |||||||||||||
| INCREASE/(DECREASE) IN NET ASSETS | ||||||||||||||||
| From Operations | ||||||||||||||||
Net investment income (loss) | $ | 2,016 | $ | 1,610 | $ | 322 | $ | 214 | ||||||||
Net realized gain (loss) | 674 | 449 | (681 | ) | (104 | ) | ||||||||||
Net change in unrealized appreciation (depreciation) | 12,063 | 626 | 1,593 | 184 | ||||||||||||
|
|
|
|
|
|
|
| |||||||||
Increase (decrease) in net assets resulting from operations | 14,753 | 2,685 | 1,234 | 294 | ||||||||||||
|
|
|
|
|
|
|
| |||||||||
| From Distributions to Shareholders | ||||||||||||||||
Net investment income, Class A | (519 | ) | (613 | ) | (86 | ) | (82 | ) | ||||||||
Net investment income, Class C | (50 | ) | (119 | ) | — | — | (1) | |||||||||
Net investment income, Class I | (608 | ) | (821 | ) | (94 | ) | (24 | ) | ||||||||
Net realized short-term gains, Class A | (173 | ) | (21 | ) | — | — | ||||||||||
Net realized short-term gains, Class C | (38 | ) | (5 | ) | — | — | ||||||||||
Net realized short-term gains, Class I | (172 | ) | (26 | ) | — | — | ||||||||||
Net realized long-term gains, Class A | (477 | ) | (66 | ) | — | (153 | ) | |||||||||
Net realized long-term gains, Class C | (105 | ) | (17 | ) | — | (13 | ) | |||||||||
Net realized long-term gains, Class I | (475 | ) | (81 | ) | — | (31 | ) | |||||||||
|
|
|
|
|
|
|
| |||||||||
Decrease in net assets from distributions to shareholders | (2,617 | ) | (1,769 | ) | (180 | ) | (303 | ) | ||||||||
|
|
|
|
|
|
|
| |||||||||
| From Share Transactions (See Note 6) | ||||||||||||||||
Change in net assets from share transactions, Class A | 27,379 | 14,600 | (2,522 | ) | 732 | |||||||||||
Change in net assets from share transactions, Class C | 4,125 | 2,509 | 657 | 472 | ||||||||||||
Change in net assets from share transactions, Class I | 75,040 | 5,033 | 2,739 | 2,842 | ||||||||||||
|
|
|
|
|
|
|
| |||||||||
Increase (decrease) in net assets from share transactions | 106,544 | 22,142 | 874 | 4,046 | ||||||||||||
|
|
|
|
|
|
|
| |||||||||
Net increase (decrease) in net assets | 118,680 | 23,058 | 1,928 | 4,037 | ||||||||||||
| Net Assets | ||||||||||||||||
Beginning of period | 77,395 | 54,337 | 20,621 | 16,584 | ||||||||||||
|
|
|
|
|
|
|
| |||||||||
End of period | $ | 196,075 | $ | 77,395 | $ | 22,549 | $ | 20,621 | ||||||||
|
|
|
|
|
|
|
| |||||||||
Accumulated undistributed net investment income (loss) at end of period | $ | 1,281 | $ | 298 | $ | 273 | $ | 126 | ||||||||
(1) Amount is less than $500.
See Notes to Financial Statements
67
Table of Contents
VIRTUS OPPORTUNITIES TRUST
STATEMENTS OF CHANGES IN NET ASSETS (Continued)
($ reported in thousands)
|
|
|
| |||||||||||||
| International Equity Fund | International Real Estate Securities Fund | |||||||||||||||
| Year Ended September 30, 2016 | Year Ended September 30, 2015 | Year Ended September 30, 2016 | Year Ended September 30, 2015 | |||||||||||||
| INCREASE/(DECREASE) IN NET ASSETS | ||||||||||||||||
| From Operations | ||||||||||||||||
Net investment income (loss) | $ | 15 | $ | 36 | $ | 667 | $ | 1,783 | ||||||||
Net realized gain (loss) | (414 | ) | (791 | ) | 802 | (140 | ) | |||||||||
Net change in unrealized appreciation (depreciation) | 662 | (293 | ) | 1,835 | (1,401 | ) | ||||||||||
|
|
|
|
|
|
|
| |||||||||
Increase (decrease) in net assets resulting from operations | 263 | (1,048 | ) | 3,304 | 242 | |||||||||||
|
|
|
|
|
|
|
| |||||||||
| From Distributions to Shareholders | ||||||||||||||||
Net investment income, Class A | (6 | ) | (30 | ) | (135 | ) | (778 | ) | ||||||||
Net investment income, Class C | — | (1 | ) | (6 | ) | (117 | ) | |||||||||
Net investment income, Class I | (26 | ) | (54 | ) | (307 | ) | (1,837 | ) | ||||||||
Net realized short-term gains, Class A | — | — | — | — | ||||||||||||
Net realized short-term gains, Class C | — | — | — | — | ||||||||||||
Net realized short-term gains, Class I | — | — | — | — | ||||||||||||
Net realized long-term gains, Class A | — | — | — | — | ||||||||||||
Net realized long-term gains, Class C | — | — | — | — | ||||||||||||
Net realized long-term gains, Class I | — | — | — | — | ||||||||||||
|
|
|
|
|
|
|
| |||||||||
Decrease in net assets from distributions to shareholders | (32 | ) | (85 | ) | (448 | ) | (2,732 | ) | ||||||||
|
|
|
|
|
|
|
| |||||||||
| From Share Transactions (See Note 6) | ||||||||||||||||
Change in net assets from share transactions, Class A | (584 | ) | (1,652 | ) | (4,508 | ) | 1,872 | |||||||||
Change in net assets from share transactions, Class C | (760 | ) | 1,096 | (397 | ) | (182 | ) | |||||||||
Change in net assets from share transactions, Class I | (1,804 | ) | (1,529 | ) | (2,557 | ) | (2,108 | ) | ||||||||
|
|
|
|
|
|
|
| |||||||||
Increase (decrease) in net assets from share transactions | (3,148 | ) | (2,085 | ) | (7,462 | ) | (418 | ) | ||||||||
|
|
|
|
|
|
|
| |||||||||
Net increase (decrease) in net assets | (2,917 | ) | (3,218 | ) | (4,606 | ) | (2,908 | ) | ||||||||
| Net Assets | ||||||||||||||||
Beginning of period | 7,936 | 11,154 | 39,640 | 42,548 | ||||||||||||
|
|
|
|
|
|
|
| |||||||||
End of period | $ | 5,019 | $ | 7,936 | $ | 35,034 | $ | 39,640 | ||||||||
|
|
|
|
|
|
|
| |||||||||
Accumulated undistributed net investment income (loss) at end of period | $ | (14 | ) | $ | (10 | ) | $ | (582 | ) | $ | (1,123 | ) | ||||
See Notes to Financial Statements
68
Table of Contents
VIRTUS OPPORTUNITIES TRUST
STATEMENTS OF CHANGES IN NET ASSETS (Continued)
($ reported in thousands)
|
|
|
| |||||||||||||
| International Small-Cap Fund | International Wealth Masters Fund | |||||||||||||||
| Year Ended September 30, 2016 | Year Ended September 30, 2015 | Year Ended September 30, 2016 | From inception November 17, 2014 to September 30, 2015 | |||||||||||||
| INCREASE/(DECREASE) IN NET ASSETS | ||||||||||||||||
| From Operations | ||||||||||||||||
Net investment income (loss) | $ | 789 | $ | 825 | $ | 50 | $ | 52 | ||||||||
Net realized gain (loss) | (2,244 | ) | 1,467 | (67 | ) | 86 | ||||||||||
Net change in unrealized appreciation (depreciation) | 10,318 | (9,603 | ) | 529 | (380 | ) | ||||||||||
|
|
|
|
|
|
|
| |||||||||
Increase (decrease) in net assets resulting from operations | 8,863 | (7,311 | ) | 512 | (242 | ) | ||||||||||
|
|
|
|
|
|
|
| |||||||||
| From Distributions to Shareholders | ||||||||||||||||
Net investment income, Class A | (32 | ) | (31 | ) | (1 | ) | — | |||||||||
Net investment income, Class C | (8 | ) | (18 | ) | (1 | ) | — | |||||||||
Net investment income, Class I | (826 | ) | (770 | ) | (68 | ) | — | |||||||||
Net investment income, Class R6 | (2 | ) | (2 | ) | — | — | ||||||||||
Net realized short-term gains, Class A | (16 | ) | (84 | ) | (2 | ) | — | |||||||||
Net realized short-term gains, Class C | (12 | ) | (53 | ) | (2 | ) | — | |||||||||
Net realized short-term gains, Class I | (338 | ) | (1,927 | ) | (72 | ) | — | |||||||||
Net realized short-term gains, Class R6 | (1 | ) | (4 | ) | — | | — | | ||||||||
Net realized long-term gains, Class A | (20 | ) | (46 | ) | — | — | ||||||||||
Net realized long-term gains, Class C | (15 | ) | (29 | ) | — | — | ||||||||||
Net realized long-term gains, Class I | (440 | ) | (1,050 | ) | — | — | ||||||||||
Net realized long-term gains, Class R6 | (1 | ) | (2 | ) | — | | — | | ||||||||
|
|
|
|
|
|
|
| |||||||||
Decrease in net assets from distributions to shareholders | (1,711 | ) | (4,016 | ) | (146 | ) | — | |||||||||
|
|
|
|
|
|
|
| |||||||||
| From Share Transactions (See Note 6) | ||||||||||||||||
Change in net assets from share transactions, Class A | (280 | ) | (107 | ) | 95 | 135 | ||||||||||
Change in net assets from share transactions, Class C | (264 | ) | 612 | (7 | ) | 124 | ||||||||||
Change in net assets from share transactions, Class I | (6,608 | ) | 4,425 | 140 | 4,825 | |||||||||||
Change in net assets from share transactions, Class R6 | 4 | 109 | — | — | ||||||||||||
|
|
|
|
|
|
|
| |||||||||
Increase (decrease) in net assets from share transactions | (7,148 | ) | 5,039 | 228 | 5,084 | |||||||||||
|
|
|
|
|
|
|
| |||||||||
Net increase (decrease) in net assets | 4 | (6,288 | ) | 594 | 4,842 | |||||||||||
| Net Assets | ||||||||||||||||
Beginning of period | 43,982 | 50,270 | 4,842 | — | ||||||||||||
|
|
|
|
|
|
|
| |||||||||
End of period | $ | 43,986 | $ | 43,982 | $ | 5,436 | $ | 4,842 | ||||||||
|
|
|
|
|
|
|
| |||||||||
Accumulated undistributed net investment income (loss) at end of period | $ | 469 | $ | 516 | $ | 50 | $ | 64 | ||||||||
See Notes to Financial Statements
69
Table of Contents
VIRTUS OPPORTUNITIES TRUST
SELECTED PER SHARE DATA AND RATIOS FOR A SHARE OUTSTANDING
THROUGHOUT EACH PERIOD
| Net Asset Value, Beginning of Period | Net Investment Income (Loss)(2) | Net Realized and Unrealized Gain (Loss) | Total from Investment Operations | Dividends from Net Investment Income | Distributions from Net Realized Gains | Tax Return of Capital | Total Distributions | Change in Net Asset Value | Net Asset Value, End of Period | Total Return(1) | Net Assets, End of Period (in thousands) | Ratio of Net Expenses to Average Net Assets(7) | Ratio of Gross Expenses to Average Net Assets (before waivers and reimbursements)(7) | Ratio of Net Investment Income (Loss) to Average Net Assets | Portfolio Turnover Rate | ||||||||||||||||||||||||||||||||||||||||||||||||||||||||||||||||||
| Emerging Markets | ||||||||||||||||||||||||||||||||||||||||||||||||||||||||||||||||||||||||||||||||||
Debt Fund | ||||||||||||||||||||||||||||||||||||||||||||||||||||||||||||||||||||||||||||||||||
Class A | ||||||||||||||||||||||||||||||||||||||||||||||||||||||||||||||||||||||||||||||||||
10/1/15 to 9/30/16 | $ | 8.54 | 0.44 | 0.86 | 1.30 | (0.39 | ) | — | — | (0.39 | ) | 0.91 | $ | 9.45 | 15.58 | % | $ | 864 | 1.35 | %(8) | 1.54 | % | 4.95 | % | 49 | % | ||||||||||||||||||||||||||||||||||||||||||||||||||||||||
10/1/14 to 9/30/15 | 9.69 | 0.44 | (1.18 | ) | (0.74 | ) | (0.33 | ) | — | (0.08 | ) | (0.41 | ) | (1.15 | ) | 8.54 | (7.85 | ) | 718 | 1.35 | 1.48 | 4.80 | 47 | |||||||||||||||||||||||||||||||||||||||||||||||||||||||||||
10/1/13 to 9/30/14 | 9.43 | 0.47 | 0.26 | 0.73 | (0.46 | ) | — | (0.01 | ) | (0.47 | ) | 0.26 | 9.69 | 7.83 | 982 | 1.35 | 1.52 | 4.88 | 39 | |||||||||||||||||||||||||||||||||||||||||||||||||||||||||||||||
10/1/12 to 9/30/13 | 10.09 | 0.48 | (0.64 | ) | (0.16 | ) | (0.48 | ) | (0.02 | ) | — | (0.50 | ) | (0.66 | ) | 9.43 | (1.94 | ) | 3,200 | 1.35 | 1.55 | 4.92 | 60 | |||||||||||||||||||||||||||||||||||||||||||||||||||||||||||
9/5/12(6) to 9/30/12 | 10.00 | 0.02 | 0.07 | 0.09 | — | — | — | — | 0.09 | 10.09 | 0.90 | (4) | 101 | 1.35 | (3) | 3.49 | (3) | 3.35 | (3) | 13 | (4) | |||||||||||||||||||||||||||||||||||||||||||||||||||||||||||||
Class C | ||||||||||||||||||||||||||||||||||||||||||||||||||||||||||||||||||||||||||||||||||
10/1/15 to 9/30/16 | $ | 8.54 | 0.37 | 0.85 | 1.22 | (0.32 | ) | — | — | (0.32 | ) | 0.90 | $ | 9.44 | 14.60 | % | $ | 377 | 2.10 | %(8) | 2.28 | % | 4.20 | % | 49 | % | ||||||||||||||||||||||||||||||||||||||||||||||||||||||||
10/1/14 to 9/30/15 | 9.68 | 0.37 | (1.17 | ) | (0.80 | ) | (0.26 | ) | — | (0.08 | ) | (0.34 | ) | (1.14 | ) | 8.54 | (8.44 | ) | 565 | 2.10 | 2.23 | 4.06 | 47 | |||||||||||||||||||||||||||||||||||||||||||||||||||||||||||
10/1/13 to 9/30/14 | 9.42 | 0.40 | 0.25 | 0.65 | (0.38 | ) | — | (0.01 | ) | (0.39 | ) | 0.26 | 9.68 | 7.03 | 788 | 2.10 | 2.21 | 4.08 | 39 | |||||||||||||||||||||||||||||||||||||||||||||||||||||||||||||||
10/1/12 to 9/30/13 | 10.09 | 0.41 | (0.66 | ) | (0.25 | ) | (0.40 | ) | (0.02 | ) | — | (0.42 | ) | (0.67 | ) | 9.42 | (2.68 | ) | 374 | 2.10 | 2.32 | 4.11 | 60 | |||||||||||||||||||||||||||||||||||||||||||||||||||||||||||
9/5/12(6) to 9/30/12 | 10.00 | 0.02 | 0.07 | 0.09 | — | — | — | — | 0.09 | 10.09 | 0.90 | (4) | 110 | 2.10 | (3) | 4.26 | (3) | 2.63 | (3) | 13 | (4) | |||||||||||||||||||||||||||||||||||||||||||||||||||||||||||||
Class I | ||||||||||||||||||||||||||||||||||||||||||||||||||||||||||||||||||||||||||||||||||
10/1/15 to 9/30/16 | $ | 8.54 | 0.46 | 0.86 | 1.32 | (0.41 | ) | — | — | (0.41 | ) | 0.91 | $ | 9.45 | 15.88 | % | $ | 29,203 | 1.10 | %(8) | 1.29 | % | 5.21 | % | 49 | % | ||||||||||||||||||||||||||||||||||||||||||||||||||||||||
10/1/14 to 9/30/15 | 9.68 | 0.46 | (1.17 | ) | (0.71 | ) | (0.35 | ) | — | (0.08 | ) | (0.43 | ) | (1.14 | ) | 8.54 | (7.52 | ) | 25,293 | 1.10 | 1.23 | 5.05 | 47 | |||||||||||||||||||||||||||||||||||||||||||||||||||||||||||
10/1/13 to 9/30/14 | 9.42 | 0.49 | 0.26 | 0.75 | (0.48 | ) | — | (0.01 | ) | (0.49 | ) | 0.26 | 9.68 | 8.11 | 31,452 | 1.10 | 1.23 | 5.09 | 39 | |||||||||||||||||||||||||||||||||||||||||||||||||||||||||||||||
10/1/12 to 9/30/13 | 10.10 | 0.50 | (0.66 | ) | (0.16 | ) | (0.50 | ) | (0.02 | ) | — | (0.52 | ) | (0.68 | ) | 9.42 | (1.80 | ) | 24,686 | 1.10 | 1.33 | 4.99 | 60 | |||||||||||||||||||||||||||||||||||||||||||||||||||||||||||
9/5/12(6) to 9/30/12 | 10.00 | 0.02 | 0.08 | 0.10 | — | — | — | — | 0.10 | 10.10 | 1.00 | (4) | 25,036 | 1.10 | (3) | 3.24 | (3) | 3.61 | (3) | 13 | (4) | |||||||||||||||||||||||||||||||||||||||||||||||||||||||||||||
| Emerging Markets | ||||||||||||||||||||||||||||||||||||||||||||||||||||||||||||||||||||||||||||||||||
Equity Income Fund | ||||||||||||||||||||||||||||||||||||||||||||||||||||||||||||||||||||||||||||||||||
Class A | ||||||||||||||||||||||||||||||||||||||||||||||||||||||||||||||||||||||||||||||||||
10/1/15 to 9/30/16 | $ | 8.30 | 0.16 | 0.84 | 1.00 | (0.27 | ) | — | — | (0.27 | ) | 0.73 | $ | 9.03 | 12.42 | % | $ | 870 | 1.76 | %(8)(9) | 2.17 | % | 1.95 | % | 74 | % | ||||||||||||||||||||||||||||||||||||||||||||||||||||||||
10/1/14 to 9/30/15 | 10.54 | 0.20 | (2.18 | ) | (1.98 | ) | (0.21 | ) | (0.05 | ) | — | (0.26 | ) | (2.24 | ) | 8.30 | (19.13 | ) | 727 | 1.75 | 1.76 | 2.04 | 72 | |||||||||||||||||||||||||||||||||||||||||||||||||||||||||||
10/1/13 to 9/30/14 | 10.57 | 0.21 | (0.05 | ) | 0.16 | (0.19 | ) | — | — | (0.19 | ) | (0.03 | ) | 10.54 | 1.54 | 1,210 | 1.75 | 1.95 | 1.96 | 72 | ||||||||||||||||||||||||||||||||||||||||||||||||||||||||||||||
10/1/12 to 9/30/13 | 10.59 | 0.31 | (0.07 | ) | 0.24 | (0.07 | ) | (0.19 | ) | — | (0.26 | ) | (0.02 | ) | 10.57 | 2.19 | 830 | 1.75 | 2.90 | 3.00 | 100 | |||||||||||||||||||||||||||||||||||||||||||||||||||||||||||||
9/5/12(6) to 9/30/12 | 10.00 | (0.01 | ) | 0.60 | 0.59 | — | — | — | — | 0.59 | 10.59 | 5.90 | (4) | 106 | 1.75 | (3) | 10.28 | (3) | (0.78 | )(3) | 37 | (4) | ||||||||||||||||||||||||||||||||||||||||||||||||||||||||||||
Class C | ||||||||||||||||||||||||||||||||||||||||||||||||||||||||||||||||||||||||||||||||||
10/1/15 to 9/30/16 | $ | 8.26 | 0.10 | 0.83 | 0.93 | (0.21 | ) | — | — | (0.21 | ) | 0.72 | $ | 8.98 | 11.54 | % | $ | 638 | 2.51 | %(8)(9) | 2.90 | % | 1.18 | % | 74 | % | ||||||||||||||||||||||||||||||||||||||||||||||||||||||||
10/1/14 to 9/30/15 | 10.50 | 0.14 | (2.19 | ) | (2.05 | ) | (0.14 | ) | (0.05 | ) | — | (0.19 | ) | (2.24 | ) | 8.26 | (19.78 | ) | 638 | 2.50 | 2.52 | 1.42 | 72 | |||||||||||||||||||||||||||||||||||||||||||||||||||||||||||
10/1/13 to 9/30/14 | 10.54 | 0.15 | (0.07 | ) | 0.08 | (0.12 | ) | — | — | (0.12 | ) | (0.04 | ) | 10.50 | 0.80 | 799 | 2.50 | 2.65 | 1.39 | 72 | ||||||||||||||||||||||||||||||||||||||||||||||||||||||||||||||
10/1/12 to 9/30/13 | 10.58 | 0.20 | (0.03 | ) | 0.17 | (0.02 | ) | (0.19 | ) | — | (0.21 | ) | (0.04 | ) | 10.54 | 1.48 | 417 | 2.50 | 3.77 | 1.89 | 100 | |||||||||||||||||||||||||||||||||||||||||||||||||||||||||||||
9/5/12(6) to 9/30/12 | 10.00 | (0.01 | ) | 0.59 | 0.58 | — | — | — | — | 0.58 | 10.58 | 5.80 | (4) | 106 | 2.50 | (3) | 11.03 | (3) | (1.54 | )(3) | 37 | (4) | ||||||||||||||||||||||||||||||||||||||||||||||||||||||||||||
Class I | ||||||||||||||||||||||||||||||||||||||||||||||||||||||||||||||||||||||||||||||||||
10/1/15 to 9/30/16 | $ | 8.31 | 0.16 | 0.86 | 1.02 | (0.29 | ) | — | — | (0.29 | ) | 0.73 | $ | 9.04 | 12.69 | % | $ | 29,608 | 1.51 | %(8)(9) | 1.88 | % | 1.90 | % | 74 | % | ||||||||||||||||||||||||||||||||||||||||||||||||||||||||
10/1/14 to 9/30/15 | 10.56 | 0.21 | (2.17 | ) | (1.96 | ) | (0.24 | ) | (0.05 | ) | — | (0.29 | ) | (2.25 | ) | 8.31 | (18.95 | ) | 42,096 | 1.50 | 1.51 | 2.14 | 72 | |||||||||||||||||||||||||||||||||||||||||||||||||||||||||||
10/1/13 to 9/30/14 | 10.58 | 0.27 | (0.08 | ) | 0.19 | (0.21 | ) | — | — | (0.21 | ) | (0.02 | ) | 10.56 | 1.87 | 80,745 | 1.50 | 1.51 | 2.60 | 72 | ||||||||||||||||||||||||||||||||||||||||||||||||||||||||||||||
10/1/12 to 9/30/13 | 10.59 | 0.27 | (0.01 | ) | 0.26 | (0.08 | ) | (0.19 | ) | — | (0.27 | ) | (0.01 | ) | 10.58 | 2.39 | 8,655 | 1.50 | 2.87 | 2.56 | 100 | |||||||||||||||||||||||||||||||||||||||||||||||||||||||||||||
9/5/12(6) to 9/30/12 | 10.00 | — | (5) | 0.59 | 0.59 | — | — | — | — | 0.59 | 10.59 | 5.90 | (4) | 5,082 | 1.50 | (3) | 10.03 | (3) | (0.54 | )(3) | 37 | (4) | ||||||||||||||||||||||||||||||||||||||||||||||||||||||||||||
| Emerging Markets | ||||||||||||||||||||||||||||||||||||||||||||||||||||||||||||||||||||||||||||||||||
Small-Cap Fund | ||||||||||||||||||||||||||||||||||||||||||||||||||||||||||||||||||||||||||||||||||
Class A | ||||||||||||||||||||||||||||||||||||||||||||||||||||||||||||||||||||||||||||||||||
10/1/15 to 9/30/16 | $ | 7.85 | 0.18 | 1.41 | 1.59 | (0.15 | ) | — | — | (0.15 | ) | 1.44 | $ | 9.29 | 20.66 | % | $ | 382 | 1.86 | %(8)(9) | 3.77 | % | 2.18 | % | 34 | % | ||||||||||||||||||||||||||||||||||||||||||||||||||||||||
10/1/14 to 9/30/15 | 10.32 | 0.16 | (2.28 | ) | (2.12 | ) | (0.12 | ) | (0.23 | ) | — | (0.35 | ) | (2.47 | ) | 7.85 | (21.20 | ) | 332 | 1.85 | 3.62 | 1.73 | 35 | |||||||||||||||||||||||||||||||||||||||||||||||||||||||||||
12/17/13(6) to 9/30/14 | 10.00 | 0.18 | 0.16 | 0.34 | (0.02 | ) | — | — | (0.02 | ) | 0.32 | 10.32 | 3.45 | (4) | 217 | 1.85 | (3) | 4.82 | (3) | 2.25 | (3) | 44 | (4) | |||||||||||||||||||||||||||||||||||||||||||||||||||||||||||
Class C | ||||||||||||||||||||||||||||||||||||||||||||||||||||||||||||||||||||||||||||||||||
10/1/15 to 9/30/16 | $ | 7.80 | 0.12 | 1.41 | 1.53 | (0.02 | ) | — | — | (0.02 | ) | 1.51 | $ | 9.31 | 19.62 | % | $ | 117 | 2.61 | %(8)(9) | 4.51 | % | 1.39 | % | 34 | % | ||||||||||||||||||||||||||||||||||||||||||||||||||||||||
10/1/14 to 9/30/15 | 10.26 | 0.07 | (2.24 | ) | (2.17 | ) | (0.06 | ) | (0.23 | ) | — | (0.29 | ) | (2.46 | ) | 7.80 | (21.68 | ) | 128 | 2.60 | 4.34 | 0.76 | 35 | |||||||||||||||||||||||||||||||||||||||||||||||||||||||||||
12/17/13(6) to 9/30/14 | 10.00 | 0.12 | 0.16 | 0.28 | (0.02 | ) | — | — | (0.02 | ) | 0.26 | 10.26 | 2.82 | (4) | 159 | 2.60 | (3) | 5.59 | (3) | 1.54 | (3) | 44 | (4) | |||||||||||||||||||||||||||||||||||||||||||||||||||||||||||
Class I | ||||||||||||||||||||||||||||||||||||||||||||||||||||||||||||||||||||||||||||||||||
10/1/15 to 9/30/16 | $ | 7.88 | 0.20 | 1.41 | 1.61 | (0.18 | ) | — | — | (0.18 | ) | 1.43 | $ | 9.31 | 20.82 | % | $ | 4,420 | 1.61 | %(8)(9) | 3.53 | % | 2.44 | % | 34 | % | ||||||||||||||||||||||||||||||||||||||||||||||||||||||||
10/1/14 to 9/30/15 | 10.34 | 0.18 | (2.28 | ) | (2.10 | ) | (0.13 | ) | (0.23 | ) | — | (0.36 | ) | (2.46 | ) | 7.88 | (20.96 | ) | 3,871 | 1.60 | 3.35 | 1.87 | 35 | |||||||||||||||||||||||||||||||||||||||||||||||||||||||||||
12/17/13(6) to 9/30/14 | 10.00 | 0.20 | 0.17 | 0.37 | (0.03 | ) | — | — | (0.03 | ) | 0.34 | 10.34 | 3.66 | (4) | 3,480 | 1.60 | (3) | 4.64 | (3) | 2.50 | (3) | 44 | (4) | |||||||||||||||||||||||||||||||||||||||||||||||||||||||||||
The footnote legend is at the end of the financial highlights.
See Notes to Financial Statements
70
Table of Contents
VIRTUS OPPORTUNITIES TRUST
FINANCIAL HIGHLIGHTS
SELECTED PER SHARE DATA AND RATIOS FOR A SHARE OUTSTANDING
THROUGHOUT EACH PERIOD
| Net Asset Value, Beginning of Period | Net Investment Income (Loss)(2) | Net Realized and Unrealized Gain (Loss) | Total from Investment Operations | Dividends from Net Investment Income | Distributions from Net Realized Gains | Total Distributions | Change in Net Asset Value | Net Asset Value, End of Period | Total Return(1) | Net Assets, End of Period (in thousands) | Ratio of Net Expenses to Average Net Assets(7) | Ratio of Gross Expenses to Average Net Assets (before waivers and reimbursements)(7) | Ratio of Net Investment Income (Loss) to Average Net Assets | Portfolio Turnover Rate | ||||||||||||||||||||||||||||||||||||||||||||||||||||||||||||||
| Global Infrastructure | |||||||||||||||||||||||||||||||||||||||||||||||||||||||||||||||||||||||||||||
Fund | |||||||||||||||||||||||||||||||||||||||||||||||||||||||||||||||||||||||||||||
Class A | |||||||||||||||||||||||||||||||||||||||||||||||||||||||||||||||||||||||||||||
10/1/15 to 9/30/16 | $ | 13.62 | 0.29 | 1.54 | 1.83 | (0.33 | ) | (0.90 | ) | (1.23 | ) | 0.60 | $ | 14.22 | 14.79 | % | $ | 51,148 | 1.34 | %(8) | 1.34 | % | 2.16 | % | 17 | % | |||||||||||||||||||||||||||||||||||||||||||||||||||
10/1/14 to 9/30/15 | 15.38 | 0.36 | (1.60 | ) | (1.24 | ) | (0.39 | ) | (0.13 | ) | (0.52 | ) | (1.76 | ) | 13.62 | (8.27 | ) | 60,744 | 1.22 | 1.22 | 2.38 | 27 | |||||||||||||||||||||||||||||||||||||||||||||||||||||||
10/1/13 to 9/30/14 | 13.94 | 0.71 | 1.40 | 2.11 | (0.67 | ) | — | (0.67 | ) | 1.44 | 15.38 | 15.21 | 60,673 | 1.29 | 1.29 | 4.69 | 24 | ||||||||||||||||||||||||||||||||||||||||||||||||||||||||||||
10/1/12 to 9/30/13 | 12.88 | 0.35 | 1.05 | 1.40 | (0.34 | ) | — | (0.34 | ) | 1.06 | 13.94 | 11.05 | 53,354 | 1.28 | 1.28 | 2.62 | 14 | ||||||||||||||||||||||||||||||||||||||||||||||||||||||||||||
10/1/11 to 9/30/12 | 10.97 | 0.31 | 1.95 | 2.26 | (0.35 | ) | — | (0.35 | ) | 1.91 | 12.88 | 20.80 | 36,347 | 1.32 | 1.32 | 2.59 | 21 | ||||||||||||||||||||||||||||||||||||||||||||||||||||||||||||
Class C | |||||||||||||||||||||||||||||||||||||||||||||||||||||||||||||||||||||||||||||
10/1/15 to 9/30/16 | $ | 13.57 | 0.19 | 1.53 | 1.72 | (0.22 | ) | (0.90 | ) | (1.12 | ) | 0.60 | $ | 14.17 | 13.94 | % | $ | 29,616 | 2.08 | %(8) | 2.08 | % | 1.42 | % | 17 | % | |||||||||||||||||||||||||||||||||||||||||||||||||||
10/1/14 to 9/30/15 | 15.33 | 0.25 | (1.59 | ) | (1.34 | ) | (0.29 | ) | (0.13 | ) | (0.42 | ) | (1.76 | ) | 13.57 | (8.94 | ) | 41,039 | 1.97 | 1.97 | 1.66 | 27 | |||||||||||||||||||||||||||||||||||||||||||||||||||||||
10/1/13 to 9/30/14 | 13.90 | 0.58 | 1.41 | 1.99 | (0.56 | ) | — | (0.56 | ) | 1.43 | 15.33 | 14.37 | 26,322 | 2.04 | 2.04 | 3.82 | 24 | ||||||||||||||||||||||||||||||||||||||||||||||||||||||||||||
10/1/12 to 9/30/13 | 12.85 | 0.25 | 1.05 | 1.30 | (0.25 | ) | — | (0.25 | ) | 1.05 | 13.90 | 10.23 | 17,969 | 2.03 | 2.03 | 1.85 | 14 | ||||||||||||||||||||||||||||||||||||||||||||||||||||||||||||
10/1/11 to 9/30/12 | 10.95 | 0.23 | 1.93 | 2.16 | (0.26 | ) | — | (0.26 | ) | 1.90 | 12.85 | 19.97 | 9,117 | 2.07 | 2.07 | 1.88 | 21 | ||||||||||||||||||||||||||||||||||||||||||||||||||||||||||||
Class I | |||||||||||||||||||||||||||||||||||||||||||||||||||||||||||||||||||||||||||||
10/1/15 to 9/30/16 | $ | 13.63 | 0.32 | 1.54 | 1.86 | (0.36 | ) | (0.90 | ) | (1.26 | ) | 0.60 | $ | 14.23 | 15.07 | % | $ | 41,056 | 1.08 | %(8) | 1.08 | % | 2.37 | % | 17 | % | |||||||||||||||||||||||||||||||||||||||||||||||||||
10/1/14 to 9/30/15 | 15.38 | 0.39 | (1.58 | ) | (1.19 | ) | (0.43 | ) | (0.13 | ) | (0.56 | ) | (1.75 | ) | 13.63 | (7.98 | ) | 50,522 | 0.97 | 0.97 | 2.61 | 27 | |||||||||||||||||||||||||||||||||||||||||||||||||||||||
10/1/13 to 9/30/14 | 13.94 | 0.74 | 1.41 | 2.15 | (0.71 | ) | — | (0.71 | ) | 1.44 | 15.38 | 15.49 | 55,557 | 1.04 | 1.04 | 4.87 | 24 | ||||||||||||||||||||||||||||||||||||||||||||||||||||||||||||
10/1/12 to 9/30/13 | 12.89 | 0.39 | 1.04 | 1.43 | (0.38 | ) | — | (0.38 | ) | 1.05 | 13.94 | 11.23 | 70,485 | 1.03 | 1.03 | 2.86 | 14 | ||||||||||||||||||||||||||||||||||||||||||||||||||||||||||||
10/1/11 to 9/30/12 | 10.97 | 0.35 | 1.95 | 2.30 | (0.38 | ) | — | (0.38 | ) | 1.92 | 12.89 | 21.19 | 48,830 | 1.07 | 1.07 | 2.85 | 21 | ||||||||||||||||||||||||||||||||||||||||||||||||||||||||||||
| Global Opportunities | |||||||||||||||||||||||||||||||||||||||||||||||||||||||||||||||||||||||||||||
Fund | |||||||||||||||||||||||||||||||||||||||||||||||||||||||||||||||||||||||||||||
Class A | |||||||||||||||||||||||||||||||||||||||||||||||||||||||||||||||||||||||||||||
10/1/15 to 9/30/16 | $ | 12.32 | 0.05 | 1.35 | 1.40 | (0.03 | ) | — | (0.03 | ) | 1.37 | $ | 13.69 | 11.38 | % | $ | 105,967 | 1.47 | %(8) | 1.48 | % | 0.37 | % | 29 | % | ||||||||||||||||||||||||||||||||||||||||||||||||||||
10/1/14 to 9/30/15 | 12.12 | 0.05 | 0.21 | 0.26 | (0.06 | ) | — | (0.06 | ) | 0.20 | 12.32 | 2.15 | 87,769 | 1.45 | 1.45 | 0.42 | 40 | ||||||||||||||||||||||||||||||||||||||||||||||||||||||||||||
10/1/13 to 9/30/14 | 11.07 | 0.08 | 1.04 | 1.12 | (0.07 | ) | — | (0.07 | ) | 1.05 | 12.12 | 10.18 | 77,738 | 1.48 | 1.46 | 0.70 | 41 | ||||||||||||||||||||||||||||||||||||||||||||||||||||||||||||
10/1/12 to 9/30/13 | 9.91 | 0.07 | 1.12 | 1.19 | (0.03 | ) | — | (0.03 | ) | 1.16 | 11.07 | 12.05 | 78,434 | 1.55 | 1.50 | 0.69 | 61 | ||||||||||||||||||||||||||||||||||||||||||||||||||||||||||||
10/1/11 to 9/30/12 | 7.91 | 0.05 | 1.99 | 2.04 | (0.04 | ) | — | (0.04 | ) | 2.00 | 9.91 | 25.80 | 71,592 | 1.55 | 1.55 | 0.53 | 73 | ||||||||||||||||||||||||||||||||||||||||||||||||||||||||||||
Class B | |||||||||||||||||||||||||||||||||||||||||||||||||||||||||||||||||||||||||||||
10/1/15 to 9/30/16 | $ | 10.85 | (0.05 | ) | 1.20 | 1.15 | — | — | — | 1.15 | $ | 12.00 | 10.60 | % | $ | 259 | 2.22 | %(8) | 2.23 | % | (0.41 | )% | 29 | % | |||||||||||||||||||||||||||||||||||||||||||||||||||||
10/1/14 to 9/30/15 | 10.73 | (0.06 | ) | 0.20 | 0.14 | (0.02 | ) | — | (0.02 | ) | 0.12 | 10.85 | 1.33 | 474 | 2.20 | 2.20 | (0.50 | ) | 40 | ||||||||||||||||||||||||||||||||||||||||||||||||||||||||||
10/1/13 to 9/30/14 | 9.81 | (0.01 | ) | 0.93 | 0.92 | — | — | — | 0.92 | 10.73 | 9.38 | 652 | 2.23 | 2.21 | (0.09 | ) | 41 | ||||||||||||||||||||||||||||||||||||||||||||||||||||||||||||
10/1/12 to 9/30/13 | 8.82 | (0.01 | ) | 1.00 | 0.99 | — | — | — | 0.99 | 9.81 | 11.22 | 798 | 2.30 | 2.25 | (0.10 | ) | 61 | ||||||||||||||||||||||||||||||||||||||||||||||||||||||||||||
10/1/11 to 9/30/12 | 7.06 | (0.02 | ) | 1.78 | 1.76 | — | — | — | 1.76 | 8.82 | 24.93 | 1,048 | 2.30 | 2.30 | (0.28 | ) | 73 | ||||||||||||||||||||||||||||||||||||||||||||||||||||||||||||
Class C | |||||||||||||||||||||||||||||||||||||||||||||||||||||||||||||||||||||||||||||
10/1/15 to 9/30/16 | $ | 10.79 | (0.04 | ) | 1.18 | 1.14 | — | — | — | 1.14 | $ | 11.93 | 10.57 | % | $ | 23,070 | 2.23 | %(8) | 2.24 | % | (0.34 | )% | 29 | % | |||||||||||||||||||||||||||||||||||||||||||||||||||||
10/1/14 to 9/30/15 | 10.66 | (0.01 | ) | 0.16 | 0.15 | (0.02 | ) | — | (0.02 | ) | 0.13 | 10.79 | 1.42 | 14,431 | 2.21 | 2.21 | (0.13 | ) | 40 | ||||||||||||||||||||||||||||||||||||||||||||||||||||||||||
10/1/13 to 9/30/14 | 9.76 | — | (5) | 0.91 | 0.91 | (0.01 | ) | — | (0.01 | ) | 0.90 | 10.66 | 9.32 | 3,455 | 2.23 | 2.21 | (0.04 | ) | 41 | ||||||||||||||||||||||||||||||||||||||||||||||||||||||||||
10/1/12 to 9/30/13 | 8.77 | — | (5) | 0.99 | 0.99 | — | — | — | 0.99 | 9.76 | 11.29 | 2,963 | 2.30 | 2.24 | (0.03 | ) | 61 | ||||||||||||||||||||||||||||||||||||||||||||||||||||||||||||
10/1/11 to 9/30/12 | 7.02 | (0.02 | ) | 1.77 | 1.75 | — | — | — | 1.75 | 8.77 | 24.93 | 1,700 | 2.30 | 2.30 | (0.25 | ) | 73 | ||||||||||||||||||||||||||||||||||||||||||||||||||||||||||||
The footnote legend is at the end of the financial highlights.
See Notes to Financial Statements
71
Table of Contents
VIRTUS OPPORTUNITIES TRUST
FINANCIAL HIGHLIGHTS
SELECTED PER SHARE DATA AND RATIOS FOR A SHARE OUTSTANDING
THROUGHOUT EACH PERIOD
| Net Asset Value, Beginning of Period | Net Investment Income (Loss)(2) | Net Realized and Unrealized Gain (Loss) | Total from Investment Operations | Dividends from Net Investment Income | Distributions from Net Realized Gains | Total Distributions | Change in Net Asset Value | Net Asset Value, End of Period | Total Return(1) | Net Assets, End of Period (in thousands) | Ratio of Net Expenses to Average Net Assets(7) | Ratio of Gross Expenses to Average Net Assets (before waivers and reimbursements)(7) | Ratio of Net Investment Income (Loss) to Average Net Assets | Portfolio Turnover Rate | ||||||||||||||||||||||||||||||||||||||||||||||||||||||||||||||
| Global Opportunities | |||||||||||||||||||||||||||||||||||||||||||||||||||||||||||||||||||||||||||||
Fund (Continued) | |||||||||||||||||||||||||||||||||||||||||||||||||||||||||||||||||||||||||||||
Class I | |||||||||||||||||||||||||||||||||||||||||||||||||||||||||||||||||||||||||||||
10/1/15 to 9/30/16 | $ | 12.32 | 0.08 | 1.35 | 1.43 | (0.06 | ) | — | (0.06 | ) | 1.37 | $ | 13.69 | 11.65 | % | $ | 48,155 | 1.23 | %(8) | 1.23 | % | 0.64 | % | 29 | % | ||||||||||||||||||||||||||||||||||||||||||||||||||||
10/1/14 to 9/30/15 | 12.11 | 0.08 | 0.21 | 0.29 | (0.08 | ) | — | (0.08 | ) | 0.21 | 12.32 | 2.37 | 38,104 | 1.20 | 1.20 | 0.67 | 40 | ||||||||||||||||||||||||||||||||||||||||||||||||||||||||||||
10/1/13 to 9/30/14 | 11.07 | 0.11 | 1.05 | 1.16 | (0.12 | ) | — | (0.12 | ) | 1.04 | 12.11 | 10.49 | 33,917 | 1.23 | 1.21 | 0.97 | 41 | ||||||||||||||||||||||||||||||||||||||||||||||||||||||||||||
10/1/12 to 9/30/13 | 9.91 | 0.10 | 1.12 | 1.22 | (0.06 | ) | — | (0.06 | ) | 1.16 | 11.07 | 12.36 | 29,540 | 1.30 | 1.30 | 0.94 | 61 | ||||||||||||||||||||||||||||||||||||||||||||||||||||||||||||
8/8/12(6) to 9/30/12 | 9.38 | — | (5) | 0.53 | 0.53 | — | — | — | 0.53 | 9.91 | 5.54 | (4) | 23,617 | 1.30 | (3) | 1.30 | (3) | 0.02 | (3) | 73 | (4) | ||||||||||||||||||||||||||||||||||||||||||||||||||||||||
| Global Real Estate | |||||||||||||||||||||||||||||||||||||||||||||||||||||||||||||||||||||||||||||
Securities Fund | |||||||||||||||||||||||||||||||||||||||||||||||||||||||||||||||||||||||||||||
Class A | |||||||||||||||||||||||||||||||||||||||||||||||||||||||||||||||||||||||||||||
10/1/15 to 9/30/16 | $ | 26.19 | 0.40 | 3.12 | 3.52 | (0.33 | ) | (0.41 | ) | (0.74 | ) | 2.78 | $ | 28.97 | 13.75 | % | $ | 68,087 | 1.41 | %(8)(9) | 1.54 | % | 1.45 | % | 22 | % | |||||||||||||||||||||||||||||||||||||||||||||||||||
10/1/14 to 9/30/15 | 25.18 | 0.66 | 1.08 | 1.74 | (0.64 | ) | (0.09 | ) | (0.73 | ) | 1.01 | 26.19 | 6.83 | 36,315 | 1.40 | 1.50 | 2.45 | 27 | |||||||||||||||||||||||||||||||||||||||||||||||||||||||||||
10/1/13 to 9/30/14 | 23.14 | 0.38 | 2.19 | 2.57 | (0.36 | ) | (0.17 | ) | (0.53 | ) | 2.04 | 25.18 | 11.36 | 21,502 | 1.40 | 1.57 | 1.52 | 29 | |||||||||||||||||||||||||||||||||||||||||||||||||||||||||||
10/1/12 to 9/30/13 | 22.40 | 0.35 | 1.09 | 1.44 | (0.70 | ) | — | (0.70 | ) | 0.74 | 23.14 | 6.48 | 15,306 | 1.40 | 1.66 | 1.51 | 18 | ||||||||||||||||||||||||||||||||||||||||||||||||||||||||||||
10/1/11 to 9/30/12 | 17.78 | 0.33 | 4.77 | 5.10 | (0.11 | ) | (0.37 | ) | (0.48 | ) | 4.62 | 22.40 | 29.21 | 8,695 | 1.40 | 2.37 | 1.61 | 31 | |||||||||||||||||||||||||||||||||||||||||||||||||||||||||||
Class C | |||||||||||||||||||||||||||||||||||||||||||||||||||||||||||||||||||||||||||||
10/1/15 to 9/30/16 | $ | 25.71 | 0.20 | 3.06 | 3.26 | (0.15 | ) | (0.41 | ) | (0.56 | ) | 2.70 | $ | 28.41 | 12.89 | % | $ | 13,560 | 2.16 | %(8)(9) | 2.29 | % | 0.73 | % | 22 | % | |||||||||||||||||||||||||||||||||||||||||||||||||||
10/1/14 to 9/30/15 | 24.77 | 0.45 | 1.07 | 1.52 | (0.49 | ) | (0.09 | ) | (0.58 | ) | 0.94 | 25.71 | 6.07 | 8,421 | 2.15 | 2.26 | 1.68 | 27 | |||||||||||||||||||||||||||||||||||||||||||||||||||||||||||
10/1/13 to 9/30/14 | 22.78 | 0.22 | 2.13 | 2.35 | (0.19 | ) | (0.17 | ) | (0.36 | ) | 1.99 | 24.77 | 10.51 | 5,850 | 2.15 | 2.32 | 0.92 | 29 | |||||||||||||||||||||||||||||||||||||||||||||||||||||||||||
10/1/12 to 9/30/13 | 22.14 | 0.18 | 1.08 | 1.26 | (0.62 | ) | — | (0.62 | ) | 0.64 | 22.78 | 5.70 | 3,545 | 2.15 | 2.41 | 0.80 | 18 | ||||||||||||||||||||||||||||||||||||||||||||||||||||||||||||
10/1/11 to 9/30/12 | 17.65 | 0.17 | 4.72 | 4.89 | (0.03 | ) | (0.37 | ) | (0.40 | ) | 4.49 | 22.14 | 28.18 | 1,356 | 2.15 | 3.11 | 0.83 | 31 | |||||||||||||||||||||||||||||||||||||||||||||||||||||||||||
Class I | |||||||||||||||||||||||||||||||||||||||||||||||||||||||||||||||||||||||||||||
10/1/15 to 9/30/16 | $ | 26.37 | 0.51 | 3.11 | 3.62 | (0.39 | ) | (0.41 | ) | (0.80 | ) | 2.82 | $ | 29.19 | 14.06 | % | $ | 114,428 | 1.16 | %(8)(9) | 1.29 | % | 1.79 | % | 22 | % | |||||||||||||||||||||||||||||||||||||||||||||||||||
10/1/14 to 9/30/15 | 25.33 | 0.73 | 1.10 | 1.83 | (0.70 | ) | (0.09 | ) | (0.79 | ) | 1.04 | 26.37 | 7.11 | 32,659 | 1.15 | 1.25 | 2.69 | 27 | |||||||||||||||||||||||||||||||||||||||||||||||||||||||||||
10/1/13 to 9/30/14 | 23.28 | 0.41 | 2.22 | 2.63 | (0.41 | ) | (0.17 | ) | (0.58 | ) | 2.05 | 25.33 | 11.60 | 26,985 | 1.15 | 1.32 | 1.65 | 29 | |||||||||||||||||||||||||||||||||||||||||||||||||||||||||||
10/1/12 to 9/30/13 | 22.51 | 0.42 | 1.09 | 1.51 | (0.74 | ) | — | (0.74 | ) | 0.77 | 23.28 | 6.78 | 25,332 | 1.15 | 1.41 | 1.78 | 18 | ||||||||||||||||||||||||||||||||||||||||||||||||||||||||||||
10/1/11 to 9/30/12 | 17.85 | 0.45 | 4.71 | 5.16 | (0.13 | ) | (0.37 | ) | (0.50 | ) | 4.66 | 22.51 | 29.50 | 12,063 | 1.15 | 1.93 | 2.04 | 31 | |||||||||||||||||||||||||||||||||||||||||||||||||||||||||||
| Greater European | |||||||||||||||||||||||||||||||||||||||||||||||||||||||||||||||||||||||||||||
Opportunities Fund | |||||||||||||||||||||||||||||||||||||||||||||||||||||||||||||||||||||||||||||
Class A | |||||||||||||||||||||||||||||||||||||||||||||||||||||||||||||||||||||||||||||
10/1/15 to 9/30/16 | $ | 15.20 | 0.17 | 0.59 | 0.76 | (0.10 | ) | — | (0.10 | ) | 0.66 | $ | 15.86 | 4.99 | % | $ | 11,364 | 1.46 | %(8)(9) | 1.82 | % | 1.06 | % | 49 | % | ||||||||||||||||||||||||||||||||||||||||||||||||||||
10/1/14 to 9/30/15 | 15.32 | 0.16 | 0.01 | 0.17 | (0.10 | ) | (0.19 | ) | (0.29 | ) | (0.12 | ) | 15.20 | 1.19 | 13,306 | 1.45 | 1.89 | 1.02 | 35 | ||||||||||||||||||||||||||||||||||||||||||||||||||||||||||
10/1/13 to 9/30/14 | 15.87 | 0.09 | (0.22 | ) | (0.13 | ) | (0.06 | ) | (0.36 | ) | (0.42 | ) | (0.55 | ) | 15.32 | (0.88 | ) | 12,703 | 1.45 | 1.91 | 0.54 | 65 | |||||||||||||||||||||||||||||||||||||||||||||||||||||||
10/1/12 to 9/30/13 | 14.20 | 0.13 | 2.09 | 2.22 | (0.12 | ) | (0.43 | ) | (0.55 | ) | 1.67 | 15.87 | 15.92 | 13,433 | 1.45 | 2.22 | 0.86 | 75 | |||||||||||||||||||||||||||||||||||||||||||||||||||||||||||
10/1/11 to 9/30/12 | 11.80 | 0.16 | 2.87 | 3.03 | (0.15 | ) | (0.48 | ) | (0.63 | ) | 2.40 | 14.20 | 26.75 | 6,513 | 1.45 | 2.82 | 1.26 | 49 | |||||||||||||||||||||||||||||||||||||||||||||||||||||||||||
Class C | |||||||||||||||||||||||||||||||||||||||||||||||||||||||||||||||||||||||||||||
10/1/15 to 9/30/16 | $ | 14.95 | 0.04 | 0.59 | 0.63 | — | — | — | 0.63 | $ | 15.58 | 4.21 | % | $ | 2,292 | 2.23 | %(8)(9) | 2.58 | % | 0.26 | % | 49 | % | ||||||||||||||||||||||||||||||||||||||||||||||||||||||
10/1/14 to 9/30/15 | 15.08 | 0.05 | 0.01 | 0.06 | — | (5) | (0.19 | ) | (0.19 | ) | (0.13 | ) | 14.95 | 0.43 | 1,564 | 2.20 | 2.64 | 0.34 | 35 | ||||||||||||||||||||||||||||||||||||||||||||||||||||||||||
10/1/13 to 9/30/14 | 15.71 | (0.02 | ) | (0.23 | ) | (0.25 | ) | (0.02 | ) | (0.36 | ) | (0.38 | ) | (0.63 | ) | 15.08 | (1.62 | ) | 1,130 | 2.20 | 2.67 | (0.12 | ) | 65 | |||||||||||||||||||||||||||||||||||||||||||||||||||||
10/1/12 to 9/30/13 | 14.10 | 0.03 | 2.07 | 2.10 | (0.06 | ) | (0.43 | ) | (0.49 | ) | 1.61 | 15.71 | 15.11 | 607 | 2.20 | 2.92 | 0.21 | 75 | |||||||||||||||||||||||||||||||||||||||||||||||||||||||||||
10/1/11 to 9/30/12 | 11.69 | 0.07 | 2.85 | 2.92 | (0.03 | ) | (0.48 | ) | (0.51 | ) | 2.41 | 14.10 | 25.73 | 187 | 2.20 | 3.57 | 0.52 | 49 | |||||||||||||||||||||||||||||||||||||||||||||||||||||||||||
The footnote legend is at the end of the financial highlights.
See Notes to Financial Statements
72
Table of Contents
VIRTUS OPPORTUNITIES TRUST
FINANCIAL HIGHLIGHTS
SELECTED PER SHARE DATA AND RATIOS FOR A SHARE OUTSTANDING
THROUGHOUT EACH PERIOD
| Net Asset Value, Beginning of Period | Net Investment Income (Loss)(2) | Net Realized and Unrealized Gain (Loss) | Total from Investment Operations | Dividends from Net Investment Income | Distributions from Net Realized Gains | Total Distributions | Change in Net Asset Value | Net Asset Value, End of Period | Total Return(1) | Net Assets, End of Period (in thousands) | Ratio of Net Expenses to Average Net Assets(7) | Ratio of Gross Expenses to Average Net Assets (before waivers and reimbursements)(7) | Ratio of Net Investment Income (Loss) to Average Net Assets | Portfolio Turnover Rate | ||||||||||||||||||||||||||||||||||||||||||||||||||||||||||||||
Greater European | |||||||||||||||||||||||||||||||||||||||||||||||||||||||||||||||||||||||||||||
Opportunities Fund (Continued) | |||||||||||||||||||||||||||||||||||||||||||||||||||||||||||||||||||||||||||||
Class I | |||||||||||||||||||||||||||||||||||||||||||||||||||||||||||||||||||||||||||||
10/1/15 to 9/30/16 | $ | 15.26 | 0.25 | 0.54 | 0.79 | (0.14 | ) | — | (0.14 | ) | 0.65 | $ | 15.91 | 5.22 | % | $ | 8,893 | 1.22 | %(8)(9) | 1.56 | % | 1.57 | % | 49 | % | ||||||||||||||||||||||||||||||||||||||||||||||||||||
10/1/14 to 9/30/15 | 15.38 | 0.24 | (0.02 | ) | 0.22 | (0.15 | ) | (0.19 | ) | (0.34 | ) | (0.12 | ) | 15.26 | 1.47 | 5,751 | 1.20 | 1.63 | 1.55 | 35 | |||||||||||||||||||||||||||||||||||||||||||||||||||||||||
10/1/13 to 9/30/14 | 15.92 | 0.14 | (0.24 | ) | (0.10 | ) | (0.08 | ) | (0.36 | ) | (0.44 | ) | (0.54 | ) | 15.38 | (0.64 | ) | 2,751 | 1.20 | 1.68 | 0.89 | 65 | |||||||||||||||||||||||||||||||||||||||||||||||||||||||
10/1/12 to 9/30/13 | 14.23 | 0.06 | 2.20 | 2.26 | (0.14 | ) | (0.43 | ) | (0.57 | ) | 1.69 | 15.92 | 16.19 | 1,918 | 1.20 | 1.96 | 0.39 | 75 | |||||||||||||||||||||||||||||||||||||||||||||||||||||||||||
10/1/11 to 9/30/12 | 11.83 | 0.17 | 2.90 | 3.07 | (0.19 | ) | (0.48 | ) | (0.67 | ) | 2.40 | 14.23 | 26.99 | 155 | 1.20 | 2.57 | 1.32 | 49 | |||||||||||||||||||||||||||||||||||||||||||||||||||||||||||
International Equity Fund | |||||||||||||||||||||||||||||||||||||||||||||||||||||||||||||||||||||||||||||
Class A | |||||||||||||||||||||||||||||||||||||||||||||||||||||||||||||||||||||||||||||
10/1/15 to 9/30/16 | $ | 9.80 | 0.03 | 0.42 | 0.45 | (0.03 | ) | — | (0.03 | ) | 0.42 | $ | 10.22 | 4.64 | % | $ | 1,402 | 1.51 | %(8)(9) | 3.05 | % | 0.28 | % | 70 | % | ||||||||||||||||||||||||||||||||||||||||||||||||||||
10/1/14 to 9/30/15 | 10.90 | 0.03 | (1.05 | ) | (1.02 | ) | (0.08 | ) | — | (0.08 | ) | (1.10 | ) | 9.80 | (9.43 | ) | 1,923 | 1.50 | 2.27 | 0.25 | 94 | ||||||||||||||||||||||||||||||||||||||||||||||||||||||||
10/1/13 to 9/30/14 | 10.50 | 0.13 | 0.64 | 0.77 | (0.24 | ) | (0.13 | ) | (0.37 | ) | 0.40 | 10.90 | 7.42 | 3,915 | 1.50 | 2.42 | 1.18 | 115 | |||||||||||||||||||||||||||||||||||||||||||||||||||||||||||
10/1/12 to 9/30/13 | 10.87 | 0.16 | 1.19 | 1.35 | (0.25 | ) | (1.47 | ) | (1.72 | ) | (0.37 | ) | 10.50 | 13.38 | 170 | 1.50 | 1.95 | 1.41 | 277 | ||||||||||||||||||||||||||||||||||||||||||||||||||||||||||
10/1/11 to 9/30/12 | 9.79 | 0.21 | 1.36 | 1.57 | (0.30 | ) | (0.19 | ) | (0.49 | ) | 1.08 | 10.87 | 16.58 | 193 | 1.50 | 1.80 | 2.02 | 25 | |||||||||||||||||||||||||||||||||||||||||||||||||||||||||||
Class C | |||||||||||||||||||||||||||||||||||||||||||||||||||||||||||||||||||||||||||||
10/1/15 to 9/30/16 | $ | 9.60 | (0.05 | ) | 0.42 | 0.37 | — | — | — | 0.37 | $ | 9.97 | 3.85 | % | $ | 967 | 2.26 | %(8)(9) | 3.76 | % | (0.52 | )% | 70 | % | |||||||||||||||||||||||||||||||||||||||||||||||||||||
10/1/14 to 9/30/15 | 10.68 | (0.02 | ) | (1.05 | ) | (1.07 | ) | (0.01 | ) | — | (0.01 | ) | (1.08 | ) | 9.60 | (10.01 | ) | 1,689 | 2.25 | 3.06 | (0.17 | ) | 94 | ||||||||||||||||||||||||||||||||||||||||||||||||||||||
10/1/13 to 9/30/14 | 10.37 | 0.04 | 0.62 | 0.66 | (0.22 | ) | (0.13 | ) | (0.35 | ) | 0.31 | 10.68 | 6.56 | 804 | 2.25 | 3.13 | 0.38 | 115 | |||||||||||||||||||||||||||||||||||||||||||||||||||||||||||
10/1/12 to 9/30/13 | 10.77 | 0.08 | 1.20 | 1.28 | (0.21 | ) | (1.47 | ) | (1.68 | ) | (0.40 | ) | 10.37 | 12.53 | 124 | 2.25 | 2.73 | 0.70 | 277 | ||||||||||||||||||||||||||||||||||||||||||||||||||||||||||
10/1/11 to 9/30/12 | 9.76 | 0.20 | 1.25 | 1.45 | (0.25 | ) | (0.19 | ) | (0.44 | ) | 1.01 | 10.77 | 15.37 | 115 | 2.25 | 2.51 | 1.94 | 25 | |||||||||||||||||||||||||||||||||||||||||||||||||||||||||||
Class I | |||||||||||||||||||||||||||||||||||||||||||||||||||||||||||||||||||||||||||||
10/1/15 to 9/30/16 | $ | 9.78 | 0.05 | 0.43 | 0.48 | (0.07 | ) | — | (0.07 | ) | 0.41 | $ | 10.19 | 4.89 | % | $ | 2,650 | 1.26 | %(8)(9) | 2.76 | % | 0.50 | % | 70 | % | ||||||||||||||||||||||||||||||||||||||||||||||||||||
10/1/14 to 9/30/15 | 10.87 | 0.07 | (1.06 | ) | (0.99 | ) | (0.10 | ) | — | (0.10 | ) | (1.09 | ) | 9.78 | (9.14 | ) | 4,324 | 1.25 | 2.02 | 0.61 | 94 | ||||||||||||||||||||||||||||||||||||||||||||||||||||||||
10/1/13 to 9/30/14 | 10.45 | 0.14 | 0.65 | 0.79 | (0.24 | ) | (0.13 | ) | (0.37 | ) | 0.42 | 10.87 | 7.67 | 6,435 | 1.25 | 2.19 | 1.24 | 115 | |||||||||||||||||||||||||||||||||||||||||||||||||||||||||||
10/1/12 to 9/30/13 | 10.82 | 0.22 | 1.16 | 1.38 | (0.28 | ) | (1.47 | ) | (1.75 | ) | (0.37 | ) | 10.45 | 13.68 | 2,185 | 1.25 | 1.54 | 1.97 | 277 | ||||||||||||||||||||||||||||||||||||||||||||||||||||||||||
10/1/11 to 9/30/12 | 9.80 | 0.30 | 1.26 | 1.56 | (0.35 | ) | (0.19 | ) | (0.54 | ) | 1.02 | 10.82 | 16.47 | 26,398 | 1.25 | 1.50 | 2.94 | 25 | |||||||||||||||||||||||||||||||||||||||||||||||||||||||||||
| International Real | |||||||||||||||||||||||||||||||||||||||||||||||||||||||||||||||||||||||||||||
Estate Securities Fund | |||||||||||||||||||||||||||||||||||||||||||||||||||||||||||||||||||||||||||||
Class A | |||||||||||||||||||||||||||||||||||||||||||||||||||||||||||||||||||||||||||||
10/1/15 to 9/30/16 | $ | 6.63 | 0.11 | 0.58 | 0.69 | (0.07 | ) | — | (0.07 | ) | 0.62 | $ | 7.25 | 10.47 | % | $ | 8,680 | 1.51 | %(8)(9) | 1.91 | % | 1.60 | % | 26 | % | ||||||||||||||||||||||||||||||||||||||||||||||||||||
10/1/14 to 9/30/15 | 7.03 | 0.28 | (0.21 | ) | 0.07 | (0.47 | ) | — | (0.47 | ) | (0.40 | ) | 6.63 | 0.94 | 12,415 | 1.50 | 1.78 | 4.09 | 27 | ||||||||||||||||||||||||||||||||||||||||||||||||||||||||||
10/1/13 to 9/30/14 | 6.61 | 0.16 | 0.39 | 0.55 | (0.13 | ) | — | (0.13 | ) | 0.42 | 7.03 | 8.61 | 11,257 | 1.50 | 1.73 | 2.38 | 32 | ||||||||||||||||||||||||||||||||||||||||||||||||||||||||||||
10/1/12 to 9/30/13 | 6.50 | 0.15 | 0.45 | 0.60 | (0.49 | ) | — | (0.49 | ) | 0.11 | 6.61 | 9.39 | 10,234 | 1.50 | 1.75 | 2.23 | 22 | ||||||||||||||||||||||||||||||||||||||||||||||||||||||||||||
10/1/11 to 9/30/12 | 5.23 | 0.16 | 1.24 | 1.40 | (0.13 | ) | — | (0.13 | ) | 1.27 | 6.50 | 27.35 | 3,916 | 1.50 | 1.85 | 2.69 | 41 | ||||||||||||||||||||||||||||||||||||||||||||||||||||||||||||
Class C | |||||||||||||||||||||||||||||||||||||||||||||||||||||||||||||||||||||||||||||
10/1/15 to 9/30/16 | $ | 6.59 | 0.07 | 0.57 | 0.64 | (0.02 | ) | — | (0.02 | ) | 0.62 | $ | 7.21 | 9.69 | % | $ | 2,006 | 2.26 | %(8)(9) | 2.68 | % | 0.97 | % | 26 | % | ||||||||||||||||||||||||||||||||||||||||||||||||||||
10/1/14 to 9/30/15 | 6.97 | 0.23 | (0.20 | ) | 0.03 | (0.41 | ) | — | (0.41 | ) | (0.38 | ) | 6.59 | 0.29 | 2,226 | 2.25 | 2.52 | 3.36 | 27 | ||||||||||||||||||||||||||||||||||||||||||||||||||||||||||
10/1/13 to 9/30/14 | 6.56 | 0.12 | 0.38 | 0.50 | (0.09 | ) | — | (0.09 | ) | 0.41 | 6.97 | 7.75 | 2,553 | 2.25 | 2.48 | 1.68 | 32 | ||||||||||||||||||||||||||||||||||||||||||||||||||||||||||||
10/1/12 to 9/30/13 | 6.48 | 0.09 | 0.46 | 0.55 | (0.47 | ) | — | (0.47 | ) | 0.08 | 6.56 | 8.55 | 1,911 | 2.25 | 2.49 | 1.35 | 22 | ||||||||||||||||||||||||||||||||||||||||||||||||||||||||||||
10/1/11 to 9/30/12 | 5.20 | 0.12 | 1.24 | 1.36 | (0.08 | ) | — | (0.08 | ) | 1.28 | 6.48 | 26.36 | 1,531 | 2.25 | 2.60 | 2.04 | 41 | ||||||||||||||||||||||||||||||||||||||||||||||||||||||||||||
The footnote legend is at the end of the financial highlights.
See Notes to Financial Statements
73
Table of Contents
VIRTUS OPPORTUNITIES TRUST
FINANCIAL HIGHLIGHTS
SELECTED PER SHARE DATA AND RATIOS FOR A SHARE OUTSTANDING
THROUGHOUT EACH PERIOD
| Net Asset Value, Beginning of Period | Net Investment Income (Loss)(2) | Net Realized and Unrealized Gain (Loss) | Total from Investment Operations | Dividends from Net Investment Income | Distributions from Net Realized Gains | Total Distributions | Change in Net Asset Value | Net Asset Value, End of Period | Total Return(1) | Net Assets, End of Period (in thousands) | Ratio of Net Expenses to Average Net Assets(7) | Ratio of Gross Expenses to Average Net Assets (before waivers and reimbursements)(7) | Ratio of Net Investment Income (Loss) to Average Net Assets | Portfolio Turnover Rate | ||||||||||||||||||||||||||||||||||||||||||||||||||||||||||||||
| International Real | |||||||||||||||||||||||||||||||||||||||||||||||||||||||||||||||||||||||||||||
Estate Securities Fund (Continued) | |||||||||||||||||||||||||||||||||||||||||||||||||||||||||||||||||||||||||||||
Class I | |||||||||||||||||||||||||||||||||||||||||||||||||||||||||||||||||||||||||||||
10/1/15 to 9/30/16 | $ | 6.64 | 0.14 | 0.56 | 0.70 | (0.08 | ) | — | (0.08 | ) | 0.62 | $ | 7.26 | 10.72 | % | $ | 24,348 | 1.26 | %(8)(9) | 1.68 | % | 1.98 | % | 26 | % | ||||||||||||||||||||||||||||||||||||||||||||||||||||
10/1/14 to 9/30/15 | 7.03 | 0.30 | (0.20 | ) | 0.10 | (0.49 | ) | — | (0.49 | ) | (0.39 | ) | 6.64 | 1.31 | 24,999 | 1.25 | 1.52 | 4.36 | 27 | ||||||||||||||||||||||||||||||||||||||||||||||||||||||||||
10/1/13 to 9/30/14 | 6.61 | 0.18 | 0.39 | 0.57 | (0.15 | ) | — | (0.15 | ) | 0.42 | 7.03 | 8.87 | 28,738 | 1.25 | 1.48 | 2.64 | 32 | ||||||||||||||||||||||||||||||||||||||||||||||||||||||||||||
10/1/12 to 9/30/13 | 6.49 | 0.15 | 0.47 | 0.62 | (0.50 | ) | — | (0.50 | ) | 0.12 | 6.61 | 9.66 | 29,999 | 1.25 | 1.49 | 2.35 | 22 | ||||||||||||||||||||||||||||||||||||||||||||||||||||||||||||
10/1/11 to 9/30/12 | 5.23 | 0.17 | 1.25 | 1.42 | (0.16 | ) | — | (0.16 | ) | 1.26 | 6.49 | 27.74 | 28,095 | 1.25 | 1.59 | 2.92 | 41 | ||||||||||||||||||||||||||||||||||||||||||||||||||||||||||||
| International | |||||||||||||||||||||||||||||||||||||||||||||||||||||||||||||||||||||||||||||
Small-Cap Fund | |||||||||||||||||||||||||||||||||||||||||||||||||||||||||||||||||||||||||||||
Class A | |||||||||||||||||||||||||||||||||||||||||||||||||||||||||||||||||||||||||||||
10/1/15 to 9/30/16 | $ | 10.85 | 0.21 | 2.38 | 2.59 | (0.20 | ) | (0.23 | ) | (0.43 | ) | 2.16 | $ | 13.01 | 24.58 | % | $ | 1,985 | 1.61 | %(8)(9) | 1.87 | % | 1.80 | % | 40 | % | |||||||||||||||||||||||||||||||||||||||||||||||||||
10/1/14 to 9/30/15 | 13.70 | 0.17 | (1.83 | ) | (1.66 | ) | (0.23 | ) | (0.96 | ) | (1.19 | ) | (2.85 | ) | 10.85 | (12.58 | ) | 1,916 | 1.60 | 1.74 | 1.41 | 64 | |||||||||||||||||||||||||||||||||||||||||||||||||||||||
10/1/13 to 9/30/14 | 13.20 | 0.47 | 0.41 | 0.88 | (0.25 | ) | (0.13 | ) | (0.38 | ) | 0.50 | 13.70 | 6.65 | 2,477 | 1.60 | 1.73 | 3.31 | 44 | |||||||||||||||||||||||||||||||||||||||||||||||||||||||||||
10/1/12 to 9/30/13 | 10.09 | 0.30 | 2.91 | 3.21 | (0.09 | ) | (0.01 | ) | (0.10 | ) | 3.11 | 13.20 | 31.97 | 403 | 1.60 | 2.51 | 2.52 | 26 | |||||||||||||||||||||||||||||||||||||||||||||||||||||||||||
9/5/12(6) to 9/30/12 | 10.00 | 0.02 | 0.07 | 0.09 | — | — | — | 0.09 | 10.09 | 0.90 | (4) | 101 | 1.60 | (3) | 16.64 | (3) | 3.65 | (3) | 0 | (4) | |||||||||||||||||||||||||||||||||||||||||||||||||||||||||
Class C | |||||||||||||||||||||||||||||||||||||||||||||||||||||||||||||||||||||||||||||
10/1/15 to 9/30/16 | $ | 10.72 | 0.12 | 2.37 | 2.49 | (0.06 | ) | (0.23 | ) | (0.29 | ) | 2.20 | $ | 12.92 | 23.76 | % | $ | 1,465 | 2.36 | %(8)(9) | 2.63 | % | 1.02 | % | 40 | % | |||||||||||||||||||||||||||||||||||||||||||||||||||
10/1/14 to 9/30/15 | 13.63 | 0.08 | (1.82 | ) | (1.74 | ) | (0.21 | ) | (0.96 | ) | (1.17 | ) | (2.91 | ) | 10.72 | (13.28 | ) | 1,464 | 2.35 | 2.49 | 0.65 | 64 | |||||||||||||||||||||||||||||||||||||||||||||||||||||||
10/1/13 to 9/30/14 | 13.16 | 0.24 | 0.54 | 0.78 | (0.18 | ) | (0.13 | ) | (0.31 | ) | 0.47 | 13.63 | 5.89 | 1,194 | 2.35 | 2.49 | 1.73 | 44 | |||||||||||||||||||||||||||||||||||||||||||||||||||||||||||
10/1/12 to 9/30/13 | 10.09 | 0.19 | 2.93 | 3.12 | (0.04 | ) | (0.01 | ) | (0.05 | ) | 3.07 | 13.16 | 30.92 | 374 | 2.35 | 3.34 | 1.62 | 26 | |||||||||||||||||||||||||||||||||||||||||||||||||||||||||||
9/5/12(6) to 9/30/12 | 10.00 | 0.02 | 0.07 | 0.09 | — | — | — | 0.09 | 10.09 | 0.90 | (4) | 107 | 2.35 | (3) | 17.43 | (3) | 2.86 | (3) | 0 | (4) | |||||||||||||||||||||||||||||||||||||||||||||||||||||||||
Class I | |||||||||||||||||||||||||||||||||||||||||||||||||||||||||||||||||||||||||||||
10/1/15 to 9/30/16 | $ | 10.89 | 0.23 | 2.40 | 2.63 | (0.25 | ) | (0.23 | ) | (0.48 | ) | 2.15 | $ | 13.04 | 24.94 | % | $ | 40,424 | 1.36 | %(8)(9) | 1.62 | % | 1.95 | % | 40 | % | |||||||||||||||||||||||||||||||||||||||||||||||||||
10/1/14 to 9/30/15 | 13.74 | 0.21 | (1.85 | ) | (1.64 | ) | (0.25 | ) | (0.96 | ) | (1.21 | ) | (2.85 | ) | 10.89 | (12.43 | ) | 40,512 | 1.35 | 1.49 | 1.70 | 64 | |||||||||||||||||||||||||||||||||||||||||||||||||||||||
10/1/13 to 9/30/14 | 13.21 | 0.36 | 0.57 | 0.93 | (0.27 | ) | (0.13 | ) | (0.40 | ) | 0.53 | 13.74 | 7.04 | 46,599 | 1.35 | 1.49 | 2.57 | 44 | |||||||||||||||||||||||||||||||||||||||||||||||||||||||||||
10/1/12 to 9/30/13 | 10.10 | 0.34 | 2.89 | 3.23 | (0.11 | ) | (0.01 | ) | (0.12 | ) | 3.11 | 13.21 | 32.13 | 18,123 | 1.35 | 2.23 | 2.82 | 26 | |||||||||||||||||||||||||||||||||||||||||||||||||||||||||||
9/5/12(6) to 9/30/12 | 10.00 | 0.03 | 0.07 | 0.10 | — | — | — | 0.10 | 10.10 | 1.00 | (4) | 2,834 | 1.35 | (3) | 16.39 | (3) | 3.89 | (3) | 0 | (4) | |||||||||||||||||||||||||||||||||||||||||||||||||||||||||
Class R6 | |||||||||||||||||||||||||||||||||||||||||||||||||||||||||||||||||||||||||||||
10/1/15 to 9/30/16 | $ | 10.89 | 0.25 | 2.39 | 2.64 | (0.27 | ) | (0.23 | ) | (0.50 | ) | 2.14 | $ | 13.03 | 25.06 | % | $ | 112 | 1.27 | %(8)(9) | 1.52 | % | 2.19 | % | 40 | % | |||||||||||||||||||||||||||||||||||||||||||||||||||
11/12/14(6) to 9/30/15 | 13.43 | 0.22 | (1.55 | ) | (1.33 | ) | (0.25 | ) | (0.96 | ) | (1.21 | ) | (2.54 | ) | 10.89 | (10.41 | )(4) | 90 | 1.27 | (3) | 1.41 | (3) | 2.02 | (3) | 64 | (4) | |||||||||||||||||||||||||||||||||||||||||||||||||||
International Wealth | |||||||||||||||||||||||||||||||||||||||||||||||||||||||||||||||||||||||||||||
Masters Fund | |||||||||||||||||||||||||||||||||||||||||||||||||||||||||||||||||||||||||||||
Class A | |||||||||||||||||||||||||||||||||||||||||||||||||||||||||||||||||||||||||||||
10/1/15 to 9/30/16 | $ | 9.52 | 0.08 | 0.88 | 0.96 | (0.12 | ) | (0.15 | ) | (0.27 | ) | 0.69 | $ | 10.21 | 10.29 | % | $ | 232 | 1.56 | %(8)(9) | 3.28 | % | 0.81 | % | 34 | % | |||||||||||||||||||||||||||||||||||||||||||||||||||
11/17/14(6) to 9/30/15 | 10.00 | 0.08 | (0.56 | ) | (0.48 | ) | — | — | — | (0.48 | ) | 9.52 | (4.80 | )(4) | 126 | 1.55 | (3) | 3.84 | (3) | 0.91 | (3) | 32 | (4) | ||||||||||||||||||||||||||||||||||||||||||||||||||||||
Class C | |||||||||||||||||||||||||||||||||||||||||||||||||||||||||||||||||||||||||||||
10/1/15 to 9/30/16 | $ | 9.46 | — | (5) | 0.87 | 0.87 | (0.05 | ) | (0.15 | ) | (0.20 | ) | 0.67 | $ | 10.13 | 9.39 | % | $ | 115 | 2.31 | %(8)(9) | 4.27 | % | 0.00 | % | 34 | % | ||||||||||||||||||||||||||||||||||||||||||||||||||
11/17/14(6) to 9/30/15 | 10.00 | 0.01 | (0.55 | ) | (0.54 | ) | — | — | — | (0.54 | ) | 9.46 | (5.40 | )(4) | 114 | 2.30 | (3) | 4.59 | (3) | 0.14 | (3) | 32 | (4) | ||||||||||||||||||||||||||||||||||||||||||||||||||||||
Class I | |||||||||||||||||||||||||||||||||||||||||||||||||||||||||||||||||||||||||||||
10/1/15 to 9/30/16 | $ | 9.54 | 0.10 | 0.89 | 0.99 | (0.14 | ) | (0.15 | ) | (0.29 | ) | 0.70 | $ | 10.24 | 10.62 | % | $ | 5,089 | 1.31 | %(8)(9) | 3.25 | % | 1.01 | % | 34 | % | |||||||||||||||||||||||||||||||||||||||||||||||||||
11/17/14(6) to 9/30/15 | 10.00 | 0.11 | (0.57 | ) | (0.46 | ) | — | — | — | (0.46 | ) | 9.54 | (4.60 | )(4) | 4,602 | 1.30 | (3) | 3.56 | (3) | 1.19 | (3) | 32 | (4) | ||||||||||||||||||||||||||||||||||||||||||||||||||||||
The footnote legend is at the end of the financial highlights.
See Notes to Financial Statements
74
Table of Contents
VIRTUS OPPORTUNITIES TRUST
FINANCIAL HIGHLIGHTS
SELECTED PER SHARE DATA AND RATIOS FOR A SHARE OUTSTANDING
THROUGHOUT EACH PERIOD
Footnote Legend
| (1) | Sales charges, where applicable, are not reflected in the total return calculation. |
| (2) | Computed using average shares outstanding. |
| (3) | Annualized. |
| (4) | Not annualized. |
| (5) | Amount is less than $0.005. |
| (6) | Inception date. |
| (7) | The Funds will also indirectly bear their prorated share of expenses of the underlying funds in which they invest. Such expenses are not included in the calculation of this ratio. |
| (8) | Earnings credits from custodian were not material, as reflected in the Statements of Operations, and had no impact on Financial Highlights. |
| (9) | Net expense ratios include extraordinary proxy expenses. |
See Notes to Financial Statements
75
Table of Contents
VIRTUS OPPORTUNITIES TRUST
SEPTEMBER 30, 2016
| Note | 1. Organization |
Virtus Opportunities Trust (the “Trust”) is organized as a Delaware statutory trust and is registered under the Investment Company Act of 1940, as amended (the “1940 Act”), as an open-end management investment company.
As of the date of this report, 31 funds of the Trust are offered for sale, of which 11 (each a “Fund”) are reported in this annual report.
Each Fund has a distinct investment objective and is diversified.
The Funds’ investment objectives are outlined in each Fund’s summary page.
All of the Funds offer Class A shares, Class C shares, and Class I shares. Class B shares are no longer available for purchase by new or existing shareholders, except by existing shareholders through Qualifying Transactions. The International Small-Cap Fund also offers Class R6 shares. For information regarding Qualifying Transactions, refer to each Fund’s prospectus.
Class A shares of the Emerging Markets Debt Fund are sold with a front-end sales charge of up to 3.75%. Class A shares of the remaining Funds are sold with a front-end sales charge of up to 5.75% with some exceptions. Generally, Class A shares are not subject to any charges by the Funds when redeemed; however, a 0.50% – 1% contingent deferred sales charge (“CDSC”) may be imposed on certain redemptions made within a certain period following purchases on which a finder’s fee has been paid. The period for which the CDSC applies for the Funds is 18 months. The CDSC period begins on the last day of the month preceding the month in which the purchase was made.
Class B shares were generally sold with a CDSC, which declines from 5% to zero depending on the period of time the shares are held. Class C shares are generally sold with a 1% CDSC, applicable if redeemed within one year of purchase. Class I shares and Class R6 shares are sold without a front-end sales charge or CDSC. Class R6 shares are only available to participants in employer-sponsored retirement plans, such as 401(k) plans, profit-sharing plans, defined benefit plans and other employer-directed plans. Class R6 shares do not carry sales commissions or pay Rule 12b-1 fees. No compensation, administrative payments, sub-transfer agency payments or service payments are paid to brokers or other entities from fund assets or the Distributor’s or an affiliate’s resources on sales of or investments in Class R6 Shares.
Virtus Mutual Funds may impose an annual fee on accounts having balances of less than $2,500. The small account fee may be waived in certain circumstances, as disclosed in the prospectuses and/or statements of additional information. The fees collected will be used to offset certain expenses of the Funds. These fees are reflected as “Low Balance Account Fees” in each Fund’s Statements of Operations for the period, as applicable.
Each Class of shares has identical voting, dividend, liquidation and other rights and the same terms and conditions, except that each Class bears different distribution and/or service fees under a Board-approved Rule 12b-1 and/or shareholder service plan (“12b-1 Plan”) and has exclusive voting rights with respect to such plans. Class I shares and Class R6 shares are not subject to a 12b-1 Plan. Income and other expenses as well as realized and unrealized gains and losses of each Fund are borne pro rata by the holders of each Class of shares.
| Note | 2. Significant Accounting Policies |
The significant accounting policies consistently followed by the Trust in the preparation of its financial statements are summarized below and for derivatives, included in Note 3 below. The preparation of financial statements in conformity with accounting principles generally accepted in the United States of America requires management to make estimates and assumptions that affect the reported amounts of assets and liabilities, and disclosure of contingent assets and liabilities at the date of the financial statements and the reported amounts of increases and decreases in net assets from operations during the reporting period. Actual results could differ from those estimates and those differences could be significant.
| A. | Security Valuation |
Security valuation procedures for each Fund, which include nightly price variance, as well as back-testing such as bi-weekly unchanged price, monthly secondary source and transaction analysis, have been approved by the Board of Trustees (the “Board”, or the “Trustees”). All internally fair valued securities are approved by a valuation committee (the “Valuation Committee”) appointed by the Board. The Valuation Committee is comprised of certain members of management as identified to the Board and convenes independently from portfolio management. All internally fair valued securities are updated daily and reviewed in detail by the Valuation Committee monthly unless changes occur within the period. The Valuation Committee reviews the validity of the model inputs and any changes to the model. Quarterly fair valuations are reviewed by the Board.
Each Fund utilizes a fair value hierarchy which prioritizes the inputs to valuation techniques used to measure fair value into three broad levels. The Funds’ policy is to recognize transfers between levels at the end of the reporting period.
| • Level 1 – | quoted prices in active markets for identical securities (security types generally include listed equities). |
| • Level 2 – | prices determined using other significant observable inputs (including quoted prices for similar securities, interest rates, prepayment speeds, credit risk, etc.). |
| • Level 3 – | prices determined using significant unobservable inputs (including the Valuation Committee’s own assumptions in determining the fair value of investments). |
A description of the valuation techniques applied to a Fund’s major categories of assets and liabilities measured at fair value on a recurring basis is as follows:
Equity securities are valued at the official closing price (typically last sale) on the exchange on which the securities are primarily traded or, if no closing price is available, at the last bid price and are categorized as Level 1 in the hierarchy. Restricted equity securities and private placements that are not widely traded, are illiquid, or are internally fair valued by the Valuation Committee, are generally categorized as Level 3 in the hierarchy.
Certain non-U.S. securities may be fair valued in cases where closing prices are not readily available or are deemed not reflective of readily available market prices. For example, significant events (such as movement in the U.S. securities market, or other regional and local developments) may occur between the time that non-U.S. markets close (where the security is principally traded) and the time that a Fund calculates its net asset value (“NAV”) (at the close of regular trading on the New York Stock Exchange (“NYSE”), generally 4 p.m. Eastern time)
76
Table of Contents
VIRTUS OPPORTUNITIES TRUST
NOTES TO FINANCIAL STATEMENTS (Continued)
SEPTEMBER 30, 2016
that may impact the value of securities traded in these non-U.S. markets. In such cases the Funds fair value non-U.S. securities using an independent pricing service which considers the correlation of the trading patterns of the non-U.S. security to the intraday trading in the U.S. markets for investments such as ADRs, financial futures, ETFs, and certain indexes, as well as prices for similar securities. Such fair valuations are categorized as Level 2 in the hierarchy. Because the frequency of significant events is not predictable, fair valuation of certain non-U.S. common stocks may occur on a frequent basis.
Debt securities, including restricted securities, are valued based on evaluated quotations received from independent pricing services or from dealers who make markets in such securities. For most bond types, the pricing service utilizes matrix pricing that considers one or more of the following factors: yield or price of bonds of comparable quality, coupon, maturity, current cash flows, type, and current day trade information, as well as dealer-supplied prices. These valuations are generally categorized as Level 2 in the hierarchy. Structured debt instruments, such as mortgage-backed and asset-backed securities, may also incorporate collateral analysis and utilize cash flow models for valuation and are generally categorized as Level 2 in the hierarchy. Pricing services do not provide pricing for all securities and therefore indicative bids from dealers are utilized which are based on pricing models used by market makers in the security and are generally categorized as Level 2 in the hierarchy. Debt securities that are not widely traded, are illiquid, or are internally fair valued by the Valuation Committee, are generally categorized as Level 3 in the hierarchy.
Listed derivatives, such as treasury futures, that are actively traded are valued based on quoted prices from the exchange and are categorized as Level 1 in the hierarchy. Over-the-counter derivative contracts, which include forward currency contracts and equity-linked instruments, do not require material subjectivity as pricing inputs are observed from actively quoted markets and are categorized as Level 2 in the hierarchy.
Investments in open-end mutual funds are valued at NAV. Investments in closed-end funds are valued as of the close of regular trading on the NYSE each business day. Both are categorized as Level 1 in the hierarchy.
A summary of the inputs used to value a Fund’s net assets by each major security type is disclosed at the end of the Schedule of Investments for each Fund. The inputs or methodologies used for valuing securities are not necessarily an indication of the risk associated with investing in those securities.
| B. | Security Transactions and Investment Income |
Security transactions are recorded on the trade date. Realized gains and losses from sales of securities are determined on the identified cost basis. Dividend income is recognized on the ex-dividend date or, in the case of certain foreign securities, as soon as a Fund is notified. Interest income is recorded on the accrual basis. Each Fund amortizes premiums and accretes discounts using the effective interest method. Any distributions from underlying funds are recorded in accordance with the character of the distributions as designated by the underlying funds.
Dividend income from REIT investments is recorded using management’s estimate of the income included in distributions received from the REIT investments. Distributions received in excess of this estimated amount are recorded as a reduction of the cost of investments or reclassified to capital gains. The actual amounts of income, return of capital, and capital gains are only determined by each domestic REIT after its fiscal year-end, and may differ from the estimated amounts.
| C. | Income Taxes |
Each Fund is treated as a separate taxable entity. It is the intention of each Fund to comply with the requirements of Subchapter M of the Internal Revenue Code and to distribute substantially all of its taxable income to its shareholders. Therefore, no provision for federal income taxes or excise taxes has been made.
Certain Funds may be subject to foreign taxes on income, gains on investments or currency repatriation, a portion of which may be recoverable. Each Fund will accrue such taxes and recoveries as applicable based upon current interpretations of the tax rules and regulations that exist in the markets in which it invests.
Management of the Funds has concluded that there are no significant uncertain tax positions that would require recognition in the financial statements. As of September 30, 2016, the tax years that remain subject to examination by the major tax jurisdictions under the statute of limitations are from the year 2013 forward (with limited exceptions).
| D. | Distributions to Shareholders |
Distributions are recorded by each Fund on the ex-dividend date. Emerging Markets Debt Fund income distributions are declared and recorded daily and distributed monthly. Income and capital gain distributions are determined in accordance with income tax regulations that may differ from accounting principles generally accepted in the United States of America. These differences may include the treatment of non-taxable dividends, market premium and discount, non-deductible expenses, expiring capital loss carryovers, foreign currency gain or loss, gain or loss on futures contracts, partnerships, operating losses and losses deferred due to wash sales. Permanent book and tax basis differences relating to shareholder distributions will result in reclassifications to capital paid in on shares of beneficial interest.
| E. | Expenses |
Expenses incurred together by a Fund and other affiliated mutual funds are allocated in proportion to the net assets of each such fund, except where allocation of direct expense to each fund or an alternative allocation method can be more appropriately used.
In addition to the net annual operating expenses that a Fund bears directly, the shareholders of a Fund indirectly bear the pro rata expenses of any underlying mutual funds in which the Fund invests.
| F. | Foreign Currency Translation |
Non-U.S. investment securities and other assets and liabilities denominated in foreign currencies are translated into U.S. dollar amounts at the foreign currency exchange rate effective at the end of the reporting period. Cost of investments is translated at the currency exchange rate effective at the trade date. The gain or loss resulting from a change in currency exchange rates between the trade and settlement date of a portfolio transaction is treated as a gain or loss on foreign currency. Likewise, the gain or loss resulting from a change in currency exchange rates between
77
Table of Contents
VIRTUS OPPORTUNITIES TRUST
NOTES TO FINANCIAL STATEMENTS (Continued)
SEPTEMBER 30, 2016
the date income is accrued and the date it is paid is treated as a gain or loss on foreign currency. The Funds do not isolate that portion of the results of operations arising from changes in foreign exchange rates on investments from the fluctuations arising from changes in the market prices of securities held. Such fluctuations are included with the net realized and unrealized gain or loss on investments.
| G. | Loan Agreements |
Certain Funds may invest in direct debt instruments which are interests in amounts owed by a corporate, governmental, or other borrower to lenders or lending syndicates. Loan agreements are generally non-investment grade and often involve borrowers that are highly leveraged. The Funds may invest in obligations of borrowers who are in bankruptcy proceedings. Loan agreements are typically senior in the corporate capital structure of the borrower. A loan is often administered by a bank or other financial institution (the “lender”) that acts as agent for all holders. The agent administers the terms of the loan, as specified in the loan agreement. A Fund’s investments in loans may be in the form of participations in loans or assignments of all or a portion of loans from third parties. When investing in loan participations, a Fund has the right to receive payments of principal, interest and any fees to which it is entitled only from the lender selling the loan participation and only upon receipt by the lender of payments from the borrower. A Fund generally has no right to enforce compliance with the terms of the loan agreement with the borrower. As a result, a Fund may be subject to the credit risk of both the borrower and the lender that is selling the loan agreement. When a Fund purchases assignments from lenders it acquires direct rights against the borrower on the loan.
A Fund may invest in multiple series or tranches of a loan, which may have varying terms and carry different associated risks. Loan agreements may involve foreign borrowers and investments may be denominated in foreign currencies. Direct indebtedness of emerging countries involves a risk that the government entities responsible for the repayment of the debt may be unable, or unwilling, to pay the principal and interest when due.
The loan agreements have floating rate loan interests which generally pay interest at rates that are periodically determined by reference to a base lending rate plus a premium. The base lending rates are generally LIBOR (London Interbank Offered Rate), the prime rate offered by one or more U.S. banks or the certificate of deposit rate. When a loan agreement is purchased a Fund may pay an assignment fee. On an ongoing basis, a Fund may receive a commitment fee based on the undrawn portion of the underlying line of credit portion of a loan agreement. Prepayment penalty fees are received upon the prepayment of a loan agreement by a borrower. Prepayment penalty, facility, commitment, consent and amendment fees are recorded to income as earned or paid.
At September 30, 2016, the Funds only hold assignment loans.
| H. | Securities Lending |
Certain Funds may loan securities to qualified brokers through an agreement with Brown Brothers Harriman (“BBH”), as a third party lending agent. Under the terms of the agreement, when doing so the Fund is required to maintain collateral with a market value not less than 100% of the market value of loaned securities. Collateral is adjusted daily in connection with changes in the market value of securities on loan. Collateral may consist of cash and securities issued by the U.S. Government or its agencies. Cash collateral is invested in a short-term money market fund. Dividends earned on the collateral and premiums paid by the broker are recorded as income by a Fund net of fees and rebates charged by BBH for its services as securities lending agent and in connection with this securities lending program. Lending portfolio securities involves a risk of delay in the recovery of the loaned securities or in the declining value of the collateral.
At September 30, 2016, the Greater European Opportunities Fund, International Small-Cap Fund and International Wealth Masters Fund had securities on loan with market values of $14, $128 and $82, and cash collateral of $15, $134 and $86, respectively ($ reported in thousands).
| I. | Earnings Credit and Interest |
Through arrangements with each Fund’s custodian, each Fund either receives an earnings credit or interest on agreed upon target un-invested cash balances to reduce each Fund’s custody expenses. The credits are reflected as “Earnings credit from Custodian” and the interest is reflected under “Interest income” in each Fund’s Statements of Operations for the period, as applicable.
| Note | 3. Derivative Financial Instruments and Transactions |
($ reported in thousands)
Disclosures about derivative instruments and hedging activities are intended to enable investors to understand how and why a Fund uses derivatives, how derivatives are accounted for, and how derivative instruments affect a Fund’s results of operations and financial position. Summarized below are such disclosures and accounting policies for each specific type of derivative instrument used by certain Funds.
Forward Currency Contracts: A forward currency contract involves an obligation to purchase or sell a specific currency at a future date, which may be any number of days from the date of the contract agreed upon by the parties, at a price set at the time of the contract. These contracts are traded directly between currency traders and their customers. The contract is marked-to-market daily and the change in market value is recorded by the Funds as an unrealized gain or loss in the Statements of Operations. When the contract is closed or offset with the same counterparty, on settlement date, the Funds record a realized gain or loss equal to the change in the value of the contract when it was opened and the value at the time it was closed or offset. This is presented in the Statements of Operations as net realized gain (loss) from foreign currency transactions.
Funds enter into forward currency contracts in conjunction with the planned purchase or sale of foreign denominated securities in order to hedge the U.S. dollar cost or proceeds. The Funds also, from time to time, hedge the currency exposure of foreign denominated securities, held in the portfolio, back to U.S. dollars during perceived times of U.S. dollar strength. This is done in order to protect the U.S. dollar value of the portfolio. Forward currency contracts involve, to varying degrees, elements of market risk in excess of the amount recognized in the Statement of Assets and Liabilities. Risks arise from the possible movements in foreign exchange rates or if the counterparty does not perform under the contract.
The International Equity Fund invested in derivative instruments during the reporting period in the form of forward currency contracts. The primary type of risk associated with forward currency contracts is the risk associated with the conversion of foreign currency to U.S. dollars. The Fund may invest in forward currency contracts in an attempt to manage such risk and protect the U.S. dollar value of the portfolio.
78
Table of Contents
VIRTUS OPPORTUNITIES TRUST
NOTES TO FINANCIAL STATEMENTS (Continued)
SEPTEMBER 30, 2016
These forward currency contracts were executed under the ISDA 2002 Master Agreement without any Schedule thereto and without the requirement of posting any collateral to the counterparty.
For the period ended September 30, 2016, the International Equity Fund had less than $500 (not in thousands) in realized gain (loss) on foreign currency exchange contracts recognized in the Statement of Operations.
The Emerging Markets Small-Cap Fund sold warrants during the reporting period. The primary type of risk associated with warrants is equity risk. The outstanding warrants during the year were approximately consistent with the warrants at year-end. At September 30, 2016, there were no warrants outstanding.
The effect of warrants on the Statement of Operations for the period ended September 30, 2016, was as follows:
Location of Gain (Loss) on Warrants | Realized Gain (Loss) on Warrants Recognized in Income | Change in Unrealized Appreciation (Depreciation) on Derivatives Recognized in Income | ||||||||
Warrants | Net realized gain (loss) on investments and net change in unrealized appreciation (depreciation) on investments | $ | 6 | $ | (16 | ) | ||||
| Note | 4. Investment Advisory Fees and Related Party Transactions |
($ reported in thousands except as noted)
| A. | Adviser |
Virtus Investment Advisers, Inc. (the “Adviser”), an indirect wholly owned subsidiary of Virtus Investment Partners, Inc. (“Virtus”), is the adviser to the Trust. The Adviser manages the Funds’ investment programs and general operations of the Funds, including oversight of the Funds’ subadvisers.
As compensation for its services to the Funds, the Adviser is entitled to a fee based upon the following annual rates as a percentage of the average daily net assets of each Fund:
| First $1 Billion | $1+ Billion | |||||||||||
Emerging Markets Debt Fund | 0.75 | % | 0.70 | % | ||||||||
Emerging Markets Equity Income Fund | 1.05 | 1.00 | ||||||||||
Emerging Markets Small-Cap Fund | 1.20 | 1.15 | ||||||||||
Greater European Opportunities Fund | 0.85 | 0.80 | ||||||||||
International Small-Cap Fund | 1.00 | 0.95 | ||||||||||
International Wealth Masters Fund | 0.90 | 0.85 | ||||||||||
| First $1 Billion | $1+ Billion through $2 Billion | $2+ Billion | ||||||||||
Global Infrastructure Fund | 0.65 | % | 0.60 | % | 0.55 | % | ||||||
Global Opportunities Fund | 0.85 | 0.80 | 0.75 | |||||||||
Global Real Estate Securities Fund | 0.85 | 0.80 | 0.75 | |||||||||
International Real Estate Securities Fund | 1.00 | 0.95 | 0.90 | |||||||||
| First $2 Billion | $2+ Billion through $4 Billion | $4+ Billion | ||||||||||
International Equity Fund | 0.85 | % | 0.80 | % | 0.75 | % | ||||||
During the period covered by these financial statements, the Emerging Markets Debt Fund invested a portion of its assets in Virtus Credit Opportunities Fund, an affiliated mutual fund. In order to avoid any duplication of advisory fees, the Adviser has voluntarily waived its advisory fees in an amount equal to that which would otherwise be paid by the Fund on the assets invested in the Credit Opportunities Fund. For the period covered by these financial statements, the waiver amounted to $1. This waiver is in addition to the expense limitation and/or fee waiver covered elsewhere in these financial statements and is included in the Statement of Operations in “expenses reimbursed and/or waived by the investment adviser”.
| B. | Subadvisers |
The subadvisers manage the investments of each Fund for which they are paid a fee by the Adviser. The subadvisers and the Funds they serve are as follows:
Fund | Subadviser | Fund | Subadviser | |||
Emerging Markets Debt Fund | NF(1) | Greater European Opportunities Fund | Vontobel(5) | |||
Emerging Markets Equity Income fund | KBI(2) | International Equity Fund | DPIM(4)(7) | |||
| Emerging Markets Small-Cap Fund | KAR(3) | International Real Estate Securities Fund | DPIM(4) | |||
Global Infrastructure Fund | DPIM(4) | International Small-Cap Fund | KAR(3) | |||
Global Opportunities Fund | Vontobel(5) | International Wealth Masters Fund | Horizon(6) | |||
Global Real Estate Securities Fund | DPIM(4) |
| (1) | Newfleet Asset Management, LLC, an indirect wholly owned subsidiary of Virtus. |
| (2) | KBI Global Investors (North America) Ltd. |
| (3) | Kayne Anderson Rudnick Investment Management, LLC, an indirect wholly owned subsidiary of Virtus. |
| (4) | Duff & Phelps Investment Management Co., an indirect wholly owned subsidiary of Virtus. |
| (5) | Vontobel Asset Management, Inc. |
| (6) | Horizon Asset Management, LLC |
| (7) | Prior to September 7, 2016, Euclid Advisors LLC, an indirect wholly owned subsidiary of Virtus, was the subadviser to this Fund. (The portfolio manager did not change.) |
79
Table of Contents
VIRTUS OPPORTUNITIES TRUST
NOTES TO FINANCIAL STATEMENTS (Continued)
SEPTEMBER 30, 2016
| C. | Expense Limits and Fee Waivers |
The Adviser has contractually agreed to limit the following Fund’s total operating expenses (excluding dividend and interest expenses, taxes, brokerage commissions, extraordinary expenses, and acquired fund fees and expenses), so that such expenses do not exceed the following percentages of the Fund’s average daily net asset values as listed below.
| Class A | Class B | Class C | Class I | Class R6 | Through Date | |||||||||||||||||||
Emerging Markets Debt Fund | 1.35 | % | — | % | 2.10 | % | 1.10 | % | — | % | 1/31/17 | |||||||||||||
Emerging Markets Equity Income Fund | 1.75 | — | 2.50 | 1.50 | — | 1/31/17 | ||||||||||||||||||
Emerging Markets Small-Cap Fund | 1.85 | — | 2.60 | 1.60 | — | 1/31/17 | ||||||||||||||||||
Global Opportunities Fund | 1.55 | 2.30 | 2.30 | 1.30 | — | 1/31/17 | ||||||||||||||||||
Global Real Estate Securities Fund | 1.40 | — | 2.15 | 1.15 | — | 1/31/17 | ||||||||||||||||||
Greater European Opportunities Fund | 1.45 | — | 2.20 | 1.20 | — | 1/31/17 | ||||||||||||||||||
International Equity Fund | 1.50 | — | 2.25 | 1.25 | — | 1/31/17 | ||||||||||||||||||
International Real Estate Securities Fund | 1.50 | — | 2.25 | 1.25 | — | 1/31/17 | ||||||||||||||||||
International Small-Cap Fund | 1.60 | — | 2.35 | 1.35 | 1.26 | 1/31/17 | ||||||||||||||||||
International Wealth Masters Fund | 1.55 | — | 2.30 | 1.30 | — | 1/31/17 | ||||||||||||||||||
| D. | Expense Recapture |
For certain Funds, the Adviser may recapture operating expenses waived or reimbursed under these arrangements, within three years after the date on which such waiver or reimbursement occurred. A Fund must pay its ordinary operating expenses before the Adviser is entitled to any reimbursement and must remain in compliance with any applicable expense limitations or, if none, the expense limitation in effect at the time of the waiver or reimbursement. All or a portion of the following Adviser reimbursed expenses may be recaptured as follows:
| Fiscal Year Ended | ||||||||||||||||
| 2017 | 2018 | 2019 | Total | |||||||||||||
Emerging Markets Debt Fund | $ | 40 | $ | 38 | $ | 50 | $ | 128 | ||||||||
Emerging Markets Equity Income Fund | 13 | 6 | 124 | $ | 143 | |||||||||||
Emerging Markets Small-Cap Fund | 80 | 79 | 87 | $ | 246 | |||||||||||
Global Real Estate Securities Fund | 79 | 79 | 164 | $ | 322 | |||||||||||
Greater European Opportunities Fund | 80 | 84 | 92 | $ | 256 | |||||||||||
International Equity Fund | 74 | 71 | 96 | $ | 241 | |||||||||||
International Real Estate Securities Fund | 100 | 114 | 152 | $ | 366 | |||||||||||
International Small-Cap Fund | 60 | 67 | 108 | $ | 235 | |||||||||||
International Wealth Masters Fund | — | 101 | 98 | $ | 199 | |||||||||||
| E. | Distributor |
VP Distributors, LLC (“VP Distributors”), an indirect wholly owned subsidiary of Virtus, serves as the distributor of each Fund’s shares. VP Distributors has advised the Funds that for the fiscal year (the “period”) ended September 30, 2016, it retained net commissions of $32 for Class A shares and deferred sales charges of $1, $—*, and $14 for Class A shares, Class B shares, and Class C shares, respectively.
* Amount is less than $500.
In addition, each Fund pays VP Distributors distribution and/or service fees under a 12b-1 Plan as a percentage of the average daily net assets of each respective class at the annual rates as follows: Class A shares 0.25%; Class B shares 1.00%; Class C shares 1.00%; Class I shares and Class R6 shares are not subject to a 12b-1 Plan.
Under certain circumstances, shares of certain Virtus Mutual Funds may be exchanged for shares of the same class of certain other Virtus Mutual Funds on the basis of the relative NAV per share at the time of the exchange. On exchanges with share classes that carry a CDSC, the CDSC schedule of the original shares purchased continues to apply.
| F. | Administrator and Transfer Agent |
Virtus Fund Services, LLC, an indirect wholly owned subsidiary of Virtus, serves as the administrator and transfer agent to the Funds.
For the period ended September 30, 2016, the Funds incurred administration fees totaling $591 which are included in the Statements of Operations.
For the period ended September 30, 2016, the Funds incurred transfer agent fees totaling $912 which are included in the Statements of Operations. A portion of these fees was paid to outside entities that also provide services to the Trust.
| G. | Affiliated Shareholders |
At September 30, 2016, Virtus and its affiliates held shares of certain Funds, which may be redeemed at any time, that aggregated the following:
| Shares | Aggregate Net Asset Value | |||||||
| Emerging Markets Debt Fund | ||||||||
Class A | 12,037 | $ | 114 | |||||
Class C | 11,683 | 110 | ||||||
Class I | 3,015,728 | 28,499 | ||||||
80
Table of Contents
VIRTUS OPPORTUNITIES TRUST
NOTES TO FINANCIAL STATEMENTS (Continued)
SEPTEMBER 30, 2016
| Shares | Aggregate Net Asset Value | |||||||
| Emerging Markets Equity Income Fund | ||||||||
Class A | 11,064 | $ | 100 | |||||
Class C | 10,784 | 97 | ||||||
Class I | 256,887 | 2,322 | ||||||
| Emerging Markets Small-Cap Fund | ||||||||
Class A | 10,589 | 98 | ||||||
Class C | 10,346 | 96 | ||||||
Class I | 297,751 | 2,772 | ||||||
| Global Infrastructure Fund | ||||||||
Class I | 684,076 | 9,734 | ||||||
| Global Real Estate Securities Fund | ||||||||
Class I | 176,175 | 5,143 | ||||||
| International Equity Fund | ||||||||
Class A | 9,905 | 101 | ||||||
Class C | 9,922 | 99 | ||||||
Class I | 80,097 | 816 | ||||||
| International Real Estate Securities Fund | ||||||||
Class A | 314,922 | 2,283 | ||||||
Class I | 766,372 | 5,564 | ||||||
| International Small-Cap Fund | ||||||||
Class R6 | 8,599 | 112 | ||||||
| International Wealth Masters Fund | ||||||||
Class A | 10,283 | 105 | ||||||
Class C | 10,215 | 103 | ||||||
Class I | 494,692 | 5,065 | ||||||
| H. | Investments in Affiliates |
A summary of the Emerging Markets Debt Fund’s total long-term and short-term purchases and sales of affiliated underlying funds during the period ended September 30, 2016, is as follows:
| Value, beginning of period | Purchases | Sales Proceeds | Value, end of period | Dividend Income | Distributions of Realized Gains | |||||||||||||||||||
Virtus Credit Opportunities Fund | $ | 143 | $ | 2 | $ | 144 | $ | — | $ | 4 | $ | — | ||||||||||||
| I. | Trustee Compensation |
The Trust provides a deferred compensation plan for its Trustees who receive compensation from the Trust. Under the deferred compensation plan, Trustees may elect to defer all or a portion of their compensation. Amounts deferred are retained by the Trust, and then, to the extent permitted by the 1940 Act, in turn, may be invested in the shares of affiliated or unaffiliated mutual funds selected by the participating Trustees. Investments in such instruments are included in “Other Assets” on the Statement of Assets and Liabilities at September 30, 2016.
| Note | 5. Purchases and Sales of Securities |
($ reported in thousands)
Purchases and sales of securities (excluding U.S. Government and agency securities, forward currency contracts, futures and short-term securities) during the period ended September 30, 2016, were as follows:
| Purchases | Sales | |||||||
Emerging Markets Debt Fund | $ | 13,587 | $ | 13,159 | ||||
Emerging Markets Equity Income Fund | 24,618 | 40,504 | ||||||
Emerging Markets Small-Cap Fund | 1,467 | 1,651 | ||||||
Global Infrastructure Fund | 21,472 | 64,420 | ||||||
Global Opportunities Fund | 71,131 | 45,998 | ||||||
Global Real Estate Securities Fund | 130,367 | 27,988 | ||||||
Greater European Opportunities Fund | 12,714 | 12,067 | ||||||
International Equity Fund | 4,183 | 7,279 | ||||||
International Real Estate Securities Fund | 9,440 | 17,521 | ||||||
International Small-Cap Fund | 15,932 | 23,904 | ||||||
International Wealth Masters Fund | 1,820 | 1,708 | ||||||
There were no purchases or sales of long-term U.S. Government and agency securities for the Funds during the period ended September 30, 2016.
81
Table of Contents
VIRTUS OPPORTUNITIES TRUST
NOTES TO FINANCIAL STATEMENTS (Continued)
SEPTEMBER 30, 2016
| Note | 6. Capital Share Transactions |
(reported in thousands)
Transactions in shares of capital stock, during the periods ended as indicated below, were as follows:
| Emerging Markets Debt Fund | Emerging Markets Equity Income Fund | |||||||||||||||||||||||||||||||
| Year Ended September 30, 2016 | Year Ended September 30, 2015 | Year Ended September 30, 2016 | Year Ended September 30, 2015 | |||||||||||||||||||||||||||||
| SHARES | AMOUNT | SHARES | AMOUNT | SHARES | AMOUNT | SHARES | AMOUNT | |||||||||||||||||||||||||
| Class A | ||||||||||||||||||||||||||||||||
| Sale of shares | 32 | $ | 284 | 24 | $ | 221 | 68 | $ | 545 | 29 | $ | 291 | ||||||||||||||||||||
| Reinvestment of distributions | 3 | 30 | 4 | 34 | 3 | 25 | 3 | 27 | ||||||||||||||||||||||||
| Shares repurchased | (29 | ) | (247 | ) | (45 | ) | (414 | ) | (62 | ) | (517 | ) | (59 | ) | (589 | ) | ||||||||||||||||
|
|
|
|
|
|
|
|
|
|
|
|
|
|
|
| |||||||||||||||||
| Net Increase / (Decrease) | 6 | $ | 67 | (17 | ) | $ | (159 | ) | 9 | $ | 53 | (27 | ) | $ | (271 | ) | ||||||||||||||||
|
|
|
|
|
|
|
|
|
|
|
|
|
|
|
| |||||||||||||||||
| Class C | ||||||||||||||||||||||||||||||||
| Sale of shares | 9 | $ | 73 | 44 | $ | 408 | 9 | $ | 73 | 26 | $ | 248 | ||||||||||||||||||||
| Reinvestment of distributions | 2 | 15 | 3 | 26 | 2 | 15 | 1 | 15 | ||||||||||||||||||||||||
| Shares repurchased | (37 | ) | (317 | ) | (62 | ) | (571 | ) | (17 | ) | (143 | ) | (26 | ) | (253 | ) | ||||||||||||||||
|
|
|
|
|
|
|
|
|
|
|
|
|
|
|
| |||||||||||||||||
| Net Increase / (Decrease) | (26 | ) | $ | (229 | ) | (15 | ) | $ | (137 | ) | (6 | ) | $ | (55 | ) | 1 | $ | 10 | ||||||||||||||
|
|
|
|
|
|
|
|
|
|
|
|
|
|
|
| |||||||||||||||||
| Class I | ||||||||||||||||||||||||||||||||
| Sale of shares | 25 | $ | 214 | 144 | $ | 1,329 | 846 | $ | 7,254 | 1,722 | $ | 16,430 | ||||||||||||||||||||
| Reinvestment of distributions | 139 | 1,237 | 143 | 1,307 | 21 | 169 | 34 | 343 | ||||||||||||||||||||||||
| Shares repurchased | (36 | ) | (306 | ) | (574 | ) | (5,295 | ) | (2,659 | ) | (21,778 | ) | (4,333 | ) | (41,211 | ) | ||||||||||||||||
|
|
|
|
|
|
|
|
|
|
|
|
|
|
|
| |||||||||||||||||
| Net Increase / (Decrease) | 128 | $ | 1,145 | (287 | ) | $ | (2,659 | ) | (1,792 | ) | $ | (14,355 | ) | (2,577 | ) | $ | (24,438 | ) | ||||||||||||||
|
|
|
|
|
|
|
|
|
|
|
|
|
|
|
| |||||||||||||||||
| Emerging Markets Small-Cap Fund | Global Infrastructure Fund | |||||||||||||||||||||||||||||||
| Year Ended September 30, 2016 | Year Ended September 30, 2015 | Year Ended September 30, 2016 | Year Ended September 30, 2015 | |||||||||||||||||||||||||||||
| SHARES | AMOUNT | SHARES | AMOUNT | SHARES | AMOUNT | SHARES | AMOUNT | |||||||||||||||||||||||||
| Class A | ||||||||||||||||||||||||||||||||
| Sale of shares | 9 | $ | 76 | 25 | $ | 240 | 578 | $ | 7,838 | 2,224 | $ | 33,956 | ||||||||||||||||||||
| Reinvestment of distributions | 1 | 6 | 1 | 8 | 361 | 4,488 | 153 | 2,277 | ||||||||||||||||||||||||
| Shares repurchased | (11 | ) | (88 | ) | (5 | ) | (38 | ) | (1,802 | ) | (24,238 | ) | (1,863 | ) | (27,573 | ) | ||||||||||||||||
|
|
|
|
|
|
|
|
|
|
|
|
|
|
|
| |||||||||||||||||
| Net Increase / (Decrease) | (1 | ) | $ | (6 | ) | 21 | $ | 210 | (863 | ) | $ | (11,912 | ) | 514 | $ | 8,660 | ||||||||||||||||
|
|
|
|
|
|
|
|
|
|
|
|
|
|
|
| |||||||||||||||||
| Class C | ||||||||||||||||||||||||||||||||
| Sale of shares | 2 | $ | 14 | — | (1) | $ | 4 | 221 | $ | 2,931 | 2,414 | $ | 36,729 | |||||||||||||||||||
| Reinvestment of distributions | — | (1) | — | (2) | 1 | 4 | 201 | 2,471 | 62 | 917 | ||||||||||||||||||||||
| Shares repurchased | (6 | ) | (45 | ) | — | — | (1,356 | ) | (17,965 | ) | (1,168 | ) | (17,261 | ) | ||||||||||||||||||
|
|
|
|
|
|
|
|
|
|
|
|
|
|
|
| |||||||||||||||||
| Net Increase / (Decrease) | (4 | ) | $ | (31 | ) | 1 | $ | 8 | (934 | ) | $ | (12,563 | ) | 1,308 | $ | 20,385 | ||||||||||||||||
|
|
|
|
|
|
|
|
|
|
|
|
|
|
|
| |||||||||||||||||
| Class I | ||||||||||||||||||||||||||||||||
| Sale of shares | 112 | $ | 878 | 274 | $ | 2,666 | 1,348 | $ | 18,253 | 1,858 | $ | 28,316 | ||||||||||||||||||||
| Reinvestment of distributions | 10 | 78 | 17 | 161 | 253 | 3,158 | 135 | 2,016 | ||||||||||||||||||||||||
| Shares repurchased | (139 | ) | (1,091 | ) | (136 | ) | (1,257 | ) | (2,424 | ) | (32,314 | ) | (1,897 | ) | (28,258 | ) | ||||||||||||||||
|
|
|
|
|
|
|
|
|
|
|
|
|
|
|
| |||||||||||||||||
| Net Increase / (Decrease) | (17 | ) | $ | (135 | ) | 155 | $ | 1,570 | (823 | ) | $ | (10,903 | ) | 96 | $ | 2,074 | ||||||||||||||||
|
|
|
|
|
|
|
|
|
|
|
|
|
|
|
| |||||||||||||||||
| (1) | Amount is less than 500. |
| (2) | Amount is less than $500. |
82
Table of Contents
VIRTUS OPPORTUNITIES TRUST
NOTES TO FINANCIAL STATEMENTS (Continued)
SEPTEMBER 30, 2016
| Global Opportunities Fund | Global Real Estate Securities Fund | |||||||||||||||||||||||||||||||
| Year Ended September 30, 2016 | Year Ended September 30, 2015 | Year Ended September 30, 2016 | Year Ended September 30, 2015 | |||||||||||||||||||||||||||||
| SHARES | AMOUNT | SHARES | AMOUNT | SHARES | AMOUNT | SHARES | AMOUNT | |||||||||||||||||||||||||
| Class A | ||||||||||||||||||||||||||||||||
| Sale of shares | 2,313 | $ | 30,155 | 2,304 | $ | 28,851 | 1,668 | $ | 46,534 | 1,115 | $ | 30,347 | ||||||||||||||||||||
| Reinvestment of distributions | 16 | 202 | 34 | 423 | 44 | 1,163 | 25 | 689 | ||||||||||||||||||||||||
| Shares repurchased | (1,718 | ) | (22,328 | ) | (1,625 | ) | (20,664 | ) | (749 | ) | (20,318 | ) | (608 | ) | (16,436 | ) | ||||||||||||||||
|
|
|
|
|
|
|
|
|
|
|
|
|
|
|
| |||||||||||||||||
| Net Increase / (Decrease) | 611 | $ | 8,029 | 713 | $ | 8,610 | 963 | $ | 27,379 | 532 | $ | 14,600 | ||||||||||||||||||||
|
|
|
|
|
|
|
|
|
|
|
|
|
|
|
| |||||||||||||||||
| Class B | ||||||||||||||||||||||||||||||||
| Sale of shares | — | $ | — | — | $ | — | — | $ | — | — | $ | — | ||||||||||||||||||||
| Reinvestment of distributions | — | — | — | (1) | 1 | — | — | — | — | |||||||||||||||||||||||
| Shares repurchased | (22 | ) | (254 | ) | (17 | ) | (192 | ) | — | — | — | — | ||||||||||||||||||||
|
|
|
|
|
|
|
|
|
|
|
|
|
|
|
| |||||||||||||||||
| Net Increase / (Decrease) | (22 | ) | $ | (254 | ) | (17 | ) | $ | (191 | ) | — | $ | — | — | $ | — | ||||||||||||||||
|
|
|
|
|
|
|
|
|
|
|
|
|
|
|
| |||||||||||||||||
| Class C | ||||||||||||||||||||||||||||||||
| Sale of shares | 1,158 | $ | 13,134 | 1,293 | $ | 14,518 | 236 | $ | 6,500 | 188 | $ | 5,085 | ||||||||||||||||||||
| Reinvestment of distributions | — | — | 1 | 6 | 7 | 190 | 5 | 134 | ||||||||||||||||||||||||
| Shares repurchased | (562 | ) | (6,368 | ) | (280 | ) | (3,149 | ) | (93 | ) | (2,565 | ) | (102 | ) | (2,710 | ) | ||||||||||||||||
|
|
|
|
|
|
|
|
|
|
|
|
|
|
|
| |||||||||||||||||
| Net Increase / (Decrease) | 596 | $ | 6,766 | 1,014 | $ | 11,375 | 150 | $ | 4,125 | 91 | $ | 2,509 | ||||||||||||||||||||
|
|
|
|
|
|
|
|
|
|
|
|
|
|
|
| |||||||||||||||||
| Class I | ||||||||||||||||||||||||||||||||
| Sale of shares | 1,467 | $ | 19,059 | 650 | $ | 8,210 | 3,406 | $ | 95,560 | 734 | $ | 20,228 | ||||||||||||||||||||
| Reinvestment of distributions | 6 | 71 | 3 | 43 | 47 | 1,232 | 33 | 912 | ||||||||||||||||||||||||
| Shares repurchased | (1,050 | ) | (13,762 | ) | (361 | ) | (4,581 | ) | (771 | ) | (21,752 | ) | (594 | ) | (16,107 | ) | ||||||||||||||||
|
|
|
|
|
|
|
|
|
|
|
|
|
|
|
| |||||||||||||||||
| Net Increase / (Decrease) | 423 | $ | 5,368 | 292 | $ | 3,672 | 2,682 | $ | 75,040 | 173 | $ | 5,033 | ||||||||||||||||||||
|
|
|
|
|
|
|
|
|
|
|
|
|
|
|
| |||||||||||||||||
| Greater European Opportunities Fund | International Equity Fund | |||||||||||||||||||||||||||||||
| Year Ended September 30, 2016 | Year Ended September 30, 2015 | Year Ended September 30, 2016 | Year Ended September 30, 2015 | |||||||||||||||||||||||||||||
| SHARES | AMOUNT | SHARES | AMOUNT | SHARES | AMOUNT | SHARES | AMOUNT | |||||||||||||||||||||||||
| Class A | ||||||||||||||||||||||||||||||||
| Sale of shares | 356 | $ | 5,574 | 420 | $ | 6,463 | 23 | $ | 229 | 287 | $ | 3,013 | ||||||||||||||||||||
| Reinvestment of distributions | 6 | 86 | 16 | 236 | 1 | 6 | 3 | 30 | ||||||||||||||||||||||||
| Shares repurchased | (520 | ) | (8,182 | ) | (390 | ) | (5,967 | ) | (83 | ) | (819 | ) | (453 | ) | (4,695 | ) | ||||||||||||||||
|
|
|
|
|
|
|
|
|
|
|
|
|
|
|
| |||||||||||||||||
| Net Increase / (Decrease) | (158 | ) | $ | (2,522 | ) | 46 | $ | 732 | (59 | ) | $ | (584 | ) | (163 | ) | $ | (1,652 | ) | ||||||||||||||
|
|
|
|
|
|
|
|
|
|
|
|
|
|
|
| |||||||||||||||||
| Class C | ||||||||||||||||||||||||||||||||
| Sale of shares | 87 | $ | 1,345 | 64 | $ | 995 | 28 | $ | 270 | 122 | $ | 1,322 | ||||||||||||||||||||
| Reinvestment of distributions | — | — | 1 | 13 | — | — | — | (1) | 1 | |||||||||||||||||||||||
| Shares repurchased | (45 | ) | (688 | ) | (35 | ) | (536 | ) | (107 | ) | (1,030 | ) | (21 | ) | (227 | ) | ||||||||||||||||
|
|
|
|
|
|
|
|
|
|
|
|
|
|
|
| |||||||||||||||||
| Net Increase / (Decrease) | 42 | $ | 657 | 30 | $ | 472 | (79 | ) | $ | (760 | ) | 101 | $ | 1,096 | ||||||||||||||||||
|
|
|
|
|
|
|
|
|
|
|
|
|
|
|
| |||||||||||||||||
| Class I | ||||||||||||||||||||||||||||||||
| Sale of shares | 892 | $ | 14,069 | 415 | $ | 6,216 | 59 | $ | 567 | 178 | $ | 1,967 | ||||||||||||||||||||
| Reinvestment of distributions | 6 | 94 | 3 | 46 | 3 | 26 | 5 | 53 | ||||||||||||||||||||||||
| Shares repurchased | (716 | ) | (11,424 | ) | (220 | ) | (3,420 | ) | (244 | ) | (2,397 | ) | (333 | ) | (3,549 | ) | ||||||||||||||||
|
|
|
|
|
|
|
|
|
|
|
|
|
|
|
| |||||||||||||||||
| Net Increase / (Decrease) | 182 | $ | 2,739 | 198 | $ | 2,842 | (182 | ) | $ | (1,804 | ) | (150 | ) | $ | (1,529 | ) | ||||||||||||||||
|
|
|
|
|
|
|
|
|
|
|
|
|
|
|
| |||||||||||||||||
| (1) | Amount is less than 500. |
83
Table of Contents
VIRTUS OPPORTUNITIES TRUST
NOTES TO FINANCIAL STATEMENTS (Continued)
SEPTEMBER 30, 2016
| International Real Estate Securities Fund | International Small-Cap Fund | |||||||||||||||||||||||||||||||
| Year Ended September 30, 2016 | Year Ended September 30, 2015 | Year Ended September 30, 2016 | Year Ended September 30, 2015 | |||||||||||||||||||||||||||||
| SHARES | AMOUNT | SHARES | AMOUNT | SHARES | AMOUNT | SHARES | AMOUNT | |||||||||||||||||||||||||
| Class A | ||||||||||||||||||||||||||||||||
| Sale of shares | 626 | $ | 4,261 | 522 | $ | 3,606 | 49 | $ | 578 | 105 | $ | 1,306 | ||||||||||||||||||||
| Reinvestment of distributions | 20 | 133 | 116 | 773 | 6 | 67 | 14 | 161 | ||||||||||||||||||||||||
| Shares repurchased | (1,322 | ) | (8,902 | ) | (367 | ) | (2,507 | ) | (79 | ) | (925 | ) | (123 | ) | (1,574 | ) | ||||||||||||||||
|
|
|
|
|
|
|
|
|
|
|
|
|
|
|
| |||||||||||||||||
| Net Increase / (Decrease) | (676 | ) | $ | (4,508 | ) | 271 | $ | 1,872 | (24 | ) | $ | (280 | ) | (4 | ) | $ | (107 | ) | ||||||||||||||
|
|
|
|
|
|
|
|
|
|
|
|
|
|
|
| |||||||||||||||||
| Class C | ||||||||||||||||||||||||||||||||
| Sale of shares | 31 | $ | 214 | 140 | $ | 982 | 37 | $ | 410 | 71 | $ | 884 | ||||||||||||||||||||
| Reinvestment of distributions | 1 | 5 | 17 | 114 | 3 | 35 | 9 | 100 | ||||||||||||||||||||||||
| Shares repurchased | (92 | ) | (616 | ) | (185 | ) | (1,278 | ) | (63 | ) | (709 | ) | (31 | ) | (372 | ) | ||||||||||||||||
|
|
|
|
|
|
|
|
|
|
|
|
|
|
|
| |||||||||||||||||
| Net Increase / (Decrease) | (60 | ) | $ | (397 | ) | (28 | ) | $ | (182 | ) | (23 | ) | $ | (264 | ) | 49 | $ | 612 | ||||||||||||||
|
|
|
|
|
|
|
|
|
|
|
|
|
|
|
| |||||||||||||||||
| Class I | ||||||||||||||||||||||||||||||||
| Sale of shares | 1,496 | $ | 10,464 | 1,960 | $ | 13,578 | 700 | $ | 8,053 | 2,141 | $ | 26,540 | ||||||||||||||||||||
| Reinvestment of distributions | 46 | 299 | 270 | 1,808 | 140 | 1,563 | 317 | 3,641 | ||||||||||||||||||||||||
| Shares repurchased | (1,955 | ) | (13,320 | ) | (2,548 | ) | (17,494 | ) | (1,462 | ) | (16,224 | ) | (2,129 | ) | (25,756 | ) | ||||||||||||||||
|
|
|
|
|
|
|
|
|
|
|
|
|
|
|
| |||||||||||||||||
| Net Increase / (Decrease) | (413 | ) | $ | (2,557 | ) | (318 | ) | $ | (2,108 | ) | (622 | ) | $ | (6,608 | ) | 329 | $ | 4,425 | ||||||||||||||
|
|
|
|
|
|
|
|
|
|
|
|
|
|
|
| |||||||||||||||||
| Class R6 | ||||||||||||||||||||||||||||||||
| Sale of shares | — | $ | — | — | $ | — | — | $ | — | 7 | $ | 100 | ||||||||||||||||||||
| Reinvestment of distributions | — | — | — | — | — | (1) | 4 | 1 | 9 | |||||||||||||||||||||||
| Shares repurchased | — | — | — | — | — | — | — | (1) | — | (2) | ||||||||||||||||||||||
|
|
|
|
|
|
|
|
|
|
|
|
|
|
|
| |||||||||||||||||
| Net Increase / (Decrease) | — | $ | — | — | $ | — | — | (1) | $ | 4 | 8 | $ | 109 | |||||||||||||||||||
|
|
|
|
|
|
|
|
|
|
|
|
|
|
|
| |||||||||||||||||
| International Wealth Masters Fund | ||||||||||||||||||||||||||||||||
| Year Ended September 30, 2016 | From Inception November 17, 2014 to September 30, 2015 | |||||||||||||||||||||||||||||||
| SHARES | AMOUNT | SHARES | AMOUNT | |||||||||||||||||||||||||||||
| Class A | ||||||||||||||||||||||||||||||||
| Sale of shares | 14 | $ | 137 | 14 | $ | 142 | ||||||||||||||||||||||||||
| Reinvestment of distributions | — | (1) | 3 | — | — | |||||||||||||||||||||||||||
| Shares repurchased | (5 | ) | (45 | ) | (1 | ) | (7 | ) | ||||||||||||||||||||||||
|
|
|
|
|
|
|
| |||||||||||||||||||||||||
| Net Increase / (Decrease) | 9 | $ | 95 | 13 | $ | 135 | ||||||||||||||||||||||||||
|
|
|
|
|
|
|
| |||||||||||||||||||||||||
| Class C | ||||||||||||||||||||||||||||||||
| Sale of shares | — | (1) | $ | 2 | 15 | $ | 149 | |||||||||||||||||||||||||
| Reinvestment of distributions | — | (1) | 2 | — | — | |||||||||||||||||||||||||||
| Shares repurchased | (1 | ) | (11 | ) | (3 | ) | (25 | ) | ||||||||||||||||||||||||
|
|
|
|
|
|
|
| |||||||||||||||||||||||||
| Net Increase / (Decrease) | (1 | ) | $ | (7 | ) | 12 | $ | 124 | ||||||||||||||||||||||||
|
|
|
|
|
|
|
| |||||||||||||||||||||||||
| Class I | ||||||||||||||||||||||||||||||||
| Sale of shares | — | $ | 1 | 482 | $ | 4,826 | ||||||||||||||||||||||||||
| Reinvestment of distributions | 15 | 139 | — | — | ||||||||||||||||||||||||||||
| Shares repurchased | — | — | — | (1) | (1 | ) | ||||||||||||||||||||||||||
|
|
|
|
|
|
|
| |||||||||||||||||||||||||
| Net Increase / (Decrease) | 15 | $ | 140 | 482 | $ | 4,825 | ||||||||||||||||||||||||||
|
|
|
|
|
|
|
| |||||||||||||||||||||||||
| (1) | Amount is less than 500. |
| (2) | Amount is less than $500. |
| Note | 7. 10% Shareholders |
As of September 30, 2016, certain Funds had individual shareholder account(s) and/or omnibus shareholder account(s) (comprised of a group of individual shareholders), which individually amounted to more than 10% of the total shares outstanding of each such Fund as detailed below:
| % of Shares Outstanding | Number of Accounts | |||||||
Emerging Markets Debt Fund | 94 | % | 1 | * | ||||
Emerging Markets Small-Cap Fund | 89 | 2 | * | |||||
Global Infrastructure Fund# | 11 | 1 | ||||||
84
Table of Contents
VIRTUS OPPORTUNITIES TRUST
NOTES TO FINANCIAL STATEMENTS (Continued)
SEPTEMBER 30, 2016
| % of Shares Outstanding | Number of Accounts | |||||||
Global Opportunities Fund | 16 | % | 1 | |||||
Global Real Estate Securities Fund# | 39 | 3 | ||||||
Greater European Opportunities Fund | 42 | 3 | ||||||
International Equity Fund | 42 | 3 | * | |||||
International Real Estate Securities Fund# | 44 | 3 | * | |||||
| International Small-Cap Fund | 81 | 1 | ||||||
| International Wealth Masters Fund | 93 | 1 | * | |||||
| * | Includes affiliated shareholder accounts. |
| # | The Fund is owned by Virtus Alternatives Diversifier Fund. Virtus Alternatives Diversifier Fund does not invest in the underlying Funds for the purpose of exercising management or control; however, investments made may represent a significant portion of an underlying Fund’s net assets. At September 30, 2016, Virtus Alternatives Diversifier Fund was the owner of record of approximately 16% of the International Real Estate Securities Fund, 8% of the Global Infrastructure Fund, and 3% of the Global Real Estate Securities Fund. |
| Note | 8. Credit Risk and Asset Concentration |
In countries with limited or developing markets, investments may present greater risks than in more developed markets and the prices of such investments may be volatile. The consequences of political, social or economic changes in these markets may have disruptive effects on the market prices of these investments and the income they generate, as well as a Fund’s ability to repatriate such amounts.
High-yield/high-risk securities typically entail greater price volatility and/or principal and interest rate risk. There is a greater chance that an issuer will not be able to make principal and interest payments on time. Analysis of the creditworthiness of issuers of high-yield/high-risk securities may be complex, and as a result, it may be more difficult for the Adviser and/or subadviser to accurately predict risk.
Certain Funds may invest a high percentage of their assets in specific sectors of the market in the pursuit of their investment objectives. Fluctuations in these sectors of concentration may have a greater impact on a Fund, positive or negative, than if a Fund did not concentrate its investments in such sectors.
At September 30, 2016, the following Funds held securities issued by various companies in specific sectors as detailed below:
Fund | Sector | Percentage of Total Investments | ||||
| Emerging Markets Equity Income Fund | Financials | 31 | % | |||
| Emerging Markets Small-Cap Fund | Industrials | 27 | % | |||
| Global Infrastructure Fund | Utilities | 37 | % | |||
| Global Infrastructure Fund | Energy | 26 | % | |||
| Global Opportunities Fund | Consumer Staples | 30 | % | |||
| Greater European Opportunities Fund | Consumer Staples | 42 | % | |||
| International Real Estate Securities Fund | Real Estate Operating Companies | 35 | % | |||
| International Real Estate Securities Fund | Retail REITs | 25 | % | |||
| International Real Estate Securities Fund | Diversified REITs | 25 | % | |||
| International Small-Cap Fund | Information Technology | 26 | % | |||
| International Wealth Masters Fund | Consumer Discretionary | 29 | % | |||
| Note | 9. Indemnifications |
Under the Trust’s organizational documents, its Trustees and officers are indemnified against certain liabilities arising out of the performance of their duties to the Funds. Each Trustee has entered into an indemnification agreement with the Trust. In addition, in the normal course of business, the Funds enter into contracts that provide a variety of indemnifications to other parties. The Funds’ maximum exposure under these arrangements is unknown as this would involve future claims that may be made against the Funds and that have not occurred. However, the Funds have not had prior claims or losses pursuant to these arrangements and expect the risk of loss to be remote.
| Note | 10. Federal Income Tax Information |
($ reported in thousands)
At September 30, 2016, federal tax cost and aggregate gross unrealized appreciation (depreciation) of securities held by the Funds were as follows:
| Federal Tax Cost | Unrealized Appreciation | Unrealized (Depreciation) | Net Unrealized Appreciation (Depreciation) | |||||||||||||
Emerging Markets Debt Fund | $ | 29,173 | $ | 1,632 | $ | (1,336 | ) | $ | 296 | |||||||
Emerging Markets Equity Income Fund | 28,628 | 2,721 | (1,039 | ) | 1,682 | |||||||||||
Emerging Markets Small-Cap Fund | 4,919 | 232 | (352 | ) | (120 | ) | ||||||||||
Global Infrastructure Fund | 112,845 | 15,002 | (7,060 | ) | 7,942 | |||||||||||
Global Opportunities Fund | 135,335 | 42,199 | (789 | ) | 41,410 | |||||||||||
Global Real Estate Securities Fund | 178,036 | 17,994 | (2,885 | ) | 15,109 | |||||||||||
Greater European Opportunities Fund | 17,779 | 4,016 | (170 | ) | 3,846 | |||||||||||
International Equity Fund | 3,818 | 795 | (77 | ) | 718 | |||||||||||
International Real Estate Securities Fund | 29,841 | 4,610 | (278 | ) | 4,332 | |||||||||||
International Small-Cap Fund | 42,201 | 4,213 | (3,489 | ) | 724 | |||||||||||
International Wealth Masters Fund | 5,384 | 598 | (490 | ) | 108 | |||||||||||
85
Table of Contents
VIRTUS OPPORTUNITIES TRUST
NOTES TO FINANCIAL STATEMENTS (Continued)
SEPTEMBER 30, 2016
Certain Funds have capital loss carryovers available to offset future realized capital gains, through the indicated expiration dates shown below:
| 2018 | 2019 | No Expiration | Total | |||||||||||||||||||||||||||||
| Short-Term | Long-Term | Short-Term | Long-Term | Short-Term | Long-Term | Short-Term | Long-Term | |||||||||||||||||||||||||
Emerging Markets Debt Fund | $ | — | $ | — | $ | — | $ | — | $ | 479 | $ | 1,521 | $ | 479 | $ | 1,521 | ||||||||||||||||
Emerging Markets Equity Income Fund | — | — | — | — | 4,691 | 2,464 | 4,691 | 2,464 | ||||||||||||||||||||||||
Emerging Markets Small-Cap Fund | — | — | — | — | 1 | 89 | 1 | 89 | ||||||||||||||||||||||||
Greater European Opportunities Fund | — | — | — | — | 129 | — | 129 | — | ||||||||||||||||||||||||
International Equity Fund | — | — | — | — | 797 | 65 | 797 | 65 | ||||||||||||||||||||||||
International Real Estate Securities Fund | 3,884 | — | 884 | — | 1,829 | 732 | 6,597 | 732 | ||||||||||||||||||||||||
International Small-Cap Fund | — | — | — | — | 491 | 31 | 491 | 31 | ||||||||||||||||||||||||
International Wealth Masters Fund | — | — | — | — | 1 | — | 1 | — | ||||||||||||||||||||||||
The Trust may not realize the benefit of these losses to the extent each Fund does not realize gains on investments prior to the expiration of the capital loss carryovers.
Under the Regulated Investment Company Modernization Act of 2010 (the “Act”), net capital losses recognized for tax years beginning after December 22, 2010, may be carried forward indefinitely, and their character is retained as short-term and/or long-term losses. Previously, net capital losses were carried forward for eight years and treated as short-term losses. As a transition rule, the Act requires that post-enactment net capital losses be used before pre-enactment net capital losses.
For the period ended September 30, 2016, the following Funds utilized losses deferred in prior years against current year capital gains:
Global Opportunities Fund | $ | 410 | ||
International Real Estate Securities Fund | 421 |
Capital losses realized after October 31, and certain late year ordinary losses may be deferred and treated as occurring on the first day of the following fiscal year. For the fiscal year ended September 30, 2016, the Funds deferred and recognized losses as follows:
| Late Year Ordinary Losses Deferred | Late Year Ordinary Losses Recognized | Capital Loss Deferred | Capital Loss Recognized | |||||||||||||
Emerging Markets Debt Fund | $ | — | $ | — | $ | 326 | $ | 1,395 | ||||||||
Emerging Markets Equity Income Fund | — | — | 5,759 | 5,981 | ||||||||||||
Emerging Markets Small-Cap Fund | — | — | 341 | 52 | ||||||||||||
Global Infrastructure Fund | 5 | — | — | — | ||||||||||||
Global Opportunities Fund | — | — | — | 1,262 | ||||||||||||
Greater European Opportunities Fund | — | — | 714 | 129 | ||||||||||||
International Equity Fund | — | 8 | 490 | 676 | ||||||||||||
International Real Estate Securities Fund | — | — | 201 | 88 | ||||||||||||
International Small-Cap Fund | — | — | 1,712 | — | ||||||||||||
International Wealth Masters Fund | — | — | 58 | — | ||||||||||||
The components of distributable earnings on a tax basis (excluding unrealized appreciation (depreciation) which are disclosed above) consist of the following:
| Undistributed Ordinary Income | Undistributed Long-Term Capital Gains | |||||||
Emerging Markets Debt Fund | $ | 73 | $ | — | ||||
Emerging Markets Equity Income Fund | 312 | — | ||||||
Emerging Markets Small-Cap Fund | 95 | — | ||||||
Global Infrastructure Fund | — | 3,073 | ||||||
Global Opportunities Fund | 555 | 767 | ||||||
Global Real Estate Securities Fund | 4,025 | 203 | ||||||
Greater European Opportunities Fund | 326 | — | ||||||
International Real Estate Securities Fund | 2,083 | — | ||||||
International Small-Cap Fund | 998 | — | ||||||
International Wealth Masters Fund | 75 | — | ||||||
86
Table of Contents
VIRTUS OPPORTUNITIES TRUST
NOTES TO FINANCIAL STATEMENTS (Continued)
SEPTEMBER 30, 2016
The tax character of dividends and distributions paid during the years ended September 30, 2016, and 2015, was as follows:
| 2016 | 2015 | |||||||||||||||||||||||||||
| Ordinary Income | Long-Term Capital Gains | Total | Ordinary Income | Long-Term Capital Gains | Return of Capital | Total | ||||||||||||||||||||||
Virtus Emerging Markets Debt Fund | $ | 1,278 | $ | — | $ | 1,278 | $ | 1,132 | $ | — | $ | 239 | $ | 1,371 | ||||||||||||||
Virtus Emerging Markets Equity Income Fund | 1,173 | — | 1,173 | 2,175 | — | — | 2,175 | |||||||||||||||||||||
Virtus Emerging Markets Small-Cap Fund | 89 | — | 89 | 174 | — | — | 174 | |||||||||||||||||||||
Virtus Global Infrastructure Fund | 2,716 | 8,619 | 11,335 | 4,398 | 1,425 | — | 5,823 | |||||||||||||||||||||
Virtus Global Opportunities Fund | 425 | — | 425 | 698 | — | — | 698 | |||||||||||||||||||||
Virtus Global Real Estate Securities Fund | 1,560 | 1,057 | 2,617 | 1,605 | 164 | — | 1,769 | |||||||||||||||||||||
Virtus Greater European Opportunities Fund | 180 | — | 180 | 107 | 196 | — | 303 | |||||||||||||||||||||
Virtus International Equity Fund | 32 | — | 32 | 85 | — | — | 85 | |||||||||||||||||||||
Virtus International Real Estate Securities Fund | 448 | — | 448 | 2,732 | — | — | 2,732 | |||||||||||||||||||||
Virtus International Small-Cap Fund | 1,234 | 477 | 1,711 | 2,889 | 1,127 | — | 4,016 | |||||||||||||||||||||
Virtus International Wealth Masters Fund | 146 | — | 146 | — | — | — | — | |||||||||||||||||||||
The differences between the book and tax basis components of distributable earnings relate principally to the timing of recognition of income and gains for federal income tax purposes. Short-term gain distributions reported in the Statements of Changes in Net Assets, if any, are reported as ordinary income for federal tax purposes. Distributions are determined on a tax basis and may differ from net investment income and realized capital gains for financial reporting purposes.
| Note | 11. Reclassifications of Capital Accounts |
($ reported in thousands)
For financial reporting purposes, book basis capital accounts are adjusted to reflect the tax character of permanent book/tax differences. Permanent reclassifications can arise from differing treatment of certain income and gain transactions, nondeductible current year net operating losses, expiring capital loss carryovers and investments in passive foreign investment companies. The reclassifications have no impact on the net assets or net asset value of the Funds. As of September 30, 2016, the Funds recorded reclassifications to increase (decrease) the accounts as listed below:
| Capital Paid in on Shares of Beneficial Interest | Undistributed Net Investment Income (Loss) | Accumulated Net Realized Gain (Loss) | ||||||||||
Emerging Markets Debt Fund | $ | — | $ | (81 | ) | $ | 81 | |||||
Emerging Markets Equity Income Fund | — | (1 | ) | 1 | ||||||||
Emerging Markets Small-Cap Fund | — | (1 | ) | 1 | ||||||||
Global Infrastructure Fund | — | (4 | ) | 4 | ||||||||
Global Opportunities Fund | — | (6 | ) | 6 | ||||||||
Global Real Estate Securities Fund | — | 144 | (144 | ) | ||||||||
Greater European Opportunities Fund | — | 5 | (5 | ) | ||||||||
International Equity Fund | (13 | ) | 12 | 1 | ||||||||
International Real Estate Securities Fund | — | (1) | 322 | (322 | ) | |||||||
International Small-Cap Fund | — | 32 | (32 | ) | ||||||||
International Wealth Masters Fund | — | 6 | (6 | ) | ||||||||
| (1) | Amount is less than $500. |
| Note | 12. Borrowings |
($ reported in thousands)
On June 29, 2016, the Funds and other affiliated funds renewed a $50,000 secured line of credit. The Credit Agreement (the “Agreement”) is with a commercial bank (the “Bank”) that allows the Funds to borrow cash from the Bank to manage large unexpected redemptions and trade fails, up to a limit of one-third or one-fifth of each Fund’s total net assets in accordance with the Agreement. The Agreement has a term of 364 days and is renewable by the Funds with the Bank’s consent. Interest is charged at the higher of the LIBOR (London Interbank Offered Rate) or the Federal Funds rate plus an additional percentage rate on the amount borrowed. Commitment fees are charged on the undrawn balance. The Funds and other affiliated funds are individually, and not jointly, liable for their particular advances, if any, under the line of credit. The Bank has the ability to require repayment of outstanding borrowings under the Agreement upon certain circumstances such as an event of default.
From November 27, 2015, to December 3, 2015, the Emerging Markets Equity Income Fund made borrowings. The average daily borrowings under the Agreement and the weighted daily average interest rate were $629 and 1.24%, respectively. From February 4, 2016, to February 8, 2016, the International Real Estate Fund made borrowings. The average daily borrowings under the Agreement and the weighted daily average interest rate were $420 and 1.43%, respectively. From August 26, 2016, to September 2, 2016, the Greater European Opportunities Fund made borrowings. The average daily borrowings under the Agreement and the weighted daily average interest rate were $721 and 1.52%, respectively.
No other Funds made borrowings during the period and no Fund had any outstanding borrowings as of September 30, 2016.
87
Table of Contents
VIRTUS OPPORTUNITIES TRUST
NOTES TO FINANCIAL STATEMENTS (Continued)
SEPTEMBER 30, 2016
| Note | 13. Illiquid and Restricted Securities |
Investments are generally considered illiquid if they cannot be disposed of within seven days in the ordinary course of business at the approximate amount at which such securities have been valued by a Fund. Additionally, the following information is also considered in determining liquidity: the frequency of trades and quotes for the investment, whether the investment is listed for trading on a recognized domestic exchange and/or whether two or more brokers are willing to purchase or sell the security at a comparable price, the extent of market making activity in the investment and the nature of the market for investment. Illiquid securities are footnoted as such at the end of each Fund’s Schedule of Investments, where applicable. However, a portion of such footnoted securities could be liquid where it is determined that some, though not all, of the position could be disposed of within seven days in the ordinary course of business at the approximate amount at which such securities have been valued by the applicable Fund.
Restricted securities are illiquid securities, as defined above, not registered under the Securities Act of 1933, as amended (the “1933 Act”). Generally, 144A securities are excluded from this category, except where defined as illiquid.
Each Fund will bear any costs, including those involved in registration under the 1933 Act, in connection with the disposition of such securities.
The following Funds held securities considered to be illiquid at September 30, 2016:
Fund | Aggregate Value | % of Fund’s net assets | ||||||
| Emerging Markets Small-Cap Fund | $ | 211 | 4.3 | % | ||||
| Global Real Estate Securities Fund | — | 0.0 | ||||||
| International Real Estate Securities Fund | — | 0.0 | ||||||
| International Small-Cap Fund | 1,792 | 4.1 | ||||||
At September 30, 2016, the Funds did not hold any securities that were both illiquid and restricted.
| Note | 14. Regulatory Matters and Litigation |
From time to time, the Trust, the Funds’ Adviser and/or Subadvisers and/or their affiliates may be involved in litigation and arbitration as well as examinations and investigations by various regulatory bodies, including the SEC, involving compliance with, among other things, securities laws, client investment guidelines, laws governing the activities of broker-dealers and other laws and regulations affecting their products and other activities. At this time, the Funds’ Adviser believes that the outcomes of such matters are not likely, either individually or in the aggregate, to be material to these financial statements.
On February 20, 2015, a putative class action complaint (In re Virtus Investment Partners, Inc. Securities Litigation; formerly styled as Tom Cummins v. Virtus Investment Partners Inc. et al.) alleging violation of the federal securities laws was filed by an individual shareholder against Virtus and certain of its officers (the “defendants”) in the United States District Court for the Southern District of New York. On August 21, 2015, the lead plaintiff filed a Consolidated Class Action Complaint (the “Consolidated Complaint”) amending the originally filed complaint and adding the Trust as a defendant. The Consolidated Complaint was purportedly filed on behalf of all purchasers of Virtus common stock between January 25, 2013 and May 11, 2015 (the “Class Period”). The Consolidated Complaint alleges that during the Class Period, the defendants disseminated materially false and misleading statements and concealed material adverse facts relating to certain funds previously subadvised by F-Squared Investments, Inc. and/or its affiliates (“F-Squared”). The plaintiff seeks to recover unspecified damages. A motion to dismiss the Consolidated Complaint was filed on behalf of the defendants on October 21, 2015. Pursuant to an Opinion & Order (“Order”) filed on July 1, 2016, the court granted in part and denied in part the defendants’ motion to dismiss. Although the Order narrows the scope of the claims asserted, claims under Sections 10(b) and 20(a) of the Exchange Act and Rule 10b-5 thereunder survive the motion. The defendants filed an Answer to the Consolidated Complaint on August 5, 2016. Virtus and its affiliates, including the Adviser, believe that the suit is without merit and intend to defend it vigorously. The Trust believes that the risk of loss to the Funds as a result of this suit is remote. The Adviser does not believe that the suit will have any impact on its ability to provide services to the Funds.
On May 8, 2015, a putative class action complaint (Mark Youngers v. Virtus Investment Partners, Inc. et al.) alleging violations of certain provisions of the federal securities laws was filed in the United States District Court for the Central District of California. The complaint, which was purportedly filed on behalf of purchasers of certain Virtus Funds previously subadvised by F-Squared between May 8, 2010 and December 22, 2014, inclusive (the “Class Period”), alleged claims against Virtus, certain Virtus officers and affiliates (including the Funds’ Adviser, Euclid Advisors LLC (“Euclid”) and VP Distributors, LLC), the trustees and certain officers of the Trust, and certain other parties (the “defendants”). The complaint alleges that during the Class Period the defendants disseminated materially false and misleading statements and concealed or omitted material facts necessary to make the statements made not misleading. On October 1, 2015, the plaintiff filed a First Amended Class Action Complaint which, among other things, added a derivative claim for breach of fiduciary duty on behalf of the Trust. On October 19, 2015, the United States District Court for the Central District of California entered an order transferring the action to the Southern District of New York. On January 4, 2016, Plaintiffs filed a Second Amended Complaint. Motions to dismiss were filed on behalf of Virtus, its officers and affiliates and the independent trustees on February 1, 2016. An Opinion & Order (“Order”) granting in part and denying in part the defendants’ motions to dismiss was issued on July 1, 2016. The Order dismissed all claims against the Adviser, Euclid, the independent trustees and certain of the other individual defendants and narrowed the claims asserted against the remaining defendants. The remaining defendants filed an Answer to the Second Amended Complaint on August 5, 2016. The defendants filed a motion to certify an interlocutory appeal of the July 1, 2016 order to the Court of Appeals for the Second Circuit on August 26, 2016. Oral argument on the motion is scheduled for October 7, 2016. Virtus and its affiliates, including the Adviser, believe that the suit has no basis in law or fact and intend to defend it vigorously. The Trust believes that the risk of loss to the Funds as a result of this suit is remote. The Adviser does not believe that the suit will have any impact on its ability to provide services to the Funds.
| Note | 15. Subsequent Events |
Management has evaluated the impact of all subsequent events on the Funds through the date the financial statements were issued, and has determined that the following subsequent events require recognition or disclosure in these financial statements.
Effective November 1, 2016, the expense limits applicable to Virtus Emerging Markets Equity Income Fund (as discussed in Note 4C) have changed. The new limits are set forth in the Prospectus Supplement for that Fund dated November 1, 2016, in the back of this Shareholder Report.
Effective November 3, 2016, Virtus Global Real Estate Securities Fund began offering Class R6 Shares.
88
Table of Contents

REPORT OF INDEPENDENT REGISTERED PUBLIC ACCOUNTING FIRM
To the Board of Trustees of
Virtus Opportunities Trust and
Shareholders of the Funds:
In our opinion, the accompanying statements of assets and liabilities, including the schedules of investments, and the related statements of operations and of changes in net assets and the financial highlights present fairly, in all material respects, the financial position of Virtus Emerging Markets Debt Fund, Virtus Emerging Markets Equity Income Fund, Virtus Emerging Markets Small-Cap Fund, Virtus Global Infrastructure Fund, Virtus Global Opportunities Fund, Virtus Global Real Estate Securities Fund, Virtus Greater European Opportunities Fund, Virtus International Equity Fund, Virtus International Real Estate Securities Fund, Virtus International Small-Cap Fund and Virtus International Wealth Masters Fund, (constituting funds within Virtus Opportunities Trust, hereafter referred to as the “Funds”) at September 30, 2016, the results of each of their operations for the year then ended, the changes in their net assets for each of the two years in the period then ended and the financial highlights for each of the periods indicated, in conformity with accounting principles generally accepted in the United States of America. These financial statements and financial highlights (hereafter referred to as “financial statements”) are the responsibility of the Funds’ management. Our responsibility is to express an opinion on these financial statements based on our audits. We conducted our audits of these financial statements in accordance with the standards of the Public Company Accounting Oversight Board (United States). Those standards require that we plan and perform the audit to obtain reasonable assurance about whether the financial statements are free of material misstatement. An audit includes examining, on a test basis, evidence supporting the amounts and disclosures in the financial statements, assessing the accounting principles used and significant estimates made by management, and evaluating the overall financial statement presentation. We believe that our audits, which included confirmation of securities at September 30, 2016 by correspondence with the custodian and brokers, provide a reasonable basis for our opinion.

Philadelphia, Pennsylvania
November 22, 2016
89
Table of Contents
VIRTUS OPPORTUNITIES TRUST
SEPTEMBER 30, 2016
For the fiscal year ended September 30, 2016, the Funds make the following disclosures for federal income tax purposes. Below is listed the percentages, or the maximum amount allowable, of its ordinary income dividends (“QDI”) to qualify for the lower tax rates applicable to individual shareholders, and the percentage of ordinary income dividends earned by the Funds which qualifies for the dividends received deduction (“DRD”) for corporate shareholders. The actual percentage of QDI and DRD for the calendar year will be designated in year-end tax statements. The Funds designate the amounts below as long-term capital gains dividends (“LTCG”) taxable at a 20% rate, or lower depending on the shareholder’s income ($ reported in thousands). LTCG amounts, if subsequently different, will be designated in the next annual report.
| QDI | DRD | LTCG | ||||||||||
Emerging Markets Debt Fund | — | % | — | % | $ | — | ||||||
Emerging Markets Equity Income Fund | 100 | — | — | |||||||||
Emerging Markets Small-Cap Fund | 86 | — | — | |||||||||
Global Infrastructure Fund | 100 | 79 | 4,202 | |||||||||
Global Opportunities Fund | 100 | 100 | 767 | |||||||||
Global Real Estate Securities Fund | 20 | — | 527 | |||||||||
Greater European Opportunities Fund | 100 | 16 | — | |||||||||
International Equity Fund | 100 | 6 | — | |||||||||
International Real Estate Securities Fund | 27 | — | — | |||||||||
International Small-Cap Fund | 61 | — | — | |||||||||
International Wealth Masters | 100 | — | — | |||||||||
For the year ended September 30, 2016, certain Funds are disclosing the following information pursuant to notice requirements of Section 853(a) and 855(d) of the Internal Revenue Code, as amended, and the Treasury Regulations thereunder ($ reported in thousands).
| Foreign Source Income Recognized | Foreign Taxes Paid on Foreign Source Income | |||||||
Emerging Markets Equity Income Fund | $ | 1,281 | $ | 149 | ||||
Emerging Markets Small-Cap Fund | 183 | 21 | ||||||
Greater European Opportunities Fund | 690 | 53 | ||||||
International Equity Fund | 119 | 11 | ||||||
International Real Estate Securities Fund | 1,301 | 120 | ||||||
International Small-Cap Fund | 1,494 | 137 | ||||||
International Wealth Masters Fund | 127 | 15 | ||||||
90
Table of Contents
CONSIDERATION OF SUBADVISORY AGREEMENTS FOR VIRTUS EMERGING MARKETS EQUITY INCOME FUND AND VIRTUS ESSENTIAL RESOURCES FUND
BY THE BOARD OF TRUSTEES
The Board of Trustees (the “Board”) of Virtus Opportunities Trust (the “Trust”) is responsible for the consideration and approval of advisory and subadvisory agreements for the Trust. As further discussed below, at meetings held on January 26, 2016, and February 23-24, 2016, the Board, including a majority of the Trustees who are not interested persons of the Trust as defined in Section 2(a)(19) of the Investment Company Act of 1940, as amended (such Act, the “1940 Act” and such Trustees, the “Independent Trustees”), considered and approved interim and new subadvisory agreements (together, the “Subadvisory Agreements”) with Kleinwort Benson Investors International, Ltd. (“KBII” or the “Subadviser”), subadviser to the Virtus Emerging Markets Equity Income Fund and Virtus Essential Resources Fund (each a “Fund” and collectively, the “Funds”).
KBII has served as the subadviser to each Fund since inception, and the Board previously approved subadvisory agreements with KBII (the “Old Subadvisory Agreements”) in 2014 and 2015. On January 13, 2016, Oddo & Cie, a French financial services group based primarily in Europe, (“Oddo”) acquired in excess of 25% of the outstanding shares of BHF Kleinwort Benson SA (“BHFKB”), an indirect parent of KBII. Under the 1940 Act, an acquisition of more than 25% of the voting shares of a company is generally considered to be a change in control. As the indirect parent company of KBII, a change in control at BHFKB also causes a change in control at KBII. Under the 1940 Act, when a change in control occurs, affected subadvisory agreements automatically terminate. In order to continue utilizing KBII as a subadviser, at a telephonic meeting held on January 26, 2016, the Board approved an interim subadvisory agreement (the “Interim Subadvisory Agreement”) effective January 13, 2016, with the proviso that such agreement may not continue for a period of more than 150 days from the termination event or the date on which a new subadvisory agreement is entered into. At an in-person meeting held on February 23-24, 2016, the Board then approved the new investment subadvisory agreement (the “New Subadvisory Agreement”) with KBII. The New Subadvisory Agreement was approved by shareholders on May 26, 2016.
In considering the approval of the Interim Subadvisory Agreement and the New Subadvisory Agreement (collectively, the “Subadvisory Agreements”), the Board requested and evaluated information provided by Virtus Investment Advisers, Inc. (“VIA” or the “Adviser”) and the Subadviser which, in the Board’s view, constituted information necessary for the Board to form a judgment as to whether the approval of the Subadvisory Agreements would be in the best interests of each applicable Fund and its respective shareholders. The Board also considered information furnished throughout the year at regular Board meetings with respect to the services provided by VIA and already provided by the Subadviser for the Funds, including quarterly performance reports prepared by management containing reviews of investment results and periodic presentations from the Subadviser.
The Independent Trustees were separately advised by independent legal counsel throughout the process. The Board considered all the criteria separately with respect to the applicable Fund and its shareholders. In their deliberations, the Trustees considered various factors, including those discussed below, none of which were controlling, and each Trustee may have attributed different weights to the various factors. The Independent Trustees also discussed the proposed approval of the Subadvisory Agreements in private sessions with their independent legal counsel at which no representatives of management were present.
Basis for the Board’s Recommendation
In making its determination with respect to the Interim Subadvisory Agreement, the Board took into account that it was approving an agreement of limited duration and that the Board would have an opportunity to consider a new subadvisory agreement at a meeting to be scheduled in the near future. The Board noted that the New Subadvisory Agreement would be submitted to shareholders for approval. The Board also took into consideration that the terms of Interim Subadvisory Agreement were substantially identical to the terms of the Old Subadvisory Agreements, including that there was no change in the compensation to be paid thereunder. The Board noted that the key difference between the Old Subadvisory Agreements and the Interim Subadvisory Agreement resulted from compliance with a regulatory requirement that interim advisory agreements have a limited term. The Board also considered that the Subadviser had been managing the Funds since they commenced operations, and that the Subadviser had stated that there would be no change in the scope or quality of services to be provided by it as a result of the change in control. Based on all of the foregoing considerations, the Board, including the Independent Trustees, determined that approval of the Interim Subadvisory Agreement with KBII was in the best interests of each Fund and its shareholders. Accordingly, the Board, and the Independent Trustees voting separately, approved the Interim Subadvisory Agreement with respect to each Fund.
In making its determination with respect to the New Subadvisory Agreement, the Board considered various factors, including:
| • | Nature, extent, and quality of the services to be provided by the Subadviser. The Trustees received in advance of the meeting information in the form of an extensive questionnaire completed by the Subadviser concerning a number of topics, including its investment philosophy, resources, operations and compliance structure. The Trustees noted that the Subadviser would continue to provide portfolio management, compliance with each Fund’s investment policies and procedures, compliance with applicable securities laws, and assurances thereof. The Trustees reviewed biographical information for the portfolio managers who would provide services under the New Subadvisory Agreement and had done so under the Old Subadvisory Agreements and the Interim Subadvisory Agreement, and noted the breadth and depth of experience of the portfolio managers. In considering the approval of the New Subadvisory Agreement, the Trustees considered the Subadviser’s investment management process, including (a) the experience, capability and integrity of the Subadviser’s management and other personnel committed by the Subadviser to each Fund; (b) the quality and commitment of the Subadviser’s regulatory and legal compliance policies, procedures and systems; and (c) the Subadviser’s brokerage and trading practices. The Board concluded that the nature, extent and quality of the services to be provided by the Subadviser to the Funds was reasonable. |
| • | Investment Performance. The Board considered performance reports and discussions at Board meetings throughout the year, as well as data furnished in connection with the consideration of the New Subadvisory Agreement. The Board noted that the Emerging Markets Equity Income Fund had underperformed its benchmark for the 1- and 3-year periods, and considered the Subadviser’s explanation for the underperformance. The Board also noted that the Essential Resources Fund had a limited performance history, but that the Fund had outperformed its benchmark since its inception in March of 2015. After reviewing these and related factors, the Board concluded that the Subadviser’s overall performance was satisfactory. |
| • | Subadvisory Fee. The Board took into account that each Fund’s subadvisory fees are paid by the Adviser and not by the Funds, so that the Funds’ shareholders would not be directly impacted by those fees. The Board also noted that the fees under the New Subadvisory Agreement would be unchanged from those in the Old Subadvisory Agreements and the Interim Subadvisory Agreement. The Board concluded that the proposed subadvisory fees were fair and reasonable in light of services to be provided by the Subadviser and all factors considered. |
91
Table of Contents
CONSIDERATION OF SUBADVISORY AGREEMENTS FOR VIRTUS EMERGING MARKETS EQUITY INCOME FUND AND VIRTUS ESSENTIAL RESOURCES FUND
BY THE BOARD OF TRUSTEES (Continued)
| • | Profitability and economies of scale. In considering the expected profitability to the Subadviser of its relationship with the Funds, the Board noted that the fees under the New Subadvisory Agreement would be paid by the Adviser out of the advisory fees that it receives under its Advisory Agreement and not by the Funds The Board also noted that there was no change to the subadvisory fee under the New Subadvisory Agreement. In considering the reasonableness of the fees payable by VIA to the Subadviser, the Board relied on the ability of VIA to negotiate the New Subadvisory Agreement and the fees thereunder at arm’s length. For each of the above reasons, the Board concluded that the profitability to the Subadviser and its affiliates from its relationship with the Funds was not a material factor in approval of the New Subadvisory Agreement. |
| • | Other Benefits. The Board considered other benefits that may be realized by the Subadviser and its affiliates from its relationship with the Funds and concluded that there were no other direct benefits to the Subadviser in providing investment advisory services to each Fund, other than the fees to be earned although there may be certain indirect benefits gained, including to the extent that serving the Funds could provide the opportunity to provide advisory services to additional portfolios of the Trust or certain reputational benefits. |
Based on all of the foregoing considerations, the Board, including the Independent Trustees, determined that approval of the New Subadvisory Agreement with KBII was in the best interests of each Fund and its shareholders. Accordingly, the Board, and the Independent Trustees voting separately, approved the New Subadvisory Agreement with respect to each Fund.
92
Table of Contents
CONSIDERATION OF SUBADVISORY AGREEMENTS FOR
VIRTUS INTERNATIONAL EQUITY FUND
BY THE BOARD OF TRUSTEES
The Board of Trustees (the “Board”) of Virtus Opportunities Trust (the “Trust”) is responsible for the consideration and approval of advisory and subadvisory agreements for the Trust. At an in-person Board meeting held on August 23-24, 2016, the Board, including a majority of the Trustees who are not interested persons of the Trust as defined in Section 2(a)(19) of the Investment Company Act of 1940, as amended, (such Act, the “1940 Act” and such Trustees, the “Independent Trustees”), authorized the termination of the current subadvisory agreement with Euclid Advisors LLC as subadviser to the Virtus International Equity Fund (the “Fund”), and approved a new interim investment subadvisory agreement and new investment subadvisory agreement (the “Subadvisory Agreements”) with Duff & Phelps Investment Management Co. (“DPIM” or the “Subadviser”).
In considering the approval of the Subadvisory Agreements, the Board requested and evaluated information provided by Virtus Investment Advisers, Inc. (the “Adviser”) and the Subadviser which, in the Board’s view, constituted information necessary for the Board to form a judgment as to whether the subadviser change would be in the best interests of the Fund and its shareholders. The Board also considered information furnished throughout the year at regular Board meetings with respect to the services provided by VIA and already provided by the Subadviser for other funds as well as by the portfolio manager for the Fund who would continue to manage the Fund, including quarterly performance reports prepared by management containing reviews of investment results and periodic presentations from the Subadviser and from the portfolio manager during his time with the Fund’s previous subadviser. The Board noted the affiliation of the Subadviser with VIA and any potential conflicts of interest.
The Independent Trustees were separately advised by independent legal counsel throughout the process. For each Agreement, the Board considered all the criteria separately with respect to the Fund and its shareholders. In their deliberations, the Trustees considered various factors, including those discussed below, none of which were controlling, and each Trustee may have attributed different weights to the various factors. The Independent Trustees also discussed the proposed approval of the Subadvisory Agreements in private sessions with their independent legal counsel at which no representatives of management were present.
Basis for the Board’s Recommendation
In making its determination with respect to the Subadvisory Agreements, the Board considered various factors, including:
| • | Nature, extent, and quality of the services to be provided by the Subadviser. The Trustees received in advance of the meeting information in the form of an extensive questionnaire completed by the Subadviser concerning a number of topics, including its investment philosophy, resources, operations and compliance structure. The Trustees noted that the Subadviser would provide portfolio management, compliance with the Fund’s investment policies and procedures, compliance with applicable securities laws, and assurances thereof. The Trustees reviewed biographical information for the portfolio manager who would provide services under the Subadvisory Agreements and noted that he had also provided services to the Fund since 2013 as an employee of the Fund’s previous subadviser. In considering the approval of the Subadvisory Agreements, the Trustees considered the Subadviser’s investment management process, including (a) the experience, capability and integrity of the Subadviser’s management and other personnel committed by the Subadviser to the Fund; (b) the quality and commitment of the Subadviser’s regulatory and legal compliance policies, procedures and systems; and (c) the Subadviser’s brokerage and trading practices. The Board concluded that the nature, extent and quality of the services to be provided by the Subadviser to the Fund was reasonable. |
| • | Investment Performance. The Board considered performance reports and discussions at Board meetings throughout the year, as well as data furnished in connection with the contract consideration process for the Fund and the Subadviser. The Board noted the portfolio manager who managed the Fund with the previous subadviser would continue in the same role with DPIM, and noted the Fund outperformed the index for the year to date period, while it underperformed the index for the 1- and 3-year periods. The Board also noted that the Subadviser’s international strategy composite outperformed the relevant index for the 1-, 3- and 5-year periods. After reviewing these and related factors, the Board concluded that the Subadviser’s overall performance was satisfactory. |
| • | Subadvisory Fee. The Board took into account that the Fund’s subadvisory fees are paid by the Adviser and not by the Fund, so that the Fund’s shareholders would not be directly impacted by those fees. The Board also noted that the proposed subadvisory fees under the Subadvisory Agreements were the same as the subadvisory fees paid to the Fund’s previous subadviser. The Board concluded that the proposed subadvisory fees were fair and reasonable in light of services to be provided by the Subadviser and all factors considered. |
| • | Profitability and economies of scale. In considering the expected profitability to the Subadviser of its relationship with the Fund, the Board noted that the fees under the Subadvisory Agreements are paid by the Adviser out of the advisory fees that it receives under the Advisory Agreement and not by the Fund. In considering the reasonableness of the fees payable by the Adviser to the Subadviser, the Board noted that, because the Subadviser is an affiliate of the Adviser, such profitability might be directly or indirectly shared by the Adviser, and therefore the Board considered the profitability together. As a result, the expected profitability to the Subadviser of its relationships with the Fund was not a material factor in the Board’s deliberations at this time. For similar reasons, the Board did not consider the potential economies of scale in the Subadviser’s management of the Fund to be a material factor in its consideration at this time. |
| • | Other Benefits. The Board considered other benefits that may be realized by the Subadviser and its affiliates from their relationship with the Fund. For instance the Board noted that the Subadviser’s reputation in the brokerage community might result in greater assets in the Fund. The Board was also advised that there may be certain intangible benefits gained by the Subadviser to the extent that serving the Fund could provide the opportunity to provide advisory services to additional funds of the Trust or could enhance the Subadviser’s reputation in the marketplace, and, therefore, the subadvisory change could enable the Subadviser to attract additional client relationships. |
Based on all of the foregoing considerations, the Board, including the Independent Trustees, determined that approval of the Subadvisory Agreements with DPIM was in the best interests of the Fund and its shareholders. Accordingly, the Board, and the Independent Trustees voting separately, approved the Subadvisory Agreements with respect to the Fund.
93
Table of Contents
RESULTS OF SHAREHOLDER MEETING
VIRTUS OPPORTUNITIES TRUST
MAY 19, 2016 (Unaudited)
At a special meeting of shareholders of all series of Virtus Equity Trust, Virtus Insight Trust and Virtus Opportunities Trust, held on May 19, 2016, shareholders of Virtus Opportunities Trust (the “Trust”) voted on the following proposals:
Proposal 1.
| Number of Eligible Votes: | ||||||||||||
| FOR | AGAINST | ABSTAIN | ||||||||||
To elect six Trustees to serve on the Board of Trustees until the next meeting of shareholders at which Trustees are elected. | ||||||||||||
George R. Aylward | 1,145,056,198.477 | 24,756,597.221 | 0 | |||||||||
Thomas J. Brown | 1,144,160,222.050 | 25,652,573.650 | 0 | |||||||||
Donald C. Burke | 1,145,758,834.912 | 24,053,960.790 | 0 | |||||||||
Roger A. Gelfenbien | 1,144,297,795.833 | 25,514,999.865 | 0 | |||||||||
John R. Mallin | 1,144,938,076.292 | 24,874,719.410 | 0 | |||||||||
Hassell H. McClellan | 1,143,864,433.134 | 25,948,362.566 | 0 | |||||||||
Shareholders of the Trust voted to approve the above proposal.
Proposal 2.
| Number of Eligible Votes: | ||||||||||||
| FOR | AGAINST | ABSTAIN | ||||||||||
To approve a proposal to permit Virtus Investment Advisers, Inc., as the investment adviser to all the Funds, to hire and replace subadvisers or to modify subadvisory agreements without shareholder approval. | ||||||||||||
Virtus CA Tax Exempt Bond Fund | 1,258,194.893 | 91,895.368 | 41,271.245 | |||||||||
Virtus Emerging Markets Debt Fund | 3,015,152.206 | 198.283 | 0 | |||||||||
Virtus Emerging Markets Equity Income Fund | 3,672,832.400 | 0 | 0 | |||||||||
Virtus Emerging Markets Opportunities Fund | 620,793,093.034 | 25,302,093.728 | 9,306,937.262 | |||||||||
Virtus Emerging Markets Small-Cap Fund | 494,281.793 | 0 | 0 | |||||||||
Virtus Essential Resources Fund | 504,931.913 | 0 | 0 | |||||||||
Virtus Foreign Opportunities Fund | 27,726,679.250 | 666,663.374 | 564,703.507 | |||||||||
Virtus Greater European Opportunities Fund | 818,457.900 | 37,502.974 | 15,676.215 | |||||||||
Virtus International Small-Cap Fund | 3,074,638.276 | 5,991.041 | 10,261.000 | |||||||||
Virtus International Wealth Masters Fund | 518,044.295 | 0 | 0 | |||||||||
Virtus Low Duration Income Fund | 10,449,114.393 | 779,684.940 | 311,840.943 | |||||||||
Virtus Multi-Sector Intermediate Bond Fund | 11,147,670.008 | 724,253.699 | 406,427.672 | |||||||||
Virtus Multi-Sector Short Term Bond Fund | 618,834,424.483 | 21,316,032.964 | 14,819,955.463 | |||||||||
Shareholders of the Funds listed above voted to approve the above proposal.
Proposal 6.
| Number of Eligible Votes: | ||||||||||||
| FOR | AGAINST | ABSTAIN | ||||||||||
To approve a proposal to amend the fundamental restrictions of the Fundamental Restriction Funds with respect to loans. | ||||||||||||
Virtus Foreign Opportunities Fund | 27,568,524.708 | 741,409.046 | 648,118.377 | |||||||||
Virtus Multi-Sector Short Term Bond Fund | 615,281,810.614 | 22,749,361.497 | 16,939,237.795 | |||||||||
Shareholders of the Funds listed above voted to approve the above proposal.
94
Table of Contents
RESULTS OF SHAREHOLDER MEETING
VIRTUS OPPORTUNITIES TRUST
MAY 26, 2016 (Unaudited)
At a special meeting of shareholders of Virtus Emerging Markets Equity Income Fund and Virtus Essential Resources Fund (collectively, the “Funds”), each a series of Virtus Opportunities Trust, held on May 26, 2016, shareholders voted on the following proposal:
| Number of Eligible Votes: | ||||||||||||
| FOR | AGAINST | ABSTAIN | ||||||||||
To approve a new subadvisory agreement between Virtus Investment Advisers, Inc., the Funds’ Investment Adviser, and Kleinwort Benson Investors International, Ltd., the Funds’ Subadviser. | ||||||||||||
Virtus Emerging Markets Equity Income Fund | 3,697,072.869 | 0 | 0 | |||||||||
Virtus Essential Resources Fund | 506,647.913 | 0 | 0 | |||||||||
Shareholders of the Funds voted to approve the above proposal.
95
Table of Contents
RESULTS OF SHAREHOLDER MEETING
VIRTUS OPPORTUNITIES TRUST
JUNE 16, 2016 (Unaudited)
At a special meeting of shareholders of Virtus Bond Fund, Virtus Global Infrastructure Fund, Virtus Global Real Estate Securities Fund, Virtus High Yield Fund, Virtus International Real Estate Securities Fund and Virtus Senior Floating Rate Fund (each a “Fund”), held on June 16, 2016, shareholders of each Fund voted on the following proposal:
Proposal 2.
| Number of Eligible Votes: | ||||||||||||
| FOR | AGAINST | ABSTAIN | ||||||||||
To approve a proposal to permit Virtus Investment Advisers, Inc., as the investment adviser to all the Funds, to hire and replace subadvisers or to modify subadvisory agreements without shareholder approval. | ||||||||||||
Virtus Bond Fund | 3,027,478.512 | 194,272.268 | 147,040.417 | |||||||||
Virtus Global Infrastructure Fund | 3,636,950.694 | 307,905.417 | 172,360.145 | |||||||||
Virtus Global Real Estate Securities Fund | 1,661,823.911 | 122,802.243 | 36,355.685 | |||||||||
Virtus High Yield Fund | 6,737,350.870 | 765,216.446 | 446,105.991 | |||||||||
Virtus International Real Estate Securities Fund | 2,728,863.703 | 48,714.840 | 63,894.599 | |||||||||
Virtus Senior Floating Rate Fund | 30,432,212.381 | 775,729.890 | 326,306.209 | |||||||||
Shareholders of the Funds listed above voted to approve the above proposal.
96
Table of Contents
RESULTS OF SHAREHOLDER MEETING
VIRTUS OPPORTUNITIES TRUST
JULY 18, 2016 (Unaudited)
At a special meeting of shareholders of Virtus Global Equity Trend Fund, Virtus Global Opportunities Fund, Virtus Herzfeld Fund, Virtus International Equity Fund, Virtus Low Volatility Equity Fund, Virtus Real Estate Securities Fund, Virtus Sector Trend Fund, Virtus Wealth Masters Fund, Virtus Alternatives Diversifier Fund, Virtus Equity Trend Fund, Virtus Multi-Asset Trend Fund and Virtus Tax-Exempt Bond Fund, held on July 18, 2016, shareholders of the Funds voted on the following proposals:
Proposal 2.
| Number of Eligible Votes: | ||||||||||||
| FOR | AGAINST | ABSTAIN | ||||||||||
To approve a proposal to permit Virtus Investment Advisers, Inc., as the investment adviser to all the Funds, to hire and replace subadvisers or to modify subadvisory agreements without shareholder approval. | ||||||||||||
Virtus Global Equity Trend Fund | 2,071,338.688 | 221,721.989 | 61,016.655 | |||||||||
Virtus Global Opportunities Fund | 6,475,669.315 | 399,601.579 | 221,211.057 | |||||||||
Virtus Herzfeld Fund | 2,285,754.412 | 134,756.871 | 89,510.278 | |||||||||
Virtus International Equity Fund | 347,976.498 | 45,434.960 | 4,980.529 | |||||||||
Virtus Low Volatility Equity Fund | 234,510.520 | 7,334.000 | 90,835.796 | |||||||||
Virtus Real Estate Securities Fund | 14,196,247.698 | 691,146.713 | 476,502.196 | |||||||||
Virtus Sector Trend Fund | 14,380,526.646 | 1,274,297.224 | 1,097,176.679 | |||||||||
Virtus Wealth Masters Fund | 2,759,756.937 | 182,003.481 | 154,822.394 | |||||||||
Virtus Alternatives Diversifier Fund | 2,054,425.037 | 135,901.800 | 177,500.739 | |||||||||
Virtus Equity Trend Fund | 47,080,228.694 | 3,814,318.119 | 2,960,680.324 | |||||||||
Virtus Multi-Asset Trend Fund | 7,428,521.065 | 660,946.728 | 521,389.418 | |||||||||
Virtus Tax-Exempt Bond Fund | 7,423,225.114 | 802,129.342 | 492,588.498 | |||||||||
Shareholders of Virtus Global Equity Trend Fund, Virtus Global Opportunities Fund, Virtus Herzfeld Fund, Virtus International Equity Fund, Virtus Low Volatility Equity Fund, Virtus Real Estate Securities Fund, Virtus Sector Trend Fund and Virtus Wealth Masters Fund voted to approve the above proposal. Shareholders of Virtus Alternatives Diversifier Fund, Virtus Equity Trend Fund, Virtus Multi-Asset Trend Fund and Virtus Tax-Exempt Bond Fund did not approve the above proposal.
Proposal 6.
| Number of Eligible Votes: | ||||||||||||
| FOR | AGAINST | ABSTAIN | ||||||||||
To approve a proposal to amend the fundamental restrictions of the Fundamental Restriction Funds with respect to loans. | ||||||||||||
Virtus Sector Trend Fund | 14,250,883.760 | 1,251,197.022 | 1,249,922.768 | |||||||||
Virtus Real Estate Securities Fund | 13,928,178.018 | 864,726.603 | 570,992.984 | |||||||||
Shareholders of Virtus Sector Trend Fund voted to approve the above proposal. Shareholders of Virtus Real Estate Securities Fund did not approve the above proposal.
Proposal 7.
| Number of Eligible Votes: | ||||||||||||
| FOR | AGAINST | ABSTAIN | ||||||||||
To approve a proposal to amend the fundamental restrictions of the Fundamental Restriction Funds with respect to loans. | ||||||||||||
Virtus Multi-Sector Short Term Bond Fund | 238,431,276.605 | 411,212,271.419 | 20,011,935.573 | |||||||||
Virtus Real Estate Securities Fund | 9,635,396.247 | 5,113,977.185 | 614,521.174 | |||||||||
Virtus Sector Trend Fund | 9,706,807.226 | 5,648,494.88 | 1,396,703.437 | |||||||||
Shareholders of the Funds listed above did not approve the above proposal.
97
Table of Contents
Information pertaining to the trustees and officers of the Trust as of September 30, 2016, is set forth below. The statement of additional information (SAI) includes additional information about the trustees and is available without charge, upon request, by calling (800) 243-1574. The address of each individual, unless otherwise noted, is 100 Pearl Street, Hartford, CT 06103-4506. There is no stated term of office for trustees of the Trust.
Independent Trustees
| Name, Year of Birth, Year Elected and Number of Funds Overseen | Principal Occupation(s) During Past 5 Years and Other Directorships Held by Trustee | |
Thomas J. Brown YOB: 1945 Elected: 2016 65 Portfolios | Retired. Trustee (since 2016), Virtus Mutual Fund Complex (52 portfolios) and Virtus Alternative Solutions Trust (4 portfolios); Trustee (since 2011), Virtus Variable Insurance Trust (9 portfolios); Director (since 2010), D’Youville Senior Care Center; and Director (since 2005), VALIC Company Funds (49 portfolios). | |
Burke, Donald C. YOB: 1961 Elected: 2016 69 Portfolios | Retired. Trustee (since 2016), Virtus Mutual Fund Complex (52 portfolios), Virtus Variable Insurance Trust (9 portfolios) and Virtus Alternative Solutions Trust (4 portfolios); Director (since 2014) closed-end funds managed by Duff & Phelps Investment Management Co. (4 funds); Director, Avista Corp. (energy company) (since 2011); Trustee, Goldman Sachs Fund Complex (2010 to 2014); and Director, BlackRock Luxembourg and Cayman Funds (2006 to 2010). | |
Roger A. Gelfenbien YOB: 1943 Elected: 2016 65 Portfolios | Retired. Trustee (since 2016), Virtus Mutual Fund Complex (52 portfolios) and Virtus Alternative Solutions Trust (4 portfolios); Trustee (since 2000), Virtus Variable Insurance Trust (9 portfolios); and Director (since 1999), USAllianz Variable Insurance Product Trust (42 portfolios). | |
John R. Mallin YOB: 1950 Elected: 2016 65 Portfolios | Partner/Attorney (since 2003), McCarter & English LLP (law firm), Real Property Practice Group; and Member (since 2014), Counselors of Real Estate. Trustee (since 2016), Virtus Mutual Fund Complex (52 portfolios) and Virtus Alternative Solutions Trust (4 portfolios); Director (since 2013), Horizon, Inc. (non-profit); and Trustee (since 1999), Virtus Variable Insurance Trust (9 portfolios). | |
McClellan, Hassell H. YOB: 1945 Elected: 2015 65 Portfolios | Retired (since 2013); and Professor (1984 to 2013), Wallace E. Carroll School of Management, Boston College. Trustee (since 2016), Virtus Alternative Solutions Trust (4 portfolios); Trustee (since 2015), Virtus Mutual Fund Complex (52 portfolios); and Director (since 2010), Barnes Group, Inc. (diversified global components manufacturer and logistical services company); Trustee, Virtus Variable Insurance Trust (9 portfolios) (since 2008); and Trustee, John Hancock Fund Complex (since 2000) (collectively, 228 portfolios). | |
McLoughlin, Philip YOB: 1946 Elected: 1999 74 Portfolios | Retired. Director and Chairman (since 2016), The Zweig Fund and Virtus Global Dividend & Income Fund Inc.; Trustee and Chairman (since 2013), Virtus Alternative Solutions Trust (4 portfolios); Trustee/Director and Chairman (since 2011), Virtus Closed-End Funds (3 funds); Chairman and Trustee (since 2003), Virtus Variable Insurance Trust (9 portfolios); Director (since 1995), closed-end funds managed by Duff & Phelps Investment Management Co. (4 funds); Director (since 1991) and Chairman (since 2010), Lazard World Trust Fund (closed-end investment firm in Luxembourg); and Trustee (since 1989) and Chairman (since 2002), Virtus Mutual Fund Complex (52 portfolios). | |
McNamara, Geraldine M. YOB: 1951 Elected: 2001 69 Portfolios | Retired. Trustee (since 2016) Virtus Alternative Solutions Trust (4 portfolios); Trustee (since 2015), Virtus Variable Insurance Trust (9 portfolios); Director (since 2003), closed-end funds managed by Duff & Phelps Investment Management Co. (4 funds); and Trustee (since 2001), Virtus Mutual Fund Complex (52 portfolios). | |
Oates, James M. YOB: 1946 Elected: 2000 70 Portfolios | Managing Director (since 1994), Wydown Group (consulting firm). Director (since 2016), The Zweig Fund and Virtus Global Dividend & Income Fund Inc.; Trustee (since 2016) Virtus Variable Insurance Trust (9 portfolios); Trustee/Director (since 2013), Virtus Closed-End Funds (3 funds); Trustee (since 2013), Virtus Alternative Solutions Trust (4 portfolios); Chairman and Trustee (since 2005), John Hancock Fund Complex (228 portfolios); Director (2002 to 2014), New Hampshire Trust Company; Chairman (since 2000), Emerson Investment Management, Inc.; Non-Executive Chairman (2000 to 2014), Hudson Castle Group, Inc. (formerly IBEX Capital Markets, Inc.) (financial services) Chairman and Director (1999 to 2014), Connecticut River Bank; Director (since 1996), Stifel Financial; and Trustee (since 1987), Virtus Mutual Fund Complex (52 portfolios). | |
Segerson, Richard E. YOB: 1948 Elected: 2000 65 Portfolios | Retired; and Managing Director (1998 to 2013), Northway Management Company. Trustee (since 2016) Virtus Alternative Solutions Trust (4 portfolios) and Virtus Variable Insurance Trust (9 portfolios); and Trustee (since 1983), Virtus Mutual Fund Complex (52 portfolios). | |
Verdonck, Ferdinand L.J. YOB: 1942 Elected: 2005 65 Portfolios | Vice Chairman (since 2014), Affirmed Therapeutics (biotechnology); Director (1998 to 2015), The J.P. Morgan Continental European Investment Trust; Director (2005 to 2013), Galapagos N.V. (biotechnology); Director (1998 to 2015) Groupe SNEF; and Mr. Verdonck is also a director of several non-U.S. companies. Trustee (since 2016) Virtus Variable Insurance Trust (9 portfolios) and Virtus Alternative Solutions Trust (4 portfolios); and Trustee (since 2002), Virtus Mutual Fund Complex (52 portfolios). | |
98
Table of Contents
FUND MANAGEMENT TABLES (Continued)
Interested Trustee
| Name, Year of Birth, Year Elected and Number of Funds Overseen | Principal Occupation(s) During Past 5 Years and Other Directorships Held by Trustee | |
Aylward, George R.* Trustee and President YOB: 1964 Elected: 2006 70 Portfolios | Director, President and Chief Executive Officer (since 2008), Virtus Investment Partners, Inc. and/or certain of its subsidiaries; various senior officer positions with Virtus affiliates (since 2005). Chairman and Trustee (since 2015), Virtus ETF Trust II; Trustee and President (since 2013), Virtus Alternative Solutions Trust (4 portfolios); Director (since 2013), Virtus Global Funds, PLC (2 portfolios); Trustee (since 2012) and President (since 2010), Virtus Variable Insurance Trust (9 portfolios); Trustee and President (since 2011), Virtus Closed-End Funds (3 funds); Trustee (since 2006), Virtus Mutual Funds (52 portfolios); and Director, President and Chief Executive Officer (since 2006), The Zweig Fund and Virtus Global Dividend & Income Fund Inc. | |
Officers
| Name, Address and Year of Birth | Position(s) Held with Trust and Length of Time Served | Principal Occupation(s) During Past 5 Years | ||
Bradley, W. Patrick YOB: 1972 | Executive Vice President (since 2016); Senior Vice President (2013 to 2016); Vice President (2011 to 2013); Chief Financial Officer and Treasurer (since 2006). | Executive Vice President, Fund Services (since 2016), Senior Vice President, Fund Services (2010 to 2016), Virtus Investment Partners, Inc. and/or certain of its subsidiaries; various officer positions (since 2006) with Virtus affiliates; Executive Vice President (since 2016), Senior Vice President (2013 to 2016), Vice President (2011 to 2013), Chief Financial Officer and Treasurer (since 2004), Virtus Variable Insurance Trust; Executive Vice President (since 2016), Senior Vice President (2013 to 2016), Vice President (2011 to 2013), Chief Financial Officer and Treasurer (since 2006), Virtus Mutual Fund Complex; Executive Vice President (since 2016), Senior Vice President (2013 to 2016), Vice President (2012 to 2013) and Treasurer (Chief Financial Officer) (since 2007), The Zweig Fund and Virtus Global Dividend & Income Fund Inc.; Executive Vice President (since 2016), Senior Vice President (2013 to 2016), Vice President (2011 to 2013), Chief Financial Officer and Treasurer (since 2011), Virtus Closed-End Funds; Vice President and Assistant Treasurer (since 2011), Duff & Phelps Global Utility Income Fund Inc.; Director (since 2013), Virtus Global Funds, PLC; and Executive Vice President (since 2016), Senior Vice President, Chief Financial Officer and Treasurer (2013 to 2016), Virtus Alternative Solutions Trust. | ||
Carr, Kevin J. YOB: 1954 | Senior Vice President (since 2013); Vice President (2005 to 2013); Chief Legal Officer, Counsel and Secretary (since 2005). | Senior Vice President (since 2009), Vice President, Counsel and Secretary (2008 to 2009), Virtus Investment Partners, Inc. and/or certain of its subsidiaries; various senior officer positions (since 2005) with Virtus affiliates; Senior Vice President (since 2013), Vice President (2005 to 2013), Chief Legal Officer, Counsel and Secretary (since 2005), Virtus Mutual Fund Complex; Senior Vice President (2013 to 2014), Vice President (2012 to 2013) and Assistant Secretary (since 2012), Secretary and Chief Legal Officer (2005 to 2012), The Zweig Fund and Virtus Global Dividend & Income Fund Inc.; Assistant Secretary (since 2013), Vice President, Chief Legal Officer, Counsel and Secretary (2010 to 2013), Virtus Variable Insurance Trust; Vice President and Assistant Secretary (since 2011), Duff & Phelps Global Utility Income Fund Inc.; Senior Vice President and Assistant Secretary (2013 to 2014), Vice President and Assistant Secretary (2012 to 2013), Vice President, Chief Legal Officer, Counsel and Secretary (2011 to 2012), Virtus Closed-End Funds; and Assistant Secretary (since 2013), Virtus Alternative Solutions Trust. | ||
Engberg, Nancy J. YOB: 1956 | Vice President and Chief Compliance Officer since 2011. | Vice President (since 2008) and Chief Compliance Officer (2008 to 2011 and since 2016), Virtus Investment Partners, Inc. and/or certain of its subsidiaries; various officer positions (since 2003) with Virtus affiliates; Vice President and Chief Compliance Officer (since 2011), Virtus Mutual Fund Complex; Vice President (since 2010) and Chief Compliance Officer (since 2011), Virtus Variable Insurance Trust; Vice President and Chief Compliance Officer (since 2011), Virtus Closed-End Funds; Vice President and Chief Compliance Officer (since 2012), The Zweig Fund and Virtus Global Dividend & Income Fund Inc.; Vice President and Chief Compliance Officer (since 2013), Virtus Alternative Solutions Trust; Chief Compliance Officer (since 2015), ETFis Series Trust I; and Chief Compliance Officer (since 2015), Virtus ETF Trust II. | ||
Waltman, Francis G. YOB: 1962 | Executive Vice President (since 2013); Senior Vice President (2008-2013). | Executive Vice President, Product Development (since 2009), Virtus Investment Partners, Inc. and/or certain of its subsidiaries; various senior officer positions (since 2006) with Virtus affiliates; Executive Vice President (since 2013), Senior Vice President (2008 to 2013), Virtus Mutual Fund Complex; Executive Vice President (since 2013), Senior Vice President (2010 to 2013), Virtus Variable Insurance Trust; Executive Vice President (since 2013), Senior Vice President (2011 to 2013), Virtus Closed-End Funds; Director (since 2013), Virtus Global Funds PLC; and Executive Vice President (since 2013), Virtus Alternative Solutions Trust. | ||
99
Table of Contents
Virtus Emerging Markets Small-Cap Fund, (“the fund”) a series of Virtus Opportunities Trust
Supplement dated June 10, 2016 to the Summary Prospectus dated January 28, 2016, as supplemented, the Virtus Opportunities Trust Statutory Prospectus, dated January 28, 2016, as supplemented, and the Statement of Additional Information, dated January 28, 2016, as supplemented
IMPORTANT NOTICETO INVESTORS
Effective June 10, 2016, James Fletcher is no longer a portfolio manager for the fund. The resulting disclosure changes to the fund’s prospectuses and SAI are described below.
The disclosure under “Portfolio Management” in the fund’s summary prospectus and in the summary section of the fund’s statutory prospectus is hereby revised by removing each reference to Mr. Fletcher.
The table under “Kayne” on page 185 of the fund’s statutory prospectus is hereby revised by removing the reference to Mr. Fletcher. The narrative under the referenced table is hereby amended by removing the biographical information for Mr. Fletcher.
The disclosure for the fund in the table under “Portfolio Managers” beginning on page 98 of the SAI is hereby amended by removing the reference to Mr. Fletcher.
The disclosure in the “Other Accounts Managed (No Performance-Based Fees)” table on page 99 of the SAI is hereby amended by removing the reference to Mr. Fletcher.
The disclosure in the table under “Portfolio Manager Fund Ownership” beginning on page 103 of the SAI is hereby amended by removing the reference to ownership by Mr. Fletcher.
Investors should retain this supplement with the
Prospectuses and SAI for future reference.
VOT 8020 EMSmall-Cap PM (6/2016)
Table of Contents
Virtus International Equity Fund, a series of Virtus Opportunities Trust
Supplement dated September 7, 2016 to the Summary and Statutory Prospectuses dated January 28, 2016
IMPORTANT NOTICETO INVESTORS
As approved by the Board of Trustees of Virtus Opportunities Trust, effective September 7, 2016, Duff & Phelps Investment Management Co. (“Duff & Phelps”) became the subadviser to the above named fund. Also effective September 7, 2016, the fund’s current subadviser, Euclid Advisors LLC (“Euclid”) is removed as subadviser. Accordingly, effective September 7, 2016, all references to Euclid as subadviser to the fund are hereby removed from the fund’s prospectuses. Frederick A. Brimberg, formerly a portfolio manager at Euclid and currently a portfolio manager at Duff & Phelps will continue to serve as the portfolio manager for the fund. Virtus Investment Advisers, Inc. (“VIA”) will continue to serve as the fund’s investment adviser. Duff & Phelps will serve under an interim subadvisory agreement until such time as the fund’s standard subadvisory agreement is implemented, not to exceed 150 days.
Additional disclosure changes resulting from the replacement of the subadviser are described below and are also effective September 7, 2016.
The second paragraph under “Management” in the summary prospectus and in the summary section of the statutory prospectus is hereby replaced with the following:
Duff & Phelps Investment Management Co. (“Duff & Phelps”), an affiliate of VIA, is subadviser to the fund (since September 2016).
The disclosure under “Portfolio Management” in the summary prospectuses and in the summary section of the statutory prospectus is hereby replaced with the following:
| > | Frederick A. Brimberg, Senior Managing Director and International Equity Portfolio Manager at Duff & Phelps. Mr. Brimberg has served as a Portfolio Manager of the fund since May 2013. |
Under “The Adviser” on page 179 of the statutory prospectus, the first table is hereby amended by replacing the row for the fund with the following information:
| Virtus International Equity Fund | Duff & Phelps |
The disclosure under “Portfolio Management” on page 183 of the statutory prospectus, the section under the subheading “Duff & Phelps” is hereby revised by adding the following:
| Virtus International Equity Fund | Frederick A. Brimberg (since May 2013) |
Frederick A. Brimberg. Mr. Brimberg is Senior Managing Director and International Equity Portfolio Manager at Duff & Phelps (since August 2016) and is a portfolio manager at Euclid Advisors LLC (“Euclid”), an affiliate of Duff & Phelps and VIA. Prior to joining Euclid, he was senior vice president and international portfolio manager at Avatar Associates (2006 to 2012), where he started the international strategy in 2006. Earlier, he was vice president and portfolio manager at ING Investment Management and its predecessor Lexington Management, with a focus on global equity investing. Mr. Brimberg’s career spans 30-plus years in investment management, trading, and capital markets, with positions at Brimberg & Co., and Lehman Brothers.
All other disclosure concerning the fund, including fees and expenses, remains unchanged from the prospectuses dated January 28, 2016.
Investors should retain this supplement with the Prospectuses for future reference.
VOT 8020/IntEquityDPIMChanges (9/2016)
Table of Contents
Virtus International Equity Fund, a series of Virtus Opportunities Trust
Supplement dated September 7, 2016 to the Statement of Additional Information (“SAI”) dated January 28, 2016
IMPORTANT NOTICETO INVESTORS
As approved by the Board of Trustees of Virtus Opportunities Trust, effective September 7, 2016, Duff & Phelps Investment Management Co. (“Duff & Phelps”) became the subadviser to the above named fund. Also effective September 7, 2016, the fund’s current subadviser, Euclid Advisors LLC (“Euclid”) is removed as subadviser. Accordingly, effective September 7, 2016, all references to Euclid as subadviser to the fund are hereby removed from the fund’s prospectuses. Frederick A. Brimberg, formerly a portfolio manager at Euclid and currently a portfolio manager at Duff & Phelps will continue to serve as the portfolio manager for the fund. Virtus Investment Advisers, Inc. (“VIA”) will continue to serve as the funds’ investment adviser. Duff & Phelps will serve under an interim subadvisory agreement until such time as the fund’s standard subadvisory agreement is implemented, not to exceed 150 days.
Additional disclosure changes resulting from the replacement of the subadviser are described below and are also effective September 7, 2016.
In the “Glossary” beginning on page 2, the entry entitled “Duff & Phelps” is hereby revised to read: “Duff & Phelps Investment Management Co., subadviser to the Global Infrastructure Fund, Global Real Estate Fund, International Equity Fund, International Real Estate Fund and Real Estate Fund.
Under the “Non-Public Portfolio Holdings Information” beginning on page 9, the table is hereby revised to replace the second row with the following:
| Type of Service Provider | Name of Service Provider | Timing of Release of Portfolio Holdings Information | ||
| Subadviser (Global Infrastructure Fund, Global Real Estate Fund, International Equity Fund, International Real Estate Fund and Real Estate Fund) | Duff & Phelps Investment Management Co. | Daily, with no delay |
Investors should retain this supplement with the SAI for future reference.
VOT 8020B SAI/IntEquityDPIMChanges (9/2016)
Table of Contents
Virtus Emerging Markets Equity Income Fund and Virtus Essential Resources Fund, each a series of Virtus Opportunities Trust
Supplement dated September 13, 2016 to the Summary and Statutory Prospectuses and Statement of Additional Information (“SAI”), each dated January 28, 2016, as supplemented
IMPORTANT NOTICETO INVESTORS
Effective September 1, 2016, the subadviser to the above-named funds changed its name from Kleinwort Benson Investors International, Ltd. to KBI Global Investors (North America) Ltd. Accordingly, all references to the subadviser’s previous name in each fund’s summary prospectus, the statutory prospectus and SAI are hereby changed to reflect the subadviser’s new name, KBI Global Investors (North America) Ltd. and references to the defined term “KBII” are hereby changed to “KBIGI (North America).” Also, KBIGI (North America)’s affiliate, Kleinwort Benson Investors Dublin Ltd., has changed its name to KBI Global Investors Ltd. Accordingly, all references to that entity’s previous name in each fund’s summary prospectus, the statutory prospectus and SAI are hereby changed to reflect its new name, KBI Global Investors Ltd.
Investors should retain this supplement with the Prospectuses and SAI for future reference.
VOT 8020 KBIINameChange (9/2016)
103
Table of Contents
Virtus Global Infrastructure Fund, a series of Virtus Opportunities Trust
Supplement dated September 30, 2016 to the Summary and Statutory Prospectuses dated January 28, 2016
IMPORTANT NOTICETO INVESTORS
Effective October 1, 2016, the fund’s primary benchmark is the FTSE Developed Core Infrastructure 50/50 Index (net) (“FTSE 50/50”). The FTSE 50/50 is a broad-based index representing infrastructure and infrastructure-related listed securities in developed markets. The fund believes that the FTSE 50/50 Index provides a better measure for the fund’s performance in light of the fund’s focus on infrastructure companies. The fund will no longer use the S&P 500® Index as its broad-based index for performance comparisons. Additionally, beginning October 1, 2016, performance of the Global Infrastructure Linked Benchmark will consist of the FTSE 50/50. Also effective October 1, 2016, the fund is adding the MSCI World Infrastructure Sector Capped Index (net) (“MSCI WISC”) as a secondary index by which to measure the fund’s performance. The MSCI WISC is a broad-based index representing global infrastructure and infrastructure-related listed securities.
Additional Information About the New Indexes
The FTSE Developed Core Infrastructure 50/50 Index (net) is a free float-adjusted market capitalization weighted index that gives participants an industry-defined interpretation of developed market infrastructure companies and adjusts the exposure to certain infrastructure subsectors. The constituent weights are 50% Utilities, 30% Transportation (including capping of 7.5% for railroads/railways), and a 20% mix of other sectors including pipelines, satellites, and telecommunication towers. The MSCI World Infrastructure Sector Capped Index (net) is a market capitalization weighted index that measures performance of global infrastructure companies by capturing broad and diversified opportunities across telecommunication, utilities, energy, transportation, and social infrastructure sectors. The telecommunication infrastructure and utilities sectors each represent one-third of the index weight, while energy, transportation and social infrastructure sectors have a combined weight of the remaining one-third of the index. The FTSE Developed Core Infrastructure 50/50 Index (net) and the MSCI World Infrastructure Sector Capped Index (net) are each calculated on a total return basis with net dividends reinvested. The indexes are unmanaged and not available for direct investment.
Investors should retain this supplement with the Prospectuses for future reference.
VOT 8020 GlobalInfrastructureBenchmark (9/2016)
104
Table of Contents
Virtus Global Real Estate Securities Fund, a series of Virtus Opportunities Trust
Supplement dated November 1, 2016 to the Summary Prospectus dated January 28, 2016, as supplemented, and the Virtus Opportunities Trust Statutory Prospectus, dated January 28, 2016, as supplemented
IMPORTANT NOTICETO INVESTORS
As of November 1, 2016, Virtus Global Real Estate Securities Fund is offering Class R6 Shares, in addition to the share classes already offered by the fund. Accordingly, the fund’s prospectuses are hereby amended to add the following disclosure.
The cover page of the statutory prospectus is hereby revised by replacing the row showing ticker symbols for the fund’s share classes with the row shown below:
| A | B | C | I | R6 | T | |||||||
| Virtus Global Real Estate Securities Fund | VGSAX | VGSCX | VGISX | VRGEX |
The tables under “Fees and Expenses” in the fund’s summary prospectus and the summary section of the statutory prospectus are hereby revised to add the Class R6 column and to revise the associated footnotes as shown below:
| Shareholder Fees (fees paid directly from your investment) | Class R6 | |||
| Maximum Sales Charge (load) Imposed on Purchases (as a percentage of offering price) | None | |||
| Maximum Sales Charge (load) (as a percentage of the lesser of purchase price or redemption proceeds) | None |
| Annual Fund Operating Expenses (expenses that you pay each year as a percentage of the value of your investment) | Class R6 | |||
| Management Fee | 0.85% | |||
| Distribution and Shareholder Servicing (12b-1) Fees | None | |||
| Other Expenses | 0.29% | (b) | ||
| Total Annual Fund Operating Expenses(c) | 1.14% | |||
| Less: Fee Waiver and/or Expense Reimbursement(d) | (0.10% | ) | ||
| Total Annual Fund Operating Expenses After Expense Reimbursement(c)(d) | 1.04% |
| (b) | Estimated for current fiscal year, as annualized. |
| (c) | The Total Annual Fund Operating Expenses do not correlate to the ratio of expenses to average net assets appearing in the Financial Highlights tables, which tables reflect only the operating expenses of the fund and do not include acquired fund fees and expenses. |
| (d) | The fund’s investment adviser has contractually agreed to limit the fund’s total operating expenses (excluding dividend and interest expenses, taxes, brokerage commissions, extraordinary expenses and acquired fund fees and expenses) so that such expenses do not exceed 1.40% for Class A Shares, 2.15% for Class C Shares, 1.15% for Class I Shares and 1.04% for Class R6 Shares through January 31, 2017. Following the contractual period, the adviser may discontinue these expense reimbursement arrangements at any time. Under certain conditions, the adviser may recapture operating expenses reimbursed under these arrangements for a period of three years following the time such reimbursement occurred. |
The Example table is hereby revised to add the Class R6 row as shown below:
| Share Status | 1 Year | 3 Years | 5 Years | 10 Years | ||||||||||||||
| Class R6 | Sold or Held | $ | 106 | $ | 352 | $ | 618 | $ | 1,377 | |||||||||
In the first table in the section “More Information About Fund Expenses” on page 128 of the statutory prospectus, the row corresponding to the fund is hereby replaced with the following.
| | Class A Shares | | | Class B Shares | | | Class C Shares | | | Class I Shares | | | Class R6 Shares | | | Class T Shares | | Through Date | ||||||||||
| Virtus Global Real Estate Securities Fund | 1.40% | N/A | 2.15% | 1.15% | 1.04% | N/A | January 31, 2017 |
Table of Contents
In the second table in the section “More Information About Fund Expenses” on page 129 of the statutory prospectus, the row corresponding to the fund is hereby replaced with the following.
| | Class A Shares | | | Class B Shares | | | Class C Shares | | | Class I Shares | | | Class R6 Shares | | | Class T Shares | | Through Date | ||||||||||
| Virtus Global Real Estate Securities Fund | 1.40% | N/A | 2.15% | 1.15% | 1.04% | N/A | January 31, 2017 |
Under “What are the classes and how do they differ?” on page 202 of the statutory prospectus, the table in this section is hereby amended to read “None” in the column entitled “Class R6” for Virtus Global Real Estate Securities Fund.
The Class R6 Shares subheading under “What arrangement is best for you?” on pages 202-204 of the statutory prospectus is hereby amended to read:
Class R6 Shares (Virtus Bond Fund, Virtus Emerging Markets Opportunities Fund, Virtus Equity Trend Fund, Virtus Foreign Opportunities Fund, Virtus Global Real Estate Securities Fund, Virtus High Yield Fund, Virtus International Small-Cap Fund, Virtus Multi-Sector Intermediate Bond Fund, Virtus MultiSector Short Term Bond Fund, Virtus Real Estate Securities Fund and Virtus Senior Floating Rate Fund only).
Investors should retain this supplement with the Prospectuses for future reference.
VOT 8020/GlRESecNewExpCap (11/16)
Table of Contents
Virtus Bond Fund, Virtus, Virtus Global Real Estate Securities Fund, Virtus High Yield Fund, Virtus Multi-Sector Short Term Bond Fund, and Senior Floating Rate Fund, each a series of Virtus Opportunities Trust
Supplement dated November 1, 2016 to the Statement of Additional Information (“SAI”) dated September 23, 2016
IMPORTANT NOTICETO INVESTORS
As of November 1, 2016, Virtus Bond Fund, Virtus Global Real Estate Securities Fund, Virtus High Yield Fund, Virtus Multi-Sector Short Term Bond Fund and Virtus Senior Floating Rate Fund are offering Class R6 Shares, in addition to the share classes already offered by each fund. Additionally, Virtus High Yield Fund has increased its expense reimbursement arrangement, effective November 1, 2016. Accordingly, the SAI is hereby amended to add the following disclosures.
The cover page of the SAI is hereby revised by replacing the rows showing ticker symbols for the following funds’ share classes with the rows shown below:
| A | B | C | I | R6 | T | |||||||
| Virtus Bond Fund | SAVAX | SAVBX | SAVCX | SAVYX | VBFRX | |||||||
| Virtus Global Real Estate Securities Fund | VGSAX | VGSCX | VGISX | VRGEX | ||||||||
| Virtus High Yield Fund | PHCHX | PHCCX | PGHCX | PHCIX | VRHYX | |||||||
| Virtus Multi-Sector Short Term Bond Fund | NARAX | PBARX | PSTCX | PIMSX | VMSSX | PMSTX | ||||||
| Virtus Senior Floating Rate Fund | PSFRX | PFSRX | PSFIX | VRSFX |
Under “Other Virtus Mutual Funds” on page 15, the rows shown below are hereby revised to indicate that each of these funds offers Class R6 Shares:
| Class/Shares | ||||||
| Trust | Fund | R6 | ||||
| Virtus Alternative Solutions Trust | Multi-Strategy Target Return Fund | X | ||||
| Virtus Equity Trust | Quality Small-Cap Fund | X |
Under the heading “Investment Advisory Agreement and Expense Limitation Agreement” in the section “Investment Advisory and Other Services” on pages 86-88 of the funds’ SAI, the rows in the second table corresponding to the funds shown below are hereby replaced with the following:
| Class A | Class B | Class C | Class I | Class R6 | Class T | Through Date | ||||||||||||||||||||||
| Bond Fund | 0.85% | 1.60% | 1.60% | 0.60% | 0.54% | N/A | January 31, 2017 | |||||||||||||||||||||
| Global Real Estate Securities Fund | 1.40% | N/A | 2.15% | 1.15% | 1.04% | N/A | January 31, 2017 | |||||||||||||||||||||
| High Yield Fund | 1.00% | 1.75% | 1.75% | 0.75% | 0.69% | N/A | January 31, 2017 | |||||||||||||||||||||
| Multi-Sector Short Term Bond Fund | 1.10% | 1.60% | 1.35% | 0.85% | 0.78% | 1.85% | January 31, 2017 | |||||||||||||||||||||
| Senior Floating Rate Fund | 1.20% | N/A | 1.95% | 0.95% | 0.89% | N/A | January 31, 2017 |
Investors should retain this supplement with the SAI for future reference.
VOT 8020B SAI/AddR6NewExpCap (11/16)
Table of Contents
Virtus Emerging Markets Equity Income Fund, a series of Virtus Opportunities Trust
Supplement dated November 1, 2016 to the Summary Prospectus dated January 28, 2016, as supplemented, and the Virtus Opportunities Trust Statutory Prospectus, dated January 28, 2016, as supplemented
IMPORTANT NOTICETO INVESTORS
Under “Fees and Expenses” in the fund’s summary prospectus and the summary section of the statutory prospectus, the “Annual Fund Operating Expenses” table and associated footnotes are hereby replaced with the following:
| Annual Fund Operating Expenses (expenses that you pay each year as a percentage of the value of your investment) | Class A | Class C | Class I | |||||||||
| Management Fees | 1.05% | 1.05% | 1.05% | |||||||||
| Distribution and Shareholder Servicing (12b-1) Fees | 0.25% | 1.00% | None | |||||||||
| Other Expenses | 0.46% | 0.46% | 0.46% | |||||||||
| Acquired Fund Fees and Expenses | 0.02% | 0.02% | 0.02% | |||||||||
| Total Annual Fund Operating Expenses(b) | 1.78% | 2.53% | 1.53% | |||||||||
| Less: Expense Reimbursement(c) | (0.16)% | (0.16)% | (0.16)% | |||||||||
| Total Annual Fund Operating Expenses After Expense Reimbursement(b)(c) | 1.62% | 2.37% | 1.37% |
| (b) | The Total Annual Fund Operating Expenses do not correlate to the ratio of expenses to average net assets appearing in the Financial Highlights tables, which tables reflect only the operating expenses of the fund and do not include acquired fund fees and expenses. |
| (c) | The fund’s investment adviser has contractually agreed to limit the fund’s total operating expenses (excluding dividend and interest expenses, taxes, brokerage commissions, extraordinary expenses and acquired fund fees and expenses) so that such expenses do not exceed 1.60% for Class A Shares, 2.35% for Class C Shares and 1.35% for Class I Shares through January 31, 2017. Following the contractual period, the adviser may discontinue these expense reimbursement arrangements at any time. Under certain conditions, the adviser may recapture operating expenses reimbursed under these arrangements for a period of three years following the time such reimbursement occurred. |
Under “Fees and Expenses, the “Example” table is hereby replaced with the following:
| Share Status | 1 Year | 3 Years | 5 Years | 10 Years | ||||||||||||||
| Class A | Sold or Held | $ | 730 | $ | 1,088 | $ | 1,470 | $ | 2,537 | |||||||||
| Class C | Sold | $ | 340 | $ | 772 | $ | 1,331 | $ | 2,854 | |||||||||
| Held | $ | 240 | $ | 772 | $ | 1,331 | $ | 2,854 | ||||||||||
| Class I | Sold or Held | $ | 139 | $ | 468 | $ | 819 | $ | 1,810 | |||||||||
In the first table in the section “More Information About Fund Expenses” on page 128 of the statutory prospectus, the row corresponding to the fund is hereby replaced with the following.
| | Class A Shares | | | Class B Shares | | | Class C Shares | | | Class I Shares | | | Class R6 Shares | | | Class T Shares | | Through Date | ||||||||||
| Virtus Emerging Markets Equity Income Fund | 1.60% | N/A | 2.35% | 1.35% | N/A | N/A | January 31, 2017 |
Table of Contents
In the second table in the section “More Information About Fund Expenses” on page 129 of the statutory prospectus, the row corresponding to the fund is hereby replaced with the following:
| | Class A Shares | | | Class B Shares | | | Class C Shares | | | Class I Shares | | | Class R6 Shares | | | Class T Shares | | |||||||
| Virtus Emerging Markets Equity Income Fund** | 1.77% | N/A | 2.52% | 1.52% | N/A | N/A |
| ** | Rates shown reflect prior expense reimbursement arrangements. |
Investors should retain this supplement with the Prospectuses for future reference.
VOT 8020/EMEI NewExpCap (11/16)
Table of Contents
VIRTUS OPPORTUNITIES TRUST
101 Munson Street
Greenfield, MA 01301-9668
Trustees
George R. Aylward
Thomas J. Brown
Donald C. Burke
Roger A. Gelfenbein
John R. Mallin
Hassell H. McClellan
Philip R. McLoughlin, Chairman
Geraldine M. McNamara
James M. Oates
Richard E. Segerson
Ferdinand L.J. Verdonck
Officers
George R. Aylward, President
Francis G. Waltman, Executive Vice President
W. Patrick Bradley, Executive Vice President, Chief Financial Officer and Treasurer
Kevin J. Carr, Senior Vice President, Chief Legal Officer, Counsel and Secretary
Nancy J. Engberg, Vice President and Chief Compliance Officer
Investment Adviser
Virtus Investment Advisers, Inc.
100 Pearl Street
Hartford, CT 06103-4506
Principal Underwriter
VP Distributors, LLC
100 Pearl Street
Hartford, CT 06103-4506
Administrator and Transfer Agent
Virtus Fund Services, LLC
100 Pearl Street
Hartford, CT 06103-4506
Custodian
JPMorgan Chase Bank, NA
1 Chase Manhattan Plaza
New York, NY 10005-1401
Independent Registered Public Accounting Firm
PricewaterhouseCoopers LLP
2001 Market Street
Philadelphia, PA 19103-7042
How to Contact Us
Mutual Fund Services | 1-800-243-1574 | |
Adviser Consulting Group | 1-800-243-4361 | |
Website | Virtus.com |
Important Notice to Shareholders
The Securities and Exchange Commission has modified mailing regulations for semiannual and annual shareholder fund reports to allow mutual fund companies to send a single copy of these reports to shareholders who share the same mailing address. If you would like additional copies, please call Mutual Fund Services at 1-800-243-1574.
Table of Contents
| ||
P.O. Box 9874 Providence, RI 02940-8074 |

For more information about Virtus Mutual Funds,
please call your financial representative, or contact us
at 1-800-243-1574 or Virtus.com.
8032 | 11-16 |
Table of Contents

ANNUAL REPORT
Virtus Emerging Markets Opportunities Fund
September 30, 2016
TRUST NAME: VIRTUS OPPORTUNITIES TRUST
Not FDIC Insured
No Bank Guarantee
May Lose Value

Table of Contents
Virtus Emerging Markets Opportunities Fund
(“Emerging Markets Opportunities Fund”)
| 1 | ||||
| 2 | ||||
| 4 | ||||
| 6 | ||||
| 10 | ||||
| 13 | ||||
| 14 | ||||
| 15 | ||||
| 16 | ||||
| 20 | ||||
| 31 | ||||
| 32 | ||||
| 33 |
PROXY VOTING PROCEDURES AND VOTING RECORD (FORM N-PX)
The subadvisers vote proxies relating to portfolio securities in accordance with procedures that have been approved by the Board of Trustees of the Trust (“Trustees,” or the “Board”). You may obtain a description of these procedures, along with information regarding how the Fund voted proxies during the most recent 12-month period ended June 30, free of charge, by calling toll-free 1-800-243-1574. This information is also available through the Securities and Exchange Commission’s (the “SEC”) website at http://www.sec.gov.
FORM N-Q INFORMATION
The Trust files a complete schedule of portfolio holdings for the Fund with the SEC for the first and third quarters of each fiscal year on Form N-Q. Form N-Q is available on the SEC’s website at http://www.sec.gov. Form N-Q may be reviewed and copied at the SEC’s Public Reference Room. Information on the operation of the SEC’s Public Reference Room can be obtained by calling toll-free 1-800-SEC-0330.
This report is not authorized for distribution to prospective investors in the Virtus Emerging Markets Opportunities Fund unless preceded or accompanied by an effective prospectus which includes information concerning the sales charge, the Fund’s record and other pertinent information.
Table of Contents
To Virtus Emerging Markets Opportunities Fund Shareholders:
 | I am pleased to present this report that reviews the performance of your fund for the nine months ended September 30, 2016.
Equities plummeted in early 2016, but stabilizing oil prices and the Federal Reserve’s (“the Fed”) softened stance on further rate hikes for 2016 sparked a rally in mid-February that lasted until June. The U.K.’s June 23 “Brexit” decision to leave the European Union triggered a selloff that was largely short-lived. Calm was restored by better-than-expected corporate earnings, an improving global economic picture, and reassurance that the world’s central banks would continue to provide monetary stimulus. By the end of September, U.S. equity markets had recovered much of their losses, and the nine-month period was positive for many asset classes. | |
For the nine months ended September 30, 2016, U.S. small-cap stocks, as measured by the 11.46% return of the Russell 2000® Index, outperformed the 7.84% return of the S&P 500® Index of U.S. large-cap stocks. Within international equities, emerging markets significantly outperformed their developed peers, with the MSCI Emerging Markets Index (net) up 16.02%, while the MSCI EAFE® Index (net) returned 1.73%.
Demand for U.S. Treasuries remained strong, driven by foreign investors seeking safe havens and yield in light of the negative interest rate environment in many international economies. On September 30, 2016, the benchmark 10-year U.S. Treasury yielded 1.60% compared with 2.27% on December 31, 2015. For the nine months ended September 30, 2016, the broader U.S. fixed income market, as represented by the Bloomberg Barclays U.S. Aggregate Bond Index, which tracks Treasuries and other investment-grade debt securities, gained 5.80%, while non-investment grade bonds rose 15.11%, as measured by the Bloomberg Barclays U.S. Corporate High Yield Bond Index.
The strength of the global economy will likely remain a leading concern for markets in the months ahead, and investors will watch with great interest the actions of the Fed and other major central banks. The U.S. economy’s continued growth, as evidenced by recent strong jobs, housing, and consumer spending data, should give investors reason for optimism, but future market direction will be determined largely by the ability of corporations to continue to produce robust earnings.
Market uncertainty is an ever-present reminder of the importance of portfolio diversification, including exposure to both traditional and alternative asset classes. While diversification cannot guarantee a profit or prevent a loss, owning a variety of asset classes may cushion your portfolio against inevitable market fluctuations. Your financial advisor can help you ensure that your portfolio is adequately diversified across asset classes and investment strategies.
As always, thank you for entrusting Virtus with your assets. Should you have questions about your account or require assistance, please visit our website at Virtus.com, or call our customer service team at 1-800-243-1574. We appreciate your business and remain committed to your long-term financial success. | ||
Sincerely,
George R. Aylward President, Virtus Mutual Funds
October 2016
Performance data quoted represents past results. Past performance is no guarantee of future results, and current performance may be higher or lower than the performance shown above. | ||

1
Table of Contents
VIRTUS EMERGING MARKETS OPPORTUNITIES FUND
DISCLOSURE OF FUND EXPENSES (Unaudited)
FOR THE SIX-MONTH PERIOD OF APRIL 1, 2016 TO SEPTEMBER 30, 2016
We believe it is important for you to understand the impact of costs on your investment. All mutual funds have operating expenses. As a shareholder of the Emerging Markets Opportunities Fund (the “Fund”), you may incur two types of costs: (1) transaction costs, including sales charges on purchases of Class A shares and contingent deferred sales charges on Class C shares; and (2) ongoing costs, including investment advisory fees; distribution and service fees; and other expenses. Class I shares and Class R6 shares are sold without sales charges and Class R6 shares do not incur distribution and service fees. For further information regarding applicable sales charges, see Note 1 in the Notes to Financial Statements. These examples are intended to help you understand your ongoing costs (in dollars) of investing in a Fund and to compare these costs with the ongoing costs of investing in other mutual funds. These examples are based on an investment of $1,000 invested at the beginning of the period and held for the entire six-month period. The following Expense Table illustrates your Fund’s costs in two ways.
Actual Expenses
The first section of the accompanying table provides information about actual account values and actual expenses. You may use the information in this section, together with the amount you invested, to estimate the expenses that you paid over the period. Simply divide your account value by $1,000 (for example, an $8,600 account value divided by $1,000 = 8.6), then multiply the result by the number given for your Fund under the heading “Expenses Paid During Period” to estimate the expenses you paid on your account during the period.
Hypothetical Example for Comparison Purposes
The second section of the accompanying table provides information about hypothetical account values and hypothetical expenses based on the Fund’s actual expense ratio and an assumed rate of return of 5% per year before expenses, which is not your Fund’s actual return. The hypothetical account values and expenses may not be used to estimate the actual ending account balance or expenses you paid for the period. You may use this information to compare the ongoing costs of investing in your Fund and other funds. To do so, compare these 5% hypothetical examples with the 5% hypothetical examples that appear in the shareholder reports of the other funds.
Please note that the expenses shown in the accompanying table are meant to highlight your ongoing costs only and do not reflect any transactional costs, such as sales charges or contingent deferred sales charges. Therefore, the second section of the accompanying table is useful in comparing ongoing costs only, and will not help you determine the relative total costs of owning different funds. In addition, if these transactional costs were included, your costs would have been higher. The calculations assume no shares were bought or sold during the period. Your actual costs may have been higher or lower, depending on the amount of your investment and the timing of any purchases or redemptions.
2
Table of Contents
VIRTUS EMERGING MARKETS OPPORTUNITIES FUND
DISCLOSURE OF FUND EXPENSES (Unaudited) (Continued)
FOR THE SIX-MONTH PERIOD OF APRIL 1, 2016 TO SEPTEMBER 30, 2016
| Expense Table | ||||||||||||||||
| Beginning Account Value April 1, 2016 | Ending Account Value September 30, 2016 | Annualized Expense Ratio | Expenses Paid During Period* | |||||||||||||
Emerging Markets Opportunities Fund |
| |||||||||||||||
Actual | ||||||||||||||||
| Class A | $ | 1,000.00 | $ | 1,116.10 | 1.61 | % | $ | 8.52 | ||||||||
| Class C | 1,000.00 | 1,113.30 | 2.36 | 12.47 | ||||||||||||
| Class I | 1,000.00 | 1,117.90 | 1.35 | 7.15 | ||||||||||||
| Class R6 | 1,000.00 | 1,119.00 | 1.23 | 6.52 | ||||||||||||
Hypothetical (5% return before expenses) |
| |||||||||||||||
| Class A | 1,000.00 | 1,016.95 | 1.61 | 8.12 | ||||||||||||
| Class C | 1,000.00 | 1,013.20 | 2.36 | 11.88 | ||||||||||||
| Class I | 1,000.00 | 1,018.25 | 1.35 | 6.81 | ||||||||||||
| Class R6 | 1,000.00 | 1,018.85 | 1.23 | 6.21 | ||||||||||||
| * | Expenses are equal to the Fund’s annualized expense ratio, which is net of waived fees and reimbursed expenses, if applicable, multiplied by the average account value over the period, multiplied by the number of days (183) expenses were accrued in the most recent fiscal half-year, then divided by 366 to reflect the one-half year period. |
| The Fund may invest in other funds, and the annualized expense ratios noted above do not reflect fees and expenses associated with the underlying funds. If such fees and expenses had been included, the expenses would have been higher. |
| You can find more information about the Fund’s expenses in the Financial Statements section that follows. For additional information on operating expenses and other shareholder costs, refer to the current prospectus. |
3
Table of Contents
VIRTUS EMERGING MARKETS OPPORTUNITIES FUND
SEPTEMBER 30, 2016 (Unaudited)
American Depositary Receipt (ADR)
Represents shares of foreign companies traded in U.S. dollars on U.S. exchanges that are held by a U.S. bank or a trust. Foreign companies use ADRs in order to make it easier for Americans to buy their shares.
Bloomberg Barclays U.S. Aggregate Bond Index
The Bloomberg Barclays U.S. Aggregate Bond Index measures the U.S. investment-grade fixed-rate bond market. The index is calculated on a total return basis. The index is unmanaged, its returns do not reflect any fees, expenses, or sales charges, and it is not available for direct investment.
Bloomberg Barclays U.S. Corporate High Yield Bond Index
The Bloomberg Barclays U.S. Corporate High Yield Bond Index measures the U.S. dollar-denominated, high yield, fixed-rate corporate bond market. The index is calculated on a total return basis. The index is unmanaged, its returns do not reflect any fees, expenses, or sales charges, and it is not available for direct investment.
Exchange-Traded Funds (ETF)
A fund that is traded on a stock exchange. Most ETFs have a portfolio of stocks or bonds that track a specific market index.
Federal Reserve (the Fed)
The Central bank of the United States, responsible for controlling the money supply, interest rates and credit with the goal of keeping the U.S. economy and currency stable. Governed by a seven-member board, the system includes 12 regional Federal Reserve Banks, 25 branches and all national and state banks that are part of the system.
MSCI EAFE® Index (net)
The MSCI EAFE® Index (net) is a free float-adjusted market capitalization-weighted index that measures developed foreign market equity performance, excluding the U.S. and Canada. The index is calculated on a total return basis with net dividends reinvested. The index is unmanaged, its returns do not reflect any fees, expenses, or sales charges, and is not available for direct investment.
MSCI Emerging Markets Index (net)
The MSCI Emerging Markets Index (net) is a free float-adjusted market capitalization-weighted index designed to measure equity market performance in the global emerging markets. The index is calculated on a total return basis with net dividends reinvested. The index is unmanaged, its returns do not reflect any fees, expenses, or sales charges, and is not available for direct investment.
Russell 2000® Index
The Russell 2000® Index is a market capitalization-weighted index of the 2,000 smallest companies in the Russell Universe, which comprises the 3,000 largest U.S. companies. The index is calculated on a total return basis with dividends reinvested. The index is unmanaged, its returns do not reflect any fees, expenses, or sales charges, and is not available for direct investment.
4
Table of Contents
VIRTUS EMERGING MARKETS OPPORTUNITIES FUND
KEY INVESTMENTS TERMS (Continued)
SEPTEMBER 30, 2016 (Unaudited)
S&P 500® Index
The S&P 500® Index is a free-float market capitalization-weighted index of 500 of the largest U.S. companies. The index is calculated on a total return basis with dividends reinvested. The index is unmanaged, its returns do not reflect any fees, expenses, or sales charges, and it is not available for direct investment.
Sponsored ADR (American Depositary Receipt)
An ADR which is issued with the cooperation of the company whose stock will underlie the ADR. Sponsored ADRs generally carry the same rights normally given to stockholders, such as voting rights. ADRs must be sponsored to be able to trade on a major U.S. exchange such as the New York Stock Exchange (“NYSE”).
5
Table of Contents
EMERGING MARKETS OPPORTUNITIES FUND (Unaudited)
Fund Summary Portfolio Manager Commentary by Vontobel Asset Management, Inc. | Ticker Symbols: A Share: HEMZX C Share: PICEX I Share: HIEMX R6 Share: VREMX |
| ¢ | The Fund is diversified and has an investment objective of capital appreciation. There is no guarantee that the Fund will achieve its objective. |
Effective September 23, 2016, Virtus Emerging Markets Opportunities Fund was reorganized as a series of the Virtus Opportunities Trust and changed its fiscal year end from December 31 to September 30. As a result the commentary addresses nine months of performance through September 30.
| ¢ | For the fiscal period January 1 through September 30, 2016, the Fund’s Class A shares at NAV returned 14.06%*, Class C shares at NAV returned 13.56%*, Class I shares at NAV returned 14.29%* and Class R6 shares returned 14.40%*. For the same period the MSCI Emerging Markets Index (net) which serves as the broad-based and style specific benchmark index appropriate for comparison returned 16.02%*. |
| * | Returns less than 1 year are not annualized. |
All performance figures assume reinvestment of distributions and exclude the effect of sales charges. Past performance is no guarantee of future results, and current performance may be higher or lower than the performance shown above.
How did the market perform during the Fund’s nine-month fiscal period?
During the nine months ended September 30, 2016, the MSCI Emerging Markets Index (total return net dividends) was positive in the fiscal second quarter, flat in the fiscal third quarter, and positive in the fiscal fourth quarter.
Emerging market equities rebounded in the early months of 2016, driven by stronger commodity prices, a sharp rise in many emerging market currencies, and lower expectations for U.S. rate increases. The rally reversed in May as investors digested waning commodities prices, the prospect of a U.S. interest rate hike, and the
potential impact of a change in government in Brazil after President Dilma Rousseff was suspended from office. Emerging markets rebounded over the summer as lower-than-expected interest rates in the United States continued to support demand for higher-yielding assets in the emerging world. Improved capital flows helped some emerging market currencies recover lost ground relative to the U.S. dollar, and stabilizing commodity prices helped a number of markets during the final months of the period.
What factors affected the Fund’s performance during the nine-month fiscal period?
The following discussion highlights the specific stocks that provided the largest contribution to the Fund’s absolute performance and those that were the largest detractors during the nine months ended September 30, 2016. As bottom-up stock pickers, we hope that investors find this useful and gain a greater understanding of how we invest their capital.
Stocks that Helped Absolute Performance
| ¢ | Tencent Holdings Limited (China) – A major Internet platform in China, Tencent has had a strong presence in online gaming, instant messaging, and has been one of the country’s largest web portals. The company performed well after reporting solid earnings for the second calendar quarter of 2016 that topped estimates, due to strong performance in mobile games, online advertising, and cloud services. The sharp rise of subscription-based revenue in areas such as music and video also contributed to performance. Tencent Holdings has been successful in providing popular services to attract new users and creating a network effect to maintain existing users. Expectations have been growing that the company will be able to successfully monetize its OTT application, “WeChat,” through advertising revenue. Online gaming has been its |
For information regarding the indexes and certain investment terms, see the Key Investment Terms starting on page 4.
6
Table of Contents
| EMERGING MARKETS OPPORTUNITIES FUND (Unaudited) (Continued) | ||
largest contributor to revenue, but Tencent also has generated sales through fee-based social networks, advertising, and e-commerce. The gaming revenues have benefited from operating the dominant social networking platform by directing traffic to the gaming platform. This has translated into strong sales, as well as earnings growth. |
| ¢ | Alibaba Group Holdings (China) – As the leading e-commerce platform operator in China, Alibaba has had a dominant market share in terms of overall gross merchandise volume (GMV). It has had multiples larger in GMV compared to the second biggest player in China, JD.com. The key advantage that Alibaba has had versus competitors is that it has had the widest number of vendors, which in turn has attracted a massive pool of buyers. Other markets like Japan and the U.S. have shown that it is difficult to displace a player who has a significant supplier/merchant advantage. This allows buyers to have access to the widest base of vendors and available inventory at the most competitive prices in almost any category. Further, by segmenting the market to lower-priced merchants (Taobao) and more established/ trustworthy merchants in Tmall, we believe Alibaba can cater to a wider base of consumers. There is also the tailwind from e-commerce penetration in China that is still in its relatively early stages. Given the fast take-up of smartphone penetration, as of the Fund’s fiscal year-end, we believe there is the potential for this to increase significantly, and Alibaba is in prime position to benefit. |
Alibaba’s shares soared in August after delivering strong results for its first fiscal quarter of 2017 that exceeded expectations. China retail revenue (which is the pure e-commerce segment) grew 49%, and that was on the back of GMV growth of 24%, the fastest revenue growth since the company’s initial public offering in September 2014. The
main driver has been the improvement in the company’s monetization rate, with mobile monetization now marginally overtaking desktop at 2.8%. The biggest driver of monetization has been the mix shift to Tmall, which consumers are migrating to as it has higher quality branded merchants. This has been growing at close to double the rate of its Taobao website, and with monetization that we estimate is four times the level of Taobao. The company has also been increasing ad loads off a low level, and getting higher clicks per minute (CPMs) as they provide advertisers with better targeted audiences and higher conversion rates particularly on mobile.
Stocks that Hurt Absolute Performance
| ¢ | Cipla (India) – Cipla is one of the largest pharmaceutical companies in India. In the first quarter of 2016, Cipla reported earnings results that were below consensus expectations. We sold the company on weak business fundamentals. |
| ¢ | Wal-mart de Mexico (“Walmex”) (Mexico) – Walmex is the premier Mexican retailer. Unlike Wal-Mart in the United States, which offers cheap prices but not the best shopping environment, Walmex offers both low prices and a better shopping experience than most stores in the country. The company has had no net debt, effective working capital management, and has generated strong cash flow. Walmex reported a solid second quarter, consistent with retail sales data. However, results were below consensus estimates, so expectations for slower growth was confirmed, taking some near-term momentum out of the stock. The stock came under pressure due to uncertainty linked to the weaker Mexican peso and the U.S. election, with protectionist fears hurting local Mexico consumer sentiment. The company confirmed it will increase some logistics spending as it ramps up its e-commerce platform. Walmex also confirmed its confidence in |
For information regarding the indexes and certain investment terms, see the Key Investment Terms starting on page 4.
7
Table of Contents
| EMERGING MARKETS OPPORTUNITIES FUND (Unaudited) (Continued) | ||
the brand expansion into five neighboring counties, leveraging its scale and distribution. As of the end of the Fund’s fiscal year, we still believe the company remains the top quality retail operator with a highly defensible franchise set to launch its online platform, great pricing power as the quality offering in Mexican retail, a coherent business strategy to grow consumer wallet share, and leverage its economies of scale. |
The preceding information is the opinion of portfolio management only through the end of the period of the report as stated on the cover. Any such opinions are subject to change at any time based upon market or other conditions and should not be relied upon as investment advice.
Equity Securities: The market price of equity securities may be adversely affected by financial market, industry, or issuer-specific events. Focus on a particular style or on small or medium-sized companies may enhance that risk.
Foreign & Emerging Markets: Investing internationally, especially in emerging markets, involves additional risks such as currency, political, accounting, economic, and market risk.
Geographic Concentration: A fund that focuses its investments in a particular geographic location will be highly sensitive to financial, economic, political, and other developments affecting the fiscal stability of that location.
Industry/Sector Concentration: A fund that focuses its investments in a particular industry or sector will be more sensitive to conditions that affect that industry or sector than a non-concentrated fund.
Prospectus: For additional information on risks, please see the Fund’s prospectus.
| ASSET ALLOCATION | ||||
The following table presents asset allocations within certain sectors as a percentage of total investments at September 30, 2016.
|
| |||
Consumer Staples | 42 | % | ||
Financials | 20 | |||
Information Technology | 19 | |||
Consumer Discretionary | 8 | |||
Health Care | 3 | |||
Telecommunication Services | 3 | |||
Real Estate | 2 | |||
Other (includes short-term investments and securities lending collateral) | 3 | |||
|
| |||
Total | 100 | % | ||
|
| |||
For information regarding the indexes and certain investment terms, see the Key Investment Terms starting on page 4.
8
Table of Contents
| EMERGING MARKETS OPPORTUNITIES FUND (Continued) | ||
| Average Annual Total Returns1 for periods ended 09/30/16 | ||||||||||||||||||||
| 1 Year | 5 Years | 10 Years | Since Inception | Inception Date | ||||||||||||||||
| Class A Shares at NAV2 | 15.38 | % | 5.45 | % | 6.70 | % | — | — | ||||||||||||
| Class A Shares at POP3,4 | 8.74 | 4.21 | 6.07 | — | — | |||||||||||||||
| Class C Shares at NAV2 and CDSC4 | 14.64 | 4.67 | 5.92 | — | ||||||||||||||||
| Class I Shares at NAV | 15.75 | 5.72 | 6.96 | — | — | |||||||||||||||
| Class R6 Shares at NAV | 15.87 | — | — | -0.04 | % | 11/12/14 | ||||||||||||||
| MSCI Emerging Markets Index (net)* | 16.78 | 3.03 | 3.94 | -2.68 | 5 | — | ||||||||||||||
| S&P 500® Index* | 15.43 | 16.37 | 7.24 | 5.56 | 5 | — | ||||||||||||||
Fund Expense Ratios6: A Shares 1.56%; C Shares 2.31%; I Shares: 1.31%; R6 Shares 1.18%.
All returns represent past performance which is no guarantee of future results. Current performance may be higher or lower than the performance shown. The investment return and principal value of an investment will fluctuate so that an investor’s shares, when redeemed, may be worth more or less than their original cost. The above table and graph below do not reflect the deduction of taxes that a shareholder would pay on fund distributions or the redemption of shares. Please visit Virtus.com for performance data current to the most recent month-end.
| 1 | Total returns are historical and include changes in share price and the reinvestment of both dividends and capital gains distributions. |
| 2 | “NAV” (Net Asset Value) total returns do not include the effect of any sales charge. |
| 3 | “POP” (Public Offering Price) total returns include the effect of the maximum front-end 5.75% sales charge. |
| 4 | “CDSC” (Contingent Deferred Sales Charge) is applied to redemptions of certain classes of shares that do not have a sales charge applied at the time of purchase. CDSC charges for certain redemptions of Class A shares and all redemptions of Class C shares are 1% within the first year and 0% thereafter. |
| 5 | The since inception index returns are from the inception date of Class R6 shares. |
| 6 | The expense ratios of the Fund, both net and gross, are set forth according to the prospectus for the Fund effective September 23, 2016, as supplemented and revised, and may differ from the expense ratios disclosed in the Financial Highlights tables in this report. See the Financial Highlights for more current expense ratios. Expense ratios reflect fees and expenses associated with the underlying funds. |
| * | The MSCI Emerging Markets Index (net) is an appropriate Broad Based Index. The Fund is no longer using the S&P 500® Index. |
Growth of $10,000 For periods ended 9/30
This chart assumes an initial investment of $10,000 made on September 30, 2006, for Class A, Class C and Class I shares including any applicable sales charges or fees. The performance of Class C shares may be greater or less than that shown based on differences in inception dates, fees, and sales charges. Performance assumes reinvestment of dividends and capital gain distributions.
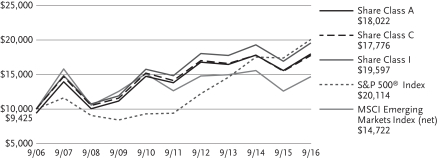
The indexes are unmanaged and not available for direct investment; therefore, their performance does not reflect the expenses associated with active management of an actual portfolio.
For information regarding the indexes and certain investment terms, see the Key Investment Terms starting on page 4.
9
Table of Contents
VIRTUS EMERGING MARKETS OPPORTUNITIES FUND
SCHEDULE OF INVESTMENTS
SEPTEMBER 30, 2016
($ reported in thousands)
| SHARES | VALUE | |||||||
| COMMON STOCKS—96.6% | ||||||||
| Consumer Discretionary—7.7% | ||||||||
Kangwon Land, Inc. (South Korea) | 2,060,668 | $ | 73,634 | |||||
Las Vegas Sands Corp. (United States) | 2,103,223 | 121,020 | ||||||
Matahari Department Store Tbk PT (Indonesia) | 72,580,113 | 103,059 | ||||||
Naspers Ltd. Class N (South Africa) | 1,220,346 | 211,229 | ||||||
New Oriental Education & Technology Group, Inc. Sponsored ADR (Cayman Islands)(2) | 1,610,838 | 74,678 | ||||||
|
| |||||||
| 583,620 | ||||||||
|
| |||||||
| Consumer Staples—41.1% | ||||||||
Ambev S.A. Sponsored ADR (Brazil) | 46,869,454 | 285,435 | ||||||
AmorePacific Corp. (South Korea) | 466,833 | 165,549 | ||||||
Anheuser-Busch InBev N.V. (Belgium) | 575,891 | 75,432 | ||||||
British American Tobacco Bhd (Malaysia) | 1,691,314 | (4) | 20,097 | |||||
British American Tobacco plc (United Kingdom) | 6,899,201 | (3) | 441,222 | |||||
Colgate Palmolive India Ltd. (India) | 1,626,621 | 23,734 | ||||||
CP ALL PCL (Thailand) | 110,847,000 | 197,163 | ||||||
Fomento Economico Mexicano SAB de C.V. Sponsored ADR (Mexico) | 2,896,456 | 266,590 | ||||||
Hanjaya Mandala Sampoerna Tbk PT (Indonesia) | 303,382,500 | 91,878 | ||||||
Heineken N.V. (Netherlands) | 1,720,107 | 151,318 | ||||||
Hindustan Unilever Ltd. (India) | 7,738,511 | 100,963 | ||||||
| SHARES | VALUE | |||||||
| Consumer Staples (continued) | ||||||||
ITC Ltd. (India) | 82,213,347 | $ | 298,341 | |||||
LG Household & Health Care Ltd. (South Korea) | 134,105 | 116,705 | ||||||
President Chain Store Corp. (Taiwan) | 6,724,158 | 53,557 | ||||||
SABMiller plc (South Africa) | 4,768,140 | 275,195 | ||||||
Thai Beverage PCL (Thailand) | 121,848,700 | 86,794 | ||||||
Unilever Indonesia Tbk PT (Indonesia) | 17,530,457 | 59,933 | ||||||
Unilever N.V. CVA (Netherlands) | 4,889,450 | 225,608 | ||||||
Wal-Mart de Mexico SAB de CV (Mexico) | 78,899,133 | 172,734 | ||||||
|
| |||||||
| 3,108,248 | ||||||||
|
| |||||||
| Energy—1.0% | ||||||||
Ultrapar Participacoes S.A. (Brazil) | 3,371,571 | 74,633 | ||||||
|
| |||||||
| Financials—19.5% | ||||||||
Bank Central Asia Tbk PT (Indonesia) | 104,509,793 | 126,057 | ||||||
Bank Pekao SA (Poland) | 2,212,071 | 71,559 | ||||||
BB Seguridade Participacoes (Brazil) | 8,545,096 | 78,826 | ||||||
Grupo Financiero Santander Mexico SAB de C.V. ADR, B Shares (Mexico) | 9,816,747 | 86,387 | ||||||
Hong Kong Exchanges & Clearing Ltd. (Hong Kong) | 1,013,498 | 26,823 | ||||||
Housing Development Finance Corp. (India) | 14,634,001 | 306,948 | ||||||
Housing Development Finance Corp. Bank Ltd. (India) | 18,255,241 | 349,572 | ||||||
Housing Development Finance Corp. Bank Ltd. ADR (India) | 563,699 | 40,524 | ||||||
See Notes to Financial Statements
10
Table of Contents
VIRTUS EMERGING MARKETS OPPORTUNITIES FUND
SCHEDULE OF INVESTMENTS (Continued)
SEPTEMBER 30, 2016
($ reported in thousands)
| SHARES | VALUE | |||||||
| Financials (continued) | ||||||||
Public Bank Bhd (Malaysia) | 23,794,000 | $ | 114,091 | |||||
Remgro Ltd. (South Africa) | 6,006,565 | 100,482 | ||||||
Samsung Fire & Marine Insurance Co., Ltd. (South Korea) | 315,968 | 80,478 | ||||||
United Overseas Bank Ltd. (Singapore) | 6,934,600 | 96,209 | ||||||
|
| |||||||
| 1,477,956 | ||||||||
|
| |||||||
| Health Care—3.3% | ||||||||
Dr. Reddy’s Laboratories Ltd. (India) | 1,102,230 | 51,433 | ||||||
Dr. Reddy’s Laboratories Ltd. ADR (India)(5) | 360,312 | 16,726 | ||||||
Mediclinic International plc (United Kingdom) | 6,150,558 | 74,291 | ||||||
Sun Pharmaceutical Industries Ltd. (India) | 9,677,687 | 108,184 | ||||||
|
| |||||||
| 250,634 | ||||||||
|
| |||||||
| Industrials—1.5% | ||||||||
Grupo Aeroportuario del Pacifico SAB de C.V. Class B (Mexico) | 2,346,605 | 22,308 | ||||||
Korea Aerospace Industries Ltd. (South Korea) | 1,274,987 | 88,855 | ||||||
|
| |||||||
| 111,163 | ||||||||
|
| |||||||
| Information Technology—18.3% | ||||||||
Alibaba Group Holding Ltd. Sponsored ADR (China)(2) | 3,420,134 | 361,816 | ||||||
Cielo S.A. (Brazil) | 15,952,354 | 160,301 | ||||||
NetEase, Inc. ADR (China) | 695,364 | 167,430 | ||||||
| SHARES | VALUE | |||||||
| Information Technology (continued) | ||||||||
Taiwan Semiconductor Manufacturing Co., Ltd. (Taiwan) | 18,944,492 | $ | 111,358 | |||||
Taiwan Semiconductor Manufacturing Co., Ltd. Sponsored ADR (Taiwan) | 3,146,244 | 96,243 | ||||||
Tata Consultancy Services Ltd. (India) | 4,757,516 | 173,864 | ||||||
Tencent Holdings Ltd. (Cayman Islands) | 11,328,516 | 314,956 | ||||||
|
| |||||||
| 1,385,968 | ||||||||
|
| |||||||
| Real Estate—1.6% | ||||||||
Link REIT (The) (Hong Kong) | 16,364,861 | 120,807 | ||||||
|
| |||||||
| Telecommunication Services—2.6% | ||||||||
Telekomunikasi Indonesia Persero Tbk PT (Indonesia) | 579,195,465 | 192,865 | ||||||
| TOTAL COMMON STOCKS (Identified Cost $6,423,862) | 7,305,894 | |||||||
| TOTAL LONG TERM INVESTMENTS—96.6% | ||||||||
| (Identified Cost $6,423,862) | 7,305,894 | |||||||
| SHORT-TERM INVESTMENT—0.5% | ||||||||
| Money Market Mutual Fund—0.5% | ||||||||
JPMorgan U.S. Government Money Market Fund –Institutional Shares (seven-day effective yield 0.360%)(7) | 41,135,789 | 41,136 | ||||||
| TOTAL SHORT-TERM INVESTMENT (Identified Cost $41,136) | 41,136 | |||||||
See Notes to Financial Statements
11
Table of Contents
VIRTUS EMERGING MARKETS OPPORTUNITIES FUND
SCHEDULE OF INVESTMENTS (Continued)
SEPTEMBER 30, 2016
($ reported in thousands)
| SHARES | VALUE | |||||||
| SECURITIES LENDING COLLATERAL—0.2% | ||||||||
INVESCO Trust Short-Term Investments Liquid Assets Portfolio (The) – Institutional Shares (seven-day effective yield 0.390%)(6)(7) | 12,243,680 | $ | 12,244 | |||||
| TOTAL SECURITIES LENDING COLLATERAL | ||||||||
| (Identified Cost $12,244) | 12,244 | |||||||
| TOTAL INVESTMENTS—97.3% (Identified Cost $6,477,242) | 7,359,274 | (1) | ||||||
Other assets and liabilities, |
| 204,658 | ||||||
|
| |||||||
| NET ASSETS—100.0% | $ | 7,563,932 | ||||||
|
| |||||||
Abbreviations:
| ADR | American Depositary Receipt |
| REIT | Real Estate Investment Trust |
FOOTNOTE LEGEND:
| (1) | Federal Income Tax Information: For tax information at September 30, 2016, see Note 8 Federal Income Tax Information in the Notes to Financial Statements. |
| (2) | Non-income producing. |
| (3) | Shares traded on Johannesburg Exchange. |
| (4) | Shares traded on London Exchange. |
| (5) | All or a portion of security is on loan. |
| (6) | Represents security purchased with cash collateral received for securities on loan. |
| (7) | Shares of these funds are publicly offered and the prospectus and annual reports of each are publicly available. |
| Country Weightings (Unaudited)† | ||||
India | 20 | % | ||
Brazil | 8 | |||
South Africa | 8 | |||
Indonesia | 8 | |||
Mexico | 8 | |||
China | 7 | |||
South Korea | 7 | |||
Other | 34 | |||
Total | 100 | % | ||
| † | % of total investments as of September 30, 2016 |
The following table provides a summary of inputs used to value the Fund’s investments as of September 30, 2016 (See Security Valuation Note 2A in the Notes to Financial Statements):
| Total Value at September 30, 2016 | Level 1 Quoted Prices | Level 2 Significant Observable Inputs | ||||||||||
Equity Securities: |
| |||||||||||
Common Stocks | $ | 7,305,894 | $ | 3,483,684 | $ | 3,822,210 | ||||||
Securities Lending Collateral | 12,244 | 12,244 | — | |||||||||
Short-term Investment | 41,136 | 41,136 | — | |||||||||
|
|
|
|
|
| |||||||
Total Investments | $ | 7,359,274 | $ | 3,537,064 | $ | 3,822,210 | ||||||
|
|
|
|
|
| |||||||
There are no Level 3 (significant unobservable inputs) priced securities.
Securities held by the fund with an end of period value of $275,195 were transferred from Level 1 to Level 2 and securities held by the fund with an end of period value of $106,891 were transferred from Level 2 to Level 1 based on out valuation procedures for non U.S. securities (see Note 2A in the Notes to Financial Statements for more information)
See Notes to Financial Statements
12
Table of Contents
VIRTUS EMERGING MARKETS OPPORTUNITIES FUND
STATEMENT OF ASSETS AND LIABILITIES
SEPTEMBER 30, 2016
(Reported in thousands except shares and per share amounts)
| Assets | ||||
Investment in securities at value(1)(3) | $ | 7,359,274 | ||
Foreign currency at value(2) | 5,094 | |||
Cash | 275,000 | |||
| Receivables | ||||
Investment securities sold | 23,982 | |||
Fund shares sold | 19,420 | |||
Dividends and interest receivable | 58 | |||
Securities lending receivable | 3 | |||
Prepaid expenses | 211 | |||
Prepaid trustee retainer | 103 | |||
Other assets | 101 | |||
|
| |||
Total assets | 7,683,246 | |||
|
| |||
| Liabilities | ||||
| Payables | ||||
Fund shares repurchased | 19,334 | |||
Investment securities purchased | 77,269 | |||
Collateral on securities loaned | 12,244 | |||
Investment advisory fees | 5,975 | |||
Distribution and service fees | 401 | |||
Administration fees | 758 | |||
Transfer agent fees and expenses | 2,306 | |||
Trustees’ fees and expenses | 89 | |||
Professional fees | 46 | |||
Trustee deferred compensation plan | 101 | |||
Other accrued expenses | 791 | |||
|
| |||
Total liabilities | 119,314 | |||
|
| |||
| Net Assets | $ | 7,563,932 | ||
|
| |||
| Net Assets Consist of: | ||||
Common stock $0.001 par value | $ | 743 | ||
Capital paid in on shares of beneficial interest | 7,440,659 | |||
Accumulated undistributed net investment income (loss) | 25,349 | |||
Accumulated undistributed net realized gain (loss) | (784,900 | ) | ||
Net unrealized appreciation (depreciation) on investments | 882,081 | |||
|
| |||
| Net Assets | $ | 7,563,932 | ||
|
| |||
| Class A | ||||
Net asset value (net assets/shares outstanding) per share | $ | 9.90 | ||
Maximum offering price per share NAV/(1–5.75%) | $ | 10.50 | ||
Shares of beneficial interest outstanding, unlimited authorization | 109,286,346 | |||
Net Assets | $ | 1,082,242 | ||
| Class C | ||||
Net asset value (net assets/shares outstanding) and offering price per share | $ | 9.63 | ||
Shares of beneficial interest outstanding, unlimited authorization | 23,083,431 | |||
Net Assets | $ | 222,221 | ||
| Class I | ||||
Net asset value (net assets/shares outstanding) and offering price per share | $ | 10.24 | ||
Shares of beneficial interest outstanding, unlimited authorization | 606,672,241 | |||
Net Assets | $ | 6,214,272 | ||
| Class R6 | ||||
Net asset value (net assets/shares outstanding) and offering price per share | $ | 10.25 | ||
Shares of beneficial interest outstanding, unlimited authorization | 4,409,492 | |||
Net Assets | $ | 45,197 | ||
(1) Investment in securities at cost | $ | 6,477,242 | ||
(2) Foreign currency at cost | 5,094 | |||
(3) Market value of securities on loan | 12,041 | |||
See Notes to Financial Statements
13
Table of Contents
VIRTUS EMERGING MARKETS OPPORTUNITIES FUND
($ reported in thousands)
| Fiscal Period Ended September 30, 2016(2) | Year Ended December 31, 2015 | |||||||
| Investment Income | ||||||||
Dividends | $ | 123,861 | $ | 240,159 | ||||
Security lending, net of fees | 138 | 91 | ||||||
Foreign taxes withheld | (5,688 | ) | (11,057 | ) | ||||
|
|
|
| |||||
Total investment income | 118,311 | 229,193 | ||||||
|
|
|
| |||||
| Expenses | ||||||||
Investment advisory fees | 57,321 | 95,290 | ||||||
Distribution and service fees, Class A | 1,454 | 2,006 | ||||||
Distribution and service fees, Class C | 1,607 | 2,452 | ||||||
Distribution fees, Class I | — | 1,382 | ||||||
Administration fees | 7,563 | 12,110 | ||||||
Transfer agent fees and expenses | 10,834 | 17,075 | ||||||
Custodian fees | 1,580 | 3,834 | ||||||
Printing fees and expenses | 1,694 | 717 | ||||||
Trustees’ fees and expenses | 583 | 478 | ||||||
Registration fees | 253 | 285 | ||||||
Professional fees | 204 | 124 | ||||||
Miscellaneous expenses | 484 | 566 | ||||||
|
|
|
| |||||
Total expenses | 83,577 | 136,319 | ||||||
Less expenses reimbursed by investment adviser and/(or) distributor | — | (1,382 | ) | |||||
Earnings credit from custodian | (536 | ) | (38 | ) | ||||
Low balance account fees | — | (1) | — | |||||
|
|
|
| |||||
Net expenses | 83,041 | 134,899 | ||||||
|
|
|
| |||||
| Net investment income (loss) | 35,270 | 94,294 | ||||||
|
|
|
| |||||
| Net Realized and Unrealized Gain (Loss) on Investments | ||||||||
Net realized gain (loss) on investments | 20,544 | (756,362 | ) | |||||
Net realized gain (loss) on foreign currency transactions | (3,387 | ) | (13,839 | ) | ||||
Net change in unrealized appreciation (depreciation) on investments | 912,262 | (339,055 | ) | |||||
Net change in unrealized appreciation (depreciation) on foreign currency translation | 1,512 | (1,176 | ) | |||||
Net change in foreign taxes on unrealized capital gains | — | 4,337 | ||||||
|
|
|
| |||||
| Net gain (loss) on investments | 930,931 | (1,106,095 | ) | |||||
|
|
|
| |||||
| Net increase (decrease) in net assets resulting from operations | $ | 966,201 | $ | (1,011,801 | ) | |||
|
|
|
| |||||
| (1) | Amount is less than $500. |
| (2) | The Fund changed its fiscal year end to September 30 during the period. |
See Notes to Financial Statements
14
Table of Contents
VIRTUS EMERGING MARKETS OPPORTUNITIES FUND
STATEMENTS OF CHANGES IN NET ASSETS
($ reported in thousands)
| Fiscal Period Ended September 30, 2016(3) | Year Ended December 31, 2015 | Year Ended December 31, 2014 | ||||||||||
| INCREASE/(DECREASE) IN NET ASSETS | ||||||||||||
| From Operations | ||||||||||||
Net investment income (loss) | $ | 35,270 | $ | 94,294 | $ | 65,058 | ||||||
Net realized gain (loss) | 17,157 | (770,201 | ) | (22,763 | ) | |||||||
Net change in unrealized appreciation (depreciation) | 913,774 | (335,894 | ) | 289,719 | ||||||||
|
|
|
|
|
| |||||||
| Increase (decrease) in net assets resulting from operations | 966,201 | (1,011,801 | ) | 332,014 | ||||||||
|
|
|
|
|
| |||||||
| From Distributions to Shareholders | ||||||||||||
Net investment income, Class A | — | (5,106 | ) | (5,770 | ) | |||||||
Net investment income, Class C | — | — | (194 | ) | ||||||||
Net investment income, Class I | — | (81,136 | ) | (63,020 | ) | |||||||
Net investment income, Class R6 | — | (358 | ) | (1 | ) | |||||||
Net realized long-term gains, Class A | — | — | (11,495 | ) | ||||||||
Net realized long-term gains, Class C | — | — | (2,358 | ) | ||||||||
Net realized long-term gains, Class I | — | — | (69,577 | ) | ||||||||
Net realized long-term gains, Class R6 | — | — | — | (1) | ||||||||
|
|
|
|
|
| |||||||
| Decrease in net assets from distributions to shareholders | — | (86,600 | ) | (152,415 | ) | |||||||
|
|
|
|
|
| |||||||
| From Share Transactions | ||||||||||||
| Sale of shares | ||||||||||||
Class A (54,614, 45,415, 39,977) | 513,358 | 426,955 | 390,454 | |||||||||
Class C (2,986, 9,993, 6,261) | 26,602 | 92,797 | 60,377 | |||||||||
Class I (224,369, 573,808, 302,688) | 2,042,674 | 5,590,072 | 3,053,397 | |||||||||
Class R6 (4,035, 4,009, 10) | 37,563 | 38,958 | 100 | |||||||||
| Reinvestment of distributions | ||||||||||||
Class A (0, 527, 1,626) | — | 4,555 | 16,026 | |||||||||
Class C (0, 0, 230) | — | — | 2,226 | |||||||||
Class I (0, 8,333, 11,523) | — | 74,414 | 116,581 | |||||||||
Class R6 (0, 39, —(2)) | — | 348 | 1 | |||||||||
| Shares repurchased | ||||||||||||
Class A (31,260, 40,498, 79,655) | (279,242 | ) | (373,105 | ) | (782,854 | ) | ||||||
Class C (6,216, 8,084, 5,996) | (54,465 | ) | (72,343 | ) | (55,400 | ) | ||||||
Class I (591,491, 374,295, 213,715) | (5,387,548 | ) | (3,524,585 | ) | (2,080,416 | ) | ||||||
Class R6 (3,461, 222, 0) | (31,143 | ) | (2,054 | ) | — | |||||||
|
|
|
|
|
| |||||||
| Increase (decrease) in net assets from share transactions | (3,132,201 | ) | 2,256,012 | 720,492 | ||||||||
|
|
|
|
|
| |||||||
| Net increase (decrease) in net assets | (2,166,000 | ) | 1,157,611 | 900,091 | ||||||||
| Net Assets | ||||||||||||
Beginning of period | 9,729,932 | 8,572,321 | 7,672,230 | |||||||||
|
|
|
|
|
| |||||||
| End of period | $ | 7,563,932 | $ | 9,729,932 | $ | 8,572,321 | ||||||
|
|
|
|
|
| |||||||
Accumulated undistributed net investment income (loss) at end of period | $ | 25,349 | $ | (6,533 | ) | $ | (388 | ) | ||||
| (1) | Amount is less than $500. |
| (2) | Shares are less than 500. |
| (3) | The Fund changed its fiscal year end to September 30 during the period. |
See Notes to Financial Statements
15
Table of Contents
VIRTUS EMERGING MARKETS OPPORTUNITIES FUND
SELECTED PER SHARE DATA AND RATIOS FOR A SHARE OUTSTANDING
THROUGHOUT EACH PERIOD
| Net Asset Value, Beginning of Period | Net Investment Income (Loss)(2) | Net Realized and Unrealized Gain/(Loss) | Total from Investment Operations | Dividends from Net Investment Income | Distributions from Net Realized Gains | Total Distributions | |||||||||||||||||||||||||||||
Class A | |||||||||||||||||||||||||||||||||||
1/1/16 to 9/30/16(11) | $ | 8.68 | 0.03 | 1.19 | 1.22 | — | — | — | |||||||||||||||||||||||||||
1/1/15 to 12/31/15 | 9.58 | 0.07 | (0.91 | ) | (0.84 | ) | (0.06 | ) | — | (0.06 | ) | ||||||||||||||||||||||||
1/1/14 to 12/31/14 | 9.26 | 0.07 | 0.42 | 0.49 | (0.06 | ) | (0.11 | ) | (0.17 | ) | |||||||||||||||||||||||||
1/1/13 to 12/31/13 | 10.00 | 0.08 | (0.74 | ) | (0.66 | ) | (0.08 | ) | — | (3) | (0.08 | ) | |||||||||||||||||||||||
1/1/12 to 12/31/12 | 8.44 | 0.07 | 1.57 | 1.64 | (0.05 | ) | (0.03 | ) | (0.08 | ) | |||||||||||||||||||||||||
1/1/11 to 12/31/11 | 8.83 | 0.09 | (0.37 | ) | (0.28 | ) | (0.04 | ) | (0.07 | ) | (0.11 | ) | |||||||||||||||||||||||
Class C | |||||||||||||||||||||||||||||||||||
1/1/16 to 9/30/16(11) | $ | 8.49 | (0.02 | ) | 1.16 | 1.14 | — | — | — | ||||||||||||||||||||||||||
1/1/15 to 12/31/15 | 9.37 | — | (0.88 | ) | (0.88 | ) | — | — | — | ||||||||||||||||||||||||||
1/1/14 to 12/31/14 | 9.08 | (0.01 | ) | 0.42 | 0.41 | (0.01 | ) | (0.11 | ) | (0.12 | ) | ||||||||||||||||||||||||
1/1/13 to 12/31/13 | 9.82 | 0.01 | (0.72 | ) | (0.71 | ) | (0.03 | ) | — | (3) | (0.03 | ) | |||||||||||||||||||||||
1/1/12 to 12/31/12 | 8.31 | — | (3) | 1.56 | 1.56 | (0.02 | ) | (0.03 | ) | (0.05 | ) | ||||||||||||||||||||||||
1/1/11 to 12/31/11 | 8.72 | 0.03 | (0.37 | ) | (0.34 | ) | — | (3) | (0.07 | ) | (0.07 | ) | |||||||||||||||||||||||
The footnote legend is at the end of the Financial Highlights.
See Notes to Financial Statements
16
Table of Contents
VIRTUS EMERGING MARKETS OPPORTUNITIES FUND
FINANCIAL HIGHLIGHTS (Continued)
SELECTED PER SHARE DATA AND RATIOS FOR A SHARE OUTSTANDING
THROUGHOUT EACH PERIOD
| Change in Net Asset Value | Net Asset Value, End of Period | Total Return(1) | Net Assets, End of Period (in thousands) | Ratio of Net Operating Expenses to Average Net Assets(6) | Ratio of Gross Operating Expenses to Average Net Assets(6) | Ratio of Net Investment Income to Average Net Assets | Portfolio Turnover Rate | ||||||||||||||||||||||||||||||||
| 1.22 | $ | 9.90 | 14.06 | %(9) | $ | 1,082,242 | 1.59 | %(4)(8) | 1.60 | %(8) | 0.40 | %(8) | 25 | %(9) | |||||||||||||||||||||||||
| (0.90 | ) | 8.68 | (8.77 | ) | 745,947 | 1.56 | 1.56 | (10) | 0.73 | 27 | |||||||||||||||||||||||||||||
| 0.32 | 9.58 | 5.23 | 770,941 | 1.55 | 1.55 | 0.71 | 28 | ||||||||||||||||||||||||||||||||
| (0.74 | ) | 9.26 | (6.58 | ) | 1,097,753 | 1.58 | 1.58 | 0.79 | 31 | ||||||||||||||||||||||||||||||
| 1.56 | 10.00 | 19.62 | 1,208,195 | 1.60 | 1.60 | 0.78 | 28 | ||||||||||||||||||||||||||||||||
| (0.39 | ) | 8.44 | (3.13 | ) | 474,368 | 1.61 | 1.61 | 1.09 | 29 | ||||||||||||||||||||||||||||||
| 1.14 | $ | 9.63 | 13.56 | %(9) | $ | 222,221 | 2.34 | %(4)(8) | 2.35 | %(8) | (0.31 | )%(8) | 25 | %(9) | |||||||||||||||||||||||||
| (0.88 | ) | 8.49 | (9.50 | ) | 223,303 | 2.31 | 2.31 | (10) | (0.01 | ) | 27 | ||||||||||||||||||||||||||||
| 0.29 | 9.37 | 4.40 | 228,652 | 2.30 | 2.30 | (0.13 | ) | 28 | |||||||||||||||||||||||||||||||
| (0.74 | ) | 9.08 | (7.21 | ) | 217,034 | 2.33 | 2.33 | 0.07 | 31 | ||||||||||||||||||||||||||||||
| 1.51 | 9.82 | 18.66 | 203,974 | 2.35 | 2.35 | 0.01 | 28 | ||||||||||||||||||||||||||||||||
| (0.41 | ) | 8.31 | (3.77 | ) | 70,198 | 2.36 | 2.36 | 0.36 | 29 | ||||||||||||||||||||||||||||||
The footnote legend is at the end of the Financial Highlights.
See Notes to Financial Statements
17
Table of Contents
VIRTUS EMERGING MARKETS OPPORTUNITIES FUND
FINANCIAL HIGHLIGHTS (Continued)
SELECTED PER SHARE DATA AND RATIOS FOR A SHARE OUTSTANDING
THROUGHOUT EACH PERIOD
| Net Asset Value, Beginning of Period | Net Investment Income (Loss)(2) | Net Realized and Unrealized Gain/(Loss) | Total from Investment Operations | Dividends from Net Investment Income | Distributions from Net Realized Gains | Total Distributions | |||||||||||||||||||||||||||||
Class I | |||||||||||||||||||||||||||||||||||
1/1/16 to 9/30/16(11) | $ | 8.96 | 0.04 | 1.24 | 1.28 | — | — | — | |||||||||||||||||||||||||||
1/1/15 to 12/31/15 | 9.89 | 0.10 | (0.95 | ) | (0.85 | ) | (0.08 | ) | — | (0.08 | ) | ||||||||||||||||||||||||
1/1/14 to 12/31/14 | 9.55 | 0.09 | 0.45 | 0.54 | (0.09 | ) | (0.11 | ) | (0.20 | ) | |||||||||||||||||||||||||
1/1/13 to 12/31/13 | 10.31 | 0.11 | (0.76 | ) | (0.65 | ) | (0.11 | ) | — | (3) | (0.11 | ) | |||||||||||||||||||||||
1/1/12 to 12/31/12 | 8.70 | 0.10 | 1.62 | 1.72 | (0.08 | ) | (0.03 | ) | (0.11 | ) | |||||||||||||||||||||||||
1/1/11 to 12/31/11 | 9.10 | 0.12 | (0.38 | ) | (0.26 | ) | (0.07 | ) | (0.07 | ) | (0.14 | ) | |||||||||||||||||||||||
Class R6 | |||||||||||||||||||||||||||||||||||
1/1/16 to 9/30/16(11) | $ | 8.96 | 0.05 | 1.24 | 1.29 | — | — | — | |||||||||||||||||||||||||||
1/1/15 to 12/31/15 | 9.89 | 0.08 | (0.91 | ) | (0.83 | ) | (0.10 | ) | — | (0.10 | ) | ||||||||||||||||||||||||
11/12/14(5) to 12/31/14 | 10.42 | (0.01 | ) | (0.45 | ) | (0.46 | ) | (0.06 | ) | (0.01 | ) | (0.07 | ) | ||||||||||||||||||||||
See Notes to Financial Statements
18
Table of Contents
VIRTUS EMERGING MARKETS OPPORTUNITIES FUND
FINANCIAL HIGHLIGHTS (Continued)
SELECTED PER SHARE DATA AND RATIOS FOR A SHARE OUTSTANDING
THROUGHOUT EACH PERIOD
| Change in Net Asset Value | Net Asset Value, End of Period | Total Return(1) | Net Assets, End of Period (in thousands) | Ratio of Net Operating Expenses to Average Net Assets(6) | Ratio of Gross Operating Expenses to Average Net Assets(6) | Ratio of Net Investment Income to Average Net Assets | Portfolio Turnover Rate | ||||||||||||||||||||||||||||||||
| 1.28 | $ | 10.24 | 14.29 | %(9) | $ | 6,214,272 | 1.33 | %(4)(8) | 1.34 | %(8) | 0.64 | %(8) | 25 | %(9) | |||||||||||||||||||||||||
| (0.93 | ) | 8.96 | (8.55 | ) | 8,726,303 | 1.31 | 1.32 | (10) | 0.99 | 27 | |||||||||||||||||||||||||||||
| 0.34 | 9.89 | 5.54 | 7,572,633 | 1.30 | 1.35 | 0.85 | 28 | ||||||||||||||||||||||||||||||||
| (0.76 | ) | 9.55 | (6.32 | ) | 6,357,443 | 1.33 | 1.38 | 1.06 | 31 | ||||||||||||||||||||||||||||||
| 1.61 | 10.31 | 19.88 | 5,352,379 | 1.35 | 1.40 | 0.99 | 28 | ||||||||||||||||||||||||||||||||
| (0.40 | ) | 8.70 | (2.92 | ) | 2,082,147 | 1.36 | 1.41 | 1.34 | 29 | ||||||||||||||||||||||||||||||
| 1.29 | $ | 10.25 | 14.40 | %(9) | $ | 45,197 | 1.21 | %(4)(8) | 1.22 | %(8) | 0.72 | %(8) | 25 | %(9) | |||||||||||||||||||||||||
| (0.93 | ) | 8.96 | (8.44 | ) | 34,379 | 1.21 | 1.21 | (10) | 0.90 | 27 | |||||||||||||||||||||||||||||
| (0.53 | ) | 9.89 | (4.60 | )(9) | 95 | 1.24 | (8) | 1.24 | (8) | (0.41 | )(8) | 28 | (7)(9) | ||||||||||||||||||||||||||
Footnote Legend:
| (1) | Sales charges, where applicable, are not reflected in total return calculation. |
| (2) | Computed using average shares outstanding. |
| (3) | Amount is less than $0.005. |
| (4) | Net expense ratio includes extraordinary proxy expenses. |
| (5) | Inception date. |
| (6) | The Funds will indirectly bear their prorated share of expenses of the underlying funds in which they invest. Such expenses are not included in the calculation of this ratio. |
| (7) | Reported on Fund level not class level. |
| (8) | Annualized. |
| (9) | Not Annualized. |
| (10) | Earnings credits from Custodian were not material as reflected in the Statements of Operations, and had no impact on Financial Highlights. |
| (11) | The Fund changed its fiscal year end to September 30 during the period. |
See Notes to Financial Statements
19
Table of Contents
VIRTUS EMERGING MARKETS OPPORTUNITIES FUND
NOTES TO FINANCIAL STATEMENTS
SEPTEMBER 30, 2016
Note 1. Organization
Virtus Opportunities Trust (the “Trust”) is organized as a Delaware statutory trust and is registered under the Investment Company Act of 1940, as amended (“1940 Act”), as an open-end management investment company.
As of the date of this report 31 funds of the Trust are offered for sale of which the Emerging Markets Opportunities Fund (the “Fund”) is reported in this annual report. The Fund’s investment objective is outlined in the Fund Summary Page. There is no guarantee that the Fund will achieve its objective.
The Fund offers Class A shares, Class C shares, Class I shares, and Class R6 shares.
Class A shares are sold with a front-end sales charge of up to 5.75% with some exceptions. Generally, Class A shares are not subject to any charges by the Fund when redeemed; however, a 1% contingent deferred sales charge (“CDSC”) may be imposed on certain redemptions made within a certain period following purchases on which a finder’s fee has been paid. The period for which the CDSC applies for the Fund is 18 months. The CDSC period begins on the last day of the month preceding the month in which the purchase was made.
Class C shares are generally sold with a 1% CDSC, applicable if redeemed within one year of purchase. Class I shares and Class R6 shares are sold without a sales charge.
Class R6 shares are only available to participants in employer-sponsored retirement plans, such as 401(k) plans, profit-sharing plans, defined benefit plans and other employer-directed plans. Class R6 shares do not carry sales commissions or pay Rule 12b-1 fees. No compensation, administrative payments, sub-transfer agency payments or service payments are paid to brokers or other entities from fund assets or the Distributor’s or an affiliate’s resources on sales of or investments in Class R6 Shares.
Virtus Mutual Funds may impose an annual fee on accounts having balances of less than $2,500. The small account fee may be waived in certain circumstances, as disclosed in the prospectuses and/or statements of additional information. The fees collected will be used to offset certain expenses of the Fund. These fees are reflected as “Low Balance Account Fees” in the Fund’s Statement of Operations for the period, as applicable.
Each class of shares has identical voting, dividend, liquidation and other rights and the same terms and conditions, except that each class bears different distribution and/or service fees under a Board approved Rule 12b-1 and/or shareholder service plan (“12b-1 plan”) and has exclusive voting rights with respect to such plan(s). Class I shares and Class R6 shares are not subject to a 12b-1 plan. Income and other expenses as well as realized and unrealized gains and losses of the Fund are borne pro rata by the holders of each class of shares.
Note 2. Significant Accounting Policies
The following is a summary of significant accounting policies consistently followed by the Trust in the preparation of its financial statements. The preparation of financial statements in conformity with accounting principles generally accepted in the United States of America requires management to make estimates and assumptions that affect the reported amounts of assets and liabilities, and disclosure of contingent assets and liabilities at the date of the financial statements and the reported amounts of increases and decreases in net assets from operations during the reporting period. Actual results could differ from those estimates, and those differences could be significant.
20
Table of Contents
VIRTUS EMERGING MARKETS OPPORTUNITIES FUND
NOTES TO FINANCIAL STATEMENTS (Continued)
SEPTEMBER 30, 2016
| A. | Security Valuation |
Security valuation procedures for the Fund, which include nightly price variance, as well as back-testing such as bi-weekly unchanged price, monthly secondary source and transaction analysis, have been approved by the Board of Trustees (the “Board,” or the “Trustees”). All internally fair valued securities are approved by a valuation committee (the “Valuation Committee”) appointed by the Board. The Valuation Committee is comprised of certain members of management as identified to the Board and convenes independently from portfolio management. All internally fair valued securities are updated daily and reviewed in detail by the Valuation Committee monthly unless changes occur within the period. The Valuation Committee reviews the validity of the model inputs and any changes to the model. Quarterly fair valuations are reviewed by the Board.
The Fund utilizes a fair value hierarchy which prioritizes the inputs to valuation techniques used to measure fair value into three broad levels. The Fund’s policy is to recognize transfers between levels at the end of the reporting period.
| • Level 1 – | quoted prices in active markets for identical securities (security types generally include listed equities). |
| • Level 2 – | prices determined using other significant observable inputs (including quoted prices for similar securities, interest rates, prepayment speeds, credit risk, etc.). |
| • Level 3 – | prices determined using significant unobservable inputs (including the Valuation Committee’s own assumptions in determining the fair value of investments). |
A description of the valuation techniques applied to the Fund’s major categories of assets and liabilities measured at fair value on a recurring basis is as follows:
Equity securities are valued at the official closing price (typically last sale) on the exchange on which the securities are primarily traded or, if no closing price is available, at the last bid price and are categorized as Level 1 in the hierarchy. Restricted equity securities and private placements that are not widely traded, are illiquid, or are internally fair valued by the Valuation Committee, are generally categorized as Level 3 in the hierarchy.
Certain non-U.S. securities may be fair valued in cases where closing prices are not readily available or are deemed not reflective of readily available market prices. For example, significant events (such as movement in the U.S. securities market, or other regional and local developments) may occur between the time that non-U.S. markets close (where the security is principally traded) and the time that the Fund calculates its net asset value (“NAV”) (at the close of regular trading on the New York Stock Exchange (“NYSE”), generally 4 p.m. Eastern time) that may impact the value of securities traded in these non-U.S. markets. In such cases the Fund fair values non-U.S. securities using an independent pricing service which considers the correlation of the trading patterns of the non-U.S. security to the intraday trading in the U.S. markets for investments such as ADRs, financial futures, ETFs and certain indexes, as well as prices for similar securities. Such fair valuations are categorized as Level 2 in the hierarchy. Because the frequency of significant events is not predictable, fair valuation of certain non-U.S. common stocks may occur on a frequent basis.
Debt securities, including restricted securities, are valued based on evaluated quotations received from independent pricing services or from dealers who make
21
Table of Contents
VIRTUS EMERGING MARKETS OPPORTUNITIES FUND
NOTES TO FINANCIAL STATEMENTS (Continued)
SEPTEMBER 30, 2016
markets in such securities. For most bond types, the pricing service utilizes matrix pricing that considers one or more of the following factors: yield or price of bonds of comparable quality, coupon, maturity, current cash flows, type, and current day trade information, as well as dealer supplied prices. These valuations are generally categorized as Level 2 in the hierarchy. Structured debt instruments, such as mortgage-backed and asset-backed securities, may also incorporate collateral analysis and utilize cash flow models for valuation and are generally categorized as Level 2 in the hierarchy. Pricing services do not provide pricing for all securities and therefore indicative bids from dealers are utilized which are based on pricing models used by market makers in the security and are generally categorized as Level 2 in the hierarchy. Debt securities that are not widely traded, are illiquid, or are internally fair valued by the Valuation Committee, are generally categorized as Level 3 in the hierarchy.
Listed derivatives, such as options, that are actively traded are valued based on quoted prices from the exchange and are categorized as Level 1 in the hierarchy. Over-the-counter derivative contracts, which include forward currency contracts and equity-linked instruments, do not require material subjectivity as pricing inputs are observed from actively quoted markets and are categorized as Level 2 in the hierarchy.
Investments in open-end mutual funds are valued at NAV. Investments in closed-end funds are valued as of the close of regular trading on the NYSE each business day. Both are categorized as Level 1 in the hierarchy.
A summary of the inputs used to value the Fund’s net assets by each major security type is disclosed at the end of the Schedule of Investments for the Fund. The inputs or methodologies used for valuing securities are not necessarily an indication of the risk associated with investing in those securities.
| B. | Security Transactions and Investment Income |
Security transactions are recorded on the trade date. Realized gains and losses from the sale of securities are determined on the identified cost basis. Dividend income is recognized on the ex-dividend date or, in the case of certain foreign securities, as soon as the Fund is notified. Interest income is recorded on the accrual basis. The Fund amortizes premiums and accretes discounts using the effective interest method.
Any distributions from underlying funds are recorded in accordance with the character of the distributions as designated by the underlying funds.
| C. | Income Taxes |
The Fund is treated as a separate taxable entity. It is the intention of the Fund to comply with the requirements of Subchapter M of the Internal Revenue Code and to distribute substantially all of its taxable income to its shareholders. Therefore, no provision for federal income taxes or excise taxes has been made.
The Fund may be subject to foreign taxes on income, gains on investments or currency repatriation, a portion of which may be recoverable. The Fund will accrue such taxes and recoveries as applicable based upon current interpretations of the tax rules and regulations that exist in the markets in which it invests.
Management of the Fund has concluded that there are no significant uncertain tax positions that would require recognition in the financial statements. As of September 30, 2016, the tax years that remain subject to examination by the major tax jurisdictions under the statute of limitations are from the year 2013 forward (with limited exceptions).
22
Table of Contents
VIRTUS EMERGING MARKETS OPPORTUNITIES FUND
NOTES TO FINANCIAL STATEMENTS (Continued)
SEPTEMBER 30, 2016
| D. | Distributions to Shareholders |
Distributions are recorded by the Fund on the ex-dividend date. Income and capital gain distributions are determined in accordance with income tax regulations that may differ from accounting principles generally accepted in the United States of America. These differences may include the treatment of non-taxable dividends, market premium and discount, non-deductible expenses, expiring capital loss carryovers, foreign currency gain or loss, gain or loss on futures contracts, partnerships, operating losses and losses deferred due to wash sales. Permanent book and tax basis differences relating to shareholder distributions will result in reclassifications to capital paid in on shares of beneficial interest.
| E. | Expenses |
Expenses incurred together by the Fund and other affiliated mutual funds are allocated in proportion to the net assets of each such fund, except where allocation of direct expense to each fund or an alternative allocation method can be more appropriately used.
In addition to the net annual operating expenses that the Fund bears directly, the shareholders of the Fund indirectly bear the Fund’s pro-rata expenses of any underlying mutual funds in which the Fund invests.
| F. | Foreign Currency Translation |
Non-U.S. investment securities and other assets and liabilities denominated in foreign currencies are translated into U.S. dollar amounts at the foreign currency exchange rate effective at the end of the reporting period. Cost of investments is translated at the currency exchange rate effective at the trade date. The gain or loss resulting from a change in currency exchange rates between the trade and settlement date of a portfolio transaction is treated as a gain or loss on foreign currency. Likewise, the gain or loss resulting from a change in currency exchange rates between the date income is accrued and the date it is paid is treated as a gain or loss on foreign currency. The Fund does not isolate that portion of the results of operations arising from changes in foreign exchange rates on investments from the fluctuations arising from changes in the market prices of securities held. Such fluctuations are included with the net realized and unrealized gain or loss on investments.
| G. | Securities Lending |
The Fund may loan securities to qualified brokers through an agreement with Brown Brothers Harriman (“BBH”), as a third party lending agent. Under the terms of agreement, when doing so the Fund is required to maintain collateral with a market value not less than 100% of the market value of loaned securities. Collateral is adjusted daily in connection with changes in the market value of securities on loan. Collateral may consist of cash and securities issued by the U.S. Government or its agencies. Cash collateral is invested in a short-term money market fund. Dividends earned on the collateral and premiums paid by the broker are recorded as income by the Fund net of fees and rebates charged by BBH for its services as securities lending agent and in connection with this securities lending program. Lending portfolio securities involves a risk of delay in the recovery of the loaned securities or in the declining value of the collateral.
23
Table of Contents
VIRTUS EMERGING MARKETS OPPORTUNITIES FUND
NOTES TO FINANCIAL STATEMENTS (Continued)
SEPTEMBER 30, 2016
At September 30, 2016, the Fund had securities on loan with a market value of $12,041 and a cash collateral of $12,244.
| H. | Earnings Credit and Interest |
Through arrangements with the Fund’s custodian, the Fund either receive an earnings credit or interest on agreed upon target un-invested cash balances to reduce the Fund’s custody expenses. The credits are reflected as “Earnings credits from Custodian” and the interest is reflected under “Interest income” in the Fund’s Statements of Operations for the period, as applicable.
Note 3. Investment Advisory Fees and Related Party Transactions
($ reported in thousands)
| A. | Adviser |
Virtus Investment Advisers, Inc. (the “Adviser”), an indirect wholly-owned subsidiary of Virtus Investment Partners, Inc. (“Virtus”), is the adviser to the Trust. The Adviser manages the Fund’s investment programs and general operations of the Fund, including oversight of the Fund’s subadviser.
As compensation for its services to the Fund, the Adviser is entitled to a fee based upon the following annual rates as a percentage of the average daily net assets of the Fund:
First $1 Billion | $1+ Billion | |||
| 1.00% | 0.95% |
| B. | Subadvisers |
Vontobel Asset Management, Inc. (the “Subadviser”) is subadviser to the Fund. The subadviser manages the investments of the Fund for which the subadviser is paid a fee by the Adviser.
| C. | Distributor |
($ reported in thousands)
VP Distributors, LLC (“VP Distributors”), an indirect wholly-owned subsidiary of Virtus, serves as the distributor of the Fund’s shares. VP Distributors has advised the Fund that for the fiscal period (the “period”) ended September 30, 2016, it retained net commissions of $51 of Class A Shares and deferred sales charges of $84 and $52 for Class A Shares and Class C Shares, respectively.
In addition, the Fund pays VP Distributors distribution and/or service fees under a 12b-1 plan as a percentage of the average daily net assets of each respective class at the annual rates as follows: Class A shares 0.25%; Class C shares 1.00% Class I and Class R6 shares are not subject to a 12b-1 plan. Prior to its elimination on February 26, 2015, VP Distributors was also entitled to a service fee under a Shareholder Services Plan for Class I shares, at the rate of 0.05% of the average daily net assets of such class of the Fund; however, VP Distributors had waived such fee prior to its elimination, so the Fund’s Class I shares did not pay such fee during the fiscal year ended December 31, 2015.
Under certain circumstances, shares of certain Virtus Mutual Funds may be exchanged for shares of the same class of certain other Virtus Mutual Funds on the basis of the
24
Table of Contents
VIRTUS EMERGING MARKETS OPPORTUNITIES FUND
NOTES TO FINANCIAL STATEMENTS (Continued)
SEPTEMBER 30, 2016
relative NAV per share at the time of the exchange. On exchanges with share classes that carry a CDSC, the CDSC schedule of the original shares purchased continues to apply.
| D. | Administrator and Transfer Agent |
Virtus Fund Services, LLC, an indirect wholly-owned subsidiary of Virtus, serves as the administrator and transfer agent to the Fund.
For the period ended September 30, 2016, the Fund incurred administration fees totaling $5,864 which are included in the Statements of Operations.
For the period ended September 30, 2016, the Fund incurred transfer agent fees totaling $10,603 which are included in the Statements of Operations. A portion of these fees was paid to outside entities that also provide services to the Trust. The Transfer Agent may from time to time temporarily waive all or a portion of its transfer agent fees.
| E. | Affiliated Shareholders |
At September 30, 2016, Virtus and its affiliates, and the retirement plans of Virtus and its affiliates, held shares which may be redeemed at any time, of the Fund in the following aggregated amounts:
| Shares | Aggregate Net Asset Value | |||||||
| Class R6 | 9,749 | $ | 100 | |||||
| F. | Trustee Compensation |
The Trust provides a deferred compensation plan for its Trustees who receive compensation from the Trust. Under the deferred compensation plan, Trustees may elect to defer all or a portion of their compensation. Amounts deferred are retained by the Trust, and then, to the extent permitted by the 1940 Act, in turn, may be invested in the shares of affiliated or unaffiliated mutual funds selected by the participating Trustees. Investments in such instruments are included in “Other Assets” on the Statement of Assets and Liabilities at September 30, 2016.
Note 4. Purchases and Sales of Securities
($ reported in thousands)
Purchases and sales of securities (excluding U.S. Government and agency securities, and short-term securities) during the period ended September 30, 2016, were as follows:
| Purchases | Sales | |||||||
| $ | 1,950,902 | $ | 4,898,915 | |||||
There were no purchases or sales of long term U.S. Government and agency securities for the Fund during the period ended September 30, 2016.
25
Table of Contents
VIRTUS EMERGING MARKETS OPPORTUNITIES FUND
NOTES TO FINANCIAL STATEMENTS (Continued)
SEPTEMBER 30, 2016
Note 5. 10% Shareholders
As of September 30, 2016, the Fund had individual shareholder account(s) and/or omnibus shareholder account(s) (comprised of a group of individual shareholders), which individually amounted to more than 10% of the total shares outstanding of each such Fund as detailed below:
| % of Shares Outstanding | Number of Accounts | |||||||
| 41 | % | 2* | ||||||
| * | None of the accounts are affiliated. |
Note 6. Credit Risk and Asset Concentration
In countries with limited or developing markets, investments may present greater risks than in more developed markets and the prices of such investments may be volatile. The consequences of political, social or economic changes in these markets may have disruptive effects on the market prices of these investments and the income they generate, as well as the Fund’s ability to repatriate such amounts.
The Fund may invest a high percentage of its assets in specific sectors or countries of the market in the pursuit of its investment objectives. Fluctuations in these sectors of concentration may have a greater impact on the Fund, positive or negative, than if the Fund did not concentrate its investments in such sectors.
At September 30, 2016, the Fund securities issued by various companies in specific sectors detailed below:
| Sector | Percentage of Total Investments | |||||||
| Consumer Staples | 42 | % | ||||||
Note 7. Illiquid and Restricted Securities
Investments are generally considered illiquid if they cannot be disposed of within seven days in the ordinary course of business at the approximate amount at which such securities have been valued by the Fund. Additionally, the following information is also considered in determining liquidity: the frequency of trades and quotes for the investment, whether the investment is listed for trading on a recognized domestic exchange and/or whether two or more brokers are willing to purchase or sell the security at a comparable price, the extent of market making activity in the investment and the nature of the market for investment. Illiquid securities are footnoted as such at the end of the Fund’s Schedule of Investments, where applicable. However, a portion of such footnoted securities could be liquid where the Fund’s Subadviser determines that some, though not all, of the position could be disposed of within seven days in the ordinary course of business at the approximate amount at which such securities have been valued by the Fund.
Restricted securities are illiquid securities, as defined above, not registered under the Securities Act of 1933, as amended (the “1933 Act”). Generally, 144A securities are excluded from this category, except where defined as illiquid.
The Fund will bear any costs, including those involved in registration under the 1933 Act, in connection with the disposition of such securities.
26
Table of Contents
VIRTUS EMERGING MARKETS OPPORTUNITIES FUND
NOTES TO FINANCIAL STATEMENTS (Continued)
SEPTEMBER 30, 2016
At September 30, 2016, the Fund did not hold any securities that were both illiquid and restricted.
Note 8. Federal Income Tax Information
($ reported in thousands)
At September 30, 2016, federal tax cost and aggregate gross unrealized appreciation (depreciation) of securities held by the Fund were as follows:
Federal | Unrealized | Unrealized | Net Unrealized | |||
| $6,500,520 | $1,005,202 | ($146,448) | $858,754 |
The differences between book basis cost and tax basis cost were attributable primarily to the tax deferral of losses on wash sales.
The Fund has capital loss carryforwards available to offset future realized capital gains as follows:
No Expiration | Total | |||
Short-term | Long-term | |||
| $348,891 | $412,731 | $761,622 | ||
The Trust may not realize the benefit of these losses to the extent the Fund does not realize gains on investments prior to the expiration of the capital loss carryovers.
Under the Regulated Investment Company Modernization Act of 2010 (the “Act”), net capital losses recognized for tax years beginning after December 22, 2010, may be carried forward indefinitely, and their character is retained as short-term and/or long-term losses.
Capital losses realized after October 31 and certain late year losses may be deferred and treated as occurring on the first day of the following fiscal year. For the fiscal period ended September 30, 2016, the Fund deferred and recognized qualified late year losses as follows:
Late Year | Late Year | Capital | Capital | |||
| $— | $6,533 | $— | $64,653 |
The components of distributable earnings on a tax basis (excluding unrealized appreciation (depreciation) which are disclosed in the beginning of this note) consist of the following:
Undistributed | Undistributed | |
| $25,349 | $— |
The differences between the book and tax basis components of distributable earnings relate principally to the timing of recognition of income and gains for federal income tax purposes. Short-term gain distributions reported in the Statements of Changes in Net Assets, if any, are reported as ordinary income for federal tax purposes. Distributions are determined on a tax basis and may differ from net investment income and realized capital gains for financial reporting purposes.
27
Table of Contents
VIRTUS EMERGING MARKETS OPPORTUNITIES FUND
NOTES TO FINANCIAL STATEMENTS (Continued)
SEPTEMBER 30, 2016
The tax character of dividends and distributions paid during the years ended September 30, 2016 and December 31, 2015 and 2014 was as follows:
| 2016 | 2015 | 2014 | ||||||||||
Ordinary Income | $ | — | $ | 86,600 | $ | 68,985 | ||||||
Long-Term Capital Gains | — | — | 83,430 | |||||||||
|
|
|
|
|
| |||||||
Total | $ | — | $ | 86,600 | $ | 152,415 | ||||||
|
|
|
|
|
| |||||||
Note 9. Reclassification of Capital Accounts
($ reported in thousands except as noted)
For financial reporting purposes, book basis capital accounts are adjusted to reflect the tax character of permanent book/tax differences. Permanent reclassifications can arise from differing treatment of certain income and gain transactions, nondeductible current year net operating losses, expiring capital loss carryovers and investments in passive foreign investment companies. The reclassifications have no impact on the net assets or NAV of the Fund. As of September 30, 2016, the Fund recorded reclassifications to increase (decrease) the accounts as listed below:
Capital Paid in | Accumulated | Undistributed | ||
| $— | $3,387 | $(3,387) |
Note 10. Borrowings
($ reported in thousands)
On June 29, 2016, the Fund and other affiliated funds renewed a $50,000 secured line of credit. The Credit Agreement (the “Agreement”) is with a commercial bank (the “Bank”) that allows the Fund to manage large unexpected redemptions and trade fails, up to a limit of one-third of the Fund’s total net assets in accordance with the Agreement. The agreement has a term of 364 days and is renewable by the Fund with the Bank’s consent. Interest is charged at the higher of the LIBOR (London Interbank Offered Rate) or the Federal Funds rate plus an additional percentage rate on the amount borrowed. Commitment fees are charged on the undrawn balance. The Fund and other affiliated funds are individually, and not jointly, liable for their particular advances, if any, under the line of credit. The Bank has the ability to require repayment of outstanding borrowings under the Agreement upon certain circumstances such as an event of default.
The Fund had no outstanding borrowings at any time during the period ended September 30, 2016.
Note 11. Indemnifications
Under the Trust’s organizational documents, its Trustees and officers are indemnified against certain liabilities arising out of the performance of their duties to the Fund. Each Trustee has entered into an indemnification agreement with the Trust. In addition, in the normal course of business, the Fund enter into contracts that provide a variety of indemnifications to other parties. The Fund’s maximum exposure under these arrangements is unknown as this would involve future claims that may be made against the Fund and that have not occurred. However, the Fund has not had prior claims or losses pursuant to these arrangements and expect the risk of loss to be remote.
28
Table of Contents
VIRTUS EMERGING MARKETS OPPORTUNITIES FUND
NOTES TO FINANCIAL STATEMENTS (Continued)
SEPTEMBER 30, 2016
Note 12. Regulatory Matters and Litigation
From time to time, the Trust, the Fund’s Adviser and/or Subadviser and/or their affiliates may be involved in litigation and arbitration as well as examinations and investigations by various regulatory bodies, including the SEC, involving compliance with, among other things, securities laws, client investment guidelines, laws governing the activities of broker-dealers and other laws and regulations affecting their products and other activities. At this time, the Adviser believes that the outcomes of such matters are not likely, either individually or in the aggregate, to be material to these financial statements.
On February 20, 2015, a putative class action complaint (In re Virtus Investment Partners, Inc. Securities Litigation; formerly styled as Tom Cummins v. Virtus Investment Partners Inc. et al.) alleging violation of the federal securities laws was filed by an individual shareholder against Virtus and certain of its officers (the “defendants”) in the United States District Court for the Southern District of New York. On August 21, 2015, the lead plaintiff filed a Consolidated Class Action Complaint (the “Consolidated Complaint”) amending the originally filed complaint and adding the Trust as a defendant. The Consolidated Complaint was purportedly filed on behalf of all purchasers of Virtus common stock between January 25, 2013 and May 11, 2015 (the “Class Period”). The Consolidated Complaint alleges that during the Class Period, the defendants disseminated materially false and misleading statements and concealed material adverse facts relating to certain funds previously subadvised by F-Squared Investments, Inc. and/or its affiliates (“F-Squared”). The plaintiff seeks to recover unspecified damages. A motion to dismiss the Consolidated Complaint was filed on behalf of the defendants on October 21, 2015. Pursuant to an Opinion & Order (“Order”) filed on July 1, 2016, the court granted in part and denied in part the defendants’ motion to dismiss. Although the Order narrows the scope of the claims asserted, claims under Sections 10(b) and 20(a) of the Exchange Act and Rule 10b-5 thereunder survive the motion. The defendants filed an Answer to the Consolidated Complaint on August 5, 2016. Virtus and its affiliates, including the Adviser, believe that the suit is without merit and intend to defend it vigorously. The Trust believes that the risk of loss to the Fund as a result of this suit is remote. The Adviser does not believe that the suit will have any impact on its ability to provide services to the Fund.
On May 8, 2015, a putative class action complaint (Mark Youngers v. Virtus Investment Partners, Inc. et al.) alleging violations of certain provisions of the federal securities laws was filed in the United States District Court for the Central District of California. The complaint, which was purportedly filed on behalf of purchasers of certain Virtus Funds previously subadvised by F-Squared between May 8, 2010 and December 22, 2014, inclusive (the “Class Period”), alleged claims against Virtus, certain Virtus officers and affiliates (including the Adviser, Euclid Advisors LLC (“Euclid”) and VP Distributors, LLC), the trustees and certain officers of the Trust, and certain other parties (the “defendants”). The complaint alleges that during the Class Period the defendants disseminated materially false and misleading statements and concealed or omitted material facts necessary to make the statements made not misleading. On October 1, 2015, the plaintiff filed a First Amended Class Action Complaint which, among other things, added a derivative claim for breach of fiduciary duty on behalf of the Trust. On October 19, 2015, the United States District Court for the Central District of California entered an order transferring the action to the Southern District of New York. On January 4, 2016, Plaintiffs filed a Second Amended Complaint. Motions to dismiss were filed on behalf of Virtus, its officers and affiliates and the independent trustees on February 1, 2016. An Opinion & Order (“Order”) granting in part
29
Table of Contents
VIRTUS EMERGING MARKETS OPPORTUNITIES FUND
NOTES TO FINANCIAL STATEMENTS (Continued)
SEPTEMBER 30, 2016
and denying in part the defendants’ motions to dismiss was issued on July 1, 2016. The Order dismissed all claims against the Adviser, Euclid, the independent trustees and certain of the other individual defendants and narrowed the claims asserted against the remaining defendants. The remaining defendants filed an Answer to the Second Amended Complaint on August 5, 2016. The defendants filed a motion to certify an interlocutory appeal of the July 1, 2016 order to the Court of Appeals for the Second Circuit on August 26, 2016. Oral argument on the motion is scheduled for October 7, 2016. Virtus and its affiliates, including the Adviser, believe that the suit has no basis in law or fact and intend to defend it vigorously. The Trust believes that the risk of loss to the Fund as a result of this suit is remote. The Adviser does not believe that the suit will have any impact on its ability to provide services to the Fund.
Note 13. Subsequent Events
Management has evaluated the impact of all subsequent events on the Fund through the date the financial statements were issued and has determined that there are no subsequent events requiring recognition or disclosure in the financial statements.
30
Table of Contents

Report of Independent Registered Public
Accounting Firm
To the Board of Trustees of
Virtus Opportunities Trust and
Shareholders of the Funds, as defined:
In our opinion, the accompanying statement of assets and liabilities, including the schedule of investments, and the related statements of operations, of changes in net assets, and the financial highlights present fairly, in all material respects, the financial position of Virtus Emerging Markets Opportunities Fund ((one of the funds constituting Virtus Opportunities Trust, hereafter referred to as the “Fund”)) at September 30, 2016, the results of its operations and its cash flows for the period ended September 30, 2016 and for the year ended December 31, 2015, the changes in its net assets for the period ended September 30, 2016 and each of the two years in the period ended December 31, 2015 and the financial highlights for each of the periods indicated, in conformity with accounting principles generally accepted in the United States of America. These financial statements and financial highlights (hereafter referred to as “financial statements”) are the responsibility of the Fund’s management. Our responsibility is to express an opinion on these financial statements based on our audits. We conducted our audits of these financial statements in accordance with the standards of the Public Company Accounting Oversight Board (United States). Those standards require that we plan and perform the audit to obtain reasonable assurance about whether the financial statements are free of material misstatement. An audit includes examining, on a test basis, evidence supporting the amounts and disclosures in the financial statements, assessing the accounting principles used and significant estimates made by management, and evaluating the overall financial statement presentation. We believe that our audits, which included confirmation of securities at September 30, 2016 by correspondence with the custodian and brokers, provide a reasonable basis for our opinion.

Philadelphia, Pennsylvania
November 22, 2016
31
Table of Contents
VIRTUS EMERGING MARKETS OPPORTUNITIES FUND
TAX INFORMATION NOTICE (Unaudited)
SEPTEMBER 30, 2016
($ reported in thousands)
For the fiscal period ended September 30, 2016, the Fund makes the following disclosures for federal income tax purposes. Below is listed the percentage, or the maximum amount allowable, of its ordinary income dividends to qualify for the lower tax rates (“QDI”) applicable to individual shareholders, and the percentage of ordinary income dividends earned by the Fund which qualifies for the dividends received deduction (“DRD”) for corporate shareholders. The actual percentage of QDI and DRD for the calendar year will be designated in year-end tax statements. The Fund designates the amounts below as long-term capital gains dividends (“LTCG”) taxable at a 20% rate, or lower depending on the shareholder’s income ($ reported in thousands). LTCG amounts, if subsequently different, will be designated in the next annual report.
QDI | DRD | LTCG | ||
| 100% | 13% | $— |
For the period ended September 30, 2016, the Fund recognized $120,100 (reported in thousands) of foreign source income on which the Fund paid foreign taxes of $5,936 (reported in thousands). This information is being furnished to you pursuant to notice requirements of Section 853(a) and 855(d) of the Internal Revenue Code, as amended, and the Treasury Regulations thereunder.
32
Table of Contents
Information pertaining to the Trustees and officers of the Trust as of September 30, 2016, is set forth below. The statement of additional information (SAI) includes additional information about the Trustees and is available without charge, upon request, by calling (800) 243-1574. The address of each individual, unless otherwise noted, is 100 Pearl Street, Hartford, CT 06103-4506. There is no stated term of office for Trustees of the Trust.
Independent Trustees
| Name, Year of Birth, Year Elected and Number of Funds Overseen | Principal Occupation(s) Other Directorships Held by Trustee | |
Thomas J. Brown YOB: 1945 Elected: 2016 65 Portfolios | Retired. Trustee (since 2016), Virtus Mutual Fund Complex (52 portfolios) and Virtus Alternative Solutions Trust (4 portfolios); Trustee (since 2011), Virtus Variable Insurance Trust (9 portfolios); Director (since 2010), D’Youville Senior Care Center; and Director (since 2005), VALIC Company Funds (49 portfolios). | |
Burke, Donald C. YOB: 1961 Elected: 2016 69 Portfolios | Retired. Trustee (since 2016), Virtus Mutual Fund Complex (52 portfolios), Virtus Variable Insurance Trust (9 portfolios) and Virtus Alternative Solutions Trust (4 portfolios); Director (since 2014) closed-end funds managed by Duff & Phelps Investment Management Co. (4 funds); Director, Avista Corp. (energy company) (since 2011); Trustee, Goldman Sachs Fund Complex (2010 to 2014); and Director, BlackRock Luxembourg and Cayman Funds (2006 to 2010). | |
Roger A. Gelfenbien YOB: 1943 Elected: 2016 65 Portfolios | Retired. Trustee (since 2016), Virtus Mutual Fund Complex (52 portfolios) and Virtus Alternative Solutions Trust (4 portfolios); Trustee (since 2000), Virtus Variable Insurance Trust (9 portfolios); and Director (since 1999), USAllianz Variable Insurance Product Trust (42 portfolios). | |
John R. Mallin YOB: 1950 Elected: 2016 65 Portfolios | Partner/Attorney (since 2003), McCarter & English LLP (law firm), Real Property Practice Group; and Member (since 2014), Counselors of Real Estate. Trustee (since 2016), Virtus Mutual Fund Complex (52 portfolios) and Virtus Alternative Solutions Trust (4 portfolios); Director (since 2013), Horizon, Inc. (non-profit); and Trustee (since 1999), Virtus Variable Insurance Trust (9 portfolios). | |
McClellan, Hassell H. YOB: 1945 Elected: 2015 65 Portfolios | Retired (since 2013); and Professor (1984 to 2013), Wallace E. Carroll School of Management, Boston College. Trustee (since 2016), Virtus Alternative Solutions Trust (4 portfolios); Trustee (since 2015), Virtus Mutual Fund Complex (52 portfolios); and Director (since 2010), Barnes Group, Inc. (diversified global components manufacturer and logistical services company); Trustee, Virtus Variable Insurance Trust (9 portfolios) (since 2008); and Trustee, John Hancock Fund Complex (since 2000) (collectively, 228 portfolios). | |
McLoughlin, Philip YOB: 1946 Elected: 1999 74 Portfolios | Retired. Director and Chairman (since 2016), The Zweig Fund and Virtus Global Dividend & Income Fund Inc.; Trustee and Chairman (since 2013), Virtus Alternative Solutions Trust (4 portfolios); Trustee/Director and Chairman (since 2011), Virtus Closed-End Funds (3 funds); Chairman and Trustee (since 2003), Virtus Variable Insurance Trust (9 portfolios); Director (since 1995), closed-end funds managed by Duff & Phelps Investment Management Co. (4 funds); Director (since 1991) and Chairman (since 2010), Lazard World Trust Fund (closed-end investment firm in Luxembourg); and Trustee (since 1989) and Chairman (since 2002), Virtus Mutual Fund Complex (52 portfolios). | |
McNamara, Geraldine M. YOB: 1951 Elected: 2001 69 Portfolios | Retired. Trustee (since 2016) Virtus Alternative Solutions Trust (4 portfolios); Trustee (since 2015), Virtus Variable Insurance Trust (9 portfolios); Director (since 2003), closed-end funds managed by Duff & Phelps Investment Management Co. (4 funds); and Trustee (since 2001), Virtus Mutual Fund Complex (52 portfolios). |
33
Table of Contents
FUND MANAGEMENT TABLES (Continued)
Independent Trustees (Continued)
| Name, Year of Birth, Year Elected and Number of Funds Overseen | Principal Occupation(s) Other Directorships Held by Trustee | |
Oates, James M. YOB: 1946 Elected: 2000 70 Portfolios | Managing Director (since 1994), Wydown Group (consulting firm). Director (since 2016), The Zweig Fund and Virtus Global Dividend & Income Fund Inc.; Trustee (since 2016) Virtus Variable Insurance Trust (9 portfolios); Trustee/Director (since 2013), Virtus Closed-End Funds (3 funds); Trustee (since 2013), Virtus Alternative Solutions Trust (4 portfolios); Chairman and Trustee (since 2005), John Hancock Fund Complex (228 portfolios); Director (2002 to 2014), New Hampshire Trust Company; Chairman (since 2000), Emerson Investment Management, Inc.; Non-Executive Chairman (2000 to 2014), Hudson Castle Group, Inc. (formerly IBEX Capital Markets, Inc.) (financial services) Chairman and Director (1999 to 2014), Connecticut River Bank; Director (since 1996), Stifel Financial; and Trustee (since 1987), Virtus Mutual Fund Complex (52 portfolios). | |
Segerson, Richard E. YOB: 1948 Elected: 2000 65 Portfolios | Retired; and Managing Director (1998 to 2013), Northway Management Company. Trustee (since 2016) Virtus Alternative Solutions Trust (4 portfolios) and Virtus Variable Insurance Trust (9 portfolios); and Trustee (since 1983), Virtus Mutual Fund Complex (52 portfolios). | |
Verdonck, Ferdinand L.J. YOB: 1942 Elected: 2005 65 Portfolios | Vice Chairman (since 2014), Affirmed Therapeutics (biotechnology); Director (1998 to 2015), The J.P. Morgan Continental European Investment Trust; Director (2005 to 2013), Galapagos N.V. (biotechnology); Director (1998 to 2015) Groupe SNEF; and Mr. Verdonck is also a director of several non-U.S. companies. Trustee (since 2016) Virtus Variable Insurance Trust (9 portfolios) and Virtus Alternative Solutions Trust (4 portfolios); and Trustee (since 2002), Virtus Mutual Fund Complex (52 portfolios). |
Interested Trustee
The individual listed below is an “interested person” of the Trust, as defined in Section 2(a)(19) of the 1940 Act, as amended, and the rules and regulations thereunder.
| Name, Year of Birth, Year Elected and Number of Funds Overseen | Principal Occupation(s) During Past 5 Years and | |
Aylward, George R.* Trustee and President YOB: 1964 Elected: 2006 70 Portfolios | Director, President and Chief Executive Officer (since 2008), Virtus Investment Partners, Inc. and/or certain of its subsidiaries; various senior officer positions with Virtus affiliates (since 2005). Chairman and Trustee (since 2015), Virtus ETF Trust II; Trustee and President (since 2013), Virtus Alternative Solutions Trust (4 portfolios); Director (since 2013), Virtus Global Funds, PLC (2 portfolios); Trustee (since 2012) and President (since 2010), Virtus Variable Insurance Trust (9 portfolios); Trustee and President (since 2011), Virtus Closed-End Funds (3 funds); Trustee (since 2006), Virtus Mutual Funds (52 portfolios); and Director, President and Chief Executive Officer (since 2006), The Zweig Fund and Virtus Global Dividend & Income Fund Inc. |
| * | Mr. Aylward is an “interested person,” as defined in the 1940 Act, by reason of his position as President and Chief Executive Officer of Virtus Investment Partners, Inc. (“Virtus”), the ultimate parent company of the Adviser, and various positions with its affiliates, including the Adviser. |
34
Table of Contents
FUND MANAGEMENT TABLES (Continued)
Officers of the Trust Who Are Not Trustees
Name, Address and Year of Birth | Position(s) Held with Time Served | Principal Occupation(s) During Past 5 Years | ||
Bradley, W. Patrick YOB: 1972 | Executive Vice President (since 2016); Senior Vice President (2013 to 2016); Vice President (2011 to 2013); Chief Financial Officer and Treasurer (since 2006). | Executive Vice President, Fund Services (since 2016), Senior Vice President, Fund Services (2010 to 2016), Virtus Investment Partners, Inc. and/or certain of its subsidiaries; various officer positions (since 2006) with Virtus affiliates; Executive Vice President (since 2016), Senior Vice President (2013 to 2016), Vice President (2011 to 2013), Chief Financial Officer and Treasurer (since 2004), Virtus Variable Insurance Trust; Executive Vice President (since 2016), Senior Vice President (2013 to 2016), Vice President (2011 to 2013), Chief Financial Officer and Treasurer (since 2006), Virtus Mutual Fund Complex; Executive Vice President (since 2016), Senior Vice President (2013 to 2016), Vice President (2012 to 2013) and Treasurer (Chief Financial Officer) (since 2007), The Zweig Fund and Virtus Global Dividend & Income Fund Inc.; Executive Vice President (since 2016), Senior Vice President (2013 to 2016), Vice President (2011 to 2013), Chief Financial Officer and Treasurer (since 2011), Virtus Closed-End Funds; Vice President and Assistant Treasurer (since 2011), Duff & Phelps Global Utility Income Fund Inc.; Director (since 2013), Virtus Global Funds, PLC; and Executive Vice President (since 2016), Senior Vice President, Chief Financial Officer and Treasurer (2013 to 2016), Virtus Alternative Solutions Trust. | ||
Carr, Kevin J. YOB: 1954 | Senior Vice President (since 2013); Vice President (2005 to 2013); Chief Legal Officer, Counsel and Secretary (since 2005). | Senior Vice President (since 2009), Vice President, Counsel and Secretary (2008 to 2009), Virtus Investment Partners, Inc. and/or certain of its subsidiaries; various senior officer positions (since 2005) with Virtus affiliates; Senior Vice President (since 2013), Vice President (2005 to 2013), Chief Legal Officer, Counsel and Secretary (since 2005), Virtus Mutual Fund Complex; Senior Vice President (2013 to 2014), Vice President (2012 to 2013) and Assistant Secretary (since 2012), Secretary and Chief Legal Officer (2005 to 2012), The Zweig Fund and Virtus Global Dividend & Income Fund Inc.; Assistant Secretary (since 2013), Vice President, Chief Legal Officer, Counsel and Secretary (2010 to 2013), Virtus Variable Insurance Trust; Vice President and Assistant Secretary (since 2011), Duff & Phelps Global Utility Income Fund Inc.; Senior Vice President and Assistant Secretary (2013 to 2014), Vice President and Assistant Secretary (2012 to 2013), Vice President, Chief Legal Officer, Counsel and Secretary (2011 to 2012), Virtus Closed-End Funds; and Assistant Secretary (since 2013), Virtus Alternative Solutions Trust. |
35
Table of Contents
FUND MANAGEMENT TABLES (Continued)
Officers of the Trust Who Are Not Trustees (Continued)
Name, Address and Year of Birth | Position(s) Held with Time Served | Principal Occupation(s) During Past 5 Years | ||
Engberg, Nancy J. YOB: 1956 | Vice President and Chief Compliance Officer since 2011. | Vice President (since 2008) and Chief Compliance Officer (2008 to 2011 and since 2016), Virtus Investment Partners, Inc. and/or certain of its subsidiaries; various officer positions (since 2003) with Virtus affiliates; Vice President and Chief Compliance Officer (since 2011), Virtus Mutual Fund Complex; Vice President (since 2010) and Chief Compliance Officer (since 2011), Virtus Variable Insurance Trust; Vice President and Chief Compliance Officer (since 2011), Virtus Closed-End Funds; Vice President and Chief Compliance Officer (since 2012), The Zweig Fund and Virtus Global Dividend & Income Fund Inc.; Vice President and Chief Compliance Officer (since 2013), Virtus Alternative Solutions Trust; Chief Compliance Officer (since 2015), ETFis Series Trust I; and Chief Compliance Officer (since 2015), Virtus ETF Trust II. | ||
Waltman, Francis G. YOB: 1962 | Executive Vice President (since 2013); Senior Vice President (2008-2013). | Executive Vice President, Product Development (since 2009), Virtus Investment Partners, Inc. and/or certain of its subsidiaries; various senior officer positions (since 2006) with Virtus affiliates; Executive Vice President (since 2013), Senior Vice President (2008 to 2013), Virtus Mutual Fund Complex; Executive Vice President (since 2013), Senior Vice President (2010 to 2013), Virtus Variable Insurance Trust; Executive Vice President (since 2013), Senior Vice President (2011 to 2013), Virtus Closed-End Funds; Director (since 2013), Virtus Global Funds PLC; and Executive Vice President (since 2013), Virtus Alternative Solutions Trust. |
36
Table of Contents
VIRTUS OPPORTUNITIES TRUST
101 Munson Street
Greenfield, MA 01301
Trustees
George R. Aylward
Thomas J. Brown
Donald C. Burke
Roger A. Gelfenbein
John R. Mallin
Hassell H. McClellan
Philip R. McLoughlin, Chairman
Geraldine M. McNamara
James M. Oates
Richard E. Segerson
Ferdinand L.J. Verdonck
Officers
George R. Aylward, President
Francis G. Waltman, Executive Vice President
W. Patrick Bradley, Executive Vice President, Chief Financial Officer and Treasurer
Nancy J. Engberg, Vice President and Chief Compliance Officer
Kevin J. Carr, Senior Vice President, Chief Legal Officer, Counsel and Secretary
Investment Adviser
Virtus Investment Advisers, Inc.
100 Pearl Street
Hartford, CT 06103-4506
Principal Underwriter
VP Distributors, LLC
100 Pearl St.
Hartford, CT 06103-4506
Administrator and Transfer Agent
Virtus Fund Services, LLC
100 Pearl Street
Hartford, CT 06103-4506
Custodian
JPMorgan Chase Bank, NA
1 Chase Manhattan Plaza
New York, NY 10005-1401
Independent Registered Public
Accounting Firm
PricewaterhouseCoopers LLP
2001 Market Street
Philadelphia, PA 19103-7042
How to Contact Us
Mutual Fund Services 1-800-243-1574
Adviser Consulting Group 1-800-243-4361
Website Virtus.com
Important Notice to Shareholders
The Securities and Exchange Commission has modified mailing regulations for semiannual and annual shareholder fund reports to allow mutual fund companies to send a single copy of these reports to shareholders who share the same mailing address. If you would like additional copies, please call Mutual Fund Services at 1-800-243-1574.
Table of Contents
For more information about
Virtus Mutual Funds, please
call your financial representative,
or contact us at 1-800-243-1574
or Virtus.com.
| 8004 | 11-16 |

P.O. Box 9874
Providence, RI 02940-8074
Table of Contents
Item 2. Code of Ethics.
| (a) | The registrant, as of the end of the period covered by this report, has adopted a code of ethics that applies to the registrant’s principal executive officer, principal financial officer, principal accounting officer or controller, or persons performing similar functions, regardless of whether these individuals are employed by the registrant or a third party. |
(c) There have been no amendments, during the period covered by this report, to a provision of the code of ethics that applies to the registrant’s principal executive officer, principal financial officer, principal accounting officer or controller, or persons performing similar functions, regardless of whether these individuals are employed by the registrant or a third party, and that relates to any element of the code of ethics described in Item 2(b) of the instructions for completion of Form N-CSR.
| (d) | The registrant has not granted any waivers, during the period covered by this report, including an implicit waiver, from a provision of the code of ethics that applies to the registrant’s principal executive officer, principal financial officer, principal accounting officer or controller, or persons performing similar functions, regardless of whether these individuals are employed by the registrant or a third party, that relates to one or more of the items set forth in paragraph (b) of the instructions for completion of this Item. |
Item 3. Audit Committee Financial Expert.
| (a)(1) | The Registrant’s Board of Trustees has determined that the Registrant has an “audit committee financial expert” serving on its Audit Committee. |
| (a)(2) | The Registrant’s Board of Trustees has determined that Donald C. Burke, Thomas J. Brown and Richard E. Segerson each possess the technical attributes identified in Instruction 2(b) of Item 3 to Form N-CSR to qualify as an “audit committee financial expert.” Each of Mr. Burke, Mr. Brown and Mr. Segerson is an “independent” trustee pursuant to paragraph (a)(2) of Item 3 to Form N-CSR. |
| (a)(3) | Not applicable. |
Item 4. Principal Accountant Fees and Services.
| ● | Registrant may incorporate the following information by reference, if this information has been disclosed in the registrant’s definitive proxy statement or definitive information statement. The |
Table of Contents
proxy statement or information statement must be filed no later than 120 days after the end of the fiscal year covered by the Annual Report. |
Audit Fees
| (a) | The aggregate fees billed for each of the last two fiscal years for professional services rendered by the principal accountant for the audit of the registrant’s annual financial statements or services that are normally provided by the accountant in connection with statutory and regulatory filings or engagements for those fiscal years are $673,744 for 2015 and $697,645 for 2016. |
Audit-Related Fees
| (b) | The aggregate fees billed in each of the last two fiscal years for assurance and related services by the principal accountant that are reasonably related to the performance of the audit of the registrant’s financial statements and are not reported under paragraph (a) of this Item are $90,281 for 2015 and $102,238 for 2016. Such audit-related fees include the out of pocket expenses and cross fund fees. |
Tax Fees
| (c) | The aggregate fees billed in each of the last two fiscal years for professional services rendered by the principal accountant for tax compliance, tax advice, and tax planning are $129,550 for 2015 and $134,875 for 2016. |
“Tax Fees” are those primarily associated with review of the Trust’s tax provision and qualification as a regulated investment company (RIC) in connection with audits of the Trust’s financial statement, review of year-end distributions by the Fund to avoid excise tax for the Trust, periodic discussion with management on tax issues affecting the Trust, and reviewing and signing the Fund’s federal income returns.
All Other Fees
| (d) | The aggregate fees billed in each of the last two fiscal years for products and services provided by the principal accountant, other than the services reported in paragraphs (a) through (c) of this Item are $0 for 2015 and $0 for 2016. |
| (e)(1) | Disclose the audit committee’s pre-approval policies and procedures described in paragraph (c)(7) of Rule 2-01 of Regulation S-X. |
The Virtus Opportunities Trust (the “Fund”) Board has adopted policies and procedures with regard to the pre-approval of services provided by PwC. Audit, audit-related and tax compliance services provided to the Fund on an annual basis require specific pre-approval by the Audit Committee. The Audit Committee must approve other non-audit services provided to the Fund and those non-audit services provided to the Fund’s Affiliated Service Providers that relate directly to the operations and financial reporting of the Fund. Certain of these non-audit services that the Audit Committee believes are a) consistent with the SEC’s auditor independence rules and b) routine and recurring services that will not impair the independence of the independent auditors may be approved by the Audit Committee without consideration on a specific case-by-case basis (“general pre-approval”).
Table of Contents
The Audit Committee has determined that Thomas J. Brown, Chair of the Audit Committee, may provide pre-approval for such services that meet the above requirements in the event such approval is sought between regularly scheduled meetings. In any event, the Audit Committee is informed of each service approved subject to general pre-approval at the next regularly scheduled in-person Audit Committee meeting.
| (e)(2) | The percentage of services described in each of paragraphs (b) through (d) of this Item that were approved by the audit committee pursuant to paragraph (c)(7)(i)(C) of Rule 2-01 of Regulation S-X are as follows: |
(b) 0%
(c) 0%
(d) N/A
| (f) | The percentage of hours expended on the principal accountant’s engagement to audit the registrant’s financial statements for the most recent fiscal year that were attributed to work performed by persons other than the principal accountant’s full-time, permanent employees was less than fifty percent. |
| (g) | The aggregate non-audit fees billed by the registrant’s accountant for services rendered to the registrant, and rendered to the registrant’s investment adviser (not including any sub-adviser whose role is primarily portfolio management and is subcontracted with or overseen by another investment adviser), and any entity controlling, controlled by, or under common control with the adviser that provides ongoing services to the registrant for each of the last two fiscal years of the registrant was $528,041 for 2015 and $631,661 for 2016. |
| (h) | The registrant’s audit committee of the board of directors has considered whether the provision of non-audit services that were rendered to the registrant’s investment adviser (not including any sub-adviser whose role is primarily portfolio management and is subcontracted with or overseen by another investment adviser), and any entity controlling, controlled by, or under common control with the investment adviser that provides ongoing services to the registrant that were not pre-approved pursuant to paragraph (c)(7)(ii) of Rule 2-01 of Regulation S-X is compatible with maintaining the principal accountant’s independence. |
Item 5. Audit Committee of Listed Registrants.
Not applicable.
Item 6. Investments.
| (a) | Schedule of Investments in securities of unaffiliated issuers as of the close of the reporting period is included as part of the report to shareholders filed under Item 1 of this form. |
Table of Contents
| (b) | Not applicable. |
| Item 7. | Disclosure of Proxy Voting Policies and Procedures for Closed-End Management Investment Companies. |
Not applicable.
Item 8. Portfolio Managers of Closed-End Management Investment Companies.
Not applicable.
| Item 9. | Purchases of Equity Securities by Closed-End Management Investment Company and Affiliated Purchasers. |
Not applicable.
Item 10. Submission of Matters to a Vote of Security Holders.
There have been no material changes to the procedures by which the shareholders may recommend nominees to the registrant’s board of trustees, where those changes were implemented after the registrant last provided disclosure in response to the requirements of Item 407(c)(2)(iv) of Regulation S-K (17 CFR 229.407) (as required by Item 22(b)(15) of Schedule 14A (17 CFR 240.14a-101)), or this Item.
Item 11. Controls and Procedures.
| (a) | The registrant’s principal executive and principal financial officers, or persons performing similar functions, have concluded that the registrant’s disclosure controls and procedures (as defined in Rule 30a-3(c) under the Investment Company Act of 1940, as amended (the “1940 Act”) (17 CFR 270.30a-3(c))) are effective, as of a date within 90 days of the filing date of the report that includes the disclosure required by this paragraph, based on their evaluation of these controls and procedures required by Rule 30a-3(b) under the 1940 Act (17 CFR 270.30a-3(b)) and Rules 13a-15(b) or 15d-15(b) under the Securities Exchange Act of 1934, as amended (17 CFR 240.13a-15(b) or 240.15d-15(b)). |
| (b) | There were no changes in the registrant’s internal control over financial reporting (as defined in Rule 30a-3(d) under the 1940 Act (17 CFR 270.30a-3(d)) that occurred during the registrant’s second fiscal quarter of the period covered by this report that has materially affected, or is reasonably likely to materially affect, the registrant’s internal control over financial reporting. |
Table of Contents
Item 12. Exhibits.
| (a)(1) | Code of ethics, or any amendment thereto, that is the subject of disclosure required by Item 2 is attached hereto. |
| (a)(2) | Certifications pursuant to Rule 30a-2(a) under the 1940 Act and Section 302 of the Sarbanes-Oxley Act of 2002 are attached hereto. |
| (a)(3) | Not applicable. |
| (b) | Certifications pursuant to Rule 30a-2(b) under the 1940 Act and Section 906 of the Sarbanes-Oxley Act of 2002 are attached hereto. |
(12.other) Not applicable.
Table of Contents
SIGNATURES
Pursuant to the requirements of the Securities Exchange Act of 1934 and the Investment Company Act of 1940, the registrant has duly caused this report to be signed on its behalf by the undersigned, thereunto duly authorized.
(Registrant) | Virtus Opportunities Trust |
| By (Signature and Title)* | /s/ George R. Aylward | |
George R. Aylward, President | ||
(principal executive officer) |
Date 12/9/2016
Pursuant to the requirements of the Securities Exchange Act of 1934 and the Investment Company Act of 1940, this report has been signed below by the following persons on behalf of the registrant and in the capacities and on the dates indicated.
| By (Signature and Title)* | /s/ George R. Aylward | |
George R. Aylward, President | ||
(principal executive officer) |
Date 12/9/2016
| By (Signature and Title)* | /s/ W. Patrick Bradley | |||
| W. Patrick Bradley, Executive Vice President, Chief Financial Officer, and Treasurer | ||||
(principal financial officer) | ||||
Date 12/9/2016
* Print the name and title of each signing officer under his or her signature.