Table of Contents
UNITED STATES
SECURITIES AND EXCHANGE COMMISSION
Washington, D.C. 20549
FORM N-CSR
CERTIFIED SHAREHOLDER REPORT OF REGISTERED MANAGEMENT
INVESTMENT COMPANIES
Investment Company Act file number 811-07455
Virtus Opportunities Trust
(Exact name of registrant as specified in charter)
101 Munson Street
Greenfield, MA 01301-9668
(Address of principal executive offices) (Zip code)
Kevin J. Carr, Esq.
Vice President, Chief Legal Officer, Counsel and Secretary for Registrant
100 Pearl Street
Hartford, CT 06103-4506
(Name and address of agent for service)
Registrant’s telephone number, including area code: (800) 243-1574
Date of fiscal year end: September 30
Date of reporting period: September 30, 2015
Form N-CSR is to be used by management investment companies to file reports with the Commission not later than 10 days after the transmission to stockholders of any report that is required to be transmitted to stockholders under Rule 30e-1 under the Investment Company Act of 1940 (17 CFR 270.30e-1). The Commission may use the information provided on Form N-CSR in its regulatory, disclosure review, inspection, and policymaking roles.
A registrant is required to disclose the information specified by Form N-CSR, and the Commission will make this information public. A registrant is not required to respond to the collection of information contained in Form N-CSR unless the Form displays a currently valid Office of Management and Budget (“OMB”) control number. Please direct comments concerning the accuracy of the information collection burden estimate and any suggestions for reducing the burden to Secretary, Securities and Exchange Commission, 100 F Street, NE, Washington, DC 20549. The OMB has reviewed this collection of information under the clearance requirements of 44 U.S.C. § 3507.
Table of Contents
Item 1. Reports to Stockholders.
The Report to Shareholders is attached herewith.
Table of Contents

ANNUAL REPORT
Virtus Bond Fund*
Virtus CA Tax-Exempt Bond Fund*
Virtus Essential Resources Fund
Virtus High Yield Fund*
Virtus Low Volatility Equity Fund*
Virtus Multi-Sector Intermediate Bond Fund
Virtus Senior Floating Rate Fund*
Virtus Wealth Masters Fund*
September 30, 2015 TRUST NAME: VIRTUS OPPORTUNITIES TRUST * Prospectus supplements applicable to these Funds appear at the back of this annual report. |
 |
Not FDIC Insured
No Bank Guarantee
May Lose Value
Table of Contents
| 1 | ||||||||
| 2 | ||||||||
| 4 | ||||||||
| Fund | Fund Summary | Schedule of Investments | ||||||
| 6 | 25 | |||||||
| 8 | 32 | |||||||
Virtus Essential Resources Fund (“Essential Resources Fund”) | | 11 | | 34 | ||||
| 14 | 36 | |||||||
Virtus Low Volatility Equity Fund (“Low Volatility Equity Fund”) | 17 | 41 | ||||||
Virtus Multi-Sector Intermediate Bond Fund (“Multi-Sector Intermediate Bond Fund”) | 19 | 42 | ||||||
Virtus Senior Floating Rate Fund (“Senior Floating Rate Fund”) | 21 | 51 | ||||||
| 23 | 57 | |||||||
| 60 | ||||||||
| 63 | ||||||||
| 66 | ||||||||
| 70 | ||||||||
| 75 | ||||||||
| 88 | ||||||||
| 89 | ||||||||
| 90 | ||||||||
Proxy Voting Procedures and Voting Record (Form N-PX)
The subadvisers vote proxies relating to portfolio securities in accordance with procedures that have been approved by the Board of Trustees of the Trust (“Trustees,” or the “Board”). You may obtain a description of these procedures, along with information regarding how the Funds voted proxies during the most recent 12-month period ended June 30, free of charge, by calling toll-free 1-800-243-1574. This information is also available through the Securities and Exchange Commission’s (the “SEC”) website at http://www.sec.gov.
Form N-Q Information
The Trust files a complete schedule of portfolio holdings for each Fund with the SEC for the first and third quarters of each fiscal year on Form N-Q. Form N-Q is available on the SEC’s website at http://www.sec.gov. Form N-Q may be reviewed and copied at the SEC’s Public Reference Room. Information on the operation of the SEC’s Public Reference Room can be obtained by calling toll-free 1-800-SEC-0330.
This report is not authorized for distribution to prospective investors in the Funds presented in this book unless preceded or accompanied by an effective prospectus which includes information concerning the sales charge, each Fund’s record and other pertinent information.
Table of Contents
To My Fellow Shareholders of Virtus Mutual Funds:
 | I am pleased to present this annual report that reviews the performance of your fund for the twelve months ended September 30, 2015.
During this period, global equity markets were challenged by falling oil prices, China’s economic slowdown, Greece’s debt crisis, and the growing likelihood of an interest rate hike by the Federal Reserve (the “Fed”). Volatility took its toll on major U.S. equity indices for the twelve months ended September 30, 2015. The large-cap S&P 500® Index and Dow Jones Industrial AverageSM moderately declined 0.61% and 2.11%, respectively, while the technology-heavy NASDAQ Composite Index® gained 4.00%. By | |
comparison, international equities were down even further, with emerging markets hit particularly hard.
Against this backdrop, U.S. Treasuries remained an attractive “safe haven” among global investors. The bellwether 10-year U.S. Treasury yield declined from 2.52% at September 30, 2014 to 2.06% at September 30, 2015. Fixed income assets experienced slight losses in anticipation of the Fed’s stated intention to raise interest rates at the end of 2015. The Barclays U.S. Aggregate Bond Index, which tracks Treasuries and other investment-grade debt securities, gained 2.94% for the twelve-month period ended September 30, 2015, while non-investment grade bonds underperformed, with the Barclays U.S. Corporate High Yield Bond Index down 3.43% for the same period.
The strength of the global economy is likely to remain a concern for the markets in the months ahead. Actions by the Fed and other global central banks will be watched with great interest. Following the weak start to the year, the U.S. economy exhibited growth over the second and third quarters of 2015 – including stronger jobs, housing, and consumer spending data – and gives investors reason for optimism. Future market direction will be determined largely by the ability of corporations to continue to produce robust earnings.
Market uncertainty serves as a constant reminder of the importance of portfolio diversification, including exposure to both traditional and alternative asset classes. While diversification cannot guarantee a profit or prevent a loss, owning a variety of asset classes may provide a cushion against inevitable market fluctuations. Your financial advisor can help you ensure that your portfolio is adequately diversified across asset classes and investment strategies.
As always, thank you for entrusting Virtus with your assets. Should you have questions about your account or require assistance, please visit our website at www.Virtus.com or call our customer service team at 1-800-243-1574. We appreciate your business and remain committed to your long-term financial success.
Sincerely,
George R. Aylward President, Virtus Mutual Funds
October 2015 | ||

Performance data quoted represents past results. Past performance is no guarantee of future results and current performance may be higher or lower than the performance shown above.
1
Table of Contents
VIRTUS OPPORTUNITIES TRUST
Disclosure of Fund Expenses (Unaudited)
FOR THE SIX-MONTH PERIOD OF APRIL 1, 2015 TO SEPTEMBER 30, 2015
We believe it is important for you to understand the impact of costs on your investment. All mutual funds have operating expenses. As a shareholder of a Virtus Opportunities Trust Fund (each, a “Fund”) you may incur two types of costs: (1) transaction costs, including sales charges on purchases of Class A shares and contingent deferred sales charges on Class B and Class C shares; and (2) ongoing costs, including investment advisory fees, distribution and service fees, and other expenses. Class I shares and Class R6 shares are sold without sales charges and do not incur distribution and service fees. For further information regarding applicable sales charges, see Note 1 in the Notes to Financial Statements. These examples are intended to help you understand your ongoing costs (in dollars) of investing in a Fund and to compare these costs with the ongoing costs of investing in other mutual funds. These examples are based on an investment of $1,000 invested at the beginning of the period and held for the entire six-month period. The following Expense Table illustrates your Fund’s costs in two ways.
Actual Expenses
The first section of the accompanying table provides information about actual account values and actual expenses. You may use the information in this section, together with the amount you invested, to estimate the expenses that you paid over the period. Simply divide your account value by $1,000 (for example, an $8,600 account value divided by $1,000 = 8.6), then multiply the result by the number given for your Fund under the heading “Expenses Paid During Period” to estimate the expenses you paid on your account during the period.
Hypothetical Example for Comparison Purposes
The second section of the accompanying table provides information about hypothetical account values and hypothetical expenses based on the Fund’s actual expense ratio and an assumed rate of return of 5% per year before expenses, which is not your Fund’s actual return. The hypothetical account values and expenses may not be used to estimate the actual ending account balance or expenses you paid for the period. You may use this information to compare the ongoing costs of investing in your Fund and other funds. To do so, compare these 5% hypothetical examples with the 5% hypothetical examples that appear in the shareholder reports of the other funds.
Please note that the expenses shown in the accompanying table are meant to highlight your ongoing costs only and do not reflect any transactional costs, such as sales charges or contingent deferred sales charges. Therefore, the second section of the accompanying table is useful in comparing ongoing costs only, and will not help you determine the relative total costs of owning different funds. In addition, if these transactional costs were included, your costs would have been higher. The calculations assume no shares were bought or sold during the period. Your actual costs may have been higher or lower, depending on the amount of your investment and the timing of any purchases or redemptions.
| Expense Table | ||||||||||||||||
| Beginning Account Value April 1, 2015 | Ending Account Value September 30, 2015 | Annualized Expense Ratio | Expenses Paid During Period* | |||||||||||||
Bond Fund |
| |||||||||||||||
Actual | ||||||||||||||||
Class A | $ | 1,000.00 | $ | 988.00 | 0.85 | % | $ | 4.24 | ||||||||
Class B | 1,000.00 | 984.90 | 1.60 | 7.96 | ||||||||||||
Class C | 1,000.00 | 985.00 | 1.60 | 7.96 | ||||||||||||
Class I | 1,000.00 | 989.40 | 0.60 | 2.99 | ||||||||||||
Hypothetical (5% return before expenses) |
| |||||||||||||||
Class A | 1,000.00 | 1,020.75 | 0.85 | 4.32 | ||||||||||||
Class B | 1,000.00 | 1,016.95 | 1.60 | 8.12 | ||||||||||||
Class C | 1,000.00 | 1,016.95 | 1.60 | 8.12 | ||||||||||||
Class I | 1,000.00 | 1,022.02 | 0.60 | 3.05 | ||||||||||||
CA Tax Exempt Bond Fund |
| |||||||||||||||
Actual | ||||||||||||||||
Class A | $ | 1,000.00 | $ | 1,009.30 | 0.85 | % | $ | 4.28 | ||||||||
Class I | 1,000.00 | 1,011.40 | 0.60 | 3.03 | ||||||||||||
Hypothetical (5% return before expenses) |
| |||||||||||||||
Class A | 1,000.00 | 1,020.75 | 0.85 | 4.32 | ||||||||||||
Class I | 1,000.00 | 1,022.02 | 0.60 | 3.05 | ||||||||||||
Essential Resources Fund |
| |||||||||||||||
Actual | ||||||||||||||||
Class A | $ | 1,000.00 | $ | 821.20 | 1.65 | % | $ | 7.53 | ||||||||
Class C | 1,000.00 | 818.20 | 2.40 | 10.94 | ||||||||||||
Class I | 1,000.00 | 822.30 | 1.40 | 6.40 | ||||||||||||
Hypothetical (5% return before expenses) |
| |||||||||||||||
Class A | 1,000.00 | 1,016.69 | 1.65 | 8.38 | ||||||||||||
Class C | 1,000.00 | 1,012.88 | 2.40 | 12.18 | ||||||||||||
Class I | 1,000.00 | 1,017.96 | 1.40 | 7.11 | ||||||||||||
High Yield Fund |
| |||||||||||||||
Actual | ||||||||||||||||
Class A | $ | 1,000.00 | $ | 963.40 | 1.15 | % | $ | 5.66 | ||||||||
Class B | 1,000.00 | 961.30 | 1.90 | 9.34 | ||||||||||||
Class C | 1,000.00 | 959.30 | 1.90 | 9.33 | ||||||||||||
Class I | 1,000.00 | 964.60 | 0.90 | 4.43 | ||||||||||||
Hypothetical (5% return before expenses) |
| |||||||||||||||
Class A | 1,000.00 | 1,019.23 | 1.15 | 5.84 | ||||||||||||
Class B | 1,000.00 | 1,015.42 | 1.90 | 9.65 | ||||||||||||
Class C | 1,000.00 | 1,015.42 | 1.90 | 9.65 | ||||||||||||
Class I | 1,000.00 | 1,020.50 | 0.90 | 4.57 | ||||||||||||
Low Volatility Equity Fund |
| |||||||||||||||
Actual | ||||||||||||||||
Class A | $ | 1,000.00 | $ | 972.80 | 1.55 | % | $ | 7.67 | ||||||||
Class C | 1,000.00 | 970.00 | 2.30 | 11.36 | ||||||||||||
Class I | 1,000.00 | 974.60 | 1.30 | 6.44 | ||||||||||||
Hypothetical (5% return before expenses) |
| |||||||||||||||
Class A | 1,000.00 | 1,017.20 | 1.55 | 7.87 | ||||||||||||
Class C | 1,000.00 | 1,013.39 | 2.30 | 11.68 | ||||||||||||
Class I | 1,000.00 | 1,018.47 | 1.30 | 6.60 | ||||||||||||
2
Table of Contents
VIRTUS OPPORTUNITIES TRUST
Disclosure of Fund Expenses (Unaudited) (Continued)
FOR THE SIX-MONTH PERIOD OF APRIL 1, 2015 TO SEPTEMBER 30, 2015
| Expense Table | ||||||||||||||||
| Beginning Account Value April 1, 2015 | Ending Account Value September 30, 2015 | Annualized Expense Ratio | Expenses Paid During Period* | |||||||||||||
Multi-Sector Intermediate Bond Fund |
| |||||||||||||||
Actual | ||||||||||||||||
Class A | $ | 1,000.00 | $ | 974.10 | 1.11 | % | $ | 5.49 | ||||||||
Class B | 1,000.00 | 970.40 | 1.88 | 9.29 | ||||||||||||
Class C | 1,000.00 | 970.70 | 1.86 | 9.19 | ||||||||||||
Class I | 1,000.00 | 976.30 | 0.86 | 3.77 | ||||||||||||
Class R6 | 1,000.00 | 976.80 | 0.76 | 2.84 | ||||||||||||
Hypothetical (5% return before expenses) |
| |||||||||||||||
Class A | 1,000.00 | 1,019.43 | 1.11 | 5.63 | ||||||||||||
Class B | 1,000.00 | 1,015.52 | 1.88 | 9.54 | ||||||||||||
Class C | 1,000.00 | 1,015.63 | 1.86 | 9.44 | ||||||||||||
Class I | 1,000.00 | 1,020.70 | 0.86 | 4.37 | ||||||||||||
Class R6 | 1,000.00 | 1,021.21 | 0.76 | 3.86 | ||||||||||||
Senior Floating Rate Fund |
| |||||||||||||||
Actual | ||||||||||||||||
Class A | $ | 1,000.00 | $ | 991.40 | 1.19 | % | $ | 5.94 | ||||||||
Class C | 1,000.00 | 986.70 | 1.94 | 9.66 | ||||||||||||
Class I | 1,000.00 | 992.70 | 0.94 | 4.70 | ||||||||||||
Hypothetical (5% return before expenses) |
| |||||||||||||||
Class A | 1,000.00 | 1,019.03 | 1.19 | 6.04 | ||||||||||||
Class C | 1,000.00 | 1,015.22 | 1.94 | 9.85 | ||||||||||||
Class I | 1,000.00 | 1,020.30 | 0.94 | 4.77 | ||||||||||||
Wealth Masters Fund |
| |||||||||||||||
Actual | ||||||||||||||||
Class A | $ | 1,000.00 | $ | 873.40 | 1.45 | % | $ | 6.81 | ||||||||
Class C | 1,000.00 | 870.30 | 2.20 | 10.31 | ||||||||||||
Class I | 1,000.00 | 874.40 | 1.20 | 5.64 | ||||||||||||
Hypothetical (5% return before expenses) |
| |||||||||||||||
Class A | 1,000.00 | 1,017.71 | 1.45 | 7.36 | ||||||||||||
Class C | 1,000.00 | 1,013.90 | 2.20 | 11.17 | ||||||||||||
Class I | 1,000.00 | 1,018.98 | 1.20 | 6.09 | ||||||||||||
| * | Expenses are equal to the relevant Funds’ annualized expense ratio, which is net of waived fees and reimbursed expenses, if applicable, multiplied by the average account value over the period, multiplied by the number of days (183) expenses were accrued in the most recent fiscal half-year, then divided by 365 to reflect the one-half year period. |
For Funds which may invest in other funds, the annualized expense ratios noted above do not reflect fees and expenses associated with the underlying funds. If such fees and expenses had been included, the expenses would have been higher.
You can find more information about the Funds’ expenses in the Financial Statements section that follows. For additional information on operating expenses and other shareholder costs, refer to the prospectus.
3
Table of Contents
(Unaudited)
American Depositary Receipt (ADR)
Represents shares of foreign companies traded in U.S. dollars on U.S. exchanges that are held by a U.S. bank or a trust. Foreign companies use ADRs in order to make it easier for Americans to buy their shares.
Barclays California Municipal Bond Index
The Barclays California Municipal Bond Index measures long term investment grade, tax-exempt and fixed rate bonds issued in California. The index is calculated on a total return basis. The index is unmanaged, its returns do not reflect any fees, expenses, or sales charges, and it is not available for direct investment.
Barclays U.S. Aggregate Bond Index
The Barclays U.S. Aggregate Bond Index measures the U.S. investment grade fixed rate bond market. The index is calculated on a total return basis. The index is unmanaged, its returns do not reflect any fees, expenses, or sales charges, and it is not available for direct investment.
Barclays U.S. Corporate High Yield Bond Index
The Barclays U.S. Corporate High Yield Bond Index measures the U.S. dollar-denominated, high yield, fixed-rate corporate bond market. The index is calculated on a total return basis. The index is unmanaged, its returns do not reflect any fees, expenses, or sales charges, and it is not available for direct investment.
Barclays U.S. High Yield 2% Issuer Capped Bond Index
The Barclays High-Yield 2% Issuer Capped Bond Index is a market capitalization-weighted index that measures fixed rate non-investment grade debt securities of U.S. and non-U.S. corporations. No single issuer accounts for more than 2% of market cap. The index is calculated on a total return basis. The index is unmanaged, its returns do not reflect any fees, expenses, or sales charges, and it is not available for direct investment.
Chicago Board Options Exchange (CBOE) Volatility Index®
The Chicago Board Options Exchange (CBOE) Volatility Index (“VIX® Index”) shows the market’s expectation of 30-day volatility. It is constructed using the implied volatilities of a wide range of S&P 500® Index options. This volatility is meant to be forward looking and is calculated from both calls and puts. The VIX® Index is a widely used measure of market risk and is often referred to as the “investor fear gauge.” The index is unmanaged, its returns do not reflect any fees, expenses, or sales charges, and is not available for direct investment.
CBOE S&P 500 Buywrite Index
The CBOE S&P 500 Buywrite Index is a passive total return index based on buying an S&P 500® stock index portfolio and “writing” (or selling) the nearterm S&P 500® Index (SPXSM) “covered” call option. The index is unmanaged, its returns do not reflect any fees, expenses, or sales charges, and is not available for direct investment.
Dow Jones Industrial AverageSM
A price weighted average of 30 blue chip stocks. The index is calculated on total return basis with dividends reinvested. The index is unmanaged, its returns do not reflect any fees, expenses, or sales charges, and it is not available for direct investment.
Exchange-Traded Funds (ETF)
A Fund that is traded on a stock exchange. Most ETFs have a portfolio of stocks or bonds that track a specific market index.
Federal Reserve (the “Fed”)
The Central Bank of the United States, responsible for controlling the money supply, interest rates and credit with the goal of keeping the U.S. economy and currency stable. Governed by a seven-member board, the system includes 12 regional Federal Reserve Banks, 25 branches and all national and state banks that are part of the system.
Gross Domestic Product (“GDP”)
The market value of all officially recognized final goods and services produced within a country in a given period.
4
Table of Contents
KEY INVESTMENT TERMS (Continued)
(Unaudited)
Horizon Kinetics ISE Wealth Index (RCH)
Is a public index published by International Securities Exchange, LLC. The index is composed of companies with wealthy individuals in positions of influence or control who have a substantial amount of their personal wealth invested in the business. The index is unmanaged, its returns do not reflect any fees, expenses, or sales charges, and it is not available for direct investment.
iShares®
Represents shares of an open-end exchange-traded fund.
NASDAQ Composite Index®
A market-capitalization weighted index of the more than 3,000 common equities listed on the Nasdaq stock exchange. Unlike other market indexes, the NASDAQ composite is not limited to companies that have U.S. headquarters. The index is unmanaged, its returns do not reflect any fees, expenses, or sales charges and it is not available for direct investment.
Organization of the Petroleum Exporting Countries (OPEC)
The Organization of the Petroleum Exporting Countries was originally organized in September 1960 with 5 member countries and there are currently 12 member countries. The organization’s objective is to co-ordinate and unify petroleum policies among member countries, in order to secure fair and stable prices for petroleum producers; an efficient, economic and regular supply of petroleum to consuming nations; and a fair return on capital to those investing in the industry.
Payment-in-Kind Security (PIK)
A bond which pays interest in the form of additional bonds, or preferred stock which pays dividends in the form of additional preferred stock.
Real Estate Investment Trust (REIT)
A publicly traded company that owns, develops and operates income-producing real estate such as apartments, office buildings, hotels, shopping centers and other commercial properties.
S&P 100® Index
The S&P 100® Index, a sub-set of the S&P 500®, measures the performance of large-cap U.S. companies, and comprises 100 major, blue chip companies across multiple industry groups.
S&P 500® Index
The S&P 500® Index is a free-float market capitalization-weighted index of 500 of the largest U.S. companies. The index is calculated on a total return basis with dividends reinvested. The index is unmanaged, its returns do not reflect any fees, expenses, or sales charges, and it is not available for direct investment.
S&P Global Natural Resources Index (net)
The S&P Global Natural Resources Index (net) is a free-float market capitalization index calculated on a total return basis with net dividends reinvested. The index consists of 90 of the largest publicly traded companies in natural resources and commodities businesses that meet specific investability requirements, offering investors diversified and investable equity exposure across three primary commodity-related sectors: agribusiness, energy, and metals and mining. The index is unmanaged, its returns do not reflect any fees, expenses, or sales charges, and it is not available for direct investment.
S&P/LSTA Leveraged Loan Index
The S&P/LSTA Leveraged Loan Index is a daily total return index that uses LSTA/LPC Mark-to-Market Pricing (third-party research data on the price movements of senior secured floating rate loans in the secondary loan market) to calculate market value change. On a real-time basis, the Index tracks the current outstanding balance and spread over LIBOR for fully funded term loans. The facilities included in the Index represent a broad cross section of leveraged loans syndicated in the United States, including dollar-denominated loans to overseas issuers. The index is unmanaged, its returns do not reflect any fees, expenses, or sales charges and it is not available for direct investment.
When-issued and Forward Commitments (Delayed Delivery)
Securities purchased on a when-issued or forward commitment basis are also known as delayed delivery transactions. Delayed delivery transactions involve a commitment by a Fund to purchase or sell a security at a future date, ordinarily up to 90 days later. When-issued or forward commitments enable a Fund to lock in what is believed to be an attractive price or yield on a particular security for a period of time, regardless of future changes in interest rates.
5
Table of Contents
Fund Summary | Ticker Symbols: Class A: SAVAX Class B: SAVBX Class C: SAVCX Class I: SAVYX |
Portfolio Manager Commentary by Newfleet Asset Management, LLC
| ¢ | The Fund is diversified and has an investment objective of high total return from both current income and capital appreciation. |
| ¢ | For the fiscal year ended September 30, 2015, the Fund’s Class A shares at NAV returned -0.26%, Class B shares returned -0.91%, Class C shares returned -1.00%, and Class I shares returned 0.08%. For the same period, the Barclays U.S. Aggregate Bond Index, which serves as the broad-based and style-specific benchmark index appropriate for comparison, returned 2.94%. |
All performance figures assume reinvestment of distributions and exclude the effect of sales charges. Past performance is no guarantee of future results, and current performance may be higher or lower than the performance shown above.
How did the market perform during the Fund’s fiscal year?
| ¢ | Most spread sectors underperformed U.S. Treasuries during the fiscal year. Plummeting oil prices dominated market volatility and investor concerns in the first half of the fiscal year, especially during the fourth quarter of 2014. Brent crude, the international benchmark for oil prices, fell about 50% between September 2014 (when the price was roughly $93 a barrel) and September 2015, ending the period at roughly $47 a barrel. Brent crude oil hit a 12-month low of roughly $40 a barrel on August 24, 2015. |
| ¢ | Globally, concerns over slowing growth in China and the Greek debt crisis weighed on the fixed income markets. A looming U.S. Federal Reserve (“Fed”) rate hike, with negative implications for capital flows and debt financing, added to the turmoil, with some emerging market central banks (unlike the International Monetary Fund and the World Bank) calling for the Fed to raise rates and remove the uncertainty that could prove to be more harmful than the actual impact. |
| ¢ | The waiting game for the Fed to raise interest rates from their near-zero level maintained since December 2008 continued through the end of the fiscal year. As of its September 17 meeting, the |
Fed decided to leave its benchmark rate unchanged, balancing relatively strong U.S. growth and labor market conditions against a lack of inflation, a strengthening U.S. dollar, and a shaky global economy. |
| ¢ | Over the last 12 months, yields increased on the short end of the U.S. Treasury curve and decreased on the intermediate to long end, and the curve flattened overall. |
What factors affected the Fund’s performance during its fiscal year?
| ¢ | The underperformance of fixed income spread sectors relative to U.S. Treasuries was the key driver of the Fund’s underperformance relative to the benchmark for the fiscal year. |
| ¢ | Among fixed income sectors, the Fund’s allocation to structured finance, specifically asset-backed securities, contributed to performance. |
| ¢ | During the fiscal year the Fund’s allocation to corporate high yield and high yield bank loans detracted from performance. |
The preceding information is the opinion of portfolio management. Any such opinions are subject to change at any time based upon market or other conditions and should not be relied upon as investment advice. Past performance is no guarantee of future results, and there is no guarantee that market forecasts will be realized.
There is no guarantee that the Fund will meet its objective.
Credit & Interest: Debt securities are subject to various risks, the most prominent of which are credit and interest rate risk. The issuer of a debt security may fail to make interest and/or principal payments. Values of debt securities may rise or fall in response to changes in interest rates, and this risk may be enhanced with longer-term maturities.
Foreign & Emerging Markets: Investing internationally, especially in emerging markets, involves additional risks such as currency, political, accounting, economic, and market risk.
ABS/MBS: Changes in interest rates can cause both extension and prepayment risks for asset- and mortgage-backed securities. These securities are also
subject to risks associated with the repayment of underlying collateral.
High Yield-High Risk Fixed Income Securities: There is a greater level of credit risk and price volatility involved with high yield securities than investment grade securities.
Prospectus: For additional information on risks, please see the fund’s prospectus.
| Asset Allocation | ||||||||
| The following table presents asset allocations within certain sectors and as a percentage of total investments as of September 30, 2015. | ||||||||
Corporate Bonds and Notes | 49 | % | ||||||
Financials | 22 | % | ||||||
Consumer Discretionary | 7 | |||||||
Health Care | 4 | |||||||
All other Corporate Bonds and Notes | 16 | |||||||
Mortgage-Backed Securities | 24 | |||||||
U.S. Government Securities | 7 | |||||||
Loan Agreements | 6 | |||||||
Asset-Backed Securities | 5 | |||||||
Preferred Stocks | 3 | |||||||
Other (includes short-term investments) | 6 | |||||||
|
| |||||||
Total | 100 | % | ||||||
|
| |||||||
For information regarding the indexes and certain investment terms, see the Key Investment Terms starting on page 4.
6
Table of Contents
Bond Fund (Continued)
| Average Annual Total Returns1 for periods ended 9/30/15 | ||||||||||||
| 1 year | 5 years | 10 years | ||||||||||
| Class A Shares at NAV2 | -0.26 | % | 3.50 | % | 4.75 | % | ||||||
| Class A Shares at POP3 | -4.00 | 2.71 | 4.35 | |||||||||
| Class B Shares at NAV2 | -0.91 | 2.73 | 3.97 | |||||||||
| Class B Shares with CDSC4 | -4.77 | 2.73 | 3.97 | |||||||||
| Class C Shares at NAV2 and with CDSC4 | -1.00 | 2.74 | 3.97 | |||||||||
| Class I Shares at NAV | 0.08 | 3.78 | 5.03 | |||||||||
| Barclays U.S. Aggregate Bond Index | 2.94 | 3.10 | 4.64 | |||||||||
Fund Expense Ratios5: A Shares: Gross 1.10%, Net 0.85%; B Shares: Gross 1.85%, Net 1.60%; C Shares: Gross 1.85%, Net 1.60%; I Shares: Gross 0.85%, Net 0.60%.
All returns represent past performance which is no guarantee of future results. Current performance may be higher or lower than the performance shown. The investment return and principal value of an investment will fluctuate so that an investor’s shares, when redeemed, may be worth more or less than their original cost. The above table and graph below do not reflect the deduction of taxes that a shareholder would pay on fund distributions or the redemption of shares. Please visit Virtus.com for performance data current to the most recent month-end.
| 1 | Total returns are historical and include changes in share price and the reinvestment of both dividends and capital gains distributions. |
| 2 | “NAV” (Net Asset Value) total returns do not include the effect of any sales charge. |
| 3 | “POP” (Public Offering Price) total returns include the effect of the maximum front-end 3.75% sales charge. |
| 4 | “CDSC” (Contingent Deferred Sales Charge) is applied to redemptions of certain classes of shares that do not have a sales charge applied at the time of purchase. CDSC charges for B shares decline from 5% to 0% over a five-year period. CDSC charges for certain redemptions of Class A shares made within 18 months of purchase in which a finder’s fee was paid and all redemptions of Class C shares within the first year are 1% and 0% thereafter. |
| 5 | The expense ratios of the Fund are set forth according to the prospectus for the Fund effective January 28, 2015, as supplemented and revised, and may differ from the expense ratios disclosed in the Financial Highlights tables in this report. See the Financial Highlights for more current expense ratios. Net Expense: Expenses reduced by contractual fee waiver in effect through January 31, 2017. For the period of October 1, 2014 through August 31, 2015, the waiver was voluntary. Gross Expense: Does not reflect the effect of the fee waiver. |
Growth of $10,000 For periods ended 9/30
This chart assumes an initial investment of $10,000 made on September 30, 2005, for Class A, Class B, Class C, and Class I shares including any applicable sales charges or fees. Performance assumes reinvestment of dividends and capital gain distributions.
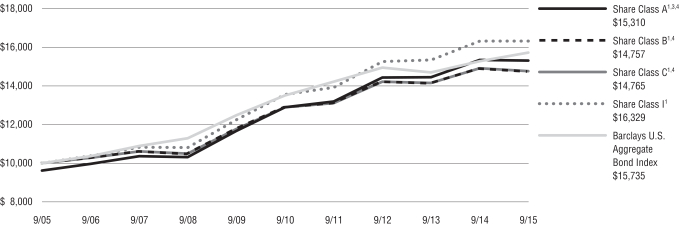
The indexes are unmanaged and not available for direct investment; therefore, their performance does not reflect the expenses associated with active management of an actual portfolio.
For information regarding the indexes and certain investment terms, see the Key Investment Terms starting on page 4.
7
Table of Contents
Fund Summary | Ticker Symbols: Class A: CTESX Class I: CTXEX |
Portfolio Manager Commentary by Newfleet Asset Management, LLC
| ¢ | The Fund is diversified and has an investment objective of obtaining a high level of current income exempt from California state and local income taxes, as well as federal income tax, consistent with the preservation of capital. |
| ¢ | For the fiscal year ended September 30, 2015, the Fund’s Class A shares at NAV returned 3.44% and Class I shares returned 3.71%. For the same period, the Barclays U.S. Aggregate Bond Index, a broad-based fixed income index, returned 2.94%, and the Barclays California Municipal Bond Index, the Fund’s style-specific benchmark appropriate for comparison, returned 3.39%. |
All performance figures assume reinvestment of distributions and exclude the effect of sales charges. Past performance is no guarantee of future results, and current performance may be higher or lower than the performance shown above.
How did the market perform during the Fund’s fiscal year?
| ¢ | The municipal bond market experienced mixed performance over the 12 months ended September 30, 2015, as tax-free interest declined over the early part of this period, only to reverse course in February and April through June. During the period, 2-year and 5-year municipal yields were 19 and 10 basis points higher, respectively, while 10-year and 30-year yields were 14 and 5 basis point lower. The rise in bond yields in the shorter maturity range was due mostly to the market’s expectation that the Federal Open Market Committee, the committee within the U.S. Federal Reserve that sets domestic monetary policy, would raise the target federal funds rate sometime during the year. However, as the market began to discount the Fed lowering rates in 2015, interest rates started to move lower across the entire yield curve. |
| ¢ | Municipalities continued to take advantage of generational low interest rates to refinance their higher cost debt. As of the end of the fiscal year, issuance was on pace to exceed $400 billion, a level not seen in quite some time. Additionally, nearly 60% of this municipal bond issuance (compared to the more typical 35%) consisted of |
the “refunding” of existing debt, causing a dramatic uptick in the overall issuance of municipal bonds. Given that the market’s strong performance in 2014 was due in part to a scarcity of supply, the market softened during the fiscal year as issuance levels increased. At the same time, municipalities remained slow to incur additional debt to fund much needed infrastructure, leaving “new money” issuance mostly in line with levels from 2014. |
| ¢ | After experiencing very strong flows into open-end mutual funds for the first seven months of the fiscal year, flows reversed over the next five months as expectations increased that the Fed would increase rates in the fall of 2015. While open-end mutual fund flows generally influence overall demand, near-term performance of the municipal bond market and future demand will likely be predicated by the direction of interest rates. In contrast, the market continues to see increased demand from households and banks through the use of separately managed accounts or direct lending by banks. Despite slowing demand from municipal mutual funds, other demand components have resulted in little pricing impact to the municipal market. According to the Investment Company Institute (ICI), open-end municipal bond mutual funds experienced almost $13 billion of inflows during the 12 months ended September 30, 2015. However, should the trend of net outflows that began in May persist over the balance of the calendar year, municipal bond yields could be pressured higher. |
| ¢ | Setting aside recent headline news out of Puerto Rico and Chicago, the general credit picture for the municipal market improved toward the end of the fiscal year. Tax revenue collections continued to grow, with the latest numbers through June 30, 2015, showing year-over-year growth of 4.2%, marking the 18th consecutive quarter of growth. That said, understanding the fundamental strength of each credit is extremely important as the municipal market is no longer characterized as a commodity, following the demise of the AAA-rated bond insurers. In 2009, more than 50% of the bonds in the municipal market were rated AAA, but that number has dropped more recently to only 11%. While tax collections have grown following the recession, municipalities will continue to deal with challenges surrounding underfunded pensions |
and their ability to enact meaningful reform, growing capital improvement projects required to meet changing federal regulations and industry changes, and variable economic conditions, which makes credit research very critical in this market. Avoiding credit problems is imperative to portfolio performance. |
What factors affected the Fund’s performance during its fiscal year?
| ¢ | Relative portfolio performance benefited from exposure to bonds with long maturities, lower-rated investment grade ratings, and having no exposure to bonds issued in Puerto Rico. |
| ¢ | Relative portfolio performance was impacted by the exposure to short-term maturities, higher coupons, better quality, and pre-refunded bonds. |
| ¢ | Over the past 12 months, the market’s best performers were longer duration, lower coupon, and lower credit quality bonds as interest rates declined beyond five years, and risk premiums narrowed. While still producing positive performance, bonds with shorter maturities, lower duration, and higher credit quality performed relatively weaker. |
The preceding information is the opinion of portfolio management. Any such opinions are subject to change at any time based upon market or other conditions and should not be relied upon as investment advice. Past performance is no guarantee of future results, and there is no guarantee that market forecasts will be realized.
There is no guarantee that the Fund will meet its objective.
Credit & Interest: Debt securities are subject to various risks, the most prominent of which are credit and interest rate risk. The issuer of a debt security may fail to make interest and/or principal payments. Values of debt securities may rise or fall in response to changes in interest rates, and this risk may be enhanced with longer-term maturities.
Geographic Concentration: A fund that focuses its investments in a particular geographic location will be highly sensitive to financial, economic, political, and other developments affecting the fiscal stability of that location.
For information regarding the indexes and certain investment terms, see the Key Investment Terms starting on page 4.
8
Table of Contents
| CA Tax-Exempt Bond Fund (Continued) |
Municipal Market: Events negatively impacting a municipal security, or the municipal bond market in general, may cause the fund to decrease in value.
State & AMT Tax: A portion of income may be subject to some state and/or local taxes and, for certain investors, a portion may be subject to the federal alternative minimum tax.
High Yield-High Risk Fixed Income Securities: There is a greater level of credit risk and price volatility involved with high yield securities than investment grade securities.
Prospectus: For additional information on risks, please see the fund’s prospectus.
| Asset Allocation | ||||||||
The following table presents asset allocations within certain sectors and as a percentage of total investments as of September 30, 2015.
|
| |||||||
Tax-Exempt Municipal Bonds | 100 | % | ||||||
General Revenue | 25 | % | ||||||
General Obligation | 16 | |||||||
Pre-Refunded | 15 | |||||||
Development Revenue | 9 | |||||||
Water & Sewer Revenue | 9 | |||||||
Medical Revenue | 8 | |||||||
Transportation Revenue | 7 | |||||||
Other | 11 | |||||||
|
| |||||||
Total | 100 | % | ||||||
|
| |||||||
For information regarding the indexes and certain investment terms, see the Key Investment Terms starting on page 4.
9
Table of Contents
CA Tax-Exempt Bond Fund (Continued)
| Average Annual Total Returns1 for periods ended 9/30/15 | ||||||||||||||||||||
| 1 year | 5 years | 10 years | Since Inception | Inception Date | ||||||||||||||||
| Class A Shares at NAV2 | 3.44 | % | 4.64 | % | 4.34 | % | — | — | ||||||||||||
| Class A Shares at POP3,4 | 0.60 | 4.06 | 4.04 | — | — | |||||||||||||||
| Class I Shares at NAV | 3.71 | 4.89 | — | 4.62 | % | 9/29/06 | ||||||||||||||
| Barclays U.S. Aggregate Bond Index | 2.94 | 3.10 | 4.64 | 4.74 | 5 | — | ||||||||||||||
| Barclays California Municipal Bond Index | �� | 3.39 | 4.87 | 4.90 | 4.92 | 5 | — | |||||||||||||
Fund Expense Ratios6: A Shares: Gross 1.11%, Net 0.85%; I Shares: Gross 0.86%, Net 0.60%.
All returns represent past performance which is no guarantee of future results. Current performance may be higher or lower than the performance shown. The investment return and principal value of an investment will fluctuate so that an investor’s shares, when redeemed, may be worth more or less than their original cost. The above table and graph below do not reflect the deduction of taxes that a shareholder would pay on fund distributions or the redemption of shares. Please visit Virtus.com for performance data current to the most recent month-end.
| 1 | Total returns are historical and include changes in share price and the reinvestment of both dividends and capital gains distributions. |
| 2 | “NAV” (Net Asset Value) total returns do not include the effect of any sales charge. |
| 3 | “POP” (Public Offering Price) total returns include the effect of the maximum front-end 2.75% sales charge. |
| 4 | “CDSC” (Contingent Deferred Sales Charge) is applied to redemptions of certain classes of shares that do not have a sales charge applied at the time of purchase. CDSC charges for certain redemptions of Class A shares made within 18 months of purchase in which a finder’s fee was paid are 1% and 0% thereafter. |
| 5 | The since inception index returns are from the inception date of Class I. |
| 6 | The expense ratios of the Fund are set forth according to the prospectus for the Fund effective January 28, 2015, as supplemented and revised, and may differ from the expense ratios disclosed in the Financial Highlights tables in this report. See the Financial Highlights for more current expense ratios. Net Expense: Expenses reduced by contractual fee waiver in effect through January 31, 2017. For the period of October 1, 2014 through August 31, 2015, the waiver was voluntary. Gross Expense: Does not reflect the effect of the fee waiver. |
Growth of $10,000 For periods ended 9/30
This chart assumes an initial investment of $10,000 made on September 30, 2005 for Class A shares including any applicable sales charges or fees. Performance assumes reinvestment of dividends and capital gain distributions.
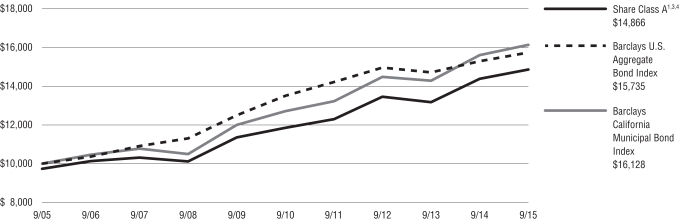
The indexes are unmanaged and not available for direct investment; therefore, their performance does not reflect the expenses associated with active management of an actual portfolio.
For information regarding the indexes and certain investment terms, see the Key Investment Terms starting on page 4.
10
Table of Contents
Fund Summary | Ticker Symbols: Class A: VERAX Class C: VERCX Class I: VERIX |
Portfolio Manager Commentary by Kleinwort Benson Investors International, Ltd.
| ¢ | The Fund is diversified and has an investment objective of capital appreciation. |
| ¢ | For the fiscal period March 24, 2015 (inception of the Fund) through September 30, 2015, the Fund’s Class A shares at NAV returned -19.60%*, Class C shares returned -19.90%*, and Class I shares returned -19.50%*. For the same period, the S&P 500® Index, a broad-based fixed equity index, returned -7.20%* and the S&P Global Natural Resources Index (net) the Fund’s style-specific benchmark appropriate for comparison returned -24.31%*. |
| * | Returns less than 1 year are not annualized. |
All performance figures assume reinvestment of distributions and exclude the effect of sales charges. Past performance is no guarantee of future results, and current performance may be higher or lower than the performance shown above.
How did the markets perform during the Fund’s fiscal period?
| ¢ | During the period from the Fund’s inception date (March 24, 2015) through September 30, 2015, global equity markets in general were volatile and produced negative returns for investors. The key themes dominating investors’ sentiment were concerns about global growth and capital expenditure which weighed on many stocks, in particular those with industrial exposure. There was very much a risk-off approach from investors as they avoided the most cyclical sectors. |
| ¢ | Specific issues that caused investors concern included worries about a hard landing in China (i.e., poor GDP, poor manufacturing data, etc.), the Fed agonizing over interest rate rises (thus not sending a sign of confidence in the global economy), the stalemate on the Greek bailout for a time, and currency volatility (especially emerging market currencies). |
| ¢ | During the period in question, emerging markets significantly underperformed their developed peers. In addition, a number of relevant sectors for the strategy including energy, materials (commodities, |
both industrial and soft), and infrastructure performed poorly versus the broader market. |
What factors affected the Fund’s performance during its fiscal period?
| ¢ | The Fund outperformed the S&P Global Natural Resources Index (net), the Fund’s style-specific benchmark, during the period due to the high exposure in the Index to energy and industrial commodity stocks. Both of these types of stocks were negatively impacted by the slump in oil prices and weaker commodity prices on the back of investors’ concerns about global growth (with Chinese growth concerns the dominant topic). The Fund had limited to no direct exposure to oil or industrial commodities. |
| ¢ | For the period, the Fund’s energy solutions strategy was the worst performing sector versus the S&P Global Natural Resources Index, followed by the agribusiness strategy, with the water strategy the best performer against this index. Within the Fund, the strategies remained broadly equally weighted as of the end of the period (allowing for market movements). |
| ¢ | In light of the conditions discussed in the general market commentary, the strategy underperformed the broader based U.S. dollar denominated equity index. Some of the underperformance can be attributed to currency translation from local currencies back into U.S. dollars. The rest of the underperformance versus the broad-based equity index can be attributable at a sub-strategy level: |
Water: the exposure to water infrastructure stocks and capital expenditure-dependent industrial water stocks impacted performance versus the broad market index. Infrastructure is an important theme within the water strategy as the increasing need for both the rehabilitation of existing aged infrastructure and investment in new infrastructure to meet the growing needs of an expanding population. We are still confident that that the water strategy represents excellent value versus the broader market, with the underlying water stocks trading at valuation levels not seen for a decade. The portfolio is positioned to benefit from spending in the U.S. non-residential and residential construction sectors, global municipal water infrastructure spending, and technological developments to alleviate water scarcity.
Agribusiness: the portfolio has exposure to soft commodity prices, which due to three years of bumper harvest have fallen. This has impacted farmer incomes and also the companies providing many of the inputs necessary for these farmers to produce. While this year’s weather has been more conducive to lower yields (thus supporting soft commodity prices), the yields will still be above historic averages. Also, the agribusiness strategy has the highest exposure to emerging markets of the three strategies underlying the Fund. Given the weakness of emerging markets (and their currencies), this has negatively impacted the performance of the strategy versus the broader market index. We play the full agribusiness value-chain (farm to fork), and thus in the current market environment we position ourselves downstream towards agribusiness infrastructure and processors.
Energy Solutions: declining oil prices negatively impacted sentiment towards renewable energy holdings, the most overweight sector within the energy solutions strategy. This was despite a robust earnings season which saw many solar companies in particular raise their annual guidance. Leveraged renewable energy stocks also struggled as fears over deteriorating financing conditions weighed across the group. We remain positive on the solar sector given the cost reduction for installation and the ever-shortening payback period for solar projects, China’s planned spend on solar capacity over the next five years, and the short-term impetus to invest in renewable due to the expiration of the federal U.S. investment tax credits for this area in 2016. Within energy solutions, we do not limited ourselves to just the renewable sector (wind, solar, etc.), we also invest in energy efficiency (electric grid efficiency, low energy building, and transportation technology, etc.) and utilities (including yield companies).
The preceding information is the opinion of portfolio management. Any such opinions are subject to change at any time based upon market or other conditions and should not be relied upon as investment advice. Past performance is no guarantee of future results and there is no guarantee market forecasts will be realized.
There is no guarantee that the Fund will meet its objectives.
For information regarding the indexes and certain investment terms, see the Key Investment Terms starting on page 4.
11
Table of Contents
| Essential Resources Fund (Continued) |
Equity Securities: The market price of equity securities may be adversely affected by financial market, industry, or issuer-specific events. Focus on a particular style or on small or medium-sized companies may enhance that risk.
Foreign & Emerging Markets: Investing internationally, especially in emerging markets, involves additional risks such as currency, political, accounting, economic, and market risk.
Industry/Sector Concentration: A fund that focuses its investments in a particular industry or sector will be more sensitive to conditions that affect that industry or sector than a non-concentrated fund.
Prospectus: For additional information on risks, please see the fund’s prospectus.
| Asset Allocation | ||||
The following table presents asset allocations within certain sectors and as a percentage of total investments as of September 30, 2015.
|
| |||
Industrials | 33 | % | ||
Consumer Staples | 14 | |||
Utilities | 14 | |||
Materials | 12 | |||
Information Technology | 11 | |||
Energy | 5 | |||
Financials | 5 | |||
Other (includes short-term investments) | 6 | |||
|
| |||
Total | 100 | % | ||
|
| |||
For information regarding the indexes and certain investment terms, see the Key Investment Terms starting on page 4.
12
Table of Contents
Essential Resources Fund (Continued)
| Average Annual Total Returns1 for periods ended 9/30/15 | ||||||||
| Since Inception | Inception Date | |||||||
| Class A Shares at NAV2 | -19.60 | % | 3/24/15 | |||||
| Class A Shares at POP3,4 | -24.22 | 3/24/15 | ||||||
| Class C Shares at NAV2 | -19.90 | 3/24/15 | ||||||
| Class C Shares with CDSC4 | -20.70 | 3/24/15 | ||||||
| Class I Shares at NAV2 | -19.50 | 3/24/15 | ||||||
| S&P 500® Index | -7.20 | 5 | — | |||||
| S&P Global Natural Resources Index (net) | -24.31 | 5 | — | |||||
Fund Expense Ratios6: A Shares: Gross 2.35%, Net 1.65%; C Shares: Gross 3.10%, Net 2.40%; I Shares: Gross 2.10%, Net 1.40%.
All returns represent past performance which is no guarantee of future results. Current performance may be higher or lower than the performance shown. The investment return and principal value of an investment will fluctuate so that an investor’s shares, when redeemed, may be worth more or less than their original cost. The above table and graph below do not reflect the deduction of taxes that a shareholder would pay on fund distributions or the redemption of shares. Please visit Virtus.com for performance data current to the most recent month-end.
| 1 | Total returns are historical and include changes in share price and the reinvestment of both dividends and capital gains distributions. |
| 2 | “NAV” (Net Asset Value) total returns do not include the effect of any sales charge. |
| 3 | “POP” (Public Offering Price) total returns include the effect of the maximum front-end 5.75% sales charge. |
| 4 | “CDSC” (Contingent Deferred Sales Charge) is applied to redemptions of certain classes of shares that do not have a sales charge applied at the time of purchase. CDSC charges for certain redemptions of Class A shares made within 18 months of purchase in which a finder’s fee was paid and all redemptions of Class C shares within the first year are 1% and 0% thereafter. |
| 5 | The since inception index returns are from the Fund’s inception date. |
| 6 | The expense ratios of the Fund are set forth according to the prospectus for the Fund effective March 23, 2015, as supplemented and revised and may differ from the expense ratios disclosed in the Financial Highlights tables in this report. See the Financial Highlights for more current expense ratios. Net Expense: Expenses reduced by a contractual fee waiver in effect through January 31, 2017. Gross Expense: Does not reflect the effect of the fee waiver. |
Growth of $10,000 For periods ended 9/30
This chart assumes an initial investment of $10,000 made on March 24, 2015 (inception date of the Fund) for Class A, Class C, and Class I shares including any applicable sales charges or fees. Performance assumes reinvestment of dividends and capital gain distributions.
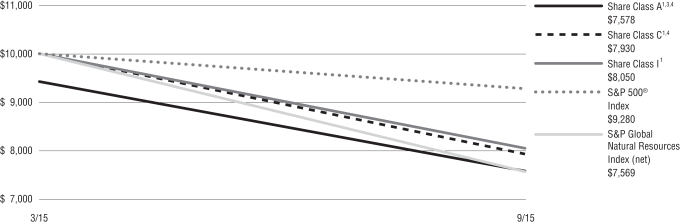
The indexes are unmanaged and not available for direct investment; therefore, their performance does not reflect the expenses associated with active management of an actual portfolio.
For information regarding the indexes and certain investment terms, see the Key Investment Terms starting on page 4.
13
Table of Contents
Fund Summary | Ticker Symbols: Class A: PHCHX Class B: PHCCX Class C: PGHCX Class I: PHCIX |
Portfolio Manager Commentary by Newfleet Asset Management, LLC
| ¢ | The Fund is diversified and has a primary investment objective of high current income and a secondary objective of capital growth. |
| ¢ | For the fiscal year ended September 30, 2015, the Fund’s Class A shares at NAV returned -3.39%, Class B shares returned -3.96%, and Class C shares returned -3.93%. Class I shares returned -3.15%. For the same period, the Barclays U.S. Aggregate Bond Index, a broad-based fixed income index, returned 2.94%, and the Barclays U.S. High-Yield 2% Issuer Capped Bond Index, the Fund‘s style-specific index appropriate for comparison, returned -3.40%. |
All performance figures assume reinvestment of distributions and exclude the effect of sales charges. Past performance is no guarantee of future results, and current performance may be higher or lower than the performance shown above.
How did the market perform during the Fund’s fiscal year?
| ¢ | The U.S. high yield market, as measured by the Barclays U.S. High-Yield 2% Issuer Capped Bond Index, delivered a -3.40% return for the fiscal year ended September 30, 2015. Volatility crept back into the high yield market along with the market becoming more bifurcated over the year. The watershed event was when OPEC decided in late November 2014 not to cut oil production, and from that point on energy credits behaved completely differently than the rest of the market. Up to that point energy credits traded right on top of the high yield universe based on price/yield/spread, but from that point on issuers traded more on idiosyncratic factors as the underlying commodity plunged more than 50% in price. The energy complex was down more than 21% over the past year with independent (exploration and production) and oil field services industries hit the hardest. |
| ¢ | Returns, across the ratings spectrum, displayed further proof that investors were searching for ways to reduce beta and move up in credit quality over the past year. Higher quality outperformed over the year as BB-rated credits led the way by delivering an almost flat return of -0.04%. As you |
move down in credit quality, the returns worsen: B-rated credits returned -4.08%, CCCs -8.75%, and Distressed -57.00%. Even within each rating tier, returns were diverse, indicating that idiosyncratic risk has risen considerably and credit picking to be imperative to delivering alpha. |
| ¢ | Outside of the energy and metals & mining industries, fundamentals remained strong yet there was some slight slippage as top-line revenue growth was anemic. Leverage ticked up slightly, as companies looked to raise capital for M&A transactions or other shareholder-friendly activities like stock buybacks or dividends. That said, leverage ratios were still below levels seen just prior to the onset of the 2008 financial crisis and interest coverage rates remained very strong. From a technical perspective, flows were very directional and volatile over the fiscal year. For the full fiscal year outflows dominated, yet within the year itself there were long periods where strong inflows were the norm. New issuance was very strong up until this past summer when volumes considerably slowed. A more recent trend was for issuers to use new issuance proceeds primarily for M&A transactions, although secondarily we saw more shareholder-friendly actions. |
What factors affected the Fund’s performance during its fiscal year?
| ¢ | The weak performance of the high yield sector significantly contributed to the Fund’s negative return for the year. The Fund was overweight the energy space prior to OPEC’s announcement in the fourth quarter of 2014, which was very detrimental to the Fund’s performance. The Fund scaled back its exposure to the energy complex over the fiscal year, helping to mitigate the earlier damage. |
| ¢ | Positive contributors to Fund performance during the year were issue selection within high yield, along with some of our conscientious overweights/underweights within certain industries. The Fund benefited from strong issue selection within the gaming, paper, technology, and other industrial industries; these are all industries in which the Fund held overweight positions. The Fund continued its conscious bet to be significantly underweight the metals & mining industry, which added alpha to the portfolio as that industry continued to underperform due to the weak economic data flowing out of China. |
| ¢ | Detractors from Fund performance were poor issue selection within the electric utilities, supermarkets, and the energy complex. Portfolio management had negative views on each of these industries, believing there were limited catalysts to lift performance to the upside, and so was underweight all three industries. |
The preceding information is the opinion of portfolio management. Any such opinions are subject to change at any time based upon market or other conditions and should not be relied upon as investment advice. Past performance is no guarantee of future results, and there is no guarantee that market forecasts will be realized.
There is no guarantee that the Fund will meet its objectives.
Credit & Interest: Debt securities are subject to various risks, the most prominent of which are credit and interest rate risk. The issuer of a debt security may fail to make interest and/or principal payments. Values of debt securities may rise or fall in response to changes in interest rates, and this risk may be enhanced with longer-term maturities.
High Yield-High Risk Fixed Income Securities: There is a greater level of credit risk and price volatility involved with high yield securities than investment grade securities.
Foreign Investing: Investing internationally involves additional risks such as currency, political, accounting, economic, and market risk.
Industry/Sector Concentration: A fund that focuses its investments in a particular industry or sector will be more sensitive to conditions that affect that industry or sector than a non-concentrated fund.
Prospectus: For additional information on risks, please see the fund’s prospectus.
For information regarding the indexes and certain investment terms, see the Key Investment Terms starting on page 4.
14
Table of Contents
| High Yield Fund (Continued) |
| Asset Allocation | ||||||||
The following table presents asset allocations within certain sectors as a percentage of total investments as of September 30, 2015.
|
| |||||||
Corporate Bonds and Notes | 82 | % | ||||||
Consumer Discretionary | 23 | % | ||||||
Health Care | 15 | |||||||
Financials | 9 | |||||||
Telecommunication Services | 8 | |||||||
Energy | 8 | |||||||
Industrials | 7 | |||||||
Materials | 6 | |||||||
All other Corporate Bonds and Notes | 6 | |||||||
Loan Agreements | 11 | |||||||
Other (includes short-term investments) | 7 | |||||||
|
| |||||||
Total | 100 | % | ||||||
|
| |||||||
For information regarding the indexes and certain investment terms, see the Key Investment Terms starting on page 4.
15
Table of Contents
High Yield Fund (Continued)
| Average Annual Total Returns1 for periods ended 9/30/15 | ||||||||||||||||||||
| 1 year | 5 years | 10 years | Since Inception | Inception Date | ||||||||||||||||
| Class A Shares at NAV2 | -3.39 | % | 5.41 | % | 4.78 | % | — | — | ||||||||||||
| Class A Shares at POP3,4 | -7.01 | 4.61 | 4.38 | — | — | |||||||||||||||
| Class B Shares at NAV2 | -3.96 | 4.63 | 4.02 | — | — | |||||||||||||||
| Class B Shares with CDSC4 | -7.62 | 4.63 | 4.02 | — | — | |||||||||||||||
| Class C Shares at NAV2 and with CDSC4 | -3.93 | 4.63 | 4.03 | — | — | |||||||||||||||
| Class I Shares at NAV2 | -3.15 | — | — | 4.13 | % | 8/8/12 | ||||||||||||||
| Barclays U.S. Aggregate Bond Index | 2.94 | 3.10 | 4.64 | 1.85 | 5 | — | ||||||||||||||
| Barclays U.S. High-Yield 2% Issuer Capped Bond Index | -3.40 | 6.14 | 7.26 | 3.97 | 5 | — | ||||||||||||||
Fund Expense Ratios6: A Shares: Gross 1.31%, Net 1.15% B Shares: Gross 2.06%, Net 1.90% C Shares: Gross 2.06%, Net 1.90% Class I: Gross 1.06% Net 0.90%.
All returns represent past performance which is no guarantee of future results. Current performance may be higher or lower than the performance shown. The investment return and principal value of an investment will fluctuate so that an investor’s shares, when redeemed, may be worth more or less than their original cost. The above table and graph below do not reflect the deduction of taxes that a shareholder would pay on fund distributions or the redemption of shares. Please visit Virtus.com for performance data current to the most recent month-end.
| 1 | Total returns are historical and include changes in share price and the reinvestment of both dividends and capital gains distributions. |
| 2 | “NAV” (Net Asset Value) total returns do not include the effect of any sales charge. |
| 3 | “POP” (Public Offering Price) total returns include the effect of the maximum front-end 3.75% sales charge. |
| 4 | “CDSC” (Contingent Deferred Sales Charge) is applied to redemptions of certain classes of shares that do not have a sales charge applied at the time of purchase. CDSC charges for B shares decline from 5% to 0% over a five-year period. CDSC charges for certain redemptions of Class A shares made within 18 months of purchase in which a finder’s fee was paid and all redemptions of Class C shares within the first year are 1% and 0% thereafter. |
| 5 | The since inception index returns are from the inception date of Class I. |
| 6 | The expense ratios of the Fund are set forth according to the prospectus for the Fund effective January 28, 2015, as supplemented and revised, and may differ from the expense ratios disclosed in the Financial Highlights tables in this report. See the Financial Highlights for more current expense ratios. Net Expense: Expenses reduced by contractual fee waiver in effect through January 31, 2017. For the period of October 1, 2014 through August 31, 2015, the waiver was voluntary. Gross Expense: Does not reflect the effect of the fee waiver. |
Growth of $10,000 For periods ended 9/30
This chart assumes an initial investment of $10,000 made on September 30, 2005, for Class A, Class B, and Class C shares including any applicable sales charges or fees. Performance assumes reinvestment of dividends and capital gain distributions.
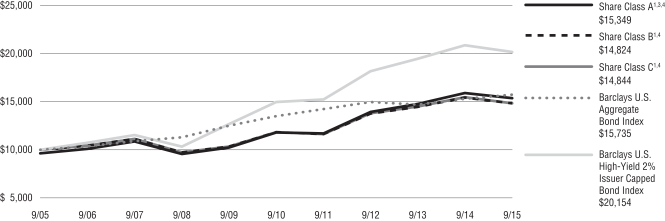
The indexes are unmanaged and not available for direct investment; therefore, their performance does not reflect the expenses associated with active management of an actual portfolio.
For information regarding the indexes and certain investment terms, see the Key Investment Terms starting on page 4.
16
Table of Contents
Fund Summary | Ticker Symbols: Class A: VLVAX Class C: VLVCX Class I: VLVIX |
Portfolio Manager Commentary by Rampart Investment Management Company, LLC
| ¢ | The Fund is diversified and has an investment objective of capital appreciation with lower volatility than U.S. equity markets over a full market cycle. |
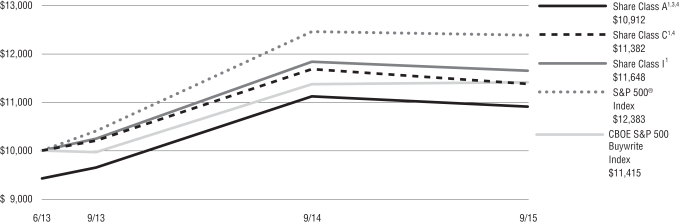
| ¢ | For the fiscal year ended September 30, 2015, the Fund’s Class A shares at NAV returned -1.88%, Class C shares returned -2.61%, and Class I shares returned -1.57%. For the same period, the CBOE S&P 500 Buywrite Index, a broad-based fixed equity index returned 0.36%, and S&P 500® Index the Fund’s style-specific benchmark appropriate for comparison returned -0.61%. |
All performance figures assume reinvestment of distributions and exclude the effect of sales charges. Past performance is no guarantee of future results, and current performance may be higher or lower than the performance shown above.
How did the Markets perform during the Fund’s fiscal year?
| ¢ | During the Fund’s fiscal year, the U.S. equity markets were down slightly. For the majority of the year, the market continued to grind higher but there were a few weeks where it experienced sharp drawdowns. The largest drawdown over the period occurred August 17-25, 2015. During these days the market lost over 11% in value. |
| ¢ | Since the Fund compares its performance to the S&P 500® Index, U.S. and global macro risks will affect how both the Fund and its benchmark perform. In December 2014, there were several worrisome factors affecting the markets from political turmoil in Greece and China’s move to tighten lending requirements. Then, throughout 2015 there was constant chatter on the Fed outlook and potential path of raising interest rates and how that will affect a global economy which has had a growing concern of slowing. Finally, as we got midway through August, it appeared as if a large number of potential risks ultimately came to a head. There were currency sell-offs in multiple countries, anxiety over emerging market performance, weak inflation numbers, and the Fed signaled additional uncertainty of its forecast on the U.S. and global economic outlook. |
What factors affected the Fund’s performance during its fiscal year?
| ¢ | The Fund’s performance was negatively impacted from its allocation to the larger-capitalization stocks in the S&P 500® Index. The equity portion was invested in the S&P 100® Index, which incurred a loss of 1.78% over the fiscal year ended September 30, 2015, while the S&P 500® Index incurred a loss of 0.61%. |
| ¢ | One of the strategies the Fund utilizes is selling calls on the S&P 500® Index to generate income. Some or all of this income is then used to purchase a negatively correlated investment, which can rise in value when the S&P 500® Index falls. Over the past 12 months, the Fund’s participation in this strategy was able to help its overall performance by 0.40%. |
| ¢ | The primary defensive investment for this Fund is done by purchasing call options on the futures contract of the CBOE Volatility Index® (VIX®). The VIX® options that the Fund purchases are meant to protect the Fund if the market experiences a sudden and violent move down. The Fund bought VIX® options for each month, and of the 12 VIX® option purchases, three of the 12 expiration periods realized gains. These gains created a net gain for the Fund of 2.10%. |
The preceding information is the opinion of portfolio management. Any such opinions are subject to change at any time based upon market or other conditions and should not be relied upon as investment advice. Past performance is no guarantee of future results and there is no guarantee market forecasts will be realized.
There is no guarantee that the Fund will meet its objectives.
Equity Securities: The market price of equity securities may be adversely affected by financial market, industry, or issuer-specific events. Focus on a particular style or on small or medium-sized companies may enhance that risk.
Exchange Traded Funds: The value of an ETF may be more volatile than the underlying portfolio of securities the ETF is designed to track. The costs of owning the ETF may exceed the cost of investing directly in the underlying securities.
Call Options: Selling call options may limit a fund’s opportunity to profit from the increase in price of its underlying portfolio. Buying call options risks the loss of the premium paid for those options.
Prospectus: For additional information on risks, please see the fund’s prospectus.
| Asset Allocation | ||||
The following table presents asset allocations within certain sectors and as a percentage of total investments as of September 30, 2015.
|
| |||
Exchange Traded Funds | 99 | % | ||
Other (includes short-term investments) | 1 | |||
|
| |||
Total | 100 | % | ||
|
| |||
For information regarding the indexes and certain investment terms, see the Key Investment Terms starting on page 4.
17
Table of Contents
Low Volatility Equity Fund (Continued)
| Average Annual Total Returns1 for periods ended 9/30/15 | ||||||||||||
| 1 year | Since Inception | Inception Date | ||||||||||
| Class A Shares at NAV2 | -1.88 | % | 6.57 | % | 6/11/13 | |||||||
| Class A Shares at POP3,4 | -7.52 | 3.86 | 6/11/13 | |||||||||
| Class C Shares at NAV2 and with CDSC4 | -2.61 | 5.78 | 6/11/13 | |||||||||
| Class I Shares at NAV2 | -1.57 | 6.84 | 6/11/13 | |||||||||
| CBOE S&P 500 Buywrite Index | 0.36 | 5.91 | 5 | — | ||||||||
S&P 500® Index | -0.61 | 9.72 | 5 | — | ||||||||
Fund Expense Ratios6: A Shares: Gross 6.35%, Net 1.55%; C Shares: Gross 7.10%, Net 2.30%; I Shares: Gross 6.10%, Net 1.30%.
All returns represent past performance which is no guarantee of future results. Current performance may be higher or lower than the performance shown. The investment return and principal value of an investment will fluctuate so that an investor’s shares, when redeemed, may be worth more or less than their original cost. The above table and graph below do not reflect the deduction of taxes that a shareholder would pay on fund distributions or the redemption of shares. Please visit Virtus.com for performance data current to the most recent month-end.
| 1 | Total returns are historical and include changes in share price and the reinvestment of both dividends and capital gains distributions. |
| 2 | “NAV” (Net Asset Value) total returns do not include the effect of any sales charge. |
| 3 | “POP” (Public Offering Price) total returns include the effect of the maximum front-end 5.75% sales charge. |
| 4 | “CDSC” (Contingent Deferred Sales Charge) is applied to redemptions of certain classes of shares that do not have a sales charge applied at the time of purchase. CDSC charges for certain redemptions of Class A shares made within 18 months of purchase in which a finder’s fee was paid and all redemptions of Class C shares within the first year are 1% and 0% thereafter. |
| 5 | The since inception index returns are from the Fund’s inception date. |
| 6 | The expense ratios of the Fund are set forth according to the prospectus for the Fund effective January 28, 2015, as supplemented and revised and may differ from the expense ratios disclosed in the Financial Highlights tables in this report. See the Financial Highlights for more current expense ratios. Net Expense: Expenses reduced by a contractual fee waiver in effect through January 31, 2017. For the period of October 1, 2014 through August 31, 2015, the waiver was voluntary. Gross Expense: Does not reflect the effect of the fee waiver. |
Growth of $10,000 For periods ended 9/30
This chart assumes an initial investment of $10,000 made on June 11, 2013 (inception date of the Fund), for Class A, Class C, and Class I shares including any applicable sales charges or fees. Performance assumes reinvestment of dividends and capital gain distributions.
The indexes are unmanaged and not available for direct investment; therefore, their performance does not reflect the expenses associated with active management of an actual portfolio.
For information regarding the indexes and certain investment terms, see the Key Investment Terms starting on page 4.
18
Table of Contents
Multi-Sector Intermediate Bond Fund
Fund Summary | Ticker Symbols: Class A: NAMFX Class B: NBMFX Class C: NCMFX Class I: VMFIX Class R6: VMFRX |
Portfolio Manager Commentary by Newfleet Asset Management, LLC
| ¢ | The Fund is diversified and has an investment objective of maximizing current income while preserving capital. |
| ¢ | For the fiscal year ended September 30, 2015, the Fund’s Class A shares at NAV returned -3.41%, Class B shares returned -4.14%, Class C shares returned -4.11%, and Class I shares returned -3.17%. Class R6 shares from November 12, 2014 (inception date) through September 30, 2015, returned -3.31%*. For the fiscal year, the Barclays U.S. Aggregate Bond Index, which is both the Fund’s broad-based and style-specific fixed income index, returned 2.94%. |
| * | Returns less than 1 year are not annualized. |
All performance figures assume reinvestment of distributions and exclude the effect of sales charges. Past performance is no guarantee of future results, and current performance may be higher or lower than the performance shown above.
How did the market perform during the Fund’s fiscal year?
| ¢ | Most spread sectors underperformed U.S. Treasuries during the fiscal year. Plummeting oil prices dominated market volatility and investor concerns in the first half of the fiscal year, especially during the fourth quarter of 2014. Brent crude, the international benchmark for oil prices, fell about 50% between September 2014 (when the price was roughly $93 a barrel) and September 2015, ending the period at roughly $47 a barrel. Brent crude oil hit a 12-month low of roughly $40 a barrel on August 24, 2015. |
| ¢ | Globally, concerns over slowing growth in China and the Greek debt crisis weighed on the fixed income markets. A looming U.S. Federal Reserve (“Fed”) rate hike, with negative implications for capital flows and debt financing, added to the turmoil, with some emerging market central banks (unlike the International Monetary Fund and the World Bank) calling for the Fed to raise rates and remove the uncertainty that could prove to be more harmful than the actual impact. |
| ¢ | The waiting game for the Fed to raise interest rates from their near-zero level maintained since December 2008 continued through the end of the fiscal year. As of its September 17 meeting, the Fed decided to leave its benchmark rate unchanged, balancing relatively strong U.S. growth and labor market conditions against a lack of inflation, a strengthening U.S. dollar, and a shaky global economy. |
| ¢ | Over the last 12 months, yields increased on the short end of the U.S. Treasury curve and decreased on the intermediate to long end, and the curve flattened overall. |
What factors affected the Fund’s performance during its fiscal year?
| ¢ | The outperformance of U.S. Treasuries and agency mortgages relative to most fixed income spread sectors was the key driver of the Fund’s underperformance for the fiscal year. |
| ¢ | Among fixed income sectors, the Fund’s allocation to structured products – asset-backed securities, commercial mortgage-backed securities, and non-agency residential mortgages – were positive contributors to performance for the fiscal year. |
| ¢ | During the fiscal year, the Fund’s allocation to non-U.S. dollar, corporate high yield, and emerging markets debt detracted from performance. |
The preceding information is the opinion of portfolio management. Any such opinions are subject to change at any time based upon market or other conditions and should not be relied upon as investment advice. Past performance is no guarantee of future results, and there is no guarantee that market forecasts will be realized.
There is no guarantee that the Fund will meet its objective.
Credit & Interest: Debt securities are subject to various risks, the most prominent of which are credit and interest rate risk. The issuer of a debt security may fail to make interest and/or principal payments. Values of debt securities may rise or fall in response to changes in interest rates, and this risk may be enhanced with longer-term maturities.
Foreign & Emerging Markets: Investing internationally, especially in emerging markets,
involves additional risks such as currency, political, accounting, economic, and market risk.
High Yield-High Risk Fixed Income Securities: There is a greater level of credit risk and price volatility involved with high yield securities than investment grade securities.
ABS/MBS: Changes in interest rates can cause both extension and prepayment risks for asset- and mortgage-backed securities. These securities are also subject to risks associated with the repayment of underlying collateral.
Bank Loans: Loans may be unsecured or not fully collateralized, may be subject to restrictions on resale and/or trade infrequently on the secondary market. Loans can carry significant credit and call risk, can be difficult to value and have longer settlement times than other investments, which can make loans relatively illiquid at times.
Prospectus: For additional information on risks, please see the fund’s prospectus.
| Asset Allocation | ||||||||
The following table presents asset allocations within certain sectors and as a percentage of total investments as of September 30, 2015.
|
| |||||||
Corporate Bonds and Notes | 54 | % | ||||||
Financials | 16 | % | ||||||
Energy | 9 | |||||||
Consumer Discretionary | 8 | |||||||
Industrials | 5 | |||||||
All other Corporate Bonds and Notes | 16 | |||||||
Mortgage-Backed Securities | 16 | |||||||
Loan Agreements | 11 | |||||||
Asset-Backed Securities | 5 | |||||||
Foreign Government Securities | 4 | |||||||
Other (includes short-term investments) | 10 | |||||||
|
| |||||||
Total | 100 | % | ||||||
|
| |||||||
For information regarding the indexes and certain investment terms, see the Key Investment Terms starting on page 4.
19
Table of Contents
Multi-Sector Intermediate Bond Fund (Continued)
| Average Annual Total Returns1 for periods ended 9/30/15 | ||||||||||||||||||||
| 1 year | 5 years | 10 years | Since Inception | Inception Date | ||||||||||||||||
| Class A Shares at NAV2 | -3.41 | % | 4.30 | % | 5.36 | % | — | — | ||||||||||||
| Class A Shares at POP3,4 | -7.03 | 3.51 | 4.96 | — | — | |||||||||||||||
| Class B Shares at NAV2 | -4.14 | 3.52 | 4.57 | — | — | |||||||||||||||
| Class B Shares with CDSC4 | -7.79 | 3.52 | 4.57 | — | — | |||||||||||||||
| Class C Shares at NAV2 and with CDSC4 | -4.11 | 3.53 | 4.59 | — | — | |||||||||||||||
| Class I Shares at NAV | -3.17 | 4.60 | — | 6.33 | % | 10/1/09 | ||||||||||||||
| Class R6 Shares at NAV | — | — | — | -3.31 | 11/12/14 | |||||||||||||||
| Barclays U.S. Aggregate Bond Index | 2.94 | 3.10 | 4.64 | — | 5 | — | ||||||||||||||
Fund Expense Ratios6: A Shares: 1.11%, B Shares: 1.86%, C Shares: 1.86%, I Shares: 0.86%, R6 Shares: 0.79%.
All returns represent past performance which is no guarantee of future results. Current performance may be higher or lower than the performance shown. The investment return and principal value of an investment will fluctuate so that an investor’s shares, when redeemed, may be worth more or less than their original cost. The above table and graph below do not reflect the deduction of taxes that a shareholder would pay on fund distributions or the redemption of shares. Please visit Virtus.com for performance data current to the most recent month-end.
| 1 | Total returns are historical and include changes in share price and the reinvestment of both dividends and capital gains distributions. |
| 2 | “NAV” (Net Asset Value) total returns do not include the effect of any sales charge. |
| 3 | “POP” (Public Offering Price) total returns include the effect of the maximum front-end 3.75% sales charge. |
| 4 | “CDSC” (Contingent Deferred Sales Charge) is applied to redemptions of certain classes of shares that do not have a sales charge applied at the time of purchase. CDSC charges for B shares decline from 5% to 0% over a five-year period. CDSC charges for certain redemptions of Class A shares made within 18 months of purchase in which a finder’s fee was paid and all redemptions of Class C shares within the first year are 1% and 0% thereafter. |
| 5 | The index returned 3.86 for Class I shares and 2.03% for Class R6 shares since the inception date of the respective share class. |
| 6 | The expense ratios of the Fund are set forth according to the prospectus for the Fund effective January 28, 2015, as supplemented and revised, and may differ from the expense ratios disclosed in the Financial Highlights tables in this report. See the Financial Highlights for more current expense ratios. |
Growth of $10,000 For periods ended 9/30
This chart assumes an initial investment of $10,000 made on September 30, 2005, for Class A, Class B, and Class C shares including any applicable sales charges or fees. Performance assumes reinvestment of dividends and capital gain distributions.
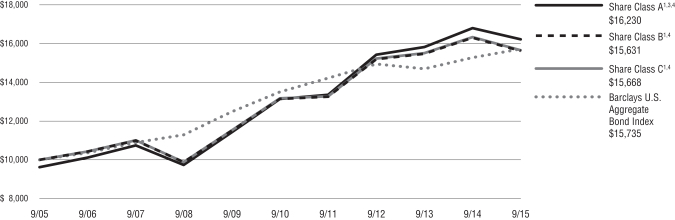
The index is unmanaged and not available for direct investment; therefore, its performance does not reflect the expenses associated with active management of an actual portfolio.
For information regarding the indexes and certain investment terms, see the Key Investment Terms starting on page 4.
20
Table of Contents
Fund Summary | Ticker Symbols: Class A: PSFRX Class C: PFSRX Class I: PSFIX |
Portfolio Manager Commentary by Newfleet Asset Management, LLC
| ¢ | The Fund is diversified and has an investment objective of high total return from both current income and capital appreciation. |
| ¢ | For the fiscal year ended September 30, 2015, the Fund’s Class A shares at NAV returned 0.53%, Class C shares returned -0.22%, and Class I shares returned 0.78%. For the same period, the Barclays U.S. Aggregate Bond Index, a fixed income index, returned 2.94%, and the S&P/LSTA Leveraged Loan Index, the Fund’s style-specific benchmark, returned 0.92%. |
All performance figures assume reinvestment of distributions and exclude the effect of sales charges. Past performance is no guarantee of future results, and current performance may be higher or lower than the performance shown above.
How did the markets perform during the Fund’s fiscal year?
| ¢ | Bank loans generated positive but modest returns over the past year with a total return of 0.92% according to the S&P/LSTA Leveraged Loan Index, as performance was uneven over the past year on a quarterly basis mainly due to oil and commodity concerns. The loan market posted solid returns in the middle two quarters of the past year on strong technicals. This was due to strong collateralized loan obligation (“CLO”) issuance and limited net supply being partially offset by losses in the first and last quarter of the past year due to energy and commodity-related issues. Bank loans outperformed most other higher beta fixed income sectors (high yield and emerging market debt) due to strong technicals that insulated the asset class from the broader market volatility. This was evident in the much lower return volatility within the asset class over the past year relative to high yield. Bank loans underperformed most higher quality and longer duration fixed income sectors, as rates fell over the past year. |
| ¢ | Higher quality loans outperformed over the past year in light of the increased volatility, with BB and single B-rated credit tiers leading the way. The distressed sector and CCC/Split CCC-rated loans underperformed. |
| ¢ | Technicals remained solid throughout the year on strong institutional demand and low net new loan |
issuance, although we have seen some recent weakening in these trends. CLO issuance totaled over $100 billion over the last four quarters and provided a solid bid for higher quality loans. CLO issuance fell in the third quarter of 2015 to the lowest quarterly volume since 2013; however, FY15 issuance remains on track to be the second largest year behind 2014. Retail mutual fund outflows generally ebbed over the past year while remaining negative but manageable in the context of strong CLO demand and limited new supply. The recent uptick in loan outflows due to increased market volatility bears monitoring but could turn when the Fed eventually raises rates and as investors refocus on rate risk. |
| ¢ | Despite some pockets of weakness in certain industries including the energy and metals & mining industries, fundamentals in the bank loan market remain strong as defaults, by number of Issuers, increased modestly to 0.77% as of the end of September 2015, from 0.64% at of the end of September 2014. Defaults remained below the long-term average of approximately 2.8%. We would expect defaults to increase over the next year given stress in the energy industry, the more restrictive regulatory environment, and growing lower-rated issuance as the credit cycle ages. |
What factors affected the Fund’s performance during its fiscal year?
| ¢ | The positive return of the U.S. leveraged loan market contributed to the Fund’s positive return during the year. |
| ¢ | Overall, positive issue selection and industry allocation relative to the Fund’s benchmark benefited performance. Performance was strong in the utility, healthcare, and gaming industries, while performance lagged in the energy, broadcasting, and technology industries. |
| ¢ | Overall, a modest overweight to higher quality tiers with an underweight to the lower quality and distressed credit tiers contributed positively to performance relative to the Index. Remaining nearly fully invested also added to performance. The Fund’s out-of-index sector allocation to high yield, which is part of the Fund’s liquidity strategy, negatively contributed to performance as high yield underperformed loans over the past year. |
The preceding information is the opinion of portfolio management. Any such opinions are subject to change at any time based upon market or other
conditions and should not be relied upon as investment advice. Past performance is no guarantee of future results, and there is no guarantee that market forecasts will be realized.
There is no guarantee that the Fund will meet its objective.
Credit & Interest: Debt securities are subject to various risks, the most prominent of which are credit and interest rate risk. The issuer of a debt security may fail to make interest and/or principal payments. Values of debt securities may rise or fall in response to changes in interest rates, and this risk may be enhanced with longer-term maturities.
Bank Loans: Loans may be unsecured or not fully collateralized, may be subject to restrictions on resale and/or trade infrequently on the secondary market. Loans can carry significant credit and call risk, can be difficult to value and have longer settlement times than other investments, which can make loans relatively illiquid at times.
High Yield-High Risk Fixed Income Securities: There is a greater level of credit risk and price volatility involved with high yield securities than investment grade securities.
Leverage: When a fund leverages its portfolio, the value of its shares may be more volatile and all other risks may be compounded.
Liquidity: Certain securities may be difficult to sell at a time and price beneficial to the fund.
Prospectus: For additional information on risks, please see the fund’s prospectus.
| Asset Allocation | ||||||||
The following table presents asset allocations within certain sectors and as a percentage of total investments as of September 30, 2015.
|
| |||||||
Loan Agreements | 94 | % | ||||||
Consumer Discretionary | 29 | % | ||||||
Health Care | 16 | |||||||
Industrials | 12 | |||||||
Information Technology | 9 | |||||||
Materials | 8 | |||||||
Financials | 6 | |||||||
All Other Loan Agreements | 14 | |||||||
Corporate Bonds and Notes | 5 | |||||||
Affiliated Mutual Fund | 1 | |||||||
|
| |||||||
Total | 100 | % | ||||||
|
| |||||||
For information regarding the indexes and certain investment terms, see the Key Investment Terms starting on page 4.
21
Table of Contents
Senior Floating Rate Fund (Continued)
| Average Annual Total Returns1 for periods ended 9/30/15 | ||||||||||||||||
| 1 year | 5 years | Since Inception | Inception Date | |||||||||||||
| Class A Shares at NAV2 | 0.53 | % | 4.10 | % | 4.92 | % | 1/31/08 | |||||||||
| Class A Shares at POP3,4 | -2.23 | 3.53 | 4.54 | 1/31/08 | ||||||||||||
| Class C Shares at NAV2 and with CDSC4 | -0.22 | 3.32 | 4.15 | 1/31/08 | ||||||||||||
| Class I Shares at NAV | 0.78 | 4.35 | 5.17 | 1/31/08 | ||||||||||||
| Barclays U.S. Aggregate Bond Index | 2.94 | 3.10 | 4.27 | 5 | — | |||||||||||
| S&P/LSTA Leveraged Loan Index | 0.92 | 4.51 | 5.22 | 5 | — | |||||||||||
Fund Expense Ratios6: A Shares: 1.18%, C Shares: 1.93%, I Shares: 0.93%.
All returns represent past performance which is no guarantee of future results. Current performance may be higher or lower than the performance shown. The investment return and principal value of an investment will fluctuate so that an investor’s shares, when redeemed, may be worth more or less than their original cost. The above table and graph below do not reflect the deduction of taxes that a shareholder would pay on fund distributions or the redemption of shares. Please visit Virtus.com for performance data current to the most recent month-end.
| 1 | Total returns are historical and include changes in share price and the reinvestment of both dividends and capital gains distributions. |
| 2 | “NAV” (Net Asset Value) total returns do not include the effect of any sales charge. |
| 3 | “POP” (Public Offering Price) total returns include the effect of the maximum front-end 2.75% sales charge. |
| 4 | “CDSC” (Contingent Deferred Sales Charge) is applied to redemptions of certain classes of shares that do not have a sales charge applied at the time of purchase. CDSC charges for certain redemptions of Class A shares made within 18 months of purchase in which a finder’s fee was paid and all redemptions of Class C shares within the first year are 1% and 0% thereafter. |
| 5 | The since inception index returns are from the Fund’s inception date. |
| 6 | The expense ratios of the Fund are set forth according to the prospectus for the Fund effective January 28, 2015, as supplemented and revised, and may differ from the expense ratios disclosed in the Financial Highlights tables in this report. See the Financial Highlights for more current expense ratios. |
Growth of $10,000 For periods ended 9/30
This chart assumes an initial investment of $10,000 made on January 31, 2008 (inception date of the Fund), for Class A, Class C and Class I shares including any applicable sales charges or fees. Performance assumes reinvestment of dividends and capital gain distributions.
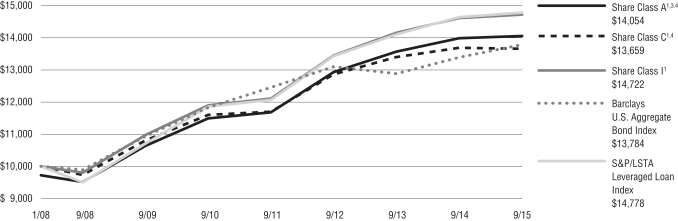
The indexes are unmanaged and not available for direct investment; therefore, their performance does not reflect the expenses associated with active management of an actual portfolio.
For information regarding the indexes and certain investment terms, see the Key Investment Terms starting on page 4.
22
Table of Contents
Fund Summary | Ticker Symbols: Class A: VWMAX Class C: VWMCX Class I: VWMIX |
Portfolio Manager Commentary by Horizon Asset Management, LLC
| ¢ | The Fund is diversified and has an investment objective of capital appreciation. |
| ¢ | For the fiscal year ended September 30, 2015, the Fund’s Class A shares at NAV returned -6.74%, Class C shares returned -7.41%, and Class I shares returned -6.53%. For the same period, the S&P 500® Index, a broad-based equity index, and the Fund’s style-specific benchmark, returned -0.61%. |
All performance figures assume reinvestment of distributions and exclude the effect of sales charges. Past performance is no guarantee of future results, and current performance may be higher or lower than the performance shown above.
How did the markets perform during the Fund’s fiscal year?
| ¢ | During the 12-month period ended September 30, 2015, the broader equity markets were down slightly, with the S&P 500® Index returning -0.61% during the fiscal year. Markets fell in late 2014, as falling oil prices dominated headlines. The S&P 500® Index then appreciated through the first half of 2015, only to fall again in August 2015. In the latter part of the 12-month period, investors weighed a variety of headwinds facing the markets: oil prices remained low, concerns continued to grow regarding the strength of the Chinese economy, and the U.S. Federal Reserve did not raise interest rates. |
| ¢ | Domestic equity mutual funds continued to experience net outflows, while exchange-traded funds (ETFs) continued to gather assets. Given the float-adjusted, market cap-weighted methodology used by most of the major indexes, the lion’s share of flows into ETFs tend to support the stock prices of the largest, most liquid companies. However, in our opinion, the business results of these companies have not necessarily improved. Many of the largest companies have experienced slowing revenue growth, and have been returning capital to investors via share buybacks and dividends rather than reinvesting in their businesses. Over the long term, we believe that this will constrain future growth. |
What factors affected the Fund’s performance during its fiscal year?
| ¢ | The Fund is designed to track the Horizon Kinetics ISE Wealth Index (the “Wealth Index”). The Wealth Index is composed of publicly-listed companies owned and operated by the wealthiest, most successful investors, business executives, and entrepreneurs in the United States (“owner-operators”). The Fund allows investors to readily leverage the business acumen of the highly-skilled individuals represented in the Wealth Index. |
| ¢ | The underperformance of the Fund is attributable, in part, to the continued outflows from actively managed domestic mutual funds and consequent inflows into passively managed ETFs, as noted above. These flows provide a floor valuation to the largest constituents of the largest indexes – the prices of these stocks appear to be driven by demand for the indexed products that hold them as much as by company fundamentals. While some of these companies are also held in the Fund, as a result of the equal-weighted methodology used to construct the Wealth Index, their results do not dominate Fund returns. |
| ¢ | At the sector level, stock selection within the consumer discretionary and industrials sectors were the largest detractors from relative returns, while the health care and telecommunications services sectors contributed positively. |
| ¢ | At the stock level, the five largest contributors to relative performance (and their owner-operators) were Pharmacyclics, Inc. (Robert Duggan), Cablevision Systems Corp. (Charles Dolan). Halozyme Therapeutics, Inc. (Randal Kirk), Papa John’s International, Inc. (John Schnattner), and AmTrust Financial Services Inc. (Michael Karfunkel). The five largest detractors from relative performance were Halcon Resources Corporation (David Hunt), TimkenSteel Corp. (Ward Timken, Jr.), Ocwen Financial Corp. (William Erbey), W&T Offshore, Inc. (Tracy Krohn), and Wynn Resorts, Limited (Stephen Wynn). It is worth noting that of the top and bottom contributors, only two were also held in the benchmark S&P 500® Index. |
The preceding information is the opinion of portfolio management. Any such opinions are subject to change at any time based on market or other
conditions and should not be relied upon as investment advice. Past performance is no guarantee of future results, and there is no guarantee that market forecasts will be realized.
There is no guarantee the Fund will meet its objective.
| Asset Allocation | ||||
The following table presents asset allocations within certain sectors and as a percentage of total investments as of September 30, 2015.
|
| |||
Consumer Discretionary | 34 | % | ||
Financials | 19 | |||
Information Technology | 12 | |||
Industrials | 10 | |||
Energy | 6 | |||
Consumer Staples | 5 | |||
Other (includes short-term investments and securities lending collateral) | 14 | |||
|
| |||
Total | 100 | % | ||
|
| |||
Equity Securities: The market price of equity securities may be adversely affected by financial market, industry, or issuer-specific events. Focus on a particular style or on small or medium-sized companies may enhance that risk.
Industry/Sector Concentration: A fund that focuses its investments in a particular industry or sector will be more sensitive to conditions that affect that industry or sector than a non-concentrated fund.
Prospectus: For additional information on risks, please see the fund’s prospectus.
For information regarding the indexes and certain investment terms, see the Key Investment Terms starting on page 4.
23
Table of Contents
Wealth Masters Fund (Continued)
| Average Annual Total Returns1 for periods ended 9/30/15 | ||||||||||||
| 1 year | Since Inception | Inception Date | ||||||||||
| Class A Shares at NAV2 | -6.74 | % | 10.86 | % | 9/5/12 | |||||||
| Class A Shares at POP3,4 | -12.10 | 8.74 | 9/5/12 | |||||||||
| Class C Shares at NAV2 and with CDSC4 | -7.41 | 10.04 | 9/5/12 | |||||||||
| Class I Shares at NAV | -6.53 | 11.12 | 9/5/12 | |||||||||
| S&P 500® Index | -0.61 | 13.12 | 5 | — | ||||||||
Fund Expense Ratios6: A Shares: Gross 1.46%, Net 1.45%; C Shares: Gross 2.21%, Net 2.20%; I Shares: Gross 1.21%, Net 1.20%.
All returns represent past performance which is no guarantee of future results. Current performance may be higher or lower than the performance shown. The investment return and principal value of an investment will fluctuate so that an investor’s shares, when redeemed, may be worth more or less than their original cost. The above table and graph below do not reflect the deduction of taxes that a shareholder would pay on fund distributions or the redemption of shares. Please visit Virtus.com for performance data current to the most recent month-end.
| 1 | Total returns are historical and include changes in share price and the reinvestment of both dividends and capital gains distributions. |
| 2 | “NAV” (Net Asset Value) total returns do not include the effect of any sales charge. |
| 3 | “POP” (Public Offering Price) total returns include the effect of the maximum front-end 5.75% sales charge. |
| 4 | “CDSC” (Contingent Deferred Sales Charge) is applied to redemptions of certain classes of shares that do not have a sales charge applied at the time of purchase. CDSC charges for certain redemptions of Class A shares made within 18 months of purchase in which a finder’s fee was paid and all redemptions of Class C shares within the first year are 1% and 0% thereafter. |
| 5 | The since inception index returns are from the Fund’s inception date. |
| 6 | The expense ratios of the Fund are set forth according to the prospectus for the Fund effective January 28, 2015, as supplemented and revised and may differ from the expense ratios disclosed in the Financial Highlights tables in this report. See the Financial Highlights for more current expense ratios. Net Expense: Expenses reduced by contractual fee waiver in effect through January 31, 2017. For the period of October 1, 2014 through August 31, 2015, the waiver was voluntary. Gross Expense: Does not reflect the effect of the fee waiver. |
Growth of $10,000 For periods ended 9/30
This chart assumes an initial investment of $10,000 made on September 5, 2012 (inception date of the Fund), for Class A, Class C, and Class I shares including any applicable sales charges or fees. Performance assumes reinvestment of dividends and capital gain distributions.
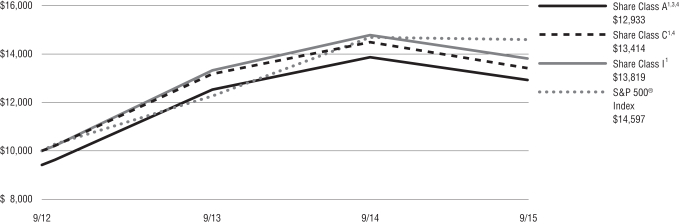
The indexes are unmanaged and not available for direct investment; therefore, their performance does not reflect the expenses associated with active management of an actual portfolio.
For information regarding the indexes and certain investment terms, see the Key Investment Terms starting on page 4.
24
Table of Contents
SCHEDULE OF INVESTMENTS
SEPTEMBER 30, 2015
($ reported in thousands)
| PAR VALUE | VALUE | |||||||
| U.S. GOVERNMENT SECURITIES—6.8% | ||||||||
U.S. Treasury Note | ||||||||
1.375%, 4/30/20 | $ | 1,990 | $ | 1,995 | ||||
2.000%, 2/15/25 | 3,065 | 3,054 | ||||||
| TOTAL U.S. GOVERNMENT SECURITIES (Identified Cost $5,008) | 5,049 | |||||||
| MUNICIPAL BONDS—1.7% | ||||||||
| Georgia—0.4% | ||||||||
Rockdale County Water & Sewerage Authority Revenue Taxable | 255 | 262 | ||||||
|
| |||||||
| Massachusetts—0.3% | ||||||||
Commonwealth of Massachusetts, Series C, Taxable | 155 | 193 | ||||||
|
| |||||||
| Michigan—0.0% | ||||||||
City of Flat Rock Finance Authority, Series A, Taxable | 35 | 36 | ||||||
|
| |||||||
| Texas—1.0% | ||||||||
University of Texas System (The) Series B, Taxable | 600 | 748 | ||||||
| TOTAL MUNICIPAL BONDS (Identified Cost $1,241) | 1,239 | |||||||
| FOREIGN GOVERNMENT SECURITIES—1.2% | ||||||||
Kingdom of Morocco 144A | 270 | 273 | ||||||
Mongolia 144A | 200 | 165 | ||||||
Republic of Chile | 84,000 | CLP | 125 | |||||
Republic of El Salvador 144A | 155 | 137 | ||||||
Republic of Romania 144A | 210 | 226 | ||||||
| TOTAL FOREIGN GOVERNMENT SECURITIES | ||||||||
| (Identified Cost $994) | 926 | |||||||
| MORTGAGE-BACKED SECURITIES—23.6% | ||||||||
| Agency—9.7% | ||||||||
Fannie Mae Pool | 715 | 747 | ||||||
FHLMC | ||||||||
7.000%, 4/1/16 | 1 | 1 | ||||||
5.000%, 12/1/35 | 36 | 40 | ||||||
4.000%, 2/1/45 | 574 | 612 | ||||||
3.500%, 3/1/45 | 390 | 407 | ||||||
FNMA | ||||||||
6.500%, 6/1/16 | 5 | 5 | ||||||
6.000%, 7/1/17 | 6 | 7 | ||||||
5.500%, 9/1/17 | 12 | 12 | ||||||
| PAR VALUE | VALUE | |||||||
| Agency—continued | ||||||||
5.000%, 4/1/20 | $ | 81 | $ | 86 | ||||
5.000%, 8/1/21 | 29 | 30 | ||||||
6.000%, 5/1/29 | 36 | 41 | ||||||
6.500%, 5/1/30 | 1 | 1 | ||||||
7.000%, 7/1/31 | 17 | 19 | ||||||
5.500%, 4/1/36 | 56 | 64 | ||||||
5.500%, 9/1/36 | 213 | 240 | ||||||
6.000%, 9/1/37 | 26 | 30 | ||||||
6.000%, 8/1/38 | 280 | 322 | ||||||
6.000%, 8/1/38 | 15 | 17 | ||||||
5.000%, 6/1/39 | 706 | 790 | ||||||
5.000%, 9/1/39 | 186 | 209 | ||||||
5.500%, 9/1/39 | 357 | 399 | ||||||
4.500%, 9/1/40 | 288 | 320 | ||||||
3.500%, 12/1/42 | 319 | 334 | ||||||
3.000%, 3/1/43 | 532 | 541 | ||||||
3.000%, 5/1/43 | 161 | 164 | ||||||
4.000%, 9/1/44 | 168 | 179 | ||||||
3.000%, 8/1/45 | 607 | 616 | ||||||
3.500%, 8/1/45 | 757 | 791 | ||||||
Freddie Mac Gold Pool | 148 | 150 | ||||||
GNMA | 31 | 35 | ||||||
|
| |||||||
| 7,209 | ||||||||
|
| |||||||
| Non-Agency—13.9% | ||||||||
A-10 Securitization LLC | ||||||||
13-1, B 144A | 260 | 261 | ||||||
14-1, A1 144A | 232 | 232 | ||||||
Access Point Financial, Inc. 15-A, A 144A | 212 | 212 | ||||||
American Homes 4 Rent | ||||||||
14-SFR2, C 144A | 195 | 199 | ||||||
15-SFR1, A 144A | 223 | 222 | ||||||
Ameriquest Mortgage Securities, Inc. | 125 | 126 | ||||||
03-AR3, M4 | 130 | 126 | ||||||
Aventura Mall Trust 13-AVM, C 144A | 205 | 213 | ||||||
B2R Mortgage Trust 15-1, A1 144A | 109 | 109 | ||||||
Banc of America Funding Trust | ||||||||
04-B, 2A1 | 101 | 100 | ||||||
05-1, 1A1 | 117 | 119 | ||||||
Banc of America Mortgage Trust 05-3, 1A15 | 106 | 108 | ||||||
Bank of America (Merrill Lynch – Countrywide) Asset-Backed Certificates 05-1 AF5A | 316 | 313 | ||||||
| PAR VALUE | VALUE | |||||||
| Non-Agency—continued | ||||||||
Bank of America (Merrill Lynch – Countrywide) Home Loan Mortgage Pass-Through-Trust 04-6, 1A2 | $ | 318 | $ | 316 | ||||
Citigroup Commercial Mortgage Trust 07-C6, A4 | 350 | 370 | ||||||
CSAIL Commercial Mortgage Trust 15-C2, AS | 375 | 386 | ||||||
Deutsche Bank-UBS Mortgage Trust 11-LC3A, D 144A | 180 | 192 | ||||||
Goldman Sachs Mortgage Securities Trust II 07-GG10, A4 | 852 | 899 | ||||||
GSAA Home Equity Trust 05-12, AF3W | 77 | 79 | ||||||
Jefferies Resecuritization Trust 14-R1, 1A1 144A | 94 | 94 | ||||||
JPMorgan Chase (Bear Stearns) Commercial Mortgage Securities, Inc. | ||||||||
06-PWR13, AM | 385 | 397 | ||||||
07- PW15, AM | 140 | 144 | ||||||
JPMorgan Chase (WaMu) Mortgage Pass-Through Certificates 03-S11, 3A5 | 214 | 220 | ||||||
JPMorgan Chase Commercial Mortgage Securities Trust | ||||||||
10-CNTR, D 144A 6.390%, 8/5/32(2)(3) | 200 | 226 | ||||||
14-1, 1A1 144A 4.000%, 1/25/44(2)(3) | 138 | 144 | ||||||
06-LDP9, A3 | 124 | 128 | ||||||
JPMorgan Chase Mortgage Trust 04-A4, 2A1 | 257 | 261 | ||||||
MASTR Specialized Loan Trust 05-3, A2 144A | 174 | 177 | ||||||
Morgan Stanley Bank of America (Merrill Lynch) Trust 15-C22, AS | 310 | 312 | ||||||
Morgan Stanley Capital I Trust | ||||||||
07-T27, A4 | 560 | 596 | ||||||
08-T29, A4 | 577 | 626 | ||||||
07-IQ14, A4 | 300 | 313 | ||||||
07-IQ14, AM | 190 | 197 | ||||||
See Notes to Financial Statements
25
Table of Contents
VIRTUS BOND FUND
SCHEDULE OF INVESTMENTS (Continued)
SEPTEMBER 30, 2015
($ reported in thousands)
| PAR VALUE | VALUE | |||||||
| Non-Agency—continued | ||||||||
Morgan Stanley Capital I, Inc. 15-MS1, AS | $ | 250 | $ | 261 | ||||
Motel 6 Trust 15-MTL6, B 144A | 210 | 212 | ||||||
New Residential Mortgage Loan Trust 14-1A, A 144A | 145 | 150 | ||||||
Residential Asset Securitization Trust 05-A1, A3 | 178 | 180 | ||||||
Sequoia Mortgage Trust 14-2, A1 144A | 149 | 154 | ||||||
Vericrest Opportunity Loan Trust | ||||||||
15-NP11, A1 | 148 | 148 | ||||||
15-NPL4, A1 144A | 206 | 205 | ||||||
Wells Fargo (Royal Bank of Scotland plc) Commercial Mortgage Trust 11-C5, C 144A | 205 | 226 | ||||||
Wells Fargo (Wachovia Bank) Commercial Mortgage Trust 15-LC20, B | 300 | 291 | ||||||
WinWater Mortgage Loan Trust 14-1, A1 144A | 109 | 113 | ||||||
|
| |||||||
| 10,357 | ||||||||
| TOTAL MORTGAGE-BACKED SECURITIES (Identified Cost $17,197) | 17,566 | |||||||
| ASSET-BACKED SECURITIES—4.8% | ||||||||
AmeriCredit Automobile Receivables Trust 14-1, D | 235 | 237 | ||||||
Avis Budget Rental Car Funding LLC (AESOP) 12-3A, A 144A | 375 | 378 | ||||||
CarMax Auto Owner Trust 15-2, C | 235 | 236 | ||||||
Centre Point Funding LLC 12-2A, 1 144A | 277 | 276 | ||||||
Drug Royalty LP II 14-1, A2 144A | 217 | 220 | ||||||
Exeter Automobile Receivables Trust 13-1A, C 144A | 235 | 239 | ||||||
Fairway Outdoor Funding LLC 12-1A, A2 144A | 147 | 148 | ||||||
Orange Lake Timeshare Trust 12-AA, A 144A | 64 | 66 | ||||||
| PAR VALUE | VALUE | |||||||
| ASSET-BACKED SECURITIES—continued | ||||||||
Santander Drive Auto Receivables Trust | ||||||||
12-2, D | $ | 500 | $ | 509 | ||||
13-1, D | 215 | 216 | ||||||
Sierra Timeshare Receivables Funding LLC 12-3A, A 144A | 127 | 127 | ||||||
Silverleaf Finance LLC XV 12-D, A 144A | 64 | 64 | ||||||
SoFi Professional Loan Program LLC 15-A, A2 144A | 159 | 159 | ||||||
TAL Advantage V LLC | ||||||||
13-1A A 144A | 223 | 224 | ||||||
14-3A, A 144A | 174 | 177 | ||||||
Tidewater Auto Receivables Trust 12-AA, B 144A | 97 | 97 | ||||||
U-Haul S Fleet LLC 10-BT1A, 1 144A | 168 | 174 | ||||||
Westgate Resorts LLC 12-2A, A 144A | 49 | 49 | ||||||
| TOTAL ASSET-BACKED SECURITIES (Identified Cost $3,574) | 3,596 | |||||||
| CORPORATE BONDS AND NOTES—48.8% | ||||||||
| Consumer Discretionary—7.3% | ||||||||
Argos Merger Sub, Inc. 144A | 135 | 137 | ||||||
Boyd Gaming Corp. | ||||||||
9.000%, 7/1/20 | 100 | 107 | ||||||
6.875%, 5/15/23 | 75 | 76 | ||||||
Caesars Entertainment Operating Co., Inc. | 100 | 82 | ||||||
Caesars Growth Properties Holdings LLC (Caesars Growth Properties Finance, Inc.) | 70 | 55 | ||||||
CCO Safari II LLC 144A | 80 | 80 | ||||||
CCO Holdings LLC | ||||||||
5.250%, 3/15/21 | 75 | 74 | ||||||
144A 5.125%, 5/1/23(3) | 80 | 74 | ||||||
Cequel Communications Holdings I LLC (Cequel Capital Corp.) | ||||||||
144A 5.125%, 12/15/21(3) | 45 | 40 | ||||||
144A 5.125%, 12/15/21(3) | 110 | 97 | ||||||
Clear Channel Worldwide Holdings, Inc. Series B | 175 | 176 | ||||||
Columbus International, Inc. 144A | 200 | 208 | ||||||
Intelsat Jackson Holdings SA | 185 | 153 | ||||||
International Game Technology plc 144A | 200 | 187 | ||||||
| PAR VALUE | VALUE | |||||||
| Consumer Discretionary—continued | ||||||||
Isle of Capri Casinos, Inc. | $ | 107 | $ | 111 | ||||
Landry’s, Inc. 144A | 260 | 278 | ||||||
MDC Holdings, Inc. | 180 | 183 | ||||||
Meritor, Inc. | 170 | 172 | ||||||
MGM Resorts International | 85 | 83 | ||||||
Mohegan Tribal Gaming Authority | 75 | 77 | ||||||
MPG Holdco I, Inc. | 145 | 152 | ||||||
New York University | 70 | 67 | ||||||
Numericable Group SA 144A | 200 | 193 | ||||||
Omega US Sub LLC 144A | 155 | 138 | ||||||
Party City Holdings, Inc. 144A | 20 | 20 | ||||||
Penn National Gaming, Inc. | 110 | 111 | ||||||
Pinnacle Entertainment, Inc. | 175 | 186 | ||||||
Priceline Group, Inc. (The) | 195 | 194 | ||||||
QVC, Inc. | 265 | 258 | ||||||
Scientific Games International, Inc. | ||||||||
6.625%, 5/15/21 | 160 | 116 | ||||||
144A 7.000%, 1/1/22(3) | 120 | 119 | ||||||
Signet UK Finance plc | 210 | 212 | ||||||
Station Casinos LLC | 230 | 240 | ||||||
Tempur Sealy International Inc 144A | 60 | 60 | ||||||
Toll Brothers Finance Corp. | ||||||||
4.000%, 12/31/18 | 40 | 41 | ||||||
6.750%, 11/1/19 | 220 | 251 | ||||||
TRI Pointe Holdings, Inc. | 155 | 153 | ||||||
UPCB Finance IV Ltd. 144A | 200 | 189 | ||||||
Wyndham Worldwide Corp. | 235 | 256 | ||||||
|
| |||||||
| 5,406 | ||||||||
|
| |||||||
| Consumer Staples—1.1% | ||||||||
Flowers Foods, Inc. | 275 | 291 | ||||||
Pilgrim’s Pride Corp. 144A | 60 | 59 | ||||||
Reynolds American, Inc. | 295 | 293 | ||||||
Rite Aid Corp. 144A | 40 | 40 | ||||||
Tops Holding LLC (Tops Markets II Corp.) 144A | 155 | 156 | ||||||
|
| |||||||
| 839 | ||||||||
|
| |||||||
See Notes to Financial Statements
26
Table of Contents
VIRTUS BOND FUND
SCHEDULE OF INVESTMENTS (Continued)
SEPTEMBER 30, 2015
($ reported in thousands)
| PAR VALUE | VALUE | |||||||
| Energy—2.6% | ||||||||
Antero Resources Corp. 144A | $ | 80 | $ | 71 | ||||
Blue Racer Midstream LLC (Blue Racer Finance Corp.) 144A | 45 | 43 | ||||||
CONSOL Energy, Inc. | 105 | 71 | ||||||
FTS International, Inc. | 60 | 19 | ||||||
Helmerich & Payne International Drilling Co. | 115 | 114 | ||||||
Kinder Morgan Energy Partners LP | 245 | 257 | ||||||
MarkWest Energy Partners LP (MarkWest Energy Finance Corp.) | 255 | 235 | ||||||
Newfield Exploration Co. | 150 | 137 | ||||||
NGL Energy Partners LP (NGL Energy Finance Corp.) | 155 | 142 | ||||||
Sabine Pass Liquefaction LLC | 140 | 131 | ||||||
Sunoco LP (Sunoco Finance Corp.) 144A | 215 | 211 | ||||||
Weatherford International Ltd. | 310 | 251 | ||||||
Williams Cos., Inc. (The) | ||||||||
3.700%, 1/15/23 | 200 | 155 | ||||||
4.550%, 6/24/24 | 170 | 135 | ||||||
|
| |||||||
| 1,972 | ||||||||
|
| |||||||
| Financials—20.9% | ||||||||
Air Lease Corp. | 70 | 70 | ||||||
Akbank TAS 144A | 375 | TRY | 108 | |||||
Allstate Corp. (The) | 310 | 321 | ||||||
Ally Financial, Inc. | 105 | 104 | ||||||
American Campus Communities Operating Partnership Lp | 25 | 25 | ||||||
Apollo Management Holdings LP 144A | 190 | 192 | ||||||
Ares Capital Corp. | 95 | 98 | ||||||
Ares Finance Co., LLC Finance Co., LLC 144A | 270 | 263 | ||||||
Banco de Credito del Peru 144A | 240 | 247 | ||||||
Banco de Credito e Inversiones 144A | 275 | 273 | ||||||
Banco Inbursa SA Institucion de Banca Multiple 144A | 160 | 155 | ||||||
| PAR VALUE | VALUE | |||||||
| Financials—continued | ||||||||
Banco Internacional del Peru SAA 144A | $ | 300 | $ | 298 | ||||
Banco Santander Chile 144A | 450 | 448 | ||||||
Bancolombia S.A. | 260 | 246 | ||||||
Bank of America Corp. | 235 | 265 | ||||||
Bank of Baroda 144A | 200 | 213 | ||||||
Bank of India 144A | 265 | 270 | ||||||
Barclays Bank plc 144A | 250 | 270 | ||||||
Brixmor Operating Partnership LP | 55 | 56 | ||||||
Citizens Financial Group, Inc. 144A | 160 | 156 | ||||||
Compass Bank | 250 | 233 | ||||||
Corporate Office Properties LP | 265 | 249 | ||||||
Corrections Corp of America | 325 | 327 | ||||||
CTR Partnership LP (Caretrust Capital Corp.) | 130 | 133 | ||||||
CyrusOne LP (CyrusOne Finance Corp.) 144A | 160 | 163 | ||||||
Developers Diversified Realty Corp. | ||||||||
7.875%, 9/1/20 | 155 | 189 | ||||||
3.500%, 1/15/21 | 130 | 132 | ||||||
Development Bank of Kazakhstan OJSC 144A | 290 | 248 | ||||||
Digital Realty Trust LP | 165 | 180 | ||||||
Discover Financial Services, Inc. | 190 | 187 | ||||||
Education Realty Operating Partnership LP | 205 | 206 | ||||||
ESH Hospitality, Inc. 144A | 155 | 153 | ||||||
Excel Trust LP | 85 | 84 | ||||||
First Cash Financial Services, Inc. | 100 | 100 | ||||||
Ford Motor Credit Co. LLC | 235 | 264 | ||||||
FS Investment Corp. | ||||||||
4.250%, 1/15/20 | 165 | 168 | ||||||
4.750%, 5/15/22 | 60 | 59 | ||||||
General Motors Financial Co., Inc. | ||||||||
4.750%, 8/15/17 | 175 | 182 | ||||||
3.450%, 4/10/22 | 30 | 29 | ||||||
Genworth Holdings, Inc. | 205 | 160 | ||||||
GLP Capital LP (GLP Financing II, Inc.) | ||||||||
4.875%, 11/1/20 | 155 | 157 | ||||||
5.375%, 11/1/23 | 5 | 5 | ||||||
| PAR VALUE | VALUE | |||||||
| Financials—continued | ||||||||
Goldman Sachs Group, Inc. (The) | $ | 500 | $ | 574 | ||||
Healthcare Realty Trust, Inc. | ||||||||
3.875%, 5/1/25 | 125 | 122 | ||||||
4.000%, 6/1/25 | 200 | 200 | ||||||
Hutchison Whampoa International Ltd. Series 12, | 310 | 322 | ||||||
ICAHN Enterprises LP (ICAHN Enterprises Finance Corp.) | ||||||||
4.875%, 3/15/19 | 15 | 15 | ||||||
5.875%, 2/1/22 | 150 | 151 | ||||||
ING Groep NV | 200 | 197 | ||||||
Intesa San Paolo S.p.A | 215 | 216 | ||||||
iStar Financial, Inc. | 90 | 86 | ||||||
Jefferies Group LLC | 85 | 96 | ||||||
JPMorgan Chase & Co. | 45 | 44 | ||||||
Kazakhstan Temir Zholy Finance BV 144A | 215 | 169 | ||||||
Kilroy Realty Lp | 190 | 192 | ||||||
Leucadia National Corp. | 150 | 151 | ||||||
Liberty Mutual Group, Inc. 144A | 245 | 253 | ||||||
Lincoln National Corp. | 250 | 260 | ||||||
Macquarie Bank Ltd. 144A | 15 | 17 | ||||||
Macquarie Group Ltd. 144A | 210 | 239 | ||||||
Morgan Stanley | ||||||||
5.550%, 4/27/17 | 330 | 350 | ||||||
4.100%, 5/22/23 | 155 | 158 | ||||||
6.375%, 7/24/42 | 435 | 538 | ||||||
MPT Operating Partnership LP | 90 | 92 | ||||||
Navient LLC | 200 | 159 | ||||||
Nordea Bank AB 144A | 265 | 271 | ||||||
PKO Finance AB 144A | 255 | 263 | ||||||
Prudential Financial, Inc. | ||||||||
5.875%, 9/15/42(2) | 190 | 201 | ||||||
5.625%, 6/15/43(2)(7) | 280 | 289 | ||||||
Retail Opportunity Investments Partnership LP | 155 | 152 | ||||||
Select Income REIT | 190 | 183 | ||||||
Teachers Insurance & Annuity Association of America 144A | 160 | 162 | ||||||
Turkiye Garanti Bankasi AS 144A | 305 | 293 | ||||||
UBS AG | 500 | 575 | ||||||
See Notes to Financial Statements
27
Table of Contents
VIRTUS BOND FUND
SCHEDULE OF INVESTMENTS (Continued)
SEPTEMBER 30, 2015
($ reported in thousands)
| PAR VALUE | VALUE | |||||||
| Financials—continued | ||||||||
Ventas Realty LP (Ventas Capital Corp.) | $ | 250 | $ | 245 | ||||
Voya Financial, Inc. | 280 | 284 | ||||||
Walter Investment Management Corp. | 135 | 116 | ||||||
WP Carey, Inc. | 160 | 163 | ||||||
York Risk Services Holding Corp. 144A | 105 | 90 | ||||||
|
| |||||||
| 15,574 | ||||||||
|
| |||||||
| Health Care—4.4% | ||||||||
AbbVie, Inc. | 65 | 64 | ||||||
Acadia Healthcare Co., Inc. | 65 | 64 | ||||||
144A 5.625%, 2/15/23(3) | 10 | 10 | ||||||
Alere, Inc. 144A | 60 | 61 | ||||||
Capsugel SA PIK Interest Capitalization 144A | 35 | 35 | ||||||
Cardinal Health, Inc. | ||||||||
3.200%, 3/15/23 | 130 | 129 | ||||||
3.750%, 9/15/25 | 165 | 167 | ||||||
Community Health Systems, Inc. | 45 | 46 | ||||||
Concordia Healthcare Corp. 144A | 10 | 9 | ||||||
Crimson Merger Sub, Inc. 144A | 120 | 103 | ||||||
DaVita Healthcare Partners, Inc. | 90 | 87 | ||||||
Emdeon, Inc. 144A | 105 | 102 | ||||||
Endo Finance LLC (Endo Finco, Inc.) 144A | 110 | 109 | ||||||
Forest Laboratories, Inc. 144A | 160 | 173 | ||||||
Fresenius US Finance II, Inc. 144A | 35 | 35 | ||||||
HCA, Inc. | ||||||||
6.500%, 2/15/20 | 160 | 174 | ||||||
5.375%, 2/1/25 | 80 | 80 | ||||||
Healthsouth Corp. | ||||||||
144A 5.750%, 11/1/24(3) | 15 | 15 | ||||||
144A 5.750%, 9/15/25(3) | 120 | 117 | ||||||
Hill-Rom Holdings, Inc. 144A | 105 | 106 | ||||||
Hologic, Inc. 144A | 10 | 10 | ||||||
IASIS Healthcare LLC | 80 | 82 | ||||||
Jaguar Holding Co. II (Pharmaceutical Product Development LLC) 144A | 95 | 93 | ||||||
| PAR VALUE | VALUE | |||||||
| Health Care—continued | ||||||||
JLL Delta Dutch Pledgeco BV PIK Interest Capitalization, 8.75% interest, 0.75% capitalization 144A 5/1/20(2)(3)(9) | $ | 85 | $ | 86 | ||||
Mallinckrodt International Finance S.A. | ||||||||
144A 5.750%, 8/1/22(3) | 60 | 58 | ||||||
144A 5.625%, 10/15/23(3) | 165 | 151 | ||||||
144A 5.500%, 4/15/25(3) | 5 | 4 | ||||||
Owens & Minor, Inc. | 35 | 35 | ||||||
Quintiles Transnational Corp. 144A | 75 | 74 | ||||||
Select Medical Corp. | 205 | 201 | ||||||
Sterigenics-Nordion Holdings LLC 144A | 55 | 55 | ||||||
Surgical Care Affiliates, Inc. 144A | 160 | 159 | ||||||
Tenet Healthcare Corp. | ||||||||
144A 3.837%, 6/15/20(2)(3) | 75 | 75 | ||||||
4.500%, 4/1/21 | 160 | 158 | ||||||
8.125%, 4/1/22 | 115 | 123 | ||||||
Valeant Pharmaceuticals International, Inc. | ||||||||
144A 6.750%, 8/15/18(3) | 140 | 143 | ||||||
144A 7.500%, 7/15/21(3) | 25 | 26 | ||||||
144A 5.500%, 3/1/23(3) | 50 | 47 | ||||||
|
| |||||||
| 3,266 | ||||||||
|
| |||||||
| Industrials—3.5% | ||||||||
ADT Corp. (The) | 260 | 269 | ||||||
Ahern Rentals, Inc. 144A | 150 | 131 | ||||||
Air Canada Pass-Through-Trust, 13-1, B 144A | 89 | 92 | ||||||
Bombardier, Inc. 144A | 110 | 89 | ||||||
Carpenter Technology Corp. | 250 | 245 | ||||||
Continental Airlines Pass-Through-Trust | ||||||||
99-1, A 6.545%, 2/2/19 | 342 | 368 | ||||||
00-1, A1 8.048%, 11/1/20 | 297 | 335 | ||||||
Delta Air Lines Pass-Through-Trust 12-1, A | 287 | 303 | ||||||
Masco Corp. | ||||||||
5.950%, 3/15/22 | 180 | 196 | ||||||
4.450%, 4/1/25 | 55 | 56 | ||||||
Northwest Airlines Pass-Through-Trust 02-1, G2 | 171 | 178 | ||||||
Penske Truck Leasing Co. LP 144A | 75 | 73 | ||||||
TransDigm, Inc. | ||||||||
6.000%, 7/15/22 | 115 | 108 | ||||||
144A 6.500%, 5/15/25(3) | 45 | 42 | ||||||
| PAR VALUE | VALUE | |||||||
| Industrials—continued | ||||||||
United Rentals North America, Inc. | $ | 155 | $ | 146 | ||||
|
| |||||||
| 2,631 | ||||||||
|
| |||||||
| Information Technology—2.1% | ||||||||
Dun & Bradstreet Corp. (The) | 270 | 267 | ||||||
First Data Corp. | 338 | 376 | ||||||
Flextronics International Ltd. 144A | 200 | 194 | ||||||
Hewlett Packard Enterprise Co. | ||||||||
144A 4.400%, 10/15/22(3) | 55 | 55 | ||||||
144A 4.900%, 10/15/25(3) | 55 | 55 | ||||||
KLA-Tencor Corp. | 190 | 190 | ||||||
McGraw Hill Financial, Inc. 144A | 195 | 194 | ||||||
Riverbed Technology, Inc. 144A | 70 | 64 | ||||||
Verisk Analytics, Inc. | 190 | 187 | ||||||
|
| |||||||
| 1,582 | ||||||||
|
| |||||||
| Materials—3.1% | ||||||||
Alpek SA de C.V. 144A | 310 | 319 | ||||||
ArcelorMittal | 155 | 126 | ||||||
Berry Plastics Corp. | 145 | 137 | ||||||
Braskem America Finance Co. RegS | 210 | 147 | ||||||
Cemex SAB de CV 144A | 265 | 265 | ||||||
Eldorado Gold Corp. 144A | 95 | 84 | ||||||
Fibria Overseas Finance Ltd. | 150 | 145 | ||||||
Fortescue Metals Group (FMG) Resources August 2006 Pty Ltd. 144A | 25 | 23 | ||||||
Hexion U.S. Finance Corp. | 130 | 111 | ||||||
Inversiones CMPC S.A. 144A | 375 | 367 | ||||||
Methanex Corp. | 190 | 183 | ||||||
NewMarket Corp. | 288 | 295 | ||||||
Owens-Brockway Glass Container, Inc. 144A | 10 | 10 | ||||||
United States Steel Corp. | 110 | 84 | ||||||
|
| |||||||
| 2,296 | ||||||||
|
| |||||||
| Telecommunication Services—1.8% | ||||||||
AT&T, Inc. | 425 | 442 | ||||||
See Notes to Financial Statements
28
Table of Contents
VIRTUS BOND FUND
SCHEDULE OF INVESTMENTS (Continued)
SEPTEMBER 30, 2015
($ reported in thousands)
| PAR VALUE | VALUE | |||||||
| Telecommunication Services—continued | ||||||||
Empresa Nacional de Telecomunicaciones S.A. 144A | $ | 215 | $ | 214 | ||||
Frontier Communications Corp. | ||||||||
6.250%, 9/15/21 | 100 | 84 | ||||||
144A 10.500%, 9/15/22(3) | 25 | 24 | ||||||
Level 3 Financing, Inc. | 160 | 166 | ||||||
Telefonica Emisiones SAU | 225 | 235 | ||||||
Windstream Corp. | 200 | 171 | ||||||
|
| |||||||
| 1,336 | ||||||||
|
| |||||||
| Utilities—2.0% | ||||||||
AmeriGas Partners LP | 140 | 144 | ||||||
Calpine Corp. | 121 | 113 | ||||||
Electricite de France SA 144A | 280 | 269 | ||||||
FirstEnergy Transmission LLC 144A | 210 | 215 | ||||||
Israel Electric Corp. Ltd. 144A | 250 | 267 | ||||||
NRG Yield Operating LLC | 60 | 53 | ||||||
State Grid Overseas Investment Ltd. | 200 | 211 | ||||||
Talen Energy Supply LLC 144A | 90 | 82 | ||||||
TerraForm Power Operating LLC 144A | ||||||||
5.875%, 2/1/23(3) | 145 | 129 | ||||||
|
| |||||||
| 1,483 | ||||||||
| TOTAL CORPORATE BONDS AND NOTES (Identified Cost $37,131) | 36,385 | |||||||
| CONVERTIBLE BOND—0.5% | ||||||||
General Electric Capital Corp. Series A | 290 | 335 | ||||||
| TOTAL CONVERTIBLE BOND (Identified Cost $290) | 335 | |||||||
| LOAN AGREEMENTS(2)—6.1% | ||||||||
| Consumer Discretionary—1.7% | ||||||||
Brickman Group Ltd. LLC (The) Second Lien, | 78 | 76 | ||||||
Caesars Entertainment Operating Co., Inc. Tranche B-7, | 50 | 45 | ||||||
Caesars Growth Properties Holdings LLC Tranche B, First Lien, | 60 | 53 | ||||||
CBAC Borrower LLC Tranche B, | 75 | 71 | ||||||
| PAR VALUE | VALUE | |||||||
| Consumer Discretionary—continued | ||||||||
Cirque Du Soleil | $ | 40 | $ | 40 | ||||
El Dorado Resorts, Inc. | 35 | 35 | ||||||
Laureate Education, Inc. 2018 Extended, | 80 | 67 | ||||||
Life Time Fitness, Inc. | 95 | 95 | ||||||
Marina District Finance Co., Inc. | 76 | 77 | ||||||
Peppermill Casinos, Inc. Tranche B, | 211 | 212 | ||||||
PetSmart, Inc. Tranche B-1 | 21 | 21 | ||||||
Shingle Springs Tribal Gaming Authority | 96 | 96 | ||||||
Staples, Inc. First Lien, | 148 | 147 | ||||||
TWCC Holding Corp. Second Lien, | 145 | 136 | ||||||
U.S. Farathane Corp. | 77 | 77 | ||||||
|
| |||||||
| 1,248 | ||||||||
|
| |||||||
| Consumer Staples—0.5% | ||||||||
Albertson’s LLC Tranche B-4, | 112 | 112 | ||||||
Hostess Brands LLC Tranche B Second Lien, | 150 | 151 | ||||||
Rite Aid Corp. | ||||||||
Tranche 1 5.750%, 8/21/20 | 14 | 14 | ||||||
Tranche 2, Second Lien, | 80 | 80 | ||||||
|
| |||||||
| 357 | ||||||||
|
| |||||||
| Energy—0.6% | ||||||||
Arch Coal, Inc. | 158 | 90 | ||||||
Chelsea Petroleum I LLC | 95 | 94 | ||||||
Chief Exploration & Development LLC Second Lien, | 117 | 97 | ||||||
Drillships Ocean Ventures, Inc. | 99 | 67 | ||||||
Jonah Energy LLC Second Lien, | 94 | 76 | ||||||
|
| |||||||
| 424 | ||||||||
|
| |||||||
| Financials—0.1% | ||||||||
Capital Automotive LP Second Lien, | 71 | 72 | ||||||
|
| |||||||
| Health Care—1.1% | ||||||||
AMAG Pharmaceuticals, Inc. | 26 | 26 | ||||||
| PAR VALUE | VALUE | |||||||
| Health Care—continued | ||||||||
Amneal Pharmaceuticals LLC Tranche B, | $ | 57 | $ | 57 | ||||
Ardent Legacy Acquisitions, Inc. | 80 | 80 | ||||||
Concentra, Inc. First Lien, Tranche B | 9 | 9 | ||||||
InVentiv Health, Inc. Tranche B-4, | 110 | 110 | ||||||
MMM Holdings, Inc. | 52 | 39 | ||||||
MSO of Puerto Rico, Inc. | 37 | 29 | ||||||
NVA Holdings, Inc. | 74 | 73 | ||||||
Regional Care, Inc. (RCHP, Inc.) | 134 | 133 | ||||||
Schumacher Group | 80 | 80 | ||||||
Surgery Center Holdings, Inc. | ||||||||
First Lien, 5.250%, 11/3/20 | 100 | 101 | ||||||
Second Lien, | 63 | 64 | ||||||
|
| |||||||
| 801 | ||||||||
|
| |||||||
| Industrials—0.5% | ||||||||
Landmark U.S. Member LLC (Landmark U.S. Corp Acquisition, Inc.) Second Lien | 120 | 120 | ||||||
Navistar, Inc. | 149 | 146 | ||||||
Sedgwick Claims Management Services, Inc. Second Lien, | 120 | 114 | ||||||
|
| |||||||
| 380 | ||||||||
|
| |||||||
| Information Technology—1.1% | ||||||||
Allflex Holdings III, Inc. | 109 | 108 | ||||||
Applied Systems, Inc. | 81 | 81 | ||||||
Deltek, Inc. | ||||||||
First Lien 5.000%, 6/25/22 | 5 | 5 | ||||||
Second Lien | 51 | 51 | ||||||
Epicor Software Corp. | 58 | 57 | ||||||
First Data Corp. | 35 | 35 | ||||||
Infinity Acquisition Ltd. | 76 | 75 | ||||||
See Notes to Financial Statements
29
Table of Contents
VIRTUS BOND FUND
SCHEDULE OF INVESTMENTS (Continued)
SEPTEMBER 30, 2015
($ reported in thousands)
| PAR VALUE | VALUE | |||||||
| Information Technology—continued | ||||||||
Kronos Acquisition Intermediate, Inc. (KIK Custom Products, Inc.) Second Lien, | $ | 195 | $ | 199 | ||||
Mitchell International, Inc. Second Lien, | 108 | 108 | ||||||
Riverbed Technologies, Inc. | 68 | 68 | ||||||
SS&C Technologies, Inc. | ||||||||
Tranche B-1, | 48 | 48 | ||||||
Tranche B-2, | 8 | 7 | ||||||
|
| |||||||
| 842 | ||||||||
|
| |||||||
| Materials—0.2% | ||||||||
CPI Acquisition, Inc. | 75 | 75 | ||||||
Houghton International, Inc. Holding Corp. Second Lien, | 110 | 109 | ||||||
INEOS U.S. Finance LLC 2022 Dollar | 9 | 9 | ||||||
|
| |||||||
| 193 | ||||||||
|
| |||||||
| Utilities—0.3% | ||||||||
Atlantic Power LP | 31 | 30 | ||||||
NRG Energy, Inc. | 199 | 196 | ||||||
|
| |||||||
| 226 | ||||||||
| TOTAL LOAN AGREEMENTS (Identified Cost $4,745) | 4,543 | |||||||
| SHARES | ||||||||
| PREFERRED STOCKS—3.2% | ||||||||
| Energy—0.3% | ||||||||
PTT Exploration & Production PCL 144A, 4.875%(2)(3) | 200 | (12) | 193 | |||||
|
| |||||||
| Financials—2.9% | ||||||||
Bank of New York Mellon Corp. (The) | 150 | (12) | 148 | |||||
Citigroup, Inc. | 8,000 | 215 | ||||||
Citigroup, Inc. | 155 | (12) | 153 | |||||
General Electric Capital Corp. | 300 | (12) | 309 | |||||
Goldman Sachs Group, Inc. (The) Series L, 5.700%(2) | 115 | (12) | 115 | |||||
JPMorgan Chase & Co. | 315 | (12) | 306 | |||||
| SHARES | VALUE | |||||||
| Financials—continued | ||||||||
PNC Financial Services Group, Inc. (The) | 215 | (12) | $ | 201 | ||||
SunTrust Bank, Inc. | 45 | (12) | 45 | |||||
Wells Fargo & Co. | 230 | (12) | 243 | |||||
XLIT Ltd. Group plc | 240 | (12) | 190 | |||||
Zions Bancorp | 8,800 | 247 | ||||||
|
| |||||||
| 2,172 | ||||||||
| TOTAL PREFERRED STOCKS (Identified Cost $2,419) | 2,365 | |||||||
| AFFILIATED MUTUAL FUND—1.5% | ||||||||
Virtus Credit Opportunities Fund(15) | 116,984 | 1,143 | ||||||
| TOTAL AFFILIATED MUTUAL FUND (Identified Cost $1,170) | 1,143 | |||||||
| TOTAL LONG TERM INVESTMENTS—98.2% | ||||||||
| (Identified Cost $73,769) | 73,147 | (14) | ||||||
| SHORT-TERM INVESTMENT—1.4% | ||||||||
| Money Market Mutual Fund—1.4% | ||||||||
Fidelity Money Market Portfolio – Institutional Shares (seven-day effective yield 0.170%) | 1,061,676 | 1,062 | ||||||
| TOTAL SHORT-TERM INVESTMENT (Identified Cost $1,062) | 1,062 | |||||||
| TOTAL INVESTMENTS—99.6% (Identified Cost $74,831) | 74,209 | (1) | ||||||
Other assets and liabilities, net—0.4% |
| 290 | ||||||
|
| |||||||
| NET ASSETS—100.0% | $ | 74,499 | ||||||
|
| |||||||
Abbreviations:
| FHLMC | Federal Home Loan Mortgage Corporation (“Freddie Mac”). |
| FNMA | Federal National Mortgage Association (“Fannie Mae”). |
| GNMA | Government National Mortgage Association (“Ginnie Mae”) |
| PIK | Payment-in-Kind Security |
| REIT | Real Estate Investment Trust |
Footnote Legend:
| (1) | Federal Income Tax Information: For tax information at September 30, 2015, see Note 10 Federal Income Tax Information in the Notes to Financial Statements. |
| (2) | Variable or step coupon security; interest rate shown reflects the rate in effect at September 30, 2015. |
| (3) | Security exempt from registration under Rule 144A of the Securities Act of 1933. These securities may be resold in transactions exempt |
| from registration, normally to qualified institutional buyers. At September 30, 2015, these securities amounted to a value of $19,993 or 26.8% of net assets. |
| (4) | Regulation S security. Security is offered and sold outside of the United States, therefore, it is exempt from registration with the SEC under rules 903 and 904 of the Securities Act of 1933. |
| (5) | Security in default. |
| (6) | No contractual maturity date. |
| (7) | Interest payments may be deferred. |
| (8) | This Note was issued for the sole purpose of funding a loan agreement between the issuer and the borrower. As the credit risk for this security lies solely with the borrower, the name represented here is that of the borrower. |
| (9) | 92.1% of the income received was in cash and 7.9% in PIK. |
| (10) | 100% of the income received was in cash. |
| (11) | This loan will settle after September 30, 2015, at which time the interest rate, based on the London Interbank Offered Rate (“LIBOR”) and the agreed upon spread on trade date, will be reflected. |
| (12) | Value shown as par value. |
| (13) | Illiquid security. |
| (14) | All or a portion of the Fund’s assets have been segregated for delayed delivery security. |
| (15) | This fund is a public fund and the prospectus and annual report are publicly available. |
Foreign Currencies:
| CLP | Chilean Peso |
| TRY | Turkish Lira |
| Country Weightings (Unaudited)† | ||||
United States | 84 | % | ||
Chile | 2 | |||
Canada | 1 | |||
Mexico | 1 | |||
Peru | 1 | |||
Switzerland | 1 | |||
United Kingdom | 1 | |||
Other | 9 | |||
Total | 100 | % | ||
† % of total investments as of September 30, 2015 |
| |||
Security abbreviation definitions are located under the Key Investment Terms starting on page 4.
See Notes to Financial Statements
30
Table of Contents
VIRTUS BOND FUND
SCHEDULE OF INVESTMENTS (Continued)
SEPTEMBER 30, 2015
($ reported in thousands)
The following table provides a summary of inputs used to value the Fund’s investments as of September 30, 2015 (See Security Valuation Note 2A in the Notes to Financial Statements):
| Total Value at September 30, 2015 | Level 1 Quoted Prices | Level 2 Significant Observable Inputs | ||||||||||
Debt Securities: | ||||||||||||
Asset-Backed Securities | $ | 3,596 | $ | — | $ | 3,596 | ||||||
Convertible Bond | 335 | — | 335 | |||||||||
Corporate Bonds And Notes | 36,385 | — | 36,385 | |||||||||
Foreign Government Securities | 926 | — | 926 | |||||||||
Loan Agreements | 4,543 | — | 4,543 | |||||||||
Mortgage-Backed Securities | 17,566 | — | 17,566 | |||||||||
Municipal Bonds | 1,239 | — | 1,239 | |||||||||
U.S. Government Securities | 5,049 | — | 5,049 | |||||||||
Equity Securities: | ||||||||||||
Affiliated Mutual Fund | 1,143 | 1,143 | — | |||||||||
Preferred Stocks | 2,365 | 215 | 2,150 | |||||||||
Short-Term Investment | 1,062 | 1,062 | — | |||||||||
|
|
|
|
|
| |||||||
Total Investments | $ | 74,209 | $ | 2,420 | $ | 71,789 | ||||||
|
|
|
|
|
| |||||||
Securities held by the Fund with an end of period value of $247 were transferred from Level 1 to Level 2 since an exchange price was no longer available.
The following is a reconciliation of assets of the Fund for Level 3 investments for which significant unobservable inputs were used to determine fair value.
| Corporate Bonds And Notes | ||||
Investments in Securities | ||||
Balance as of September 30, 2014: | $ | 5 | ||
Accrued discount/(premium) | — | (c) | ||
Realized gain (loss) | — | (c) | ||
Change in unrealized appreciation (depreciation) | — | (c) | ||
Purchases | — | |||
Sales(b) | (5 | ) | ||
Transfers into Level 3(a) | — | |||
Transfers from Level 3(a) | — | |||
|
| |||
Balance as of September 30, 2015 | $ | — | ||
|
| |||
| (a) | “Transfers into and/or from” represent the ending value as of September 30, 2015, for any investment security where a change in the pricing level occurred from the beginning to the end of the period. |
| (b) | Includes paydowns on securities. |
| (c) | Amount is less than $500. |
See Notes to Financial Statements
31
Table of Contents
SCHEDULE OF INVESTMENTS
SEPTEMBER 30, 2015
($ reported in thousands)
| PAR VALUE | VALUE | |||||||
| MUNICIPAL TAX-EXEMPT BONDS(2)—98.4% | ||||||||
| Development Revenue—9.0% | ||||||||
Los Angeles County Redevelopment Refunding Authority, Long Beach Project, | $ | 215 | $ | 245 | ||||
Milpitas Redevelopment Agency Successor Agency Redevelopment Project Area #1 | 250 | 296 | ||||||
Sacramento Redevelopment Agency Successor Agency | 75 | 85 | ||||||
5.000%, 12/1/34 | 75 | 84 | ||||||
San Diego Redevelopment Agency, Center City Redevelopment Project (AMBAC Insured) | 500 | 502 | ||||||
Center City Redevelopment Project | 500 | 514 | ||||||
San Marcos Redevelopment Agency Successor Agency | 250 | 287 | ||||||
San Mateo Redevelopment Agency Successor Agency, | 250 | 283 | ||||||
Santa Clara Redevelopment Agency, Bayshore North Project (NATL Insured) | 500 | 502 | ||||||
|
| |||||||
| 2,798 | ||||||||
|
| |||||||
| General Obligation—16.0% | ||||||||
Cajon Valley Union School District Union School District 5.000%, 8/1/31 | 250 | 286 | ||||||
California, State of | 250 | 278 | ||||||
(AMBAC Insured) 5.000%, 2/1/27 | 290 | 361 | ||||||
5.000%, 9/1/32 | 300 | 339 | ||||||
5.000%, 12/1/37 | 275 | 297 | ||||||
6.000%, 4/1/38 | 250 | 291 | ||||||
Contra Costa Community College District, | 45 | 48 | ||||||
Grossmont Health Care District | 350 | 435 | ||||||
Los Alamitos Unified School District, School Facilities Improvement District #1, 2008 Election | 250 | 285 | ||||||
Los Angeles Unified School District, | 250 | 309 | ||||||
Oakland Unified School District Alameda County, (AGM Insured) 5.000%, 8/1/24 | 200 | 238 | ||||||
5.000%, 8/1/33 | 300 | 336 | ||||||
Placer Union High School District (AGM Insured) | 35 | 18 | ||||||
| PAR VALUE | VALUE | |||||||
| General Obligation—continued | ||||||||
Riverside Unified School District, (AGM Insured) | $ | 275 | $ | 296 | ||||
Ross Valley School District, | 350 | 402 | ||||||
San Diego Community College District, | 150 | 169 | ||||||
San Diego Unified School District, (AGM Insured) | 225 | 289 | ||||||
Sequoia Union High School District, | 250 | 276 | ||||||
|
| |||||||
| 4,953 | ||||||||
|
| |||||||
| General Revenue—24.3% | ||||||||
Anaheim Public Financing Authority, Public Improvement Projects, (AGM Insured) | 390 | 410 | ||||||
California Infrastructure & Economic Development Bank, | 200 | 247 | ||||||
California State Municipal Finance Authority, Bowles Hall Foundation | 100 | 106 | ||||||
Chula Vista Municipal Financing Authority, | 200 | 233 | ||||||
Contra Costa Transportation Authority, | 220 | 256 | ||||||
Golden State Tobacco Securitization Corp., | ||||||||
5.000%, 6/1/29 | 350 | 396 | ||||||
5.125%, 6/1/47 | 950 | 780 | ||||||
Imperial County Local Transportation Authority, | 300 | 331 | ||||||
Midpeninsula Regional Open Space District, | 120 | 148 | ||||||
North City West School Facilities Financing Authority, | 750 | 859 | ||||||
Pomona, City of, Certificates of Participation (AMBAC Insured) 5.500%, 6/1/28 | 700 | 709 | ||||||
Sacramento Area Flood Control Agency, Consololidated Capital Assessment District (BHAC Insured) | 250 | 282 | ||||||
South Bay Regional Public Communications Authority, Hawthorne Projects, (ACA Insured) | 435 | 439 | ||||||
| PAR VALUE | VALUE | |||||||
| General Revenue—continued | ||||||||
State of California Public Works Board, Department of General Services, Buildings 8&9 | $ | 500 | $ | 582 | ||||
Capital Projects, | 550 | 643 | ||||||
Department of Forestry & Fire Protection, | 500 | 540 | ||||||
Tustin Unified School District, Community Facilities, District #97-1, (BAM Insured) | 250 | 282 | ||||||
Ventura County Public Financing Authority, | 250 | 296 | ||||||
|
| |||||||
| 7,539 | ||||||||
|
| |||||||
| Higher Education Revenue—4.7% | ||||||||
California Educational Facilities Authority, Pomona College, | 500 | 501 | ||||||
California State University, | 500 | 560 | ||||||
University of California, | ||||||||
5.000%, 5/15/23 | 100 | 123 | ||||||
5.000%, 5/15/23 | 225 | 276 | ||||||
|
| |||||||
| 1,460 | ||||||||
|
| |||||||
| Medical Revenue—8.0% | ||||||||
California State Health Facilities Financing Authority, El Camino Hospital, | 100 | 119 | ||||||
Cedars-Sinai Medical Center, | 400 | 402 | ||||||
Kaiser Permanente, | 400 | 407 | ||||||
Lucille Salter Packard Children Hospital at Stanford, | 100 | 112 | ||||||
California State Municipal Finance Authority, Community Medical Centers, | 100 | 114 | ||||||
California Statewide Communities Development Authority, Sutter Health, (AMBAC Insured) | 205 | 216 | ||||||
Cottage Health System | 250 | 277 | ||||||
St. Joseph Health System, (FGIC Insured) | 350 | 385 | ||||||
San Benito Health Care District (CHFCLIF Insured) | 140 | 149 | ||||||
University of California, Regents Medical, (NATL Insured) | 300 | 303 | ||||||
|
| |||||||
| 2,484 | ||||||||
|
| |||||||
See Notes to Financial Statements
32
Table of Contents
VIRTUS CA TAX-EXEMPT BOND
SCHEDULE OF INVESTMENTS (Continued)
SEPTEMBER 30, 2015
($ reported in thousands)
| PAR VALUE | VALUE | |||||||
| Natural Gas Revenue—2.3% | ||||||||
Roseville Natural Gas Financing Authority, | ||||||||
5.000%, 2/15/24 | $ | 450 | $ | 501 | ||||
5.000%, 2/15/27 | 195 | 217 | ||||||
|
| |||||||
| 718 | ||||||||
|
| |||||||
| Power Revenue—3.6% | ||||||||
Northern California Power Agency, Hydroelectric Project No. 1, | 200 | 229 | ||||||
Sacramento Municipal Utility District, | ||||||||
5.000%, 8/15/26 | 350 | 411 | ||||||
5.000%, 8/15/29 | 150 | 177 | ||||||
Southern California Public Power Authority, Windy Point Project | 250 | 290 | ||||||
|
| |||||||
| 1,107 | ||||||||
|
| |||||||
| Pre-Refunded—14.9% | ||||||||
Bay Area Toll Authority, (Pre-refunded 4/1/19 @100) | 400 | 459 | ||||||
California State Department of Water Resources, Central Valley Project (Pre-refunded 6/1/18 @100) | 35 | 39 | ||||||
California State Health Facilities Financing Authority, | ||||||||
Providence Health & Services, (Pre-refunded 10/1/18 @100) | 5 | 6 | ||||||
Providence Health & Services, (Pre-refunded 10/1/18 @100) | 195 | 228 | ||||||
California State Infrastructure & Economic Development Bank, Bay Area Toll Bridges (Pre-refunded 7/1/26 @100) (AMBAC Insured) | 755 | 974 | ||||||
Los Angeles Unified School District, (Pre-refunded 7/1/17 @100)(AGM Insured) | 300 | 323 | ||||||
Northern California Power Agency, (Pre-refunded 7/1/21 @ 100) (AMBAC Insured) | 195 | 244 | ||||||
Riverside County Single Family, (Pre-refunded 11/1/15 @ 100) (GNMA Collateralized) | 1,085 | 1,439 | ||||||
Stockton Housing Facilities Revenue, O’Connors Woods Project, (Pre-refunded 9/20/17 @ 100) (GNMA Collateralized) | 155 | 162 | ||||||
University of California, | 710 | 738 | ||||||
|
| |||||||
| 4,612 | ||||||||
|
| |||||||
| PAR VALUE | VALUE | |||||||
| Transportation Revenue—6.9% | ||||||||
Los Angeles Department of Airports Department of Airports, | $ | 200 | $ | 235 | ||||
Los Angeles Harbor Department, | 235 | 270 | ||||||
San Diego County Regional Airport Authority, | ||||||||
5.000%, 7/1/40 | 250 | 274 | ||||||
5.000%, 7/1/40 | 500 | 549 | ||||||
San Diego Unified Port District, | 200 | 232 | ||||||
San Francisco City & County Airports Community, San Francisco International Airport, | 150 | 167 | ||||||
San Francisco Municipal Transportation Agency, | ||||||||
5.000%, 3/1/31 | 125 | 143 | ||||||
5.000%, 3/1/33 | 250 | 288 | ||||||
|
| |||||||
| 2,158 | ||||||||
|
| |||||||
| Water & Sewer Revenue—8.7% | ||||||||
Los Angeles County Sanitation District #14 | 300 | 372 | ||||||
Los Angeles Department of Water & Power, | 295 | 341 | ||||||
Manteca, City of, Water Revenue, | 300 | 346 | ||||||
Oakland, City of, Sewer Revenue, | 200 | 237 | ||||||
Ross Valley Public Financing Authority, Sanitary District #1 (AGM Insured) | 225 | 263 | ||||||
San Diego County Water Authority, | 250 | 289 | ||||||
Santa Margarita-Dana Point Authority, Water Improvements Districts #‘s 2,3,4, | 630 | 693 | ||||||
Silicon Valley Clean Water, Sewer Improvement | 150 | 171 | ||||||
|
| |||||||
| 2,712 | ||||||||
| TOTAL MUNICIPAL TAX-EXEMPT BONDS (Identified Cost $28,913) | 30,541 | |||||||
| TOTAL LONG TERM INVESTMENTS—98.4% | ||||||||
| (Identified Cost $28,913) | 30,541 | |||||||
| TOTAL INVESTMENTS—98.4% (Identified Cost $28,913) | 30,541 | (1) | ||||||
Other assets and liabilities, net—1.6% |
| 496 | ||||||
|
| |||||||
| NET ASSETS—100.0% | $ | 31,037 | ||||||
|
| |||||||
Abbreviations:
| ACA | American Capital Access Financial Guarantee Corp. |
| AGM | Assured Guaranty Municipal Corp. |
| AMBAC | American Municipal Bond Assurance Corp. |
| BAM | Build America Municipal Insured. |
| BHAC | Berkshire Hathaway Assurance Corp. |
| CHFCLIF | California Health Facility Construction Loan Insurance Fund. |
| FGIC | Financial Guaranty Insurance Company |
| GNMA | Government National Mortgage Association (“Ginnie Mae”) |
| NATL | National Public Finance Guarantee Corp. |
Footnote Legend:
| (1) | Federal Income Tax Information: For tax information at September 30, 2015, see Note 10 Federal Income Tax Information in the Notes to Financial Statements. |
| (2) | At September 30, 2015, the concentration of the Fund’s investments by state or territory determined as a percentage of net assets is as follows: California 100%. At September 30, 2015, 38.5% of the securities in the portfolio are backed by insurance of financial institutions and financial guaranty assurance agencies. Insurers with a concentration greater than 10% of net assets are as follows: AMBAC 14.3%. |
The following table provides a summary of inputs used to value the Fund’s investments as of September 30, 2015 (See Security Valuation Note 2A in the Notes to Financial Statements):
| Total Value at September 30, 2015 | Level 2 Significant Observable Inputs | |||||||
Debt Securities: | ||||||||
Municipal Tax-Exempt Bonds | $ | 30,541 | $ | 30,541 | ||||
|
|
|
| |||||
Total Investments | $ | 30,541 | $ | 30,541 | ||||
|
|
|
| |||||
There are no Level 1 (quoted Prices) or Level 3 (significant unobservable inputs) priced securities.
There were no transfers between Level 1 and Level 2 related to securities held at September 30, 2015.
Security abbreviation definitions are located under the Key Investment Terms starting on page 4.
See Notes to Financial Statements
33
Table of Contents
VIRTUS ESSENTIAL RESOURCES FUND
SCHEDULE OF INVESTMENTS
SEPTEMBER 30, 2015
($ reported in thousands)
| SHARES | VALUE | |||||||
| COMMON STOCKS—96.7% | ||||||||
| Consumer Discretionary—4.0% | ||||||||
Delphi Automotive plc (United Kingdom) | 395 | $ | 30 | |||||
EnerCare, Inc. (Canada) | 7,572 | 80 | ||||||
Johnson Controls, Inc. (United States) | 1,253 | 52 | ||||||
|
| |||||||
| 162 | ||||||||
|
| |||||||
| Consumer Staples—13.9% | ||||||||
Adecoagro SA (Brazil)(2) | 5,844 | 47 | ||||||
AG Growth International, Inc. (Canada) | 684 | 18 | ||||||
Andersons, Inc. (The) (United States) | 754 | 26 | ||||||
Archer-Daniels-Midland Co. (United States) | 1,295 | 54 | ||||||
Aryzta AG (Switzerland) | 477 | 20 | ||||||
Bunge Ltd. (United States) | 1,027 | 75 | ||||||
Golden Agri-Resources Ltd. (Singapore) | 133,000 | 31 | ||||||
Greencore Group plc (Ireland) | 5,558 | 23 | ||||||
Indofood Agri Resources Ltd. (Singapore) | 56,000 | 20 | ||||||
JBS SA (Brazil) | 3,900 | 16 | ||||||
KWS SAAT AG (Germany) | 78 | 26 | ||||||
Marine Harvest ASA (Norway) | 1,984 | 25 | ||||||
Minerva Sa/Brazil (Brazil) | 6,600 | 22 | ||||||
Origin Enterprises plc (Ireland) | 6,560 | 47 | ||||||
Purecircle Ltd. (United Kingdom)(2) | 4,295 | 28 | ||||||
SLC Agricola SA (Brazil) | 10,800 | 49 | ||||||
SunOpta, Inc. (Canada)(2) | 5,449 | 26 | ||||||
United Natural Foods, Inc. (United States)(2) | 292 | 14 | ||||||
|
| |||||||
| 567 | ||||||||
|
| |||||||
| Energy—5.0% | ||||||||
Cosan Ltd. (Brazil) | 21,100 | 61 | ||||||
Energy Development Corp. (Philippines) | 188,300 | 22 | ||||||
Greenko Group plc (India)(2) | 10,255 | 12 | ||||||
Infinis Energy plc (United Kingdom) | 10,446 | 21 | ||||||
Innergex Renewable Energy, Inc. (Canada) | 3,498 | 28 | ||||||
Newalta Corp. (Canada) | 2,657 | 18 | ||||||
Pattern Energy Group, Inc. (United States) | 1,267 | 24 | ||||||
TransAlta Renewables, Inc. (Canada) | 2,336 | 18 | ||||||
|
| |||||||
| 204 | ||||||||
|
| |||||||
| Financials—4.7% | ||||||||
Capital Stage AG (Germany) | 3,900 | 38 | ||||||
Gladstone Land Corp. (United States) | 2,310 | 21 | ||||||
Hannon Armstrong Sustainable Infrastructure Capital, Inc. (United States) | 1,049 | 18 | ||||||
Metro Pacific Investments Corp. (Philippines) | 62,400 | 7 | ||||||
PICO Holdings, Inc. (United States)(2) | 3,524 | 34 | ||||||
| SHARES | VALUE | |||||||
| Financials—continued | ||||||||
Renewables Infrastructure Group Ltd. (The) (United Kingdom) | 30,209 | $ | 46 | |||||
Saeta Yield SA (Spain) | 3,111 | 29 | ||||||
|
| |||||||
| 193 | ||||||||
|
| |||||||
| Health Care—0.6% | ||||||||
Genus plc (United Kingdom) | 1,180 | 25 | ||||||
|
| |||||||
| Industrials—32.3% | ||||||||
Aegion Corp. (United States)(2) | 1,611 | 27 | ||||||
AGCO Corp. (United States) | 500 | 23 | ||||||
Ameresco, Inc. (United States)(2) | 3,866 | 23 | ||||||
Amiad Water Systems Ltd. (Israel) | 3,414 | 8 | ||||||
Arcadis NV (Netherlands) | 2,422 | 57 | ||||||
BayWa AG (Germany) | 1,635 | 53 | ||||||
Canadian National Railway Co. (Canada) | 432 | 25 | ||||||
China Everbright International Ltd. (Hong Kong)(2) | 8,000 | 11 | ||||||
Covanta Holding Corp. (United States) | 2,876 | 50 | ||||||
CSX Corp. (United States) | 2,038 | 55 | ||||||
Danaher Corp. (United States) | 525 | 45 | ||||||
Deere & Co. (United States) | 246 | 18 | ||||||
Dialight plc (United Kingdom) | 840 | 8 | ||||||
DIRTT Environmental Solutions (Canada)(2) | 1,683 | 7 | ||||||
Eaton Corp. plc (United States) | 774 | 40 | ||||||
Ebara Corp. (Japan) | 6,000 | 22 | ||||||
Empresas ICA Sab de CV (Mexico)(2) | 42,700 | 18 | ||||||
Flowserve Corp. (United States) | 433 | 18 | ||||||
Franklin Electric Co., Inc. (United States) | 596 | 16 | ||||||
FuelCell Energy, Inc. | 7,477 | 5 | ||||||
Gamesa Corp Tecnologica SA (Spain) | 1,425 | 20 | ||||||
GEA Group AG (Germany) | 1,328 | 51 | ||||||
Georg Fisher AG Registered Shares (Switzerland) | 65 | 37 | ||||||
HD Supply Holdings, Inc. (United States)(2) | 1,887 | 54 | ||||||
Lumenpulse, Inc. (Canada)(2) | 1,425 | 13 | ||||||
MasTec, Inc. (United States)(2) | 435 | 7 | ||||||
Mueller Water Products, Inc. Class A (United States) | 6,231 | 48 | ||||||
Noble Group Ltd. (Singapore) | 35,000 | 10 | ||||||
Pentair plc (United States) | 1,302 | 66 | ||||||
PNE Wind AG (Germany)(2) | 8,693 | 20 | ||||||
Prysmian SpA (Italy) | 814 | 17 | ||||||
Quanta Services, Inc. (United States) | 657 | 16 | ||||||
Regal-Beloit Corp. (United States) | 496 | 28 | ||||||
Rexnord Corp. (United States)(2) | 4,103 | 70 | ||||||
Rotork plc. (United Kingdom) | 3,167 | 8 | ||||||
Rumo Logistica Operadora Multimodal SA (Brazil)(2) | 5,930 | 9 | ||||||
SIG plc (United Kingdom) | 13,438 | 35 | ||||||
SPX Corp. (United States) | 1,613 | 19 | ||||||
SPX Flow, Inc. (United States)(2) | 2,599 | 89 | ||||||
Tetra Tech, Inc. (United States) | 1,621 | 39 | ||||||
Toro Co. (The) (United States) | 424 | 30 | ||||||
Xylem, Inc. (United States) | 1,690 | 56 | ||||||
Zumtobel Group AG (Austria) | 2,094 | 46 | ||||||
|
| |||||||
| 1,317 | ||||||||
|
| |||||||
| SHARES | VALUE | |||||||
| Information Technology—11.2% | ||||||||
Canadian Solar, Inc. (Canada)(2) | 2,574 | $ | 43 | |||||
Daqo New Energy Corp. ADR (China)(2) | 421 | 7 | ||||||
First Solar, Inc. (United States)(2) | 1,116 | 48 | ||||||
GCL-Poly Energy Holdings Ltd. (China)(2) | 88,000 | 17 | ||||||
Itron, Inc. (United States)(2) | 2,426 | 77 | ||||||
JinkoSolar Holding Co.Ltd. ADR (China)(2) | 2,120 | 46 | ||||||
PSI AG Gesellschaft Fuer Produkte Und Systeme Der Informationstechnologie (Germany)(2) | 992 | 13 | ||||||
Pure Technologies Ltd. (Canada) | 6,960 | 27 | ||||||
SolarEdge Technologies, Inc. (United States)(2) | 615 | 14 | ||||||
SunEdison, Inc. (United States)(2) | 1,210 | 9 | ||||||
SunPower Corp. (United States)(2) | 4,173 | 84 | ||||||
Trimble Navigation Ltd. (United States)(2) | 1,464 | 24 | ||||||
Trina Solar Ltd. ADR (China)(2) | 5,452 | 49 | ||||||
|
| |||||||
| 458 | ||||||||
|
| |||||||
| Materials—11.6% | ||||||||
Agrium, Inc. (Canada) | 550 | 49 | ||||||
Calgon Carbon Corp. (United States) | 3,400 | 53 | ||||||
CF Industries Holdings, Inc. (United States) | 313 | 14 | ||||||
Ecolab, Inc. (United States) | 254 | 28 | ||||||
FMC Corp. (United States) | 481 | 16 | ||||||
Israel Chemicals Ltd. (Israel) | 3,593 | 18 | ||||||
Johnson Matthey plc (United Kingdom) | 1,104 | 41 | ||||||
Monsanto Co. (United States) | 463 | 40 | ||||||
Mosaic Co. (The) (United States) | 1,301 | 40 | ||||||
PhosAgro OAO GDR Registered Shares (Russia) | 3,093 | 43 | ||||||
Plant Health Care plc (United Kingdom)(2) | 10,774 | 15 | ||||||
Potash Corp. of Saskatchewan, Inc. (Canada) | 1,515 | 31 | ||||||
Syngenta AG Registered Shares (Switzerland) | 172 | 55 | ||||||
Yara International ASA (Norway) | 746 | 30 | ||||||
|
| |||||||
| 473 | ||||||||
|
| |||||||
| Utilities—13.4% | ||||||||
American Water Works Co., Inc. (United States) | 648 | 36 | ||||||
Aqua America, Inc. (United States) | 1,169 | 31 | ||||||
Beijing Enterprises Water Group Ltd. Class H (Hong Kong) | 22,000 | 15 | ||||||
Beijing Jingneng Clean Energy Co., Ltd. (China) | 96,000 | 29 | ||||||
California Water Service Group (United States) | 1,750 | 39 | ||||||
Capstone Infrastructure Corp. (Canada) | 26,054 | 60 | ||||||
China Everbright Water Ltd. (China)(2) | 18,800 | 8 | ||||||
Companhia de Saneamento Basico do Estado de Sao Paulo ADR (Brazil) | 3,695 | 14 | ||||||
See Notes to Financial Statements
34
Table of Contents
VIRTUS ESSENTIAL RESOURCES FUND
SCHEDULE OF INVESTMENTS (Continued)
SEPTEMBER 30, 2015
($ reported in thousands)
| SHARES | VALUE | |||||||
| Utilities—continued | ||||||||
Companhia de Saneamento de Minas Gerais (Brazil) | 2,500 | $ | 8 | |||||
CT Environmental Group (Cayman Islands) | 24,000 | 8 | ||||||
EDP Renovaveis SA (Spain) | 4,004 | 26 | ||||||
Huaneng Renewables Corp. Ltd. Class H (China) | 100,000 | 37 | ||||||
Manila Water Co, Inc. (Philippines) | 24,600 | 11 | ||||||
National Grid plc (United Kingdom) | 1,990 | 28 | ||||||
NextEra Energy, Inc. (United States) | 280 | 27 | ||||||
Northland Power, Inc. (Canada) | 2,138 | 28 | ||||||
SevernTrent plc (United Kingdom) | 608 | 20 | ||||||
Suez Environnement SA (France) | 3,883 | 70 | ||||||
United Utilities Group plc (United Kingdom) | 2,130 | 30 | ||||||
Veolia Environnement SA (France) | 911 | 21 | ||||||
|
| |||||||
| 546 | ||||||||
| TOTAL COMMON STOCKS (Identified Cost $4,918) | 3,945 | |||||||
| CLOSED END FUNDS—0.8% | ||||||||
| Financials—0.3% | ||||||||
Greencoat UK Wind plc Fund (United Kingdom) | 8,453 | 14 | ||||||
|
| |||||||
| SHARES | VALUE | |||||||
| Industrials—0.5% | ||||||||
Chemtrade Logistics Income Fund (Canada) | 1,460 | $ | 19 | |||||
| TOTAL CLOSED END FUNDS (Identified Cost $39) | 33 | |||||||
| TOTAL LONG TERM INVESTMENTS—97.5% | ||||||||
| (Identified Cost $4,957) | 3,978 | |||||||
| SHORT-TERM INVESTMENT—1.8% | ||||||||
| Money Market Mutual Fund—1.8% | ||||||||
Fidelity Money Market Portfolio – Institutional Shares (seven-day effective yield 0.170%) | 72,144 | 72 | ||||||
| TOTAL SHORT-TERM INVESTMENT (Identified Cost $72) | 72 | |||||||
| TOTAL INVESTMENTS—99.3% (Identified Cost $5,029) | 4,050 | (1) | ||||||
Other assets and liabilities, net—0.7% |
| 27 | ||||||
|
| |||||||
| NET ASSETS—100.0% | $ | 4,077 | ||||||
|
| |||||||
Abbreviation:
| ADR | American Depositary Receipt |
Footnote Legend:
| (1) | Federal Income Tax Information: For tax information at September 30, 2015, see Note 10 Federal Income Tax Information in the Notes to Financial Statements. |
| (2) | Non-income producing. |
| Country Weightings (Unaudited)† | ||||
United States | 45 | % | ||
Canada | 12 | |||
United Kingdom | 9 | |||
Brazil | 5 | |||
China | 5 | |||
Germany | 5 | |||
Switzerland | 3 | |||
Other | 16 | |||
Total | 100 | % | ||
† % of total investments as of September 30, 2015 |
| |||
The following table provides a summary of inputs used to value the Fund’s investments as of September 30, 2015 (See Security Valuation Note 2A in the Notes to Financial Statements):
| Total Value at September 30, 2015 | Level 1 Quoted Prices | Level 2 Significant Observable Inputs | ||||||||||
Equity Securities: | ||||||||||||
Closed End Funds | $ | 33 | $ | 33 | $ | — | ||||||
Common Stocks | 3,945 | 3,696 | 249 | |||||||||
Short-Term Investment | 72 | 72 | — | |||||||||
|
|
|
|
|
| |||||||
Total Investments | $ | 4,050 | $ | 3,801 | $ | 249 | ||||||
|
|
|
|
|
| |||||||
There are no Level 3 (significant unobservable inputs) priced securities.
There were no transfers between Level 1 and Level 2 related to securities held at September 30, 2015.
See Notes to Financial Statements
35
Table of Contents
SCHEDULE OF INVESTMENTS
SEPTEMBER 30, 2015
($ reported in thousands)
| PAR VALUE | VALUE | |||||||
| MORTGAGE-BACKED SECURITIES—1.7% | ||||||||
| Non-Agency—1.7% | ||||||||
Citigroup Mortgage Loan Trust, Inc. 05-5, 2A3 | $ | 124 | $ | 123 | ||||
Goldman Sachs Residential Mortgage Loan Trust 05-5F, B1 | 273 | 265 | ||||||
Home Equity Loan Trust 07-HSA3, AI4 | 415 | 421 | ||||||
MASTR Reperforming Loan Trust 05-1, 1A5 144A | 240 | 257 | ||||||
Residential Accredit Loans, Inc. 05-QS1, A5 | 137 | 139 | ||||||
| TOTAL MORTGAGE-BACKED SECURITIES (Identified Cost $1,182) | 1,205 | |||||||
| ASSET-BACKED SECURITIES—0.6% | ||||||||
Greater Capital Association of Realtors 15-1A, C | 250 | 250 | ||||||
LEAF Receivables Funding 10 LLC 15-1, E2 144A | 160 | 154 | ||||||
| TOTAL ASSET-BACKED SECURITIES (Identified Cost $407) | 404 | |||||||
| CORPORATE BONDS AND NOTES—80.2% | ||||||||
| Consumer Discretionary—22.6% | ||||||||
Argos Merger Sub, Inc. 144A | 700 | 710 | ||||||
Boyd Gaming Corp. | ||||||||
9.000%, 7/1/20 | 275 | 294 | ||||||
6.875%, 5/15/23 | 265 | 270 | ||||||
Brookfield Residential Properties, Inc. 144A | 35 | 34 | ||||||
Caesars Entertainment Operating Co., Inc. | 450 | 371 | ||||||
Caesars Entertainment Resort Properties LLC | 300 | 287 | ||||||
Caesars Growth Properties Holdings LLC (Caesars Growth Properties Finance, Inc.) | 260 | 205 | ||||||
CCO Holdings LLC | ||||||||
(CCO Holdings Capital Corp.) 6.500%, 4/30/21 | 500 | 503 | ||||||
144A 5.125%, 5/1/23(3) | 215 | 198 | ||||||
CCO Safari II LLC 144A | 110 | 110 | ||||||
Cequel Communications | 400 | 379 | ||||||
| PAR VALUE | VALUE | |||||||
| Consumer Discretionary—continued | ||||||||
Clear Channel Worldwide Holdings, Inc. | $ | 150 | $ | 150 | ||||
Series B | 1,495 | 1,504 | ||||||
Columbus International, Inc. series B,144A | 245 | 254 | ||||||
CSC Holdings LLC | 450 | 356 | ||||||
Dana Holding Corp. | 100 | 97 | ||||||
DISH DBS Corp. | 475 | 399 | ||||||
Fiat Chrysler Automobiles NV | 250 | 234 | ||||||
Hilton Worldwide Finance LLC / Hilton Worldwide Finance Corp. | 550 | 571 | ||||||
iHeartCommunications, Inc. | 250 | 133 | ||||||
9.000%, 3/1/21 | 600 | 503 | ||||||
Intelsat Jackson Holdings SA | 425 | 352 | ||||||
Landry’s Holdings II, Inc. 144A | 175 | 180 | ||||||
Landry’s, Inc. 144A | 425 | 455 | ||||||
Lennar Corp. | 215 | 218 | ||||||
MDC Holdings, Inc. | 325 | 330 | ||||||
Meritor, Inc. | 500 | 505 | ||||||
MGM Resorts International | 650 | 674 | ||||||
Mohegan Tribal Gaming Authority | 65 | 66 | ||||||
9.750%, 9/1/21 | 100 | 102 | ||||||
MPG Holdco I, Inc. | 225 | 235 | ||||||
Numericable Group SA 144A | 465 | 449 | ||||||
Omega US Sub LLC 144A | 650 | 579 | ||||||
Party City Holdings, Inc. 144A | 35 | 35 | ||||||
Penn National Gaming, Inc. | 490 | 497 | ||||||
Pinnacle Entertainment, Inc. | 300 | 319 | ||||||
RCN Telecom Services LLC (RCN Capital Corp.) 144A | 670 | 694 | ||||||
Scientific Games International, Inc. | 250 | 181 | ||||||
144A 7.000%, 1/1/22(3) | 350 | 347 | ||||||
Standard Pacific Corp. | 120 | 129 | ||||||
5.875%, 11/15/24 | 150 | 155 | ||||||
| PAR VALUE | VALUE | |||||||
| Consumer Discretionary—continued | ||||||||
Tempur Sealy International Inc 144A | $ | 110 | $ | 110 | ||||
TRI Pointe Holdings, Inc. | 400 | 394 | ||||||
Univision Communications, Inc. 144A | 475 | 454 | ||||||
UPCB Finance IV Ltd. 144A | 200 | 189 | ||||||
UPCB Finance Ltd. Series V 144A | 44 | 47 | ||||||
VTR Finance B.V. 144A | 450 | 410 | ||||||
|
| |||||||
| 15,668 | ||||||||
|
| |||||||
| Consumer Staples—2.0% | ||||||||
Dole Food Co., Inc. 144A | 250 | 250 | ||||||
Pilgrim’s Pride Corp. 144A | 105 | 103 | ||||||
Rite Aid Corp. | ||||||||
6.750%, 6/15/21 | 475 | 488 | ||||||
144A 6.125%, 4/1/23(3) | 65 | 65 | ||||||
Roundy’s Supermarkets, Inc. 144A | 250 | 171 | ||||||
Tops Holding LLC (Tops Markets II Corp.) 144A | 275 | 276 | ||||||
|
| |||||||
| 1,353 | ||||||||
|
| |||||||
| Energy—8.0% | ||||||||
Antero Resources Corp. 144A | 275 | 243 | ||||||
Blue Racer Midstream LLC (Blue Racer Finance Corp.) 144A | 340 | 325 | ||||||
CONSOL Energy, Inc. | 200 | 135 | ||||||
Crestwood Midstream Partners LP (Crestwood Midstream Finance Corp.) 144A | 295 | 252 | ||||||
Denbury Resources, Inc. | 150 | 90 | ||||||
Energy Transfer Partners LP | 400 | 362 | ||||||
EnQuest plc 144A | 250 | 156 | ||||||
EP Energy LLC (Everest Acquisition Finance, Inc.) | ||||||||
9.375%, 5/1/20 | 215 | 186 | ||||||
6.375%, 6/15/23 | 230 | 171 | ||||||
Exterran Partners LP (EXLP Finance Corp.) | 300 | 253 | ||||||
FTS International, Inc. | ||||||||
144A 7.837%, 6/15/20(2)(3) | 230 | 170 | ||||||
6.250%, 5/1/22 | 190 | 60 | ||||||
See Notes to Financial Statements
36
Table of Contents
VIRTUS HIGH YIELD FUND
SCHEDULE OF INVESTMENTS (Continued)
SEPTEMBER 30, 2015
($ reported in thousands)
| PAR VALUE | VALUE | |||||||
| Energy—continued | ||||||||
Gulfport Energy, Corp. | $ | 250 | $ | 247 | ||||
Halcon Resources Corp. 144A 8.625%, 2/1/20(3) | 160 | 134 | ||||||
Helmerich & Payne International Drilling Co. | 150 | 149 | ||||||
Linn Energy LLC (Linn Energy Finance Corp.) | 200 | 47 | ||||||
MarkWest Energy Partners LP (MarkWest Energy Finance Corp.) | 325 | 299 | ||||||
Newfield Exploration Co. | 300 | 274 | ||||||
NGL Energy Partners LP (NGL Energy Finance Corp.) | 200 | 183 | ||||||
Pacific Exploration and Production Corp. 144A | 100 | 38 | ||||||
Parker Drilling Co. (The) | 200 | 165 | ||||||
Regency Energy Partners LP | 235 | 241 | ||||||
Sabine Oil & Gas Corp. | 329 | 48 | ||||||
Sabine Pass Liquefaction LLC | 380 | 354 | ||||||
SM Energy Co. | 200 | 186 | ||||||
Sunoco LP (Sunoco Finance Corp.) | ||||||||
144A 5.500%, 8/1/20(3) | 220 | 218 | ||||||
144A 6.375%, 4/1/23(3) | 425 | 418 | ||||||
Whiting Petroleum Corp. | 125 | 109 | ||||||
|
| |||||||
| 5,513 | ||||||||
|
| |||||||
| Financials—9.3% | ||||||||
Aircastle Ltd. | 550 | 553 | ||||||
Ally Financial, Inc. | 95 | 94 | ||||||
Corrections Corp of America | 255 | 257 | ||||||
CTR Partnership LP (Caretrust Capital Corp.) | 300 | 307 | ||||||
CyrusOne LP (CyrusOne Finance Corp.) 144A | 350 | 357 | ||||||
DuPont Fabros Technology LP | 350 | 360 | ||||||
Dycom Investments, Inc. | 300 | 316 | ||||||
ESH Hospitality, Inc. 144A | 225 | 222 | ||||||
First Cash Financial Services, Inc. | 250 | 251 | ||||||
| PAR VALUE | VALUE | |||||||
| Financials—continued | ||||||||
Genworth Holdings, Inc. | $ | 350 | $ | 274 | ||||
GLP Capital LP (GLP Financing II, Inc.) | ||||||||
4.875%, 11/1/20 | 215 | 218 | ||||||
5.375%, 11/1/23 | 5 | 5 | ||||||
Hertz Corp. (The) | 350 | 353 | ||||||
ICAHN Enterprises LP (ICAHN Enterprises Finance Corp.) | 300 | 302 | ||||||
ING Groep NV | 200 | 197 | ||||||
iStar Financial, Inc. | 500 | 477 | ||||||
Nationstar Mortgage LLC | 250 | 208 | ||||||
Navient LLC | 200 | 158 | ||||||
Springleaf Finance Corp. | 550 | 539 | ||||||
Sprint Capital Corp. | 325 | 287 | ||||||
Voya Financial, Inc. | 205 | 208 | ||||||
Walter Investment Management Corp. | 300 | 258 | ||||||
York Risk Services Holding Corp. 144A | 275 | 235 | ||||||
|
| |||||||
| 6,436 | ||||||||
|
| |||||||
| Health Care—14.3% | ||||||||
Acadia Healthcare Co., Inc. | ||||||||
5.125%, 7/1/22 | 145 | 143 | ||||||
144A 5.625%, 2/15/23(3) | 30 | 30 | ||||||
Alere, Inc. | ||||||||
6.500%, 6/15/20 | 350 | 357 | ||||||
144A 6.375%, 7/1/23(3) | 115 | 117 | ||||||
Capsugel SA PIK Interest Capitalization 144A | 275 | 275 | ||||||
Community Health Systems, Inc. | ||||||||
5.125%, 8/1/21 | 300 | 306 | ||||||
6.875%, 2/1/22 | 145 | 148 | ||||||
Concordia Healthcare Corp. 144A | 450 | 394 | ||||||
Crimson Merger Sub, Inc. 144A | 225 | 194 | ||||||
DaVita Healthcare Partners, Inc. | ||||||||
5.125%, 7/15/24 | 310 | 305 | ||||||
5.000%, 5/1/25 | 100 | 96 | ||||||
DJO Finco, Inc. (DJO Finance | 210 | 205 | ||||||
Emdeon, Inc. 144A | 340 | 331 | ||||||
| PAR VALUE | VALUE | |||||||
| Health Care—continued | ||||||||
Endo Finance LLC (Endo Finco, Inc.) 144A | $ | 250 | $ | 241 | ||||
Envision Healthcare Corp. 144A | 300 | 298 | ||||||
Fresenius US Finance II, Inc. 144A | 60 | 60 | ||||||
HCA, Inc. | ||||||||
6.500%, 2/15/20 | 425 | 463 | ||||||
5.375%, 2/1/25 | 600 | 597 | ||||||
Healthsouth Corp. | ||||||||
144A 5.750%, 11/1/24(3) | 40 | 40 | ||||||
144A 5.750%, 9/15/25(3) | 275 | 267 | ||||||
Hill-Rom Holdings, Inc. 144A | 375 | 378 | ||||||
Hologic, Inc. 144A | 55 | 56 | ||||||
inVentiv Health, Inc. 144A | 130 | 134 | ||||||
Jaguar Holding Co. II (Pharmaceutical Product Development LLC) 144A | 230 | 224 | ||||||
JLL Delta Dutch Pledgeco BV PIK Interest Capitalization, 8.75% interest, | 245 | 247 | ||||||
Mallinckrodt International Finance S.A. | ||||||||
144A 4.875%, 4/15/20(3) | 10 | 10 | ||||||
144A 5.750%, 8/1/22(3) | 105 | 102 | ||||||
144A 5.625%, 10/15/23(3) | 435 | 397 | ||||||
144A 5.500%, 4/15/25(3) | 20 | 18 | ||||||
Pinnacle Merger Sub, Inc. (PRA Holdings, Inc.) 144A | 225 | 249 | ||||||
Quintiles Transnational Corp. 144A | 300 | 298 | ||||||
Select Medical Corp. | 350 | 343 | ||||||
Sterigenics-Nordion Holdings LLC 144A | 325 | 323 | ||||||
Surgical Care Affiliates, Inc. 144A | 400 | 398 | ||||||
Tenet Healthcare Corp. | ||||||||
6.000%, 10/1/20 | 375 | 397 | ||||||
4.500%, 4/1/21 | 275 | 272 | ||||||
Valeant Pharmaceuticals International, Inc. | ||||||||
144A 6.750%, 8/15/18(3) | 155 | 158 | ||||||
144A 5.375%, 3/15/20(3) | 800 | 780 | ||||||
144A 7.250%, 7/15/22(3) | 250 | 258 | ||||||
|
| |||||||
| 9,909 | ||||||||
|
| |||||||
| Industrials—6.7% | ||||||||
ADS Waste Holdings, Inc. | 300 | 301 | ||||||
See Notes to Financial Statements
37
Table of Contents
VIRTUS HIGH YIELD FUND
SCHEDULE OF INVESTMENTS (Continued)
SEPTEMBER 30, 2015
($ reported in thousands)
| PAR VALUE | VALUE | |||||||
| Industrials—continued | ||||||||
ADT Corp. (The) | $ | 400 | $ | 414 | ||||
Ahern Rentals, Inc. 144A | 274 | 240 | ||||||
American Airlines Group, Inc. 144A | 160 | 156 | ||||||
Bombardier, Inc. 144A | 200 | 148 | ||||||
Builders FirstSource, Inc. | ||||||||
144A 7.625%, 6/1/21(3) | 300 | 314 | ||||||
144A 10.750%, 8/15/23(3) | 150 | 151 | ||||||
Building Materials Corp. of America 144A | 170 | 169 | ||||||
CEB, Inc. 144A | 150 | 150 | ||||||
Garda World Security Corp. 144A | 410 | 378 | ||||||
Harland Clarke Holdings Corp. | ||||||||
144A 6.875%, 3/1/20(3) | 150 | 136 | ||||||
144A 9.250%, 3/1/21(3) | 300 | 250 | ||||||
HD Supply, Inc. 144A | 400 | 404 | ||||||
JBS Investments GmbH 144A | 200 | 193 | ||||||
NCI Building Systems, Inc. 144A | 290 | 305 | ||||||
TransDigm, Inc. | ||||||||
6.000%, 7/15/22 | 300 | 281 | ||||||
144A 6.500%, 5/15/25(3) | 230 | 217 | ||||||
United Rentals North America, Inc. | 500 | 469 | ||||||
|
| |||||||
| 4,676 | ||||||||
|
| |||||||
| Information Technology—1.8% | ||||||||
First Data Corp. | 675 | 751 | ||||||
Interactive Data Corp. 144A | 300 | 302 | ||||||
Riverbed Technology, Inc. 144A | 215 | 196 | ||||||
|
| |||||||
| 1,249 | ||||||||
|
| |||||||
| Materials—6.0% | ||||||||
ArcelorMittal | 150 | 122 | ||||||
Ardagh Packaging Finance plc | ||||||||
144A 6.250%, 1/31/19(3) | 145 | 145 | ||||||
144A 9.125%, 10/15/20(3) | 275 | 287 | ||||||
144A 6.750%, 1/31/21(3) | 295 | 297 | ||||||
Berry Plastics Corp. | 400 | 379 | ||||||
Beverage Packaging Holdings Luxembourg II SA 144A | 180 | 177 | ||||||
Cascades, Inc. | ||||||||
144A 5.500%, 7/15/22(3) | 575 | 548 | ||||||
144A 5.750%, 7/15/23(3) | 225 | 215 | ||||||
| PAR VALUE | VALUE | |||||||
| Materials—continued | ||||||||
Cemex SAB de CV 144A | $ | 245 | $ | 245 | �� | |||
Eldorado Gold Corp. 144A | 150 | 132 | ||||||
Fortescue Metals Group (FMG) Resources August 2006 Pty Ltd. 144A | 185 | 173 | ||||||
Hexion U.S. Finance Corp. | 260 | 222 | ||||||
INEOS Group Holdings SA | ||||||||
144A 6.125%, 8/15/18(3) | 235 | 222 | ||||||
144A 5.875%, 2/15/19(3) | 305 | 285 | ||||||
Owens-Brockway Glass Container, Inc. 144A | 20 | 20 | ||||||
Reynolds Group Issuer, Inc. | 190 | 191 | ||||||
Sappi Papier Holding GmbH 144A | 300 | 305 | ||||||
United States Steel Corp. | 100 | 77 | ||||||
Vedanta Resources plc 144A | 100 | 84 | ||||||
|
| |||||||
| 4,126 | ||||||||
|
| |||||||
| Telecommunication Services—7.0% | ||||||||
Altice Financing SA | ||||||||
144A 6.625%, 2/15/23(3) | 480 | 462 | ||||||
Luxemborg, 144A | 480 | 422 | ||||||
US II Corp. 144A | 200 | 178 | ||||||
CenturyLink, Inc. Series V | 375 | 348 | ||||||
Digicel Group Ltd. 144A | 310 | 288 | ||||||
Frontier Communications Corp. | ||||||||
8.500%, 4/15/20 | 425 | 414 | ||||||
144A 8.875%, 9/15/20(3) | 40 | 39 | ||||||
6.250%, 9/15/21 | 125 | 105 | ||||||
144A 10.500%, 9/15/22(3) | 45 | 44 | ||||||
Level 3 Financing, Inc. | 250 | 259 | ||||||
Millicom International Cellular SA 144A | 300 | 298 | ||||||
Neptune Finco Corp. | ||||||||
144A 10.125%, 1/15/23(3) | 210 | 212 | ||||||
144A 6.625%, 10/15/25(3) | 210 | 212 | ||||||
Sprint Capital Corp. | 250 | 182 | ||||||
Sprint Corp. | 325 | 264 | ||||||
T-Mobile USA, Inc. | ||||||||
6.625%, 11/15/20 | 150 | 153 | ||||||
6.125%, 1/15/22 | 240 | 232 | ||||||
6.836%, 4/28/23 | 250 | 248 | ||||||
6.500%, 1/15/24 | 275 | 267 | ||||||
Windstream Corp. | 300 | 234 | ||||||
|
| |||||||
| 4,861 | ||||||||
|
| |||||||
| PAR VALUE | VALUE | |||||||
| Utilities—2.5% | ||||||||
Abengoa Yield plc 144A | $ | 230 | $ | 203 | ||||
AmeriGas Partners LP | 325 | 335 | ||||||
Calpine Corp. | 350 | 328 | ||||||
NRG Yield Operating LLC | 190 | 168 | ||||||
Talen Energy Supply LLC 144A | 325 | 297 | ||||||
TerraForm Power Operating LLC 144A | 250 | 222 | ||||||
Texas Competitive Electric Holdings Co. LLC 144A | 500 | 195 | ||||||
|
| |||||||
| 1,748 | ||||||||
| TOTAL CORPORATE BONDS AND NOTES (Identified Cost $59,515) | 55,539 | |||||||
| LOAN AGREEMENTS(2)—10.4% | ||||||||
| Consumer Discretionary—2.6% | ||||||||
Brickman Group Ltd. LLC (The) Second Lien, | 225 | 220 | ||||||
Caesars Entertainment Operating Co., Inc. Tranche B-7, | 165 | 150 | ||||||
CBAC Borrower LLC Tranche B, | 95 | 90 | ||||||
Cirque Du Soleil | 179 | 179 | ||||||
Graton Resort & Casino Tranche B, | 116 | 116 | ||||||
Mohegan Tribal Gaming Authority Tranche B, | 114 | 114 | ||||||
Peppermill Casinos, Inc. Tranche B, | 374 | 375 | ||||||
Transtar Holding Co. Second Lien, | 200 | 194 | ||||||
TWCC Holding Corp. Second Lien, | 239 | 224 | ||||||
U.S. Farathane Corp. | 149 | 150 | ||||||
|
| |||||||
| 1,812 | ||||||||
|
| |||||||
| Consumer Staples—0.9% | ||||||||
Crossmark Holdings, Inc. Second Lien, | 190 | 149 | ||||||
Hostess Brands LLC Tranche B Second Lien, | 430 | 432 | ||||||
|
| |||||||
| 581 | ||||||||
|
| |||||||
See Notes to Financial Statements
38
Table of Contents
VIRTUS HIGH YIELD FUND
SCHEDULE OF INVESTMENTS (Continued)
SEPTEMBER 30, 2015
($ reported in thousands)
| PAR VALUE | VALUE | |||||||
| Energy—0.7% | ||||||||
Arch Coal, Inc. | $ | 150 | $ | 85 | ||||
Chief Exploration & Development LLC Second Lien, | 183 | 152 | ||||||
Drillships Ocean Ventures, Inc. | 136 | 91 | ||||||
Jonah Energy LLC Second Lien, | 125 | 101 | ||||||
Sabine Oil & Gas LLC Second Lien, | 285 | 51 | ||||||
|
| |||||||
| 480 | ||||||||
|
| |||||||
| Health Care—2.3% | ||||||||
21st Century Oncology, Inc. Tranche B | 224 | 214 | ||||||
American Renal Holdings, Inc. Second Lien, | 292 | 292 | ||||||
Ardent Legacy Acquisitions, Inc. | 130 | 130 | ||||||
InVentiv Health, Inc. Tranche B-4, | 159 | 160 | ||||||
MMM Holdings, Inc. | 82 | 63 | ||||||
MSO of Puerto Rico, Inc. | 60 | 45 | ||||||
NVA Holdings, Inc. Second Lien | 175 | 174 | ||||||
Regional Care, Inc. (RCHP, Inc.) First Lien, | 249 | 247 | ||||||
Schumacher Group | 152 | 152 | ||||||
Surgery Center Holdings, Inc. Second Lien, | 103 | 104 | ||||||
|
| |||||||
| 1,581 | ||||||||
|
| |||||||
| Industrials—1.0% | ||||||||
Filtration Group Corp. Second Lien, | 81 | 81 | ||||||
Landmark U.S. Member LLC (Landmark U.S. Corp Acquisition, Inc.) Second Lien | 250 | 249 | ||||||
Sedgwick Claims Management Services, Inc. Second Lien, | 390 | 370 | ||||||
|
| |||||||
| 700 | ||||||||
|
| |||||||
| Information Technology—2.4% | ||||||||
Allflex Holdings III, Inc. Second Lien, | 193 | 191 | ||||||
| PAR VALUE | VALUE | |||||||
| Information Technology—continued | ||||||||
Applied Systems, Inc. Second Lien, | $ | 200 | $ | 199 | ||||
Deltek, Inc. Second Lien | 181 | 181 | ||||||
Kronos Acquisition Intermediate, Inc. (KIK Custom Products, Inc.) Second Lien, | 450 | 459 | ||||||
Mitchell International, Inc. Second Lien, | 500 | 500 | ||||||
Presidio, Inc. Refinancing Term | 147 | 147 | ||||||
|
| |||||||
| 1,677 | ||||||||
|
| |||||||
| Materials—0.5% | ||||||||
Houghton International, Inc. Holding Corp. Second Lien, 9.750%, 12/21/20 | 370 | 368 | ||||||
| TOTAL LOAN AGREEMENTS (Identified Cost $7,719) | 7,199 | |||||||
| SHARES | ||||||||
| PREFERRED STOCKS—1.2% | ||||||||
| Financials—1.4% | ||||||||
Ally Financial, Inc. | 11,530 | 299 | ||||||
Goldman Sachs Group, Inc. (The) Series L, 5.700%(2) | 215 | (11) | 214 | |||||
JPMorgan Chase & Co. | 250 | (11) | 243 | |||||
SunTrust Bank, Inc. 5.625%(2) | 95 | (11) | 95 | |||||
| TOTAL PREFERRED STOCKS (Identified Cost $870) | 851 | |||||||
| AFFILIATED MUTUAL FUND—0.5% | ||||||||
Virtus Credit Opportunities Fund(14) | 35,000 | 342 | ||||||
| TOTAL AFFILIATED MUTUAL FUND (Identified Cost $350) | 342 | |||||||
| TOTAL LONG TERM INVESTMENTS—94.6% | ||||||||
| (Identified Cost $70,043) | 65,540 | (13) | ||||||
| SHORT-TERM INVESTMENT—3.6% | ||||||||
| Money Market Mutual Fund—3.6% | ||||||||
Fidelity Money Market Portfolio – Institutional Shares (seven-day effective yield 0.170%) | 2,503,270 | 2,503 | ||||||
| TOTAL SHORT-TERM INVESTMENT (Identified Cost $2,503) | 2,503 | |||||||
| TOTAL INVESTMENTS—98.2% (Identified Cost $72,546) | 68,043 | (1) | ||||||
Other assets and liabilities, net—1.8% |
| 1,279 | ||||||
|
| |||||||
| NET ASSETS—100.0% | $ | 69,322 | ||||||
|
| |||||||
Abbreviations:
| ADS | American Depositary Share |
| PIK | Payment-in-Kind Security |
Footnote Legend:
| (1) | Federal Income Tax Information: For tax information at September 30, 2015, see Note 10 Federal Income Tax Information in the Notes to Financial Statements. |
| (2) | Variable or step coupon security; interest rate shown reflects the rate in effect at September 30, 2015. |
| (3) | Security exempt from registration under Rule 144A of the Securities Act of 1933. These securities may be resold in transactions exempt from registration, normally to qualified institutional buyers. At September 30, 2015, these securities amounted to a value of $26,141 or 37.7% of net assets. |
| (4) | Security in default. |
| (5) | No contractual maturity date. |
| (6) | Interest payments may be deferred. |
| (7) | 100% of the income received was in cash. |
| (8) | 92.1% of the income received was in cash and 7.9% in PIK. |
| (9) | This loan will settle after September 30, 2015, at which time the interest rate, based on the London Interbank Offered Rate (“LIBOR”) and the agreed upon spread on trade date, will be reflected. |
| (10) | Security in default, interest payments are being received during the bankruptcy proceedings. |
| (11) | Value shown as par value. |
| (12) | Illiquid security. |
| (13) | All or a portion of the Fund’s assets have been segregated for delayed delivery security. |
| (14) | This fund is a public fund and the prospectus and annual report are publicly available. |
| Country Weightings (Unaudited)† | ||||
United States | 84 | % | ||
Luxembourg | 5 | |||
Canada | 4 | |||
Austria | 1 | |||
Bermuda | 1 | |||
Ireland | 1 | |||
Netherlands | 1 | |||
Other | 3 | |||
Total | 100 | % | ||
† % of total investments as of September 30, 2015. |
| |||
Security abbreviation definitions are located under the Key Investment Terms starting on page 4.
See Notes to Financial Statements
39
Table of Contents
VIRTUS HIGH YIELD FUND
SCHEDULE OF INVESTMENTS (Continued)
SEPTEMBER 30, 2015
($ reported in thousands)
The following table provides a summary of inputs used to value the Fund’s investments as of September 30, 2015 (See Security Valuation Note 2A in the Notes to Financial Statements):
| Total Value at September 30, 2015 | Level 1 Quoted Prices | Level 2 Significant Observable Inputs | Level 3 Significant Unobservable Inputs | |||||||||||||
Debt Securities: | ||||||||||||||||
Asset-Backed Securities | $ | 404 | $ | — | $ | 154 | $ | 250 | ||||||||
Corporate Bonds And Notes | 55,539 | — | 55,539 | — | ||||||||||||
Loan Agreements | 7,199 | — | 7,005 | 194 | ||||||||||||
Mortgage-Backed Securities | 1,205 | — | 1,205 | — | ||||||||||||
Equity Securities: | ||||||||||||||||
Affiliated Mutual Fund | 342 | 342 | — | — | ||||||||||||
Preferred Stocks | 851 | 299 | 552 | — | ||||||||||||
Short-Term Investment | 2,503 | 2,503 | — | — | ||||||||||||
|
|
|
|
|
|
|
| |||||||||
Total Investments | $ | 68,043 | $ | 3,144 | $ | 64,455 | $ | 444 | ||||||||
|
|
|
|
|
|
|
| |||||||||
There were no transfers between Level 1 and Level 2 related to securities held at September 30, 2015.
The following is a reconciliation of assets of the Fund for Level 3 investments for which significant unobservable inputs were used to determine fair value.
| Total | Asset-Backed Securities | Corporate Bonds And Notes | Loan Agreements | |||||||||||||
Investments in Securities | ||||||||||||||||
Balance as of September 30, 2014: | $ | 125 | $ | — | $ | 125 | $ | — | ||||||||
Accrued discount/(premium) | 9 | — | (c) | 9 | — | |||||||||||
Realized gain (loss) | 8 | — | 8 | — | ||||||||||||
Change in unrealized appreciation (depreciation) | (18 | ) | — | (c) | (18 | ) | — | |||||||||
Purchases | 250 | 250 | — | — | ||||||||||||
Sales(b) | (124 | ) | — | (124 | ) | — | ||||||||||
Transfers into Level 3(a) | 194 | (d) | — | — | 194 | (d) | ||||||||||
Transfers from Level 3(a) | — | — | — | — | ||||||||||||
|
|
|
|
|
|
|
| |||||||||
Balance as of September 30, 2015 | $ | 444 | $ | 250 | $ | — | $ | 194 | ||||||||
|
|
|
|
|
|
|
| |||||||||
| (a) | “Transfers into and/or from” represent the ending value as of September 30, 2015, for any investment security where a change in the pricing level occurred from the beginning to the end of the period. |
| (b) | Includes paydowns on securities. |
| (c) | Amount less than $500. |
| (d) | The transfer is due to increase and/or decrease in trading activities at period end. |
None of the securities in this table are internally fair valued.
See Notes to Financial Statements
40
Table of Contents
VIRTUS LOW VOLATILITY EQUITY FUND
SCHEDULE OF INVESTMENTS
SEPTEMBER 30, 2015
($ reported in thousands)
| SHARES | VALUE | |||||||
| EXCHANGE-TRADED FUND—98.2% | ||||||||
iShares S&P 100 Index Fund(2)(3) | 58,580 | $ | 4,966 | |||||
| TOTAL EXCHANGE-TRADED FUND (Identified Cost $4,961) | 4,966 | |||||||
| CONTRACTS | ||||||||
| PURCHASED OPTION—0.3% | ||||||||
| Call Option—0.3% | ||||||||
CBOE Volatility Index expiration 10/21/15 strike price $26 | 100 | 15 | ||||||
| TOTAL PURCHASED OPTION—0.3% (Premiums Paid $13) | 15 | |||||||
| TOTAL LONG TERM INVESTMENTS—98.5% | ||||||||
| (Identified Cost $4,974) | 4,981 | (1) | ||||||
| SHARES | ||||||||
| SHORT-TERM INVESTMENT—1.4% | ||||||||
| Money Market Mutual Fund—1.4% | ||||||||
Fidelity Money Market Portfolio – Institutional Shares (seven-day effective yield 0.170%) | 72,747 | 73 | ||||||
| TOTAL SHORT-TERM INVESTMENT (Identified Cost $73) | 73 | |||||||
| TOTAL INVESTMENTS, BEFORE WRITTEN OPTION—99.9% | ||||||||
| (Identified Cost $5,047) | 5,054 | (1) | ||||||
| CONTRACTS | VALUE | |||||||
| WRITTEN OPTION—(0.8)% | ||||||||
| Call Option—(0.8)% | ||||||||
S&P 500® Index expiration 10/23/15 strike price $1,970 | 25 | $ | (39 | ) | ||||
| TOTAL WRITTEN OPTION—(0.8)% (Premiums Received $92) | (39 | ) | ||||||
| TOTAL INVESTMENTS, NET OF WRITTEN OPTION—99.1% (Identified Cost $4,955) | 5,015 | (1) | ||||||
Other assets and liabilities, net—0.9% |
| 44 | ||||||
|
| |||||||
| NET ASSETS—100.0% | $ | 5,059 | ||||||
|
| |||||||
Footnote Legend:
| (1) | Federal Income Tax Information: For tax information at September 30, 2015, see Note 10 Federal Income Tax Information in the Notes to Financial Statements. |
| (2) | All or a portion segregated as collateral for written options. |
| (3) | This fund is a public fund and the prospectus and annual report are publicly available. |
The following table provides a summary of inputs used to value the Fund’s investments as of September 30, 2015 (See Security Valuation Note 2A in the Notes to Financial Statements):
| Total Value at September 30, 2015 | Level 1 Quoted Prices | |||||||
Equity Securities: | ||||||||
Exchange-Traded Fund | $ | 4,966 | $ | 4,966 | ||||
Purchased Option | 15 | 15 | ||||||
Short-Term Investment | 73 | 73 | ||||||
|
|
|
| |||||
Total Investments before Written Option | $ | 5,054 | $ | 5,054 | ||||
|
|
|
| |||||
Written Option | (39 | ) | (39 | ) | ||||
|
|
|
| |||||
Total Investments Net of Written Option | $ | 5,015 | $ | 5,015 | ||||
|
|
|
| |||||
There are no Level 2 (significant observable inputs) or Level 3 (significant unobservable inputs) priced securities.
There were no transfers between Level 1 and Level 2 related to securities held at September 30, 2015.
See Notes to Financial Statements
41
Table of Contents
VIRTUS MULTI-SECTOR INTERMEDIATE BOND FUND
SCHEDULE OF INVESTMENTS
SEPTEMBER 30, 2015
($ reported in thousands)
| PAR VALUE | VALUE | |||||||
| U.S. GOVERNMENT SECURITIES—1.1% | ||||||||
U.S. Treasury Note | ||||||||
1.875%, 8/31/22 | $ | 835 | $ | 842 | ||||
2.250%, 11/15/24 | 2,600 | 2,650 | ||||||
| TOTAL U.S. GOVERNMENT SECURITIES (Identified Cost $3,448) | 3,492 | |||||||
| MUNICIPAL BONDS—0.1% | ||||||||
| Michigan—0.0% | ||||||||
Tobacco Settlement Finance Authority Taxable Series A, | 145 | 126 | ||||||
|
| |||||||
| Virginia—0.1% | ||||||||
Tobacco Settlement Financing Corp. Series A-1, Taxable | 325 | 249 | ||||||
| TOTAL MUNICIPAL BONDS (Identified Cost $456) | 375 | |||||||
| FOREIGN GOVERNMENT SECURITIES—4.4% | ||||||||
Argentine Republic Series NY, | 1,570 | 1,606 | ||||||
Bolivarian Republic of Venezuela | ||||||||
RegS 5.750%, 2/26/16(4) | 295 | 249 | ||||||
RegS 7.000%, 12/1/18(4) | 216 | 80 | ||||||
RegS 7.750%, 10/13/19(4) | 202 | 70 | ||||||
RegS 8.250%, 10/13/24(4) | 1,110 | 377 | ||||||
7.650%, 4/21/25 | 1,500 | 503 | ||||||
9.250%, 9/15/27 | 360 | 142 | ||||||
9.375%, 1/13/34 | 2,145 | 756 | ||||||
Kingdom of Morocco 144A | 1,030 | 1,040 | ||||||
Mongolia 144A | 825 | 680 | ||||||
Republic of Azerbaijan 144A | 880 | 823 | ||||||
Republic of Chile | 474,000 | CLP | 705 | |||||
Republic of Colombia | 1,867,000 | COP | 495 | |||||
Republic of Costa Rica 144A | 795 | 670 | ||||||
Republic of Cote d’Ivoire 144A | 905 | 803 | ||||||
Republic of El Salvador 144A | 1,405 | 1,240 | ||||||
Republic of Iraq RegS | 610 | 423 | ||||||
Republic of Panama | 700 | 677 | ||||||
Republic of Romania 144A | 498 | 537 | ||||||
Republic of South Africa | ||||||||
Series R203, | 3,690 | ZAR | 271 | |||||
Series R208, | 6,720 | ZAR | 456 | |||||
| PAR VALUE | VALUE | |||||||
| FOREIGN GOVERNMENT SECURITIES—continued | ||||||||
Russian Federation 144A | $ | 60,000 | RUB | $ | 856 | |||
United Mexican States Series M, | 17,764 | MXN | 1,090 | |||||
| TOTAL FOREIGN GOVERNMENT SECURITIES | ||||||||
| (Identified Cost $19,227) | 14,549 | |||||||
| MORTGAGE-BACKED SECURITIES—16.4% | ||||||||
| Agency—2.8% | ||||||||
FHLMC | ||||||||
4.000%, 2/1/45 | 794 | 846 | ||||||
3.500%, 3/1/45 | 2,038 | 2,127 | ||||||
FNMA | ||||||||
3.000%, 6/1/43 | 2,354 | 2,394 | ||||||
4.000%, 10/1/44 | 1,510 | 1,612 | ||||||
3.500%, 9/1/45 | 2,428 | 2,536 | ||||||
|
| |||||||
| 9,515 | ||||||||
|
| |||||||
| Non-Agency—13.6% | ||||||||
A-10 Securitization LLC | ||||||||
13-1, B 144A | 1,100 | 1,103 | ||||||
American Homes 4 Rent | ||||||||
14-SFR2, C 144A | 915 | 933 | ||||||
15-SFR1, A 144A | 695 | 691 | ||||||
Ameriquest Mortgage Securities, Inc. | 660 | 640 | ||||||
03-AR3, M4 144A | 805 | 814 | ||||||
Aventura Mall Trust | 845 | 879 | ||||||
Banc of America Alternative Loan Trust 03-2, CB3 | 840 | 870 | ||||||
Bank of America (Merrill Lynch – Countrywide) Asset-Backed Certificates | ||||||||
05-1 AF5A | 1,216 | 1,203 | ||||||
05-12, 2A4 | 540 | 538 | ||||||
Banc of America Funding Trust | ||||||||
05-1, 1A1 | 541 | 546 | ||||||
06-2, 3A1 | 316 | 322 | ||||||
Bank of America (Merrill Lynch – Countrywide) Alternative Loan Trust | ||||||||
04-22CB, 1A1 | 519 | 547 | ||||||
04-24CB, 1A1 | 114 | 116 | ||||||
| PAR VALUE | VALUE | |||||||
| Non-Agency—continued | ||||||||
Bank of America (Merrill Lynch – Countrywide) Mortgage Trust | $ | 715 | $ | 729 | ||||
Bank of America (Merrill Lynch) Mortgage Investors Trust 98-C1, C | 1,260 | 1,374 | ||||||
Barclays (Lehman Brothers) – UBS Commercial Mortgage Trust 07-C7, A3 | 448 | 483 | ||||||
Citigroup Mortgage Loan Trust, Inc. | ||||||||
05-5, 2A3 5.000%, 8/25/35 | 347 | 345 | ||||||
15-A, A1 3.500%, 6/25/58(2) | 900 | 918 | ||||||
Commercial Mortgage Trust 07-GG11, AM | 1,200 | 1,267 | ||||||
Credit Suisse Commercial Mortgage Trust | 939 | 955 | ||||||
CSAIL Commercial Mortgage Trust 15-C2, AS | 489 | 503 | ||||||
Deutsche Bank-UBS Mortgage Trust | 860 | 918 | ||||||
Fannie Mae Connecticut Avenue Securities | 1,080 | 970 | ||||||
GAHR Commercial Mortgage Trust 15-NRF, CFX 144A | 600 | 598 | ||||||
GMAC Mortgage Corp. Loan Trust | ||||||||
06-HLTV, A4 | 165 | 166 | ||||||
05-AR2, 2A | 729 | 687 | ||||||
Goldman Sachs Mortgage Securities Trust II 07-GG10, A4 | 673 | 710 | ||||||
Goldman Sachs Residential Mortgage Loan Trust 05-5F, B1 | 1,334 | 1,297 | ||||||
GSAA Home Equity Trust | 346 | 355 | ||||||
Hilton USA Trust | 720 | 727 | ||||||
Home Equity Loan Trust | ||||||||
03-HS3, AI4 | 316 | 325 | ||||||
07-HI1, A3 | 98 | 99 | ||||||
07-HSA3, AI4 | 1,481 | 1,499 | ||||||
See Notes to Financial Statements
42
Table of Contents
VIRTUS MULTI-SECTOR INTERMEDIATE BOND FUND
SCHEDULE OF INVESTMENTS (Continued)
SEPTEMBER 30, 2015
($ reported in thousands)
| PAR VALUE | VALUE | |||||||
| Non-Agency—continued | ||||||||
Jefferies Resecuritization Trust 14-R1, 2A1 144A | $ | 697 | $ | 696 | ||||
JPMorgan Chase (Bear Stearns) Commercial Mortgage Securities, Inc. | ||||||||
07- PW15, AM | 645 | 663 | ||||||
07-PW18, AM | 1,525 | 1,645 | ||||||
JPMorgan Chase Commercial Mortgage Securities Trust | ||||||||
14-1, 1A1 144A | 792 | 830 | ||||||
07-LDPX, AM | 1,341 | 1,378 | ||||||
MASTR Alternative Loan Trust | ||||||||
04-6, 7A1 | 1,309 | 1,333 | ||||||
05-2, 2A1 | 521 | 553 | ||||||
MASTR Reperforming Loan Trust 05-1, 1A5 144A | 639 | 684 | ||||||
MASTR Specialized Loan Trust 05-3, A2 144A | 454 | 462 | ||||||
Morgan Stanley Bank of America (Merrill Lynch) Trust 15-C22, AS | 965 | 972 | ||||||
Morgan Stanley Capital I Trust 07-IQ14, AM | 925 | 961 | ||||||
Motel 6 Trust 15-MTL6, B 144A | 1,080 | 1,088 | ||||||
Nomura Asset Acceptance Corp. 04-R3, A1 144A | 273 | 278 | ||||||
Resecuritization Pass-Through Trust 05-BR, A5 | 541 | 547 | ||||||
Residential Asset Mortgage Trust 04-RZ1, M1 | 1,081 | 1,101 | ||||||
Residential Asset Securitization Trust | 827 | 836 | ||||||
Residential Funding Mortgage Securities I, Inc. 05-S1, 1A2 | 566 | 570 | ||||||
Sequoia Mortgage Trust | ||||||||
14-2, A1 144A | 380 | 392 | ||||||
15-1, A1 144A | 959 | 967 | ||||||
| PAR VALUE | VALUE | |||||||
| Non-Agency—continued | ||||||||
Vericrest Opportunity Loan Trust | ||||||||
15-NP11, A1 144A | $ | 691 | $ | 689 | ||||
15-NPL2, A1 144A | 723 | 721 | ||||||
15-NPL3, A1 144A | 686 | 684 | ||||||
VFC LLC 15-3, B 144A | 1,000 | 999 | ||||||
Wells Fargo (Royal Bank of Scotland plc) Commercial Mortgage Trust 11-C5, C 144A | 645 | 713 | ||||||
Wells Fargo (Wachovia Bank) Commercial Mortgage Trust | ||||||||
07-C32, A3 | 360 | 377 | ||||||
15-LC20, B | 875 | 850 | ||||||
|
| |||||||
| 45,116 | ||||||||
| TOTAL MORTGAGE-BACKED SECURITIES (Identified Cost $54,249) | 54,630 | |||||||
| ASSET-BACKED SECURITIES—4.8% | ||||||||
Applebee’s LLC 14-1, A2 144A | 1,260 | 1,289 | ||||||
CarFinance Capital Auto Trust | ||||||||
14-1A, D 144A | 1,316 | 1,326 | ||||||
15-1A, C 144A | 2,160 | 2,188 | ||||||
Cheesecake Restaurant Holdings, Inc. 13-1A, A2 144A | 934 | 967 | ||||||
Conseco Financial Corp. 01-3, A4 | 346 | 381 | ||||||
DB Master Finance LLC 15-A1, A2II 144A | 381 | 384 | ||||||
Domino’s Pizza Master Issuer LLC 12-1A, A2 144A | 604 | 622 | ||||||
Drive Auto Receivables Trust 15-AA, D 144A | 1,080 | 1,097 | ||||||
Exeter Automobile Receivables Trust | ||||||||
15-A1, C 144A | 900 | 917 | ||||||
15-2A, C 144A | 925 | 938 | ||||||
Fairway Outdoor Funding LLC 12-1A, A2 144A | 546 | 552 | ||||||
Foursight Capital Automobile Receivables Trust 15-1, B 144A | 1,110 | 1,123 | ||||||
| PAR VALUE | VALUE | |||||||
| ASSET-BACKED SECURITIES—continued | ||||||||
Greater Capital Association of Realtors 15-1A, C | $ | 545 | $ | 544 | ||||
IndyMac Manufactured Housing Contract 98-1, A3 | 243 | 249 | ||||||
LEAF Receivables Funding 10 LLC 15-1, E2 144A | 555 | 536 | ||||||
Origen Manufactured Housing Contract Trust 04-B, M1 | 445 | 462 | ||||||
SolarCity LMC Series III LLC 14-2, A 144A | 961 | 947 | ||||||
Trip Rail Master Funding LLC 11-1A, A1A 144A | 220 | 228 | ||||||
Wendy’s Funding LLC 15-1A, A2II 144A | 1,110 | 1,120 | ||||||
| TOTAL ASSET-BACKED SECURITIES (Identified Cost $15,697) | 15,871 | |||||||
| CORPORATE BONDS AND NOTES—54.6% | ||||||||
| Consumer Discretionary—7.9% | ||||||||
Argos Merger Sub, Inc. 144A | 775 | 786 | ||||||
Boyd Gaming Corp. | ||||||||
9.000%, 7/1/20 | 435 | 464 | ||||||
6.875%, 5/15/23 | 415 | 423 | ||||||
Brookfield Residential Properties, Inc. 144A | 185 | 177 | ||||||
Caesars Entertainment Operating Co., Inc. | 535 | 441 | ||||||
Caesars Entertainment Resort Properties LLC | 320 | 306 | ||||||
Caesars Growth Properties Holdings LLC (Caesars Growth Properties Finance, Inc.) | 495 | 390 | ||||||
CCO Holdings LLC | 467 | 461 | ||||||
144A 5.125%, 5/1/23(3) | 390 | 360 | ||||||
CCO Safari II LLC 144A | 260 | 259 | ||||||
Cequel Communications Holdings I LLC (Cequel Capital Corp.) | ||||||||
144A 5.125%, 12/15/21(3) | 275 | 243 | ||||||
144A 5.125%, 12/15/21(3) | 655 | 579 | ||||||
Clear Channel Worldwide Holdings, Inc. | ||||||||
Series A | 320 | 320 | ||||||
Series B | 1,465 | 1,474 | ||||||
See Notes to Financial Statements
43
Table of Contents
VIRTUS MULTI-SECTOR INTERMEDIATE BOND FUND
SCHEDULE OF INVESTMENTS (Continued)
SEPTEMBER 30, 2015
($ reported in thousands)
| PAR VALUE | VALUE | |||||||
| Consumer Discretionary—continued | ||||||||
Columbus International, Inc. series B,144A | $ | 200 | $ | 208 | ||||
iHeartCommunications, Inc. | 230 | 123 | ||||||
Intelsat Jackson Holdings SA | 760 | 629 | ||||||
International Game Technology plc | ||||||||
7.500%, 6/15/19 | 580 | 612 | ||||||
144A 6.250%, 2/15/22(3) | 340 | 318 | ||||||
Isle of Capri Casinos, Inc. | 667 | 690 | ||||||
Landry’s Holdings II, Inc. 144A | 425 | 437 | ||||||
Landry’s, Inc. 144A | 475 | 509 | ||||||
MDC Holdings, Inc. | 860 | 873 | ||||||
Meritor, Inc. | 960 | 970 | ||||||
MGM Resorts International | 490 | 476 | ||||||
Mohegan Tribal Gaming Authority 144A | 305 | 312 | ||||||
MPG Holdco I, Inc. | 830 | 867 | ||||||
Myriad International Holdings BV 144A | 995 | 975 | ||||||
New York University | 545 | 522 | ||||||
Numericable Group SA 144A | 305 | 295 | ||||||
Omega US Sub LLC 144A | 925 | 823 | ||||||
Party City Holdings, Inc. 144A | 125 | 127 | ||||||
Penn National Gaming, Inc. | 490 | 497 | ||||||
Pinnacle Entertainment, Inc. | 1,035 | 1,100 | ||||||
QVC, Inc. | 240 | 247 | ||||||
RCN Telecom Services LLC (RCN Capital Corp.) 144A | 510 | 528 | ||||||
Scientific Games International, Inc. | ||||||||
6.625%, 5/15/21 | 910 | 660 | ||||||
144A 7.000%, 1/1/22(3) | 590 | 586 | ||||||
Signet UK Finance plc | 895 | 904 | ||||||
Standard Pacific Corp. | 545 | 561 | ||||||
Station Casinos LLC | 970 | 1,014 | ||||||
Tempur Sealy International Inc 144A | 360 | 361 | ||||||
| PAR VALUE | VALUE | |||||||
| Consumer Discretionary—continued | ||||||||
Toll Brothers Finance Corp. | ||||||||
4.000%, 12/31/18 | $ | 375 | $ | 386 | ||||
6.750%, 11/1/19 | 940 | 1,072 | ||||||
TRI Pointe Holdings, Inc. | 890 | 877 | ||||||
UPCB Finance IV Ltd. 144A | 425 | 402 | ||||||
VTR Finance B.V. 144A | 600 | 546 | ||||||
|
| |||||||
| 26,190 | ||||||||
|
| |||||||
| Consumer Staples—0.6% | ||||||||
Dole Food Co., Inc. 144A | 545 | 545 | ||||||
Kronos Acquisition Intermediate, Inc. (KIK Custom Products, Inc.) Second Lien, | 1,241 | 1,267 | ||||||
Pilgrim’s Pride Corp. 144A | 340 | 335 | ||||||
Rite Aid Corp. 144A | 250 | 249 | ||||||
Tops Holding LLC (Tops Markets II Corp.) 144A | 925 | 930 | ||||||
|
| |||||||
| 3,326 | ||||||||
|
| |||||||
| Energy—9.7% | ||||||||
Afren plc 144A | 475 | 12 | ||||||
Antero Resources Corp. 144A | 490 | 432 | ||||||
Blue Racer Midstream LLC (Blue Racer Finance Corp.) 144A | 305 | 291 | ||||||
CNOOC Finance USA LLC | 995 | 947 | ||||||
Compagnie Generale de Geophysique-Veritas | 725 | 418 | ||||||
CONSOL Energy, Inc. | 650 | 440 | ||||||
Denbury Resources, Inc. | 440 | 263 | ||||||
Ecopetrol SA | 910 | 794 | ||||||
Energy Transfer Partners LP | 885 | 801 | ||||||
EnQuest plc 144A | 885 | 553 | ||||||
EP Energy LLC (Everest Acquisition Finance, Inc.) | 840 | 727 | ||||||
Exterran Partners LP (EXLP Finance Corp.) | 740 | 623 | ||||||
FTS International, Inc. | 450 | 142 | ||||||
| PAR VALUE | VALUE | |||||||
| Energy—continued | ||||||||
Gazprom Neft OAO (GPN Capital SA) 144A | $ | 255 | $ | 237 | ||||
Gazprom OAO (Gaz Capital SA) 144A | 1,115 | 1,030 | ||||||
Gulfmark Offshore, Inc. | 960 | 578 | ||||||
Gulfport Energy, Corp. | 885 | 874 | ||||||
Helmerich & Payne International Drilling Co. | 540 | 538 | ||||||
Kinder Morgan, Inc. | 890 | 936 | ||||||
Laredo Petroleum, Inc. | 830 | 807 | ||||||
6.250%, 3/15/23 | 145 | 133 | ||||||
Linn Energy LLC | ||||||||
6.500%, 5/15/19 | 512 | 143 | ||||||
6.500%, 9/15/21 | 155 | 33 | ||||||
Lukoil International Finance BV | ||||||||
144A 7.250%, 11/5/19(3) | 525 | 554 | ||||||
144A 4.563%, 4/24/23(3) | 495 | 439 | ||||||
MarkWest Energy Partners LP (MarkWest Energy Finance Corp.) | 1,390 | 1,279 | ||||||
Newfield Exploration Co. | ||||||||
5.750%, 1/30/22 | 160 | 155 | ||||||
5.625%, 7/1/24 | 785 | 746 | ||||||
5.375%, 1/1/26 | 550 | 503 | ||||||
NGL Energy Partners LP (NGL Energy Finance Corp.) | 925 | 846 | ||||||
Novatek OAO (Novatek Finance Ltd.) 144A | 1,105 | 958 | ||||||
Odebrecht Offshore Drilling Finance Ltd. 144A | 1,110 | 292 | ||||||
Pacific Exploration and Production Corp. 144A | 610 | 233 | ||||||
Parker Drilling Co. (The) | 1,075 | 887 | ||||||
Pertamina Persero PT | ||||||||
144A 4.300%, 5/20/23(3) | 600 | 550 | ||||||
144A 6.000%, 5/3/42(3) | 400 | 333 | ||||||
Petrobras Global Finance BV | ||||||||
3.000%, 1/15/19 | 795 | 574 | ||||||
5.375%, 1/27/21 | 830 | 606 | ||||||
Petroleos de Venezuela SA | ||||||||
RegS 8.500%, 11/2/17(4) | 485 | 326 | ||||||
144A 6.000%, 5/16/24(3) | 1,580 | 513 | ||||||
RegS 6.000%, 11/15/26(4) | 790 | 255 | ||||||
Petroleos Mexicanos | 650 | 522 | ||||||
PHI, Inc. | 360 | 311 | ||||||
QEP Resources, Inc. | 1,105 | 1,022 | ||||||
See Notes to Financial Statements
44
Table of Contents
VIRTUS MULTI-SECTOR INTERMEDIATE BOND FUND
SCHEDULE OF INVESTMENTS (Continued)
SEPTEMBER 30, 2015
($ reported in thousands)
| PAR VALUE | VALUE | |||||||
| Energy—continued | ||||||||
QGOG Constellation SA 144A | $ | 1,000 | $ | 445 | ||||
Regency Energy Partners LP | 1,160 | 1,073 | ||||||
Sabine Oil & Gas Corp. | 935 | 136 | ||||||
Sabine Pass Liquefaction LLC | 915 | 853 | ||||||
SM Energy Co. | 1,160 | 1,080 | ||||||
Sunoco LP (Sunoco Finance Corp.) | ||||||||
144A 5.500%, 8/1/20(3) | 700 | 693 | ||||||
144A 6.375%, 4/1/23(3) | 1,075 | 1,056 | ||||||
Transcanada Trust | 940 | 900 | ||||||
Transocean, Inc. | 1,050 | 648 | ||||||
Whiting Petroleum Corp. | 910 | 792 | ||||||
|
| |||||||
| 31,332 | ||||||||
|
| |||||||
| Financials—16.5% | ||||||||
Aercap Ireland Capital Ltd. | 165 | 165 | ||||||
Akbank TAS 144A | 1,565 | TRY | 449 | |||||
Allstate Corp. (The) | 1,455 | 1,506 | ||||||
ALROSA Finance S.A. 144A | 1,065 | 1,116 | ||||||
Ares Finance Co. II LLC 144A | 930 | 947 | ||||||
Avis Budget Car Rental LLC (Avis Budget Finance, Inc.) 144A | 785 | 729 | ||||||
Banco Bilbao Vizcaya Argentaria Bancomer S.A. | ||||||||
144A 6.500%, 3/10/21(3) | 425 | 454 | ||||||
144A 6.750%, 9/30/22(3) | 1,000 | 1,082 | ||||||
Banco de Credito del Peru | ||||||||
144A 4.250%, 4/1/23(3) | 657 | 634 | ||||||
144A 6.125%, 4/24/27(2)(3) | 1,095 | 1,128 | ||||||
Banco Internacional del Peru SAA | ||||||||
144A 5.750%, 10/7/20(3) | 1,060 | 1,137 | ||||||
144A 6.625%, 3/19/29(3) | 395 | 393 | ||||||
Banco Santander Brasil SA 144A | 900 | BRL | 216 | |||||
Bancolombia S.A. | 1,015 | 959 | ||||||
Bank of America Corp. | 1,140 | 1,138 | ||||||
Bank of China Ltd. 144A | 875 | 889 | ||||||
Bank of Georgia JSC 144A | 1,015 | 1,055 | ||||||
Block Financial LLC | 490 | 490 | ||||||
| PAR VALUE | VALUE | |||||||
| Financials—continued | ||||||||
Brixmor Operating Partnership LP | $ | 245 | $ | 247 | ||||
Citizens Financial Group, Inc. 144A 5.500%(2)(3)(5) | 920 | 897 | ||||||
Compass Bank | 900 | 839 | ||||||
Corporate Office Properties LP | 950 | 892 | ||||||
Corrections Corp of America | 1,465 | 1,476 | ||||||
CTR Partnership LP (Caretrust Capital Corp.) | 720 | 738 | ||||||
CyrusOne LP (CyrusOne Finance Corp.) 144A | 945 | 964 | ||||||
Development Bank of Kazakhstan OJSC 144A | 1,090 | 931 | ||||||
Discover Financial Services, Inc. | 1,250 | 1,233 | ||||||
Drawbridge Special Opportunities Fund LP 144A | 915 | 894 | ||||||
ESH Hospitality, Inc. 144A | 925 | 913 | ||||||
Eurasian Development Bank 144A | 925 | 876 | ||||||
Excel Trust LP | 230 | 228 | ||||||
First Cash Financial Services, Inc. | 530 | 533 | ||||||
First Niagara Financial Group, Inc. | 1,160 | 1,306 | ||||||
FS Investment Corp. | ||||||||
4.250%, 1/15/20 | 785 | 799 | ||||||
4.750%, 5/15/22 | 285 | 281 | ||||||
Genworth Holdings, Inc. | 1,170 | 916 | ||||||
GLP Capital LP (GLP Financing II, Inc.) | 25 | 25 | ||||||
Healthcare Realty Trust, Inc. | 395 | 384 | ||||||
HSBC Finance Corp. | 500 | 585 | ||||||
Hutchison Whampoa International Ltd. Series 12, | 1,130 | 1,175 | ||||||
ICAHN Enterprises LP (ICAHN Enterprises Finance Corp.) | ||||||||
4.875%, 3/15/19 | 65 | 65 | ||||||
6.000%, 8/1/20 | 370 | 381 | ||||||
5.875%, 2/1/22 | 755 | 760 | ||||||
| PAR VALUE | VALUE | |||||||
| Financials—continued | ||||||||
ING Groep NV | $ | 865 | $ | 853 | ||||
iStar Financial, Inc. | 940 | 897 | ||||||
Itau Unibanco Holding S.A. 144A | 715 | 620 | ||||||
Jefferies Group LLC | 410 | 461 | ||||||
JPMorgan Chase & Co. Series Z, 5.300%(2)(5)(6) | 175 | 172 | ||||||
Kazakhstan Temir Zholy Finance BV 144A | 795 | 625 | ||||||
Kilroy Realty Lp | 830 | 838 | ||||||
Leucadia National Corp. | 575 | 578 | ||||||
Lincoln National Corp. | 300 | 252 | ||||||
Macquarie Bank Ltd. 144A | 189 | 212 | ||||||
McGraw Hill Financial, Inc. 144A 4.000%, 6/15/25(3) | 295 | 294 | ||||||
144A 4.400%, 2/15/26(3) | 485 | 492 | ||||||
Morgan Stanley 144A | 2,400 | BRL | 563 | |||||
MPT Operating Partnership LP | 455 | 465 | ||||||
Navient LLC | 850 | 674 | ||||||
Nordea Bank AB 144A | 1,360 | 1,393 | ||||||
Phosagro OAO (Phosagro Bond Funding Ltd.) | 875 | 868 | ||||||
PKO Finance AB 144A | 1,315 | 1,356 | ||||||
Prudential Financial, Inc. | ||||||||
5.875%, 9/15/42(2) | 2,155 | 2,279 | ||||||
5.625%, 6/15/43(2)(6) | 450 | 464 | ||||||
Royal Bank of Scotland Group plc (The) | 370 | 416 | ||||||
Santander Bank NA | 400 | 457 | ||||||
Select Income REIT | 900 | 866 | ||||||
Springleaf Finance Corp. | 950 | 931 | ||||||
SunTrust Bank, Inc. | 250 | 272 | ||||||
Teachers Insurance & Annuity Association of America 144A | 740 | 749 | ||||||
Turkiye Garanti Bankasi AS 144A | 1,285 | 1,234 | ||||||
Ukreximbank Via Biz Finance plc 144A | 950 | 837 | ||||||
See Notes to Financial Statements
45
Table of Contents
VIRTUS MULTI-SECTOR INTERMEDIATE BOND FUND
SCHEDULE OF INVESTMENTS (Continued)
SEPTEMBER 30, 2015
($ reported in thousands)
| PAR VALUE | VALUE | |||||||
| Financials—continued | ||||||||
Voya Financial, Inc. | $ | 870 | $ | 881 | ||||
Walter Investment Management Corp. | 695 | 597 | ||||||
York Risk Services Holding Corp. 144A | 685 | 585 | ||||||
|
| |||||||
| 55,006 | ||||||||
|
| |||||||
| Health Care—4.6% | ||||||||
Acadia Healthcare Co., Inc. | ||||||||
5.125%, 7/1/22 | 300 | 296 | ||||||
144A 5.625%, 2/15/23(3) | 65 | 66 | ||||||
Alere, Inc. 144A | 345 | 351 | ||||||
Capsugel SA PIK Interest Capitalization 144A | 200 | 200 | ||||||
Community Health Systems, Inc. | 525 | 537 | ||||||
Concordia Healthcare Corp. 144A | 65 | 57 | ||||||
Crimson Merger Sub, Inc. 144A | 710 | 612 | ||||||
DaVita Healthcare Partners, Inc. | 935 | 920 | ||||||
Emdeon, Inc. 144A | 625 | 608 | ||||||
Endo Finance LLC (Endo Finco, Inc.) 144A | 660 | 636 | ||||||
HCA, Inc. | ||||||||
6.500%, 2/15/20 | 990 | 1,079 | ||||||
5.375%, 2/1/25 | 720 | 716 | ||||||
HealthSouth Corp. | ||||||||
144A 5.750%, 11/1/24(3) | 95 | 94 | ||||||
144A 5.750%, 9/15/25(3) | 835 | 812 | ||||||
Hill-Rom Holdings, Inc. 144A | 535 | 539 | ||||||
Hologic, Inc. 144A | 70 | 71 | ||||||
IASIS Healthcare LLC | 545 | 562 | ||||||
Jaguar Holding Co. II (Pharmaceutical Product Development LLC) 144A | 530 | 517 | ||||||
JLL Delta Dutch Pledgeco BV PIK Interest Capitalization, | 545 | 550 | ||||||
Mallinckrodt International Finance S.A. | ||||||||
144A 5.750%, 8/1/22(3) | 360 | 349 | ||||||
144A 5.625%, 10/15/23(3) | 815 | 745 | ||||||
144A 5.500%, 4/15/25(3) | 60 | 54 | ||||||
| PAR VALUE | VALUE | |||||||
| Health Care—continued | ||||||||
Quintiles Transnational Corp. 144A | $ | 435 | $ | 432 | ||||
Select Medical Corp. | 455 | 446 | ||||||
Sterigenics-Nordion Holdings LLC 144A | 325 | 323 | ||||||
Surgical Care Affiliates, Inc. 144A | 912 | 907 | ||||||
Tenet Healthcare Corp. | ||||||||
4.750%, 6/1/20 | 575 | 583 | ||||||
6.000%, 10/1/20 | 180 | 190 | ||||||
4.500%, 4/1/21 | 470 | 465 | ||||||
8.125%, 4/1/22 | 440 | 469 | ||||||
Valeant Pharmaceuticals International, Inc. | ||||||||
144A 7.500%, 7/15/21(3) | 130 | 134 | ||||||
144A 5.625%, 12/1/21(3) | 140 | 133 | ||||||
144A 5.500%, 3/1/23(3) | 220 | 209 | ||||||
144A 5.875%, 5/15/23(3) | 705 | 678 | ||||||
|
| |||||||
| 15,340 | ||||||||
|
| |||||||
| Industrials—5.0% | ||||||||
ADT Corp. (The) | 1,130 | 1,171 | ||||||
Ahern Rentals, Inc. 144A | 930 | 814 | ||||||
Air Canada 144A | 1,050 | 1,103 | ||||||
Pass-Through-Trust, | 1,364 | 1,403 | ||||||
American Airlines Group, Inc. 144A | 210 | 205 | ||||||
American Airlines Pass-Through-Trust 14-1, B | 859 | 860 | ||||||
AWAS Aviation Capital Ltd. 144A | 649 | 651 | ||||||
Bombardier, Inc. 144A | 740 | 548 | ||||||
Builders FirstSource, Inc. 144A | 480 | 482 | ||||||
Carpenter Technology Corp. | 600 | 632 | ||||||
CEB, Inc. 144A | 365 | 365 | ||||||
Continental Airlines Pass-Through-Trust | 552 | 622 | ||||||
01-1, A1 6.703%, 6/15/21 | 235 | 246 | ||||||
DP World Ltd. 144A | 400 | 423 | ||||||
Harland Clarke Holdings Corp. 144A | 600 | 543 | ||||||
| PAR VALUE | VALUE | |||||||
| Industrials—continued | ||||||||
Hawaiian Airlines Pass-Through Certificates 13-1, B | $ | 808 | $ | 781 | ||||
JBS Investments GmbH 144A | 665 | 642 | ||||||
Lender Processing Services, Inc. | 655 | 693 | ||||||
Masco Corp. | 640 | 698 | ||||||
4.450%, 4/1/25 | 320 | 324 | ||||||
Northwest Airlines Pass-Through-Trust 02-1, G2 | 413 | 430 | ||||||
Pelabuhan Indonesia II PT 144A | 925 | 808 | ||||||
Penske Truck Leasing Co. LP 144A | 350 | 342 | ||||||
TransDigm, Inc. | 630 | 591 | ||||||
144A 6.500%, 5/15/25(3) | 270 | 255 | ||||||
United Rentals North America, Inc. | ||||||||
5.500%, 7/15/25 | 930 | 873 | ||||||
|
| |||||||
| 16,505 | ||||||||
|
| |||||||
| Information Technology—1.4% | ||||||||
First Data Corp. | 1,854 | 2,062 | ||||||
Flextronics International Ltd. 144A | 930 | 901 | ||||||
Hewlett Packard Enterprise Co. | ||||||||
144A 4.400%, 10/15/22(3) | 200 | 200 | ||||||
144A 4.900%, 10/15/25(3) | 200 | 199 | ||||||
KLA-Tencor Corp. | 905 | 905 | ||||||
Riverbed Technology, Inc. 144A 8.875%, 3/1/23(3) | 540 | 493 | ||||||
|
| |||||||
| 4,760 | ||||||||
|
| |||||||
| Materials—4.2% | ||||||||
Alpek SA de C.V. 144A | 1,460 | 1,504 | ||||||
ArcelorMittal | 945 | 768 | ||||||
Berry Plastics Corp. | 870 | 824 | ||||||
Braskem America Finance Co. RegS | 1,300 | 907 | ||||||
Cascades, Inc. 144A | 1,100 | 1,049 | ||||||
Corp Nacional del Cobre de Chile 144A | 820 | 788 | ||||||
See Notes to Financial Statements
46
Table of Contents
VIRTUS MULTI-SECTOR INTERMEDIATE BOND FUND
SCHEDULE OF INVESTMENTS (Continued)
SEPTEMBER 30, 2015
($ reported in thousands)
| PAR VALUE | VALUE | |||||||
| Materials—continued | ||||||||
Eldorado Gold Corp. 144A | $ | 455 | $ | 400 | ||||
EuroChem Mineral & Chemical Co. OJSC 144A | 550 | 548 | ||||||
Fibria Overseas Finance Ltd. | 910 | 878 | ||||||
Fortescue Metals Group (FMG) Resources August 2006 Pty Ltd. 144A | 550 | 514 | ||||||
Gerdau Holdings, Inc. 144A | 735 | 690 | ||||||
Gerdau Trade, Inc. 144A | 150 | 130 | ||||||
Hexion U.S. Finance Corp. | 580 | 496 | ||||||
INEOS Group Holdings SA 144A | 920 | 859 | ||||||
Owens-Brockway Glass Container, Inc. 144A | 50 | 51 | ||||||
Sappi Papier Holding GmbH 144A | 850 | 864 | ||||||
Severstal OAO (Steel Capital SA) 144A | 425 | 447 | ||||||
Tronox Finance LLC | 650 | 416 | ||||||
Union Andina de Cementos SAA 144A | 155 | 150 | ||||||
United States Steel Corp. | 550 | 421 | ||||||
Vedanta Resources plc | ||||||||
144A 9.500%, 7/18/18(3) | 745 | 626 | ||||||
144A 6.000%, 1/31/19(3) | 720 | 525 | ||||||
|
| |||||||
| 13,855 | ||||||||
|
| |||||||
| Telecommunication Services—3.0% | ||||||||
Altice Financing SA | ||||||||
144A 6.625%, 2/15/23(3) | 720 | 693 | ||||||
US II Corp. 144A | 400 | 356 | ||||||
America Movil SAB de C.V. Series 12 | 5,000 | MXN | 282 | |||||
Bharti Airtel International Netherlands BV 144A | 880 | 932 | ||||||
CenturyLink, Inc. Series V | 570 | 529 | ||||||
Comcel Trust 144A | 475 | 469 | ||||||
Digicel Group Ltd. 144A | 1,100 | 1,023 | ||||||
Empresa Nacional de Telecomunicaciones S.A. 144A | 430 | 428 | ||||||
| PAR VALUE | VALUE | |||||||
| Telecommunication Services—continued | ||||||||
Frontier Communications Corp. | ||||||||
6.250%, 9/15/21 | $ | 670 | $ | 561 | ||||
144A 10.500%, 9/15/22(3) | 210 | 205 | ||||||
Level 3 Financing, Inc. | 935 | 970 | ||||||
Neptune Finco Corp. | ||||||||
144A 10.125%, 1/15/23(3) | 340 | 344 | ||||||
144A 6.625%, 10/15/25(3) | 650 | 655 | ||||||
Sprint Communications, Inc. | 935 | 706 | ||||||
T-Mobile USA, Inc. | 380 | 369 | ||||||
Verizon Communications, Inc. | 895 | 833 | ||||||
Windstream Corp. | 780 | 666 | ||||||
|
| |||||||
| 10,021 | ||||||||
|
| |||||||
| Utilities—1.7% | ||||||||
AmeriGas Partners LP | 770 | 793 | ||||||
Calpine Corp. | 586 | 549 | ||||||
Electricite de France SA 144A | 1,360 | 1,309 | ||||||
Enel SpA 144A | 375 | 432 | ||||||
Lamar Funding Ltd. 144A | 910 | 851 | ||||||
Majapahit Holding BV 144A | 795 | 886 | ||||||
NRG Yield Operating LLC | 345 | 304 | ||||||
Talen Energy Supply LLC 144A | 625 | 572 | ||||||
TerraForm Power Operating LLC 144A | 860 | 763 | ||||||
Texas Competitive Electric Holdings Co. LLC Series A | 200 | 26 | ||||||
|
| |||||||
| 6,485 | ||||||||
| TOTAL CORPORATE BONDS AND NOTES (Identified Cost $197,404) | 181,553 | |||||||
| LOAN AGREEMENTS(2)—11.5% | ||||||||
| Consumer Discretionary—3.4% | ||||||||
Advantage Sales & Marketing, Inc. Second Lien, | 740 | 710 | ||||||
Affinity Gaming LLC | 541 | 544 | ||||||
Aristocrat Leisure Ltd. | 537 | 539 | ||||||
Brickman Group Ltd. LLC (The) Second Lien, | 344 | 336 | ||||||
| PAR VALUE | VALUE | |||||||
| Consumer Discretionary—continued | ||||||||
Caesars Entertainment Operating Co., Inc. | ||||||||
Tranche B-6, | $ | 512 | $ | 477 | ||||
Tranche B-7, | 102 | 93 | ||||||
Caesars Growth Properties Holdings LLC Tranche B, First Lien, | 353 | 311 | ||||||
CBAC Borrower LLC Tranche B, | 480 | 454 | ||||||
Cirque Du Soleil | 254 | 254 | ||||||
El Dorado Resorts, Inc. | 204 | 205 | ||||||
Graton Resort & Casino Tranche B, | 268 | 268 | ||||||
iHeartCommunications, Inc. (Clear Channel Communications, Inc.) Tranche D, | 808 | 673 | ||||||
Key Safety Systems, Inc. | 440 | 430 | ||||||
Landry’s, Inc. (Landry’s Restaurants, Inc.) Tranche B, | 902 | 904 | ||||||
Laureate Education, Inc. 2018 Extended, | 577 | 485 | ||||||
Life Time Fitness, Inc. | 564 | 562 | ||||||
Marina District Finance Co., Inc. | 264 | 267 | ||||||
Peppermill Casinos, Inc. Tranche B, | 1,042 | 1,045 | ||||||
PetSmart, Inc. Tranche B-1 | 154 | 153 | ||||||
Shingle Springs Tribal Gaming Authority | 549 | 553 | ||||||
Staples, Inc. First Lien, | 697 | 694 | ||||||
Transtar Holding Co. Second Lien, | 380 | 369 | ||||||
TWCC Holding Corp. Second Lien, | 784 | 734 | ||||||
U.S. Farathane Corp. | 364 | 366 | ||||||
|
| |||||||
| 11,426 | ||||||||
|
| |||||||
| Consumer Staples—0.9% | ||||||||
Albertson’s LLC Tranche B-4, | 667 | 668 | ||||||
See Notes to Financial Statements
47
Table of Contents
VIRTUS MULTI-SECTOR INTERMEDIATE BOND FUND
SCHEDULE OF INVESTMENTS (Continued)
SEPTEMBER 30, 2015
($ reported in thousands)
| PAR VALUE | VALUE | |||||||
| Consumer Staples—continued | ||||||||
Hostess Brands LLC Tranche B Second Lien, | $ | 890 | $ | 893 | ||||
Rite Aid Corp. Tranche 2, | 550 | 551 | ||||||
|
| |||||||
| 2,112 | ||||||||
|
| |||||||
| Energy—0.9% | ||||||||
Arch Coal, Inc. | 1,101 | 629 | ||||||
Chelsea Petroleum I LLC | 783 | 776 | ||||||
Chief Exploration & Development LLC Second Lien, | 649 | 539 | ||||||
Drillships Ocean Ventures, Inc. | 564 | 379 | ||||||
Jonah Energy LLC Second Lien, | 520 | 421 | ||||||
Seadrill Operating LP | 502 | 308 | ||||||
|
| |||||||
| 3,052 | ||||||||
|
| |||||||
| Financials—0.1% | ||||||||
Capital Automotive LP Second Lien, | 450 | 454 | ||||||
|
| |||||||
| Health Care—1.7% | ||||||||
21st Century Oncology, Inc. Tranche B | 227 | 216 | ||||||
AMAG Pharmaceuticals, Inc. | 149 | 149 | ||||||
American Renal Holdings, Inc. Second Lien, | 909 | 909 | ||||||
Amneal Pharmaceuticals LLC Tranche B, | 330 | 331 | ||||||
Ardent Legacy Acquisitions, Inc. | 459 | 461 | ||||||
Concentra, Inc. First Lien, | 60 | 60 | ||||||
Horizon Pharma, Inc. | 195 | 190 | ||||||
InVentiv Health, Inc. Tranche B-4, | 583 | 585 | ||||||
MMM Holdings, Inc. | 253 | 193 | ||||||
MSO of Puerto Rico, Inc. | 184 | 140 | ||||||
NVA Holdings, Inc. Second Lien | 509 | 506 | ||||||
| PAR VALUE | VALUE | |||||||
| Health Care—continued | ||||||||
PharMEDium Healthcare Corp. Second Lien, | $ | 187 | $ | 185 | ||||
Regional Care, Inc. (RCHP, Inc.) First Lien, | 827 | 820 | ||||||
Surgery Center Holdings, Inc. | ||||||||
First Lien, 5.250%, 11/3/20 | 647 | 647 | ||||||
Second Lien, | 288 | 291 | ||||||
|
| |||||||
| 5,683 | ||||||||
|
| |||||||
| Industrials—1.3% | ||||||||
Ceridian HCM Holding, Inc. | 736 | 700 | ||||||
DynCorp International, Inc. | 386 | 378 | ||||||
Filtration Group Corp. Second Lien, | 194 | 194 | ||||||
Husky Injection Molding Systems Ltd. | 532 | 526 | ||||||
Landmark U.S. Member LLC (Landmark U.S. Corp Acquisition, Inc.) Second Lien | 725 | 723 | ||||||
Navistar, Inc. | 729 | 714 | ||||||
Sedgwick Claims Management Services, Inc. Second Lien, | 1,105 | 1,047 | ||||||
|
| |||||||
| 4,282 | ||||||||
|
| |||||||
| Information Technology—2.4% | ||||||||
Allflex Holdings III, Inc. Second Lien, | 599 | 592 | ||||||
Applied Systems, Inc. Second Lien, | 660 | 656 | ||||||
Blue Coat Systems, Inc. | 195 | 194 | ||||||
Deltek, Inc. | ||||||||
First Lien | 23 | 23 | ||||||
Second Lien 9.500%, 6/26/23 | 408 | 409 | ||||||
Epicor Software Corp. Tranche B, | 364 | 362 | ||||||
First Data Corp. | ||||||||
2018 Term Loan | 1,349 | 1,340 | ||||||
3.946%, 7/8/22 | 225 | 224 | ||||||
Infinity Acquisition Ltd. | 354 | 351 | ||||||
| PAR VALUE | VALUE | |||||||
| Information Technology—continued | ||||||||
Kronos Acquisition Intermediate, Inc. (KIK Custom Products) | $ | 865 |
| $ | 849 |
| ||
Mitchell International, Inc. Second Lien, | 1,323 | 1,322 | ||||||
Presidio, Inc. Refinancing Term | 676 | 676 | ||||||
Riverbed Technologies, Inc. | 407 | 408 | ||||||
|
| |||||||
| 7,406 | ||||||||
|
| |||||||
| Materials—0.4% | ||||||||
CPI Acquisition, Inc. First Lien, | 500 | 497 | ||||||
Fortescue Metals Group (FMG) Resources Property Ltd. | 318 | 261 | ||||||
Houghton International, Inc. Holding Corp. Second Lien, | 630 | 627 | ||||||
INEOS U.S. Finance LLC 2022 Dollar | 57 | 55 | ||||||
|
| |||||||
| 1,440 | ||||||||
|
| |||||||
| Utilities—0.4% | ||||||||
Atlantic Power LP | 173 | 172 | ||||||
NRG Energy, Inc. | 903 | 885 | ||||||
Texas Competitive Electric Holdings Co. LLC 2017 Extended, | 375 | 145 | ||||||
|
| |||||||
| 1,202 | ||||||||
| TOTAL LOAN AGREEMENTS (Identified Cost $40,125) | 38,324 | |||||||
| SHARES | ||||||||
| PREFERRED STOCKS—3.3% | ||||||||
| Energy—0.3% | ||||||||
PTT Exploration & Production PCL 144A, | 905 | (10) | 872 | |||||
|
| |||||||
| Financials—2.8% | ||||||||
Ally Financial, Inc. Series A, | 20,000 | 519 | ||||||
Ally Financial, Inc. Series G, 144A | 161 | 162 | ||||||
See Notes to Financial Statements
48
Table of Contents
VIRTUS MULTI-SECTOR INTERMEDIATE BOND FUND
SCHEDULE OF INVESTMENTS (Continued)
SEPTEMBER 30, 2015
($ reported in thousands)
| SHARES | VALUE | |||||||
| Financials—continued | ||||||||
Banco Bilbao Vizcaya Argentaria S.A. International S.A. Unipersonal | 265 | (10) | $ | 268 | ||||
Bank of New York Mellon Corp. (The) Series E, | 705 | (10) | 694 | |||||
Citigroup, Inc. Series J, | 46,600 | 1,254 | ||||||
Citigroup, Inc. Series N, | 1,065 | (10) | 1,050 | |||||
General Electric Capital Corp. Series B, | 700 | (10) | 760 | |||||
General Electric Capital Corp. Series C, | 600 | (10) | 617 | |||||
Goldman Sachs Group, Inc. (The) Series L, | 635 | (10) | 633 | |||||
JPMorgan Chase & Co. Series V, | 285 | (10) | 277 | |||||
PNC Financial Services Group, Inc. (The) Series R, | 965 | (10) | 903 | |||||
SunTrust Bank, Inc. | 260 | (10) | 260 | |||||
Wells Fargo & Co. Series K, | 950 | (10) | 1,003 | |||||
Zions Bancorp | 38,525 | 1,083 | ||||||
|
| |||||||
| 9,483 | ||||||||
|
| |||||||
| Industrials—0.2% | ||||||||
Seaspan Corp. Series C, | 20,000 | 508 | ||||||
| TOTAL PREFERRED STOCKS (Identified Cost $10,578) | 10,863 | |||||||
| COMMON STOCK—0.0% | ||||||||
| Consumer Discretionary—0.0% | ||||||||
Mark IV Industries | 446 | 16 | ||||||
| TOTAL COMMON STOCK (Identified Cost $4) | 16 | |||||||
| EXCHANGE-TRADED FUND—0.5% | ||||||||
SPDR S&P 500 (R) ETF Trust | 9,500 | 1,820 | ||||||
| TOTAL EXCHANGE-TRADED FUND (Identified Cost $1,799) | 1,820 | |||||||
| SHARES | VALUE | |||||||
| AFFILIATED MUTUAL FUND—2.7% | ||||||||
Virtus Credit Opportunities Fund(16) | 927,131 | $ | 9,058 | |||||
| TOTAL AFFILIATED MUTUAL FUND (Identified Cost $9,270) | 9,058 | |||||||
| TOTAL LONG TERM INVESTMENTS—99.4% | ||||||||
| (Identified Cost $352,257) | 330,551 | (9) | ||||||
| SHORT-TERM INVESTMENT—1.1% | ||||||||
| Money Market Mutual Fund—1.1% | ||||||||
Fidelity Money Market Portfolio – Institutional Shares (seven-day effective yield 0.170%) | 3,669,575 | 3,670 | ||||||
| TOTAL SHORT-TERM INVESTMENT (Identified Cost $3,670) | 3,670 | |||||||
| TOTAL INVESTMENTS—100.5% (Identified Cost $355,927) | 334,221 | (1) | ||||||
Other assets and liabilities, net—(0.5)% |
| (1,687 | ) | |||||
|
| |||||||
| NET ASSETS—100.0% | $ | 332,534 | ||||||
|
| |||||||
Abbreviations:
| ETF | Exchange-Traded Fund |
| FHLMC | Federal Home Loan Mortgage Corporation (“Freddie Mac”). |
| FNMA | Federal National Mortgage Association (“Fannie Mae”). |
| PIK | Payment-in-Kind Security |
| REIT | Real Estate Investment Trust |
| SPDR | S&P Depositary Receipt |
Footnote Legend:
| (1) | Federal Income Tax Information: For tax information at September 30, 2015, see Note 10 Federal Income Tax Information in the Notes to Financial Statements. |
| (2) | Variable or step coupon security; interest rate shown reflects the rate in effect at September 30, 2015. |
| (3) | Security exempt from registration under Rule 144A of the Securities Act of 1933. These securities may be resold in transactions exempt from registration, normally to qualified institutional buyers. At September 30, 2015, these securities amounted to a value of $122,366 or 36.8% of net assets. |
| (4) | Regulation S security. Security is offered and sold outside of the United States, therefore, it is exempt from registration with the SEC under rules 903 and 904 of the Securities Act of 1933. |
| (5) | No contractual maturity date. |
| (6) | Interest payments may be deferred. |
| (7) | This Note was issued for the sole purpose of funding a loan agreement between the issuer and the borrower. As the credit risk for this security lies solely with the borrower, the name represented here is that of the borrower. |
| (8) | This loan will settle after September 30, 2015, at which time the interest rate, based on the London Interbank Offered Rate (“LIBOR”) and the agreed upon spread on trade date, will be reflected. |
| (9) | All or a portion of the Fund’s assets have been segregated as collateral for delayed delivery security. |
| (10) | Value shown as par value. |
| (11) | 92.1% of the income received was in cash and 7.9% in PIK. |
| (12) | Security in default, portion of the interest payments are being received during the bankruptcy proceedings. |
| (13) | 100% of the income received was in cash. |
| (14) | Security in default. |
| (15) | Illiquid security. |
| (16) | This fund is a public fund and the prospectus and annual report are publicly available. |
Foreign Currencies:
| BRL | Brazilian Real |
| CLP | Chilean Peso |
| COP | Colombian Peso |
| MXN | Mexican Peso |
| RUB | Russian Ruble |
| TRY | Turkish Lira |
| ZAR | South African Rand |
| Country Weightings (Unaudited)† | ||||
United States | 76 | % | ||
Canada | 2 | |||
Luxembourg | 2 | |||
Mexico | 2 | |||
Netherlands | 2 | |||
Cayman Islands | 1 | |||
United Kingdom | 1 | |||
Other | 14 | |||
Total | 100 | % | ||
† % of total investments as of September 30, 2015. |
| |||
Security abbreviation definitions are located under the Key Investment Terms starting on page 4.
See Notes to Financial Statements
49
Table of Contents
VIRTUS MULTI-SECTOR INTERMEDIATE BOND FUND
SCHEDULE OF INVESTMENTS (Continued)
SEPTEMBER 30, 2015
($ reported in thousands)
The following table provides a summary of inputs used to value the Fund’s investments as of September 30, 2015 (See Security Valuation Note 2A in the Notes to Financial Statements):
| Total Value at September 30, 2015 | Level 1 Quoted Prices | Level 2 Significant Observable Inputs | Level 3 Significant Unobservable Inputs | |||||||||||||
Debt Securities: | ||||||||||||||||
Asset-Backed Securities | $ | 15,871 | $ | — | $ | 15,327 | $ | 544 | ||||||||
Corporate Bonds and Notes | 181,553 | — | 181,553 | — | ||||||||||||
Foreign Government Securities | 14,549 | — | 14,549 | — | ||||||||||||
Loan Agreements | 38,324 | — | 37,955 | 369 | ||||||||||||
Mortgage-Backed Securities | 54,630 | — | 54,630 | — | ||||||||||||
Municipal Bonds | 375 | — | 375 | — | ||||||||||||
U.S. Government Securities | 3,492 | — | 3,492 | — | ||||||||||||
Equity Securities: | ||||||||||||||||
Affiliated Mutual Fund | 9,058 | 9,058 | — | — | ||||||||||||
Common Stock | 16 | — | — | 16 | ||||||||||||
Exchange-Traded Fund | 1,820 | 1,820 | — | — | ||||||||||||
Preferred Stocks | 10,863 | 2,281 | 8,582 | — | ||||||||||||
Short-Term Investment | 3,670 | 3,670 | — | — | ||||||||||||
|
|
|
|
|
|
|
| |||||||||
Total Investments | $ | 334,221 | $ | 16,829 | $ | 316,463 | $ | 929 | ||||||||
|
|
|
|
|
|
|
| |||||||||
Securities held by the Fund with an end of period value of $1,083 were transferred from Level 1 to Level 2 since an exchange price is no longer available.
The following is a reconciliation of assets of the Fund for Level 3 investments for which significant unobservable inputs were used to determine fair value.
| Total | Asset-Backed Securities | Common Stocks | Loan Agreements | |||||||||||||
Investments in Securities | ||||||||||||||||
Balance as of September 30, 2014: | $ | 24 | $ | — | $ | 24 | $ | — | ||||||||
Accrued discount/(premium) | — | (d) | — | (d) | — | — | ||||||||||
Realized gain (loss) | — | — | (d) | — | — | |||||||||||
Change in unrealized appreciation (depreciation)(c) | (9 | ) | (1 | ) | (8 | ) | — | |||||||||
Purchases | 545 | 545 | — | — | ||||||||||||
Sales(b) | — | — | — | — | ||||||||||||
Transfers into Level 3(a) | 369 | (e) | — | — | 369 | (e) | ||||||||||
Transfers from Level 3(a) | — | — | — | — | ||||||||||||
|
|
|
|
|
|
|
| |||||||||
Balance as of September 30, 2015 | $ | 929 | $ | 544 | $ | 16 | $ | 369 | ||||||||
|
|
|
|
|
|
|
| |||||||||
| (a) | “Transfers into and/or from” represent the ending value as of September 30, 2015, for any investment security where a change in the pricing level occurred from the beginning to the end of the period. |
| (b) | Includes paydowns on securities. |
| (c) | Included in the related net change in unrealized appreciation/(depreciation) in the Statements of Operations on investments still held as of September 30, 2015. The change in unrealized appreciation (depreciation) on investments still held on September 30, 2015 was $(8). |
| (d) | Amount less than $500. |
| (e) | The transfer is due to increase and/or decrease in trading activities at period end. |
None of the securities in this table are internally fair valued.
See Notes to Financial Statements
50
Table of Contents
VIRTUS SENIOR FLOATING RATE FUND
SCHEDULE OF INVESTMENTS
SEPTEMBER 30, 2015
($ reported in thousands)
| PAR VALUE | VALUE | |||||||
| ASSET-BACKED SECURITIES—0.2% | ||||||||
Home Equity Loan Trust | $ | 1,146 | $ | 1,160 | ||||
| TOTAL ASSET-BACKED SECURITIES (Identified Cost $1,131) | 1,160 | |||||||
| CORPORATE BONDS AND NOTES—4.9% | ||||||||
| Consumer Discretionary—0.8% | ||||||||
American Axle & Manufacturing, Inc. | 835 | 838 | ||||||
Argos Merger Sub, Inc. 144A | 905 | 918 | ||||||
Boyd Gaming Corp. | 365 | 372 | ||||||
iHeartCommunications, Inc. | 1,365 | 729 | ||||||
International Game Technology plc 144A | 600 | 585 | ||||||
Isle of Capri Casinos, Inc. | 179 | 185 | ||||||
Landry’s, Inc. 144A | 950 | 1,018 | ||||||
Numericable Group SA 144A | 755 | 732 | ||||||
Univision Communications, Inc. 144A | 445 | 425 | ||||||
|
| |||||||
| 5,802 | ||||||||
|
| |||||||
| Consumer Staples—0.2% | ||||||||
Dole Food Co., Inc. 144A | 880 | 880 | ||||||
Spectrum Brands, Inc. | 715 | 760 | ||||||
|
| |||||||
| 1,640 | ||||||||
|
| |||||||
| Energy—0.3% | ||||||||
FTS International, Inc. 144A | 1,120 | 830 | ||||||
6.250%, 5/1/22 | 825 | 260 | ||||||
Halcon Resources Corp. 144A | 435 | 363 | ||||||
PHI, Inc. | 450 | 389 | ||||||
|
| |||||||
| 1,842 | ||||||||
|
| |||||||
| Financials—0.9% | ||||||||
Aercap Ireland Capital Ltd. | 335 | 335 | ||||||
Aircastle Ltd. | 580 | 592 | ||||||
Banco Santander Brasil SA 144A | 1,300 | BRL | 312 | |||||
iStar Financial, Inc. | ||||||||
4.875%, 7/1/18 | 1,415 | 1,374 | ||||||
5.000%, 7/1/19 | 865 | 826 | ||||||
| PAR VALUE | VALUE | |||||||
| Financials—continued | ||||||||
Springleaf Finance Corp. | $ | 2,510 | $ | 2,460 | ||||
|
| |||||||
| 5,899 | ||||||||
|
| |||||||
| Health Care—0.7% | ||||||||
Capsugel SA PIK Interest Capitalization 144A | 350 | 350 | ||||||
Community Health Systems, Inc. | 1,055 | 1,081 | ||||||
Quintiles Transnational Corp. 144A | 385 | 382 | ||||||
Tenet Healthcare Corp. | 415 | 403 | ||||||
144A 3.837%, 6/15/20(2)(3) | 730 | 726 | ||||||
6.000%, 10/1/20 | 435 | 460 | ||||||
Valeant Pharmaceuticals International, Inc. | 965 | 984 | ||||||
144A 5.375%, 3/15/20(3) | 750 | 731 | ||||||
|
| |||||||
| 5,117 | ||||||||
|
| |||||||
| Industrials—0.2% | ||||||||
Air Canada 144A | 965 | 1,013 | ||||||
American Airlines Group, Inc. | 460 | 450 | ||||||
|
| |||||||
| 1,463 | ||||||||
|
| |||||||
| Information Technology—0.4% | ||||||||
Avaya, Inc. 144A | 1,090 | 869 | ||||||
Blue Coat Holdings, Inc. 144A | 430 | 431 | ||||||
First Data Corp. | 1,331 | 1,481 | ||||||
|
| |||||||
| 2,781 | ||||||||
|
| |||||||
| Materials—0.9% | ||||||||
Ardagh Packaging Finance plc 144A | 400 | 400 | ||||||
Beverage Packaging Holdings Luxembourg II SA 144A | 1,465 | 1,439 | ||||||
Fortescue Metals Group (FMG) Resources August 2006 Pty Ltd. 144A | 160 | 150 | ||||||
Hexion U.S. Finance Corp. | 2,745 | 2,347 | ||||||
INEOS Group Holdings SA 144A | 1,130 | 1,055 | ||||||
Vedanta Resources plc 144A | 685 | 576 | ||||||
|
| |||||||
| 5,967 | ||||||||
|
| |||||||
| PAR VALUE | VALUE | |||||||
| Telecommunication Services—0.3% | ||||||||
Frontier Communications Corp. 144A | $ | 215 | $ | 211 | ||||
6.250%, 9/15/21 | 1,085 | 909 | ||||||
Level 3 Financing, Inc. | 1,105 | 1,146 | ||||||
|
| |||||||
| 2,266 | ||||||||
|
| |||||||
| Utilities—0.2% | ||||||||
Talen Energy Supply LLC 144A | 1,510 | 1,382 | ||||||
| TOTAL CORPORATE BONDS AND NOTES | ||||||||
| (Identified Cost $37,105) | 34,159 | |||||||
| LOAN AGREEMENTS(2)—97.0% | ||||||||
| Consumer Discretionary—29.7% | ||||||||
Acosta Holdco, Inc. Tranche B-1 | 1,876 | 1,851 | ||||||
Advantage Sales & Marketing, Inc. First Lien, | 2,086 | 2,053 | ||||||
Second Lien, | 1,780 | 1,709 | ||||||
Affinity Gaming LLC | 971 | 977 | ||||||
Allison Transmission | 645 | 646 | ||||||
Aristocrat Leisure Ltd. | 3,346 | 3,354 | ||||||
Boyd Gaming Corp. Tranche B, | 4,367 | 4,370 | ||||||
Brickman Group Ltd. LLC (The) Second Lien, | 1,971 | 1,927 | ||||||
Caesars Entertainment Operating Co., Inc. | ||||||||
Tranche B-4, | 943 | 886 | ||||||
Tranche B-6, | 2,558 | 2,381 | ||||||
Tranche B-7, | 2,220 | 2,018 | ||||||
Caesars Entertainment Resort Properties LLC Tranche B, | 3,054 | 2,861 | ||||||
Caesars Growth Properties Holdings LLC Tranche B, First Lien, | 3,493 | 3,083 | ||||||
CBAC Borrower LLC Tranche B, | 2,523 | 2,384 | ||||||
Cequel Communications LLC | 1,646 | 1,629 | ||||||
Charter Communications Operations LLC | ||||||||
Tranche F, 3.000%, 1/3/21 | 6,180 | 6,089 | ||||||
Tranche H, 3.250%, 8/24/21 | 1,104 | 1,100 | ||||||
Tranche I, 3.500%, 1/24/23 | 1,348 | 1,343 | ||||||
See Notes to Financial Statements
51
Table of Contents
VIRTUS SENIOR FLOATING RATE FUND
SCHEDULE OF INVESTMENTS (Continued)
SEPTEMBER 30, 2015
($ reported in thousands)
| PAR VALUE | VALUE | |||||||
| Consumer Discretionary—continued | ||||||||
Chrysler Group LLC Tranche B, | $ | 2,573 | $ | 2,555 | ||||
Cirque Du Soleil | 1,613 | 1,616 | ||||||
CityCenter Holdings LLC Tranche B, | 2,560 | 2,556 | ||||||
Cooper-Standard Automotive, Inc. | 2,988 | 2,974 | ||||||
CSC Holdings, Inc. | ||||||||
Tranche B, 2.694%, 4/17/20 | 2,066 | 2,054 | ||||||
0.000%, 9/23/22(7) | 5,060 | 5,038 | ||||||
Cumulus Media Holdings, Inc. | 1,756 | 1,484 | ||||||
Delta 2 (Lux) S.A.R.L. Tranche B-3, | 3,813 | 3,752 | ||||||
El Dorado Resorts, Inc. | 1,042 | 1,043 | ||||||
Federal-Mogul Corp. Tranche C, | 2,308 | 2,196 | ||||||
Golden Nugget, Inc. | 1,000 | 1,004 | ||||||
Delayed Draw | 429 | 430 | ||||||
Graton Resort & Casino Tranche B, | 1,146 | 1,145 | ||||||
Hilton Worldwide Finance LLC | 13,756 | 13,743 | ||||||
Hudson’s Bay Co. | 1,980 | 1,991 | ||||||
iHeartCommunications, Inc. (Clear Channel Communications, Inc.) Tranche D, | 13,633 | 11,343 | ||||||
Infiltrator Systems Tranche B, | 723 | 724 | ||||||
Intelsat Jackson Holdings S.A. Tranche B-2, | 2,838 | 2,767 | ||||||
Jarden | ||||||||
Tranche B-1, | 198 | 199 | ||||||
Tranche B-2 | 1,393 | 1,394 | ||||||
KAR Auction Services, Inc. Tranche B-2, | 2,563 | 2,564 | ||||||
Key Safety Systems, Inc. | 2,030 | 1,989 | ||||||
Laureate Education, Inc. 2018 Extended, | 4,201 | 3,529 | ||||||
Leslie’s Poolmart Tranche B, | 3,210 | 3,149 | ||||||
Libbey Glass, Inc. | 3,510 | 3,505 | ||||||
Life Time Fitness, Inc. | 2,790 | 2,783 | ||||||
| PAR VALUE | VALUE | |||||||
| Consumer Discretionary—continued | ||||||||
Marina District Finance Co., Inc. | $ | 814 | $ | 821 | ||||
MCC LLC (Mediacom Broadband Group) | ||||||||
Tranche H, 3.250%, 1/29/21 | 2,293 | 2,263 | ||||||
Tranche G, 3.500%, 6/30/21 | 2,319 | 2,303 | ||||||
Tranche J, 3.750%, 6/30/21 | 925 | 924 | ||||||
Media General, Inc. | 4,108 | 4,082 | ||||||
Metaldyne LLC 3. | 2,606 | 2,596 | ||||||
MGM Resort International Tranche B | 5,726 | 5,691 | ||||||
Michaels Stores, Inc. Tranche B, | 2,918 | 2,917 | ||||||
Mohegan Tribal Gaming Authority Tranche B, | 2,448 | 2,441 | ||||||
Numericable SFR | ||||||||
Tranche B-1, | 1,302 | 1,297 | ||||||
Tranche B-2, | 1,136 | 1,132 | ||||||
Party City Holdings, Inc. | 687 | 687 | ||||||
Peninsula Gaming LLC Tranche B, | 796 | 796 | ||||||
Penn National Gaming, Inc. Tranche B, | 2,948 | 2,946 | ||||||
Peppermill Casinos, Inc. Tranche B, | 2,266 | 2,272 | ||||||
PetSmart, Inc. Tranche B-1 | 1,117 | 1,117 | ||||||
Pinnacle Entertainment, Inc. Tranche B-2, | 1,858 | 1,859 | ||||||
Scientific Games International, Inc. Tranche B-2, | 2,786 | 2,755 | ||||||
ServiceMaster Co. LLC (The) | 6,545 | 6,549 | ||||||
Shingle Springs Tribal Gaming Authority | 1,450 | 1,459 | ||||||
Sinclair Television Group, Inc. Tranche B-1, | 3,756 | 3,730 | ||||||
Six Flags Theme Parks, Inc. Tranche B, | 1,354 | 1,356 | ||||||
SRAM LLC First Lien, | 2,461 | 2,332 | ||||||
Staples, Inc. First Lien, | 2,412 | 2,403 | ||||||
Station Casinos LLC Tranche B, | 3,008 | 3,006 | ||||||
| PAR VALUE | VALUE | |||||||
| Consumer Discretionary—continued | ||||||||
TI Group Auto Systems LLC | $ | 290 | $ | 287 | ||||
Transtar Holding Co. | ||||||||
First Lien, 5.750%, 10/9/18 | 1,427 | 1,384 | ||||||
Second Lien, | 460 | 446 | ||||||
Tribune Media Co. Tranche B, | 3,988 | 3,960 | ||||||
TWCC Holding Corp. Second Lien, | 2,142 | 2,004 | ||||||
U.S. Farathane Corp. | 1,210 | 1,217 | ||||||
Univision Communications, Inc. First Lien, | 4,396 | 4,374 | ||||||
4.000%, 3/1/20 | 7,586 | 7,548 | ||||||
Virgin Media Investment Holdings Ltd. Tranche F, | 2,590 | 2,556 | ||||||
Ziggo B.V. | ||||||||
Tranche B-3, | 1,482 | 1,457 | ||||||
Tranche B-1, | 1,398 | 1,375 | ||||||
Tranche B-2, | 901 | 886 | ||||||
|
| |||||||
| 205,416 | ||||||||
|
| |||||||
| Consumer Staples—4.5% | ||||||||
Albertson’s LLC Tranche B-4, | 2,263 | 2,267 | ||||||
ARAMARK Corp. | ||||||||
Tranche E, 3.250%, 9/7/19 | 3,823 | 3,821 | ||||||
Tranche F, 3.250%, 2/24/21 | 983 | 981 | ||||||
Charger OpCo B.V. (Oak Tea, Inc.) Tranche B-1, | 1,083 | 1,085 | ||||||
Crossmark Holdings, Inc. | ||||||||
First Lien, | 1,968 | 1,738 | ||||||
Second Lien, | 520 | 408 | ||||||
Del Monte Corp. First Lien, | 946 | 898 | ||||||
Dole Food Co., Inc. Tranche B, | 2,179 | 2,177 | ||||||
Hostess Brands LLC | ||||||||
Tranche B, First Lien, | 2,570 | 2,577 | ||||||
Tranche B Second Lien, | 1,900 | 1,906 | ||||||
Kronos Acquisition Intermediate, Inc. (KIK Custom Products, Inc.) | ||||||||
Second Lien, | 4,447 | 4,541 | ||||||
6.000%, 8/26/22 | 2,227 | 2,186 | ||||||
Prestige Brands, Inc. Tranche B-3, | 263 | 263 | ||||||
Reynolds Group Holdings, Inc. 4.500%, 12/1/18 | 3,988 | 3,995 | ||||||
See Notes to Financial Statements
52
Table of Contents
VIRTUS SENIOR FLOATING RATE FUND
SCHEDULE OF INVESTMENTS (Continued)
SEPTEMBER 30, 2015
($ reported in thousands)
| PAR VALUE | VALUE | |||||||
| Consumer Staples—continued | ||||||||
Rite Aid Corp. | ||||||||
Tranche 1 | $ | 101 | $ | 102 | ||||
Tranche 2, Second Lien, | 1,417 | 1,421 | ||||||
Spectrum Brands, Inc. | 740 | 743 | ||||||
|
| |||||||
| 31,109 | ||||||||
|
| |||||||
| Energy—2.7% | �� | |||||||
Arch Coal, Inc. | 3,326 | 1,900 | ||||||
Azure Midstream | 1,364 | 1,173 | ||||||
Chelsea Petroleum I LLC | 1,634 | 1,620 | ||||||
Chief Exploration & Development LLC Second Lien, | 2,739 | 2,273 | ||||||
Drillships Ocean Ventures, Inc. | 1,510 | 1,015 | ||||||
Fieldwood Energy LLC | 847 | 724 | ||||||
Second Lien, 8.375%, 9/30/20 | 2,613 | 742 | ||||||
FTS International, Inc. | 791 | 247 | ||||||
Jonah Energy LLC Second Lien, | 2,045 | 1,657 | ||||||
MEG Energy Corp. | 1,921 | 1,801 | ||||||
Ocean Rig Tranche B-1, | 2,940 | 1,755 | ||||||
Paragon Offshore Finance Co. 3.750%, 7/16/21 | 1,716 | 699 | ||||||
Sabine Oil & Gas LLC Second Lien, | 1,290 | 229 | ||||||
Seadrill Operating LP | 5,278 | 3,237 | ||||||
|
| |||||||
| 19,072 | ||||||||
|
| |||||||
| Financials—6.0% | ||||||||
Alix Partners LLP | 4,146 | 4,141 | ||||||
Asurion LLC Tranche B-1, | 1,069 | 1,023 | ||||||
Tranche B-2, | 731 | 687 | ||||||
Tranche B-4, | 1,071 | 1,016 | ||||||
Capital Automotive LP Tranche B-1, | 1,502 | 1,503 | ||||||
Second Lien, | 1,828 | 1,845 | ||||||
Clipper Acquisitions Corp. | 986 | 971 | ||||||
Delos Finance S.A.R.L. | 4,026 | 4,022 | ||||||
| PAR VALUE | VALUE | |||||||
| Financials—continued | ||||||||
DtTZ U.S. Borrower, LLC (DTZ AUS Holdco PTY Ltd.) | $ | 2,993 | $ | 2,967 | ||||
iStar Financial, Inc. Tranche A-2, | 362 | 371 | ||||||
National Financial Partners LLC 4.500%, 7/1/20 | 2,799 | 2,757 | ||||||
Realogy Corp. | 204 | 203 | ||||||
Tranche B, | 7,377 | 7,369 | ||||||
Starwood Property Trust, Inc. First Lien, | 3,296 | 3,253 | ||||||
TransUnion LLC Tranche B-2, | 5,214 | 5,170 | ||||||
Walter Investment Management Corp. Tranche B, | 4,303 | 3,998 | ||||||
|
| |||||||
| 41,296 | ||||||||
|
| |||||||
| Health Care—16.3% | ||||||||
21st Century Oncology, Inc. Tranche B | 1,905 | 1,815 | ||||||
Accellent, Inc. First Lien, | 1,749 | 1,749 | ||||||
Air Medical | 184 | 174 | ||||||
Akorn, Inc. | 2,711 | 2,709 | ||||||
Alere, Inc. Tranche B, | 1,684 | 1,686 | ||||||
AMAG Pharmaceuticals, Inc. | 1,057 | 1,054 | ||||||
American Renal Holdings, Inc. Tranche B, First Lien, | 2,429 | 2,416 | ||||||
Second Lien, | 2,390 | 2,390 | ||||||
Amneal Pharmaceuticals LLC Tranche B, | 3,385 | 3,388 | ||||||
AmSurg Corp. | 1,192 | 1,194 | ||||||
Ardent Legacy Acquisitions, Inc. | 1,559 | 1,565 | ||||||
Beacon Health Strategies | 2,279 | 2,252 | ||||||
Capsugel Holdings US, Inc. | 3,953 | 3,947 | ||||||
CHG Healthcare Services, Inc. First Lien, | 4,302 | 4,298 | ||||||
Community Health Systems, Inc. (CHS) | ||||||||
Incremental 2018, Tranche F, 3.575%, 12/31/18 | 1,291 | 1,292 | ||||||
Incremental 2019, Tranche G, 3.750%, 12/31/19 | 1,332 | 1,332 | ||||||
| PAR VALUE | VALUE | |||||||
| Health Care—continued | ||||||||
Incremental 2021, Tranche H, 4.000%, 1/27/21 | $ | 2,451 | $ | 2,454 | ||||
Concentra, Inc. First Lien, Tranche B | 289 | 289 | ||||||
Convatec, Inc. | 100 | 100 | ||||||
DaVita HealthCare Partners, Inc. Tranche B, | 3,116 | 3,116 | ||||||
DJO Finance | 1,462 | 1,459 | ||||||
Emdeon, Inc. | 495 | 493 | ||||||
Tranche B-2, | 4,050 | 4,035 | ||||||
Endo Luxembourg Finance Co. I S.A.R.L. | 2,251 | 2,248 | ||||||
Envision Healthcare Corp. (F/K/A Emergency Medical Services Corp.) | 3,645 | 3,649 | ||||||
Hill-Rom Tranche B, | 145 | 145 | ||||||
Horizon Pharma, Inc. | 1,220 | 1,196 | ||||||
Iasis Healthcare LLC Tranche B-2, | 1,971 | 1,975 | ||||||
IMS Health, Inc. Tranche B, | 5,278 | 5,263 | ||||||
InVentiv Health, Inc. Tranche B-4, | 2,887 | 2,896 | ||||||
Kinetic Concepts, Inc. | 928 | 928 | ||||||
Tranche E-1, | 571 | 571 | ||||||
Mallinckrodt International Finance S.A. Tranche B, | 2,747 | 2,703 | ||||||
Tranche B-1, | 289 | 286 | ||||||
MMM Holdings, Inc. | 377 | 287 | ||||||
MSO of Puerto Rico, Inc. | 274 | 209 | ||||||
Multiplan, Inc. Tranche B-1, | 3,065 | 3,032 | ||||||
National Mentor Holdings, Inc. Tranche B, | 1,067 | 1,061 | ||||||
National Surgical Hospitals First Lien, | 1,085 | 1,088 | ||||||
NBTY, Inc. Tranche B-2, | 2,782 | 2,768 | ||||||
NVA Holdings | 117 | 117 | ||||||
NVA Holdings, Inc. | 772 | 773 | ||||||
See Notes to Financial Statements
53
Table of Contents
VIRTUS SENIOR FLOATING RATE FUND
SCHEDULE OF INVESTMENTS (Continued)
SEPTEMBER 30, 2015
($ reported in thousands)
| PAR VALUE | VALUE | |||||||
| Health Care—continued | ||||||||
Second Lien | $ | 986 | $ | 980 | ||||
Ortho-Clinical Diagnostics, Inc. | 3,310 | 3,259 | ||||||
Pharmaceutical Product Development | 2,480 | 2,456 | ||||||
PharMEDium Healthcare Corp. | 1,636 | 1,621 | ||||||
Second Lien, | 540 | 535 | ||||||
PRA Holdings, Inc. Tranche B-1, | 2,322 | 2,328 | ||||||
Quintiles Transnational Corp. Tranche B, | 1,127 | 1,129 | ||||||
Regional Care, Inc. (RCHP, Inc.) First Lien, | 3,895 | 3,864 | ||||||
RPI Finance Trust Tranche B-4, | 1,134 | 1,132 | ||||||
Schumacher Group | 1,840 | 1,835 | ||||||
Sterigenics-Nordion | 1,086 | 1,081 | ||||||
Surgery Center Holdings, Inc. | 651 | 652 | ||||||
Second Lien, | 1,693 | 1,711 | ||||||
Surgical Care Affiliates, Inc. | 729 | 729 | ||||||
U.S. Renal Care, Inc. Tranche B-2, First Lien, | 2,981 | 2,980 | ||||||
Valeant Pharmaceuticals International, Inc. | 2,158 | 2,128 | ||||||
Series C-2, Tranche B, | 2 | 2 | ||||||
Series E1, Tranche B, | 3,981 | 3,929 | ||||||
Series F-1, Tranche B, | 3,930 | 3,896 | ||||||
|
| |||||||
| 112,649 | ||||||||
|
| |||||||
| Industrials—12.3% | ||||||||
Air Canada | 2,232 | 2,235 | ||||||
Allied Security Holdings LLC | 1,377 | 1,364 | ||||||
Second Lien, | 688 | 680 | ||||||
American Airlines, Inc. | 9,047 | 8,971 | ||||||
3.500%, 10/10/21 | 2,015 | 2,011 | ||||||
Beacon Roofing Supply | 423 | 423 | ||||||
| PAR VALUE | VALUE | |||||||
| Industrials—continued | ||||||||
Brickman Group Holdings, Inc. First Lien, | $ | 3,821 | $ | 3,771 | ||||
Brock Holdings III, Inc. First Lien, | 2,580 | 2,506 | ||||||
Builders FirstSource | 2,045 | 2,032 | ||||||
Ceridian HCM Holding, Inc. | 2,361 | 2,244 | ||||||
DynCorp International, Inc. | 2,372 | 2,323 | ||||||
Filtration Group Corp. | 1,425 | 1,427 | ||||||
Second Lien, | 543 | 544 | ||||||
Harland Clarke Holdings Corp. Tranche B-3, | 2,112 | 2,110 | ||||||
Tranche B-4, | 658 | 657 | ||||||
HD Supply | 2,971 | 2,963 | ||||||
Headwaters, Inc. Tranche B, | 149 | 149 | ||||||
Husky Injection Molding Systems Ltd. | 3,287 | 3,249 | ||||||
Landmark U.S. Member LLC (Landmark U.S. Corp Acquisition, Inc.) | 112 | 111 | ||||||
First Lien, | 2,818 | 2,806 | ||||||
Second Lien | 970 | 967 | ||||||
McJunkin Red Man Corp. | 1,037 | 1,015 | ||||||
Navistar, Inc. | 1,319 | 1,292 | ||||||
Nortek, Inc. Incremental-1, | 4,268 | 4,244 | ||||||
Quikrete Co., Inc. First Lien, | 2,829 | 2,818 | ||||||
Rexnord LLC Tranche B, | 4,900 | 4,862 | ||||||
Science Applications Tranche B, | 3,082 | 3,085 | ||||||
Sedgwick Claims Management Services, Inc. | 4,807 | 4,742 | ||||||
Second Lien, | 1,760 | 1,668 | ||||||
Spin Holdco, Inc. First Lien, | 2,280 | 2,240 | ||||||
TransDigm, Inc. | 6,993 | 6,919 | ||||||
Tranche D, 3.750%, 6/4/21 | 2,642 | 2,613 | ||||||
United Airlines, Inc. (Continental Airlines, Inc.) Tranche B-1, | 4,255 | 4,250 | ||||||
| PAR VALUE | VALUE | |||||||
| Industrials—continued | ||||||||
Waste Industries USA, Inc. | $ | 2,185 | $ | 2,197 | ||||
|
| |||||||
| 85,488 | ||||||||
|
| |||||||
| Information Technology—10.2% | ||||||||
Allflex Holdings III, Inc. | 4,150 | 4,108 | ||||||
Second Lien, | 789 | 780 | ||||||
Applied Systems, Inc. First Lien, | 569 | 568 | ||||||
Second Lien, | 1,878 | 1,866 | ||||||
Avago Technologies Cayman Ltd. | 3,047 | 3,049 | ||||||
Blue Coat Systems, Inc. | 1,651 | 1,640 | ||||||
CCC Information Services | 2,876 | 2,867 | ||||||
CDW LLC | 8,152 | 8,094 | ||||||
Deltek, Inc. | 194 | 194 | ||||||
Second Lien | 858 | 861 | ||||||
Ellucian, Inc. | 2,580 | 2,578 | ||||||
Epicor Software Corp. Tranche B, | 1,440 | 1,433 | ||||||
Evergreen Skills Lux S.A.R.L. | 2,767 | 2,502 | ||||||
Excelitas Technologies Corp. Tranche B, | 2,142 | 2,080 | ||||||
First Data Corp. | 11,620 | 11,542 | ||||||
Second Lien 2018 | 1,156 | 1,147 | ||||||
3.946%, 7/8/22 | 354 | 353 | ||||||
Infinity Acquisition Ltd. | 2,572 | 2,548 | ||||||
Infor (U.S.), Inc. | 3,508 | 3,402 | ||||||
Tranche B-3, | 4,374 | 4,239 | ||||||
Interactive Data Corp. | 3,168 | 3,162 | ||||||
Mitchell International, Inc. | 3,329 | 3,322 | ||||||
Second Lien, | 3,057 | 3,054 | ||||||
Presidio, Inc. Refinancing Term 5.250%, 2/2/22 | 1,419 | 1,419 | ||||||
Riverbed Technologies, Inc. 6.000%, 4/25/22 | 2,164 | 2,170 | ||||||
See Notes to Financial Statements
54
Table of Contents
VIRTUS SENIOR FLOATING RATE FUND
SCHEDULE OF INVESTMENTS (Continued)
SEPTEMBER 30, 2015
($ reported in thousands)
| PAR VALUE | VALUE | |||||||
| Information Technology—continued | ||||||||
SS&C Technologies, Inc. | $ | 188 | $ | 188 | ||||
Tranche A-2, | 292 | 292 | ||||||
Tranche B-1, | 1,237 | 1,241 | ||||||
Tranche B-2, | 196 | 196 | ||||||
|
| |||||||
| 70,895 | ||||||||
|
| |||||||
| Materials—8.1% | ||||||||
American Builders & Contractors Supply Co., Inc. | 5,880 | 5,846 | ||||||
Anchor Glass Container Tranche B, | 4,834 | 4,846 | ||||||
Ardagh Packaging Finance plc | 863 | 861 | ||||||
AZ Chem US, Inc. First Lien, | 1,532 | 1,533 | ||||||
Berlin Packaging, Inc. S.A.R.L. | 1,828 | 1,823 | ||||||
Berry Plastics Groups, Inc. Tranche D, | 4,532 | 4,497 | ||||||
Tranche E, | 1,843 | 1,833 | ||||||
0.000%, 9/16/22(7) | 736 | 736 | ||||||
CPG International | 758 | 751 | ||||||
Fortescue Metals Group (FMG) Resources Property Ltd. | 4,909 | 4,027 | ||||||
Huntsman International LLC | 3,970 | 3,848 | ||||||
Ineos US Finance LLC | 9,000 | 8,747 | ||||||
Owens-Illinois Tranche B, | 559 | 561 | ||||||
Royal Holdings, Inc. First Lien, | 2,134 | 2,121 | ||||||
Solenis International LP | 2,321 | 2,295 | ||||||
Summit Materials | 3,545 | 3,543 | ||||||
Univar, Inc. | 3,562 | 3,502 | ||||||
W.R. Grace & Co. | 1,238 | 1,228 | ||||||
2.750%, 2/3/21 | 3,440 | 3,414 | ||||||
|
| |||||||
| 56,012 | ||||||||
|
| |||||||
| Telecommunication Services—4.0% | ||||||||
Crown Castle Operating Co. | 2,630 | 2,625 | ||||||
Global Tel*Link Corp. First Lien, | 1,822 | 1,790 | ||||||
| PAR VALUE | VALUE | |||||||
| Telecommunication Services—continued | ||||||||
Level 3 Financing, Inc. Tranche B-III, | $ | 3,875 | $ | 3,880 | ||||
Tranche B, 2020 | 3,388 | 3,383 | ||||||
Tranche B-II, | 3,343 | 3,322 | ||||||
SBA Senior Finance II LLC | 3,739 | 3,698 | ||||||
Securus Technologies Holdings, Inc. First Lien, | 2,352 | 2,284 | ||||||
Tranche B-2, | 765 | 749 | ||||||
West Corp. Tranche B-10, | 2,203 | 2,178 | ||||||
XO Communications LLC | 3,564 | 3,543 | ||||||
|
| |||||||
| 27,452 | ||||||||
|
| |||||||
| Utilities—3.2% | ||||||||
Atlantic Power LP | 1,023 | 1,018 | ||||||
Calpine Construction Finance Co. LP Tranche B-1, | 4,697 | 4,591 | ||||||
Tranche B-2, | 3,818 | 3,735 | ||||||
3.500%, 5/27/22 | 941 | 927 | ||||||
Granite Acquisition, Inc. | ||||||||
Tranche B, First Lien, | 2,827 | 2,776 | ||||||
Tranche C, First Lien, | 125 | 123 | ||||||
NRG Energy, Inc. | 5,293 | 5,192 | ||||||
Texas Competitive Electric Holdings Co. LLC 2017 Extended, | 9,165 | 3,532 | ||||||
|
| |||||||
| 21,894 | ||||||||
| TOTAL LOAN AGREEMENTS (Identified Cost $694,116) | 671,283 | |||||||
| SHARES | ||||||||
| AFFILIATED MUTUAL FUND—1.1% | ||||||||
Virtus Credit Opportunities Fund(9) | 767,836 | 7,502 | ||||||
| TOTAL AFFILIATED MUTUAL FUND (Identified Cost $7,677) | 7,502 | |||||||
| TOTAL LONG TERM INVESTMENTS—103.2% | ||||||||
| (Identified Cost $740,029) | 714,104 | (6) | ||||||
| TOTAL INVESTMENTS—103.2% (Identified Cost $740,029) | 714,104 | (1) | ||||||
Other assets and liabilities,net—(3.2)% |
| (22,295 | ) | |||||
|
| |||||||
| NET ASSETS—100.0% | $ | 691,809 | ||||||
|
| |||||||
Abbreviations:
| PIK | Payment-in-Kind Security |
Footnote Legend:
| (1) | Federal Income Tax Information: For tax information at September 30, 2015, see Note 10 Federal Income Tax Information in the Notes to Financial Statements. |
| (2) | Variable or step coupon security; interest rate shown reflects the rate in effect at September 30, 2015. |
| (3) | Security exempt from registration under Rule 144A of the Securities Act of 1933. These securities may be resold in transactions exempt from registration, normally to qualified institutional buyers. At September 30, 2015, these securities amounted to a value of $17,212 or 2.5% of net assets. |
| (4) | 100% of the interest income received was in cash. |
| (5) | Security in default, interest payments are being received during the bankruptcy proceedings. |
| (6) | All or a portion of the Fund’s assets have been segregated as collateral for delayed delivery settlements and leverage. |
| (7) | This loan will settle after September 30, 2015, at which time the interest rate, based on the London Interbank Offered Rate (“LIBOR”) and the agreed upon spread on trade date, will be reflected. |
| (8) | Security in default. |
| (9) | This fund is a public fund and the prospectus and annual report are publicly available. |
| (10) | Illiquid security |
Foreign Currencies:
| BRL | Brazilian Real |
| Country Weightings (Unaudited)† | ||||
United States | 93 | % | ||
Luxembourg | 3 | |||
Australia | 1 | |||
Canada | 1 | |||
Netherlands | 1 | |||
Other | 1 | |||
Total | 100 | % | ||
† % of total investments as of September 30, 2015 |
| |||
Security abbreviation definitions are located under the Key Investment Terms starting on page 4.
See Notes to Financial Statements
55
Table of Contents
VIRTUS SENIOR FLOATING RATE FUND
SCHEDULE OF INVESTMENTS (Continued)
SEPTEMBER 30, 2015
($ reported in thousands)
The following table provides a summary of inputs used to value the Fund’s investments as of September 30, 2015 (See Security Valuation Note 2A in the Notes to Financial Statements):
| Total Value at September 30, 2015 | Level 1 Quoted Prices | Level 2 Significant Observable Inputs | Level 3 Significant Unobservable Inputs | |||||||||||||
Debt Securities: | ||||||||||||||||
Asset-Backed Securities | $ | 1,160 | $ | — | $ | 1,160 | $ | — | ||||||||
Corporate Bonds And Notes | 34,159 | — | 34,159 | — | ||||||||||||
Loan Agreements | 671,283 | — | 670,837 | 446 | ||||||||||||
Equity Securities: | ||||||||||||||||
Affiliated Mutual Fund | 7,502 | 7,502 | — | — | ||||||||||||
|
|
|
|
|
|
|
| |||||||||
Total Investments | $ | 714,104 | $ | 7,502 | $ | 706,156 | $ | 446 | ||||||||
|
|
|
|
|
|
|
| |||||||||
There were no transfers between Level 1 and Level 2 related to securities held at September 30, 2015.
The following is a reconciliation of assets of the Fund for Level 3 investments for which significant unobservable inputs were used to determine fair value.
| Loan Agreements | ||||
Investments in Securities | ||||
Balance as of September 30, 2014: | $ | — | ||
Accrued discount/(premium) | — | |||
Realized gain (loss) | — | |||
Change in unrealized appreciation (depreciation) | — | |||
Purchases | — | |||
Sales(b) | — | |||
Transfers into Level 3(a) | 446 | (c) | ||
Transfers from Level 3(a) | — | |||
|
| |||
Balance as of September 30, 2015 | $ | 446 | ||
|
| |||
| (a) | “Transfers into and/or from” represent the ending value as of September 30, 2015, for any investment security where a change in the pricing level occurred from the beginning to the end of the period. |
| (b) | Includes paydowns on securities. |
| (c) | The transfer is due to increase and/or decrease in trading activities at period end. |
None of the securities in this table are internally fair valued.
See Notes to Financial Statements
56
Table of Contents
SCHEDULE OF INVESTMENTS
SEPTEMBER 30, 2015
($ reported in thousands)
| SHARES | VALUE | |||||||
| COMMON STOCKS—99.4% | ||||||||
| Consumer Discretionary—35.4% | ||||||||
Amazon.com, Inc.(2) | 1,309 | $ | 670 | |||||
AMC Networks, Inc. Class A(2) | 9,404 | 688 | ||||||
American Eagle Outfitters, Inc. | 43,344 | 677 | ||||||
Apollo Group, Inc. Class A | 59,554 | 659 | ||||||
AutoNation, Inc.(2) | 11,787 | 686 | ||||||
Buckle, Inc. (The) | 18,483 | 683 | ||||||
Cabela’s, Inc.(2) | 14,628 | 667 | ||||||
Carnival Corp. | 14,156 | 704 | ||||||
CBS Corp. Class B | 16,553 | 660 | ||||||
Choice Hotels International, Inc. | 14,375 | 685 | ||||||
Columbia Sportswear Co. | 11,242 | 661 | ||||||
Comcast Corp. Class A | 12,220 | 695 | ||||||
Dick’s Sporting Goods, Inc. | 14,306 | 710 | ||||||
Dillard’s, Inc. Class A | 7,832 | 684 | ||||||
Discovery Communications, Inc. Class C(2) | 27,142 | 659 | ||||||
DISH Network Corp. Class A(2) | 11,388 | 664 | ||||||
DreamWorks Animation SKG, Inc. Class A(2)(3) | 39,550 | 690 | ||||||
DSW, Inc. Class A | 24,822 | 628 | ||||||
Expedia, Inc. | 5,642 | 664 | ||||||
Federal-Mogul Corp.(2) | 94,431 | 645 | ||||||
Fossil Group, Inc.(2) | 12,034 | 672 | ||||||
Gap, Inc. (The) | 22,238 | 634 | ||||||
Garmin Ltd. | 19,647 | 705 | ||||||
Horton (D.R.), Inc. | 23,564 | 692 | ||||||
Hyatt Hotels Corp. Class A(2) | 14,458 | 681 | ||||||
International Speedway Corp. Class A | 22,065 | 700 | ||||||
Jarden Corp.(2) | 13,569 | 663 | ||||||
L Brands, Inc. | 7,690 | 693 | ||||||
Lands’ End, Inc.(2)(3) | 26,220 | 708 | ||||||
Las Vegas Sands Corp. | 16,238 | 617 | ||||||
Lennar Corp. Class A | 14,259 | 686 | ||||||
Liberty Broadband Corp.(2) | 12,842 | 657 | ||||||
Liberty Global plc Class C(2) | 15,661 | 642 | ||||||
Liberty Global plc(2) | 20,435 | 700 | ||||||
Liberty Interactive Corp. Class A(2) | 25,854 | 678 | ||||||
Liberty Media Corp.(2) | 19,761 | 681 | ||||||
Liberty Tripadvisor Holdings, Class A(2) | 29,175 | 647 | ||||||
Liberty Ventures Class A(2) | 16,976 | 685 | ||||||
Lions Gate Entertainment Corp. | 18,278 | 673 | ||||||
Madison Square Garden Co. (The) | 9,605 | 693 | ||||||
Marriott International, Inc. Class A | 10,373 | 707 | ||||||
Marriott Vacations Worldwide Corp. | 10,242 | 698 | ||||||
Mohawk Industries, Inc.(2) | 3,558 | 647 | ||||||
Morningstar, Inc. | 8,636 | 693 | ||||||
News Corp. Class A | 55,115 | 696 | ||||||
NIKE, Inc. Class B | 6,084 | 748 | ||||||
Nordstrom, Inc. | 9,571 | 686 | ||||||
Papa John’s International, Inc. | 10,149 | 695 | ||||||
Penn National Gaming, Inc.(2) | 40,710 | 683 | ||||||
Penske Automotive Group, Inc. | 13,926 | 675 | ||||||
Ralph Lauren Corp. | 6,389 | 755 | ||||||
Restaurant Brands International, Inc. | 18,729 | 673 | ||||||
Sears Holdings Corp.(2) | 27,570 | 623 | ||||||
Sears Hometown and Outlet Stores, Inc.(2) | 87,734 | 703 | ||||||
Starbucks Corp. | 12,347 | 702 | ||||||
| SHARES | VALUE | |||||||
| Consumer Discretionary—continued | ||||||||
Starz – Liberty Capital Class A(2) | 17,704 | $ | 661 | |||||
Tesla Motors, Inc.(2) | 2,704 | 672 | ||||||
Twenty-First Century Fox, Inc. Class A | 26,772 | 722 | ||||||
Under Armour, Inc. Class A(2) | 6,921 | 670 | ||||||
Urban Outfitters, Inc.(2) | 24,120 | 709 | ||||||
Viacom, Inc. Class B | 16,003 | 691 | ||||||
Wendy’s Co. (The) | 77,893 | 674 | ||||||
Wynn Resorts Ltd. | 11,032 | 586 | ||||||
|
| |||||||
| 42,755 | ||||||||
|
| |||||||
| Consumer Staples—5.2% | ||||||||
Boston Beer Co., Inc. (The) Class A(2) | 3,122 | 657 | ||||||
Brown-Forman Corp. Class B | 7,121 | 690 | ||||||
Estee Lauder Cos., Inc. (The) Class A | 9,120 | 736 | ||||||
HRG Group, Inc.(2) | 57,471 | 674 | ||||||
Kraft Heinz Co.(The) | 9,496 | 670 | ||||||
Lancaster Colony Corp. | 7,085 | 691 | ||||||
Monster Beverage Corp.(2) | 5,243 | 709 | ||||||
PriceSmart, Inc. | 8,864 | 686 | ||||||
Tootsie Roll Industries, Inc. | 22,515 | 704 | ||||||
|
| |||||||
| 6,217 | ||||||||
|
| |||||||
| Energy—6.5% | ||||||||
Cheniere Energy, Inc.(2) | 13,978 | 675 | ||||||
Chesapeake Energy Corp.(3) | 88,092 | 646 | ||||||
Clayton Williams Energy, Inc.(2) | 14,323 | 556 | ||||||
Continental Resources, Inc.(2) | 24,271 | 703 | ||||||
CVR Energy, Inc. | 17,170 | 705 | ||||||
Exterran Holdings, Inc. | 34,473 | 620 | ||||||
Hess Corp. | 13,780 | 690 | ||||||
Par Petroleum Corp.(2) | 35,383 | 737 | ||||||
RPC, Inc.(3) | 68,211 | 603 | ||||||
Transocean Ltd.(3) | 48,587 | 628 | ||||||
W&T Offshore, Inc.(3) | 199,236 | 598 | ||||||
Western Refining, Inc. | 16,594 | 732 | ||||||
|
| |||||||
| 7,893 | ||||||||
|
| |||||||
| Financials—20.2% | ||||||||
Altisource Portfolio Solutions SA(2) | 27,680 | 660 | ||||||
American Financial Group, Inc. | 10,239 | 706 | ||||||
American Homes 4 Rent Class A | 42,912 | 690 | ||||||
AmTrust Financial Services, Inc. | 11,639 | 733 | ||||||
Berkley (W.R.) Corp. | 13,048 | 709 | ||||||
Berkshire Hathaway, Inc. | 5,454 | 711 | ||||||
BOK Financial Corp. | 11,336 | 734 | ||||||
Boston Properties, Inc. | 6,050 | 716 | ||||||
Brown & Brown, Inc. | 22,460 | 696 | ||||||
Charles Schwab Corp. (The) | 24,919 | 712 | ||||||
Cohen & Steers, Inc. | 24,778 | 680 | ||||||
Credit Acceptance Corp.(2) | 3,510 | 691 | ||||||
Equity Lifestyle Properties, Inc. | 12,236 | 717 | ||||||
Equity Residential | 9,733 | 731 | ||||||
Erie Indemnity Co. Class A | 8,731 | 724 | ||||||
First Citizens BancShares, Inc. Class A | 3,159 | 714 | ||||||
Franklin Resources, Inc. | 18,555 | 691 | ||||||
| SHARES | VALUE | |||||||
| Financials—continued | ||||||||
Gaming and Leisure Properties, Inc. | 23,289 | $ | 692 | |||||
Greenlight Capital Re Ltd. | 30,303 | 675 | ||||||
Hilltop Holdings, Inc.(2) | 35,402 | 701 | ||||||
Host Hotels & Resorts, Inc. | 43,918 | 694 | ||||||
Howard Hughes Corp. (The)(2) | 5,825 | 668 | ||||||
Leucadia National Corp. | 34,838 | 706 | ||||||
Loews Corp. | 19,675 | 711 | ||||||
Mercury General Corp. | 13,696 | 692 | ||||||
Ocwen Financial Corp.(2)(3) | 101,026 | 678 | ||||||
Raymond James Financial, Inc. | 14,167 | 703 | ||||||
Seritage Growth Properties(2) | 17,157 | 639 | ||||||
Simon Property Group, Inc. | 3,850 | 707 | ||||||
Taubman Centers, Inc. | 10,158 | 702 | ||||||
Third Point Reinsurance Ltd(2) | 51,194 | 689 | ||||||
Urban Edge Properties | 33,034 | 713 | ||||||
Vornado Realty Trust | 7,755 | 701 | ||||||
WisdomTree Investments, Inc. | 40,169 | 648 | ||||||
WP GLIMCHER, Inc. | 58,945 | 687 | ||||||
|
| |||||||
| 24,421 | ||||||||
|
| |||||||
| Health Care—3.6% | ||||||||
Akorn, Inc.(2) | 18,866 | 538 | ||||||
Bruker Corp.(2) | 39,774 | 653 | ||||||
Cerner Corp.(2) | 11,210 | 672 | ||||||
Halozyme Therapeutics, Inc.(2) | 40,441 | 543 | ||||||
Hologic, Inc.(2) | 17,042 | 667 | ||||||
MannKind Corp.(2)(3) | 217,452 | 698 | ||||||
OPKO Health, Inc.(2)(3) | 72,268 | 608 | ||||||
|
| |||||||
| 4,379 | ||||||||
|
| |||||||
| Industrials—11.0% | ||||||||
Air Lease Corp. | 21,448 | 663 | ||||||
American Railcar Industries, Inc.(3) | 18,268 | 661 | ||||||
Cintas Corp. | 8,206 | 704 | ||||||
Colfax Corp.(2) | 21,749 | 650 | ||||||
Covanta Holding Corp. | 37,681 | 658 | ||||||
Danaher Corp. | 8,245 | 703 | ||||||
FedEx Corp. | 4,904 | 706 | ||||||
Grainger (W.W.), Inc. | 3,324 | 715 | ||||||
Heartland Express, Inc. | 34,538 | 689 | ||||||
Hertz Global Holdings, Inc.(2) | 40,421 | 676 | ||||||
Illinois Tool Works, Inc. | 8,464 | 697 | ||||||
Manitowoc Co., Inc. (The)(3) | 45,232 | 678 | ||||||
MasTec, Inc.(2) | 40,553 | 642 | ||||||
MSC Industrial Direct Co., Inc. Class A | 11,062 | 675 | ||||||
Navistar International Corp.(3) | 47,188 | 600 | ||||||
Rollins, Inc. | 25,187 | 677 | ||||||
Solarcity Corp.(2)(3) | 14,851 | 634 | ||||||
Timken Co. (The) | 24,780 | 681 | ||||||
Werner Enterprises, Inc. | 25,913 | 650 | ||||||
XPO Logistics, Inc.(2)(3) | 23,991 | 572 | ||||||
|
| |||||||
| 13,331 | ||||||||
|
| |||||||
| Information Technology—12.6% | ||||||||
Amkor Technology, Inc. | 154,952 | 696 | ||||||
Anixter International, Inc. | 11,775 | 680 | ||||||
eBay, Inc.(2) | 27,530 | 673 | ||||||
EchoStar Corp. Class A(2) | 16,180 | 696 | ||||||
Facebook, Inc. Class A(2) | 7,584 | 682 | ||||||
See Notes to Financial Statements
57
Table of Contents
VIRTUS WEALTH MASTERS FUND
SCHEDULE OF INVESTMENTS (Continued)
SEPTEMBER 30, 2015
($ reported in thousands)
| SHARES | VALUE | |||||||
| Information Technology—continued | ||||||||
Google, Inc. Class C(2) | 1,131 | $ | 688 | |||||
IAC/InterActiveCorp. | 10,378 | 677 | ||||||
Intuit, Inc. | 8,123 | 721 | ||||||
Marvell Technology Group Ltd. | 79,606 | 721 | ||||||
National Instruments Corp. | 25,527 | 709 | ||||||
Nuance Communications, Inc.(2) | 41,340 | 677 | ||||||
Oracle Corp. | 19,503 | 705 | ||||||
Paychex, Inc. | 15,323 | 730 | ||||||
PayPal Holdings, Inc.(2) | 21,181 | 658 | ||||||
Pegasystems, Inc. | 28,495 | 701 | ||||||
Rackspace Hosting, Inc.(2) | 24,159 | 596 | ||||||
RealPage, Inc.(2) | 40,375 | 671 | ||||||
salesforce.com, Inc.(2) | 9,839 | 683 | ||||||
SS&C Technologies Holdings, Inc. | 9,715 | 681 | ||||||
Syntel, Inc.(2) | 16,009 | 725 | ||||||
TeleTech Holdings, Inc. | 26,481 | 709 | ||||||
Yahoo!, Inc.(2) | 23,185 | 670 | ||||||
|
| |||||||
| 15,149 | ||||||||
|
| |||||||
| Materials—4.9% | ||||||||
Airgas, Inc. | 7,637 | 682 | ||||||
Huntsman Corp. | 47,916 | 464 | ||||||
LyondellBasell Industries N.V. Class A | 8,302 | 692 | ||||||
NewMarket Corp. | 1,835 | 655 | ||||||
Novagold Resources, Inc.(3) | 200,359 | 723 | ||||||
Scotts Miracle-Gro Co. (The) Class A | 11,596 | 705 | ||||||
Silgan Holdings, Inc. | 13,617 | 709 | ||||||
Timkensteel Corp. | 61,319 | 621 | ||||||
| SHARES | VALUE | |||||||
| Materials—continued | ||||||||
Westlake Chemical Corp. | 12,887 | $ | 669 | |||||
|
| |||||||
| 5,920 | ||||||||
| TOTAL COMMON STOCKS (Identified Cost $122,120) | 120,065 | |||||||
| TOTAL LONG TERM INVESTMENTS—99.4% | ||||||||
| (Identified Cost $122,120) | 120,065 | |||||||
| SECURITIES LENDING COLLATERAL—5.7% | ||||||||
INVESCO Trust Short-Term Investments Liquid Assets Portfolio (The) Institutional Shares (seven-day effective yield 0.160%)(4) | 6,922,260 | 6,922 | ||||||
| TOTAL SECURITIES LENDING COLLATERAL | ||||||||
| (Identified Cost $6,922) | 6,922 | |||||||
| TOTAL INVESTMENTS—105.1% (Identified Cost $129,042) | 126,987 | (1) | ||||||
Other assets and liabilities, net—(5.1)% |
| (6,212 | ) | |||||
|
| |||||||
| NET ASSETS—100.0% | $ | 120,775 | ||||||
|
| |||||||
Footnote Legend:
| (1) | Federal Income Tax Information: For tax information at September 30, 2015, see Note 10 Federal Income Tax Information in the Notes to Financial Statements. |
| (2) | Non-income producing. |
| (3) | All or a portion of security is on loan. |
| (4) | Represents security purchased with cash collateral received for securities on loan. |
The following table provides a summary of inputs used to value the Fund’s investments as of September 30, 2015 (See Security Valuation Note 2A in the Notes to Financial Statements):
| Total Value at September 30, 2015 | Level 1 Quoted Prices | |||||||
Equity Securities: | ||||||||
Common Stocks | $ | 120,065 | $ | 120,065 | ||||
Securities Lending Collateral | 6,922 | 6,922 | ||||||
|
|
|
| |||||
Total Investments | $ | 126,987 | $ | 126,987 | ||||
|
|
|
| |||||
There are no Level 2 (significant observable inputs) or Level 3 (significant unobservable inputs) priced securities.
There were no transfers between Level 1 and Level 2 related to securities held at September 30, 2015.
See Notes to Financial Statements
58
Table of Contents
THIS PAGE INTENTIONALLY BLANK.
Table of Contents
VIRTUS OPPORTUNITIES TRUST
STATEMENTS OF ASSETS AND LIABILITIES
SEPTEMBER 30, 2015
(Reported in thousands except shares and per share amounts)
|
|
|
|
|
| |||||||
| Bond Fund | CA Tax-Exempt Bond | Essential Resources Fund | ||||||||||
| Assets | ||||||||||||
Investment in unaffiliated securities at value(1) | $ | 73,066 | $ | 30,541 | $ | 4,050 | ||||||
Investments in affiliated securities at value(2) | 1,143 | — | — | |||||||||
Foreign currency at value(3) | — | — | 13 | |||||||||
Cash | 32 | 358 | — | |||||||||
Receivables | ||||||||||||
Investment securities sold | 588 | — | 54 | |||||||||
Fund shares sold | 8 | 1 | — | (5) | ||||||||
Receivable from adviser | — | — | 28 | |||||||||
Dividends and interest receivable | 693 | 383 | 6 | |||||||||
Tax reclaims | — | — | 2 | |||||||||
Prepaid expenses | 36 | 19 | 13 | |||||||||
Prepaid trustee retainer | — | (5) | — | (5) | — | (5) | ||||||
|
|
|
|
|
| |||||||
Total assets | 75,566 | 31,302 | 4,166 | |||||||||
|
|
|
|
|
| |||||||
| Liabilities | ||||||||||||
Payables | ||||||||||||
Fund shares repurchased | 139 | 26 | — | |||||||||
Investment securities purchased | 819 | 166 | 61 | |||||||||
Dividend distributions | 23 | 15 | — | |||||||||
Investment advisory fees | 6 | 1 | — | |||||||||
Distribution and service fees | 17 | 4 | — | (5) | ||||||||
Administration fees | 8 | 3 | — | (5) | ||||||||
Transfer agent fees and expenses | 19 | 4 | — | (5) | ||||||||
Trustees’ fees and expenses | — | (5) | — | (5) | — | (5) | ||||||
Professional fees | 30 | 44 | 26 | |||||||||
Other accrued expenses | 6 | 2 | 2 | |||||||||
|
|
|
|
|
| |||||||
Total liabilities | 1,067 | 265 | 89 | |||||||||
|
|
|
|
|
| |||||||
| Net Assets | $ | 74,499 | $ | 31,037 | $ | 4,077 | ||||||
|
|
|
|
|
| |||||||
| Net Assets Consist of: | ||||||||||||
Capital paid in on shares of beneficial interest | $ | 79,591 | $ | 28,734 | $ | 5,058 | ||||||
Accumulated undistributed net investment income (loss) | (8 | ) | 9 | 23 | ||||||||
Accumulated undistributed net realized gain (loss) | (4,462 | ) | 666 | (26 | ) | |||||||
Net unrealized appreciation (depreciation) on investments | (622 | ) | 1,628 | (978 | ) | |||||||
|
|
|
|
|
| |||||||
| Net Assets | $ | 74,499 | $ | 31,037 | $ | 4,077 | ||||||
|
|
|
|
|
| |||||||
| Class A | ||||||||||||
Net asset value (net assets/shares outstanding) per share | $ | 11.02 | $ | 12.14 | $ | 8.04 | ||||||
Maximum offering price per share NAV/(1–2.75%) | $ | — | $ | 12.48 | $ | — | ||||||
Maximum offering price per share NAV/(1–3.75%) | $ | 11.45 | $ | — | $ | — | ||||||
Maximum offering price per share NAV/(1–5.75%) | $ | — | $ | — | $ | 8.53 | ||||||
Shares of beneficial interest outstanding, par value(4), unlimited authorization | 4,360,230 | 1,644,997 | 10,385 | |||||||||
Net Assets | $ | 48,064 | $ | 19,978 | $ | 84 | ||||||
| Class B | ||||||||||||
Net asset value (net assets/shares outstanding) and offering price per share | $ | 10.74 | $ | — | $ | — | ||||||
Shares of beneficial interest outstanding, par value(4), unlimited authorization | 11,698 | — | — | |||||||||
Net Assets | $ | 126 | $ | — | $ | — | ||||||
| Class C | ||||||||||||
Net asset value (net assets/shares outstanding) and offering price per share | $ | 10.78 | $ | — | $ | 8.01 | ||||||
Shares of beneficial interest outstanding, par value(4), unlimited authorization | 821,045 | — | 12,936 | |||||||||
Net Assets | $ | 8,853 | $ | — | $ | 104 | ||||||
| Class I | ||||||||||||
Net asset value (net assets/shares outstanding) and offering price per share | $ | 11.19 | $ | 12.12 | $ | 8.05 | ||||||
Shares of beneficial interest outstanding, par value(4), unlimited authorization | 1,559,765 | 912,562 | 482,964 | |||||||||
Net Assets | $ | 17,456 | $ | 11,059 | $ | 3,889 | ||||||
(1) Investment in unaffiliated securities at cost | $ | 73,661 | $ | 28,913 | $ | 5,029 | ||||||
(2) Investment in affiliated securities at cost | $ | 1,170 | $ | — | $ | — | ||||||
(3) Foreign currency at cost | $ | — | $ | — | $ | 13 | ||||||
(4) All Funds with the exception of the Bond Fund have no par value. Bond Fund has a par value of $1.00. | ||||||||||||
(5) Amount is less than $500. | ||||||||||||
See Notes to Financial Statements
60
Table of Contents
VIRTUS OPPORTUNITIES TRUST
STATEMENTS OF ASSETS AND LIABILITIES (Continued)
SEPTEMBER 30, 2015
(Reported in thousands except shares and per share amounts)
|
|
|
|
|
| |||||||
| High Yield Fund | Low Volatility Equity Fund | Multi-Sector Intermediate Bond Fund | ||||||||||
| Assets | ||||||||||||
Investment in unaffiliated securities at value(1) | $ | 67,701 | $ | 5,054 | $ | 325,163 | ||||||
Investments in affiliated securities at value(2) | 342 | — | 9,058 | |||||||||
Foreign currency at value(3) | — | — | — | (5) | ||||||||
Cash | 68 | — | (5) | 288 | ||||||||
Deposits with prime broker | — | 14 | — | |||||||||
Receivables | ||||||||||||
Investment securities sold | 1,052 | — | 1,197 | |||||||||
Fund shares sold | 5 | — | (5) | 342 | ||||||||
Receivable from adviser | — | 1 | — | |||||||||
Dividends and interest receivable | 1,146 | 28 | 4,182 | |||||||||
Tax reclaims | — | (5) | — | 1 | ||||||||
Prepaid expenses | 31 | 25 | 55 | |||||||||
Prepaid trustee retainer | 1 | — | (5) | 3 | ||||||||
|
|
|
|
|
| |||||||
Total assets | 70,346 | 5,122 | 340,289 | |||||||||
|
|
|
|
|
| |||||||
| Liabilities | ||||||||||||
Written options(4) | — | 39 | — | |||||||||
Payables | ||||||||||||
Fund shares repurchased | 122 | — | 537 | |||||||||
Investment securities purchased | 742 | — | 6,572 | |||||||||
Dividend distributions | 49 | — | 231 | |||||||||
Investment advisory fees | 23 | — | 147 | |||||||||
Distribution and service fees | 16 | 2 | 95 | |||||||||
Administration fees | 7 | 1 | 33 | |||||||||
Transfer agent fees and expenses | 23 | 1 | 81 | |||||||||
Trustees’ fees and expenses | — | (5) | — | 1 | ||||||||
Professional fees | 37 | 19 | 38 | |||||||||
Other accrued expenses | 5 | 1 | 20 | |||||||||
|
|
|
|
|
| |||||||
Total liabilities | 1,024 | 63 | 7,755 | |||||||||
|
|
|
|
|
| |||||||
| Net Assets | $ | 69,322 | $ | 5,059 | $ | 332,534 | ||||||
|
|
|
|
|
| |||||||
| Net Assets Consist of: | ||||||||||||
Capital paid in on shares of beneficial interest | $ | 98,817 | $ | 4,961 | $ | 361,122 | ||||||
Accumulated undistributed net investment income (loss) | (30 | ) | 16 | (249 | ) | |||||||
Accumulated undistributed net realized gain (loss) | (24,962 | ) | 22 | (6,625 | ) | |||||||
Net unrealized appreciation (depreciation) on investments | (4,503 | ) | 60 | (21,714 | ) | |||||||
|
|
|
|
|
| |||||||
| Net Assets | $ | 69,322 | $ | 5,059 | $ | 332,534 | ||||||
|
|
|
|
|
| |||||||
| Class A | ||||||||||||
Net asset value (net assets/shares outstanding) per share | $ | 3.98 | $ | 11.45 | $ | 9.76 | ||||||
Maximum offering price per share NAV/(1–3.75%) | $ | 4.14 | $ | — | $ | 10.14 | ||||||
Maximum offering price per share NAV/(1–5.75%) | $ | — | $ | 12.15 | $ | — | ||||||
Shares of beneficial interest outstanding, no par value, unlimited authorization | 15,304,383 | 179,400 | 10,738,969 | |||||||||
Net Assets | $ | 60,951 | $ | 2,055 | $ | 104,833 | ||||||
| Class B | ||||||||||||
Net asset value (net assets/shares outstanding) and offering price per share | $ | 3.88 | $ | — | $ | 9.73 | ||||||
Shares of beneficial interest outstanding, no par value, unlimited authorization | 10,462 | — | 294,724 | |||||||||
Net Assets | $ | 41 | $ | — | $ | 2,868 | ||||||
| Class C | ||||||||||||
Net asset value (net assets/shares outstanding) and offering price per share | $ | 3.92 | $ | 11.32 | $ | 9.85 | ||||||
Shares of beneficial interest outstanding, no par value, unlimited authorization | 945,098 | 125,704 | 8,538,762 | |||||||||
Net Assets | $ | 3,705 | $ | 1,423 | $ | 84,099 | ||||||
| Class I | ||||||||||||
Net asset value (net assets/shares outstanding) and offering price per share | $ | 3.98 | $ | 11.50 | $ | 9.77 | ||||||
Shares of beneficial interest outstanding, no par value, unlimited authorization | 1,161,409 | 137,527 | 14,225,456 | |||||||||
Net Assets | $ | 4,625 | $ | 1,581 | $ | 138,956 | ||||||
| Class R6 | ||||||||||||
Net asset value (net assets/shares outstanding) and offering price per share | $ | — | $ | — | $ | 9.77 | ||||||
Shares of beneficial interest outstanding, no par value, unlimited authorization | — | — | 182,048 | |||||||||
Net Assets | $ | — | $ | — | $ | 1,778 | ||||||
(1) Investment in unaffiliated securities at cost | $ | 72,196 | $ | 5,047 | $ | 346,657 | ||||||
(2) Investments in affiliated securities at cost | $ | 350 | $ | — | $ | 9,270 | ||||||
(3) Foreign currency at cost | $ | — | $ | — | $ | — | (5) | |||||
(4) Written options premiums received | $ | — | $ | 92 | $ | — | ||||||
(5) Amount is less than $500. | $ | — | $ | — | $ | — | ||||||
See Notes to Financial Statements
61
Table of Contents
VIRTUS OPPORTUNITIES TRUST
STATEMENTS OF ASSETS AND LIABILITIES (Continued)
SEPTEMBER 30, 2015
(Reported in thousands except shares and per share amounts)
|
|
|
| |||||
| Senior Floating Rate Fund | Wealth Masters Fund | |||||||
| Assets | ||||||||
Investment in unaffiliated securities at value(1)(2) | $ | 706,602 | $ | 126,987 | ||||
Investment in affiliated securities at value(3) | 7,502 | — | ||||||
Cash | 7,733 | — | ||||||
Receivables | ||||||||
Investment securities sold | 11,974 | 15,244 | ||||||
Fund shares sold | 1,003 | 443 | ||||||
Dividends and interest receivable | 3,369 | 99 | ||||||
Securities Lending Receivable | — | 45 | ||||||
Prepaid expenses | 30 | 40 | ||||||
Prepaid trustee retainer | 6 | 1 | ||||||
|
|
|
| |||||
Total assets | 738,219 | 142,859 | ||||||
|
|
|
| |||||
| Liabilities | ||||||||
Cash overdraft | — | 4,483 | ||||||
Payables | ||||||||
Fund shares repurchased | 2,972 | 150 | ||||||
Investment securities purchased | 16,696 | 10,329 | ||||||
Borrowings (Note 13) | 25,500 | — | ||||||
Collateral on securities loaned | — | 6,922 | ||||||
Dividend distributions | 374 | — | ||||||
Investment advisory fees | 345 | 77 | ||||||
Distribution and service fees | 172 | 41 | ||||||
Administration fees | 71 | 13 | ||||||
Transfer agent fees and expenses | 139 | 35 | ||||||
Trustees’ fees and expenses | 9 | 1 | ||||||
Professional fees | 36 | 28 | ||||||
Interest payable on line of credit | — | (4) | — | |||||
Other accrued expenses | 96 | 5 | ||||||
|
|
|
| |||||
Total liabilities | 46,410 | 22,084 | ||||||
|
|
|
| |||||
| Net Assets | $ | 691,809 | $ | 120,775 | ||||
|
|
|
| |||||
| Net Assets Consist of: | ||||||||
Capital paid in on shares of beneficial interest | $ | 728,026 | $ | 125,955 | ||||
Accumulated undistributed net investment income (loss) | (347 | ) | 229 | |||||
Accumulated undistributed net realized gain (loss) | (9,947 | ) | (3,354 | ) | ||||
Net unrealized appreciation (depreciation) on investments | (25,923 | ) | (2,055 | ) | ||||
|
|
|
| |||||
| Net Assets | $ | 691,809 | $ | 120,775 | ||||
|
|
|
| |||||
| Class A | ||||||||
Net asset value (net assets/shares outstanding) per share | $ | 9.36 | $ | 13.25 | ||||
Maximum offering price per share NAV/(1–2.75%) | $ | 9.62 | $ | — | ||||
Maximum offering price per share NAV/(1–5.75%) | $ | — | $ | 14.06 | ||||
Shares of beneficial interest outstanding, no par value, unlimited authorization | 28,696,639 | 4,084,080 | ||||||
Net Assets | $ | 268,596 | $ | 54,109 | ||||
| Class C | ||||||||
Net asset value (net assets/shares outstanding) and offering price per share | $ | 9.37 | $ | 13.02 | ||||
Shares of beneficial interest outstanding, no par value, unlimited authorization | 14,777,304 | 2,624,952 | ||||||
Net Assets | $ | 138,478 | $ | 34,171 | ||||
| Class I | ||||||||
Net asset value (net assets/shares outstanding) and offering price per share | $ | 9.35 | $ | 13.30 | ||||
Shares of beneficial interest outstanding, no par value, unlimited authorization | 30,451,148 | 2,442,915 | ||||||
Net Assets | $ | 284,735 | $ | 32,495 | ||||
(1) Investment in unaffiliated securities at cost | $ | 732,352 | $ | 129,042 | ||||
(2) Market value of securities on loan | $ | — | $ | 6,889 | ||||
(3) Investment in affiliated securities at cost | $ | 7,677 | $ | — | ||||
(4) Amount is less than $500. | ||||||||
See Notes to Financial Statements
62
Table of Contents
VIRTUS OPPORTUNITIES TRUST
YEAR ENDED SEPTEMBER 30, 2015
($ reported in thousands)
|
|
|
|
|
| |||||||
| Bond Fund | CA Tax-Exempt Bond | Essential Resources Fund(2) | ||||||||||
| Investment Income | ||||||||||||
Dividends | $ | 29 | $ | — | $ | 63 | ||||||
Dividends from affiliated funds | 6 | — | — | |||||||||
Interest | 3,330 | 1,355 | — | |||||||||
Foreign taxes withheld | (1 | ) | — | (5 | ) | |||||||
|
|
|
|
|
| |||||||
Total investment income | 3,364 | 1,355 | 58 | |||||||||
|
|
|
|
|
| |||||||
| Expenses | ||||||||||||
Investment advisory fees | 345 | 152 | 27 | |||||||||
Service fees, Class A | 127 | 56 | — | (1) | ||||||||
Distribution and service fees, Class B | 2 | — | — | |||||||||
Distribution and service fees, Class C | 85 | — | 1 | |||||||||
Administration fees | 92 | 40 | 3 | |||||||||
Transfer agent fees and expenses | 116 | 34 | 1 | |||||||||
Registration fees | 56 | 29 | 21 | |||||||||
Printing fees and expenses | 9 | 5 | 56 | |||||||||
Custodian fees | 5 | 1 | 2 | |||||||||
Professional fees | 31 | 49 | 35 | |||||||||
Trustees’ fees and expenses | 3 | 1 | — | (1) | ||||||||
Miscellaneous expenses | 8 | 3 | 2 | |||||||||
|
|
|
|
|
| |||||||
Total expenses | 879 | 370 | 148 | |||||||||
Less expenses reimbursed and/or waived by investment adviser | (206 | ) | (110 | ) | (113 | ) | ||||||
|
|
|
|
|
| |||||||
Net expenses | 673 | 260 | 35 | |||||||||
|
|
|
|
|
| |||||||
Net investment income (loss) | 2,691 | 1,095 | 23 | |||||||||
|
|
|
|
|
| |||||||
| Net Realized and Unrealized Gain (Loss) on Investments | ||||||||||||
Net realized gain (loss) on unaffiliated investments | (1,798 | ) | 672 | (24 | ) | |||||||
Net realized gain (loss) on foreign currency transactions | (3 | ) | — | (2 | ) | |||||||
Net change in unrealized appreciation (depreciation) on unaffiliated investments | (1,052 | ) | (606 | ) | (978 | ) | ||||||
Net change in unrealized appreciation (depreciation) on affiliated investments | (27 | ) | — | — | ||||||||
|
|
|
|
|
| |||||||
| Net gain (loss) on investments | (2,880 | ) | 66 | (1,004 | ) | |||||||
|
|
|
|
|
| |||||||
Net increase (decrease) in net assets resulting from operations | $ | (189 | ) | $ | 1,161 | $ | (981 | ) | ||||
|
|
|
|
|
| |||||||
(1) Amount is less than $500.
(2) From inception date March 24, 2015.
See Notes to Financial Statements
63
Table of Contents
VIRTUS OPPORTUNITIES TRUST
STATEMENTS OF OPERATIONS (Continued)
YEAR ENDED SEPTEMBER 30, 2015
($ reported in thousands)
|
|
|
|
|
| |||||||
| High Yield Fund | Low Volatility Equity Fund | Multi-Sector Intermediate Bond Fund | ||||||||||
| Investment Income | ||||||||||||
Dividends | $ | 74 | $ | 100 | $ | 272 | ||||||
Dividends from affiliated fund | 5 | — | 45 | |||||||||
Interest | 5,549 | — | 21,031 | |||||||||
Foreign taxes withheld | — | — | (14 | ) | ||||||||
|
|
|
|
|
| |||||||
Total investment income | 5,628 | 100 | 21,334 | |||||||||
|
|
|
|
|
| |||||||
| Expenses | ||||||||||||
Investment advisory fees | 571 | 44 | 1,986 | |||||||||
Service fees, Class A | 193 | 4 | 295 | |||||||||
Distribution and service fees, Class B | 1 | — | 40 | |||||||||
Distribution and service fees, Class C | 40 | 12 | 928 | |||||||||
Administration fees | 105 | 5 | 433 | |||||||||
Transfer agent fees and expenses | 137 | 5 | 446 | |||||||||
Registration fees | 57 | 37 | 85 | |||||||||
Printing fees and expenses | 10 | 1 | 31 | |||||||||
Custodian fees | 5 | 1 | 13 | |||||||||
Professional fees | 37 | 19 | 41 | |||||||||
Trustees’ fees and expenses | 4 | — | (1) | 15 | ||||||||
Miscellaneous expenses | 10 | 3 | 34 | |||||||||
|
|
|
|
|
| |||||||
Total expenses | 1,170 | 131 | 4,347 | |||||||||
Less expenses reimbursed and/or waived by investment adviser | (148 | ) | (55 | ) | (16 | ) | ||||||
|
|
|
|
|
| |||||||
Net expenses | 1,022 | 76 | 4,331 | |||||||||
|
|
|
|
|
| |||||||
Net investment income (loss) | 4,606 | 24 | 17,003 | |||||||||
|
|
|
|
|
| |||||||
| Net Realized and Unrealized Gain (Loss) on Investments | ||||||||||||
Net realized gain (loss) on unaffiliated investments | (2,033 | ) | 54 | (9,937 | ) | |||||||
Net realized gain (loss) on affiliated investments | (16 | ) | — | — | ||||||||
Net realized gain (loss) on foreign currency transactions | — | — | (89 | ) | ||||||||
Net realized gain (loss) on written options | — | 20 | — | |||||||||
Net increase from payments by affiliates(2) | — | — | (1) | | 1 | | ||||||
Net change in unrealized appreciation (depreciation) on unaffiliated investments | (4,606 | ) | (325 | ) | (19,458 | ) | ||||||
Net change in unrealized appreciation (depreciation) affiliated investments | (8 | ) | — | (212 | ) | |||||||
Net change in unrealized appreciation (depreciation) on foreign currency translations | — | — | (8 | ) | ||||||||
Net change in unrealized appreciation (depreciation) on written options | — | 53 | — | |||||||||
|
|
|
|
|
| |||||||
| Net gain (loss) on investments | (6,663 | ) | (198 | ) | (29,703 | ) | ||||||
|
|
|
|
|
| |||||||
Net increase (decrease) in net assets resulting from operations | $ | (2,057 | ) | $ | (174 | ) | $ | (12,700 | ) | |||
|
|
|
|
|
| |||||||
(1) Amount is less than $500.
(2) See Note 4I in the Notes to Financial Statements.
See Notes to Financial Statements
64
Table of Contents
VIRTUS OPPORTUNITIES TRUST
STATEMENTS OF OPERATIONS (Continued)
YEAR ENDED SEPTEMBER 30, 2015
($ reported in thousands)
|
|
|
| |||||
| Senior Floating Rate Fund | Wealth Masters Fund | |||||||
| Investment Income | ||||||||
Dividends | $ | 1 | $ | 2,010 | ||||
Dividends from affiliated funds | 37 | — | ||||||
Interest | 40,122 | — | ||||||
Security lending | — | 664 | ||||||
Foreign taxes withheld | — | (4 | ) | |||||
|
|
|
| |||||
Total investment income | 40,160 | 2,670 | ||||||
|
|
|
| |||||
| Expenses | ||||||||
Investment advisory fees | 4,689 | 1,249 | ||||||
Service fees, Class A | 701 | 157 | ||||||
Distribution and service fees, Class C | 1,547 | 372 | ||||||
Administration fees | 937 | 176 | ||||||
Transfer agent fees and expenses | 787 | 221 | ||||||
Interest expense and fees | 449 | — | ||||||
Registration fees | 74 | 61 | ||||||
Printing fees and expenses | 58 | 22 | ||||||
Custodian fees | 23 | 3 | ||||||
Professional fees | 53 | 30 | ||||||
Trustees’ fees and expenses | 42 | 5 | ||||||
Miscellaneous expenses | 291 | 10 | ||||||
|
|
|
| |||||
Total expenses | 9,651 | 2,306 | ||||||
Less expenses reimbursed and/or waived by investment adviser | (14 | ) | (14 | ) | ||||
|
|
|
| |||||
Total expenses | 9,637 | 2,292 | ||||||
|
|
|
| |||||
Net investment income (loss) | 30,523 | 378 | ||||||
|
|
|
| |||||
| Net Realized and Unrealized Gain (Loss) on Investments | ||||||||
Net realized gain (loss) on unaffiliated investments | (9,939 | ) | (563 | ) | ||||
Net realized gain (loss) on foreign currency transactions | (3 | ) | — | |||||
Net increase from payments by affiliates(1) | 4 | — | ||||||
Net change in unrealized appreciation (depreciation) on unaffiliated investments | (16,579 | ) | (10,130 | ) | ||||
Net change in unrealized appreciation (depreciation) on affiliated investments | (175 | ) | — | |||||
|
|
|
| |||||
| Net gain (loss) on investments | (26,692 | ) | (10,693 | ) | ||||
|
|
|
| |||||
Net increase (decrease) in net assets resulting from operations | $ | 3,831 | $ | (10,315 | ) | |||
|
|
|
| |||||
(1) See Note 4I in the Notes to Financial Statements.
See Notes to Financial Statements
65
Table of Contents
VIRTUS OPPORTUNITIES TRUST
STATEMENTS OF CHANGES IN NET ASSETS
($ reported in thousands)
|
|
|
| |||||||||||||
| Bond Fund | CA Tax-Exempt Bond | |||||||||||||||
| Year Ended September 30, 2015 | Year Ended September 30, 2014 | Year Ended September 30, 2015 | Year Ended September 30, 2014 | |||||||||||||
| INCREASE/(DECREASE) IN NET ASSETS | ||||||||||||||||
| From Operations | ||||||||||||||||
Net investment income (loss) | $ | 2,691 | $ | 3,270 | $ | 1,095 | $ | 1,502 | ||||||||
Net realized gain (loss) | (1,801 | ) | 386 | 672 | 1,095 | |||||||||||
Net change in unrealized appreciation (depreciation) | (1,079 | ) | 1,221 | (606 | ) | 1,137 | ||||||||||
|
|
|
|
|
|
|
| |||||||||
Increase (decrease) in net assets resulting from operations | (189 | ) | 4,877 | 1,161 | 3,734 | |||||||||||
|
|
|
|
|
|
|
| |||||||||
| From Distributions to Shareholders | ||||||||||||||||
Net investment income, Class A | (1,481 | ) | (2,272 | ) | (736 | ) | (757 | ) | ||||||||
Net investment income, Class B | (4 | ) | (11 | ) | — | — | ||||||||||
Net investment income, Class C | (188 | ) | (214 | ) | — | — | ||||||||||
Net investment income, Class I | (533 | ) | (759 | ) | (396 | ) | (724 | ) | ||||||||
Net realized short-term gains, Class A | — | — | (21 | ) | (7 | ) | ||||||||||
Net realized short-term gains, Class I | — | — | (10 | ) | (8 | ) | ||||||||||
Net realized long-term gains, Class A | — | — | (706 | ) | (437 | ) | ||||||||||
Net realized long-term gains, Class I | — | — | (354 | ) | (501 | ) | ||||||||||
Return of capital Class A | (253 | ) | — | — | — | |||||||||||
Return of capital Class B | (1 | ) | — | — | — | |||||||||||
Return of capital Class C | (41 | ) | — | — | — | |||||||||||
Return of capital Class I | (84 | ) | — | — | — | |||||||||||
|
|
|
|
|
|
|
| |||||||||
Decrease in net assets from distributions to shareholders | (2,585 | ) | (3,256 | ) | (2,223 | ) | (2,434 | ) | ||||||||
|
|
|
|
|
|
|
| |||||||||
| From Share Transactions (See Note 6) | ||||||||||||||||
Change in net assets from share transactions, Class A | (3,738 | ) | (4,781 | ) | (1,030 | ) | (1,622 | ) | ||||||||
Change in net assets from share transactions, Class B | (102 | ) | (175 | ) | — | — | ||||||||||
Change in net assets from share transactions, Class C | 2,882 | (620 | ) | — | — | |||||||||||
Change in net assets from share transactions, Class I | 1,612 | (5,975 | ) | (53 | ) | (15,134 | ) | |||||||||
|
|
|
|
|
|
|
| |||||||||
Increase (decrease) in net assets from share transactions | 654 | (11,551 | ) | (1,083 | ) | (16,756 | ) | |||||||||
|
|
|
|
|
|
|
| |||||||||
Net increase (decrease) in net assets | (2,120 | ) | (9,930 | ) | (2,145 | ) | (15,456 | ) | ||||||||
| Net Assets | ||||||||||||||||
Beginning of period | 76,619 | 86,549 | 33,182 | 48,638 | ||||||||||||
|
|
|
|
|
|
|
| |||||||||
End of period | $ | 74,499 | $ | 76,619 | $ | 31,037 | $ | 33,182 | ||||||||
|
|
|
|
|
|
|
| |||||||||
Accumulated undistributed net investment income (loss) at end of period | $ | (8 | ) | $ | (4 | ) | $ | 9 | $ | 46 | ||||||
See Notes to Financial Statements
66
Table of Contents
VIRTUS OPPORTUNITIES TRUST
STATEMENTS OF CHANGES IN NET ASSETS (Continued)
($ reported in thousands)
|
|
|
| |||||||||
| Essential Resources | High Yield Fund | |||||||||||
| From Inception March 24, 2015 to September 30, 2015 | Year Ended September 30, 2015 | Year Ended September 30, 2014 | ||||||||||
| INCREASE/(DECREASE) IN NET ASSETS | ||||||||||||
| From Operations | ||||||||||||
Net investment income (loss) | $ | 23 | $ | 4,606 | $ | 5,019 | ||||||
Net realized gain (loss) | (26 | ) | (2,049 | ) | 2,456 | |||||||
Net change in unrealized appreciation (depreciation) | (978 | ) | (4,614 | ) | (680 | ) | ||||||
|
|
|
|
|
| |||||||
Increase (decrease) in net assets resulting from operations | (981 | ) | (2,057 | ) | 6,795 | |||||||
|
|
|
|
|
| |||||||
| From Distributions to Shareholders | ||||||||||||
Net investment income, Class A | — | (4,183 | ) | (4,402 | ) | |||||||
Net investment income, Class B | — | (4 | ) | (5 | ) | |||||||
Net investment income, Class C | — | (189 | ) | (170 | ) | |||||||
Net investment income, Class I | — | (376 | ) | (333 | ) | |||||||
|
|
|
|
|
| |||||||
Decrease in net assets from distributions to shareholders | — | (4,752 | ) | (4,910 | ) | |||||||
|
|
|
|
|
| |||||||
| From Share Transactions (See Note 6) | ||||||||||||
Change in net assets from share transactions, Class A | 103 | (4,168 | ) | (10,859 | ) | |||||||
Change in net assets from share transactions, Class B | — | (59 | ) | (28 | ) | |||||||
Change in net assets from share transactions, Class C | 129 | 21 | 697 | |||||||||
Change in net assets from share transactions, Class I | 4,826 | (969 | ) | 211 | ||||||||
|
|
|
|
|
| |||||||
Increase (decrease) in net assets from share transactions | 5,058 | (5,175 | ) | (9,979 | ) | |||||||
|
|
|
|
|
| |||||||
Net increase (decrease) in net assets | 4,077 | (11,984 | ) | (8,094 | ) | |||||||
| Net Assets | ||||||||||||
Beginning of period | — | 81,306 | 89,400 | |||||||||
|
|
|
|
|
| |||||||
End of period | $ | 4,077 | $ | 69,322 | $ | 81,306 | ||||||
|
|
|
|
|
| |||||||
Accumulated undistributed net investment income (loss) at end of period | $ | 23 | $ | (30 | ) | $ | 113 | |||||
See Notes to Financial Statements
67
Table of Contents
VIRTUS OPPORTUNITIES TRUST
STATEMENTS OF CHANGES IN NET ASSETS (Continued)
($ reported in thousands)
|
|
|
| |||||||||||||
| Low Volatility Equity Fund | Multi-Sector Intermediate Bond Fund | |||||||||||||||
| Year Ended September 30, 2015 | Year Ended September 30, 2014 | Year Ended September 30, 2015 | Year Ended September 30, 2014 | |||||||||||||
| INCREASE/(DECREASE) IN NET ASSETS | ||||||||||||||||
| From Operations | ||||||||||||||||
Net investment income (loss) | $ | 24 | $ | 12 | $ | 17,003 | $ | 17,646 | ||||||||
Net realized gain (loss) | 74 | (44 | ) | (10,025 | ) | 4,281 | ||||||||||
Net change in unrealized appreciation (depreciation) | (272 | ) | 297 | (19,678 | ) | (614 | ) | |||||||||
|
|
|
|
|
|
|
| |||||||||
Increase (decrease) in net assets resulting from operations | (174 | ) | 265 | (12,700 | ) | 21,313 | ||||||||||
|
|
|
|
|
|
|
| |||||||||
| From Distributions to Shareholders | ||||||||||||||||
Net investment income, Class A | (7 | ) | (1 | ) | (4,622 | ) | (7,869 | ) | ||||||||
Net investment income, Class B | — | — | (127 | ) | (260 | ) | ||||||||||
Net investment income, Class C | (2 | ) | (1 | ) | (2,903 | ) | (3,889 | ) | ||||||||
Net investment income, Class I | (6 | ) | (13 | ) | (6,036 | ) | (4,673 | ) | ||||||||
Net investment income, Class R6 | — | — | (32 | ) | — | |||||||||||
Net realized short-term gains, Class A | — | — | (226 | ) | (1,570 | ) | ||||||||||
Net realized short-term gains, Class B | — | — | (8 | ) | (63 | ) | ||||||||||
Net realized short-term gains, Class C | — | — | (178 | ) | (905 | ) | ||||||||||
Net realized short-term gains, Class I | — | — | (278 | ) | (823 | ) | ||||||||||
Net realized short-term gains, Class R6 | — | — | (2 | ) | — | |||||||||||
Net realized long-term gains, Class A | — | — | (1,292 | ) | (1,696 | ) | ||||||||||
Net realized long-term gains, Class B | — | — | (50 | ) | (68 | ) | ||||||||||
Net realized long-term gains, Class C | — | — | (1,037 | ) | (968 | ) | ||||||||||
Net realized long-term gains, Class I | — | — | (1,595 | ) | (865 | ) | ||||||||||
Net realized long-term gains, Class R6 | — | — | (— | )(1) | — | |||||||||||
Return of capital Class A | — | — | (625 | ) | — | |||||||||||
Return of capital Class B | — | — | (21 | ) | — | |||||||||||
Return of capital Class C | — | — | (491 | ) | — | |||||||||||
Return of capital Class I | — | — | (770 | ) | — | |||||||||||
Return of capital Class R6 | — | — | (5 | ) | — | |||||||||||
|
|
|
|
|
|
|
| |||||||||
Decrease in net assets from distributions to shareholders | (15 | ) | (15 | ) | (20,298 | ) | (23,649 | ) | ||||||||
|
|
|
|
|
|
|
| |||||||||
| From Share Transactions (See Note 6) | ||||||||||||||||
Change in net assets from share transactions, Class A | 1,668 | 316 | (3,826 | ) | (65,126 | ) | ||||||||||
Change in net assets from share transactions, Class B | — | — | (2,133 | ) | (2,224 | ) | ||||||||||
Change in net assets from share transactions, Class C | 1,188 | 138 | (3,590 | ) | (7,973 | ) | ||||||||||
Change in net assets from share transactions, Class I | 77 | 13 | 8,043 | 59,707 | ||||||||||||
Change in net assets from share transactions, Class R6 | — | — | 1,885 | — | ||||||||||||
|
|
|
|
|
|
|
| |||||||||
Increase (decrease) in net assets from share transactions | 2,933 | 467 | 379 | (15,616 | ) | |||||||||||
|
|
|
|
|
|
|
| |||||||||
Net increase (decrease) in net assets | 2,744 | 717 | (32,619 | ) | (17,952 | ) | ||||||||||
| Net Assets | ||||||||||||||||
Beginning of period | 2,315 | 1,598 | 365,153 | 383,105 | ||||||||||||
|
|
|
|
|
|
|
| |||||||||
End of period | $ | 5,059 | $ | 2,315 | $ | 332,534 | $ | 365,153 | ||||||||
|
|
|
|
|
|
|
| |||||||||
Accumulated undistributed net investment income (loss) at end of period | $ | 16 | $ | 7 | $ | (249 | ) | $ | (55 | ) | ||||||
(1) Amount less than $500.
See Notes to Financial Statements
68
Table of Contents
VIRTUS OPPORTUNITIES TRUST
STATEMENTS OF CHANGES IN NET ASSETS (Continued)
($ reported in thousands)
|
|
|
| |||||||||||||
| Senior Floating Rate Fund | Wealth Masters Fund | |||||||||||||||
| Year Ended September 30, 2015 | Year Ended September 30, 2014 | Year Ended September 30, 2015 | Year Ended September 30, 2014 | |||||||||||||
| INCREASE/(DECREASE) IN NET ASSETS | ||||||||||||||||
| From Operations | ||||||||||||||||
Net investment income (loss) | $ | 30,523 | $ | 38,225 | $ | 378 | $ | 103 | ||||||||
Net realized gain (loss) | (9,938 | ) | 2,023 | (563 | ) | 51 | ||||||||||
Net change in unrealized appreciation (depreciation) | (16,754 | ) | (9,946 | ) | (10,130 | ) | 7,065 | |||||||||
|
|
|
|
|
|
|
| |||||||||
Increase (decrease) in net assets resulting from operations | 3,831 | 30,302 | (10,315 | ) | 7,219 | |||||||||||
|
|
|
|
|
|
|
| |||||||||
| From Distributions to Shareholders | ||||||||||||||||
Net investment income, Class A | (11,297 | ) | (14,890 | ) | (184 | ) | — | |||||||||
Net investment income, Class C | (5,079 | ) | (5,719 | ) | — | — | ||||||||||
Net investment income, Class I | (14,848 | ) | (17,118 | ) | (252 | ) | (35 | ) | ||||||||
Net realized short-term gains, Class A | (394 | ) | — | (1,046 | ) | (13 | ) | |||||||||
Net realized short-term gains, Class C | (231 | ) | — | (622 | ) | (4 | ) | |||||||||
Net realized short-term gains, Class I | (540 | ) | — | (869 | ) | (38 | ) | |||||||||
Net realized long-term gains, Class A | (341 | ) | — | (20 | ) | (1 | ) | |||||||||
Net realized long-term gains, Class C | (199 | ) | — | (12 | ) | (— | )(1) | |||||||||
Net realized long-term gains, Class I | (463 | ) | — | (17 | ) | (1 | ) | |||||||||
|
|
|
|
|
|
|
| |||||||||
Decrease in net assets from distributions to shareholders | (33,392 | ) | (37,727 | ) | (3,022 | ) | (92 | ) | ||||||||
|
|
|
|
|
|
|
| |||||||||
| From Share Transactions (See Note 6) | ||||||||||||||||
Change in net assets from share transactions, Class A | (15,274 | ) | (89,707 | ) | 4,094 | 48,771 | ||||||||||
Change in net assets from share transactions, Class C | (33,299 | ) | (3,743 | ) | 7,353 | 28,200 | ||||||||||
Change in net assets from share transactions, Class I | (159,653 | ) | 79,900 | (12,645 | ) | (512 | ) | |||||||||
|
|
|
|
|
|
|
| |||||||||
Increase (decrease) in net assets from share transactions | (208,226 | ) | (13,550 | ) | (1,198 | ) | 76,459 | |||||||||
|
|
|
|
|
|
|
| |||||||||
Net increase (decrease) in net assets | (237,787 | ) | (20,975 | ) | (14,535 | ) | 83,586 | |||||||||
| Net Assets | ||||||||||||||||
Beginning of period | 929,596 | 950,571 | 135,310 | 51,724 | ||||||||||||
|
|
|
|
|
|
|
| |||||||||
End of period | $ | 691,809 | $ | 929,596 | $ | 120,775 | $ | 135,310 | ||||||||
|
|
|
|
|
|
|
| |||||||||
Accumulated undistributed net investment income (loss) at end of period | $ | (347 | ) | $ | 350 | $ | 229 | $ | 152 | |||||||
(1) Amount is less than $500.
See Notes to Financial Statements
69
Table of Contents
VIRTUS OPPORTUNITIES TRUST
SELECTED PER SHARE DATA AND RATIOS FOR A SHARE OUTSTANDING
THROUGHOUT EACH PERIOD
| Net Asset Value, Beginning of Period | Net Investment Income (Loss)(2) | Net Realized and Unrealized Gain (Loss) | Total from Investment Operations | Dividends from Net Investment Income | Distributions from Net Realized Gains | Return of Capital | Total Distributions | Change in Net Asset Value | Net Asset Value, End of Period | Total Return(1) | Net Assets, End of Period (in thousands) | Ratio of Net Expenses to Average Net Assets(8) | Ratio of Gross Expenses to Average Net Assets (before waivers and reimburse ments)(8) | Ratio of Net Investment Income (Loss) to Average Net Assets | Portfolio Turnover Rate | ||||||||||||||||||||||||||||||||||||||||||||||||||||||||||||||||||
Bond Fund | ||||||||||||||||||||||||||||||||||||||||||||||||||||||||||||||||||||||||||||||||||
Class A | ||||||||||||||||||||||||||||||||||||||||||||||||||||||||||||||||||||||||||||||||||
10/1/14 to 9/30/15 | $ | 11.43 | 0.40 | (0.43 | ) | (0.03 | ) | (0.32 | ) | — | (0.06 | ) | (0.38 | ) | (0.41 | ) | $ | 11.02 | (0.26 | )% | $ | 48,064 | 0.85 | % | 1.12 | % | 3.55 | % | 64 | % | ||||||||||||||||||||||||||||||||||||||||||||||||||||
10/1/13 to 9/30/14 | 11.21 | 0.47 | 0.22 | 0.69 | (0.47 | ) | — | — | (0.47 | ) | 0.22 | 11.43 | 6.18 | 53,603 | 0.85 | 1.10 | 4.08 | 38 | ||||||||||||||||||||||||||||||||||||||||||||||||||||||||||||||||
10/1/12 to 9/30/13 | 11.61 | 0.43 | (0.41 | ) | 0.02 | (0.42 | ) | — | — | (0.42 | ) | (0.40 | ) | 11.21 | 0.17 | 57,286 | 0.85 | 1.07 | 3.75 | 107 | ||||||||||||||||||||||||||||||||||||||||||||||||||||||||||||||
10/1/11 to 9/30/12 | 10.96 | 0.35 | 0.67 | 1.02 | (0.37 | ) | — | — | (0.37 | ) | 0.65 | 11.61 | 9.34 | 67,804 | 0.85 | 1.02 | 3.12 | 210 | ||||||||||||||||||||||||||||||||||||||||||||||||||||||||||||||||
10/1/10 to 9/30/11 | 11.18 | 0.46 | (0.21 | ) | 0.25 | (0.47 | ) | — | — | (0.47 | ) | (0.22 | ) | 10.96 | 2.39 | 64,449 | 0.85 | 1.04 | 4.16 | 169 | ||||||||||||||||||||||||||||||||||||||||||||||||||||||||||||||
Class B | ||||||||||||||||||||||||||||||||||||||||||||||||||||||||||||||||||||||||||||||||||
10/1/14 to 9/30/15 | $ | 11.14 | 0.31 | (0.41 | ) | (0.10 | ) | (0.24 | ) | — | (0.06 | ) | (0.30 | ) | (0.40 | ) | $ | 10.74 | (0.91 | )% | $ | 126 | 1.60 | % | 1.86 | % | 2.82 | % | 64 | % | ||||||||||||||||||||||||||||||||||||||||||||||||||||
10/1/13 to 9/30/14 | 10.95 | 0.37 | 0.20 | 0.57 | (0.38 | ) | — | — | (0.38 | ) | 0.19 | 11.14 | 5.27 | 233 | 1.60 | 1.84 | 3.34 | 38 | ||||||||||||||||||||||||||||||||||||||||||||||||||||||||||||||||
10/1/12 to 9/30/13 | 11.34 | 0.33 | (0.38 | ) | (0.05 | ) | (0.34 | ) | — | — | (0.34 | ) | (0.39 | ) | 10.95 | (0.50 | ) | 401 | 1.60 | 1.82 | 2.95 | 107 | ||||||||||||||||||||||||||||||||||||||||||||||||||||||||||||
10/1/11 to 9/30/12 | 10.71 | 0.27 | 0.64 | 0.91 | (0.28 | ) | — | — | (0.28 | ) | 0.63 | 11.34 | 8.48 | 727 | 1.60 | 1.77 | 2.43 | 210 | ||||||||||||||||||||||||||||||||||||||||||||||||||||||||||||||||
10/1/10 to 9/30/11 | 10.93 | 0.37 | (0.20 | ) | 0.17 | (0.39 | ) | — | — | (0.39 | ) | (0.22 | ) | 10.71 | 1.64 | 1,171 | 1.60 | 1.80 | 3.38 | 169 | ||||||||||||||||||||||||||||||||||||||||||||||||||||||||||||||
Class C | ||||||||||||||||||||||||||||||||||||||||||||||||||||||||||||||||||||||||||||||||||
10/1/14 to 9/30/15 | $ | 11.19 | 0.30 | (0.41 | ) | (0.11 | ) | (0.24 | ) | — | (0.06 | ) | (0.30 | ) | (0.41 | ) | $ | 10.78 | (1.00 | )% | $ | 8,853 | 1.60 | % | 1.87 | % | 2.74 | % | 64 | % | ||||||||||||||||||||||||||||||||||||||||||||||||||||
10/1/13 to 9/30/14 | 10.99 | 0.37 | 0.21 | 0.58 | (0.38 | ) | — | — | (0.38 | ) | 0.20 | 11.19 | 5.34 | 6,315 | 1.60 | 1.85 | 3.33 | 38 | ||||||||||||||||||||||||||||||||||||||||||||||||||||||||||||||||
10/1/12 to 9/30/13 | 11.38 | 0.34 | (0.39 | ) | (0.05 | ) | (0.34 | ) | — | — | (0.34 | ) | (0.39 | ) | 10.99 | (0.51 | ) | 6,825 | 1.60 | 1.82 | 2.99 | 107 | ||||||||||||||||||||||||||||||||||||||||||||||||||||||||||||
10/1/11 to 9/30/12 | 10.75 | 0.26 | 0.65 | 0.91 | (0.28 | ) | — | — | (0.28 | ) | 0.63 | 11.38 | 8.55 | 8,756 | 1.60 | 1.77 | 2.36 | 210 | ||||||||||||||||||||||||||||||||||||||||||||||||||||||||||||||||
10/1/10 to 9/30/11 | 10.96 | 0.37 | (0.19 | ) | 0.18 | (0.39 | ) | — | — | (0.39 | ) | (0.21 | ) | 10.75 | 1.63 | 7,984 | 1.60 | 1.79 | 3.41 | 169 | ||||||||||||||||||||||||||||||||||||||||||||||||||||||||||||||
Class I | ||||||||||||||||||||||||||||||||||||||||||||||||||||||||||||||||||||||||||||||||||
10/1/14 to 9/30/15 | $ | 11.59 | 0.43 | (0.42 | ) | 0.01 | (0.35 | ) | — | (0.06 | ) | (0.41 | ) | (0.40 | ) | $ | 11.19 | 0.08 | % | $ | 17,456 | 0.60 | % | 0.87 | % | 3.78 | % | 64 | % | |||||||||||||||||||||||||||||||||||||||||||||||||||||
10/1/13 to 9/30/14 | 11.37 | 0.50 | 0.21 | 0.71 | (0.49 | ) | — | — | (0.49 | ) | 0.22 | 11.59 | 6.35 | 16,468 | 0.60 | 0.85 | 4.33 | 38 | ||||||||||||||||||||||||||||||||||||||||||||||||||||||||||||||||
10/1/12 to 9/30/13 | 11.76 | 0.47 | (0.41 | ) | 0.06 | (0.45 | ) | — | — | (0.45 | ) | (0.39 | ) | 11.37 | 0.49 | 22,037 | 0.60 | 0.82 | 3.98 | 107 | ||||||||||||||||||||||||||||||||||||||||||||||||||||||||||||||
10/1/11 to 9/30/12 | 11.10 | 0.39 | 0.66 | 1.05 | (0.39 | ) | — | — | (0.39 | ) | 0.66 | 11.76 | 9.64 | 29,527 | 0.60 | 0.77 | 3.39 | 210 | ||||||||||||||||||||||||||||||||||||||||||||||||||||||||||||||||
10/1/10 to 9/30/11 | 11.30 | 0.49 | (0.19 | ) | 0.30 | (0.50 | ) | — | — | (0.50 | ) | (0.20 | ) | 11.10 | 2.67 | 76,169 | 0.60 | 0.79 | 4.39 | 169 | ||||||||||||||||||||||||||||||||||||||||||||||||||||||||||||||
CA Tax-Exempt | ||||||||||||||||||||||||||||||||||||||||||||||||||||||||||||||||||||||||||||||||||
Bond Fund | ||||||||||||||||||||||||||||||||||||||||||||||||||||||||||||||||||||||||||||||||||
Class A | ||||||||||||||||||||||||||||||||||||||||||||||||||||||||||||||||||||||||||||||||||
10/1/14 to 9/30/15 | $ | 12.51 | 0.39 | 0.03 | 0.42 | (0.40 | ) | (0.39 | ) | — | (0.79 | ) | (0.37 | ) | $ | 12.14 | 3.44 | % | $ | 19,978 | 0.85 | % | 1.18 | % | 3.16 | % | 24 | % | ||||||||||||||||||||||||||||||||||||||||||||||||||||||
10/1/13 to 9/30/14 | 12.10 | 0.43 | 0.64 | 1.07 | (0.42 | ) | (0.24 | ) | — | (0.66 | ) | 0.41 | 12.51 | 9.16 | 21,729 | 0.85 | 1.11 | 3.49 | 7 | |||||||||||||||||||||||||||||||||||||||||||||||||||||||||||||||
10/1/12 to 9/30/13 | 12.96 | 0.43 | (0.68 | ) | (0.25 | ) | (0.43 | ) | (0.18 | ) | — | (0.61 | ) | (0.86 | ) | 12.10 | (2.12 | ) | 22,612 | 0.85 | 1.04 | 3.39 | 22 | |||||||||||||||||||||||||||||||||||||||||||||||||||||||||||
10/1/11 to 9/30/12 | 12.30 | 0.46 | 0.68 | 1.14 | (0.48 | ) | — | — | (0.48 | ) | 0.66 | 12.96 | 9.40 | 28,803 | 0.85 | 1.04 | 3.65 | 16 | ||||||||||||||||||||||||||||||||||||||||||||||||||||||||||||||||
10/1/10 to 9/30/11 | 12.34 | 0.48 | (0.04 | ) | 0.44 | (0.48 | ) | — | — | (0.48 | ) | (0.04 | ) | 12.30 | 3.75 | 29,688 | 0.85 | 1.05 | 4.04 | 12 | ||||||||||||||||||||||||||||||||||||||||||||||||||||||||||||||
Class I | ||||||||||||||||||||||||||||||||||||||||||||||||||||||||||||||||||||||||||||||||||
10/1/14 to 9/30/15 | $ | 12.49 | 0.42 | 0.03 | 0.45 | (0.43 | ) | (0.39 | ) | — | (0.82 | ) | (0.37 | ) | $ | 12.12 | 3.71 | % | $ | 11,059 | 0.60 | % | 0.93 | % | 3.41 | % | 24 | % | ||||||||||||||||||||||||||||||||||||||||||||||||||||||
10/1/13 to 9/30/14 | 12.09 | 0.45 | 0.64 | 1.09 | (0.45 | ) | (0.24 | ) | — | (0.69 | ) | 0.40 | 12.49 | 9.36 | 11,453 | 0.60 | 0.83 | 3.74 | 7 | |||||||||||||||||||||||||||||||||||||||||||||||||||||||||||||||
10/1/12 to 9/30/13 | 12.95 | 0.46 | (0.68 | ) | (0.22 | ) | (0.46 | ) | (0.18 | ) | — | (0.64 | ) | (0.86 | ) | 12.09 | (1.88 | ) | 26,026 | 0.60 | 0.79 | 3.65 | 22 | |||||||||||||||||||||||||||||||||||||||||||||||||||||||||||
10/1/11 to 9/30/12 | 12.29 | 0.49 | 0.68 | 1.17 | (0.51 | ) | — | — | (0.51 | ) | 0.66 | 12.95 | 9.68 | 28,639 | 0.60 | 0.79 | 3.90 | 16 | ||||||||||||||||||||||||||||||||||||||||||||||||||||||||||||||||
10/1/10 to 9/30/11 | 12.33 | 0.51 | (0.04 | ) | 0.47 | (0.51 | ) | — | — | (0.51 | ) | (0.04 | ) | 12.29 | 4.01 | 27,417 | 0.60 | 0.80 | 4.29 | 12 | ||||||||||||||||||||||||||||||||||||||||||||||||||||||||||||||
The footnote legend is at the end of the Financial Highlights.
See Notes to Financial Statements
70
Table of Contents
VIRTUS OPPORTUNITIES TRUST
FINANCIAL HIGHLIGHTS
SELECTED PER SHARE DATA AND RATIOS FOR A SHARE OUTSTANDING
THROUGHOUT EACH PERIOD
| Net Asset Value, Beginning of Period | Net Investment Income (Loss)(2) | Net Realized and Unrealized Gain (Loss) | Total from Investment Operations | Dividends from Net Investment Income | Total Distributions | Change in Net Asset Value | Net Asset Value, End of Period | Total Return(1) | Net Assets, End of Period (in thousands) | Ratio of Net Expenses to Average Net Assets(8) | Ratio of Gross Expenses to Average Net Assets (before waivers and reimburse ments)(8) | Ratio of Net Investment Income (Loss) to Average Net Assets | Portfolio Turnover Rate | ||||||||||||||||||||||||||||||||||||||||||||||||||||||||||
| Essential Resources | ||||||||||||||||||||||||||||||||||||||||||||||||||||||||||||||||||||||||
Fund | ||||||||||||||||||||||||||||||||||||||||||||||||||||||||||||||||||||||||
Class A | ||||||||||||||||||||||||||||||||||||||||||||||||||||||||||||||||||||||||
3/24/15(6) to 9/30/15 | $ | 10.00 | 0.03 | (1.99 | ) | (1.96 | ) | — | — | (1.96 | ) | $ | 8.04 | (19.60 | )%(4) | $ | 84 | 1.65 | %(3) | 6.26 | %(3) | 0.66 | %(3) | 48 | %(4) | |||||||||||||||||||||||||||||||||||||||||||||||
Class C | ||||||||||||||||||||||||||||||||||||||||||||||||||||||||||||||||||||||||
3/24/15(6) to 9/30/15 | $ | 10.00 | (— | )(5) | (1.99 | ) | (1.99 | ) | — | — | (1.99 | ) | $ | 8.01 | (19.90 | )%(4) | $ | 104 | 2.40 | %(3) | 7.26 | %(3) | (0.10 | )%(3) | 48 | %(4) | ||||||||||||||||||||||||||||||||||||||||||||||
Class I | ||||||||||||||||||||||||||||||||||||||||||||||||||||||||||||||||||||||||
3/24/15(6) to 9/30/15 | $ | 10.00 | 0.05 | (2.00 | ) | (1.95 | ) | — | — | (1.95 | ) | $ | 8.05 | (19.50 | )%(4) | $ | 3,889 | 1.40 | %(3) | 5.98 | %(3) | 0.93 | %(3) | 48 | %(4) | |||||||||||||||||||||||||||||||||||||||||||||||
High Yield Fund | ||||||||||||||||||||||||||||||||||||||||||||||||||||||||||||||||||||||||
Class A | ||||||||||||||||||||||||||||||||||||||||||||||||||||||||||||||||||||||||
10/1/14 to 9/30/15 | $ | 4.35 | 0.22 | (0.36 | ) | (0.14 | ) | (0.23 | ) | (0.23 | ) | (0.37 | ) | $ | 3.98 | (3.39 | )% | $ | 60,951 | 1.15 | % | 1.32 | % | 5.26 | % | 94 | % | |||||||||||||||||||||||||||||||||||||||||||||
10/1/13 to 9/30/14 | 4.27 | 0.24 | 0.08 | 0.32 | (0.24 | ) | (0.24 | ) | 0.08 | 4.35 | 7.53 | 71,042 | 1.15 | 1.31 | 5.55 | 82 | ||||||||||||||||||||||||||||||||||||||||||||||||||||||||
10/1/12 to 9/30/13 | 4.28 | 0.26 | (0.01 | ) | 0.25 | (0.26 | ) | (0.26 | ) | (0.01 | ) | 4.27 | 5.98 | 80,155 | 1.15 | 1.31 | 6.05 | 100 | ||||||||||||||||||||||||||||||||||||||||||||||||||||||
10/1/11 to 9/30/12 | 3.85 | 0.28 | 0.44 | 0.72 | (0.29 | ) | (0.29 | ) | 0.43 | 4.28 | 19.19 | 98,701 | 1.15 | 1.31 | 6.82 | 92 | ||||||||||||||||||||||||||||||||||||||||||||||||||||||||
10/1/10 to 9/30/11 | 4.17 | 0.29 | (0.32 | ) | (0.03 | ) | (0.29 | ) | (0.29 | ) | (0.32 | ) | 3.85 | (0.82 | ) | 86,530 | 1.21 | (7) | 1.35 | 6.93 | 106 | |||||||||||||||||||||||||||||||||||||||||||||||||||
Class B | ||||||||||||||||||||||||||||||||||||||||||||||||||||||||||||||||||||||||
10/1/14 to 9/30/15 | $ | 4.24 | 0.19 | (0.35 | ) | (0.16 | ) | (0.20 | ) | (0.20 | ) | (0.36 | ) | $ | 3.88 | (3.96 | )% | $ | 41 | 1.90 | % | 2.07 | % | 4.54 | % | 94 | % | |||||||||||||||||||||||||||||||||||||||||||||
10/1/13 to 9/30/14 | 4.17 | 0.21 | 0.07 | 0.28 | (0.21 | ) | (0.21 | ) | 0.07 | 4.24 | 6.68 | 106 | 1.90 | 2.07 | 4.80 | 82 | ||||||||||||||||||||||||||||||||||||||||||||||||||||||||
10/1/12 to 9/30/13 | 4.19 | 0.23 | (0.02 | ) | 0.21 | (0.23 | ) | (0.23 | ) | (0.02 | ) | 4.17 | 5.06 | 131 | 1.90 | 2.05 | 5.31 | 100 | ||||||||||||||||||||||||||||||||||||||||||||||||||||||
10/1/11 to 9/30/12 | 3.77 | 0.24 | 0.44 | 0.68 | (0.26 | ) | (0.26 | ) | 0.42 | 4.19 | 18.46 | 307 | 1.90 | 2.06 | 6.07 | 92 | ||||||||||||||||||||||||||||||||||||||||||||||||||||||||
10/1/10 to 9/30/11 | 4.08 | 0.25 | (0.31 | ) | (0.06 | ) | (0.25 | ) | (0.25 | ) | (0.31 | ) | 3.77 | (1.66 | ) | 404 | 1.96 | (7) | 2.10 | 6.17 | 106 | |||||||||||||||||||||||||||||||||||||||||||||||||||
Class C | ||||||||||||||||||||||||||||||||||||||||||||||||||||||||||||||||||||||||
10/1/14 to 9/30/15 | $ | 4.28 | 0.19 | (0.35 | ) | (0.16 | ) | (0.20 | ) | (0.20 | ) | (0.36 | ) | $ | 3.92 | (3.93 | )% | $ | 3,705 | 1.90 | % | 2.07 | % | 4.52 | % | 94 | % | |||||||||||||||||||||||||||||||||||||||||||||
10/1/13 to 9/30/14 | 4.21 | �� | 0.21 | 0.07 | 0.28 | (0.21 | ) | (0.21 | ) | 0.07 | 4.28 | 6.60 | 4,038 | 1.90 | 2.07 | 4.79 | 82 | |||||||||||||||||||||||||||||||||||||||||||||||||||||||
10/1/12 to 9/30/13 | 4.23 | 0.23 | (0.02 | ) | 0.21 | (0.23 | ) | (0.23 | ) | (0.02 | ) | 4.21 | 5.00 | 3,302 | 1.90 | 2.06 | 5.31 | 100 | ||||||||||||||||||||||||||||||||||||||||||||||||||||||
10/1/11 to 9/30/12 | 3.80 | 0.25 | 0.44 | 0.69 | (0.26 | ) | (0.26 | ) | 0.43 | 4.23 | 18.59 | 2,944 | 1.90 | 2.07 | 6.07 | 92 | ||||||||||||||||||||||||||||||||||||||||||||||||||||||||
10/1/10 to 9/30/11 | 4.11 | 0.25 | (0.31 | ) | (0.06 | ) | (0.25 | ) | (0.25 | ) | (0.31 | ) | 3.80 | (1.65 | ) | 2,028 | 1.95 | (7) | 2.10 | 6.18 | 106 | |||||||||||||||||||||||||||||||||||||||||||||||||||
Class I | ||||||||||||||||||||||||||||||||||||||||||||||||||||||||||||||||||||||||
10/1/14 to 9/30/15 | $ | 4.35 | 0.23 | (0.36 | ) | (0.13 | ) | (0.24 | ) | (0.24 | ) | (0.37 | ) | $ | 3.98 | (3.15 | )% | $ | 4,625 | 0.90 | % | 1.07 | % | 5.53 | % | 94 | % | |||||||||||||||||||||||||||||||||||||||||||||
10/1/13 to 9/30/14 | 4.27 | 0.26 | 0.07 | 0.33 | (0.25 | ) | (0.25 | ) | 0.08 | 4.35 | 7.80 | 6,120 | 0.90 | 1.07 | 5.80 | 82 | ||||||||||||||||||||||||||||||||||||||||||||||||||||||||
10/1/12 to 9/30/13 | 4.28 | 0.27 | (0.01 | ) | 0.26 | (0.27 | ) | (0.27 | ) | (0.01 | ) | 4.27 | 6.25 | 5,812 | 0.90 | 1.05 | 6.37 | 100 | ||||||||||||||||||||||||||||||||||||||||||||||||||||||
8/8/12(6) to 9/30/12 | 4.23 | 0.04 | 0.06 | 0.10 | (0.05 | ) | (0.05 | ) | 0.05 | 4.28 | 2.37 | (4) | 102 | 0.90 | (3) | 1.08 | (3) | 6.86 | (3) | 92 | (4) | |||||||||||||||||||||||||||||||||||||||||||||||||||
Low Volatility Equity Fund | ||||||||||||||||||||||||||||||||||||||||||||||||||||||||||||||||||||||||
Class A | ||||||||||||||||||||||||||||||||||||||||||||||||||||||||||||||||||||||||
10/1/14 to 9/30/15 | $ | 11.71 | 0.08 | (0.30 | ) | (0.22 | ) | (0.04 | ) | (0.04 | ) | (0.26 | ) | $ | 11.45 | (1.88 | )% | $ | 2,055 | 1.55 | % | 2.70 | % | 0.64 | % | 1 | % | |||||||||||||||||||||||||||||||||||||||||||||
10/1/13 to 9/30/14 | 10.24 | 0.06 | 1.50 | 1.56 | (0.09 | ) | (0.09 | ) | 1.47 | 11.71 | 15.23 | 485 | 1.55 | 6.15 | 0.56 | 3 | ||||||||||||||||||||||||||||||||||||||||||||||||||||||||
6/11/13(6) to 9/30/13 | 10.00 | 0.06 | 0.18 | 0.24 | — | — | 0.24 | 10.24 | 2.40 | (4) | 136 | 1.55 | (3) | 7.66 | (3) | 2.00 | (3) | 0 | ||||||||||||||||||||||||||||||||||||||||||||||||||||||
The footnote legend is at the end of the Financial Highlights.
See Notes to Financial Statements
71
Table of Contents
VIRTUS OPPORTUNITIES TRUST
FINANCIAL HIGHLIGHTS
SELECTED PER SHARE DATA AND RATIOS FOR A SHARE OUTSTANDING
THROUGHOUT EACH PERIOD
| Net Asset Value, Beginning of Period | Net Investment Income (Loss)(2) | Net Realized and Unrealized Gain (Loss) | Total from Investment Operations | Dividends from Net Investment Income | Distributions from Net Realized Gains | Return of Capital | Total Distributions | Change in Net Asset Value | Net Asset Value, End of Period | Total Return(1) | Net Assets, End of Period (in thousands) | Ratio of Net Expenses to Average Net Assets(8) | Ratio of Gross Expenses to Average Net Assets (before waivers and reimburse ments)(8) | Ratio of Net Investment Income (Loss) to Average Net Assets | Portfolio Turnover Rate | ||||||||||||||||||||||||||||||||||||||||||||||||||||||||||||||||||
| Low Volatility Equity Fund | ||||||||||||||||||||||||||||||||||||||||||||||||||||||||||||||||||||||||||||||||||
(Continued) | ||||||||||||||||||||||||||||||||||||||||||||||||||||||||||||||||||||||||||||||||||
Class C | ||||||||||||||||||||||||||||||||||||||||||||||||||||||||||||||||||||||||||||||||||
10/1/14 to 9/30/15 | $ | 11.64 | 0.01 | (0.31 | ) | (0.30 | ) | (0.02 | ) | — | — | (0.02 | ) | (0.32 | ) | $ | 11.32 | (2.61 | )% | $ | 1,423 | 2.30 | % | 3.47 | % | 0.04 | % | 1 | % | |||||||||||||||||||||||||||||||||||||||||||||||||||||
10/1/13 to 9/30/14 | 10.21 | (0.02 | ) | 1.50 | 1.48 | (0.05 | ) | — | — | (0.05 | ) | 1.43 | 11.64 | 14.47 | 291 | 2.30 | 6.72 | (0.19 | ) | 3 | ||||||||||||||||||||||||||||||||||||||||||||||||||||||||||||||
6/11/13(6) to 9/30/13 | 10.00 | 0.03 | 0.18 | 0.21 | — | — | — | — | 0.21 | 10.21 | 2.10 | (4) | 130 | 2.30 | (3) | 8.49 | (3) | 0.99 | (3) | 0 | ||||||||||||||||||||||||||||||||||||||||||||||||||||||||||||||
Class I | ||||||||||||||||||||||||||||||||||||||||||||||||||||||||||||||||||||||||||||||||||
10/1/14 to 9/30/15 | $ | 11.73 | 0.09 | (0.27 | ) | (0.18 | ) | (0.05 | ) | — | — | (0.05 | ) | (0.23 | ) | $ | 11.50 | (1.57 | )% | $ | 1,581 | 1.30 | % | 2.62 | % | 0.79 | % | 1 | % | |||||||||||||||||||||||||||||||||||||||||||||||||||||
10/1/13 to 9/30/14 | 10.25 | 0.07 | 1.51 | 1.58 | (0.10 | ) | — | — | (0.10 | ) | 1.48 | 11.73 | 15.45 | 1,539 | 1.30 | 5.32 | 0.67 | 3 | ||||||||||||||||||||||||||||||||||||||||||||||||||||||||||||||||
6/11/13(6) to 9/30/13 | 10.00 | 0.07 | 0.18 | 0.25 | — | — | — | — | 0.25 | 10.25 | 2.50 | (4) | 1,332 | 1.30 | (3) | 7.51 | (3) | 2.23 | (3) | 0 | ||||||||||||||||||||||||||||||||||||||||||||||||||||||||||||||
| Multi-Sector Intermediate | ||||||||||||||||||||||||||||||||||||||||||||||||||||||||||||||||||||||||||||||||||
Bond Fund | ||||||||||||||||||||||||||||||||||||||||||||||||||||||||||||||||||||||||||||||||||
Class A | ||||||||||||||||||||||||||||||||||||||||||||||||||||||||||||||||||||||||||||||||||
10/1/14 to 9/30/15 | $ | 10.70 | 0.49 | (0.85 | ) | (0.36 | ) | (0.40 | ) | (0.13 | ) | (0.05 | ) | (0.58 | ) | (0.94 | ) | $ | 9.76 | (3.41 | )% | $ | 104,833 | 1.10 | % | 1.10 | % | 4.81 | % | 66 | % | |||||||||||||||||||||||||||||||||||||||||||||||||||
10/1/13 to 9/30/14 | 10.77 | 0.54 | 0.11 | 0.65 | (0.52 | ) | (0.20 | ) | — | (0.72 | ) | (0.07 | ) | 10.70 | 6.18 | 119,423 | 1.11 | 1.11 | 5.00 | 54 | ||||||||||||||||||||||||||||||||||||||||||||||||||||||||||||||
10/1/12 to 9/30/13 | 11.15 | 0.57 | (0.28 | ) | 0.29 | (0.55 | ) | (0.12 | ) | — | (0.67 | ) | (0.38 | ) | 10.77 | 2.59 | 184,524 | 1.10 | 1.10 | 5.13 | 77 | |||||||||||||||||||||||||||||||||||||||||||||||||||||||||||||
10/1/11 to 9/30/12 | 10.24 | 0.62 | 0.93 | 1.55 | (0.64 | ) | — | — | (0.64 | ) | 0.91 | 11.15 | 15.51 | 196,554 | 1.13 | 1.13 | 5.73 | 76 | ||||||||||||||||||||||||||||||||||||||||||||||||||||||||||||||||
10/1/10 to 9/30/11 | 10.77 | 0.66 | (0.47 | ) | 0.19 | (0.72 | ) | — | — | (0.72 | ) | (0.53 | ) | 10.24 | 1.58 | 137,395 | 1.16 | 1.16 | 6.07 | 45 | ||||||||||||||||||||||||||||||||||||||||||||||||||||||||||||||
Class B | ||||||||||||||||||||||||||||||||||||||||||||||||||||||||||||||||||||||||||||||||||
10/1/14 to 9/30/15 | $ | 10.67 | 0.41 | (0.84 | ) | (0.43 | ) | (0.33 | ) | (0.13 | ) | (0.05 | ) | (0.51 | ) | (0.94 | ) | $ | 9.73 | (4.14 | )% | $ | 2,868 | 1.85 | % | 1.85 | % | 4.01 | % | 66 | % | |||||||||||||||||||||||||||||||||||||||||||||||||||
10/1/13 to 9/30/14 | 10.74 | 0.46 | 0.11 | 0.57 | (0.44 | ) | (0.20 | ) | — | (0.64 | ) | (0.07 | ) | 10.67 | 5.40 | 5,360 | 1.86 | 1.86 | 4.26 | 54 | ||||||||||||||||||||||||||||||||||||||||||||||||||||||||||||||
10/1/12 to 9/30/13 | 11.12 | 0.49 | (0.28 | ) | 0.21 | (0.47 | ) | (0.12 | ) | — | (0.59 | ) | (0.38 | ) | 10.74 | 1.83 | 7,603 | 1.85 | 1.85 | 4.39 | 77 | |||||||||||||||||||||||||||||||||||||||||||||||||||||||||||||
10/1/11 to 9/30/12 | 10.22 | 0.54 | 0.92 | 1.46 | (0.56 | ) | — | — | (0.56 | ) | 0.90 | 11.12 | 14.59 | 9,974 | 1.88 | 1.88 | 5.02 | 76 | ||||||||||||||||||||||||||||||||||||||||||||||||||||||||||||||||
10/1/10 to 9/30/11 | 10.75 | 0.58 | (0.47 | ) | 0.11 | (0.64 | ) | — | — | (0.64 | ) | (0.53 | ) | 10.22 | 0.82 | 10,685 | 1.91 | 1.91 | 5.31 | 45 | ||||||||||||||||||||||||||||||||||||||||||||||||||||||||||||||
Class C | ||||||||||||||||||||||||||||||||||||||||||||||||||||||||||||||||||||||||||||||||||
10/1/14 to 9/30/15 | $ | 10.79 | 0.42 | (0.85 | ) | (0.43 | ) | (0.33 | ) | (0.13 | ) | (0.05 | ) | (0.51 | ) | (0.94 | ) | $ | 9.85 | (4.11 | )% | $ | 84,099 | 1.85 | % | 1.85 | % | 4.06 | % | 66 | % | |||||||||||||||||||||||||||||||||||||||||||||||||||
10/1/13 to 9/30/14 | 10.86 | 0.47 | 0.10 | 0.57 | (0.44 | ) | (0.20 | ) | — | (0.64 | ) | (0.07 | ) | 10.79 | 5.33 | 96,072 | 1.86 | 1.86 | 4.25 | 54 | ||||||||||||||||||||||||||||||||||||||||||||||||||||||||||||||
10/1/12 to 9/30/13 | 11.23 | 0.49 | (0.27 | ) | 0.22 | (0.47 | ) | (0.12 | ) | — | (0.59 | ) | (0.37 | ) | 10.86 | 1.90 | 104,591 | 1.85 | 1.85 | 4.39 | 77 | |||||||||||||||||||||||||||||||||||||||||||||||||||||||||||||
10/1/11 to 9/30/12 | 10.31 | 0.54 | 0.94 | 1.48 | (0.56 | ) | — | — | (0.56 | ) | 0.92 | 11.23 | 14.65 | 108,595 | 1.88 | 1.88 | 4.98 | 76 | ||||||||||||||||||||||||||||||||||||||||||||||||||||||||||||||||
10/1/10 to 9/30/11 | 10.84 | 0.58 | (0.47 | ) | 0.11 | (0.64 | ) | — | — | (0.64 | ) | (0.53 | ) | 10.31 | 0.80 | 70,735 | 1.91 | 1.91 | 5.32 | 45 | ||||||||||||||||||||||||||||||||||||||||||||||||||||||||||||||
Class I | ||||||||||||||||||||||||||||||||||||||||||||||||||||||||||||||||||||||||||||||||||
10/1/14 to 9/30/15 | $ | 10.71 | 0.52 | (0.85 | ) | (0.33 | ) | (0.43 | ) | (0.13 | ) | (0.05 | ) | (0.61 | ) | (0.94 | ) | $ | 9.77 | (3.17 | )% | $ | 138,956 | 0.85 | % | 0.85 | % | 5.06 | % | 66 | % | |||||||||||||||||||||||||||||||||||||||||||||||||||
10/1/13 to 9/30/14 | 10.77 | 0.57 | 0.12 | 0.69 | (0.55 | ) | (0.20 | ) | — | (0.75 | ) | (0.06 | ) | 10.71 | 6.54 | 144,298 | 0.86 | 0.86 | 5.24 | 54 | ||||||||||||||||||||||||||||||||||||||||||||||||||||||||||||||
10/1/12 to 9/30/13 | 11.15 | 0.60 | (0.28 | ) | 0.32 | (0.58 | ) | (0.12 | ) | — | (0.70 | ) | (0.38 | ) | 10.77 | 2.85 | 86,387 | 0.85 | 0.85 | 5.38 | 77 | |||||||||||||||||||||||||||||||||||||||||||||||||||||||||||||
10/1/11 to 9/30/12 | 10.24 | 0.64 | 0.93 | 1.57 | (0.66 | ) | — | — | (0.66 | ) | 0.91 | 11.15 | 15.80 | 74,847 | 0.88 | 0.88 | 5.93 | 76 | ||||||||||||||||||||||||||||||||||||||||||||||||||||||||||||||||
10/1/10 to 9/30/11 | 10.76 | 0.69 | (0.46 | ) | 0.23 | (0.75 | ) | — | — | (0.75 | ) | (0.52 | ) | 10.24 | 1.93 | 22,408 | 0.91 | 0.91 | 6.32 | 45 | ||||||||||||||||||||||||||||||||||||||||||||||||||||||||||||||
Class R6 | ||||||||||||||||||||||||||||||||||||||||||||||||||||||||||||||||||||||||||||||||||
11/14/14(6) to 9/30/15 | $ | 10.67 | 0.46 | (0.81 | ) | (0.35 | ) | (0.37 | ) | (0.13 | ) | (0.05 | ) | (0.55 | ) | (0.90 | ) | $ | 9.77 | (3.31 | )%(4) | $ | 1,778 | 0.76 | % | 0.77 | %(3) | 5.12 | %(3) | 66 | % | |||||||||||||||||||||||||||||||||||||||||||||||||||
The footnote legend is at the end of the Financial Highlights.
See Notes to Financial Statements
72
Table of Contents
VIRTUS OPPORTUNITIES TRUST
FINANCIAL HIGHLIGHTS
SELECTED PER SHARE DATA AND RATIOS FOR A SHARE OUTSTANDING
THROUGHOUT EACH PERIOD
| Net Asset Value, Beginning of Period | Net Investment Income (Loss)(2) | Net Realized and Unrealized Gain (Loss) | Total from Investment Operations | Dividends from Net Investment Income | Distributions from Net Realized Gains | Total Return of Capital | Total Distributions | Payment from Affiliate | Change in Net Asset Value | Net Asset Value, End of Period | Total Return(1) | Net Assets, End of Period (in thousands) | Ratio of Net Expenses to Average Net Assets(8) | Ratio of Gross Expenses to Average Net Assets(8) | Ratio of Net Investment Income to Average Net Assets | Portfolio Turnover Rate | ||||||||||||||||||||||||||||||||||||||||||||||||||||||||||||||||||||||
| Senior Floating | |||||||||||||||||||||||||||||||||||||||||||||||||||||||||||||||||||||||||||||||||||||||
Rate Fund | |||||||||||||||||||||||||||||||||||||||||||||||||||||||||||||||||||||||||||||||||||||||
Class A | |||||||||||||||||||||||||||||||||||||||||||||||||||||||||||||||||||||||||||||||||||||||
10/1/14 to 9/30/15 | $ | 9.72 | 0.38 | (0.32 | ) | 0.06 | (0.39 | ) | (0.03 | ) | — | (0.42 | ) | — | (5) | (0.36 | ) | $ | 9.36 | 0.53 | % | $ | 268,596 | 1.20 | %(9) | 1.20 | % | 3.94 | % | 34 | % | ||||||||||||||||||||||||||||||||||||||||||||||||||||||||
10/1/13 to 9/30/14 | 9.79 | 0.37 | (0.07 | ) | 0.30 | (0.37 | ) | — | — | (0.37 | ) | — | (0.07 | ) | 9.72 | 3.08 | 294,617 | 1.18 | (9) | 1.18 | 3.79 | 77 | |||||||||||||||||||||||||||||||||||||||||||||||||||||||||||||||||
10/1/12 to 9/30/13 | 9.79 | 0.42 | 0.04 | 0.46 | (0.46 | ) | (— | )(5) | — | (0.46 | ) | — | — | 9.79 | 4.84 | 386,113 | 1.21 | (9) | 1.21 | 4.29 | 68 | ||||||||||||||||||||||||||||||||||||||||||||||||||||||||||||||||||
10/1/11 to 9/30/12 | 9.28 | 0.49 | 0.49 | 0.98 | (0.47 | ) | — | — | (0.47 | ) | — | 0.51 | 9.79 | 10.75 | 256,397 | 1.23 | (9) | 1.23 | 5.06 | 56 | |||||||||||||||||||||||||||||||||||||||||||||||||||||||||||||||||||
10/1/10 to 9/30/11 | 9.80 | 0.45 | (0.27 | ) | 0.18 | (0.49 | ) | (0.07 | ) | (0.14 | ) | (0.70 | ) | — | (0.52 | ) | 9.28 | 1.62 | 215,427 | 1.20 | (10) | 1.19 | 4.58 | 69 | |||||||||||||||||||||||||||||||||||||||||||||||||||||||||||||||
Class C | |||||||||||||||||||||||||||||||||||||||||||||||||||||||||||||||||||||||||||||||||||||||
10/1/14 to 9/30/15 | $ | 9.73 | 0.31 | (0.33 | ) | (0.02 | ) | (0.31 | ) | (0.03 | ) | — | (0.34 | ) | — | (5) | (0.36 | ) | $ | 9.37 | (0.22 | )% | $ | 138,478 | 1.95 | %(9) | 1.95 | % | 3.19 | % | 34 | % | |||||||||||||||||||||||||||||||||||||||||||||||||||||||
10/1/13 to 9/30/14 | 9.81 | 0.30 | (0.08 | ) | 0.22 | (0.30 | ) | — | — | (0.30 | ) | — | (0.08 | ) | 9.73 | 2.20 | 177,485 | 1.93 | (9) | 1.93 | 3.04 | 77 | |||||||||||||||||||||||||||||||||||||||||||||||||||||||||||||||||
10/1/12 to 9/30/13 | 9.80 | 0.35 | 0.05 | 0.40 | (0.39 | ) | (— | )(5) | — | (0.39 | ) | — | 0.01 | 9.81 | 4.15 | 182,667 | 1.96 | (9) | 1.96 | 3.51 | 68 | ||||||||||||||||||||||||||||||||||||||||||||||||||||||||||||||||||
10/1/11 to 9/30/12 | 9.29 | 0.41 | 0.50 | 0.91 | (0.40 | ) | — | — | (0.40 | ) | — | 0.51 | 9.80 | 9.92 | 95,078 | 1.98 | (9) | 1.98 | 4.31 | 56 | |||||||||||||||||||||||||||||||||||||||||||||||||||||||||||||||||||
10/1/10 to 9/30/11 | 9.81 | 0.36 | (0.26 | ) | 0.10 | (0.41 | ) | (0.07 | ) | (0.14 | ) | (0.62 | ) | — | (0.52 | ) | 9.29 | 0.85 | 92,623 | 1.95 | (10) | 1.94 | 3.69 | 69 | |||||||||||||||||||||||||||||||||||||||||||||||||||||||||||||||
Class I | |||||||||||||||||||||||||||||||||||||||||||||||||||||||||||||||||||||||||||||||||||||||
10/1/14 to 9/30/15 | $ | 9.71 | 0.40 | (0.32 | ) | 0.08 | (0.41 | ) | (0.03 | ) | — | (0.44 | ) | — | (5) | (0.36 | ) | $ | 9.35 | 0.78 | % | $ | 284,735 | 0.95 | %(9) | 0.95 | % | 4.20 | % | 34 | % | ||||||||||||||||||||||||||||||||||||||||||||||||||||||||
10/1/13 to 9/30/14 | 9.79 | 0.40 | (0.09 | ) | 0.31 | (0.39 | ) | — | — | (0.39 | ) | — | (0.08 | ) | 9.71 | 3.23 | 457,494 | 0.93 | (9) | 0.93 | 4.06 | 77 | |||||||||||||||||||||||||||||||||||||||||||||||||||||||||||||||||
10/1/12 to 9/30/13 | 9.78 | 0.43 | 0.07 | 0.50 | (0.49 | ) | (— | )(5) | — | (0.49 | ) | — | 0.01 | 9.79 | 5.21 | 381,791 | | 0.96 | (9) | 0.96 | 4.41 | 68 | |||||||||||||||||||||||||||||||||||||||||||||||||||||||||||||||||
10/1/11 to 9/30/12 | 9.27 | 0.51 | 0.49 | 1.00 | (0.49 | ) | — | — | (0.49 | ) | — | 0.51 | 9.78 | 11.04 | 94,193 | 0.98 | (9) | 0.98 | 5.31 | 56 | |||||||||||||||||||||||||||||||||||||||||||||||||||||||||||||||||||
10/1/10 to 9/30/11 | 9.80 | 0.46 | (0.27 | ) | 0.19 | (0.51 | ) | (0.07 | ) | (0.14 | ) | (0.72 | ) | — | (0.53 | ) | 9.27 | 1.78 | 71,584 | 0.95 | (10) | 0.93 | 4.67 | 69 | |||||||||||||||||||||||||||||||||||||||||||||||||||||||||||||||
Wealth Masters | |||||||||||||||||||||||||||||||||||||||||||||||||||||||||||||||||||||||||||||||||||||||
Fund | |||||||||||||||||||||||||||||||||||||||||||||||||||||||||||||||||||||||||||||||||||||||
Class A | |||||||||||||||||||||||||||||||||||||||||||||||||||||||||||||||||||||||||||||||||||||||
10/1/14 to 9/30/15 | $ | 14.50 | 0.05 | (0.98 | ) | (0.93 | ) | (0.05 | ) | (0.27 | ) | — | (0.32 | ) | — | (1.25 | ) | $ | 13.25 | (6.74 | )% | $ | 54,109 | 1.45 | % | 1.46 | % | 0.36 | % | 51 | % | ||||||||||||||||||||||||||||||||||||||||||||||||||||||||
10/1/13 to 9/30/14 | 13.12 | 0.02 | 1.37 | 1.39 | — | (0.01 | ) | — | (0.01 | ) | — | 1.38 | 14.50 | 10.67 | 55,881 | 1.45 | 1.46 | 0.11 | 62 | ||||||||||||||||||||||||||||||||||||||||||||||||||||||||||||||||||||
10/1/12 to 9/30/13 | 10.22 | (0.01 | ) | 3.05 | 3.04 | (0.09 | ) | (0.05 | ) | — | (0.14 | ) | — | 2.90 | 13.12 | 30.09 | 5,169 | 1.45 | 3.29 | (0.10 | ) | 22 | |||||||||||||||||||||||||||||||||||||||||||||||||||||||||||||||||
9/5/12(6) to 9/30/12 | 10.00 | 0.01 | 0.21 | 0.22 | — | — | — | — | — | 0.22 | 10.22 | 2.20 | (4) | 106 | 1.45 | (3) | 44.72 | (3) | 0.78 | (3) | 26 | (4) | |||||||||||||||||||||||||||||||||||||||||||||||||||||||||||||||||
Class C | |||||||||||||||||||||||||||||||||||||||||||||||||||||||||||||||||||||||||||||||||||||||
10/1/14 to 9/30/15 | $ | 14.32 | (0.06 | ) | (0.97 | ) | (1.03 | ) | — | (0.27 | ) | — | (0.27 | ) | — | (1.30 | ) | $ | 13.02 | (7.41 | )% | $ | 34,171 | 2.20 | % | 2.21 | % | (0.39 | )% | 51 | % | ||||||||||||||||||||||||||||||||||||||||||||||||||||||||
10/1/13 to 9/30/14 | 13.04 | (0.09 | ) | 1.38 | 1.29 | — | (0.01 | ) | — | (0.01 | ) | — | 1.28 | 14.32 | 9.90 | 30,511 | 2.20 | 2.22 | (0.65 | ) | 62 | ||||||||||||||||||||||||||||||||||||||||||||||||||||||||||||||||||
10/1/12 to 9/30/13 | 10.21 | (0.08 | ) | 3.03 | 2.95 | (0.07 | ) | (0.05 | ) | — | (0.12 | ) | — | 2.83 | 13.04 | 29.11 | 1,742 | 2.20 | 4.41 | (0.66 | ) | 22 | |||||||||||||||||||||||||||||||||||||||||||||||||||||||||||||||||
9/5/12(6) to 9/30/12 | 10.00 | (— | )(5) | 0.21 | 0.21 | — | — | — | — | — | 0.21 | 10.21 | 2.10 | (4) | 107 | 2.20 | (3) | 45.67 | (3) | 0.04 | (3) | 26 | (4) | ||||||||||||||||||||||||||||||||||||||||||||||||||||||||||||||||
Class I | |||||||||||||||||||||||||||||||||||||||||||||||||||||||||||||||||||||||||||||||||||||||
10/1/14 to 9/30/15 | $ | 14.56 | 0.09 | (1.00 | ) | (0.91 | ) | (0.08 | ) | (0.27 | ) | — | (0.35 | ) | — | (1.26 | ) | $ | 13.30 | (6.53 | )% | $ | 32,495 | 1.20 | % | 1.21 | % | 0.62 | % | 51 | % | ||||||||||||||||||||||||||||||||||||||||||||||||||||||||
10/1/13 to 9/30/14 | 13.14 | 0.05 | 1.39 | 1.44 | (0.01 | ) | (0.01 | ) | — | (0.02 | ) | — | 1.42 | 14.56 | 10.96 | 48,918 | 1.20 | 1.20 | 0.33 | 62 | |||||||||||||||||||||||||||||||||||||||||||||||||||||||||||||||||||
10/1/12 to 9/30/13 | 10.22 | 0.06 | 3.01 | 3.07 | (0.10 | ) | (0.05 | ) | — | (0.15 | ) | — | 2.92 | 13.14 | 30.37 | 44,813 | 1.20 | 4.64 | 0.52 | 22 | |||||||||||||||||||||||||||||||||||||||||||||||||||||||||||||||||||
9/5/12(6) to 9/30/12 | 10.00 | 0.01 | 0.21 | 0.22 | — | — | — | — | — | 0.22 | 10.22 | 2.20 | (4) | 818 | 1.20 | (3) | 44.40 | (3) | 1.04 | (3) | 26 | (4) | |||||||||||||||||||||||||||||||||||||||||||||||||||||||||||||||||
The footnote legend is at the end of the Financial Highlights.
See Notes to Financial Statements
73
Table of Contents
VIRTUS OPPORTUNITIES TRUST
FINANCIAL HIGHLIGHTS
SELECTED PER SHARE DATA AND RATIOS FOR A SHARE OUTSTANDING
THROUGHOUT EACH PERIOD
Footnote Legend
| (1) | Sales charges, where applicable, are not reflected in the total return calculation. |
| (2) | Computed using average shares outstanding. |
| (3) | Annualized. |
| (4) | Not annualized. |
| (5) | Amount is less than $0.005 per share. |
| (6) | Inception date. |
| (7) | Due to a change in expense ratio, the ratio shown is a blended expense ratio. |
| (8) | The Funds will also indirectly bear their prorated share of expenses of the underlying funds in which they invest. Such expenses are not included in the calculation of this ratio. |
| (9) | The Fund is currently under its expense limitation. |
| (10) | See Note 4D in the Notes to Financial Statements for information on recapture of expenses previously waived. |
See Notes to Financial Statements
74
Table of Contents
VIRTUS OPPORTUNITIES TRUST
SEPTEMBER 30, 2015
| Note 1. Organization |
Virtus Opportunities Trust (the “Trust”) is organized as a Delaware statutory trust and is registered under the Investment Company Act of 1940, as amended (“1940 Act”), as an open-end management investment company.
As of the date of this report, 32 funds of the Trust are offered for sale, of which eight (each a “Fund”) are reported in this annual report.
The Fund’s investment objective is outlined in each Fund’s Summary page.
| There | is no guarantee that a Fund will achieve its objective. |
All of the Funds offer Class A shares and Class C shares with the exception of the CA Tax-Exempt Bond Fund which does not offer Class C shares. All of the Funds offer Class I shares. Class B shares are no longer available for purchase by new or existing shareholders, except for existing shareholders through Qualifying Transactions. For information regarding Qualifying Transactions, refer to each Fund’s prospectus. The Multi-Sector Intermediate Bond Fund also offers Class R6 shares.
Class A shares of the CA Tax-Exempt Bond Fund and Senior Floating Rate Fund are sold with a front-end sales charge of up to 2.75% with some exceptions. Class A shares of the Bond Fund, High Yield Fund, and Multi-Sector Intermediate Bond Fund are sold with a front-end sales charge of up to 3.75% with some exceptions. Class A shares of the Essential Resources, Low Volatility Equity and Wealth Masters Funds are sold with a front-end sales charge of up to 5.75% with some exceptions. Generally, Class A shares are not subject to any charges by the Funds when redeemed; however, a 0.50% – 1% contingent deferred sales charge (“CDSC”) may be imposed on certain redemptions made within a certain period following purchases on which a finder’s fee has been paid. The period for which such CDSC applies for the Funds is 18 months. The CDSC period begins on the last day of the month preceding the month in which the purchase was made.
Class B shares were generally sold with a CDSC, which declines from 5% to zero depending on the period of time the shares are held. Class C shares are generally sold with a 1% CDSC, applicable if redeemed within one year of purchase. Class R6 and Class I shares are sold without a front-end sales charge or CDSC.
Class R6 shares are only available to participants in employer-sponsored retirement plans, such as 401(k) plans, profit-sharing plans, defined benefit plans and other employer-directed plans. Class R6 shares do not carry sales commissions or pay Rule 12b-1 fees.
Virtus Mutual Funds may impose an annual fee on accounts having balances of less than $2,500. The small account fee may be waived in certain circumstances, as disclosed in the prospectuses and/or statements of additional information. The fees collected will be used to offset certain expenses of the Funds.
Each Class of shares has identical voting, dividend, liquidation and other rights and the same terms and conditions, except that each Class bears different distribution and/or service fees under a Board-approved Rule 12b-1 and/or shareholder servicing plan (“12b-1 plan”) and has exclusive voting rights with respect to such plans. Class I shares and Class R6 shares are not subject to a 12b-1 plan. Income and other expenses as well as realized and unrealized gains and losses of each Fund are borne pro rata by the holders of each class of shares.
| Note 2. Significant Accounting Policies |
The significant accounting policies consistently followed by the Trust in the preparation of its financial statements are summarized below and for derivatives, included in Note 3 below. The preparation of financial statements in conformity with accounting principles generally accepted in the United States of America requires management to make estimates and assumptions that affect the reported amounts of assets and liabilities, and disclosure of contingent assets and liabilities at the date of the financial statements and the reported amounts of increases and decreases in net assets from operations during the reporting period. Actual results could differ from those estimates and those differences could be significant.
| A. | Security Valuation |
Security valuation procedures for each Fund, which include nightly price variance as well as back-testing such as bi-weekly unchanged price, monthly secondary source and transaction analysis, have been approved by the Board of Trustees (the “Board”, or the “Trustees”). All internally fair valued securities are approved by a valuation committee (the “Valuation Committee”) appointed by the Board. The Valuation Committee is comprised of certain members of management as identified to the Board and convenes independently from portfolio management. All internally fair valued securities, referred to below, are updated daily and reviewed in detail by the Valuation Committee monthly unless changes occur within the period. The Valuation Committee reviews the validity of the model inputs and any changes to the model. Quarterly fair valuations are reviewed by the Board.
Each Fund utilizes a fair value hierarchy which prioritizes the inputs to valuation techniques used to measure fair value into three broad levels. The Funds’ policy is to recognize transfers between levels at the end of the reporting period.
| • Level 1 – | quoted prices in active markets for identical securities (security types generally include listed equities). |
| • Level 2 – | prices determined using other significant observable inputs (including quoted prices for similar securities, interest rates, prepayment speeds, credit risk, etc.). |
| • Level 3 – | prices determined using significant unobservable inputs (including the Valuation Committee’s own assumptions in determining the fair value of investments). |
A description of the valuation techniques applied to a Fund’s major categories of assets and liabilities measured at fair value on a recurring basis is as follows:
Equity securities are valued at the official closing price (typically last sale) on the exchange on which the securities are primarily traded or, if no closing price is available, at the last bid price and are categorized as Level 1 in the hierarchy. Restricted equity securities and private placements that are not widely traded, are illiquid, or are internally fair valued by the Valuation Committee, are generally categorized as Level 3 in the hierarchy.
75
Table of Contents
VIRTUS OPPORTUNITIES TRUST
NOTES TO FINANCIAL STATEMENTS (Continued)
SEPTEMBER 30, 2015
Certain non-U.S. securities may be fair valued in cases where closing prices are not readily available or are deemed not reflective of readily available market prices. For example, significant events (such as movement in the U.S. securities market, or other regional and local developments) may occur between the time that non-U.S. markets close (where the security is principally traded) and the time that a Fund calculates its net asset value (“NAV”) (at the close of regular trading on the New York Stock Exchange (“NYSE”), generally 4 p.m. Eastern time) that may impact the value of securities traded in these non-U.S. markets. In such cases the Fund fair values non-U.S. securities using an independent pricing service which considers the correlation of the trading patterns of the non-U.S. security to the intraday trading in the U.S. markets for investments such as ADRs, financial futures, ETFs, and certain indexes, as well as prices for similar securities. Such fair valuations are categorized as Level 2 in the hierarchy. Because the frequency of significant events is not predictable, fair valuation of certain non-U.S. common stocks may occur on a frequent basis.
Debt securities, including restricted securities, are valued based on evaluated quotations received from independent pricing services or from dealers who make markets in such securities. For most bond types, the pricing service utilizes matrix pricing that considers one or more of the following factors: yield or price of bonds of comparable quality, coupon, maturity, current cash flows, type, and current day trade information, as well as dealer-supplied prices. These valuations are generally categorized as Level 2 in the hierarchy. Structured debt instruments such as mortgage-backed and asset-backed securities may also incorporate collateral analysis and utilize cash flow models for valuation and are generally categorized as Level 2 in the hierarchy. Pricing services do not provide pricing for all securities and therefore indicative bids from dealers are utilized which are based on pricing models used by market makers in the security and are generally categorized as Level 2 in the hierarchy. Debt securities that are not widely traded, are illiquid, or are internally fair valued by the Valuation Committee, are generally categorized as Level 3 in the hierarchy.
Listed derivatives, such as treasury futures, that are actively traded are valued based on quoted prices from the exchange and are categorized as Level 1 in the hierarchy. Over-the-counter derivative contracts, which include forward currency contracts and equity-linked instruments, do not require material subjectivity as pricing inputs are observed from actively quoted markets and are categorized as Level 2 in the hierarchy.
Investments in open-end mutual funds are valued at NAV. Investments in closed-end funds are valued as of the close of regular trading on the NYSE each business day. Both are categorized as Level 1 in the hierarchy.
A summary of the inputs used to value a Fund’s net assets by each major security type is disclosed at the end of the Schedule of Investments for each Fund. The inputs or methodologies used for valuing securities are not necessarily an indication of the risk associated with investing in those securities.
The significant unobservable inputs used in the fair value measurement of these corporate bonds are based on comparable liquid assets adjusted for accretion/amortization rate, current yield, current swap rates, and discount rates related to differences in capital structure and liquidity. Significant changes in any of these inputs in isolation would result in a significantly lower or higher fair value measurement. Generally, a change in the observable market assumptions would have direct impacts to the discount rates used related to capital structure and/or liquidity discounts.
| B. | Security Transactions and Investment Income |
Security transactions are recorded on the trade date. Realized gains and losses from sales of securities are determined on the identified cost basis. Dividend income is recognized on the ex-dividend date or, in the case of certain foreign securities, as soon as a Fund is notified. Interest income is recorded on the accrual basis. Each Fund amortizes premiums and accretes discounts using the effective interest method. Any distributions from underlying funds are recorded in accordance with the character of the distributions as designated by the underlying funds.
Dividend income from REIT investments is recorded using management’s estimate of the income included in distributions received from the REIT investments. Distributions received in excess of this estimated amount are recorded as a reduction of the cost of investments or reclassified to capital gains. The actual amounts of income, return of capital, and capital gains are only determined by each REIT after its fiscal year-end, and may differ from the estimated amounts.
| C. | Income Taxes |
Each Fund is treated as a separate taxable entity. It is the intention of each Fund to comply with the requirements of Subchapter M of the Internal Revenue Code and to distribute substantially all of its taxable income to its shareholders. Therefore, no provision for federal income taxes or excise taxes has been made.
Certain Funds may be subject to foreign taxes on income, gains on investments or currency repatriation, a portion of which may be recoverable. Each Fund will accrue such taxes and recoveries as applicable based upon current interpretations of the tax rules and regulations that exist in the markets in which it invests.
Management of the Funds has concluded that there are no significant uncertain tax positions that would require recognition in the financial statements. As of September 30, 2015, the tax years that remain subject to examination by the major tax jurisdictions under the statute of limitations are from the year 2012 forward (with limited exceptions).
| D. | Distributions to Shareholders |
Distributions are recorded by each Fund on the ex-dividend date. For the Bond Fund, CA Tax-Exempt Fund, High Yield Fund, Multi-Sector Intermediate Bond Fund and Senior Floating Rate Fund income distributions are declared and recorded daily and distributed monthly. Income and capital gain distributions are determined in accordance with income tax regulations that may differ from accounting principles generally accepted in the United States of America. These differences may include the treatment of non-taxable dividends, market premium and discount, non-deductible expenses, expiring capital loss carryovers, foreign currency gain or loss, gain or loss on futures contracts, partnerships, operating losses and losses deferred due to wash sales. Permanent book and tax basis differences relating to shareholder distributions will result in reclassifications to capital paid in on shares of beneficial interest.
76
Table of Contents
VIRTUS OPPORTUNITIES TRUST
NOTES TO FINANCIAL STATEMENTS (Continued)
SEPTEMBER 30, 2015
| E. | Expenses |
Expenses incurred together by a Fund and other affiliated mutual funds are allocated in proportion to the net assets of each such fund, except where allocation of direct expense to each fund or an alternative allocation method can be more appropriately used.
In addition to the net annual operating expenses that a Fund bears directly, the shareholders of a Fund indirectly bear the pro rata expenses of the underlying mutual funds in which the Fund invests.
| F. | Foreign Currency Translation |
Non-U.S. investment securities and other assets and liabilities denominated in foreign currencies are translated into U.S. dollar amounts at the foreign currency exchange rate effective at the end of the reporting period. Cost of investments is translated at the currency exchange rate effective at the trade date. The gain or loss resulting from a change in currency exchange rates between the trade and settlement date of a portfolio transaction is treated as a gain or loss on foreign currency. Likewise, the gain or loss resulting from a change in currency exchange rates between the date income is accrued and the date it is paid is treated as a gain or loss on foreign currency. The Funds do not isolate that portion of the results of operations arising from changes in foreign exchange rates on investments from the fluctuations arising from changes in the market prices of securities held. Such fluctuations are included with the net realized and unrealized gain or loss on investments.
| G. | When-issued Purchases and Forward Commitments (Delayed Delivery) |
Certain Funds may engage in when-issued or forward commitment transactions. Securities purchased on a when-issued or forward commitment basis are also known as delayed delivery transactions. Delayed delivery transactions involve a commitment by a Fund to purchase or sell a security at a future date (ordinarily up to 90 days later). When-issued or forward commitments enable a Fund to lock in what is believed to be an attractive price or yield on a particular security for a period of time, regardless of future changes in interest rates. Each Fund records when-issued and delayed delivery securities on the trade date. Each Fund maintains collateral for the securities purchased. Securities purchased on a when-issued or delayed delivery basis begin earning interest on the settlement date.
| H. | Loan Agreements |
Certain Funds may invest in direct debt instruments which are interests in amounts owed by a corporate, governmental, or other borrower to lenders or lending syndicates. Loan agreements are generally non-investment grade and often involve borrowers that are highly leveraged. The Funds may invest in obligations of borrowers who are in bankruptcy proceedings. Loan agreements are typically senior in the corporate capital structure of the borrower. A loan is often administered by a bank or other financial institution (the “lender”) that acts as agent for all holders. The agent administers the terms of the loan, as specified in the loan agreement. A Fund’s investments in loans may be in the form of participations in loans or assignments of all or a portion of loans from third parties. When investing in loan participations, a Fund has the right to receive payments of principal, interest and any fees to which it is entitled only from the lender selling the loan participation and only upon receipt by the lender of payments from the borrower. A Fund generally has no right to enforce compliance with the terms of the loan agreement with the borrower. As a result, a Fund may be subject to the credit risk of both the borrower and the lender that is selling the loan agreement. When a Fund purchases assignments from lenders it acquires direct rights against the borrower on the loan.
A Fund may invest in multiple series or tranches of a loan, which may have varying terms and carry different associated risks. Loan agreements may involve foreign borrowers, and investments may be denominated in foreign currencies. Direct indebtedness of emerging countries involves a risk that the government entities responsible for the repayment of the debt may be unable, or unwilling, to pay the principal and interest when due.
The loan agreements have floating rate loan interests which generally pay interest at rates that are periodically determined by reference to a base lending rate plus a premium. The base lending rates are generally LIBOR (London Interbank Offered Rate), the prime rate offered by one or more U.S. banks or the certificate of deposit rate. When a loan agreement is purchased a Fund may pay an assignment fee. On an ongoing basis, a Fund may receive a commitment fee based on the undrawn portion of the underlying line of credit portion of a loan agreement. Prepayment penalty fees are received upon the prepayment of a loan agreement by a borrower. Prepayment penalty, facility, commitment, consent and amendment fees are recorded to income as earned or paid.
At September 30, 2015, all loan agreements held by the Funds are assignment loans.
| I. | Securities Lending |
($ reported in thousands)
Certain Funds may loan securities to qualified brokers through an agreement with Brown Brothers Harriman (“BBH”), as a third party lending agent. Under the terms of agreement, a Fund doing so is required to maintain collateral with a market value not less than 100% of the market value of loaned securities. Collateral is adjusted daily in connection with changes in the market value of securities on loan. Collateral may consist of cash and securities issued by the U.S. Government or its agencies. Cash collateral is invested in a short-term money market fund. Dividends earned on the collateral and premiums paid by the broker are recorded as income by a Fund net of fees and rebates charged by BBH for its services as securities lending agent and in connection with this securities lending program. Lending portfolio securities involves a risk of delay in the recovery of the loaned securities or in the declining value of the collateral.
At September 30, 2015, the Wealth Masters Fund had securities on loan with a market value of $6,889 and cash collateral of $6,922.
| Note | 3. Derivative Financial Instruments and Transactions |
($ reported in thousands)
Disclosures about derivative instruments and hedging activities are intended to enable investors to understand how and why a Fund uses derivatives, how derivatives are accounted for, and how derivative instruments affect a fund’s results of operations and financial position. Summarized below are such disclosures and accounting policies for each specific type of derivative instrument used by certain Funds.
77
Table of Contents
VIRTUS OPPORTUNITIES TRUST
NOTES TO FINANCIAL STATEMENTS (Continued)
SEPTEMBER 30, 2015
| A. | Options contracts |
An options contract provides the purchaser with the right, but not the obligation, to buy (call option) or sell (put option) a financial instrument at an agreed upon price. Certain Funds may purchase or write both put and call options on portfolio securities. The Fund is subject to equity price risk in the normal course of pursuing its investment objectives. The Fund uses options contracts to hedge against changes in the values of equities.
When a Fund purchases an option, it pays a premium and an amount equal to that premium is recorded as an asset. When a Fund writes an option, it receives a premium and an amount equal to that premium is recorded as a liability. The asset or liability is adjusted daily to reflect the current market value of the option. Holdings of the Fund designated to cover outstanding written options are noted in the Schedules of Investments. Purchased options are reported as an asset within “Investment securities at value” in the Statement of Assets and Liabilities. Options written are reported as a liability within “Written options outstanding at value”. Changes in value of the purchased option is included in “Net change in unrealized appreciation/(depreciation) on investments” in the Statement of Operations. Changes in value of written options is included in “Net change in unrealized appreciation/(depreciation) on written options”.
If an option expires unexercised, the Fund realizes a gain or loss to the extent of the premium received or paid. If an option is exercised, the premium received or paid is recorded as an adjustment to the proceeds from the sale or the cost basis of the purchase. The difference between the premium and the amount received or paid on affecting a closing purchase or sale transaction is also treated as a realized gain or loss. Gain or loss on purchased options is included in “Net realized gain/(loss) on investments” in the Statement of Operations. Gain or loss on written options is presented separately as “Net realized gain/(loss) on written options” in the Statement of Operations.
The risk in writing call options is that the Fund gives up the opportunity for profit if the market price of the security increases and the option is exercised. The risk in writing put options is that the Fund may incur a loss if the market price of the security decreases and the option is exercised. The risk in buying options is that the Fund pays a premium whether or not the option is exercised. The use of such instruments may involve certain additional risks as a result of unanticipated movements in the market. Writers (sellers) of options are subject to unlimited risk of loss, as the seller will be obligated to deliver or take delivery of the security at a predetermined price which may, upon exercise of the option, be significantly different from the then-market value.
The Low Volatility Equity Fund invested in writing index call options and buying call options on VIX futures. Both are used as techniques for limiting the volatility of the Fund’s portfolio.
The Fund had transactions in written call options for the period ended September 30, 2015 as follows:
Written call options | Number of | Premium | ||||||
Written Options outstanding at September 30, 2014 | 11 | $ | 1 | |||||
Options written | 337 | 200 | ||||||
Options closed | (323 | ) | (109 | ) | ||||
Options expired | — | — | ||||||
Options exercised | — | — | ||||||
|
|
|
| |||||
Written Options outstanding at September 30, 2015 | 25 | $ | 92 | |||||
|
|
|
| |||||
The following is a summary of the Fund’s option contracts which have a primary risk exposure to equity contracts as of September 30, 2015:
Statements of Assets and Liabilities | ||||
Assets: Purchased call options at value | $ | 15 | (1) | |
Liabilities: Written options | (39 | ) | ||
|
| |||
Net asset (liability) balance | $ | (24 | ) | |
|
| |||
Statements of Operations | ||||
| Net realized gain (loss) on purchased options | $ | 53 | (2) | |
Net realized gain (loss) on written options | 20 | |||
Net change in unrealized appreciation (depreciation) on purchased options | (2 | )(3) | ||
Net change in unrealized appreciation (depreciation) on written options | 52 | |||
|
| |||
Total realized and unrealized gain (loss) on purchased and written options | $ | 123 | ||
|
| |||
| (1) | Amount included in Investment in unaffiliated securities at value. |
| (2) | Amount included in Net realized gain (loss) on unaffiliated investments. |
| (3) | Amount included in net change in unrealized appreciation (depreciation) on unaffiliated investments. |
For the period ended September 30, 2015, the average daily premiums paid by the Fund for purchased call options were $9, and the average daily premiums received for written call options by the Fund were $(8).
| Note 4. Investment | Advisory Fees and Related Party Transactions |
($ reported in thousands except as noted)
| A. | Adviser |
Virtus Investment Advisers, Inc. (the “Adviser”), an indirect wholly-owned subsidiary of Virtus Investment Partners, Inc. (“Virtus”), is the adviser to the Trust. The Adviser manages the Funds’ investment programs and general operations of the Funds, including oversight of the Funds’ subadvisers.
78
Table of Contents
VIRTUS OPPORTUNITIES TRUST
NOTES TO FINANCIAL STATEMENTS (Continued)
SEPTEMBER 30, 2015
As compensation for its services to the Funds, the Adviser is entitled to a fee based upon the following annual rates as a percentage of the average daily net assets of each Fund:
Essential Resources Fund | 1.10 | % |
| First $1 Billion | $1+ Billion | |||||||
Bond Fund | 0.45 | % | 0.40 | % | ||||
Wealth Masters Fund | 0.85 | 0.80 | ||||||
| First $1 Billion | $1+ Billion through $2 Billion | $2+ Billion | ||||||||||
CA Tax-Exempt Bond Fund | 0.45 | % | 0.40 | % | 0.35 | % | ||||||
High Yield Fund | 0.65 | 0.60 | 0.55 | |||||||||
Multi-Sector Intermediate Bond Fund | 0.55 | 0.50 | 0.45 | |||||||||
Senior Floating Rate Fund | �� | 0.60 | 0.55 | 0.50 | ||||||||
| First $2 Billion | $2+ Billion through $4 Billion | $4+ Billion | ||||||||||
Low Volatility Equity Fund | 0.95 | % | 0.90 | % | 0.85 | % | ||||||
During the period covered by these financial statements, the Bond Fund, High Yield Fund, Multi-Sector Intermediate Fund, and the Senior Floating Rate Fund invested a portion of its assets in Virtus Credit Opportunities Fund, an affiliated mutual fund. In order to avoid any duplication of advisory fees, the Adviser has voluntarily waived its advisory fees in an amount equal to that which would otherwise be paid by the Fund on the assets invested in the Credit Opportunities Fund. For the period covered by these financial statements, the waiver amounted to $2, $2, $16, and $14, respectively. These waivers are in addition to the expense limitation and/or fee waiver covered elsewhere in these financial statements and are included in the Statements of Operations in “expenses reimbursed and/or waived by the investment adviser”.
| B. | Subadvisers |
The subadvisers manage the investments of each Fund for which they are paid a fee by the Adviser. The subadvisers and the Fund(s) they serve are as follows:
Fund | Subadviser | Fund | Subadviser | |||
| Bond Fund | NF(1) | Low Volatility Equity Fund | Rampart(4) | |||
| CA Tax-Exempt Bond Fund | NF(1) | Multi-Sector Intermediate Bond Fund | NF(1) | |||
| Essential Resources Fund | KBI(3) | Senior Floating Rate Fund | NF(1) | |||
High Yield Fund | NF(1) | Wealth Masters Fund | Horizon(2) |
| (1) | Newfleet Asset Management, LLC, an indirect wholly-owned subsidiary of Virtus (“NF”) |
| (2) | Horizon Asset Management, LLC (“Horizon”) |
| (3) | Kleinwort Benson Investors International, Ltd. (“KBI”) |
| (4) | Rampart Investment Management Company, LLC (“Rampart”) |
| C. | Expense Limits and Fee Waivers |
Effective September 1, 2015, the Adviser has contractually agreed to limit certain Funds’ total operating expenses (excluding dividend and interest expenses, taxes, brokerage commissions, extraordinary expenses and acquired fund fees and expenses), so that such expenses do not exceed the percentages of the Fund’s average daily net asset values as listed below. For the period of October 1, 2014 through August 31, 2015, for all the Funds except for Essential Resources the waiver was voluntary.
| Class A | Class B | Class C | Class I | Through Date | ||||||||||||||||
Bond Fund | 0.85 | % | 1.60 | % | 1.60 | % | 0.60 | % | 1/31/17 | |||||||||||
CA Tax-Exempt Bond Fund | 0.85 | — | — | 0.60 | 1/31/17 | |||||||||||||||
Essential Resources Fund | 1.65 | — | 2.40 | 1.40 | 1/31/17 | |||||||||||||||
High Yield Fund | 1.15 | 1.90 | 1.90 | 0.90 | 1/31/17 | |||||||||||||||
Low Volatility Equity Fund | 1.55 | — | 2.30 | 1.30 | 1/31/17 | |||||||||||||||
Senior Floating Rate Fund(1) | 1.20 | — | 1.95 | 0.95 | 1/31/17 | |||||||||||||||
Wealth Masters Fund | 1.45 | — | 2.20 | 1.20 | 1/31/17 | |||||||||||||||
| (1) | Excluding leverage expenses, if any. |
| D. | Expense Recapture |
For certain Funds, the Adviser may recapture operating expenses waived or reimbursed under these arrangements within three fiscal years following the end of the fiscal year in which such waiver or reimbursement occurred. A Fund must pay its ordinary operating expenses before the Adviser is entitled to any reimbursement and must remain in compliance with any applicable expense limitations or, if none, the expense limitation in effect at the time of the waiver or reimbursement. All or a portion of the following Adviser reimbursed expenses may be recaptured as follows:
| Fiscal Year Ended | ||||||||||||||||
| 2016 | 2017 | 2018 | Total | |||||||||||||
Bond Fund | $ | 222 | $ | 197 | $ | 204 | $ | 623 | ||||||||
CA Tax-Exempt Bond Fund | 100 | 103 | 110 | 313 | ||||||||||||
Essential Resources Fund | — | — | 113 | 113 | ||||||||||||
High Yield Fund | 161 | 150 | 146 | 457 | ||||||||||||
Low Volatility Equity Fund | 29 | 81 | 55 | 165 | ||||||||||||
Wealth Masters Fund | 96 | 8 | 14 | 118 | ||||||||||||
79
Table of Contents
VIRTUS OPPORTUNITIES TRUST
NOTES TO FINANCIAL STATEMENTS (Continued)
SEPTEMBER 30, 2015
| E. | Distributor |
VP Distributors, LLC (“VP Distributors”), an indirect wholly-owned subsidiary of Virtus, serves as the distributor of each Fund’s shares and has advised the Funds that for the fiscal year (the “period”) ended September 30, 2015, it retained net commissions of $61 for Class A shares and deferred sales charges of $66, $— and $41 for Class A shares, Class B shares, and Class C shares respectively.
In addition, each Fund pays VP Distributors distribution and/or service fees under a 12b-1 plan as a percentage of the average daily net assets of each respective class at the annual rates of 0.25% for Class A shares, 1.00% for Class B shares and 1.00% for Class C shares; Class I shares and Class R6 shares are not subject to a 12b-1 plan.
Under certain circumstances, shares of certain Virtus Mutual Funds may be exchanged for shares of the same class of certain other Virtus Mutual Funds on the basis of the relative NAV per share at the time of the exchange. On exchanges with share classes that carry a CDSC, the CDSC schedule of the original shares purchased continues to apply.
| F. | Administrator and Transfer Agent |
Virtus Fund Services, LLC, an indirect wholly-owned subsidiary of Virtus, serves as the administrator and transfer agent to the Funds.
For the period ended September 30, 2015, the Funds incurred administration fees totaling $1,433 which are included in the Statements of Operations.
For the period ended September 30, 2015, the Funds incurred transfer agent fees totaling $1,583 which are included in the Statements of Operations. A portion of these fees are paid to outside entities that also provide services to the Trust.
| G. | Affiliated Shareholders |
At September 30, 2015, Virtus and its affiliates and the retirement plans of Virtus and its affiliates held shares of certain Funds which may be redeemed at any time that aggregated to the following:
| Shares | Aggregate Net Asset Value | |||||||
| Essential Resources Fund | ||||||||
Class A | 10,000 | $ | 80 | |||||
Class C | 10,000 | 80 | ||||||
Class I | 480,000 | 3,864 | ||||||
| Low Volatility Equity Fund | ||||||||
Class A | 10,112 | 116 | ||||||
Class C | 10,055 | 114 | ||||||
Class I | 131,671 | 1,514 | ||||||
| Multi-Sector Intermediate Bond Fund | ||||||||
Class R6 | 9,897 | 96 | ||||||
| Senior Floating Rate Fund | ||||||||
Class I | 1,300,941 | 12,164 | ||||||
| H. | Investments in Affiliates |
A summary of total long-term and short-term purchases and sales of the affiliated underlying fund, Virtus Credit Opportunities Fund during the period ended September 30, 2015 is as follows:
| Value, beginning of period | Purchases | Sales Proceeds | Value, end of period | Dividend Income | Distributions of Realized Gains | |||||||||||||||||||
Bond Fund | $ | — | $ | 1,170 | $ | — | $ | 1,143 | $ | 6 | $ | — | ||||||||||||
High Yield Fund | — | 1,050 | (684 | ) | 342 | 5 | — | |||||||||||||||||
Multi-Sector Intermediate Bond Fund | — | 9,270 | — | 9,058 | 45 | — | ||||||||||||||||||
Senior Floating Rate Fund | — | 7,677 | — | 7,502 | 37 | — | ||||||||||||||||||
| I. | Payment from Affiliate |
During the period the Adviser reimbursed certain funds for losses. These amounts are included in payments by affiliates in the Statements of Operations. There was no impact on the total return.
80
Table of Contents
VIRTUS OPPORTUNITIES TRUST
NOTES TO FINANCIAL STATEMENTS (Continued)
SEPTEMBER 30, 2015
| Note 5. Purchases and Sales of Securities |
($ reported in thousands)
Purchases and sales of securities (excluding U.S. Government and agency securities, short-term securities and written options) during the period ended September 30, 2015, were as follows:
| Purchases | Sales | |||||||
Bond Fund | $ | 29,996 | $ | 34,553 | ||||
CA Tax-Exempt Bond | 7,875 | 9,734 | ||||||
Essential Resources Fund | 7,179 | 2,199 | ||||||
High Yield Fund | 79,410 | 88,587 | ||||||
Low Volatility Equity Fund | 3,108 | 62 | ||||||
Multi-Sector Intermediate Bond Fund | 193,860 | 206,426 | ||||||
Senior Floating Rate Fund | 282,842 | 526,182 | ||||||
Wealth Masters Fund | 73,350 | 77,314 | ||||||
Purchases and sales of long term U.S. Government and agency securities for the Funds during the period ended September 30, 2015, were as follows:
| Purchases | Sales | |||||||
Bond Fund | $ | 19,517 | $ | 13,556 | ||||
High Yield Fund | 225 | 225 | ||||||
Multi-Sector Intermediate Bond Fund | 40,602 | 26,737 | ||||||
81
Table of Contents
VIRTUS OPPORTUNITIES TRUST
NOTES TO FINANCIAL STATEMENTS (Continued)
SEPTEMBER 30, 2015
| Note 6. Capital | Share Transactions |
(reported in thousands)
Transactions in shares of capital stock, during the periods ended as indicated below, were as follows:
| Bond Fund | CA Tax-Exempt Bond Fund | |||||||||||||||||||||||||||||||
| Year Ended September 30, 2015 | Year Ended September 30, 2014 | Year Ended September 30, 2015 | Year Ended September 30, 2014 | |||||||||||||||||||||||||||||
| SHARES | AMOUNT | SHARES | AMOUNT | SHARES | AMOUNT | SHARES | AMOUNT | |||||||||||||||||||||||||
| Class A | ||||||||||||||||||||||||||||||||
| Sale of shares | 248 | $ | 2,789 | 372 | $ | 4,261 | 245 | $ | 3,076 | 10 | $ | 118 | ||||||||||||||||||||
| Reinvestment of distributions | 128 | 1,443 | 158 | 1,810 | 95 | 1,156 | 73 | 880 | ||||||||||||||||||||||||
| Shares repurchased | (707 | ) | (7,970 | ) | (948 | ) | (10,852 | ) | (432 | ) | (5,262 | ) | (214 | ) | (2,620 | ) | ||||||||||||||||
|
|
|
|
|
|
|
|
|
|
|
|
|
|
|
| |||||||||||||||||
| Net Increase / (Decrease) | (331 | ) | $ | (3,738 | ) | (418 | ) | $ | (4,781 | ) | (92 | ) | $ | (1,030 | ) | (131 | ) | $ | (1,622 | ) | ||||||||||||
|
|
|
|
|
|
|
|
|
|
|
|
|
|
|
| |||||||||||||||||
| Class B | ||||||||||||||||||||||||||||||||
| Sale of shares | — | $ | — | (2) | — | $ | — | — | $ | — | — | $ | — | |||||||||||||||||||
| Reinvestment of distributions | — | (1) | 4 | 1 | 9 | — | — | — | — | |||||||||||||||||||||||
| Shares repurchased | (10 | ) | (106 | ) | (16 | ) | (184 | ) | — | — | — | — | ||||||||||||||||||||
|
|
|
|
|
|
|
|
|
|
|
|
|
|
|
| |||||||||||||||||
| Net Increase / (Decrease) | (10 | ) | $ | (102 | ) | (15 | ) | $ | (175 | ) | — | $ | — | — | $ | — | ||||||||||||||||
|
|
|
|
|
|
|
|
|
|
|
|
|
|
|
| |||||||||||||||||
| Class C | ||||||||||||||||||||||||||||||||
| Sale of shares | 1,066 | $ | 11,856 | 128 | $ | 1,442 | — | $ | — | — | $ | — | ||||||||||||||||||||
| Reinvestment of distributions | 17 | 190 | 16 | 179 | — | — | — | — | ||||||||||||||||||||||||
| Shares repurchased | (827 | ) | (9,164 | ) | (201 | ) | (2,241 | ) | — | — | — | — | ||||||||||||||||||||
|
|
|
|
|
|
|
|
|
|
|
|
|
|
|
| |||||||||||||||||
| Net Increase / (Decrease) | 256 | $ | 2,882 | (57 | ) | $ | (620 | ) | — | $ | — | — | $ | — | ||||||||||||||||||
|
|
|
|
|
|
|
|
|
|
|
|
|
|
|
| |||||||||||||||||
| Class I | ||||||||||||||||||||||||||||||||
| Sale of shares | 429 | $ | 4,917 | 298 | $ | 3,463 | 66 | $ | 807 | 101 | $ | 1,222 | ||||||||||||||||||||
| Reinvestment of distributions | 52 | 600 | 58 | 673 | 64 | 753 | 32 | 383 | ||||||||||||||||||||||||
| Shares repurchased | (342 | ) | (3,905 | ) | (874 | ) | (10,111 | ) | (133 | ) | (1,613 | ) | (1,367 | ) | (16,739 | ) | ||||||||||||||||
|
|
|
|
|
|
|
|
|
|
|
|
|
|
|
| |||||||||||||||||
| Net Increase / (Decrease) | 139 | $ | 1,612 | (518 | ) | $ | (5,975 | ) | (3 | ) | $ | (53 | ) | (1,234 | ) | $ | (15,134 | ) | ||||||||||||||
|
|
|
|
|
|
|
|
|
|
|
|
|
|
|
| |||||||||||||||||
| Essential Resources Fund | High Yield Fund | |||||||||||||||||||||||||||
| From Inception March 23, 2015 to September 30, 2015 | Year Ended September 30, 2015 | Year Ended September 30, 2014 | ||||||||||||||||||||||||||
| SHARES | AMOUNT | SHARES | AMOUNT | SHARES | AMOUNT | |||||||||||||||||||||||
Class A | ||||||||||||||||||||||||||||
Sale of shares | 10 | $ | 103 | 11,578 | $ | 49,167 | 2,906 | $ | 12,699 | |||||||||||||||||||
Reinvestment of distributions | — | — | 824 | 3,485 | 792 | 3,494 | ||||||||||||||||||||||
Shares repurchased | — | — | (13,440 | ) | (56,820 | ) | (6,129 | ) | (27,052 | ) | ||||||||||||||||||
|
|
|
|
|
|
|
|
|
|
|
| |||||||||||||||||
Net Increase / (Decrease) | 10 | $ | 103 | (1,038 | ) | $ | (4,168 | ) | (2,431 | ) | $ | (10,859 | ) | |||||||||||||||
|
|
|
|
|
|
|
|
|
|
|
| |||||||||||||||||
Class B | ||||||||||||||||||||||||||||
Sale of shares | — | $ | — | 1 | $ | 4 | — | $ | — | |||||||||||||||||||
Reinvestment of distributions | — | — | 1 | 3 | 1 | 5 | ||||||||||||||||||||||
Shares repurchased | — | — | (16 | ) | (66 | ) | (8 | ) | (33 | ) | ||||||||||||||||||
|
|
|
|
|
|
|
|
|
|
|
| |||||||||||||||||
Net Increase / (Decrease) | — | $ | — | (14 | ) | $ | (59 | ) | (7 | ) | $ | (28 | ) | |||||||||||||||
|
|
|
|
|
|
|
|
|
|
|
| |||||||||||||||||
Class C | ||||||||||||||||||||||||||||
Sale of shares | 13 | $ | 129 | 349 | $ | 1,452 | 374 | $ | 1,629 | |||||||||||||||||||
Reinvestment of distributions | — | — | 41 | 172 | 33 | 143 | ||||||||||||||||||||||
Shares repurchased | — | (1) | — | (2) | (388 | ) | (1,603 | ) | (249 | ) | (1,075 | ) | ||||||||||||||||
|
|
|
|
|
|
|
|
|
|
|
| |||||||||||||||||
Net Increase / (Decrease) | 13 | $ | 129 | 2 | $ | 21 | 158 | $ | 697 | |||||||||||||||||||
|
|
|
|
|
|
|
|
|
|
|
| |||||||||||||||||
Class I | ||||||||||||||||||||||||||||
Sale of shares | 485 | $ | 4,847 | 815 | $ | 3,498 | 190 | $ | 844 | |||||||||||||||||||
Reinvestment of distributions | — | — | 87 | 367 | 65 | 285 | ||||||||||||||||||||||
Shares repurchased | (2 | ) | (19 | ) | (1,148 | ) | (4,834 | ) | (208 | ) | (918 | ) | ||||||||||||||||
|
|
|
|
|
|
|
|
|
|
|
| |||||||||||||||||
Net Increase / (Decrease) | 483 | $ | 4,826 | (246 | ) | $ | (969 | ) | 47 | $ | 211 | |||||||||||||||||
|
|
|
|
|
|
|
|
|
|
|
| |||||||||||||||||
| (1) | Amount is less than 500. |
| (2) | Amount is less than $500. |
82
Table of Contents
VIRTUS OPPORTUNITIES TRUST
NOTES TO FINANCIAL STATEMENTS (Continued)
SEPTEMBER 30, 2015
| Low Volatility Equity Fund | Multi-Sector Intermediate Bond Fund | |||||||||||||||||||||||||||||||
| Year Ended September 30, 2015 | Year Ended September 30, 2014 | Year Ended September 30, 2015 | Year Ended September 30, 2014 | |||||||||||||||||||||||||||||
| SHARES | AMOUNT | SHARES | AMOUNT | SHARES | AMOUNT | SHARES | AMOUNT | |||||||||||||||||||||||||
| Class A | ||||||||||||||||||||||||||||||||
| Sale of shares | 171 | $ | 2,056 | 31 | $ | 355 | 2,970 | $ | 30,801 | 3,763 | $ | 40,776 | ||||||||||||||||||||
| Reinvestment of distributions | 1 | 7 | — | (1) | 1 | 565 | 5,794 | 908 | 9,799 | |||||||||||||||||||||||
| Shares repurchased | (34 | ) | (395 | ) | (3 | ) | (40 | ) | (3,956 | ) | (40,421 | ) | (10,641 | ) | (115,701 | ) | ||||||||||||||||
|
|
|
|
|
|
|
|
|
|
|
|
|
|
|
| |||||||||||||||||
| Net Increase / (Decrease) | 138 | $ | 1,668 | 28 | $ | 316 | (421 | ) | $ | (3,826 | ) | (5,970 | ) | $ | (65,126 | ) | ||||||||||||||||
|
|
|
|
|
|
|
|
|
|
|
|
|
|
|
| |||||||||||||||||
| Class B | ||||||||||||||||||||||||||||||||
| Sale of shares | — | $ | — | — | $ | — | 3 | $ | 36 | — | (1) | $ | 5 | |||||||||||||||||||
| Reinvestment of distributions | — | — | — | — | 19 | 196 | 35 | 372 | ||||||||||||||||||||||||
| Shares repurchased | — | — | — | — | (230 | ) | (2,365 | ) | (241 | ) | (2,601 | ) | ||||||||||||||||||||
|
|
|
|
|
|
|
|
|
|
|
|
|
|
|
| |||||||||||||||||
| Net Increase / (Decrease) | — | $ | — | — | $ | — | (208 | ) | $ | (2,133 | ) | (206 | ) | $ | (2,224 | ) | ||||||||||||||||
|
|
|
|
|
|
|
|
|
|
|
|
|
|
|
| |||||||||||||||||
| Class C | ||||||||||||||||||||||||||||||||
| Sale of shares | 140 | $ | 1,648 | 12 | $ | 137 | 2,225 | $ | 23,203 | 1,482 | $ | 16,227 | ||||||||||||||||||||
| Reinvestment of distributions | — | (1) | 2 | — | (1) | 1 | 337 | 3,489 | 388 | 4,218 | ||||||||||||||||||||||
| Shares repurchased | (39 | ) | (462 | ) | — | — | (2,927 | ) | (30,282 | ) | (2,602 | ) | (28,418 | ) | ||||||||||||||||||
|
|
|
|
|
|
|
|
|
|
|
|
|
|
|
| |||||||||||||||||
| Net Increase / (Decrease) | 101 | $ | 1,188 | 12 | $ | 138 | (365 | ) | $ | (3,590 | ) | (732 | ) | $ | (7,973 | ) | ||||||||||||||||
|
|
|
|
|
|
|
|
|
|
|
|
|
|
|
| |||||||||||||||||
| Class I | ||||||||||||||||||||||||||||||||
| Sale of shares | 6 | $ | 71 | — | $ | — | 7,369 | $ | 75,867 | 9,376 | $ | 102,122 | ||||||||||||||||||||
| Reinvestment of distributions | 1 | 6 | 1 | 13 | 657 | 6,736 | 411 | 4,444 | ||||||||||||||||||||||||
| Shares repurchased | — | — | — | — | (7,278 | ) | (74,560 | ) | (4,327 | ) | (46,859 | ) | ||||||||||||||||||||
|
|
|
|
|
|
|
|
|
|
|
|
|
|
|
| |||||||||||||||||
| Net Increase / (Decrease) | 7 | $ | 77 | 1 | $ | 13 | 748 | $ | 8,043 | 5,460 | $ | 59,707 | ||||||||||||||||||||
|
|
|
|
|
|
|
|
|
|
|
|
|
|
|
| |||||||||||||||||
| Class R6 | ||||||||||||||||||||||||||||||||
| Sale of shares | — | $ | — | — | $ | — | 183 | $ | 1,906 | — | $ | — | ||||||||||||||||||||
| Reinvestment of distributions | — | — | — | — | 5 | 40 | — | — | ||||||||||||||||||||||||
| Shares repurchased | — | — | — | — | (6 | ) | (61 | ) | — | — | ||||||||||||||||||||||
|
|
|
|
|
|
|
|
|
|
|
|
|
|
|
| |||||||||||||||||
| Net Increase / (Decrease) | — | $ | — | — | $ | — | 182 | $ | 1,885 | — | $ | — | ||||||||||||||||||||
|
|
|
|
|
|
|
|
|
|
|
|
|
|
|
| |||||||||||||||||
| Senior Floating Rate Fund | Wealth Masters Fund | |||||||||||||||||||||||||||||||
| Year Ended September 30, 2015 | Year Ended September 30, 2014 | Year Ended September 30, 2015 | Year Ended September 30, 2014 | |||||||||||||||||||||||||||||
| SHARES | AMOUNT | SHARES | AMOUNT | SHARES | AMOUNT | SHARES | AMOUNT | |||||||||||||||||||||||||
| Class A | ||||||||||||||||||||||||||||||||
| Sale of shares | 5,295 | $ | 51,097 | 20,351 | $ | 200,743 | 1,889 | $ | 28,329 | 4,607 | $ | 65,457 | ||||||||||||||||||||
| Reinvestment of distributions | 1,177 | 11,287 | 1,405 | 13,850 | 82 | 1,205 | 1 | 14 | ||||||||||||||||||||||||
| Shares repurchased | (8,090 | ) | (77,658 | ) | (30,864 | ) | (304,300 | ) | (1,740 | ) | (25,440 | ) | (1,149 | ) | (16,700 | ) | ||||||||||||||||
|
|
|
|
|
|
|
|
|
|
|
|
|
|
|
| |||||||||||||||||
| Net Increase / (Decrease) | (1,618 | ) | $ | (15,274 | ) | (9,108 | ) | $ | (89,707 | ) | 231 | $ | 4,094 | 3,459 | $ | 48,771 | ||||||||||||||||
|
|
|
|
|
|
|
|
|
|
|
|
|
|
|
| |||||||||||||||||
| Class C | ||||||||||||||||||||||||||||||||
| Sale of shares | 1,575 | $ | 15,160 | 4,222 | $ | 41,705 | 1,134 | $ | 16,676 | 2,113 | $ | 29,835 | ||||||||||||||||||||
| Reinvestment of distributions | 483 | 4,636 | 472 | 4,661 | 39 | 567 | — | (1) | 4 | |||||||||||||||||||||||
| Shares repurchased | (5,520 | ) | (53,095 | ) | (5,080 | ) | (50,109 | ) | (680 | ) | (9,890 | ) | (115 | ) | (1,639 | ) | ||||||||||||||||
|
|
|
|
|
|
|
|
|
|
|
|
|
|
|
| |||||||||||||||||
| Net Increase / (Decrease) | (3,462 | ) | $ | (33,299 | ) | (386 | ) | $ | (3,743 | ) | 493 | $ | 7,353 | 1,998 | $ | 28,200 | ||||||||||||||||
|
|
|
|
|
|
|
|
|
|
|
|
|
|
|
| |||||||||||||||||
| Class I | ||||||||||||||||||||||||||||||||
| Sale of shares | 9,564 | $ | 91,910 | 33,480 | $ | 329,745 | 1,346 | $ | 20,069 | 3,818 | $ | 54,849 | ||||||||||||||||||||
| Reinvestment of distributions | 1,206 | 11,564 | 1,248 | 11,990 | 74 | 1,097 | 5 | 73 | ||||||||||||||||||||||||
| Shares repurchased | (27,432 | ) | (263,127 | ) | (26,595 | ) | (261,835 | ) | (2,336 | ) | (33,811 | ) | (3,873 | ) | (55,434 | ) | ||||||||||||||||
|
|
|
|
|
|
|
|
|
|
|
|
|
|
|
| |||||||||||||||||
| Net Increase / (Decrease) | (16,662 | ) | $ | (159,653 | ) | 8,103 | $ | 79,900 | (916 | ) | $ | (12,645 | ) | (50 | ) | $ | (512 | ) | ||||||||||||||
|
|
|
|
|
|
|
|
|
|
|
|
|
|
|
| |||||||||||||||||
| (1) | Amount is less than 500. |
| (2) | Amount is less than $500. |
83
Table of Contents
VIRTUS OPPORTUNITIES TRUST
NOTES TO FINANCIAL STATEMENTS (Continued)
SEPTEMBER 30, 2015
| Note 7. 10% Shareholders |
As of September 30, 2015, certain Funds had individual shareholder account(s) and/or omnibus shareholder account(s) (comprised of a group of individual shareholders), which individually amounted to more than 10% of the total shares outstanding of each such Fund as detailed below:
| % of Shares Outstanding | Number of Accounts | |||||||
CA-Tax Exempt Bond Fund | 31 | % | 1 | |||||
Essential Resources Fund | 95 | 1 | * | |||||
Low Volatility Equity Fund | 71 | 3 | * | |||||
Multi-Sector Intermediate Bond Fund | 21 | 2 | ||||||
Senior Floating Rate Fund | 44 | �� | 3 | |||||
Wealth Masters Fund | 18 | 1 | ||||||
| * | Includes affiliated shareholder account(s) |
| Note 8. Credit Risk and Asset Concentration |
In countries with limited or developing markets, investments may present greater risks than in more developed markets and the prices of such investments may be volatile. The consequences of political, social or economic changes in these markets may have disruptive effects on the market prices of these investments and the income they generate, as well as a Fund’s ability to repatriate such amounts.
High-yield/high-risk securities typically entail greater price volatility and/or principal and interest rate risk. There is a greater chance that an issuer will not be able to make principal and interest payments on time. Analysis of the creditworthiness of issuers of high-yield/high-risk securities may be complex, and as a result, it may be more difficult for the Adviser and/or subadviser to accurately predict risk.
Many municipalities insure repayment for their obligations. Although bond insurance reduces the risk of loss due to default by an issuer, such bonds remain subject to the risk that the market may fluctuate for other reasons, and there is no assurance that the insurance company will meet its obligations. Insured securities have been identified in the Schedule of Investments. A real or perceived decline in creditworthiness of a bond insurer can have an adverse impact on the value of insured bonds held in the Funds.
Certain Funds may invest a high percentage of their assets in specific sectors of the market in the pursuit of their investment objectives. Fluctuations in these sectors of concentration may have a greater impact on a Fund, positive or negative, than if a Fund did not concentrate its investments in such sectors.
At September 30, 2015, the following Funds held securities issued by various companies in specific sectors or countries as detailed below:
Fund | Sector | Percentage of Total Investments | ||||
Essential Resources Fund | Industrials | 33 | % | |||
Senior Floating Rate Fund | Consumer Discretionary | 30 | ||||
Wealth Masters Fund | Consumer Discretionary | 34 | ||||
| Note 9. Indemnifications |
Under the Trust’s organizational documents, its Trustees and officers are indemnified against certain liabilities arising out of the performance of their duties to the Funds. Each Trustee has also entered into an indemnification agreement with the Trust. In addition, in the normal course of business, the Funds enter into contracts that provide a variety of indemnifications to other parties. The Funds’ maximum exposure under these arrangements is unknown as this would involve future claims that may be made against the Funds and that have not occurred. However, the Funds have not had prior claims or losses pursuant to these arrangements and expect the risk of loss to be remote.
| Note 10. Federal Income Tax Information |
($ reported in thousands)
At September 30, 2015, federal tax cost and aggregate gross unrealized appreciation (depreciation) of securities held by the Funds were as follows:
Fund | Federal Tax Cost | Unrealized Appreciation | Unrealized (Depreciation) | Net Unrealized Appreciation (Depreciation) | ||||||||||||
Bond Fund | $ | 74,842 | $ | 1,360 | $ | (1,993 | ) | $ | (633 | ) | ||||||
CA Tax-Exempt Bond Fund | 28,913 | 1,810 | (182 | ) | 1,628 | |||||||||||
Essential Resources Fund | 5,057 | 11 | (1,018 | ) | (1,007 | ) | ||||||||||
High Yield Fund | 72,625 | 361 | (4,943 | ) | (4,582 | ) | ||||||||||
Low Volatility Equity Fund Securities | 5,049 | 5 | — | 5 | ||||||||||||
Low Volatility Equity Fund Options | (39 | ) | — | — | — | |||||||||||
Multi-Sector Intermediate Bond Fund | 356,255 | 4,799 | (26,833 | ) | (22,034 | ) | ||||||||||
Senior Floating Rate Fund | 740,376 | 1,156 | (27,428 | ) | (26,272 | ) | ||||||||||
Wealth Masters Fund | 134,400 | 8,538 | (15,951 | ) | (7,413 | ) | ||||||||||
(1) Amount is less than $500
84
Table of Contents
VIRTUS OPPORTUNITIES TRUST
NOTES TO FINANCIAL STATEMENTS (Continued)
SEPTEMBER 30, 2015
Certain Funds have capital loss carryovers available to offset future realized capital gains, through the indicated expiration dates shown below:
| 2017 | 2018 | No Expiration | Total | |||||||||||||||||
| Short-Term | Long-Term | |||||||||||||||||||
Bond Fund | $ | 3,149 | $ | — | $ | 8 | $ | — | $ | 3,157 | ||||||||||
High Yield Fund | 13,758 | 9,151 | 7 | — | 22,916 | |||||||||||||||
Multi-Sector Intermediate Bond Fund | — | — | — | 114 | 114 | |||||||||||||||
Senior Floating Rate Fund | — | — | 129 | 68 | 197 | |||||||||||||||
The Trust may not realize the benefit of these losses to the extent each Fund does not realize gains on investments prior to the expiration of the capital loss carryovers.
Under the Regulated Investment Company Modernization Act of 2010 (the “Act”), net capital losses recognized for tax years beginning after December 22, 2010 may be carried forward indefinitely, and their character is retained as short-term and/or long-term losses. Previously, net capital losses were carried forward for eight years and treated as short-term losses. As a transition rule, the Act requires that post-enactment net capital losses be used before pre-enactment net capital losses.
For the Period ended September 30, 2015, the Low Volatility Equity Fund utilized losses of $12 deferred in prior years against current year capital gains.
Capital losses realized after October 31 and certain late year ordinary losses may be deferred and treated as occurring on the first day of the following fiscal year. For the fiscal period ended September 30, 2015, certain Funds deferred and recognized post-October losses as follows:
Fund | Capital Loss Deferred | Capital Loss Recognized | ||||||
Bond Fund | $ | 1,302 | $ | — | ||||
High Yield Fund | 2,043 | — | ||||||
Low Volatility Equity Fund | — | 39 | ||||||
Multi-Sector Intermediate Bond Fund | 6,432 | — | ||||||
Senior Floating Rate Fund | 9,748 | — | ||||||
The components of distributable earnings on a tax basis (excluding unrealized appreciation (depreciation) which are disclosed above) consist of the following:
| Undistributed Ordinary Income | Undistributed Long-Term Capital Gains | Undistributed Tax-Exempt Income | ||||||||||
Bond Fund | $ | — | $ | — | $ | — | ||||||
CA Tax-Exempt Bond Fund | 12 | 652 | 10 | |||||||||
Essential Resources Fund | 26 | — | — | |||||||||
High Yield Fund | 45 | — | — | |||||||||
Low Volatility Equity Fund | 48 | 45 | — | |||||||||
Multi-Sector Intermediate Bond Fund | — | — | — | |||||||||
Senior Floating Rate Fund | — | — | — | |||||||||
Wealth Masters Fund | 1,723 | 509 | — | |||||||||
For the period ended September 30, 2015, the CA Tax-Exempt Bond Fund distributed $1,130 of exempt interest dividends.
The differences between the book and tax basis components of distributable earnings relate principally to the timing of recognition of income and gains for federal income tax purposes. Short-term gain distributions reported in the Statements of Changes in Net Assets, if any, are reported as ordinary income for federal tax purposes. Distributions are determined on a tax basis and may differ from net investment income and realized capital gains for financial reporting purposes.
| 2015 | 2014 | |||||||||||||||||||||||||||||||||||
| Tax Exempt Income | Ordinary income | Long-Term Capital Gains | Tax Return of Capital | Total | Tax Exempt Income | Ordinary Income | Long-Term Capital Gains | Total | ||||||||||||||||||||||||||||
Bond Fund | $ | — | $ | 2,207 | $ | — | $ | 379 | $ | 2,586 | $ | — | $ | 3,256 | $ | — | $ | 3,256 | ||||||||||||||||||
CA Tax-Exempt Bond Fund | 1,130 | 33 | 1,061 | — | 2,224 | 1,479 | 17 | 938 | 2,434 | |||||||||||||||||||||||||||
Essential Resources Fund | — | — | — | — | — | — | — | — | — | |||||||||||||||||||||||||||
High Yield Fund | — | 4,752 | — | — | 4,752 | — | 4,910 | — | 4,910 | |||||||||||||||||||||||||||
Low Volatility Equity Fund | — | 15 | — | — | 15 | — | 15 | — | 15 | |||||||||||||||||||||||||||
Multi-Sector Intermediate Bond Fund | — | 14,411 | 3,975 | 1,912 | 20,298 | — | 20,052 | 3,597 | 23,649 | |||||||||||||||||||||||||||
Senior Floating Rate Fund | — | 32,389 | 1,003 | — | 33,392 | — | 37,727 | — | 37,727 | |||||||||||||||||||||||||||
Wealth Masters Fund | — | 2,974 | 48 | — | 3,022 | — | 90 | 2 | 92 | |||||||||||||||||||||||||||
85
Table of Contents
VIRTUS OPPORTUNITIES TRUST
NOTES TO FINANCIAL STATEMENTS (Continued)
SEPTEMBER 30, 2015
| Note 11. Reclassification of Capital Accounts |
($ reported in thousands)
For financial reporting purposes, book basis capital accounts are adjusted to reflect the tax character of permanent book/tax differences. Permanent reclassifications can arise from differing treatment of certain income and gain transactions, nondeductible current year net operating losses, expiring capital loss carryovers and investments in passive foreign investment companies. The reclassifications have no impact on the net assets or net asset value of the Funds. As of September 30, 2015, certain Funds recorded reclassifications to increase (decrease) the accounts as listed below ($ reported in thousands):
| Capital Paid in on Shares of Beneficial Interest | Undistributed Net Investment Income (Loss) | Accumulated Net Realized Gain (Loss) | ||||||||||
Bond Fund | $ | — | $ | (490 | ) | $ | 490 | |||||
CA Tax-Exempt Bond Fund | — | (1) | — | — | (1) | |||||||
Essential Resources Fund | — | 1 | (1 | ) | ||||||||
High Yield Fund | — | 3 | (3 | ) | ||||||||
Low Volatility Equity Fund | — | (1) | — | — | (1) | |||||||
Multi-Sector Intermediate Bond Fund | — | (3,478 | ) | 3,478 | ||||||||
Senior Floating Rate Fund | (111 | ) | 6 | 105 | ||||||||
Wealth Masters Fund | — | (1) | 135 | (135 | ) | |||||||
(1) Amount less than $500.
| Note 12. Regulatory | Matters and Litigation |
From time to time, the Funds’ investment adviser and/or its affiliates and/or subadvisers may be involved in litigation and arbitration as well as examinations and investigations by various regulatory bodies, including the SEC, involving compliance with, among other things, securities laws, client investment guidelines, laws governing the activities of broker-dealers and other laws and regulations affecting their products and other activities. At this time, the Funds’ investment adviser believes that the outcomes of such matters are not likely, either individually or in the aggregate, to be material to these financial statements.
As part of an SEC non-public, confidential investigation of a matter entitled – In the Matter of F-Squared Investments Inc., the SEC staff informed the Funds’ investment adviser that it was inquiring into whether it had violated securities laws or regulations with respect to circumstances related to that matter. On November 16, 2015, without admitting or denying the SEC’s findings, the Funds’ investment adviser consented to the entry of an order providing that it cease and desist from committing or causing any violations and future violations of Sections 204, 206(2) and 206(4) of the Investment Advisers Act of 1940, as amended, and Rules 204-2, 206(4)-1, 206(4)-7 and 206(4)-8 thereunder, and Section 34(b) of the Investment Company Act of 1940, as amended; agreed to a censure; and paid $16.5 million, which included a civil money penalty of $2 million, disgorgement of $13.4 million and prejudgment interest of $1.1 million.
On February 20, 2015, a putative class action complaint (In re Virtus Investment Partners, Inc. Securities Litigation; formerly styled as Tom Cummins v. Virtus Investment Partners Inc. et al) alleging violation of the federal securities laws was filed by an individual shareholder against Virtus and certain of its officers (the “defendants”) in the United States District Court for the Southern District of New York. On August 21, 2015, the lead plaintiff filed a Consolidated Class Action Complaint (the “Consolidated Complaint”) amending the originally filed complaint and adding the Trust as a defendant. The Consolidated Complaint was purportedly filed on behalf of all purchasers of Virtus common stock between January 25, 2013 and May 11, 2015 (the “Class Period”). The Consolidated Complaint alleges that during the Class Period, the defendants knowingly disseminated materially false and misleading statements and concealed material adverse facts relating to certain funds previously subadvised by F-Squared Investments, Inc. and/or its affiliates (“F-Squared”). The plaintiff seeks to recover unspecified damages. Virtus and its affiliates, including the Funds’ adviser, believe that the suit is without merit and intend to defend it vigorously. A motion to dismiss the Consolidated Complaint was filed on behalf of the defendants on October 21, 2015. The Trust believes that the risk of loss to the Funds as a result of this suit is remote. The adviser does not believe that the suit will have any impact on its ability to provide services to the Funds.
On May 8, 2015, a putative class action complaint (Mark Youngers v. Virtus Investment Partners, Inc. et al) alleging violations of certain provisions of the federal securities laws was filed in the United States District Court for the Central District of California. The complaint, which was purportedly filed on behalf of purchasers of certain Virtus Funds previously subadvised by F-Squared between May 8, 2010 and December 22, 2014, inclusive (the “Class Period”), alleges claims against Virtus, certain Virtus officers and affiliates (including the Funds’ investment adviser, Euclid Advisors LLC and VP Distributors, LLC), the trustees and certain officers of the Trust, and certain other parties (the “defendants”). The complaint alleges that during the Class Period the defendants knowingly disseminated materially false and misleading statements and concealed or omitted material facts necessary to make the statements made not misleading. On October 1, 2015, the plaintiff filed a First Amended Class Action Complaint which, among other things, added a derivative claim for breach of fiduciary duty on behalf of the Trust. On October 19, 2015, the Court entered an order transferring the action to the Southern District of New York. Virtus and its affiliates, including the Funds’ adviser, believe the plaintiff’s claims asserted in the complaint are frivolous and intend to defend them vigorously. The Trust believes that the risk of loss to the Funds as a result of this suit is remote. The adviser does not believe that the suit will have any impact on its ability to provide services to the Funds.
| Note 13. Borrowings |
($ reported in thousands)
On July 2, 2015, the Funds as well as other Funds of the Trust (with the exception of the Senior Floating Rate Fund), entered into a $50,000 secured Line of Credit Agreement (the “Agreement”) with a commercial bank (the “Bank”) that allows the Funds to manage large unexpected redemptions and trade fails, up to a limit of one-third or one-fifth of each Fund’s total net assets in accordance with the Agreement. Interest is
86
Table of Contents
VIRTUS OPPORTUNITIES TRUST
NOTES TO FINANCIAL STATEMENTS (Continued)
SEPTEMBER 30, 2015
charged at the higher of the LIBOR (London Interbank Offered Rate) or the Federal Funds rate plus an additional percentage rate on the amount borrowed. Commitment fees are charged on the undrawn balance. The Funds are individually, and not jointly, liable for their particular advances, if any, under the line of credit. The Bank has the ability to require repayment of outstanding borrowings under the Agreement upon certain circumstances such as an event of default.
From July 2, 2015 to September 30, 2015, the High Yield Fund made borrowings. The average daily borrowings under the Agreement and the weighted daily average interest rate were $2,483 and 1.19%, respectively. No other Funds made borrowings during the period and no Fund had any outstanding borrowings as of September 30, 2015.
On April 30, 2012, the Senior Floating Rate Fund entered into a Credit Agreement (the “Agreement”) with a commercial bank (the “Bank”) that allows the Fund to borrow cash from the Bank, up to a limit of $125,000. Borrowings under the Agreement are collateralized by investments of the Fund. Interest is charged at LIBOR (London Interbank Offered Rate) plus an additional percentage rate on the amount borrowed. Commitment fees are charged on the undrawn balance. Total commitment fees paid and accrued for the period ended September 30, 2015, were $118 and are included in interest expense and fees on the Statement of Operations. The Agreement is renewable by the Fund with the Bank’s consent. The Agreement can also be converted to a 364 day fixed term facility, one time at the Fund’s option. The Bank has the ability to require repayment of outstanding borrowings under the Agreement upon certain circumstances such as an event of default. From October 1, 2014 to September 30, 2015, the average daily borrowings under the Agreement and the weighted daily average interest rate were $32,566 and 1.022%, respectively. At September 30, 2015, the amount of such outstanding borrowings was as follows:
Outstanding | Interest Rate | |||
$25,500 | 1.0475 | % | ||
| Note 14. Illiquid and Restricted Securities |
Investments are generally considered illiquid if they cannot be disposed of within seven days in the ordinary course of business at the approximate amount at which such securities have been valued by a Fund. Additionally, the following information is also considered in determining liquidity: the frequency of trades and quotes for the investment, whether the investment is listed for trading on a recognized domestic exchange and/or whether two or more brokers are willing to purchase or sell the security at a comparable price, the extent of market making activity in the investment and the nature of the market for investment. Illiquid securities are footnoted as such at the end of each Fund’s Schedule of Investments where applicable. However, a portion of such footnoted securities could be liquid where it is determined that some, though not all, of the position could be disposed of within seven days in the ordinary course of business at the approximate amount at which such securities have been valued by the applicable Fund.
Restricted securities are illiquid securities, as defined above, not registered under the Securities Act of 1933, as amended (the “1933 Act”). Generally, 144A securities are excluded from this category, except where defined as illiquid.
Each Fund will bear any costs, including those involved in registration under the 1933 Act, in connection with the disposition of such securities.
At September 30, 2015, the Funds did not hold any securities that are both illiquid and restricted.
| Note 15. Subsequent Events |
Management has evaluated the impact of all subsequent events on the Funds through the date the financial statements were issued, and has determined that there are no subsequent events requiring recognition or disclosure in the financial statements.
87
Table of Contents

REPORT OF INDEPENDENT REGISTERED PUBLIC ACCOUNTING FIRM
To the Board of Trustees of
Virtus Opportunities Trust and
Shareholders of the Funds, as defined:
In our opinion, the accompanying statements of assets and liabilities, including the schedules of investments, and the related statements of operations and of changes in net assets and the financial highlights present fairly, in all material respects, the financial position of Virtus Bond Fund, Virtus CA Tax-Exempt Bond Fund, Virtus Essential Resources Fund, Virtus High Yield Fund, Virtus Low Volatility Equity Fund, Virtus Multi-Sector Intermediate Bond Fund, Virtus Senior Floating Rate Fund and Virtus Wealth Masters Fund (constituting funds within Virtus Opportunities Trust, hereafter referred to as the “Funds”) at September 30, 2015, the results of each of their operations for the year or period then ended, the changes in each of their net assets and the financial highlights for each of the periods indicated, in conformity with accounting principles generally accepted in the United States of America. These financial statements and financial highlights (hereafter referred to as “financial statements”) are the responsibility of the Funds’ management. Our responsibility is to express an opinion on these financial statements based on our audits. We conducted our audits of these financial statements in accordance with the standards of the Public Company Accounting Oversight Board (United States). Those standards require that we plan and perform the audit to obtain reasonable assurance about whether the financial statements are free of material misstatement. An audit includes examining, on a test basis, evidence supporting the amounts and disclosures in the financial statements, assessing the accounting principles used and significant estimates made by management, and evaluating the overall financial statement presentation. We believe that our audits, which included confirmation of securities at September 30, 2015 by correspondence with the custodian and brokers, provide a reasonable basis for our opinion.
PricewaterhouseCoopers LLP
Philadelphia, Pennsylvania
November 20, 2015
88
Table of Contents
VIRTUS OPPORTUNITIES TRUST
SEPTEMBER 30, 2015
(Unaudited)
For the fiscal year ended September 30, 2015, the Funds make the following disclosures for federal income tax purposes. Below is listed the percentages, or the maximum amount allowable, of its ordinary income dividends (“QDI”) to qualify for the lower tax rates applicable to individual shareholders, and the percentage of ordinary income dividends earned by the Funds which qualifies for the dividends received deduction (“DRD”) for corporate shareholders. The Funds designate the amounts below as long-term capital gains dividends (“LTCG”) ($ reported in thousands), or if subsequently different, the amounts will be designated in the next annual report. The actual percentage for the calendar year will be designated in year-end tax statements.
Fund | QDI | DRD | LTCG | |||||||||
Bond Fund | 0 | % | 0 | % | $ | — | ||||||
CA Tax-Exempt Bond Fund | — | — | 656 | |||||||||
Essential Resources Fund | 100 | 42 | — | |||||||||
High Yield Fund | — | — | — | |||||||||
Low Volatility Equity Fund | 100 | 100 | 45 | |||||||||
Multi-Sector Intermediate Bond Fund | — | — | — | |||||||||
Senior Floating Rate Fund | — | — | — | |||||||||
Wealth Masters Fund | 84 | 75 | 513 | |||||||||
For federal income tax purposes, 100% of the income dividends paid by the CA Tax-Exempt Bond Fund qualify as exempt-interest dividends.
For the period ended September 30, 2015, the Essential Resources Fund (the “Fund”) recognized $48 ($ reported in thousands) of foreign source income on which the Fund paid foreign taxes of $5 ($ reported in thousands). This information is being furnished to you pursuant to notice requirements of Section 853(a) and 855(d) of the Internal Revenue Code, as amended and the Treasury Regulations thereunder.
89
Table of Contents
(UNAUDITED)
Information pertaining to the trustees and officers of the Trust as of September 30, 2015, is set forth below. The statement of additional information (SAI) includes additional information about the trustees and is available without charge, upon request, by calling (800) 243-1574. The address of each individual, unless otherwise noted, is 100 Pearl Street, Hartford, CT 06103-4506. There is no stated term of office for trustees of the Trust.
Independent Trustees
| Name, Year of Birth, Year Elected and Number of Funds Overseen | Principal Occupation(s) During Past 5 Years and Other Directorships Held by Trustee | |
McClellan, Hassell H. YOB: 1945 Elected: 2015 55 Portfolios | Retired. Professor (1984 to 2013), Wallace E. Carroll School of Management, Boston College; Trustee, Virtus Variable Insurance Trust (9 portfolios) (since 2008); Trustee (since 2015), Virtus Mutual Fund Complex (46 portfolios); Trustee, John Hancock Fund Complex (since 2000), John Hancock Funds (collectively, 234 portfolios); and Director (since 2010), Barnes Group, Inc. (diversified global components manufacturer and logistical services company). | |
McLoughlin, Philip YOB: 1946 Elected: 2006 69 Portfolios | Director (since 1991) and Chairman (since 2010), World Trust Fund (closed-end investment firm in Luxembourg); Director (since 1995), closed-end funds managed by Duff & Phelps Investment Management Co. (4 portfolios); Chairman (since 2002) and Trustee (since 1989), Virtus Mutual Fund Complex (46 portfolios); Chairman and Trustee (since 2003), Virtus Variable Insurance Trust (9 portfolios); Trustee/Director and Chairman (since 2011), Virtus Closed-End Funds (3 portfolios); Trustee and Chairman (since 2013), Virtus Alternative Solutions Trust (7 portfolios); Partner (2006 to 2010), Cross Pond Partners, LLC (investment management consultant); and Managing Director (2008 to 2010), SeaCap Partners, LLC (investment management). | |
McNamara, Geraldine M. YOB: 1951 Elected: 2006 59 Funds | Retired. Trustee (since 2001), Virtus Mutual Fund Complex (46 portfolios); and Director (since 2003), closed-end funds managed by Duff & Phelps Investment Management Co. (4 portfolios); and Trustee (since 2015), Virtus Variable Insurance Trust (9 portfolios) | |
Oates, James M. YOB: 1946 Elected: 2006 56 Funds | Managing Director (since 1994), Wydown Group (consulting firm). Trustee (since 1987), Virtus Mutual Fund Complex (46 portfolios); Director (since 1996), Stifel Financial; Director (1998 to 2014), Connecticut River Bancorp; Chairman and Director (1999 to 2014), Connecticut River Bank; Chairman (since 2000), Emerson Investment Management, Inc.; Director (2002 to 2014), New Hampshire Trust Company; Chairman and Trustee (since 2005), John Hancock Fund Complex (228 portfolios); Non-Executive Chairman (2007 to 2011), Hudson Castle Group, Inc. (formerly IBEX Capital Markets, Inc.) (financial services); Trustee/Director (since 2013), Virtus Closed-End Funds (3 portfolios); and Trustee (since 2013), Virtus Alternative Solutions Trust (7 portfolios). | |
Segerson, Richard E. YOB: 1948 Elected: 2006 46 Funds | Trustee (since 1983), Virtus Mutual Fund Complex (46 portfolios); and Managing Director (1998 to 2013), Northway Management Company. | |
Verdonck, Ferdinand L.J. YOB: 1942 Elected: 2006 46 Funds | Trustee (since 2002), Virtus Mutual Fund Complex (46 portfolios). | |
Interested Trustee
The individual listed below is an “interested person” of the Trust, as defined in Section 2(a)(19) of the 1940 Act, as amended, and the rules and regulations thereunder.
| Name, Year of Birth, Year Elected and Number of Funds Overseen | Principal Occupation(s) During Past 5 Years and Other Directorships Held by Trustee | |
Aylward, George R.* Trustee and President YOB: 1964 Elected: 2006 67 Funds | Director, President and Chief Executive Officer (since 2008), Virtus Investment Partners, Inc. and/or certain of its subsidiaries; various senior officer positions with Virtus affiliates (since 2005); Trustee (since 2006), Virtus Mutual Funds (46 portfolios); Chairman, President and Chief Executive Officer (since 2006), The Zweig Closed-End Funds (2 portfolios); Trustee (since 2012) and President (since 2010), Virtus Variable Insurance Trust (9 portfolios); Trustee and President (since 2011), Virtus Closed-End Funds (3 portfolios); Director (since 2013), Virtus Global Funds, PLC (2 portfolios); and Trustee (since 2013), Virtus Alternative Solutions Trust (7 portfolios). | |
90
Table of Contents
FUND MANAGEMENT TABLES (Continued)
(UNAUDITED)
Officers of the Trust Who Are Not Trustees
Name, Address and Year of Birth | Position(s) Held with Trust and Length of Time Served | Principal Occupation(s) During Past 5 Years | ||
Waltman, Francis G. YOB: 1962 | Executive Vice President (since 2013); Senior Vice President (2008-2013). | Virtus Investment Partners, Inc. and/or certain of its subsidiaries; various senior officer positions (since 2006) with Virtus affiliates; Executive Vice President (since 2013), Senior Vice President (2008 to 2013), Virtus Mutual Fund Complex; Executive Vice President (since 2013), Senior Vice President (2010 to 2013), Virtus Variable Insurance Trust; Executive Vice President (since 2013), Senior Vice President (2011 to 2013), Virtus Closed-End Funds; Director (since 2013), Virtus Global Funds PLC; and Executive Vice President (since 2013), Virtus Alternative Solutions Trust. | ||
Bradley, W. Patrick YOB: 1972 | Senior Vice President (since 2013); Vice President (2011 to 2013); Chief Financial Officer and Treasurer (since 2006). | Senior Vice President, Fund Services (since 2010), Virtus Investment Partners, Inc. and/or certain of its subsidiaries; various officer positions (since 2006) with Virtus affiliates; Senior Vice President (since 2013), Vice President (2011 to 2013), Chief Financial Officer and Treasurer (since 2004), Virtus Variable Insurance Trust; Senior Vice President (since 2013), Vice President (2011 to 2013), Chief Financial Officer and Treasurer (since 2006), Virtus Mutual Fund Complex; Senior Vice President (since 2013), Vice President (2012 to 2013) and Treasurer (Chief Financial Officer) (since 2007), The Zweig Closed-End Funds; Senior Vice President (since 2013), Vice President (2011 to 2013), Chief Financial Officer and Treasurer (since 2011), Virtus Closed-End Funds; Vice President and Assistant Treasurer (since 2011), Duff & Phelps Global Utility Income Fund Inc.; Director (since 2013), Virtus Global Funds, PLC; and Senior Vice President, Chief Financial Officer and Treasurer (since 2013), Virtus Alternative Solutions Trust. | ||
Carr, Kevin J. YOB: 1954 | Senior Vice President, since 2013; Vice President (2005-2013); Chief Legal Officer, Counsel and Secretary (since 2005). | Senior Vice President (since 2009), Vice President, Counsel and Secretary (2008 to 2009), Virtus Investment Partners, Inc. and/or certain of its subsidiaries; various senior officer positions (since 2005) with Virtus affiliates; Senior Vice President (since 2013), Vice President (2005 to 2013), Chief Legal Officer, Counsel and Secretary (since 2005), Virtus Mutual Fund Complex; Senior Vice President (2013 to 2014), Vice President (2012 to 2013) and Assistant Secretary (since 2012), Secretary and Chief Legal Officer (2005 to 2012), The Zweig Closed-End Funds; Assistant Secretary (since 2013), Vice President, Chief Legal Officer, Counsel and Secretary (2010 to 2013), Virtus Variable Insurance Trust; Vice President and Assistant Secretary (since 2011), Duff & Phelps Global Utility Income Fund Inc.; Senior Vice President and Assistant Secretary (2013 to 2014), Vice President and Assistant Secretary (2012 to 2013), Vice President, Chief Legal Officer, Counsel and Secretary (2011 to 2012), Virtus Closed-End Funds; and Assistant Secretary (since 2013), Virtus Alternative Solutions Trust. | ||
Engberg, Nancy J. YOB: 1956 | Vice President and Chief Compliance Officer since 2011. | Vice President (since 2008) and Chief Compliance Officer (2008 to 2011), Virtus Investment Partners, Inc. and/or certain of its subsidiaries; various officer positions (since 2003) with Virtus affiliates; Vice President and Chief Compliance Officer (since 2011), Virtus Mutual Fund Complex; Vice President (since 2010), Chief Compliance Officer (since 2011), Virtus Variable Insurance Trust; Vice President and Chief Compliance Officer (since 2011), Virtus Closed-End Funds; Vice President and Chief Compliance Officer (since 2012), The Zweig Closed-End Funds; and Vice President and Chief Compliance Officer (since 2013), Virtus Alternative Solutions Trust. | ||
91
Table of Contents
Virtus Bond Fund,
Virtus CA Tax-Exempt Bond Fund,
Virtus High Yield Fund,
Virtus Low Volatility Equity Fund,
Virtus Senior Floating Rate Fund and Virtus Wealth Masters Fund each a series of Virtus Opportunities Trust
Supplement dated September 14, 2015 to the Summary Prospectuses dated January 28, 2015, as supplemented, and the Virtus Opportunities Trust Statutory Prospectus, dated January 28, 2015, as supplemented.
THIS SUPPLEMENT SUPERCEDES THE SUPPLEMENT DATED SEPTEMBER 2, 2015 TO THE ABOVE-REFERENCED PROSPECTUSES. THIS SUPPLEMENT INCLUDES ADDITIONAL INFORMATION WHICH WAS INADVERTANTLY OMITTED IN THE EARLIER SUPPLEMENT.
IMPORTANT NOTICETO INVESTORS
Virtus Bond Fund
Under “Fees and Expenses” in the fund’s summary prospectus and the summary section of the statutory prospectus, the “Annual Fund Operating Expenses” table and associated footnotes are hereby replaced with the following:
| Annual Fund Operating Expenses (expenses that you pay each year as a percentage of the value of your investment) | Class A | Class B | Class C | Class I | ||||
| Management Fees | 0.45% | 0.45% | 0.45% | 0.45% | ||||
| Distribution and Shareholder Servicing (12b-1) Fees | 0.25% | 1.00% | 1.00% | None | ||||
| Other Expenses | 0.40% | 0.40% | 0.40% | 0.40% | ||||
| Total Annual Fund Operating Expenses | 1.10% | 1.85% | 1.85% | 0.85% | ||||
| Less: Expense Reimbursement(b) | (0.25%) | (0.25%) | (0.25%) | (0.25%) | ||||
| Total Annual Fund Operating Expenses After | ||||||||
| Expense Reimbursement(b) | 0.85% | 1.60% | 1.60% | 0.60% |
| (b) | The fund’s investment adviser has contractually agreed to limit the fund’s total operating expenses (excluding dividend and interest expenses, taxes, brokerage commissions, extraordinary expenses and acquired fund fees and expenses) so that such expenses do not exceed 0.85% for Class A Shares, 1.60% for Class B Shares, 1.60% for Class C Shares and 0.60% for Class I Shares through January 31, 2017. Following the contractual period, the adviser may discontinue these expense reimbursement arrangements at any time. Under certain conditions, the adviser may recapture operating expenses reimbursed under these arrangements for a period of three years following the fiscal year in which such reimbursement occurred. |
Under “Fees and Expenses, the “Example” table is hereby replaced with the following:
| Share Status | 1 Year | 3 Years | 5 Years | 10 Years | ||||||||||||||
| Class A | Sold or Held | $ | 459 | $ | 663 | $ | 911 | $ | 1,620 | |||||||||
| Class B | Sold | $ | 563 | $ | 732 | $ | 953 | $ | 1,930 | |||||||||
| Held | $ | 163 | $ | 532 | $ | 953 | $ | 1,930 | ||||||||||
| Class C | Sold | $ | 263 | $ | 532 | $ | 953 | $ | 2,127 | |||||||||
| Held | $ | 163 | $ | 532 | $ | 953 | $ | 2,127 | ||||||||||
| Class I | Sold or Held | $ | 61 | $ | 220 | $ | 421 | $ | 1,001 |
Virtus CA Tax-Exempt Bond Fund
Under “Fees and Expenses” in the fund’s summary prospectus and the summary section of the statutory prospectus, the “Annual Fund Operating Expenses” table and associated footnotes are hereby replaced with the following:
| Annual Fund Operating Expenses (expenses that you pay each year as a percentage of the value of your investment) | Class A | Class I | ||
| Management Fees | 0.45% | 0.45% | ||
| Distribution and Shareholder Servicing (12b-1) Fees | 0.25% | None | ||
| Other Expenses | 0.41% | 0.41% | ||
| Total Annual Fund Operating Expenses | 1.11% | 0.86% | ||
| Less: Expense Reimbursement(a) | (0.26%) | (0.26%) | ||
| Total Annual Fund Operating Expenses After Expense Reimbursement(a) | 0.85% | 0.60% |
| (a) | The fund’s investment adviser has contractually agreed to limit the fund’s total operating expenses (excluding dividend and interest expenses, taxes, brokerage commissions, extraordinary expenses and acquired fund fees and expenses) so that such expenses do not |
Table of Contents
| exceed 0.85% for Class A Shares and 0.60% for Class I Shares through January 31, 2017. Following the contractual period, the adviser may discontinue these expense reimbursement arrangements at any time. Under certain conditions, the adviser may recapture operating expenses reimbursed under these arrangements for a period of three years following the fiscal year in which such reimbursement occurred. |
Under “Fees and Expenses, the “Example” table is hereby replaced with the following:
| Share Status | 1 Year | 3 Years | 5 Years | 10 Years | ||||||||||||||
| Class A | Sold or Held | $ | 359 | $ | 567 | $ | 819 | $ | 1,543 | |||||||||
| Class I | Sold or Held | $ | 61 | $ | 221 | $ | 424 | $ | 1,011 |
Virtus High Yield Fund
Under “Fees and Expenses” in the fund’s summary prospectus and the summary section of the statutory prospectus, the “Annual Fund Operating Expenses” table and associated footnotes are hereby replaced with the following:
| Annual Fund Operating Expenses (expenses that you pay each year as a percentage of the value of your investment) | Class A | Class B | Class C | Class I | ||||
| Management Fees | 0.65% | 0.65% | 0.65% | 0.65% | ||||
| Distribution and Shareholder Servicing (12b-1) Fees | 0.25% | 1.00% | 1.00% | None | ||||
| Other Expenses | 0.41% | 0.41% | 0.41% | 0.41% | ||||
| Total Annual Fund Operating Expenses | 1.31% | 2.06% | 2.06% | 1.06% | ||||
| Less: Expense Reimbursement(b) | (0.16%) | (0.16%) | (0.16%) | (0.16%) | ||||
| Total Annual Fund Operating Expenses After | ||||||||
| Expense Reimbursement(b) | 1.15% | 1.90% | 1.90% | 0.90% |
| (b) | The fund’s investment adviser has contractually agreed to limit the fund’s total operating expenses (excluding dividend and interest expenses, taxes, brokerage commissions, extraordinary expenses and acquired fund fees and expenses) so that such expenses do not exceed 1.15% for Class A Shares, 1.90% for Class B Shares , 1.90% for Class C Shares and 0.90% for Class I Shares through January 31, 2017. Following the contractual period, the adviser may discontinue these expense reimbursement arrangements at any time. Under certain conditions, the adviser may recapture operating expenses reimbursed under these arrangements for a period of three years following the fiscal year in which such reimbursement occurred. |
Under “Fees and Expenses, the “Example” table is hereby replaced with the following:
| Share Status | 1 Year | 3 Years | 5 Years | 10 Years | ||||||||||||||
| Class A | Sold or Held | $ | 488 | $ | 743 | $ | 1,036 | $ | 1,867 | |||||||||
| Class B | Sold | $ | 593 | $ | 814 | $ | 1,078 | $ | 2,171 | |||||||||
| Held | $ | 193 | $ | 614 | $ | 1,078 | $ | 2,171 | ||||||||||
| Class C | Sold | $ | 293 | $ | 614 | $ | 1,078 | $ | 2,363 | |||||||||
| Held | $ | 193 | $ | 614 | $ | 1,078 | $ | 2,363 | ||||||||||
| Class I | Sold or Held | $ | 92 | $ | 305 | $ | 553 | $ | 1,264 |
Virtus Low Volatility Equity Fund
Under “Fees and Expenses” in the fund’s summary prospectus and the summary section of the statutory prospectus, the “Annual Fund Operating Expenses” table and associated footnotes are hereby replaced with the following:
| Annual Fund Operating Expenses (expenses that you pay each year as a percentage of the value of your investment) | Class A | Class C | Class I | |||
| Management Fees | 0.95% | 0.95% | 0.95% | |||
| Distribution and Shareholder Servicing (12b-1) Fees | 0.25% | 1.00% | None | |||
| Other Expenses | 4.95% | 4.95% | 4.95% | |||
| Acquired Fund Fees and Expenses | 0.20% | 0.20% | 0.20% | |||
| Total Annual Fund Operating Expenses(b) | 6.35% | 7.10% | 6.10% | |||
| Less: Expense Reimbursement(c) | (4.80%) | (4.80%) | (4.80%) | |||
| Total Annual Fund Operating Expenses After Expense Reimbursement(b)(c) | 1.55% | 2.30% | 1.30% |
| (b) | The Total Annual Fund Operating Expenses do not correlate to the ratio of expenses to average net assets appearing in the Financial Highlights tables, which tables reflect only the operating expenses of the fund and do not include acquired fund fees and expenses. |
| (c) | The fund’s investment adviser has contractually agreed to limit the fund’s total operating expenses (excluding dividend and interest expenses, taxes, brokerage commissions, extraordinary expenses and acquired fund fees and expenses) so that such expenses do not exceed 1.55% for Class A Shares, 2.30% for Class C Shares and 1.30% for Class I Shares through January 31, 2017. Following the contractual period, the adviser may discontinue these expense reimbursement arrangements at any time. Under certain conditions, the adviser may recapture operating expenses reimbursed under these arrangements for a period of three years following the fiscal year in which such reimbursement occurred. |
Table of Contents
Under “Fees and Expenses, the “Example” table is hereby replaced with the following:
| Share Status | 1 Year | 3 Years | 5 Years | 10 Years | ||||||||||||||
| Class A | Sold or Held | $ | 724 | $ | 1,514 | $ | 2,760 | $ | 5,733 | |||||||||
| Class C | Sold | $ | 333 | $ | 1,213 | $ | 2,649 | $ | 5,983 | |||||||||
| Held | $ | 233 | $ | 1,213 | $ | 2,649 | $ | 5,983 | ||||||||||
| Class I | Sold or Held | $ | 132 | $ | 922 | $ | 2,205 | $ | 5,292 |
Virtus Wealth Masters Fund
Under “Fees and Expenses” in the fund’s summary prospectus and the summary section of the statutory prospectus, the “Annual Fund Operating Expenses” table and associated footnotes are hereby replaced with the following:
| Annual Fund Operating Expenses (expenses that you pay each year as a percentage of the value of your investment) | Class A | Class C | Class I | |||
| Management Fees | 0.85% | 0.85% | 0.85% | |||
| Distribution and Shareholder Servicing (12b-1) Fees | 0.25% | 1.00% | None | |||
| Other Expenses | 0.36% | 0.36% | 0.36% | |||
| Total Annual Fund Operating Expenses | 1.46% | 2.21% | 1.21% | |||
| Less: Expense Reimbursement(b) | (0.01%) | (0.01%) | (0.01%) | |||
| Total Annual Fund Operating Expenses After Expense Reimbursement(b) | 1.45% | 2.20% | 1.20% |
| (b) | The fund’s investment adviser has contractually agreed to limit the fund’s total operating expenses (excluding dividend and interest expenses, taxes, brokerage commissions, extraordinary expenses and acquired fund fees and expenses) so that such expenses do not exceed 1.45% for Class A Shares, 2.20% for Class C Shares and 1.20% for Class I Shares through January 31, 2017. Following the contractual period, the adviser may discontinue these expense reimbursement arrangements at any time. Under certain conditions, the adviser may recapture operating expenses reimbursed under these arrangements for a period of three years following the fiscal year in which such reimbursement occurred. |
Under “Fees and Expenses, the “Example” table is hereby replaced with the following:
| Share Status | 1 Year | 3 Years | 5 Years | 10 Years | ||||||||||||||
| Class A | Sold or Held | $ | 714 | $ | 1,008 | $ | 1,325 | $ | 2,219 | |||||||||
| Class C | Sold | $ | 323 | $ | 689 | $ | 1,183 | $ | 2,543 | |||||||||
| Held | $ | 223 | $ | 689 | $ | 1,183 | $ | 2,543 | ||||||||||
| Class I | Sold or Held | $ | 122 | $ | 382 | $ | 663 | $ | 1,464 |
Virtus Bond Fund, Virtus CA Tax-Exempt Bond Fund, Virtus High Yield Fund, Virtus Low Volatility Equity Fund, Virtus Senior Floating Rate Fund and Virtus Wealth Masters Fund
The first paragraph and the information in the first table in the section “More Information About Fund Expenses” on page 139 of the statutory prospectus are hereby revised with the following information for the above referenced funds:
Virtus Investment Advisers, Inc. (“VIA”) has contractually agreed to limit the total operating expenses (excluding dividend and interest expenses, taxes, brokerage commissions, leverage expenses, extraordinary expenses and acquired fund fees and expenses, if any) of certain of the funds so that expenses do not exceed, on an annualized basis, the amounts indicated in the following table.
Virtus Wealth Masters Fund
Under “Fees and Expenses” in the fund’s summary prospectus and the summary section of the statutory prospectus, the “Annual Fund Operating Expenses” table and associated footnotes are hereby replaced with the following:
| Annual Fund Operating Expenses (expenses that you pay each year as a percentage of the value of your investment) | Class A | Class C | Class I | |||
| Management Fees | 0.85% | 0.85% | 0.85% | |||
| Distribution and Shareholder Servicing (12b-1) Fees | 0.25% | 1.00% | None | |||
| Other Expenses | 0.36% | 0.36% | 0.36% | |||
| Total Annual Fund Operating Expenses | 1.46% | 2.21% | 1.21% | |||
| Less: Expense Reimbursement(b) | (0.01%) | (0.01%) | (0.01%) | |||
| Total Annual Fund Operating Expenses After Expense Reimbursement(b) | 1.45% | 2.20% | 1.20% |
| (b) | The fund’s investment adviser has contractually agreed to limit the fund’s total operating expenses (excluding dividend and interest expenses, taxes, brokerage commissions, extraordinary expenses and acquired fund fees and expenses) so that such expenses do not |
Table of Contents
| exceed 1.45% for Class A Shares, 2.20% for Class C Shares and 1.20% for Class I Shares through January 31, 2017. Following the contractual period, the adviser may discontinue these expense reimbursement arrangements at any time. Under certain conditions, the adviser may recapture operating expenses reimbursed under these arrangements for a period of three years following the fiscal year in which such reimbursement occurred. |
Under “Fees and Expenses, the “Example” table is hereby replaced with the following:
| Share Status | 1 Year | 3 Years | 5 Years | 10 Years | ||||||||||||||
| Class A | Sold or Held | $ | 714 | $ | 1,008 | $ | 1,325 | $ | 2,219 | |||||||||
| Class C | Sold | $ | 323 | $ | 689 | $ | 1,183 | $ | 2,543 | |||||||||
| Held | $ | 223 | $ | 689 | $ | 1,183 | $ | 2,543 | ||||||||||
| Class I | Sold or Held | $ | 122 | $ | 382 | $ | 663 | $ | 1,464 |
Virtus Bond Fund, Virtus CA Tax-Exempt Bond Fund, Virtus High Yield Fund, Virtus Low Volatility Equity Fund, Virtus Senior Floating Rate Fund and Virtus Wealth Masters Fund
The first paragraph and the information in the first table in the section “More Information About Fund Expenses” on page 139 of the statutory prospectus are hereby revised with the following information for the above referenced funds:
Virtus Investment Advisers, Inc. (“VIA”) has contractually agreed to limit the total operating expenses (excluding dividend and interest expenses, taxes, brokerage commissions, leverage expenses, extraordinary expenses and acquired fund fees and expenses, if any) of certain of the funds so that expenses do not exceed, on an annualized basis, the amounts indicated in the following table.
| Class A Shares | Class B Shares | Class C Shares | Class I Shares | Class R6 Shares | Class T Shares | Through Date | ||||||||
| Virtus Bond Fund | 0.85% | 1.60% | 1.60% | 0.60% | N/A | N/A | January 31, 2017 | |||||||
| Virtus CA Tax Exempt Bond Fund | 0.85% | N/A | N/A | 0.60% | N/A | N/A | January 31, 2017 | |||||||
| Virtus High Yield Fund | 1.15% | 1.90% | 1.90% | 0.90% | N/A | N/A | January 31, 2017 | |||||||
| Virtus Low Volatility Equity Fund | 1.55% | N/A | 2.30% | 1.30% | N/A | N/A | January 31, 2017 | |||||||
| Virtus Senior Floating Rate Fund(1) | 1.20% | N/A | 1.95% | 0.95% | N/A | N/A | January 31, 2017 | |||||||
| Virtus Wealth Masters Fund | 1.45% | N/A | 2.20% | 1.20% | N/A | N/A | January 31, 2017 |
| (1) | Fund expenses currently below the capped level. |
Investors should retain this supplement with the Prospectuses for future reference.
VOT 8020/6FundsNewExpCap&Waiver (09/15)
Table of Contents
VIRTUS OPPORTUNITIES TRUST
101 Munson Street
Greenfield, MA 01301-9668
Trustees
George R. Aylward
Hassell H. McClellan
Philip R. McLoughlin, Chairman
Geraldine M. McNamara
James M. Oates
Richard E. Segerson
Ferdinand L.J. Verdonck
Officers
George R. Aylward, President
Francis G. Waltman, Executive Vice President
W. Patrick Bradley, Senior Vice President, Chief Financial Officer and Treasurer
Kevin J. Carr, Senior Vice President, Chief Legal Officer, Counsel and Secretary
Nancy J. Engberg, Vice President and Chief Compliance Officer
Investment Adviser
Virtus Investment Advisers, Inc.
100 Pearl Street
Hartford, CT 06103-4506
Principal Underwriter
VP Distributors, LLC
100 Pearl Street
Hartford, CT 06103-4506
Administrator and Transfer Agent
Virtus Fund Services, LLC
100 Pearl Street
Hartford, CT 06103-4506
Custodian
JPMorgan Chase Bank, NA
1 Chase Manhattan Plaza
New York, NY 10005-1401
Independent Registered Public Accounting Firm
PricewaterhouseCoopers LLP
2001 Market Street
Philadelphia, PA 19103-7042
How to Contact Us
Mutual Fund Services | 1-800-243-1574 | |||
Adviser Consulting Group | 1-800-243-4361 | |||
Web site | Virtus.com |
Important Notice to Shareholders
The Securities and Exchange Commission has modified mailing regulations for semiannual and annual shareholder fund reports to allow mutual fund companies to send a single copy of these reports to shareholders who share the same mailing address. If you would like additional copies, please call Mutual Fund Services at 1-800-243-1574.
Table of Contents
| ||
P.O. Box 9874 Providence, RI 02940-8074 |

For more information about Virtus Mutual Funds,
please call your financial representative, or contact us
at 1-800-243-1574 or Virtus.com.
8008 | 11-15 |
Table of Contents

ANNUAL REPORT
Virtus Real Estate Securities Fund
September 30, 2015
TRUST NAME: VIRTUS OPPORTUNITIES TRUST
Not FDIC Insured
No Bank Guarantee
May Lose Value

Table of Contents
Virtus Real Estate Securities Fund
(“Real Estate Securities Fund”)
| 1 | ||||
| 2 | ||||
| 4 | ||||
| 5 | ||||
| 9 | ||||
| 11 | ||||
| 12 | ||||
| 13 | ||||
| 14 | ||||
| 16 | ||||
| 24 | ||||
| 25 | ||||
| 26 |
PROXY VOTING PROCEDURES AND VOTING RECORD (FORM N-PX)
The subadviser votes proxies relating to portfolio securities in accordance with procedures that have been approved by the Board of Trustees of the Trust (“Trustees,” or the “Board”). You may obtain a description of these procedures, along with information regarding how the Fund voted proxies during the most recent 12-month period ended June 30, free of charge, by calling toll-free 1-800-243-1574. This information is also available through the Securities and Exchange Commission’s (“SEC”) website at http://www.sec.gov.
FORM N-Q INFORMATION
The Trust files a complete schedule of portfolio holdings for the Fund with the SEC for the first and third quarters of each fiscal year on Form N-Q. Form N-Q is available on the SEC’s website at http://www.sec.gov. Form N-Q may be reviewed and copied at the SEC’s Public Reference Room. Information on the operation of the SEC’s Public Reference Room can be obtained by calling toll-free 1-800-SEC-0330.
This report is not authorized for distribution to prospective investors in the Virtus Real Estate Securities Fund unless preceded or accompanied by an effective prospectus which includes information concerning the sales charge, the Fund’s record and other pertinent information.
Table of Contents
To My Fellow Shareholders of Virtus Mutual Funds:
 | I am pleased to present this annual report that reviews the performance of your fund for the twelve months ended September 30, 2015.
During this period, global equity markets were challenged by falling oil prices, China’s economic slowdown, Greece’s debt crisis, and the growing likelihood of an interest rate hike by the Federal Reserve (the “Fed”). Volatility took its toll on major U.S. equity indices for the twelve months ended September 30, 2015. The large-cap S&P 500® Index and Dow Jones Industrial AverageSM moderately declined 0.61% and 2.11%, respectively, while the technology-heavy NASDAQ Composite Index® gained 4.00%. By comparison, international equities were down even further, with emerging markets hit particularly hard. | |
Against this backdrop, U.S. Treasuries remained an attractive “safe haven” among global investors. The bellwether 10-year U.S. Treasury yield declined from 2.52% at September 30, 2014 to 2.06% at September 30, 2015. Fixed income assets experienced slight losses in anticipation of the Fed’s stated intention to raise interest rates at the end of 2015. The Barclays U.S. Aggregate Bond Index, which tracks Treasuries and other investment-grade debt securities, gained 2.94% for the twelve-month period ended September 30, 2015, while non-investment grade bonds underperformed, with the Barclays U.S. Corporate High Yield Bond Index down 3.43% for the same period.
The strength of the global economy is likely to remain a concern for the markets in the months ahead. Actions by the Fed and other global central banks will be watched with great interest. Following the weak start to the year, the U.S. economy exhibited growth over the second and third quarters of 2015 – including stronger jobs, housing, and consumer spending data – and gives investors reason for optimism. Future market direction will be determined largely by the ability of corporations to continue to produce robust earnings.
Market uncertainty serves as a constant reminder of the importance of portfolio diversification, including exposure to both traditional and alternative asset classes. While diversification cannot guarantee a profit or prevent a loss, owning a variety of asset classes may provide a cushion against inevitable market fluctuations. Your financial advisor can help you ensure that your portfolio is adequately diversified across asset classes and investment strategies.
As always, thank you for entrusting Virtus with your assets. Should you have questions about your account or require assistance, please visit our website at www.Virtus.com, or call our customer service team at 1-800-243-1574. We appreciate your business and remain committed to your long-term financial success.
Sincerely,
George R. Aylward President, Virtus Mutual Funds
October 2015
Performance data quoted represents past results. Past performance is no guarantee of future results, and current performance may be higher or lower than the performance shown above. | ||

1
Table of Contents
VIRTUS REAL ESTATE SECURITIES FUND
DISCLOSURE OF FUND EXPENSES (Unaudited)
FOR THE SIX-MONTH PERIOD OF APRIL 1, 2015 TO SEPTEMBER 30, 2015
We believe it is important for you to understand the impact of costs on your investment. All mutual funds have operating expenses. As a shareholder of the Virtus Real Estate Securities Fund (the “Fund”), you may incur two types of costs: (1) transaction costs, including sales charges on purchases of Class A shares and contingent deferred sales charges on Class B and Class C shares; and (2) ongoing costs, including investment advisory fees, distribution and service fees, and other expenses. Class I shares and Class R6 shares are sold without a sales charge and do not incur distribution and service fees. For further information regarding applicable sales charges, see Note 1 in the Notes to Financial Statements. These examples are intended to help you understand your ongoing costs (in dollars) of investing in the Fund and to compare these costs with the ongoing costs of investing in other mutual funds. These examples are based on an investment of $1,000 invested at the beginning of the period and held for the entire six-month period. The following Expense Table illustrates your Fund’s costs in two ways.
Actual Expenses
The first section of the accompanying table provides information about actual account values and actual expenses. You may use the information in this section, together with the amount you invested, to estimate the expenses that you paid over the period. Simply divide your account value by $1,000 (for example, an $8,600 account value divided by $1,000 = 8.6), then multiply the result by the number in the first section under the heading “Expenses Paid During Period” to estimate the expenses you paid on your account during the period.
Hypothetical Example for Comparison Purposes
The second section of the accompanying table provides information about hypothetical account values and hypothetical expenses based on the Fund’s actual expense ratio and an assumed rate of return of 5% per year before expenses, which is not your Fund’s actual return. The hypothetical account values and expenses may not be used to estimate the actual ending account balance or expenses you paid for the period. You may use this information to compare the ongoing costs of investing in your Fund and other funds. To do so, compare these 5% hypothetical examples with the 5% hypothetical examples that appear in the shareholder reports of the other funds.
Please note that the expenses shown in the accompanying table are meant to highlight your ongoing costs only and do not reflect any transactional costs, such as sales charges or contingent deferred sales charges. Therefore, the second section of the accompanying table is useful in comparing ongoing costs only, and will not help you determine the relative total costs of owning different funds. In addition, if these transactional costs were included, your costs would have been higher. The calculations assume no shares were bought or sold during the period. Your actual costs may have been higher or lower, depending on the amount of your investment and timing of any purchases or redemptions.
2
Table of Contents
VIRTUS REAL ESTATE SECURITIES FUND
DISCLOSURE OF FUND EXPENSES (Unaudited) (Continued)
FOR THE SIX-MONTH PERIOD OF APRIL 1, 2015 TO SEPTEMBER 30, 2015
| Expense Table | ||||||||||||||||
Beginning Value | Ending Account Value September 30, 2015 | Annualized Expense Ratio | Expenses Paid During Period* | |||||||||||||
Actual | ||||||||||||||||
| Class A | $ | 1,000.00 | $ | 928.00 | 1.36 | % | $ | 6.57 | ||||||||
| Class B | 1,000.00 | 924.70 | 2.12 | 10.23 | ||||||||||||
| Class C | 1,000.00 | 924.50 | 2.12 | 10.23 | ||||||||||||
| Class I | 1,000.00 | 929.40 | 1.12 | 5.42 | ||||||||||||
| Class R6 | 1,000.00 | 930.30 | 0.94 | 4.55 | ||||||||||||
Hypothetical (5% return before expenses) |
| |||||||||||||||
| Class A | 1,000.00 | 1,018.16 | 1.36 | 6.90 | ||||||||||||
| Class B | 1,000.00 | 1,014.31 | 2.12 | 10.76 | ||||||||||||
| Class C | 1,000.00 | 1,014.31 | 2.12 | 10.76 | ||||||||||||
| Class I | 1,000.00 | 1,019.38 | 1.12 | 5.69 | ||||||||||||
| Class R6 | 1,000.00 | 1,020.30 | 0.94 | 4.77 | ||||||||||||
| * | Expenses are equal to the Fund’s annualized expense ratio, which is net of waived fees and reimbursed expenses, if applicable, multiplied by the average account value over the period, multiplied by the number of days (183) expenses were accrued in the most recent fiscal half-year, then divided by 365 to reflect the one-half year period. |
| The Fund may invest in other funds, and the annualized expense ratios noted above do not reflect fees and expenses associated with the underlying funds. If such fees and expenses were included, the expenses would have been higher. |
| You can find more information about the Fund’s expenses in the Financial Statements section that follows. For additional information on operating expenses and other shareholder costs, refer to the prospectus. |
3
Table of Contents
VIRTUS REAL ESTATE SECURITIES FUND
SEPTEMBER 30, 2015
(Unaudited)
Barclays U.S. Aggregate Bond Index
The Barclays U.S. Aggregate Bond Index measures the U.S. investment grade fixed rate bond market. The index is calculated on a total return basis. The index is unmanaged, its returns do not reflect any fees, expenses, or sales charges, and it is not available for direct investment.
Barclays U.S. Corporate High Yield Bond Index
The Barclays U.S. Corporate High Yield Bond Index measures the U.S. dollar-denominated, high yield, fixed-rate corporate bond market. The index is calculated on a total return basis. The index is unmanaged, its returns do not reflect any fees, expenses, or sales charges, and it is not available for direct investment.
Basel III
A comprehensive series of reform measures intended to strengthen the regulation, supervision, and risk management of the global banking sector.
Dow Jones Industrial AverageSM
A price weighted average of 30 blue chip stocks. The index is calculated on total return basis with dividends reinvested. The index is unmanaged, its returns do not reflect any fees, expenses, or sales charges and it is not available for direct investment.
Federal Reserve (the “Fed”)
The Central Bank of the United States, responsible for controlling the money supply, interest rates and credit with the goal of keeping the U.S. economy and currency stable.
Governed by a seven-member board, the system includes 12 regional Federal Reserve Banks, 25 branches and all national and state banks that are part of the system.
FTSE NAREIT Equity REITs Index
The FTSE NAREIT Equity REITs Index is a free-float market capitalization index measuring equity tax-qualified real estate investment trusts, which meet minimum size and liquidity criteria, that are listed on the New York Stock Exchange, the American Stock Exchange and the NASDAQ National Market System. The index is calculated on a total return basis with dividends reinvested. The index is unmanaged, its returns do not reflect any fees, expenses, or sales charges, and it is not available for direct investment.
NASDAQ Composite Index®
A market-capitalization weighted index of the more than 3,000 common equities listed on the Nasdaq stock exchange. Unlike other market indexes, the NASDAQ composite is not limited to companies that have U.S. headquarters. The index is unmanaged, its returns do not reflect any fees, expenses, or sales charges and it is not available for direct investment.
REIT (Real Estate Investment Trust)
A publicly traded company that owns, develops and operates income-producing real estate such as apartments, office buildings, hotels, shopping centers and other commercial properties.
S&P 500® Index
The S&P 500® Index is a free-float market capitalization-weighted index of 500 of the largest U.S. companies. The index is calculated on a total return basis with dividends reinvested. The index is unmanaged, its returns do not reflect any fees, expenses, or sales charges, and it is not available for direct investment.
4
Table of Contents
Fund Summary Portfolio Manager Commentary by Duff & Phelps Investment Management Co. | Ticker Symbols: Class A: PHRAX Class B: PHRBX Class C: PHRCX Class R6: VRREX Class I: PHRIX |
| ¢ | The Fund is diversified and has investment objectives of capital appreciation and income with approximately equal emphasis. |
| ¢ | For the fiscal year ended September 30, 2015, the Fund’s Class A shares at NAV returned 11.34%, Class B shares returned 10.51%, Class C shares returned 10.49%, Class I shares returned 11.63% and Class R6 shares from November 12, 2014 (inception date) through September 30, 2015, returned 1.54%*. For the fiscal year, the S&P 500® Index, a broad-based equity index, returned -0.61%, and the FTSE NAREIT Equity REITs Index, the Fund’s style-specific index appropriate for comparison, returned 9.88%. |
| * | Returns less than 1 year are not annualized. |
All performance figures assume reinvestment of distributions and exclude the effect of sales charges. Past performance is no guarantee of future results, and current performance may be higher or lower than the performance shown above.
How did the markets perform during the Fund’s fiscal year?
| ¢ | Equity markets as measured by the S&P 500®Index were flat during the Fund’s fiscal year, yet U.S. REITs performed well, returning 9.88% as measured by the Fund’s benchmark, the FTSE NAREIT Equity REITs Index, which the Fund outperformed. Keys to the solid U.S. REIT performance included strong commercial real estate fundamentals and increases in private market values. |
| ¢ | Over the fiscal year, the 10-Year U.S. Treasury defied the consensus forecast again and rallied a bit, ending the period at a 2.04% yield after starting the year at a 2.49% yield on September 30, 2014. For an additional reference point, the yield was 2.61% on September 30, 2013. The key to the ongoing 10-Year U.S. Treasury rally was slowing global growth estimates with China driving the greatest concern among major economies. |
| ¢ | Across the major regions of the world, economic growth continued to remain the most resilient in the U.S., the U.K. and the major Nordic cities, as we evidenced during our ongoing property tours. Our U.S. and international travels during the period included property tours in many markets. Touring properties of U.S.-listed names with investments overseas is a regular part of our due diligence. The trips were helpful in providing timely updates on the space and asset markets in each respective locale. Additionally, quality time was spent with existing strategy holdings and conducting due diligence on potential new investment opportunities. At a high level, the strong appetite for high-quality commercial real estate from a wide and deep pool of institutional capital sources was evident across most locations as reflected in recent asset market pricing trends. Space market trends were notably robust for U.S. self-storage, apartment, and industrial real estate. |
| ¢ | As of the end of the fiscal year, there remained a range of communication from Federal Reserve (“Fed”) presidents and governors regarding the potential for a 2015 or 2016 initial interest rate hike. Yet the key point is, for another fiscal year of the Fund, the first Fed interest rate hike was deferred. For many market participants including ourselves, having the Fed reload its tool kit before it faces the next economic slowdown in the U.S. is important. Fed Chair Yellen is getting a de-facto benefit of what many could view as an accommodating fiscal policy for consumers in the form of a materially lower gasoline price, something former Fed Chair Bernanke did not witness in his last few years. |
| ¢ | Importantly, one differentiator between this recovery and others is the lack of overbuilding. Basel III’s restrictions on banks are providing new constraints this cycle. Supply has increased, but remains contained at 1.2% of existing space in aggregate, broadly in line |
For information regarding the indexes and certain investment terms, see the Key Investment Terms on page 4.
5
Table of Contents
| REAL ESTATE SECURITIES FUND (Continued) |
with historical obsolescence levels and below long-term historical levels of approximately 2% (source: McGraw-Hill Construction & Citi Research). Controlled supply is a net positive for the REITs we invest in, as it can lead to greater occupancy and pricing power. And in today’s global environment, pricing power is a compelling attribute of commercial real estate. |
| ¢ | Thematically, real estate companies remained active on the capital raising front as they looked to fund redevelopment, selective development, and acquisitions. Portfolio pruning and capital recycling was more evident in the U.S. than in other markets as is often the case. We also witnessed a pick-up in mergers and acquisition activity as several privatization deals were announced in the U.S. With the significant amount of real estate private equity capital that has been raised, but currently remains unspent, and the more attractive valuations on offer by publicly traded real estate securities, we expect M&A activity to continue, if not accelerate, over the coming year. |
What factors affected the Fund’s performance during its fiscal year?
| ¢ | For the one-year period ended September 30, 2015, the Fund benefited from both security selection and property sector allocation, with the bulk of the relative performance driven from property sector allocation. Overall, the Fund performed ahead of its style-specific benchmark. |
| ¢ | Within the U.S., the manufactured home, self-storage, and apartment property sectors demonstrated the best total returns over the last 12 months. The lodging, diversified, and mixed office & industrial property sectors were laggards. |
| ¢ | The most significant individual positive contributor to relative performance during the Fund’s fiscal year was allocation to and stock selection within the self-storage property sector. Diversified and regional malls, primarily a result of property sector allocation in the |
case of diversified and security selection for regional malls, were the second and third most positive contributors to the Fund’s relative performance. |
| ¢ | The most significant detractor from relative performance during the Fund’s fiscal year was our overweight allocation and stock selection within the lodging sector. Lodging lagged other sectors in the last 12 months, primarily due to concerns of a global slowdown. There were modest announced downward revisions of less than a couple percent to revenue-per-available-room expectations over the summer, even though per-share earnings guidance, as measured by funds from operations, had been lifted from the start of the year for a number of the key lodging REITs. One of those lodging REITs announced its privatization in September to a strong bid. The possibility of more privatizations to follow, given significant discounts of lodging REITs to net asset value and a robust and well-funded private bid, remains present in lodging and other property sectors. No other property sector had an adverse impact of more than a few basis points on the Fund in its fiscal year. |
The preceding information is the opinion of portfolio management. Any such opinions are subject to change at any time based upon market or other conditions and should not be relied upon as investment advice. Past performance is no guarantee of future results, and there is no guarantee that market forecasts will be realized.
There is no guarantee that the Fund will meet its objectives.
Equity Securities: The market price of equity securities may be adversely affected by financial market, industry, or issuer-specific events. Focus on a particular style or on small or medium-sized companies may enhance that risk.
Real Estate: The fund may be negatively affected by factors specific to the real estate market, including interest rates, leverage, property, and management.
6
Table of Contents
| REAL ESTATE SECURITIES FUND (Continued) |
Industry/Sector Concentration: A fund that focuses its investments in a particular industry or sector will be more sensitive to conditions that affect that industry or sector than a non-concentrated fund.
Prospectus: For additional information on risks, please see the fund’s prospectus.
| Asset Allocations | ||||
The following table presents asset allocations within certain sectors as a percentage of total investments at September 30, 2015.
|
| |||
Apartments | 21 | % | ||
Office | 15 | |||
Regional Malls | 13 | |||
Shopping Centers | 12 | |||
Lodging/Resorts | 10 | |||
Self Storage | 10 | |||
Industrials | 9 | |||
Other (includes short-term investments) | 10 | |||
|
| |||
| 100 | % | |||
|
| |||
7
Table of Contents
| REAL ESTATE SECURITIES FUND (Continued) |
| Average Annual Total Returns1 for periods ended 9/30/15 | ||||||||||||||||||||
| 1 Year | 5 Years | 10 Years | Since Inception | Inception Date | ||||||||||||||||
| Class A Shares at NAV2 | 11.34 | % | 11.70 | % | 7.11 | % | — | — | ||||||||||||
| Class A Shares at POP3,4 | 4.94 | 10.38 | 6.48 | — | — | |||||||||||||||
| Class B Shares at NAV2 | 10.51 | 10.86 | 6.30 | — | — | |||||||||||||||
| Class B Shares with CDSC4 | 9.30 | 10.86 | 6.30 | — | — | |||||||||||||||
| Class C Shares with NAV2 and with CDSC4 | 10.49 | 10.87 | 6.31 | — | — | |||||||||||||||
| Class I Shares at NAV | 11.63 | 11.98 | — | 4.14 | %6 | 12/29/06 | ||||||||||||||
| Class R6 Shares at NAV | — | — | — | 1.54 | 11/12/14 | |||||||||||||||
| S&P 500® Index | -0.61 | 13.34 | 6.80 | —5 | — | |||||||||||||||
| FTSE NAREIT Equity REITs Index | 9.88 | 12.00 | 6.82 | —6 | — | |||||||||||||||
Fund Expense Ratios7: A Shares: 1.38%, B Shares: 2.13%, C Shares: 2.13%, I Shares: 1.13%, R6 Shares 0.95%.
All returns represent past performance which is no guarantee of future results. Current performance may be higher or lower than the performance shown. The investment return and principal value of an investment will fluctuate so that an investor’s shares, when redeemed, may be worth more or less than their original cost. The above table and graph below do not reflect the deduction of taxes that a shareholder would pay on fund distributions or the redemption of fund shares. Please visit Virtus.com for performance data current to the most recent month-end.
| 1 | Total returns are historical and include changes in share price and the reinvestment of both dividends and capital gains distributions. |
| 2 | “NAV” (Net Asset Value) total returns do not include the effect of any sales charge. |
| 3 | “POP” (Public Offering Price) total returns include the effect of the maximum front-end 5.75% sales charge. |
| 4 | CDSC (contingent deferred sales charge) is applied to redemptions of certain classes of shares that do not have a sales charge applied at the time of purchase. CDSC charges for Class B shares decline from 5% to 0% over a five-year period. CDSC charges for certain redemptions of Class A shares made within 18 months of purchases on which a finder’s fee was paid and all redemptions of Class C shares are 1% within the first year and 0% thereafter. |
| 5 | The index returned 5.76% for Class I shares and -4.06% for Class R6 shares since the inception date of the respective class. |
| 6 | The index returned 4.00% for Class I shares and 0.36% for Class R6 shares since the inception date of the respective class. |
| 7 | The expense ratios of the Fund are set forth according to the prospectus for the Fund effective January 28, 2015, as supplemented and revised, and may differ from the expense ratios disclosed in the Financial Highlights tables in this report. See the Financial Highlights for more current expense ratios. |
Growth of $10,000 for periods ended 9/30
This chart assumes an initial investment of $10,000 made on September 30, 2005, for Class A,
Class B, and Class C shares including any applicable sales charges or fees. Performance assumes reinvestment of dividends and capital gain distributions.
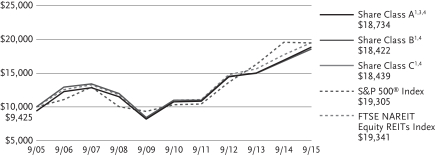
The indexes are unmanaged and not available for direct investment; therefore, their performance does not reflect the expenses associated with active management of an actual portfolio.
8
Table of Contents
VIRTUS REAL ESTATE SECURITIES FUND
SEPTEMBER 30, 2015
($ reported in thousands)
| SHARES | VALUE | |||||||
| COMMON STOCKS—99.3% | ||||||||
| REAL ESTATE INVESTMENT TRUSTS—99.3% | ||||||||
| DIVERSIFIED—1.5% | ||||||||
American Homes 4 Rent Class A | 1,291,800 | $ | 20,772 | |||||
|
| |||||||
| HEALTH CARE—2.7% | ||||||||
HCP, Inc. | 284,221 | 10,587 | ||||||
Ventas, Inc. | 462,961 | 25,954 | ||||||
|
| |||||||
| 36,541 | ||||||||
|
| |||||||
| INDUSTRIAL/OFFICE—27.7% | ||||||||
| Industrial—8.6% | ||||||||
DCT Industrial Trust, Inc. | 1,605,903 | 54,055 | ||||||
Prologis, Inc. | 1,578,550 | 61,405 | ||||||
|
| |||||||
| 115,460 | ||||||||
|
| |||||||
| Mixed—4.2% | ||||||||
Duke Realty Corp. | 1,094,852 | 20,857 | ||||||
Liberty Property Trust | 1,119,344 | 35,270 | ||||||
|
| |||||||
| 56,127 | ||||||||
|
| |||||||
| Office—14.9% | ||||||||
Boston Properties, Inc. | 292,883 | 34,677 | ||||||
Cousins Properties, Inc. | 2,440,850 | 22,505 | ||||||
Douglas Emmett, Inc. | 1,195,829 | 34,344 | ||||||
Highwoods Properties, Inc. | 702,942 | 27,239 | ||||||
Kilroy Realty Corp. | 808,942 | 52,711 | ||||||
Paramount Group, Inc. | 750,136 | 12,602 | ||||||
SL Green Realty Corp. | 138,077 | 14,935 | ||||||
|
| |||||||
| 199,013 | ||||||||
|
| |||||||
| 370,600 | ||||||||
|
| |||||||
| LODGING/RESORTS—10.4% | ||||||||
Host Hotels & Resorts, Inc. | 2,553,336 | 40,368 | ||||||
LaSalle Hotel Properties | 1,059,147 | 30,069 | ||||||
Pebblebrook Hotel Trust | 1,008,713 | 35,759 | ||||||
RLJ Lodging Trust | 1,292,700 | 32,667 | ||||||
|
| |||||||
| 138,863 | ||||||||
|
| |||||||
| RESIDENTIAL—21.6% | ||||||||
| Apartments—20.5% | ||||||||
American Campus Communities, Inc. | 635,424 | 23,028 | ||||||
| SHARES | VALUE | |||||||
| Apartments (continued) | ||||||||
AvalonBay Communities, Inc. | 375,190 | $ | 65,591 | |||||
Camden Property Trust | 515,686 | 38,109 | ||||||
Equity Residential | 957,645 | 71,938 | ||||||
Essex Property Trust, Inc. | 337,040 | 75,302 | ||||||
|
| |||||||
| 273,968 | ||||||||
|
| |||||||
| Manufactured Homes—1.1% | ||||||||
Equity Lifestyle Properties, Inc. | 264,953 | 15,518 | ||||||
|
| |||||||
| 289,486 | ||||||||
|
| |||||||
| RETAIL—25.6% | ||||||||
| Regional Malls—13.4% | ||||||||
General Growth Properties, Inc. | 1,955,475 | 50,784 | ||||||
Macerich Co. (The) | 67,675 | 5,199 | ||||||
Simon Property Group, Inc. | 666,641 | 122,475 | ||||||
|
| |||||||
| 178,458 | ||||||||
|
| |||||||
| Shopping Centers—12.2% | ||||||||
Brixmor Property Group, Inc. | 1,621,196 | 38,066 | ||||||
Federal Realty Investment Trust | 327,200 | 44,646 | ||||||
Regency Centers Corp. | 516,600 | 32,107 | ||||||
Tanger Factory Outlet Centers | 1,482,700 | 48,884 | ||||||
|
| |||||||
| 163,703 | ||||||||
|
| |||||||
| 342,161 | ||||||||
|
| |||||||
| SELF STORAGE—9.8% | ||||||||
CubeSmart | 654,250 | 17,802 | ||||||
Extra Space Storage, Inc. | 661,933 | 51,075 | ||||||
Public Storage | 293,020 | 62,012 | ||||||
|
| |||||||
| 130,889 | ||||||||
| TOTAL COMMON STOCKS (Identified Cost $864,134) | 1,329,312 | |||||||
| TOTAL LONG TERM INVESTMENTS—99.3% | ||||||||
| (Identified cost $864,134) | 1,329,312 | |||||||
See Notes to Financial Statements
9
Table of Contents
VIRTUS REAL ESTATE SECURITIES FUND
SCHEDULE OF INVESTMENTS (Continued)
SEPTEMBER 30, 2015
($ reported in thousands)
| SHARES | VALUE | |||||||
| SHORT-TERM INVESTMENTS—0.2% | ||||||||
| Money Market Mutual Funds—0.2% | ||||||||
Fidelity Money Market Portfolio – Institutional Shares (Seven-day effective yield 0.170%) | 2,189,000 | $ | 2,189 | |||||
| TOTAL SHORT-TERM INVESTMENTS | ||||||||
| (Identified Cost $2,189) | 2,189 | |||||||
TOTAL INVESTMENTS—99.5% (Identified Cost $866,323) |
| 1,331,501 | (1) | |||||
Other assets and liabilities, net—0.5% |
| 7,070 | ||||||
|
| |||||||
| NET ASSETS—100.0% | $ | 1,338,571 | ||||||
|
| |||||||
Abbreviation:
REIT Real Estate Investment Trust
FOOTNOTE LEGEND:
| (1) | Federal Income Tax Information: For tax information at September 30, 2015, see Note 9 Federal Income Tax Information in the Notes to Financial Statements. |
The following table provides a summary of inputs used to value the Fund’s investments as of September 30, 2015 (See Security Valuation Note 2A in the Notes to Financial Statements):
| Total Value at September 30, 2015 | Level 1 Quoted Prices | |||||||
Equity Securities: | ||||||||
Common Stocks | $ | 1,329,312 | $ | 1,329,312 | ||||
Short-term Investments | 2,189 | 2,189 | ||||||
|
|
|
| |||||
Total Investments | $ | 1,331,501 | $ | 1,331,501 | ||||
|
|
|
| |||||
There are no Level 2 (significant observable inputs) or Level 3 (significant unobservable inputs) priced securities.
There were no transfers between Level 1 and Level 2 related to securities held at September 30, 2015.
For information about the abbreviation, See Key Investment Terms on page 4.
See Notes to Financial Statements
10
Table of Contents
VIRTUS REAL ESTATE SECURITIES FUND
STATEMENT OF ASSETS AND LIABILITIES
SEPTEMBER 30, 2015
($ Reported in thousands except shares and per share amounts)
| Assets | ||||
Investment in securities at value(1) | $ | 1,331,501 | ||
Receivables | ||||
Investment securities sold | 4,633 | |||
Fund shares sold | 1,648 | |||
Dividends and interest receivable | 5,941 | |||
Prepaid expenses | 77 | |||
Prepaid trustee retainer | 25 | |||
|
| |||
Total assets | 1,343,825 | |||
|
| |||
| Liabilities | ||||
Payables | ||||
Fund shares repurchased | 3,546 | |||
Investment advisory fees | 803 | |||
Distribution and service fees | 181 | |||
Administration fees | 132 | |||
Transfer agent fees and expenses | 498 | |||
Professional fees | 29 | |||
Trustee fees and expenses | 2 | |||
Other accrued expenses | 63 | |||
|
| |||
Total liabilities | 5,254 | |||
|
| |||
| Net Assets | $ | 1,338,571 | ||
|
| |||
| Net Assets Consist of: | ||||
Capital paid in on shares of beneficial interest | $ | 717,237 | ||
Accumulated undistributed net investment income (loss) | 64 | |||
Accumulated undistributed net realized gain (loss) | 156,092 | |||
Net unrealized appreciation (depreciation) on investments | 465,178 | |||
|
| |||
| Net Assets | $ | 1,338,571 | ||
|
| |||
| Class A | ||||
Net asset value (net assets/shares outstanding) per share | $ | 38.45 | ||
Maximum offering price per share NAV/(1-5.75%) | $ | 40.80 | ||
Shares of beneficial interest outstanding, no par value, unlimited authorization | 16,163,574 | |||
Net Assets | $ | 621,507 | ||
| Class B | ||||
Net asset value (net assets/shares outstanding) and offering price per share | $ | 37.90 | ||
Shares of beneficial interest outstanding, no par value, unlimited authorization | 37,409 | |||
Net Assets | $ | 1,418 | ||
| Class C | ||||
Net asset value (net assets/shares outstanding) and offering price per share | $ | 38.37 | ||
Shares of beneficial interest outstanding, no par value, unlimited authorization | 1,720,520 | |||
Net Assets | $ | 66,023 | ||
| Class I | ||||
Net asset value (net assets/shares outstanding) and offering price per share | $ | 38.42 | ||
Shares of beneficial interest outstanding, no par value, unlimited authorization | 16,867,541 | |||
Net Assets | $ | 647,976 | ||
| Class R6 | ||||
Net asset value (net assets/shares outstanding) and offering price per share | $ | 38.42 | ||
Shares of beneficial interest outstanding, no par value, unlimited authorization | 42,858 | |||
Net Assets | $ | 1,647 | ||
(1) Investment in securities at cost | $ | 866,323 | ||
See Notes to Financial Statements
11
Table of Contents
VIRTUS REAL ESTATE SECURITIES FUND
YEAR ENDED SEPTEMBER 30, 2015
($ reported in thousands)
| Investment Income | ||||
Dividends | $ | 41,621 | ||
|
| |||
Total investment income | 41,621 | |||
|
| |||
| Expenses | ||||
Investment advisory fees | 11,538 | |||
Service fees, Class A | 1,949 | |||
Distribution and service fees, Class B | 22 | |||
Distribution and service fees, Class C | 710 | |||
Administration fees | 1,893 | |||
Transfer agent fees and expenses | 3,595 | |||
Registration fees | 119 | |||
Printing fees and expenses | 142 | |||
Trustees’ fees and expenses | 53 | |||
Professional fees | 36 | |||
Custodian fees | 19 | |||
Interest expense and fees | 7 | |||
Miscellaneous expenses | 79 | |||
|
| |||
Total expenses | 20,162 | |||
|
| |||
| Net investment income (loss) | 21,459 | |||
|
| |||
| Net Realized and Unrealized Gain (Loss) on Investments | ||||
Net realized gain (loss) on investments | 197,947 | |||
Net change in unrealized appreciation (depreciation) on investments | (43,973 | ) | ||
|
| |||
| Net gain (loss) on investments | 153,974 | |||
|
| |||
| Net increase (decrease) in net assets resulting from operations | $ | 175,433 | ||
|
|
See Notes to Financial Statements
12
Table of Contents
VIRTUS REAL ESTATE SECURITIES FUND
STATEMENTS OF CHANGES IN NET ASSETS
(Reported in thousands)
| Year Ended September 30, 2015 | Year Ended September 30, 2014 | |||||||
| INCREASE/(DECREASE) IN NET ASSETS | ||||||||
| From Operations | ||||||||
Net investment income (loss) | $ | 21,459 | $ | 12,621 | ||||
Net realized gain (loss) | 197,947 | 82,965 | ||||||
Net change in unrealized appreciation (depreciation) | (43,973 | ) | 75,694 | |||||
|
|
|
| |||||
| Increase (decrease) in net assets resulting from operations | 175,433 | 171,280 | ||||||
|
|
|
| |||||
| From Distributions to Shareholders | ||||||||
Net investment income, Class A | (9,863 | ) | (5,947 | ) | ||||
Net investment income, Class B | (10 | ) | — | |||||
Net investment income, Class C | (399 | ) | (22 | ) | ||||
Net investment income, Class I | (11,111 | ) | (6,661 | ) | ||||
Net investment income, Class R6 | (12 | ) | — | |||||
Net realized short-term gains, Class A | (2,206 | ) | (3,484 | ) | ||||
Net realized short-term gains, Class B | (7 | ) | (16 | ) | ||||
Net realized short-term gains, Class C | (189 | ) | (289 | ) | ||||
Net realized short-term gains, Class I | (1,983 | ) | (2,785 | ) | ||||
Net realized short-term gains, Class R6 | (— | )(1) | — | |||||
Net realized long-term gains, Class A | (36,741 | ) | (44,343 | ) | ||||
Net realized long-term gains, Class B | (122 | ) | (231 | ) | ||||
Net realized long-term gains, Class C | (3,144 | ) | (3,706 | ) | ||||
Net realized long-term gains, Class I | (33,016 | ) | (35,011 | ) | ||||
Net realized long-term gains, Class R6 | (5 | ) | — | |||||
|
|
|
| |||||
| Decrease in net assets from distributions to shareholders | (98,808 | ) | (102,495 | ) | ||||
|
|
|
| |||||
| From Share Transactions (See Note 5) | ||||||||
| Sale of shares | ||||||||
Class A (5,635 and 7,009 shares, respectively) | 229,447 | 255,043 | ||||||
Class B (—(2) and 1 shares, respectively) | 14 | 24 | ||||||
Class C (249 and 226 shares, respectively) | 10,111 | 8,175 | ||||||
Class I (3,839 and 8,981 shares, respectively) | 156,081 | 320,980 | ||||||
Class R6 (55 and 0 shares, respectively) | 2,219 | — | ||||||
| Reinvestment of distributions | ||||||||
Class A (1,152 and 1,522 shares, respectively) | 46,862 | 50,196 | ||||||
Class B (3 and 6 shares, respectively) | 124 | 207 | ||||||
Class C (83 and 106 shares, respectively) | 3,363 | 3,460 | ||||||
Class I (1,103 and 1,207 shares, respectively) | 44,771 | 39,908 | ||||||
Class R6 (—(2) and 0 shares, respectively) | 17 | — | ||||||
| Shares repurchased | ||||||||
Class A (10,962 and 9,437 shares, respectively) | (439,189 | ) | (339,925 | ) | ||||
Class B (43 and 45 shares, respectively) | (1,694 | ) | (1,607 | ) | ||||
Class C (330 and 412 shares, respectively) | (13,174 | ) | (14,730 | ) | ||||
Class I (6,450 and 5,925 shares, respectively) | (260,654 | ) | (213,956 | ) | ||||
Class R6 (12 and 0 shares, respectively) | (489 | ) | — | |||||
|
|
|
| |||||
| Increase (decrease) in net assets from share transactions | (222,191 | ) | 107,775 | |||||
|
|
|
| |||||
| Net increase (decrease) in net assets | (145,566 | ) | 176,560 | |||||
| Net Assets | ||||||||
Beginning of period | 1,484,137 | 1,307,577 | ||||||
|
|
|
| |||||
| End of period | $ | 1,338,571 | $ | 1,484,137 | ||||
|
|
|
| |||||
Accumulated undistributed net investment income (loss) at end of period | $ | 64 | $ | — | ||||
| (1) | Amount is less than $500. |
| (2) | Amount is less than 500 shares. |
See Notes to Financial Statements
13
Table of Contents
VIRTUS REAL ESTATE SECURITIES FUND
SELECTED PER SHARE DATA AND RATIOS FOR A SHARE OUTSTANDING
THROUGHOUT EACH PERIOD
| Net Asset Value, Beginning of Period | Net Investment Income (Loss)(2) | Net Realized and Unrealized Gain (Loss) | Total from Investment Operations | Dividends from Net Investment Income | Distributions from Net Realized Gains | Total Distributions | Change in Net Asset Value | Net Asset Value, End of Period | Total Return(1) | Net Assets, End of Period (000’s) | Ratio of Expenses to Average Net Assets(3) | Ratio of Net Investment Income (Loss) to Average Net Assets | Portfolio Turnover Rate | |||||||||||||||||||||||||||||||||||||||||||||||||||||||||
Class A | ||||||||||||||||||||||||||||||||||||||||||||||||||||||||||||||||||||||
| 10/1/14 to 9/30/15 | $ | 36.65 | 0.51 | 3.76 | 4.27 | (0.53 | ) | (1.94 | ) | (2.47 | ) | 1.80 | $ | 38.45 | 11.34 | % | $ | 621,507 | 1.36 | % | 1.26 | % | 22 | % | ||||||||||||||||||||||||||||||||||||||||||||||
| 10/1/13 to 9/30/14 | 35.10 | 0.29 | 3.86 | 4.15 | (0.29 | ) | (2.31 | ) | (2.60 | ) | 1.55 | 36.65 | 12.75 | 745,473 | 1.38 | 0.79 | 28 | |||||||||||||||||||||||||||||||||||||||||||||||||||||
| 10/1/12 to 9/30/13 | 34.19 | 0.36 | 0.91 | 1.27 | (0.36 | ) | — | (0.36 | ) | 0.91 | 35.10 | 3.70 | 745,631 | 1.40 | 1.00 | 30 | ||||||||||||||||||||||||||||||||||||||||||||||||||||||
| 10/1/11 to 9/30/12 | 26.05 | 0.21 | 8.24 | 8.45 | (0.31 | ) | — | (0.31 | ) | 8.14 | 34.19 | 32.49 | 789,925 | 1.41 | 0.67 | 24 | ||||||||||||||||||||||||||||||||||||||||||||||||||||||
| 10/1/10 to 9/30/11 | 26.10 | 0.11 | 0.12 | 0.23 | (0.28 | ) | — | (0.28 | ) | (0.05 | ) | 26.05 | 0.82 | 605,073 | 1.46 | 0.39 | 36 | |||||||||||||||||||||||||||||||||||||||||||||||||||||
Class B | ||||||||||||||||||||||||||||||||||||||||||||||||||||||||||||||||||||||
| 10/1/14 to 9/30/15 | $ | 36.13 | 0.17 | 3.74 | 3.91 | (0.20 | ) | (1.94 | ) | (2.14 | ) | 1.77 | $ | 37.90 | 10.51 | % | $ | 1,418 | 2.11 | % | 0.42 | % | 22 | % | ||||||||||||||||||||||||||||||||||||||||||||||
| 10/1/13 to 9/30/14 | 34.62 | (0.01 | ) | 3.84 | 3.83 | (0.01 | ) | (2.31 | ) | (2.32 | ) | 1.51 | 36.13 | 11.91 | 2,770 | 2.13 | (0.02 | ) | 28 | |||||||||||||||||||||||||||||||||||||||||||||||||||
| 10/1/12 to 9/30/13 | 33.72 | 0.10 | 0.89 | 0.99 | (0.09 | ) | — | (0.09 | ) | 0.90 | 34.62 | 2.92 | 3,978 | 2.15 | 0.29 | 30 | ||||||||||||||||||||||||||||||||||||||||||||||||||||||
| 10/1/11 to 9/30/12 | 25.71 | 0.02 | 8.06 | 8.08 | (0.07 | ) | — | (0.07 | ) | 8.01 | 33.72 | 31.49 | 6,761 | 2.16 | 0.07 | 24 | ||||||||||||||||||||||||||||||||||||||||||||||||||||||
| 10/1/10 to 9/30/11 | 25.76 | (0.01 | ) | 0.03 | 0.02 | (0.07 | ) | — | (0.07 | ) | (0.05 | ) | 25.71 | 0.03 | 9,461 | 2.21 | (0.05 | ) | 36 | |||||||||||||||||||||||||||||||||||||||||||||||||||
Class C | ||||||||||||||||||||||||||||||||||||||||||||||||||||||||||||||||||||||
| 10/1/14 to 9/30/15 | $ | 36.59 | 0.22 | 3.73 | 3.95 | (0.23 | ) | (1.94 | ) | (2.17 | ) | 1.78 | $ | 38.37 | 10.49 | % | $ | 66,023 | 2.11 | % | 0.56 | % | 22 | % | ||||||||||||||||||||||||||||||||||||||||||||||
| 10/1/13 to 9/30/14 | 35.04 | 0.01 | 3.87 | 3.88 | (0.02 | ) | (2.31 | ) | (2.33 | ) | 1.55 | 36.59 | 11.91 | 62,889 | 2.13 | 0.04 | 28 | |||||||||||||||||||||||||||||||||||||||||||||||||||||
| 10/1/12 to 9/30/13 | 34.14 | 0.08 | 0.92 | 1.00 | (0.10 | ) | — | (0.10 | ) | 0.90 | 35.04 | 2.93 | 63,005 | 2.15 | 0.23 | 30 | ||||||||||||||||||||||||||||||||||||||||||||||||||||||
| 10/1/11 to 9/30/12 | 26.02 | (0.03 | ) | 8.22 | 8.19 | (0.07 | ) | — | (0.07 | ) | 8.12 | 34.14 | 31.48 | 60,941 | 2.16 | (0.10 | ) | 24 | ||||||||||||||||||||||||||||||||||||||||||||||||||||
| 10/1/10 to 9/30/11 | 26.06 | (0.09 | ) | 0.12 | 0.03 | (0.07 | ) | — | (0.07 | ) | (0.04 | ) | 26.02 | 0.08 | 44,853 | 2.21 | (0.30 | ) | 36 | |||||||||||||||||||||||||||||||||||||||||||||||||||
The footnote legend is at the end of the financial highlights
See Notes to Financial Statements
14
Table of Contents
VIRTUS REAL ESTATE SECURITIES FUND
FINANCIAL HIGHLIGHTS (Continued)
SELECTED PER SHARE DATA AND RATIOS FOR A SHARE OUTSTANDING
THROUGHOUT EACH PERIOD
| Net Asset Value, Beginning of Period | Net Investment Income (Loss)(2) | Net Realized and Unrealized Gain (Loss) | Total from Investment Operations | Dividends from Net Investment Income | Distributions from Net Realized Gains | Total Distributions | Change in Net Asset Value | Net Asset Value, End of Period | Total Return(1) | Net Assets, End of Period (000’s) | Ratio of Expenses to Average Net Assets(3) | Ratio of Net Investment Income (Loss) to Average Net Assets | Portfolio Turnover Rate | |||||||||||||||||||||||||||||||||||||||||||||||||||||||||
Class I | ||||||||||||||||||||||||||||||||||||||||||||||||||||||||||||||||||||||
| 10/1/14 to 9/30/15 | $ | 36.62 | 0.62 | 3.75 | 4.37 | (0.63 | ) | (1.94 | ) | (2.57 | ) | 1.80 | $ | 38.42 | 11.63 | % | $ | 647,976 | 1.11 | % | 1.55 | % | 22 | % | ||||||||||||||||||||||||||||||||||||||||||||||
| 10/1/13 to 9/30/14 | 35.07 | 0.39 | 3.86 | 4.25 | (0.39 | ) | (2.31 | ) | (2.70 | ) | 1.55 | 36.62 | 13.04 | 673,005 | 1.13 | 1.07 | 28 | |||||||||||||||||||||||||||||||||||||||||||||||||||||
| 10/1/12 to 9/30/13 | 34.16 | 0.43 | 0.92 | 1.35 | (0.44 | ) | — | (0.44 | ) | 0.91 | 35.07 | 3.96 | 494,963 | 1.15 | 1.21 | 30 | ||||||||||||||||||||||||||||||||||||||||||||||||||||||
| 10/1/11 to 9/30/12 | 26.03 | 0.30 | 8.22 | 8.52 | (0.39 | ) | — | (0.39 | ) | 8.13 | 34.16 | 32.80 | 422,374 | 1.16 | 0.93 | 24 | ||||||||||||||||||||||||||||||||||||||||||||||||||||||
| 10/1/10 to 9/30/11 | 26.08 | 0.19 | 0.12 | 0.31 | (0.36 | ) | — | (0.36 | ) | (0.05 | ) | 26.03 | 1.08 | 320,059 | 1.21 | 0.65 | 36 | |||||||||||||||||||||||||||||||||||||||||||||||||||||
Class R6 | ||||||||||||||||||||||||||||||||||||||||||||||||||||||||||||||||||||||
| 11/12/14(4) to 9/30/15 | $ | 40.32 | 0.79 | (0.06 | ) | 0.73 | (0.69 | ) | (1.94 | ) | (2.63 | ) | (1.90 | ) | $ | 38.42 | 1.54 | %(6) | $ | 1,647 | 0.94 | %(5) | 2.30 | %(5) | 22 | % | ||||||||||||||||||||||||||||||||||||||||||||
Footnote Legend
| (1) | Sales charges, where applicable, are not reflected in the total return calculation. |
| (2) | Computed using average shares outstanding. |
| (3) | The Fund may invest in other funds, and the annualized expense ratios do not reflect fees and expenses associated with the underlying funds. |
| (4) | Inception date of class. |
| (5) | Annualized. |
| (6) | Not annualized. |
See Notes to Financial Statements
15
Table of Contents
VIRTUS REAL ESTATE SECURITIES FUND
SEPTEMBER 30, 2015
Note 1. Organization
Virtus Opportunities Trust (the “Trust”) is organized as a Delaware statutory trust and is registered under the Investment Company Act of 1940, as amended (“1940 Act”), as an open-end management investment company.
As of the date of this report, 32 funds of the Trust are offered for sale, of which the Real Estate Securities Fund (the “Fund”) is reported in this annual report. The Fund’s investment objectives is outlined in the Fund Summary page. There is no guarantee the Fund will achieve its objective.
The Fund offers Class A shares, Class C shares, Class I shares and Class R6 shares for sale. Class B shares are no longer available for purchase by new or existing shareholders, except by existing shareholders through Qualifying Transactions. (For information regarding Qualifying Transactions, refer to the Fund’s prospectus.)
Class A shares are sold with a front-end sales charge of up to 5.75% with some exceptions. Generally, Class A shares are not subject to any charges by the Fund when redeemed; however, a 1% contingent deferred sales charge (“CDSC”) may be imposed on certain redemptions made within a certain period following purchases on which a finder’s fee has been paid. The period for which the CDSC applies for the Fund is 18 months. The CDSC period begins on the last day of the month preceding the month in which the purchase was made.
Class B shares were generally sold with a CDSC which declines from 5% to zero depending on the period of time the shares are held.
Class C shares are generally sold with a 1% CDSC, applicable if redeemed within one year of purchase. Class I shares are sold without a front-end sales charge or CDSC.
Class R6 shares are only available to participants in employer-sponsored retirement plans, such as 401(k) plans, profit sharing plans, defined benefit plans and other employer directed plans. Class R6 shares do not carry sales commissions or pay Rule 12b-1 fees.
Virtus Mutual Funds may impose an annual fee on accounts having balances of less than $2,500. The small account fee may be waived in certain circumstances, as disclosed in the prospectuses and/or statements of additional information. The fees collected will be used to offset certain expenses of the funds.
Each class of shares has identical voting, dividend, liquidation and other rights and the same terms and conditions, except that each class bears different distribution and/or service fees under a Board-approved Rule 12b-1 and/or shareholder service plan (“12b-1 plan”) and has exclusive voting rights with respect to such plans. Class I shares and Class R6 shares are not subject to a 12b-1 plan. Income and other expenses as well as realized and unrealized gains and losses of the Fund are borne pro rata by the holders of each class of shares.
Note 2. Significant Accounting Policies
The following is a summary of significant accounting policies consistently followed by the Trust in the preparation of its financial statements. The preparation of financial statements in conformity with accounting principles generally accepted in the United States of America requires management to make estimates and assumptions that affect the reported amounts of assets and liabilities, disclosure of contingent assets and liabilities at the date of the financial statements and the reported amounts of increases and decreases in net assets from operations during the reporting period. Actual results could differ from those estimates and those differences could be significant.
16
Table of Contents
VIRTUS REAL ESTATE SECURITIES FUND
NOTES TO FINANCIAL STATEMENTS (Continued)
SEPTEMBER 30, 2015
| A. | Security Valuation |
Security valuation procedures for the Fund, which include nightly price variance, as well as back-testing such as bi-weekly unchanged price, monthly secondary source and transaction analysis, have been approved by the Board of Trustees (the “Board”, or the “Trustees”). All internally fair valued securities are approved by a valuation committee (the “Valuation Committee”) appointed by the Board. The Valuation Committee is comprised of certain members of management as identified to the Board and convenes independently from portfolio management. All internally fair valued securities are updated daily and reviewed in detail by the Valuation Committee monthly unless changes occur within the period. The Valuation Committee reviews the validity of the model inputs and any changes to the model. Quarterly fair valuations are reviewed by the Board.
The Fund utilizes a fair value hierarchy which prioritizes the inputs to valuation techniques used to measure fair value into three broad levels. It is the Fund’s policy to recognize transfers at the end of the reporting period.
| • Level 1 – | quoted prices in active markets for identical securities (security types generally include listed equities). |
| • Level 2 – | prices determined using other significant observable inputs (including quoted prices for similar securities, interest rates, prepayment speeds, credit risk, etc.). |
| • Level 3 – | prices determined using significant unobservable inputs (including the Valuation Committee’s own assumptions in determining the fair value of investments). |
A description of the valuation techniques applied to the Fund’s major categories of assets and liabilities measured at fair value on a recurring basis is as follows:
Equity securities are valued at the official closing price (typically last sale) on the exchange on which the securities are primarily traded or, if no closing price is available, at the last bid price and are categorized as Level 1 in the hierarchy. Restricted equity securities and private placements that are not widely traded, are illiquid, or are internally fair valued by the Valuation Committee, are generally categorized as Level 3 in the hierarchy.
Certain non-U.S. securities may be fair valued in cases where closing prices are not readily available or are deemed not reflective of readily available market prices. For example, significant events (such as movement in the U.S. securities market, or other regional and local developments) may occur between the time that non-U.S. markets close (where the security is principally traded) and the time that the Fund calculates its net asset value (“NAV”) (at the close of regular trading on the New York Stock Exchange (“NYSE”), generally 4 p.m. Eastern time) that may impact the value of securities traded in these non-U.S. markets. In such cases the Fund fair values non-U.S. securities using an independent pricing service which considers the correlation of the trading patterns of the non-U.S. security to the intraday trading in the U.S. markets for investments such as American Depositary Receipts, financial futures, exchange-traded funds, and certain indexes, as well as prices for similar securities. Such fair valuations are categorized as Level 2 in the hierarchy. Because the frequency of significant events is not predictable, fair valuation of certain non-U.S. common stocks may occur on a frequent basis.
Listed derivatives that are actively traded are valued based on quoted prices from the exchange and are categorized as Level 1 in the hierarchy. Over-the-counter derivative
17
Table of Contents
VIRTUS REAL ESTATE SECURITIES FUND
NOTES TO FINANCIAL STATEMENTS (Continued)
SEPTEMBER 30, 2015
contracts, which include forward currency contracts and equity-linked instruments, do not require material subjectivity as pricing inputs are observed from actively quoted markets and are categorized as Level 2 in the hierarchy.
Investments in open-end mutual funds are valued at NAV. Investments in closed-end funds are valued as of the close of regular trading on the NYSE each business day. Both are categorized as Level 1 in the hierarchy.
A summary of the inputs used to value the Fund’s net assets by each major security type is disclosed at the end of the Schedule of Investments for the Fund. The inputs or methodologies used for valuing securities are not necessarily an indication of the risk associated with investing in those securities.
| B. | Security Transactions and Investment Income |
Security transactions are recorded on the trade date. Realized gains and losses from the sale of securities are determined on the identified cost basis. Dividend income is recognized on the ex-dividend date or, in the case of certain foreign securities, as soon as the Fund is notified. Interest income is recorded on the accrual basis. The Fund amortizes premiums and accretes discounts using the effective interest method.
Dividend income from REIT investments is recorded using management’s estimate of the income included in distributions received from the REIT investments. Distributions received in excess of this estimated amount are recorded as a reduction of the cost of investments or reclassified to capital gains. The actual amounts of income, return of capital, and capital gains are only determined by each REIT after its fiscal year-end, and may differ from the estimated amounts.
| C. | Income Taxes |
The Fund is treated as a separate taxable entity. It is the intention of the Fund to comply with the requirements of Subchapter M of the Internal Revenue Code and to distribute substantially all of its taxable income to its shareholders. Therefore, no provision for federal income taxes or excise taxes has been made.
The Fund may be subject to foreign taxes on income, gains on investments or currency repatriation, a portion of which may be recoverable. The Fund will accrue such taxes and recoveries as applicable based upon current interpretations of the tax rules and regulations that exist in the markets in which it invests.
Management of the Fund has concluded that there are no significant uncertain tax positions that would require recognition in the financial statements. As of September 30, 2015, the tax years that remain subject to examination by the major tax jurisdictions under the statute of limitations are from the year 2012 forward (with limited exceptions).
| D. | Distributions to Shareholders |
Distributions are recorded by the Fund on the ex-dividend date. Income and capital gain distributions are determined in accordance with income tax regulations that may differ from accounting principles generally accepted in the United States of America. These differences may include the treatment of non-taxable dividends, market premium and discount, non-deductible expenses, expiring capital loss carryovers, foreign currency gain or loss, gain or loss on futures contracts, partnerships, operating losses and losses deferred due to wash sales. Permanent book and tax basis differences relating to shareholder distributions will result in reclassifications to capital paid in on shares of beneficial interest.
18
Table of Contents
VIRTUS REAL ESTATE SECURITIES FUND
NOTES TO FINANCIAL STATEMENTS (Continued)
SEPTEMBER 30, 2015
| E. | Expenses |
Expenses incurred together by the Fund and other affiliated mutual funds are allocated in proportion to the net assets of each such fund, except where allocation of direct expense to each fund or an alternative allocation method can be more appropriately used.
In addition to the net operating expenses that the Fund bears directly, the shareholders of the Fund indirectly bear the Fund’s pro-rata expenses of any underlying mutual funds in which the Fund invests.
Note 3. Investment Advisory Fees and Related Party Transactions
($ reported in thousands except as noted)
| A. | Adviser |
Virtus Investment Advisers, Inc. (the “Adviser”), an indirect, wholly-owned subsidiary of Virtus Investment Partners, Inc. (“Virtus”), is the adviser to the Trust. The Adviser manages the Fund’s investment program and general operations of the Fund, including oversight of the Fund’s subadviser.
As compensation for its services to the Fund, the Adviser is entitled to a fee based upon the following annual rates as a percentage of the average daily net assets of the Fund:
First $1 Billion | $1 Billion through | $2+ Billion | ||
| 0.75% | 0.70% | 0.65% |
| B. | Subadviser |
Duff & Phelps Investment Management Co. (the “Subadviser”), an indirect wholly-owned subsidiary of Virtus, is the subadviser to the Fund. The Subadviser manages the investments of the Fund for which it is paid a fee by the Adviser.
| C. | Distributor |
VP Distributors, LLC (“VP Distributors”), an indirect wholly-owned subsidiary of Virtus, serves as the distributor of the Fund’s shares. VP Distributors has advised the Fund that for the fiscal year (the “period”) ended September 30, 2015, it retained net commissions of $23 for Class A shares and deferred sales charges of $1, $0 and $0 for Class A shares, Class B shares and Class C shares, respectively.
In addition, the Fund pays VP Distributors distribution and/or service fees under a 12b-1 plan as a percentage of the daily average net assets of each respective class at the annual rates as follows: 0.25% for Class A shares, 1.00% for Class B shares, and 1.00% for Class C shares. Class R6 shares and Class I shares are not subject to a 12b-1 plan.
Under certain circumstances, shares of certain Virtus Mutual Funds may be exchanged for shares of the same class of certain other Virtus Mutual Funds on the basis of the relative NAV per share at the time of the exchange. On exchanges with share classes that carry a CDSC, the CDSC schedule of the original shares purchased continues to apply.
19
Table of Contents
VIRTUS REAL ESTATE SECURITIES FUND
NOTES TO FINANCIAL STATEMENTS (Continued)
SEPTEMBER 30, 2015
| D. | Administrator and Transfer Agent |
Virtus Fund Services, LLC, an indirect wholly-owned subsidiary of Virtus, serves as administrator and transfer agent to the Fund.
For the period ended September 30, 2015, the Fund incurred administration fees totaling $1,514 which are included in the Statement of Operations.
For the period ended September 30, 2015, the Fund incurred transfer agent fees totaling $3,478 which are included in the Statement of Operations. A portion of these fees was paid to outside entities that also provide services to the Trust.
| E. | Affiliated Shareholders |
At September 30, 2015, Virtus and its affiliates, and the retirement plans of Virtus and its affiliates, held shares of the Fund which may be redeemed at any time that aggregated to the following:
| Shares | Aggregate Net Asset Value | |||||||
| 200,403 | $ | 7,699 | ||||||
Note 4. Purchases and Sales of Securities
($ reported in thousands)
Purchases and sales of securities (excluding U.S. Government and agency securities and short-term securities) during the period ended September 30, 2015, were as follows:
| Purchases | Sales | |||||||
| $ | 330,978 | $ | 615,313 | |||||
There were no purchases or sales of long-term U.S. Government and agency securities for the period ended September 30, 2015.
Note 5. Borrowings
($ reported in thousands)
On July 2, 2015, the Fund and other affiliated Funds entered into a $50,000 secured Line of Credit Agreement (the “Agreement”) with a commercial bank (the “Bank”) that allows the Fund to borrow cash from the Bank to manage large unexpected redemptions and trade fails, up to a limit of one-fifth of the Fund’s total net assets in accordance with the Agreement. Interest is charged at the higher of the LIBOR (London Interbank Offered Rate) or the Federal Funds rate plus an additional percentage rate on the amount borrowed. Commitment fees are charged on the undrawn balance. The Funds are individually, and not jointly, liable for their particular advances, if any, under the line of credit. The Bank has the ability to require repayment of outstanding borrowings under the Agreement upon certain circumstances such as an event of default.
From July 2, 2015 to September 30, 2015, the average daily borrowings under the Agreement and the weighted daily average interest rate were $12,500 and 1.19%, respectively. The Fund had no outstanding borrowings as of September 30, 2015.
20
Table of Contents
VIRTUS REAL ESTATE SECURITIES FUND
NOTES TO FINANCIAL STATEMENTS (Continued)
SEPTEMBER 30, 2015
Note 6. 10% Shareholders
As of September 30, 2015, the Fund had individual shareholder account(s) and/or omnibus shareholder account(s) (comprised of a group of individual shareholders), which individually amounted to more than 10% of the total shares outstanding of the Fund as detailed below:
| % of Shares Outstanding | Number of Accounts | |||||||
| 27 | % | 2 | ||||||
The shareholders are not affiliated with Virtus.
Note 7. Credit Risk and Asset Concentrations
The Fund may invest a high percentage of its assets in specific sectors of the market in its pursuit of its investment objective. Fluctuations in these sectors of concentration may have a greater impact on the Fund, positive or negative, than if the Fund did not concentrate its investments in such sectors.
Note 8. Indemnifications
Under the Trust’s organizational documents, its Trustees and officers are indemnified against certain liabilities arising out of the performance of their duties to the Fund. Each Trustee has also entered into an indemnification agreement with the Trust. In addition, in the normal course of business, the Fund enters into contracts that provide a variety of indemnifications to other parties. The Fund’s maximum exposure under these arrangements is unknown as this would involve future claims that may be made against the Fund and that have not occurred. However, the Fund has not had prior claims or losses pursuant to these arrangements and expects the risk of loss to be remote.
Note 9. Federal Income Tax Information
($ reported in thousands)
At September 30, 2015, federal tax cost and aggregate gross unrealized appreciation (depreciation) of securities held by the Fund were as follows:
Federal | Unrealized | Unrealized | Net Unrealized | |||
| $889,060 | $468,675 | $(26,234) | $442,441 |
Under the Regulated Investment Company Modernization Act of 2010 (the “Act”), net capital losses recognized for tax years beginning after December 22, 2010, may be carried forward indefinitely, and their character is retained as short-term and/or long-term losses.
The components of distributable earnings on a tax basis (excluding unrealized appreciation (depreciation) (which are disclosed above) consist of undistributed ordinary income of $8,841 and undistributed long-term capital gains of $170,052.
The differences between the book and tax basis components of distributable earnings relate principally to the timing of recognition of income and gains for federal income tax purposes. Short-term gain distributions reported in the Statements of Changes in Net Assets, if any, are reported as ordinary income for federal tax purposes. Distributions are determined on a tax basis and may differ from net investment income and realized capital gains for financial reporting purposes.
21
Table of Contents
VIRTUS REAL ESTATE SECURITIES FUND
NOTES TO FINANCIAL STATEMENTS (Continued)
SEPTEMBER 30, 2015
The tax character of dividends and distributions paid during the years ended September 30, 2015 and 2014 was as follows:
| Year Ended | ||||||||
| 2015 | 2014 | |||||||
Ordinary Income | $ | 25,780 | $ | 19,204 | ||||
Long-Term Capital Gains | 73,028 | 83,291 | ||||||
|
|
|
| |||||
Total | $ | 98,808 | $ | 102,495 | ||||
|
|
|
| |||||
Note 10. Regulatory Matters and Litigation
From time to time, the Fund’s investment adviser and/or its affiliates and/or subadvisers may be involved in litigation and arbitration as well as examinations and investigations by various regulatory bodies, including the SEC, involving compliance with, among other things, securities laws, client investment guidelines, laws governing the activities of broker-dealers and other laws and regulations affecting their products and other activities. At this time, the Fund’s investment adviser believes that the outcomes of such matters are not likely, either individually or in the aggregate, to be material to these financial statements.
As part of an SEC non-public, confidential investigation of a matter entitled – In the Matter of F-Squared Investments Inc., the SEC staff informed the Fund’s investment adviser that it was inquiring into whether it had violated securities laws or regulations with respect to circumstances related to that matter. On November 16, 2015, without admitting or denying the SEC’s findings, the Fund’s investment adviser consented to the entry of an order providing that it cease and desist from committing or causing any violations and future violations of Sections 204, 206(2) and 206(4) of the Investment Advisers Act of 1940, as amended, and Rules 204-2, 206(4)-1, 206(4)-7 and 206(4)-8 thereunder, and Section 34(b) of the Investment Company Act of 1940, as amended; agreed to a censure; and paid $16.5 million, which included a civil money penalty of $2 million, disgorgement of $13.4 million and prejudgment interest of $1.1 million.
On February 20, 2015, a putative class action complaint (In re Virtus Investment Partners, Inc. Securities Litigation; formerly styled as Tom Cummins v. Virtus Investment Partners Inc. et al) alleging violation of the federal securities laws was filed by an individual shareholder against Virtus and certain of its officers (the “defendants”) in the United States District Court for the Southern District of New York. On August 21, 2015, the lead plaintiff filed a Consolidated Class Action Complaint (the “Consolidated Complaint”) amending the originally filed complaint and adding the Trust as a defendant. The Consolidated Complaint was purportedly filed on behalf of all purchasers of Virtus common stock between January 25, 2013 and May 11, 2015 (the “Class Period”). The Consolidated Complaint alleges that during the Class Period, the defendants knowingly disseminated materially false and misleading statements and concealed material adverse facts relating to certain funds previously subadvised by F-Squared Investments, Inc. and/or its affiliates (“F-Squared”). The plaintiff seeks to recover unspecified damages. Virtus and its affiliates, including the Fund’s adviser, believe that the suit is without merit and intend to defend it vigorously. A motion to dismiss the Consolidated Complaint was filed on behalf of the defendants on October 21, 2015. The Trust believes that the risk of loss to the Fund as a result of this suit is remote. The adviser does not believe that the suit will have any impact on its ability to provide services to the Fund.
22
Table of Contents
VIRTUS REAL ESTATE SECURITIES FUND
NOTES TO FINANCIAL STATEMENTS (Continued)
SEPTEMBER 30, 2015
On May 8, 2015, a putative class action complaint (Mark Youngers v. Virtus Investment Partners, Inc. et al) alleging violations of certain provisions of the federal securities laws was filed in the United States District Court for the Central District of California. The complaint, which was purportedly filed on behalf of purchasers of certain Virtus Funds previously subadvised by F-Squared between May 8, 2010 and December 22, 2014, inclusive (the “Class Period”), alleges claims against Virtus, certain Virtus officers and affiliates (including the Fund’s investment adviser, Euclid Advisors LLC and VP Distributors, LLC), the trustees and certain officers of the Trust, and certain other parties (the “defendants”). The complaint alleges that during the Class Period the defendants knowingly disseminated materially false and misleading statements and concealed or omitted material facts necessary to make the statements made not misleading. On October 1, 2015, the plaintiff filed a First Amended Class Action Complaint which, among other things, added a derivative claim for breach of fiduciary duty on behalf of the Trust. On October 19, 2015, the Court entered an order transferring the action to the Southern District of New York. Virtus and its affiliates, including the Fund’s adviser, believe the plaintiff’s claims asserted in the complaint are frivolous and intend to defend them vigorously. The Trust believes that the risk of loss to the Fund as a result of this suit is remote. The adviser does not believe that the suit will have any impact on its ability to provide services to the Fund.
Note 11. Subsequent Events
Management has evaluated the impact of all subsequent events on the Fund through the date the financial statements were issued, and has determined that there are no subsequent events requiring recognition or disclosure in the financial statements.
23
Table of Contents

Report of Independent Registered Public
Accounting Firm
To the Board of Trustees of
Virtus Opportunities Trust and Shareholders of
Virtus Real Estate Securities Fund:
In our opinion, the accompanying statement of assets and liabilities, including the schedule of investments, and the related statements of operations and of changes in net assets and the financial highlights present fairly, in all material respects, the financial position of the Virtus Real Estate Securities Fund (one of the funds constituting Virtus Opportunities Trust, hereafter referred to as the “Fund”) at September 30, 2015, the results of its operations for the year then ended, the changes in its net assets for each of the two years in the period then ended and the financial highlights for each of the periods indicated, in conformity with accounting principles generally accepted in the United States of America. These financial statements and financial highlights (hereafter referred to as “financial statements”) are the responsibility of the Fund’s management. Our responsibility is to express an opinion on these financial statements based on our audits. We conducted our audits of these financial statements in accordance with the standards of the Public Company Accounting Oversight Board (United States). Those standards require that we plan and perform the audit to obtain reasonable assurance about whether the financial statements are free of material misstatement. An audit includes examining, on a test basis, evidence supporting the amounts and disclosures in the financial statements, assessing the accounting principles used and significant estimates made by management, and evaluating the overall financial statement presentation. We believe that our audits, which included confirmation of securities at September 30, 2015 by correspondence with the custodian and brokers, provide a reasonable basis for our opinion.
PricewaterhouseCoopers LLP
Philadelphia, Pennsylvania
November 20, 2015
24
Table of Contents
VIRTUS REAL ESTATE SECURITIES FUND
TAX INFORMATION NOTICE (Unaudited)
SEPTEMBER 30, 2015
For the fiscal year ended September 30, 2015, the Fund makes the following disclosures for federal income tax purposes. Below is listed the percentage, or the maximum amount allowable, of its ordinary income dividends (“QDI”) to qualify for the lower tax rates applicable to individual shareholders, and the percentage of ordinary income dividends earned by the Fund which qualifies for the dividends received deduction (“DRD”) for corporate shareholders. The actual percentage of QDI and DRD for the calendar year will be designated in year-end tax statements. The Fund designates the amount below as long-term capital gains dividends (“LTCG”) taxable at a 20% rate, or lower depending on the shareholder’s income ($ reported in thousands). LTCG amount, if subsequently different, will be designated in the next annual report.
QDI | DRD | LTCG | ||
| 0% | 0% | $181,095 |
25
Table of Contents
FUND MANAGEMENT TABLES (UNAUDITED)
Information pertaining to the Trustees and officers of the Trust as of September 30, 2015, is set forth below. The statement of additional information (SAI) includes additional information about the Trustees and is available without charge, upon request, by calling (800) 243-1574. The address of each individual, unless otherwise noted, is 100 Pearl Street, Hartford, CT 06103-4506. There is no stated term of office for Trustees of the Trust.
Independent Trustees
| Name, Year of Birth, Year Elected and Number of Funds Overseen | Principal Occupation(s) Other Directorships Held by Trustee | |
McClellan, Hassell H. YOB: 1945 Elected: 2015 55 Portfolios | Retired. Professor (1984 to 2013), Wallace E. Carroll School of Management, Boston College; Trustee, Virtus Variable Insurance Trust (9 portfolios) (since 2008); Trustee (since 2015), Virtus Mutual Fund Complex (46 portfolios); Trustee, John Hancock Fund Complex (since 2000), John Hancock Funds (collectively, 234 portfolios); and Director (since 2010), Barnes Group, Inc. (diversified global components manufacturer and logistical services company). | |
McLoughlin, Philip YOB: 1946 Elected: 2006 69 Portfolios | Director (since 1991) and Chairman (since 2010), World Trust Fund (closed-end investment firm in Luxembourg); Director (since 1995), closed-end funds managed by Duff & Phelps Investment Management Co. (4 portfolios); Chairman (since 2002) and Trustee (since 1989), Virtus Mutual Fund Complex (46 portfolios); Chairman and Trustee (since 2003), Virtus Variable Insurance Trust (9 portfolios); Trustee/Director and Chairman (since 2011), Virtus Closed-End Funds (3 portfolios); Trustee and Chairman (since 2013), Virtus Alternative Solutions Trust (7 portfolios); Partner (2006 to 2010), Cross Pond Partners, LLC (investment management consultant); and Managing Director (2008 to 2010), SeaCap Partners, LLC (investment management). | |
McNamara, Geraldine M. YOB: 1951 Elected: 2006 59 Funds | Retired. Trustee (since 2001), Virtus Mutual Fund Complex (46 portfolios); and Director (since 2003), closed-end funds managed by Duff & Phelps Investment Management Co. (4 portfolios); and Trustee (since 2015), Virtus Variable Insurance Trust (9 portfolios). | |
Oates, James M. YOB: 1946 Elected: 2006 56 Funds | Managing Director (since 1994), Wydown Group (consulting firm). Trustee (since 1987), Virtus Mutual Fund Complex (46 portfolios); Director (since 1996), Stifel Financial; Director (1998 to 2014), Connecticut River Bancorp; Chairman and Director (1999 to 2014), Connecticut River Bank; Chairman (since 2000), Emerson Investment Management, Inc.; Director (2002 to 2014), New Hampshire Trust Company; Chairman and Trustee (since 2005), John Hancock Fund Complex (228 portfolios); Non-Executive Chairman (2007 to 2011), Hudson Castle Group, Inc. (formerly IBEX Capital Markets, Inc.) (financial services); Trustee/Director (since 2013), Virtus Closed-End Funds (3 portfolios); and Trustee (since 2013), Virtus Alternative Solutions Trust (7 portfolios). | |
Segerson, Richard E. YOB: 1948 Elected: 2006 46 Funds | Trustee (since 1983), Virtus Mutual Fund Complex (46 portfolios); and Managing Director (1998 to 2013), Northway Management Company. | |
Verdonck, Ferdinand L.J. YOB: 1942 Elected: 2006 46 Funds | Trustee (since 2002), Virtus Mutual Fund Complex (46 portfolios). |
26
Table of Contents
FUND MANAGEMENT TABLES (UNAUDITED) (Continued)
Interested Trustee
The individual listed below is an “interested person” of the Trust, as defined in Section 2(a)(19) of the 1940 Act, as amended, and the rules and regulations thereunder.
| Name, Year of Birth, Year Elected and Number of Funds Overseen | Principal Occupation(s) During Past 5 Years and | |
Aylward, George R.* Trustee and President YOB: 1964 Elected: 2006 67 Funds | Director, President and Chief Executive Officer (since 2008), Virtus Investment Partners, Inc. and/or certain of its subsidiaries; various senior officer positions with Virtus affiliates (since 2005); Trustee (since 2006), Virtus Mutual Funds (46 portfolios); Chairman, President and Chief Executive Officer (since 2006), The Zweig Closed-End Funds (2 portfolios); Trustee (since 2012) and President (since 2010), Virtus Variable Insurance Trust (9 portfolios); Trustee and President (since 2011), Virtus Closed-End Funds (3 portfolios); Director (since 2013), Virtus Global Funds, PLC (2 portfolios); and Trustee (since 2013), Virtus Alternative Solutions Trust (7 portfolios). |
27
Table of Contents
FUND MANAGEMENT TABLES (UNAUDITED) (Continued)
Officers of the Trust Who Are Not Trustees
Name, Address and Year of Birth | Position(s) Held with Time Served | Principal Occupation(s) During Past 5 Years | ||
Waltman, Francis G. YOB: 1962 | Executive Vice President (since 2013); Senior Vice President (2008-2013). | Virtus Investment Partners, Inc. and/or certain of its subsidiaries; various senior officer positions (since 2006) with Virtus affiliates; Executive Vice President (since 2013), Senior Vice President (2008 to 2013), Virtus Mutual Fund Complex; Executive Vice President (since 2013), Senior Vice President (2010 to 2013), Virtus Variable Insurance Trust; Executive Vice President (since 2013), Senior Vice President (2011 to 2013), Virtus Closed-End Funds; Director (since 2013), Virtus Global Funds PLC; and Executive Vice President (since 2013), Virtus Alternative Solutions Trust. | ||
Bradley, W. Patrick YOB: 1972 | Senior Vice President (since 2013); Vice President (2011 to 2013); Chief Financial Officer and Treasurer (since 2006). | Senior Vice President, Fund Services (since 2010), Virtus Investment Partners, Inc. and/or certain of its subsidiaries; various officer positions (since 2006) with Virtus affiliates; Senior Vice President (since 2013), Vice President (2011 to 2013), Chief Financial Officer and Treasurer (since 2004), Virtus Variable Insurance Trust; Senior Vice President (since 2013), Vice President (2011 to 2013), Chief Financial Officer and Treasurer (since 2006), Virtus Mutual Fund Complex; Senior Vice President (since 2013), Vice President (2012 to 2013) and Treasurer (Chief Financial Officer) (since 2007), The Zweig Closed-End Funds; Senior Vice President (since 2013), Vice President (2011 to 2013), Chief Financial Officer and Treasurer (since 2011), Virtus Closed-End Funds; Vice President and Assistant Treasurer (since 2011), Duff & Phelps Global Utility Income Fund Inc.; Director (since 2013), Virtus Global Funds, PLC; and Senior Vice President, Chief Financial Officer and Treasurer (since 2013), Virtus Alternative Solutions Trust. | ||
Carr, Kevin J. YOB: 1954 | Senior Vice President, since 2013; Vice President (2005-2013); Chief Legal Officer, Counsel and Secretary (since 2005). | Senior Vice President (since 2009), Vice President, Counsel and Secretary (2008 to 2009), Virtus Investment Partners, Inc. and/or certain of its subsidiaries; various senior officer positions (since 2005) with Virtus affiliates; Senior Vice President (since 2013), Vice President (2005 to 2013), Chief Legal Officer, Counsel and Secretary (since 2005), Virtus Mutual Fund Complex; Senior Vice President (2013 to 2014), Vice President (2012 to 2013) and Assistant Secretary (since 2012), Secretary and Chief Legal Officer (2005 to 2012), The Zweig Closed-End Funds; Assistant Secretary (since 2013), Vice President, Chief Legal Officer, Counsel and Secretary (2010 to 2013), Virtus Variable Insurance Trust; Vice President and Assistant Secretary (since 2011), Duff & Phelps Global Utility Income Fund Inc.; Senior Vice President and Assistant Secretary (2013 to 2014), Vice President and Assistant Secretary (2012 to 2013), Vice President, Chief Legal Officer, Counsel and Secretary (2011 to 2012), Virtus Closed-End Funds; and Assistant Secretary (since 2013), Virtus Alternative Solutions Trust. |
28
Table of Contents
FUND MANAGEMENT TABLES (UNAUDITED) (Continued)
Name, Address and Year of Birth | Position(s) Held with Time Served | Principal Occupation(s) During Past 5 Years | ||
Engberg, Nancy J. YOB: 1956 | Vice President and Chief Compliance Officer since 2011. | Vice President (since 2008) and Chief Compliance Officer (2008 to 2011), Virtus Investment Partners, Inc. and/or certain of its subsidiaries; various officer positions (since 2003) with Virtus affiliates; Vice President and Chief Compliance Officer (since 2011), Virtus Mutual Fund Complex; Vice President (since 2010), Chief Compliance Officer (since 2011), Virtus Variable Insurance Trust; Vice President and Chief Compliance Officer (since 2011), Virtus Closed-End Funds; Vice President and Chief Compliance Officer (since 2012), The Zweig Closed-End Funds; and Vice President and Chief Compliance Officer (since 2013), Virtus Alternative Solutions Trust. |
29
Table of Contents
VIRTUS OPPORTUNITIES TRUST
101 Munson Street
Greenfield, MA 01301-9668
Trustees
George R. Aylward
Hassell H. McClellan
Philip R. McLoughlin, Chairman
Geraldine M. McNamara
James M. Oates
Richard E. Segerson
Ferdinand L.J. Verdonck
Officers
George R. Aylward, President
Francis G. Waltman, Executive Vice President
W. Patrick Bradley, Senior Vice President, Chief Financial Officer and Treasurer
Kevin J. Carr, Senior Vice President, Chief Legal Officer, Counsel and Secretary
Nancy J. Engberg, Vice President and Chief Compliance Officer
Investment Adviser
Virtus Investment Advisers, Inc.
100 Pearl Street
Hartford, CT 06103-4506
Principal Underwriter
VP Distributors, LLC
100 Pearl Street
Hartford, CT 06103-4506
Administrator and Transfer Agent
Virtus Fund Services, LLC
100 Pearl Street
Hartford, CT 06103-4506
Custodian
JPMorgan Chase Bank, NA
1 Chase Manhattan Plaza
New York, NY 10005-1401
Independent Registered Public Accounting Firm
PricewaterhouseCoopers LLP
2001 Market Street
Philadelphia, PA 19103-7042
How to Contact Us
Mutual Fund Services | 1-800-243-1574 | |||
Adviser Consulting Group | 1-800-243-4361 | |||
Web site | Virtus.com |
Important Notice to Shareholders
The Securities and Exchange Commission has modified mailing regulations for semiannual and annual shareholder fund reports to allow mutual fund companies to send a single copy of these reports to shareholders who share the same mailing address. If you would like additional copies, please call Mutual Fund Services at 1-800-243-1574.
Table of Contents
For more information about
Virtus Mutual Funds, please call
your financial representative, or
contact us at 1-800-243-1574
or Virtus.com
| 8009 | 11-15 |

Table of Contents

ANNUAL REPORT
Virtus Alternatives Diversifier Fund
Virtus Disciplined Equity Style Fund*
Virtus Disciplined Select Bond Fund*
Virtus Disciplined Select Country Fund*
Virtus Dynamic Trend Fund
Virtus Equity Trend Fund*
Virtus Global Equity Trend Fund*
Virtus Herzfeld Fund*
Virtus Multi-Asset Trend Fund*
Virtus Sector Trend Fund
September 30, 2015 TRUST NAME: VIRTUS OPPORTUNITIES TRUST * Prospectus supplements applicable to these Funds appear at the back of this Annual Report. |
 |
Not FDIC Insured
No Bank Guarantee
May Lose Value
Table of Contents
| 1 | ||||||||
| 2 | ||||||||
| 4 | ||||||||
| Fund | Fund Summary | Schedule of Investments | ||||||
Virtus Alternatives Diversifier Fund (“Alternatives Diversifier Fund”) | 8 | 34 | ||||||
Virtus Disciplined Equity Style Fund (“Disciplined Equity Style Fund”) | 10 | 35 | ||||||
Virtus Disciplined Select Bond Fund (“Disciplined Select Bond Fund”) | 12 | 36 | ||||||
Virtus Disciplined Select Country Fund (“Disciplined Select Country Fund”) | 14 | 37 | ||||||
| 16 | 38 | |||||||
| 19 | 39 | |||||||
Virtus Global Equity Trend Fund (“Global Equity Trend Fund”) | 22 | 41 | ||||||
| 25 | 42 | |||||||
| 28 | 43 | |||||||
| 31 | 45 | |||||||
| 46 | ||||||||
| 49 | ||||||||
| 52 | ||||||||
| 57 | ||||||||
| 63 | ||||||||
| 76 | ||||||||
| 77 | ||||||||
| 78 | ||||||||
Proxy Voting Procedures and Voting Record (Form N-PX)
The subadvisers vote proxies relating to portfolio securities in accordance with procedures that have been approved by the Board of Trustees (“Trustees” or the “Board”) of the Trust. You may obtain a description of these procedures, along with information regarding how the Funds voted proxies during the most recent 12-month period ended June 30, free of charge, by calling toll-free 1-800-243-1574. This information is also available through the Securities and Exchange Commission’s (the “SEC”) website at http://www.sec.gov.
Form N-Q Information
The Trust files a complete schedule of portfolio holdings for each Fund with the SEC for the first and third quarters of each fiscal year on Form N-Q. Form N-Q is available on the SEC’s website at http://www.sec.gov. Form N-Q may be reviewed and copied at the SEC’s Public Reference Room. Information on the operation of the SEC’s Public Reference Room can be obtained by calling toll-free 1-800-SEC-0330.
This report is not authorized for distribution to prospective investors in the Funds presented in this book unless preceded or accompanied by an effective prospectus which includes information concerning the sales charge, each Fund’s record and other pertinent information.
Table of Contents
To My Fellow Shareholders of Virtus Mutual Funds:
 | I am pleased to present this annual report that reviews the performance of your fund for the twelve months ended September 30, 2015.
During this period, global equity markets were challenged by falling oil prices, China’s economic slowdown, Greece’s debt crisis, and the growing likelihood of an interest rate hike by the Federal Reserve (the “Fed”). Volatility took its toll on major U.S. equity indices for the twelve months ended September 30, 2015. The large-cap S&P 500® Index and Dow Jones Industrial AverageSM moderately declined 0.61% and 2.11%, respectively, while the technology-heavy NASDAQ Composite Index® gained 4.00%. By comparison, international equities were down even further, with emerging markets hit particularly hard. | |
Against this backdrop, U.S. Treasuries remained an attractive “safe haven” among global investors. The bellwether 10-year U.S. Treasury yield declined from 2.52% at September 30, 2014 to 2.06% at September 30, 2015. Fixed income assets experienced slight losses in anticipation of the Fed’s stated intention to raise interest rates at the end of 2015. The Barclays U.S. Aggregate Bond Index, which tracks Treasuries and other investment-grade debt securities, gained 2.94% for the twelve-month period ended September 30, 2015, while non-investment grade bonds underperformed, with the Barclays U.S. Corporate High Yield Bond Index down 3.43% for the same period.
The strength of the global economy is likely to remain a concern for the markets in the months ahead. Actions by the Fed and other global central banks will be watched with great interest. Following the weak start to the year, the U.S. economy exhibited growth over the second and third quarters of 2015 – including stronger jobs, housing, and consumer spending data – and gives investors reason for optimism. Future market direction will be determined largely by the ability of corporations to continue to produce robust earnings.
Market uncertainty serves as a constant reminder of the importance of portfolio diversification, including exposure to both traditional and alternative asset classes. While diversification cannot guarantee a profit or prevent a loss, owning a variety of asset classes may provide a cushion against inevitable market fluctuations. Your financial advisor can help you ensure that your portfolio is adequately diversified across asset classes and investment strategies.
As always, thank you for entrusting Virtus with your assets. Should you have questions about your account or require assistance, please visit our website at www.Virtus.com or call our customer service team at 1-800-243-1574. We appreciate your business and remain committed to your long-term financial success. | ||
Sincerely,
George R. Aylward President, Virtus Mutual Funds
October 2015 | ||

Performance data quoted represents past results. Past performance is no guarantee of future results and current performance may be higher or lower than the performance shown above.
1
Table of Contents
Disclosure of Fund Expenses (Unaudited)
FOR THE SIX-MONTH PERIOD OF APRIL 1, 2015 TO SEPTEMBER 30, 2015
We believe it is important for you to understand the impact of costs on your investment. All mutual funds have operating expenses. As a shareholder of a Virtus Opportunities Trust Fund (each, a “Fund”) you may incur two types of costs: (1) transaction costs, including sales charges on purchases of Class A shares and contingent deferred sales charges on Class B and Class C shares; and (2) ongoing costs, including investment advisory fees, distribution and service fees, and other expenses. Class I shares and Class R6 shares are sold without a sales charge and do not incur distribution and service fees. For further information regarding applicable sales charges, see Note 1 in the Notes to Financial Statements. These examples are intended to help you understand your ongoing costs (in dollars) of investing in a Fund and to compare these costs with the ongoing costs of investing in other mutual funds. These examples are based on an investment of $1,000 invested at the beginning of the period and held for the entire six-month period. The following Expense Table illustrates your Fund’s costs in two ways.
Actual Expenses
The first section of the accompanying table provides information about actual account values and actual expenses. You may use the information in this section, together with the amount you invested, to estimate the expenses that you paid over the period. Simply divide your account value by $1,000 (for example, an $8,600 account value divided by $1,000 = 8.6), then multiply the result by the number in the first section under the heading “Expenses Paid During Period” to estimate the expenses you paid on your account during the period.
Hypothetical Example for Comparison Purposes
The second section of the accompanying table provides information about hypothetical account values and hypothetical expenses based on the Fund’s actual expense ratio and an assumed rate of return of 5% per year before expenses, which is not your Fund’s actual return. The hypothetical account values and expenses may not be used to estimate the actual ending account balance or expenses you paid for the period. You may use this information to compare the ongoing costs of investing in your Fund and other funds. To do so, compare these 5% hypothetical examples with the 5% hypothetical examples that appear in the shareholder reports of the other funds.
Please note that the expenses shown in the accompanying table are meant to highlight your ongoing costs only and do not reflect any transactional costs, such as sales charges or contingent deferred sales charges. Therefore, the second section of the accompanying table is useful in comparing ongoing costs only, and will not help you determine the relative total costs of owning different funds. In addition, if these transactional costs were included, your costs would have been higher. The calculations assume no shares were bought or sold during the period. Your actual costs may have been higher or lower, depending on the amount of your investment and the timing of any purchases or redemptions.
| Expense Table | ||||||||||||||||
| Beginning Account Value April 1, 2015 | Ending Account Value September 30, 2015 | Annualized Expense Ratio | Expenses Paid During Period* | |||||||||||||
Alternatives Diversifier Fund |
| |||||||||||||||
Actual | ||||||||||||||||
Class A | $ | 1,000.00 | $ | 910.40 | 0.70 | % | $ | 3.35 | ||||||||
Class C | 1,000.00 | 906.80 | 1.45 | 6.93 | ||||||||||||
Class I | 1,000.00 | 911.60 | 0.44 | 2.11 | ||||||||||||
Hypothetical (5% return before expenses) |
| |||||||||||||||
Class A | 1,000.00 | 1,021.51 | 0.70 | 3.55 | ||||||||||||
Class C | 1,000.00 | 1,017.71 | 1.45 | 7.36 | ||||||||||||
Class I | 1,000.00 | 1,022.83 | 0.44 | 2.23 | ||||||||||||
Disciplined Equity Style Fund |
| |||||||||||||||
Actual | ||||||||||||||||
Class A | $ | 1,000.00 | $ | 897.30 | 1.60 | % | $ | 7.61 | ||||||||
Class C | 1,000.00 | 894.20 | 2.35 | 11.16 | ||||||||||||
Class I | 1,000.00 | 897.90 | 1.35 | 6.42 | ||||||||||||
Hypothetical (5% return before expenses) |
| |||||||||||||||
Class A | 1,000.00 | 1,016.95 | 1.60 | 8.12 | ||||||||||||
Class C | 1,000.00 | 1,013.14 | 2.35 | 11.93 | ||||||||||||
Class I | 1,000.00 | 1,018.22 | 1.35 | 6.85 | ||||||||||||
Disciplined Select Bond Fund |
| |||||||||||||||
Actual | ||||||||||||||||
Class A | $ | 1,000.00 | $ | 963.80 | 1.40 | % | $ | 6.89 | ||||||||
Class C | 1,000.00 | 959.60 | 2.15 | 10.56 | ||||||||||||
Class I | 1,000.00 | 964.80 | 1.15 | 5.66 | ||||||||||||
Hypothetical (5% return before expenses) |
| |||||||||||||||
Class A | 1,000.00 | 1,017.96 | 1.40 | 7.11 | ||||||||||||
Class C | 1,000.00 | 1,014.15 | 2.15 | 10.91 | ||||||||||||
Class I | 1,000.00 | 1,019.23 | 1.15 | 5.84 | ||||||||||||
Disciplined Select Country Fund |
| |||||||||||||||
Actual | ||||||||||||||||
Class A | $ | 1,000.00 | $ | 906.40 | 1.70 | % | $ | 8.12 | ||||||||
Class C | 1,000.00 | 903.10 | 2.45 | 11.69 | ||||||||||||
Class I | 1,000.00 | 907.60 | 1.45 | 6.93 | ||||||||||||
Hypothetical (5% return before expenses) |
| |||||||||||||||
Class A | 1,000.00 | 1,016.44 | 1.70 | 8.63 | ||||||||||||
Class C | 1,000.00 | 1,012.63 | 2.45 | 12.44 | ||||||||||||
Class I | 1,000.00 | 1,017.71 | 1.45 | 7.36 | ||||||||||||
Dynamic Trend Fund**† |
| |||||||||||||||
Actual | ||||||||||||||||
Class A | $ | 1,000.00 | $ | 957.40 | 0.19 | % | $ | 0.93 | ||||||||
Class B | 1,000.00 | 953.10 | 1.01 | 4.95 | ||||||||||||
Class C | 1,000.00 | 953.90 | 0.93 | 4.56 | ||||||||||||
Class I | 1,000.00 | 958.00 | -0.05 | -0.25 | ||||||||||||
Class R6 | 1,000.00 | 959.00 | -0.24 | -1.18 | ||||||||||||
Hypothetical (5% return before expenses) |
| |||||||||||||||
Class A | 1,000.00 | 1,024.10 | 0.19 | 0.96 | ||||||||||||
Class B | 1,000.00 | 1,019.94 | 1.01 | 5.13 | ||||||||||||
Class C | 1,000.00 | 1,020.35 | 0.93 | 4.72 | ||||||||||||
Class I | 1,000.00 | 1,025.32 | -0.05 | -0.25 | ||||||||||||
Class R6 | 1,000.00 | 1,026.29 | -0.24 | -1.22 | ||||||||||||
2
Table of Contents
Disclosure of Fund Expenses (Unaudited) (Continued)
FOR THE SIX-MONTH PERIOD OF APRIL 1, 2015 TO SEPTEMBER 30, 2015
| Expense Table | ||||||||||||||||
| Beginning Account Value April 1, 2015 | Ending Account Value September 30, 2015 | Annualized Expense Ratio | Expenses Paid During Period* | |||||||||||||
Equity Trend Fund |
| |||||||||||||||
Actual | ||||||||||||||||
Class A | $ | 1,000.00 | $ | 936.70 | 1.61 | % | $7.82 | |||||||||
Class C | 1,000.00 | 933.20 | 2.37 | 11.49 | ||||||||||||
Class I | 1,000.00 | 937.70 | 1.36 | 6.61 | ||||||||||||
Class R6 | 1,000.00 | 938.50 | 1.25 | 6.07 | ||||||||||||
Hypothetical (5% return before expenses) |
| |||||||||||||||
Class A | 1,000.00 | 1,016.90 | 1.61 | 8.17 | ||||||||||||
Class C | 1,000.00 | 1,013.04 | 2.37 | 12.03 | ||||||||||||
Class I | 1,000.00 | 1,018.16 | 1.36 | 6.90 | ||||||||||||
Class R6 | 1,000.00 | 1,018.72 | 1.25 | 6.35 | ||||||||||||
Global Equity Trend Fund |
| |||||||||||||||
Actual | ||||||||||||||||
Class A | $ | 1,000.00 | $ | 929.50 | 1.68 | % | $8.13 | |||||||||
Class C | 1,000.00 | 926.60 | 2.43 | 11.74 | ||||||||||||
Class I | 1,000.00 | 930.60 | 1.44 | 6.97 | ||||||||||||
Hypothetical (5% return before expenses) |
| |||||||||||||||
Class A | 1,000.00 | 1,016.54 | 1.68 | 8.53 | ||||||||||||
Class C | 1,000.00 | 1,012.73 | 2.43 | 12.34 | ||||||||||||
Class I | 1,000.00 | 1,017.76 | 1.44 | 7.31 | ||||||||||||
Herzfeld Fund |
| |||||||||||||||
Actual | ||||||||||||||||
Class A | $ | 1,000.00 | $ | 896.90 | 1.60 | % | $7.61 | |||||||||
Class C | 1,000.00 | 893.20 | 2.35 | 11.15 | ||||||||||||
Class I | 1,000.00 | 898.20 | 1.35 | 6.42 | ||||||||||||
Hypothetical (5% return before expenses) |
| |||||||||||||||
Class A | 1,000.00 | 1,016.95 | 1.60 | 8.12 | ||||||||||||
Class C | 1,000.00 | 1,013.14 | 2.35 | 11.93 | ||||||||||||
Class I | 1,000.00 | 1,018.22 | 1.35 | 6.85 | ||||||||||||
Multi-Asset Trend Fund |
| |||||||||||||||
Actual | ||||||||||||||||
Class A | $ | 1,000.00 | $ | 952.10 | 1.61 | % | $ | 7.88 | ||||||||
Class C | 1,000.00 | 948.70 | 2.36 | 11.53 | ||||||||||||
Class I | 1,000.00 | 953.20 | 1.36 | 6.66 | ||||||||||||
Hypothetical (5% return before expenses) |
| |||||||||||||||
Class A | 1,000.00 | 1,016.90 | 1.61 | 8.17 | ||||||||||||
Class C | 1,000.00 | 1,013.09 | 2.36 | 11.98 | ||||||||||||
Class I | 1,000.00 | 1,018.16 | 1.36 | 6.90 | ||||||||||||
Sector Trend Fund |
| |||||||||||||||
Actual | ||||||||||||||||
Class A | $ | 1,000.00 | $ | 956.50 | 1.00 | % | $ | 4.90 | ||||||||
Class C | 1,000.00 | 953.10 | 1.76 | 8.62 | ||||||||||||
Class I | 1,000.00 | 958.30 | 0.76 | 3.73 | ||||||||||||
Hypothetical (5% return before expenses) |
| |||||||||||||||
Class A | 1,000.00 | 1,019.99 | 1.00 | 5.08 | ||||||||||||
Class C | 1,000.00 | 1,016.13 | 1.76 | 8.93 | ||||||||||||
Class I | 1,000.00 | 1,021.21 | 0.76 | 3.86 | ||||||||||||
| * | Expenses are equal to the relevant Fund’s annualized expense ratio, which is net of waived fees, reimbursed expenses, dividends and interest on short sales, if applicable, multiplied by the average account value over the period, multiplied by the number of days (183) expenses were accrued in the most recent fiscal half-year, then divided by 365 to reflect the one-half year period. |
| ** | Dynamic Trend Fund’s annualized expense ratios include interest expense due to leverage and dividends and interest expense on short sales. |
| † | The expense figures reflected in the table for the Dynamic Trend Fund are due to a negative performance fee adjustment during the period. See Note 3A in the Notes to Financial Statements for more information on the performance fee calculation. |
For Funds which may invest in other funds, the annualized expense ratios noted above do not reflect fees and expenses associated with the underlying funds. If such fees and expenses had been included, the expenses would have been higher.
You can find more information about the Funds’ expenses in the Financial Statements section that follows. For additional information on operating expenses and other shareholder costs, refer to the prospectus.
3
Table of Contents
(Unaudited)
Alerian MLP Index
The Alerian MLP Index is the leading gauge of large- and mid-cap energy Master Limited Partnerships (MLPs). The float adjusted, capitalization-weighted index, which includes 50 prominent companies and captures approximately 75% of available market capitalization, is disseminated real-time on a price-return basis (AMZ) and on a total-return basis. The index is unmanaged, its returns do not reflect any fees, tax assets or liabilities, expenses or sales charges, and it is not available for direct investment.
Alternatives Diversifier Composite Index
The Alternatives Diversifier composite index consists of: Diversified Trends Index (15%), UBS Global Investors (Real Estate) Index (20%), Global Infrastructure, represented by the MSCI World Infrastructure Sector Capped Index (since 9/1/2008) (15%), S&P North American Natural Resources Sector Index (10%), Deutsche Bank Liquid Commodity Index (15%), Deutsche Bank G10 Currency Harvest Index (15%), and Credit Suisse Leveraged Loan Index (10%). From 9/1/2008 to 3/1/2012 the composite consisted of HFRX Equity Market Neutral Index (20%), UBS Global Investors (Real Estate) Index (20%), Global Infrastructure, represented by the MSCI World Infrastructure Sector Capped Index (since 9/1/2008) (15%), S&P North American Natural Resources Sector Index (10%), Deutsche Bank Liquid Commodity Index (15%), Deutsche Bank G10 Currency Harvest Index (10%) and Credit Suisse Leveraged Loan Index (10%). Prior to 9/1/2008, the Global Infrastructure component was represented by a mix of MSCI US Utilities Index (65%), MSCI World Telecom Services Index (20%) and MSCI World ex US Utilities Index (15%). The index is unmanaged, its returns do not reflect any fees, expenses, or sales charges, and it is not available for direct investment.
American Depositary Receipt (ADR)
Represents shares of foreign companies traded in U.S. dollars on U.S. exchanges that are held by a bank or a trust. Foreign companies use ADRs in order to make it easier for Americans to buy their shares.
Barclays U.S. Corporate High Yield Bond Index
The Barclays U.S. Corporate High Yield Bond Index measures the U.S. dollar-denominated, high yield, fixed-rate corporate bond market. The index is calculated on a total return basis. The index is unmanaged, its returns do not reflect any fees, expenses, or sales charges, and it is not available for direct investment.
Barclays U.S. Aggregate Bond Index
The Barclays U.S. Aggregate Bond Index measures the U.S. investment grade fixed rate bond market. The index is calculated on a total return basis. The index is unmanaged, its returns do not reflect any fees, expenses, or sales charges, and it is not available for direct investment.
BofA Merrill Lynch US High Yield Master II Option-Adjusted Spread Index
The BofA Merrill Lynch Option-Adjusted Spreads (OASs) are the calculated spreads between a computed OAS index of all bonds in a given rating category and a spot Treasury curve. An OAS index is constructed using each constituent bond’s OAS, weighted by market capitalization. The BofA Merrill Lynch High Yield Master II OAS uses an index of bonds that are below investment grade (those rated BB or below).
Chicago Board Options Exchange (CBOE) Volatility Index®
The Chicago Board Options Exchange (CBOE) Volatility Index (“VIX® Index”) shows the market’s expectation of 30-day volatility. It is constructed using the implied volatilities of a wide range of S&P 500® Index options. This volatility is meant to be forward looking and is calculated from both calls and puts. The VIX® Index is a widely used measure of market risk and is often referred to as the “investor fear gauge.” The index is unmanaged, its returns do not reflect any fees, expenses, or sales charges, and is not available for direct investment.
Dow Jones Global Moderate Portfolio Index
The Dow Jones Global Moderate Portfolio Index is a benchmark that takes 60% of the risk of the global securities market. It is a total returns index that is a time-varying weighted average of stocks, bonds, and cash. The index is the efficient allocation of stocks, bonds, and cash in a portfolio with 60% of the risk of the Dow Jones Aggressive Portfolio Index. The index is calculated on a total return basis with dividends reinvested. The index is unmanaged, its returns do not reflect any fees, expenses, or sales charges, and it is not available for direct investment.
4
Table of Contents
KEY INVESTMENT TERMS (Continued)
(Unaudited)
Dow Jones Industrial AverageSM
A market indicator composed of 30 actively traded blue chip U.S. stocks. While the index attempts to be representative of the U.S. economy as a whole, it is somewhat heavily weighted toward industrials. It is a price-weighted average, which means that the price movement of each stock is weighted equally regardless of its market capitalization. The index is unmanaged, its returns do not reflect any fees, expenses, or sales charges, and it is not available for direct investment.
Exchange-Traded Funds (ETF)
A Fund that is traded on a stock exchange. Most ETFs have a portfolios of stocks or bonds that track a specific market index.
Federal Reserve (the “Fed”)
The Central Bank of the United States, responsible for controlling the money supply, interest rates and credit with the goal of keeping the U.S. economy and currency stable. Governed by a seven-member board, the system includes 12 regional Federal Reserve Banks, 25 branches and all national and state banks that are part of the system.
Herzfeld Composite Index (60% MSCI AC World Index (net)/40% Barclays U.S. Aggregate Bond Index)
The composite index consists of 60% MSCI AC World Index (net) and 40% Barclays U.S. Aggregate Bond Index. The MSCI AC World Index (net) is a free float-adjusted market capitalization-weighted index that measures equity performance of developed and emerging markets. The index is calculated on a total return basis with net dividends reinvested. The Barclays U.S. Aggregate Bond Index measures the U.S. investment grade fixed rate bond market. The index is calculated on a total return basis. Each index is unmanaged, its returns do not reflect any fees, expenses, or sales charges, and is not available for direct investment.
HFRX Equity Hedge Index
The HFRX Equity Hedge Index measures performance of long and short strategies that invest primarily in equity and equity derivative securities. The index is unmanaged, its returns do not reflect any fees, expenses, or sales charges, and is not available for direct investment.
iShares®
Represents shares of an open-end exchange-traded fund.
Long position (“long”)
Ownership of a security, giving the investor the right to transfer ownership to someone else, the right to receive income paid by the security, and the right to any profits or losses as the security’s value changes.
MLP (Master Limited Partnership)
A type of limited partnership that is publicly traded. The partnership must derive most of its cash flows from real estate, natural resources and commodities.
MSCI All Country World Index (Net)
The MSCI All Country World Index (Net) is a free float-adjusted market capitalization-weighted index that measures equity performance of developed and emerging markets. The index is calculated on a total return basis with net dividends reinvested. The index is unmanaged, its returns do not reflect any fees, expenses or sales charges, and is not available for direct investment.
MSCI EAFE® Index (net)
The MSCI EAFE® Index (net) is a free float-adjusted market capitalization-weighted index that measures developed foreign market equity performance, excluding the U.S. and Canada. The index is calculated on a total return basis with net dividends reinvested. The index is unmanaged, its returns do not reflect any fees, expenses, or sales charges, and it is not available for direct investment.
MSCI France Index
The MSCI France Index is designed to measure the performance of the large, mid and small cap segments of the French market. With 74 constituents, the index covers about 85% of the equity universe in France. The index is unmanaged, its returns do not reflect any fees, expenses, or sales charges, and it is not available for direct investment.
5
Table of Contents
KEY INVESTMENT TERMS (Continued)
(Unaudited)
MSCI Japan Index
The MSCI Japan Index is designed to measure the performance of the large and mid cap segments of the Japanese market. With 316 constituents, the index covers approximately 85% of the free float-adjusted market capitalization in Japan. The index is unmanaged, its returns do not reflect any fees, expenses, or sales charges, and it is not available for direct investment.
MSCI Sweden Index
The MSCI Sweden Index is designed to measure the performance of the large and mid cap segments of the Swedish market. With 30 constituents, the index covers about 85% of the equity universe in Sweden. The index is unmanaged, its returns do not reflect any fees, expenses, or sales charges, and it is not available for direct investment.
MSCI Switzerland Index
The MSCI Switzerland Index is designed to measure the performance of the large and mid cap segments of the Swiss market. With 39 constituents, the index covers approximately 85% of the free float-adjusted market capitalization in Switzerland. The index is unmanaged, its returns do not reflect any fees, expenses, or sales charges, and it is not available for direct investment.
NASDAQ Composite Index®
A market-capitalization weighted index of the more than 3,000 common equities listed on the Nasdaq stock exchange. Unlike other market indexes, the NASDAQ composite is not limited to companies that have U.S. headquarters. The index is unmanaged, its returns do not reflect any fees, expenses or sales charges and it is not available for direct investment.
Russell 1000® Index
The Russell 1000® Index measures the performance of the large-cap segment of the U.S. equity universe. It is a subset of the Russell 3000® Index and includes approximately 1000 of the largest securities based on a combination of their market cap and current index membership. The index is unmanaged, its returns do not reflect any fees, expenses, or sales charges, and it is not available for direct investment.
Russell 1000® Value Index
The Russell 1000® Value Index measures the performance of the large-cap value segment of the U.S. equity universe. It includes those Russell 1000® companies with lower price-to-book ratios and lower expected growth values. The index is unmanaged, its returns do not reflect any fees, expenses, or sales charges, and it is not available for direct investment.
Russell 2000® Index
The Russell 2000® Index is a market capitalization-weighted index of the 2,000 smallest companies in the Russell Universe, which comprises the 3,000 largest U.S. companies. The index is calculated on a total return basis with dividends reinvested. The index is unmanaged, its returns do not reflect any fees, expenses, or sales charges, and it is not available for direct investment.
Russell 2000® Value Index
The Russell 2000® Value Index measures the performance of small-cap value segment of the U.S. equity universe. It includes those Russell 2000® companies with lower price-to-book ratios and lower forecasted growth values. The index is unmanaged, its returns do not reflect any fees, expenses, or sales charges, and it is not available for direct investment.
Russell 3000® Index
The Russell 3000® Index is a market capitalization-weighted index that measures the performance of the 3,000 largest U.S. companies. The index is calculated on a total return basis with dividends reinvested. The index is unmanaged, its returns do not reflect any fees, expenses, or sales charges, and it is not available for direct investment.
Russell 3000® Growth Index
The Russell 3000 Growth Index measures the performance of the broad growth segment of the U.S. equity universe. It includes those Russell 3000 companies with higher price-to-book ratios and higher forecasted growth values. The index is unmanaged, its returns do not reflect any fees, expenses, or sales charges, and it is not available for direct investment.
6
Table of Contents
KEY INVESTMENT TERMS (Continued)
(Unaudited)
Russell 3000® Value Index
The Russell 3000® Value Index measures the performance of the broad value segment of U.S. equity value universe. It includes those Russell 3000 companies with lower price-to-book ratios and lower forecasted growth values. The index is unmanaged, its returns do not reflect any fees, expenses, or sales charges, and is not available for direct investment.
Russell Midcap® Index
The Russell Midcap® Index is a market capitalization-weighted index of medium-capitalization stocks of U.S. companies. The index is calculated on a total return basis with dividends reinvested. The index is unmanaged, its returns do not reflect any fees, expenses, or sales charges, and it is not available for direct investment.
Russell Midcap® Value Index
The Russell Midcap® Value Index measures the performance of the mid-cap value segment of the U.S. equity universe. It includes those Russell Midcap® Index companies with lower price-to-book ratios and lower forecasted growth values. The index is unmanaged, its returns do not reflect any fees, expenses, or sales charges, and it is not available for direct investment.
S&P 500® Index
The S&P 500® Index is a free-float market capitalization-weighted index of 500 of the largest U.S. companies. The index is calculated on a total return basis with dividends reinvested. The index is unmanaged, its returns do not reflect any fees, expenses, or sales charges, and it is not available for direct investment.
SPDR®
Represents shares of an open-end exchange-traded fund.
Short position (“short”)
Stock shares that an investor has sold without actually owning (by borrowing the certificates from a broker) in anticipation of a decline in the stock value by a certain date. If the price falls, the investor buys the shares at the lower rate and makes a profit on the difference. It the price rises, the investor must buy at the higher price and sustains a loss.
Treasury Inflation-Protected Securities (TIPS)
Treasury Inflation-Protected Securities provide protection against inflation. The principal of a TIPS increases with inflation and decreases with deflation, as measured by the Consumer Price Index. When a TIPS matures, the investor is paid the adjusted principal or original principal, whichever is greater.
7
Table of Contents
Fund Summary | Ticker Symbols: Class A: PDPAX Class C: PDPCX Class I: VADIX |
Portfolio Manager Commentary by Euclid Advisors LLC
| ¢ | The Fund is diversified and has an investment objective of long-term capital appreciation. |
| ¢ | For the fiscal year ended September 30, 2015, the Fund’s Class A shares at NAV returned -10.02%, Class C shares returned -10.66%, and Class I shares returned -9.77%. For the same period, the S&P 500® Index, a broad-based equity index, returned -0.61%, and the Alternatives Diversifier Composite Index, the Fund’s style-specific index appropriate for comparison, returned -11.55%. |
All performance figures assume reinvestment of distributions and exclude the effect of sales charges. Past performance is no guarantee of future results, and current performance may be higher or lower than the performance shown above.
How did the markets perform during the Fund’s fiscal year?
| ¢ | U.S. stock markets experienced increased volatility over the last 12 months. After a violent 7.5% sell-off in the fall of 2014, stocks rallied more than 14% to make new all-time highs in May of this year. After a few months of mostly sideways action, in August the market had its first 10% correction since 2011. Other global equity markets also suffered losses, with many emerging markets in bear market territory, having lost more than 20% during the year. Bond markets remained surprisingly subdued with government yields in most developed markets very low because of exceedingly accommodative central bank policy. Commodity markets were very weak over the year and continued to be so as of the end of the Fund’s fiscal year. Crude oil and other hydrocarbons, such as natural gas and coal, collapsed over the last year and remained under pricing pressure as of the end of the Fund’s fiscal year. The slow pace of global growth, particularly in China, caused industrial metals and grain prices to decline as well. |
What factors affected the Fund’s performance during its fiscal year?
| ¢ | For the previous 12 months, the Fund declined 10.02% (Class A shares), slightly ahead of its style |
index, which was down 11.55%. The Fund’s overweighting of real estate was a positive performance driver, as it was the best performing asset class over the last year. The Fund’s underweighting of commodities and related equities was beneficial, but was not enough to stave off losses in the portfolio. Very low inflation globally, combined with weakening economic conditions in many emerging markets and China, put downward pressure on commodity prices. During the year, both commodities and commodity equites suffered losses of more than 30%. The Fund invests some of its money in these areas to diversify away from traditional stocks and bonds, but this year, that diversification was detrimental to overall performance as commodities were especially hard hit. The Fund’s underweight to managed futures also detracted from performance. Even though that area suffered losses for the year, it was still among the Fund’s better performing components. |
The preceding information is the opinion of portfolio management. Any such opinions are subject to change at any time based upon market or other conditions and should not be relied upon as investment
advice. Past performance is no guarantee of future results, and there is no guarantee that market forecasts will be realized.
There is no guarantee that the Fund will meet its objective.
Equity Securities: The market price of equity securities may be adversely affected by financial market, industry, or issuer-specific events. Focus on a particular style or on small or medium-sized companies may enhance that risk.
Credit & Interest: Debt securities are subject to various risks, the most prominent of which are credit and interest rate risk. The issuer of a debt security may fail to make interest and/or principal payments. Values of debt securities may rise or fall in response to changes in interest rates, and this risk may be enhanced with longer-term maturities.
Industry/Sector Concentration: A fund that focuses its investments in a particular industry or sector will be more sensitive to conditions that affect that industry or sector than a non-concentrated fund.
Derivatives: Investments in derivatives such as futures, options, forwards, and swaps may increase volatility or cause a loss greater than the principal investment.
Allocation: The fund’s exposure to different asset classes may not be optimal for market conditions at a given time. Asset allocation does not guarantee a profit or protect against a loss in declining markets.
Foreign Investing: Investing internationally involves additional risks such as currency, political, accounting, economic, and market risk.
Real Estate: The fund may be negatively affected by factors specific to the real estate market, including interest rates, leverage, property, and management.
Fund of funds: Because the fund can invest in other funds, it indirectly bears its proportionate share of the operating expenses and management fees of the underlying fund(s).
Affiliated Funds: The fund’s adviser can select affiliated and/or unaffiliated funds, which may create a conflict of interest.
Prospectus: For additional information on risks, please see the fund’s prospectus.
| Asset Allocation | ||||
The following table presents asset allocations within certain sectors and as a percentage of total investments as of September 30, 2015.
|
| |||
Affiliated Equity Mutual Funds | 47 | % | ||
Exchange-Traded Funds | 38 | |||
Affiliated Fixed Income Mutual Funds | 15 | |||
|
| |||
Total | 100 | % | ||
|
| |||
For information regarding the indexes and certain investment terms, see the Key Investment Terms starting on page 4.
8
Table of Contents
Alternatives Diversifier Fund (Continued)
| Average Annual Total Returns1 for periods ended 9/30/15 | ||||||||||||||||
| 1 year | 5 years | Since Inception | Inception Date | |||||||||||||
| Class A Shares at NAV2 | -10.02 | % | 1.31 | % | 1.48 | % | 11/30/05 | |||||||||
| Class A Shares at POP3,4 | -15.19 | 0.12 | 0.87 | 11/30/05 | ||||||||||||
| Class C Shares at NAV2 and with CDSC4 | -10.66 | 0.55 | 0.72 | 11/30/05 | ||||||||||||
| Class I Shares at NAV | -9.77 | 1.56 | 3.09 | 10/1/09 | ||||||||||||
| S&P 500® Index | -0.61 | 13.34 | — | 5 | — | |||||||||||
| Alternatives Diversifier Composite Index | -11.55 | 2.04 | — | 6 | — | |||||||||||
Fund Expense Ratios7: A Shares: 1.70%; C Shares: 2.45%; I Shares: 1.45%.
All returns represent past performance which is no guarantee of future results. Current performance may be higher or lower than the performance shown. The investment return and principal value of an investment will fluctuate so that an investor’s shares, when redeemed, may be worth more or less than their original cost. The above table and graph below do not reflect the deduction of taxes that a shareholder would pay on fund distributions or the redemption of shares. Please visit Virtus.com for performance data current to the most recent month-end.
| 1 | Total returns are historical and include changes in share price and the reinvestment of both dividends and capital gains distributions. |
| 2 | “NAV” (Net Asset Value) total returns do not include the effect of any sales charge. |
| 3 | “POP” (Public Offering Price) total returns include the effect of the maximum front-end 5.75% sales charge. |
| 4 | “CDSC” (Contingent Deferred Sales Charge) is applied to redemptions of certain classes of shares that do not have a sales charge applied at the time of purchase. CDSC charges for certain redemptions of Class A shares made within 18 months of purchase in which a finder’s fee was paid and all redemptions of Class C shares within the first year are 1% and 0% thereafter. |
| 5 | The index returned 6.69% for Class A and Class C shares and 13.29% for Class I shares since the inception date of the respective share class. |
| 6 | The index returned 2.65% for Class A and Class C shares and 3.23% for Class I shares since the inception date of the respective share class. |
| 7 | The expense ratios of the Fund are set forth according to the prospectus for the Fund effective January 28, 2015, as supplemented and revised, and may differ from the expense ratios disclosed in the Financial Highlights tables in this report. See the Financial Highlights for more current expense ratios. Expense ratios reflect fees and expenses associated with the underlying funds. |
Growth of $10,000 For periods ended 9/30
This chart assumes an initial investment of $10,000 made on November 30, 2005 (inception date of the Fund), for Class A and Class C shares including any applicable sales charges or fees. Performance assumes reinvestment of dividends and capital gain distributions.
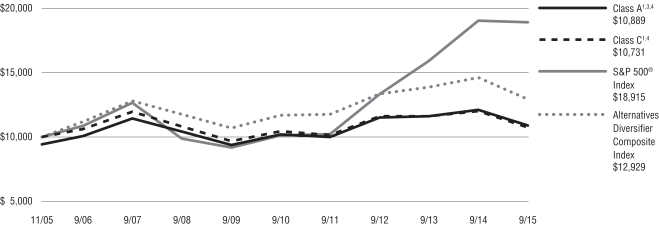
The indexes are unmanaged and not available for direct investment; therefore, their performance does not reflect the expenses associated with active management of an actual portfolio.
For information regarding the indexes and certain investment terms, see the Key Investment Terms starting on page 4.
9
Table of Contents
Fund Summary | Ticker Symbols: Class A: VDEAX Class C: VDECX Class I: VDEIX |
Portfolio Manager Commentary by Newfound Investments, LLC
| ¢ | The Fund is diversified and has an investment objective of capital appreciation. |
| ¢ | For the fiscal year ended September 30, 2015, the Fund’s Class A shares at NAV returned -0.01%, Class C shares returned -0.72%, and Class I shares returned 0.16%. For the same period, the S&P 500® Index, a broad-based equity index, returned -0.61%, and the Russell 3000® Index the Fund’s style-specific benchmark appropriate for comparison returned -0.49%. |
All performance figures assume reinvestment of distributions and exclude the effect of sales charges. Past performance is no guarantee of future results, and current performance may be higher or lower than the performance shown above.
How did the markets perform during the Fund’s fiscal year?
| ¢ | During the Fund’s prior fiscal year, the Russell 3000® Index returned -0.49%, marred by volatility and dramatic sell-offs in October 2014 and August 2015. Global economic news remains mixed with concerns around deflation in Europe, slowing economic growth in China, and the stability of the U.S. economic recovery. |
| ¢ | Over this period, in line with the nearly eight-year secular trend, growth equities continued to outperform value equities, with the Russell 3000® Growth Index out-performing the Russell 3000® Value Index by over 7.50%. |
| ¢ | Small-cap equities (proxied by the Russell 2000® Index) outperformed mid-cap equities (Russell MidCap® Index), which in turn outperformed large-cap equities (Russell 1000® Index), creating a demonstrable size-bias throughout the fiscal year. This resulted in small-caps outperforming their large-cap peers by just over 2.00% |
What factors affected the Fund’s performance during its fiscal year?
| ¢ | The Fund seeks to take advantage of relative performance difference in growth and value equities by holding an equal share of either large-, mid-, and small-cap growth equities or large-, mid-, and small-cap value equities. |
| ¢ | The equal-weight approach to market capitalization within the Fund provided a tailwind to the Fund’s performance as small- and mid-cap equities outperformed large-cap equities. |
| ¢ | Short-term head-fakes in the relative performance between growth and value in the third quarter of 2015 led to several “whipsaw” trades, detracting from overall performance and the Fund’s ability to capture the full relative outperformance opportunity offered by the performance difference between these two categories. |
| ¢ | The Fund’s overall tilt towards growth during the fiscal year served as a positive contribution to performance, as growth equities outperformed their value peers. |
The preceding information is the opinion of portfolio management. Any such opinions are subject to change at any time based on market or other conditions and should not be relied upon as investment advice. Past performance is no guarantee of future results, and there is no guarantee that market forecasts will be realized.
There is no guarantee that the Fund will meet its objectives.
| Asset Allocation | ||||||||
The following table presents asset allocations within certain sectors and as a percentage of total investments as of September 30, 2015.
|
| |||||||
Exchange-Traded Funds | 99 | % | ||||||
Russell 2000® Value Index Fund | 33 | % | ||||||
Russell Midcap® Value Index Fund | 33 | |||||||
Russell 1000® Value Index Fund | 33 | |||||||
Other (includes short-term investments) | 1 | |||||||
|
| |||||||
Total | 100 | % | ||||||
|
| |||||||
Equity Securities: The market price of equity securities may be adversely affected by financial market, industry, or issuer-specific events. Focus on a particular style or on small or medium-sized companies may enhance that risk.
Exchange Traded Funds: The value of an ETF may be more volatile than the underlying portfolio of securities the ETF is designed to track. The costs of owning the ETF may exceed the cost of investing directly in the underlying securities.
Prospectus: For additional information on risks, please see the fund’s prospectus.
For information regarding the indexes and certain investment terms, see the Key Investment Terms starting on page 4.
10
Table of Contents
Disciplined Equity Style Fund (Continued)
| Average Annual Total Returns1 for periods ended 9/30/15 | ||||||||||||
| 1 year | Since Inception | Inception Date | ||||||||||
| Class A Shares at NAV2 | -0.01 | % | 13.00 | % | 12/18/12 | |||||||
| Class A Shares at POP3,4 | -5.76 | 10.62 | 12/18/12 | |||||||||
| Class C Shares at NAV2 and with CDSC4 | -0.72 | 12.17 | 12/18/12 | |||||||||
| Class I Shares at NAV | 0.16 | 13.26 | 12/18/12 | |||||||||
S&P 500® Index | -0.61 | 13.03 | 5 | — | ||||||||
Russell 3000® Index | -0.49 | 13.00 | 5 | — | ||||||||
Fund Expense Ratios6: A Shares: Gross 5.20%, Net 1.60%; C Shares: Gross 5.95%, Net 2.35%; I Shares: Gross 4.95%, Net 1.35%.
All returns represent past performance which is no guarantee of future results. Current performance may be higher or lower than the performance shown. The investment return and principal value of an investment will fluctuate so that an investor’s shares, when redeemed, may be worth more or less than their original cost. The above table and graph below do not reflect the deduction of taxes that a shareholder would pay on fund distributions or the redemption of shares. Please visit Virtus.com for performance data current to the most recent month-end.
| 1 | Total returns are historical and include changes in share price and the reinvestment of both dividends and capital gains distributions. |
| 2 | “NAV” (Net Asset Value) total returns do not include the effect of any sales charge. |
| 3 | “POP” (Public Offering Price) total returns include the effect of the maximum front-end 5.75% sales charge. |
| 4 | “CDSC” (Contingent Deferred Sales Charge) is applied to redemptions of certain classes of shares that do not have a sales charge applied at the time of purchase. CDSC charges for certain redemptions of Class A shares made within 18 months of purchase in which a finder’s fee was paid and all redemptions of Class C shares within the first year are 1% and 0% thereafter. |
| 5 | The since inception index returns are from the Fund’s inception date. |
| 6 | The expense ratios of the Fund are set forth according to the prospectus for the Fund effective January 28, 2015, as supplemented and revised, and may differ from the expense ratios disclosed in the Financial Highlights tables in this report. See the Financial Highlights for more current expense ratios. Net Expense: Expenses reduced by the contractual fee waiver in effect through January 31, 2017. For the period of October 1, 2014 through August 31, 2015, the waiver was voluntary. Gross Expense: Does not reflect the effect of the fee waiver. Expense ratios reflect fees and expenses associated with the underlying funds. |
Growth of $10,000 For periods ended 9/30
This chart assumes an initial investment of $10,000 made on December 18, 2012 (inception date of the Fund), for Class A, Class C, and Class I shares including any applicable sales charges or fees. Performance assumes reinvestment of dividends and capital gain distributions.
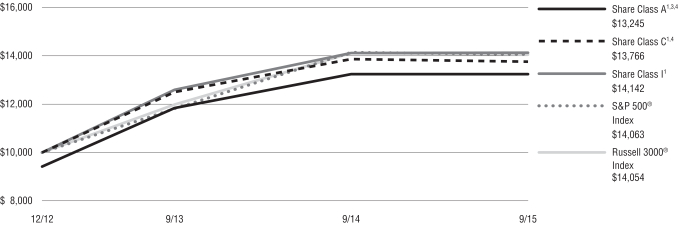
The indexes are unmanaged and not available for direct investment; therefore, their performance does not reflect the expense associated with active management of an actual portfolio.
For information regarding the indexes and certain investment terms, see the Key Investment Terms starting on page 4.
11
Table of Contents
Fund Summary | Ticker Symbols: Class A: VDBAX Class C: VDBCX Class I: VDBIX |
Portfolio Manager Commentary by Newfound Investments LLC
| ¢ | The Fund is diversified and has an investment objective of high total return from current income and capital appreciation. |
| ¢ | For the fiscal ended September 30, 2015, the Fund’s Class A shares at NAV returned -2.25%, Class C shares returned -3.02%, and Class I shares returned -2.03%. For the same period, the Barclays U.S. Aggregate Bond Index, a broad-based fixed income index, returned 2.94%. |
All performance figures assume reinvestment of distributions and exclude the effect of sales charges. Past performance is no guarantee of future results and current performance may be higher or lower than the performance shown above.
How did the markets perform during the Fund’s fiscal year?
| ¢ | U.S. Treasury rates remained volatile through the year, with the 10-year rate hitting a low of 1.68% and a high of 2.52% and the 20-year rate hitting a low of 2.04% and 2.98% during the Fund’s fiscal year. |
| ¢ | Credit spreads, as measured by the BofA Merrill Lynch U.S. High Yield Master II Option-Adjusted Spread Index, began the fiscal year at 4.40% and ended the period at 6.62%, a multi-year high. During the year, however, spreads fell from 5.71% to 4.38% in a three-month period, highlighting the volatility of these spreads. |
| ¢ | The 10-year breakeven inflation rate fell throughout the period, from 1.97% to 1.41%, highlighting continued deflationary pressures. |
What factors affected the Fund’s performance during its fiscal year?
| ¢ | The high levels of volatility within U.S. Treasury rates and credit spreads made the identification of meaningful secular relative outperformance trends difficult. |
| ¢ | The lack of meaningful long-term relative trends led to several whipsaw trades throughout the Fund’s fiscal year which detracted from performance. |
The preceding information is the opinion of portfolio management. Any such opinions are subject to change at any time based on market or other conditions and should not be relied upon as investment advice. Past performance is no guarantee of future results, and there is no guarantee that market forecasts will be realized.
There is no guarantee that the Fund will meet its objectives.
| Asset Allocation | ||||||||
The following table presents asset allocations within certain sectors and as a percentage of total investments as of September 30, 2015.
|
| |||||||
Exchange-Traded Funds | 98 | % | ||||||
Treasury Bond Funds | 20 | % | ||||||
Corporate Bond Funds | 78 | |||||||
Other (includes short-term investments) | 2 | |||||||
|
| |||||||
Total | 100 | % | ||||||
|
| |||||||
Credit & Interest: Debt securities are subject to various risks, the most prominent of which are credit and interest rate risk. The issuer of a debt security may fail to make interest and/or principal payments. Values of debt securities may rise or fall in response to changes in interest rates, and this risk may be enhanced with longer-term maturities.
Exchange Traded Funds: The value of an ETF may be more volatile than the underlying portfolio of securities the ETF is designed to track. The costs of owning the ETF may exceed the cost of investing directly in the underlying securities.
U.S. Government Securities: U.S. government securities may be subject to price fluctuations. An agency may default on an obligation not backed by the United States. Any guarantee on U.S. government securities does not apply to the value of the fund’s shares.
Prospectus: For additional information on risks, please see the fund’s prospectus.
For information regarding the indexes and certain investment terms, see the Key Investment Terms starting on page 4.
12
Table of Contents
Disciplined Select Bond Fund (Continued)
| Average Annual Total Returns1 for periods ended 9/30/15 | ||||||||||||
| 1 year | Since Inception | Inception Date | ||||||||||
| Class A Shares at NAV2 | -2.25 | % | -1.21 | % | 12/18/12 | |||||||
| Class A Shares at POP3,4 | -5.91 | -2.55 | 12/18/12 | |||||||||
| Class C Shares at NAV2 and with CDSC4 | -3.02 | -1.94 | 12/18/12 | |||||||||
| Class I Shares at NAV | -2.03 | -0.98 | 12/18/12 | |||||||||
| Barclays U.S. Aggregate Bond Index | 2.94 | 1.92 | 5 | — | ||||||||
Fund Expense Ratios6: A Shares: Gross 7.48%, Net 1.40%; C Shares: Gross 8.23%, Net 2.15%; I Shares: Gross 7.23%, Net 1.15%.
All returns represent past performance which is no guarantee of future results. Current performance may be higher or lower than the performance shown. The investment return and principal value of an investment will fluctuate so that an investor’s shares, when redeemed, may be worth more or less than their original cost. The above table and graph below do not reflect the deduction of taxes that a shareholder would pay on fund distributions or the redemption of shares. Please visit Virtus.com for performance data current to the most recent month-end.
| 1 | Total returns are historical and include changes in share price and the reinvestment of both dividends and capital gains distributions. |
| 2 | “NAV” (Net Asset Value) total returns do not include the effect of any sales charge. |
| 3 | “POP” (Public Offering Price) total returns include the effect of the maximum front-end 3.75% sales charge. |
| 4 | “CDSC” (Contingent Deferred Sales Charge) is applied to redemptions of certain classes of shares that do not have a sales charge applied at the time of purchase. CDSC charges for certain redemptions of Class A shares made within 18 months of purchase in which a finder’s fee was paid and all redemptions of Class C shares within the first year are 1% and 0% thereafter. |
| 5 | The since inception index returns are from the Fund’s inception date. |
| 6 | The expense ratios of the Fund are set forth according to the prospectus for the Fund effective January 28, 2015, as supplemented and revised, and may differ from the expense ratios disclosed in the Financial Highlights tables in this report. See the Financial Highlights for more current expense ratios. Net Expense: Expenses reduced by the contractual fee waiver in effect through January 31, 2017. For the period of October 1, 2014 through August 31, 2015, the waiver was voluntary. Gross Expense: Does not reflect the effect of the fee waiver. Expense ratios reflect fees and expenses associated with the underlying funds. |
Growth of $10,000 For periods ended 9/30
This chart assumes an initial investment of $10,000 made on December 18, 2012 (inception date of the Fund), for Class A, Class C, and Class I shares including any applicable sales charges or fees. Performance assumes reinvestment of dividends and capital gain distributions.
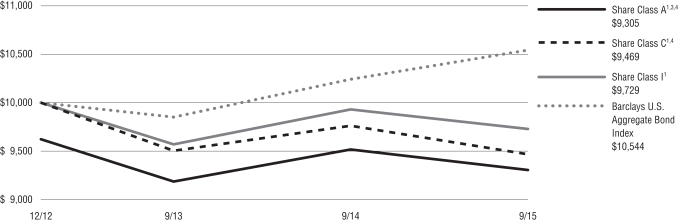
The index is unmanaged and not available for direct investment; therefore, its performance does not reflect the expense associated with active management of an actual portfolio.
For information regarding the indexes and certain investment terms, see the Key Investment Terms starting on page 4.
13
Table of Contents
Disciplined Select Country Fund
Fund Summary | Ticker Symbols: Class A: VDCAX Class C: VDCCX Class I: VDCIX |
Portfolio Manager Commentary by Newfound Investments, LLC
| ¢ | The Fund is diversified and has an investment objective of capital appreciation. |
| ¢ | For the fiscal year ended September 30, 2015, the Fund’s Class A shares at NAV returned -9.68%, Class C shares returned -10.29%, and Class I shares returned -9.43%. For the same period, S&P 500® Index, a broad-based equity index, returned -0.61%, and the MSCI EAFE® Index (net), the Fund’s style-specific benchmark appropriate for comparison, returned -8.66%. |
All performance figures assume reinvestment of distributions and exclude the effect of sales charges. Past performance is no guarantee of future results, and current performance may be higher or lower than the performance shown above.
How did the markets perform during the Fund’s fiscal year?
| ¢ | During the Fund’s fiscal year, the MSCI EAFE® Index returned -8.66%. This return was largely due to concerns about slowing global economic growth as well as a strengthening U.S. dollar relative to global currencies. |
| ¢ | While January through May 2015 saw strong growth in the MSCI EAFE® Index, concerns about global growth and economic recovery led to a significant sell-off throughout the second and third quarters of 2015. At the end of the Fund’s fiscal year, the MSCI EAFE® Index was in a -14.80% drawdown. |
What factors affected the Fund’s performance during its fiscal year?
| ¢ | The Fund dramatically shifted off-benchmark during the period; in the vast majority of weeks, at least one or two countries were selectively removed from the portfolio. Australia (ETF: EWA) and Spain (ETF: EWP), for example, were both removed from the portfolio for the entire fiscal year, avoiding a -20.84% and -20.18% drawdown in these positions. |
| ¢ | A significant detractor in performance was the construction methodology utilized in the defensive, minimum-volatility portfolio. When a country is |
selectively removed, available capital is reallocated equally across the four countries exhibiting the lowest volatility (subject to the constraint that not all the countries are from the same geographic region). |
| ¢ | Despite a negative signal since June, Singapore (ETF: EWS) remained in the portfolio at significant size based on its inclusion in the minimum volatility portfolio. Instead of avoiding a -19.17% loss in the country based on our momentum signals, we held an overweight to this country due to its low volatility levels. This resulted in a significant drag on portfolio performance over the period. |
The preceding information is the opinion of portfolio management. Any such opinions are subject to change at any time based on market or other conditions and should not be relied upon as investment advice. Past performance is no guarantee of future results, and there is no guarantee that market forecasts will be realized.
There is no guarantee that the Fund will meet its objectives.
| Asset Allocation | ||||||||
The following table presents asset allocations within certain sectors and as a percentage of total investments as of September 30, 2015.
|
| |||||||
Exchange-Traded Funds | 99 | % | ||||||
MSCI Switzerland Index Fund | 25 | % | ||||||
MSCI Japan Index Fund | 25 | |||||||
MSCI France Index Fund | 25 | |||||||
MSCI Sweden Index Fund | 24 | |||||||
Other (includes short-term investments) | 1 | |||||||
|
| |||||||
Total | 100 | % | ||||||
|
| |||||||
Equity Securities: The market price of equity securities may be adversely affected by financial market, industry, or issuer-specific events. Focus on a particular style or on small or medium-sized companies may enhance that risk.
Exchange Traded Funds: The value of an ETF may be more volatile than the underlying portfolio of securities the ETF is designed to track. The costs of owning the ETF may exceed the cost of investing directly in the underlying securities.
Foreign Investing: Investing internationally involves additional risks such as currency, political, accounting, economic, and market risk.
Prospectus: For additional information on risks, please see the fund’s prospectus.
For information regarding the indexes and certain investment terms, see the Key Investment Terms starting on page 4.
14
Table of Contents
Disciplined Select Country Fund (Continued)
| Average Annual Total Returns1 for periods ended 9/30/15 | ||||||||||||
| 1 year | Since Inception | Inception Date | ||||||||||
| Class A Shares at NAV2 | -9.68 | % | 0.97 | % | 12/18/12 | |||||||
| Class A Shares at POP3,4 | -14.87 | -1.16 | 12/18/12 | |||||||||
| Class C Shares at NAV2 and with CDSC4 | -10.29 | 0.24 | 12/18/12 | |||||||||
| Class I Shares at NAV | -9.43 | 1.24 | 12/18/12 | |||||||||
S&P 500® Index | -0.61 | 13.03 | 5 | — | ||||||||
| MSCI EAFE® Index (net) | -8.66 | 3.74 | 5 | — | ||||||||
Fund Expense Ratios6: A Shares: Gross 6.92%, Net 1.70%; C Shares: Gross 7.67%, Net 2.45%; I Shares: Gross 6.67%, Net 1.45%.
All returns represent past performance which is no guarantee of future results. Current performance may be higher or lower than the performance shown. The investment return and principal value of an investment will fluctuate so that an investor’s shares, when redeemed, may be worth more or less than their original cost. The above table and graph below do not reflect the deduction of taxes that a shareholder would pay on fund distributions or the redemption of shares. Please visit Virtus.com for performance data current to the most recent month-end.
| 1 | Total returns are historical and include changes in share price and the reinvestment of both dividends and capital gains distributions. |
| 2 | “NAV” (Net Asset Value) total returns do not include the effect of any sales charge. |
| 3 | “POP” (Public Offering Price) total returns include the effect of the maximum front-end 5.75% sales charge. |
| 4 | “CDSC” (Contingent Deferred Sales Charge) is applied to redemptions of certain classes of shares that do not have a sales charge applied at the time of purchase. CDSC charges for certain redemptions of Class A shares made within 18 months of purchase in which a finder’s fee was paid and all redemptions of Class C shares within the first year are 1% and 0% thereafter. |
| 5 | The since inception index returns are from the Fund’s inception date. |
| 6 | The expense ratios of the Fund are set forth according to the prospectus for the Fund effective January 28, 2015, as supplemented and revised, and may differ from the expense ratios disclosed in the Financial Highlights tables in this report. See the Financial Highlights for more current expense ratios. Net Expense: Expenses reduced by the contractual fee waiver in effect through January 31, 2017. For the period of October 1, 2014, through August 31, 2015, the waiver was voluntary. Gross Expense: Does not reflect the effect of the fee waiver. Expense ratios reflect fees and expenses associated with the underlying funds. |
Growth of $10,000 For periods ended 9/30
This chart assumes an initial investment of $10,000 made on December 18, 2012 (inception date of the Fund), for Class A, Class C, and Class I shares including any applicable sales charges or fees. Performance assumes reinvestment of dividends and capital gain distributions.
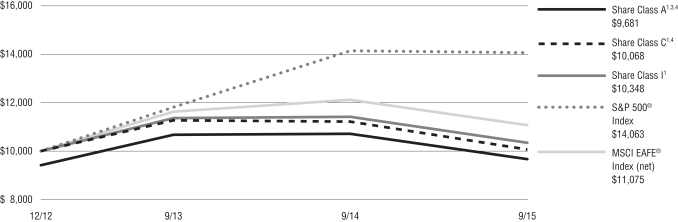
The indexes are unmanaged and not available for direct investment; therefore, their performance does not reflect the expense associated with active management of an actual portfolio.
For information regarding the indexes and certain investment terms, see the Key Investment Terms starting on page 4.
15
Table of Contents
Fund Summary | Ticker Symbols: Class A: EMNAX Class B: EMNBX Class C: EMNCX Class I: VIMNX Class R6: VDARX |
Portfolio Manager Commentary by Euclid Advisors LLC
| ¢ | The Fund is diversified and has an investment objective of long-term capital appreciation. |
| ¢ | For the fiscal year ended September 30, 2015, the Fund’s Class A shares at NAV returned -11.02%, Class B shares returned -11.76%, Class C shares returned -11.73%, Class I shares returned -10.86%, and Class R6 shares from November 12, 2014 (inception date) through September 30, 2015 returned -7.69%*. For the fiscal year, the S&P 500® Index, which is the broad-based equity index returned -0.61%, and the HFRX Equity Hedge Index the Fund’s style-specific index returned -2.95%. |
| * | Returns less than 1 year are not annualized. |
All performance figures assume reinvestment of distributions and exclude the effect of sales charges. Past performance is no guarantee of future results, and current performance may be higher or lower than the performance shown above.
How did the markets perform during the Fund’s fiscal year?
| ¢ | During the early months of the fiscal year, equity markets were mostly calm, rising gradually despite a spike in volatility in October 2014, a quick sell-off and subsequent recovery, and a modest drawdown in January 2015. In the middle of May 2015, management of the Fund changed, as did the Fund’s investment strategy. While the central investment thesis – participation in rising equity markets with protection in higher risk markets – remained the same, the techniques used to achieve these goals changed. The new investment strategy combines relative strength analysis, used to identify the most attractive areas for investment in the U.S. equity markets, with absolute momentum analysis, which is used to identify periods when a more cautious approach to taking equity risk is required. |
| ¢ | Soon after the manager change was made, the new strategy was tested by two very different market environments. The months of May, June, and July were relatively calm for U.S. equity markets, despite a brief spike in volatility in late June. Global |
concerns seemed to have little impact on U.S. markets, and the longstanding bull market appeared intact. Stocks began to fall into August, although volatility and risk levels remained reasonable. |
| ¢ | As August came to a close, U.S. equity markets experienced massive volatility, as markets appeared to digest an array of global stresses all at once. A deterioration that began in the third week of August devolved into a complete meltdown on Monday, August 24, when the Dow Jones Industrial AverageSM dropped more than 1,000 points after the market open, the largest intra-day drop in history. Concurrently, the CBOE Volatility Index® (VIX®) experienced its largest two-day percentage increase since the index was first published in 1990. |
| ¢ | Volatility settled into an elevated regime over the rest of September, with the VIX® at levels roughly double what was seen in July and early August. After an extremely choppy September, the S&P 500® Index (price return) ended the quarter about 7% below where it started, and about 10% below the highs reached in mid-July. This put the index down just over 1% over the 12 months, and down over 7% for 2015, leaving market participants to ask the question: Is this the end of one of the longest and strongest bull markets of all time, or just a (major) bump in the road? In our view, prediction is less reliable than preparation, and the portfolio is prepared to respond to both eventualities. |
What factors affected the Fund’s performance during its fiscal year?
| ¢ | The Fund was bullishly positioned (with five sectors on and levered 25%) to start the fiscal year before a large drawdown occurred in which the portfolio de-risked to just one sector (75% in cash equivalents and 45% short) as volatility levels escalated quickly. The market subsequently rebounded quicker than the downturn and hit all-time highs. Going to cash and shorting the sectors, then carrying them through to the middle of December, was the largest drag on the portfolio as the market continued to advance. Heading into January the Fund was bullishly positioned (with four sectors on and levered 15%) in January before the market experienced another modest |
downturn and volatility levels became elevated; the portfolio de-risked to one sector (75% cash equivalents and 45% short). The market subsequently rebounded in February, reaching all-time highs. Remaining invested in one or two sectors, being short seven or eight sectors during February, and failing to participate in the strong market rally in February led to the underperformance in the first part of the fiscal year. |
| ¢ | As the change in Fund management was made in May 2015, global markets remained calm. The Fund maintained full exposure to equities until the last week of August, in line with the calm markets up to that point. Just before the end of the month, in response to the quickly deteriorating conditions, the Fund began to aggressively trade out of equities and into cash equivalents as a defensive mechanism. By the end of August, more than one-third of the portfolio was in cash equivalents. In addition, a short position in the S&P 500® Index was added to provide further protection and to enable the Fund to benefit from a continuation of the negative market trend. |
| ¢ | Selling activity was not focused on any sectors in particular, as the market sell-off was broad-based and appeared to impact all parts of the equities universe. The Fund did maintain an existing overweight to consumer discretionary stocks throughout the selling activity, ending the period with a nearly 30% allocation to that sector. This allocation was based on the strength of the sub-industries within that sector compared to the rest of the market, a theme which has been active for a number of months. |
| ¢ | As of the Fund’s fiscal year end, the S&P 500® Index was still significantly below its 200-day average price level, and the portfolio had a cash position in excess of 35% plus a short S&P 500® Index position. The defensive actions taken by the Fund in August and September led to outperformance, compared to the S&P 500® Index, of approximately 2.40% since the changes to the investment strategy were made. |
The preceding information is the opinion of portfolio management. Any such opinions are subject to change at any time based upon market or other conditions and should not be relied upon as investment
For information regarding the indexes and certain investment terms, see the Key Investment Terms starting on page 4.
16
Table of Contents
| Dynamic Trend Fund (Continued) |
advice. Past performance is no guarantee of future results, and there is no guarantee that market forecasts will be realized.
There is no guarantee that the Fund will meet its objective.
Equity Securities: The market price of equity securities may be adversely affected by financial market, industry, or issuer-specific events. Focus on a particular style or on small or medium-sized companies may enhance that risk.
Industry/Sector Concentration: A fund that focuses its investments in a particular industry or sector will be more sensitive to conditions that affect that industry or sector than a non-concentrated fund.
Allocation: The fund’s exposure to different asset classes may not be optimal for market conditions at a given time. Asset allocation does not guarantee a profit or protect against a loss in declining markets.
Short Sales: The fund may engage in short sales, and may experience a loss if the price of a borrowed security increases before the date on which the fund replaces the security.
Prospectus: For additional information on risks, please see the fund’s prospectus.
There is no relationship between Dorsey Wright and Virtus other than a license by Dorsey Wright to Virtus of certain Dorsey Wright trademarks and trade names, and the Dorsey Wright technical analysis (“Technical Analysis”). The Technical Analysis has been created and developed by Dorsey Wright without regard to and independently of Virtus, its business, its development of this product, and/or any prospective investor. The licensing of any Technical Analysis to Virtus is not an offer to purchase or sell, or a solicitation or an offer to buy any securities. A determination that any portion of an investor’s portfolio should be devoted to any product developed by Virtus is a determination made solely by the investment advisor serving the investor or the investor himself, not Dorsey Wright or Virtus.
| Asset Allocation – Long | ||||
The following table presents asset allocations within certain sectors as a percentage of total long investments as of September 30, 2015.
|
| |||
Consumer Discretionary | 28 | % | ||
Information Technology | 8 | |||
Consumer Staples | 8 | |||
Health Care | 7 | |||
Other (includes short-term investments) | 49 | |||
|
| |||
Total | 100 | % | ||
|
| |||
| Asset Allocation – Short | ||||
The following table presents asset allocations within certain sectors as a percentage of total short investments as of September 30, 2015.
|
| |||
Exchange-Traded Fund | 100 | % | ||
|
| |||
Total | 100 | % | ||
|
| |||
For information regarding the indexes and certain investment terms, see the Key Investment Terms starting on page 4.
17
Table of Contents
Dynamic Trend Fund (Continued)
| Average Annual Total Returns1 for periods ended 9/30/15 | ||||||||||||||||||||
| 1 year | 5 years | 10 years | Since Inception | Inception Date | ||||||||||||||||
| Class A Shares at NAV2 | -11.02 | % | 2.98 | % | 0.65 | % | — | — | ||||||||||||
| Class A Shares at POP3,4 | -16.14 | 1.77 | 0.05 | — | — | |||||||||||||||
| Class B Shares at NAV2 | -11.76 | 2.17 | -0.14 | — | — | |||||||||||||||
| Class B Shares with CDSC4 | -14.74 | 2.00 | -0.14 | — | — | |||||||||||||||
| Class C Shares at NAV2 and with CDSC4 | -11.73 | 2.22 | -0.11 | — | — | |||||||||||||||
| Class I Shares at NAV | -10.86 | 3.26 | — | 2.87 | % | 10/1/09 | ||||||||||||||
| Class R6 Shares at NAV | — | — | — | -7.69 | 11/12/14 | |||||||||||||||
| S&P 500® Index | -0.61 | 13.34 | 6.80 | — | 5 | — | ||||||||||||||
| HFRX Equity Hedge Index | -2.95 | -0.18 | -0.25 | — | 6 | — | ||||||||||||||
Fund Expense Ratios7: A Shares: 1.52%; B Shares: 2.27%; C Shares: 2.27%; I Shares: 1.27%; R6 Shares 1.20%.
All returns represent past performance which is no guarantee of future results. Current performance may be higher or lower than the performance shown. The investment return and principal value of an investment will fluctuate so that an investor’s shares, when redeemed, may be worth more or less than their original cost. The above table and graph below do not reflect the deduction of taxes that a shareholder would pay on fund distributions or the redemption of shares. Please visit Virtus.com for performance data current to the most recent month-end.
| 1 | Total returns are historical and include changes in share price and the reinvestment of both dividends and capital gains distributions. |
| 2 | “NAV” (Net Asset Value) total returns do not include the effect of any sales charge. |
| 3 | “POP” (Public Offering Price) total returns include the effect of the maximum front-end 5.75% sales charge. |
| 4 | “CDSC” (Contingent Deferred Sales Charge) is applied to redemptions of certain classes of shares that do not have a sales charge applied at the time of purchase. CDSC charges for certain redemptions of Class A shares made within 18 months of purchase in which a finder’s fee was paid and all redemptions of Class C shares within the first year are 1% and 0% thereafter. CDSC charges for B shares decline from 5% to 0% over a six year period. |
| 5 | The index returned 0.52% for Class I and -2.45% for Class R6 since the inception date of the respective share class. |
| 6 | The index returned 13.29% for Class I and -4.06% for Class R6 since the inception date of the respective share class. |
| 7 | The expense ratios of the Fund are set forth according to the prospectus for the Fund effective January 28, 2015, as supplemented and revised, and may differ from the expense ratios disclosed in the Financial Highlights tables in this report. See the Financial Highlights for more current expense ratios. Expense ratios include 0.22% of dividends on short sales and interest expenses. |
Growth of $10,000 For periods ended 9/30
This chart assumes an initial investment of $10,000 made on September 30, 2005, for Class A, Class B, and Class C shares including any applicable sales charges or fees. Performance assumes reinvestment of dividends and capital gain distributions.
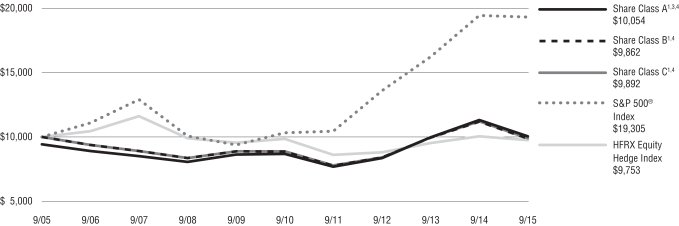
The indexes are unmanaged and not available for direct investment; therefore, their performance does not reflect the expenses associated with active management of an actual portfolio.
For information regarding the indexes and certain investment terms, see the Key Investment Terms starting on page 4.
18
Table of Contents
Fund Summary | Ticker Symbols: Class A: VAPAX Class C: VAPCX Class I: VAPIX Class R6: VRPAX |
Portfolio Manager Commentary by Euclid Advisors LLC
| ¢ | The Fund is diversified and has an investment objective of long-term capital appreciation. |
| ¢ | For the fiscal year ended September 30, 2015, the Fund’s Class A shares at NAV returned -12.79%, Class C shares returned -13.45%, Class I shares returned -12.57% for the fiscal year and Class R6 shares from November 12, 2014, (inception date) through September 30, 2015 returned -11.39%*. For the fiscal year, the S&P 500® Index, both the broad-based equity index and the style specific index, returned -0.61%. |
| * | Returns less than 1 year are not annualized. |
All performance figures assume reinvestment of distributions and exclude the effect of sales charges. Past performance is no guarantee of future results, and current performance may be higher or lower than the performance shown above.
How did the markets perform during the Fund’s fiscal year?
| ¢ | During the early months of the fiscal year, equity markets were mostly calm, rising gradually despite a spike in volatility in October 2014, a quick sell-off and subsequent recovery, and a modest drawdown in January 2015. In the middle of May 2015, management of the Fund changed, as did the Fund’s investment strategy. While the central investment thesis – participation in rising equity markets with protection in higher risk markets – remained the same, the techniques used to achieve these goals changed. The new investment strategy combines relative strength analysis, used to identify the most attractive areas for investment in the U.S. equity markets, with absolute momentum analysis, which is used to identify periods when a more cautious approach to taking equity risk is required. |
| ¢ | Soon after the manager change was made, the new strategy was tested by two very different market environments. The months of May, June, and July were relatively calm for U.S. equity markets, despite a brief spike in volatility in late June. Global concerns seemed to have little impact on U.S. markets, and the longstanding bull market |
appeared intact. Stocks began to fall into August, although volatility and risk levels remained reasonable. |
| ¢ | As August came to a close, U.S. equity markets experienced massive volatility, as markets appeared to digest an array of global stresses all at once. A deterioration that began in the third week of August devolved into a complete meltdown on Monday, August 24, when the Dow Jones Industrial AverageSM dropped more than 1,000 points after the market open, the largest intra-day drop in history. Concurrently, the CBOE Volatility Index® (VIX®) experienced its largest two-day percentage increase since the index was first published in 1990. |
| ¢ | Volatility settled into an elevated regime over the rest of September, with the VIX® at levels roughly double what was seen in July and early August. After an extremely choppy September, the S&P 500® Index (price return) ended the quarter about 7% below where it started, and about 10% below the highs reached in mid-July. This put the index down just over 1% over the 12 months, and down over 7% for 2015, leaving market participants to ask the question: Is this the end of one of the longest and strongest bull markets of all time, or just a (major) bump in the road? In our view, prediction is less reliable than preparation, and the portfolio is prepared to respond to both eventualities. |
What factors affected the Fund’s performance during its fiscal year?
| ¢ | The Fund was bullishly positioned (with five sectors on) to start the fiscal year before a large drawdown occurred in which the portfolio de-risked to one sector (with 75% in cash equivalents) as volatility levels escalated quickly. The market subsequently rebounded quicker than the downturn and managed to hit all-time highs. Going to cash and carrying it through to the middle of December 2014, was the largest drag on the portfolio as the market continued to advance. The Fund avoided most of the drawdown in energy which had deteriorated quickly over this period, helping performance. Heading into January, the Fund was bullishly positioned (with five sectors on) before the market experienced another modest downturn and volatility levels became elevated; the portfolio once again de-risked to one sector (and 75% in cash equivalents). The market subsequently rebounded in February, |
reaching all-time highs. Remaining invested in just one or two sectors and failing to participate in the strong market rally in February led to the underperformance in the first part of the year. |
| ¢ | As the change in Fund management was made in May 2015, global markets remained calm. The Fund maintained full exposure to equities until the last week of August, in line with the calm markets up to that point. Just before the end of the month, in response to the quickly deteriorating conditions, the Fund began to aggressively trade out of equities and into cash equivalents as a defensive mechanism. By the end of August, more than one-third of the portfolio was in cash equivalents. By the first week of September, the cash position had increased to greater than 50% of the portfolio. |
| ¢ | Activity was not focused on any sectors in particular, as the market sell-off was broad-based and appeared to impact all parts of the equities universe. The Fund did maintain an existing overweight to consumer discretionary stocks throughout the selling activity, ending the period with a roughly 20% allocation to that sector. This allocation was based on the strength of the sub-industries within that sector compared to the rest of the market, a theme which has been active for a number of months. |
| ¢ | As the quarter ended, the S&P 500® Index was still significantly below its 200-day average price level, and the portfolio had a cash position in excess of 50%. The defensive actions taken by the Fund in August and September led to outperformance during the quarter of approximately 1.25% compared to the S&P 500® Index. |
The preceding information is the opinion of portfolio management. Any such opinions are subject to change at any time based upon market or other conditions and should not be relied upon as investment advice. Past performance is no guarantee of future results, and there is no guarantee that market forecasts will be realized.
There is no guarantee that the Fund will meet its objective.
Equity Securities: The market price of equity securities may be adversely affected by financial market, industry, or issuer-specific events. Focus on
For information regarding the indexes and certain investment terms, see the Key Investment Terms starting on page 4.
19
Table of Contents
| Equity Trend Fund (Continued) |
a particular style or on small or medium-sized companies may enhance that risk.
Industry/Sector Concentration: A fund that focuses its investments in a particular industry or sector will be more sensitive to conditions that affect that industry or sector than a non-concentrated fund.
Allocation: The fund’s exposure to different asset classes may not be optimal for market conditions at a given time. Asset allocation does not guarantee a profit or protect against a loss in declining markets.
Prospectus: For additional information on risks, please see the fund’s prospectus.
There is no relationship between Dorsey Wright and Virtus other than a license by Dorsey Wright to Virtus of certain Dorsey Wright trademarks and trade names, and the Dorsey Wright technical analysis (“Technical Analysis”). The Technical Analysis has been created and developed by Dorsey Wright without regard to and independently of Virtus, its business, its development of this product, and/or any prospective investor. The licensing of any Technical Analysis to Virtus is not an offer to purchase or sell, or a solicitation or an offer to buy any securities. A determination that any portion of an investor’s portfolio should be devoted to any product developed by Virtus is a determination made solely by the investment advisor serving the investor or the investor himself, not Dorsey Wright or Virtus.
| Asset Allocation | ||||
The following table presents asset allocations within certain sectors and as a percentage of total investments as of September 30, 2015. |
| |||
Consumer Discretionary | 21 | % | ||
Consumer Staples | 8 | |||
Information Technology | 6 | |||
Industrials | 5 | |||
Health Care | 3 | |||
Materials | 2 | |||
Utilities | 2 | |||
Other (includes short-term investments) | 53 | |||
|
| |||
Total | 100 | % | ||
|
| |||
For information regarding the indexes and certain investment terms, see the Key Investment Terms starting on page 4.
20
Table of Contents
Equity Trend Fund (Continued)
| Average Annual Total Returns1 for periods ended 9/30/15 | ||||||||||||||||
| 1 year | 5 years | Since Inception | Inception Date | |||||||||||||
| Class A Shares at NAV2 | -12.79 | % | 7.42 | % | 9.33 | % | 7/1/10 | |||||||||
| Class A Shares at POP3,4 | -17.81 | 6.15 | 8.10 | 7/1/10 | ||||||||||||
| Class C Shares at NAV2 and with CDSC4 | -13.45 | 6.61 | 8.51 | 7/1/10 | ||||||||||||
| Class I Shares at NAV | -12.57 | 7.68 | 9.59 | 7/1/10 | ||||||||||||
| Class R6 Shares at NAV | — | — | -11.39 | 11/12/14 | ||||||||||||
| S&P 500® Index | -0.61 | 13.34 | — | 5 | — | |||||||||||
Fund Expense Ratios6: A Shares: 1.51%; C Shares: 2.26%; I Shares: 1.26%; R6 Shares 1.19%.
All returns represent past performance which is no guarantee of future results. Current performance may be higher or lower than the performance shown. The investment return and principal value of an investment will fluctuate so that an investor’s shares, when redeemed, may be worth more or less than their original cost. The above table and graph below do not reflect the deduction of taxes that a shareholder would pay on fund distributions or the redemption of shares. Please visit Virtus.com for performance data current to the most recent month-end.
| 1 | Total returns are historical and include changes in share price and the reinvestment of both dividends and capital gains distributions. |
| 2 | “NAV” (Net Asset Value) total returns do not include the effect of any sales charge. |
| 3 | “POP” (Public Offering Price) total returns include the effect of the maximum front-end 5.75% sales charge. |
| 4 | “CDSC” (Contingent Deferred Sales Charge) is applied to redemptions of certain classes of shares that do not have a sales charge applied at the time of purchase. CDSC charges for certain redemptions of Class A shares made within 18 months of purchase in which a finder’s fee was paid and all redemptions of Class C shares within the first year are 1% and 0% thereafter. |
| 5 | The index returned 15.05% for Classes A, C, and I since the inception date of those respective classes and -4.06% since the inception date of Class R6. |
| 6 | The expense ratios of the Fund are set forth according to the prospectus for the Fund effective January 28, 2015, as supplemented and revised, and may differ from the expense ratios disclosed in the Financial Highlights tables in this report. See the Financial Highlights for more current expense ratios. |
Growth of $10,000 For periods ended 9/30
This chart assumes an initial investment of $10,000 made on July 1, 2010 (inception date of the Fund), for Class A, Class C, and Class I shares including any applicable sales charges or fees. Performance assumes reinvestment of dividends and capital gain distributions.
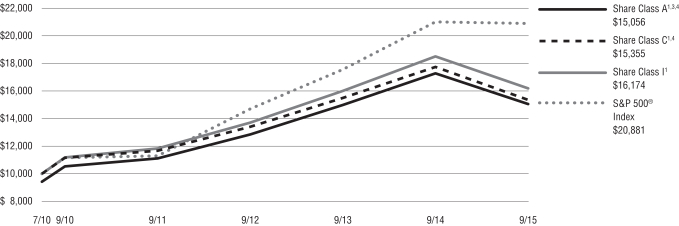
The indexes are unmanaged and not available for direct investment; therefore, their performance does not reflect the expenses associated with active management of an actual portfolio.
For information regarding the indexes and certain investment terms, see the Key Investment Terms starting on page 4.
21
Table of Contents
Fund Summary | Ticker Symbols: Class A: VGPAX Class C: VGPCX Class I: VGPIX |
Portfolio Manager Commentary by Euclid Advisors LLC
| ¢ | The Fund is diversified and has an investment objective of capital appreciation. In pursuing this objective, the Fund maintains an emphasis on preservation of capital. |
| ¢ | For the fiscal year ended September 30, 2015, the Fund’s Class A shares at NAV returned -13.21%, Class C shares returned -13.88%, and Class I shares returned -13.06%. For the same period, the S&P 500® Index, a broad-based equity index, returned -0.61%. MSCI All Country World Index (net), the Fund’s style-specific benchmark appropriate for comparison returned -6.66%. |
All performance figures assume reinvestment of distributions and exclude the effect of sales charges. Past performance is no guarantee of future results, and current performance may be higher or lower than the performance shown above.
How did the markets perform during the Fund’s fiscal year?
| ¢ | During the early months of the fiscal year, global equity markets were mostly calm, rising gradually despite a spike in volatility in October 2014, a quick sell-off and subsequent recovery, and a modest drawdown in January 2015. In the middle of May 2015, management of the Fund changed, as did the Fund’s investment strategy. While the central investment thesis – participation in rising equity markets with protection in higher risk markets – remained the same, the techniques used to achieve these goals changed. The new investment strategy combines relative strength analysis, used to identify the most attractive areas for investment in global equity markets, with absolute momentum analysis, which is used to identify periods when a more cautious approach to taking equity risk is required. |
| ¢ | Soon after the manager change was made, the new strategy was tested by two very different market environments. The months of May, June, and July were relatively calm for U.S. equity markets, despite a brief spike in volatility in late June. Global concerns seemed to have little impact on U.S. markets, and the longstanding bull market appeared intact. Stocks began to fall into August, although volatility and risk levels remained reasonable. |
| ¢ | As August came to a close, U.S. equity markets experienced massive volatility, as markets appeared to digest an array of global stresses all at once. A deterioration that began in the third week of August devolved into a complete meltdown on Monday, August 24, when the Dow Jones Industrial AverageSM dropped more than 1,000 points after the market open, the largest intra-day drop in history. Concurrently, the CBOE Volatility Index® (VIX®) experienced its largest two-day percentage increase since the index was first published in 1990. |
| ¢ | Volatility settled into an elevated regime over the rest of September, with the VIX® at levels roughly double what was seen in July and early August. After an extremely choppy September, the S&P 500® Index (price return) ended the quarter about 7% below where it started, and about 10% below the highs reached in mid-July. This put the index down just over 1% over the 12 months, and down over 7% for 2015. In comparison, the MSCI All Country World Index (ex-US) was down nearly 12% over the 12 months and down over 8% year to date. These troubling signs leave market participants to ask the question: Is this the end of one of the longest and strongest bull markets of all time, or just a (major) bump in the road? In our view, prediction is less reliable than preparation, and the portfolio is prepared to respond to both eventualities. |
What factors affected the Fund’s performance during its fiscal year?
| ¢ | The Fund was bullishly positioned to start the fiscal year before a large drawdown occurred in which the portfolio de-risked to one sector on the domestic side, and one region on the international side, as volatility levels escalated quickly. The market subsequently rebounded quicker than the downturn and hit all-time highs. Going to over 60% in cash equivalents, and carrying it through to the middle of December, was the largest drag on the portfolio as the market continued to advance. The Fund avoided most of the drawdown in energy, which had deteriorated quickly over this time period, helping performance. Staying in emerging markets also helped performance. Heading into January, the Fund was bullishly positioned before the market experienced another modest downturn and volatility levels became elevated; the portfolio de-risked to 57% cash equivalents. The market |
subsequently rebounded in February, reaching all-time highs. Remaining invested in one or two sectors/regions during February and failing to participate in the strong market rally that month led to the underperformance in the first part of the year. |
| ¢ | As the change in Fund management was made in May 2015, global markets remained calm. The Fund maintained full exposure to equities until the last week of August, in line with the calm markets up to that point. Just before the end of the month, in response to the quickly deteriorating conditions, the Fund began to aggressively trade out of equities and into cash as a defensive mechanism. By the end of August, more than one-third of the U.S. portion of the portfolio was in cash, and the non-U.S. portion had a nearly 85% cash equivalents position. By the first week of September, the U.S. portfolio’s cash position had increased to greater than 50%, while the non-U.S. portfolio maintained its large cash allocation. |
| ¢ | Activity in the U.S. portfolio was not focused on any sectors in particular, as the market sell-off was broad-based and appeared to impact all parts of the equities universe. The Fund did maintain an existing overweight to consumer discretionary stocks throughout the selling activity, ending the period with a roughly 20% allocation to that sector. This allocation was based on the strength of the sub-industries within that sector compared to the rest of the market, a theme which has been active for a number of months. |
| ¢ | The global portfolio, in the context of generally weaker global markets, had begun cutting risk exposure in late July. In short order the Fund exited positions in Asia (China, India, Japan, Hong Kong) and Europe (Spain, Switzerland, Germany). By the end of August, only Italy remained in the portfolio. |
| ¢ | As the quarter ended, both the S&P 500® Index and the MSCI All Country World Index (ex-US) were still significantly below their 200-day average price levels, and the portfolio had a cash equivalents position in excess of 65%. The defensive activities the Fund took in August and September led to outperformance, since the investment strategy was changed, of approximately 7.00% compared to the MSCI All Country World Index |
For information regarding the indexes and certain investment terms, see the Key Investment Terms starting on page 4.
22
Table of Contents
| Global Equity Trend Fund (Continued) |
(ex-US), while the non-U.S exposure led to slight underperformance compared to the S&P 500® Index. |
The preceding information is the opinion of portfolio management. Any such opinions are subject to change at any time based upon market or other conditions and should not be relied upon as investment advice. Past performance is no guarantee of future results, and there is no guarantee that market forecasts will be realized.
There is no guarantee that the Fund will meet its objective.
Equity Securities: The market price of equity securities may be adversely affected by financial market, industry, or issuer-specific events. Focus on a particular style or on small or medium-sized companies may enhance that risk.
Industry/Sector Concentration: A fund that focuses its investments in a particular industry or sector will be more sensitive to conditions that affect that industry or sector than a non-concentrated fund.
Exchange Traded Funds: The value of an ETF may be more volatile than the underlying portfolio of securities the ETF is designed to track. The costs of owning the ETF may exceed the cost of investing directly in the underlying securities.
Foreign & Emerging Markets: Investing internationally, especially in emerging markets, involves additional risks such as currency, political, accounting, economic, and market risk.
Allocation: The fund’s exposure to different asset classes may not be optimal for market conditions at a given time. Asset allocation does not guarantee a profit or protect against a loss in declining markets.
Prospectus: For additional information on risks, please see the fund’s prospectus
There is no relationship between Dorsey Wright and Virtus other than a license by Dorsey Wright to Virtus of certain Dorsey Wright trademarks and trade names, and the Dorsey Wright technical analysis (“Technical Analysis”). The Technical Analysis has been created and developed by Dorsey Wright without regard to and independently of Virtus, its business, its development of this product, and/or any prospective investor. The licensing of any Technical
Analysis to Virtus is not an offer to purchase or sell, or a solicitation or an offer to buy any securities. A determination that any portion of an investor’s portfolio should be devoted to any product developed by Virtus is a determination made solely by the investment advisor serving the investor or the investor himself, not Dorsey Wright or Virtus.
| Asset Allocation | ||||
The following table presents asset allocations within certain sectors and as a percentage of total investments as of September 30, 2015. |
| |||
Consumer Discretionary | 16 | % | ||
Consumer Staples | 6 | |||
Information Technology | 5 | |||
Industrials | 4 | |||
Health Care | 3 | |||
Energy | 1 | |||
Materials | 1 | |||
Other (includes short-term investments) | 64 | |||
|
| |||
Total | 100 | % | ||
|
| |||
For information regarding the indexes and certain investment terms, see the Key Investment Terms starting on page 4.
23
Table of Contents
Global Equity Trend Fund (Continued)
| Average Annual Total Returns1 for periods ended 9/30/15 | ||||||||||||
| 1 year | Since Inception | Inception Date | ||||||||||
| Class A Shares at NAV2 | -13.21 | % | 2.62 | % | 3/15/11 | |||||||
| Class A Shares at POP3,4 | -18.20 | 1.29 | 3/15/11 | |||||||||
| Class C Shares at NAV2 and with CDSC4 | -13.88 | 1.88 | 3/15/11 | |||||||||
| Class I Shares at NAV | -13.06 | 2.85 | 3/15/11 | |||||||||
| S&P 500® Index | -0.61 | 11.64 | 5 | — | ||||||||
| MSCI AC World Index (Net) | -6.66 | 5.78 | 5 | — | ||||||||
Fund Expense Ratios6: A Shares: Gross 1.78%, Net 1.75%; C Shares: Gross 2.53%, Net 2.50%; I Shares: Gross 1.53%, Net 1.50%.
All returns represent past performance which is no guarantee of future results. Current performance may be higher or lower than the performance shown. The investment return and principal value of an investment will fluctuate so that an investor’s shares, when redeemed, may be worth more or less than their original cost. The above table and graph below do not reflect the deduction of taxes that a shareholder would pay on fund distributions or the redemption of shares. Please visit Virtus.com for performance data current to the most recent month-end.
| 1 | Total returns are historical and include changes in share price and the reinvestment of both dividends and capital gains distributions. |
| 2 | “NAV” (Net Asset Value) total returns do not include the effect of any sales charge. |
| 3 | “POP” (Public Offering Price) total returns include the effect of the maximum front-end 5.75% sales charge. |
| 4 | “CDSC” (Contingent Deferred Sales Charge) is applied to redemptions of certain classes of shares that do not have a sales charge applied at the time of purchase. CDSC charges for certain redemptions of Class A shares made within 18 months of purchase in which a finder’s fee was paid and all redemptions of Class C shares within the first year are 1% and 0% thereafter. |
| 5 | The since inception index returns are from the Fund’s inception date. |
| 6 | The expense ratios of the Fund are set forth according to the prospectus for the Fund effective January 28, 2015, as supplemented and revised, and may differ from the expense ratios disclosed in the Financial Highlights tables in this report. See the Financial Highlights for more current expense ratios. Net Expense: Expenses reduced by the contractual fee waiver, in effect through January 31, 2017. For the period of October 1, 2014 through August 31, 2015, the waiver was voluntary. Gross Expense: Does not reflect the effect of the fee waiver. Expense ratios reflect fees and expenses associated with the underlying funds. Class C share ratio reflects distributor’s contractual waiver for 12b-1 fees. |
Growth of $10,000 For periods ended 9/30
This chart assumes an initial investment of $10,000 made on March 15, 2011 (inception date of the Fund), for Class A, Class C, and Class I shares including any applicable sales charges or fees. Performance assumes reinvestment of dividends and capital gain distributions.
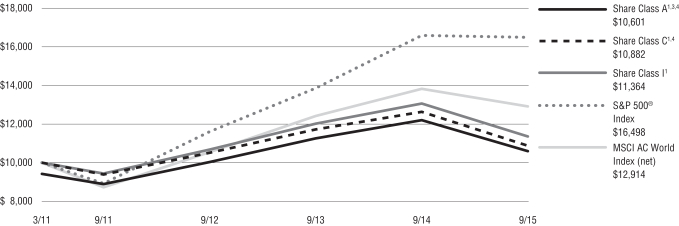
The indexes are unmanaged and not available for direct investment; therefore, their performance does not reflect the expenses associated with active management of an actual portfolio.
For information regarding the indexes and certain investment terms, see the Key Investment Terms starting on page 4.
24
Table of Contents
Fund Summary | Ticker Symbols: Class A: VHFAX Class C: VHFCX Class I: VHFIX |
Portfolio Manager Commentary by Thomas J. Herzfeld Advisors, Inc.
| ¢ | The Fund is diversified and has an investment objective of seeking capital appreciation and current income. |
| ¢ | For the fiscal year ended September 30, 2015, the Fund’s Class A shares at NAV returned -7.17%, Class C shares returned -7.94%, and Class I shares returned -7.01%. For the same period, the Fund’s style-specific benchmark, the Herzfeld Composite Index, which consists of 60% MSCI AC World Index (net) and 40% Barclays U.S. Aggregate Index, returned -2.76%. Performance for the composite’s underlying indices over the period was -6.66% for the MSCI AC World Index (net) and 2.94% for the Barclays U.S. Aggregate Bond Index. |
All performance figures assume reinvestment of distributions and exclude the effect of sales charges. Past performance is no guarantee of future results and current performance may be higher or lower than the performance shown above.
How did the markets perform during the Fund’s fiscal year?
| ¢ | Over the Fund’s fiscal year, the broad equity market struggled as the commodity sell-off led to widespread underperformance in energy, materials, industrials, and the emerging markets. Additionally, fears of the Federal Reserve’s first interest rate hike since 2006 sent the closed-end fund (CEF) fixed income market into a tailspin as price performance vastly underperformed NAV returns. With fixed income CEFs making up two-thirds of the marketplace, it made for a difficult fiscal year as discounts in taxable fixed income CEFs widened from -7.09% to -12.04% while municipal CEF discounts remained unchanged but elevated at -8.01%. The combination of weak global equity markets combined with weak fixed income CEF performance made for an extremely difficult market for CEF investors. |
| ¢ | The trend of discount widening, dating back to September 2012, had continued for three years as of September 2015. The discount widening trend in the industry has been extreme compared to historical standards as the CEF market traded at a slight premium of 0.25% in September of 2012 |
and closed the recent fiscal year at -9.99%. As a result, the average CEF investor has had a difficult time keeping pace with the overall equity and fixed income markets as they have lost more than 10 percentage points to discount widening over the three-year period. |
What factors affected the Fund’s performance during its fiscal year?
| ¢ | The Fund kept pace with the benchmark composite index over the first eight months of the fiscal period as the discount in the Fund vacillated between -10.06% and -11.79%. Through June 16, the Fund performance was equal with the benchmark composite index. The Fund deviated from the benchmark composite index in June as discounts widened to -12.95%. In July, oil began to sell off again, which sent the energy sector to new lows. The Fund’s overweight allocation to energy MLPs led to additional underperformance into the end of the fiscal year as the Alerian MLP Index dropped 22.1% in our last fiscal quarter. With all MLP CEFs utilizing leverage, this exacerbated the Fund’s underperformance. From June 16 to the end of the fiscal year, the Fund dropped 10.2% versus only a 5.8% loss for the benchmark composite index with 2 percentage points directly attributed to discount widening in the Fund and the remaining underperformance related to underperformance of levered equities, mainly MLPs. |
| ¢ | The sharp collapse in the stock market in August sent CEF investors to the sidelines as discounts on the Fund widened to more than -14% before closing the fiscal year at -13.95%. At the start of the fiscal year, the average discount of the Fund was -10.25%. The closing discount of -13.95% was 3.70 percentage points lower than the start of the year. This widening in the overall market and Fund holdings, coupled with the overweighting to midstream MLP CEFs, were the main detractors to the Fund’s performance over the fiscal year. |
| ¢ | Our overweight positioning to CEF preferred shares, our largest positioning by strategy, provided a solid income stream and minimal volatility. We felt these investments, which provide qualified dividends with coupons ranging from 7.25% to 8.125%, were more prudent than fixed income CEFs going into a possible Fed rate hike in 2015. Understanding the behavior and mindset of |
retail CEF investors, we expected there to be selling pressure in fixed income CEFs regardless of NAV performance as the constant news flow on when the Fed was going to hike rates would influence investment decisions more than fundamentals. Although no rate hike occurred over the fiscal year, discounts in taxable fixed income funds widened from -7.09% to -12.04%, leading to a majority of funds to have negative total returns over the fiscal year. |
| ¢ | With only four periods since 1987 where discounts in the CEF market breached -10%, we went to full investment in the Fund at the end of the fiscal year instead of waiting until tax-loss selling in December as we believe seasonal discount widening will be muted due to the extreme discounts we are currently seeing in the market. The Fund closed the fiscal year with a cash position of 2.5% versus the prior year’s 14%. |
| ¢ | The Fund used the sell-off in CEFs in the last fiscal quarter to add to equity and fixed income positions, which closed the period at 58.8% and 38.7%, respectively. At the prior fiscal year-end, only 46% was allocated to equities and 40% to fixed income. The fixed income allocation appears relatively unchanged year over year, but the composition of the holdings is vastly different as 24.6% of the portfolio is direct investment in CEF preferred shares versus 7.2% the year before. After the first Fed rate hike is done, we will be taking a closer look at fixed income CEFs again as we believe retail investors will return to the space once they see a rise in rates won’t affect the industry as much as they think based on the current extreme discounts. |
| ¢ | All CEF premium/discount data is sourced daily from Bloomberg and compiled by Thomas J. Herzfeld Advisors, Inc. Premium/discount is weighted by net assets of each fund. |
The preceding information is the opinion of portfolio management. Any such opinions are subject to change at any time based on market or other conditions and should not be relied upon as investment advice. Past performance is no guarantee of future results, and there is no guarantee that market forecasts will be realized.
For information regarding the indexes and certain investment terms, see the Key Investment Terms starting on page 4.
25
Table of Contents
| Herzfeld Fund (Continued) |
There is no guarantee that the Fund will meet its objectives.
| Asset Allocation | ||||
The following table presents asset allocations within certain sectors and as a percentage of total investments as of September 30, 2015.
|
| |||
Equity Funds | 35 | % | ||
International Equity Funds | 20 | |||
Fixed Income Funds | 15 | |||
Preferred Stock | 25 | |||
International Fixed Income Funds | 1 | |||
Other (includes short-term investments) | 4 | |||
|
| |||
Total | 100 | % | ||
|
| |||
Closed-end Funds: Closed-end funds may trade at a discount from their net asset values, which may affect whether the fund will realize gains or losses. They may also employ leverage, which may increase volatility.
Equity Securities: The market price of equity securities may be adversely affected by financial market, industry, or issuer-specific events. Focus on a particular style or on small or medium-sized companies may enhance that risk.
Credit & Interest: Debt securities are subject to various risks, the most prominent of which are credit and interest rate risk. The issuer of a debt security may fail to make interest and/or principal payments. Values of debt securities may rise or fall in response to changes in interest rates, and this risk may be enhanced with longer-term maturities.
Foreign & Emerging Markets: Investing internationally, especially in emerging markets, involves additional risks such as currency, political, accounting, economic, and market risk.
Fund of funds: Because the fund can invest in other funds, it indirectly bears its proportionate share of the operating expenses and management fees of the underlying fund(s).
Prospectus: For additional information on risks, please see the fund’s prospectus.
For information regarding the indexes and certain investment terms, see the Key Investment Terms starting on page 4.
26
Table of Contents
Herzfeld Fund (Continued)
| Average Annual Total Returns1 for periods ended 9/30/15 | ||||||||||||
| 1 year | Since Inception | Inception Date | ||||||||||
| Class A Shares at NAV2 | -7.17 | % | 3.99 | % | 9/5/12 | |||||||
| Class A Shares at POP3,4 | -12.51 | 2.01 | 9/5/12 | |||||||||
| Class C Shares at NAV2 and with CDSC | -7.94 | 3.22 | 9/5/12 | |||||||||
| Class I Shares at NAV | -7.01 | 4.25 | 9/5/12 | |||||||||
MSCI AC World Index (net) | -6.66 | 8.04 | 5 | — | ||||||||
| Barclays U.S. Aggregate Bond Index | 2.94 | 1.74 | 5 | — | ||||||||
| Herzfeld Composite: 60% MSCI AC World Index (net) / 40% Barclays U.S. Aggregate Index | -2.76 | 5.61 | 5 | — | ||||||||
Fund Expense Ratios6: A Shares: Gross 3.51%, Net 1.60%; C Shares: Gross 4.26%, Net 2.35%; I Shares: Gross 3.26%, Net 1.35%.
All returns represent past performance which is no guarantee of future results. Current performance may be higher or lower than the performance shown. The investment return and principal value of an investment will fluctuate so that an investor’s shares, when redeemed, may be worth more or less than their original cost. The above table and graph below do not reflect the deduction of taxes that a shareholder would pay on fund distributions or the redemption of shares. Please visit Virtus.com for performance data current to the most recent month-end.
| 1 | Total returns are historical and include changes in share price and the reinvestment of both dividends and capital gains distributions. |
| 2 | “NAV” (Net Asset Value) total returns do not include the effect of any sales charge. |
| 3 | “POP” (Public Offering Price) total returns include the effect of the maximum front-end 5.75% sales charge. |
| 4 | “CDSC” (Contingent Deferred Sales Charge) is applied to redemptions of certain classes of shares that do not have a sales charge applied at the time of purchase. CDSC charges for certain redemptions of Class A shares made within 18 months of purchase in which a finder’s fee was paid and all redemptions of Class C shares within the first year are 1% and 0% thereafter. |
| 5 | The since inception index returns are from the Fund’s inception date. |
| 6 | The expense ratios of the Fund are set forth according to the prospectus for the Fund effective January 28, 2015, as supplemented and revised, and may differ from the expense ratios disclosed in the Financial Highlights tables in this report. See the Financial Highlights for more current expense ratios. Net Expense: Expenses reduced by the contractual fee waiver in effect through January 31, 2017. For the period of October 1, 2014 through August 31, 2015, the waiver was voluntary. Gross Expense: Does not reflect the effect of the fee waiver. Expense ratios reflect fees and expenses associated with the underlying funds. |
Growth of $10,000 For periods ended 9/30
This chart assumes an initial investment of $10,000 made on September 5, 2012 (inception date of the Fund), for Class A, Class C, and Class I shares including any applicable sales charges or fees. Performance assumes reinvestment of dividends and capital gain distributions.

The indexes are unmanaged and not available for direct investment; therefore, their performance does not reflect the expenses associated with active management of an actual portfolio.
For information regarding the indexes and certain investment terms, see the Key Investment Terms starting on page 4.
27
Table of Contents
Fund Summary | Ticker Symbols: Class A: VAAAX Class C: VAACX Class I: VAISX |
Portfolio Manager Commentary by Euclid Advisors LLC
| ¢ | The Fund is diversified and has an investment objective of capital appreciation. In pursuing this objective, the Fund maintains an emphasis on preservation of capital. |
| ¢ | For the fiscal year ended September 30, 2015, the Fund’s Class A shares at NAV returned -8.58%, Class C shares returned -9.23%, and Class I shares returned -8.36%. For the same period, the S&P 500® Index, a broad-based equity index, returned -0.61%. Dow Jones Global Moderate Portfolio Index, the Fund’s style-specific index appropriate for comparison, returned -1.83%. |
All performance figures assume reinvestment of distributions and exclude the effect of sales charges. Past performance is no guarantee of future results, and current performance may be higher or lower than the performance shown above.
How did the markets perform during the Fund’s fiscal year?
| ¢ | During the early months of the fiscal year, global equity markets were mostly calm, rising gradually despite a spike in volatility in October 2014, a quick sell-off and subsequent recovery, and a modest drawdown in January 2015. In the middle of May 2015, management of the Fund changed, as did the Fund’s investment strategy. While the central investment thesis – participation in rising equity markets with protection in higher risk markets – remains the same, the techniques used to achieve these goals changed. The new investment strategy combines relative strength analysis, used to identify the most attractive areas for investment in a variety of global securities markets, with absolute momentum analysis, which is used to identify periods when a more cautious approach to taking risk is required. |
| ¢ | Soon after the change was made, the new strategy was tested by two very different market environments. |
| ¢ | May, June, and July proved to be relatively calm in the U.S. equity markets, despite a brief spike in volatility near the end of June. Global markets began to show weakness in May, after certain |
non-U.S. equity indexes approached all-time highs in April, although volatility levels remained in line with historical averages. This global weakness seemed to have little impact on U.S. markets, and the longstanding bull market appeared intact. Stocks did begin to falter into August, although volatility and risk levels remained reasonable. |
| ¢ | As August came to a close, U.S. and global equity markets experienced massive volatility, as markets appeared to digest an array of global stresses all at once. A deterioration that began in the third week of August devolved into a complete meltdown on Monday, August 24, as the Dow Jones Industrial AverageSM dropped more than 1,000 points after the open, the largest intra-day drop in history. Concurrently, the CBOE Volatility Index® (VIX®) experienced its largest two-day percentage increase since the index was first published in 1990. The one-day damage in non-U.S. markets was less severe, but significant pain had already been felt overseas in the week prior. |
| ¢ | Volatility settled into an elevated regime over the rest of September, with the VIX® at levels roughly double what was seen in July and early August. After an extremely choppy September, the S&P 500® Index (price return) ended the quarter about 7% below where it started, and about 10% below the highs reached in mid-July. This puts the index down just over 1% over the past 12 months and down over 7% for 2015. In comparison, the MSCI All Country World Index (ex-US) was down nearly 12% over the past 12 months and down over 8% year to date. These troubling signs leave market participants to ask the question: Is this the end of one of the longest and strongest bull markets of all time, or just a (major) bump in the road? In our view, prediction is less reliable than preparation, and the portfolio is prepared to respond to both eventualities. |
What factors affected the Fund’s performance during its fiscal year?
| ¢ | The equity portion of the Fund was bullishly positioned to start the fiscal year before a large drawdown occurred in which the portfolio de-risked to one sector on the domestic side, and one region on the international side, as volatility levels escalated quickly. The market subsequently rebounded quicker than the downturn and hit all-time highs. |
Going to over 50% cash equivalents, and carrying it through to the middle of December, was the largest drag on the portfolio as the market continued to advance. The Fund avoided most of the drawdown in energy, which had deteriorated quickly over this time period, helping performance. Staying in emerging markets and real estate also helped performance. Heading into January the Fund was bullishly positioned before the market experienced another modest downturn and volatility levels became elevated; the portfolio then de-risked to 46% cash equivalents. The market subsequently rebounded in February, reaching all-time highs. Remaining invested in one or two sectors/regions during the course of February and failing to participate in the strong market rally led to the underperformance in the first part of the year. |
| ¢ | As the change in Fund management was made in May 2015, global markets remained calm. The Fund maintained exposure to risky assets until the last week of August, including global equities, real estate, and a long-dollar position. The Fund had exited an emerging market bond position in June, and a TIPS position in late July, shifting to safer fixed income assets. All positions as the end of the summer approached were in line with the calm markets up to that point, and were chosen based on strong relative strength signals. Just before the end of August, in response to the quickly deteriorating conditions, the Fund began to aggressively trade out of equities and into cash as a defensive mechanism. By the end of August, more than one-third of the U.S. portion of the portfolio was in cash, and the non-U.S. portion of the portfolio had a nearly 85% cash position. By the first week of September, the U.S. portfolio’s cash position had increased to greater than 50%, while the non-U.S. portfolio maintained its large cash allocation. The Fund also exited real estate and added a gold position. |
| ¢ | Activity in the U.S. equity portfolio was not focused on any sectors in particular, as the market sell-off was broad-based and appeared to impact all parts of the equities universe. The Fund did maintain an existing overweight to consumer discretionary stocks throughout the selling activity, ending the period with a roughly 20% allocation to that sector. This allocation was based on the strength of |
For information regarding the indexes and certain investment terms, see the Key Investment Terms starting on page 4.
28
Table of Contents
| Multi-Asset Trend Fund (Continued) |
the sub-industries within that sector compared to the rest of the market, a theme which has been active for a number of months. |
| ¢ | The global equity portfolio, in the context of generally weaker global markets, had begun cutting risk exposure in late July. In short order the Fund exited positions in Asia (China, India, Japan, Hong Kong) and Europe (Spain, Switzerland, Germany). By the end of August, only Italy remained in the portfolio. |
| ¢ | As the quarter ended, both the S&P 500® Index and the MSCI All Country World Index (ex-U.S.) were still significantly below their 200-day average price levels, and the portfolio had a cash equivalents position in excess of 65%. The fixed income portion of the portfolio was highly defensive, limiting risk to U.S. Treasuries. In addition, the Fund had exposure to gold and the dollar. The defensive activities the Fund took in August and September led to outperformance, since the investment strategy was changed, of approximately 3.00% compared to the S&P 500® Index, and outperformance of approximately 1.00% compared to the Dow Jones Global Moderate Portfolio Index. |
The preceding information is the opinion of portfolio management. Any such opinions are subject to change at any time based upon market or other conditions and should not be relied upon as investment advice. Past performance is no guarantee of future results, and there is no guarantee that market forecasts will be realized.
There is no guarantee that the Fund will meet its objective.
Equity Securities: The market price of equity securities may be adversely affected by financial market, industry, or issuer-specific events. Focus on a particular style or on small or medium-sized companies may enhance that risk.
Industry/Sector Concentration: A fund that focuses its investments in a particular industry or sector will be more sensitive to conditions that affect that industry or sector than a non-concentrated fund.
Credit & Interest: Debt securities are subject to various risks, the most prominent of which are credit and interest rate risk. The issuer of a debt security may fail to make interest and/or principal payments.
Values of debt securities may rise or fall in response to changes in interest rates, and this risk may be enhanced with longer-term maturities.
High Yield-High Risk Fixed Income Securities: There is a greater level of credit risk and price volatility involved with high yield securities than investment grade securities.
Foreign & Emerging Markets: Investing internationally, especially in emerging markets, involves additional risks such as currency, political, accounting, economic, and market risk.
Exchange Traded Funds: The value of an ETF may be more volatile than the underlying portfolio of securities the ETF is designed to track. The costs of owning the ETF may exceed the cost of investing directly in the underlying securities.
Commodity-Linked: Commodity-linked instruments may experience a return different than the commodity they attempt to track and may also be exposed to counterparty risk.
Allocation: The fund’s exposure to different asset classes may not be optimal for market conditions at a given time. Asset allocation does not guarantee a profit or protect against a loss in declining markets.
Prospectus: For additional information on risks, please see the fund’s prospectus.
There is no relationship between Dorsey Wright and Virtus other than a license by Dorsey Wright to Virtus of certain Dorsey Wright trademarks and trade names, and the Dorsey Wright technical analysis (“Technical Analysis”). The Technical Analysis has been created and developed by Dorsey Wright without regard to and independently of Virtus, its business, its development of this product, and/or any prospective investor. The licensing of any Technical Analysis to Virtus is not an offer to purchase or sell, or a solicitation or an offer to buy any securities. A determination that any portion of an investor’s portfolio should be devoted to any product developed by Virtus is a determination made solely by the investment advisor serving the investor or the investor himself, not Dorsey Wright or Virtus.
| Asset Allocation | ||||||||
The following table presents asset allocations within certain sectors and as a percentage of total investments as of September 30, 2015.
|
| |||||||
Common Stocks | 19 | % | ||||||
Consumer Discretionary | 8 | % | ||||||
Consumer Staples | 3 | |||||||
Information Technology | 3 | |||||||
All other Common Stocks | 5 | |||||||
Exchange-Traded Funds | 44 | |||||||
Other (includes short-term investments) | 37 | |||||||
|
| |||||||
Total | 100 | % | ||||||
|
| |||||||
For information regarding the indexes and certain investment terms, see the Key Investment Terms starting on page 4.
29
Table of Contents
Multi-Asset Trend Fund (Continued)
| Average Annual Total Returns1 for periods ended 9/30/15 | ||||||||||||
| 1 year | Since Inception | Inception Date | ||||||||||
| Class A Shares at NAV2 | -8.58 | % | 2.52 | % | 3/15/11 | |||||||
| Class A Shares at POP3,4 | -13.84 | 1.19 | 3/15/11 | |||||||||
| Class C Shares at NAV2 and with CDSC4 | -9.23 | 1.78 | 3/15/11 | |||||||||
| Class I Shares at NAV | -8.36 | 2.77 | 3/15/11 | |||||||||
| S&P 500® Index | -0.61 | 11.64 | 5 | — | ||||||||
| Dow Jones Global Moderate Portfolio IndexSM | -1.83 | 5.78 | 5 | — | ||||||||
Fund Expense Ratios6: A Shares: Gross 1.79%, Net 1.75%; C Shares: Gross 2.52%, Net 2.50%; I Shares: Gross 1.54%, Net 1.50%.
All returns represent past performance which is no guarantee of future results. Current performance may be higher or lower than the performance shown. The investment return and principal value of an investment will fluctuate so that an investor’s shares, when redeemed, may be worth more or less than their original cost. The above table and graph below do not reflect the deduction of taxes that a shareholder would pay on fund distributions or the redemption of shares. Please visit Virtus.com for performance data current to the most recent month-end.
| 1 | Total returns are historical and include changes in share price and the reinvestment of both dividends and capital gains distributions. |
| 2 | “NAV” (Net Asset Value) total returns do not include the effect of any sales charge. |
| 3 | “POP” (Public Offering Price) total returns include the effect of the maximum front-end 5.75% sales charge. |
| 4 | “CDSC” (Contingent Deferred Sales Charge) is applied to redemptions of certain classes of shares that do not have a sales charge applied at the time of purchase. CDSC charges for certain redemptions of Class A shares made within 18 months of purchase in which a finder’s fee was paid and all redemptions of Class C shares within the first year are 1% and 0% thereafter. |
| 5 | The index returns are from the Fund’s inception date. |
| 6 | The expense ratios of the Fund are set forth according to the prospectus for the Fund effective January 28, 2015, as supplemented and revised, and may differ from the expense ratios disclosed in the Financial Highlights tables in this report. See the Financial Highlights for more current expense ratios. Net Expense: Expenses reduced by contractual fee waiver through January 31, 2017. For the period of October 1, 2014 through August 31, 2015, the waiver was voluntary. Gross Expense: Does not reflect the effect of the fee waiver. Expense ratios reflect fees and expenses associated with the underlying funds. Class C share ratio reflects distributor’s contractual waiver for 12b-1 fees. |
Growth of $10,000 For periods ended 9/30
This chart assumes an initial investment of $10,000 made on March 15, 2011 (inception date of the Fund), for Class A, Class C, and Class I shares including any applicable sales charges or fees. Performance assumes reinvestment of dividends and capital gain distributions.
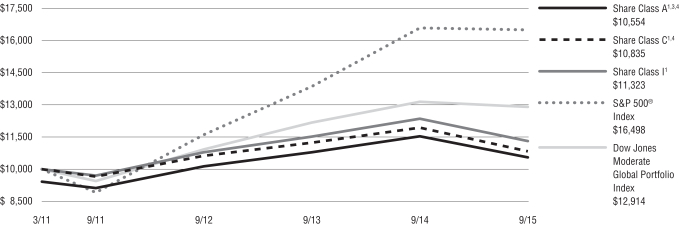
The indexes are unmanaged and not available for direct investment; therefore, their performance does not reflect the expenses associated with active management of an actual portfolio.
For information regarding the indexes and certain investment terms, see the Key Investment Terms starting on page 4.
30
Table of Contents
Fund Summary | Ticker Symbols: Class A: PWBAX Class C: PWBCX Class I: VARIX |
Portfolio Manager Commentary by Euclid Advisors LLC
| ¢ | The Fund is diversified and has an investment objective of long-term capital appreciation. |
| ¢ | For the fiscal year ended September 30, 2015, the Fund’s Class A shares at NAV returned -6.19%, Class C shares returned -6.86%, and Class I shares returned -5.90%. For the same period, the S&P 500® Index, which is both the broad-based equity index, and the Fund’s style-specific benchmark returned -0.61%. |
All performance figures assume reinvestment of distributions and exclude the effect of sales charges. Past performance is no guarantee of future results, and current performance may be higher or lower than the performance shown above.
How did the markets perform during the Fund’s fiscal year?
| ¢ | During the early months of the fiscal year, equity markets were mostly calm, rising gradually despite a spike in volatility in October 2014, a quick sell-off and subsequent recovery, and a modest drawdown in January 2015. In the middle of May 2015, management of the Fund changed, as did the Fund’s investment strategy. While the central investment thesis – participation in rising equity markets with protection in higher risk markets – remained the same, the techniques used to achieve these goals changed. The new investment strategy combines relative strength analysis, used to identify the most attractive areas for investment in the U.S. equity markets, with absolute momentum analysis, which is used to identify periods when a more cautious approach to taking equity risk is required. |
| ¢ | Soon after the manager change was made, the new strategy was tested by two very different market environments. The months of May, June, and July were relatively calm for U.S. equity markets, despite a brief spike in volatility in late June. Global concerns seemed to have little impact on U.S. markets, and the longstanding bull market appeared intact. Stocks began to fall into August, although volatility and risk levels remained reasonable. |
| ¢ | As August came to a close, U.S. equity markets experienced massive volatility, as markets appeared to digest an array of global stresses all at once. A deterioration that began in the third week of August devolved into a complete meltdown on Monday, August 24, when the Dow Jones Industrial AverageSM dropped more than 1,000 points after the market open, the largest intra-day drop in history. Concurrently, the CBOE Volatility Index® (VIX®) experienced its largest two-day percentage increase since the index was first published in 1990. |
| ¢ | Volatility settled into an elevated regime over the rest of September, with the VIX® at levels roughly double what was seen in July and early August. After an extremely choppy September, the S&P 500® Index (price return) ended the quarter about 7% below where it started, and about 10% below the highs reached in mid-July. This put the index down just over 1% over the 12 months, and down over 7% for 2015, leaving market participants to ask the question: Is this the end of one of the longest and strongest bull markets of all time, or just a (major) bump in the road? In our view, prediction is less reliable than preparation, and the portfolio is prepared to respond to both eventualities. |
What factors affected the Fund’s performance during its fiscal year?
| ¢ | The Fund was bullishly positioned (with seven sectors on) to start the fiscal year before a large drawdown occurred in the markets. The portfolio de-risked to one sector (and 75% in cash equivalents) as volatility levels remained escalated. Going to cash, and then carrying it through to the middle of December was the largest drag on the portfolio as the market continued to advance. The Fund avoided most of the drawdown in energy which had deteriorated quickly over this time period, helping performance. Heading into January, the Fund was bullishly positioned (with five sectors on) before the market experienced another modest downturn and volatility levels became elevated; the portfolio de-risked to one sector (and 75% in cash equivalents). The market subsequently rebounded in February, reaching all-time highs. Remaining invested in one or two sectors during February and failing to participate in the strong market rally led to the underperformance in the first part of the year. |
| ¢ | As the change in investment strategy was made in May 2015, global markets remained calm. The Fund maintained full exposure to equities until the last week of August, in line with the calm markets up to that point. During June and July, the Fund removed allocations to the utilities, materials, and industrials sectors, reallocating capital to sectors with positive trends. Just before the end of August, in response to the quickly deteriorating conditions, the Fund began to aggressively trade out of equities and into cash equivalents as a defensive mechanism. |
| ¢ | Over the course of just a few days, the Fund exited the technology, health care, consumer staples, and financials sectors as each began to show signs of a negative price trend. By the end of August, only the consumer discretionary sector remained, leaving the portfolio with an 80% cash position. |
| ¢ | The defensive activities the Fund took in August and September led to outperformance, compared to the S&P 500® Index, of 3.00% since the changes to the investment strategy were made. |
The preceding information is the opinion of portfolio management. Any such opinions are subject to change at any time based upon market or other conditions and should not be relied upon as investment advice. Past performance is no guarantee of future results, and there is no guarantee that market forecasts will be realized.
There is no guarantee that the Fund will meet its objective.
Equity Securities: The market price of equity securities may be adversely affected by financial market, industry, or issuer-specific events. Focus on a particular style or on small or medium-sized companies may enhance that risk.
Industry/Sector Concentration: A fund that focuses its investments in a particular industry or sector will be more sensitive to conditions that affect that industry or sector than a non-concentrated fund.
Allocation: The fund’s exposure to different asset classes may not be optimal for market conditions at a given time. Asset allocation does not guarantee a profit or protect against a loss in declining markets.
Prospectus: For additional information on risks, please see the fund’s prospectus
For information regarding the indexes and certain investment terms, see the Key Investment Terms starting on page 4.
31
Table of Contents
| Sector Trend Fund (Continued) |
There is no relationship between Dorsey Wright and Virtus other than a license by Dorsey Wright to Virtus of certain Dorsey Wright trademarks and trade names, and the Dorsey Wright technical analysis (“Technical Analysis”). The Technical Analysis has been created and developed by Dorsey Wright without regard to and independently of Virtus, its business, its development of this product, and/or any prospective investor. The licensing of any Technical Analysis to Virtus is not an offer to purchase or sell, or a solicitation or an offer to buy any securities. A determination that any portion of an investor’s portfolio should be devoted to any product developed by Virtus is a determination made solely by the investment advisor serving the investor or the investor himself, not Dorsey Wright or Virtus.
| Asset Allocation | ||||
The following table presents asset allocations within certain sectors and as a percentage of total investments as of September 30, 2015.
|
| |||
Consumer Discretionary | 21 | % | ||
Other (includes short-term investments) | 79 | |||
|
| |||
Total | 100 | % | ||
|
| |||
For information regarding the indexes and certain investment terms, see the Key Investment Terms starting on page 4.
32
Table of Contents
Sector Trend Fund (Continued)
| Average Annual Total Returns1 for periods ended 9/30/15 | ||||||||||||||||||||
| 1 year | 5 years | 10 years | Since Inception | Inception Date | ||||||||||||||||
| Class A Shares at NAV2 | -6.19 | % | 10.53 | % | 5.92 | % | — | — | ||||||||||||
| Class A Shares at POP3,4 | -11.59 | 9.23 | 5.29 | — | — | |||||||||||||||
| Class C Shares at NAV2 and with CDSC4 | -6.86 | 9.73 | 5.15 | — | — | |||||||||||||||
| Class I Shares at NAV | -5.90 | 10.82 | — | 11.12 | % | 10/1/09 | ||||||||||||||
| S&P 500® Index | -0.61 | 13.34 | 6.80 | 13.29 | 5 | — | ||||||||||||||
Fund Expense Ratios6: A Shares 0.98%; C Shares 1.73%; I Shares 0.73%.
All returns represent past performance which is no guarantee of future results. Current performance may be higher or lower than the performance shown. The investment return and principal value of an investment will fluctuate so that an investor’s shares, when redeemed, may be worth more or less than their original cost. The above table and graph below do not reflect the deduction of taxes that a shareholder would pay on fund distributions or the redemption of shares. Please visit Virtus.com for performance data current to the most recent month-end.
| 1 | Total returns are historical and include changes in share price and the reinvestment of both dividends and capital gains distributions. |
| 2 | “NAV” (Net Asset Value) total returns do not include the effect of any sales charge. |
| 3 | “POP” (Public Offering Price) total returns include the effect of the maximum front-end 5.75% sales charge. |
| 4 | “CDSC” (Contingent Deferred Sales Charge) is applied to redemptions of certain classes of shares that do not have a sales charge applied at the time of purchase. CDSC charges for certain redemptions of Class A shares made within 18 months of purchase in which a finder’s fee was paid and all redemptions of Class C shares within the first year are 1% and 0% thereafter. |
| 5 | The since inception index returns are from the inception date of Class I shares. |
| 6 | The expense ratios of the Fund are set forth according to the prospectus for the Fund effective January 28, 2015, as supplemented and revised, and may differ from the expense ratios disclosed in the Financial Highlights tables in this report. See the Financial Highlights for more current expense ratios. Expense ratios reflect fees and expenses associated with the underlying funds. |
Growth of $10,000 For periods ended 9/30
This chart assumes an initial investment of $10,000 made on September 30, 2005, for Class A and Class C shares including any applicable sales charges or fees. Performance assumes reinvestment of dividends and capital gain distributions.
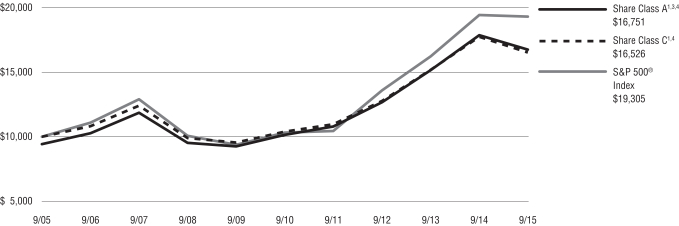
The indexes are unmanaged and not available for direct investment; therefore, their performance does not reflect the expenses associated with active management of an actual portfolio.
For information regarding the indexes and certain investment terms, see the Key Investment Terms starting on page 4.
33
Table of Contents
VIRTUS ALTERNATIVES DIVERSIFIER FUND
SCHEDULE OF INVESTMENTS
SEPTEMBER 30, 2015
($ reported in thousands)
| SHARES | VALUE | |||||||
| AFFILIATED MUTUAL FUNDS(3)—61.2% | ||||||||
| Equity Funds—46.3% | ||||||||
Virtus Global Infrastructure Fund | 1,125,028 | $ | 15,334 | |||||
Virtus Global Real Estate Securities Fund | 286,002 | 7,542 | ||||||
Virtus International Real Estate Securities Fund | 1,160,713 | 7,707 | ||||||
Virtus Real Estate Securities Fund | 187,107 | 7,189 | ||||||
|
| |||||||
| 37,772 | ||||||||
|
| |||||||
| Fixed Income Funds—14.9% | ||||||||
Virtus Senior Floating Rate Fund | 1,300,941 | 12,164 | ||||||
| TOTAL AFFILIATED MUTUAL FUNDS (Identified Cost $38,363) | 49,936 | |||||||
| EXCHANGE-TRADED FUNDS(3)—38.0% | ||||||||
Global X Uranium Fund | 30,100 | 209 | ||||||
iShares S&P North American Natural Resources Sector Index Fund | 218,500 | 6,345 | ||||||
PowerShares DB Commodity Index Tracking Fund(2) | 572,400 | 8,672 | ||||||
PowerShares DB G10 Currency Harvest Fund(2) | 439,450 | 9,756 | ||||||
WisdomTree Managed Futures Strategy Fund(2) | 146,000 | 6,050 | ||||||
| TOTAL EXCHANGE-TRADED FUNDS (Identified Cost $34,989) | 31,032 | |||||||
| TOTAL LONG TERM INVESTMENTS—99.2% | ||||||||
| (Identified Cost $73,352) | 80,968 | |||||||
| SHARES | VALUE | |||||||
| SHORT-TERM INVESTMENTS—0.4% | ||||||||
| Money Market Mutual Fund—0.4% | ||||||||
Fidelity Money Market Portfolio – Institutional Shares (seven-day effective yield 0.170%) | 296,368 | $ | 296 | |||||
| TOTAL SHORT-TERM INVESTMENTS (Identified Cost $296) | 296 | |||||||
| TOTAL INVESTMENTS—99.6% (Identified Cost $73,648) | 81,264 | (1) | ||||||
Other assets and liabilities, net—0.4% |
| 293 | ||||||
|
| |||||||
| NET ASSETS—100.0% | $ | 81,557 | ||||||
|
| |||||||
Footnote Legend:
| (1) | Federal Income Tax Information: For tax information at September 30, 2015, see Note 11 Federal Income Tax Information in the Notes to Financial Statements. |
| (2) | Non-income producing. |
| (3) | All of these funds are public funds and the prospectus and annual reports of each are publicly available. |
The following table provides a summary of inputs used to value the Fund’s investments as of September 30, 2015 (See Security Valuation Note 2A in the Notes to Financial Statements):
| Total Value at, September 30, 2015 | Level 1 Quoted Prices | |||||||
Equity Securities: |
| |||||||
Affiliated Mutual Funds | $ | 49,936 | $ | 49,936 | ||||
Exchange-Traded Funds | 31,032 | 31,032 | ||||||
Short-Term Investments | 296 | 296 | ||||||
|
|
|
| |||||
Total Investments | $ | 81,264 | $ | 81,264 | ||||
|
|
|
| |||||
There are no Level 2 (significant observable inputs) or Level 3 (significant unobservable inputs) priced securities.
There were no transfers between Level 1 and Level 2 related to securities held at September 30, 2015.
See Notes to Financial Statements
34
Table of Contents
VIRTUS DISCIPLINED EQUITY STYLE FUND
SCHEDULE OF INVESTMENTS
SEPTEMBER 30, 2015
($ reported in thousands)
| SHARES | VALUE | |||||||
| EXCHANGE-TRADED FUNDS(2)—99.5% | ||||||||
iShares Russell 1000® Value Index Fund | 15,500 | $ | 1,446 | |||||
iShares Russell 2000® Value Index Fund | 15,880 | 1,431 | ||||||
iShares Russell Midcap® Value Index Fund | 21,530 | 1,444 | ||||||
| TOTAL EXCHANGE-TRADED FUNDS (Identified Cost $4,300) | 4,321 | |||||||
| TOTAL LONG TERM INVESTMENTS—99.5% | ||||||||
| (Identified Cost $4,300) | 4,321 | |||||||
| SHARES | VALUE | |||||||
| SHORT-TERM INVESTMENTS—0.9% | ||||||||
| Money Market Mutual Fund—0.9% | ||||||||
Fidelity Money Market Portfolio – Institutional Shares (seven-day effective yield 0.170%) | 38,900 | $ | 39 | |||||
| TOTAL SHORT-TERM INVESTMENTS (Identified Cost $39) | 39 | |||||||
| TOTAL INVESTMENTS—100.4% (Identified Cost $4,339) | 4,360 | (1) | ||||||
Other assets and liabilities, net—(0.4)% |
| (19 | ) | |||||
|
| |||||||
| NET ASSETS—100.0% | $ | 4,341 | ||||||
|
| |||||||
Footnote Legend:
| (1) | Federal Income Tax Information: For tax information at September 30, 2015, see Note 11 Federal Income Tax Information in the Notes to Financial Statements. |
| (2) | All of these funds are public funds and the prospectus and annual reports of each are publicly available. |
The following table provides a summary of inputs used to value the Fund’s investments as of September 30, 2015 (See Security Valuation Note 2A in the Notes to Financial Statements):
| Total Value at September 30, 2015 | Level 1 Quoted Prices | |||||||
Equity Securities: | ||||||||
Exchange-Traded Funds | $ | 4,321 | $ | 4,321 | ||||
Short-Term Invest | 39 | 39 | ||||||
|
|
|
| |||||
Total Investments | $ | 4,360 | $ | 4,360 | ||||
|
|
|
| |||||
There are no Level 2 (significant observable inputs) or Level 3 (significant unobservable inputs) priced securities.
There were no transfers between Level 1 and Level 2 related to securities held at September 30, 2015.
See Notes to Financial Statements
35
Table of Contents
VIRTUS DISCIPLINED SELECT BOND FUND
SCHEDULE OF INVESTMENTS
SEPTEMBER 30, 2015
($ reported in thousands)
| SHARES | VALUE | |||||||
| EXCHANGE-TRADED FUNDS(2)—98.3% | ||||||||
iShares 1-3 Year Treasury Bond Fund | 570 | $ | 49 | |||||
iShares 20+ Year Treasury Bond Fund | 400 | 49 | ||||||
iShares Barclays 7-10 Year Treasury Bond Fund | 450 | 49 | ||||||
iShares iBoxx $ High Yield Corporate Bond Fund | 3,710 | 309 | ||||||
iShares iBoxx $ Investment Grade Corporate Bond Fund | 7,340 | 852 | ||||||
iShares TIPS Bond Fund | 1,320 | 146 | ||||||
| TOTAL EXCHANGE-TRADED FUNDS (Identified Cost $1,460) | 1,454 | |||||||
| TOTAL LONG TERM INVESTMENTS—98.3% | ||||||||
| (Identified Cost $1,460) | 1,454 | |||||||
| SHORT-TERM INVESTMENTS—1.8% | ||||||||
| Money Market Mutual Fund—1.8% | ||||||||
Fidelity Money Market Portfolio – Institutional Shares (seven-day effective yield 0.170%) | 26,474 | 26 | ||||||
| TOTAL SHORT-TERM INVESTMENTS (Identified Cost $26) | 26 | |||||||
| TOTAL INVESTMENTS—100.1% (Identified Cost $1,486) | 1,480 | (1) | ||||||
Other assets and liabilities, net—(0.1)% |
| (1 | ) | |||||
|
| |||||||
| NET ASSETS—100.0% | $ | 1,479 | ||||||
|
| |||||||
Footnote Legend:
| (1) | Federal Income Tax Information: For tax information at September 30, 2015, see Note 11 Federal Income Tax Information in the Notes to Financial Statements. |
| (2) | All of these funds are public funds and the prospectus and annual reports of each are publicly available. |
The following table provides a summary of inputs used to value the Fund’s investments as of September 30, 2015 (See Security Valuation Note 2A in the Notes to Financial Statements):
| Total Value at September 30, 2015 | Level 1 Quoted Prices | |||||||
Equity Securities: | ||||||||
Exchange-Traded Funds | $ | 1,454 | $ | 1,454 | ||||
Short-Term Invest | 26 | 26 | ||||||
|
|
|
| |||||
Total Investments | $ | 1,480 | $ | 1,480 | ||||
|
|
|
| |||||
There are no Level 2 (significant observable inputs) or Level 3 (significant unobservable inputs) priced securities.
There were no transfers between Level 1 and Level 2 related to securities held at September 30, 2015.
See Notes to Financial Statements
36
Table of Contents
VIRTUS DISCIPLINED SELECT COUNTRY FUND
SCHEDULE OF INVESTMENTS
SEPTEMBER 30, 2015
($ reported in thousands)
| SHARES | VALUE | |||||||
| EXCHANGE-TRADED FUNDS(2)—100.6% | ||||||||
iShares MSCI France Index Fund | 12,970 | $ | 312 | |||||
iShares MSCI Japan Index Fund | 27,320 | 312 | ||||||
iShares MSCI Sweden Index Fund | 10,670 | 310 | ||||||
iShares MSCI Switzerland Index Fund Capped | 10,250 | 314 | ||||||
| TOTAL EXCHANGE-TRADED FUNDS (Identified Cost $1,293) | 1,248 | |||||||
| TOTAL LONG TERM INVESTMENTS—100.6% | ||||||||
| (Identified Cost $1,293) | 1,248 | |||||||
| SHORT-TERM INVESTMENTS—0.9% | ||||||||
| Money Market Mutual Fund—0.9% | ||||||||
Fidelity Money Market Portfolio – Institutional Shares (seven-day effective yield 0.170%) | 10,949 | 11 | �� | |||||
| TOTAL SHORT-TERM INVESTMENTS (Identified Cost $11) | 11 | |||||||
| TOTAL INVESTMENTS—101.5% (Identified Cost $1,304) | 1,259 | (1) | ||||||
Other assets and liabilities, net—(1.5)% |
| (19 | ) | |||||
|
| |||||||
| NET ASSETS—100.0% | $ | 1,240 | ||||||
|
| |||||||
Footnote Legend:
| (1) | Federal Income Tax Information: For tax information at September 30, 2015, see Note 11 Federal Income Tax Information in the Notes to Financial Statements. |
| (2) | All of these funds are public funds and the prospectus and annual reports of each are publicly available. |
The following table provides a summary of inputs used to value the Fund’s investments as of
September 30, 2015 (See Security Valuation Note 2A in the Notes to Financial Statements):
| Total Value at September 30, 2015 | Level 1 Quoted Prices | |||||||
Equity Securities: | ||||||||
Exchange-Traded Funds | $ | 1,248 | $ | 1,248 | ||||
Short-Term Invest | 11 | 11 | ||||||
|
|
|
| |||||
Total Investments | $ | 1,259 | $ | 1,259 | ||||
|
|
|
| |||||
There are no Level 2 (significant observable inputs) or Level 3 (significant unobservable inputs) priced securities.
There were no transfers between Level 1 and Level 2 related to securities held at September 30, 2015.
See Notes to Financial Statements
37
Table of Contents
SCHEDULE OF INVESTMENTS AND SECURITIES SOLD SHORT
SEPTEMBER 30, 2015
($ reported in thousands)
| SHARES | VALUE | |||||||
| COMMON STOCKS—60.0% | ||||||||
| Consumer Discretionary—27.4% | ||||||||
Advance Auto Parts, Inc. | 12,228 | $ | 2,318 | |||||
Amazon.com, Inc.(2)(4) | 27,369 | 14,010 | ||||||
AutoNation, Inc.(2) | 31,592 | 1,838 | ||||||
AutoZone, Inc.(2) | 12,370 | 8,954 | ||||||
Cablevision Systems Corp. Class A | 21,390 | 695 | ||||||
CarMax, Inc.(2)(4) | 90,010 | 5,339 | ||||||
Comcast Corp. Class A(4) | 258,577 | 14,708 | ||||||
Expedia, Inc. | 7,089 | 834 | ||||||
Goodyear Tire & Rubber Co. (The)(4) | 681,770 | 19,996 | ||||||
Home Depot, Inc. | 152,950 | 17,664 | ||||||
Lowe’s Cos., Inc. | 114,320 | 7,879 | ||||||
Netflix, Inc.(2) | 29,472 | 3,043 | ||||||
Newell Rubbermaid, Inc.(4) | 609,950 | 24,221 | ||||||
NIKE, Inc. Class B(4) | 231,220 | 28,433 | ||||||
O’Reilly Automotive, Inc.(2) | 38,835 | 9,709 | ||||||
Priceline Group, Inc. (The)(2) | 3,731 | 4,615 | ||||||
Time Warner Cable, Inc. | 25,912 | 4,648 | ||||||
TripAdvisor, Inc.(2) | 8,142 | 513 | ||||||
|
| |||||||
| 169,417 | ||||||||
|
| |||||||
| Consumer Staples—7.7% | ||||||||
Brown-Forman Corp. Class B | 97,330 | 9,431 | ||||||
Constellation Brands, Inc. Class A(4) | 116,860 | 14,632 | ||||||
CVS Health Corp.(4) | 146,550 | 14,139 | ||||||
Walgreens Boots Alliance, Inc. | 110,480 | 9,181 | ||||||
|
| |||||||
| 47,383 | ||||||||
|
| |||||||
| Health Care—7.4% | ||||||||
Aetna, Inc. | 32,415 | 3,546 | ||||||
Anthem, Inc. | 27,165 | 3,803 | ||||||
Cigna Corp. | 23,325 | 3,149 | ||||||
HCA Holdings, Inc.(2)(4) | 169,850 | 13,140 | ||||||
Humana, Inc. | 14,780 | 2,646 | ||||||
Tenet Healthcare Corp.(2) | 67,325 | 2,486 | ||||||
UnitedHealth Group, Inc. | 93,770 | 10,878 | ||||||
Universal Health Services, Inc. Class B | 49,790 | 6,214 | ||||||
|
| |||||||
| 45,862 | ||||||||
|
| |||||||
| Industrials—3.5% | ||||||||
Allegion plc | 157,895 | 9,104 | ||||||
Masco Corp. | 499,660 | 12,582 | ||||||
|
| |||||||
| 21,686 | ||||||||
|
| |||||||
| Information Technology—8.2% | ||||||||
Alliance Data Systems Corp.(2) | 4,775 | 1,237 | ||||||
Automatic Data Processing, Inc. | 32,040 | 2,575 | ||||||
Computer Sciences Corp. | 10,172 | 624 | ||||||
Electronic Arts, Inc.(2)(4) | 368,780 | 24,985 | ||||||
Fidelity National Information Services, Inc. | 17,520 | 1,175 | ||||||
Fiserv, Inc.(2) | 15,940 | 1,380 | ||||||
MasterCard, Inc. Class A | 65,242 | 5,880 | ||||||
Paychex, Inc. | 21,420 | 1,020 | ||||||
PayPal Holdings, Inc.(2) | 33,774 | 1,048 | ||||||
Total System Services, Inc. | 12,625 | 573 | ||||||
| SHARES | VALUE | |||||||
| Information Technology—continued | ||||||||
Visa, Inc. Class A | 127,830 | $ | 8,905 | |||||
Western Union Co. (The) | 39,740 | 730 | ||||||
Xerox Corp. | 78,490 | 764 | ||||||
|
| |||||||
| 50,896 | ||||||||
|
| |||||||
| Materials—3.7% | ||||||||
Martin Marietta Materials, Inc. | 66,374 | 10,086 | ||||||
Vulcan Materials Co. | 143,343 | 12,786 | ||||||
|
| |||||||
| 22,872 | ||||||||
|
| |||||||
| Utilities—2.1% | ||||||||
AGL Resources, Inc.(4) | 212,660 | 12,981 | ||||||
|
| |||||||
| 12,981 | ||||||||
| TOTAL COMMON STOCKS (Identified Cost $366,945) | 371,097 | |||||||
| TOTAL LONG TERM INVESTMENTS—60.0% | ||||||||
| (Identified Cost $366,945) | 371,097 | |||||||
| SHORT-TERM INVESTMENTS—38.7% | ||||||||
| Money Market Mutual Funds—38.7% | ||||||||
Fidelity Money Market Portfolio – Institutional Shares (seven-day effective yield 0.170%) | 71,793,883 | 71,794 | ||||||
Goldman Sachs Financial Square Funds – Money Market Fund – Institutional Shares (seven-day effective yield 0.090%) | 131,622,118 | 131,622 | ||||||
JPMorgan U.S. Government Money Market Fund (seven-day effective yield 0.040%) | 35,896,941 | 35,897 | ||||||
| TOTAL SHORT-TERM INVESTMENTS (Identified Cost $239,313) | 239,313 | |||||||
| TOTAL INVESTMENTS, BEFORE SECURITIES SOLD SHORT—98.7% | ||||||||
| (Identified Cost $606,258) | 610,410 | (1) | ||||||
| SECURITIES SOLD SHORT—(24.4)% | ||||||||
| EXCHANGE-TRADED FUNDS SOLD SHORT—(24.4)% | ||||||||
S & P 500® ETF Trust SPDR Fund(3) | 785,199 | (150,468 | ) | |||||
| TOTAL SECURITIES SOLD SHORT—(24.4)% | ||||||||
| (Proceeds ($155,502)) | (150,468 | ) | ||||||
| TOTAL INVESTMENTS, NET OF SECURITIES SOLD SHORT—74.3% | ||||||||
| (Identified Cost $450,756) | 459,942 | (1) | ||||||
Other assets and liabilities, net—25.7% |
| 157,990 | ||||||
|
| |||||||
| NET ASSETS—100.0% | $ | 617,932 | ||||||
|
| |||||||
Abbreviations:
| ETF | Exchange-Traded Fund |
| SPDR | S&P Depositary Receipt |
Footnote Legend:
| (1) | Federal Income Tax Information: For tax information at September 30, 2015, see Note 11 Federal Income Tax Information in the Notes to Financial Statements. |
| (2) | Non-income producing. |
| (3) | This is a public fund and the prospectus and annual report are publicly available. |
| (4) | All or a portion segregated as collateral for securities sold short. |
The following table provides a summary of inputs used to value the Fund’s investments as of September 30, 2015 (See Security Valuation Note 2A in the Notes to Financial Statements):
| Total Value at September 30, 2015 | Level 1 Quoted Prices | |||||||
Equity Securities: | ||||||||
Common stocks | $ | 371,097 | $ | 371,097 | ||||
Short-Term Investments | 239,313 | 239,313 | ||||||
|
|
|
| |||||
Total Investments Before Securities Sold Short | $ | 610,410 | $ | 610,410 | ||||
|
|
|
| |||||
Liabilities: | ||||||||
Exchange-Traded Funds Sold Short | (150,468 | ) | (150,468 | ) | ||||
|
|
|
| |||||
Total Investments Net of Securities Sold Short | 459,942 |
|
459,942 |
| ||||
|
|
|
| |||||
There are no Level 2 (significant observable inputs) or Level 3 (significant unobservable inputs) priced securities.
There were no transfers between Level 1 and Level 2 related to securities held at September 30, 2015.
Security abbreviation definitions are located under the Key Investment Terms starting on page 4.
See Notes to Financial Statements
38
Table of Contents
SCHEDULE OF INVESTMENTS
SEPTEMBER 30, 2015
($ reported in thousands)
| SHARES | VALUE | |||||||
| COMMON STOCKS—48.5% | ||||||||
| Consumer Discretionary—21.3% | ||||||||
Advance Auto Parts, Inc. | 28,989 | $ | 5,494 | |||||
Amazon.com, Inc.(2) | 35,715 | 18,282 | ||||||
AutoNation, Inc.(2) | 39,650 | 2,307 | ||||||
AutoZone, Inc.(2) | 14,910 | 10,792 | ||||||
Best Buy Co., Inc. | 603,999 | 22,420 | ||||||
Cablevision Systems Corp. Class A | 26,940 | 875 | ||||||
CarMax, Inc.(2) | 121,030 | 7,179 | ||||||
Chipotle Mexican Grill, Inc.(2) | 3,690 | 2,658 | ||||||
Comcast Corp. Class A | 317,665 | 18,069 | ||||||
Darden Restaurants, Inc. | 16,470 | 1,129 | ||||||
Expedia, Inc. | 10,540 | 1,240 | ||||||
GameStop Corp. Class A | 218,611 | 9,009 | ||||||
Gap, Inc. (The) | 94,825 | 2,702 | ||||||
Goodyear Tire & Rubber Co. (The) | 993,350 | 29,135 | ||||||
H&R Block, Inc. | 902,407 | 32,667 | ||||||
Home Depot, Inc. | 177,650 | 20,517 | ||||||
Horton (D.R.), Inc. | 345,010 | 10,129 | ||||||
L Brands, Inc. | 85,475 | 7,704 | ||||||
Leggett & Platt, Inc. | 236,605 | 9,760 | ||||||
Lennar Corp. Class A | 204,740 | 9,854 | ||||||
Lowe’s Cos., Inc. | 145,553 | 10,032 | ||||||
McDonald’s Corp. | 112,840 | 11,118 | ||||||
Mohawk Industries, Inc.(2) | 100,325 | 18,238 | ||||||
Netflix, Inc.(2) | 31,610 | 3,264 | ||||||
Newell Rubbermaid, Inc. | 732,020 | 29,069 | ||||||
NIKE, Inc. Class B | 287,070 | 35,301 | ||||||
O’Reilly Automotive, Inc.(2) | 45,050 | 11,262 | ||||||
Priceline Group, Inc. (The)(2) | 5,590 | 6,914 | ||||||
PulteGroup, Inc. | 365,870 | 6,904 | ||||||
Ross Stores, Inc. | 121,180 | 5,874 | ||||||
Starbucks Corp. | 180,050 | 10,234 | ||||||
Time Warner Cable, Inc. | 31,445 | 5,640 | ||||||
TJX Cos., Inc. | 189,590 | 13,541 | ||||||
TripAdvisor, Inc.(2) | 14,325 | 903 | ||||||
Urban Outfitters, Inc.(2) | 43,927 | 1,291 | ||||||
Yum! Brands, Inc. | 53,810 | 4,302 | ||||||
|
| |||||||
| 395,809 | ||||||||
|
| |||||||
| Consumer Staples—8.1% | ||||||||
Altria Group, Inc. | 232,577 | 12,652 | ||||||
Brown-Forman Corp. Class B | 129,730 | 12,571 | ||||||
Campbell Soup Co. | 21,705 | 1,100 | ||||||
ConAgra Foods, Inc. | 49,477 | 2,004 | ||||||
Constellation Brands, Inc. Class A | 144,657 | 18,112 | ||||||
CVS Health Corp. | 183,660 | 17,720 | ||||||
General Mills, Inc. | 69,506 | 3,901 | ||||||
Hershey Co. (The) | 16,107 | 1,480 | ||||||
Hormel Foods Corp. | 16,916 | 1,071 | ||||||
J.M. Smucker Co. (The) | 10,684 | 1,219 | ||||||
Kellogg Co. | 30,639 | 2,039 | ||||||
Keurig Green Mountain, Inc. | 11,639 | 607 | ||||||
Kraft Heinz Co.(The) | 69,171 | 4,882 | ||||||
McCormick & Co., Inc. | 15,798 | 1,298 | ||||||
Mead Johnson Nutrition Co. | 23,754 | 1,672 | ||||||
| SHARES | VALUE | |||||||
| Consumer Staples—continued | ||||||||
Molson Coors Brewing Co. Class B | 354,635 | $ | 29,442 | |||||
Mondelez International, Inc. Class A | 189,438 | 7,932 | ||||||
Philip Morris International, Inc. | 182,953 | 14,514 | ||||||
Reynolds American, Inc. | 97,742 | 4,327 | ||||||
Tyson Foods, Inc. Class A | 34,453 | 1,485 | ||||||
Walgreens Boots Alliance, Inc. | 140,375 | 11,665 | ||||||
|
| |||||||
| 151,693 | ||||||||
|
| |||||||
| Energy—1.6% | ||||||||
Marathon Petroleum Corp. | 145,186 | 6,727 | ||||||
Phillips 66 | 152,918 | 11,750 | ||||||
Tesoro Corp. | 29,708 | 2,889 | ||||||
Valero Energy Corp. | 125,575 | 7,547 | ||||||
|
| |||||||
| 28,913 | ||||||||
|
| |||||||
| Health Care—3.0% | ||||||||
Aetna, Inc. | 37,880 | 4,145 | ||||||
Anthem, Inc. | 34,830 | 4,876 | ||||||
Cigna Corp. | 29,110 | 3,930 | ||||||
HCA Holdings, Inc.(2) | 214,200 | 16,571 | ||||||
Humana, Inc. | 18,380 | 3,290 | ||||||
Tenet Healthcare Corp.(2) | 73,865 | 2,727 | ||||||
UnitedHealth Group, Inc. | 111,040 | 12,882 | ||||||
Universal Health Services, Inc. Class B | 63,395 | 7,912 | ||||||
|
| |||||||
| 56,333 | ||||||||
|
| |||||||
| Industrials—4.8% | ||||||||
Allegion plc | 195,430 | 11,269 | ||||||
Cintas Corp. | 370,680 | 31,786 | ||||||
Dun & Bradstreet Corp. | 38,610 | 4,054 | ||||||
Equifax, Inc. | 112,260 | 10,909 | ||||||
Masco Corp. | 644,600 | 16,231 | ||||||
Nielsen Holdings plc | 336,100 | 14,946 | ||||||
|
| |||||||
| 89,195 | ||||||||
|
| |||||||
| Information Technology—6.4% | ||||||||
Adobe Systems, Inc.(2) | 110,345 | 9,073 | ||||||
Akamai Technologies, Inc.(2) | 11,280 | 779 | ||||||
Alliance Data Systems Corp.(2) | 6,180 | 1,601 | ||||||
Autodesk, Inc. | 49,512 | 2,186 | ||||||
Automatic Data Processing, Inc. | 42,830 | 3,442 | ||||||
Citrix Systems, Inc.(2) | 34,878 | 2,416 | ||||||
Computer Sciences Corp. | 12,920 | 793 | ||||||
eBay, Inc.(2) | 61,310 | 1,498 | ||||||
Electronic Arts, Inc.(2) | 442,980 | 30,012 | ||||||
Facebook, Inc. Class A(2) | 93,200 | 8,379 | ||||||
Fidelity National Information Services, Inc. | 23,780 | 1,595 | ||||||
Fiserv, Inc.(2) | 20,615 | 1,786 | ||||||
Google, Inc. Class A(2) | 11,580 | 7,392 | ||||||
Google, Inc. Class C(2) | 12,022 | 7,314 | ||||||
Intuit, Inc. | 63,095 | 5,600 | ||||||
| SHARES | VALUE | |||||||
| Information Technology—continued | ||||||||
MasterCard, Inc. Class A | 79,980 | $ | 7,208 | |||||
Paychex, Inc. | 30,802 | 1,467 | ||||||
PayPal Holdings, Inc.(2) | 58,740 | 1,823 | ||||||
salesforce.com, Inc.(2) | 138,293 | 9,602 | ||||||
Total System Services, Inc. | 13,940 | 633 | ||||||
VeriSign, Inc.(2) | 6,092 | 430 | ||||||
Visa, Inc. Class A | 158,360 | 11,031 | ||||||
Western Union Co. (The) | 50,500 | 927 | ||||||
Xerox Corp. | 96,547 | 939 | ||||||
Yahoo!, Inc.(2) | 61,497 | 1,778 | ||||||
|
| |||||||
| 119,704 | ||||||||
|
| |||||||
| Materials—1.6% | ||||||||
Martin Marietta Materials, Inc. | 84,370 | 12,820 | ||||||
Vulcan Materials Co. | 187,510 | 16,726 | ||||||
|
| |||||||
| 29,546 | ||||||||
|
| |||||||
| Utilities—1.7% | ||||||||
AGL Resources, Inc. | 513,638 | 31,352 | ||||||
| TOTAL COMMON STOCKS (Identified Cost $885,519) | 902,545 | |||||||
| TOTAL LONG TERM INVESTMENTS—48.5% | ||||||||
| (Identified Cost $885,519) | 902,545 | |||||||
| SHORT-TERM INVESTMENTS—50.7% | ||||||||
| Money Market Mutual Funds—50.7% | ||||||||
BlackRock Liquidity Funds TempFund Portfolio – Institutional Shares (seven-day effective yield 0.010%) | 141,491,837 | 141,492 | ||||||
JPMorgan Prime Money Market Fund (seven-day effective yield 0.090%) | 660,295,241 | 660,295 | ||||||
JPMorgan U.S. Government Money Market Fund (seven-day effective yield 0.040%) | 141,491,837 | 141,492 | ||||||
| TOTAL SHORT-TERM INVESTMENTS (Identified Cost $943,279) | 943,279 | |||||||
| TOTAL INVESTMENTS—99.2% | ||||||||
| (Identified Cost $1,828,798) | 1,845,824 | (1) | ||||||
Other assets and liabilities, net—0.8% |
| 15,452 | ||||||
|
| |||||||
| NET ASSETS—100.0% | $ | 1,861,276 | ||||||
|
| |||||||
Footnote Legend:
| (1) | Federal Income Tax Information: For tax information at September 30, 2015, see Note 11 Federal Income Tax Information in the Notes to Financial Statements. |
| (2) | Non-income producing. |
See Notes to Financial Statements
39
Table of Contents
VIRTUS EQUITY TREND FUND
SCHEDULE OF INVESTMENTS (Continued)
SEPTEMBER 30, 2015
($ reported in thousands)
The following table provides a summary of inputs used to value the Fund’s investments as of September 30, 2015 (See Security Valuation Note 1A in the Notes to Schedules of Investments):
| Total Value at September 30, 2015 | Level 1 Quoted Prices | |||||||
Equity Securities: | ||||||||
Common Stocks | $ | 902,545 | $ | 902,545 | ||||
Short-Term Investments | 943,279 | 943,279 | ||||||
|
|
|
| |||||
Total Investments | $ | 1,845,824 | $ | 1,845,824 | ||||
|
|
|
| |||||
There are no Level 2 (significant observable inputs) or Level 3 (significant unobservable inputs) priced securities.
There were no transfers between Level 1 and Level 2 related to securities held at September 30, 2015.
See Notes to Financial Statements
40
Table of Contents
VIRTUS GLOBAL EQUITY TREND FUND
SCHEDULE OF INVESTMENTS
SEPTEMBER 30, 2015
($ reported in thousands)
| SHARES | VALUE | |||||||
| COMMON STOCKS—35.0% | ||||||||
| Consumer Discretionary—15.5% | ||||||||
Advance Auto Parts, Inc. | 528 | $ | 100 | |||||
Amazon.com, Inc.(2) | 927 | 475 | ||||||
AutoNation, Inc.(2) | 960 | 56 | ||||||
AutoZone, Inc.(2) | 350 | 253 | ||||||
Best Buy Co., Inc. | 11,025 | 409 | ||||||
Cablevision Systems Corp. Class A | 400 | 13 | ||||||
CarMax, Inc.(2) | 2,382 | 141 | ||||||
Chipotle Mexican Grill, Inc.(2) | 70 | 50 | ||||||
Comcast Corp. Class A | 7,290 | 415 | ||||||
Darden Restaurants, Inc. | 320 | 22 | ||||||
Expedia, Inc. | 290 | 34 | ||||||
GameStop Corp. Class A | 4,002 | 165 | ||||||
Gap, Inc. (The) | 2,160 | 62 | ||||||
Goodyear Tire & Rubber Co. (The) | 22,380 | 656 | ||||||
H&R Block, Inc. | 16,401 | 594 | ||||||
Home Depot, Inc. (The) | 4,090 | 472 | ||||||
Horton (D.R.), Inc. | 8,520 | 250 | ||||||
L Brands, Inc. | 1,725 | 156 | ||||||
Leggett & Platt, Inc. | 5,255 | 217 | ||||||
Lennar Corp. Class A | 4,610 | 222 | ||||||
Lowe’s Cos., Inc. | 3,045 | 210 | ||||||
McDonald’s Corp. | 2,440 | 240 | ||||||
Mohawk Industries, Inc.(2) | 2,400 | 436 | ||||||
Netflix, Inc.(2) | 1,260 | 130 | ||||||
Newell Rubbermaid, Inc. | 17,400 | 691 | ||||||
NIKE, Inc. Class B | 6,610 | 813 | ||||||
O’Reilly Automotive, Inc.(2) | 1,090 | 273 | ||||||
Priceline Group, Inc. (The)(2) | 130 | 161 | ||||||
PulteGroup, Inc. | 8,450 | 159 | ||||||
Ross Stores, Inc. | 3,180 | 154 | ||||||
Starbucks Corp. | 3,740 | 213 | ||||||
Time Warner Cable, Inc. | 845 | 152 | ||||||
TJX Cos., Inc. | 4,580 | 327 | ||||||
TripAdvisor, Inc.(2) | 320 | 20 | ||||||
Urban Outfitters, Inc.(2) | 815 | 24 | ||||||
Yum! Brands, Inc. | 1,100 | 88 | ||||||
|
| |||||||
| 8,853 | ||||||||
|
| |||||||
| Consumer Staples—5.4% | ||||||||
Altria Group, Inc. | 4,424 | 241 | ||||||
Brown-Forman Corp. Class B | 3,087 | 299 | ||||||
Campbell Soup Co. | 412 | 21 | ||||||
ConAgra Foods, Inc. | 941 | 38 | ||||||
Constellation Brands, Inc. Class A | 3,340 | 418 | ||||||
CVS Health Corp. | 4,070 | 393 | ||||||
General Mills, Inc. | 1,275 | 71 | ||||||
Hershey Co. (The) | 291 | 27 | ||||||
Hormel Foods Corp. | 321 | 20 | ||||||
J.M. Smucker Co. (The) | 225 | 26 | ||||||
Kellogg Co. | 582 | 39 | ||||||
Keurig Green Mountain, Inc. | 246 | 13 | ||||||
Kraft Heinz Co.(The) | 1,315 | 93 | ||||||
McCormick & Co., Inc. | 250 | 20 | ||||||
Mead Johnson Nutrition Co. | 418 | 29 | ||||||
Molson Coors Brewing Co. Class B | 6,417 | 533 | ||||||
Mondelez International, Inc. Class A | 3,696 | 155 | ||||||
Philip Morris International, Inc. | 3,513 | 279 | ||||||
Reynolds American, Inc. | 1,858 | 82 | ||||||
Tyson Foods, Inc. Class A | 624 | 27 | ||||||
Walgreens Boots Alliance, Inc. | 3,170 | 263 | ||||||
|
| |||||||
| 3,087 | ||||||||
|
| |||||||
| SHARES | VALUE | |||||||
| Energy—1.2% | ||||||||
Marathon Petroleum Corp. | 3,234 | $ | 150 | |||||
Phillips 66 | 3,235 | 249 | ||||||
Tesoro Corp. | 880 | 85 | ||||||
Valero Energy Corp. | 3,042 | 183 | ||||||
|
| |||||||
| 667 | ||||||||
|
| |||||||
| Health Care—2.5% | ||||||||
Aetna, Inc. | 1,130 | 124 | ||||||
Anthem, Inc. | 870 | 122 | ||||||
Cigna Corp. | 840 | 113 | ||||||
HCA Holdings, Inc.(2) | 5,140 | 398 | ||||||
Humana, Inc. | 480 | 86 | ||||||
Tenet Healthcare Corp.(2) | 2,070 | 76 | ||||||
UnitedHealth Group, Inc. | 2,540 | 295 | ||||||
Universal Health Services, Inc. Class B | 1,567 | 195 | ||||||
|
| |||||||
| 1,409 | ||||||||
|
| |||||||
| Industrials—3.5% | ||||||||
Allegion plc | 4,280 | 247 | ||||||
Cintas Corp. | 8,057 | 691 | ||||||
Dun & Bradstreet Corp. | 880 | 92 | ||||||
Equifax, Inc. | 2,450 | 238 | ||||||
Masco Corp. | 15,510 | 390 | ||||||
Nielsen Holdings plc | 7,637 | 340 | ||||||
|
| |||||||
| 1,998 | ||||||||
|
| |||||||
| Information Technology—4.6% | ||||||||
Adobe Systems, Inc.(2) | 1,981 | 163 | ||||||
Akamai Technologies, Inc.(2) | 130 | 9 | ||||||
Alliance Data Systems Corp. | 140 | 36 | ||||||
Autodesk, Inc.(2) | 870 | 38 | ||||||
Automatic Data Processing, Inc. | 1,017 | 82 | ||||||
Citrix Systems, Inc.(2) | 646 | 45 | ||||||
Computer Sciences Corp. | 160 | 10 | ||||||
eBay, Inc.(2) | 1,455 | 35 | ||||||
Electronic Arts, Inc.(2) | 10,865 | 736 | ||||||
Facebook, Inc. Class A(2) | 2,280 | 205 | ||||||
Fidelity National Information Services, Inc. | 610 | 41 | ||||||
Fiserv, Inc.(2) | 520 | 45 | ||||||
Google, Inc. Class A(2) | 320 | 204 | ||||||
Google, Inc. Class C(2) | 320 | 195 | ||||||
Intuit, Inc. | 1,154 | 102 | ||||||
MasterCard, Inc. Class A | 1,750 | 158 | ||||||
Paychex, Inc. | 700 | 33 | ||||||
PayPal Holdings, Inc.(2) | 1,455 | 45 | ||||||
salesforce.com, Inc.(2) | 2,533 | 176 | ||||||
Total System Services, Inc. | 190 | 9 | ||||||
VeriSign, Inc. | 70 | 5 | ||||||
Visa, Inc. Class A | 3,475 | 242 | ||||||
Western Union Co. (The) | 1,130 | 21 | ||||||
|
| |||||||
| 2,635 | ||||||||
|
| |||||||
| Materials—1.3% | ||||||||
Martin Marietta Materials, Inc. | 1,960 | 298 | ||||||
Vulcan Materials Co. | 4,140 | 369 | ||||||
Xerox Corp. | 2,270 | 22 | ||||||
Yahoo!, Inc.(2) | 1,160 | 34 | ||||||
|
| |||||||
| 723 | ||||||||
|
| |||||||
| SHARES | VALUE | |||||||
| Utilities—1.0% | ||||||||
AGL Resources, Inc. | 9,335 | $ | 570 | |||||
| TOTAL COMMON STOCKS (Identified Cost $19,600) | 19,942 | |||||||
| TOTAL LONG TERM INVESTMENTS—35.0% | ||||||||
| (Identified Cost $19,600) | 19,942 | |||||||
| SHORT-TERM INVESTMENTS—59.0% | ||||||||
| Money Market Mutual Fund—59.0% | ||||||||
Fidelity Money Market Portfolio – Institutional Shares (Seven-day effective yield 0.140%) | 33,546,257 | 33,546 | ||||||
| TOTAL SHORT-TERM INVESTMENTS (Identified Cost $33,546) | 33,546 | |||||||
| TOTAL INVESTMENTS—94.0% (Identified Cost $53,146) | 53,488 | (1) | ||||||
Other assets and liabilities, net—6.0% |
| 3,409 | ||||||
|
| |||||||
| NET ASSETS—100.0% | $ | 56,897 | ||||||
|
| |||||||
Footnote Legend:
| (1) | Federal Income Tax Information: For tax information at September 30, 2015, see Note 11 Federal Income Tax Information in the Notes to Financial Statements. |
| (2) | Non-income producing. |
The following table provides a summary of inputs used to value the Fund’s investments as of September 30, 2015 (See Security Valuation Note 2A in the Notes to Financial Statements):
| Total Value at September 30, 2015 | Level 1 Quoted Prices | |||||||
Equity Securities: | ||||||||
Common Stocks | $ | 19,942 | $ | 19,942 | ||||
Short-Term | 33,546 | 33,546 | ||||||
|
|
|
| |||||
Total Investments | $ | 53,488 | $ | 53,488 | ||||
|
|
|
| |||||
There are no Level 2 (significant observable inputs) or Level 3 (significant unobservable inputs) priced securities.
There were no transfers between Level 1 and Level 2 related to securities held at September 30, 2015.
See Notes to Financial Statements
41
Table of Contents
SCHEDULE OF INVESTMENTS
SEPTEMBER 30, 2015
($ reported in thousands)
| SHARES | VALUE | |||||||
| CLOSED END FUNDS—72.7% | ||||||||
| Convertible Fund—0.9% | ||||||||
Putnam High Income Securities Fund | 48,414 | $ | 341 | |||||
|
| |||||||
| Equity Funds—35.8% | ||||||||
Adams Diversified Equity Fund, Inc. | 71,234 | 908 | ||||||
Adams Natural Resources Fund, Inc. | 13,166 | 239 | ||||||
Alpine Total Dynamic Dividend Fund | 118,834 | 891 | ||||||
BlackRock Science & Technology Trust | 116,277 | 1,843 | ||||||
Boulder Growth & Income Fund, Inc. | 239,381 | 1,783 | ||||||
Cohen & Steers Infrastructure Fund, Inc. | 27,935 | 533 | ||||||
Cohen & Steers Total Return Realty Fund, Inc. | 16,684 | 198 | ||||||
Cushing MLP Total Return Fund (The) | 30,672 | 361 | ||||||
Eaton Vance Tax-Advantaged Dividend Income Fund | 9,652 | 177 | ||||||
First Trust Energy Infrastructure Fund | 25,901 | 414 | ||||||
Gabelli Dividend & Income Trust (The) | 56,938 | 1,000 | ||||||
Gabelli Healthcare & WellnessRx Trust (The) | 68,857 | 667 | ||||||
Gabelli Multimedia Trust, Inc. | 44,700 | 337 | ||||||
General American Investors Co., Inc. | 20,749 | 643 | ||||||
Guggenheim Enhanced Equity Income Fund | 68,412 | 493 | ||||||
Kayne Anderson Midsteam/Energy Fund, Inc. | 15,100 | 285 | ||||||
Liberty All Star Equity Fund | 175,199 | 890 | ||||||
Salient Midstream & MLP Fund | 65,385 | 915 | ||||||
Tortoise Pipeline & Energy Fund, Inc. | 32,000 | 574 | ||||||
Tri-Continental Corp. | 26,847 | 523 | ||||||
|
| |||||||
| 13,674 | ||||||||
|
| |||||||
| Fixed Income Funds—14.7% | ||||||||
First Trust High Income Long/Short Fund | 32,500 | 458 | ||||||
First Trust Mortgage Income Fund | 14,700 | 212 | ||||||
NexPoint Credit Strategies Fund | 196,934 | 1,128 | ||||||
Nuveen Credit Strategies Income Fund | 11,000 | 88 | ||||||
Nuveen Multi-Market Income Fund, Inc. | 14,024 | 98 | ||||||
PIMCO Corporate & Income Strategy Fund | 10,911 | 143 | ||||||
PIMCO Dynamic Credit Income Fund | 98,300 | 1,796 | ||||||
PIMCO Dynamic Income Fund | 52,056 | 1,499 | ||||||
PIMCO Income Strategy Fund | 22,000 | 213 | ||||||
|
| |||||||
| 5,635 | ||||||||
|
| |||||||
| International Equity Funds—20.1% | ||||||||
Aberdeen Japan Equity Fund, Inc. | 64,648 | 444 | ||||||
Aberdeen Singapore Fund, Inc. | 5,100 | 44 | ||||||
| SHARES | VALUE | |||||||
| International Equity Funds—continued | ||||||||
Alpine Global Dynamic Dividend Fund | 58,343 | $ | 499 | |||||
Brookfield Global Listed Infrastructure Income Fund, Inc. | 7,000 | 88 | ||||||
Clough Global Opportunities Fund | 24,477 | 262 | ||||||
Delaware Enhanced Global Dividend and Income Fund | 18,872 | 175 | ||||||
Japan Smaller Capitalization Fund, Inc. | 53,793 | 547 | ||||||
Korea Fund, Inc. (The)(2) | 7,079 | 251 | ||||||
Macquarie Global Infrastructure Total Return Fund, Inc. | 4,000 | 77 | ||||||
Morgan Stanley China A Share Fund, Inc. | 38,500 | 864 | ||||||
New Germany Fund, Inc. (The) | 30,664 | 442 | ||||||
RMR Real Estate Income Fund | 11,278 | 203 | ||||||
Taiwan Fund, Inc. (The) | 29,640 | 429 | ||||||
Tekla Healthcare Investors | 20,000 | 552 | ||||||
Tekla Healthcare Opportunities Fund | 136,403 | 2,223 | ||||||
Tekla World Healthcare Fund | 39,431 | 567 | ||||||
Templeton Dragon Fund, Inc. | 1,837 | 34 | ||||||
|
| |||||||
| 7,701 | ||||||||
|
| |||||||
| International Income Funds—1.2% | ||||||||
Aberdeen Asia-Pacific Income Fund, Inc. | 14,107 | 64 | ||||||
Diversified Real Asset Income Fund | 24,030 | 386 | ||||||
|
| |||||||
| 450 | ||||||||
| TOTAL CLOSED END FUNDS (Identified Cost $31,998) | 27,801 | |||||||
| PREFERRED STOCKS—24.8% | ||||||||
| Financials—24.8% | ||||||||
Eagle Point Credit Co, Inc. 7.75% | 19,140 | 490 | ||||||
MVC Capital, Inc. 7.25 | 83,145 | 1,961 | ||||||
Oxford Lane Capital Corp. 7.50% | 142,952 | 3,445 | ||||||
Oxford Lane Capital Corp. 8.125% | 142,366 | 3,581 | ||||||
| TOTAL PREFERRED STOCKS (Identified Cost $9,667) | 9,477 | |||||||
| TOTAL LONG TERM INVESTMENTS—97.5% | ||||||||
| (Identified Cost $41,665) | 37,278 | |||||||
| SHORT-TERM INVESTMENTS—3.6% | ||||||||
| Money Market Mutual Fund—3.6% | ||||||||
Fidelity Money Market Portfolio – Institutional Shares (seven-day effective yield 0.170%) | 1,376,096 | 1,376 | ||||||
| TOTAL SHORT-TERM INVESTMENTS (Identified Cost $1,376) | 1,376 | |||||||
| TOTAL INVESTMENTS—101.1% (Identified Cost $43,041) | 38,654 | (1) | ||||||
Other assets and liabilities, net—(1.1)% |
| (421 | ) | |||||
|
| |||||||
| NET ASSETS—100.0% | $ | 38,233 | ||||||
|
| |||||||
Footnote Legend:
| (1) | Federal Income Tax Information: For tax information at September 30, 2015, see Note 11 Federal Income Tax Information in the Notes to Financial Statements. |
| (2) | Non-income producing. |
The following table provides a summary of inputs used to value the Fund’s investments as of September 30, 2015 (See Security Valuation Note 2A in the Notes to Financial Statements):
| Total Value at September 30, 2015 | Level 1 Quoted Prices | |||||||
Equity Securities: | ||||||||
Closed-End Funds | $ | 27,801 | $ | 27,801 | ||||
Preferred Stock | 9,477 | 9,477 | ||||||
Short-Term Invest | 1,376 | 1,376 | ||||||
|
|
|
| |||||
Total Investments | $ | 38,654 | $ | 38,654 | ||||
|
|
|
| |||||
There are no Level 2 (significant observable inputs) or Level 3 (significant unobservable inputs) priced securities.
There were no transfers between Level 1 and Level 2 related to securities held at September 30, 2015.
See Notes to Financial Statements
42
Table of Contents
SCHEDULE OF INVESTMENTS
SEPTEMBER 30, 2015
($ reported in thousands)
| SHARES | VALUE | |||||||
| COMMON STOCKS—18.8% | ||||||||
| Consumer Discretionary—8.3% | ||||||||
Advance Auto Parts, Inc. | 1,478 | $ | 280 | |||||
Amazon.com, Inc.(2) | 2,090 | 1,070 | ||||||
AutoNation, Inc.(2) | 2,520 | 147 | ||||||
AutoZone, Inc.(2) | 920 | 666 | ||||||
Best Buy Co., Inc. | 31,315 | 1,162 | ||||||
Cablevision Systems Corp. Class A | 1,050 | 34 | ||||||
CarMax, Inc.(2) | 6,110 | 363 | ||||||
Chipotle Mexican Grill, Inc.(2) | 190 | 137 | ||||||
Comcast Corp. Class A | 16,630 | 946 | ||||||
Darden Restaurants, Inc. | 820 | 56 | ||||||
Expedia, Inc. | 760 | 89 | ||||||
GameStop Corp. Class A | 11,056 | 456 | ||||||
Gap, Inc. (The) | 5,065 | 144 | ||||||
Goodyear Tire & Rubber Co. (The) | 57,282 | 1,680 | ||||||
H&R Block, Inc. | 46,250 | 1,674 | ||||||
Home Depot, Inc. | 10,105 | 1,167 | ||||||
Horton (D.R.), Inc. | 21,480 | 631 | ||||||
L Brands, Inc. | 4,500 | 406 | ||||||
Leggett & Platt, Inc. | 12,290 | 507 | ||||||
Lennar Corp. Class A | 11,620 | 559 | ||||||
Lowe’s Cos., Inc. | 8,345 | 575 | ||||||
McDonald’s Corp. | 6,160 | 607 | ||||||
Mohawk Industries, Inc.(2) | 5,460 | 993 | ||||||
Netflix, Inc.(2) | 1,940 | 200 | ||||||
Newell Rubbermaid, Inc. | 41,310 | 1,640 | ||||||
NIKE, Inc. Class B | 15,125 | 1,860 | ||||||
O’Reilly Automotive, Inc.(2) | 2,510 | 628 | ||||||
Priceline Group, Inc. (The)(2) | 380 | 470 | ||||||
PulteGroup, Inc. | 21,310 | 402 | ||||||
Ross Stores, Inc. | 7,740 | 375 | ||||||
Starbucks Corp. | 9,480 | 539 | ||||||
Time Warner Cable, Inc. | 2,180 | 391 | ||||||
TJX Cos., Inc. | 12,605 | 900 | ||||||
TripAdvisor, Inc.(2) | 860 | 54 | ||||||
Urban Outfitters, Inc.(2) | 2,150 | 63 | ||||||
Yum! Brands, Inc. | 2,810 | 225 | ||||||
|
| |||||||
| 22,096 | ||||||||
|
| |||||||
| Consumer Staples—3.0% | ||||||||
Altria Group, Inc. | 12,007 | 653 | ||||||
Brown-Forman Corp. Class B | 7,110 | 689 | ||||||
Campbell Soup Co. | 1,222 | 62 | ||||||
ConAgra Foods, Inc. | 2,786 | 113 | ||||||
Constellation Brands, Inc. Class A | 9,190 | 1,151 | ||||||
CVS Health Corp. | 9,417 | 909 | ||||||
General Mills, Inc. | 3,605 | 202 | ||||||
Hershey Co. (The) | 972 | 89 | ||||||
Hormel Foods Corp. | 952 | 60 | ||||||
J.M. Smucker Co. (The) | 501 | 57 | ||||||
Kellogg Co. | 1,294 | 86 | ||||||
Keurig Green Mountain, Inc. | 546 | 29 | ||||||
Kraft Heinz Co.(The) | 3,506 | 248 | ||||||
McCormick & Co., Inc. | 741 | 61 | ||||||
Mead Johnson Nutrition Co. | 1,114 | 78 | ||||||
Molson Coors Brewing Co. Class B | 18,179 | 1,509 | ||||||
Mondelez International, Inc. Class A | 9,575 | 401 | ||||||
Philip Morris International, Inc. | 9,433 | 748 | ||||||
Reynolds American, Inc. | 4,816 | 213 | ||||||
| SHARES | VALUE | |||||||
| Consumer Staples—continued | ||||||||
Tyson Foods, Inc. Class A | 1,386 | $ | 60 | |||||
Walgreens Boots Alliance, Inc. | 7,087 | 589 | ||||||
|
| |||||||
| 8,007 | ||||||||
|
| |||||||
| Energy—0.7% | ||||||||
Marathon Petroleum Corp. | 8,860 | 411 | ||||||
Phillips 66 | 8,872 | 682 | ||||||
Tesoro Corp. | 2,070 | 201 | ||||||
Valero Energy Corp. | 8,340 | 501 | ||||||
|
| |||||||
| 1,795 | ||||||||
|
| |||||||
| Health Care—1.2% | ||||||||
Aetna, Inc. | 2,657 | 291 | ||||||
Anthem, Inc. | 2,030 | 284 | ||||||
Cigna Corp. | 1,970 | 266 | ||||||
HCA Holdings, Inc.(2) | 10,940 | 846 | ||||||
Humana, Inc. | 1,130 | 202 | ||||||
Tenet Healthcare Corp.(2) | 4,860 | 180 | ||||||
UnitedHealth Group, Inc. | 6,990 | 811 | ||||||
Universal Health Services, Inc. Class B | 3,440 | 429 | ||||||
|
| |||||||
| 3,309 | ||||||||
|
| |||||||
| Industrials—2.0% | ||||||||
Allegion plc | 11,770 | 679 | ||||||
Cintas Corp. | 20,000 | 1,715 | ||||||
Dun & Bradstreet Corp. | 2,060 | 216 | ||||||
Equifax, Inc. | 6,715 | 653 | ||||||
Masco Corp. | 42,700 | 1,075 | ||||||
Nielsen Holdings plc | 20,970 | 932 | ||||||
|
| |||||||
| 5,270 | ||||||||
|
| |||||||
| Information Technology—2.4% | ||||||||
Adobe Systems, Inc.(2) | 5,618 | 462 | ||||||
Akamai Technologies, Inc.(2) | 620 | 43 | ||||||
Alliance Data Systems Corp.(2) | 360 | 93 | ||||||
Autodesk, Inc. | 2,323 | 102 | ||||||
Automatic Data Processing, Inc. | 2,395 | 192 | ||||||
Citrix Systems, Inc.(2) | 1,888 | 131 | ||||||
Computer Sciences Corp. | 800 | 49 | ||||||
eBay, Inc.(2) | 3,415 | 83 | ||||||
Electronic Arts, Inc.(2) | 23,665 | 1,603 | ||||||
Facebook, Inc. Class A(2) | 4,840 | 435 | ||||||
Fidelity National Information Services, Inc. | 1,620 | 109 | ||||||
Fiserv, Inc.(2) | 1,360 | 118 | ||||||
Google, Inc. Class A(2) | 640 | 409 | ||||||
Google, Inc. Class C(2) | 660 | 402 | ||||||
Intuit, Inc. | 3,172 | 281 | ||||||
MasterCard, Inc. Class A | 4,800 | 433 | ||||||
Paychex, Inc. | 1,850 | 88 | ||||||
PayPal Holdings, Inc.(2) | 3,290 | 102 | ||||||
salesforce.com, Inc.(2) | 7,252 | 503 | ||||||
Total System Services, Inc. | 500 | 23 | ||||||
VeriSign, Inc.(2) | 200 | 14 | ||||||
Visa, Inc. Class A | 9,540 | 665 | ||||||
Western Union Co. (The) | 2,980 | 55 | ||||||
Xerox Corp. | 5,960 | 58 | ||||||
Yahoo!, Inc.(2) | 3,055 | 88 | ||||||
|
| |||||||
| 6,541 | ||||||||
|
| |||||||
| SHARES | VALUE | |||||||
| Materials—0.6% | ||||||||
Martin Marietta Materials, Inc. | 4,700 | $ | 714 | |||||
Vulcan Materials Co. | 11,385 | 1,016 | ||||||
|
| |||||||
| 1,730 | ||||||||
|
| |||||||
| Utilities—0.6% | ||||||||
AGL Resources, Inc. | 26,324 | 1,607 | ||||||
| TOTAL COMMON STOCKS (Identified Cost $49,596) | 50,355 | |||||||
| EXCHANGE-TRADED FUNDS(3)—43.3% | ||||||||
iShares 1-3 Year Treasury Bond Fund | 676,665 | 57,510 | ||||||
iShares 20+ Year Treasury Bond Fund | 313,540 | 38,735 | ||||||
PowerShares DB Gold Fund(2) | 258,206 | 9,445 | ||||||
Powershares DB U.S. Dollar Index Bullish Fund(2) | 415,267 | 10,423 | ||||||
| TOTAL EXCHANGE-TRADED FUNDS (Identified Cost $115,021) | 116,113 | |||||||
| TOTAL LONG TERM INVESTMENTS—62.1% | ||||||||
| (Identified Cost $164,617) | 166,468 | |||||||
| SHORT-TERM INVESTMENTS—34.8% | ||||||||
| Money Market Mutual Fund—34.8% | ||||||||
Fidelity Money Market Portfolio – Institutional Shares (seven-day effective yield 0.170%) | 93,287,912 | 93,288 | ||||||
| TOTAL SHORT-TERM INVESTMENTS (Identified Cost $93,288) | 93,288 | |||||||
| TOTAL INVESTMENTS—96.9% | ||||||||
| (Identified Cost $257,905) | 259,756 | (1) | ||||||
Other assets and liabilities, net—3.1% |
| 8,209 | ||||||
|
| |||||||
| NET ASSETS—100.0% | $ | 267,965 | ||||||
|
| |||||||
Footnote Legend:
| (1) | Federal Income Tax Information: For tax information at September 30, 2015, see Note 11 Federal Income Tax Information in the Notes to Financial Statements. |
| (2) | Non-income producing. |
| (3) | All of these funds are public funds and the prospectus and annual reports of each are publicly available. |
See Notes to Financial Statements
43
Table of Contents
VIRTUS MULTI-ASSET TREND FUND
SCHEDULE OF INVESTMENTS (Continued)
SEPTEMBER 30, 2015
($ reported in thousands)
The following table provides a summary of inputs used to value the Fund’s investments as of September 30, 2015 (See Security Valuation Note 2A in the Notes to Financial Statements):
| Total Value at September 30, 2015 | Level 1 Quoted Prices | |||||||
Equity Securities: | ||||||||
Common Stocks | $ | 50,355 | $ | 50,355 | ||||
Exchange-Traded Funds | 116,113 | 116,113 | ||||||
Short-Term Invest | 93,288 | 93,288 | ||||||
|
|
|
| |||||
Total Investments | $ | 259,756 | $ | 259,756 | ||||
|
|
|
| |||||
There are no Level 2 (significant observable inputs) or Level 3 (significant unobservable inputs) priced securities.
There were no transfers between Level 1 and Level 2 related to securities held at September 30, 2015.
See Notes to Financial Statements
44
Table of Contents
SCHEDULE OF INVESTMENTS
SEPTEMBER 30, 2015
($ reported in thousands)
| SHARES | VALUE | |||||||
| COMMON STOCKS—21.3% | ||||||||
| Consumer Discretionary—21.3% | ||||||||
Advance Auto Parts, Inc. | 3,750 | $ | 711 | |||||
Amazon.com, Inc.(2) | 19,395 | 9,928 | ||||||
AutoNation, Inc.(2) | 3,998 | 233 | ||||||
AutoZone, Inc.(2) | 1,585 | 1,147 | ||||||
Bed Bath & Beyond, Inc. | 8,910 | 508 | ||||||
Best Buy Co., Inc. | 15,790 | 586 | ||||||
BorgWarner, Inc. | 11,815 | 491 | ||||||
Cablevision Systems Corp. Class A | 11,220 | 364 | ||||||
CarMax, Inc.(2) | 10,530 | 625 | ||||||
Carnival Corp. | 23,848 | 1,185 | ||||||
CBS Corp. Class B | 22,813 | 910 | ||||||
Chipotle Mexican Grill, Inc.(2) | 1,590 | 1,145 | ||||||
Coach, Inc. | 14,220 | 411 | ||||||
Comcast Corp. Class A | 108,660 | 6,181 | ||||||
Comcast Corp. Special Class A | 18,940 | 1,084 | ||||||
Darden Restaurants, Inc. | 5,805 | 398 | ||||||
Delphi Automotive plc | 14,530 | 1,105 | ||||||
Discovery Communications, Inc. Class A(2) | 7,548 | 196 | ||||||
Discovery Communications, Inc. Class C(2) | 13,260 | 322 | ||||||
Dollar General Corp. | 15,135 | 1,096 | ||||||
Dollar Tree, Inc.(2) | 12,037 | 802 | ||||||
Expedia, Inc. | 5,050 | 594 | ||||||
Ford Motor Co. | 201,360 | 2,732 | ||||||
Fossil Group, Inc.(2) | 2,260 | 126 | ||||||
GameStop Corp. Class A | 5,425 | 224 | ||||||
Gap, Inc. (The) | 12,205 | 348 | ||||||
Garmin Ltd. | 6,290 | 226 | ||||||
General Motors Co. | 74,725 | 2,243 | ||||||
Genuine Parts Co. | 7,733 | 641 | ||||||
Goodyear Tire & Rubber Co. (The) | 13,975 | 410 | ||||||
H&R Block, Inc. | 14,075 | 510 | ||||||
Hanesbrands, Inc. | 20,250 | 586 | ||||||
Harley-Davidson, Inc. | 10,648 | 585 | ||||||
Harman International Industries, Inc. | 3,718 | 357 | ||||||
Hasbro, Inc. | 5,740 | 414 | ||||||
Home Depot, Inc. | 66,033 | 7,626 | ||||||
Horton (D.R.), Inc. | 16,618 | 488 | ||||||
Interpublic Group of Cos., Inc. (The) | 20,525 | 393 | ||||||
Johnson Controls, Inc. | 33,650 | 1,392 | ||||||
Kohl’s Corp. | 10,325 | 478 | ||||||
L Brands, Inc. | 13,085 | 1,179 | ||||||
Leggett & Platt, Inc. | 6,885 | 284 | ||||||
Lennar Corp. Class A | 8,930 | 430 | ||||||
Lowe’s Cos., Inc. | 47,540 | 3,276 | ||||||
Macy’s, Inc. | 17,200 | 883 | ||||||
Marriott International, Inc. Class A | 10,243 | 699 | ||||||
Mattel, Inc. | 17,668 | 372 | ||||||
McDonald’s Corp. | 48,240 | 4,753 | ||||||
Michael Kors Holdings Ltd. | 9,978 | 421 | ||||||
Mohawk Industries, Inc.(2) | 3,265 | 594 | ||||||
Netflix, Inc.(2) | 21,981 | 2,270 | ||||||
Newell Rubbermaid, Inc. | 13,610 | 540 | ||||||
| SHARES | VALUE | |||||||
| Consumer Discretionary—continued | ||||||||
News Corp | 5,500 | $ | 71 | |||||
News Corp. Class A | 19,568 | 247 | ||||||
NIKE, Inc. Class B | 34,468 | 4,239 | ||||||
Nordstrom, Inc. | 7,138 | 512 | ||||||
O’Reilly Automotive, Inc.(2) | 5,080 | 1,270 | ||||||
Omnicom Group, Inc. | 12,528 | 826 | ||||||
Phillips-Van Heusen Corp. | 4,290 | 437 | ||||||
Priceline Group, Inc. (The)(2) | 2,600 | 3,216 | ||||||
PulteGroup, Inc. | 16,770 | 316 | ||||||
Ralph Lauren Corp. | 3,130 | 370 | ||||||
Ross Stores, Inc. | 21,276 | 1,031 | ||||||
Royal Caribbean Cruises Ltd. | 8,870 | 790 | ||||||
Scripps Networks Interactive, Inc. Class A | 4,958 | 244 | ||||||
Signet Jewelers Ltd. | 4,030 | 549 | ||||||
Staples, Inc. | 33,190 | 389 | ||||||
Starbucks Corp. | 75,505 | 4,292 | ||||||
Starwood Hotels & Resorts Worldwide, Inc. | 8,853 | 589 | ||||||
Target Corp. | 32,110 | 2,526 | ||||||
TEGNA, Inc. | 11,590 | 260 | ||||||
Tiffany & Co. | 5,703 | 440 | ||||||
Time Warner Cable, Inc. | 14,378 | 2,579 | ||||||
Time Warner, Inc. | 41,968 | 2,885 | ||||||
TJX Cos., Inc. | 34,600 | 2,471 | ||||||
Tractor Supply Co. | 6,888 | 581 | ||||||
TripAdvisor, Inc.(2) | 5,725 | 361 | ||||||
Twenty-First Century Fox Inc | 22,180 | 600 | ||||||
Twenty-First Century Fox, Inc. Class A | 62,730 | 1,692 | ||||||
Under Armour, Inc. Class A(2) | 9,187 | 889 | ||||||
Urban Outfitters, Inc.(2) | 4,813 | 141 | ||||||
VF Corp. | 17,417 | 1,188 | ||||||
Viacom, Inc. Class B | 17,825 | 769 | ||||||
Walt Disney Co. (The) | 79,396 | 8,114 | ||||||
Whirlpool Corp. | 4,020 | 592 | ||||||
Wyndham Worldwide Corp. | 6,145 | 442 | ||||||
Wynn Resorts Ltd. | 4,265 | 227 | ||||||
Yum! Brands, Inc. | 22,450 | 1,795 | ||||||
| TOTAL COMMON STOCKS (Identified Cost $116,539) | 113,442 | |||||||
| TOTAL LONG TERM INVESTMENTS—21.3% | ||||||||
| (Identified Cost $116,539) | 113,442 | |||||||
| SHORT-TERM INVESTMENTS—79.0% | ||||||||
| Money Market Mutual Funds—79.0% | ||||||||
Fidelity Money Market Portfolio – Institutional Shares (seven-day effective yield 0.170%) | 315,921,510 | 315,922 | ||||||
Goldman Sachs Financial Square Funds – Money Market Fund – Institutional Shares (seven-day effective yield 0.090%) | 84,245,736 | 84,246 | ||||||
| SHARES | VALUE | |||||||
| Money Market Mutual Funds—continued | ||||||||
JPMorgan U.S. Government Money Market Fund (seven-day effective yield 0.040%) | 21,061,434 | $ | 21,061 | |||||
| TOTAL SHORT-TERM INVESTMENTS (Identified Cost $421,229) | 421,229 | |||||||
| TOTAL INVESTMENTS—100.3% (Identified Cost $537,768) | 534,671 | (1) | ||||||
Other assets and liabilities, net—(0.3)% |
| (1,379 | ) | |||||
|
| |||||||
| NET ASSETS—100.0% | $ | 533,292 | ||||||
|
| |||||||
Footnote Legend:
| (1) | Federal Income Tax Information: For tax information at September 30, 2015, see Note 11 Federal Income Tax Information in the Notes to Financial Statements. |
| (2) | Non-income producing. |
The following table provides a summary of inputs used to value the Fund’s investments as of September 30, 2015 (See Security Valuation Note 2A in the Notes to Financial Statements):
| Total Value at September 30, 2015 | Level 1 Quoted Prices | |||||||
Equity Securities: | ||||||||
Common Stocks | $ | 113,442 | $ | 113,442 | ||||
Short-Term Investments | 421,229 | 421,229 | ||||||
|
|
|
| |||||
Total Investments | $ | 534,671 | $ | 534,671 | ||||
|
|
|
| |||||
There are no Level 2 (significant observable inputs) or Level 3 (significant unobservable inputs) priced securities.
There were no transfers between Level 1 and Level 2 related to securities held at September 30, 2015.
See Notes to Financial Statements
45
Table of Contents
STATEMENTS OF ASSETS AND LIABILITIES
SEPTEMBER 30, 2015
(Reported in thousands except shares and per share amounts)
|
|
|
|
|
|
|
| |||||||||
| Alternatives Diversifier Fund | Disciplined Equity Style Fund | Disciplined Select Bond Fund | Disciplined Select Country Fund | |||||||||||||
| Assets | ||||||||||||||||
Investment in unaffiliated securities at value(1)(3) | $ | 31,328 | $ | 4,360 | $ | 1,480 | $ | 1,259 | ||||||||
Investments in affiliated funds at value(2) | 49,936 | — | — | — | ||||||||||||
Receivables | ||||||||||||||||
Investment securities sold | 1,400 | 4,276 | — | — | ||||||||||||
Fund shares sold | 20 | — | — | — | ||||||||||||
Receivable from adviser | — | 2 | 4 | 3 | ||||||||||||
Dividends and interest receivable | 39 | 10 | — | — | ||||||||||||
Prepaid trustee retainer | 1 | — | — | — | ||||||||||||
Prepaid expenses | 32 | 15 | 14 | 14 | ||||||||||||
|
|
|
|
|
|
|
| |||||||||
Total assets | 82,756 | 8,663 | 1,498 | 1,276 | ||||||||||||
|
|
|
|
|
|
|
| |||||||||
| Liabilities | ||||||||||||||||
Cash overdraft | ||||||||||||||||
Payables | ||||||||||||||||
Fund shares repurchased | 334 | — | — | 17 | ||||||||||||
Investment securities purchased | 769 | 4,300 | — | — | ||||||||||||
Distribution and service fees | 27 | 1 | — | — | ||||||||||||
Administration fees | 8 | 1 | — | — | ||||||||||||
Transfer agent fees and expenses | 36 | 1 | — | — | ||||||||||||
Trustees’ fees and expenses | — | — | — | — | ||||||||||||
Professional fees | 19 | 18 | 18 | 18 | ||||||||||||
Other accrued expenses | 6 | 1 | 1 | 1 | ||||||||||||
|
|
|
|
|
|
|
| |||||||||
Total liabilities | 1,199 | 4,322 | 19 | 36 | ||||||||||||
|
|
|
|
|
|
|
| |||||||||
| Net Assets | $ | 81,557 | $ | 4,341 | $ | 1,479 | $ | 1,240 | ||||||||
|
|
|
|
|
|
|
| |||||||||
| Net Assets Consist of: | ||||||||||||||||
Capital paid in on shares of beneficial interest | $ | 155,153 | $ | 4,633 | $ | 1,601 | $ | 1,401 | ||||||||
Accumulated undistributed net investment income (loss) | 411 | (20 | ) | 1 | 4 | |||||||||||
Accumulated undistributed net realized gain (loss) | (81,623 | ) | (293 | ) | (117 | ) | (120 | ) | ||||||||
Net unrealized appreciation (depreciation) on investments | 7,616 | 21 | (6 | ) | (45 | ) | ||||||||||
|
|
|
|
|
|
|
| |||||||||
| Net Assets | $ | 81,557 | $ | 4,341 | $ | 1,479 | $ | 1,240 | ||||||||
|
|
|
|
|
|
|
| |||||||||
| Class A | ||||||||||||||||
Net asset value (net assets/shares outstanding) per share | $ | 9.99 | $ | 10.83 | $ | 9.32 | $ | 9.30 | ||||||||
Maximum offering price per share NAV/(1–3.75%) | $ | — | $ | — | $ | 9.68 | $ | — | ||||||||
Maximum offering price per share NAV/(1–5.75%) | $ | 10.60 | $ | 11.49 | $ | — | $ | 9.87 | ||||||||
Shares of beneficial interest outstanding, no par value, unlimited authorization | 2,540,845 | 158,782 | 53,521 | 26,536 | ||||||||||||
Net Assets | $ | 25,377 | $ | 1,720 | $ | 499 | $ | 247 | ||||||||
| Class C | ||||||||||||||||
Net asset value (net assets/shares outstanding) and offering price per share | $ | 9.90 | $ | 10.57 | $ | 9.26 | $ | 9.23 | ||||||||
Shares of beneficial interest outstanding, no par value, unlimited authorization | 2,589,782 | 140,418 | 21,787 | 16,360 | ||||||||||||
Net Assets | $ | 25,637 | $ | 1,484 | $ | 202 | $ | 151 | ||||||||
| Class I | ||||||||||||||||
Net asset value (net assets/shares outstanding) and offering price per share | $ | 9.98 | $ | 10.91 | $ | 9.33 | $ | 9.33 | ||||||||
Shares of beneficial interest outstanding, no par value, unlimited authorization | 3,061,072 | 104,230 | 83,424 | 90,237 | ||||||||||||
Net Assets | $ | 30,543 | $ | 1,137 | $ | 778 | $ | 842 | ||||||||
(1) Investment in unaffiliated securities at cost | $ | 35,285 | $ | 4,339 | $ | 1,486 | $ | 1,304 | ||||||||
(2) Investment in affiliated funds at cost | $ | 38,363 | $ | — | $ | — | $ | — | ||||||||
See Notes to Financial Statements
46
Table of Contents
VIRTUS OPPORTUNITIES TRUST
STATEMENTS OF ASSETS AND LIABILITIES (Continued)
SEPTEMBER 30, 2015
(Reported in thousands except shares and per share amounts)
|
|
|
|
|
|
|
| |||||||||
| Dynamic Trend Fund | Equity Trend Fund | Global Equity Trend Fund | Herzfeld Fund | |||||||||||||
| Assets | ||||||||||||||||
Investment in unaffiliated securities at value(1) | $ | 610,410 | $ | 1,845,824 | $ | 53,488 | $ | 38,654 | ||||||||
Cash | 41 | — | — | — | ||||||||||||
Deposits with prime broker for securities sold short | 155,502 | — | — | — | ||||||||||||
Receivables | ||||||||||||||||
Investment securities sold | — | 27,405 | 3,765 | — | ||||||||||||
Fund shares sold | 7,736 | 1,244 | 13 | 299 | ||||||||||||
Dividends and interest receivable | 149 | 1,150 | 26 | 259 | ||||||||||||
Prepaid trustee retainer | 5 | 17 | 1 | — | ||||||||||||
Prepaid expenses | 82 | 168 | 25 | 29 | ||||||||||||
|
|
|
|
|
|
|
| |||||||||
Total assets | 773,925 | 1,875,808 | 57,318 | 39,241 | ||||||||||||
|
|
|
|
|
|
|
| |||||||||
| Liabilities | ||||||||||||||||
Securities sold short at value(2) | 150,468 | — | — | — | ||||||||||||
Payables | ||||||||||||||||
Fund shares repurchased | 3,293 | 11,137 | 305 | 597 | ||||||||||||
Investment securities purchased | — | — | — | 332 | ||||||||||||
Dividends and interest expense on securities sold short | 883 | — | — | — | ||||||||||||
Investment advisory fees | 783 | 1,610 | 49 | 32 | ||||||||||||
Distribution and service fees | 209 | 755 | 23 | 14 | ||||||||||||
Administration fees | 64 | 195 | 6 | 4 | ||||||||||||
Transfer agent fees and expenses | 232 | 639 | 14 | 7 | ||||||||||||
Trustees’ fees and expenses | 1 | 3 | — | (3) | — | |||||||||||
Professional fees | 20 | 24 | 18 | 19 | ||||||||||||
Other accrued expenses | 40 | 169 | 6 | 3 | ||||||||||||
|
|
|
|
|
|
|
| |||||||||
Total liabilities | 155,993 | 14,532 | 421 | 1,008 | ||||||||||||
|
|
|
|
|
|
|
| |||||||||
| Net Assets | $ | 617,932 | $ | 1,861,276 | $ | 56,897 | $ | 38,233 | ||||||||
|
|
|
|
|
|
|
| |||||||||
| Net Assets Consist of: | ||||||||||||||||
Capital paid in on shares of beneficial interest | $ | 726,905 | $ | 2,251,358 | $ | 69,840 | $ | 42,707 | ||||||||
Accumulated undistributed net investment income (loss) | — | (3) | (8,830 | ) | (698 | ) | — | |||||||||
Accumulated undistributed net realized gain (loss) | (118,158 | ) | (398,278 | ) | (12,587 | ) | (87 | ) | ||||||||
Net unrealized appreciation (depreciation) on investments | 4,152 | 17,026 | 342 | (4,387 | ) | |||||||||||
Net unrealized appreciation (depreciation) on securities sold short | 5,033 | — | — | — | ||||||||||||
|
|
|
|
|
|
|
| |||||||||
| Net Assets | $ | 617,932 | $ | 1,861,276 | $ | 56,897 | $ | 38,233 | ||||||||
|
|
|
|
|
|
|
| |||||||||
| Class A | ||||||||||||||||
Net asset value (net assets/shares outstanding) per share | $ | 10.10 | $ | 12.14 | $ | 9.76 | $ | 9.91 | ||||||||
Maximum offering price per share NAV/(1–5.75%) | $ | 10.72 | $ | 12.88 | $ | 10.36 | $ | 10.51 | ||||||||
Shares of beneficial interest outstanding, no par value, unlimited authorization | 15,029,556 | 42,873,573 | 1,898,041 | 840,073 | ||||||||||||
Net Assets | $ | 151,867 | $ | 520,337 | $ | 18,523 | $ | 8,324 | ||||||||
| Class B | ||||||||||||||||
Net asset value (net assets/shares outstanding) and offering price per share | $ | 9.15 | $ | — | $ | — | $ | — | ||||||||
Shares of beneficial interest outstanding, no par value, unlimited authorization | 4,831 | — | — | — | ||||||||||||
Net Assets | $ | 44 | $ | — | $ | — | $ | — | ||||||||
| Class C | ||||||||||||||||
Net asset value (net assets/shares outstanding) and offering price per share | $ | 9.09 | $ | 11.87 | $ | 9.59 | $ | 9.87 | ||||||||
Shares of beneficial interest outstanding, no par value, unlimited authorization | 22,668,315 | 62,902,674 | 2,333,491 | 1,495,125 | ||||||||||||
Net Assets | $ | 206,159 | $ | 746,390 | $ | 22,376 | $ | 14,761 | ||||||||
| Class I | ||||||||||||||||
Net asset value (net assets/shares outstanding) and offering price per share | $ | 10.27 | $ | 12.19 | $ | 9.79 | $ | 9.92 | ||||||||
Shares of beneficial interest outstanding, no par value, unlimited authorization | 25,291,601 | 48,769,639 | 1,633,329 | 1,526,603 | ||||||||||||
Net Assets | $ | 259,770 | $ | 594,460 | $ | 15,998 | $ | 15,148 | ||||||||
| Class R6 | ||||||||||||||||
Net asset value (net assets/shares outstanding) and offering price per share | $ | 10.28 | $ | 12.20 | $ | — | $ | — | ||||||||
Shares of beneficial interest outstanding, no par value, unlimited authorization | 8,980 | 7,263 | — | — | ||||||||||||
Net Assets | $ | 92 | $ | 89 | $ | — | $ | — | ||||||||
(1) Investment in securities at cost | $ | 606,258 | $ | 1,828,798 | $ | 53,146 | $ | 43,041 | ||||||||
(2) Proceeds from securities sold short | $ | 155,502 | $ | — | $ | — | $ | — | ||||||||
(3) Amount is less than $500. | ||||||||||||||||
See Notes to Financial Statements
47
Table of Contents
VIRTUS OPPORTUNITIES TRUST
STATEMENTS OF ASSETS AND LIABILITIES (Continued)
SEPTEMBER 30, 2015
(Reported in thousands except shares and per share amounts)
|
|
|
| |||||
| Multi-Asset Trend Fund | Sector Trend Fund | |||||||
| Assets | ||||||||
Investment in unaffiliated securities at value(1) | $ | 259,756 | $ | 534,671 | ||||
Receivables | ||||||||
Investment securities sold | 9,916 | — | ||||||
Fund shares sold | 314 | 745 | ||||||
Dividends and interest receivable | 70 | 155 | ||||||
Prepaid trustee retainer | 2 | 4 | ||||||
Prepaid expenses | 32 | 135 | ||||||
|
|
|
| |||||
Total assets | 270,090 | 535,710 | ||||||
|
|
|
| |||||
| Liabilities | ||||||||
Payables | ||||||||
Fund shares repurchased | 1,638 | 1,754 | ||||||
Investment advisory fees | 229 | 203 | ||||||
Distribution and service fees | 130 | 206 | ||||||
Administration fees | 28 | 55 | ||||||
Transfer agent fees and expenses | 60 | 145 | ||||||
Trustees’ fees and expenses | 1 | 1 | ||||||
Professional fees | 18 | 19 | ||||||
Other accrued expenses | 21 | 35 | ||||||
|
|
|
| |||||
Total liabilities | 2,125 | 2,418 | ||||||
|
|
|
| |||||
| Net Assets | $ | 267,965 | $ | 533,292 | ||||
|
|
|
| |||||
| Net Assets Consist of: | ||||||||
Capital paid in on shares of beneficial interest | $ | 298,820 | $ | 582,797 | ||||
Accumulated undistributed net investment income (loss) | (2,581 | ) | 1,513 | |||||
Accumulated undistributed net realized gain (loss) | (30,125 | ) | (47,922 | ) | ||||
Net unrealized appreciation (depreciation) on investments | 1,851 | (3,096 | ) | |||||
|
|
|
| |||||
| Net Assets | $ | 267,965 | $ | 533,292 | ||||
|
|
|
| |||||
| Class A | ||||||||
Net asset value (net assets/shares outstanding) per share | $ | 9.94 | $ | 11.00 | ||||
Maximum offering price per share NAV/(1–5.75%) | $ | 10.55 | $ | 11.67 | ||||
Shares of beneficial interest outstanding, no par value, unlimited authorization | 5,552,953 | 14,257,268 | ||||||
Net Assets | $ | 55,214 | $ | 156,759 | ||||
| Class C | ||||||||
Net asset value (net assets/shares outstanding) and offering price per share | $ | 9.80 | $ | 10.76 | ||||
Shares of beneficial interest outstanding, no par value, unlimited authorization | 14,204,285 | 19,197,935 | ||||||
Net Assets | $ | 139,223 | $ | 206,556 | ||||
| Class I | ||||||||
Net asset value (net assets/shares outstanding) and offering price per share | $ | 9.99 | $ | 11.02 | ||||
Shares of beneficial interest outstanding, no par value, unlimited authorization | 7,363,867 | 15,426,427 | ||||||
Net Assets | $ | 73,528 | $ | 169,977 | ||||
(1) Investment in securities at cost | $ | 257,905 | $ | 537,768 | ||||
See Notes to Financial Statements
48
Table of Contents
STATEMENTS OF OPERATIONS
YEAR ENDED SEPTEMBER 30, 2015
($ reported in thousands)
|
|
|
|
|
|
|
| |||||||||
| Alternatives Diversifier Fund | Disciplined Equity Style Fund | Disciplined Select Bond Fund | Disciplined Select Country Fund | |||||||||||||
| Investment Income | ||||||||||||||||
Dividends | $ | 235 | $ | 38 | $ | 30 | $ | 49 | ||||||||
Dividends from affiliated funds | 2,410 | — | — | — | ||||||||||||
|
|
|
|
|
|
|
| |||||||||
Total investment income | 2,645 | 38 | 30 | 49 | ||||||||||||
|
|
|
|
|
|
|
| |||||||||
| Expenses | ||||||||||||||||
Investment advisory fees | — | 34 | 12 | 17 | ||||||||||||
Service fees, Class A | 84 | 3 | 1 | 1 | ||||||||||||
Distribution and service fees, Class C | 332 | 11 | 2 | 2 | ||||||||||||
Administration fees | 132 | 4 | 1 | 1 | ||||||||||||
Transfer agent fees and expenses | 202 | 4 | 1 | 1 | ||||||||||||
Registration fees | 46 | 39 | 39 | 39 | ||||||||||||
Printing fees and expenses | 13 | 1 | 1 | 1 | ||||||||||||
Custodian fees | 2 | 1 | 1 | 1 | ||||||||||||
Professional fees | 23 | 18 | 18 | 18 | ||||||||||||
Trustees’ fees and expenses | 5 | — | (1) | — | (1) | — | (1) | |||||||||
Miscellaneous expenses | 7 | 1 | 2 | 2 | ||||||||||||
|
|
|
|
|
|
|
| |||||||||
Total expenses | 846 | 116 | 78 | 83 | ||||||||||||
Less expenses reimbursed and/or waived by investment adviser | — | (57 | ) | (58 | ) | (58 | ) | |||||||||
|
|
|
|
|
|
|
| |||||||||
Net expenses | 846 | 59 | 20 | 25 | ||||||||||||
|
|
|
|
|
|
|
| |||||||||
Net investment income (loss) | 1,799 | (21 | ) | 10 | 24 | |||||||||||
|
|
|
|
|
|
|
| |||||||||
| Net Realized and Unrealized Gain (Loss) on Investments | ||||||||||||||||
Net realized gain (loss) on unaffiliated investments | (3,866 | ) | (293 | ) | (75 | ) | (110 | ) | ||||||||
Net realized gain (loss) on affiliated investments | 3,355 | — | — | — | ||||||||||||
Capital gain distributions from affiliated funds | 911 | — | — | — | ||||||||||||
Net increase from payments by affiliate(2) | — | — | 22 | 4 | ||||||||||||
Net change in unrealized appreciation (depreciation) on unaffiliated investments | (5,718 | ) | 58 | (4 | ) | (73 | ) | |||||||||
Net change in unrealized appreciation (depreciation) on affiliated investments | (6,791 | ) | — | — | — | |||||||||||
|
|
|
|
|
|
|
| |||||||||
| Net gain (loss) on investments | (12,109 | ) | (235 | ) | (57 | ) | (179 | ) | ||||||||
|
|
|
|
|
|
|
| |||||||||
Net increase (decrease) in net assets resulting from operations | $ | (10,310 | ) | $ | (256 | ) | $ | (47 | ) | $ | (155 | ) | ||||
|
|
|
|
|
|
|
| |||||||||
(1) Amount is less than $500.
(2) See Note 3I in the Notes to Financial Statements.
See Notes to Financial Statements
49
Table of Contents
VIRTUS OPPORTUNITIES TRUST
STATEMENTS OF OPERATIONS (Continued)
YEAR ENDED SEPTEMBER 30, 2015
($ reported in thousands)
|
|
|
|
|
|
|
| |||||||||
| Dynamic Trend Fund | Equity Trend Fund | Global Equity Trend Fund | Herzfeld Fund | |||||||||||||
| Investment Income | ||||||||||||||||
Dividends | $ | 13,354 | $ | 62,297 | $ | 1,924 | $ | 1,516 | ||||||||
Security lending | — | 32 | — | — | ||||||||||||
Foreign taxes withheld | — | (21 | ) | — | — | |||||||||||
|
|
|
|
|
|
|
| |||||||||
Total investment income | 13,354 | 62,308 | 1,924 | 1,516 | ||||||||||||
|
|
|
|
|
|
|
| |||||||||
| Expenses | ||||||||||||||||
Investment advisory fees | 4,975 | (2) | 48,367 | 1,406 | 319 | |||||||||||
Service fees, Class A | 862 | 3,044 | 103 | 21 | ||||||||||||
Distribution and service fees, Class B | 1 | — | — | — | ||||||||||||
Distribution and service fees, Class C | 3,635 | 13,843 | 452 | 136 | ||||||||||||
Administration fees | 1,662 | 5,346 | 155 | 38 | ||||||||||||
Transfer agent fees and expenses | 1,770 | 5,397 | 183 | 38 | ||||||||||||
Interest expense | 605 | — | — | — | ||||||||||||
Registration fees | 174 | 375 | 59 | 41 | ||||||||||||
Printing fees and expenses | 104 | 320 | 11 | 4 | ||||||||||||
Custodian fees | 23 | 126 | 4 | 1 | ||||||||||||
Professional fees | 58 | 129 | 23 | 25 | ||||||||||||
Trustees’ fees and expenses | 119 | 381 | 11 | 1 | ||||||||||||
Miscellaneous expenses | 100 | 291 | 11 | 3 | ||||||||||||
|
|
|
|
|
|
|
| |||||||||
Total expenses | 14,088 | 77,619 | 2,418 | 627 | ||||||||||||
|
|
|
|
|
|
|
| |||||||||
Dividends on short sales | 5,940 | — | — | — | ||||||||||||
Interest expense on short sales | 775 | — | — | — | ||||||||||||
|
|
|
|
|
|
|
| |||||||||
Total expenses, including dividends and interest expense on short sales | 20,803 | 77,619 | 2,418 | 627 | ||||||||||||
|
|
|
|
|
|
|
| |||||||||
Less expenses reimbursed and/or waived by investment adviser | — | — | (7 | ) | (40 | ) | ||||||||||
|
|
|
|
|
|
|
| |||||||||
Net expenses | 20,803 | 77,619 | 2,411 | 587 | ||||||||||||
|
|
|
|
|
|
|
| |||||||||
Net investment income (loss) | (7,449 | ) | (15,311 | ) | (487 | ) | 929 | |||||||||
|
|
|
|
|
|
|
| |||||||||
| Net Realized and Unrealized Gain (Loss) on Investments | ||||||||||||||||
Net realized gain (loss) on unaffiliated investments | 156,390 | 179,217 | (8,221 | ) | (398 | ) | ||||||||||
Net realized gain (loss) on foreign currency transactions | — | (1) | — | — | — | |||||||||||
Net realized gain (loss) on securities sold short | (81,135 | ) | — | — | — | |||||||||||
Capital gain distributions from underlying funds | — | — | — | 616 | ||||||||||||
Net change in unrealized appreciation (depreciation) on investments | (262,270 | ) | (738,910 | ) | (10,115 | ) | (4,845 | ) | ||||||||
Net change in unrealized appreciation (depreciation) on securities sold short | 10,846 | — | — | — | ||||||||||||
|
|
|
|
|
|
|
| |||||||||
| Net gain (loss) on investments | (176,169 | ) | (559,693 | ) | (18,336 | ) | (4,627 | ) | ||||||||
|
|
|
|
|
|
|
| |||||||||
Net increase (decrease) in net assets resulting from operations | $ | (183,618 | ) | $ | (575,004 | ) | $ | (18,823 | ) | $ | (3,698 | ) | ||||
|
|
|
|
|
|
|
| |||||||||
(1) Amount is less than $500.
(2) Includes $(16,501) related to a performance fee adjustment. See Note 3A.
See Notes to Financial Statements
50
Table of Contents
VIRTUS OPPORTUNITIES TRUST
STATEMENTS OF OPERATIONS (Continued)
YEAR ENDED SEPTEMBER 30, 2015
($ reported in thousands)
|
|
|
| |||||
| Multi-Asset Trend Fund | Sector Trend Fund | |||||||
| Investment Income | ||||||||
Dividends | $ | 7,576 | $ | 11,095 | ||||
Security lending | — | 4 | ||||||
Foreign taxes withheld | (1 | ) | (1 | ) | ||||
|
|
|
| |||||
Total investment income | 7,575 | 11,098 | ||||||
|
|
|
| |||||
| Expenses | ||||||||
Investment advisory fees | 5,544 | 3,603 | ||||||
Service fees, Class A | 253 | 668 | ||||||
Distribution and service fees, Class C | 2,379 | 2,742 | ||||||
Administration fees | 616 | 959 | ||||||
Transfer agent fees and expenses | 631 | 1,041 | ||||||
Registration fees | 99 | 42 | ||||||
Printing fees and expenses | 41 | 68 | ||||||
Custodian fees | 9 | 17 | ||||||
Professional fees | 32 | 42 | ||||||
Trustees’ fees and expenses | 44 | 68 | ||||||
Miscellaneous expenses | 34 | 47 | ||||||
|
|
|
| |||||
Total expenses | 9,682 | 9,297 | ||||||
Less expenses reimbursed and/or waived by investment adviser | (19 | ) | — | |||||
|
|
|
| |||||
Net expenses | 9,663 | 9,297 | ||||||
|
|
|
| |||||
Net investment income (loss) | (2,088 | ) | 1,801 | |||||
|
|
|
| |||||
| Net Realized and Unrealized Gain (Loss) on Investments | ||||||||
Net realized gain (loss) on investments | (20,719 | ) | 94,402 | |||||
Capital gain distributions from underlying funds | 43 | — | ||||||
Net change in unrealized appreciation (depreciation) on investments | (21,205 | ) | (139,165 | ) | ||||
|
|
|
| |||||
| Net gain (loss) on investments | (41,881 | ) | (44,763 | ) | ||||
|
|
|
| |||||
Net increase (decrease) in net assets resulting from operations | $ | (43,969 | ) | $ | (42,962 | ) | ||
|
|
|
| |||||
(1) Amount is less than $500.
See Notes to Financial Statements
51
Table of Contents
STATEMENTS OF CHANGES IN NET ASSETS
($ reported in thousands)
|
|
|
| |||||||||||||
| Alternatives Diversifier Fund | Disciplined Equity Style Fund | |||||||||||||||
| Year Ended September 30, 2015 | Year Ended September 30, 2014 | Year Ended September 30, 2015 | Year Ended September 30, 2014 | |||||||||||||
| INCREASE/(DECREASE) IN NET ASSETS | ||||||||||||||||
| From Operations | ||||||||||||||||
Net investment income (loss) | $ | 1,799 | $ | 2,116 | $ | (21 | ) | $ | (10 | ) | ||||||
Net realized gain (loss) | 400 | 3,565 | (293 | ) | 423 | |||||||||||
Net change in unrealized appreciation (depreciation) | (12,509 | ) | 2,712 | 58 | (215 | ) | ||||||||||
|
|
|
|
|
|
|
| |||||||||
| Increase (decrease) in net assets resulting from operations | (10,310 | ) | 8,393 | (256 | ) | 198 | ||||||||||
|
|
|
|
|
|
|
| |||||||||
| From Distributions to Shareholders | ||||||||||||||||
Net investment income, Class A | (652 | ) | (549 | ) | — | — | ||||||||||
Net investment income, Class C | (386 | ) | (21 | ) | — | — | ||||||||||
Net investment income, Class I | (977 | ) | (1,358 | ) | — | — | ||||||||||
Net investment income, Class R6 | (— | ) | — | — | — | |||||||||||
Net realized short-term gains, Class A | — | — | (117 | ) | (22 | ) | ||||||||||
Net realized short-term gains, Class C | — | — | (83 | ) | (15 | ) | ||||||||||
Net realized short-term gains, Class I | — | — | (210 | ) | (63 | ) | ||||||||||
Net realized long-term gains, Class A | — | — | (1 | ) | — | |||||||||||
Net realized long-term gains, Class C | — | — | — | (1) | — | |||||||||||
Net realized long-term gains, Class I | — | — | (2 | ) | — | |||||||||||
|
|
|
|
|
|
|
| |||||||||
| Decrease in net assets from distributions to shareholders | (2,015 | ) | (1,928 | ) | (413 | ) | (100 | ) | ||||||||
|
|
|
|
|
|
|
| |||||||||
| From Share Transactions (See Note 5) | ||||||||||||||||
Change in net assets from share transactions, Class A | (9,920 | ) | (14,109 | ) | 1,372 | 242 | ||||||||||
Change in net assets from share transactions, Class C | (8,585 | ) | (8,314 | ) | 1,397 | 51 | ||||||||||
Change in net assets from share transactions, Class I | (12,643 | ) | (66,597 | ) | 212 | 63 | ||||||||||
|
|
|
|
|
|
|
| |||||||||
| Increase (decrease) in net assets from share transactions | (31,148 | ) | (89,020 | ) | 2,981 | 356 | ||||||||||
|
|
|
|
|
|
|
| |||||||||
| Net increase (decrease) in net assets | (43,473 | ) | (82,555 | ) | 2,312 | 454 | ||||||||||
| Net Assets | ||||||||||||||||
Beginning of fiscal year | 125,030 | 207,585 | 2,029 | 1,575 | ||||||||||||
|
|
|
|
|
|
|
| |||||||||
| End of fiscal year | $ | 81,557 | $ | 125,030 | $ | 4,341 | $ | 2,029 | ||||||||
|
|
|
|
|
|
|
| |||||||||
Accumulated undistributed net investment income (loss) at end of fiscal year | $ | 411 | $ | 794 | $ | (20 | ) | $ | — | |||||||
(1) Amount is less than $500.
See Notes to Financial Statements
52
Table of Contents
VIRTUS OPPORTUNITIES TRUST
STATEMENTS OF CHANGES IN NET ASSETS (Continued)
($ reported in thousands)
|
|
|
| |||||||||||||
| Disciplined Select Bond Fund | Disciplined Select Country Fund | |||||||||||||||
| Year Ended September 30, 2015 | Year Ended September 30, 2014 | Year Ended September 30, 2015 | Year Ended September 30, 2014 | |||||||||||||
| INCREASE/(DECREASE) IN NET ASSETS | ||||||||||||||||
| From Operations | ||||||||||||||||
Net investment income (loss) | $ | 10 | $ | 23 | $ | 24 | $ | 21 | ||||||||
Net realized gain (loss) | (53 | ) | (4 | ) | (106 | ) | 70 | |||||||||
Net change in unrealized appreciation (depreciation) | (4 | ) | 19 | (73 | ) | (100 | ) | |||||||||
|
|
|
|
|
|
|
| |||||||||
| Increase (decrease) in net assets resulting from operations | (47 | ) | 38 | (155 | ) | (9 | ) | |||||||||
|
|
|
|
|
|
|
| |||||||||
| From Distributions to Shareholders | ||||||||||||||||
Net investment income, Class A | (3 | ) | (3 | ) | (7 | ) | (1 | ) | ||||||||
Net investment income, Class C | (— | )(1) | (2 | ) | (2 | ) | — | |||||||||
Net investment income, Class I | (6 | ) | (17 | ) | (25 | ) | (10 | ) | ||||||||
Net realized short-term gains, Class A | — | — | — | (2 | ) | |||||||||||
Net realized short-term gains, Class C | — | — | — | (1 | ) | |||||||||||
Net realized short-term gains, Class I | — | — | — | (8 | ) | |||||||||||
Net realized long-term gains, Class A | — | — | (16 | ) | — | |||||||||||
Net realized long-term gains, Class C | — | — | (8 | ) | — | |||||||||||
Net realized long-term gains, Class I | — | — | (54 | ) | — | |||||||||||
|
|
|
|
|
|
|
| |||||||||
| Decrease in net assets from distributions to shareholders | (9 | ) | (22 | ) | (112 | ) | (22 | ) | ||||||||
|
|
|
|
|
|
|
| |||||||||
| From Share Transactions (See Note 5) | ||||||||||||||||
Change in net assets from share transactions, Class A | 418 | (53 | ) | (2 | ) | 139 | ||||||||||
Change in net assets from share transactions, Class C | 69 | 25 | 29 | 46 | ||||||||||||
Change in net assets from share transactions, Class I | 6 | 17 | 38 | 95 | ||||||||||||
|
|
|
|
|
|
|
| |||||||||
| Increase (decrease) in net assets from share transactions | 493 | (11 | ) | 65 | 280 | |||||||||||
|
|
|
|
|
|
|
| |||||||||
| Net increase (decrease) in net assets | 437 | 5 | (202 | ) | 249 | |||||||||||
| Net Assets | ||||||||||||||||
Beginning of fiscal year | 1,042 | 1,037 | 1,442 | 1,193 | ||||||||||||
|
|
|
|
|
|
|
| |||||||||
| End of fiscal year | $ | 1,479 | $ | 1,042 | $ | 1,240 | $ | 1,442 | ||||||||
|
|
|
|
|
|
|
| |||||||||
Accumulated undistributed net investment income (loss) at end of fiscal year | $ | 1 | $ | 1 | $ | 4 | $ | 14 | ||||||||
(1) Amount is less than $500.
See Notes to Financial Statements
53
Table of Contents
VIRTUS OPPORTUNITIES TRUST
STATEMENTS OF CHANGES IN NET ASSETS (Continued)
($ reported in thousands)
|
|
|
| |||||||||||||
| Dynamic Trend Fund | Equity Trend Fund | |||||||||||||||
| Year Ended September 30, 2015 | Year Ended September 30, 2014 | Year Ended September 30, 2015 | Year Ended September 30, 2014 | |||||||||||||
| INCREASE/(DECREASE) IN NET ASSETS | ||||||||||||||||
| From Operations | ||||||||||||||||
Net investment income (loss) | $ | (7,449 | ) | $ | (4,830 | ) | $ | (15,311 | ) | $ | 21,879 | |||||
Net realized gain (loss) | 75,255 | 154,804 | 179,217 | 999,509 | ||||||||||||
Net change in unrealized appreciation (depreciation) | (251,424 | ) | 116,010 | (738,910 | ) | (48,648 | ) | |||||||||
|
|
|
|
|
|
|
| |||||||||
| Increase (decrease) in net assets resulting from operations | (183,618 | ) | 265,984 | (575,004 | ) | 972,740 | ||||||||||
|
|
|
|
|
|
|
| |||||||||
| From Distributions to Shareholders | ||||||||||||||||
Net investment income, Class A | — | — | (816 | ) | (6,111 | ) | ||||||||||
Net investment income, Class C | — | — | — | |||||||||||||
Net investment income, Class I | — | — | (4,384 | ) | (15,369 | ) | ||||||||||
Net investment income, Class R6 | — | (— | )(1) | — | ||||||||||||
Net realized short-term gains, Class A | (7,936 | ) | — | (96,936 | ) | (42,252 | ) | |||||||||
Net realized short-term gains, Class B | (2 | ) | — | — | — | |||||||||||
Net realized short-term gains, Class C | (8,222 | ) | — | (98,311 | ) | (29,718 | ) | |||||||||
Net realized short-term gains, Class I | (17,766 | ) | — | (160,323 | ) | (56,898 | ) | |||||||||
Net realized short-term gains, Class R6 | (2 | ) | — | (5 | ) | — | ||||||||||
Net realized long-term gains, Class A | (67,402 | ) | — | (286,197 | ) | (16,551 | ) | |||||||||
Net realized long-term gains, Class B | (15 | ) | — | — | — | |||||||||||
Net realized long-term gains, Class C | (69,944 | ) | — | (289,362 | ) | (11,641 | ) | |||||||||
Net realized long-term gains, Class I | (150,789 | ) | — | (473,696 | ) | (22,288 | ) | |||||||||
Net realized long-term gains, Class R6 | (13 | ) | — | (15 | ) | — | ||||||||||
|
|
|
|
|
|
|
| |||||||||
| Decrease in net assets from distributions to shareholders | (322,091 | ) | — | (1,410,045 | ) | (200,828 | ) | |||||||||
|
|
|
|
|
|
|
| |||||||||
| From Share Transactions (See Note 5) | ||||||||||||||||
Change in net assets from share transactions, Class A | (447,390 | ) | (45,309 | ) | (984,779 | ) | (150,111 | ) | ||||||||
Change in net assets from share transactions, Class B | (73 | ) | (4 | ) | — | — | ||||||||||
Change in net assets from share transactions, Class C | (216,653 | ) | 240,321 | (668,784 | ) | 508,692 | ||||||||||
Change in net assets from share transactions, Class I | (930,551 | ) | 588,058 | (2,373,748 | ) | 917,705 | ||||||||||
Change in net assets from share transactions, Class R6 | 114 | — | 120 | — | ||||||||||||
|
|
|
|
|
|
|
| |||||||||
| Increase (decrease) in net assets from share transactions | (1,594,553 | ) | 783,066 | (4,027,191 | ) | 1,276,286 | ||||||||||
|
|
|
|
|
|
|
| |||||||||
| Net increase (decrease) in net assets | (2,100,262 | ) | 1,049,050 | (6,012,240 | ) | 2,048,198 | ||||||||||
| Net Assets | ||||||||||||||||
Beginning of fiscal year | 2,718,194 | 1,669,144 | 7,873,516 | 5,825,318 | ||||||||||||
|
|
|
|
|
|
|
| |||||||||
| End of fiscal year | $ | 617,932 | $ | 2,718,194 | $ | 1,861,276 | $ | 7,873,516 | ||||||||
|
|
|
|
|
|
|
| |||||||||
Accumulated undistributed net investment income (loss) at end of fiscal year | $ | — | (1) | $ | — | $ | (8,830 | ) | $ | 6,248 | ||||||
(1) Amount is less than $500.
See Notes to Financial Statements
54
Table of Contents
VIRTUS OPPORTUNITIES TRUST
STATEMENTS OF CHANGES IN NET ASSETS (Continued)
($ reported in thousands)
|
|
|
| |||||||||||||
| Global Equity Trend Fund | Herzfeld Fund | |||||||||||||||
| Year Ended September 30, 2015 | Year Ended September 30, 2014 | Year Ended September 30, 2015 | Year Ended September 30, 2014 | |||||||||||||
| INCREASE/(DECREASE) IN NET ASSETS | ||||||||||||||||
| From Operations | ||||||||||||||||
Net investment income (loss) | $ | (487 | ) | $ | 834 | $ | 929 | $ | 442 | |||||||
Net realized gain (loss) | (8,221 | ) | 15,899 | 218 | 546 | |||||||||||
Net change in unrealized appreciation (depreciation) | (10,115 | ) | (3,898 | ) | (4,845 | ) | 709 | |||||||||
|
|
|
|
|
|
|
| |||||||||
| Increase (decrease) in net assets resulting from operations | (18,823 | ) | 12,835 | (3,698 | ) | 1,697 | ||||||||||
|
|
|
|
|
|
|
| |||||||||
| From Distributions to Shareholders | ||||||||||||||||
Net investment income, Class A | (271 | ) | (129 | ) | (283 | ) | (182 | ) | ||||||||
Net investment income, Class C | — | — | (365 | ) | (209 | ) | ||||||||||
Net investment income, Class I | (467 | ) | (179 | ) | (414 | ) | (86 | ) | ||||||||
Net realized short-term gains, Class A | (1,492 | ) | (1,574 | ) | (122 | ) | (20 | ) | ||||||||
Net realized short-term gains, Class C | (1,771 | ) | (1,227 | ) | (166 | ) | (37 | ) | ||||||||
Net realized short-term gains, Class I | (1,788 | ) | (1,115 | ) | (74 | ) | (12 | ) | ||||||||
Net realized long-term gains, Class A | (3,944 | ) | (123 | ) | (104 | ) | (8 | ) | ||||||||
Net realized long-term gains, Class C | (4,687 | ) | (96 | ) | (143 | ) | (15 | ) | ||||||||
Net realized long-term gains, Class I | (4,759 | ) | (87 | ) | (69 | ) | (5 | ) | ||||||||
|
|
|
|
|
|
|
| |||||||||
| Decrease in net assets from distributions to shareholders | (19,179 | ) | (4,530 | ) | (1,740 | ) | (574 | ) | ||||||||
|
|
|
|
|
|
|
| |||||||||
| From Share Transactions (See Note 5) | ||||||||||||||||
Change in net assets from share transactions, Class A | (45,890 | ) | 15,714 | 428 | 5,951 | |||||||||||
Change in net assets from share transactions, Class C | (36,615 | ) | 25,459 | 6,251 | 5,063 | |||||||||||
Change in net assets from share transactions, Class I | (70,130 | ) | 58,239 | 13,715 | 1,516 | |||||||||||
|
|
|
|
|
|
|
| |||||||||
| Increase (decrease) in net assets from share transactions | (152,635 | ) | 99,412 | 20,394 | 12,530 | |||||||||||
|
|
|
|
|
|
|
| |||||||||
| Net increase (decrease) in net assets | (190,637 | ) | 107,717 | 14,956 | 13,653 | |||||||||||
| Net Assets | ||||||||||||||||
Beginning of fiscal year | 247,534 | 139,817 | 23,277 | 9,624 | ||||||||||||
|
|
|
|
|
|
|
| |||||||||
| End of fiscal year | $ | 56,897 | $ | 247,534 | $ | 38,233 | $ | 23,277 | ||||||||
|
|
|
|
|
|
|
| |||||||||
Accumulated undistributed net investment income (loss) at end of fiscal year | $ | (698 | ) | $ | 526 | $ | — | $ | 6 | |||||||
See Notes to Financial Statements
55
Table of Contents
VIRTUS OPPORTUNITIES TRUST
STATEMENTS OF CHANGES IN NET ASSETS (Continued)
($ reported in thousands)
|
|
|
| |||||||||||||
| Multi-Asset Trend Fund | Sector Trend Fund | |||||||||||||||
| Year Ended September 30, 2015 | Year Ended September 30, 2014 | Year Ended September 30, 2015 | Year Ended September 30, 2014 | |||||||||||||
| INCREASE/(DECREASE) IN NET ASSETS | ||||||||||||||||
| From Operations | ||||||||||||||||
Net investment income (loss) | $ | (2,088 | ) | $ | 4,432 | $ | 1,801 | $ | 6,966 | |||||||
Net realized gain (loss) | (20,676 | ) | 56,144 | 94,402 | 79,066 | |||||||||||
Net change in unrealized appreciation (depreciation) | (21,205 | ) | (18,719 | ) | (139,165 | ) | 37,708 | |||||||||
|
|
|
|
|
|
|
| |||||||||
| Increase (decrease) in net assets resulting from operations | (43,969 | ) | 41,857 | (42,962 | ) | 123,740 | ||||||||||
|
|
|
|
|
|
|
| |||||||||
| From Distributions to Shareholders | ||||||||||||||||
Net investment income, Class A | (516 | ) | (790 | ) | (1,055 | ) | (2,909 | ) | ||||||||
Net investment income, Class C | — | — | (406 | ) | (577 | ) | ||||||||||
Net investment income, Class I | (1,292 | ) | (2,285 | ) | (1,161 | ) | (2,482 | ) | ||||||||
Net realized short-term gains, Class A | (3,223 | ) | (1,344 | ) | (13,616 | ) | (8,366 | ) | ||||||||
Net realized short-term gains, Class C | (7,394 | ) | (2,898 | ) | (13,013 | ) | (7,087 | ) | ||||||||
Net realized short-term gains, Class I | (6,241 | ) | (2,928 | ) | (12,582 | ) | (5,701 | ) | ||||||||
Net realized long-term gains, Class A | (7,765 | ) | (213 | ) | (59,091 | ) | (10,147 | ) | ||||||||
Net realized long-term gains, Class C | (17,829 | ) | (460 | ) | (56,735 | ) | (8,594 | ) | ||||||||
Net realized long-term gains, Class I | (15,105 | ) | (465 | ) | (54,658 | ) | (6,915 | ) | ||||||||
|
|
|
|
|
|
|
| |||||||||
| Decrease in net assets from distributions to shareholders | (59,365 | ) | (11,383 | ) | (212,317 | ) | (52,778 | ) | ||||||||
|
|
|
|
|
|
|
| |||||||||
| From Share Transactions (See Note 5) | ||||||||||||||||
Change in net assets from share transactions, Class A | (68,771 | ) | 22,647 | (72,892 | ) | 30,534 | ||||||||||
Change in net assets from share transactions, Class C | (146,112 | ) | 89,286 | (2,219 | ) | 54,832 | ||||||||||
Change in net assets from share transactions, Class I | (206,162 | ) | 55,797 | (62,196 | ) | 121,101 | ||||||||||
|
|
|
|
|
|
|
| |||||||||
| Increase (decrease) in net assets from share transactions | (421,045 | ) | 167,730 | (137,307 | ) | 206,467 | ||||||||||
|
|
|
|
|
|
|
| |||||||||
| Net increase (decrease) in net assets | (524,379 | ) | 198,204 | (392,586 | ) | 277,429 | ||||||||||
| Net Assets | ||||||||||||||||
Beginning of fiscal year | 792,344 | 594,140 | 925,878 | 648,449 | ||||||||||||
|
|
|
|
|
|
|
| |||||||||
| End of fiscal year | $ | 267,965 | $ | 792,344 | $ | 533,292 | $ | 925,878 | ||||||||
|
|
|
|
|
|
|
| |||||||||
Accumulated undistributed net investment income (loss) at end of fiscal year | $ | (2,581 | ) | $ | 1,359 | $ | 1,513 | $ | 2,325 | |||||||
See Notes to Financial Statements
56
Table of Contents
FINANCIAL HIGHLIGHTS
SELECTED PER SHARE DATA AND RATIOS FOR A SHARE OUTSTANDING
THROUGHOUT EACH PERIOD
| Net Asset Value, Beginning of Period | Net Investment Income (Loss)(2) | Capital Gains Distributions Received from Affiliated Funds(2) | Net Realized and Unrealized Gain (Loss) | Total from Investment Operations | Dividends from Net Investment Income | Distributions from Net Realized Gains | Total Distributions | Change in Net Asset Value | Net Asset Value, End of Period | Total Return(1) | Net Assets, End of Period (in thousands) | Ratio of Net Expenses to Average Net Assets(8) | Ratio of Gross Expenses to Average Net Assets (before waivers and reimbursements)(8) | Ratio of Net Investment Income (Loss) to Average Net Assets | Portfolio Turnover Rate | ||||||||||||||||||||||||||||||||||||||||||||||||||||||||||||||||||
| Alternatives | ||||||||||||||||||||||||||||||||||||||||||||||||||||||||||||||||||||||||||||||||||
Diversifier Fund | ||||||||||||||||||||||||||||||||||||||||||||||||||||||||||||||||||||||||||||||||||
Class A | ||||||||||||||||||||||||||||||||||||||||||||||||||||||||||||||||||||||||||||||||||
10/1/14 to 9/30/15 | $ | 11.31 | 0.19 | 0.09 | (1.39 | ) | (1.11 | ) | (0.21 | ) | — | (0.21 | ) | (1.32 | ) | $ | 9.99 | (10.02 | )% | $ | 25,377 | 0.64 | % | 0.64 | % | 1.77 | % | 46 | % | |||||||||||||||||||||||||||||||||||||||||||||||||||||
10/1/13 to 9/30/14 | 10.97 | 0.15 | 0.07 | 0.25 | 0.47 | (0.13 | ) | — | (0.13 | ) | 0.34 | 11.31 | 4.28 | 39,076 | 0.65 | 0.65 | 1.32 | 27 | ||||||||||||||||||||||||||||||||||||||||||||||||||||||||||||||||
10/1/12 to 9/30/13 | 11.10 | 0.21 | — | (0.13 | ) | 0.08 | (0.21 | ) | — | (0.21 | ) | (0.13 | ) | 10.97 | 0.73 | 51,339 | 0.58 | (7) | 0.63 | 1.93 | 24 | |||||||||||||||||||||||||||||||||||||||||||||||||||||||||||||
10/1/11 to 9/30/12 | 9.68 | 0.10 | — | 1.38 | 1.48 | (0.06 | ) | — | (0.06 | ) | 1.42 | 11.10 | 15.37 | 65,463 | 0.45 | 0.65 | 0.95 | 29 | ||||||||||||||||||||||||||||||||||||||||||||||||||||||||||||||||
10/1/10 to 9/30/11(11) | 10.05 | 0.21 | 0.07 | (0.49 | ) | (0.21 | ) | (0.16 | ) | — | (0.16 | ) | (0.37 | ) | 9.68 | (2.12 | ) | 79,103 | 0.45 | 0.65 | 1.96 | 18 | ||||||||||||||||||||||||||||||||||||||||||||||||||||||||||||
Class C | ||||||||||||||||||||||||||||||||||||||||||||||||||||||||||||||||||||||||||||||||||
10/1/14 to 9/30/15 | $ | 11.21 | 0.11 | 0.09 | (1.39 | ) | (1.19 | ) | (0.12 | ) | — | (0.12 | ) | (1.31 | ) | $ | 9.90 | (10.66 | )% | $ | 25,637 | 1.39 | % | 1.39 | % | 1.02 | % | 46 | % | |||||||||||||||||||||||||||||||||||||||||||||||||||||
10/1/13 to 9/30/14 | 10.83 | 0.07 | 0.07 | 0.25 | 0.39 | (0.01 | ) | — | (0.01 | ) | 0.38 | 11.21 | 3.47 | 38,005 | 1.40 | 1.40 | 0.58 | 27 | ||||||||||||||||||||||||||||||||||||||||||||||||||||||||||||||||
10/1/12 to 9/30/13 | 10.93 | 0.13 | — | (0.13 | ) | — | (0.10 | ) | — | (0.10 | ) | (0.10 | ) | 10.83 | (0.05 | ) | 44,850 | 1.33 | (7) | 1.38 | 1.22 | 24 | ||||||||||||||||||||||||||||||||||||||||||||||||||||||||||||
10/1/11 to 9/30/12 | 9.55 | 0.02 | — | 1.36 | 1.38 | — | — | — | 1.38 | 10.93 | 14.45 | 57,336 | 1.20 | 1.40 | 0.20 | 29 | ||||||||||||||||||||||||||||||||||||||||||||||||||||||||||||||||||
10/1/10 to 9/30/11(11) | 9.95 | 0.13 | 0.07 | (0.48 | ) | (0.28 | ) | (0.12 | ) | — | (0.12 | ) | (0.40 | ) | 9.55 | (2.82 | ) | 66,411 | 1.20 | 1.40 | 1.20 | 18 | ||||||||||||||||||||||||||||||||||||||||||||||||||||||||||||
Class I | ||||||||||||||||||||||||||||||||||||||||||||||||||||||||||||||||||||||||||||||||||
10/1/14 to 9/30/15 | $ | 11.30 | 0.22 | 0.09 | (1.39 | ) | (1.08 | ) | (0.24 | ) | — | (0.24 | ) | (1.32 | ) | $ | 9.98 | (9.77 | )% | $ | 30,543 | 0.39 | % | 0.39 | % | 1.99 | % | 46 | % | |||||||||||||||||||||||||||||||||||||||||||||||||||||
10/1/13 to 9/30/14 | 10.98 | 0.18 | 0.08 | 0.24 | 0.50 | (0.18 | ) | — | (0.18 | ) | 0.32 | 11.30 | 4.52 | 47,949 | 0.40 | 0.40 | 1.56 | 27 | ||||||||||||||||||||||||||||||||||||||||||||||||||||||||||||||||
10/1/12 to 9/30/13 | 11.12 | 0.16 | — | (0.05 | ) | 0.11 | (0.25 | ) | — | (0.25 | ) | (0.14 | ) | 10.98 | 1.00 | 111,396 | 0.36 | (7) | 0.38 | 1.48 | 24 | |||||||||||||||||||||||||||||||||||||||||||||||||||||||||||||
10/1/11 to 9/30/12 | 9.70 | 0.13 | — | 1.38 | 1.51 | (0.09 | ) | — | (0.09 | ) | 1.42 | 11.12 | 15.63 | 37,590 | 0.20 | 0.40 | 1.21 | 29 | ||||||||||||||||||||||||||||||||||||||||||||||||||||||||||||||||
10/1/10 to 9/30/11(11) | 10.06 | 0.23 | 0.06 | (0.48 | ) | (0.19 | ) | (0.17 | ) | — | (0.17 | ) | (0.36 | ) | 9.70 | (1.89 | ) | 36,495 | 0.20 | 0.39 | 2.16 | 18 | ||||||||||||||||||||||||||||||||||||||||||||||||||||||||||||
| Disciplined Equity | ||||||||||||||||||||||||||||||||||||||||||||||||||||||||||||||||||||||||||||||||||
Style Fund | ||||||||||||||||||||||||||||||||||||||||||||||||||||||||||||||||||||||||||||||||||
Class A | ||||||||||||||||||||||||||||||||||||||||||||||||||||||||||||||||||||||||||||||||||
10/1/14 to 9/30/15 | $ | 13.13 | (0.05 | ) | — | 0.21 | 0.16 | — | (2.46 | ) | (2.46 | ) | (2.30 | ) | $ | 10.83 | (0.01 | )% | $ | 1,720 | 1.60 | % | 3.21 | % | (0.45 | )% | 408 | % | ||||||||||||||||||||||||||||||||||||||||||||||||||||||
10/1/13 to 9/30/14 | 12.47 | (0.07 | ) | — | 1.51 | 1.44 | — | (0.78 | ) | (0.78 | ) | 0.66 | 13.13 | 11.77 | 594 | 1.60 | 4.97 | (0.56 | ) | 220 | ||||||||||||||||||||||||||||||||||||||||||||||||||||||||||||||
12/18/12(6) to 9/30/13 | 10.00 | — | — | 2.55 | 2.55 | (0.08 | ) | — | (5) | (0.08 | ) | 2.47 | 12.47 | 25.75 | (4) | 326 | 1.60 | (3) | 7.63 | (3) | 0.02 | (3) | 447 | (4) | ||||||||||||||||||||||||||||||||||||||||||||||||||||||||||
Class C | ||||||||||||||||||||||||||||||||||||||||||||||||||||||||||||||||||||||||||||||||||
10/1/14 to 9/30/15 | $ | 12.95 | (0.14 | ) | — | 0.22 | 0.08 | — | (2.46 | ) | (2.46 | ) | (2.38 | ) | $ | 10.57 | (0.72 | )% | $ | 1,484 | 2.35 | % | 3.87 | % | (1.20 | )% | 408 | % | ||||||||||||||||||||||||||||||||||||||||||||||||||||||
10/1/13 to 9/30/14 | 12.40 | (0.17 | ) | — | 1.50 | 1.33 | — | (0.78 | ) | (0.78 | ) | 0.55 | 12.95 | 10.91 | 300 | 2.35 | 5.76 | (1.32 | ) | 220 | ||||||||||||||||||||||||||||||||||||||||||||||||||||||||||||||
12/18/12(6) to 9/30/13 | 10.00 | (0.05 | ) | — | 2.53 | 2.48 | (0.08 | ) | — | (5) | (0.08 | ) | 2.40 | 12.40 | 25.02 | (4) | 237 | 2.35 | (3) | 8.53 | (3) | (0.51 | )(3) | 447 | (4) | |||||||||||||||||||||||||||||||||||||||||||||||||||||||||
Class I | ||||||||||||||||||||||||||||||||||||||||||||||||||||||||||||||||||||||||||||||||||
10/1/14 to 9/30/15 | $ | 13.19 | (0.04 | ) | — | 0.22 | 0.18 | — | (2.46 | ) | (2.46 | ) | (2.28 | ) | $ | 10.91 | 0.16 | % | $ | 1,137 | 1.35 | % | 3.18 | % | (0.29 | )% | 408 | % | ||||||||||||||||||||||||||||||||||||||||||||||||||||||
10/1/13 to 9/30/14 | 12.49 | (0.04 | ) | — | 1.52 | 1.48 | — | (0.78 | ) | (0.78 | ) | 0.70 | 13.19 | 12.09 | 1,135 | 1.35 | 4.74 | (0.33 | ) | 220 | ||||||||||||||||||||||||||||||||||||||||||||||||||||||||||||||
12/18/12(6) to 9/30/13 | 10.00 | 0.05 | — | 2.52 | 2.57 | (0.08 | ) | — | (5) | (0.08 | ) | 2.49 | 12.49 | 25.96 | (4) | 1,012 | 1.35 | (3) | 7.87 | (3) | 0.59 | (3) | 447 | (4) | ||||||||||||||||||||||||||||||||||||||||||||||||||||||||||
The footnote legend is at the end of the Financial Highlights
See Notes to Financial Statements
57
Table of Contents
VIRTUS OPPORTUNITIES TRUST
FINANCIAL HIGHLIGHTS
SELECTED PER SHARE DATA AND RATIOS FOR A SHARE OUTSTANDING
THROUGHOUT EACH PERIOD
| Net Asset Value, Beginning of Period | Net Investment Income (Loss)(2) | Net Realized and Unrealized Gain (Loss) | Total from Investment Operations | Dividends from Net Investment Income | Distributions from Net Realized Gains | Total Distributions | Change in Net Asset Value | Net Asset Value, End of Period | Total Return(1) | Net Assets, End of Period (in thousands) | Ratio of Net Expenses to Average Net Assets(8) | Ratio of Gross Expenses to Average Net Assets (before waivers and reimbursements)(8) | Ratio of Net Investment Income (Loss) to Average Net Assets | Portfolio Turnover Rate | ||||||||||||||||||||||||||||||||||||||||||||||||||||||||||||||
| Disciplined Select | |||||||||||||||||||||||||||||||||||||||||||||||||||||||||||||||||||||||||||||
Bond Fund | |||||||||||||||||||||||||||||||||||||||||||||||||||||||||||||||||||||||||||||
Class A | |||||||||||||||||||||||||||||||||||||||||||||||||||||||||||||||||||||||||||||
10/1/14 to 9/30/15 | $ | 9.59 | 0.06 | (0.27 | ) | (0.21 | ) | (0.06 | ) | — | (0.06 | ) | (0.27 | ) | $ | 9.32 | (2.25 | )% | $ | 499 | 1.40 | % | 6.16 | % | 0.67 | % | 1,212 | % | |||||||||||||||||||||||||||||||||||||||||||||||||
10/1/13 to 9/30/14 | 9.44 | 0.19 | 0.15 | 0.34 | (0.19 | ) | — | (0.19 | ) | 0.15 | 9.59 | 3.59 | 108 | 1.40 | 7.28 | 2.02 | 1,126 | ||||||||||||||||||||||||||||||||||||||||||||||||||||||||||||
12/18/12(6) to 9/30/13 | 10.00 | 0.11 | (0.57 | ) | (0.46 | ) | (0.10 | ) | — | (0.10 | ) | (0.56 | ) | 9.44 | (4.53 | )(4) | 157 | 1.40 | (3) | 9.27 | (3) | 1.46 | (3) | 401 | (4) | ||||||||||||||||||||||||||||||||||||||||||||||||||||
Class C | |||||||||||||||||||||||||||||||||||||||||||||||||||||||||||||||||||||||||||||
10/1/14 to 9/30/15 | $ | 9.57 | (0.02 | ) | (0.27 | ) | (0.29 | ) | (0.02 | ) | — | (0.02 | ) | (0.31 | ) | $ | 9.26 | (3.02 | )% | $ | 202 | 2.15 | % | 5.62 | % | (0.25 | )% | 1,212 | % | ||||||||||||||||||||||||||||||||||||||||||||||||
10/1/13 to 9/30/14 | 9.44 | 0.11 | 0.15 | 0.26 | (0.13 | ) | — | (0.13 | ) | 0.13 | 9.57 | 2.73 | 140 | 2.15 | 8.57 | 1.19 | 1,126 | ||||||||||||||||||||||||||||||||||||||||||||||||||||||||||||
12/18/12(6) to 9/30/13 | 10.00 | 0.05 | (0.54 | ) | (0.49 | ) | (0.07 | ) | — | (0.07 | ) | (0.56 | ) | 9.44 | (4.95 | )(4) | 114 | 2.15 | (3) | 10.14 | (3) | 0.70 | (3) | 401 | (4) | ||||||||||||||||||||||||||||||||||||||||||||||||||||
Class I | |||||||||||||||||||||||||||||||||||||||||||||||||||||||||||||||||||||||||||||
10/1/14 to 9/30/15 | $ | 9.59 | 0.08 | (0.27 | ) | (0.19 | ) | (0.07 | ) | — | (0.07 | ) | (0.26 | ) | $ | 9.33 | (2.03 | )% | $ | 778 | 1.15 | % | 4.50 | % | 0.86 | % | 1,212 | % | |||||||||||||||||||||||||||||||||||||||||||||||||
10/1/13 to 9/30/14 | 9.45 | 0.21 | 0.14 | 0.35 | (0.21 | ) | — | (0.21 | ) | 0.14 | 9.59 | 3.75 | 794 | 1.15 | 7.35 | 2.22 | 1,126 | ||||||||||||||||||||||||||||||||||||||||||||||||||||||||||||
12/18/12(6) to 9/30/13 | 10.00 | 0.13 | (0.55 | ) | (0.42 | ) | (0.13 | ) | — | (0.13 | ) | (0.55 | ) | 9.45 | (4.28 | )(4) | 766 | 1.15 | (3) | 9.18 | (3) | 1.71 | (3) | 401 | (4) | ||||||||||||||||||||||||||||||||||||||||||||||||||||
| Disciplined Select | |||||||||||||||||||||||||||||||||||||||||||||||||||||||||||||||||||||||||||||
Country Fund | |||||||||||||||||||||||||||||||||||||||||||||||||||||||||||||||||||||||||||||
Class A | |||||||||||||||||||||||||||||||||||||||||||||||||||||||||||||||||||||||||||||
10/1/14 to 9/30/15 | $ | 11.18 | 0.10 | (1.13 | ) | (1.03 | ) | (0.25 | ) | (0.60 | ) | (0.85 | ) | (1.88 | ) | $ | 9.30 | (9.68 | )% | $ | 247 | 1.70 | % | 5.56 | % | 0.96 | % | 579 | % | ||||||||||||||||||||||||||||||||||||||||||||||||
10/1/13 to 9/30/14 | 11.34 | 0.25 | (0.21 | ) | 0.04 | (0.06 | ) | (0.14 | ) | (0.20 | ) | (0.16 | ) | 11.18 | 0.29 | 299 | 1.70 | 6.45 | 2.09 | 217 | |||||||||||||||||||||||||||||||||||||||||||||||||||||||||
12/18/12(6) to 9/30/13 | 10.00 | 0.03 | 1.31 | 1.34 | — | — | — | 1.34 | 11.34 | 13.40 | (4) | 171 | 1.70 | (3) | 8.97 | (3) | 0.38 | (3) | 115 | (4) | |||||||||||||||||||||||||||||||||||||||||||||||||||||||||
Class C | |||||||||||||||||||||||||||||||||||||||||||||||||||||||||||||||||||||||||||||
10/1/14 to 9/30/15 | $ | 11.09 | 0.04 | (1.13 | ) | (1.09 | ) | (0.17 | ) | (0.60 | ) | (0.77 | ) | (1.86 | ) | $ | 9.23 | (10.29 | )% | $ | 151 | 2.45 | % | 6.37 | % | 0.41 | % | 579 | % | ||||||||||||||||||||||||||||||||||||||||||||||||
10/1/13 to 9/30/14 | 11.28 | 0.11 | (0.16 | ) | (0.05 | ) | — | (0.14 | ) | (0.14 | ) | (0.19 | ) | 11.09 | (0.51 | ) | 156 | 2.45 | 7.16 | 0.94 | 217 | ||||||||||||||||||||||||||||||||||||||||||||||||||||||||
12/18/12(6) to 9/30/13 | 10.00 | (0.04 | ) | 1.32 | 1.28 | — | — | — | 1.28 | 11.28 | 12.80 | (4) | 113 | 2.45 | (3) | 9.87 | (3) | (0.55 | )(3) | 115 | (4) | ||||||||||||||||||||||||||||||||||||||||||||||||||||||||
Class I | |||||||||||||||||||||||||||||||||||||||||||||||||||||||||||||||||||||||||||||
10/1/14 to 9/30/15 | $ | 11.21 | 0.20 | (1.20 | ) | (1.00 | ) | (0.28 | ) | (0.60 | ) | (0.88 | ) | (1.88 | ) | $ | 9.33 | (9.43 | )% | $ | 842 | 1.45 | % | 5.13 | % | 1.90 | % | 579 | % | ||||||||||||||||||||||||||||||||||||||||||||||||
10/1/13 to 9/30/14 | 11.37 | 0.19 | (0.12 | ) | 0.07 | (0.09 | ) | (0.14 | ) | (0.23 | ) | (0.16 | ) | 11.21 | 0.48 | 987 | 1.45 | 6.17 | 1.65 | 217 | |||||||||||||||||||||||||||||||||||||||||||||||||||||||||
12/18/12(6) to 9/30/13 | 10.00 | 0.04 | 1.33 | 1.37 | — | — | — | 1.37 | 11.37 | 13.70 | (4) | 909 | 1.45 | (3) | 8.87 | (3) | 0.46 | (3) | 115 | (4) | |||||||||||||||||||||||||||||||||||||||||||||||||||||||||
The footnote legend is at the end of the Financial Highlights
See Notes to Financial Statements
58
Table of Contents
FINANCIAL HIGHLIGHTS
SELECTED PER SHARE DATA AND RATIOS FOR A SHARE OUTSTANDING
THROUGHOUT EACH PERIOD
| Net Asset Value, Beginning of Period | Net Investment Income (Loss)(2) | Net Realized and Unrealized Gain (Loss) | Total from Investment Operations | Dividends from Net Investment Income | Distributions from Net Realized Gains | Tax Return of Capital | Total Distributions | Change in Net Asset Value | Net Asset Value, End of Period | Total Return(1) | Net Assets, End of Period (in thousands) | Ratio of Expenses (including dividends and interest on short sales after expense waivers and reimbursements) to Average Net Assets(8) | Ratio of Expenses (including dividends and interest on short sales before expense waivers and reimburse ments) to Average Net Assets(8) | Ratio of Net Investment Income (Loss) to Average Net Assets | Portfolio Turnover Rate | ||||||||||||||||||||||||||||||||||||||||||||||||||||||||||||||||||
Dynamic Trend | ||||||||||||||||||||||||||||||||||||||||||||||||||||||||||||||||||||||||||||||||||
Fund | ||||||||||||||||||||||||||||||||||||||||||||||||||||||||||||||||||||||||||||||||||
Class A | ||||||||||||||||||||||||||||||||||||||||||||||||||||||||||||||||||||||||||||||||||
10/1/14 to 9/30/15 | $ | 13.29 | (0.06 | ) | (1.27 | ) | (1.33 | ) | — | (1.86 | ) | — | (1.86 | ) | (3.19 | ) | $ | 10.10 | (11.02 | )% | $ | 151,867 | 1.42 | %(9) | 1.42 | %(9) | (0.49 | )% | 687 | % | ||||||||||||||||||||||||||||||||||||||||||||||||||||
10/1/13 to 9/30/14 | 11.73 | (0.03 | ) | 1.59 | 1.56 | — | — | — | — | 1.56 | 13.29 | 13.30 | 721,407 | 2.68 | (9) | 2.68 | (9) | (0.23 | ) | 233 | ||||||||||||||||||||||||||||||||||||||||||||||||||||||||||||||
10/1/12 to 9/30/13 | 9.90 | 0.03 | 1.87 | 1.90 | (0.04 | ) | — | (0.03 | ) | (0.07 | ) | 1.83 | 11.73 | 19.32 | 660,921 | 2.73 | (7)(9) | 2.83 | (9) | 0.27 | 137 | |||||||||||||||||||||||||||||||||||||||||||||||||||||||||||||
10/1/11 to 9/30/12 | 9.09 | 0.08 | 0.73 | 0.81 | — | — | — | — | 0.81 | 9.90 | 8.91 | 109,724 | 2.78 | (9) | 3.06 | (9) | 0.86 | 165 | ||||||||||||||||||||||||||||||||||||||||||||||||||||||||||||||||
10/1/10 to 9/30/11 | 10.57 | (0.28 | ) | (0.91 | ) | (1.19 | ) | — | (0.29 | ) | — | (0.29 | ) | (1.48 | ) | 9.09 | (11.59 | ) | 6,615 | 4.35 | 4.65 | (2.79 | ) | 186 | ||||||||||||||||||||||||||||||||||||||||||||||||||||||||||
Class B | ||||||||||||||||||||||||||||||||||||||||||||||||||||||||||||||||||||||||||||||||||
10/1/14 to 9/30/15 | $ | 12.30 | (0.11 | ) | (1.18 | ) | (1.29 | ) | — | (1.86 | ) | — | (1.86 | ) | (3.15 | ) | $ | 9.15 | (11.76 | )% | $ | 44 | 2.02 | %(9) | 2.02 | %(9) | (1.10 | )% | 687 | % | ||||||||||||||||||||||||||||||||||||||||||||||||||||
10/1/13 to 9/30/14 | 10.94 | (0.12 | ) | 1.48 | 1.36 | — | — | — | — | 1.36 | 12.30 | 12.43 | 144 | 3.44 | (9) | 3.44 | (9) | (0.99 | ) | 233 | ||||||||||||||||||||||||||||||||||||||||||||||||||||||||||||||
10/1/12 to 9/30/13 | 9.24 | (0.07 | ) | 1.77 | 1.70 | — | — | — | — | 1.70 | 10.94 | 18.40 | 130 | 3.41 | (7)(9) | 3.52 | (9) | (0.71 | ) | 137 | ||||||||||||||||||||||||||||||||||||||||||||||||||||||||||||||
10/1/11 to 9/30/12 | 8.54 | (0.19 | ) | 0.89 | 0.70 | — | — | — | — | 0.70 | 9.24 | 8.20 | 150 | 4.23 | (9) | 4.81 | (9) | (2.19 | ) | 165 | ||||||||||||||||||||||||||||||||||||||||||||||||||||||||||||||
10/1/10 to 9/30/11 | 10.04 | (0.33 | ) | (0.88 | ) | (1.21 | ) | — | (0.29 | ) | — | (0.29 | ) | (1.50 | ) | 8.54 | (12.42 | ) | 260 | 5.02 | 5.32 | (3.49 | ) | 186 | ||||||||||||||||||||||||||||||||||||||||||||||||||||||||||
Class C | ||||||||||||||||||||||||||||||||||||||||||||||||||||||||||||||||||||||||||||||||||
10/1/14 to 9/30/15 | $ | 12.24 | (0.10 | ) | (1.19 | ) | (1.29 | ) | — | (1.86 | ) | — | (1.86 | ) | (3.15 | ) | $ | 9.09 | (11.73 | )% | $ | 206,159 | 2.02 | %(9) | 2.02 | %(9) | (1.02 | )% | 687 | % | ||||||||||||||||||||||||||||||||||||||||||||||||||||
10/1/13 to 9/30/14 | 10.88 | (0.11 | ) | 1.47 | 1.36 | — | — | — | — | 1.36 | 12.24 | 12.50 | 546,986 | 3.44 | (9) | 3.44 | (9) | (0.87 | ) | 233 | ||||||||||||||||||||||||||||||||||||||||||||||||||||||||||||||
10/1/12 to 9/30/13 | 9.21 | (0.04 | ) | 1.74 | 1.70 | — | — | (0.03 | ) | (0.03 | ) | 1.67 | 10.88 | 18.48 | 263,722 | 3.52 | (7)(9) | 3.62 | (9) | (0.38 | ) | 137 | ||||||||||||||||||||||||||||||||||||||||||||||||||||||||||||
10/1/11 to 9/30/12 | 8.52 | 0.01 | 0.68 | 0.69 | — | — | — | — | 0.69 | 9.21 | 8.10 | 27,123 | 3.61 | (9) | 3.91 | (9) | 0.12 | 165 | ||||||||||||||||||||||||||||||||||||||||||||||||||||||||||||||||
10/1/10 to 9/30/11 | 10.00 | (0.33 | ) | (0.86 | ) | (1.19 | ) | — | (0.29 | ) | — | (0.29 | ) | (1.48 | ) | 8.52 | (12.26 | ) | 2,330 | 5.07 | 5.38 | (3.50 | ) | 186 | ||||||||||||||||||||||||||||||||||||||||||||||||||||||||||
Class I | ||||||||||||||||||||||||||||||||||||||||||||||||||||||||||||||||||||||||||||||||||
10/1/14 to 9/30/15 | $ | 13.45 | (0.03 | ) | (1.29 | ) | (1.32 | ) | — | (1.86 | ) | — | (1.86 | ) | (3.18 | ) | $ | 10.27 | (10.86 | )% | $ | 259,770 | 1.24 | %(9) | 1.24 | %(9) | (0.30 | )% | 687 | % | ||||||||||||||||||||||||||||||||||||||||||||||||||||
10/1/13 to 9/30/14 | 11.84 | 0.01 | 1.60 | 1.61 | — | — | — | — | 1.61 | 13.45 | 13.60 | 1,449,657 | 2.43 | (9) | 2.43 | (9) | 0.11 | 233 | ||||||||||||||||||||||||||||||||||||||||||||||||||||||||||||||||
10/1/12 to 9/30/13 | 9.98 | 0.06 | 1.89 | 1.95 | (0.06 | ) | — | (0.03 | ) | (0.09 | ) | 1.86 | 11.84 | 19.67 | 744,371 | 2.49 | (7)(9) | 2.59 | (9) | 0.50 | 137 | |||||||||||||||||||||||||||||||||||||||||||||||||||||||||||||
10/1/11 to 9/30/12 | 9.12 | 0.05 | 0.81 | 0.86 | — | — | — | — | 0.86 | 9.98 | 9.43 | 112,349 | 2.78 | (9) | 3.06 | (9) | 0.49 | 165 | ||||||||||||||||||||||||||||||||||||||||||||||||||||||||||||||||
10/1/10 to 9/30/11 | 10.58 | (0.25 | ) | (0.92 | ) | (1.17 | ) | — | (0.29 | ) | — | (0.29 | ) | (1.46 | ) | 9.12 | (11.47 | ) | 27,976 | 4.03 | 4.33 | (2.48 | ) | 186 | ||||||||||||||||||||||||||||||||||||||||||||||||||||||||||
Class R6 | ||||||||||||||||||||||||||||||||||||||||||||||||||||||||||||||||||||||||||||||||||
11/14/14(6) to 9/30/15 | $ | 13.00 | 0.06 | (0.92 | ) | (0.86 | ) | — | (1.86 | ) | — | (1.86 | ) | (2.72 | ) | $ | 10.28 | (7.69 | )%(4) | $ | 92 | 0.52 | %(3)(9) | 0.52 | %(3)(9) | 0.58 | %(3) | 687 | % | |||||||||||||||||||||||||||||||||||||||||||||||||||||
The footnote legend is at the end of the Financial Highlights
See Notes to Financial Statements
59
Table of Contents
VIRTUS OPPORTUNITIES TRUST
FINANCIAL HIGHLIGHTS
SELECTED PER SHARE DATA AND RATIOS FOR A SHARE OUTSTANDING
THROUGHOUT EACH PERIOD
| Net Asset Value, Beginning of Period | Net Investment Income (Loss)(2) | Net Realized and Unrealized Gain (Loss) | Total from Investment Operations | Dividends from Net Investment Income | Distributions from Net Realized Gains | Total Distributions | Change in Net Asset Value | Net Asset Value, End of Period | Total Return(1) | Net Assets, End of Period (In thousands) | Ratio of Net Expenses to Average Net Assets(8) | Ratio of Gross Expenses to Average Net Assets (before waivers and reimbursements)(8) | Ratio of Net Investment Income (Loss) to Average Net Assets | Portfolio Turnover Rate | ||||||||||||||||||||||||||||||||||||||||||||||||||||||||||||||
Equity Trend | |||||||||||||||||||||||||||||||||||||||||||||||||||||||||||||||||||||||||||||
Fund | |||||||||||||||||||||||||||||||||||||||||||||||||||||||||||||||||||||||||||||
Class A | |||||||||||||||||||||||||||||||||||||||||||||||||||||||||||||||||||||||||||||
10/1/14 to 9/30/15 | $ | 17.39 | (0.03 | ) | (1.79 | ) | (1.82 | ) | (0.01 | ) | (3.42 | ) | (3.43 | ) | (5.25 | ) | $ | 12.14 | (12.79 | )% | $ | 520,337 | 1.60 | %(12) | 1.60 | % | (0.22 | )% | 674 | % | |||||||||||||||||||||||||||||||||||||||||||||||
10/1/13 to 9/30/14 | 15.52 | 0.06 | 2.29 | 2.35 | (0.04 | ) | (0.44 | ) | (0.48 | ) | 1.87 | 17.39 | 15.31 | 2,044,955 | 1.61 | (12) | 1.61 | 0.36 | 227 | ||||||||||||||||||||||||||||||||||||||||||||||||||||||||||
10/1/12 to 9/30/13 | 13.43 | 0.11 | 2.09 | 2.20 | (0.11 | ) | — | (0.11 | ) | 2.09 | 15.52 | 16.50 | 1,937,456 | 1.62 | (12) | 1.62 | 0.75 | 140 | |||||||||||||||||||||||||||||||||||||||||||||||||||||||||||
10/1/11 to 9/30/12 | 11.69 | 0.10 | 1.73 | 1.83 | (0.09 | ) | — | (0.09 | ) | 1.74 | 13.43 | 15.74 | 1,323,109 | 1.64 | 1.64 | 0.80 | 297 | ||||||||||||||||||||||||||||||||||||||||||||||||||||||||||||
10/1/10 to 9/30/11 | 11.17 | 0.10 | 0.52 | 0.62 | (0.08 | ) | (0.02 | ) | (0.10 | ) | 0.52 | 11.69 | 5.47 | 958,603 | 1.67 | (10) | 1.67 | 0.80 | 247 | ||||||||||||||||||||||||||||||||||||||||||||||||||||||||||
Class C | |||||||||||||||||||||||||||||||||||||||||||||||||||||||||||||||||||||||||||||
10/1/14 to 9/30/15 | $ | 17.16 | (0.13 | ) | (1.76 | ) | (1.89 | ) | — | (3.40 | ) | (3.40 | ) | (5.29 | ) | $ | 11.87 | (13.45 | )% | $ | 746,390 | 2.36 | %(12) | 2.36 | % | (0.97 | )% | 674 | % | ||||||||||||||||||||||||||||||||||||||||||||||||
10/1/13 to 9/30/14 | 15.39 | (0.06 | ) | 2.27 | 2.21 | — | (0.44 | ) | (0.44 | ) | 1.77 | 17.16 | 14.48 | 1,988,290 | 2.36 | (12) | 2.36 | (0.38 | ) | 227 | |||||||||||||||||||||||||||||||||||||||||||||||||||||||||
10/1/12 to 9/30/13 | 13.34 | — | 2.07 | 2.07 | (0.02 | ) | — | (0.02 | ) | 2.05 | 15.39 | 15.55 | 1,307,857 | 2.37 | (12) | 2.37 | 0.02 | 140 | |||||||||||||||||||||||||||||||||||||||||||||||||||||||||||
10/1/11 to 9/30/12 | 11.62 | 0.01 | 1.72 | 1.73 | (0.01 | ) | — | (0.01 | ) | 1.72 | 13.34 | 14.91 | 767,602 | 2.38 | 2.39 | 0.09 | 297 | ||||||||||||||||||||||||||||||||||||||||||||||||||||||||||||
10/1/10 to 9/30/11 | 11.15 | 0.02 | 0.51 | 0.53 | (0.04 | ) | (0.02 | ) | (0.06 | ) | 0.47 | 11.62 | 4.68 | 457,630 | 2.38 | (10) | 2.42 | 0.13 | 247 | ||||||||||||||||||||||||||||||||||||||||||||||||||||||||||
Class I | |||||||||||||||||||||||||||||||||||||||||||||||||||||||||||||||||||||||||||||
10/1/14 to 9/30/15 | $ | 17.42 | 0.01 | (1.80 | ) | (1.79 | ) | (0.02 | ) | (3.42 | ) | (3.44 | ) | (5.23 | ) | $ | 12.19 | (12.57 | )% | $ | 594,460 | 1.35 | %(12) | 1.35 | % | 0.04 | % | 674 | % | ||||||||||||||||||||||||||||||||||||||||||||||||
10/1/13 to 9/30/14 | 15.54 | 0.10 | 2.30 | 2.40 | (0.08 | ) | (0.44 | ) | (0.52 | ) | 1.88 | 17.42 | 15.61 | 3,840,271 | 1.36 | (12) | 1.36 | 0.62 | 227 | ||||||||||||||||||||||||||||||||||||||||||||||||||||||||||
10/1/12 to 9/30/13 | 13.45 | 0.15 | 2.08 | 2.23 | (0.14 | ) | — | (0.14 | ) | 2.09 | 15.54 | 16.75 | 2,580,005 | 1.37 | (12) | 1.37 | 1.02 | 140 | |||||||||||||||||||||||||||||||||||||||||||||||||||||||||||
10/1/11 to 9/30/12 | 11.71 | 0.14 | 1.72 | 1.86 | (0.12 | ) | — | (0.12 | ) | 1.74 | 13.45 | 15.98 | 1,479,042 | 1.39 | 1.39 | 1.10 | 297 | ||||||||||||||||||||||||||||||||||||||||||||||||||||||||||||
10/1/10 to 9/30/11 | 11.17 | 0.14 | 0.52 | 0.66 | (0.10 | ) | (0.02 | ) | (0.12 | ) | 0.54 | 11.71 | 5.78 | 754,415 | 1.42 | (10) | 1.42 | 1.09 | 247 | ||||||||||||||||||||||||||||||||||||||||||||||||||||||||||
Class R6 | |||||||||||||||||||||||||||||||||||||||||||||||||||||||||||||||||||||||||||||
11/12/14(6) to 9/30/15 | $ | 17.20 | 0.01 | (1.57 | ) | (1.56 | ) | (0.02 | ) | (3.42 | ) | (3.44 | ) | (5.00 | ) | $ | 12.20 | (11.39 | )%(4) | $ | 89 | 1.28 | %(3)(12) | 1.28 | %(3) | 0.10 | %(3) | 674 | % | ||||||||||||||||||||||||||||||||||||||||||||||||
| Global Equity | |||||||||||||||||||||||||||||||||||||||||||||||||||||||||||||||||||||||||||||
Trend Fund | |||||||||||||||||||||||||||||||||||||||||||||||||||||||||||||||||||||||||||||
Class A | |||||||||||||||||||||||||||||||||||||||||||||||||||||||||||||||||||||||||||||
10/1/14 to 9/30/15 | $ | 12.42 | (0.03 | ) | (1.48 | ) | (1.51 | ) | (0.07 | ) | (1.08 | ) | (1.15 | ) | (2.66 | ) | $ | 9.76 | (13.21 | )% | $ | 18,523 | 1.68 | %(12) | 1.68 | % | (0.23 | )% | 614 | % | |||||||||||||||||||||||||||||||||||||||||||||||
10/1/13 to 9/30/14 | 11.76 | 0.07 | 0.91 | 0.98 | (0.02 | ) | (0.30 | ) | (0.32 | ) | 0.66 | 12.42 | 8.43 | 75,879 | 1.66 | (10) | 1.65 | 0.55 | 205 | ||||||||||||||||||||||||||||||||||||||||||||||||||||||||||
10/1/12 to 9/30/13 | 10.56 | 0.04 | 1.26 | 1.30 | (0.06 | ) | (0.04 | ) | (0.10 | ) | 1.20 | 11.76 | 12.32 | 56,689 | 1.75 | (10) | 1.71 | 0.33 | 194 | ||||||||||||||||||||||||||||||||||||||||||||||||||||||||||
10/1/11 to 9/30/12 | 9.42 | 0.08 | 1.12 | 1.20 | (0.06 | ) | — | (0.06 | ) | 1.14 | 10.56 | 12.75 | 27,699 | 1.75 | 1.78 | 0.83 | 258 | ||||||||||||||||||||||||||||||||||||||||||||||||||||||||||||
3/15/11(6) to 9/30/11 | 10.00 | 0.07 | (0.63 | ) | (0.56 | ) | (0.02 | ) | — | (0.02 | ) | (0.58 | ) | 9.42 | (5.62 | )(4) | 5,467 | 1.75 | (3) | 2.88 | (3) | 1.23 | (3) | 199 | (4) | ||||||||||||||||||||||||||||||||||||||||||||||||||||
Class C | |||||||||||||||||||||||||||||||||||||||||||||||||||||||||||||||||||||||||||||
10/1/14 to 9/30/15 | $ | 12.24 | (0.09 | ) | (1.48 | ) | (1.57 | ) | — | (1.08 | ) | (1.08 | ) | (2.65 | ) | $ | 9.59 | (13.88 | )% | $ | 22,376 | 2.41 | %(12) | 2.43 | % | (0.87 | )% | 614 | % | ||||||||||||||||||||||||||||||||||||||||||||||||
10/1/13 to 9/30/14 | 11.64 | (0.02 | ) | 0.92 | 0.90 | — | (0.30 | ) | (0.30 | ) | 0.60 | 12.24 | 7.69 | 72,013 | 2.37 | (10) | 2.40 | (0.17 | ) | 205 | |||||||||||||||||||||||||||||||||||||||||||||||||||||||||
10/1/12 to 9/30/13 | 10.50 | (0.05 | ) | 1.25 | 1.20 | (0.02 | ) | (0.04 | ) | (0.06 | ) | 1.14 | 11.64 | 11.52 | 44,239 | 2.48 | (10) | 2.46 | (0.42 | ) | 194 | ||||||||||||||||||||||||||||||||||||||||||||||||||||||||
10/1/11 to 9/30/12 | 9.40 | — | (5) | 1.12 | 1.12 | (0.02 | ) | — | (0.02 | ) | 1.10 | 10.50 | 12.04 | 21,051 | 2.50 | 2.53 | 0.01 | 258 | |||||||||||||||||||||||||||||||||||||||||||||||||||||||||||
3/15/11(6) to 9/30/11 | 10.00 | 0.01 | (0.61 | ) | (0.60 | ) | — | (5) | — | — | (0.60 | ) | 9.40 | (6.09 | )(4) | 4,885 | 2.50 | (3) | 3.81 | (3) | 0.17 | (3) | 199 | (4) | |||||||||||||||||||||||||||||||||||||||||||||||||||||
Class I | |||||||||||||||||||||||||||||||||||||||||||||||||||||||||||||||||||||||||||||
10/1/14 to 9/30/15 | $ | 12.47 | — | (5) | (1.50 | ) | (1.50 | ) | (0.10 | ) | (1.08 | ) | (1.18 | ) | (2.68 | ) | $ | 9.79 | (13.06 | )% | $ | 15,998 | 1.43 | %(12) | 1.43 | % | 0.01 | % | 614 | % | |||||||||||||||||||||||||||||||||||||||||||||||
10/1/13 to 9/30/14 | 11.80 | 0.10 | 0.92 | 1.02 | (0.05 | ) | (0.30 | ) | (0.35 | ) | 0.67 | 12.47 | 8.68 | 99,642 | 1.44 | (10) | 1.41 | 0.80 | 205 | ||||||||||||||||||||||||||||||||||||||||||||||||||||||||||
10/1/12 to 9/30/13 | 10.58 | 0.07 | 1.25 | 1.32 | (0.06 | ) | (0.04 | ) | (0.10 | ) | 1.22 | 11.80 | 12.59 | 38,889 | 1.50 | (10) | 1.46 | 0.58 | 194 | ||||||||||||||||||||||||||||||||||||||||||||||||||||||||||
10/1/11 to 9/30/12 | 9.42 | 0.09 | 1.14 | 1.23 | (0.07 | ) | — | (0.07 | ) | 1.16 | 10.58 | 13.15 | 19,112 | 1.50 | 1.52 | 0.90 | 258 | ||||||||||||||||||||||||||||||||||||||||||||||||||||||||||||
3/15/11(6) to 9/30/11 | 10.00 | 0.07 | (0.63 | ) | (0.56 | ) | (0.02 | ) | — | (0.02 | ) | (0.58 | ) | 9.42 | (5.59 | )(4) | 9,565 | 1.50 | (3) | 2.85 | (3) | 1.37 | (3) | 199 | (4) | ||||||||||||||||||||||||||||||||||||||||||||||||||||
The footnote legend is at the end of the Financial Highlights
See Notes to Financial Statements
60
Table of Contents
VIRTUS OPPORTUNITIES TRUST
FINANCIAL HIGHLIGHTS
SELECTED PER SHARE DATA AND RATIOS FOR A SHARE OUTSTANDING
THROUGHOUT EACH PERIOD
| Net Asset Value, Beginning of Period | Net Investment Income (Loss)(2) | Net Realized and Unrealized Gain (Loss) | Total from Investment Operations | Dividends from Net Investment Income | Distributions from Net Realized Gains | Total Distributions | Change in Net Asset Value | Net Asset Value, End of Period | Total Return(1) | Net Assets, End of Period (In thousands) | Ratio of Net Expenses to Average Net Assets(8) | Ratio of Gross Expenses to Average Net Assets (before waivers and reimbursements)(8) | Ratio of Net Investment Income (Loss) to Average Net Assets | Portfolio Turnover Rate | ||||||||||||||||||||||||||||||||||||||||||||||||||||||||||||||
Herzfeld Fund | |||||||||||||||||||||||||||||||||||||||||||||||||||||||||||||||||||||||||||||
Class A | |||||||||||||||||||||||||||||||||||||||||||||||||||||||||||||||||||||||||||||
10/1/14 to 9/30/15 | $ | 11.37 | 0.35 | (1.12 | ) | (0.77 | ) | (0.37 | ) | (0.32 | ) | (0.69 | ) | (1.46 | ) | $ | 9.91 | (7.17 | )% | $ | 8,324 | 1.60 | % | 1.73 | % | 3.20 | % | 57 | % | ||||||||||||||||||||||||||||||||||||||||||||||||
10/1/13 to 9/30/14 | 10.45 | 0.34 | 1.02 | 1.36 | (0.36 | ) | (0.08 | ) | (0.44 | ) | 0.92 | 11.37 | 13.21 | 9,212 | 1.60 | 1.93 | 3.04 | 53 | |||||||||||||||||||||||||||||||||||||||||||||||||||||||||||
10/1/12 to 9/30/13 | 10.21 | 0.33 | 0.18 | 0.51 | (0.26 | ) | (0.01 | ) | (0.27 | ) | 0.24 | 10.45 | 5.10 | 2,917 | 1.60 | 2.60 | 3.13 | 22 | |||||||||||||||||||||||||||||||||||||||||||||||||||||||||||
9/5/12(6) to 9/30/12 | 10.00 | 0.04 | 0.17 | 0.21 | — | — | — | 0.21 | 10.21 | 2.10 | (4) | 105 | 1.60 | (3) | 37.91 | (3) | 5.93 | 3 | (4) | ||||||||||||||||||||||||||||||||||||||||||||||||||||||||||
Class C | |||||||||||||||||||||||||||||||||||||||||||||||||||||||||||||||||||||||||||||
10/1/14 to 9/30/15 | $ | 11.34 | 0.26 | (1.11 | ) | (0.85 | ) | (0.30 | ) | (0.32 | ) | (0.62 | ) | (1.47 | ) | $ | 9.87 | (7.94 | )% | $ | 14,761 | 2.35 | % | 2.48 | % | 2.39 | % | 57 | % | ||||||||||||||||||||||||||||||||||||||||||||||||
10/1/13 to 9/30/14 | 10.43 | 0.26 | 1.01 | 1.27 | (0.28 | ) | (0.08 | ) | (0.36 | ) | 0.91 | 11.34 | 12.34 | 10,624 | 2.35 | 2.70 | 2.35 | 53 | |||||||||||||||||||||||||||||||||||||||||||||||||||||||||||
10/1/12 to 9/30/13 | 10.21 | 0.25 | 0.19 | 0.44 | (0.21 | ) | (0.01 | ) | (0.22 | ) | 0.22 | 10.43 | 4.36 | 4,942 | 2.35 | 3.25 | 2.40 | 22 | |||||||||||||||||||||||||||||||||||||||||||||||||||||||||||
9/5/12(6) to 9/30/12 | 10.00 | 0.03 | 0.18 | 0.21 | — | — | — | 0.21 | 10.21 | 2.10 | (4) | 102 | 2.35 | (3) | 38.62 | (3) | 5.21 | 3 | (4) | ||||||||||||||||||||||||||||||||||||||||||||||||||||||||||
Class I | |||||||||||||||||||||||||||||||||||||||||||||||||||||||||||||||||||||||||||||
10/1/14 to 9/30/15 | $ | 11.39 | 0.37 | (1.12 | ) | (0.75 | ) | (0.40 | ) | (0.32 | ) | (0.72 | ) | (1.47 | ) | $ | 9.92 | (7.01 | )% | $ | 15,148 | 1.35 | % | 1.47 | % | 3.39 | % | 57 | % | ||||||||||||||||||||||||||||||||||||||||||||||||
10/1/13 to 9/30/14 | 10.46 | 0.38 | 1.01 | 1.39 | (0.38 | ) | (0.08 | ) | (0.46 | ) | 0.93 | 11.39 | 13.54 | 3,441 | 1.35 | 1.71 | 3.40 | 53 | |||||||||||||||||||||||||||||||||||||||||||||||||||||||||||
10/1/12 to 9/30/13 | 10.21 | 0.09 | 0.46 | 0.55 | (0.29 | ) | (0.01 | ) | (0.30 | ) | 0.25 | 10.46 | 5.41 | 1,765 | 1.35 | 3.71 | 0.86 | 22 | |||||||||||||||||||||||||||||||||||||||||||||||||||||||||||
9/5/12(6) to 9/30/12 | 10.00 | 0.03 | 0.18 | 0.21 | — | — | — | 0.21 | 10.21 | 2.10 | (4) | 1,017 | 1.35 | (3) | 38.61 | (3) | 4.39 | 3 | (4) | ||||||||||||||||||||||||||||||||||||||||||||||||||||||||||
| Multi-Asset Trend | |||||||||||||||||||||||||||||||||||||||||||||||||||||||||||||||||||||||||||||
Fund | |||||||||||||||||||||||||||||||||||||||||||||||||||||||||||||||||||||||||||||
Class A | |||||||||||||||||||||||||||||||||||||||||||||||||||||||||||||||||||||||||||||
10/1/14 to 9/30/15 | $ | 11.85 | (0.02 | ) | (0.92 | ) | (0.94 | ) | (0.04 | ) | (0.93 | ) | (0.97 | ) | (1.91 | ) | $ | 9.94 | (8.58 | )% | $ | 55,214 | 1.62 | %(12) | 1.62 | % | (0.15 | )% | 519 | % | |||||||||||||||||||||||||||||||||||||||||||||||
10/1/13 to 9/30/14 | 11.28 | 0.10 | 0.69 | 0.79 | (0.07 | ) | (0.15 | ) | (0.22 | ) | 0.57 | 11.85 | 6.97 | 143,765 | 1.62 | (12) | 1.62 | (12) | 0.83 | 337 | |||||||||||||||||||||||||||||||||||||||||||||||||||||||||
10/1/12 to 9/30/13 | 10.67 | 0.06 | 0.62 | 0.68 | (0.05 | ) | (0.02 | ) | (0.07 | ) | 0.61 | 11.28 | 6.39 | 114,697 | 1.64 | (12) | 1.64 | (12) | 0.51 | 275 | |||||||||||||||||||||||||||||||||||||||||||||||||||||||||
10/1/11 to 9/30/12 | 9.69 | 0.09 | 0.98 | 1.07 | (0.09 | ) | — | (0.09 | ) | 0.98 | 10.67 | 11.08 | 66,122 | 1.73 | 1.70 | 0.84 | 211 | ||||||||||||||||||||||||||||||||||||||||||||||||||||||||||||
3/15/11(6) to 9/30/11 | 10.00 | 0.07 | (0.38 | ) | (0.31 | ) | — | — | — | (0.31 | ) | 9.69 | (3.10 | )(4) | 12,232 | 1.75 | (3) | 2.17 | (3) | 1.35 | (3) | 153 | (4) | ||||||||||||||||||||||||||||||||||||||||||||||||||||||
Class C | |||||||||||||||||||||||||||||||||||||||||||||||||||||||||||||||||||||||||||||
10/1/14 to 9/30/15 | $ | 11.73 | (0.09 | ) | (0.91 | ) | (1.00 | ) | — | (0.93 | ) | (0.93 | ) | (1.93 | ) | $ | 9.80 | (9.23 | )% | $ | 139,223 | 2.36 | %(12) | 2.37 | % | (0.89 | )% | 519 | % | ||||||||||||||||||||||||||||||||||||||||||||||||
10/1/13 to 9/30/14 | 11.19 | 0.01 | 0.68 | 0.69 | — | (0.15 | ) | (0.15 | ) | 0.54 | 11.73 | 6.15 | 331,980 | 2.35 | (12) | 2.37 | (12) | 0.09 | 337 | ||||||||||||||||||||||||||||||||||||||||||||||||||||||||||
10/1/12 to 9/30/13 | 10.60 | (0.02 | ) | 0.63 | 0.61 | — | (0.02 | ) | (0.02 | ) | 0.59 | 11.19 | 5.71 | 230,459 | 2.37 | (12) | 2.39 | (12) | (0.23 | ) | 275 | ||||||||||||||||||||||||||||||||||||||||||||||||||||||||
10/1/11 to 9/30/12 | 9.66 | 0.02 | 0.96 | 0.98 | (0.04 | ) | — | (0.04 | ) | 0.94 | 10.60 | 10.13 | 131,330 | 2.45 | 2.45 | 0.16 | 211 | ||||||||||||||||||||||||||||||||||||||||||||||||||||||||||||
3/15/11(6) to 9/30/11 | 10.00 | 0.02 | (0.36 | ) | (0.34 | ) | — | — | — | (0.34 | ) | 9.66 | (3.40 | )(4) | 32,390 | 2.50 | (3) | 2.85 | (3) | 0.43 | (3) | 153 | (4) | ||||||||||||||||||||||||||||||||||||||||||||||||||||||
Class I | |||||||||||||||||||||||||||||||||||||||||||||||||||||||||||||||||||||||||||||
10/1/14 to 9/30/15 | $ | 11.88 | 0.01 | (0.91 | ) | (0.90 | ) | (0.06 | ) | (0.93 | ) | (0.99 | ) | (1.89 | ) | $ | 9.99 | (8.36 | )% | $ | 73,528 | 1.36 | %(12) | 1.36 | % | 0.11 | % | 519 | % | ||||||||||||||||||||||||||||||||||||||||||||||||
10/1/13 to 9/30/14 | 11.31 | 0.13 | 0.69 | 0.82 | (0.10 | ) | (0.15 | ) | (0.25 | ) | 0.57 | 11.88 | 7.20 | 316,599 | 1.37 | (12) | 1.37 | (12) | 1.06 | 337 | |||||||||||||||||||||||||||||||||||||||||||||||||||||||||
10/1/12 to 9/30/13 | 10.69 | 0.08 | 0.63 | 0.71 | (0.07 | ) | (0.02 | ) | (0.09 | ) | 0.62 | 11.31 | 6.70 | 248,984 | 1.39 | (12) | 1.39 | (12) | 0.74 | 275 | |||||||||||||||||||||||||||||||||||||||||||||||||||||||||
10/1/11 to 9/30/12 | 9.71 | 0.12 | 0.96 | 1.08 | (0.10 | ) | — | (0.10 | ) | 0.98 | 10.69 | 11.24 | 146,634 | 1.49 | 1.46 | 1.17 | 211 | ||||||||||||||||||||||||||||||||||||||||||||||||||||||||||||
3/15/11(6) to 9/30/11 | 10.00 | 0.10 | (0.39 | ) | (0.29 | ) | — | — | — | (0.29 | ) | 9.71 | (2.90 | )(4) | 19,131 | 1.50 | (3) | 2.01 | (3) | 1.82 | (3) | 153 | (4) | ||||||||||||||||||||||||||||||||||||||||||||||||||||||
The footnote legend is at the end of the Financial Highlights
See Notes to Financial Statements
61
Table of Contents
VIRTUS OPPORTUNITIES TRUST
FINANCIAL HIGHLIGHTS
SELECTED PER SHARE DATA AND RATIOS FOR A SHARE OUTSTANDING
THROUGHOUT EACH PERIOD
| Net Asset Value, Beginning of Period | Net Investment Income (Loss)(2) | Net Realized and Unrealized Gain (Loss) | Total from Investment Operations | Dividends from Net Investment Income | Distributions from Net Realized Gains | Total Distributions | Change in Net Asset Value | Net Asset Value, End of Period | Total Return(1) | Net Assets End of Period (in thousands) | Ratio of Net Expenses to Average Net Assets(8) | Ratio of Gross Expenses to Average Net Assets (before waivers and reimbursements)(8) | Ratio of Net Investment Income (Loss) to Average Net Assets | Portfolio Turnover Rate | ||||||||||||||||||||||||||||||||||||||||||||||||||||||||||||||
Sector Trend Fund | |||||||||||||||||||||||||||||||||||||||||||||||||||||||||||||||||||||||||||||
Class A | |||||||||||||||||||||||||||||||||||||||||||||||||||||||||||||||||||||||||||||
10/1/14 to 9/30/15 | $ | 15.21 | 0.05 | (0.71 | ) | (0.66 | ) | (0.05 | ) | (3.50 | ) | (3.55 | ) | (4.21 | ) | $ | 11.00 | (6.19 | )% | $ | 156,759 | 0.98 | % | 0.98 | % | 0.39 | % | 576 | % | ||||||||||||||||||||||||||||||||||||||||||||||||
10/1/13 to 9/30/14 | 13.87 | 0.15 | 2.25 | 2.40 | (0.13 | ) | (0.93 | ) | (1.06 | ) | 1.34 | 15.21 | 17.81 | 316,571 | 0.98 | 0.98 | 1.02 | 129 | |||||||||||||||||||||||||||||||||||||||||||||||||||||||||||
10/1/12 to 9/30/13 | 12.15 | 0.17 | 2.11 | 2.28 | (0.17 | ) | (0.39 | ) | (0.56 | ) | 1.72 | 13.87 | 19.63 | 257,492 | 1.00 | 1.00 | 1.29 | 123 | |||||||||||||||||||||||||||||||||||||||||||||||||||||||||||
10/1/11 to 9/30/12 | 10.67 | 0.14 | 1.68 | 1.82 | (0.12 | ) | (0.22 | ) | (0.34 | ) | 1.48 | 12.15 | 17.51 | 199,268 | 1.02 | 1.02 | 1.22 | 190 | |||||||||||||||||||||||||||||||||||||||||||||||||||||||||||
10/1/10 to 9/30/11 | 10.18 | 0.11 | 0.54 | 0.65 | (0.16 | ) | — | (0.16 | ) | 0.49 | 10.67 | 6.20 | 184,613 | 1.04 | 1.04 | 0.97 | 134 | ||||||||||||||||||||||||||||||||||||||||||||||||||||||||||||
Class C | |||||||||||||||||||||||||||||||||||||||||||||||||||||||||||||||||||||||||||||
10/1/14 to 9/30/15 | $ | 15.02 | (0.04 | ) | (0.69 | ) | (0.73 | ) | (0.02 | ) | (3.51 | ) | (3.53 | ) | (4.26 | ) | $ | 10.76 | (6.86 | )% | $ | 206,556 | 1.74 | % | 1.74 | % | (0.34 | )% | 576 | % | |||||||||||||||||||||||||||||||||||||||||||||||
10/1/13 to 9/30/14 | 13.73 | 0.04 | 2.21 | 2.25 | (0.03 | ) | (0.93 | ) | (0.96 | ) | 1.29 | 15.02 | 16.89 | 296,160 | 1.73 | 1.73 | 0.28 | 129 | |||||||||||||||||||||||||||||||||||||||||||||||||||||||||||
10/1/12 to 9/30/13 | 12.03 | 0.07 | 2.10 | 2.17 | (0.08 | ) | (0.39 | ) | (0.47 | ) | 1.70 | 13.73 | 18.80 | 217,861 | 1.74 | 1.75 | 0.57 | 123 | |||||||||||||||||||||||||||||||||||||||||||||||||||||||||||
10/1/11 to 9/30/12 | 10.56 | 0.06 | 1.67 | 1.73 | (0.04 | ) | (0.22 | ) | (0.26 | ) | 1.47 | 12.03 | 16.60 | 157,461 | 1.75 | 1.77 | 0.53 | 190 | |||||||||||||||||||||||||||||||||||||||||||||||||||||||||||
10/1/10 to 9/30/11 | 10.09 | 0.04 | 0.52 | 0.56 | (0.09 | ) | — | (0.09 | ) | 0.47 | 10.56 | 5.49 | 144,813 | 1.71 | 1.79 | 0.33 | 134 | ||||||||||||||||||||||||||||||||||||||||||||||||||||||||||||
Class I | |||||||||||||||||||||||||||||||||||||||||||||||||||||||||||||||||||||||||||||
10/1/14 to 9/30/15 | $ | 15.21 | 0.08 | (0.71 | ) | (0.63 | ) | (0.05 | ) | (3.51 | ) | (3.56 | ) | (4.19 | ) | $ | 11.02 | (5.90 | )% | $ | 169,977 | 0.73 | % | 0.73 | % | 0.65 | % | 576 | % | ||||||||||||||||||||||||||||||||||||||||||||||||
10/1/13 to 9/30/14 | 13.87 | 0.19 | 2.25 | 2.44 | (0.17 | ) | (0.93 | ) | (1.10 | ) | 1.34 | 15.21 | 18.08 | 313,147 | 0.73 | 0.73 | 1.29 | 129 | |||||||||||||||||||||||||||||||||||||||||||||||||||||||||||
10/1/12 to 9/30/13 | 12.15 | 0.20 | 2.11 | 2.31 | (0.20 | ) | (0.39 | ) | (0.59 | ) | 1.72 | 13.87 | 19.92 | 173,096 | 0.75 | 0.75 | 1.56 | 123 | |||||||||||||||||||||||||||||||||||||||||||||||||||||||||||
10/1/11 to 9/30/12 | 10.67 | 0.17 | 1.68 | 1.85 | (0.15 | ) | (0.22 | ) | (0.37 | ) | 1.48 | 12.15 | 17.71 | 122,198 | 0.77 | 0.77 | 1.53 | 190 | |||||||||||||||||||||||||||||||||||||||||||||||||||||||||||
10/1/10 to 9/30/11 | 10.18 | 0.14 | 0.54 | 0.68 | (0.19 | ) | — | (0.19 | ) | 0.49 | 10.67 | 6.56 | 85,585 | 0.82 | 0.82 | 1.26 | 134 | ||||||||||||||||||||||||||||||||||||||||||||||||||||||||||||
Footnote Legend
| (1) | Sales charges, where applicable, are not reflected in the total return calculation. |
| (2) | Computed using average shares outstanding. |
| (3) | Annualized. |
| (4) | Not annualized. |
| (5) | Amount is less than $0.005. |
| (6) | Inception date. |
| (7) | Due to a change in expense cap, the ratio shown is a blended expense ratio. |
| (8) | The Funds will also indirectly bear their prorated share of expenses of the underlying funds in which they invest. Such expenses are not included in the calculation of this ratio. |
| (9) | The effect of interest expense due to leverage, as well as dividends and interest expense on securities sold short, increased the expense ratio by the following: |
10/1/14 to 9/30/15 | 0.52 | % | ||
10/1/13 to 9/30/14 | 0.45 | % |
10/1/12 to 9/30/13 | 0.38 | % | ||
10/1/11 to 9/30/12 | 0.63 | % |
| If interest and dividends were excluded the ratio would be lower. |
| (10) | See Note 3C in the Notes to Financial Statements for information on recapture of expense previously waived. |
| (11) | Effective December 1, 2010, the Adviser has discontinued charging an advisory fee. |
| (12) | The Fund is currently under its expense limitation. |
See Notes to Financial Statements
62
Table of Contents
VIRTUS OPPORTUNITIES TRUST
SEPTEMBER 30, 2015
| Note | 1. Organization |
Virtus Opportunities Trust (the “Trust”) is organized as a Delaware statutory trust and is registered under the Investment Company Act of 1940, as amended (“1940 Act”), as an open-end management investment company.
As of the date of this report, 32 funds of the Trust are offered for sale, of which ten (each a “Fund”) are reported in this annual report.
The Fund’s investment objective is outlined in each Fund’s Summary Page
There is no guarantee that a Fund will achieve its objective.
All of the Funds offer Class A shares, Class C shares, and Class I shares. The Dynamic Trend and Equity Trend Funds now offer Class R6 shares. Class B shares are no longer available for purchase by new or existing shareholders, except for existing shareholders through Qualifying Transactions. For information regarding Qualifying Transactions, refer to the prospectus. Class A shares are sold with a front-end sales charge of up to 5.75% with some exceptions. Generally, Class A shares are not subject to any charges by the Funds when redeemed; however, a 0.50% – 1% contingent deferred sales charge (“CDSC”) may be imposed on certain redemptions made within a certain period following purchases on which a finder’s fee has been paid. The period for which such CDSC applies for the Funds is 18 months. The CDSC period begins on the last day of the month preceding the month in which the purchase was made.
Class B shares were generally sold with a CDSC, which declines from 5% to zero depending on the period of time the shares are held. Class C shares are generally sold with a 1% CDSC, applicable if redeemed within one year of purchase. Class I shares and Class R6 shares are sold without a front-end sales charge or CDSC. Class R6 shares are only available to participants in employer-sponsored retirement plans, such as 401(k) plans, profit sharing plans, defined benefit plans and other employer directed plans. Class R6 shares do not carry sales commissions or pay Rule 12b-1 fees.
Virtus Mutual Funds may impose an annual fee on accounts having balances of less than $2,500. The small account fee may be waived in certain circumstances, as disclosed in the prospectuses and/or statements of additional information. The fees collected will be used to offset certain expenses of the Funds.
Each class of shares has identical voting, dividend, liquidation and other rights and the same terms and conditions, except that each Class bears different distribution and/or service fees under a Board-approved Rule 12b-1 and/or shareholder servicing plan (“12b-1 plan”) and has exclusive voting rights with respect to such plans. Class I shares and Class R6 shares are not subject to a 12b-1 plan. Income and other expenses as well as realized and unrealized gains and losses of each Fund are borne pro rata by the holders of each class of shares.
| Note | 2. Significant Accounting Policies |
The following is a summary of significant accounting policies consistently followed by the Trust in the preparation of its financial statements. The preparation of financial statements in conformity with accounting principles generally accepted in the United States of America requires management to make estimates and assumptions that affect the reported amounts of assets and liabilities, and disclosure of contingent assets and liabilities at the date of the financial statements and the reported amounts of increases and decreases in net assets from operations during the reporting period. Actual results could differ from those estimates and those differences could be significant.
| A. | Security Valuation |
Security valuation procedures for each Fund, which include nightly price variance as well as back-testing such as bi-weekly unchanged price, monthly secondary source and transaction analysis, have been approved by the Board of Trustees (the “Board”, or the “Trustees”). All internally fair valued securities are approved by a valuation committee (the “Valuation Committee”) appointed by the Board. The Valuation Committee is comprised of certain members of management as identified to the Board and convenes independently from portfolio management. All internally fair valued securities are updated daily and reviewed in detail by the Valuation Committee monthly unless changes occur within the period. The Valuation Committee reviews the validity of the model inputs and any changes to the model. Quarterly fair valuations are reviewed by the Board.
Each Fund utilizes a fair value hierarchy which prioritizes the inputs to valuation techniques used to measure fair value into three broad levels. The Funds’ policy is to recognize transfers between levels at the end of the reporting period.
| • Level 1 – | quoted prices in active markets for identical securities (security types generally include listed equities). |
| • Level 2 – | prices determined using other significant observable inputs (including quoted prices for similar securities, interest rates, prepayment speeds, credit risk, etc.). |
| • Level 3 – | prices determined using significant unobservable inputs (including the Valuation Committee’s own assumptions in determining the fair value of investments). |
A description of the valuation techniques applied to a Fund’s major categories of assets and liabilities measured at fair value on a recurring basis is as follows:
Equity securities are valued at the official closing price (typically last sale) on the exchange on which the securities are primarily traded or, if no closing price is available, at the last bid price and are categorized as Level 1 in the hierarchy. Restricted equity securities and private placements that are not widely traded, are illiquid, or are internally fair valued by the Valuation Committee, are generally categorized as Level 3 in the hierarchy.
Certain non-U.S. securities may be fair valued in cases where closing prices are not readily available or are deemed not reflective of readily available market prices. For example, significant events (such as movement in the U.S. securities market, or other regional and local developments) may occur between the time that non-U.S. markets close (where the security is principally traded) and the time that a Fund calculates its net asset value (“NAV”) (at the close of regular trading on the New York Stock Exchange (“NYSE”), generally 4 p.m. Eastern time) that may impact the value of securities traded in these non-U.S. markets. In such cases the Fund fair values non-U.S. securities using an independent pricing service which considers the correlation of the trading patterns of the non-U.S. security to the intraday trading in the
63
Table of Contents
VIRTUS OPPORTUNITIES TRUST
NOTES TO FINANCIAL STATEMENTS (Continued)
SEPTEMBER 30, 2015
U.S. markets for investments such as ADRs, financial futures, ETFs, and certain indexes, as well as prices for similar securities. Such fair valuations are categorized as Level 2 in the hierarchy. Because the frequency of significant events is not predictable, fair valuation of certain non-U.S. common stocks may occur on a frequent basis.
Debt securities, including restricted securities, are valued based on evaluated quotations received from independent pricing services or from dealers who make markets in such securities. For most bond types, the pricing service utilizes matrix pricing which considers one or more of the following factors: yield or price of bonds of comparable quality, coupon, maturity, current cash flows, type, and current day trade information, as well as dealer-supplied prices. These valuations are generally categorized as Level 2 in the hierarchy. Structured debt instruments such as mortgage-backed and asset-backed securities may also incorporate collateral analysis and utilize cash flow models for valuation and are generally categorized as Level 2 in the hierarchy. Pricing services do not provide pricing for all securities and therefore indicative bids from dealers are utilized which are based on pricing models used by market makers in the security and are generally categorized as Level 2 in the hierarchy. Debt securities that are not widely traded, are illiquid, or are internally fair valued by the Valuation Committee, are generally categorized as Level 3 in the hierarchy.
Listed derivatives that are actively traded are valued based on quoted prices from the exchange and are categorized as Level 1 in the hierarchy. Over-the-counter derivative contracts, which include forward currency contracts and equity-linked instruments, do not require material subjectivity as pricing inputs are observed from actively quoted markets and are categorized as Level 2 in the hierarchy.
Investments in open-end mutual funds are valued at NAV. Investments in closed-end funds and ETFs are valued as of the close of regular trading on the NYSE each business day. Both are categorized as Level 1 in the hierarchy.
A summary of the inputs used to value the Funds’ net assets by each major security type is disclosed at the end of the Schedule of Investments for each Fund. The inputs or methodologies used for valuing securities are not necessarily an indication of the risk associated with investing in those securities.
| B. | Security Transactions and Investment Income |
Security transactions are recorded on the trade date. Realized gains and losses from sales of securities are determined on the identified cost basis. Dividend income is recognized on the ex-dividend date or, in the case of certain foreign securities, as soon as a Fund is notified. Interest income is recorded on the accrual basis. Each Fund amortizes premiums and accretes discounts using the effective interest method. Any distributions from underlying funds are recorded in accordance with the character of the distributions as designated by the underlying funds.
| C. | Income Taxes |
Each Fund is treated as a separate taxable entity. It is the intention of each Fund to comply with the requirements of Subchapter M of the Internal Revenue Code and to distribute substantially all of its taxable income to its shareholders. Therefore, no provision for federal income taxes or excise taxes has been made.
Certain Funds may be subject to foreign taxes on income, gains on investments or currency repatriation, a portion of which may be recoverable. Each Fund will accrue such taxes and recoveries as applicable based upon current interpretations of the tax rules and regulations that exist in the markets in which it invests.
Management of the Funds has concluded that there are no significant uncertain tax positions that would require recognition in the financial statements. As of September 30, 2015 the tax years that remain subject to examination by the major tax jurisdictions under the statute of limitations are from the year 2012 forward (with limited exceptions).
| D. | Distributions to Shareholders |
Distributions are recorded by each Fund on the ex-dividend date. Income and capital gain distributions are determined in accordance with income tax regulations which may differ from accounting principles generally accepted in the United States of America. These differences may include the treatment of non-taxable dividends, market premium and discount, non-deductible expenses, expiring capital loss carryovers, foreign currency gain or loss, gain or loss on futures contracts, partnerships, operating losses and losses deferred due to wash sales. Permanent book and tax basis differences relating to shareholder distributions will result in reclassifications to capital paid in on shares of beneficial interest.
| E. | Expenses |
Expenses incurred together by a fund and other affiliated mutual funds are allocated in proportion to the net assets of each such fund, except where allocation of direct expense to each fund or an alternative allocation method can be more appropriately used.
In addition to the net annual operating expenses that a fund bears directly, the shareholders of a fund indirectly bear the pro-rata expenses of any underlying mutual funds in which the fund invests.
| F. | Foreign Currency Translation |
Non-U.S. investment securities and other assets and liabilities denominated in foreign currencies are translated into U.S. dollar amounts at the foreign currency exchange rate effective at the end of the reporting period. Cost of investments is translated at the currency exchange rate effective at the trade date. The gain or loss resulting from a change in currency exchange rates between the trade and settlement date of a portfolio transaction is treated as a gain or loss on foreign currency. Likewise, the gain or loss resulting from a change in currency exchange rates between the date income is accrued and the date it is paid is treated as a gain or loss on foreign currency. The Funds do not isolate that portion of the results of operations arising from changes in foreign exchange rates on investments from the fluctuations arising from changes in the market prices of securities held. Such fluctuations are included with the net realized and unrealized gain or loss on investments.
64
Table of Contents
VIRTUS OPPORTUNITIES TRUST
NOTES TO FINANCIAL STATEMENTS (Continued)
SEPTEMBER 30, 2015
| G. | Short Sales |
($ reported in thousands)
Certain Funds may sell securities short. A short sale is a transaction in which a Fund sells a security it does not own in anticipation of a decline in market price. To sell a security short, a Fund must borrow the security. The Fund’s obligation to replace the security borrowed and sold short will be fully collateralized at all times by the proceeds from the short sale retained by the broker and by cash and securities deposited in a segregated account with the Fund’s custodian. If the price of the security sold short increases between the time of the short sale and the time the Fund replaces the borrowed security, the Fund will realize a loss, and if the price declines during the period, the Fund will realize a gain. Any realized gain will be decreased, and any realized loss increased, by the amount of transaction costs. On ex-dividend date, dividends on short sales are recorded as an expense to the Fund.
In accordance with the terms of its prime brokerage agreement, the Dynamic Trend Fund may receive rebate income or be charged a fee on borrowed securities which is under “Interest Expense on short sales” on the Statements of Operations. Such income or fee is calculated on a daily basis based upon the market value of each borrowed security and a variable rate that is dependent upon the availability of such security.
| H. | Securities Lending |
Certain Funds may loan securities to qualified brokers through an agreement with Brown Brothers Harriman (“BBH”), as a third party lending agent. Under the terms of agreement, a Fund doing so is required to maintain collateral with a market value not less than 100% of the market value of loaned securities. Collateral is adjusted daily in connection with changes in the market value of securities on loan. Collateral may consist of cash and securities issued by the U.S. Government or its agencies. Cash collateral is invested in a short-term money market fund. Dividends earned on the collateral and premiums paid by the broker are recorded as income by the Fund net of fees and rebates charged by BBH for its services as securities lending agent and in connection with this securities lending program. Lending portfolio securities involves a risk of delay in the recovery of the loaned securities or in the declining value of the collateral.
For the period October 1, 2014 to May 10, 2015, the Dynamic Trend Fund loaned securities through an agreement with JP Morgan Clearing Corp. (“JPMCC”). Under the terms of agreement, the Fund loaned directly to JPMCC and in doing was required to maintain collateral with a market value not less than 100% of the market value of loaned securities. Collateral is adjusted daily in connection with changes in the market value of securities on loan. Collateral is received in cash which is invested in additional portfolio securities of the Fund. The Fund paid a fee based on the one-week London Interbank Offering Rate (LIBOR) plus a negotiated spread. For the period ended September 30, 2015, the cost incurred by the Fund is $605 and is disclosed as “Interest Expense” on the Statement of Operations. Effective May 11, 2015, in conjunction with the name and strategy change of this fund, the Fund no longer utilizes securities lending.
At September 30, 2015, none of the Funds had securities on loan.
| Note | 3. Investment Advisory Fees and Related Party Transactions |
($ reported in thousands except as noted)
| A. | Adviser |
Virtus Investment Advisers, Inc. (the “Adviser”), an indirect wholly-owned subsidiary of Virtus Investment Partners, Inc. (“Virtus”), is the adviser to the Trust. The Adviser manages the Funds’ investment programs and general operations of the Funds, including oversight of the Funds’ subadvisers.
As compensation for its services to the Funds, the Adviser is entitled to a fee based upon the following annual rates as a percentage of the average daily net assets (except as otherwise noted) of the following Funds:
| First $2 Billion | $2+ Billion through $4 Billion | $4 + Billion | ||||||||||
Disciplined Equity Style Fund | 1.00 | % | 0.95 | % | 0.90 | % | ||||||
Disciplined Select Bond Fund | 0.80 | 0.75 | 0.70 | |||||||||
Disciplined Select Country Fund | 1.10 | 1.05 | 1.00 | |||||||||
Global Equity Trend Fund | 1.00 | 0.95 | 0.90 | |||||||||
Multi-Asset Trend Fund | 1.00 | 0.95 | 0.90 | |||||||||
| First $1 Billion | $1+ Billion | |||||||||||
Dynamic Trend Fund* | 1.50 | % | 1.40 | % | ||||||||
Herzfeld Fund | 1.00 | 0.95 | ||||||||||
Sector Trend Fund | 0.45 | 0.40 | ||||||||||
| First $10 Billion | $10+ Billion | |||||||||||
Equity Trend Fund | 1.00 | % | 0.95 | % | ||||||||
Alternatives Diversifier Fund – the Adviser has discontinued charging an advisory fee.
| * | The advisory fee is calculated based on the average daily managed assets (“managed assets” means the total assets of the Fund including any assets attributable to borrowings, minus the Fund’s accrued liabilities other than such borrowings). Beginning February 6, 2013, the advisory fee for this Fund became subject to a performance adjustment, which may increase or decrease the advisory fee based upon how well the Fund has performed relative to the S&P 500® Index (“Index”). The fee rate is adjusted by adding or subtracting 0.10% for each 1.00% of absolute performance by which the Fund’s performance exceeds or lags that of the Index. The maximum performance adjustment may be plus or minus 1.00%. Performance is measured for purposes of the performance adjustment over the most recent 36-month period or such shorter period (but not less than 12 months) if the performance fee has been in effect for less than 36 months. For the period ended September 30, 2015 there was a $(16,501) of additional advisory fee expense/(income) related to the performance fee adjustment. Such performance adjustment is included in the Investment Advisory Fees in the Statement of Operations. |
65
Table of Contents
VIRTUS OPPORTUNITIES TRUST
NOTES TO FINANCIAL STATEMENTS (Continued)
SEPTEMBER 30, 2015
| B. | Subadvisers |
The subadvisers manage the investments of each Fund for which they are paid a fee by the Adviser. A list of the subadvisers and the Fund(s) they serve is as follows:
Fund | Subadviser(s) | Fund | Subadviser(s) | |||
| Alternatives Diversifier Fund | Euclid(1) | Equity Trend Fund(5) | Euclid(1) | |||
Disciplined Equity Style Fund | Newfound(2) | Global Equity Trend Fund(5) | Euclid(1) | |||
Disciplined Select Bond Fund | Newfound(2) | Herzfeld Fund | Herzfeld(3) | |||
Disciplined Select Country Fund | Newfound(2) | Multi-Asset Trend Fund(5) | Euclid(1) | |||
| Dynamic Trend Fund(4) | Euclid(1) | Sector Trend Fund(5) | Euclid(1) |
| (1) | Euclid Advisors LLC, an indirect wholly-owned subsidiary of Virtus. |
| (2) | Newfound Investments, LLC, an indirect wholly-owned subsidiary of Virtus. |
| (3) | Thomas J. Herzfeld Advisors, Inc. |
| (4) | For the period of October 1, 2014, to May 10, 2015, F-Squared Alternative Advisors, LLC served as the limited services subadviser. |
| (5) | For the period of October 1, 2014, to May 10, 2015, F-Squared Institutional Advisors, LLC served as the limited services subadviser. |
| C. | Expense Limits and Fee Waivers |
Effective September 1, 2015, the Adviser has contractually agreed to limit certain Funds’ total operating expenses (excluding interest, taxes, extraordinary expenses and acquired fund fees and expenses, if any), so that such expenses do not exceed the percentages of the Fund’s average daily net asset values as listed below through January 31, 2017. For the period of October 1, 2014 through August 31, 2015, the waiver was voluntary.
| Class A | Class C | Class I | Class R6 | |||||||||||||
Disciplined Equity Style Fund | 1.60 | % | 2.35 | % | 1.35 | % | — | % | ||||||||
Disciplined Select Bond Fund | 1.40 | 2.15 | 1.15 | — | ||||||||||||
Disciplined Select Country Fund | 1.70 | 2.45 | 1.45 | — | ||||||||||||
Equity Trend Fund† | 1.70 | 2.45 | 1.45 | 1.38 | ||||||||||||
Global Equity Trend Fund† | 1.75 | 2.50 | 1.50 | — | ||||||||||||
Herzfeld Fund | 1.60 | 2.35 | 1.35 | — | ||||||||||||
Multi-Asset Trend Fund† | 1.75 | 2.50 | 1.50 | — | ||||||||||||
| † | expenses are currently below the cap level. |
| D. | Expense Recapture |
For certain Funds the Adviser may recapture operating expenses waived or reimbursed under these arrangements, within three fiscal years following the end of the fiscal year in which such waiver or reimbursement occurred. The Fund must pay its ordinary operating expenses before the Adviser is entitled to any reimbursement and must remain in compliance with any applicable expense limitations or, if none, the expense limitation in effect at the time of the waiver or reimbursement. All or a portion of the following Adviser reimbursed expenses may be recaptured as follows:
| Fiscal Year Ended | ||||||||||||||||
| 2016 | 2017 | 2018 | Total | |||||||||||||
Alternatives Diversifier Fund | $ | 75 | $ | — | $ | — | $ | 75 | ||||||||
Disciplined Equity Style Fund | 64 | 64 | 57 | 185 | ||||||||||||
Disciplined Select Bond Fund | 64 | 65 | 58 | 187 | ||||||||||||
Disciplined Select Country Fund | 64 | 64 | 58 | 186 | ||||||||||||
Dynamic Trend Fund | 794 | — | — | 794 | ||||||||||||
Herzfeld Fund | 68 | 56 | 40 | 164 | ||||||||||||
| E. | Distributor |
VP Distributors, LLC (“VP Distributors”), an indirect wholly-owned subsidiary of Virtus, serves as the distributor of each Fund’s shares. VP Distributors has advised the Funds that for the fiscal year (the “period”) ended September 30, 2015, it retained net commissions of $262 of Class A shares and deferred sales charges of $264, $(3) and $1,275 for Class A shares, Class B shares and Class C shares respectively.
In addition, each Fund pays VP Distributors distribution and/or service fees under a 12b-1 plan as a percentage of the average daily net assets of each respective class at the annual rates of 0.25%(1) for Class A shares and 1.00%(1)(2) for Class B shares and Class C shares. Class I shares and Class R6 shares are not subject to a 12b-1 plan.
Under certain circumstances, shares of certain Virtus Mutual Funds may be exchanged for shares of the same class of certain other Virtus Mutual Funds on the basis of the relative NAV per share at the time of the exchange. On exchanges with share classes that carry a CDSC, the CDSC schedule of the original shares purchased continues to apply.
| (1) | The Funds invest in ETFs. In addition to the fees listed the Funds bear their proportionate shares of any distribution and shareholder servicing fees of the ETFs. |
| (2) | The Funds’ distributor has contractually agreed to waive its 12b-1 fees applicable to Class C shares to the extent that the Funds’ investments in underlying ETFs with their own 12b-1 fees would otherwise cause the total 12b-1 fees paid directly or indirectly by the Fund to exceed the limits set forth in applicable law or regulation. |
| (3) | Amount is less than $500. |
66
Table of Contents
VIRTUS OPPORTUNITIES TRUST
NOTES TO FINANCIAL STATEMENTS (Continued)
SEPTEMBER 30, 2015
| F. | Administrator and Transfer Agent |
Virtus Fund Services, LLC, an indirect wholly-owned subsidiary of Virtus, serves as the administrator and transfer agent of the Trust.
For the period ended September 30, 2015, the Funds incurred administration fees from the Trust totaling $7,152 which are included in the Statements of Operations.
For the period ended September 30, 2015, the Funds incurred transfer agent fees from the Trust totaling $8,951 which are included in the Statements of Operations. A portion of these fees was paid to outside entities that also provide services to the Trust.
| G. | Affiliated Shareholders |
At September 30, 2015, Virtus and its affiliates held shares of certain Funds which may be redeemed at any time that aggregated the following:
| Shares | Aggregate Net Asset Value | |||||||
Disciplined Equity Style Fund | ||||||||
Class A | 12,976 | $ | 141 | |||||
Class C | 13,024 | 138 | ||||||
Class I | 103,698 | 1,131 | ||||||
Disciplined Select Bond Fund | ||||||||
Class A | 10,373 | 97 | ||||||
Class C | 10,226 | 95 | ||||||
Class I | 83,424 | 778 | ||||||
Disciplined Select Country Fund | ||||||||
Class A | 11,045 | 103 | ||||||
Class C | 10,908 | 101 | ||||||
Class I | 88,728 | 828 | ||||||
Dynamic Trend Fund | ||||||||
Class R6 | 8,980 | 92 | ||||||
Equity Trend Fund | ||||||||
Class R6 | 7,263 | 89 | ||||||
Herzfeld Fund | ||||||||
Class A | 11,379 | 113 | ||||||
Class C | 11,165 | 110 | ||||||
Class I | 91,635 | 909 | ||||||
| H. | Investments in Affiliates |
A summary of the Alternatives Diversifier Fund’s total long-term and short-term purchases and sales of the Class I shares of the affiliated underlying funds(1) during the period ended September 30, 2015 is as follows:
| Value, beginning of period | Purchases(2) | Sales Proceeds | ||||||||||
Virtus Global Commodities Stock Fund | $ | 14,721 | $ | 400 | $ | 13,353 | ||||||
Virtus Global Infrastructure Fund | 24,548 | 3,742 | 10,570 | |||||||||
Virtus Global Real Estate Securities Fund | 10,582 | 317 | 3,930 | |||||||||
Virtus International Real Estate Securities Fund | 13,051 | 2,921 | 7,700 | |||||||||
Virtus Real Estate Securities Fund | 13,261 | 3,658 | 10,905 | |||||||||
Virtus Senior Floating Rate Fund | 11,606 | 4,401 | 3,380 | |||||||||
|
|
|
|
|
| |||||||
| $ | 87,769 | $ | 15,439 | $ | 49,838 | |||||||
|
|
|
|
|
| |||||||
| Value, end of period | Dividend Income | Distributions of Realized Gains | ||||||||||
Virtus Global Commodities Stock Fund | $ | — | $ | — | $ | — | ||||||
Virtus Global Infrastructure Fund | 15,334 | 636 | 224 | |||||||||
Virtus Global Real Estate Securities Fund | 7,542 | 280 | 37 | |||||||||
Virtus International Real Estate Securities Fund | 7,707 | 821 | — | |||||||||
Virtus Real Estate Securities Fund | 7,189 | 138 | 619 | |||||||||
Virtus Senior Floating Rate Fund | 12,164 | 535 | 31 | |||||||||
|
|
|
|
|
| |||||||
| $ | 49,936 | $ | 2,410 | $ | 911 | |||||||
|
|
|
|
|
| |||||||
| (1) | The Alternatives Diversifier Fund does not invest in the underlying funds for the purpose of exercising management or control; however, investments made by the Fund within each of its principal investment strategies may represent a significant portion of an underlying fund’s net assets. At September 30, 2015, the Fund was the owner of record of approximately, 19% of Virtus International Real Estate Securities Fund, 10% of Virtus Global Infrastructure Fund, and 10% of Virtus Global Real Estate Securities Fund. |
| (2) | Includes reinvested dividends from income and capital gain distributions. |
67
Table of Contents
VIRTUS OPPORTUNITIES TRUST
NOTES TO FINANCIAL STATEMENTS (Continued)
SEPTEMBER 30, 2015
| I. | Payment from Affiliate |
During the period the Adviser reimbursed certain funds for losses. These amounts are included in payments by affiliate in the Statements of Operations. These payments by affiliates resulted in an increase in total return of 1.47% and 0.19% for the Disciplined Select Bond Fund and Disciplined Select Country Fund, respectively.
| Note | 4. Purchases and Sales of Securities |
($ reported in thousands)
Purchases and sales of securities (excluding U.S. Government and agency securities, and short-term securities) during the period ended September 30, 2015, were as follows:
| Purchases | Sales | |||||||
Alternatives Diversifier Fund | $ | 50,084 | $ | 80,147 | ||||
Disciplined Equity Style Fund | 16,304 | 13,753 | ||||||
Disciplined Select Bond Fund | 18,150 | 17,640 | ||||||
Disciplined Select Country Fund | 8,440 | 8,410 | ||||||
Dynamic Trend Fund | 7,100,895 | 10,064,947 | ||||||
Equity Trend Fund | 19,827,069 | 26,235,829 | ||||||
Global Equity Trend Fund | 568,348 | 772,829 | ||||||
Herzfeld Fund | 39,918 | 16,146 | ||||||
Multi-Asset Fund | 1,868,394 | 2,397,840 | ||||||
Sector Trend Fund | 2,649,366 | 3,423,318 | ||||||
| Buy Cover | Short Sales | |||||||
Dynamic Trend Fund | $ | 1,642,219 | $ | 1,414,014 | ||||
| Note | 5. Borrowings |
($ reported in thousands)
On July 2, 2015, the Funds and other affiliated Funds entered into a $50,000 secured Line of Credit Agreement (the “Agreement”) with a commercial bank (the “Bank”) that allows the Funds to borrow cash from the Bank to manage large unexpected redemptions and trade fails, up to a limit of one-third or one-fifth of each Fund’s total net assets in accordance with the Agreement. Interest is charged at the higher of the LIBOR (London Interbank Offered Rate) or the Federal Funds rate plus an additional percentage rate on the amount borrowed. Commitment fees are charged on the undrawn balance. The Funds are individually, and not jointly, liable for their particular advances, if any, under the line of credit. The Bank has the ability to require repayment of outstanding borrowings under the Agreement upon certain circumstances such as an event of default.
The Funds had no outstanding borrowings at any time during the period ended September 30, 2015.
68
Table of Contents
VIRTUS OPPORTUNITIES TRUST
NOTES TO FINANCIAL STATEMENTS (Continued)
SEPTEMBER 30, 2015
| Note | 6. Capital Share Transactions |
(reported in thousands)
Transactions in shares of capital stock, during the periods ended as indicated below, were as follows:
| Alternatives Diversifier Fund | Disciplined Equity Style Fund | |||||||||||||||||||||||||||||||
| Year Ended September 30, 2015 | Year Ended September 30, 2014 | Year Ended September 30, 2015 | Year Ended September 30, 2014 | |||||||||||||||||||||||||||||
| SHARES | AMOUNT | SHARES | AMOUNT | SHARES | AMOUNT | SHARES | AMOUNT | |||||||||||||||||||||||||
| Class A | ||||||||||||||||||||||||||||||||
| Sale of shares | 240 | $ | 2,652 | 686 | $ | 7,882 | 151 | $ | 1,829 | 27 | $ | 345 | ||||||||||||||||||||
| Reinvestment of distributions | 55 | 607 | 44 | 492 | 10 | 117 | 2 | 22 | ||||||||||||||||||||||||
| Shares repurchased | (1,209 | ) | (13,179 | ) | (1,956 | ) | (22,483 | ) | (47 | ) | (574 | ) | (10 | ) | (125 | ) | ||||||||||||||||
|
|
|
|
|
|
|
|
|
|
|
|
|
|
|
| |||||||||||||||||
| Net Increase / (Decrease) | (914 | ) | $ | (9,920 | ) | (1,226 | ) | $ | (14,109 | ) | 114 | $ | 1,372 | 19 | $ | 242 | ||||||||||||||||
|
|
|
|
|
|
|
|
|
|
|
|
|
|
|
| |||||||||||||||||
| Class C | ||||||||||||||||||||||||||||||||
| Sale of shares | 75 | $ | 825 | 211 | $ | 2,411 | 140 | $ | 1,670 | 3 | $ | 37 | ||||||||||||||||||||
| Reinvestment of distributions | 28 | 309 | 1 | 16 | 7 | 83 | 1 | 15 | ||||||||||||||||||||||||
| Shares repurchased | (904 | ) | (9,720 | ) | (963 | ) | (10,741 | ) | (30 | ) | (356 | ) | — | (1) | (1 | ) | ||||||||||||||||
|
|
|
|
|
|
|
|
|
|
|
|
|
|
|
| |||||||||||||||||
| Net Increase / (Decrease) | (801 | ) | $ | (8,586 | ) | (751 | ) | $ | (8,314 | ) | 117 | $ | 1,397 | 4 | $ | 51 | ||||||||||||||||
|
|
|
|
|
|
|
|
|
|
|
|
|
|
|
| |||||||||||||||||
| Class I | ||||||||||||||||||||||||||||||||
| Sale of shares | 1,229 | $ | 13,567 | 3,719 | $ | 42,297 | — | $ | — | — | $ | — | ||||||||||||||||||||
| Reinvestment of distributions | 62 | 681 | 43 | 491 | 18 | 212 | 5 | 63 | ||||||||||||||||||||||||
| Shares repurchased | (2,472 | ) | (26,891 | ) | (9,667 | ) | (109,385 | ) | — | — | — | — | ||||||||||||||||||||
|
|
|
|
|
|
|
|
|
|
|
|
|
|
|
| |||||||||||||||||
| Net Increase / (Decrease) | (1,181 | ) | $ | (12,643 | ) | (5,905 | ) | $ | (66,597 | ) | 18 | $ | 212 | 5 | $ | 63 | ||||||||||||||||
|
|
|
|
|
|
|
|
|
|
|
|
|
|
|
| |||||||||||||||||
| Disciplined Select Bond Fund | Disciplined Select Country Fund | |||||||||||||||||||||||||||||||
| Year Ended September 30, 2015 | Year Ended September 30, 2014 | Year Ended September 30, 2015 | Year Ended September 30, 2014 | |||||||||||||||||||||||||||||
| SHARES | AMOUNT | SHARES | AMOUNT | SHARES | AMOUNT | SHARES | AMOUNT | |||||||||||||||||||||||||
| Class A | ||||||||||||||||||||||||||||||||
| Sale of shares | 63 | $ | 614 | — | (1) | $ | 5 | 7 | $ | 75 | 18 | $ | 207 | |||||||||||||||||||
| Reinvestment of distributions | — | (1) | 3 | — | (1) | 3 | 2 | 23 | — | (1) | 4 | |||||||||||||||||||||
| Shares repurchased | (21 | ) | (199 | ) | (6 | ) | (61 | ) | (10 | ) | (100 | ) | (6 | ) | (72 | ) | ||||||||||||||||
|
|
|
|
|
|
|
|
|
|
|
|
|
|
|
| |||||||||||||||||
| Net Increase / (Decrease) | 42 | $ | 418 | (6 | ) | $ | (53 | ) | (1 | ) | $ | (2 | ) | 12 | $ | 139 | ||||||||||||||||
|
|
|
|
|
|
|
|
|
|
|
|
|
|
|
| |||||||||||||||||
| Class C | ||||||||||||||||||||||||||||||||
| Sale of shares | 12 | $ | 119 | 2 | $ | 23 | 7 | $ | 78 | 4 | $ | 45 | ||||||||||||||||||||
| Reinvestment of distributions | — | (1) | — | (2) | — | (1) | 2 | 1 | 11 | — | (1) | 1 | ||||||||||||||||||||
| Shares repurchased | (5 | ) | (50 | ) | — | — | (6 | ) | (60 | ) | — | — | ||||||||||||||||||||
|
|
|
|
|
|
|
|
|
|
|
|
|
|
|
| |||||||||||||||||
| Net Increase / (Decrease) | 7 | $ | 69 | 2 | $ | 25 | 2 | $ | 29 | 4 | $ | 46 | ||||||||||||||||||||
|
|
|
|
|
|
|
|
|
|
|
|
|
|
|
| |||||||||||||||||
| Class I | ||||||||||||||||||||||||||||||||
| Sale of shares | — | $ | — | — | $ | — | 94 | $ | 1,052 | 6 | $ | 77 | ||||||||||||||||||||
| Reinvestment of distributions | 1 | 6 | 2 | 17 | 8 | 78 | 2 | 18 | ||||||||||||||||||||||||
| Shares repurchased | — | — | — | — | (100 | ) | (1,092 | ) | — | — | ||||||||||||||||||||||
|
|
|
|
|
|
|
|
|
|
|
|
|
|
|
| |||||||||||||||||
| Net Increase / (Decrease) | 1 | $ | 6 | 2 | $ | 17 | 2 | $ | 38 | 8 | $ | 95 | ||||||||||||||||||||
|
|
|
|
|
|
|
|
|
|
|
|
|
|
|
| |||||||||||||||||
| (1) | Amount is less than 500. |
| (2) | Amount is less than $500. |
69
Table of Contents
VIRTUS OPPORTUNITIES TRUST
NOTES TO FINANCIAL STATEMENTS (Continued)
SEPTEMBER 30, 2015
| Dynamic Trend Fund | Equity Trend Fund | |||||||||||||||||||||||||||||||
| Year Ended September 30, 2015 | Year Ended September 30, 2014 | Year Ended September 30, 2015 | Year Ended September 30, 2014 | |||||||||||||||||||||||||||||
| SHARES | AMOUNT | SHARES | AMOUNT | SHARES | AMOUNT | SHARES | AMOUNT | |||||||||||||||||||||||||
Class A | ||||||||||||||||||||||||||||||||
| Sale of shares | 4,968 | $ | 55,975 | 36,001 | $ | 459,530 | 14,875 | $ | 216,781 | 54,862 | $ | 915,782 | ||||||||||||||||||||
| Reinvestment of distributions | 6,511 | 71,488 | — | — | 26,015 | 358,962 | 3,699 | 61,192 | ||||||||||||||||||||||||
| Shares repurchased | (50,713 | ) | (574,853 | ) | (38,073 | ) | (504,839 | ) | (115,604 | ) | (1,560,522 | ) | (65,809 | ) | (1,127,085 | ) | ||||||||||||||||
|
|
|
|
|
|
|
|
|
|
|
|
|
|
|
| |||||||||||||||||
| Net Increase / (Decrease) | (39,234 | ) | $ | (447,390 | ) | (2,072 | ) | $ | (45,309 | ) | (74,714 | ) | $ | (984,779 | ) | (7,248 | ) | $ | (150,111 | ) | ||||||||||||
|
|
|
|
|
|
|
|
|
|
|
|
|
|
|
| |||||||||||||||||
| Class B | ||||||||||||||||||||||||||||||||
| Sale of shares | 1 | $ | 12 | 4 | $ | 42 | — | $ | — | — | $ | — | ||||||||||||||||||||
| Reinvestment of distributions | — | (1) | 5 | — | — | — | — | — | — | |||||||||||||||||||||||
| Shares repurchased | (9 | ) | (90 | ) | (4 | ) | (46 | ) | — | — | — | — | ||||||||||||||||||||
|
|
|
|
|
|
|
|
|
|
|
|
|
|
|
| |||||||||||||||||
| Net Increase / (Decrease) | (8 | ) | $ | (73 | ) | — | (1) | $ | (4 | ) | — | $ | — | — | $ | — | ||||||||||||||||
|
|
|
|
|
|
|
|
|
|
|
|
|
|
|
| |||||||||||||||||
| Class C | ||||||||||||||||||||||||||||||||
| Sale of shares | 5,928 | $ | 60,205 | 24,796 | $ | 292,883 | 16,872 | $ | 238,376 | 43,028 | $ | 712,397 | ||||||||||||||||||||
| Reinvestment of distributions | 6,656 | 66,220 | — | (1) | — | (2) | 24,034 | 325,886 | 2,071 | 33,878 | ||||||||||||||||||||||
| Shares repurchased | (34,614 | ) | (343,078 | ) | (4,338 | ) | (52,562 | ) | (93,877 | ) | (1,233,046 | ) | (14,189 | ) | (237,583 | ) | ||||||||||||||||
|
|
|
|
|
|
|
|
|
|
|
|
|
|
|
| |||||||||||||||||
| Net Increase / (Decrease) | (22,030 | ) | $ | (216,653 | ) | 20,458 | $ | 240,321 | (52,971 | ) | $ | (668,784 | ) | 30,910 | $ | 508,692 | ||||||||||||||||
|
|
|
|
|
|
|
|
|
|
|
|
|
|
|
| |||||||||||||||||
| Class I | ||||||||||||||||||||||||||||||||
| Sale of shares | 16,768 | $ | 192,173 | 71,916 | $ | 943,464 | 39,668 | $ | 574,419 | 112,965 | $ | 1,913,873 | ||||||||||||||||||||
| Reinvestment of distributions | 12,609 | 140,330 | — | (1) | — | (2) | 37,699 | 521,659 | 4,322 | 71,756 | ||||||||||||||||||||||
| Shares repurchased | (111,882 | ) | (1,263,054 | ) | (27,004 | ) | (355,406 | ) | (248,990 | ) | (3,469,826 | ) | (62,865 | ) | (1,067,924 | ) | ||||||||||||||||
|
|
|
|
|
|
|
|
|
|
|
|
|
|
|
| |||||||||||||||||
| Net Increase / (Decrease) | (82,505 | ) | $ | (930,551 | ) | 44,912 | $ | 588,058 | (171,623 | ) | $ | (2,373,748 | ) | 54,422 | $ | 917,705 | ||||||||||||||||
|
|
|
|
|
|
|
|
|
|
|
|
|
|
|
| |||||||||||||||||
| Class R6 | ||||||||||||||||||||||||||||||||
| Sale of shares | 8 | $ | 100 | — | $ | — | 6 | $ | 100 | — | $ | — | ||||||||||||||||||||
| Reinvestment of distributions | 1 | 14 | — | — | 1 | 20 | — | — | ||||||||||||||||||||||||
| Plan of Reorganization | — | (1) | — | (2) | — | — | — | (1) | — | (2) | — | — | ||||||||||||||||||||
| Shares repurchased | — | (2) | — | (2) | — | — | — | (2) | — | (2) | — | — | ||||||||||||||||||||
|
|
|
|
|
|
|
|
|
|
|
|
|
|
|
| |||||||||||||||||
| Net Increase / (Decrease) | 9 | $ | 114 | — | $ | — | 7 | $ | 120 | — | $ | — | ||||||||||||||||||||
|
|
|
|
|
|
|
|
|
|
|
|
|
|
|
| |||||||||||||||||
| (1) | Amount is less than 500. |
| (2) | Amount is less than $500. |
70
Table of Contents
VIRTUS OPPORTUNITIES TRUST
NOTES TO FINANCIAL STATEMENTS (Continued)
SEPTEMBER 30, 2015
| Global Equity Trend Fund | Herzfeld Fund | |||||||||||||||||||||||||||||||
| Year Ended September 30, 2015 | Year Ended September 30, 2014 | Year Ended September 30, 2015 | Year Ended September 30, 2014 | |||||||||||||||||||||||||||||
| SHARES | AMOUNT | SHARES | AMOUNT | SHARES | AMOUNT | SHARES | AMOUNT | |||||||||||||||||||||||||
| Class A | ||||||||||||||||||||||||||||||||
| Sale of shares | 1,197 | $ | 13,144 | 3,483 | $ | 42,832 | 612 | $ | 6,823 | 547 | $ | 6,139 | ||||||||||||||||||||
| Reinvestment of distributions | 509 | 5,652 | 137 | 1,674 | 47 | 506 | 18 | 203 | ||||||||||||||||||||||||
| Shares repurchased | (5,916 | ) | (64,685 | ) | (2,333 | ) | (28,792 | ) | (628 | ) | (6,901 | ) | (35 | ) | (391 | ) | ||||||||||||||||
|
|
|
|
|
|
|
|
|
|
|
|
|
|
|
| |||||||||||||||||
| Net Increase / (Decrease) | (4,210 | ) | $ | (45,889 | ) | 1,287 | $ | 15,714 | 31 | $ | 428 | 530 | $ | 5,951 | ||||||||||||||||||
|
|
|
|
|
|
|
|
|
|
|
|
|
|
|
| |||||||||||||||||
| Class C | ||||||||||||||||||||||||||||||||
| Sale of shares | 635 | $ | 6,902 | 2,528 | $ | 30,806 | 967 | $ | 10,722 | 482 | $ | 5,281 | ||||||||||||||||||||
| Reinvestment of distributions | 584 | 6,384 | 107 | 1,299 | 63 | 671 | 22 | 240 | ||||||||||||||||||||||||
| Shares repurchased | (4,770 | ) | (49,901 | ) | (550 | ) | (6,646 | ) | (472 | ) | (5,142 | ) | (41 | ) | (458 | ) | ||||||||||||||||
|
|
|
|
|
|
|
|
|
|
|
|
|
|
|
| |||||||||||||||||
| Net Increase / (Decrease) | (3,551 | ) | $ | (36,615 | ) | 2,085 | $ | 25,459 | 558 | $ | 6,251 | 463 | $ | 5,063 | ||||||||||||||||||
|
|
|
|
|
|
|
|
|
|
|
|
|
|
|
| |||||||||||||||||
| Class I | ||||||||||||||||||||||||||||||||
| Sale of shares | 992 | $ | 11,048 | 5,607 | $ | 69,477 | 1,671 | $ | 18,514 | 149 | $ | 1,689 | ||||||||||||||||||||
| Reinvestment of distributions | 631 | 7,036 | 106 | 1,295 | 52 | 553 | 9 | 100 | ||||||||||||||||||||||||
| Shares repurchased | (7,982 | ) | (88,214 | ) | (1,018 | ) | (12,533 | ) | (499 | ) | (5,352 | ) | (25 | ) | (273 | ) | ||||||||||||||||
|
|
|
|
|
|
|
|
|
|
|
|
|
|
|
| |||||||||||||||||
| Net Increase / (Decrease) | (6,359 | ) | $ | (70,130 | ) | 4,695 | $ | 58,239 | 1,224 | $ | 13,715 | 133 | $ | 1,516 | ||||||||||||||||||
|
|
|
|
|
|
|
|
|
|
|
|
|
|
|
| |||||||||||||||||
| Multi-Asset Trend Fund | Sector Trend Fund | |||||||||||||||||||||||||||||||
| Year Ended September 30, 2015 | Year Ended September 30, 2014 | Year Ended September 30, 2015 | Year Ended September 30, 2014 | |||||||||||||||||||||||||||||
| SHARES | AMOUNT | SHARES | AMOUNT | SHARES | AMOUNT | SHARES | AMOUNT | |||||||||||||||||||||||||
| Class A | ||||||||||||||||||||||||||||||||
| Sale of shares | 1,899 | $ | 20,815 | 6,643 | $ | 78,209 | 11,512 | $ | 142,000 | 10,445 | $ | 153,503 | ||||||||||||||||||||
| Reinvestment of distributions | 1,017 | 11,007 | 184 | 2,162 | 5,546 | 66,431 | 1,358 | 19,450 | ||||||||||||||||||||||||
| Shares repurchased | (9,493 | ) | (100,593 | ) | (4,863 | ) | (57,724 | ) | (23,619 | ) | (281,323 | ) | (9,546 | ) | (142,419 | ) | ||||||||||||||||
|
|
|
|
|
|
|
|
|
|
|
|
|
|
|
| |||||||||||||||||
| Net Increase / (Decrease) | (6,577 | ) | $ | (68,771 | ) | 1,964 | $ | 22,647 | (6,561 | ) | $ | (72,892 | ) | 2,257 | $ | 30,534 | ||||||||||||||||
|
|
|
|
|
|
|
|
|
|
|
|
|
|
|
| |||||||||||||||||
| Class C | ||||||||||||||||||||||||||||||||
| Sale of shares | 2,972 | $ | 31,920 | 12,269 | $ | 142,783 | 9,549 | $ | 113,509 | 5,634 | $ | 81,499 | ||||||||||||||||||||
| Reinvestment of distributions | 2,252 | 24,117 | 274 | 3,169 | 4,741 | 55,847 | 866 | 12,234 | ||||||||||||||||||||||||
| Shares repurchased | (19,312 | ) | (202,149 | ) | (4,846 | ) | (56,666 | ) | (14,803 | ) | (171,575 | ) | (2,662 | ) | (38,901 | ) | ||||||||||||||||
|
|
|
|
|
|
|
|
|
|
|
|
|
|
|
| |||||||||||||||||
| Net Increase / (Decrease) | (14,088 | ) | $ | (146,112 | ) | 7,697 | $ | 89,286 | (513 | ) | $ | (2,219 | ) | 3,838 | $ | 54,832 | ||||||||||||||||
|
|
|
|
|
|
|
|
|
|
|
|
|
|
|
| |||||||||||||||||
| Class I | ||||||||||||||||||||||||||||||||
| Sale of shares | 3,215 | $ | 35,797 | 15,715 | $ | 185,802 | 19,340 | $ | 231,425 | 12,354 | $ | 184,057 | ||||||||||||||||||||
| Reinvestment of distributions | 1,924 | 20,908 | 450 | 5,304 | 5,015 | 60,118 | 784 | 11,234 | ||||||||||||||||||||||||
| Shares repurchased | (24,418 | ) | (262,867 | ) | (11,539 | ) | (135,309 | ) | (29,519 | ) | (353,739 | ) | (5,027 | ) | (74,190 | ) | ||||||||||||||||
|
|
|
|
|
|
|
|
|
|
|
|
|
|
|
| |||||||||||||||||
| Net Increase / (Decrease) | (19,279 | ) | $ | (206,162 | ) | 4,626 | $ | 55,797 | (5,164 | ) | $ | (62,196 | ) | 8,111 | $ | 121,101 | ||||||||||||||||
|
|
|
|
|
|
|
|
|
|
|
|
|
|
|
| |||||||||||||||||
71
Table of Contents
VIRTUS OPPORTUNITIES TRUST
NOTES TO FINANCIAL STATEMENTS (Continued)
SEPTEMBER 30, 2015
| Note | 7. 10% Shareholders |
As of September 30, 2015, certain Funds had individual shareholder account(s) and/or omnibus shareholder account(s) (comprised of a group of individual shareholders), which individually amounted to more than 10% of the total shares outstanding of each such Fund as detailed below.
| % of Shares Outstanding | Number of Accounts | |||||||
Alternatives Diversifier Fund | 21 | % | 2 | |||||
Disciplined Equity Style Fund | 53 | 3 | * | |||||
Disciplined Select Bond Fund | 77 | 2 | * | |||||
Disciplined Select Country Fund | 67 | 1 | * | |||||
Global Equity Trend Fund | 39 | 3 | ||||||
Herzfeld Fund | 59 | 4 | ||||||
Multi-Asset Trend Fund | 18 | 1 | ||||||
| * | Includes affiliated shareholder accounts. |
| Note | 8. Credit Risk and Asset Concentration |
Certain Funds may invest a high percentage of their assets in specific sectors of the market in their pursuit of their investment objectives. Fluctuations in these sectors of concentration may have a greater impact on a Fund, positive or negative, than if the Fund did not concentrate its investments in such sectors. At September 30, 2015, the Dynamic Trend Fund held securities issued by various companies in the Consumer Discretionary sector representing 28% of the total investments of the Fund.
| Note | 9. Indemnifications |
Under the Trust’s organizational documents, its Trustees and officers are indemnified against certain liabilities arising out of the performance of their duties to the Funds. Each Trustee has entered into an indemnification agreement with the Trust. In addition in the normal course of business, the Funds enter into contracts that provide a variety of indemnifications to other parties. The Funds’ maximum exposure under these arrangements is unknown as this would involve future claims that may be made against the Funds and that have not occurred. However, the Funds have not had prior claims or losses pursuant to these arrangements and expect the risk of loss to be remote.
| Note | 10. Exemptive Order |
On August 23, 2010, the SEC issued an amended order under Section 12(d) (1) (J) of the 1940 Act granting an exemption from Sections 12(d) (1) (A) and (B) of the 1940 Act and under Sections 6(c) and 17(b) of the 1940 Act granting an exemption from Section 17(a) of the 1940 Act, which permits the Trust to invest in other affiliated and unaffiliated funds, including exchange-traded funds, in each case subject to certain conditions.
| Note | 11. Federal Income Tax Information |
($ reported in thousands)
At September 30, 2015, federal tax cost and aggregate gross unrealized appreciation (depreciation) of securities held by the Funds were as follows:
| Federal Tax Cost | Unrealized Appreciation | Unrealized (Depreciation) | Net Unrealized Appreciation (Depreciation) | |||||||||||||
Alternative Book | ||||||||||||||||
Alternatives Diversifier Fund | $ | 101,030 | $ | 8,530 | $ | (28,296 | ) | $ | (19,766 | ) | ||||||
Disciplined Equity Style Fund | 4,679 | 24 | (343 | ) | (319 | ) | ||||||||||
Disciplined Select Bond Fund | 1,512 | 6 | (38 | ) | (32 | ) | ||||||||||
Disciplined Select Country Fund | 1,341 | — | (82 | ) | (82 | ) | ||||||||||
Dynamic Trend Fund-investments | 606,480 | 12,611 | (8,681 | ) | 3,930 | |||||||||||
Dynamic Trend Fund securities sold short | (155,502 | ) | 5,034 | — | 5,034 | |||||||||||
Equity Trend Fund | 1,840,381 | 25,838 | (20,395 | ) | 5,443 | |||||||||||
Global Equity Trend Fund | 53,658 | 277 | (447 | ) | (170 | ) | ||||||||||
Herzfeld Fund | 43,262 | 221 | (4,829 | ) | (4,608 | ) | ||||||||||
Multi-Asset Trend Fund | 259,339 | 1,552 | (1,135 | ) | 417 | |||||||||||
Sector Trend Fund | 541,622 | 2,616 | (9,567 | ) | (6,951 | ) | ||||||||||
Certain Funds have capital loss carryovers available to offset future realized capital gains, through the indicated expiration dates shown below:
| 2016 | 2018 | No Expiration | Total | |||||||||||||||||||||||||||||
| Short-Term | Long-Term | Short-Term | Long-Term | Short-Term | Long-Term | Short-Term | Long-Term | |||||||||||||||||||||||||
Alternatives Diversifier Fund | $ | — | $ | — | $ | 49,764 | $ | — | $ | 2,070 | $ | 94 | $ | 51,834 | $ | 94 | ||||||||||||||||
Disciplined Select Bond Fund | — | — | — | — | 16 | 7 | 16 | 7 | ||||||||||||||||||||||||
Dynamic Trend Fund | 24 | — | — | — | 109 | — | 133 | |||||||||||||||||||||||||
Sector Trend Fund | — | — | 1,080 | — | — | — | 1,080 | |||||||||||||||||||||||||
The Trust may not realize the benefit of these losses to the extent each Fund does not realize gains on investments prior to the expiration of the capital loss carryovers.
72
Table of Contents
VIRTUS OPPORTUNITIES TRUST
NOTES TO FINANCIAL STATEMENTS (Continued)
SEPTEMBER 30, 2015
Under the Regulated Investment Company Modernization Act of 2010 (the “Act”), net capital losses recognized for tax years beginning after December 22, 2010, may be carried forward indefinitely, and their character is retained as short-term and/or long-term losses. Previously, net capital losses were carried forward for eight years and treated as short-term losses. As a transition rule, the Act requires that post-enactment net capital losses be used before pre-enactment net capital losses.
For the period ended September 30, 2015, the following Funds utilized losses deferred in prior years against current year capital gains:
Dynamic Trend Fund | $ | 295 | ||
Sector Trend Fund | 360 |
Capital losses realized after October 31 and certain late year ordinary losses may be deferred and treated as occurring on the first day of the following fiscal year. For the fiscal year ended September 30, 2015, the Funds deferred and recognized post-October losses as follows:
| Late Year Ordinary Losses Deferred | Late Year Ordinary Losses Recognized | Capital Loss Deferred | Capital Loss Recognized | |||||||||||||
Alternatives Diversifier Fund | $ | — | $ | — | $ | 2,312 | $ | 1,917 | ||||||||
Disciplined Equity Style Fund | 20 | — | — | — | ||||||||||||
Disciplined Select Bond Fund | — | — | 68 | 8 | ||||||||||||
Disciplined Select Country Fund | — | — | 84 | — | ||||||||||||
Dynamic Trend Fund | — | (1) | — | 117,804 | — | |||||||||||
Equity Trend Fund | 8,830 | — | 386,696 | — | ||||||||||||
Global Equity Trend Fund | 697 | — | 12,075 | — | ||||||||||||
Herzfeld Fund | — | — | 327 | — | ||||||||||||
Multi-Asset Trend Fund | 2,862 | — | 28,691 | — | ||||||||||||
Sector Trend Fund | — | — | 42,987 | — | ||||||||||||
| (1) | Amount is less than $500. |
The components of distributable earnings on a tax basis (excluding unrealized appreciation (depreciation) which are disclosed above) consist of the following:
| Undistributed Ordinary Income | Undistributed Long-Term Capital Gains | |||||||
Alternatives Diversifier Fund | $ | 411 | $ | — | ||||
Disciplined Equity Style Fund | — | 46 | ||||||
Disciplined Select Bond Fund | 1 | — | ||||||
Disciplined Select Country Fund | 4 | — | ||||||
Dynamic Trend Fund | — | — | ||||||
Equity Trend Fund | — | — | ||||||
Global Equity Trend Fund | — | — | ||||||
Herzfeld Fund | — | 460 | ||||||
Multi-Asset Trend Fund | 281 | — | ||||||
Sector Trend Fund | 1,513 | — | ||||||
The differences between the book and tax basis components of distributable earnings relate principally to the timing of recognition of income and gains for federal income tax purposes. Short-term gain distributions reported in the Statements of Changes in Net Assets, if any, are reported as ordinary income for federal tax purposes. Distributions are determined on a tax basis and may differ from net investment income and realized capital gains for financial reporting purposes.
The tax character of dividends and distributions paid during the years ended September 30, 2015 and 2014 was as follows:
| 2015 | 2014 | |||||||||||||||||||||||
| Ordinary income | Long-Term Capital Gains | Total | Ordinary income | Long-Term Capital Gains | Total | |||||||||||||||||||
Alternatives Diversifier Fund | $ | 2,015 | $ | — | $ | 2,015 | $ | 1,928 | $ | — | $ | 1,928 | ||||||||||||
Disciplined Equity Style Fund | 410 | 3 | 413 | 100 | — | 100 | ||||||||||||||||||
Disciplined Select Bond Fund | 9 | — | 9 | 22 | — | 22 | ||||||||||||||||||
Disciplined Select Country Fund | 34 | 78 | 112 | 22 | — | 22 | ||||||||||||||||||
Dynamic Trend Fund | 33,928 | 288,163 | 322,091 | — | — | — | ||||||||||||||||||
Equity Trend Fund | 360,775 | 1,049,270 | 1,410,045 | 150,348 | 50,480 | 200,828 | ||||||||||||||||||
Global Equity Trend Fund | 5,789 | 13,389 | 19,178 | 4,224 | 306 | 4,530 | ||||||||||||||||||
Herzfeld Fund | 1,424 | 315 | 1,739 | 546 | 28 | 574 | ||||||||||||||||||
Multi-Asset Trend Fund | 18,666 | 40,699 | 59,365 | 10,245 | 1,138 | 11,383 | ||||||||||||||||||
Sector Trend Fund | 41,833 | 170,484 | 212,317 | 27,122 | 25,656 | 52,778 | ||||||||||||||||||
73
Table of Contents
VIRTUS OPPORTUNITIES TRUST
NOTES TO FINANCIAL STATEMENTS (Continued)
SEPTEMBER 30, 2015
| Note | 12. Reclassification of Capital Accounts |
($ reported in thousands)
For financial reporting purposes, book basis capital accounts are adjusted to reflect the tax character of permanent book/tax differences. Permanent reclassifications can arise from differing treatment of certain income and gain transactions, nondeductible current year net operating losses, expiring capital loss carryovers and investments in passive foreign investment companies. The reclassifications have no impact on the net assets or net asset value of the Funds. As of September 30, 2015, the Funds recorded reclassifications to increase (decrease) the accounts as listed below:
| Capital Paid in on Shares of Beneficial Interest | Undistributed Net Investment Income (Loss) | Accumulated Net Realized Gain (Loss) | ||||||||||
Alternatives Diversifier Fund | $ | 322 | $ | (168 | ) | $ | (154 | ) | ||||
Disciplined Equity Style Fund | (1 | ) | 1 | — | (1) | |||||||
Disciplined Select Bond Fund | (22 | ) | — | (1) | (22 | ) | ||||||
Disciplined Select Country Fund | (4 | ) | — | (1) | (4 | ) | ||||||
Dynamic Trend Fund | (4,190 | ) | 7,449 | (3,259 | ) | |||||||
Equity Trend Fund | (1,797 | ) | 5,433 | (3,636 | ) | |||||||
Global Equity Trend Fund | (1 | ) | 1 | — | ||||||||
Herzfeld Fund | (— | )(1) | 127 | (127 | ) | |||||||
Multi-Asset Trend Fund | — | (1) | (43 | ) | 43 | |||||||
Sector Trend Fund | 1,230 | 10 | (1,240 | ) | ||||||||
| (1) | Amount is less than $500. |
| Note | 13. Regulatory Matters and Litigation |
From time to time, the Funds’ investment adviser and/or its affiliates and/or subadvisers may be involved in litigation and arbitration as well as examinations and investigations by various regulatory bodies, including the SEC, involving compliance with, among other things, securities laws, client investment guidelines, laws governing the activities of broker-dealers and other laws and regulations affecting their products and other activities. At this time, the Funds’ investment adviser believes that the outcomes of such matters are not likely, either individually or in the aggregate, to be material to these financial statements.
As part of an SEC non-public, confidential investigation of a matter entitled – In the Matter of F-Squared Investments Inc., the SEC staff informed the Funds’ investment adviser that it was inquiring into whether it had violated securities laws or regulations with respect to circumstances related to that matter. On November 16, 2015, without admitting or denying the SEC’s findings, the Funds’ investment adviser consented to the entry of an order providing that it cease and desist from committing or causing any violations and future violations of Sections 204, 206(2) and 206(4) of the Investment Advisers Act of 1940, as amended, and Rules 204-2, 206(4)-1, 206(4)-7 and 206(4)-8 thereunder, and Section 34(b) of the Investment Company Act of 1940, as amended; agreed to a censure; and paid $16.5 million, which included a civil money penalty of $2 million, disgorgement of $13.4 million and prejudgment interest of $1.1 million.
On February 20, 2015, a putative class action complaint (In re Virtus Investment Partners, Inc. Securities Litigation; formerly styled as Tom Cummins v. Virtus Investment Partners Inc. et al) alleging violation of the federal securities laws was filed by an individual shareholder against Virtus and certain of its officers (the “defendants”) in the United States District Court for the Southern District of New York. On August 21, 2015, the lead plaintiff filed a Consolidated Class Action Complaint (the “Consolidated Complaint”) amending the originally filed complaint and adding the Trust as a defendant. The Consolidated Complaint was purportedly filed on behalf of all purchasers of Virtus common stock between January 25, 2013 and May 11, 2015 (the “Class Period”). The Consolidated Complaint alleges that during the Class Period, the defendants knowingly disseminated materially false and misleading statements and concealed material adverse facts relating to certain funds previously subadvised by F-Squared Investments, Inc. and/or its affiliates (“F-Squared”). The plaintiff seeks to recover unspecified damages. Virtus and its affiliates, including the Funds’ adviser, believe that the suit is without merit and intend to defend it vigorously. A motion to dismiss the Consolidated Complaint was filed on behalf of the defendants on October 21, 2015. The Trust believes that the risk of loss to the Funds as a result of this suit is remote. The adviser does not believe that the suit will have any impact on its ability to provide services to the Funds.
On May 8, 2015, a putative class action complaint (Mark Youngers v. Virtus Investment Partners, Inc. et al) alleging violations of certain provisions of the federal securities laws was filed in the United States District Court for the Central District of California. The complaint, which was purportedly filed on behalf of purchasers of certain Virtus Funds previously subadvised by F-Squared between May 8, 2010 and December 22, 2014, inclusive (the “Class Period”), alleges claims against Virtus, certain Virtus officers and affiliates (including the Funds’ investment adviser, Euclid Advisors LLC and VP Distributors, LLC), the trustees and certain officers of the Trust, and certain other parties (the “defendants”). The complaint alleges that during the Class Period the defendants knowingly disseminated materially false and misleading statements and concealed or omitted material facts necessary to make the statements made not misleading. On October 1, 2015, the plaintiff filed a First Amended Class Action Complaint which, among other things, added a derivative claim for breach of fiduciary duty on behalf of the Trust. On October 19, 2015, the Court entered an order transferring the action to the Southern District of New York. Virtus and its affiliates, including the Funds’ adviser, believe the plaintiff’s claims asserted in the complaint are frivolous and intend to defend them vigorously. The Trust believes that the risk of loss to the Funds as a result of this suit is remote. The adviser does not believe that the suit will have any impact on its ability to provide services to the Funds.
| Note | 14. Subsequent Event Evaluations |
Management has evaluated the impact of all subsequent events on the Funds through the date the financial statements were issued, and has determined that the following subsequent events require recognition or disclosure in the financial statements.
On October 22, 2015, the Board of Trustees of the Virtus Opportunities Trust voted to liquidate the Virtus Disciplined Equity Style Fund, Virtus Disciplined Select Bond Fund and Virtus Disciplined Select Country Fund (the “Funds”). Based on the recommendation of management, the Trustees
74
Table of Contents
VIRTUS OPPORTUNITIES TRUST
NOTES TO FINANCIAL STATEMENTS (Continued)
SEPTEMBER 30, 2015
determined that liquidation is in the best interest of the shareholders and voted to direct the mandatory redemption of all shares of the Funds. Effective November 20, 2015, the Funds will be closed to new investors and additional investor deposits.
On or about December 2, 2015 (the “Liquidation Date”), each of the Funds will be liquidated at its net asset value. Prior to such time, shareholders may exchange their shares of the Funds for shares of the same class of any other Virtus Mutual Fund. Shareholders may also redeem their shares at any time prior to the Funds’ liquidation on the Liquidation Date. There will be no fee or sales charges associated with exchange or redemption requests.
The Board of Trustees of Virtus Opportunities Trust (the “Board”), on behalf of Virtus Dynamic Trend Fund, has unanimously approved an Agreement and Plan of Reorganization (“Agreement”) relating to the proposed combination of Virtus Dynamic Trend Fund, a series of Virtus Opportunities Trust, with and into Virtus Equity Trend Fund, a separate series of Virtus Opportunities Trust.
| Merging Fund | Surviving Fund | |
| Virtus Dynamic Trend Fund | Virtus Equity Trend Fund |
The merger is subject to shareholder approval. If approved the merger is expected to take place in 2016.
75
Table of Contents

REPORT OF INDEPENDENT REGISTERED PUBLIC ACCOUNTING FIRM
To the Board of Trustees of
Virtus Opportunities Trust and
Shareholders of the Funds, as defined:
In our opinion, the accompanying statements of assets and liabilities, including the schedules of investments (including the schedule of investments and securities sold short for Virtus Dynamic Trend Fund), and the related statements of operations and of changes in net assets and the financial highlights present fairly, in all material respects, the financial position of Virtus Alternatives Diversifier Fund, Virtus Disciplined Equity Style Fund, Virtus Disciplined Select Bond Fund, Virtus Disciplined Select Country Fund, Virtus Dynamic Trend Fund, Virtus Equity Trend Fund, Virtus Global Equity Trend Fund, Virtus Herzfeld Fund, Virtus Multi-Asset Trend Fund and Virtus Sector Trend Fund (constituting funds within Virtus Opportunities Trust, hereafter referred to as the “Funds”) at September 30, 2015, the results of each of their operations for the year then ended, the changes in each of their net assets for each of the two years in the period then ended and the financial highlights for each of the periods indicated, in conformity with accounting principles generally accepted in the United States of America. These financial statements and financial highlights (hereafter referred to as “financial statements”) are the responsibility of the Funds’ management. Our responsibility is to express an opinion on these financial statements based on our audits. We conducted our audits of these financial statements in accordance with the standards of the Public Company Accounting Oversight Board (United States). Those standards require that we plan and perform the audit to obtain reasonable assurance about whether the financial statements are free of material misstatement. An audit includes examining, on a test basis, evidence supporting the amounts and disclosures in the financial statements, assessing the accounting principles used and significant estimates made by management, and evaluating the overall financial statement presentation. We believe that our audits, which included confirmation of securities at September 30, 2015 by correspondence with the custodian, brokers, and transfer agent of the investee funds, provide a reasonable basis for our opinion.
PricewaterhouseCoopers LLP
Philadelphia, Pennsylvania
November 20, 2015
76
Table of Contents
VIRTUS OPPORTUNITIES TRUST
SEPTEMBER 30, 2015
For the fiscal year ended September 30, 2015, the Funds make the following disclosures for federal income tax purposes. Below is listed the percentages, or the maximum amount allowable, of its ordinary income dividends (“QDI”) to qualify for the lower tax rates applicable to individual shareholders, and the percentage of ordinary income dividends earned by the Funds which qualifies for the dividends received deduction (“DRD”) for corporate shareholders. The actual percentage of QDI and DRD for the calendar year will be designated in year-end tax statements. The Funds designate the amounts below as long-term capital gains dividends (“LTCG”) taxable at a 20% rate, or lower depending on the shareholder’s income ($ reported in thousands). LTCG amounts, if subsequently different, will be designated in the next annual report.
Fund | QDI | DRD | LTCG | |||||||||
Alternatives Diversifier Fund | 69 | % | 21 | % | $ | — | ||||||
Disciplined Equity Style Fund | — | — | 47 | |||||||||
Disciplined Select Country Fund | 89 | 16 | — | |||||||||
Dynamic Trend Fund | — | — | 175,430 | |||||||||
Equity Trend Fund | — | — | 464,699 | |||||||||
Global Equity Trend Fund | 100 | 100 | 1,259 | |||||||||
Herzfeld Fund | 30 | 8 | 560 | |||||||||
Multi-Asset Trend Fund | 100 | 100 | 3,998 | |||||||||
Sector Trend Fund | 38 | 49 | 118,777 | |||||||||
For the fiscal year ended September 30, 2015, certain Funds are disclosing the following information pursuant to notice requirements of Section 853(a) and 855(d) of the Internal Revenue Code, as amended, and the Treasury Regulations thereunder ($ reported in thousands):
| Foreign Source Income Recognized | Foreign Taxes Paid on Foreign Source Income | |||||||
Alternatives Diversifier Fund | $ | 727 | $ | 19 | ||||
Disciplined Select Country Fund | 42 | 4 | ||||||
Herzfeld Fund | 110 | 2 | ||||||
Multi-Asset Trend Fund | 2,571 | 262 | ||||||
77
Table of Contents
Information pertaining to the trustees and officers of the Trust as of September 30, 2015, is set forth below. The statement of additional information (SAI) includes additional information about the trustees and is available without charge, upon request, by calling (800) 243-1574. The address of each individual, unless otherwise noted, is 100 Pearl Street, Hartford, CT 06103-4506. There is no stated term of office for trustees of the Trust.
Independent Trustees
| Name, Year of Birth, Year Elected and Number of Funds Overseen | Principal Occupation(s) During Past 5 Years and Other Directorships Held by Trustee | |
McClellan, Hassell H. YOB: 1945 Elected: 2015 55 Portfolios | Retired. Professor (1984 to 2013), Wallace E. Carroll School of Management, Boston College; Trustee, Virtus Variable Insurance Trust (9 portfolios) (since 2008); Trustee (since 2015), Virtus Mutual Fund Complex (46 portfolios); Trustee, John Hancock Fund Complex (since 2000), John Hancock Funds (collectively, 234 portfolios); and Director (since 2010), Barnes Group, Inc. (diversified global components manufacturer and logistical services company). | |
McLoughlin, Philip YOB: 1946 Elected: 2006 69 Portfolios | Director (since 1991) and Chairman (since 2010), World Trust Fund (closed-end investment firm in Luxembourg); Director (since 1995), closed-end funds managed by Duff & Phelps Investment Management Co. (4 portfolios); Chairman (since 2002) and Trustee (since 1989), Virtus Mutual Fund Complex (46 portfolios); Chairman and Trustee (since 2003), Virtus Variable Insurance Trust (9 portfolios); Trustee/Director and Chairman (since 2011), Virtus Closed-End Funds (3 portfolios); Trustee and Chairman (since 2013), Virtus Alternative Solutions Trust (7 portfolios); Partner (2006 to 2010), Cross Pond Partners, LLC (investment management consultant); and Managing Director (2008 to 2010), SeaCap Partners, LLC (investment management). | |
McNamara, Geraldine M. YOB: 1951 Elected: 2006 59 Funds | Retired. Trustee (since 2001), Virtus Mutual Fund Complex (46 portfolios); and Director (since 2003), closed-end funds managed by Duff & Phelps Investment Management Co. (4 portfolios); and Trustee (since 2015), Virtus Variable Insurance Trust (9 portfolios) | |
Oates, James M. YOB: 1946 Elected: 2006 56 Funds | Managing Director (since 1994), Wydown Group (consulting firm). Trustee (since 1987), Virtus Mutual Fund Complex (46 portfolios); Director (since 1996), Stifel Financial; Director (1998 to 2014), Connecticut River Bancorp; Chairman and Director (1999 to 2014), Connecticut River Bank; Chairman (since 2000), Emerson Investment Management, Inc.; Director (2002 to 2014), New Hampshire Trust Company; Chairman and Trustee (since 2005), John Hancock Fund Complex (228 portfolios); Non-Executive Chairman (2007 to 2011), Hudson Castle Group, Inc. (formerly IBEX Capital Markets, Inc.) (financial services); Trustee/Director (since 2013), Virtus Closed-End Funds (3 portfolios); and Trustee (since 2013), Virtus Alternative Solutions Trust (7 portfolios). | |
Segerson, Richard E. YOB: 1948 Elected: 2006 46 Funds | Trustee (since 1983), Virtus Mutual Fund Complex (46 portfolios); and Managing Director (1998 to 2013), Northway Management Company. | |
Verdonck, Ferdinand L.J. YOB: 1942 Elected: 2006 46 Funds | Trustee (since 2002), Virtus Mutual Fund Complex (46 portfolios). | |
Interested Trustee
The individual listed below is an “interested person” of the Trust, as defined in Section 2(a)(19) of the 1940 Act, as amended, and the rules and regulations thereunder.
| Name, Year of Birth, Year Elected and Number of Funds Overseen | Principal Occupation(s) During Past 5 Years and Other Directorships Held by Trustee | |
Aylward, George R.* Trustee and President YOB: 1964 Elected: 2006 67 Funds | Director, President and Chief Executive Officer (since 2008), Virtus Investment Partners, Inc. and/or certain of its subsidiaries; various senior officer positions with Virtus affiliates (since 2005); Trustee (since 2006), Virtus Mutual Funds (46 portfolios); Chairman, President and Chief Executive Officer (since 2006), The Zweig Closed-End Funds (2 portfolios); Trustee (since 2012) and President (since 2010), Virtus Variable Insurance Trust (9 portfolios); Trustee and President (since 2011), Virtus Closed-End Funds (3 portfolios); Director (since 2013), Virtus Global Funds, PLC (2 portfolios); and Trustee (since 2013), Virtus Alternative Solutions Trust (7 portfolios). | |
78
Table of Contents
FUND MANAGEMENT TABLES (Continued)
Officers of the Trust Who Are Not Trustees
Name, Address and Year of Birth | Position(s) Held with Trust and Length of Time Served | Principal Occupation(s) During Past 5 Years | ||
Waltman, Francis G. YOB: 1962 | Executive Vice President (since 2013); Senior Vice President (2008-2013). | Virtus Investment Partners, Inc. and/or certain of its subsidiaries; various senior officer positions (since 2006) with Virtus affiliates; Executive Vice President (since 2013), Senior Vice President (2008 to 2013), Virtus Mutual Fund Complex; Executive Vice President (since 2013), Senior Vice President (2010 to 2013), Virtus Variable Insurance Trust; Executive Vice President (since 2013), Senior Vice President (2011 to 2013), Virtus Closed-End Funds; Director (since 2013), Virtus Global Funds PLC; and Executive Vice President (since 2013), Virtus Alternative Solutions Trust. | ||
Bradley, W. Patrick YOB: 1972 | Senior Vice President (since 2013); Vice President (2011 to 2013); Chief Financial Officer and Treasurer (since 2006). | Senior Vice President, Fund Services (since 2010), Virtus Investment Partners, Inc. and/or certain of its subsidiaries; various officer positions (since 2006) with Virtus affiliates; Senior Vice President (since 2013), Vice President (2011 to 2013), Chief Financial Officer and Treasurer (since 2004), Virtus Variable Insurance Trust; Senior Vice President (since 2013), Vice President (2011 to 2013), Chief Financial Officer and Treasurer (since 2006), Virtus Mutual Fund Complex; Senior Vice President (since 2013), Vice President (2012 to 2013) and Treasurer (Chief Financial Officer) (since 2007), The Zweig Closed-End Funds; Senior Vice President (since 2013), Vice President (2011 to 2013), Chief Financial Officer and Treasurer (since 2011), Virtus Closed-End Funds; Vice President and Assistant Treasurer (since 2011), Duff & Phelps Global Utility Income Fund Inc.; Director (since 2013), Virtus Global Funds, PLC; and Senior Vice President, Chief Financial Officer and Treasurer (since 2013), Virtus Alternative Solutions Trust. | ||
Carr, Kevin J. YOB: 1954 | Senior Vice President, since 2013; Vice President (2005-2013); Chief Legal Officer, Counsel and Secretary (since 2005). | Senior Vice President (since 2009), Vice President, Counsel and Secretary (2008 to 2009), Virtus Investment Partners, Inc. and/or certain of its subsidiaries; various senior officer positions (since 2005) with Virtus affiliates; Senior Vice President (since 2013), Vice President (2005 to 2013), Chief Legal Officer, Counsel and Secretary (since 2005), Virtus Mutual Fund Complex; Senior Vice President (2013 to 2014), Vice President (2012 to 2013) and Assistant Secretary (since 2012), Secretary and Chief Legal Officer (2005 to 2012), The Zweig Closed-End Funds; Assistant Secretary (since 2013), Vice President, Chief Legal Officer, Counsel and Secretary (2010 to 2013), Virtus Variable Insurance Trust; Vice President and Assistant Secretary (since 2011), Duff & Phelps Global Utility Income Fund Inc.; Senior Vice President and Assistant Secretary (2013 to 2014), Vice President and Assistant Secretary (2012 to 2013), Vice President, Chief Legal Officer, Counsel and Secretary (2011 to 2012), Virtus Closed-End Funds; and Assistant Secretary (since 2013), Virtus Alternative Solutions Trust. | ||
Engberg, Nancy J. YOB: 1956 | Vice President and Chief Compliance Officer since 2011. | Vice President (since 2008) and Chief Compliance Officer (2008 to 2011), Virtus Investment Partners, Inc. and/or certain of its subsidiaries; various officer positions (since 2003) with Virtus affiliates; Vice President and Chief Compliance Officer (since 2011), Virtus Mutual Fund Complex; Vice President (since 2010), Chief Compliance Officer (since 2011), Virtus Variable Insurance Trust; Vice President and Chief Compliance Officer (since 2011), Virtus Closed-End Funds; Vice President and Chief Compliance Officer (since 2012), The Zweig Closed-End Funds; and Vice President and Chief Compliance Officer (since 2013), Virtus Alternative Solutions Trust. | ||
79
Table of Contents
Virtus Disciplined Equity Style Fund, Virtus Disciplined Select Bond Fund,
Virtus Disciplined Select Country Fund, Virtus Equity Trend Fund,
Virtus Global Equity Trend Fund, Virtus Herzfeld Fund and
Virtus Multi-Asset Trend Fund each a series of Virtus Opportunities Trust
Supplement dated September 1, 2015 to the Summary Prospectuses dated January 28, 2015,
as supplemented, and the Virtus Opportunities Trust Statutory Prospectus,
dated January 28, 2015, as supplemented.
IMPORTANT NOTICE TO INVESTORS
Virtus Disciplined Equity Style Fund
Under “Fees and Expenses” in the fund’s summary prospectus and the summary section of the statutory prospectus, the “Annual Fund Operating Expenses” table and associated footnotes are hereby replaced with the following:
| Annual Fund Operating Expenses (expenses that you pay each year as a percentage of the value of your investment) | Class A | Class C | Class I | |||||||||
Management Fees | 1.00 | % | 1.00 | % | 1.00 | % | ||||||
Distribution and Shareholder Servicing (12b-1) Fees | 0.25 | % | 1.00 | % | None | |||||||
Other Expenses | 3.72 | % | 3.72 | % | 3.72 | % | ||||||
Acquired Fund Fees and Expenses | 0.23 | % | 0.23 | % | 0.23 | % | ||||||
Total Annual Fund Operating Expenses(b) | 5.20 | % | 5.95 | % | 4.95 | % | ||||||
Less: Expense Reimbursement(c) | (3.60 | %) | (3.60 | %) | (3.60 | %) | ||||||
Total Annual Fund Operating Expenses After Expense Reimbursement(b)(c) | 1.60 | % | 2.35 | % | 1.35 | % | ||||||
| (b) | The Total Annual Fund Operating Expenses do not correlate to the ratio of expenses to average net assets appearing in the Financial Highlights tables, which tables reflect only the operating expenses of the fund and do not include acquired fund fees and expenses. |
| (c) | The fund’s investment adviser has contractually agreed to limit the fund’s total operating expenses (excluding dividend and interest expenses, taxes, brokerage commissions, extraordinary expenses and acquired fund fees and expenses) so that such expenses do not exceed 1.60% for Class A Shares, 2.35% for Class C Shares and 1.35% for Class I Shares through January 31, 2017. Following the contractual period, the adviser may discontinue these expense reimbursement arrangements at any time. Under certain conditions, the adviser may recapture operating expenses reimbursed under these arrangements for a period of three years following the fiscal year in which such reimbursement occurred. |
Under “Fees and Expenses, the “Example” table is hereby replaced with the following:
| Share Status | 1 Year | 3 Years | 5 Years | 10 Years | ||||||||||||||
Class A | Sold or Held | $ | 728 | $ | 1,410 | $ | 2,454 | $ | 5,045 | |||||||||
Class C | Sold | $ | 338 | $ | 1,107 | $ | 2,337 | $ | 5,311 | |||||||||
| Held | $ | 238 | $ | 1,107 | $ | 2,337 | $ | 5,311 | ||||||||||
Class I | Sold or Held | $ | 137 | $ | 812 | $ | 1,877 | $ | 4,543 | |||||||||
Virtus Disciplined Select Bond Fund
Under “Fees and Expenses” in the fund’s summary prospectus and the summary section of the statutory prospectus, the “Annual Fund Operating Expenses” table and associated footnotes are hereby replaced with the following:
| Annual Fund Operating Expenses (expenses that you pay each year as a percentage of the value of your investment) | Class A | Class C | Class I | |||||||||
Management Fees | 0.80 | % | 0.80 | % | 0.80 | % | ||||||
Distribution and Shareholder Servicing (12b-1) Fees | 0.25 | % | 1.00 | % | None | |||||||
Other Expenses | 6.23 | % | 6.23 | % | 6.23 | % | ||||||
Acquired Fund Fees and Expenses | 0.20 | % | 0.20 | % | 0.20 | % | ||||||
Total Annual Fund Operating Expenses(b) | 7.48 | % | 8.23 | % | 7.23 | % | ||||||
Less: Expense Reimbursement(c) | (6.08 | %) | (6.08 | %) | (6.08 | %) | ||||||
Total Annual Fund Operating Expenses After Expense Reimbursement(b)(c) | 1.40 | % | 2.15 | % | 1.15 | % | ||||||
| (b) | The Total Annual Fund Operating Expenses do not correlate to the ratio of expenses to average net assets appearing in the Financial Highlights tables, which tables reflect only the operating expenses of the fund and do not include acquired fund fees and expenses. |
| (c) | The fund’s investment adviser has contractually agreed to limit the fund’s total operating expenses (excluding dividend and interest expenses, taxes, brokerage commissions, extraordinary expenses and acquired fund fees and expenses) so that such expenses do not exceed 1.40% for Class A Shares, 2.15% for Class C Shares and 1.15% for Class I Shares through January 31, 2017. Following the contractual period, the adviser may discontinue these expense reimbursement arrangements at any time. Under certain conditions, the adviser may recapture operating expenses reimbursed under these arrangements for a period of three years following the fiscal year in which such reimbursement occurred. |
Table of Contents
Under “Fees and Expenses, the “Example” table is hereby replaced with the following:
| Share Status | 1 Year | 3 Years | 5 Years | 10 Years | ||||||||||||||
Class A | Sold or Held | $ | 512 | $ | 1,417 | $ | 2,887 | $ | 6,255 | |||||||||
Class C | Sold | $ | 318 | $ | 1,299 | $ | 2,930 | $ | 6,568 | |||||||||
| Held | $ | 218 | $ | 1,299 | $ | 2,930 | $ | 6,568 | ||||||||||
Class I | Sold or Held | $ | 117 | $ | 1,010 | $ | 2,501 | $ | 5,947 | |||||||||
Virtus Disciplined Select Country Fund
Under “Fees and Expenses” in the fund’s summary prospectus and the summary section of the statutory prospectus, the “Annual Fund Operating Expenses” table and associated footnotes are hereby replaced with the following:
| Annual Fund Operating Expenses (expenses that you pay each year as a percentage of the value of your investment) | Class A | Class C | Class I | |||||||||
Management Fees | 1.10 | % | 1.10 | % | 1.10 | % | ||||||
Distribution and Shareholder Servicing (12b-1) Fees | 0.25 | % | 1.00 | % | None | |||||||
Other Expenses | 5.10 | % | 5.10 | % | 5.10 | % | ||||||
Acquired Fund Fees and Expenses | 0.47 | % | 0.47 | % | 0.47 | % | ||||||
Total Annual Fund Operating Expenses(b) | 6.92 | % | 7.67 | % | 6.67 | % | ||||||
Less: Expense Reimbursement(c) | (5.22 | %) | (5.22 | %) | (5.22 | %) | ||||||
Total Annual Fund Operating Expenses After Expense Reimbursement(b)(c) | 1.70 | % | 2.45 | % | 1.45 | % | ||||||
| (b) | The Total Annual Fund Operating Expenses do not correlate to the ratio of expenses to average net assets appearing in the Financial Highlights tables, which tables reflect only the operating expenses of the fund and do not include acquired fund fees and expenses. |
| (c) | The fund’s investment adviser has contractually agreed to limit the fund’s total operating expenses (excluding dividend and interest expenses, taxes, brokerage commissions, extraordinary expenses and acquired fund fees and expenses) so that such expenses do not exceed 1.70% for Class A Shares, 2.45% for Class C Shares and 1.45% for Class I Shares through January 31, 2017. Following the contractual period, the adviser may discontinue these expense reimbursement arrangements at any time. Under certain conditions, the adviser may recapture operating expenses reimbursed under these arrangements for a period of three years following the fiscal year in which such reimbursement occurred. |
Under “Fees and Expenses, the “Example” table is hereby replaced with the following:
| Share Status | 1 Year | 3 Years | 5 Years | 10 Years | ||||||||||||||
Class A | Sold or Held | $ | 738 | $ | 1,595 | $ | 2,935 | $ | 6,064 | |||||||||
Class C | Sold | $ | 348 | $ | 1,298 | $ | 2,827 | $ | 6,305 | |||||||||
| Held | $ | 248 | $ | 1,298 | $ | 2,827 | $ | 6,305 | ||||||||||
Class I | Sold or Held | $ | 148 | $ | 1,010 | $ | 2,393 | $ | 5,653 | |||||||||
Virtus Herzfeld Fund
Under “Fees and Expenses” in the fund’s summary prospectus and the summary section of the statutory prospectus, the “Annual Fund Operating Expenses” table and associated footnotes are hereby replaced with the following:
| Annual Fund Operating Expenses (expenses that you pay each year as a percentage of the value of your investment) | Class A | Class C | Class I | |||||||||
Management Fees | 1.00 | % | 1.00 | % | 1.00 | % | ||||||
Distribution and Shareholder Servicing (12b-1) Fees | 0.25 | % | 1.00 | % | None | |||||||
Other Expenses | 0.68 | % | 0.68 | % | 0.68 | % | ||||||
Acquired Fund Fees and Expenses | 1.58 | % | 1.58 | % | 1.58 | % | ||||||
Total Annual Fund Operating Expenses(b) | 3.51 | % | 4.26 | % | 3.26 | % | ||||||
Less: Expense Reimbursement(c) | (1.91 | %) | (1.91 | %) | (1.91 | %) | ||||||
Total Annual Fund Operating Expenses After Expense Reimbursement(b)(c) | 1.60 | % | 2.35 | % | 1.35 | % | ||||||
| (b) | The Total Annual Fund Operating Expenses do not correlate to the ratio of expenses to average net assets appearing in the Financial Highlights tables, which tables reflect only the operating expenses of the fund and do not include acquired fund fees and expenses. |
| (c) | The fund’s investment adviser has contractually agreed to limit the fund’s total operating expenses (excluding dividend and interest expenses, taxes, brokerage commissions, extraordinary expenses and acquired fund fees and expenses) so that such expenses do not exceed 1.60% for Class A Shares, 2.35% for Class C Shares and 1.35% for Class I Shares through January 31, 2017. Following the contractual period, the adviser may discontinue these expense reimbursement arrangements at any time. Under certain conditions, the adviser may recapture operating expenses reimbursed under these arrangements for a period of three years following the fiscal year in which such reimbursement occurred. |
Table of Contents
Under “Fees and Expenses, the “Example” table is hereby replaced with the following:
| Share Status | 1 Year | 3 Years | 5 Years | 10 Years | ||||||||||||||
Class A | Sold or Held | $ | 728 | $ | 1,243 | $ | 1,972 | $ | 3,891 | |||||||||
Class C | Sold | $ | 338 | $ | 933 | $ | 1,844 | $ | 4,182 | |||||||||
| Held | $ | 238 | $ | 933 | $ | 1,844 | $ | 4,182 | ||||||||||
Class I | Sold or Held | $ | 137 | $ | 633 | $ | 1,358 | $ | 3,284 | |||||||||
Virtus Disciplined Equity Style Fund, Virtus Disciplined Select Bond Fund, Virtus Disciplined Select Country Fund, Virtus Equity Trend Fund, Virtus Global Equity Trend Fund, Virtus Herzfeld Fund and Virtus Multi-Asset Trend Fund
The first paragraph and the information in the first table in the section “More Information About Fund Expenses” on page 139 of the statutory prospectus are hereby revised with the following information for the above referenced funds:
Virtus Investment Advisers, Inc. (“VIA”) has contractually agreed to limit the total operating expenses (excluding dividend and interest expenses, taxes, brokerage commissions, leverage expenses, extraordinary expenses and acquired fund fees and expenses, if any) of certain of the funds so that expenses do not exceed, on an annualized basis, the amounts indicated in the following table.
| Class A Shares | Class B Shares | Class C Shares | Class I Shares | Class R6 Shares | Class T Shares | Through Date | |||||||||||||||||||||
Virtus Disciplined Equity Style Fund | 1.60 | % | N/A | 2.35 | % | 1.35 | % | N/A | N/A | January 31, 2017 | ||||||||||||||||||
Virtus Disciplined Select Bond Fund | 1.40 | % | N/A | 2.15 | % | 1.15 | % | N/A | N/A | January 31, 2017 | ||||||||||||||||||
Virtus Disciplined Select Country Fund | 1.70 | % | N/A | 2.45 | % | 1.45 | % | N/A | N/A | January 31, 2017 | ||||||||||||||||||
Virtus Equity Trend Fund(1) | 1.70 | % | N/A | 2.45 | % | 1.45 | % | 1.38 | % | N/A | January 31, 2017 | |||||||||||||||||
Virtus Global Equity Trend Fund(1) | 1.75 | % | N/A | 2.50 | % | 1.50 | % | N/A | N/A | January 31, 2017 | ||||||||||||||||||
Virtus Herzfeld Fund | 1.60 | % | N/A | 2.35 | % | 1.35 | % | N/A | N/A | January 31, 2017 | ||||||||||||||||||
Virtus Multi-Asset Trend Fund(1) | 1.75 | % | N/A | 2.50 | % | 1.50 | % | N/A | N/A | January 31, 2017 | ||||||||||||||||||
| (1) | Fund expenses currently below the capped level. |
Investors should retain this supplement with the Prospectuses for future reference.
VOT 8020/7FundsNewExpCap&Waiver (09/15)
Table of Contents
FUND MANAGEMENT TABLES (Continued)
(UNAUDITED)
VIRTUS OPPORTUNITIES TRUST
101 Munson Street
Greenfield, MA 01301-9668
Trustees
George R. Aylward
Hassell H. McClellan
Philip R. McLoughlin, Chairman
Geraldine M. McNamara
James M. Oates
Richard E. Segerson
Ferdinand L.J. Verdonck
Officers
George R. Aylward, President
Francis G. Waltman, Executive Vice President
W. Patrick Bradley, Senior Vice President, Chief Financial Officer and Treasurer
Kevin J. Carr, Senior Vice President, Chief Legal Officer, Counsel and Secretary
Nancy J. Engberg, Vice President and Chief Compliance Officer
Investment Adviser
Virtus Investment Advisers, Inc.
100 Pearl Street
Hartford, CT 06103-4506
Principal Underwriter
VP Distributors, LLC
100 Pearl Street
Hartford, CT 06103-4506
Administrator and Transfer Agent
Virtus Fund Services, LLC
100 Pearl Street
Hartford, CT 06103-4506
Custodian
JPMorgan Chase Bank, NA
1 Chase Manhattan Plaza,
New York, NY 10005-1401
Independent Registered Public
Accounting Firm
PricewaterhouseCoopers LLP
2001 Market Street
Philadelphia PA 19103-7042
How to Contact Us
Mutual Fund Services | 1-800-243-1574 | |
Adviser Consulting Group | 1-800-243-4361 | |
Web site | Virtus.com |
Important Notice to Shareholders
The Securities and Exchange Commission has modified mailing regulations for semiannual and annual shareholder fund reports to allow mutual fund companies to send a single copy of these reports to shareholders who share the same mailing address. If you would like additional copies, please call Mutual Fund Services at 1-800-243-1574.
Table of Contents
| ||
P.O. Box 9874 Providence, RI 02940-8074 |

For more information about Virtus Mutual Funds,
please call your financial representative, or contact us
at 1-800-243-1574 or Virtus.com
| 8454 | 11-15 |
Table of Contents

ANNUAL REPORT
Virtus Foreign Opportunities Fund
September 30, 2015
TRUST NAME: VIRTUS OPPORTUNITIES TRUST
Not FDIC Insured
No Bank Guarantee
May Lose Value

Table of Contents
Virtus Foreign Opportunities Fund
(“Foreign Opportunities Fund”)
| 1 | ||||
| 2 | ||||
| 4 | ||||
| 6 | ||||
| 10 | ||||
| 13 | ||||
| 14 | ||||
| 15 | ||||
| 16 | ||||
| 17 | ||||
| 26 | ||||
| 27 | ||||
| 28 |
PROXY VOTING PROCEDURES AND VOTING RECORD (FORM N-PX)
The subadviser votes proxies relating to portfolio securities in accordance with procedures that have been approved by the Board of Trustees of the Trust (“Trustees,” or the “Board��). You may obtain a description of these procedures, along with information regarding how the Fund voted proxies during the most recent 12-month period ended June 30, free of charge, by calling toll-free 1-800-243-1574. This information is also available through the Securities and Exchange Commission’s (the “SEC”) website at http://www.sec.gov.
FORM N-Q INFORMATION
The Trust files a complete schedule of portfolio holdings for the Fund with the SEC for the first and third quarters of each fiscal year on Form N-Q. Form N-Q is available on the SEC’s website at http://www.sec.gov. Form N-Q may be reviewed and copied at the SEC’s Public Reference Room. Information on the operation of the SEC’s Public Reference Room can be obtained by calling toll-free 1-800-SEC-0330.
This report is not authorized for distribution to prospective investors in the Virtus Foreign Opportunities Fund unless preceded or accompanied by an effective prospectus which includes information concerning the sales charge, the Fund’s record and other pertinent information.
Table of Contents
To My Fellow Shareholders of Virtus Mutual Funds:
 | I am pleased to present this annual report that reviews the performance of your fund for the twelve months ended September 30, 2015.
During this period, global equity markets were challenged by falling oil prices, China’s economic slowdown, Greece’s debt crisis, and the growing likelihood of an interest rate hike by the Federal Reserve (the “Fed”). Volatility took its toll on major U.S. equity indices for the twelve months ended September 30, 2015. The large-cap S&P 500® Index and Dow Jones Industrial AverageSM moderately declined 0.61% and 2.11%, respectively, while the technology-heavy NASDAQ Composite Index® gained 4.00%. By comparison, international equities were down even further, with emerging markets hit particularly hard. | |
Against this backdrop, U.S. Treasuries remained an attractive “safe haven” among global investors. The bellwether 10-year U.S. Treasury yield declined from 2.52% at September 30, 2014 to 2.06% at September 30, 2015. Fixed income assets experienced slight losses in anticipation of the Fed’s stated intention to raise interest rates at the end of 2015. The Barclays U.S. Aggregate Bond Index, which tracks Treasuries and other investment-grade debt securities, gained 2.94% for the twelve-month period ended September 30, 2015, while non-investment grade bonds underperformed, with the Barclays U.S. Corporate High Yield Bond Index down 3.43% for the same period.
The strength of the global economy is likely to remain a concern for the markets in the months ahead. Actions by the Fed and other global central banks will be watched with great interest. Following the weak start to the year, the U.S. economy exhibited growth over the second and third quarters of 2015 – including stronger jobs, housing, and consumer spending data – and gives investors reason for optimism. Future market direction will be determined largely by the ability of corporations to continue to produce robust earnings.
Market uncertainty serves as a constant reminder of the importance of portfolio diversification, including exposure to both traditional and alternative asset classes. While diversification cannot guarantee a profit or prevent a loss, owning a variety of asset classes may provide a cushion against inevitable market fluctuations. Your financial advisor can help you ensure that your portfolio is adequately diversified across asset classes and investment strategies.
As always, thank you for entrusting Virtus with your assets. Should you have questions about your account or require assistance, please visit our website at www.Virtus.com, or call our customer service team at 1-800-243-1574. We appreciate your business and remain committed to your long-term financial success.
Sincerely,
George R. Aylward President, Virtus Mutual Funds
October 2015
Performance data quoted represents past results. Past performance is no guarantee of future results, and current performance may be higher or lower than the performance shown above. | ||

1
Table of Contents
VIRTUS FOREIGN OPPORTUNITIES FUND
DISCLOSURE OF FUND EXPENSES (Unaudited)
FOR THE SIX-MONTH PERIOD OF APRIL 1, 2015 TO SEPTEMBER 30, 2015
We believe it is important for you to understand the impact of costs on your investment. All mutual funds have operating expenses. As a shareholder of the Virtus Foreign Opportunities Fund (the “Fund”) you may incur two types of costs: (1) transaction costs, including sales charges on purchases of Class A shares and contingent deferred sales charges on Class C shares; and (2) ongoing costs, including investment advisory fees, distribution and service fees, and other expenses. Class I shares and Class R6 shares are sold without a sales charge and do not incur distribution and service fees. For further information regarding applicable sales charges, see Note 1 in the Notes to Financial Statements. These examples are intended to help you understand your ongoing costs (in dollars) of investing in the Fund and to compare these costs with the ongoing costs of investing in other mutual funds. These examples are based on an investment of $1,000 invested at the beginning of the period and held for the entire six-month period. The following Expense Table illustrates your Fund’s costs in two ways.
Actual Expenses
The first section of the accompanying table provides information about actual account values and actual expenses. You may use the information in this section, together with the amount you invested, to estimate the expenses that you paid over the period. Simply divide your account value by $1,000 (for example, an $8,600 account value divided by $1,000 = 8.6), then multiply the result by the number in the first section under the heading “Expenses Paid During Period” to estimate the expenses you paid on your account during the period.
Hypothetical Example for Comparison Purposes
The second section of the accompanying table provides information about hypothetical account values and hypothetical expenses based on the Fund’s actual expense ratio and an assumed rate of return of 5% per year before expenses, which is not your Fund’s actual return. The hypothetical account values and expenses may not be used to estimate the actual ending account balance or expenses you paid for the period. You may use this information to compare the ongoing costs of investing in your Fund and other funds. To do so, compare these 5% hypothetical examples with the 5% hypothetical examples that appear in the shareholder reports of the other funds.
Please note that the expenses shown in the accompanying table are meant to highlight your ongoing costs only and do not reflect any transactional costs, such as sales charges or contingent deferred sales charges. Therefore, the second section of the accompanying table is useful in comparing ongoing costs only, and will not help you determine the relative total costs of owning different funds. In addition, if these transactional costs were included, your costs would have been higher. The calculations assume no shares were bought or sold during the period. Your actual costs may have been higher or lower, depending on the amount of your investment and the timing of any purchases or redemptions.
2
Table of Contents
VIRTUS FOREIGN OPPORTUNITIES FUND
DISCLOSURE OF FUND EXPENSES (Unaudited) (Continued)
FOR THE SIX-MONTH PERIOD OF APRIL 1, 2015 TO SEPTEMBER 30, 2015
| Expense Table | ||||||||||||||||
Beginning April 1, 2015 | Ending September 30, 2015 | Annualized Expense Ratio | Expenses Paid During Period* | |||||||||||||
Actual | ||||||||||||||||
Class A | $ | 1,000.00 | $ | 963.10 | 1.43 | % | $ | 7.04 | ||||||||
Class C | 1,000.00 | 959.40 | 2.18 | 10.71 | ||||||||||||
Class I | 1,000.00 | 964.30 | 1.18 | 5.81 | ||||||||||||
| Class R6 | 1,000.00 | 965.00 | 1.07 | 5.27 | ||||||||||||
Hypothetical (5% return before expenses) |
| |||||||||||||||
Class A | 1,000.00 | 1,017.81 | 1.43 | 7.26 | ||||||||||||
Class C | 1,000.00 | 1,014.00 | 2.18 | 11.07 | ||||||||||||
Class I | 1,000.00 | 1,019.08 | 1.18 | 5.99 | ||||||||||||
| Class R6 | 1,000.00 | 1,019.64 | 1.07 | 5.43 | ||||||||||||
| * | Expenses are equal to the Fund’s annualized expense ratio, which is net of waived fees and reimbursed expenses, if applicable, multiplied by the average account value over the period, multiplied by the number of days (183) expenses were accrued in the most recent fiscal half-year, then divided by 365 to reflect the one-half year period. |
| The Fund may invest in other funds, and the annualized expense ratios noted above do not reflect fees and expenses associated with the underlying funds. If such fees and expenses were included, the expenses would have been higher. |
| You can find more information about the Fund’s expenses in the Financial Statements section that follows. For additional information on operating expenses and other shareholder costs, refer to the prospectus. |
3
Table of Contents
VIRTUS FOREIGN OPPORTUNITIES FUND
SEPTEMBER 30, 2015
(Unaudited)
American Depositary Receipt (ADR)
Represents shares of foreign companies traded in U.S. dollars on U.S. exchanges that are held by a U.S. bank or trust. Foreign companies use ADRs in order to make it easier for Americans to buy their shares.
Barclays U.S. Aggregate Bond Index
The Barclays U.S. Aggregate Bond Index measures the U.S. investment grade fixed rate bond market. The index is calculated on a total return basis. The index is unmanaged its returns do not reflect any fees, expenses, or sales charges, and it is not available for direct investment.
Barclays U.S. Corporate High Yield Bond Index
The Barclays U.S. Corporate High Yield Bond Index measures the U.S. dollar-denominated, high yield, fixed-rate corporate bond market. The index is calculated on a total return basis. The index is unmanaged, its returns do not reflect any fees, expenses, or sales charges, and it is not available for direct investment.
Dow Jones Industrial AverageSM
A price weighted average of 30 blue chip stocks. The index is calculated on total return basis with dividends reinvested. The index is unmanaged, its returns do not reflect any fees, expenses, or sales charges, and it is not available for direct investment.
Federal Reserve (the “Fed”)
The Central Bank of the United States, responsible for controlling the money supply, interest rates and credit with the goal of keeping the U.S. economy and currency stable. Governed by a seven-member board, the system includes 12 regional Federal Reserve Banks, 25 branches and all national and state banks that are part of the system.
MSCI EAFE® Index (net)
A free float-adjusted market capitalization-weighted index that measures developed foreign market equity performance, excluding the U.S. and Canada. The index is calculated on a total return basis with net dividends reinvested. The index is unmanaged its returns do not reflect any fees, expenses, or sales charges, and it is not available for direct investment.
MSCI Emerging Markets Index (net)
The MSCI Emerging Markets Index (net) is a free float-adjusted market capitalization-weighted index designed to measure equity market performance in the global emerging markets. The index is calculated on a total return basis with net dividends reinvested. The index is unmanaged, its returns do not reflect any fees, expenses, or sales charges, and it is not available for direct investment.
MSCI Europe Index (net)
The MSCI Europe Index (net) is a free float-adjusted market capitalization weighted index that measures equity market performance of the developed markets in Europe. The index is calculated on a total return basis with net dividends reinvested. The index is unmanaged, its returns do not reflect any fees, expenses, or sales charges, and it is not available for direct investment.
4
Table of Contents
VIRTUS FOREIGN OPPORTUNITIES FUND (Continued)
SEPTEMBER 30, 2015
(Unaudited)
NASDAQ Composite Index®
A market-capitalization weighted index of the more than 3,000 common equities listed on the Nasdaq stock exchange. Unlike other market indexes, the NASDAQ composite is not limited to companies that have U.S. headquarters. The index is unmanaged, its returns do not reflect any fees, expenses or sales charges, and it is not available for direct investment.
Quantitative Easing
A government monetary policy occasionally used to increase the money supply by buying government securities or other securities from the market. Quantitative Easing increases the money supply by flooding financial institutions with capital in an effort to promote increased lending and liquidity.
Real Estate Investment Trust (REIT)
A publicly traded company that owns, develops, and operates income producing real estate such as apartments, office buildings, hotels, shopping centers, and other commercial properties.
S&P 500® Index
The S&P 500® Index is a free-float market capitalization-weighted index of 500 of the largest U.S. companies. The index is calculated on a total return basis with dividends reinvested. The index is unmanaged its returns do not reflect any fees, expenses, or sales charges, and it is not available for direct investment.
5
Table of Contents
VIRTUS FOREIGN OPPORTUNITIES FUND
Fund Summary Portfolio Manager Commentary by Vontobel Asset Management, Inc. | Ticker Symbols: Class A: JVIAX Class C: JVICX Class R6: VFOPX Class I: JVXIX |
| ¢ | The Fund is diversified and has an investment objective of long-term capital appreciation. |
| ¢ | For the fiscal year ended September 30, 2015, the Fund’s Class A shares at NAV returned -2.41%, Class C shares returned -3.13% Class I shares returned -2.16% and Class R6 shares from November 14, 2014 (inception date) through September 30, 2015, returned -3.84%*. For the fiscal year, the S&P® 500 Index, a broad-based equity index, returned -0.61% and the MSCI EAFE® Index (net), the Fund’s style-specific index appropriate for comparison, returned -8.66%. |
| * | Returns less than 1 year are not annualized. |
All performance figures assume reinvestment of distribution and exclude the effect of sales charges. Past performance is no guarantee of future results, and current performance may be higher or lower than the performance shown.
How did the market perform during the Fund’s fiscal year?
| ¢ | The MSCI EAFE® Index was down in fiscal Q1, positive in fiscal Q2, essentially flat in fiscal Q3, and negative in fiscal Q4 as global markets sold off. |
| ¢ | Concerns over global growth and uncertainty driven by the U.S. Federal Reserve’s decision in September to postpone its pending interest rate hike negatively impacted global equities at the end of the one-year period. |
| ¢ | Towards the end of 2014, European equities struggled as disappointing economic data was released and the European Central Bank lowered its growth forecasts for the eurozone economy. However, European equities entered positive territory in the beginning of 2015, bolstered by central bank bond purchases. By mid-year, the Greek debt crisis impacted European markets, which experienced losses through September, as the effects of the Chinese slowdown and a scandal at German auto |
manufacturer Volkswagen weighed on investor sentiment. Over the one-year period ended September 30, 2015, European equities (as represented by the MSCI Europe Index) returned -9.33% in U.S. dollar terms. The euro experienced a significant devaluation, declining more than 11.5% against the U.S. dollar over the period. |
| ¢ | Falling commodity prices and a strengthening U.S. dollar drove emerging markets to negative territory at the end of 2014. Emerging markets entered 2015 with positive momentum with promising developments occurring in India, where equities benefited from two unexpected central bank rate cuts and a greater government focus on infrastructure spending. After reaching highs in late April, driven by soaring Chinese equity markets, emerging markets experienced steep declines as concerns over China’s weak macroeconomic data, Beijing’s unexpected move to devalue its currency, and substantial Chinese equity market volatility led to a global market sell-off in August. Emerging markets suffered far worse than their developed market counterparts. Currencies of many developing countries tumbled as well. Emerging market equities (as represented by the MSCI Emerging Markets Index) returned -19.28% in U.S. dollar terms over the one-year period ended September 30, 2015. |
What factors affected the Fund’s performance during its fiscal year?
| ¢ | The following discussion highlights specific stocks – those that provided the largest contribution to absolute performance and those that were the largest detractors for the quarter. As bottom-up stock pickers, we hope that the Fund’s shareholders find this useful and gain a greater understanding of how we invest their capital. |
Stocks that Helped Absolute Performance
| ¢ | HDFC Bank is a high-quality Indian private sector bank which has been a cornerstone |
For information regarding the indexes and certain investment terms, see Key Investment Terms starting on page 4.
6
Table of Contents
| VIRTUS FOREIGN OPPORTUNITIES FUND (Continued) |
investment in the portfolio for many years. HDFC Bank released solid F1Q2016 results. We believe that its cutting its benchmark (base rate) lending rate will likely accelerate its market share gains. HDFC Bank is the largest privately owned retail bank in India with a network of 3,659 branches and 11,633 ATMs (many outside of branches) across 2,287 towns and cities nationwide at calendar year-end 2014. The bank has delivered solid growth while maintaining high credit and underwriting standards. HDFC Bank has a strong deposit franchise and powerful technology backbone that has allowed it to significantly grow earnings over the past 10 years. |
| ¢ | Paddy Power, an Irish gaming company, has been a long-held and successful position in our strategies. It is predominantly a technology company as much of gambling has moved online. The company has a powerful brand and a fun, innovative, and edgy image. Its business footprint currently spans only jurisdictions where it can operate legally, which is a rarity in the global online gaming marketplace. Most competitors in the online space have been happy to cross into geographies where gambling is not legal, tempted by the short-term buck to be made. Paddy Power has consistently kept its gaming nose clean and mainly operates in Ireland, the United Kingdom, France, Italy, and Australia through direct or business-to-business operating ventures. Specifically, Paddy Power has been extremely successful in Australia and, by far, has become the market leader there. Paddy Power’s stock performed well over the period as it released 1H2015 results that exceeded expectations and announced that it has reached an agreement on the key terms of a merger with Betfair, which would create one the world’s largest public online betting and gaming companies. In our view, the merger brings together two very strong businesses to create an even stronger business. And, since Betfair is currently managed by many former Paddy Power employees, it is a good cultural fit. We believe the combined company will be |
a long-term industry winner in online gaming, particularly in the U.K. In our view, Paddy Power has a bright future as penetration to online continues to grow and the company is growing its online business with existing customers. |
Stocks that Hurt Absolute Performance
| ¢ | Baidu disappointed over the period with continued weakness in margins as the company is spending heavily on marketing to drive adoption of its online-to-offline (O2O) platforms. We agree that longer term O2O is the right strategy as it allows Baidu to take a higher share of revenues from completed transactions in local services areas, such as food delivery. Longer term, as search revenue slows down, we think O2O transactions will become a more important growth driver for the company; however, shorter term, the investment required is impacting margins. We believe the majority of these investments are discretionary and will be pulled back over the years. The core search business continues to perform well with revenue growth in the 30-35% range as the investments the company has made in promoting mobile search are coming to fruition. However, the O2O strategy is not driving incremental revenue growth for the near term and intense competition for the O2O markets continues to be strong. This is necessitating Baidu to spend more aggressively on marketing and promotion to try to win market share, which is not value added from its shareholders’ perspective, and continues to drag down margins. |
| ¢ | Enbridge is the largest liquid pipeline in Canada. It is the backbone system to move oil from the Alberta region to Eastern Canada and the United States. We think that the underperformance of the stock reflects the sharp correction in oil prices. In a scenario of long-term low oil prices, there is risk that oil producers in Canada will need to start cutting production targets. And, this will have a negative impact on Enbridge’s long-term growth trajectory. |
For information regarding the indexes and certain investment terms, see the Key Investment Terms on page 4.
7
Table of Contents
| VIRTUS FOREIGN OPPORTUNITIES FUND (Continued) |
The preceding information is the opinion of portfolio management. Any such opinions are subject to change at any time based upon market or other conditions and should not be relied upon as investment advice. Past performance is no guarantee of future results, and there is no guarantee that market forecasts will be realized
Past performance is not indicative of future results. Any performance results portrayed reflect the reinvestment of dividends and other earnings. Any companies described in this commentary may or may not currently represent a position in our client portfolios. Also, any sector and industry weights described in the commentary may or may not have changed since the writing of this commentary. The information and methodology described in this commentary should not be construed as a recommendation to purchase or sell securities.
Any projections, forecasts or estimates contained in this commentary are based on a variety of estimates and assumptions. There can be no assurance that the estimates or assumptions made will prove accurate, and actual results may differ materially.
In the event a company described in this commentary is a position in client portfolios, the securities identified and described do not represent all of the securities purchased, sold or recommended. The reader should not assume that an investment in any securities identified was or will be profitable or that investment recommendations or investment decisions we make in the future will be profitable.
There is no guarantee that the Fund will meet its objective.
Equity Securities: The market price of equity securities may be adversely affected by financial market, industry, or issuer-specific events. Focus on a particular style or on small or medium-sized companies may enhance that risk.
Foreign & Emerging Markets: Investing internationally, especially in emerging markets, involves additional risks such as currency, political, accounting, economic, and market risk.
Industry/Sector Concentration: A fund that focuses its investments in a particular industry or sector will be more sensitive to conditions that affect that industry or sector than a non-concentrated fund.
Prospectus: For additional information on risks, please see the fund’s prospectus.
| Asset Allocations | ||||
The following table presents asset allocations within certain sectors and as a percentage of total investments as of September 30, 2015.
|
| |||
Consumer Staples | 39 | % | ||
Health Care | 19 | |||
Financials | 16 | |||
Consumer Discretionary | 12 | |||
Information Technology | 6 | |||
Industrials | 3 | |||
Energy | 2 | |||
Other (includes short-term investments and securities lending collateral) | 3 | |||
|
| |||
Total | 100 | % | ||
|
| |||
For information regarding the indexes and certain investment terms, see the Key Investment Terms on page 4.
8
Table of Contents
| VIRTUS FOREIGN OPPORTUNITIES FUND (Continued) |
| Average Annual Total Returns1 for periods ended 9/30/15 | ||||||||||||||||||||
1 Year | 5 Years | 10 Years | Since Inception | Inception Date | ||||||||||||||||
| Class A Shares at NAV2 | -2.41 | % | 5.51 | % | 5.21 | % | — | — | ||||||||||||
| Class A Shares at POP3,4 | -8.03 | 4.27 | 4.59 | — | — | |||||||||||||||
| Class C Shares at NAV2 and with CDSC4 | -3.13 | 4.73 | 4.42 | — | — | |||||||||||||||
| Class I Shares at NAV | -2.16 | 5.78 | — | 3.85 | % | 5/15/06 | ||||||||||||||
| Class R6 Shares at NAV | — | — | — | -3.84 | 11/14/14 | |||||||||||||||
| S&P 500® Index | -0.61 | 13.34 | 6.80 | — | 5,6 | — | ||||||||||||||
| MSCI EAFE® Index (net) | -8.66 | 3.98 | 2.97 | — | 5,6 | — | ||||||||||||||
Fund Expense Ratios7: A Shares: 1.43%; C Shares: 2.18%; I Shares: 1.18%; R6 Shares: 1.06%.
All returns represent past performance which is no guarantee of future results. Current performance may be higher or lower than the performance shown. The investment return and principal value of an investment will fluctuate so that an investor’s shares, when redeemed, may be worth more or less than their original cost. The above table and graph below do not reflect the deduction of taxes that a shareholder would pay on fund distributions or the redemption of fund shares. Please visit Virtus.com for performance data current to the most recent month-end.
| 1 | Total returns are historical and include changes in share price and the reinvestment of both dividends and capital gains distributions. |
| 2 | “NAV” (Net Asset Value) total returns do not include the effect of any sales charge. |
| 3 | “POP” (Public Offering Price) total returns include the effect of the maximum front-end 5.75% sales charge. |
| 4 | “CDSC” (contingent deferred sales charge) is applied to redemptions of certain classes of shares that do not have a sales charge applied at the time of purchase. CDSC charges for certain redemptions of Class A shares made within 18 months of purchases in which a finder’s fee was paid and all Class C shares are 1% within the first year and 0% thereafter. |
| 5 | The index returned 6.53% for Class I shares and -4.06% for Class R6 shares since the inception date of the respective class. |
| 6 | The index returned 1.21% for Class I shares and 6.92% for Class R6 shares since the inception date of the respective class. |
| 7 | The expense ratios of the Fund are set forth according to the prospectus for the Fund effective January 28, 2015, as supplemented and revised, and may differ from the expense ratios disclosed in the Financial Highlights tables in this report. See the Financial Highlights for more current expense ratios. |
Growth of $10,000 for periods ended 9/30
This chart assumes an initial investment of $10,000 made on September 30, 2005, for Class A and Class C shares including any applicable sales charges or fees. Performance assumes reinvestment of dividends and capital gain distributions.

The indexes are unmanaged and not available for direct investment; therefore, their performance does not reflect the expenses associated with active management of an actual portfolio.
9
Table of Contents
VIRTUS FOREIGN OPPORTUNITIES FUND
SEPTEMBER 30, 2015
($ reported in thousands)
| SHARES | VALUE | |||||||
| COMMON STOCKS—100.3% | ||||||||
| Consumer Discretionary—11.7% | ||||||||
Alimentation Couche-Tard, Inc. Class B (Canada) | 737,102 | $ | 33,897 | |||||
Domino’s Pizza Group plc (United Kingdom) | 1,866,480 | 25,073 | ||||||
Hermes International SA (France) | 64,826 | 23,542 | ||||||
Naspers Ltd. Class N (South Africa) | 201,463 | 25,159 | ||||||
Paddy Power plc (Ireland) | 196,111 | 22,615 | ||||||
Persimmon plc (United Kingdom) | 1,140,508 | 34,644 | ||||||
Priceline Group, Inc. (The) (United States)(2) | 32,212 | 39,841 | ||||||
|
| |||||||
| 204,771 | ||||||||
|
| |||||||
| Consumer Staples—39.3% | ||||||||
AmorePacific Corp. (South Korea) | 11,041 | 3,598 | ||||||
British American Tobacco plc (United Kingdom) | 2,140,720 | 117,973 | ||||||
Chocoladefabrike Lindt & Spruengli AG (Switzerland) | 5,714 | 33,507 | ||||||
Diageo plc (United Kingdom) | 1,046,354 | 28,025 | ||||||
Imperial Tobacco Group plc (United Kingdom) | 876,111 | 45,234 | ||||||
ITC Ltd. (India) | 8,440,838 | 42,325 | ||||||
L’Oreal SA (France) | 155,938 | 27,017 | ||||||
Nestle S.A. Registered Shares (Switzerland) | 1,201,979 | 90,340 | ||||||
Philip Morris International, Inc. (United States) | 1,068,236 | 84,743 | ||||||
Reckitt Benckiser Group plc (United Kingdom) | 881,695 | 79,853 | ||||||
SABMiller plc (United Kingdom) | 1,057,756 | 59,796 | ||||||
Unicharm Corp. (Japan) | 952,100 | 16,863 | ||||||
Unilever N.V. CVA (Netherlands) | 1,552,727 | 62,270 | ||||||
|
| |||||||
| 691,544 | ||||||||
|
| |||||||
| SHARES | VALUE | |||||||
| Energy—2.3% | ||||||||
Enbridge, Inc. (Canada) | 1,092,113 | $ | 40,550 | |||||
|
| |||||||
| Financials—16.3% | ||||||||
Banco Bilbao Vizcaya Argentaria S.A. (Spain) | 2,375,686 | 20,122 | ||||||
Daito Trust Construction Co., Ltd. (Japan) | 204,400 | 20,768 | ||||||
Housing Development Finance Corp. (India) | 4,954,412 | 91,793 | ||||||
Housing Development Finance Corp. Bank Ltd. (India) | 4,854,967 | 79,311 | ||||||
Housing Development Finance Corp. Bank Ltd. ADR (India) | 15,574 | 952 | ||||||
Link REIT (The) (Hong Kong) | 3,398,857 | 18,712 | ||||||
Lloyds Banking Group plc (United Kingdom) | 18,936,054 | 21,530 | ||||||
UBS Group AG (Switzerland) | 1,808,503 | 33,420 | ||||||
|
| |||||||
| 286,608 | ||||||||
|
| |||||||
| Health Care—19.6% | ||||||||
Bayer AG Registered Shares (Germany) | 316,592 | 40,488 | ||||||
Coloplast A/S Class B (Denmark) | 169,840 | 12,023 | ||||||
CSL Ltd. (Australia) | 636,420 | 40,052 | ||||||
Essilor International SA (France) | 285,871 | 34,786 | ||||||
Fresenius Medical Care AG & Co. KGaA (Germany) | 232,700 | 18,155 | ||||||
Grifols SA (Spain) | 666,364 | 27,472 | ||||||
Novo Nordisk A/S Class B (Denmark) | 1,038,937 | 55,733 | ||||||
Ramsay Health Care Ltd. (Australia) | 708,704 | 29,230 | ||||||
Roche Holding AG (Switzerland) | 301,680 | 79,552 | ||||||
Sonic Healthcare Ltd. (Australia) | 618,141 | 7,951 | ||||||
|
| |||||||
| 345,442 | ||||||||
|
| |||||||
See Notes to Financial Statements
10
Table of Contents
VIRTUS FOREIGN OPPORTUNITIES FUND
SCHEDULE OF INVESTMENTS (Continued)
SEPTEMBER 30, 2015
($ reported in thousands)
| SHARES | VALUE | |||||||
| COMMON STOCKS (continued) | ||||||||
| Industrials—3.2% | ||||||||
Bureau Veritas SA (France) | 1,272,260 | $ | 26,776 | |||||
Cheung Kong Infrastructure Holdings Ltd. (Hong Kong)(3) | 2,109,989 | 18,911 | ||||||
DKSH Holding AG (Switzerland) | 149,876 | 9,481 | ||||||
|
| |||||||
| 55,168 | ||||||||
|
| |||||||
| Information Technology—6.5% | ||||||||
Accenture plc Class A (United States) | 117,595 | 11,555 | ||||||
Google, Inc. Class C (United States)(2) | 58,173 | 35,394 | ||||||
Paypal Holdings, Inc. (United States)(2) | 1,206,222 | 37,441 | ||||||
SAP SE (Germany) | 471,577 | 30,536 | ||||||
|
| |||||||
| 114,926 | ||||||||
|
| |||||||
| Materials—1.4% | ||||||||
Air Liquide SA (France) | 205,676 | 24,281 | ||||||
| TOTAL COMMON STOCKS (Identified Cost $1,394,119) | 1,763,290 | |||||||
| TOTAL LONG TERM INVESTMENTS—100.3% | ||||||||
| (Identified Cost $1,394,119) | 1,763,290 | |||||||
| SHORT-TERM INVESTMENTS—0.7% | ||||||||
| Money Market Mutual Fund—0.7% | ||||||||
Fidelity Money Market Portfolio – Institutional Shares (seven-day effective yield 0.170%) | 12,963,290 | 12,963 | ||||||
| TOTAL SHORT-TERM INVESTMENTS | ||||||||
| (Identified Cost $12,963) | 12,963 | |||||||
| SHARES | VALUE | |||||||
| SECURITIES LENDING COLLATERAL—0.5% | ||||||||
INVESCO Trust Short-Term Investments Liquid Assets Portfolio (The) Institutional Shares (seven-day effective yield 0.160%)(4) | 9,258,540 | $ | 9,259 | |||||
| TOTAL SECURITIES LENDING COLLATERAL | ||||||||
| (Identified Cost $9,259) | 9,259 | |||||||
| TOTAL INVESTMENTS—101.5% (Identified Cost $1,416,341) | 1,785,512 | (1) | ||||||
Other assets and liabilities, |
| (25,664 | ) | |||||
|
| |||||||
| NET ASSETS—100.0% | $ | 1,759,848 | ||||||
|
| |||||||
Abbreviations:
| ADR American | Depositary Receipt |
| REIT Real | Estate Investment Trust |
Footnote Legend:
| (1) | Federal Income Tax Information: For tax information at September 30, 2015, see Note 9 Federal Income Tax Information in the Notes to Financial Statements. |
| (2) | Non-income producing. |
| (3) | All or a portion of security is on loan. |
| (4) | Represents security purchased with cash collateral received for securities on loan. |
| Country Weightings (Unaudited)† | ||||
United Kingdom | 23 | % | ||
Switzerland | 14 | |||
United States | 13 | |||
India | 12 | |||
France | 8 | |||
Germany | 5 | |||
Australia | 4 | |||
Other | 21 | |||
Total | 100 | % | ||
| † | % of total investments as of September 30, 2015 |
For information regarding the abbreviations, See Key Investment Terms starting on page 4
See Notes to Financial Statements
11
Table of Contents
VIRTUS FOREIGN OPPORTUNITIES FUND
SCHEDULE OF INVESTMENTS (Continued)
SEPTEMBER 30, 2015
($ reported in thousands)
The following table provides a summary of inputs used to value the Fund’s investments as of September 30, 2015 (See Security Valuation Note 2A in the Notes to Financial Statements):
| Total Value at September 30, 2015 | Level 1 Quoted Prices | Level 2 Significant Observable Inputs | ||||||||||
Equity Securities: | ||||||||||||
Common Stocks | $ | 1,763,290 | $ | 1,393,776 | $ | 369,514 | ||||||
Securities Lending Collateral | 9,259 | 9,259 | — | |||||||||
Short-Term Investments | 12,963 | 12,963 | — | |||||||||
|
|
|
|
|
| |||||||
Total Investments | $ | 1,785,512 | $ | 1,415,998 | $ | 369,514 | ||||||
|
|
|
|
|
| |||||||
There are no Level 3 (significant unobservable inputs) priced securities.
Securities held by the Fund with an end of period value of $341,102 were transferred from Level 1 to Level 2 based on our valuation procedures for non-U.S. securities (See Notes 2A in the Notes to Financial Statements).
See Notes to Financial Statements
12
Table of Contents
VIRTUS FOREIGN OPPORTUNITIES FUND
STATEMENT OF ASSETS AND LIABILITIES
SEPTEMBER 30, 2015
(Reported in thousands except shares and per share amounts)
| Assets | ||||
Investment in securities at value(1)(3) | $ | 1,785,512 | ||
Foreign currency at value(2) | — | (4) | ||
| Receivables | ||||
Investment securities sold | 8,944 | |||
Fund shares sold | 1,872 | |||
Dividends and interest receivable | 2,518 | |||
Tax reclaims | 3,667 | |||
Securities Lending Receivable | 4 | |||
Prepaid expenses | 112 | |||
Prepaid trustee retainer | 31 | |||
|
| |||
Total assets | 1,802,660 | |||
|
| |||
| Liabilities | ||||
| Payables | ||||
Fund shares repurchased | 18,908 | |||
Collateral on securities loaned | 9,259 | |||
Investment securities purchased | 12,220 | |||
Investment advisory fees | 1,244 | |||
Distribution and service fees | 181 | |||
Administration fees | 178 | |||
Transfer agent fees and expenses | 578 | |||
Trustees’ fees and expenses | 3 | |||
Professional fees | 39 | |||
Other accrued expenses | 202 | |||
|
| |||
Total liabilities | 42,812 | |||
|
| |||
| Net Assets | $ | 1,759,848 | ||
|
| |||
| Net Assets Consist of: | ||||
Capital paid in on shares of beneficial interest | $ | 1,625,762 | ||
Accumulated undistributed net investment income (loss) | 11,585 | |||
Accumulated undistributed net realized gain (loss) | (246,530 | ) | ||
Net unrealized appreciation (depreciation) on investments | 369,031 | |||
|
| |||
| Net Assets | $ | 1,759,848 | ||
|
| |||
| Class A | ||||
Net asset value (net assets/shares outstanding) per share | $ | 27.21 | ||
Maximum offering price per share NAV/(1–5.75%) | $ | 28.87 | ||
Shares of beneficial interest outstanding, $0.001 par value, unlimited authorization | 14,934,979 | |||
Net Assets | $ | 406,429 | ||
| Class C | ||||
Net asset value (net assets/shares outstanding) and offering price per share | $ | 26.95 | ||
Shares of beneficial interest outstanding, $0.001 par value, unlimited authorization | 4,362,522 | |||
Net Assets | $ | 117,568 | ||
| Class I | ||||
Net asset value (net assets/shares outstanding) and offering price per share | $ | 27.23 | ||
Shares of beneficial interest outstanding, $0.001 par value, unlimited authorization | 45,227,449 | |||
Net Assets | $ | 1,231,349 | ||
| Class R6 | ||||
Net asset value (net assets/shares outstanding) and offering price per share | $ | 27.24 | ||
Shares of beneficial interest outstanding, $0.001 par value, unlimited authorization | 165,248 | |||
Net Assets | $ | 4,502 | ||
(1) Investment in securities at cost | $ | 1,416,341 | ||
(2) Foreign currency at cost | $ | — | (4) | |
(3) Market value of securities on loan | $ | 8,835 | ||
(4) Amount is less than $500. | ||||
See Notes to Financial Statements
13
Table of Contents
VIRTUS FOREIGN OPPORTUNITIES FUND
YEAR ENDED SEPTEMBER 30, 2015
($ reported in thousands)
| Investment Income | ||||
Dividends | $ | 46,840 | ||
Security lending | 201 | |||
Foreign taxes withheld | (2,556 | ) | ||
|
| |||
Total investment income | 44,485 | |||
|
| |||
| Expenses | ||||
Investment advisory fees | 16,386 | |||
Service fees, Class A | 1,197 | |||
Distribution and service fees, Class C | 1,223 | |||
Administration fees | 2,317 | |||
Transfer agent fees and expenses | 3,006 | |||
Registration fees | 94 | |||
Printing fees and expenses | 138 | |||
Custodian fees | 246 | |||
Professional fees | 96 | |||
Trustees’ fees and expenses | 65 | |||
Miscellaneous expenses | 107 | |||
|
| |||
Total expenses | 24,875 | |||
|
| |||
| Net investment income (loss) | 19,610 | |||
|
| |||
| Net Realized and Unrealized Gain (Loss) on Investments | ||||
Net realized gain (loss) on investments | (54,525 | ) | ||
Net realized gain (loss) on foreign currency transactions | (232 | ) | ||
Net change in unrealized appreciation (depreciation) on investments | (7,890 | ) | ||
Net change in unrealized appreciation (depreciation) on foreign currency translation | (2 | ) | ||
|
| |||
| Net gain (loss) on investments | (62,649 | ) | ||
|
| |||
| Net increase (decrease) in net assets resulting from operations | $ | (43,039 | ) | |
|
|
See Notes to Financial Statements
14
Table of Contents
VIRTUS FOREIGN OPPORTUNITIES FUND
STATEMENTS OF CHANGES IN NET ASSETS
($ Reported in thousands)
| Year Ended September 30, 2015 | Year Ended September 30, 2014 | |||||||
| INCREASE/(DECREASE) IN NET ASSETS | ||||||||
| From Operations | ||||||||
Net investment income (loss) | $ | 19,610 | $ | 18,417 | ||||
Net realized gain (loss) | (54,757 | ) | 24,752 | |||||
Net change in unrealized appreciation (depreciation) | (7,892 | ) | 42,875 | |||||
|
|
|
| |||||
| Increase (decrease) in net assets resulting from operations | (43,039 | ) | 86,044 | |||||
|
|
|
| |||||
| From Distributions to Shareholders | ||||||||
Net investment income, Class A | (4,099 | ) | (3,966 | ) | ||||
Net investment income, Class C | (244 | ) | — | |||||
Net investment income, Class I | (14,754 | ) | (9,101 | ) | ||||
Net investment income, Class R6 | (22 | ) | — | |||||
|
|
|
| |||||
| Decrease in net assets from distributions to shareholders | (19,119 | ) | (13,067 | ) | ||||
|
|
|
| |||||
| From Share Transactions | ||||||||
| Sale of shares | ||||||||
Class A (3,683 and 6,394 shares, respectively) | 104,669 | 178,539 | ||||||
Class C (981 and 1,172 shares, respectively) | 27,884 | 32,538 | ||||||
Class I (13,604 and 19,587 shares, respectively) | 387,428 | 553,830 | ||||||
Class R6 (170 and 0 shares, respectively) | 4,966 | — | ||||||
| Reinvestment of distributions | ||||||||
Class A (133 and 129 shares, respectively) | 3,774 | 3,591 | ||||||
Class C (8 and 0 shares, respectively) | 211 | — | ||||||
Class I (488 and 298 shares, respectively) | 13,901 | 8,294 | ||||||
Class R6 (1 and 0 shares, respectively) | 22 | — | ||||||
| Shares repurchased | ||||||||
Class A (5,843 and 14,591 shares, respectively) | (164,218 | ) | (413,237 | ) | ||||
Class C (855 and 733 shares, respectively) | (24,083 | ) | (20,420 | ) | ||||
Class I (13,756 and 13,775 shares, respectively) | (390,723 | ) | (383,850 | ) | ||||
Class R6 (6 and 0 shares, respectively) | (165 | ) | — | |||||
|
|
|
| |||||
| Increase (decrease) in net assets from share transactions | (36,334 | ) | (40,715 | ) | ||||
|
|
|
| |||||
| Net increase (decrease) in net assets | (98,492 | ) | 32,262 | |||||
| Net Assets | ||||||||
Beginning of period | 1,858,340 | 1,826,078 | ||||||
|
|
|
| |||||
| End of period | $ | 1,759,848 | $ | 1,858,340 | ||||
|
|
|
| |||||
Accumulated undistributed net investment income (loss) at end of period | $ | 11,585 | 11,326 | |||||
See Notes to Financial Statements
15
Table of Contents
VIRTUS FOREIGN OPPORTUNITIES FUND
SELECTED DATA FOR A SHARE OUTSTANDING
THROUGHOUT EACH PERIOD
| Net Asset Value, Beginning of Period | Net Investment Income (Loss)(2) | Net Realized and Unrealized Gain (Loss) | Total from Investment Operations | Dividends from Net Investment Income | Total Distributions | Change in Net Asset Value | Net Asset Value, End of Period | Total Return(1) | Net Assets, End of Period (000’s) | Ratio of Expenses to Average Net Assets(3) | Ratio of Net Investment Income (Loss) to Average Net Assets | Portfolio Turnover Rate | |||||||||||||||||||||||||||||||||||||||||||||||||||||
Class A | |||||||||||||||||||||||||||||||||||||||||||||||||||||||||||||||||
10/1/14 to 9/30/15 | $ | 28.12 | 0.25 | (0.92 | ) | (0.67 | ) | (0.24 | ) | (0.24 | ) | (0.91 | ) | $ | 27.21 | (2.41 | )% | $ | 406,429 | 1.41 | % | 0.89 | % | 32 | % | ||||||||||||||||||||||||||||||||||||||||
10/1/13 to 9/30/14 | 27.01 | 0.24 | 1.03 | 1.27 | (0.16 | ) | (0.16 | ) | 1.11 | 28.12 | 4.72 | 477,036 | 1.43 | 0.85 | 31 | ||||||||||||||||||||||||||||||||||||||||||||||||||
10/1/12 to 9/30/13 | 25.42 | 0.23 | 1.63 | 1.86 | (0.27 | ) | (0.27 | ) | 1.59 | 27.01 | 7.37 | 676,149 | 1.46 | 0.85 | 29 | ||||||||||||||||||||||||||||||||||||||||||||||||||
10/1/11 to 9/30/12 | 20.83 | 0.27 | 4.73 | 5.00 | (0.41 | ) | (0.41 | ) | 4.59 | 25.42 | 24.34 | 398,166 | 1.45 | 1.16 | 47 | ||||||||||||||||||||||||||||||||||||||||||||||||||
10/1/10 to 9/30/11 | 22.06 | 0.34 | (1.23 | ) | (0.89 | ) | (0.34 | ) | (0.34 | ) | (1.23 | ) | 20.83 | (4.15 | ) | 346,594 | 1.47 | 1.48 | 31 | ||||||||||||||||||||||||||||||||||||||||||||||
Class C | |||||||||||||||||||||||||||||||||||||||||||||||||||||||||||||||||
10/1/14 to 9/30/15 | $ | 27.88 | 0.04 | (0.91 | ) | (0.87 | ) | (0.06 | ) | (0.06 | ) | (0.93 | ) | $ | 26.95 | (3.13 | )% | $ | 117,568 | 2.17 | % | 0.15 | % | 32 | % | ||||||||||||||||||||||||||||||||||||||||
10/1/13 to 9/30/14 | 26.82 | 0.04 | 1.02 | 1.06 | — | — | 1.06 | 27.88 | 3.95 | 117,906 | 2.18 | 0.15 | 31 | ||||||||||||||||||||||||||||||||||||||||||||||||||||
10/1/12 to 9/30/13 | 25.27 | 0.03 | 1.62 | 1.65 | (0.10 | ) | (0.10 | ) | 1.55 | 26.82 | 6.56 | 101,655 | 2.21 | 0.10 | 29 | ||||||||||||||||||||||||||||||||||||||||||||||||||
10/1/11 to 9/30/12 | 20.57 | 0.10 | 4.70 | 4.80 | (0.10 | ) | (0.10 | ) | 4.70 | 25.27 | 23.43 | 54,634 | 2.20 | 0.42 | 47 | ||||||||||||||||||||||||||||||||||||||||||||||||||
10/1/10 to 9/30/11 | 21.81 | 0.17 | (1.22 | ) | (1.05 | ) | (0.19 | ) | (0.19 | ) | (1.24 | ) | 20.57 | (4.85 | ) | 45,742 | 2.22 | 0.74 | 31 | ||||||||||||||||||||||||||||||||||||||||||||||
Class I | |||||||||||||||||||||||||||||||||||||||||||||||||||||||||||||||||
10/1/14 to 9/30/15 | $ | 28.14 | 0.32 | (0.91 | ) | (0.59 | ) | (0.32 | ) | (0.32 | ) | (0.91 | ) | $ | 27.23 | (2.16 | )% | $ | 1,231,349 | 1.17 | % | 1.14 | % | 32 | % | ||||||||||||||||||||||||||||||||||||||||
10/1/13 to 9/30/14 | 27.03 | 0.32 | 1.02 | 1.34 | (0.23 | ) | (0.23 | ) | 1.11 | 28.14 | 4.97 | 1,263,398 | 1.18 | 1.13 | 31 | ||||||||||||||||||||||||||||||||||||||||||||||||||
10/1/12 to 9/30/13 | 25.43 | 0.28 | 1.66 | 1.94 | (0.34 | ) | (0.34 | ) | 1.60 | 27.03 | 7.66 | 1,048,274 | 1.21 | 1.04 | 29 | ||||||||||||||||||||||||||||||||||||||||||||||||||
10/1/11 to 9/30/12 | 20.89 | 0.34 | 4.72 | 5.06 | (0.52 | ) | (0.52 | ) | 4.54 | 25.43 | 24.64 | 672,948 | 1.20 | 1.46 | 47 | ||||||||||||||||||||||||||||||||||||||||||||||||||
10/1/10 to 9/30/11 | 22.12 | 0.42 | (1.26 | ) | (0.84 | ) | (0.39 | ) | (0.39 | ) | (1.23 | ) | 20.89 | (3.88 | ) | 584,212 | 1.22 | 1.83 | 31 | ||||||||||||||||||||||||||||||||||||||||||||||
Class R6 | |||||||||||||||||||||||||||||||||||||||||||||||||||||||||||||||||
11/14/14(4) to 9/30/15 | $ | 28.66 | 0.36 | (1.45 | ) | (1.09 | ) | (0.33 | ) | (0.33 | ) | (1.42 | ) | $ | 27.24 | (3.84 | )%(6) | $ | 4,502 | 1.07 | %(5) | 1.44 | %(5) | 32 | % | ||||||||||||||||||||||||||||||||||||||||
Footnote Legend
| (1) | Sales charges, where applicable, are not reflected in the total return calculation. |
| (2) | Computed using average shares outstanding. |
| (3) | The Fund may invest in other funds, and the annualized expense ratios do not reflect fees and expenses associated with the underlying funds. |
| (4) | Inception date of class. |
| (5) | Annualized. |
| (6) | Not annualized. |
See Notes to Financial Statements
16
Table of Contents
VIRTUS FOREIGN OPPORTUNITIES FUND
SEPTEMBER 30, 2015
Note 1. Organization
Virtus Opportunities Trust (the “Trust”) is organized as a Delaware statutory trust and is registered under the Investment Company Act of 1940, as amended (“1940 Act”), as an open-end management investment company.
As of the date of this report, 32 funds of the Trust are offered for sale, of which the Foreign Opportunities Fund (the “Fund”) is reported in this annual report. The Fund’s investment objective is outlined in the Fund Summary Page. There is no guarantee the Fund will achieve its objective.
The Fund offers Class A shares, Class C shares, Class R6 shares and Class I shares.
Class A shares are sold with a front-end sales charge of up to 5.75% with some exceptions. Generally, Class A shares are not subject to any charges by the Fund when redeemed; however, a 1% contingent deferred sales charge (“CDSC”) may be imposed on certain redemptions made within a certain period following purchases on which a finder’s fee has been paid. The period for which the CDSC applies for the Fund is 18 months. The CDSC period begins on the last day of the month preceding the month in which the purchase was made.
Class C shares are generally sold with a 1% CDSC, applicable if redeemed within one year of purchase. Class I shares are sold without a front-end sales charge or CDSC.
Class R6 shares are only available to participants in employer-sponsored retirement plans, such as 401(k) plans, profit sharing plans, defined benefit plans and other employer directed plans. Class R6 shares do not carry sales commissions or pay Rule 12b-1 fees.
Virtus Mutual Funds may impose an annual fee on accounts having balances of less than $2,500. The small account fee may be waived in certain circumstances, as disclosed in the prospectuses and/or statements of additional information. The fees collected will be used to offset certain expenses of the funds.
Each class of shares has identical voting, dividend, liquidation and other rights and the same terms and conditions, except that each class bears different distribution and/or service fees under a Board-approved Rule 12b-1 and/or shareholder service plan (“12b-1 plan”) and has exclusive voting rights with respect to such plans. Class I shares and Class R6 shares are not subject to a 12b-1 plan. Income and other expenses as well as realized and unrealized gains and losses of the Fund are borne pro rata by the holders of each class of shares.
Note 2. Significant Accounting Policies
The following is a summary of significant accounting policies consistently followed by the Trust in the preparation of its financial statements. The preparation of financial statements in conformity with accounting principles generally accepted in the United States of America requires management to make estimates and assumptions that affect the reported amounts of assets and liabilities, disclosure of contingent assets and liabilities at the date of the financial statements and the reported amounts of increases and decreases in net assets from operations during the reporting period. Actual results could differ from those estimates and those differences could be significant.
| A. | Security Valuation |
Security valuation procedures for the Fund, which include nightly price variance, as well as back-testing such as bi-weekly unchanged price, monthly secondary source and
17
Table of Contents
VIRTUS FOREIGN OPPORTUNITIES FUND
NOTES TO FINANCIAL STATEMENTS (Continued)
SEPTEMBER 30, 2015
transaction analysis, have been approved by the Board of Trustees (the “Board”, or the “Trustees”). All internally fair valued securities are approved by a valuation committee (the “Valuation Committee”) appointed by the Board. The Valuation Committee is comprised of certain members of management as identified to the Board and convenes independently from portfolio management. All internally fair valued securities are updated daily and reviewed in detail by the Valuation Committee monthly unless changes occur within the period. The Valuation Committee reviews the validity of the model inputs and any changes to the model. Quarterly fair valuations are reviewed by the Board.
The Fund utilizes a fair value hierarchy which prioritizes the inputs to valuation techniques used to measure fair value into three broad levels. The Fund’s policy is to recognize transfers at the end of the reporting period.
| • Level 1 – | quoted prices in active markets for identical securities (security types generally include listed equities). |
| • Level 2 – | prices determined using other significant observable inputs (including quoted prices for similar securities, interest rates, prepayment speeds, credit risk, etc.). |
| • Level 3 – | prices determined using significant unobservable inputs (including the Valuation Committee’s own assumptions in determining the fair value of investments). |
A description of the valuation techniques applied to the Fund’s major categories of assets and liabilities measured at fair value on a recurring basis is as follows:
Equity securities are valued at the official closing price (typically last sale) on the exchange on which the securities are primarily traded or, if no closing price is available, at the last bid price and are categorized as Level 1 in the hierarchy. Restricted equity securities and private placements that are not widely traded, are illiquid, or are internally fair valued by the Valuation Committee, are generally categorized as Level 3 in the hierarchy.
Certain non-U.S. securities may be fair valued in cases where closing prices are not readily available or are deemed not reflective of readily available market prices. For example, significant events (such as movement in the U.S. securities market, or other regional and local developments) may occur between the time that non-U.S. markets close (where the security is principally traded) and the time that the Fund calculates its net asset value (“NAV”) (at the close of regular trading on the New York Stock Exchange (“NYSE”), generally 4 p.m. Eastern time) that may impact the value of securities traded in these non-U.S. markets. In such cases the Fund fair values non-U.S. securities using an independent pricing service which considers the correlation of the trading patterns of the non-U.S. security to the intraday trading in the U.S. markets for investments such as ADRs, financial futures, exchange-traded funds (“ETFs”), and certain indexes, as well as prices for similar securities. Such fair valuations are categorized as Level 2 in the hierarchy. Because the frequency of significant events is not predictable, fair valuation of certain non-U.S. common stocks may occur on a frequent basis.
Listed derivatives that are actively traded are valued based on quoted prices from the exchange and are categorized as Level 1 in the hierarchy. Over-the-counter derivative contracts, which include forward currency contracts and equity-linked instruments, do
18
Table of Contents
VIRTUS FOREIGN OPPORTUNITIES FUND
NOTES TO FINANCIAL STATEMENTS (Continued)
SEPTEMBER 30, 2015
not require material subjectivity as pricing inputs are observed from actively quoted markets and are categorized as Level 2 in the hierarchy.
Investments in open-end mutual funds are valued at NAV. Investments in closed-end funds are valued as of the close of regular trading on the NYSE each business day. Both are categorized as Level 1 in the hierarchy.
A summary of the inputs used to value the Fund’s net assets by each major security type is disclosed at the end of the Schedule of Investments for the Fund. The inputs or methodologies used for valuing securities are not necessarily an indication of the risk associated with investing in those securities.
| B. | Security Transactions and Investment Income |
Security transactions are recorded on the trade date. Realized gains and losses from the sale of securities are determined on the identified cost basis. Dividend income is recognized on the ex-dividend date or, in the case of certain foreign securities, as soon as the Fund is notified. Interest income is recorded on the accrual basis. The Fund amortizes premiums and accretes discounts using the effective interest method.
| C. | Income Taxes |
The Fund is treated as a separate taxable entity. It is the intention of the Fund to comply with the requirements of Subchapter M of the Internal Revenue Code and to distribute substantially all of its taxable income to its shareholders. Therefore, no provision for federal income taxes or excise taxes has been made.
The Fund may be subject to foreign taxes on income, gains on investments or currency repatriation, a portion of which may be recoverable. The Fund will accrue such taxes and recoveries as applicable based upon current interpretations of the tax rules and regulations that exist in the markets in which it invests.
Management of the Fund has concluded that there are no significant uncertain tax positions that would require recognition in the financial statements. As of September 30, 2015, the tax years that remain subject to examination by the major tax jurisdictions under the statute of limitations are from the year 2012 forward (with limited exceptions).
| D. | Distributions to Shareholders |
Distributions are recorded by the Fund on the ex-dividend date. Income and capital gain distributions are determined in accordance with income tax regulations that may differ from accounting principles generally accepted in the United States of America. These differences may include the treatment of non-taxable dividends, market premium and discount, non-deductible expenses, expiring capital loss carryovers, foreign currency gain or loss, gain or loss on futures contracts, partnerships, operating losses and losses deferred due to wash sales. Permanent book and tax basis differences relating to shareholder distributions will result in reclassifications to capital paid in on shares of beneficial interest.
| E. | Expenses |
Expenses incurred together by the Fund and other affiliated mutual funds are allocated in proportion to the net assets of each such fund, except where allocation of direct expense to each fund or an alternative allocation method can be more appropriately used.
19
Table of Contents
VIRTUS FOREIGN OPPORTUNITIES FUND
NOTES TO FINANCIAL STATEMENTS (Continued)
SEPTEMBER 30, 2015
In addition to the net operating expenses that the Fund bears directly, the shareholders of the Fund indirectly bear the Fund’s pro-rata expenses of any underlying mutual funds in which the Fund invests.
| F. | Foreign Currency Translation |
Non-U.S. investment securities and other assets and liabilities denominated in foreign currencies are translated into U.S. dollar amounts at the foreign currency exchange rate effective at the end of the reporting period. Cost of investments is translated at the currency exchange rate effective at the trade date. The gain or loss resulting from a change in currency exchange rates between the trade and settlement date of a portfolio transaction is treated as a gain or loss on foreign currency. Likewise, the gain or loss resulting from a change in currency exchange rates between the date income is accrued and the date it is paid is treated as a gain or loss on foreign currency. The Fund does not isolate that portion of the results of operations arising from changes in foreign exchange rates on investments from the fluctuations arising from changes in the market prices of securities held. Such fluctuations are included with the net realized and unrealized gain or loss on investments.
| G. | Securities Lending |
($ reported in thousands)
The Fund may loan securities to qualified brokers through an agreement with Brown Brothers Harriman (“BBH”), as a third party lending agent. Under the terms of the agreement, the Fund doing so is required to maintain collateral with a market value not less than 100% of the market value of loaned securities. Collateral is adjusted daily in connection with changes in the market value of securities on loan. Collateral may consist of cash and securities issued by the U.S. Government or its agencies. Cash collateral is invested in a short-term money market fund. Dividends earned on the collateral and premiums paid by the broker are recorded as income by the Fund net of fees and rebates charged by BBH for its services as securities lending agent and in connection with this securities lending program. Lending portfolio securities involves a risk of delay in the recovery of the loaned securities or in the declining value of the collateral.
At September 30, 2015, the Fund had securities on loan with a market value of $8,835 and cash collateral of $9,259.
Note 3. Investment Advisory Fees and Related Party Transactions
($ reported in thousands except as noted)
| A. | Adviser |
Virtus Investment Advisers, Inc. (the “Adviser”), an indirect, wholly-owned subsidiary of Virtus Investment Partners, Inc. (“Virtus”), is the adviser to the Trust. The Adviser manages the Fund’s investment program and general operations of the Fund, including oversight of the Fund’s subadviser.
As compensation for its services to the Fund, the Adviser is entitled to a fee based upon the following annual rates as a percentage of the average daily net assets of the Fund:
First $2 Billion | $2+ Billion – | $4+ Billion | ||
| 0.85% | 0.80% | 0.75% |
20
Table of Contents
VIRTUS FOREIGN OPPORTUNITIES FUND
NOTES TO FINANCIAL STATEMENTS (Continued)
SEPTEMBER 30, 2015
| B. | Subadviser |
Vontobel Asset Management, Inc. (the “Subadviser”) is the Subadviser to the Fund. The Subadviser manages the investments of the Fund for which it is paid a fee by the Adviser.
| C. | Distributor |
VP Distributors, LLC (“VP Distributors”), an indirect wholly-owned subsidiary of Virtus, serves as the distributor of the Fund’s shares. VP Distributors has advised the Fund that for the fiscal year (the “period”) ended September 30, 2015, it retained net commissions of $21 for Class A shares and deferred sales charges of $1 for Class A shares and $16 for Class C shares.
In addition, the Fund pays VP Distributors distribution and/or service fees under a 12b-1 plan, as a percentage of the average daily net assets of each respective class at the annual rates as follows: Class A shares 0.25% and Class C shares 1.00%. Class R6 shares and Class I shares are not subject to a 12b-1 plan.
Under certain circumstances, shares of certain Virtus Mutual Funds may be exchanged for shares of the same class of certain other Virtus Mutual Funds on the basis of the relative NAV per share at the time of the exchange. On exchanges with share classes that carry a CDSC, the CDSC schedule of the original shares purchased continues to apply.
| D. | Administrator and Transfer Agent |
Virtus Fund Services, LLC, an indirect wholly-owned subsidiary of Virtus, serves as the administrator and transfer agent to the Fund.
For the period ended September 30, 2015, the Fund incurred administration fees totaling $1,852 which are included in the Statement of Operations.
For the period ended September 30, 2015, the Fund incurred transfer agent fees totaling $2,889 which are included in the Statement of Operations. A portion of these fees was paid to outside entities that also provide services to the Trust.
| E. | Affiliated Shareholders |
At September 30, 2015, Virtus and its affiliates, and the retirement plans of Virtus and its affiliates, held shares of the Fund which may be redeemed at any time that aggregated the following:
| Shares | Aggregate Net Asset Value | |||||||
Class R6 shares | 3,530 | $ | 96 | |||||
Note 4. Purchases and Sales of Securities
($ reported in thousands)
Purchases and sales of securities (excluding U.S. Government and agency securities, and short-term securities) during the period ended September 30, 2015, were as follows:
| Purchases | Sales | |||||||
| $ | 612,468 | $ | 602,640 | |||||
21
Table of Contents
VIRTUS FOREIGN OPPORTUNITIES FUND
NOTES TO FINANCIAL STATEMENTS (Continued)
SEPTEMBER 30, 2015
There were no purchases or sales of long-term U.S. Government and agency securities for the Fund during the period ended September 30, 2015.
Note 5. Borrowings
($ reported in thousands)
On July 2, 2015, the Fund and other affiliated Funds entered into a $50,000 secured Line of Credit Agreement (the “Agreement”) with a commercial bank (the “Bank”) that allows the Fund to borrow cash from the Bank to manage large unexpected redemptions and trade fails, up to a limit of one-third of the Fund’s total net assets in accordance with the Agreement. Interest is charged at the higher of the LIBOR (London Interbank Offered Rate) or the Federal Funds rate plus an additional percentage rate on the amount borrowed. Commitment fees are charged on the undrawn balance. The Funds are individually, and not jointly, liable for their particular advances, if any, under the line of credit. The Bank has the ability to require repayment of outstanding borrowings under the Agreement upon certain circumstances such as an event of default.
The Fund had no outstanding borrowings at any time during the period ended September 30, 2015.
Note 6. 10% Shareholders
As of September 30, 2015, the Fund had individual shareholder account(s) and/or omnibus shareholder account(s) (comprised of a group of individual shareholders), which individually amounted to more than 10% of the total shares outstanding of the Fund as detailed below:
| % of Shares Outstanding | Number of Accounts | |||||||
| 31 | % | 2 | ||||||
The shareholders are not affiliated with Virtus.
Note 7. Credit Risk and Asset Concentrations
In countries with limited or developing markets, investments may present greater risks than in more developed markets and the prices of such investments may be volatile. The consequences of political, social or economic changes in these markets may have disruptive effects on the market prices of these investments and the income they generate, as well as the Fund’s ability to repatriate such amounts.
The Fund may invest a high percentage of its assets in specific sectors of the market in the pursuit of its investment objective. Fluctuations in these sectors of concentration may have a greater impact on the Fund, positive or negative, than if the Fund did not concentrate its investments in such sectors.
At September 30, 2015, the Fund held securities issued by various companies in the Consumer Staples Sector representing 39% of the total investments of the Fund.
Note 8. Indemnifications
Under the Trust’s organizational documents, its Trustees and officers are indemnified against certain liabilities arising out of the performance of their duties to the Fund. Each Trustee has also entered into an indemnification agreement with the Trust. In addition, in the normal course of business, the Fund enters into contracts that provide a variety of
22
Table of Contents
VIRTUS FOREIGN OPPORTUNITIES FUND
NOTES TO FINANCIAL STATEMENTS (Continued)
SEPTEMBER 30, 2015
indemnifications to other parties. The Fund’s maximum exposure under these arrangements is unknown as this would involve future claims that may be made against the Fund and that have not occurred. However, the Fund has not had prior claims or losses pursuant to these arrangements and expects the risk of loss to be remote.
Note 9. Federal Income Tax Information
($ reported in thousands)
At September 30, 2015, federal tax cost and aggregate gross unrealized appreciation (depreciation) of securities held by the Fund were as follows:
Federal | Unrealized | Unrealized | Net Unrealized | |||
| $1,423,438 | $402,623 | $(40,549) | $362,074 |
The Fund has capital loss carryovers available to offset future realized capital gains, through the indicated expiration dates shown below:
2018 | No Expiration | Total | ||||||||
Short-Term | Long-Term | Short-Term | Long-Term | Short-Term | Long-Term | |||||
| 183,071 | — | 860 | 10,250 | 183,931 | 10,250 | |||||
The Fund may not realize the benefit of these losses to the extent the Fund does not realize gains on investments prior to the expiration of the capital loss carryovers.
Under the Regulated Investment Company Modernization Act of 2010 (the “Act”), net capital losses recognized for tax years beginning after December 22, 2010, may be carried forward indefinitely, and their character is retained as short-term and/or long-term losses. Previously, net capital losses were carried forward for eight years and treated as short-term losses. As a transition rule, the Act requires that post-enactment net capital losses be used before pre-enactment net capital losses.
Capital losses realized after October 31 and certain late year losses may be deferred and treated as occurring on the first day of the following fiscal year. For the fiscal year ended September 30, 2015 the Fund deferred post-October capital loss of $45,251 and qualified late-year ordinary losses of $0 and recognized post-October capital losses of $0 and qualified late-year ordinary losses of $0 .
The components of distributable earnings on a tax basis (excluding unrealized appreciation (depreciation) (which is disclosed above) consist of undistributed ordinary income of $11,583 and undistributed long-term capital gains of $0.
The tax character of dividends and distributions paid during the years ended September 30,
2015 and 2014 was as follows:
| Year Ended | ||||||||
| 2015 | 2014 | |||||||
| Ordinary Income | $ | 19,119 | $ | 13,067 | ||||
|
|
|
| |||||
| Total | $ | 19,119 | $ | 13,067 | ||||
|
|
|
| |||||
The differences between the book and tax basis components of distributable earnings relate principally to the timing of recognition of income and gains for federal income tax purposes.
23
Table of Contents
VIRTUS FOREIGN OPPORTUNITIES FUND
NOTES TO FINANCIAL STATEMENTS (Continued)
SEPTEMBER 30, 2015
Short-term gain distributions reported in the Statements of Changes in Net Assets, if any, are reported as ordinary income for federal tax purposes. Distributions are determined on a tax basis and may differ from net investment income and realized capital gains for financial reporting purposes.
Note 10. Reclassifications of Capital Accounts
($ reported in thousands)
For financial reporting purposes, book basis capital accounts are adjusted to reflect the tax character of permanent book/tax differences. Permanent reclassifications can arise from differing treatment of certain income and gain transactions, nondeductible current year net operating losses, expiring capital loss carryovers and investments in passive foreign investment companies. The reclassifications have no impact on the net assets or net asset value of the Fund. As of September 30, 2015, the Fund recorded reclassifications to increase (decrease) the accounts as listed below:
Capital Paid | Undistributed | Accumulated | ||
| $— | $(232) | $232 |
Note 11. Regulatory Matters and Litigation
From time to time, the Fund’s investment adviser and/or its affiliates and/or subadvisers may be involved in litigation and arbitration as well as examinations and investigations by various regulatory bodies, including the SEC, involving compliance with, among other things, securities laws, client investment guidelines, laws governing the activities of broker-dealers and other laws and regulations affecting their products and other activities. At this time, the Fund’s investment adviser believes that the outcomes of such matters are not likely, either individually or in the aggregate, to be material to these financial statements.
As part of an SEC non-public, confidential investigation of a matter entitled – In the Matter of F-Squared Investments Inc., the SEC staff informed the Fund’s investment adviser that it was inquiring into whether it had violated securities laws or regulations with respect to circumstances related to that matter. On November 16, 2015, without admitting or denying the SEC’s findings, the Fund’s investment adviser consented to the entry of an order providing that it cease and desist from committing or causing any violations and future violations of Sections 204, 206(2) and 206(4) of the Investment Advisers Act of 1940, as amended, and Rules 204-2, 206(4)-1, 206(4)-7 and 206(4)-8 thereunder, and Section 34(b) of the Investment Company Act of 1940, as amended; agreed to a censure; and paid $16.5 million, which included a civil money penalty of $2 million, disgorgement of $13.4 million and prejudgment interest of $1.1 million.
On February 20, 2015, a putative class action complaint (In re Virtus Investment Partners, Inc. Securities Litigation; formerly styled as Tom Cummins v. Virtus Investment Partners Inc. et al) alleging violation of the federal securities laws was filed by an individual shareholder against Virtus and certain of its officers (the “defendants”) in the United States District Court for the Southern District of New York. On August 21, 2015, the lead plaintiff filed a Consolidated Class Action Complaint (the “Consolidated Complaint”) amending the originally filed complaint and adding the Trust as a defendant. The Consolidated Complaint was purportedly filed on behalf of all purchasers of Virtus common stock between January 25, 2013 and May 11, 2015 (the “Class Period”). The Consolidated Complaint
24
Table of Contents
VIRTUS FOREIGN OPPORTUNITIES FUND
NOTES TO FINANCIAL STATEMENTS (Continued)
SEPTEMBER 30, 2015
alleges that during the Class Period, the defendants knowingly disseminated materially false and misleading statements and concealed material adverse facts relating to certain funds previously subadvised by F-Squared Investments, Inc. and/or its affiliates (“F-Squared”). The plaintiff seeks to recover unspecified damages. Virtus and its affiliates, including the Fund’s adviser, believe that the suit is without merit and intend to defend it vigorously. A motion to dismiss the Consolidated Complaint was filed on behalf of the defendants on October 21, 2015. The Trust believes that the risk of loss to the Fund as a result of this suit is remote. The adviser does not believe that the suit will have any impact on its ability to provide services to the Fund.
On May 8, 2015, a putative class action complaint (Mark Youngers v. Virtus Investment Partners, Inc. et al) alleging violations of certain provisions of the federal securities laws was filed in the United States District Court for the Central District of California. The complaint, which was purportedly filed on behalf of purchasers of certain Virtus Funds previously subadvised by F-Squared between May 8, 2010 and December 22, 2014, inclusive (the “Class Period”), alleges claims against Virtus, certain Virtus officers and affiliates (including the Fund’s investment adviser, Euclid Advisors LLC and VP Distributors, LLC), the trustees and certain officers of the Trust, and certain other parties (the “defendants”). The complaint alleges that during the Class Period the defendants knowingly disseminated materially false and misleading statements and concealed or omitted material facts necessary to make the statements made not misleading. On October 1, 2015, the plaintiff filed a First Amended Class Action Complaint which, among other things, added a derivative claim for breach of fiduciary duty on behalf of the Trust. On October 19, 2015, the Court entered an order transferring the action to the Southern District of New York. Virtus and its affiliates, including the Fund’s adviser, believe the plaintiff’s claims asserted in the complaint are frivolous and intend to defend them vigorously. The Trust believes that the risk of loss to the Fund as a result of this suit is remote. The adviser does not believe that the suit will have any impact on its ability to provide services to the Fund.
Note 12. Subsequent Events
Management has evaluated the impact of all subsequent events on the Fund through the date the financial statements were issued, and has determined that there are no subsequent events requiring recognition or disclosure in the financial statements.
25
Table of Contents

Report of Independent Registered Public
Accounting Firm
To the Board of Trustees of
Virtus Opportunities Trust and Shareholders of
Virtus Foreign Opportunities Fund:
In our opinion, the accompanying statement of assets and liabilities, including the schedule of investments, and the related statements of operations and of changes in net assets and the financial highlights present fairly, in all material respects, the financial position of the Virtus Foreign Opportunities Fund (one of the funds constituting Virtus Opportunities Trust, hereafter referred to as the “Fund”) at September 30, 2015, the results of its operations for the year then ended, the changes in its net assets for each of the two years in the period then ended and the financial highlights for each of the periods indicated, in conformity with accounting principles generally accepted in the United States of America. These financial statements and financial highlights (hereafter referred to as “financial statements”) are the responsibility of the Fund’s management. Our responsibility is to express an opinion on these financial statements based on our audits. We conducted our audits of these financial statements in accordance with the standards of the Public Company Accounting Oversight Board (United States). Those standards require that we plan and perform the audit to obtain reasonable assurance about whether the financial statements are free of material misstatement. An audit includes examining, on a test basis, evidence supporting the amounts and disclosures in the financial statements, assessing the accounting principles used and significant estimates made by management, and evaluating the overall financial statement presentation. We believe that our audits, which included confirmation of securities at September 30, 2015 by correspondence with the custodian and brokers, provide a reasonable basis for our opinion.
PricewaterhouseCoopers LLP
Philadelphia, Pennsylvania
November 20, 2015
26
Table of Contents
VIRTUS FOREIGN OPPORTUNITIES FUND
SEPTEMBER 30, 2015 (Unaudited)
For the fiscal year ended September 30, 2015, the Fund makes the following disclosures for federal income tax purposes. Below is listed the percentage, or the maximum amount allowable, of its ordinary income dividends (“QDI”) to qualify for the lower tax rates applicable to individual shareholders, and the percentage of ordinary income dividends earned by the Fund which qualifies for the dividends received deduction (“DRD”) for corporate shareholders. The actual percentage of QDI and DRD for the calendar year will be designated in year-end tax statements. The Fund designates the amounts below as long-term capital gains dividends (“LTCG”) taxable at a 20% rate, or lower depending on the shareholder’s income ($ reported in thousands). LTCG amounts, if subsequently different, will be designated in the next annual report.
QDI | DRD | LTCG | ||
| 100% | 18% | $— |
For the fiscal year ended September 30, 2015, the Fund recognized $42,743 ($ reported in thousands), of foreign source income on which the Fund paid foreign taxes of $2,556 ($ reported in thousands). This information is being furnished to you pursuant to notice requirements of Section 853(a) and 855(d) of the Internal Revenue Code, as amended, and the Treasury Regulations thereunder.
27
Table of Contents
FUND MANAGEMENT TABLES (UNAUDITED)
Information pertaining to the Trustees and officers of the Trust as of September 30, 2015, is set forth below. The statement of additional information (SAI) includes additional information about the Trustees and is available without charge, upon request, by calling (800) 243-1574. The address of each individual, unless otherwise noted, is 100 Pearl Street, Hartford, CT 06103-4506. There is no stated term of office for Trustees of the Trust.
Independent Trustees
| Name, Year of Birth, Year Elected and Number of Funds Overseen | Principal Occupation(s) Other Directorships Held by Trustee | |
McClellan, Hassell H. YOB: 1945 Elected: 2015 55 Portfolios | Retired. Professor (1984 to 2013), Wallace E. Carroll School of Management, Boston College; Trustee, Virtus Variable Insurance Trust (9 portfolios) (since 2008); Trustee (since 2015), Virtus Mutual Fund Complex (46 portfolios); Trustee, John Hancock Fund Complex (since 2000), John Hancock Funds (collectively, 234 portfolios); and Director (since 2010), Barnes Group, Inc. (diversified global components manufacturer and logistical services company). | |
McLoughlin, Philip YOB: 1946 Elected: 2006 69 Portfolios | Director (since 1991) and Chairman (since 2010), World Trust Fund (closed-end investment firm in Luxembourg); Director (since 1995), closed-end funds managed by Duff & Phelps Investment Management Co. (4 portfolios); Chairman (since 2002) and Trustee (since 1989), Virtus Mutual Fund Complex (46 portfolios); Chairman and Trustee (since 2003), Virtus Variable Insurance Trust (9 portfolios); Trustee/Director and Chairman (since 2011), Virtus Closed-End Funds (3 portfolios); Trustee and Chairman (since 2013), Virtus Alternative Solutions Trust (7 portfolios); Partner (2006 to 2010), Cross Pond Partners, LLC (investment management consultant); and Managing Director (2008 to 2010), SeaCap Partners, LLC (investment management). | |
McNamara, Geraldine M. YOB: 1951 Elected: 2006 59 Funds | Retired. Trustee (since 2001), Virtus Mutual Fund Complex (46 portfolios); and Director (since 2003), closed-end funds managed by Duff & Phelps Investment Management Co. (4 portfolios); and Trustee (since 2015), Virtus Variable Insurance Trust (9 portfolios). | |
Oates, James M. YOB: 1946 Elected: 2006 56 Funds | Managing Director (since 1994), Wydown Group (consulting firm). Trustee (since 1987), Virtus Mutual Fund Complex (46 portfolios); Director (since 1996), Stifel Financial; Director (1998 to 2014), Connecticut River Bancorp; Chairman and Director (1999 to 2014), Connecticut River Bank; Chairman (since 2000), Emerson Investment Management, Inc.; Director (2002 to 2014), New Hampshire Trust Company; Chairman and Trustee (since 2005), John Hancock Fund Complex (228 portfolios); Non-Executive Chairman (2007 to 2011), Hudson Castle Group, Inc. (formerly IBEX Capital Markets, Inc.) (financial services); Trustee/Director (since 2013), Virtus Closed-End Funds (3 portfolios); and Trustee (since 2013), Virtus Alternative Solutions Trust (7 portfolios). | |
Segerson, Richard E. YOB: 1948 Elected: 2006 46 Funds | Trustee (since 1983), Virtus Mutual Fund Complex (46 portfolios); and Managing Director (1998 to 2013), Northway Management Company. | |
Verdonck, Ferdinand L.J. YOB: 1942 Elected: 2006 46 Funds | Trustee (since 2002), Virtus Mutual Fund Complex (46 portfolios). |
28
Table of Contents
FUND MANAGEMENT TABLES (UNAUDITED) (Continued)
Interested Trustee
The individual listed below is an “interested person” of the Trust, as defined in Section 2(a)(19) of the 1940 Act, as amended, and the rules and regulations thereunder.
| Name, Year of Birth, Year Elected and Number of Funds Overseen | Principal Occupation(s) During Past 5 Years and Other Directorships Held by Trustee | |
Aylward, George R.* Trustee and President YOB: 1964 Elected: 2006 67 Funds | Director, President and Chief Executive Officer (since 2008), Virtus Investment Partners, Inc. and/or certain of its subsidiaries; various senior officer positions with Virtus affiliates (since 2005); Trustee (since 2006), Virtus Mutual Funds (46 portfolios); Chairman, President and Chief Executive Officer (since 2006), The Zweig Closed-End Funds (2 portfolios); Trustee (since 2012) and President (since 2010), Virtus Variable Insurance Trust (9 portfolios); Trustee and President (since 2011), Virtus Closed-End Funds (3 portfolios); Director (since 2013), Virtus Global Funds, PLC (2 portfolios); and Trustee (since 2013), Virtus Alternative Solutions Trust (7 portfolios). |
29
Table of Contents
FUND MANAGEMENT TABLES (UNAUDITED) (Continued)
Officers of the Trust Who Are Not Trustees
Name, Address and Year of Birth | Position(s) Held with Time Served | Principal Occupation(s) During Past 5 Years | ||
Waltman, Francis G. YOB: 1962 | Executive Vice President (since 2013); Senior Vice President (2008-2013). | Virtus Investment Partners, Inc. and/or certain of its subsidiaries; various senior officer positions (since 2006) with Virtus affiliates; Executive Vice President (since 2013), Senior Vice President (2008 to 2013), Virtus Mutual Fund Complex; Executive Vice President (since 2013), Senior Vice President (2010 to 2013), Virtus Variable Insurance Trust; Executive Vice President (since 2013), Senior Vice President (2011 to 2013), Virtus Closed-End Funds; Director (since 2013), Virtus Global Funds PLC; and Executive Vice President (since 2013), Virtus Alternative Solutions Trust. | ||
Bradley, W. Patrick YOB: 1972 | Senior Vice President (since 2013); Vice President (2011 to 2013); Chief Financial Officer and Treasurer (since 2006). | Senior Vice President, Fund Services (since 2010), Virtus Investment Partners, Inc. and/or certain of its subsidiaries; various officer positions (since 2006) with Virtus affiliates; Senior Vice President (since 2013), Vice President (2011 to 2013), Chief Financial Officer and Treasurer (since 2004), Virtus Variable Insurance Trust; Senior Vice President (since 2013), Vice President (2011 to 2013), Chief Financial Officer and Treasurer (since 2006), Virtus Mutual Fund Complex; Senior Vice President (since 2013), Vice President (2012 to 2013) and Treasurer (Chief Financial Officer) (since 2007), The Zweig Closed-End Funds; Senior Vice President (since 2013), Vice President (2011 to 2013), Chief Financial Officer and Treasurer (since 2011), Virtus Closed-End Funds; Vice President and Assistant Treasurer (since 2011), Duff & Phelps Global Utility Income Fund Inc.; Director (since 2013), Virtus Global Funds, PLC; and Senior Vice President, Chief Financial Officer and Treasurer (since 2013), Virtus Alternative Solutions Trust. |
30
Table of Contents
FUND MANAGEMENT TABLES (UNAUDITED) (Continued)
Name, Address and Year of Birth | Position(s) Held with Time Served | Principal Occupation(s) During Past 5 Years | ||
Carr, Kevin J. YOB: 1954 | Senior Vice President, since 2013; Vice President (2005-2013); Chief Legal Officer, Counsel and Secretary (since 2005). | Senior Vice President (since 2009), Vice President, Counsel and Secretary (2008 to 2009), Virtus Investment Partners, Inc. and/or certain of its subsidiaries; various senior officer positions (since 2005) with Virtus affiliates; Senior Vice President (since 2013), Vice President (2005 to 2013), Chief Legal Officer, Counsel and Secretary (since 2005), Virtus Mutual Fund Complex; Senior Vice President (2013 to 2014), Vice President (2012 to 2013) and Assistant Secretary (since 2012), Secretary and Chief Legal Officer (2005 to 2012), The Zweig Closed-End Funds; Assistant Secretary (since 2013), Vice President, Chief Legal Officer, Counsel and Secretary (2010 to 2013), Virtus Variable Insurance Trust; Vice President and Assistant Secretary (since 2011), Duff & Phelps Global Utility Income Fund Inc.; Senior Vice President and Assistant Secretary (2013 to 2014), Vice President and Assistant Secretary (2012 to 2013), Vice President, Chief Legal Officer, Counsel and Secretary (2011 to 2012), Virtus Closed-End Funds; and Assistant Secretary (since 2013), Virtus Alternative Solutions Trust. | ||
Engberg, Nancy J. YOB: 1956 | Vice President and Chief Compliance Officer since 2011. | Vice President (since 2008) and Chief Compliance Officer (2008 to 2011), Virtus Investment Partners, Inc. and/or certain of its subsidiaries; various officer positions (since 2003) with Virtus affiliates; Vice President and Chief Compliance Officer (since 2011), Virtus Mutual Fund Complex; Vice President (since 2010), Chief Compliance Officer (since 2011), Virtus Variable Insurance Trust; Vice President and Chief Compliance Officer (since 2011), Virtus Closed-End Funds; Vice President and Chief Compliance Officer (since 2012), The Zweig Closed-End Funds; and Vice President and Chief Compliance Officer (since 2013), Virtus Alternative Solutions Trust. |
31
Table of Contents
VIRTUS OPPORTUNITIES TRUST
101 Munson Street
Greenfield, MA 01301-9668
Trustees
George R. Aylward
Hassell H. McClellan
Philip R. McLoughlin, Chairman
Geraldine M. McNamara
James M. Oates
Richard E. Segerson
Ferdinand L.J. Verdonck
Officers
George R. Aylward, President
Francis G. Waltman, Executive Vice President
W. Patrick Bradley, Senior Vice President, Chief Financial Officer and Treasurer
Kevin J. Carr, Senior Vice President, Chief Legal Officer, Counsel and Secretary
Nancy J. Engberg, Vice President and Chief Compliance Officer
Investment Adviser
Virtus Investment Advisers, Inc.
100 Pearl Street
Hartford, CT 06103-4506
Principal Underwriter
VP Distributors, LLC
100 Pearl Street
Hartford, CT 06103-4506
Administrator and Transfer Agent
Virtus Fund Services, LLC
100 Pearl Street
Hartford, CT 06103-4506
Custodian
JPMorgan Chase Bank, NA
1 Chase Manhattan Plaza
New York, NY 10005-1401
Independent Registered Public Accounting Firm
PricewaterhouseCoopers LLP
2001 Market Street
Philadelphia, PA 19103-7042
How to Contact Us
Mutual Fund Services | 1-800-243-1574 | |||
Adviser Consulting Group | 1-800-243-4361 | |||
Web site | Virtus.com |
Important Notice to Shareholders
The Securities and Exchange Commission has modified mailing regulations for semiannual and annual shareholder fund reports to allow mutual fund companies to send a single copy of these reports to shareholders who share the same mailing address. If you would like additional copies, please call Mutual Fund Services at 1-800-243-1574.
Table of Contents
For more information about
Virtus Mutual Funds, please call
your financial representative, or
contact us at 1-800-243-1574
or Virtus.com
| 8011 | 11-15 |

Table of Contents

ANNUAL REPORT
Virtus Multi-Sector Short Term Bond Fund*
September 30, 2015
TRUST NAME: VIRTUS OPPORTUNITIES TRUST
| * | Prospectus supplement applicable to the Fund appears at the back of this Annual Report. |
Not FDIC Insured
No Bank Guarantee
May Lose Value

Table of Contents
Virtus Multi-Sector Short Term Bond Fund
(“Multi-Sector Short Term Bond Fund”)
| 1 | ||||
| 2 | ||||
| 4 | ||||
| 5 | ||||
| 8 | ||||
| 38 | ||||
| 39 | ||||
| 40 | ||||
| 41 | ||||
| 43 | ||||
| 54 | ||||
| 55 | ||||
| 56 |
PROXY VOTING PROCEDURES AND VOTING RECORD (FORM N-PX)
The subadviser votes proxies relating to portfolio securities in accordance with procedures that have been approved by the Board of Trustees of the Trust (“Trustees,” or the “Board”). You may obtain a description of these procedures, along with information regarding how the Fund voted proxies during the most recent 12-month period ended June 30, free of charge, by calling toll-free 1-800-243-1574. This information is also available through the Securities and Exchange Commission’s (the “SEC”) website at http://www.sec.gov.
FORM N-Q INFORMATION
The Trust files a complete schedule of portfolio holdings for the Fund with the SEC for the first and third quarters of each fiscal year on Form N-Q. Form N-Q is available on the SEC’s website at http://www.sec.gov. Form N-Q may be reviewed and copied at the SEC’s Public Reference Room. Information on the operation of the SEC’s Public Reference Room can be obtained by calling toll-free 1-800-SEC-0330.
This report is not authorized for distribution to prospective investors in the Virtus Multi-Sector Short Term Bond Fund unless preceded or accompanied by an effective prospectus which includes information concerning the sales charge, the Fund’s record and other pertinent information.
Table of Contents
To My Fellow Shareholders of Virtus Mutual Funds:
 | I am pleased to present this annual report that reviews the performance of your fund for the twelve months ended September 30, 2015.
During this period, global equity markets were challenged by falling oil prices, China’s economic slowdown, Greece’s debt crisis, and the growing likelihood of an interest rate hike by the Federal Reserve (the “Fed”). Volatility took its toll on major U.S. equity indices for the twelve months ended September 30, 2015. The large-cap S&P 500® Index and Dow Jones Industrial AverageSM moderately declined 0.61% and 2.11%, respectively, while the technology-heavy NASDAQ Composite Index® gained 4.00%. By comparison, international equities were down even further, with emerging markets hit particularly hard. | |
Against this backdrop, U.S. Treasuries remained an attractive “safe haven” among global investors. The bellwether 10-year U.S. Treasury yield declined from 2.52% at September 30, 2014 to 2.06% at September 30, 2015. Fixed income assets experienced slight losses in anticipation of the Fed’s stated intention to raise interest rates at the end of 2015. The Barclays U.S. Aggregate Bond Index, which tracks Treasuries and other investment-grade debt securities, gained 2.94% for the twelve-month period ended September 30, 2015, while non-investment grade bonds underperformed, with the Barclays U.S. Corporate High Yield Bond Index down 3.43% for the same period.
The strength of the global economy is likely to remain a concern for the markets in the months ahead. Actions by the Fed and other global central banks will be watched with great interest. Following the weak start to the year, the U.S. economy exhibited growth over the second and third quarters of 2015 – including stronger jobs, housing, and consumer spending data – and gives investors reason for optimism. Future market direction will be determined largely by the ability of corporations to continue to produce robust earnings.
Market uncertainty serves as a constant reminder of the importance of portfolio diversification, including exposure to both traditional and alternative asset classes. While diversification cannot guarantee a profit or prevent a loss, owning a variety of asset classes may provide a cushion against inevitable market fluctuations. Your financial advisor can help you ensure that your portfolio is adequately diversified across asset classes and investment strategies.
As always, thank you for entrusting Virtus with your assets. Should you have questions about your account or require assistance, please visit our website at www.Virtus.com, or call our customer service team at 1-800-243-1574. We appreciate your business and remain committed to your long-term financial success. | ||
Sincerely,
George R. Aylward President, Virtus Mutual Funds
October 2015
Performance data quoted represents past results. Past performance is no guarantee of future results, and current performance may be higher or lower than the performance shown above. | ||

1
Table of Contents
VIRTUS MULTI-SECTOR SHORT TERM BOND FUND
DISCLOSURE OF FUND EXPENSES (Unaudited)
FOR THE SIX-MONTH PERIOD OF APRIL 1, 2015 TO SEPTEMBER 30, 2015
We believe it is important for you to understand the impact of costs on your investment. All mutual funds have operating expenses. As a shareholder of the Virtus Multi-Sector Short Term Bond Fund (the “Fund”) you may incur two types of costs: (1) transaction costs, including sales charges on purchases of Class A shares and contingent deferred sales charges on Class B and Class T shares; and (2) ongoing costs, including investment advisory fees, distribution and service fees, and other expenses. Class C shares are sold without a sales charge. Class I shares are sold without a sales charge and do not incur distribution and service fees. For further information regarding applicable sales charges, see Note 1 in the Notes to Financial Statements. These examples are intended to help you understand your ongoing costs (in dollars) of investing in the Fund and to compare these costs with the ongoing costs of investing in other mutual funds. These examples are based on an investment of $1,000 invested at the beginning of the period and held for the entire six-month period. The following Expense Table illustrates your Fund’s costs in two ways.
Actual Expenses
The first section of the accompanying table provides information about actual account values and actual expenses. You may use the information in this section, together with the amount you invested, to estimate the expenses that you paid over the period. Simply divide your account value by $1,000 (for example, an $8,600 account value divided by $1,000 = 8.6), then multiply the result by the number in the first section under the heading “Expenses Paid During Period” to estimate the expenses you paid on your account during the period.
Hypothetical Example for Comparison Purposes
The second section of the accompanying table provides information about hypothetical account values and hypothetical expenses based on the Fund’s actual expense ratio and an assumed rate of return of 5% per year before expenses, which is not your Fund’s actual return. The hypothetical account values and expenses may not be used to estimate the actual ending account balance or expenses you paid for the period. You may use this information to compare the ongoing costs of investing in your Fund and other funds. To do so, compare these 5% hypothetical examples with the 5% hypothetical examples that appear in the shareholder reports of the other funds.
Please note that the expenses shown in the accompanying table are meant to highlight your ongoing costs only and do not reflect any transactional costs, such as sales charges or contingent deferred sales charges. Therefore, the second section of the accompanying table is useful in comparing ongoing costs only, and will not help you determine the relative total costs of owning different funds. In addition, if these transactional costs were included, your costs would have been higher. The calculations assume no shares were bought or sold during the period. Your actual costs may have been higher or lower, depending on the amount of your investment and the timing of any purchases or redemptions.
2
Table of Contents
VIRTUS MULTI-SECTOR SHORT TERM BOND FUND
DISCLOSURE OF FUND EXPENSES (Unaudited) (Continued)
FOR THE SIX-MONTH PERIOD OF APRIL 1, 2015 TO SEPTEMBER 30, 2015
| Expense Table | ||||||||||||||||
| Beginning Account Value April 1, 2015 | Ending Account Value September 30, 2015 | Annualized Expense Ratio | Expenses Paid During Period* | |||||||||||||
Actual | ||||||||||||||||
| Class A | $ | 1,000.00 | $ | 994.90 | 0.99 | % | $ | 4.95 | ||||||||
| Class B | 1,000.00 | 992.30 | 1.48 | 7.39 | ||||||||||||
| Class C | 1,000.00 | 993.70 | 1.24 | 6.20 | ||||||||||||
| Class T | 1,000.00 | 991.20 | 1.74 | 8.69 | ||||||||||||
| Class I | 1,000.00 | 998.20 | 0.74 | 3.71 | ||||||||||||
Hypothetical (5% return before expenses) |
| |||||||||||||||
| Class A | 1,000.00 | 1,020.04 | 0.99 | 5.03 | ||||||||||||
| Class B | 1,000.00 | 1,017.56 | 1.48 | 7.51 | ||||||||||||
| Class C | 1,000.00 | 1,018.77 | 1.24 | 6.29 | ||||||||||||
| Class T | 1,000.00 | 1,016.24 | 1.74 | 8.83 | ||||||||||||
| Class I | 1,000.00 | 1,021.31 | 0.74 | 3.76 | ||||||||||||
| * | Expenses are equal to the Fund’s annualized expense ratio, which is net of waived fees and reimbursed expenses, if applicable, multiplied by the average account value over the period, multiplied by the number of days (183) expenses were accrued in the most recent fiscal half-year, then divided by 365 to reflect the one-half year period. |
| The Fund may invest in other funds, and the annualized expense ratios noted above do not reflect fees and expenses associated with the underlying funds. If such fees and expenses were included, the expenses would have been higher. |
| You can find more information about the Fund’s expenses in the Financial Statements section that follows. For additional information on operating expenses and other shareholder costs, refer to the prospectus. |
3
Table of Contents
VIRTUS MULTI-SECTOR SHORT TERM BOND FUND
SEPTEMBER 30, 2015 (Unaudited)
BofA Merrill Lynch 1–2.99 Year Medium Quality Corporate Bonds Index
The BofA Merrill Lynch 1–2.99 Year Medium Quality Corporate Bonds Index measures performance of U.S. investment grade corporate bond issues rated “BBB” and “A” by Standard & Poor’s/Moody’s with maturities between one and three years. The index is calculated on a total return basis. The index is unmanaged, its returns do not reflect any fees, expenses, or sales charges and it is not available for direct investment.
Barclays U.S. Aggregate Bond Index
The Barclays U.S. Aggregate Bond Index measures the U.S. investment-grade fixed-rate bond market. The index is calculated on a total return basis. The index is unmanaged, its returns do not reflect any fees, expenses, or sales charges, and it is not available for direct investment.
Barclays U.S. Corporate High Yield Bond Index
The Barclays U.S. Corporate High Yield Bond Index measures the U.S. dollar-denominated, high yield, fixed-rate corporate bond market. The index is calculated on a total return basis. The index is unmanaged, its returns do not reflect any fees, expenses, or sales charges, and it is not available for direct investment.
Dow Jones Industrial AverageSM
A price weighted average of 30 blue chip stocks. The index is calculated on total return basis with dividends reinvested. The index is unmanaged, its returns do not reflect any fees, expenses, or sales charges, and it is not available for direct investment.
Exchange-Traded Funds (ETF)
An open-end fund that is traded on a stock exchange. Most ETFs have a portfolio of stocks or bonds that track a specific market index.
Federal Reserve (the “Fed”)
The Central Bank of the United States, responsible for controlling the money supply, interest rates and credit with the goal of keeping the U.S. economy and currency stable. Governed by a seven-member board, the system includes 12 regional Federal Reserve Banks, 25 branches and all national and state banks that are part of the system.
NASDAQ Composite Index®
A market-capitalization weighted index of the more than 3,000 common equities listed on the Nasdaq stock exchange. Unlike other market indexes, the NASDAQ composite is not limited to companies that have U.S. headquarters. The index is unmanaged, its returns do not reflect any fees, expenses, or sales charges, and it is not available for direct investment.
Real Estate Investment Trust (REIT)
A publicly traded company that owns, develops, and operates income-producing real estate such as apartments, office buildings, hotels, shopping centers, and other commercial properties.
S&P 500® Index
The S&P 500® Index is a free-float market capitalization-weighted index of 500 of the largest U.S. companies. The index is calculated on a total return basis with dividends reinvested. The index is unmanaged, its returns do not reflect any fees, expenses, or sales charges, and it is not available for direct investment.
4
Table of Contents
MULTI-SECTOR SHORT TERM BOND FUND Portfolio Manager Commentary by Newfleet Asset Management, LLC | Ticker Symbols: Class A: NARAX Class B: PBARX Class C: PSTCX Class T: PMSTX Class I: PIMSX |
| ¢ | The Fund is diversified and has an investment objective of providing high current income while attempting to limit changes in the Fund’s net asset value per share caused by interest rate changes. |
| ¢ | For the fiscal year ended September 30, 2015, the Fund’s Class A shares at NAV returned -0.23%; Class B shares returned -0.73%; Class C shares returned -0.27%; Class T shares returned -0.98%; and Class I shares returned 0.02%. For the same period, the Barclays U.S. Aggregate Bond Index, a broad-based fixed income index, returned 2.94%; and the BofA Merrill Lynch 1–2.99 Year Medium Quality Corporate Bonds Index, the Fund’s style-specific index appropriate for comparison, returned 1.07%. |
All performance figures assume reinvestment of distributions and exclude the effect of sales charges. Past performance is no guarantee of future results, and current performance may be higher or lower than the performance shown.
How did the market perform during the Fund’s fiscal year?
| ¢ | Most spread sectors underperformed U.S. Treasuries during the fiscal year. Plummeting oil prices dominated market volatility and investor concerns in the first half of the fiscal year, especially during the fourth quarter of 2014. Brent crude, the international benchmark for oil prices, fell about 50% between September 2014 (when the price was roughly $93 a barrel) and September 2015, ending the period at roughly $47 a barrel. Brent crude oil hit a 12-month low of roughly $40 a barrel on August 24, 2015. |
| ¢ | Globally, concerns over slowing growth in China and the Greek debt crisis weighed on the fixed income markets. A looming U.S. Federal Reserve (“Fed”) rate hike, with negative implications for capital flows and debt |
financing, added to the turmoil, with some emerging market central banks (unlike the International Monetary Fund and the World Bank) calling for the Fed to raise rates and remove the uncertainty that could prove to be more harmful than the actual impact. |
| ¢ | The waiting game for the Fed to raise interest rates from their near-zero level maintained since December 2008 continued through the end of the fiscal year. As of its September 17 meeting, the Fed decided to leave its benchmark rate unchanged, balancing relatively strong U.S. growth and labor market conditions against a lack of inflation, a strengthening U.S. dollar, and a shaky global economy. |
| ¢ | Over the last 12 months, yields increased on the short end of the U.S. Treasury curve and decreased on the intermediate to long end, and the curve flattened overall. |
What factors affected the Fund’s performance during its fiscal year?
| ¢ | The outperformance of U.S. Treasuries and agency mortgages relative to most fixed income spread sectors was the key driver of the Fund’s underperformance for the fiscal year. |
| ¢ | Among fixed income sectors, the Fund’s allocation to structured products – asset-backed securities, commercial mortgage-backed securities, and non-agency residential mortgages – were positive contributors to performance for the fiscal year. |
| ¢ | During the fiscal year, the Fund’s allocation to non-U.S. dollar, corporate high yield, and emerging markets debt detracted from performance. |
The preceding information is the opinion of portfolio management. Any such opinions are subject to change at any time based upon market or other conditions and should not be relied upon as investment advice. Past performance is no guarantee of future results,
For information regarding the indexes and certain investment terms, see the Key Investment Terms on page 4.
5
Table of Contents
| MULTI-SECTOR SHORT TERM BOND FUND (Continued) |
and there is no guarantee that market forecasts will be realized.
There is no guarantee that the Fund will meet its objective.
Credit & Interest: Debt securities are subject to various risks, the most prominent of which are credit and interest rate risk. The issuer of a debt security may fail to make interest and/or principal payments. Values of debt securities may rise or fall in response to changes in interest rates, and this risk may be enhanced with longer-term maturities.
Foreign & Emerging Markets: Investing internationally, especially in emerging markets, involves additional risks such as currency, political, accounting, economic, and market risk.
High Yield-High Risk Fixed Income Securities: There is a greater level of credit risk and price volatility involved with high yield securities than investment grade securities.
ABS/MBS: Changes in interest rates can cause both extension and prepayment risks for asset- and mortgage-backed securities. These securities are also subject to risks associated with the repayment of underlying collateral.
Bank Loans: Loans may be unsecured or not fully collateralized, may be subject to restrictions on resale and/or trade infrequently on the secondary market. Loans can carry significant credit and call risk, can be difficult to value and have longer settlement times than other investments, which can make loans relatively illiquid at times.
Prospectus: For additional information on risks, please see the Fund’s prospectus.
| Asset Allocations | ||||
The following table presents the portfolio holdings within certain sectors as a percentage of total investments as of September 30, 2015.
|
| |||
Corporate Bonds and Notes | 36 | % | ||
Mortgage-Backed Securities | 25 | |||
Asset-Backed Securities | 18 | |||
Loan Agreements | 15 | |||
Foreign Government Securities | 2 | |||
Other (includes short-term investments) | 4 | |||
|
| |||
Total | 100 | % | ||
|
| |||
For information regarding the indexes and certain investment terms, see the Key Investment Terms on page 4.
6
Table of Contents
| MULTI-SECTOR SHORT TERM BOND FUND (Continued) |
| Average Annual Total Returns1 for periods ended 9/30/15 | ||||||||||||||||||||
| 1 Year | 5 Years | 10 Years | Since Inception | Inception Date | ||||||||||||||||
| Class A Shares at NAV2 | -0.23 | % | 3.38 | % | 4.59 | % | — | — | ||||||||||||
| Class A Shares at POP3,4 | -2.47 | 2.91 | 4.35 | — | — | |||||||||||||||
| Class B Shares at NAV2 | -0.73 | 2.85 | 4.05 | — | — | |||||||||||||||
| Class B Shares with CDSC4 | -2.18 | 2.85 | 4.05 | — | — | |||||||||||||||
| Class C Shares at NAV2 | -0.27 | 3.13 | 4.32 | — | — | |||||||||||||||
| Class T Shares at NAV2 and with CDSC4 | -0.98 | 2.58 | 3.79 | — | — | |||||||||||||||
| Class I Shares at NAV | 0.02 | 3.64 | — | 5.36 | % | 6/6/08 | ||||||||||||||
| Barclays U.S. Aggregate Bond Index | 2.94 | 3.10 | 4.64 | 4.505 | — | |||||||||||||||
| BofA Merrill Lynch 1–2.99 Year Medium Quality Corporate Bonds Index | 1.07 | 2.27 | 3.76 | 3.375 | — | |||||||||||||||
Fund Expense Ratios6: A Shares: 0.99%; B Shares: 1.49%; C Shares: 1.24%; T Shares: 1.74%; I Shares: 0.74%.
All returns represent past performance which is no guarantee of future results. Current performance may be higher or lower than the performance shown. The investment return and principal value of an investment will fluctuate so that an investor’s shares, when redeemed, may be worth more or less than their original cost. The above table and graph below do not reflect the deduction of taxes that a shareholder would pay on fund distributions or the redemption of fund shares. Please visit Virtus.com for performance data current to the most recent month-end.
| 1 | Total returns are historical and include changes in share price and the reinvestment of both dividends and capital gain distributions. |
| 2 | “NAV” (Net Asset Value) total returns do not include the effect of any sales charge. |
| 3 | “POP” (Public Offering Price) total returns include the effect of the maximum front-end 2.25% sales charge. |
| 4 | CDSC (Contingent Deferred Sales Charge) is applied to redemptions of certain classes of shares that do not have a sales charge applied at the time of purchase. CDSC charges for Class B shares decline from 2% to 0% over a three-year period. CDSC charges for certain redemptions of Class A shares made within 18 months of purchase in which a finder’s fee was paid and all redemptions of Class T shares are 1% within the first year and 0% thereafter. |
| 5 | The since inception index returns are from the inception date of Class I shares. |
| 6 | The expense ratios of the Fund are set forth according to the prospectus for the Fund effective January 28, 2015, as supplemented and revised, and may differ from the expense ratios disclosed in the Financial Highlights tables in this report. See the Financial Highlights for more current expense ratios. |
Growth of $10,000 for periods ended 9/30
This chart assumes an initial investment of $10,000 made on September 30, 2005, for Class A, Class B, Class C and Class T shares including any applicable sales charges or fees. Performance assumes reinvestment of dividends and capital gain distributions.
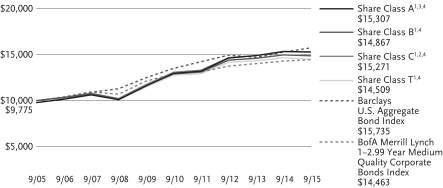
The indexes are unmanaged and not available for direct investment; therefore, their performance does not reflect the expenses associated with active management of an actual portfolio.
7
Table of Contents
VIRTUS MULTI-SECTOR SHORT TERM BOND FUND
SEPTEMBER 30, 2015
($ reported in thousands)
| PAR VALUE | VALUE | |||||||
| U.S. GOVERNMENT SECURITIES—0.9% | ||||||||
U.S. Treasury Note | ||||||||
0.750%, 4/15/18 | $ | 29,000 | $ | 28,957 | ||||
1.625%, 12/31/19 | 4,000 | 4,060 | ||||||
1.500%, 5/31/20 | 32,925 | 33,219 | ||||||
| TOTAL U.S. GOVERNMENT SECURITIES | ||||||||
| (Identified Cost $65,858) | 66,236 | |||||||
| MUNICIPAL BONDS—0.0% | ||||||||
| Virginia—0.0% | ||||||||
Tobacco Settlement Financing Corp. | 4,635 | 3,555 | ||||||
| TOTAL MUNICIPAL BONDS (Identified Cost $4,295) | 3,555 | |||||||
| FOREIGN GOVERNMENT SECURITIES—2.0% | ||||||||
Argentine Republic | 24,360 | 24,908 | ||||||
Bolivarian Republic of Venezuela | ||||||||
RegS | 4,165 | 3,519 | ||||||
RegS | 20,999 | 7,770 | ||||||
RegS | 19,501 | 6,777 | ||||||
Mongolia 144A | 12,680 | 11,761 | ||||||
Republic of Chile | 11,647,000 | CLP | 17,311 | |||||
Republic of Colombia Treasury Note, | 21,072,000 | COP | 7,672 | |||||
Republic of Latvia RegS | 8,560 | 8,720 | ||||||
Republic of Panama | 3,800 | 4,099 | ||||||
Republic of Romania 144A | 7,000 | 8,260 | ||||||
| PAR VALUE | VALUE | |||||||
| FOREIGN GOVERNMENT SECURITIES (continued) | ||||||||
Republic of South Africa | 134,520 | ZAR | $ | 9,879 | ||||
Republic of Sri Lanka 144A | $ | 17,450 | 17,712 | |||||
Russian Federation 144A | 1,005,000 | RUB | 14,339 | |||||
State of Qatar 144A | 12,000 | 12,318 | ||||||
| TOTAL FOREIGN GOVERNMENT SECURITIES | ||||||||
| (Identified Cost $185,766) | 155,045 | |||||||
| MORTGAGE-BACKED SECURITIES—24.6% | ||||||||
| Agency—3.3% | ||||||||
FHLMC 14-DN2, M2 | 13,365 | 13,257 | ||||||
FNMA | ||||||||
5.500%, 1/1/17 | 26 | 26 | ||||||
6.000%, 5/1/17 | 8 | 8 | ||||||
4.500%, 4/1/18 | 114 | 118 | ||||||
5.000%, 10/1/19 | 337 | 351 | ||||||
5.500%, 2/1/20 | 67 | 68 | ||||||
5.500%, 3/1/20 | 124 | 131 | ||||||
5.500%, 3/1/20 | 15 | 15 | ||||||
5.500%, 3/1/20 | 42 | 44 | ||||||
5.500%, 3/1/20 | 70 | 73 | ||||||
5.500%, 4/1/20 | 203 | 216 | ||||||
5.000%, 6/1/20 | 333 | 349 | ||||||
4.000%, 8/1/25 | 11,765 | 12,525 | ||||||
3.000%, 6/1/27 | 1,061 | 1,110 | ||||||
2.500%, 5/1/28 | 16,733 | 17,222 | ||||||
6.000%, 12/1/32 | 44 | 50 | ||||||
5.500%, 2/1/33 | 66 | 74 | ||||||
5.500%, 5/1/34 | 321 | 362 | ||||||
6.000%, 8/1/34 | 252 | 288 | ||||||
5.500%, 11/1/34 | 388 | 433 | ||||||
5.500%, 11/1/34 | 143 | 160 | ||||||
6.000%, 11/1/34 | 220 | 248 | ||||||
5.500%, 12/1/34 | 136 | 153 | ||||||
5.500%, 1/1/35 | 286 | 322 | ||||||
5.500%, 7/1/37 | 6 | 7 | ||||||
6.000%, 7/1/37 | 44 | 50 | ||||||
6.000%, 4/1/38 | 203 | 230 | ||||||
5.000%, 12/1/39 | 7,082 | 7,826 | ||||||
See Notes to Financial Statements
8
Table of Contents
VIRTUS MULTI-SECTOR SHORT TERM BOND FUND
SCHEDULE OF INVESTMENTS (Continued)
SEPTEMBER 30, 2015
($ reported in thousands)
| PAR VALUE | VALUE | |||||||
| MORTGAGE-BACKED SECURITIES (continued) | ||||||||
| Agency (continued) | ||||||||
4.500%, 4/1/40 | $ | 8,969 | $ | 9,735 | ||||
5.000%, 8/1/40 | 14,214 | 15,741 | ||||||
4.000%, 10/1/40 | 182 | 194 | ||||||
4.000%, 3/1/41 | 5,748 | 6,140 | ||||||
4.500%, 5/1/41 | 6,356 | 6,914 | ||||||
3.500%, 4/1/42 | 11,636 | 12,173 | ||||||
3.500%, 12/1/42 | 34,201 | 35,779 | ||||||
3.000%, 3/1/43 | 58,029 | 58,999 | ||||||
3.000%, 5/1/43 | 17,698 | 18,000 | ||||||
4.000%, 10/1/44 | 29,642 | 31,649 | ||||||
GNMA | ||||||||
6.500%, 11/15/31 | 20 | 23 | ||||||
6.500%, 2/15/32 | 23 | 27 | ||||||
|
| |||||||
| 251,090 | ||||||||
|
| |||||||
| Non-Agency—21.3% | ||||||||
A-10 Securitization LLC | ||||||||
13-1, A 144A | 974 | 977 | ||||||
14-1, A1 144A | 12,909 | 12,883 | ||||||
ABN AMRO Mortgage Corp. 02-9, M | 594 | 570 | ||||||
Access Point Financial, Inc. | 11,237 | 11,234 | ||||||
American Homes 4 Rent | ||||||||
14-SFR1, A 144A | 7,294 | 7,154 | ||||||
15-SFR1, A 144A | 7,886 | 7,840 | ||||||
Americold LLC Trust 10-ARTA, A1 144A | 8,498 | 8,875 | ||||||
Ameriquest Mortgage Securities, Inc. | 1,026 | 1,056 | ||||||
Asset Backed Funding Certificates | 3,475 | 3,568 | ||||||
| PAR VALUE | VALUE | |||||||
| Non-Agency (continued) | ||||||||
B2R Mortgage Trust 15-1, A1 144A | $ | 11,690 | $ | 11,652 | ||||
Banc of America (Merrill Lynch) Commercial Mortgage, Inc. 07-2, A4 | 18,643 | 19,344 | ||||||
Banc of America Alternative Loan Trust | ||||||||
03-2, CB3 | 16,926 | 17,534 | ||||||
03-10, 2A1 | 3,258 | 3,511 | ||||||
Banc of America Funding Corp. | 2,211 | 2,248 | ||||||
Banc of America Funding Trust | ||||||||
04-B, 2A1 | 896 | 886 | ||||||
05-1, 1A1 | 603 | 609 | ||||||
06-2, 3A1 | 3,212 | 3,278 | ||||||
Banc of America Mortgage Trust 04-11, 5A1 | 889 | 903 | ||||||
Banc of America Mortgage Trust | ||||||||
04-7, 6A3 | 862 | 862 | ||||||
04-11, 2A1 | 1,773 | 1,813 | ||||||
05-3, 1A15 | 1,979 | 2,008 | ||||||
Bank of America (Merrill Lynch – Countrywide) Alternative Loan Trust 04-22CB, 1A1 | 27,323 | 28,781 | ||||||
See Notes to Financial Statements
9
Table of Contents
VIRTUS MULTI-SECTOR SHORT TERM BOND FUND
SCHEDULE OF INVESTMENTS (Continued)
SEPTEMBER 30, 2015
($ reported in thousands)
| PAR VALUE | VALUE | |||||||
| MORTGAGE-BACKED SECURITIES (continued) | ||||||||
| Non-Agency (continued) | ||||||||
Bank of America (Merrill Lynch – Countrywide) Asset-Backed Certificates | ||||||||
04-10, AF6 | $ | 1,007 | $ | 1,033 | ||||
05-1 AF5A | 13,627 | 13,488 | ||||||
05-12, 2A3 | 4,191 | 4,299 | ||||||
Bank of America (Merrill Lynch – Countrywide) Commercial Mortgage Trust 06-4, A3 | 8,533 | 8,783 | ||||||
Bank of America (Merrill Lynch – Countrywide) Home Loan Mortgage Pass-Through-Trust | ||||||||
04-6, 1A2 | 1,683 | 1,675 | ||||||
04-4, A6 | 1,249 | 1,279 | ||||||
Bank of America (Merrill Lynch – Countrywide) Mortgage Trust 06-C1, AM | 7,570 | 7,714 | ||||||
Bank of America (Merrill Lynch – Deutsche Bank Trust) | 19,916 | 20,347 | ||||||
Bank of America (Merrill Lynch) Mortgage Investors, Inc. 98-C1, B | 10,000 | 10,642 | ||||||
Bank of America (Merrill Lynch) Commercial Mortgage Trust 06-3, A4 | 10,005 | 10,250 | ||||||
| PAR VALUE | VALUE | |||||||
| Non-Agency (continued) | ||||||||
Barclays (Lehman Brothers) – UBS Commercial Mortgage Trust | ||||||||
06-C3, AM | $ | 7,615 | $ | 7,723 | ||||
07-C2, A3 | 6,369 | 6,636 | ||||||
07-C6, A4 | 13,473 | 14,045 | ||||||
07-C7, A3 | 11,008 | 11,855 | ||||||
Bayview Commercial Asset Trust | ||||||||
07-5A, A2 144A | 2,676 | 3,059 | ||||||
08-1, A3 144A | 32,808 | 31,582 | ||||||
Bayview Financial Acquisition Trust 07-A, 1A2 | 7,796 | 8,189 | ||||||
Bayview Financial Mortgage-Pass-Through Trust | ||||||||
06-A, 1A2 | 41 | 43 | ||||||
06-A, 1A4 | 16,408 | 17,200 | ||||||
BCRR Trust 09-1, 2A1 5.858%, 7/17/40(2) | 2,871 | 2,934 | ||||||
Citicorp Mortgage Securities, Inc. 07-1,A1 | 203 | 204 | ||||||
Citicorp Residential Mortgage Securities, Inc. | 5,576 | 5,764 | ||||||
Citigroup – Deutsche Bank Commercial Mortgage Trust | ||||||||
06-CD2, A4 | 1,672 | 1,673 | ||||||
07-CD4, A4 | 4,505 | 4,651 | ||||||
07-CD4, AMFX | 13,955 | 14,425 | ||||||
See Notes to Financial Statements
10
Table of Contents
VIRTUS MULTI-SECTOR SHORT TERM BOND FUND
SCHEDULE OF INVESTMENTS (Continued)
SEPTEMBER 30, 2015
($ reported in thousands)
| PAR VALUE | VALUE | |||||||
| MORTGAGE-BACKED SECURITIES (continued) | ||||||||
| Non-Agency (continued) | ||||||||
Citigroup Commercial Mortgage Trust | ||||||||
07-C6, A1A | $ | 26,496 | $ | 27,989 | ||||
07-C6, A4 | 388 | 410 | ||||||
08-C7, AM | 12,335 | 13,271 | ||||||
10-RR3, MLSR 144A | 3,134 | 3,282 | ||||||
Citigroup Mortgage Loan Trust, Inc. | ||||||||
03-UP3, A2 | 841 | 884 | ||||||
04-UST1, A3 | 1,622 | 1,625 | ||||||
04-NCM2, 2CB2 | 12,524 | 13,283 | ||||||
14-A, A 144A | 16,322 | 16,878 | ||||||
05-5, 2A3 | 624 | 621 | ||||||
Colony Multi-Family Commercial Mortgage-Backed Securities 14-1, A 144A | 19,232 | 19,226 | ||||||
Commercial Mortgage Trust | ||||||||
10-C1, D 144A | 6,669 | 7,307 | ||||||
07-GG11, AM | 19,989 | 21,111 | ||||||
Credit Suisse Commercial Mortgage Trust | ||||||||
07-C1, A1A | 37,912 | 39,351 | ||||||
07-C5, A1AM | 21,039 | 21,389 | ||||||
14-LVR2, A2 144A | 14,150 | 14,573 | ||||||
07-C2, A3 | 12,995 | 13,575 | ||||||
| PAR VALUE | VALUE | |||||||
| Non-Agency (continued) | ||||||||
Credit Suisse First Boston Mortgage Securities Corp. | ||||||||
03-27, 5A3 | $ | 1,817 | $ | 1,853 | ||||
04-8, 7A1 | 6,049 | 6,383 | ||||||
Deutsche Bank-UBS Mortgage Trust 11-LC3A, D 144A | 6,306 | 6,733 | ||||||
Extended Stay America Trust 13-ESH7, A17 144A | 16,230 | 16,254 | ||||||
Fannie Mae Connecticut Avenue Securities | 1,420 | 1,276 | ||||||
FDIC Trust 13-N1, A 144A | 2,548 | 2,553 | ||||||
GAHR Commercial Mortgage Trust 15-NRF, CFX 144A | 16,875 | 16,826 | ||||||
GMAC Mortgage Corp. Loan Trust | ||||||||
06-HLTV, A4 | 1,710 | 1,720 | ||||||
03-J7, A10 | 1,321 | 1,354 | ||||||
04-AR1, 12A | 9,022 | 9,175 | ||||||
05-AR1, 5A | 2,867 |
| 2,829 |
| ||||
Goldman Sachs Mortgage Securities Trust | ||||||||
07-GG,10 | 2,976 | 3,166 | ||||||
II 07-GG10, A4 | 18,831 | 19,860 | ||||||
Goldman Sachs Residential Mortgage Loan Trust | ||||||||
05-5F, B1 | 2,862 | 2,783 | ||||||
See Notes to Financial Statements
11
Table of Contents
VIRTUS MULTI-SECTOR SHORT TERM BOND FUND
SCHEDULE OF INVESTMENTS (Continued)
SEPTEMBER 30, 2015
($ reported in thousands)
| PAR VALUE | VALUE | |||||||
| MORTGAGE-BACKED SECURITIES (continued) | ||||||||
| Non-Agency (continued) | ||||||||
07-1F, 2A2 | $ | 470 | $ | 447 | ||||
GSAA Home Equity Trust | ||||||||
05-1, AF4 | 609 | 641 | ||||||
05-12, AF3W | 4,851 | 4,979 | ||||||
Hilton USA Trust 13-HLT, EFX 144A | 21,980 | 22,193 | ||||||
Home Equity Loan Trust 07-HSA3, AI4 | 9,928 | 10,051 | ||||||
IMC Home Equity Loan Trust 97-5, A9 | 2,976 | 2,987 | ||||||
Jefferies Resecuritization Trust | ||||||||
14-R1, 1A1 144A | 9,828 | 9,836 | ||||||
14-R1, 2A1 144A | 7,664 | 7,659 | ||||||
JPMorgan Chase (Bear Stearns) Adjustable Rate Mortgage Trust 04-10, 14A1 144A | 1,645 | 1,607 | ||||||
JPMorgan Chase (Bear Stearns) Asset Backed Securities Trust 03-AC4. A | 7,841 | 8,095 | ||||||
JPMorgan Chase (Bear Stearns) Commercial Mortgage Securities, Inc. | ||||||||
06-T22, AM | 10,700 | 10,852 | ||||||
06-PW12, AM | 9,250 | 9,468 | ||||||
06-PW14, AM | 5,000 | 5,194 | ||||||
| PAR VALUE | VALUE | |||||||
| Non-Agency (continued) | ||||||||
05-PW10, AM | $ | 14,480 | $ | 14,518 | ||||
06-PWR13, AM | 3,272 | 3,377 | ||||||
07- PW15, AM | 13,247 | 13,608 | ||||||
07- PW17, A4 | 21,890 | 23,116 | ||||||
07-PW18, AM | 12,400 | 13,374 | ||||||
JPMorgan Chase (Washington Mutual) Mortgage Pass-Through Certificates Trust | ||||||||
04-CB1, 5A | 1,215 | 1,242 | ||||||
03-AR6, A1 | 1,065 | 1,066 | ||||||
03-AR4, 2A1 | 332 | 328 | ||||||
04-CB1, 2A | 3,445 | 3,560 | ||||||
JPMorgan Chase Commercial Mortgage Securities Trust | ||||||||
09-IWST, A1 144A | 5,770 | 6,107 | ||||||
10-CNTR, A2 144A | 11,503 | 12,561 | ||||||
10-CNTR, D 144A | 765 | 865 | ||||||
15-SGP, B 144A | 13,925 | 13,925 | ||||||
14-1, 1A1 144A | 26,408 | 27,671 | ||||||
06-LDP7, AM | 22,312 | 22,829 | ||||||
06-LDP7, A4 | 8,734 | 8,867 | ||||||
06-LDP9, A3 | 19,732 | 20,390 | ||||||
06-LDP9, AM | 24,850 | 25,471 | ||||||
07-LDPX, AM | 32,275 | 33,175 | ||||||
See Notes to Financial Statements
12
Table of Contents
VIRTUS MULTI-SECTOR SHORT TERM BOND FUND
SCHEDULE OF INVESTMENTS (Continued)
SEPTEMBER 30, 2015
($ reported in thousands)
| PAR VALUE | VALUE | |||||||
| MORTGAGE-BACKED SECURITIES (continued) | ||||||||
| Non-Agency (continued) | ||||||||
07-LD12, A4 | $ | 15,529 | $ | 16,331 | ||||
JPMorgan Chase Mortgage Trust 15-5, A2 144A | 13,675 | 13,806 | ||||||
JPMorgan Chase Mortgage Trust | ||||||||
14-2, 2A2 144A | 13,985 | 14,415 | ||||||
06-A2, 4A1 144A | 2,147 | 2,154 | ||||||
04-A4, 2A1 | 3,945 | 4,008 | ||||||
05-A1, 4A1 144A | 855 | 862 | ||||||
05-A2, 4A1 144A | 1,187 | 1,160 | ||||||
05-A4, 3A1 144A | 5,822 | 5,806 | ||||||
06-A6, 3A3L 144A | 1,781 | 1,548 | ||||||
14-IVR3, 2A1 144A | 5,777 | 5,807 | ||||||
MASTR Adjustable Rate Mortgages Trust 04-12,3A1 | 1,677 | 1,665 | ||||||
MASTR Alternative Loan Trust | ||||||||
04-7, 4A1 | 2,913 | 2,967 | ||||||
03-8, 2A1 | 6,463 | 6,776 | ||||||
04-4, 6A1 | 3,580 | 3,759 | ||||||
04-6, 7A1 | 6,318 | 6,429 | ||||||
04-7, 9A1 | 15,372 | 16,102 | ||||||
05-2, 2A1 | 3,748 | 3,984 | ||||||
05-2, 1A1 | 10,571 | 11,068 | ||||||
| PAR VALUE | VALUE | |||||||
| Non-Agency (continued) | ||||||||
MASTR Asset Securitization Trust 05-1, 1A1 | $ | 605 | $ | 610 | ||||
MASTR Reperforming Loan Trust | 1,825 | 1,833 | ||||||
Morgan Stanley Capital I Trust | ||||||||
06-T23, AM | 10,575 | 10,894 | ||||||
08-T29, AM | 1,610 | 1,768 | ||||||
06-IQ12, A4 | 13,356 | 13,755 | ||||||
07-IQ14, A4 | 17,390 | 18,142 | ||||||
07-IQ14, AM | 15,932 | 16,545 | ||||||
07- LQ16, A4 | 21,232 | 22,582 | ||||||
Morgan Stanley Mortgage Loan Trust | ||||||||
04-2AR, 3A | 1,796 | 1,793 | ||||||
04-2AR, 4A | 1,415 | 1,429 | ||||||
Morgan Stanley Residential Mortgage Loan Trust 14-1A, A1 144A | 8,255 | 8,413 | ||||||
Motel 6 Trust 15-MTL6, B 144A | 9,275 | 9,346 | ||||||
New Residential Mortgage Loan Trust | ||||||||
14-1A, A 144A | 8,487 | 8,764 | ||||||
14-2A, 3A 144A | 2,513 | 2,621 | ||||||
14-3A, AFX3 144A | 6,939 | 7,180 | ||||||
Nomura Asset Acceptance Corp. 04-R3, A1 144A | 7,630 | 7,790 | ||||||
See Notes to Financial Statements
13
Table of Contents
VIRTUS MULTI-SECTOR SHORT TERM BOND FUND
SCHEDULE OF INVESTMENTS (Continued)
SEPTEMBER 30, 2015
($ reported in thousands)
| PAR VALUE | VALUE | |||||||
| MORTGAGE-BACKED SECURITIES (continued) | ||||||||
| Non-Agency (continued) | ||||||||
Residential Accredit Loans, Inc. | ||||||||
03-QS6, A4 | $ | 952 | $ | 960 | ||||
03-QS17, CB5 | 1,368 | 1,409 | ||||||
05-QS1, A5 | 1,176 | 1,186 | ||||||
Residential Asset Mortgage Products, Inc. | ||||||||
04-SL2, A3 | 2,095 | 2,203 | ||||||
04-SL1, A8 | 2,374 | 2,438 | ||||||
05-SL2, A4 | 2,100 | 2,195 | ||||||
04-SL4, A3 | 1,469 | 1,511 | ||||||
03-RS8, AI7 | 541 | 547 | ||||||
Residential Asset Securitization Trust | ||||||||
03-A11, A9 | 2,813 | 2,887 | ||||||
04-A1, A5 | 13,366 | 13,558 | ||||||
Residential Funding Mortgage Securities I, Inc. | ||||||||
06-S12, 1A1 | 1,237 | 1,257 | ||||||
05-S1, 1A2 | 943 | 950 | ||||||
Residential Funding Mortgage Securities II Home Loan Trust 06-H11, M1 | 1,088 | 1,088 | ||||||
Sequoia Mortgage Trust | ||||||||
14-2, A1 144A | 10,687 | 11,014 | ||||||
15-1, A1 144A | 10,544 | 10,641 | ||||||
| PAR VALUE | VALUE | |||||||
| Non-Agency (continued) | ||||||||
Structured Adjustable Rate Mortgage Loan Trust | ||||||||
03-30, 2A1 | $ | 4,145 | $ | 4,234 | ||||
04-4, 3A1 | 817 | 810 | ||||||
04-4, 3A4 | 2,788 | 2,763 | ||||||
04-4, 3A2 | 3,613 | 3,614 | ||||||
04-5, 3A2 | 1,755 | 1,750 | ||||||
04-14, 7A | 12,752 | 12,786 | ||||||
Structured Asset Securities Corp. Assistance Loan Trust 03-AL1, A 144A | 9,020 | 8,877 | ||||||
Structured Asset Securities Corp. Mortgage Pass-Through Certificates | ||||||||
02-AL1, A3 | 11,064 | 10,935 | ||||||
03-33H, 1A1 | 3,901 | 3,981 | ||||||
03-34A, 6A | 2,833 | 2,774 | ||||||
04-15, 3A3 | 2,688 | 2,726 | ||||||
Towd Point Mortgage Trust 15-3, A1B 144A | 7,159 | 7,209 | ||||||
Vericrest Opportunity Loan Trust | ||||||||
15-NP11, A1 144A | 7,910 | 7,894 | ||||||
14-NP10, A1 144A | 2,761 | 2,752 | ||||||
14-NPL9, A1 144A | 9,278 | 9,264 | ||||||
15-NPL4, A1 144A | 5,533 | 5,521 | ||||||
See Notes to Financial Statements
14
Table of Contents
VIRTUS MULTI-SECTOR SHORT TERM BOND FUND
SCHEDULE OF INVESTMENTS (Continued)
SEPTEMBER 30, 2015
($ reported in thousands)
| PAR VALUE | VALUE | |||||||
| MORTGAGE-BACKED SECURITIES (continued) | ||||||||
| Non-Agency (continued) | ||||||||
15-NPL3, A1 144A | $ | 16,936 | $ | 16,885 | ||||
VFC LLC 14-2, A 144A | 3,271 | 3,270 | ||||||
Wells Fargo (Royal Bank of Scotland plc) Commercial Mortgage Trust 11-C5, C 144A | 1,800 | 1,988 | ||||||
Wells Fargo (Wachovia Bank Commercial Mortgage Trust) | ||||||||
04-C15, B | 7,573 | 7,587 | ||||||
06-C25, A4 | 6,563 | 6,615 | ||||||
07-31, AM | 34,000 | 35,736 | ||||||
Wells Fargo (Wachovia Bank) Commercial Mortgage Trust | ||||||||
06-C25, AM | 18,625 | 18,986 | ||||||
07-C30, A5 | 39,765 | 41,140 | ||||||
07-C30, AM | 25,695 | 26,707 | ||||||
07-C31, A4 | 14,562 | 14,859 | ||||||
07-C32, A3 | 22,577 | 23,665 | ||||||
07-C33, A5 | 1,265 | 1,357 | ||||||
Wells Fargo Mortgage Backed Securities Trust | ||||||||
06-17, A1 | 168 | 170 | ||||||
03-G, A1 | 1,390 | 1,404 | ||||||
03-J, 5A1 | 501 | 506 | ||||||
| PAR VALUE | VALUE | |||||||
| Non-Agency (continued) | ||||||||
04-4, A9 | $ | 2,080 | $ | 2,139 | ||||
04-U, A1 | 1,125 | 1,123 | ||||||
04-Z, 2A1 | 6,918 | 6,918 | ||||||
04-CC, A1 | 2,905 | 2,935 | ||||||
05-12, 1A1 | 4,678 | 4,766 | ||||||
05-14, 2A1 | 3,569 | 3,634 | ||||||
06-6, 1A15 | 442 | 437 | ||||||
07-16, 1A1 | 3,667 | 3,777 | ||||||
07-AR10, 2A1 | 4,554 | 4,479 | ||||||
WinWater Mortgage Loan Trust 14-1, A1 144A | 14,735 | 15,241 | ||||||
|
| |||||||
| 1,644,848 | ||||||||
| TOTAL MORTGAGE-BACKED SECURITIES | ||||||||
| (Identified Cost $1,864,345) | 1,895,938 | |||||||
| ASSET-BACKED SECURITIES—18.5% | ||||||||
American Credit Acceptance Receivables Trust 14-3, C 144A | 19,200 | 19,351 | ||||||
AmeriCredit Automobile Receivables Trust | ||||||||
12-1, C | 2,636 | 2,646 | ||||||
12-3, D | 19,762 | 20,075 | ||||||
12-4, D | 7,150 | 7,241 | ||||||
13-2, D | 23,090 | 23,284 | ||||||
14-1, D | 18,320 | 18,457 | ||||||
14-2, C | 19,450 | 19,538 | ||||||
See Notes to Financial Statements
15
Table of Contents
VIRTUS MULTI-SECTOR SHORT TERM BOND FUND
SCHEDULE OF INVESTMENTS (Continued)
SEPTEMBER 30, 2015
($ reported in thousands)
| PAR VALUE | VALUE | |||||||
| ASSET-BACKED SECURITIES (continued) | ||||||||
15-3, C | $ | 9,730 | $ | 9,775 | ||||
Applebee’s LLC 14-1, A2 144A | 20,471 | 20,941 | ||||||
Ascentium Equipment Receivables 15-A1, B 144A | 5,400 | 5,469 | ||||||
Associates Manufactured Housing Pass-Through Certificates 96-1, B1 | 1,527 | 1,637 | ||||||
Avant Loans Funding Trust 2015-A 144A | 4,113 | 4,113 | ||||||
Avis Budget Rental Car Funding LLC | ||||||||
(AESOP) 11-3A, A 144A | 12,848 | 13,136 | ||||||
(AESOP) 12-3A, A 144A | 23,085 | 23,254 | ||||||
(AESOP) 13-2A, A 144A | 2,635 | 2,713 | ||||||
BankAmerica Manufactured Housing Contract Trust 98-1, B1 | 2,625 | 2,727 | ||||||
Barclays (Lehman Brothers) Manufactured Housing Contract Trust 01-B, A3 | 3,317 | 3,407 | ||||||
BCC Funding VIII LLC | ||||||||
14-A, B 144A | 2,799 | 2,823 | ||||||
14-1A, C 144A | 5,519 | 5,571 | ||||||
Beacon Container Finance LLC 12-1A, A 144A | 20,384 | 20,681 | ||||||
| PAR VALUE | VALUE | |||||||
| ASSET-BACKED SECURITIES (continued) | ||||||||
BXG Receivables Note Trust | ||||||||
10-A, A 144A | $ | 1,794 | $ | 1,849 | ||||
12-A, A 144A | 4,201 | 4,193 | ||||||
13-A, A 144A | 7,234 | 7,296 | ||||||
15-A, A 144A | 3,294 | 3,302 | ||||||
California Republic Auto Receivables Trust | ||||||||
12-1, B 144A | 13,570 | 13,640 | ||||||
13-1, B 144A | 11,600 | 11,748 | ||||||
14-2, B | 7,090 | 7,121 | ||||||
14-2, C | 2,700 | 2,704 | ||||||
15-3, B | 3,705 | 3,711 | ||||||
Capital Auto Receivables Asset Trust | ||||||||
13-1, C | 5,425 | 5,446 | ||||||
13-4, C | 2,950 | 2,989 | ||||||
15-2, C | 7,250 | 7,285 | ||||||
CarFinance Capital Auto Trust | ||||||||
13-1A, B 144A | 5,541 | 5,572 | ||||||
13-A1, C 144A | 2,210 | 2,234 | ||||||
13-2A, B 144A | 19,350 | 19,596 | ||||||
14-1A, B 144A | 5,550 | 5,568 | ||||||
14-2A, B 144A | 3,455 | 3,483 | ||||||
14-2A, C 144A | 2,765 | 2,783 | ||||||
15-A1, B 144A | 6,000 | 6,077 | ||||||
See Notes to Financial Statements
16
Table of Contents
VIRTUS MULTI-SECTOR SHORT TERM BOND FUND
SCHEDULE OF INVESTMENTS (Continued)
SEPTEMBER 30, 2015
($ reported in thousands)
| PAR VALUE | VALUE | |||||||
| ASSET-BACKED SECURITIES (continued) | ||||||||
CarMax Auto Owner Trust | ||||||||
14-2, B | $ | 1,000 | $ | 1,007 | ||||
15-2, C | 2,275 | 2,280 | ||||||
CarNow Auto Receivables Trust | ||||||||
14-1A, D 144A | 3,000 | 2,959 | ||||||
14-1A, E 144A | 3,650 | 3,620 | ||||||
15-2,C 144A | 5,000 | 5,000 | ||||||
CCG Receivables Trust | ||||||||
14-1, B 144A | 5,080 | 5,103 | ||||||
15-1, A3 144A | 4,000 | 4,014 | ||||||
Centre Point Funding LLC 12-2A, 1 144A | 10,467 | 10,432 | ||||||
Cheesecake Restaurant Holdings, Inc. 13-1A, A2 144A | 23,788 | 24,638 | ||||||
CLI Funding LLC 14-2A, A 144A | 7,721 | 7,791 | ||||||
CNH Equipment Trust 12-B, B | 4,000 | 4,019 | ||||||
Conseco Financial Corp. | ||||||||
94-1, A5 | 68 | 70 | ||||||
01-3, A4 | 10,396 | 11,456 | ||||||
DB Master Finance LLC | ||||||||
15-1A, A2I 144A | 4,975 | 5,004 | ||||||
15-A1, A2II 144A | 18,922 | 19,081 | ||||||
Diamond Resorts Owner Trust 14-1, A 144A | 7,312 | 7,387 | ||||||
| PAR VALUE | VALUE | |||||||
| ASSET-BACKED SECURITIES (continued) | ||||||||
Direct Capital Funding IV LLC | ||||||||
13-1, D 144A | $ | 3,555 | $ | 3,598 | ||||
13-A1, C 144A | 5,000 | 5,074 | ||||||
Domino’s Pizza Master Issuer LLC 12-1A, A2 144A | 19,325 | 19,905 | ||||||
Drive Auto Receivables Trust | ||||||||
15-DA, B 144A | 3,920 | 3,920 | ||||||
14-AA, C 144A | 18,650 | 18,858 | ||||||
15-AA, D 144A | 7,920 | 8,044 | ||||||
Drug Royalty LP II 14-1, A2 144A | 21,706 | 22,049 | ||||||
DT Auto Owner Trust | ||||||||
13-1A, C 144A | 6,527 | 6,536 | ||||||
13-2A, C 144A | 17,500 | 17,607 | ||||||
14-1A, C 144A | 18,900 | 19,007 | ||||||
14-2A, C 144A | 14,370 | 14,370 | ||||||
14-3A, C 144A | 4,840 | 4,897 | ||||||
15-1A, C 144A | 7,000 | 7,060 | ||||||
Exeter Automobile Receivables Trust | ||||||||
12-1A, C 144A | 4,427 | 4,463 | ||||||
12-2A, C 144A | 8,050 | 8,076 | ||||||
13-2A, B 144A | 17,820 | 17,956 | ||||||
14-1A, B 144A | 9,220 | 9,270 | ||||||
13-1A, C 144A | 20,725 | 21,034 | ||||||
14-1A, C 144A | 15,830 | 16,017 | ||||||
See Notes to Financial Statements
17
Table of Contents
VIRTUS MULTI-SECTOR SHORT TERM BOND FUND
SCHEDULE OF INVESTMENTS (Continued)
SEPTEMBER 30, 2015
($ reported in thousands)
| PAR VALUE | VALUE | |||||||
| ASSET-BACKED SECURITIES (continued) | ||||||||
14-2A, C 144A | $ | 14,615 | $ | 14,634 | ||||
15-A1, C 144A | 14,505 | 14,785 | ||||||
15-2A, C 144A | 17,705 | 17,947 | ||||||
14-3A, D 144A | 13,875 | 14,211 | ||||||
Fairway Outdoor Funding LLC 12-1A, A2 144A | 20,914 | 21,131 | ||||||
First Investors Auto Owner Trust 15-1A, C 144A | 5,000 | 4,967 | ||||||
Flagship Credit Auto Trust | ||||||||
14-2, D 144A | 9,560 | 9,664 | ||||||
15-2, C 144A | 6,495 | 6,522 | ||||||
Foursight Capital Automobile Receivables Trust | ||||||||
14-1, B 144A | 4,704 | 4,784 | ||||||
15-1, B 144A | 5,589 | 5,656 | ||||||
Global Science Finance S.A.R.L. | ||||||||
13-1A, A 144A | 11,716 | 11,811 | ||||||
13-2A, A 144A | 5,656 | 5,649 | ||||||
Gold Key Resorts LLC 14-A, A 144A | 10,312 | 10,383 | ||||||
GreatAmerica Leasing Receivables Funding, LLC 13-1, A4 144A | 2,235 | 2,238 | ||||||
Greater Capital Association of Realtors 15-1A, C | 8,195 | 8,183 | ||||||
| PAR VALUE | VALUE | |||||||
| ASSET-BACKED SECURITIES (continued) | ||||||||
Hertz Vehicle Financing LLC | ||||||||
11-1A, A2 144A | $ | 12,290 | $ | 12,603 | ||||
15-2A, A 144A | 6,705 | 6,704 | ||||||
Hilton Grand Vacations Trust | ||||||||
13-A, A 144A | 10,191 | 10,271 | ||||||
14-AA, A 144A | 13,908 | 13,757 | ||||||
Hyundai Auto Receivables Trust | ||||||||
14-B, D | 9,675 | 9,653 | ||||||
15-A, D | 8,950 | 9,117 | ||||||
IndyMac Manufactured Housing Contract 98-1, A3 | 998 | 1,023 | ||||||
LEAF II Receivables Funding LLC 13-1, C 144A | 6,850 | 6,873 | ||||||
LEAF Receivables Funding 10 LLC | ||||||||
15-1, D 144A | 800 | 793 | ||||||
15-1, E1 144A | 4,500 | 4,458 | ||||||
15-1, E2 144A | 2,455 | 2,370 | ||||||
LEAF Receivables Funding 8 LLC | 5,859 | 5,938 | ||||||
LEAF Receivables Funding 9 LLC | 655 | 673 | ||||||
Marriott Vacation Club Owner Trust | ||||||||
12-1A, A 144A | 16,412 | 16,529 | ||||||
See Notes to Financial Statements
18
Table of Contents
VIRTUS MULTI-SECTOR SHORT TERM BOND FUND
SCHEDULE OF INVESTMENTS (Continued)
SEPTEMBER 30, 2015
($ reported in thousands)
| PAR VALUE | VALUE | |||||||
| ASSET-BACKED SECURITIES (continued) | ||||||||
10-1A, A 144A | $ | 534 | $ | 547 | ||||
10-1A, B 144A | 1,041 | 1,074 | ||||||
MVW Owner Trust 15-1A, B 144A | 2,177 | 2,192 | ||||||
National City Mortgage Capital Trust 08-1, 2A1 | 2,432 | 2,548 | ||||||
Nations Equipment Finance Funding I LLC | ||||||||
13-1A, B 144A | 1,054 | 1,056 | ||||||
13-1A, C 144A | 7,833 | 7,850 | ||||||
OneMain Financial Issuance Trust | ||||||||
14-1A, A 144A | 16,940 | 16,939 | ||||||
15-2A, A 144A | 19,675 | 19,630 | ||||||
15-A1, A 144A | 11,875 | 11,995 | ||||||
Orange Lake Timeshare Trust | ||||||||
12-AA, A 144A | 5,200 | 5,347 | ||||||
14-AA, A 144A | 4,181 | 4,197 | ||||||
Prestige Auto Receivables Trust 14-1A, C 144A | 7,000 | 7,066 | ||||||
Santander Drive Auto Receivables Trust | ||||||||
12-2, D | 31,045 | 31,618 | ||||||
12-6, C | 7,358 | 7,382 | ||||||
12-5, C | 4,850 | 4,885 | ||||||
12-6, D | 17,455 | 17,642 | ||||||
13-1, D | 23,445 | 23,590 | ||||||
| PAR VALUE | VALUE | |||||||
| ASSET-BACKED SECURITIES (continued) | ||||||||
13-3, C | $ | 17,215 | $ | 17,261 | ||||
13-5, D | 20,100 | 20,336 | ||||||
14-3, C | 16,400 | 16,525 | ||||||
14-4, D | 6,650 | 6,715 | ||||||
Sierra Timeshare Receivables Funding LLC | ||||||||
10-3A, B 144A | 2,016 | 2,023 | ||||||
11-1A, B 144A | 1,887 | 1,897 | ||||||
12-2A, B 144A | 2,719 | 2,756 | ||||||
12-3A, A 144A | 9,847 | 9,880 | ||||||
13-1A, A 144A | 3,736 | 3,709 | ||||||
14-1A, A 144A | 3,914 | 3,937 | ||||||
14-2A, A 144A | 5,803 | 5,848 | ||||||
Silverleaf Finance LLC | ||||||||
XV 12-D, A 144A | 5,720 | 5,783 | ||||||
XVII 13-12, A1 144A | 4,879 | 4,897 | ||||||
XVIII 14-A, A 144A | 3,635 | 3,649 | ||||||
SLM Private Education Loan Trust | ||||||||
13-B, A2A 144A | 4,500 | 4,491 | ||||||
13-C, A2A 144A | 5,000 | 5,166 | ||||||
SNAAC Auto Receivables Trust 14-1A, C 144A | 11,085 | 11,118 | ||||||
SoFi Professional Loan Program LLC | ||||||||
14-A, A2 144A | 2,180 | 2,219 | ||||||
14-B, 2A 144A | 1,705 | 1,713 | ||||||
See Notes to Financial Statements
19
Table of Contents
VIRTUS MULTI-SECTOR SHORT TERM BOND FUND
SCHEDULE OF INVESTMENTS (Continued)
SEPTEMBER 30, 2015
($ reported in thousands)
| PAR VALUE | VALUE | |||||||
| ASSET-BACKED SECURITIES (continued) | ||||||||
15-A, A2 144A | $ | 6,625 | $ | 6,618 | ||||
SolarCity LMC | 8,287 | 8,166 | ||||||
Structured Asset Securities Corp. 01-SB1, A2 | 2,043 | 2,015 | ||||||
SVO VOI Mortgage Corp. | ||||||||
10-AA, A 144A | 3,150 | 3,184 | ||||||
12-AA, A 144A | 6,937 | 6,910 | ||||||
TAL Advantage V LLC | ||||||||
13-1A A 144A | 12,416 | 12,499 | ||||||
14-3A, A 144A | 11,990 | 12,154 | ||||||
TCF Auto Receivables Owner Trust | ||||||||
14-1A, B 144A | 1,733 | 1,757 | ||||||
14-1A, C 144A | 2,035 | 2,080 | ||||||
Textainer Marine Containers Ltd. | ||||||||
13-1A, A 144A | 16,000 | 16,000 | ||||||
14-1A, A 144A | 4,133 | 4,197 | ||||||
Tidewater Auto Receivables Trust | ||||||||
12-AA, B 144A | 3,387 | 3,390 | ||||||
14-AA, C 144A | 3,500 | 3,513 | ||||||
Trip Rail Master Funding LLC | ||||||||
11-1A, A1A 144A | 14,496 | 15,052 | ||||||
14-1A, A1 144A | 4,165 | 4,213 | ||||||
U-Haul S Fleet LLC 10-BT1A, 1 144A | 22,728 | 23,640 | ||||||
| PAR VALUE | VALUE | |||||||
| ASSET-BACKED SECURITIES (continued) | ||||||||
Volvo Financial Equipment LLC | ||||||||
13-1A, B 144A | $ | 15,835 | $ | 15,840 | ||||
14-1A, C 144A | 6,000 | 6,037 | ||||||
Welk Resorts LLC | ||||||||
13-A, A 144A | 4,420 | 4,462 | ||||||
15-AA, A 144A | 7,473 | 7,503 | ||||||
Wendy’s Funding LLC 15-1A, A2II 144A | 18,420 | 18,580 | ||||||
Westgate Resorts LLC 12-2A, A 144A | 345 | 346 | ||||||
Westlake Automobile Receivables Trust | ||||||||
14-1A, C 144A | 6,165 | 6,158 | ||||||
15-1A, C 144A | 8,500 | 8,523 | ||||||
| TOTAL ASSET-BACKED SECURITIES | ||||||||
| (Identified Cost $1,414,982) | 1,426,683 | |||||||
| CORPORATE BONDS AND NOTES—36.5% | ||||||||
| Consumer Discretionary—2.5% | ||||||||
Alibaba Group Holding Ltd. 144A | 6,600 | 6,477 | ||||||
Boyd Gaming Corp. | ||||||||
9.000%, 7/1/20 | 5,350 | 5,712 | ||||||
6.875%, 5/15/23 | 1,340 | 1,367 | ||||||
Brookfield Residential Properties, Inc. 144A | 5,810 | 5,767 | ||||||
Caesars Entertainment Operating Co., Inc. | 3,625 | 2,991 | ||||||
CCO Holdings LLC | 6,700 | 6,976 | ||||||
CCO Safari II LLC 144A | 2,605 | 2,605 | ||||||
See Notes to Financial Statements
20
Table of Contents
VIRTUS MULTI-SECTOR SHORT TERM BOND FUND
SCHEDULE OF INVESTMENTS (Continued)
SEPTEMBER 30, 2015
($ reported in thousands)
| PAR VALUE | VALUE | |||||||
| CORPORATE BONDS AND NOTES (continued) | ||||||||
| Consumer Discretionary (continued) | ||||||||
Clear Channel Worldwide Holdings, Inc. Series B | $ | 14,945 | $ | 15,038 | ||||
Columbus International, Inc. | 2,330 | 2,420 | ||||||
International Game Technology plc | ||||||||
7.500%, 6/15/19 | 1,115 | 1,176 | ||||||
144A | 3,245 | 3,164 | ||||||
144A | 8,185 | 7,653 | ||||||
Landry’s, Inc. 144A | 8,530 | 9,138 | ||||||
Marriott International, Inc. Series N, | 13,545 | 13,746 | ||||||
MGM Resorts International | 6,500 | 6,744 | ||||||
Nielsen Finance LLC (Nielsen Finance Co.) 144A | 19,395 | 18,837 | ||||||
Numericable Group SA 144A | 8,295 | 8,046 | ||||||
QVC, Inc. | 12,765 | 12,737 | ||||||
Scientific Games International, Inc. 144A | 12,535 | 12,441 | ||||||
Toll Brothers Finance Corp. | ||||||||
4.000%, 12/31/18 | 14,890 | 15,337 | ||||||
6.750%, 11/1/19 | 14,716 | 16,776 | ||||||
TRI Pointe Holdings, Inc. | 13,872 | 13,664 | ||||||
| PAR VALUE | VALUE | |||||||
| Consumer Discretionary (continued) | ||||||||
Wyndham Worldwide Corp. | $ | 2,960 | $ | 2,964 | ||||
|
| |||||||
| 191,776 | ||||||||
|
| |||||||
| Consumer Staples—0.2% | ||||||||
CVS Health Corp. | 11,400 | 11,596 | ||||||
Kraft Heinz Foods Co. | ||||||||
144A | 2,680 | 2,697 | ||||||
144A | 2,855 | 2,917 | ||||||
|
| |||||||
| 17,210 | ||||||||
|
| |||||||
| Energy—4.4% | ||||||||
Afren plc 144A | 4,790 | 120 | ||||||
Antero Resources Corp. 144A | 6,835 | 6,032 | ||||||
Blue Racer Midstream LLC (Blue Racer Finance Corp.) 144A | 4,595 | 4,388 | ||||||
CNOOC Finance Propriety Ltd. | 5,800 | 5,717 | ||||||
Denbury Resources, Inc. | 7,225 | 4,317 | ||||||
Energy Transfer Partners LP | 14,620 | 14,789 | ||||||
EP Energy LLC (Everest Acquisition Finance, Inc.) | 15,345 | 13,273 | ||||||
FTS International, Inc. | 2,245 | 707 | ||||||
Gazprom OAO (Gaz Capital SA) 144A | 5,000 | 5,075 | ||||||
IPIC GMTN Ltd. RegS | 10,000 | 10,300 | ||||||
Kinder Morgan, Inc. | ||||||||
3.050%, 12/1/19 | 4,805 | 4,718 | ||||||
See Notes to Financial Statements
21
Table of Contents
VIRTUS MULTI-SECTOR SHORT TERM BOND FUND
SCHEDULE OF INVESTMENTS (Continued)
SEPTEMBER 30, 2015
($ reported in thousands)
| PAR VALUE | VALUE | |||||||
| CORPORATE BONDS AND NOTES (continued) | ||||||||
| Energy (continued) | ||||||||
144A | $ | 15,495 | $ | 15,198 | ||||
Kunlun Energy Co., Ltd. 144A | 5,000 | 4,919 | ||||||
Linn Energy LLC | 9,980 | 2,794 | ||||||
Lukoil OAO International Finance BV 144A | 6,000 | 5,760 | ||||||
Markwest Energy Partners LP (Markwest Energy Finance Corp.) | 11,935 | 11,622 | ||||||
Midcontinent Express Pipeline LLC 144A | 7,500 | 7,350 | ||||||
Newfield Exploration Co. | ||||||||
5.750%, 1/30/22 | 1,640 | 1,591 | ||||||
5.625%, 7/1/24 | 7,925 | 7,529 | ||||||
NGL Energy Partners LP (NGL Energy Finance Corp.) | 18,475 | 16,905 | ||||||
Pacific Exploration and Production Corp. 144A | 13,565 | 5,189 | ||||||
Petrobras Global Finance BV | ||||||||
3.250%, 3/17/17 | 21,600 | 19,062 | ||||||
3.000%, 1/15/19 | 13,420 | 9,696 | ||||||
Petroleos de Venezuela SA | ||||||||
RegS | 41,325 | 27,791 | ||||||
144A | 12,980 | 4,210 | ||||||
Petroleos Mexicanos | 10,000 | 9,938 | ||||||
Petronas Capital Ltd. 144A | 5,000 | 4,883 | ||||||
PHI, Inc. | 6,275 | 5,428 | ||||||
| PAR VALUE | VALUE | |||||||
| Energy (continued) | ||||||||
Pride International, Inc. | $ | 4,065 | $ | 4,209 | ||||
QEP Resources, Inc. | 22,275 | 20,604 | ||||||
QGOG Constellation SA 144A | 7,925 | 3,527 | ||||||
Regency Energy Partners LP (Regency Energy Finance Corp.) | 12,815 | 13,756 | ||||||
Rosneft Finance SA RegS | 13,235 | 13,582 | ||||||
Sabine Oil & Gas Corp. | 9,035 | 1,310 | ||||||
Sabine Pass Liquefaction LLC | ||||||||
5.625%, 2/1/21 | 8,000 | 7,460 | ||||||
6.250%, 3/15/22 | 8,415 | 7,868 | ||||||
Sinopec Capital Ltd. 144A | 11,750 | 11,623 | ||||||
Sunoco LP (Sunoco Finance Corp.) 144A | 15,750 | 15,592 | ||||||
Transocean, Inc. | 13,020 | 9,700 | ||||||
Weatherford International Ltd. | 4,110 | 4,403 | ||||||
|
| |||||||
| 342,935 | ||||||||
|
| |||||||
| Financials—16.8% | ||||||||
ABN AMRO Bank N.V. 144A | 4,425 | 4,581 | ||||||
Aercap Ireland Capital Ltd. (Aercap Global Aviation Trust) | 5,930 | 5,841 | ||||||
Air Lease Corp. | 5,495 | 5,488 | ||||||
Akbank TAS 144A | 12,140 | TRY | 3,487 | |||||
See Notes to Financial Statements
22
Table of Contents
VIRTUS MULTI-SECTOR SHORT TERM BOND FUND
SCHEDULE OF INVESTMENTS (Continued)
SEPTEMBER 30, 2015
($ reported in thousands)
| PAR VALUE | VALUE | |||||||
| CORPORATE BONDS AND NOTES (continued) | ||||||||
| Financials (continued) | ||||||||
Allstate Corp. | $ | 4,730 | $ | 4,765 | ||||
Ally Financial, Inc. | 4,285 | 4,226 | ||||||
American Campus Communities Operating Partnership LP | 2,040 | 2,064 | ||||||
American Tower Trust I 144A | 6,900 | 6,846 | ||||||
Ares Capital Corp. | 5,715 | 5,891 | ||||||
Associated Banc Corp. | 8,635 | 8,767 | ||||||
Aviation Capital Group Corp. | ||||||||
144A | 10,380 | 10,497 | ||||||
144A | 4,415 | 4,411 | ||||||
Banco Continental SA (Continental Senior Trustees II Cayman Ltd.) 144A | 10,000 | 9,875 | ||||||
Banco de Credito del Peru 144A | 15,836 | 15,757 | ||||||
Banco Santander Brasil SA | ||||||||
144A | 28,335BRL | 6,790 | ||||||
144A | 9,300 | 9,300 | ||||||
Banco Santander Chile 144A | 5,300 | 5,340 | ||||||
Bangkok Bank PCL 144A | 16,550 | 16,729 | ||||||
Bank of America Corp. | ||||||||
(Countrywide Financial Corp.) | 9,110 | 9,369 | ||||||
2.000%, 1/11/18 | 14,905 | 14,961 | ||||||
5.490%, 3/15/19 | 2,868 | 3,151 | ||||||
| PAR VALUE | VALUE | |||||||
| Financials (continued) | ||||||||
Bank of Baroda 144A | $ | 23,575 | $ | 25,143 | ||||
Bank of Georgia JSC 144A | 10,110 | 10,506 | ||||||
Bank of India | ||||||||
144A | 22,470 | 22,874 | ||||||
144A | 10,200 | 10,400 | ||||||
Barclays Bank plc 144A | 13,130 | 14,199 | ||||||
BBVA Banco Continental SA 144A | 8,270 | 8,342 | ||||||
Blackstone Holdings Finance Co. LLC 144A | 7,105 | 8,273 | ||||||
Block Financial LLC | 11,380 | 11,390 | ||||||
Brixmor Operating Partnership LP | 5,570 | 5,621 | ||||||
Capital One NA | 5,000 | 4,968 | ||||||
China Cinda Finance Ltd. 144A | 12,775 | 12,899 | ||||||
Citigroup, Inc. | ||||||||
0.603%, 6/9/16(2) | 3,400 | 3,383 | ||||||
5.500%, 2/15/17 | 23,460 | 24,699 | ||||||
2.500%, 9/26/18 | 10,000 | 10,132 | ||||||
Comerica Bank, Inc. | 5,940 | 6,233 | ||||||
Corpbanca SA | ||||||||
3.125%, 1/15/18 | 8,000 | 7,982 | ||||||
144A | 4,000 | 4,037 | ||||||
Corrections Corp of America | 6,845 | 6,896 | ||||||
Daimler Finance North America LLC 144A | 11,000 | 11,113 | ||||||
Digital Delta Holdings LLC 144A | 11,735 | 11,780 | ||||||
See Notes to Financial Statements
23
Table of Contents
VIRTUS MULTI-SECTOR SHORT TERM BOND FUND
SCHEDULE OF INVESTMENTS (Continued)
SEPTEMBER 30, 2015
($ reported in thousands)
| PAR VALUE | VALUE | |||||||
| CORPORATE BONDS AND NOTES (continued) | ||||||||
| Financials (continued) | ||||||||
Digital Realty Trust LP | $ | 8,175 | $ | 8,167 | ||||
Discover Bank | 1,750 | 2,091 | ||||||
DNB Bank ASA 144A | 24,700 | 25,341 | ||||||
Drawbridge Special Opportunities Fund LP 144A | 14,685 | 14,355 | ||||||
Fidelity National Financial, Inc. | 6,475 | 6,922 | ||||||
Fifth Third Bancorp | 6,745 | 7,177 | ||||||
First Tennessee Bank N.A. | ||||||||
5.650%, 4/1/16 | 15,664 | 15,970 | ||||||
2.950%, 12/1/19 | 4,500 | 4,553 | ||||||
Ford Motor Credit Co. LLC | ||||||||
4.207%, 4/15/16 | 10,000 | 10,157 | ||||||
5.000%, 5/15/18 | 10,000 | 10,636 | ||||||
FS Investment Corp. | 7,725 | 7,860 | ||||||
General Motors Financial Co., Inc. | ||||||||
4.750%, 8/15/17 | 25,655 | 26,627 | ||||||
3.500%, 7/10/19 | 9,715 | 9,825 | ||||||
Genworth Holdings, Inc. | ||||||||
7.200%, 2/15/21 | 5,000 | 5,013 | ||||||
7.625%, 9/24/21 | 13,825 | 13,514 | ||||||
GLP Capital LP (GLP Financing II, Inc.) | 18,265 | 18,493 | ||||||
Goldman Sachs Group, Inc. (The) | ||||||||
5.625%, 1/15/17 | 14,000 | 14,703 | ||||||
2.900%, 7/19/18 | 8,200 | 8,409 | ||||||
7.500%, 2/15/19 | 2,451 | 2,865 | ||||||
Government Properties Income Trust | 2,905 | 2,979 | ||||||
| PAR VALUE | VALUE | |||||||
| Financials (continued) | ||||||||
Guanay Finance Ltd. 144A | $ | 26,900 | $ | 26,530 | ||||
HBOS plc 144A | 685 | 755 | ||||||
HCP, Inc. | 4,940 | 5,158 | ||||||
Health Care REIT, Inc. | 4,100 | 4,334 | ||||||
HSBC USA, Inc. | 19,485 | 19,829 | ||||||
Huntington Bancshares, Inc. | 17,065 | 20,146 | ||||||
Hutchison Whampoa International Ltd. | 13,210 | 13,737 | ||||||
Hyundai Capital Services, Inc. | ||||||||
144A | 500 | 506 | ||||||
144A | 8,000 | 7,996 | ||||||
144A | 2,940 | 2,950 | ||||||
ICAHN Enterprises LP (ICAHN Enterprises Finance Corp.) | ||||||||
3.500%, 3/15/17 | 965 | 968 | ||||||
4.875%, 3/15/19 | 1,520 | 1,522 | ||||||
ICICI Bank Ltd. RegS | 13,000 | 13,636 | ||||||
Industrial & Commercial Bank of China Ltd. | 6,275 | 6,394 | ||||||
ING Bank NV 144A | 9,000 | 9,022 | ||||||
International Lease Finance Corp. | 18,635 | 18,588 | ||||||
Intesa San Paolo S.p.A | 12,190 | 12,255 | ||||||
iStar Financial, Inc. | ||||||||
4.000%, 11/1/17 | 12,900 | 12,448 | ||||||
4.875%, 7/1/18 | 12,250 | 11,898 | ||||||
5.000%, 7/1/19 | 2,440 | 2,329 | ||||||
See Notes to Financial Statements
24
Table of Contents
VIRTUS MULTI-SECTOR SHORT TERM BOND FUND
SCHEDULE OF INVESTMENTS (Continued)
SEPTEMBER 30, 2015
($ reported in thousands)
| PAR VALUE | VALUE | |||||||
| CORPORATE BONDS AND NOTES (continued) | ||||||||
| Financials (continued) | ||||||||
Itau Unibanco Holding SA 144A | $ | 17,300 | $ | 16,262 | ||||
Jefferies Group LLC | ||||||||
5.125%, 4/13/18 | 6,541 | 6,867 | ||||||
6.875%, 4/15/21 | 3,725 | 4,187 | ||||||
JPMorgan Chase & Co. | ||||||||
Series Z, | 3,985 | 3,925 | ||||||
6.125%, 6/27/17 | 8,850 | 9,512 | ||||||
Korea Development Bank | 9,750 | 10,086 | ||||||
Lazard Group LLC | 7,765 | 8,226 | ||||||
Lincoln National Corp. | ||||||||
8.750%, 7/1/19 | 15,040 | 18,371 | ||||||
6.050%, 4/20/67(2)(7) | 2,885 | 2,423 | ||||||
Macquarie Group Ltd. | ||||||||
144A | 4,870 | 4,938 | ||||||
144A | 10,950 | 12,287 | ||||||
McGraw Hill Financial, Inc. 144A | 15,097 | 15,362 | ||||||
MDC-GMTN B.V. 144A | 4,000 | 4,062 | ||||||
Morgan Stanley | ||||||||
5.550%, 4/27/17 | 10,200 | 10,824 | ||||||
144A | 22,595BRL | 5,300 | ||||||
MPT Operating Partnership LP (MPT Finance Corp.) | 1,150 | 1,202 | ||||||
MUFG Union Bank NA | ||||||||
Series CD, | 2,000 | 2,008 | ||||||
2.625%, 9/26/18 | 2,700 | 2,746 | ||||||
New York Life Global Funding 144A | 2,855 | 2,842 | ||||||
ORIX Corp. | 5,228 | 5,283 | ||||||
| PAR VALUE | VALUE | |||||||
| Financials (continued) | ||||||||
Phosagro OAO (Phosagro Bond Funding Ltd.) 144A | $ | 14,800 | $ | 14,676 | ||||
PNC Funding Corp. | 3,130 | 3,296 | ||||||
Principal Life Global Funding II 144A | 17,580 | 17,858 | ||||||
Prudential Financial, Inc. | 11,200 | 12,855 | ||||||
QBE Insurance Group Ltd. 144A | 7,750 | 7,802 | ||||||
Regions Bank | 2,369 | 2,659 | ||||||
Royal Bank of Scotland Group plc (The) | 3,130 | 3,517 | ||||||
Russian Agricultural Bank OJSC (RSHB Capital SA) | ||||||||
144A | 13,655 | 13,563 | ||||||
144A | 8,750 | 8,531 | ||||||
Sabra Health Care LP | 9,610 | 10,042 | ||||||
Santander Holdings USA, Inc. | 7,540 | 7,404 | ||||||
Santander U.S. Debt S.A.U. Unipersonal 144A | 8,000 | 8,001 | ||||||
SBA Tower Trust 144A | 13,275 | 13,478 | ||||||
Select Income REIT | 18,910 | 18,639 | ||||||
Senior Housing Properties Trust | ||||||||
4.300%, 1/15/16 | 6,875 | 6,889 | ||||||
3.250%, 5/1/19 | 6,685 | 6,727 | ||||||
Shinhan Bank | ||||||||
144A | 11,700 | 12,235 | ||||||
See Notes to Financial Statements
25
Table of Contents
VIRTUS MULTI-SECTOR SHORT TERM BOND FUND
SCHEDULE OF INVESTMENTS (Continued)
SEPTEMBER 30, 2015
($ reported in thousands)
| PAR VALUE | VALUE | |||||||
| CORPORATE BONDS AND NOTES (continued) | ||||||||
| Financials (continued) | ||||||||
144A | $ | 1,000 | $ | 993 | ||||
Skandinaviska Enskilda Banken AB 144A | 6,775 | 6,770 | ||||||
Societe Generale S.A. 144A | 6,895 | 6,948 | ||||||
Springleaf Finance Corp. | 18,055 | 17,694 | ||||||
State Street Corp. | 24,025 | 25,626 | ||||||
SunTrust Bank, Inc. | ||||||||
6.000%, 9/11/17 | 4,925 | 5,325 | ||||||
5.450%, 12/1/17 | 3,750 | 4,056 | ||||||
Svenska Handelsbanken AB | 10,000 | 10,178 | ||||||
TIAA Asset Management Finance Co. LLC 144A | 2,850 | 2,890 | ||||||
Turkiye Garanti Bankasi AS 144A | 8,500 | 8,351 | ||||||
Turkiye Is Bankasi 144A | 12,630 | 12,178 | ||||||
Turkiye Vakiflar Bankasi Tao 144A | 4,000 | 3,854 | ||||||
Unum Group | 6,620 | 6,980 | ||||||
Ventas Realty LP (Ventas Capital Corp.) | ||||||||
4.000%, 4/30/19 | 7,100 | 7,470 | ||||||
2.700%, 4/1/20 | 2,948 | 2,935 | ||||||
Vnesheconombank (VEB Finance plc) 144A | 16,710 | 15,958 | ||||||
Voya Financial, Inc. | 12,620 | 12,887 | ||||||
| PAR VALUE | VALUE | |||||||
| Financials (continued) | ||||||||
VTB Bank OJSC (VTB Capital SA) 144A | $ | 6,785 | $ | 6,951 | ||||
Wachovia Corp. | 2,500 | 2,616 | ||||||
Wells Fargo & Co. | 5,000 | 5,189 | ||||||
West Europe Finance LLC 144A | 4,065 | 4,104 | ||||||
Willis Group | 6,000 | 6,074 | ||||||
North America, Inc. | 4,960 | 5,242 | ||||||
XLIT Ltd. Series E, | 9,730 | 9,821 | ||||||
Zions Bancorp | 8,120 | 8,337 | ||||||
|
| |||||||
| 1,299,976 | ||||||||
|
| |||||||
| Health Care—2.1% | ||||||||
AbbVie, Inc. | ||||||||
2.500%, 5/14/20 | 895 | 890 | ||||||
3.200%, 11/6/22 | 1,940 | 1,928 | ||||||
Actavis Funding SCS | ||||||||
3.000%, 3/12/20 | 2,825 | 2,828 | ||||||
3.450%, 3/15/22 | 3,815 | 3,763 | ||||||
Alere, Inc. | 6,175 | 6,298 | ||||||
Community Health Systems, Inc. | 4,790 | 4,886 | ||||||
Endo Finance LLC (Endo Finco, Inc.) 144A | 720 | 714 | ||||||
Forest Laboratories, Inc. 144A | 13,430 | 14,227 | ||||||
Fresenius US Finance II, Inc. 144A | 2,590 | 2,590 | ||||||
HCA, Inc. | ||||||||
3.750%, 3/15/19 | 9,580 | 9,551 | ||||||
6.500%, 2/15/20 | 19,575 | 21,337 | ||||||
Hologic, Inc. 144A | 1,575 | 1,595 | ||||||
See Notes to Financial Statements
26
Table of Contents
VIRTUS MULTI-SECTOR SHORT TERM BOND FUND
SCHEDULE OF INVESTMENTS (Continued)
SEPTEMBER 30, 2015
($ reported in thousands)
| PAR VALUE | VALUE | |||||||
| CORPORATE BONDS AND NOTES (continued) | ||||||||
| Health Care (continued) | ||||||||
inVentiv Health, Inc. 144A | $ | 8,625 | $ | 8,921 | ||||
Mallinckrodt International Finance S.A. 144A | 930 | 892 | ||||||
Owens & Minor, Inc. | 2,485 | 2,510 | ||||||
Quintiles Transnational Corp. 144A | 4,175 | 4,144 | ||||||
Tenet Healthcare Corp. | ||||||||
4.750%, 6/1/20 | 4,650 | 4,717 | ||||||
144A | 4,045 | 4,025 | ||||||
6.000%, 10/1/20 | 9,560 | 10,110 | ||||||
8.125%, 4/1/22 | 8,265 | 8,805 | ||||||
Valeant Pharmaceuticals International, Inc. | ||||||||
144A | 9,750 | 9,500 | ||||||
144A | 7,310 | 6,963 | ||||||
144A | 1,210 | 1,163 | ||||||
Zimmer Biomet Holdings, Inc. | ||||||||
2.700%, 4/1/20 | 12,805 | 12,853 | ||||||
3.150%, 4/1/22 | 12,805 | 12,680 | ||||||
Zoetis, Inc. | 1,975 | 1,969 | ||||||
|
| |||||||
| 159,859 | ||||||||
|
| |||||||
| Industrials—5.3% | ||||||||
ADT Corp. (The) | 23,265 | 24,108 | ||||||
Air Canada Pass-Through-Trust, 13-1, B 144A | 16,320 | 16,790 | ||||||
| PAR VALUE | VALUE | |||||||
| Industrials (continued) | ||||||||
America West Airlines Pass-Through-Trust | ||||||||
98-1, A | $ | 865 | $ | 894 | ||||
99-1, G | 7,627 | 8,199 | ||||||
01-1, G | 47,977 | 52,355 | ||||||
American Airlines Group, Inc. 144A | 1,655 | 1,618 | ||||||
American Airlines Pass-Through-Trust | ||||||||
13-2, B 144A | 8,993 | 9,173 | ||||||
14-1, B | 9,539 | 9,551 | ||||||
AWAS Aviation Capital Ltd. 144A | 6,439 | 6,463 | ||||||
Bombardier, Inc. 144A | 15,692 | 12,711 | ||||||
British Airways Pass-Through-Trust 13-1, B 144A | 11,538 | 12,028 | ||||||
Builders FirstSource, Inc. 144A | 8,670 | 9,060 | ||||||
Continental Airlines Pass-Through-Trust | ||||||||
99-1, A | 9,395 | 10,111 | ||||||
09-2, A | 3,532 | 3,965 | ||||||
99-2, C2 AMBC | 10,964 | 11,705 | ||||||
12-1, B | 3,887 | 4,052 | ||||||
00-1, A1 | 5,086 | 5,735 | ||||||
01-1, A1 | 13,833 | 14,490 | ||||||
07-1, B | 7,459 | 7,879 | ||||||
Delta Air Lines Pass-Through-Trust 12-1, A | 25,647 | 27,058 | ||||||
See Notes to Financial Statements
27
Table of Contents
VIRTUS MULTI-SECTOR SHORT TERM BOND FUND
SCHEDULE OF INVESTMENTS (Continued)
SEPTEMBER 30, 2015
($ reported in thousands)
| PAR VALUE | VALUE | |||||||
| CORPORATE BONDS AND NOTES (continued) | ||||||||
| Industrials (continued) | ||||||||
Hawaiian Airlines Pass-Through Certificates 13-1, B | $ | 3,716 | $ | 3,590 | ||||
Masco Corp. | 20,970 | 22,884 | ||||||
Northwest Airlines Pass-Through-Trust | ||||||||
07-1, B | 5,268 | 5,762 | ||||||
02-1, G2 | 12,242 | 12,739 | ||||||
Penske Truck Leasing Co. LP 144A | 8,365 | 8,178 | ||||||
Toledo Edison Co. (The) | 224 | 263 | ||||||
Transnet SOC Ltd. 144A | 9,000 | 9,056 | ||||||
U.S. Airways Pass-Through-Trust | ||||||||
12-2, C | 8,180 | 8,272 | ||||||
01-1, G | 15,014 | 16,327 | ||||||
UAL Pass-Through-Trust | ||||||||
09-2A | 16,496 | 17,941 | ||||||
07-01, A | 17,409 | 18,551 | ||||||
United Rentals North America, Inc. | 16,600 | 16,081 | ||||||
Virgin Australia Trust 13-1A 144A | 22,732 | 23,642 | ||||||
|
| |||||||
| 411,231 | ||||||||
|
| |||||||
| Information Technology—0.6% | ||||||||
Dun & Bradstreet Corp. (The) | ||||||||
3.250%, 12/1/17 | 12,110 | 12,296 | ||||||
4.000%, 6/15/20 | 4,660 | 4,759 | ||||||
| PAR VALUE | VALUE | |||||||
| Information Technology (continued) | ||||||||
First Data Corp. | $ | 11,439 | $ | 12,726 | ||||
Hewlett Packard Enterprise Co. | ||||||||
144A | 4,615 | 4,609 | ||||||
144A | 1,845 | 1,845 | ||||||
Juniper Networks, Inc. | 4,645 | 4,715 | ||||||
Oracle Corp. | 6,545 | 6,451 | ||||||
|
| |||||||
| 47,401 | ||||||||
|
| |||||||
| Materials—1.9% | ||||||||
Airgas, Inc. | 890 | 904 | ||||||
Allegheny Technologies, Inc. | 7,245 | 7,680 | ||||||
Anglo American Capital plc | ||||||||
144A | 1,950 | 2,062 | ||||||
144A | 5,205 | 4,542 | ||||||
Ardagh Packaging Finance plc 144A | 2,705 | 2,705 | ||||||
Cemex SAB de CV RegS | 9,800 | 9,702 | ||||||
CRH America, Inc. | 4,770 | 5,548 | ||||||
EuroChem Mineral & Chemical Co. OJSC 144A | 11,920 | 11,885 | ||||||
Freeport-McMoRan Copper & Gold, Inc. | 4,500 | 3,937 | ||||||
Gerdau Holdings, Inc. 144A | 8,330 | 7,820 | ||||||
Trade, Inc. 144A | 1,700 | 1,479 | ||||||
Hexion U.S. Finance Corp. | 12,240 | 10,465 | ||||||
See Notes to Financial Statements
28
Table of Contents
VIRTUS MULTI-SECTOR SHORT TERM BOND FUND
SCHEDULE OF INVESTMENTS (Continued)
SEPTEMBER 30, 2015
($ reported in thousands)
| PAR VALUE | VALUE | |||||||
| CORPORATE BONDS AND NOTES (continued) | ||||||||
| Materials (continued) | ||||||||
Huntsman International LLC | $ | 3,910 | $ | 3,417 | ||||
INEOS Group Holdings SA 144A | 5,870 | 5,481 | ||||||
Packaging Corp. of America | 7,215 | 7,376 | ||||||
Reynolds Group Issuer, Inc. | ||||||||
5.750%, 10/15/20 | 12,945 | 13,107 | ||||||
8.250%, 2/15/21 | 3,120 | 3,128 | ||||||
Severstal OAO (Steel Capital SA) 144A | 5,975 | 6,281 | ||||||
Sinopec Group Overseas Development Ltd. 144A | 10,000 | 10,140 | ||||||
Tronox Finance LLC | 9,405 | 6,019 | ||||||
Union Andina de Cementos SAA 144A | 1,690 | 1,631 | ||||||
Vedanta Resources plc | ||||||||
144A | 10,640 | 8,946 | ||||||
144A | 14,955 | 10,915 | ||||||
|
| |||||||
| 145,170 | ||||||||
|
| |||||||
| Telecommunication Services—1.6% | ||||||||
AT&T, Inc. | 11,000 | 12,242 | ||||||
CenturyLink, Inc. | 12,735 | 11,828 | ||||||
Crown Castle Towers LLC | ||||||||
144A | 5,915 | 6,081 | ||||||
144A | 3,000 | 2,925 | ||||||
| PAR VALUE | VALUE | |||||||
| Telecommunication Services (continued) | ||||||||
Digicel Group Ltd. 144A | $ | 15,680 | $ | 14,582 | ||||
Frontier Communications Corp. | ||||||||
7.125%, 3/15/19 | 12,200 | 12,011 | ||||||
144A | 3,380 | 3,321 | ||||||
144A | 3,650 | 3,559 | ||||||
Level 3 Financing, Inc. | 4,065 | 4,217 | ||||||
Sprint Corp. | 4,080 | 3,351 | ||||||
T-Mobile USA, Inc. | ||||||||
6.464%, 4/28/19 | 7,630 | 7,782 | ||||||
6.542%, 4/28/20 | 7,905 | 8,053 | ||||||
Telefonica Emisiones SAU | 2,805 | 2,869 | ||||||
Verizon Communications, Inc. | ||||||||
2.500%, 9/15/16 | 4,044 | 4,099 | ||||||
3.650%, 9/14/18 | 13,800 | 14,541 | ||||||
Windstream Corp. | 12,125 | 10,352 | ||||||
|
| |||||||
| 121,813 | ||||||||
|
| |||||||
| Utilities—1.1% | ||||||||
AmeriGas Partners LP | ||||||||
6.750%, 5/20/20 | 3,374 | 3,433 | ||||||
7.000%, 5/20/22 | 9,275 | 9,553 | ||||||
Exelon Corp. | 1,875 | 1,892 | ||||||
Israel Electric Corp. Ltd. 144A | 14,735 | 15,711 | ||||||
Korea Western Power Co., Ltd. 144A | 9,800 | 10,013 | ||||||
Majapahit Holding BV 144A | 8,800 | 9,812 | ||||||
PPL WEM Holdings plc 144A | 5,495 | 5,567 | ||||||
See Notes to Financial Statements
29
Table of Contents
VIRTUS MULTI-SECTOR SHORT TERM BOND FUND
SCHEDULE OF INVESTMENTS (Continued)
SEPTEMBER 30, 2015
($ reported in thousands)
| PAR VALUE | VALUE | |||||||
| CORPORATE BONDS AND NOTES (continued) | ||||||||
| Utilities (continued) | ||||||||
State Grid Overseas Investment Ltd. | ||||||||
144A | $ | 5,000 | $ | 4,973 | ||||
144A | 9,370 | 9,521 | ||||||
Talen Energy Supply LLC 144A | 12,340 | 11,291 | ||||||
|
| |||||||
| 81,766 | ||||||||
| TOTAL CORPORATE BONDS AND NOTES | ||||||||
| (Identified Cost $2,906,458) | 2,819,137 | |||||||
| LOAN AGREEMENTS(2)—15.2% | ||||||||
| Consumer Discretionary—4.4% | ||||||||
Allison Transmission Tranche B-3, | 2,097 | 2,100 | ||||||
Aristocrat Leisure Ltd. | 13,296 | 13,329 | ||||||
Boyd Gaming Corp. Tranche B, | 6,544 | 6,549 | ||||||
Caesars Entertainment Operating Co., Inc. | ||||||||
Tranche B-4, | 3,616 | 3,397 | ||||||
Tranche B-6, | 3,861 | 3,594 | ||||||
Tranche B-7, | 1,741 | 1,583 | ||||||
Caesars Entertainment Resort Properties LLC Tranche B, | 7,860 | 7,363 | ||||||
Caesars Growth Properties Holdings LLC Tranche B, First Lien, | 4,296 | 3,791 | ||||||
Cequel Communications LLC | 12,902 | 12,765 | ||||||
| PAR VALUE | VALUE | |||||||
| Consumer Discretionary (continued) | ||||||||
Charter Communications Operations LLC | ||||||||
Tranche E, | $ | 9,362 | $ | 9,267 | ||||
Tranche F, | 14,379 | 14,169 | ||||||
Tranche H, | 3,221 | 3,209 | ||||||
Tranche I, | 2,879 | 2,868 | ||||||
Cirque Du Soleil | 5,736 | 5,745 | ||||||
CityCenter Holdings LLC Tranche B, | 9,919 | 9,907 | ||||||
CSC Holdings, Inc. | ||||||||
Tranche B, | 5,273 | 5,242 | ||||||
0.000%, 9/23/22(8) | 16,748 | 16,677 | ||||||
Delta 2 (Lux) S.A.R.L. Tranche B-3, | 9,421 | 9,271 | ||||||
El Dorado Resorts, Inc. | 2,771 | 2,773 | ||||||
Hanesbrands, Inc. Tranche B, | 940 | 946 | ||||||
Hilton Worldwide Finance LLC | 13,077 | 13,065 | ||||||
iHeartCommunications, Inc. (Clear Channel Communications, Inc.) Tranche D, | 15,735 | 13,092 | ||||||
Intelsat Jackson Holdings S.A. Tranche B-2, | 12,912 | 12,586 | ||||||
Jarden | ||||||||
Tranche B-1, | 676 | 679 | ||||||
Tranche B-2 | 4,745 | 4,749 | ||||||
Key Safety Systems, Inc. | 6,563 | 6,428 | ||||||
See Notes to Financial Statements
30
Table of Contents
VIRTUS MULTI-SECTOR SHORT TERM BOND FUND
SCHEDULE OF INVESTMENTS (Continued)
SEPTEMBER 30, 2015
($ reported in thousands)
| PAR VALUE | VALUE | |||||||
| LOAN AGREEMENTS (continued) | ||||||||
| Consumer Discretionary (continued) | ||||||||
Las Vegas Sands LLC Tranche B, | $ | 12,592 | $ | 12,494 | ||||
Libbey Glass, Inc. | 5,887 | 5,880 | ||||||
Life Time Fitness, Inc. | 10,103 | 10,077 | ||||||
MGM Resort International Tranche B | 7,062 | 7,020 | ||||||
Mohegan Tribal Gaming Authority Tranche B, | 3,341 | 3,332 | ||||||
PetSmart, Inc. Tranche B-1 | 17,640 | 17,629 | ||||||
PVH Corp. Tranche B | 10,513 | 10,572 | ||||||
Scientific Games International, Inc. | ||||||||
6.000%, 10/18/20 | 2,792 | 2,761 | ||||||
Tranche B-2, | 3,400 | 3,363 | ||||||
Seminole Tribe of Florida, Inc. | 13,158 | 13,139 | ||||||
ServiceMaster Co. LLC (The) | 8,419 | 8,424 | ||||||
Sinclair Television Group, Inc. Tranche B-1, | 11,631 | 11,551 | ||||||
Six Flags Theme Parks, Inc. Tranche B, | 5,790 | 5,800 | ||||||
SRAM LLC First Lien, | 1,841 | 1,745 | ||||||
Staples, Inc. First Lien, | 10,659 | 10,620 | ||||||
Station Casinos LLC Tranche B, | 11,390 | 11,385 | ||||||
| PAR VALUE | VALUE | |||||||
| Consumer Discretionary (continued) | ||||||||
TI Group Auto Systems LLC | $ | 1,033 | $ | 1,022 | ||||
Tribune Media Co. Tranche B, | 8,988 | 8,924 | ||||||
TWCC Holding Corp. Second Lien, | 10,125 | 9,473 | ||||||
|
| |||||||
| 340,355 | ||||||||
|
| |||||||
| Consumer Staples—1.6% | ||||||||
Albertson’s LLC Tranche B-4, | 16,079 | 16,103 | ||||||
ARAMARK Corp. | ||||||||
Tranche E, | 16,976 | 16,964 | ||||||
Tranche F, | 14,632 | 14,606 | ||||||
Charger OpCo B.V. (Oak Tea, Inc.) Tranche B-1, | 3,785 | 3,791 | ||||||
Hostess Brands LLC Tranche B, First Lien, | 13,733 | 13,770 | ||||||
Kronos Acquisition Intermediate, Inc. (KIK Custom Products, Inc.) | ||||||||
First Lien, | 22,237 | 22,188 | ||||||
Second Lien, | 17,280 | 17,648 | ||||||
Prestige Brands, Inc. Tranche B-3, | 1,406 | 1,408 | ||||||
Rite Aid Corp. | ||||||||
Tranche 1 | 720 | 729 | ||||||
Tranche 2, Second Lien, | 14,688 | 14,725 | ||||||
Spectrum Brands, Inc. | 2,229 | 2,239 | ||||||
|
| |||||||
| 124,171 | ||||||||
|
| |||||||
See Notes to Financial Statements
31
Table of Contents
VIRTUS MULTI-SECTOR SHORT TERM BOND FUND
SCHEDULE OF INVESTMENTS (Continued)
SEPTEMBER 30, 2015
($ reported in thousands)
| PAR VALUE | VALUE | |||||||
| LOAN AGREEMENTS (continued) | ||||||||
| Energy—0.4% | ||||||||
Arch Coal, Inc. | $ | 16,295 | $ | 9,306 | ||||
Drillships Ocean Ventures, Inc. | 6,164 | 4,145 | ||||||
EP Energy LLC (Everest Acquisition LLC) | ||||||||
Tranche B-3, | 4,100 | 3,828 | ||||||
Tranche B-2, | 768 | 743 | ||||||
FTS International, Inc. | 1,520 | 475 | ||||||
Paragon Offshore Finance Co. | 9,958 | 4,058 | ||||||
Seadrill Operating LP | 21,586 | 13,239 | ||||||
|
| |||||||
| 35,794 | ||||||||
|
| |||||||
| Financials—1.3% | ||||||||
Asurion LLC | ||||||||
Tranche B-1, | 4,884 | 4,672 | ||||||
Tranche B-4, | 6,336 | 6,006 | ||||||
Capital Automotive LP | ||||||||
Tranche B-1, | 3,549 | 3,552 | ||||||
Second Lien, | 6,047 | 6,102 | ||||||
Clipper Acquisitions Corp. Tranche B, | 6,204 | 6,111 | ||||||
Delos Finance S.A.R.L. 3.500%, 3/6/21 | 21,956 | 21,935 | ||||||
iStar Financial, Inc. Tranche A-2, | 2,892 | 2,965 | ||||||
Realogy Corp. Tranche B, | 17,603 | 17,584 | ||||||
TransUnion LLC Tranche B-2, | 20,059 | 19,889 | ||||||
| PAR VALUE | VALUE | |||||||
| Financials (continued) | ||||||||
Walter Investment Management Corp. Tranche B, | $ | 11,771 | $ | 10,937 | ||||
|
| |||||||
| 99,753 | ||||||||
|
| |||||||
| Health Care—1.6% | ||||||||
Alere, Inc. Tranche B, | 5,197 | 5,204 | ||||||
American Renal Holdings, Inc. Tranche B, First Lien, | 9,041 | 8,992 | ||||||
AmSurg Corp. | 2,565 | 2,570 | ||||||
CHG Healthcare Services, Inc. First Lien, | 9,926 | 9,918 | ||||||
Community Health Systems, Inc. (CHS) Incremental 2018, Tranche F, | 8,963 | 8,966 | ||||||
Concentra, Inc. First Lien, Tranche B | 455 | 455 | ||||||
Convatec, Inc. | 327 | 327 | ||||||
DaVita HealthCare Partners, Inc. Tranche B, | 3,878 | 3,878 | ||||||
Emdeon, Inc. Tranche B-2, | 5,276 | 5,257 | ||||||
Endo Luxembourg Finance Co. I S.A.R.L. | ||||||||
Tranche B, | 5,571 | 5,563 | ||||||
Envision Healthcare Corp. (F/K/A Emergency Medical Services Corp.) | 6,610 | 6,617 | ||||||
Hill-Rom Tranche B, | 739 | 741 | ||||||
See Notes to Financial Statements
32
Table of Contents
VIRTUS MULTI-SECTOR SHORT TERM BOND FUND
SCHEDULE OF INVESTMENTS (Continued)
SEPTEMBER 30, 2015
($ reported in thousands)
| PAR VALUE | VALUE | |||||||
| LOAN AGREEMENTS (continued) | ||||||||
| Health Care (continued) | ||||||||
Iasis Healthcare LLC Tranche B-2, | $ | 5,702 | $ | 5,713 | ||||
InVentiv Health, Inc. Tranche B-4, | 8,750 | 8,777 | ||||||
Kinetic Concepts, Inc. | ||||||||
Tranche E-2, | 6,602 | 6,605 | ||||||
Tranche E-1, | 1,557 | 1,555 | ||||||
Mallinckrodt International Finance S.A. Tranche B-1, | 1,638 | 1,621 | ||||||
NVA Holdings, Inc. First Lien, | 2,831 | 2,834 | ||||||
Quintiles Transnational Corp. Tranche B, | 2,471 | 2,476 | ||||||
RPI Finance Trust | ||||||||
Tranche B-3, | 10,601 | 10,628 | ||||||
Tranche B-4, | 5,922 | 5,912 | ||||||
Surgery Center Holdings, Inc. First Lien, | 1,419 | 1,421 | ||||||
U.S. Renal Care, Inc. Tranche B-2, First Lien, | 4,558 | 4,556 | ||||||
Valeant Pharmaceuticals International, Inc. | 12,168 | 11,998 | ||||||
|
| |||||||
| 122,584 | ||||||||
|
| |||||||
| Industrials—2.0% | ||||||||
American Airlines, Inc. | ||||||||
3.250%, 6/27/20 | 35,214 | 34,919 | ||||||
3.500%, 10/10/21 | 10,996 | 10,976 | ||||||
| PAR VALUE | VALUE | |||||||
| Industrials (continued) | ||||||||
AWAS Finance Luxembourg SA | $ | 7,387 | $ | 7,371 | ||||
Brock Holdings III, Inc. First Lien, | 9,774 | 9,493 | ||||||
Ceridian HCM Holding, Inc. | 18,510 | 17,596 | ||||||
DigitalGlobe, Inc. | 3,572 | 3,562 | ||||||
DynCorp International, Inc. | 9,906 | 9,699 | ||||||
Husky Injection Molding Systems Ltd. | 5,232 | 5,170 | ||||||
McJunkin Red Man Corp. | 598 | 585 | ||||||
Nortek, Inc. Incremental-1, | 9,634 | 9,580 | ||||||
U.S. Airways, Inc. Tranche B-1, | 24,868 | 24,814 | ||||||
United Airlines, Inc. (Continental Airlines, Inc.) Tranche B-1, | 12,154 | 12,139 | ||||||
Waste Industries USA, Inc. | 9,899 | 9,955 | ||||||
|
| |||||||
| 155,859 | ||||||||
|
| |||||||
| Information Technology—2.2% | ||||||||
Activision Blizzard, Inc. | 9,842 | 9,861 | ||||||
Applied Systems, Inc. Second Lien, | 2,727 | 2,710 | ||||||
Avago Technologies Cayman Ltd. | 17,285 | 17,295 | ||||||
Blue Coat Systems, Inc. | 5,418 | 5,381 | ||||||
See Notes to Financial Statements
33
Table of Contents
VIRTUS MULTI-SECTOR SHORT TERM BOND FUND
SCHEDULE OF INVESTMENTS (Continued)
SEPTEMBER 30, 2015
($ reported in thousands)
| PAR VALUE | VALUE | |||||||
| LOAN AGREEMENTS (continued) | ||||||||
| Information Technology (continued) | ||||||||
CCC Information Services | $ | 5,782 | $ | 5,763 | ||||
Deltek, Inc. | ||||||||
First Lien | 519 | 520 | ||||||
Second Lien | 3,678 | 3,690 | ||||||
Epicor Software Corp. Tranche B, | 4,988 | 4,963 | ||||||
Evergreen Skills Lux S.A.R.L. First Lien, | 3,885 | 3,513 | ||||||
Excelitas Technologies Corp. Tranche B, | 5,297 | 5,144 | ||||||
First Data Corp. | ||||||||
2018 Term Loan | 44,210 | 43,913 | ||||||
2022 Term Loan | 2,520 | 2,513 | ||||||
Infinity Acquisition Ltd. | 12,158 | 12,044 | ||||||
Interactive Data Corp. | 8,039 | 8,024 | ||||||
Mitchell International, Inc. | ||||||||
4.500%, 10/13/20 | 5,032 | 5,021 | ||||||
Second Lien, | 19,067 | 19,051 | ||||||
Presidio, Inc. Refinancing Term | 8,526 | 8,524 | ||||||
Riverbed Technologies, Inc. | 5,807 | 5,824 | ||||||
SS&C Technologies, Inc. | ||||||||
Tranche A-1, | 894 | 893 | ||||||
Tranche A-2, | 1,386 | 1,385 | ||||||
Tranche B-1, | 5,874 | 5,893 | ||||||
| PAR VALUE | VALUE | |||||||
| Information Technology (continued) | ||||||||
Tranche B-2, | $ | 929 | $ | 932 | ||||
|
| |||||||
| 172,857 | ||||||||
|
| |||||||
| Materials—0.6% | ||||||||
AZ Chem US, Inc. First Lien, | 2,571 | 2,571 | ||||||
Berry Plastics Groups, Inc. | 8,743 | 8,738 | ||||||
CPI Acquisition, Inc. First Lien, | 12,000 | 11,933 | ||||||
Fairmount Minerals Ltd. Tranche B-2, | 3,821 | 3,009 | ||||||
Fortescue Metals Group (FMG) Resources Property Ltd. | 13,237 | 10,859 | ||||||
INEOS U.S. Finance LLC 2022 Dollar | 5,740 | 5,588 | ||||||
Owens-Illinois Tranche B, | 1,995 | 2,005 | ||||||
|
| |||||||
| 44,703 | ||||||||
|
| |||||||
| Telecommunication Services—0.3% | ||||||||
Global Tel*Link Corp. First Lien, | 9,038 | 8,882 | ||||||
Level 3 Financing, Inc. | ||||||||
Tranche B-III, | 6,319 | 6,327 | ||||||
Tranche B-II, | 5,842 | 5,805 | ||||||
|
| |||||||
| 21,014 | ||||||||
|
| |||||||
| Utilities—0.8% | ||||||||
Atlantic Power LP | 2,502 | 2,493 | ||||||
Calpine Construction Finance Co. LP Tranche B-1, | 8,342 | 8,155 | ||||||
See Notes to Financial Statements
34
Table of Contents
VIRTUS MULTI-SECTOR SHORT TERM BOND FUND
SCHEDULE OF INVESTMENTS (Continued)
SEPTEMBER 30, 2015
($ reported in thousands)
| PAR VALUE | VALUE | |||||||
| LOAN AGREEMENTS (continued) | ||||||||
| Utilities (continued) | ||||||||
Granite Acquisition, Inc. | ||||||||
Tranche B, First Lien, | $ | 10,646 | $ | 10,451 | ||||
Tranche C, First Lien, | 472 | 463 | ||||||
NRG Energy, Inc. | 23,666 | 23,213 | ||||||
State of Santa Catarina (The) | 13,931 | 12,245 | ||||||
Texas Competitive Electric Holdings Co. LLC 2017 Extended, | 5,925 | 2,283 | ||||||
|
| |||||||
| 59,303 | ||||||||
| TOTAL LOAN AGREEMENTS (Identified Cost $1,217,930) | 1,176,393 | |||||||
| SHARES | ||||||||
| PREFERRED STOCKS—0.8% | ||||||||
| Energy—0.1% | ||||||||
PTT Exploration & Production PCL | 8,645 | (9) | 8,332 | |||||
|
| |||||||
| Financials—0.7% | ||||||||
Ally Financial, Inc. Series G, | 351 | 352 | ||||||
Banco Bilbao Vizcaya Argentaria S.A. International S.A. Unipersonal | 2,295 | (9) | 2,324 | |||||
Bank of New York Mellon Corp. (The) Series E, 4.950% | 16,070 | (9) | 15,829 | |||||
JPMorgan Chase & Co. Series V, 5.000% | 4,395 | (9) | 4,274 | |||||
| SHARES | VALUE | |||||||
| Financials (continued) | ||||||||
Wells Fargo & Co. Series K, 7.980% | 16,155 | (9) | $ | 17,064 | ||||
XLIT Group plc 6.50%(2) | 12,790 | (9) | 10,155 | |||||
|
| |||||||
| 49,998 | ||||||||
| TOTAL PREFERRED STOCKS (Identified Cost $61,462) | 58,330 | |||||||
| EXCHANGE-TRADED FUNDS—0.3% | ||||||||
SPDR S&P 500® ETF Trust(13) | 114,000 | 21,846 | ||||||
| TOTAL EXCHANGE-TRADED FUNDS | ||||||||
| (Identified Cost $21,590) | 21,846 | |||||||
| AFFILIATED MUTUAL FUNDS—0.9% | ||||||||
Virtus Credit Opportunities Fund(13) | 6,934,641 | 67,751 | ||||||
| TOTAL AFFILIATED MUTUAL FUNDS | ||||||||
| (Identified Cost $69,338) | 67,751 | |||||||
| TOTAL LONG TERM INVESTMENTS—99.7% | ||||||||
| (Identified Cost $7,812,024) | 7,690,914 | (12) | ||||||
| SHORT-TERM INVESTMENTS—0.7% | ||||||||
| Money Market Mutual Fund—0.7% | ||||||||
Fidelity Money Market Portfolio – Institutional Shares (seven-day effective yield 0.170%) | 57,560,109 | 57,560 | ||||||
| TOTAL SHORT-TERM INVESTMENTS | ||||||||
| (Identified Cost $57,560) | 57,560 | |||||||
| TOTAL INVESTMENTS—100.4% (Identified Cost $7,869,584) | 7,748,474 | (1) | ||||||
Other assets and liabilities, net—(0.4)% |
| (33,102 | ) | |||||
|
| |||||||
| NET ASSETS—100.0% | $ | 7,715,372 | ||||||
|
| |||||||
See Notes to Financial Statements
35
Table of Contents
VIRTUS MULTI-SECTOR SHORT TERM BOND FUND
SCHEDULE OF INVESTMENTS (Continued)
SEPTEMBER 30, 2015
($ reported in thousands)
Abbreviations:
| ETF | Exchange-Traded Fund |
| FDIC | Federal Deposit Insurance Corporation |
| FHLMC | Federal Home Loan Mortgage Corporation (“Freddie Mac”). |
| FNMA | Federal National Mortgage Association (“Fannie Mae”). |
| GNMA | Government National Mortgage Association (“Ginnie Mae”) |
| REIT | Real Estate Investment Trust |
| SPDR | S&P Depositary Receipt |
FOOTNOTE LEGEND:
| (1) | Federal Income Tax Information: For tax information at September 30, 2015, see Note 10 Federal Income Tax Information in the Notes to Financial Statements. |
| (2) | Variable or step coupon security; interest rate shown reflects the rate in effect at September 30, 2015. |
| (3) | Security exempt from registration under Rule 144A of the Securities Act of 1933. These securities may be resold in transactions exempt from registration, normally to qualified institutional buyers. At September 30, 2015, these securities amounted to a value of $2,759,860 or 35.8% of net assets. |
| (4) | Regulation S security. Security is offered and sold outside of the United States, therefore, it is exempt from registration with the SEC under rules 903 and 904 of the Securities Act of 1933. |
| (5) | This Note was issued for the sole purpose of funding a loan agreement between the issuer and the borrower. As the credit risk for this security lies solely with the borrower, the name represented here is that of the borrower. |
| (6) | No contractual maturity date. |
| (7) | Interest payments may be deferred. |
| (8) | This loan will settle after September 30, 2015, at which time the interest rate, based on the London Interbank Offered Rate (“LIBOR”) and the agreed upon spread on trade date, will be reflected. |
| (9) | Value shown as par value. |
| (10) | Security in default. |
| (11) | Security in default, interest payments are being received during the bankruptcy proceedings. |
| (12) | All or a portion of the Fund’s assets have been segregated for delayed delivery security. |
| (13) | This fund is a public fund and the prospectus and annual report are publicly available. |
Foreign Currencies:
| BRL | Brazilian Real |
| CLP | Chilean Peso |
| COP | Colombian Peso |
| RUB | Russian Ruble |
| TRY | Turkish Lira |
| ZAR | South African Rand |
| Country Weightings (Unaudited)† | ||||
United States | 83 | % | ||
Australia | 1 | |||
Canada | 1 | |||
Chile | 1 | |||
India | 1 | |||
Luxembourg | 1 | |||
United Kingdom | 1 | |||
Other | 11 | |||
Total | 100 | % | ||
| † | % of total investments as of September 30, 2015 |
See Notes to Financial Statements
36
Table of Contents
VIRTUS MULTI-SECTOR SHORT TERM BOND FUND
SCHEDULE OF INVESTMENTS (Continued)
SEPTEMBER 30, 2015
($ reported in thousands)
The following table provides a summary of inputs used to value the Fund’s investments as of September 30, 2015 (See Security Valuation Note 2A in the Notes to Financial Statements):
| Total Value at September 30, 2015 | Level 1 Quoted Prices | Level 2 Significant Observable Inputs | Level 3 Significant Unobservable Inputs | |||||||||||||
Debt Securities: | ||||||||||||||||
Asset-Backed Securities | $ | 1,426,683 | $ | — | $ | 1,414,387 | $ | 12,296 | ||||||||
Corporate Bonds and Notes | 2,819,137 | — | 2,819,137 | — | ||||||||||||
Foreign Government Securities | 155,045 | — | 155,045 | — | ||||||||||||
Loan Agreements | 1,176,393 | — | 1,164,148 | 12,245 | ||||||||||||
Mortgage-Backed Securities | 1,895,938 | — | 1,895,938 | — | ||||||||||||
Municipal Bonds | 3,555 | — | 3,555 | — | ||||||||||||
U.S. Government Securities | 66,236 | — | 66,236 | — | ||||||||||||
Equity Securities: | ||||||||||||||||
Affiliated Mutual Fund | 67,751 | 67,751 | — | — | ||||||||||||
Exchange-traded Fund | 21,846 | 21,846 | — | — | ||||||||||||
Preferred Stocks | 58,330 | — | 58,330 | — | ||||||||||||
Short-Term Investments | 57,560 | 57,560 | — | — | ||||||||||||
|
|
|
|
|
|
|
| |||||||||
Total Investments | $ | 7,748,474 | $ | 147,157 | $ | 7,576,776 | $ | 24,541 | ||||||||
|
|
|
|
|
|
|
| |||||||||
There were no transfers between Level 1 and Level 2 related to securities held at September 30, 2015.
The following is a reconciliation of assets of the Fund for Level 3 investments for which significant unobservable inputs were used to determine fair value.
| Total | Asset- Backed Securities | Loan Agreements | ||||||||||
Investments in Securities | ||||||||||||
Balance as of September 30, 2014: | $ | 14,320 | $ | — | $ | 14,320 | ||||||
Accrued discount/(premium) | (127 | ) | 4 | (131 | ) | |||||||
Realized gain (loss) | (59 | ) | — | (59 | ) | |||||||
Change in unrealized appreciation/(depreciation)(c) | (1,040 | ) | (15 | ) | (1,025 | ) | ||||||
Purchases | 12,558 | 12,558 | — | |||||||||
Sales(b) | (1,111 | ) | (251 | ) | (860 | ) | ||||||
Transfers into Level 3(a) | — | — | — | |||||||||
Transfers from Level 3(a) | — | — | — | |||||||||
|
|
|
|
|
| |||||||
Balance as of September 30, 2015 | $ | 24,541 | $ | 12,296 | $ | 12,245 | ||||||
|
|
|
|
|
| |||||||
| (a) | “Transfers into and/or from” represent the ending value as of September 30, 2015, for any investment security where a change in the pricing level occurred from the beginning to the end of the period. |
| (b) | Includes paydowns on securities. |
| (c) | Included in the related net change in unrealized appreciation/(depreciation) in the Statement of Operations. The change in unrealized appreciation/(depreciation) on investments still held as of September 30, 2015 was $(1,025). |
None of the securities in the table are internally fair valued at September 30, 2015.
See Notes to Financial Statements
37
Table of Contents
VIRTUS MULTI-SECTOR SHORT TERM BOND FUND
STATEMENT OF ASSETS AND LIABILITIES
SEPTEMBER 30, 2015
(Reported in thousands except shares and per share amounts)
| Assets | ||||
Investment in unaffiliated securities at value(1) | $ | 7,680,723 | ||
Investments in affiliated fund at value(2) | 67,751 | |||
Foreign currency at value(3) | 2 | |||
Cash | 10,206 | |||
| Receivables | ||||
Investment securities sold | 11,863 | |||
Fund shares sold | 15,028 | |||
Dividends and interest receivable | 56,795 | |||
Tax reclaims | 19 | |||
Prepaid expenses | 222 | |||
Prepaid trustee retainer | 60 | |||
|
| |||
Total assets | 7,842,669 | |||
|
| |||
| Liabilities | ||||
| Payables | ||||
Fund shares repurchased | 36,376 | |||
Investment securities purchased | 81,366 | |||
Dividend distributions | 2,318 | |||
Investment advisory fees | 2,987 | |||
Distribution and service fees | 1,421 | |||
Administration fees | 822 | |||
Transfer agent fees and expenses | 1,589 | |||
Professional fees | 43 | |||
Trustees’ fees and expenses | 14 | |||
Other accrued expenses | 361 | |||
|
| |||
Total liabilities | 127,297 | |||
|
| |||
| Net Assets | $ | 7,715,372 | ||
|
| |||
| Net Assets Consist of: | ||||
Capital paid in on shares of beneficial interest | $ | 7,903,054 | ||
Accumulated undistributed net investment income (loss) | (3,391 | ) | ||
Accumulated undistributed net realized gain (loss) | (62,973 | ) | ||
Net unrealized appreciation (depreciation) on investments | (121,318 | ) | ||
|
| |||
| Net Assets | $ | 7,715,372 | ||
|
| |||
| Class A | ||||
Net asset value (net assets/shares outstanding) per share | $ | 4.69 | ||
Maximum offering price per share NAV/(1–2.25%) | $ | 4.80 | ||
Shares of beneficial interest outstanding, no par value, unlimited authorization | 335,979,268 | |||
Net Assets | $ | 1,575,629 | ||
| Class B | ||||
Net asset value (net assets/shares outstanding) and offering price per share | $ | 4.66 | ||
Shares of beneficial interest outstanding, no par value, unlimited authorization | 82,039 | |||
Net Assets | $ | 382 | ||
| Class C | ||||
Net asset value (net assets/shares outstanding) and offering price per share | $ | 4.75 | ||
Shares of beneficial interest outstanding, no par value, unlimited authorization | 307,541,074 | |||
Net Assets | $ | 1,460,120 | ||
| Class T | ||||
Net asset value (net assets/shares outstanding) and offering price per share | $ | 4.73 | ||
Shares of beneficial interest outstanding, no par value, unlimited authorization | 123,290,045 | |||
Net Assets | $ | 583,694 | ||
| Class I | ||||
Net asset value (net assets/shares outstanding) and offering price per share | $ | 4.69 | ||
Shares of beneficial interest outstanding, no par value, unlimited authorization | 872,349,502 | |||
Net Assets | $ | 4,095,547 | ||
(1) Investment in unaffiliated securities at cost. | $ | 7,800,246 | ||
(2) Investment in affiliated fund at cost | $ | 69,338 | ||
(3) Foreign currency at cost. | $ | — | (4) | |
(4) Amount is less than $500. | ||||
See Notes to Financial Statements
38
Table of Contents
VIRTUS MULTI-SECTOR SHORT TERM BOND FUND
YEAR ENDED SEPTEMBER 30, 2015
($ reported in thousands)
| Investment Income | ||||
Dividends | $ | 568 | ||
Interest | 348,803 | |||
Dividends from affiliated fund | 338 | |||
Foreign taxes withheld | (389 | ) | ||
|
| |||
Total investment income | 349,320 | |||
|
| |||
| Expenses | ||||
Investment advisory fees | 39,612 | |||
Service fees, Class A | 4,377 | |||
Distribution and service fees, Class B | 7 | |||
Distribution and service fees, Class C | 8,017 | |||
Distribution and service fees, Class T | 6,534 | |||
Administration fees | 10,344 | |||
Transfer agent fees and expenses | 9,136 | |||
Registration fees | 419 | |||
Printing fees and expenses | 453 | |||
Trustees’ fees and expenses | 363 | |||
Custodian fees | 234 | |||
Professional fees | 84 | |||
Miscellaneous expenses | 653 | |||
|
| |||
Total expenses | 80,233 | |||
Less expenses reimbursed and/or waived by investment adviser | (96 | ) | ||
|
| |||
Net expenses | 80,137 | |||
|
| |||
| Net investment income (loss) | 269,183 | |||
|
| |||
| Net Realized and Unrealized Gain (Loss) on Investments | ||||
Net realized gain (loss) on unaffiliated investments | (126,120 | ) | ||
Net realized gain (loss) on foreign currency transactions | (1,794 | ) | ||
Net change in unrealized appreciation (depreciation) on investments | (149,459 | ) | ||
Net change in unrealized appreciation (depreciation) on affiliated funds | (1,587 | ) | ||
Net change in unrealized appreciation (depreciation) on foreign currency translation | 287 | |||
|
| |||
| Net gain (loss) on investments | (278,673 | ) | ||
|
| |||
| Net increase (decrease) in net assets resulting from operations | $ | (9,490 | ) | |
|
|
See Notes to Financial Statements
39
Table of Contents
VIRTUS MULTI-SECTOR SHORT TERM BOND FUND
STATEMENTS OF CHANGES IN NET ASSETS
(Reported in thousands)
| Year Ended September 30, 2015 | Year Ended September 30, 2014 | |||||||
| INCREASE/(DECREASE) IN NET ASSETS | ||||||||
| From Operations | ||||||||
Net investment income (loss) | $ | 269,183 | $ | 281,430 | ||||
Net realized gain (loss) | (127,914 | ) | 2,448 | |||||
Net change in unrealized appreciation (depreciation) | (150,759 | ) | (38,011 | ) | ||||
|
|
|
| |||||
| Increase (decrease) in net assets resulting from operations | (9,490 | ) | 245,867 | |||||
|
|
|
| |||||
| From Distributions to Shareholders | ||||||||
Net investment income, Class A | (42,497 | ) | (105,722 | ) | ||||
Net investment income, Class B | (18 | ) | (56 | ) | ||||
Net investment income, Class C | (34,290 | ) | (46,403 | ) | ||||
Net investment income, Class T | (10,794 | ) | (17,738 | ) | ||||
Net investment income, Class I | (119,152 | ) | (100,400 | ) | ||||
Net realized long-term gains, Class A | — | (630 | ) | |||||
Net realized long-term gains, Class B | — | (— | )(1) | |||||
Net realized long-term gains, Class C | — | (306 | ) | |||||
Net realized long-term gains, Class T | — | (140 | ) | |||||
Net realized long-term gains, Class I | — | (562 | ) | |||||
Return of capital Class A | (8,732 | ) | — | |||||
Return of capital Class B | (4 | ) | — | |||||
Return of capital Class C | (7,997 | ) | — | |||||
Return of capital Class T | (3,261 | ) | — | |||||
Return of capital Class I | (22,250 | ) | — | |||||
|
|
|
| |||||
| Decrease in net assets from distributions to shareholders | (248,995 | ) | (271,957 | ) | ||||
|
|
|
| |||||
| From Share Transactions | ||||||||
| Sale of shares | ||||||||
Class A (91,590 and 213,985 shares, respectively) | 438,116 | 1,043,710 | ||||||
Class B (9 and 11 shares, respectively) | 45 | 52 | ||||||
Class C (82,833 and 148,857 shares, respectively) | 401,212 | 735,299 | ||||||
Class T (9,811 and 23,586 shares, respectively) | 47,392 | 116,148 | ||||||
Class I (269,095 and 672,603 shares, respectively) | 1,287,295 | 3,291,503 | ||||||
| Reinvestment of distributions | ||||||||
Class A (9,714 and 20,365 shares, respectively) | 46,369 | 99,389 | ||||||
Class B (4 and 11 shares, respectively) | 21 | 53 | ||||||
Class C (8,562 and 9,071 shares, respectively) | 41,374 | 44,772 | ||||||
Class T (1,870 and 2,309 shares, respectively) | 9,014 | 11,365 | ||||||
Class I (25,004 and 15,682 shares, respectively) | 119,514 | 76,553 | ||||||
| Shares repurchased | ||||||||
Class A (157,118 and 580,132 shares, respectively) | (750,068 | ) | (2,835,996 | ) | ||||
Class B (227 and 260 shares, respectively) | (1,080 | ) | (1,262 | ) | ||||
Class C (135,370 and 126,206 shares, respectively) | (654,153 | ) | (622,784 | ) | ||||
Class T (35,882 and 32,030 shares, respectively) | (172,911 | ) | (157,686 | ) | ||||
Class I (406,378 and 202,225 shares, respectively) | (1,940,913 | ) | (987,226 | ) | ||||
|
|
|
| |||||
| Increase (decrease) in net assets from share transactions | (1,128,773 | ) | 813,890 | |||||
|
|
|
| |||||
| Net increase (decrease) in net assets | (1,387,258 | ) | 787,800 | |||||
| Net Assets | ||||||||
Beginning of period | 9,102,630 | 8,314,830 | ||||||
|
|
|
| |||||
| End of period | $ | 7,715,372 | $ | 9,102,630 | ||||
|
|
|
| |||||
Accumulated undistributed net investment income (loss) at end of period | $ | (3,391 | ) | $ | (544 | ) | ||
| (1) | Amount is less than $500. |
See Notes to Financial Statements
40
Table of Contents
VIRTUS MULTI-SECTOR SHORT TERM BOND FUND
SELECTED PER SHARE DATA AND RATIOS FOR A SHARE OUTSTANDING
THROUGHOUT EACH PERIOD
| Net Asset Value, Beginning of Period | Net Investment Income (Loss)(2) | Capital Gain Distributions Received from Affiliated Funds | Net Realized and Unrealized Gain (Loss) | Total from Investment Operations | Dividends from Net Investment Income | Distributions from Net Realized Gains | Return of Capital | Total Distributions | Change in Net Asset Value | Net Asset Value, End of Period | Total Return(1) | Net Assets, End of Period (000’s) | Ratio of Expenses to Average Net Assets(3) | Ratio of Gross Expenses to Average Net Assets | Ratio of Net Investment Income to Average Net Assets | Portfolio Turnover Rate | |||||||||||||||||||||||||||||||||||||||||||||||||||||||||||||||||||||
Class A | |||||||||||||||||||||||||||||||||||||||||||||||||||||||||||||||||||||||||||||||||||||
| 10/1/14 to 9/30/15 | $ | 4.84 | 0.15 | — | (0.16 | ) | (0.01 | ) | (0.11 | ) | — |
| (0.03 | ) | (0.14 | ) | (0.15 | ) | $ | 4.69 | (0.23 | )% | $ | 1,575,629 | 0.97 | % | 0.97 | % | 3.15 | % | 37 | % | |||||||||||||||||||||||||||||||||||||||||||||||||||||
| 10/1/13 to 9/30/14 | 4.85 | 0.16 | — | (0.01 | ) | 0.15 | (0.16 | ) | — | (4) | — | (4) | (0.16 | ) | (0.01 | ) | 4.84 | 3.03 | 1,894,633 | 0.99 | — | 3.30 | 39 | ||||||||||||||||||||||||||||||||||||||||||||||||||||||||||||||
| 10/1/12 to 9/30/13 | 4.94 | 0.18 | — | (0.09 | ) | 0.09 | (0.18 | ) | — | — | (4) | (0.18 | ) | (0.09 | ) | 4.85 | 1.84 | 3,574,450 | 0.99 | — | 3.65 | 49 | |||||||||||||||||||||||||||||||||||||||||||||||||||||||||||||||
| 10/1/11 to 9/30/12 | 4.67 | 0.21 | — | 0.27 | 0.48 | (0.21 | ) | — | — | (4) | (0.21 | ) | 0.27 | 4.94 | 10.58 | 3,038,093 | 1.01 | — | 4.31 | 52 | |||||||||||||||||||||||||||||||||||||||||||||||||||||||||||||||||
| 10/1/10 to 9/30/11 | 4.80 | 0.22 | — | (0.12 | ) | 0.10 | (0.23 | ) | — | — | (4) | (0.23 | ) | (0.13 | ) | 4.67 | 2.02 | 2,463,360 | 1.05 | — | 4.59 | 35 | |||||||||||||||||||||||||||||||||||||||||||||||||||||||||||||||
Class B | |||||||||||||||||||||||||||||||||||||||||||||||||||||||||||||||||||||||||||||||||||||
| 10/1/14 to 9/30/15 | $ | 4.81 | 0.13 | — | (0.16 | ) | (0.03 | ) | (0.09 | ) | — |
| (0.03 | ) | (0.12 | ) | (0.15 | ) | $ | 4.66 | (0.73 | )% | $ | 382 | 1.46 | % | 1.47 | % | 2.67 | % | 37 | % | |||||||||||||||||||||||||||||||||||||||||||||||||||||
| 10/1/13 to 9/30/14 | 4.82 | 0.14 | — | (0.02 | ) | 0.12 | (0.13 | ) | — | (4) | — | (4) | (0.13 | ) | (0.01 | ) | 4.81 | 2.53 | 1,421 | 1.49 | — | 2.80 | 39 | ||||||||||||||||||||||||||||||||||||||||||||||||||||||||||||||
| 10/1/12 to 9/30/13 | 4.91 | 0.16 | — | (0.09 | ) | 0.07 | (0.16 | ) | — | — | (4) | (0.16 | ) | (0.09 | ) | 4.82 | 1.34 | 2,572 | 1.49 | — | 3.17 | 49 | |||||||||||||||||||||||||||||||||||||||||||||||||||||||||||||||
| 10/1/11 to 9/30/12 | 4.65 | 0.18 | — | 0.27 | 0.45 | (0.19 | ) | — | — | (4) | (0.19 | ) | 0.26 | 4.91 | 9.87 | 3,590 | 1.51 | — | 3.86 | 52 | |||||||||||||||||||||||||||||||||||||||||||||||||||||||||||||||||
| 10/1/10 to 9/30/11 | 4.78 | 0.20 | — | (0.12 | ) | 0.08 | (0.21 | ) | — | — | (4) | (0.21 | ) | (0.13 | ) | 4.65 | 1.53 | 5,550 | 1.55 | — | 4.10 | 35 | |||||||||||||||||||||||||||||||||||||||||||||||||||||||||||||||
Class C | |||||||||||||||||||||||||||||||||||||||||||||||||||||||||||||||||||||||||||||||||||||
| 10/1/14 to 9/30/15 | $ | 4.89 | 0.14 | — | (0.15 | ) | (0.01 | ) | (0.10 | ) | — | (0.03 | ) | (0.13 | ) | (0.14 | ) | $ | 4.75 | (0.27 | )% | $ | 1,460,120 | 1.22 | % | 1.22 | % | 2.90 | % | 37 | % | ||||||||||||||||||||||||||||||||||||||||||||||||||||||
| 10/1/13 to 9/30/14 | 4.90 | 0.15 | — | (0.02 | ) | 0.13 | (0.14 | ) | — | (4) | — | (4) | (0.14 | ) | (0.01 | ) | 4.89 | 2.73 | 1,720,245 | 1.24 | — | 3.03 | 39 | ||||||||||||||||||||||||||||||||||||||||||||||||||||||||||||||
| 10/1/12 to 9/30/13 | 4.99 | 0.17 | — | (0.09 | ) | 0.08 | (0.17 | ) | — | — | (4) | (0.17 | ) | (0.09 | ) | 4.90 | 1.56 | 1,567,725 | 1.24 | — | 3.40 | 49 | |||||||||||||||||||||||||||||||||||||||||||||||||||||||||||||||
| 10/1/11 to 9/30/12 | 4.72 | 0.20 | — | 0.27 | 0.47 | (0.20 | ) | — | — | (4) | (0.20 | ) | 0.27 | 4.99 | 10.19 | 1,067,276 | 1.27 | — | 4.04 | 52 | |||||||||||||||||||||||||||||||||||||||||||||||||||||||||||||||||
| 10/1/10 to 9/30/11 | 4.85 | 0.21 | — | (0.12 | ) | 0.09 | (0.22 | ) | — | — | (4) | (0.22 | ) | (0.13 | ) | 4.72 | 1.75 | 616,170 | 1.30 | — | 4.33 | 35 | |||||||||||||||||||||||||||||||||||||||||||||||||||||||||||||||
The footnote legend is at the end of the financial highlights
See Notes to Financial Statements
41
Table of Contents
VIRTUS MULTI-SECTOR SHORT TERM BOND FUND
FINANCIAL HIGHLIGHTS (Continued)
SELECTED PER SHARE DATA AND RATIOS FOR A SHARE OUTSTANDING
THROUGHOUT EACH PERIOD
| Net Asset Value, Beginning of Period | Net Investment Income (Loss)(2) | Capital Gain Distributions Received from Affiliated Funds | Net Realized and Unrealized Gain (Loss) | Total from Investment Operations | Dividends from Net Investment Income | Distributions from Net Realized Gains | Return of Capital | Total Distributions | Change in Net Asset Value | Net Asset Value, End of Period | Total Return(1) | Net Assets, End of Period (000’s) | Ratio of Expenses to Average Net Assets(3) | Ratio of Gross Expenses to Average Net Assets | Ratio of Net Investment Income to Average Net Assets | Portfolio Turnover Rate | |||||||||||||||||||||||||||||||||||||||||||||||||||||||||||||||||||||
Class T | |||||||||||||||||||||||||||||||||||||||||||||||||||||||||||||||||||||||||||||||||||||
| 10/1/14 to 9/30/15 | $ | 4.88 | 0.12 | — | (0.17 | ) | (0.05 | ) | (0.07 | ) | — | (0.03 | ) | (0.10 | ) | (0.15 | ) | $ | 4.73 | (0.98 | )% | $ | 583,694 | 1.72 | % | 1.72 | % | 2.40 | % | 37 | % | ||||||||||||||||||||||||||||||||||||||||||||||||||||||
| 10/1/13 to 9/30/14 | 4.89 | 0.12 | — | (0.01 | ) | 0.11 | (0.12 | ) | — | (4) | — | (4) | (0.12 | ) | (0.01 | ) | 4.88 | 2.23 | 719,840 | 1.74 | — | 2.53 | 39 | ||||||||||||||||||||||||||||||||||||||||||||||||||||||||||||||
| 10/1/12 to 9/30/13 | 4.98 | 0.14 | — | (0.09 | ) | 0.05 | (0.14 | ) | — | — | (4) | (0.14 | ) | (0.09 | ) | 4.89 | 1.06 | 751,220 | 1.74 | — | 2.91 | 49 | |||||||||||||||||||||||||||||||||||||||||||||||||||||||||||||||
| 10/1/11 to 9/30/12 | 4.71 | 0.17 | — | 0.28 | 0.45 | (0.18 | ) | — | — | (4) | (0.18 | ) | 0.27 | 4.98 | 9.67 | 704,225 | 1.76 | — | 3.56 | 52 | |||||||||||||||||||||||||||||||||||||||||||||||||||||||||||||||||
| 10/1/10 to 9/30/11 | 4.84 | 0.19 | — | (0.13 | ) | 0.06 | (0.19 | ) | — | — | (4) | (0.19 | ) | (0.13 | ) | 4.71 | 1.24 | 530,162 | 1.80 | — | 3.84 | 35 | |||||||||||||||||||||||||||||||||||||||||||||||||||||||||||||||
Class I | |||||||||||||||||||||||||||||||||||||||||||||||||||||||||||||||||||||||||||||||||||||
| 10/1/14 to 9/30/15 | $ | 4.84 | 0.16 | — | (0.16 | ) | — | (0.12 | ) | — | (0.03 | ) | (0.15 | ) | (0.15 | ) | $ | 4.69 | 0.02 | % | $ | 4,095,547 | 0.72 | % | 0.72 | % | 3.40 | % | 37 | % | |||||||||||||||||||||||||||||||||||||||||||||||||||||||
| 10/1/13 to 9/30/14 | 4.85 | 0.17 | — | (0.01 | ) | 0.16 | (0.17 | ) | — | (4) | — | (4) | (0.17 | ) | (0.01 | ) | 4.84 | 3.28 | 4,766,491 | 0.74 | — | 3.51 | 39 | ||||||||||||||||||||||||||||||||||||||||||||||||||||||||||||||
| 10/1/12 to 9/30/13 | 4.94 | 0.19 | — | (0.09 | ) | 0.10 | (0.19 | ) | — | — | (4) | (0.19 | ) | (0.09 | ) | 4.85 | 2.09 | 2,418,863 | 0.74 | — | 3.90 | 49 | |||||||||||||||||||||||||||||||||||||||||||||||||||||||||||||||
| 10/1/11 to 9/30/12 | 4.68 | 0.22 | — | 0.27 | 0.49 | (0.23 | ) | — | — | (4) | (0.23 | ) | 0.26 | 4.94 | 10.62 | 1,606,957 | 0.77 | — | 4.55 | 52 | |||||||||||||||||||||||||||||||||||||||||||||||||||||||||||||||||
| 10/1/10 to 9/30/11 | 4.81 | 0.23 | — | (0.12 | ) | 0.11 | (0.24 | ) | — | — | (4) | (0.24 | ) | (0.13 | ) | 4.68 | 2.28 | 901,528 | 0.80 | — | 4.83 | 35 | |||||||||||||||||||||||||||||||||||||||||||||||||||||||||||||||
Footnote Legend
| (1) | Sales charges, where applicable, are not reflected in the total return calculation. |
| (2) | Computed using average shares outstanding. |
| (3) | The Fund may invest in other funds and the annualized expense ratios do not reflect fees and expenses associated with the underlying funds. |
| (4) | Amount is less than $0.005. |
See Notes to Financial Statements
42
Table of Contents
VIRTUS MULTI-SECTOR SHORT TERM BOND FUND
SEPTEMBER 30, 2015
Note 1. Organization
Virtus Opportunities Trust (the “Trust”) is organized as a Delaware statutory trust and is registered under the Investment Company Act of 1940, as amended (“1940 Act”), as an open-end management investment company.
As of the date of this report, 32 funds of the Trust are offered for sale, of which the Virtus Multi-Sector Short Term Bond Fund (the “Fund”) is reported in this annual report. The Fund’s investment objective is outlined in the Fund Summary Page. There is no guarantee the Fund will achieve its objective.
The Fund offers Class A shares, Class C shares, Class T shares and Class I shares. Class B shares are no longer available for purchase by new or existing shareholders, except by existing shareholders through Qualifying Transactions. (For information regarding Qualifying Transactions refer to the Trust’s prospectus.)
Class A shares are sold with a front-end sales charge of up to 2.25%. Generally, Class A shares are not subject to any charges by the Fund when redeemed; however, a 0.50% contingent deferred sales charge (“CDSC”) may be imposed on certain redemptions made within a certain period following purchases on which a finder’s fee has been paid. The period for which the CDSC applies for the Fund is 18 months. The CDSC period begins on the last day of the month preceding the month in which the purchase was made.
Class B shares generally were sold with a CDSC which declines from 2% to zero depending on the period of time the shares are held. Class C shares are sold without a sales charge. Class T shares are sold with a 1% CDSC, applicable if redeemed within one year of purchase. Class I shares are sold without a front-end sales charge or CDSC.
Virtus Mutual Funds may impose an annual fee on accounts having balances of less than $2,500. The small account fee may be waived in certain circumstances, as disclosed in the prospectuses and/or statements of additional information. The fees collected will be used to offset certain expenses of the funds.
Each class of shares has identical voting, dividend, liquidation and other rights and the same terms and conditions, except that each class bears different distribution and/or service fees under a Board-approved Rule 12b-1 and/or shareholder service plan (“12b-1 plan”) and has exclusive voting rights with respect to such plans. Class I shares are not subject to a 12b-1 plan. Income and other expenses as well as realized and unrealized gains and losses of the Fund are borne pro rata by the holders of each class of shares.
Note 2. Significant Accounting Policies
The following is a summary of significant accounting policies consistently followed by the Trust in the preparation of its financial statements. The preparation of financial statements in conformity with accounting principles generally accepted in the United States of America requires management to make estimates and assumptions that affect the reported amounts of assets and liabilities, disclosure of contingent assets and liabilities at the date of the financial statements and the reported amounts of increases and decreases in net assets from operations during the reporting period. Actual results could differ from those estimates and those differences could be significant.
| A. | Security Valuation |
Security valuation procedures for the Fund, which include nightly price variance, as well as back-testing such as bi-weekly unchanged price, monthly secondary source and
43
Table of Contents
VIRTUS MULTI-SECTOR SHORT TERM BOND FUND
NOTES TO FINANCIAL STATEMENTS (Continued)
SEPTEMBER 30, 2015
transaction analysis, have been approved by the Board of Trustees (the “Board”, or the “Trustees”). All internally fair valued securities are approved by a valuation committee (the “Valuation Committee”) appointed by the Board. The Valuation Committee is comprised of certain members of management as identified to the Board and convenes independently from portfolio management. All internally fair valued securities are updated daily and reviewed in detail by the Valuation Committee monthly unless changes occur within the period. The Valuation Committee reviews the validity of the model inputs and any changes to the model. Quarterly fair valuations are reviewed by the Board.
The Fund utilizes a fair value hierarchy which prioritizes the inputs to valuation techniques used to measure fair value into three broad levels. It is the Fund’s policy to recognize transfers at the end of reporting period.
| • Level 1 – | quoted prices in active markets for identical securities (security types generally include listed equities). |
| • Level 2 – | prices determined using other significant observable inputs (including quoted prices for similar securities, interest rates, prepayment speeds, credit risk, etc.). |
| • Level 3 – | prices determined using significant unobservable inputs (including the Valuation Committee’s own assumptions in determining the fair value of investments). |
A description of the valuation techniques applied to the Fund’s major categories of assets and liabilities measured at fair value on a recurring basis is as follows:
Equity securities are valued at the official closing price (typically last sale) on the exchange on which the securities are primarily traded or, if no closing price is available, at the last bid price and are categorized as Level 1 in the hierarchy. Restricted equity securities and private placements that are not widely traded, are illiquid, or are internally fair valued by the Valuation Committee, are generally categorized as Level 3 in the hierarchy.
Certain non-U.S. securities may be fair valued in cases where closing prices are not readily available or are deemed not reflective of readily available market prices. For example, significant events (such as movement in the U.S. securities market, or other regional and local developments) may occur between the time that non-U.S. markets close (where the security is principally traded) and the time that the Fund calculates its net asset value (“NAV”) (at the close of regular trading on the New York Stock Exchange (“NYSE”), generally 4 p.m. Eastern time) that may impact the value of securities traded in these non-U.S. markets. In such cases the Fund fair values non-U.S. securities using an independent pricing service which considers the correlation of the trading patterns of the non-U.S. security to the intraday trading in the U.S. markets for investments such as American Depositary Receipts, financial futures, ETFs, and certain indexes, as well as prices for similar securities. Such fair valuations are categorized as Level 2 in the hierarchy. Because the frequency of significant events is not predictable, fair valuation of certain non-U.S. common stocks may occur on a frequent basis.
Debt securities, including restricted securities, are valued based on evaluated quotations received from independent pricing services or from dealers who make
44
Table of Contents
VIRTUS MULTI-SECTOR SHORT TERM BOND FUND
NOTES TO FINANCIAL STATEMENTS (Continued)
SEPTEMBER 30, 2015
markets in such securities. For most bond types, the pricing service utilizes matrix pricing that considers one or more of the following factors: yield or price of bonds of comparable quality, coupon, maturity, current cash flows, type, and current day trade information, as well as dealer-supplied prices. These valuations are generally categorized as Level 2 in the hierarchy. Structured debt instruments such as mortgage-backed and asset-backed securities may also incorporate collateral analysis and utilize cash flow models for valuation and are generally categorized as Level 2 in the hierarchy. Pricing services do not provide pricing for all securities and therefore indicative bids from dealers are utilized which are based on pricing models used by market makers in the security and are generally categorized as Level 2 in the hierarchy. Debt securities that are not widely traded, are illiquid, or are internally fair valued by the Valuation Committee, are generally categorized as Level 3 in the hierarchy.
Listed derivatives that are actively traded are valued based on quoted prices from the exchange and are categorized as Level 1 in the hierarchy. Over-the-counter derivative contracts, which include forward currency contracts and equity-linked instruments, do not require material subjectivity as pricing inputs are observed from actively quoted markets and are categorized as Level 2 in the hierarchy.
Investments in open-end mutual funds are valued at NAV. Investments in closed-end funds are valued as of the close of regular trading on the NYSE each business day. Both are categorized as Level 1 in the hierarchy.
A summary of the inputs used to value the Fund’s net assets by each major security type is disclosed at the end of the Schedule of Investments for the Fund. The inputs or methodologies used for valuing securities are not necessarily an indication of the risk associated with investing in those securities.
| B. | Security Transactions and Investment Income |
Security transactions are recorded on the trade date. Realized gains and losses from the sale of securities are determined on the identified cost basis. Dividend income is recognized on the ex-dividend date or, in the case of certain foreign securities, as soon as the Fund is notified. Interest income is recorded on the accrual basis. The Fund amortizes premiums and accretes discounts using the effective interest method. Any distributions from underlying funds are recorded in accordance with the character of the disbursements as designated by the underlying fund.
| C. | Income Taxes |
The Fund is treated as a separate taxable entity. It is the intention of the Fund to comply with the requirements of Subchapter M of the Internal Revenue Code and to distribute substantially all of its taxable income to its shareholders. Therefore, no provision for federal income taxes or excise taxes has been made.
The Fund may be subject to foreign taxes on income, gains on investments or currency repatriation, a portion of which may be recoverable. The Fund will accrue such taxes and recoveries as applicable based upon current interpretations of the tax rules and regulations that exist in the markets in which it invests.
Management of the Fund has concluded that there are no significant uncertain tax positions that would require recognition in the financial statements. As of September 30, 2015, the tax years that remain subject to examination by the major tax jurisdictions under the statute of limitations are from the year 2012 forward (with limited exceptions).
45
Table of Contents
VIRTUS MULTI-SECTOR SHORT TERM BOND FUND
NOTES TO FINANCIAL STATEMENTS (Continued)
SEPTEMBER 30, 2015
| D. | Distributions to Shareholders |
Distributions are recorded by the Fund on the ex-dividend date. Income distributions are recorded daily. Income and capital gain distributions are determined in accordance with income tax regulations that may differ from accounting principles generally accepted in the United States of America. These differences may include the treatment of non-taxable dividends, market premium and discount, non-deductible expenses, expiring capital loss carryovers, foreign currency gain or loss, gain or loss on futures contracts, partnerships, operating losses and losses deferred due to wash sales. Permanent book and tax basis differences relating to shareholder distributions will result in reclassifications to capital paid in on shares of beneficial interest.
| E. | Expenses |
Expenses incurred together by the Fund and other affiliated mutual funds are allocated in proportion to the net assets of each such fund, except where allocation of direct expense to each fund or an alternative allocation method can be more appropriately used.
In addition to the net annual operating expenses that the Fund bears directly, the shareholders of the Fund indirectly bear the Fund’s pro-rata expenses of any underlying mutual funds in which the Fund invests.
| F. | Foreign Currency Translation |
Non-U.S. investment securities and other assets and liabilities denominated in foreign currencies are translated into U.S. dollar amounts at the foreign currency exchange rate effective at the end of the reporting period. Cost of investments is translated at the currency exchange rate effective at the trade date. The gain or loss resulting from a change in currency exchange rates between the trade and settlement date of a portfolio transaction is treated as a gain or loss on foreign currency. Likewise, the gain or loss resulting from a change in currency exchange rates between the date income is accrued and the date it is paid is treated as a gain or loss on foreign currency. The Fund does not isolate that portion of the results of operations arising from changes in foreign exchange rates on investments from the fluctuations arising from changes in the market prices of securities held. Such fluctuations are included with the net realized and unrealized gain or loss on investments.
| G. | When-issued Purchases and Forward Commitments (Delayed Delivery) |
The Fund may engage in when-issued or forward commitment transactions. Securities purchased on a when-issued or forward commitment basis are also known as delayed delivery transactions. Delayed delivery transactions involve a commitment by a fund to purchase or sell a security at a future date, ordinarily up to 90 days later. When-issued or forward commitments enable a fund to lock in what is believed to be an attractive price or yield on a particular security for a period of time, regardless of future changes in interest rates. The Fund records when-issued and delayed delivery securities on the trade date. The Fund maintains collateral for the securities purchased. Securities purchased on a when-issued or delayed delivery basis begin earning interest on the settlement date.
46
Table of Contents
VIRTUS MULTI-SECTOR SHORT TERM BOND FUND
NOTES TO FINANCIAL STATEMENTS (Continued)
SEPTEMBER 30, 2015
| H. | Loan Agreements |
The Fund may invest in direct debt instruments which are interests in amounts owed by a corporate, governmental, or other borrower to lenders or lending syndicates. Loan agreements are generally non-investment grade and often involve borrowers that are highly leveraged. The Fund may invest in obligations of borrowers who are in bankruptcy proceedings. Loan agreements are typically senior in the corporate capital structure of the borrower. A loan is often administered by a bank or other financial institution (the “lender”) that acts as agent for all holders. The agent administers the terms of the loan, as specified in the loan agreement. The Fund’s investments in loans may be in the form of participations in loans or assignments of all or a portion of loans from third parties. When investing in loan participations, the Fund has the right to receive payments of principal, interest and any fees to which it is entitled only from the lender selling the loan participation and only upon receipt by the lender of payments from the borrower. The Fund generally has no right to enforce compliance with the terms of the loan agreement with the borrower. As a result, the Fund may be subject to the credit risk of both the borrower and the lender that is selling the loan agreement. When the Fund purchases assignments from lenders it acquires direct rights against the borrower on the loan.
The Fund may invest in multiple series or tranches of a loan, which may have varying terms and carry different associated risks. Loan agreements may involve foreign borrowers, and investments may be denominated in foreign currencies. Direct indebtedness of emerging countries involves a risk that the government entities responsible for the repayment of the debt may be unable, or unwilling, to pay the principal and interest when due.
The loan agreements have floating rate loan interests which generally pay interest at rates that are periodically determined by reference to a base lending rate plus a premium. The base lending rates are generally LIBOR (London Interbank Offered Rate), the prime rate offered by one or more U.S. banks or the certificate of deposit rate. When a loan agreement is purchased the Fund may pay an assignment fee. On an ongoing basis, the Fund may receive a commitment fee based on the undrawn portion of the underlying line of credit portion of a loan agreement. Prepayment penalty fees are received upon the prepayment of a loan agreement by a borrower. Prepayment penalty, facility, commitment, consent and amendment fees are recorded to income as earned or paid.
At September 30, 2015, all loan agreements held by the Fund are assignment loans.
Note 3. Investment Advisory Fees and Related Party Transactions
($ reported in thousands except as noted)
| A. | Adviser |
Virtus Investment Advisers, Inc. (the “Adviser”), an indirect, wholly-owned subsidiary of Virtus Investment Partners, Inc. (“Virtus”), is the adviser to the Trust. The Adviser manages the Fund’s investment program and general operations of the Fund, including oversight of the Fund’s subadviser.
47
Table of Contents
VIRTUS MULTI-SECTOR SHORT TERM BOND FUND
NOTES TO FINANCIAL STATEMENTS (Continued)
SEPTEMBER 30, 2015
As compensation for its services to the Fund, the Adviser is entitled to a fee based upon the following annual rates as a percentage of the average daily net assets of the Fund:
First $1 Billion | $1+ Billion – | $2+ Billion – 10 Billion | $10+ Billion | |||
| 0.55% | 0.50% | 0.45% | 0.425% |
During the period covered by these financial statements, the Fund invested a portion of its assets in Virtus Credit Opportunities Fund, an affiliated mutual fund. In order to avoid any duplication of advisory fees, the Adviser has voluntarily waived its advisory fees in an amount equal to that which would otherwise be paid by the Fund on the assets invested in the Credit Opportunities Fund. For the period covered by these financial statements, the waiver amounted to $96. This waiver is in addition to the expense limitation and/or fee waiver covered elsewhere in these financial statements and is included in the Statement of Operations in “expenses reimbursed and/or waived by the investment adviser”.
| B. | Subadviser |
Newfleet Asset Management, LLC (the “Subadviser”), an indirect, wholly-owned subsidiary of Virtus, is the subadviser to the Fund. The Subadviser manages the investments of the Fund for which it is paid a fee by the Adviser.
| C. | Expense Limitations |
Effective September 1, 2015, the Adviser has contractually agreed to limit the Fund’s total operating expenses (excluding dividend and interest expenses, taxes, brokerage commissions, leverage expenses, extraordinary expenses and acquired fund fees and expenses, if any) so that such expenses do not exceed, on an annualized basis, the following percentages of the Fund’s average net asset values: 1.10% for Class A shares, 1.60% for Class B shares, 1.35% for Class C shares, 1.85% for Class T shares, and 0.85% for Class I shares through January 31, 2017. For the period of October 1, 2014 through August 31, 2015, the waiver was voluntary. The Fund is currently below its expense cap.
| D. | Distributor |
VP Distributors, LLC (“VP Distributors”), an indirect wholly-owned subsidiary of Virtus, serves as the distributor of the Fund’s shares. VP Distributors has advised the Fund that for the fiscal (the “period”) ended September 30, 2015, it retained net commissions of $38 for Class A shares and deferred sales charges of $74, $—(1), $7 and $62 for Class A shares, Class B shares, Class C shares and Class T shares, respectively.
| (1) | Amount is less than $500. |
In addition, the Fund pays VP Distributors distribution and/or service fees under a 12b-1 plan as a percentage of the average daily net assets of each respective class, at the annual rate of 0.25% for Class A shares, 0.75% for Class B shares, 0.50% for Class C shares, and 1.00% for Class T shares. Class I shares are not subject to a 12b-1 plan.
Under certain circumstances, shares of certain Virtus Mutual Funds may be exchanged for shares of the same class of certain other Virtus Mutual Funds on the basis of the relative NAV per share at the time of the exchange. On exchanges with share classes that carry a CDSC, the CDSC schedule of the original shares purchased continues to apply.
48
Table of Contents
VIRTUS MULTI-SECTOR SHORT TERM BOND FUND
NOTES TO FINANCIAL STATEMENTS (Continued)
SEPTEMBER 30, 2015
| E. | Administrator and Transfer Agent |
Virtus Fund Services LLC, an indirect wholly-owned subsidiary of Virtus, serves as the administrator and transfer agent to the Fund.
For the period ended September 30, 2015, the Fund incurred administration fees totaling $8,134 which are included in the Statement of Operations.
For the period ended September 30, 2015, the Fund incurred transfer agent fees totaling $8,903 which are included in the Statement of Operations. A portion of these fees is paid to outside entities that also provide services to the Trust.
| F. | Affiliated Shareholders |
At September 30, 2015, Virtus and its affiliates, and the retirement plans of Virtus and its affiliates, held shares of the Fund which may be redeemed at any time that aggregated to the following:
| Shares | Aggregate Net Asset Value | |||||||
Class I Shares | 2,022,361 | $ | 9,485 | |||||
| G. | Investments in Affiliates |
A summary of the Multi-Sector Short Term Bond Fund’s total long-term and short-term purchases and sales of affiliated underlying funds during the period ended September 30, 2015, is as follows:
| Value, beginning of period | Purchases | Sales Proceeds | Value, end of period | Dividend Income | Distributions of Realized Gains | |||||||||||||||||||
Virtus Credit Opportunities Fund | $ | — | $ | 69,338 | $ | — | $ | 67,751 | $ | 338 | $ | — | ||||||||||||
The Multi-Sector Short Term Bond Fund does not invest in the underlying fund for the purpose of exercising management or control; however the investments made by the Fund within each of its principal investment strategies may represent a significant portion of an underlying fund’s net assets. At September 30, 2015, the Fund was the owner of record of approximately 71% of the Credit Opportunities Fund.
Note 4. Purchases and Sales of Securities
($ reported in thousands)
Purchases and sales of securities for the Fund (excluding U.S. Government and agency securities, and short-term securities) during the period ended September 30, 2015, were as follows:
| Purchases | Sales | |||||||
| $ | 2,572,430 | $ | 3,584,499 | |||||
Purchases and sales of long-term U.S. Government and agency securities for the Fund during the period ended September 30, 2015, were as follows:
| Purchases | Sales | |||||||
| $ | 514,106 | $ | 507,434 | |||||
49
Table of Contents
VIRTUS MULTI-SECTOR SHORT TERM BOND FUND
NOTES TO FINANCIAL STATEMENTS (Continued)
SEPTEMBER 30, 2015
Note 5. Borrowings
($ reported in thousands)
On July 2, 2015, the Fund and other affiliated Funds entered into a $50,000 secured Line of Credit Agreement (the “Agreement”) with a commercial bank (the “Bank”) that allows the Fund to borrow cash from the Bank to manage large unexpected redemptions and trade fails, up to a limit of one-third of the Fund’s total net assets in accordance with the Agreement. Interest is charged at the higher of the LIBOR (London Interbank Offered Rate) or the Federal Funds rate plus an additional percentage rate on the amount borrowed. Commitment fees are charged on the undrawn balance. The Funds are individually, and not jointly, liable for their particular advances, if any, under the line of credit. The Bank has the ability to require repayment of outstanding borrowings under the Agreement upon certain circumstances such as an event of default.
The Fund had no outstanding borrowings at any time during the period ended September 30, 2015.
Note 6. 10% Shareholders
As of September 30, 2015, the Fund had individual shareholder account(s) and/or omnibus shareholder account(s) (comprised of a group of individual shareholders), which individually amounted to more than 10% of the total shares outstanding of the Fund as detailed below.
| % of Shares Outstanding | Number of Accounts | |||||||
| 30 | % | 2 | ||||||
The shareholders are not affiliated with Virtus.
Note 7. Credit Risk and Asset Concentrations
In countries with limited or developing markets, investments may present greater risks than in more developed markets and the prices of such investments may be volatile. The consequences of political, social or economic changes in these markets may have disruptive effects on the market prices of these investments and the income they generate, as well as the Fund’s ability to repatriate such amounts.
High-yield/high-risk securities typically entail greater price volatility and/or principal and interest rate risk. There is a greater chance that an issuer will not be able to make principal and interest payments on time. Analysis of the creditworthiness of issuers of high-yield/high-risk securities may be complex, and as a result it, may be more difficult for the Adviser and/or Subadviser to accurately predict risk.
The Fund may invest a high percentage of its assets in specific sectors of the market in the pursuit of its investment objective. Fluctuations in these sectors of concentration may have a greater impact on the Fund, positive or negative, than if the Fund did not concentrate its investments in such sectors.
Note 8. Illiquid and Restricted Securities
Investments generally are considered illiquid if they cannot be disposed of in seven days in the ordinary course of business at the approximate amount at which such securities have been valued by the Fund. Additionally, the following information is also considered in determining illiquidity: the frequency of trades and quotes for the investment, whether the investment is listed for trading on a recognized domestic exchange and/or whether two or
50
Table of Contents
VIRTUS MULTI-SECTOR SHORT TERM BOND FUND
NOTES TO FINANCIAL STATEMENTS (Continued)
SEPTEMBER 30, 2015
more brokers are willing to purchase or sell the security at a comparable price, the extent of market making activity in the investment and the nature of the market for investment. Illiquid securities are footnoted as such at the end of the Fund’s Schedule of Investments where applicable. However, a portion of such footnoted securities could be liquid where the Subadviser determines that some, though not all, of the position could be disposed of within seven days in the ordinary course of business at the approximate amount at which such securities have been valued by the Fund.
Restricted securities are illiquid securities, as defined above, not registered under the Securities Act of 1933, as amended (the “1933 Act”). Generally, 144A securities are excluded from this category, except where defined as illiquid.
The Fund will bear any costs, including those involved in registration under the 1933 Act, in connection with the disposition of such securities.
At September 30, 2015, the Fund did not hold any securities that are both illiquid and restricted.
Note 9. Indemnifications
Under the Trust’s organizational documents, its Trustees and officers are indemnified against certain liabilities arising out of the performance of their duties to the Fund. Each Trustee has also entered into an indemnification agreement with the Trust. In addition, in the normal course of business the Fund enters into contracts that provide a variety of indemnifications to other parties. The Fund’s maximum exposure under these arrangements is unknown as this would involve future claims that may be made against the Fund and that have not occurred. However, the Fund has not had prior claims or losses pursuant to these arrangements and expects the risk of loss to be remote.
Note 10. Federal Income Tax Information
($ reported in thousands)
At September 30, 2015, federal tax cost and aggregate gross unrealized appreciation (depreciation) of securities held by the Fund were as follows:
Federal | Unrealized | Unrealized | Net Unrealized | |||
| $7,873,288 | $101,470 | $(226,287) | $(124,817) |
The Fund has capital loss carryovers available to offset future realized gains, through the indicated expiration date shown below:
No Expiration | Total | |||||
Short-Term | Long-Term | Short-Term | Long-Term | |||
| $5,915 | $— | $5,915 | $— | |||
Under the Regulated Investment Company Modernization Act of 2010 (the “Act”), net capital losses recognized for tax years beginning after December 22, 2010, may be carried forward indefinitely, and their character is retained as short-term and/or long-term losses.
Capital losses realized after October 31 and certain late year losses may be deferred and treated as occurring on the first day of the following fiscal year. For the fiscal year ended September 30, 2015, the Fund deferred post-October capital loss of $56,744 and qualified late year ordinary losses of $0 and recognized post-October capital losses of $0 and qualified late year ordinary losses of $0 .
51
Table of Contents
VIRTUS MULTI-SECTOR SHORT TERM BOND FUND
NOTES TO FINANCIAL STATEMENTS (Continued)
SEPTEMBER 30, 2015
The components of distributable earnings on a tax basis (excluding unrealized appreciation (depreciation) (which are disclosed above) consist of undistributed ordinary income of $0 and undistributed long-term capital gains of $0.
The differences between the book and tax basis components of distributable earnings relate principally to the timing of recognition of income and gains for federal income tax purposes. Short-term gain distributions reported in the Statements of Changes in Net Assets, if any, are reported as ordinary income for federal tax purposes. Distributions are determined on a tax basis and may differ from net investment income and realized capital gains for financial reporting purposes. The Fund has distributed more than its income and capital gains; therefore, a portion of the distribution is a taxable return of capital (“ROC”) the ROC amounts are reflected in the Statement of Changes and Financial Highlights.
The tax character of dividends and distributions paid during the years ended September 30, 2015 and 2014 was as follows:
| Year Ended | ||||||||
| 2015 | 2014 | |||||||
Ordinary Income | $ | 206,751 | $ | 270,319 | ||||
Long-Term Capital Gains | — | 1,638 | ||||||
Return of Capital | 42,244 | — | ||||||
|
|
|
| |||||
Total | $ | 248,995 | $ | 271,957 | ||||
|
|
|
| |||||
Note 11. Reclassifications of Capital Accounts
($ reported in thousands)
For financial reporting purposes, book basis capital accounts are adjusted to reflect the tax character of permanent book/tax differences. Permanent reclassifications can arise from differing treatment of certain income and gain transactions, nondeductible current year net operating losses, expiring capital loss carryovers and investments in passive foreign investment companies. The reclassifications have no impact on the net assets or net asset value of the Fund. As of September 30, 2015, the Fund recorded reclassifications to increase (decrease) the accounts as listed below:
Capital Paid in | Undistributed |
| ||
| $— | $(65,278) | $65,278 |
Note 12. Regulatory Matters and Litigation
From time to time, the Fund’s investment adviser and/or its affiliates and/or subadvisers may be involved in litigation and arbitration as well as examinations and investigations by various regulatory bodies, including the SEC, involving compliance with, among other things, securities laws, client investment guidelines, laws governing the activities of broker-dealers and other laws and regulations affecting their products and other activities. At this time, the Fund’s investment adviser believes that the outcomes of such matters are not likely, either individually or in the aggregate, to be material to these financial statements.
As part of an SEC non-public, confidential investigation of a matter entitled – In the Matter of F-Squared Investments Inc., the SEC staff informed the Fund’s investment adviser that it
52
Table of Contents
VIRTUS MULTI-SECTOR SHORT TERM BOND FUND
NOTES TO FINANCIAL STATEMENTS (Continued)
SEPTEMBER 30, 2015
was inquiring into whether it had violated securities laws or regulations with respect to circumstances related to that matter. On November 16, 2015, without admitting or denying the SEC’s findings, the Fund’s investment adviser consented to the entry of an order providing that it cease and desist from committing or causing any violations and future violations of Sections 204, 206(2) and 206(4) of the Investment Advisers Act of 1940, as amended, and Rules 204-2, 206(4)-1, 206(4)-7 and 206(4)-8 thereunder, and Section 34(b) of the Investment Company Act of 1940, as amended; agreed to a censure; and paid $16.5 million, which included a civil money penalty of $2 million, disgorgement of $13.4 million and prejudgment interest of $1.1 million.
On February 20, 2015, a putative class action complaint (In re Virtus Investment Partners, Inc. Securities Litigation; formerly styled as Tom Cummins v. Virtus Investment Partners Inc. et al) alleging violation of the federal securities laws was filed by an individual shareholder against Virtus and certain of its officers (the “defendants”) in the United States District Court for the Southern District of New York. On August 21, 2015, the lead plaintiff filed a Consolidated Class Action Complaint (the “Consolidated Complaint”) amending the originally filed complaint and adding the Trust as a defendant. The Consolidated Complaint was purportedly filed on behalf of all purchasers of Virtus common stock between January 25, 2013 and May 11, 2015 (the “Class Period”). The Consolidated Complaint alleges that during the Class Period, the defendants knowingly disseminated materially false and misleading statements and concealed material adverse facts relating to certain funds previously subadvised by F-Squared Investments, Inc. and/or its affiliates (“F-Squared”). The plaintiff seeks to recover unspecified damages. Virtus and its affiliates, including the Fund’s adviser, believe that the suit is without merit and intend to defend it vigorously. A motion to dismiss the Consolidated Complaint was filed on behalf of the defendants on October 21, 2015. The Trust believes that the risk of loss to the Fund as a result of this suit is remote. The adviser does not believe that the suit will have any impact on its ability to provide services to the Fund.
On May 8, 2015, a putative class action complaint (Mark Youngers v. Virtus Investment Partners, Inc. et al) alleging violations of certain provisions of the federal securities laws was filed in the United States District Court for the Central District of California. The complaint, which was purportedly filed on behalf of purchasers of certain Virtus Funds previously subadvised by F-Squared between May 8, 2010 and December 22, 2014, inclusive (the “Class Period”), alleges claims against Virtus, certain Virtus officers and affiliates (including the Fund’s investment adviser, Euclid Advisors LLC and VP Distributors, LLC), the trustees and certain officers of the Trust, and certain other parties (the “defendants”). The complaint alleges that during the Class Period the defendants knowingly disseminated materially false and misleading statements and concealed or omitted material facts necessary to make the statements made not misleading. On October 1, 2015, the plaintiff filed a First Amended Class Action Complaint which, among other things, added a derivative claim for breach of fiduciary duty on behalf of the Trust. On October 19, 2015, the Court entered an order transferring the action to the Southern District of New York. Virtus and its affiliates, including the Fund’s adviser, believe the plaintiff’s claims asserted in the complaint are frivolous and intend to defend them vigorously. The Trust believes that the risk of loss to the Fund as a result of this suit is remote. The adviser does not believe that the suit will have any impact on its ability to provide services to the Fund.
Note 13. Subsequent Events
Management has evaluated the impact of all subsequent events on the Fund through the date the financial statements were issued, and has determined that there are no subsequent events requiring recognition or disclosure in the financial statements.
53
Table of Contents

Report of Independent Registered Public
Accounting Firm
To the Board of Trustees of
Virtus Opportunities Trust and Shareholders of
Virtus Multi-Sector Short Term Bond Fund:
In our opinion, the accompanying statement of assets and liabilities, including the schedule of investments, and the related statements of operations and of changes in net assets and the financial highlights present fairly, in all material respects, the financial position of the Virtus Multi-Sector Short Term Bond Fund (one of the funds constituting Virtus Opportunities Trust, hereafter referred to as the “Fund”) at September 30, 2015, the results of its operations for the year then ended, the changes in its net assets for each of the two years in the period then ended and the financial highlights for each of the five years in the period then ended, in conformity with accounting principles generally accepted in the United States of America. These financial statements and financial highlights (hereafter referred to as “financial statements”) are the responsibility of the Fund’s management. Our responsibility is to express an opinion on these financial statements based on our audits. We conducted our audits of these financial statements in accordance with the standards of the Public Company Accounting Oversight Board (United States). Those standards require that we plan and perform the audit to obtain reasonable assurance about whether the financial statements are free of material misstatement. An audit includes examining, on a test basis, evidence supporting the amounts and disclosures in the financial statements, assessing the accounting principles used and significant estimates made by management, and evaluating the overall financial statement presentation. We believe that our audits, which included confirmation of securities at September 30, 2015 by correspondence with the custodian and brokers, provide a reasonable basis for our opinion.
PricewaterhouseCoopers LLP
Philadelphia, Pennsylvania
November 20, 2015
54
Table of Contents
VIRTUS MULTI-SECTOR SHORT TERM BOND FUND
SEPTEMBER 30, 2015 (Unaudited)
For the fiscal year ended September 30, 2015, the Fund makes the following disclosures for federal income tax purposes. Below is listed the percentage, or the maximum amount allowable, of its ordinary income dividends (“QDI”) to qualify for the lower tax rates applicable to individual shareholders, and the percentage of ordinary income dividends earned by the Fund which qualifies for the dividends received deduction (“DRD”) for corporate shareholders. The actual percentage of QDI and DRD for the calendar year will be designated in year-end tax statements. The Fund designates the amount below as long-term capital gains dividends (“LTCG”) taxable at a 20% rate, or lower depending on the shareholder’s income ($ reported in thousands). LTCG amount, if subsequently different, will be designated in the next annual report.
QDI | DRD | LTCG | ||
| —% | —% | $— |
55
Table of Contents
FUND MANAGEMENT TABLES (UNAUDITED)
Information pertaining to the Trustees and officers of the Trust as of September 30, 2015, is set forth below. The statement of additional information (SAI) includes additional information about the Trustees and is available without charge, upon request, by calling (800) 243-1574. The address of each individual, unless otherwise noted, is 100 Pearl Street, Hartford, CT 06103-4506. There is no stated term of office for Trustees of the Trust.
Independent Trustees
| Name, Year of Birth, Year Elected and Number of Funds Overseen | Principal Occupation(s) Other Directorships Held by Trustee | |
McClellan, Hassell H. YOB: 1945 Elected: 2015 55 Portfolios | Retired. Professor (1984 to 2013), Wallace E. Carroll School of Management, Boston College; Trustee, Virtus Variable Insurance Trust (9 portfolios) (since 2008); Trustee (since 2015), Virtus Mutual Fund Complex (46 portfolios); Trustee, John Hancock Fund Complex (since 2000), John Hancock Funds (collectively, 234 portfolios); and Director (since 2010), Barnes Group, Inc. (diversified global components manufacturer and logistical services company). | |
McLoughlin, Philip YOB: 1946 Elected: 2006 69 Portfolios | Director (since 1991) and Chairman (since 2010), World Trust Fund (closed-end investment firm in Luxembourg); Director (since 1995), closed-end funds managed by Duff & Phelps Investment Management Co. (4 portfolios); Chairman (since 2002) and Trustee (since 1989), Virtus Mutual Fund Complex (46 portfolios); Chairman and Trustee (since 2003), Virtus Variable Insurance Trust (9 portfolios); Trustee/Director and Chairman (since 2011), Virtus Closed-End Funds (3 portfolios); Trustee and Chairman (since 2013), Virtus Alternative Solutions Trust (7 portfolios); Partner (2006 to 2010), Cross Pond Partners, LLC (investment management consultant); and Managing Director (2008 to 2010), SeaCap Partners, LLC (investment management). | |
McNamara, Geraldine M. YOB: 1951 Elected: 2006 59 Funds | Retired. Trustee (since 2001), Virtus Mutual Fund Complex (46 portfolios); and Director (since 2003), closed-end funds managed by Duff & Phelps Investment Management Co. (4 portfolios); and Trustee (since 2015), Virtus Variable Insurance Trust (9 portfolios) | |
Oates, James M. YOB: 1946 Elected: 2006 56 Funds | Managing Director (since 1994), Wydown Group (consulting firm). Trustee (since 1987), Virtus Mutual Fund Complex (46 portfolios); Director (since 1996), Stifel Financial; Director (1998 to 2014), Connecticut River Bancorp; Chairman and Director (1999 to 2014), Connecticut River Bank; Chairman (since 2000), Emerson Investment Management, Inc.; Director (2002 to 2014), New Hampshire Trust Company; Chairman and Trustee (since 2005), John Hancock Fund Complex (228 portfolios); Non-Executive Chairman (2007 to 2011), Hudson Castle Group, Inc. (formerly IBEX Capital Markets, Inc.) (financial services); Trustee/Director (since 2013), Virtus Closed-End Funds (3 portfolios); and Trustee (since 2013), Virtus Alternative Solutions Trust (7 portfolios). | |
Segerson, Richard E. YOB: 1948 Elected: 2006 46 Funds | Trustee (since 1983), Virtus Mutual Fund Complex (46 portfolios); and Managing Director (1998 to 2013), Northway Management Company. | |
Verdonck, Ferdinand L.J. YOB: 1942 Elected: 2006 46 Funds | Trustee (since 2002), Virtus Mutual Fund Complex (46 portfolios). |
56
Table of Contents
FUND MANAGEMENT TABLES (UNAUDITED) (Continued)
Interested Trustee
The individual listed below is an “interested person” of the Trust, as defined in Section 2(a)(19) of the 1940 Act, as amended, and the rules and regulations thereunder.
| Name, Year of Birth, Year Elected and Number of Funds Overseen | Principal Occupation(s) During Past 5 Years and | |
Aylward, George R.* Trustee and President YOB: 1964 Elected: 2006 67 Funds | Director, President and Chief Executive Officer (since 2008), Virtus Investment Partners, Inc. and/or certain of its subsidiaries; various senior officer positions with Virtus affiliates (since 2005); Trustee (since 2006), Virtus Mutual Funds (46 portfolios); Chairman, President and Chief Executive Officer (since 2006), The Zweig Closed-End Funds (2 portfolios); Trustee (since 2012) and President (since 2010), Virtus Variable Insurance Trust (9 portfolios); Trustee and President (since 2011), Virtus Closed-End Funds (3 portfolios); Director (since 2013), Virtus Global Funds, PLC (2 portfolios); and Trustee (since 2013), Virtus Alternative Solutions Trust (7 portfolios). |
57
Table of Contents
FUND MANAGEMENT TABLES (UNAUDITED) (Continued)
Officers of the Trust Who Are Not Trustees
| Name, Address and Year of Birth | Position(s) Held with Trust and Length of Time Served | Principal Occupation(s) During Past 5 Years | ||
Waltman, Francis G. YOB: 1962 | Executive Vice President (since 2013); Senior Vice President (2008-2013). | Virtus Investment Partners, Inc. and/or certain of its subsidiaries; various senior officer positions (since 2006) with Virtus affiliates; Executive Vice President (since 2013), Senior Vice President (2008 to 2013), Virtus Mutual Fund Complex; Executive Vice President (since 2013), Senior Vice President (2010 to 2013), Virtus Variable Insurance Trust; Executive Vice President (since 2013), Senior Vice President (2011 to 2013), Virtus Closed-End Funds; Director (since 2013), Virtus Global Funds PLC; and Executive Vice President (since 2013), Virtus Alternative Solutions Trust. | ||
Bradley, W. Patrick YOB: 1972 | Senior Vice President (since 2013); Vice President (2011 to 2013); Chief Financial Officer and Treasurer (since 2006). | Senior Vice President, Fund Services (since 2010), Virtus Investment Partners, Inc. and/or certain of its subsidiaries; various officer positions (since 2006) with Virtus affiliates; Senior Vice President (since 2013), Vice President (2011 to 2013), Chief Financial Officer and Treasurer (since 2004), Virtus Variable Insurance Trust; Senior Vice President (since 2013), Vice President (2011 to 2013), Chief Financial Officer and Treasurer (since 2006), Virtus Mutual Fund Complex; Senior Vice President (since 2013), Vice President (2012 to 2013) and Treasurer (Chief Financial Officer) (since 2007), The Zweig Closed-End Funds; Senior Vice President (since 2013), Vice President (2011 to 2013), Chief Financial Officer and Treasurer (since 2011), Virtus Closed-End Funds; Vice President and Assistant Treasurer (since 2011), Duff & Phelps Global Utility Income Fund Inc.; Director (since 2013), Virtus Global Funds, PLC; and Senior Vice President, Chief Financial Officer and Treasurer (since 2013), Virtus Alternative Solutions Trust. |
58
Table of Contents
FUND MANAGEMENT TABLES (UNAUDITED) (Continued)
| Name, Address and Year of Birth | Position(s) Held with Trust and Length of Time Served | Principal Occupation(s) During Past 5 Years | ||
Carr, Kevin J. YOB: 1954 | Senior Vice President, since 2013; Vice President (2005-2013); Chief Legal Officer, Counsel and Secretary (since 2005). | Senior Vice President (since 2009), Vice President, Counsel and Secretary (2008 to 2009), Virtus Investment Partners, Inc. and/or certain of its subsidiaries; various senior officer positions (since 2005) with Virtus affiliates; Senior Vice President (since 2013), Vice President (2005 to 2013), Chief Legal Officer, Counsel and Secretary (since 2005), Virtus Mutual Fund Complex; Senior Vice President (2013 to 2014), Vice President (2012 to 2013) and Assistant Secretary (since 2012), Secretary and Chief Legal Officer (2005 to 2012), The Zweig Closed-End Funds; Assistant Secretary (since 2013), Vice President, Chief Legal Officer, Counsel and Secretary (2010 to 2013), Virtus Variable Insurance Trust; Vice President and Assistant Secretary (since 2011), Duff & Phelps Global Utility Income Fund Inc.; Senior Vice President and Assistant Secretary (2013 to 2014), Vice President and Assistant Secretary (2012 to 2013), Vice President, Chief Legal Officer, Counsel and Secretary (2011 to 2012), Virtus Closed-End Funds; and Assistant Secretary (since 2013), Virtus Alternative Solutions Trust. | ||
Engberg, Nancy J. YOB: 1956 | Vice President and Chief Compliance Officer since 2011. | Vice President (since 2008) and Chief Compliance Officer (2008 to 2011), Virtus Investment Partners, Inc. and/or certain of its subsidiaries; various officer positions (since 2003) with Virtus affiliates; Vice President and Chief Compliance Officer (since 2011), Virtus Mutual Fund Complex; Vice President (since 2010), Chief Compliance Officer (since 2011), Virtus Variable Insurance Trust; Vice President and Chief Compliance Officer (since 2011), Virtus Closed-End Funds; Vice President and Chief Compliance Officer (since 2012), The Zweig Closed-End Funds; and Vice President and Chief Compliance Officer (since 2013), Virtus Alternative Solutions Trust. |
59
Table of Contents
Virtus Multi-Sector Short Term Bond Fund,
a series of Virtus Opportunities Trust
Supplement dated September 1, 2015 to the Summary Prospectuses
and the Virtus Opportunities Trust Statutory Prospectus,
each dated January 28, 2015, as supplemented.
IMPORTANT NOTICE TO INVESTORS
The first paragraph and the information in the first table in the section “More Information About Fund Expenses” on page 139 of the statutory prospectus are hereby revised with the following information for the above referenced fund:
Virtus Investment Advisers, Inc. (“VIA”) has contractually agreed to limit the total operating expenses (excluding dividend and interest expenses, taxes, brokerage commissions, leverage expenses, extraordinary expenses and acquired fund fees and expenses, if any) of certain of the funds so that expenses do not exceed, on an annualized basis, the amounts indicated in the following table.
| Class A Shares | Class B Shares | Class C Shares | Class I Shares | Class R6 Shares | Class T Shares | Through Date | ||||||||||||||||||||||
Virtus Multi-Sector Short Term Bond Fund(1) | 1.10 | % | 1.60 | % | 1.35 | % | 0.85 | % | N/A | 1.85 | % | January 31, 2017 | ||||||||||||||||
| (1) | Fund expenses currently below the capped level. |
Investors should retain this supplement with the Prospectuses for future reference.
VOT 8020/MSSTBNewExpCap&Waiver (09/15)
Table of Contents
VIRTUS OPPORTUNITIES TRUST
101 Munson Street
Greenfield, MA 01301-9668
Trustees
George R. Aylward
Hassell H. McClellan
Philip R. McLoughlin, Chairman
Geraldine M. McNamara
James M. Oates
Richard E. Segerson
Ferdinand L.J. Verdonck
Officers
George R. Aylward, President
Francis G. Waltman, Executive Vice President
W. Patrick Bradley, Senior Vice President, Chief Financial Officer and Treasurer
Kevin J. Carr, Senior Vice President, Chief Legal Officer, Counsel and Secretary
Nancy J. Engberg, Vice President and Chief Compliance Officer
Investment Adviser
Virtus Investment Advisers, Inc.
100 Pearl Street
Hartford, CT 06103-4506
Principal Underwriter
VP Distributors, LLC
100 Pearl Street
Hartford, CT 06103-4506
Administrator and Transfer Agent
Virtus Fund Services, LLC
100 Pearl Street
Hartford, CT 06103-4506
Custodian
JPMorgan Chase Bank, NA
1 Chase Manhattan Plaza
New York, NY 10005-1401
Independent Registered Public
Accounting Firm
PricewaterhouseCoopers LLP
2001 Market Street
Philadelphia, PA 19103-7042
How to Contact Us
Mutual Fund Services | 1-800-243-1574 | |||
Adviser Consulting Group | 1-800-243-4361 | |||
Web site | Virtus.com |
Important Notice to Shareholders
The Securities and Exchange Commission has modified mailing regulations for semiannual and annual shareholder fund reports to allow mutual fund companies to send a single copy of these reports to shareholders who share the same mailing address. If you would like additional copies, please call Mutual Fund Services at 1-800-243-1574.
Table of Contents
For more information about
Virtus Mutual Funds, please call
your financial representative, or
contact us at 1-800-243-1574
or Virtus.com
| 8010 | 11-15 |

Table of Contents

ANNUAL REPORT
Virtus Emerging Markets Debt Fund*
Virtus Emerging Markets Equity Income Fund*
Virtus Emerging Markets Small-Cap Fund*
Virtus Global Infrastructure Fund
Virtus Global Opportunities Fund*
Virtus Global Real Estate Securities Fund*
Virtus Greater European Opportunities Fund*
Virtus International Equity Fund*
Virtus International Real Estate Securities Fund*
Virtus International Small-Cap Fund*
Virtus International Wealth Masters Fund
September 30, 2015 TRUST NAME: VIRTUS OPPORTUNITIES TRUST * Prospectus supplement applicable to these Funds appears at the back of this annual report. |
|

Not FDIC Insured
No Bank Guarantee
May Lose Value
Table of Contents
Proxy Voting Procedures and Voting Record (Form N-PX)
The subadvisers vote proxies relating to portfolio securities in accordance with procedures that have been approved by the Board of Trustees of the Trust (“Trustees,” or the “Board”). You may obtain a description of these procedures, along with information regarding how the Funds voted proxies during the most recent 12-month period ended June 30, free of charge, by calling toll-free 1-800-243-1574. This information is also available through the Securities and Exchange Commission’s (the “SEC”) website at http://www.sec.gov.
Form N-Q Information
The Trust files a complete schedule of portfolio holdings for each Fund with the SEC for the first and third quarters of each fiscal year on Form N-Q. Form N-Q is available on the SEC’s website at http://www.sec.gov. Form N-Q may be reviewed and copied at the SEC’s Public Reference Room. Information on the operation of the SEC’s Public Reference Room can be obtained by calling toll-free 1-800-SEC-0330.
This report is not authorized for distribution to prospective investors in the Funds presented in this book unless preceded or accompanied by an effective prospectus which includes information concerning the sales charge, each Fund’s record and other pertinent information.
Table of Contents
To My Fellow Shareholders of Virtus Mutual Funds:
 | I am pleased to present this annual report that reviews the performance of your fund for the twelve months ended September 30, 2015.
During this period, global equity markets were challenged by falling oil prices, China’s economic slowdown, Greece’s debt crisis, and the growing likelihood of an interest rate hike by the Federal Reserve (the “Fed”). Volatility took its toll on major U.S. equity indices for the twelve months ended September 30, 2015. The large-cap S&P 500® Index and Dow Jones Industrial AverageSM moderately declined 0.61% and 2.11%, respectively, while the technology-heavy NASDAQ Composite Index® gained 4.00%. By | |||
comparison, international equities were down even further, with emerging markets hit particularly hard.
Against this backdrop, U.S. Treasuries remained an attractive “safe haven” among global investors. The bellwether 10-year U.S. Treasury yield declined from 2.52% at September 30, 2014 to 2.06% at September 30, 2015. Fixed income assets experienced slight losses in anticipation of the Fed’s stated intention to raise interest rates at the end of 2015. The Barclays U.S. Aggregate Bond Index, which tracks Treasuries and other investment-grade debt securities, gained 2.94% for the twelve-month period ended September 30, 2015, while non-investment grade bonds underperformed, with the Barclays U.S. Corporate High Yield Bond Index down 3.43% for the same period.
The strength of the global economy is likely to remain a concern for the markets in the months ahead. Actions by the Fed and other global central banks will be watched with great interest. Following the weak start to the year, the U.S. economy exhibited growth over the second and third quarters of 2015 – including stronger jobs, housing, and consumer spending data – and gives investors reason for optimism. Future market direction will be determined largely by the ability of corporations to continue to produce robust earnings.
Market uncertainty serves as a constant reminder of the importance of portfolio diversification, including exposure to both traditional and alternative asset classes. While diversification cannot guarantee a profit or prevent a loss, owning a variety of asset classes may provide a cushion against inevitable market fluctuations. Your financial advisor can help you ensure that your portfolio is adequately diversified across asset classes and investment strategies.
As always, thank you for entrusting Virtus with your assets. Should you have questions about your account or require assistance, please visit our website at www.Virtus.com, or call our customer service team at 1-800-243-1574. We appreciate your business and remain committed to your long-term financial success.
Sincerely,
George R. Aylward President, Virtus Mutual Funds
October 2015 | ||||

Performance data quoted represents past results. Past performance is no guarantee of future results, and current performance may be higher or lower than the performance shown above.
1
Table of Contents
VIRTUS OPPORTUNITIES TRUST
Disclosure of Fund Expenses (Unaudited)
For the six-month period of April 1, 2015 to September 30, 2015
We believe it is important for you to understand the impact of costs on your investment. All mutual funds have operating expenses. As a shareholder of a Virtus Opportunities Trust Fund (each, a “Fund”), you may incur two types of costs: (1) transaction costs, including sales charges on purchases of Class A shares and contingent deferred sales charges on Class B and Class C shares; and (2) ongoing costs, including investment advisory fees, distribution and service fees, and other expenses. Class I shares and Class R6 shares are sold without sales charges and do not incur distribution and service fees. For further information regarding applicable sales charges, see Note 1 in the Notes to Financial Statements. These examples are intended to help you understand your ongoing costs (in dollars) of investing in a Fund and to compare these costs with the ongoing costs of investing in other mutual funds. These examples are based on an investment of $1,000 invested at the beginning of the period and held for the entire six-month period. The following Expense Table illustrates your Fund’s costs in two ways.
Actual Expenses
The first section of the accompanying table provides information about actual account values and actual expenses. You may use the information in this section, together with the amount you invested, to estimate the expenses that you paid over the period. Simply divide your account value by $1,000 (for example, an $8,600 account value divided by $1,000 = 8.6), then multiply the result by the number in the first section under the heading “Expenses Paid During Period” to estimate the expenses you paid on your account during the period.
Hypothetical Example for Comparison Purposes
The second section of the accompanying table provides information about hypothetical account values and hypothetical expenses based on the Fund’s actual expense ratio and an assumed rate of return of 5% per year before expenses, which is not your Fund’s actual return. The hypothetical account values and expenses may not be used to estimate the actual ending account balance or expenses you paid for the period. You may use this information to compare the ongoing costs of investing in your Fund and other funds. To do so, compare these 5% hypothetical examples with the 5% hypothetical examples that appear in the shareholder reports of the other funds.
Please note that the expenses shown in the accompanying table are meant to highlight your ongoing costs only and do not reflect any transactional costs, such as sales charges or contingent deferred sales charges. Therefore, the second section of the accompanying table is useful in comparing ongoing costs only, and will not help you determine the relative total costs of owning different funds. In addition, if these transactional costs were included, your costs would have been higher. The calculations assume no shares were bought or sold during the period. Your actual costs may have been higher or lower, depending on the amount of your investment and the timing of any purchases or redemptions.
| Expense Table | ||||||||||||||||
| Beginning Account Value April 1, 2015 | Ending Account Value September 30, 2015 | Annualized Expense Ratio | Expenses Paid During Period* | |||||||||||||
Emerging Markets Debt Fund |
| |||||||||||||||
Actual |
| |||||||||||||||
Class A | $ | 1,000.00 | $ | 963.50 | 1.35 | % | $ | 6.64 | ||||||||
Class C | 1,000.00 | 959.80 | 2.10 | 10.32 | ||||||||||||
Class I | 1,000.00 | 964.70 | 1.10 | 5.42 | ||||||||||||
Hypothetical (5% return before expenses) |
| |||||||||||||||
Class A | 1,000.00 | 1,018.22 | 1.35 | 6.85 | ||||||||||||
Class C | 1,000.00 | 1,014.41 | 2.10 | 10.66 | ||||||||||||
Class I | 1,000.00 | 1,019.48 | 1.10 | 5.58 | ||||||||||||
Emerging Markets Equity Income Fund |
| |||||||||||||||
Actual |
| |||||||||||||||
Class A | $ | 1,000.00 | $ | 842.60 | 1.75 | % | $ | 8.08 | ||||||||
Class C | 1,000.00 | 839.10 | 2.50 | 11.53 | ||||||||||||
Class I | 1,000.00 | 843.10 | 1.50 | 6.93 | ||||||||||||
Hypothetical (5% return before expenses) |
| |||||||||||||||
Class A | 1,000.00 | 1,016.18 | 1.75 | 8.88 | ||||||||||||
Class C | 1,000.00 | 1,012.38 | 2.50 | 12.69 | ||||||||||||
Class I | 1,000.00 | 1,017.45 | 1.50 | 7.61 | ||||||||||||
Emerging Markets Small-Cap Fund |
| |||||||||||||||
Actual |
| |||||||||||||||
Class A | $ | 1,000.00 | $ | 827.20 | 1.85 | % | $ | 8.47 | ||||||||
Class C | 1,000.00 | 825.40 | 2.60 | 11.90 | ||||||||||||
Class I | 1,000.00 | 828.60 | 1.60 | 7.33 | ||||||||||||
Hypothetical (5% return before expenses) |
| |||||||||||||||
Class A | 1,000.00 | 1,015.68 | 1.85 | 9.39 | ||||||||||||
Class C | 1,000.00 | 1,011.87 | 2.60 | 13.20 | ||||||||||||
Class I | 1,000.00 | 1,016.95 | 1.60 | 8.12 | ||||||||||||
Global Infrastructure Fund |
| |||||||||||||||
Actual |
| |||||||||||||||
Class A | $ | 1,000.00 | $ | 920.00 | 1.23 | % | $ | 5.92 | ||||||||
Class C | 1,000.00 | 916.80 | 1.98 | 9.51 | ||||||||||||
Class I | 1,000.00 | 921.30 | 0.98 | 4.72 | ||||||||||||
Hypothetical (5% return before expenses) |
| |||||||||||||||
Class A | 1,000.00 | 1,018.82 | 1.23 | 6.24 | ||||||||||||
Class C | 1,000.00 | 1,015.02 | 1.98 | 10.05 | ||||||||||||
Class I | 1,000.00 | 1,020.09 | 0.98 | 4.98 | ||||||||||||
Global Opportunities Fund |
| |||||||||||||||
Actual |
| |||||||||||||||
Class A | $ | 1,000.00 | $ | 973.90 | 1.46 | % | $ | 7.22 | ||||||||
Class B | 1,000.00 | 969.60 | 2.21 | 10.91 | ||||||||||||
Class C | 1,000.00 | 970.30 | 2.22 | 10.97 | ||||||||||||
Class I | 1,000.00 | 975.50 | 1.21 | 5.99 | ||||||||||||
Hypothetical (5% return before expenses) |
| |||||||||||||||
Class A | 1,000.00 | 1,017.66 | 1.46 | 7.41 | ||||||||||||
Class B | 1,000.00 | 1,013.85 | 2.21 | 11.22 | ||||||||||||
Class C | 1,000.00 | 1,013.80 | 2.22 | 11.27 | ||||||||||||
Class I | 1,000.00 | 1,018.93 | 1.21 | 6.14 | ||||||||||||
Global Real Estate Securities Fund |
| |||||||||||||||
Actual |
| |||||||||||||||
Class A | $ | 1,000.00 | $ | 939.40 | 1.40 | % | $ | 6.81 | ||||||||
Class C | 1,000.00 | 935.60 | 2.15 | 10.43 | ||||||||||||
Class I | 1,000.00 | 940.40 | 1.15 | 5.59 | ||||||||||||
Hypothetical (5% return before expenses) |
| |||||||||||||||
Class A | 1,000.00 | 1,017.96 | 1.40 | 7.11 | ||||||||||||
Class C | 1,000.00 | 1,014.15 | 2.15 | 10.91 | ||||||||||||
Class I | 1,000.00 | 1,019.23 | 1.15 | 5.84 | ||||||||||||
2
Table of Contents
VIRTUS OPPORTUNITIES TRUST
Disclosure of Fund Expenses (Unaudited) (Continued)
For the six-month period of April 1, 2015 to September 30, 2015
| Expense Table | ||||||||||||||||
| Beginning Account Value April 1, 2015 | Ending Account Value September 30, 2015 | Annualized Expense Ratio | Expenses Paid During Period* | |||||||||||||
Greater European Opportunities Fund |
| |||||||||||||||
Actual |
| |||||||||||||||
Class A | $ | 1,000.00 | $ | 994.10 | 1.45 | % | $ | 7.25 | ||||||||
Class C | 1,000.00 | 990.10 | 2.20 | 10.98 | ||||||||||||
Class I | 1,000.00 | 995.40 | 1.20 | 6.00 | ||||||||||||
Hypothetical (5% return before expenses) |
| |||||||||||||||
Class A | 1,000.00 | 1,017.71 | 1.45 | 7.36 | ||||||||||||
Class C | 1,000.00 | 1,013.90 | 2.20 | 11.17 | ||||||||||||
Class I | 1,000.00 | 1,018.98 | 1.20 | 6.09 | ||||||||||||
International Equity Fund |
| |||||||||||||||
Actual |
| |||||||||||||||
Class A | $ | 1,000.00 | $ | 904.90 | 1.50 | % | $ | 7.16 | ||||||||
Class C | 1,000.00 | 901.40 | 2.25 | 10.72 | ||||||||||||
Class I | 1,000.00 | 906.40 | 1.25 | 5.97 | ||||||||||||
Hypothetical (5% return before expenses) |
| |||||||||||||||
Class A | 1,000.00 | 1,017.45 | 1.50 | 7.61 | ||||||||||||
Class C | 1,000.00 | 1,013.65 | 2.25 | 11.42 | ||||||||||||
Class I | 1,000.00 | 1,018.72 | 1.25 | 6.35 | ||||||||||||
International Real Estate Securities Fund |
| |||||||||||||||
Actual |
| |||||||||||||||
Class A | $ | 1,000.00 | $ | 956.70 | 1.50 | % | $ | 7.36 | ||||||||
Class C | 1,000.00 | 952.30 | 2.25 | 11.01 | ||||||||||||
Class I | 1,000.00 | 958.20 | 1.25 | 6.14 | ||||||||||||
Hypothetical (5% return before expenses) |
| |||||||||||||||
Class A | 1,000.00 | 1,017.45 | 1.50 | 7.61 | ||||||||||||
Class C | 1,000.00 | 1,013.65 | 2.25 | 11.42 | ||||||||||||
Class I | 1,000.00 | 1,018.72 | 1.25 | 6.35 | ||||||||||||
International Small-Cap Fund |
| |||||||||||||||
Actual |
| |||||||||||||||
Class A | $ | 1,000.00 | $ | 886.40 | 1.60 | % | $ | 7.57 | ||||||||
Class C | 1,000.00 | 883.00 | 2.35 | 11.09 | ||||||||||||
Class I | 1,000.00 | 888.30 | 1.35 | 6.39 | ||||||||||||
Class R6 | 1,000.00 | 888.30 | 1.25 | 5.92 | ||||||||||||
Hypothetical (5% return before expenses) |
| |||||||||||||||
Class A | 1,000.00 | 1,016.95 | 1.60 | 8.12 | ||||||||||||
Class C | 1,000.00 | 1,013.14 | 2.35 | 11.93 | ||||||||||||
Class I | 1,000.00 | 1,018.22 | 1.35 | 6.85 | ||||||||||||
Class R6 | 1,000.00 | 1,018.72 | 1.25 | 6.35 | ||||||||||||
International Wealth Masters Fund |
| |||||||||||||||
Actual | ||||||||||||||||
Class A | $ | 1,000.00 | $ | 926.10 | 1.55 | % | $ | 7.48 | ||||||||
Class C | 1,000.00 | 922.00 | 2.30 | 11.08 | ||||||||||||
Class I | 1,000.00 | 927.10 | 1.30 | 6.28 | ||||||||||||
Hypothetical (5% return before expenses) |
| |||||||||||||||
Class A | 1,000.00 | 1,017.20 | 1.55 | 7.87 | ||||||||||||
Class C | 1,000.00 | 1,013.39 | 2.30 | 11.68 | ||||||||||||
Class I | 1,000.00 | 1,018.47 | 1.30 | 6.60 | ||||||||||||
| * | Expenses are equal to the relevant Fund’s annualized expense ratio, which is net of waived fees and reimbursed expenses, if applicable, multiplied by the average account value over the period, multiplied by the number of days (183) expenses were accrued in the most recent fiscal half-year, then divided by 365 to reflect the one-half year period. |
For Funds which may invest in other funds, the annualized expense ratios noted above do not reflect fees and expenses associated with the underlying funds. If such fees and expenses had been included, the expenses would have been higher.
You can find more information about the Funds’ expenses in the Financial Statements section that follows. For additional information on operating expenses and other shareholder costs, refer to the prospectus.
3
Table of Contents
American Depositary Receipt (ADR)
Represents shares of foreign companies traded in U.S. dollars on U.S. exchanges that are held by a U.S. bank or a trust. Foreign companies use ADRs in order to make it easier for Americans to buy their shares.
Barclays U.S. Aggregate Bond Index
The Barclays U.S. Aggregate Bond Index measures the U.S. investment-grade fixed-rate bond market. The index is calculated on a total return basis. The index is unmanaged, its returns do not reflect any fees, expenses, or sales charges, and it is not available for direct investment.
Barclays U.S. Corporate High Yield Bond Index
The Barclays U.S. Corporate High Yield Bond Index measures the U.S. dollar-denominated, high yield, fixed-rate corporate bond market. The index is calculated on a total return basis. The index is unmanaged, its returns do not reflect any fees, expenses, or sales charges, and it is not available for direct investment.
Dow Jones Industrial AverageSM
A price weighted average of 30 blue chip stocks. The index is calculated on total return basis with dividends reinvested. The index is unmanaged, its returns do not reflect any fees, expenses, or sales charges, and it is not available for direct investment.
Exchange-Traded Funds (ETF)
An open-end fund that is traded on a stock exchange. Most ETFs have a portfolio of stocks or bonds that track a specific market index.
European Central Bank (“ECB”)
The European Central Bank (ECB) is responsible for conducting monetary policy for the euro area. The ECB was established as the core of the Eurosystem and the European System of Central Banks (ESCB). The ESCB comprises the ECB and the National Central Banks (NCBs) of all 17 EU Member States whether they have adopted the Euro or not.
Federal Reserve (the “Fed”)
The Central Bank of the United States, responsible for controlling the money supply, interest rates and credit with the goal of keeping the U.S. economy and currency stable. Governed by a seven-member board, the system includes 12 regional Federal Reserve Banks, 25 branches and all national and state banks that are part of the system.
FTSE EPRA/NAREIT Developed Rental ex U.S. Index (net)
The FTSE EPRA/NAREIT Developed Rental ex U.S. Index (net) is a free-float market capitalization-weighted index measuring international real estate securities, which meet minimum size, liquidity and investment focus criteria. The index is a sub-set of the FTSE EPRA/NAREIT Investment Focus Index Series, which separates the existing constituents into both Rental and Non-Rental Indices. A company is classified as Rental if the rental revenue from properties is greater than or equal to 70% of total revenue. The classification is based on revenue sources as disclosed in the latest published financial statement. The index is calculated on a total return basis with net dividends reinvested. The index is unmanaged, its returns do not reflect any fees, expenses, or sales charges, and it is not available for direct investment.
FTSE EPRA/NAREIT Developed Rental Index (net)
The FTSE EPRA/NAREIT Developed Rental Index (net) is a free-float market capitalization-weighted index measuring global real estate securities, which meet minimum size, liquidity and investment focus criteria. The index is a sub-set of the FTSE EPRA/NAREIT Investment Focus Index Series, which separates the existing constituents into both Rental and Non-Rental Indices. A company is classified as Rental if the rental revenue from properties is greater than or equal to 70% of total revenue. The classification is based on revenue sources as disclosed in the latest published financial statement. The index is calculated on a total return basis with net dividends reinvested. The index is unmanaged, its returns do not reflect any fees, expenses, or sales charges, and it is not available for direct investment.
Global Infrastructure Linked Benchmark
The Global Infrastructure Linked Benchmark consists of the MSCI World Infrastructure Sector Capped Index, a market capitalization weighted index that measures performance of global infrastructure companies by capturing broad and diversified opportunities across telecommunication, utilities, energy, transportation and social infrastructure sectors. The
4
Table of Contents
KEY INVESTMENT TERMS (Continued)
telecommunication infrastructure and utilities sector each represent one-third of the index weight, while energy, transportation and social infrastructure sectors have a combined weight of the remaining one-third of the index. The index is calculated on a total return basis with net dividends reinvested. The index is unmanaged, its returns do not reflect any fees, expenses, or sales charges, and it is not available for direct investment. Performance of the Global Infrastructure Linked Benchmark prior to 9/1/2008 represents an allocation consisting of 65% MSCI USA/Utilities Index, 20% MSCI World Telecom Services Index, and 15% MSCI World ex USA/Utilities Index.
Horizon Kinetics ISE Wealth Index (RCH)
Is a public index published by International Securities Exchange, LLC. The index is composed of companies with wealthy individuals in positions of influence or control who have a substantial amount of their personal wealth invested in the business. The index is unmanaged, its returns do not reflect any fees, expenses, or sales charges, and it is not available for direct investment.
JPMorgan Corporate Emerging Markets Bond Index (CEMBI)
The JPMorgan Corporate Emerging Markets Bond Index (CEMBI) is a global, liquid corporate emerging markets benchmark that tracks U.S. dollar-denominated corporate bonds issued by emerging markets entities.
JPMorgan Emerging Markets Bond Index Global Diversified (EMBI Global Diversified)
The JPMorgan Emerging Markets Bond Global Diversified Index (EMBI Global Diversified) is a uniquely-weighted version of the JPMorgan EMBI Global Index. The index limits the weights of those countries with larger debt stock by only including specified portions of these countries’ eligible current face amounts of debt outstanding. The countries covered in the EMBI Global Diversified Index are identical to those covered by the EMBI Global Index. The EMBI Global Index tracks total returns for U.S. dollar-denominated debt instruments issued by emerging market sovereign and quasi-sovereign entities: Brady bonds, loans, Eurobonds. The index is unmanaged, its returns do not reflect any fees, expenses, or sales charges, and it is not available for direct investment.
JPMorgan Government Bond Index-Emerging Markets (GBI-EM)
The GBI-EM is the first comprehensive, global local emerging markets index, and consists of regularly traded, liquid fixed rate, domestic currency government bonds. The index is unmanaged, its returns do not reflect any fees, expenses, or sales charges, and it is not available for direct investment.
MSCI All Country World ex U.S. Small Cap Index (net)
The MSCI All Country World Index ex U.S. Small Cap Index (net) is a free float-adjusted market capitalization-weighted index that measures small cap equity performance of developed and emerging markets, excluding the U.S. The index is calculated on a total return basis with net dividends reinvested. The index is unmanaged, its returns do not reflect any fees, expenses, or sales charges, and it is not available for direct investment.
MSCI All Country World Index (net)
The MSCI All Country World Index (net) is a free float-adjusted market capitalization-weighted index that measures equity performance of developed and emerging markets. The index is calculated on a total return basis with net dividends reinvested. The index is unmanaged, its returns do not reflect any fees, expenses, or sales charges, and it is not available for direct investment.
MSCI EAFE® Index (net)
The MSCI EAFE® (Europe, Australasia, Far East) Index (net) is a free float-adjusted market capitalization-weighted index that measures developed foreign market equity performance, excluding the U.S. and Canada. The index is calculated on a total return basis with net dividends reinvested. The index is unmanaged, its returns do not reflect any fees, expenses, or sales charges, and it is not available for direct investment.
MSCI Emerging Markets Index (net)
The MSCI Emerging Markets Index (net) is a free float-adjusted market capitalization-weighted index designed to measure equity market performance in the global emerging markets. The index is calculated on a total return basis with net dividends reinvested. The index is unmanaged, its returns do not reflect any fees, expenses, or sales charges, and it is not available for direct investment.
5
Table of Contents
KEY INVESTMENT TERMS (Continued)
MSCI Emerging Markets Small Cap Index (net)
The MSCI Emerging Markets Small Cap Index (net) is a free float-adjusted market capitalization-weighted index designed to measure small cap equity market performance in the global emerging markets. The index is calculated on a total return basis with net dividends reinvested. The index is unmanaged, its returns do not reflect any fees, expenses, or sales charges, and it is not available for direct investment.
MSCI Europe Index (net)
The MSCI Europe Index (net) is a free float-adjusted market capitalization weighted index that measures equity market performance of the developed markets in Europe. The index is calculated on a total return basis with net dividends reinvested. The index is unmanaged, its returns do not reflect any fees, expenses, or sales charges, and it is not available for direct investment.
MSCI World Index (net)
The MSCI World Index (net) is a free float-adjusted market capitalization-weighted index that measures developed global market equity performance. The index is calculated on a total return basis with net dividends reinvested. The index is unmanaged, its returns do not reflect any fees, expenses, or sales charges, and it is not available for direct investment.
NASDAQ Composite Index®
A market-capitalization weighted index of the more than 3,000 common equities listed on the Nasdaq stock exchange. Unlike other market indexes, the NASDAQ composite is not limited to companies that have U.S. headquarters. The index is unmanaged, its returns do not reflect any fees, expenses, or sales charges, and it is not available for direct investment.
Organization of the Petroleum Exporting Countries (OPEC)
The Organization of the Petroleum Exporting Countries was originally organized in September 1960 with 5 member countries and there are currently 12 member countries. The organization’s objective is to co-ordinate and unify petroleum policies among member countries, in order to secure fair and stable prices for petroleum producers; an efficient, economic and regular supply of petroleum to consuming nations; and a fair return on capital to those investing in the industry.
Payment-in-Kind Security (PIK)
A bond which pays interest in the form of additional bonds, or preferred stock which pays dividends in the form of additional preferred stock.
Quantitative Easing (QE)
A government monetary policy occasionally used to increase the money supply by buying government securities or other securities from the market. Quantitative easing increases the money supply by flooding financial institutions with capital in an effort to promote increased lending and liquidity.
Real Estate Investment Trust (REIT)
A publicly traded company that owns, develops and operates income-producing real estate such as apartments, office buildings, hotels, shopping centers and other commercial properties.
S&P 500® Index
The S&P 500® Index is a free-float market capitalization-weighted index of 500 of the largest U.S. companies. The index is calculated on a total return basis with dividends reinvested. The index is unmanaged, its returns do not reflect any fees, expenses, or sales charges, and it is not available for direct investment.
Sponsored ADR (American Depositary Receipt)
An ADR which is issued with the cooperation of the company whose stock will underlie the ADR. Sponsored ADRs generally carry the same rights normally given to stockholders, such as voting rights. ADRs must be sponsored to be able to trade on a major U.S. exchange such as the New York Stock Exchange (“NYSE”).
6
Table of Contents
Fund Summary | Ticker Symbols: Class A: VEDAX Class C: VEDCX Class I: VIEDX |
Portfolio Manager Commentary by Newfleet Asset Management, LLC
| ¢ | The Fund is non-diversified and has an investment objective of total return from current income and capital appreciation. |
| ¢ | For the fiscal year ended September 30, 2015, the Fund’s Class A shares at NAV returned -7.85%, Class C shares returned -8.44%, and Class I shares returned -7.52%. For the same period, the Barclays U.S. Aggregate Bond Index, a broad-based fixed income index, returned 2.94%, and the JPMorgan Emerging Markets Bond Global Diversified Index, the Fund’s style-specific benchmark appropriate for comparison, returned -0.62%. |
All performance figures assume reinvestment of distributions and exclude the effect of sales charges. Past performance is no guarantee of future results, and current performance may be higher or lower than the performance shown above.
How did the markets perform during the Fund’s fiscal year?
Emerging market (EM) dollar-denominated debt returns lagged U.S. investment grade and Treasury sectors while outperforming the U.S. high yield corporate sector during the fiscal year ended September 30, 2015. EM sovereign dollar-denominated debt, as represented by the J.P. Morgan EMBI Global Diversified Index (EMBI), returned -0.62% for the period. EM dollar-denominated corporate debt, as represented by the J.P. Morgan CEMBI Diversified Index (CEMBI), returned -0.51% for the period while local market returns as measured by the J.P. Morgan GBI-EM Diversified Index returned -18.17%.
EM debt market returns were negatively impacted by the deceleration in China economic growth and lower commodity prices. The slowdown in the Chinese economy has been focused on the manufacturing sector and resulted in a meaningful decline in trade activity which has impacted a host of emerging market economies. Meanwhile, the decline in commodity prices has largely reflected oversupply across a number of hard commodities including most importantly within the oil market. Pressure on oil prices intensified post the November 2014 OPEC meeting when the group determined it would maintain production levels. Subsequently, oil prices fell sharply
into mid-January 2015 before staging a modest recovery through June before once again falling toward multi-year low levels in September 2015.
The deterioration in Brazil’s credit quality during the period and a strong U.S. dollar also contributed to negative returns across the EM asset class. In Brazil, the corruption investigation surrounding Petrobras and elevated political turmoil led to rating downgrades to below investment grade at both Petrobras (by two agencies) and at the Brazil sovereign level (by one agency) as fundamentals deteriorated.
Within the JPMorgan Emerging Markets Bond Index Global Diversified (EMBI Global Diversified) sovereign universe, investment grade bonds outperformed led by the Asia and European regions including China and Russia. Meanwhile, high yield sovereign debt and commodity exporters underperformed led by Venezuela and Brazil. The JPMorgan Corporate Emerging Market Bond Index (CEMBI) universe experienced similar trends to the sovereign index with negative performance led by the Brazil corporate sector and the commodity sectors and partially offset by Asia and Europe regions. EM technical factors moderated during the period with more modest supply somewhat offset by a decline in inflows to the sector.
What factors affected the Fund’s performance during its fiscal year?
The Fund’s overall return performance for the period lagged its style-specific benchmark. Country exposure to China, India, Hong Kong, Thailand, Peru, Poland, Romania, and Hungary and within the Middle East region contributed positively to the Fund’s relative performance. The move during the period to overweight high quality sovereign and corporate sectors also helped relative performance. While Russia country exposure was accretive to Fund returns, the decision to move to a modest underweight hurt relative performance versus the benchmark index during the period.
Exposure to commodity-related issuers, including a relative overweight in Venezuela, detracted from overall performance during the period with significant mark-to-market losses on a handful of oil and mining-related corporate issues. Exposure to the Brazil corporate sector, in particular to Petrobras and a drill rig operator, also detracted from the Fund’s
relative performance as did out-of-index local market non-dollar exposure. During the period, the Fund reduced its exposure to local markets, to Brazil issuers, and to commodity-linked issuers which contributed to improved relative performance in the last six months of the period.
The preceding information is the opinion of portfolio management. Any such opinions are subject to change at any time based upon market or other conditions and should not be relied upon as investment advice. Past performance is no guarantee of future results, and there is no guarantee that market forecasts will be realized.
There is no guarantee that the Fund will meet its objective.
| Asset Allocation | ||||||||
The following table presents asset allocations within certain sectors and as a percentage of total investments as of September 30, 2015.
|
| |||||||
Corporate Bonds and Notes | 70 | % | ||||||
Financials | 28 | % | ||||||
Energy | 16 | |||||||
Materials | 9 | |||||||
Industrials | 5 | |||||||
All other Corporate Bonds | 12 | |||||||
Foreign Government Securities | 27 | |||||||
Other (includes short-term investments) | 3 | |||||||
|
| |||||||
Total | 100 | % | ||||||
|
| |||||||
Credit & Interest: Debt securities are subject to various risks, the most prominent of which are credit and interest rate risk. The issuer of a debt security may fail to make interest and/or principal payments. Values of debt securities may rise or fall in response to changes in interest rates, and this risk may be enhanced with longer-term maturities.
Foreign & Emerging Markets: Investing internationally, especially in emerging markets, involves additional risks such as currency, political, accounting, economic, and market risk.
High Yield-High Risk Fixed Income Securities: There is a greater level of credit risk and price volatility involved with high yield securities than investment grade securities.
Prospectus: For additional information on risks, please see the Fund’s prospectus.
For information regarding the indexes and certain investment terms, see the Key Investment Terms starting on page 4.
7
Table of Contents
Emerging Markets Debt Fund (Continued)
| Average Annual Total Returns1 for periods ended 9/30/15 | ||||||||||||
| 1 year | Since Inception | Inception Date | ||||||||||
| Class A Shares at NAV2 | -7.85 | % | -0.52 | % | 9/5/12 | |||||||
| Class A Shares at POP3,4 | -11.30 | -1.75 | 9/5/12 | |||||||||
| Class C Shares at NAV2 and with CDSC4 | -8.44 | -1.24 | 9/5/12 | |||||||||
| Class I Shares at NAV | -7.52 | -0.27 | 9/5/12 | |||||||||
| Barclays U.S. Aggregate Bond Index | 2.94 | 1.74 | 5 | — | ||||||||
| JPMorgan Emerging Markets Bond Global Diversified Index | -0.62 | 1.84 | 5 | — | ||||||||
Fund Expense Ratios6: A Shares: Gross 1.52%, Net 1.35%; C Shares: Gross 2.27%, Net 2.10%; I Shares: Gross 1.27%, Net 1.10%.
All returns represent past performance which is no guarantee of future results. Current performance may be higher or lower than the performance shown. The investment return and principal value of an investment will fluctuate so that an investor’s shares, when redeemed, may be worth more or less than their original cost. The above table and graph below do not reflect the deduction of taxes that a shareholder would pay on fund distributions or the redemption of shares. Please visit Virtus.com for performance data current to the most recent month-end.
| 1 | Total returns are historical and include changes in share price and the reinvestment of both dividends and capital gains distributions. |
| 2 | “NAV” (Net Asset Value) total returns do not include the effect of any sales charge. |
| 3 | “POP” (Public Offering Price) total returns include the effect of the maximum front-end 3.75% sales charge. |
| 4 | “CDSC” (Contingent Deferred Sales Charge) is applied to redemptions of certain classes of shares that do not have a sales charge applied at the time of purchase. CDSC charges for certain redemptions of Class A shares made within 18 months of purchase in which a finder’s fee was paid and all redemptions of Class C shares within the first year are 1% and 0% thereafter. |
| 5 | The since inception index returns are from the Fund’s inception date. |
| 6 | The expense ratios of the Fund are set forth according to the prospectus for the Fund effective January 28, 2015, as supplemented and revised, and may differ from the expense ratios disclosed in the Financial Highlights tables in this report. See the Financial Highlights for more current expense ratios. Net Expense: Expenses reduced by the contractual fee waiver in effect through January 31, 2017. For the period of October 1, 2014, through August 31, 2015, the waiver was voluntary. Gross Expense: Does not reflect the effect of the fee waiver. |
Growth of $10,000 For periods ended 9/30
This chart assumes an initial investment of $10,000 made on September 5, 2012 (inception date of the Fund), for Class A, Class C, and Class I shares including any applicable sales charges or fees. Performance assumes reinvestment of dividends and capital gain distributions.
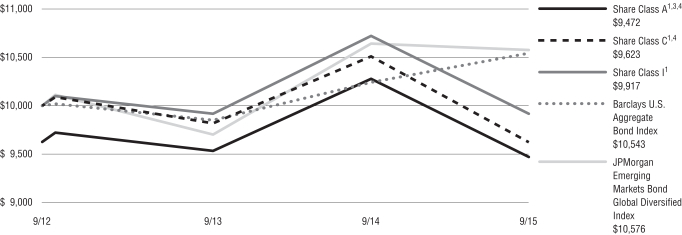
The indexes are unmanaged and not available for direct investment; therefore, their performance does not reflect the expenses associated with active management of an actual portfolio.
For information regarding the indexes and certain investment terms, see the Key Investment Terms starting on page 4.
8
Table of Contents
Emerging Markets Equity Income Fund
Fund Summary | Ticker Symbols: Class A: VEIAX Class C: VEICX Class I: VEIIX |
Portfolio Manager Commentary by Kleinwort Benson Investors, International, Ltd.
| ¢ | The Fund is diversified and has investment objectives of seeking capital appreciation and income. |
| ¢ | For the fiscal year ended September 30, 2015, the Fund’s Class A shares at NAV returned -19.13%, Class C shares returned -19.78%, and Class I shares returned -18.95%. For the same period, the S&P 500® Index, a broad-based equity index, returned -0.61%, and the MSCI Emerging Markets Index (net), the Fund’s style-specific benchmark appropriate for comparison, returned -19.28%. |
All performance figures assume reinvestment of distributions and exclude the effect of sales charges. Past performance is no guarantee of future results, and current performance may be higher or lower than the performance shown above.
How did the markets perform during the Fund’s fiscal year?
During the Fund’s fiscal year, all regional markets ended the 12-month period in negative territory, with emerging markets, and Latin America in particular, being the worst performer. The MSCI Emerging Markets Index (net) returned -19.28% over the year.
Emerging markets had a difficult period as a strengthening U.S. dollar, expectations that the Federal Reserve would raise interest rates sooner than expected, and slowing global growth outside the U.S. dampened investor enthusiasm for the region. Investors have been concerned about the impact of rising U.S. interest rates on emerging market economies. Fortunately, emerging market governments have been given a long time to prepare for this eventuality and have generally implemented sensible reforms. Export growth continued to disappoint across the region as growth outside the U.S. remained lackluster, increasing the need for appropriate self-help measures.
Commodity-dependent countries such as Russia, Brazil, and Colombia struggled due to further sharp declines in commodity prices during the period under review. Poor market performance was exacerbated by currency losses with the Mexican peso, South African rand, Brazilian real, and Malaysia ringgit all posting
sharp declines. While we are concerned regarding corporate profitability, the ongoing commodity price weakness has taken some of the pressure off margins. Also, slower economic growth has dampened wage demands, and this will in time enable companies to generate superior returns.
What factors affected the Fund’s performance during its fiscal year?
In constructing the portfolio, we seek to ensure that all excess value is delivered through security selection rather than through regional or sector bets. This is due to our conviction that the characteristics exhibited by companies and managements that are committed to paying and growing their dividends are powerful indicators of a company’s future health and profitability. The Fund’s strategy moderately outperformed the benchmark during the fiscal year. Style factors inevitably have an impact. In terms of style, despite the sharp declines registered by equity markets, growth outperformed value over the 12-month period. This acted as a headwind for our strategy during the period. We inherently have a value tilt in the portfolio, as one of the key market inefficiencies that we exploit is the underpricing by investors of the earnings growth delivered by higher payout companies.
In addition, during the 12-month period, investors did not favor traditional high-yield stocks. The Fund’s relative outperformance was driven by the fact that we focus on quality companies (those with superior capital management, subsequently superior return on equity, and return on invested capital). The other key reason we kept pace with the markets was that while we like dividend-paying and dividend-growing companies, we do so in an unconventional way; we do not fall into the traditional income traps of concentrating our risk budget on specific sectors and regions. Our all-cap, all-region, all-industry investment approach allows us to look for companies with a strong dividend discipline where others do not.
Regionally our performance was strongest in Asia, followed by Europe, Middle East and Africa, with Latin America the only region where we underperformed. The reason that Latin America underperformed is because the outperformance of growth over value was so pronounced in this region. In term of industry groups, relative performance contributed very positively to performance in both banks and real
estate. In banks, our selection of a number of Chinese banks in the portfolio was vindicated as investors rewarded their strong balance sheets, especially their robust capital positions. In real estate, our top performing stock was a Chinese stock which benefited from government reforms in the domestic real estate sector. Relative performance was particularly disappointing in capital goods and energy. These industry groups were hit by concerns over global capital investment and by the sharp decline in global oil prices. The largest stock detractor from our relative performance versus the index was a Chinese Internet stock that we did not hold as investors sought refuge in low yielding growth stocks.
The preceding information is the opinion of portfolio management. Any such opinions are subject to change based upon market or other conditions and should not be relied upon as investment advice. Past performance is no guarantee of future results, and there is no guarantee that market forecasts will be realized.
There is no guarantee that the Fund will meet its objectives.
| Asset Allocation | ||||
The following table presents asset allocations within certain sectors and as a percentage of total investments as of September 30, 2015.
|
| |||
Financials | 31 | % | ||
Information Technology | 17 | |||
Industrials | 9 | |||
Consumer Discretionary | 9 | |||
Energy | 8 | |||
Telecommunication Services | 8 | |||
Consumer Staples | 6 | |||
Other (includes short-term investments) | 12 | |||
|
| |||
Total | 100 | % | ||
|
| |||
Equity Securities: The market price of equity securities may be adversely affected by financial market, industry, or issuer-specific events. Focus on a particular style or on small or medium-sized companies may enhance that risk.
Foreign & Emerging Markets: Investing internationally, especially in emerging markets, involves additional risks such as currency, political, accounting, economic, and market risk.
For information regarding the indexes and certain investment terms, see the Key Investment Terms starting on page 4.
9
Table of Contents
| Emerging Markets Equity Income Fund (Continued) | ||
Geographic Concentration: A fund that focuses its investments in a particular geographic location will be highly sensitive to financial, economic, political, and other developments affecting the fiscal stability of that location.
Industry/Sector Concentration: A fund that focuses its investments in a particular industry or sector will be more sensitive to conditions that affect that industry or sector than a non-concentrated fund.
Prospectus: For additional information on risks, please see the Fund’s prospectus.
For information regarding the indexes and certain investment terms, see the Key Investment Terms starting on page 4.
10
Table of Contents
Emerging Markets Equity Income Fund (Continued)
| Average Annual Total Returns1 for periods ended 9/30/15 | ||||||||||||
| 1 year | Since Inception | Inception Date | ||||||||||
| Class A Shares at NAV2 | -19.13 | % | -3.77 | % | 9/5/12 | |||||||
| Class A Shares at POP3,4 | -23.78 | -5.61 | �� | 9/5/12 | ||||||||
| Class C Shares at NAV2 and with CDSC4 | -19.78 | -4.50 | 9/5/12 | |||||||||
| Class I Shares at NAV | -18.95 | -3.54 | 9/5/12 | |||||||||
S&P 500® Index | -0.61 | 13.12 | 5 | | — | | ||||||
| MSCI Emerging Markets Index (net) | -19.28 | -3.08 | 5 | — | ||||||||
Fund Expense Ratios6: A Shares: Gross 2.01%, Net 1.75%; C Shares: Gross 2.76%, Net 2.50%; I Shares: Gross 1.76%, Net 1.50%.
All returns represent past performance which is no guarantee of future results. Current performance may be higher or lower than the performance shown. The investment return and principal value of an investment will fluctuate so that an investor’s shares, when redeemed, may be worth more or less than their original cost. The above table and graph below do not reflect the deduction of taxes that a shareholder would pay on fund distributions or the redemption of shares. Please visit Virtus.com for performance data current to the most recent month-end.
| 1 | Total returns are historical and include changes in share price and the reinvestment of both dividends and capital gains distributions. |
| 2 | “NAV” (Net Asset Value) total returns do not include the effect of any sales charge. |
| 3 | “POP” (Public Offering Price) total returns include the effect of the maximum front-end 5.75% sales charge. |
| 4 | “CDSC” (Contingent Deferred Sales Charge) is applied to redemptions of certain classes of shares that do not have a sales charge applied at the time of purchase. CDSC charges for certain redemptions of Class A shares made within 18 months of purchase in which a finder’s fee was paid and all redemptions of Class C shares within the first year are 1% and 0% thereafter. |
| 5 | The since inception index returns are from the Fund’s inception date. |
| 6 | The expense ratios of the Fund are set forth according to the prospectus for the Fund effective January 28, 2015, as supplemented and revised, and may differ from the expense ratios disclosed in the Financial Highlights tables in this report. See the Financial Highlights for more current expense ratios. Net Expense: Expenses reduced by the contractual fee waiver in effect through January 31, 2017. For the period of October 1, 2014, through August 31, 2015, the waiver was voluntary. Gross Expense: Does not reflect the effect of the fee waiver. |
Growth of $10,000 For periods ended 9/30
This chart assumes an initial investment of $10,000 made on September 5, 2012 (inception date of the Fund), for Class A, Class C, and Class I shares including any applicable sales charges or fees. Performance assumes reinvestment of dividends and capital gain distributions.
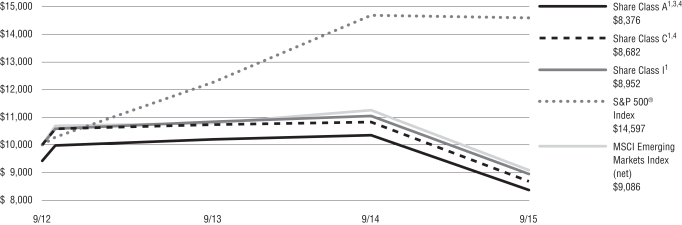
The indexes are unmanaged and not available for direct investment; therefore, their performance does not reflect the expenses associated with active management of an actual portfolio.
For information regarding the indexes and certain investment terms, see the Key Investment Terms starting on page 4.
11
Table of Contents
Emerging Markets Small-Cap Fund
Fund Summary | Ticker Symbols: Class A: VAESX Class C: VCESX Class I: VIESX |
Portfolio Manager Commentary by Kayne Anderson Rudnick Investment Management, LLC
| ¢ | The Fund is diversified and has an investment objective of capital appreciation. |
| ¢ | For the fiscal year ended September 30, 2015, the Fund’s Class A shares at NAV returned -21.20%, Class C shares returned -21.68%, and Class I shares returned -20.96%. For the same period, the S&P 500® Index, a broad-based equity index, returned -0.61%, and the MSCI Small Cap Index (net), the Fund’s style-specific benchmark appropriate for comparison, returned -15.23%. |
All performance figures assume reinvestment of distributions and exclude the effect of sales charges. Past performance is no guarantee of future results, and current performance may be higher or lower than the performance shown above.
How did the markets perform during the Fund’s fiscal year?
The MSCI Emerging Markets Small Cap Index declined during the fiscal year. Fears over slowing growth in China, the dramatic rise and fall of the Shanghai Stock Exchange, falling commodity prices, and uncertainty surrounding the Federal Reserve policy caused emerging market assets to decline sharply. The decline was magnified in dollar terms, as many emerging market currencies depreciated significantly over the past 12 months.
In China, the shift from an investment-driven economy to a consumption-driven economy is ongoing and has been bumpy. As such, markets more closely tied to China were the biggest underperformers during the period. This included countries with significant commodity exposure, such as Brazil, Russia, Colombia, South Africa, and Indonesia. It also included markets closely tied to China economically, such as Hong Kong and Taiwan. Accordingly, the strongest performing markets during the period were India and South Korea, both of which have relatively low exposure to commodity prices and less linkage to the Chinese economy.
The strongest sector during the period was healthcare. The weakest sectors were energy and materials.
What factors affected the Fund’s performance during its fiscal year?
The Fund underperformed the MSCI Emerging Markets Small Cap Index over the fiscal year. Country and currency mismatches relative to the benchmark detracted from performance, created by our relatively higher exposure in Brazil, Malaysia, South Africa, and Turkey, which experienced sharp currency devaluations and heightened volatility. Relative underweight positions in India and South Korea also detracted from performance. We emphasize that our country selection is driven not by trying to predict macroeconomic outcomes, but by our bottom-up search for the highest quality companies with the best risk-reward in our universe. We tend to own larger positions than most managers, and many of these positions are not highly correlated with the markets in which they trade. This will, at times, result in performance for the Fund that varies materially from the benchmark. We believe that our concentrated, high-quality approach will achieve excess returns over a complete market cycle.
In addition to mismatches in geographic and currency weights, one particular stock, Tegma Gestao Logistica, was a significant detractor from performance. As the largest provider of logistic services for the automotive industry in Brazil, the company struggled as automotive sales and production in Brazil declined dramatically over the last two years as the challenging economic backdrop descended into a crisis. While the company has remained profitable and maintained its leading market share, we have been disappointed by the margin declines experienced this year and the departure of the company’s prior CEO.
The biggest contributor to performance over the past year was BFI Finance, a consumer finance company in Indonesia. The company’s stock rose during the period, driven by continued strong revenue and profit growth. BFI Finance maintains a unique distribution model in rural Indonesia, providing consumer lending services through its 225 outlets, the majority of which are located outside of the Java region in remote areas where client relationships are crucial. Trading at roughly half the valuation of other Indonesian banks and finance companies while still posting healthy growth and returns, we still find significant upside potential remaining for the stock.
The preceding information is the opinion of portfolio management. Any such opinions are subject to change at any time based upon market or other conditions and should not be relied upon as investment advice. Past performance is no guarantee of future results, and there is no guarantee that market forecasts will be realized.
There is no guarantee that the Fund will meet its objective.
| Asset Allocation | ||||
The following table presents asset allocations within certain sectors and as a percentage of total investments as of September 30, 2015.
|
| |||
Consumer Staples | 24 | % | ||
Industrials | 19 | |||
Financials | 16 | |||
Information Technology | 15 | |||
Materials | 11 | |||
Consumer Discretionary | 8 | |||
Telecommunication Services | 3 | |||
Health Care | 2 | |||
Other (includes short-term investments) | 2 | |||
|
| |||
Total | 100 | % | ||
|
| |||
Equity Securities: The market price of equity securities may be adversely affected by financial market, industry, or issuer-specific events. Focus on a particular style or on small or medium-sized companies may enhance that risk.
Foreign & Emerging Markets: Investing internationally, especially in emerging markets, involves additional risks such as currency, political, accounting, economic, and market risk.
Industry/Sector Concentration: A fund that focuses its investments in a particular industry or sector will be more sensitive to conditions that affect that industry or sector than a non-concentrated fund.
Limited Number of Investments: Because the Fund has a limited number of securities, it may be more susceptible to factors adversely affecting its securities than a less concentrated fund.
Prospectus: For additional information on risks, please see the Fund’s prospectus.
For information regarding the indexes and certain investment terms, see the Key Investment Terms starting on page 4.
12
Table of Contents
Emerging Markets Small-Cap Fund (Continued)
| Average Annual Total Returns1 for periods ended 9/30/15 | ||||||||||||
| 1 year | Since Inception | Inception Date | ||||||||||
| Class A Shares at NAV2 | -21.20 | % | -10.81 | % | 12/17/13 | |||||||
| Class A Shares at POP3,4 | -25.73 | -13.72 | 12/17/13 | |||||||||
| Class C Shares at NAV2 and with CDSC4 | -21.68 | -11.42 | 12/17/13 | |||||||||
| Class I Shares at NAV | -20.96 | -10.56 | 12/17/13 | |||||||||
| S&P 500® Index | -0.61 | 6.46 | 5 | — | ||||||||
| MSCI Small Cap Index | -15.23 | -4.15 | 5 | — | ||||||||
Fund Expense Ratios6: A Shares: Gross 4.84%, Net 1.85%; C Shares: Gross 5.59%, Net 2.60%; I Shares: Gross 4.59%, Net 1.60%.
All returns represent past performance which is no guarantee of future results. Current performance may be higher or lower than the performance shown. The investment return and principal value of an investment will fluctuate so that an investor’s shares, when redeemed, may be worth more or less than their original cost. The above table and graph below do not reflect the deduction of taxes that a shareholder would pay on fund distributions or the redemption of shares. Please visit Virtus.com for performance data current to the most recent month-end.
| 1 | Total returns are historical and include changes in share price and the reinvestment of both dividends and capital gains distributions. |
| 2 | “NAV” (Net Asset Value) total returns do not include the effect of any sales charge. |
| 3 | “POP” (Public Offering Price) total returns include the effect of the maximum front-end 5.75% sales charge. |
| 4 | “CDSC” (Contingent Deferred Sales Charge) is applied to redemptions of certain classes of shares that do not have a sales charge applied at the time of purchase. CDSC charges for certain redemptions of Class A shares made within 18 months of purchase in which a finder’s fee was paid and all redemptions of Class C shares within the first year are 1% and 0% thereafter. |
| 5 | The since inception index returns are from the Fund’s inception date. |
| 6 | The expense ratios of the Fund are set forth according to the prospectus for the Fund effective January 28, 2015, as supplemented and revised, and may differ from the expense ratios disclosed in the Financial Highlights tables in this report. See the Financial Highlights for more current expense ratios. Net Expense: Expenses reduced by the contractual fee waiver in effect through January 31, 2017. For the period of October 1, 2014, through August 31, 2015, the waiver was voluntary. Gross Expense: Does not reflect the effect of the fee waiver. |
Growth of $10,000 For periods ended 9/30
This chart assumes an initial investment of $10,000 made on December 17, 2013 (inception date of the Fund), for Class A, Class C, and Class I shares including any applicable sales charges or fees. Performance assumes reinvestment of dividends and capital gain distributions.
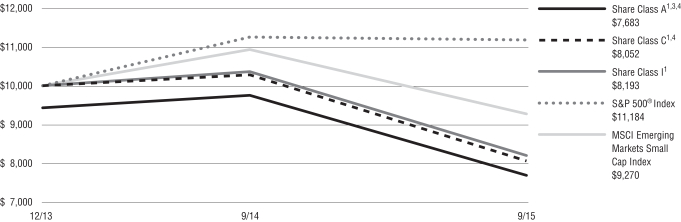
The indexes are unmanaged and not available for direct investment; therefore, their performance does not reflect the expenses associated with active management of an actual portfolio.
For information regarding the indexes and certain investment terms, see the Key Investment Terms starting on page 4.
13
Table of Contents
Fund Summary | Ticker Symbols: Class A: PGUAX Class C: PGUCX Class I: PGIUX |
Portfolio Manager Commentary by Duff & Phelps Investment Management Co.
| ¢ | The Fund is diversified and has investment objectives of both capital appreciation and current income. |
| ¢ | For the fiscal year ended September 30, 2015, the Fund’s Class A shares at NAV returned -8.27%, Class C shares returned -8.94%, and Class I shares returned -7.98%. For the same period, the S&P 500® Index, a broad-based equity index, returned -0.61%, and the Global Infrastructure Linked Benchmark, the Fund’s style-specific benchmark appropriate for comparison, returned -10.65%. |
All performance figures assume reinvestment of distributions and exclude the effect of sales charges. Past performance is no guarantee of future results, and current performance may be higher or lower than the performance shown above.
How did the markets perform during the Fund’s fiscal year?
For the 12 months ended September 30, 2015, after heighten levels of volatility, most developed world equity markets finished in negative territory. Markets were subjected to multiple events that put investors on edge. The negative overtone began early in the period when OPEC refused to cut production levels, and oil prices and energy stocks sold off as a result. In Europe, equity markets see-sawed throughout the period with the fortunes of Greece as a eurozone collapse was once again narrowly averted. The recurring Greek crisis and an unsteady economic pace overshadowed the potential benefits from eurozone quantitative easing. Toward the end of the period, China devalued its currency as its economy was slowing and its stock market falling. In a domino effect, commodities sold off worldwide, and global stock markets tumbled.
The U.S. equity market, although still negative, performed better than many others over the last 12 months as its economy continued to be healthier than those of other developed nations. However, near the end of the period, after heavy anticipation and substantial speculation, the Federal Reserve chose not to raise interest rates, but instead held steady.
U.S. equity markets initially reacted negatively, jolted by fears of an unstable economic recovery. The stage is now set for a policy change before year-end, or even perhaps sometime into 2016.
What factors affected the Fund’s performance during its fiscal year?
The same negative sentiment that overtook broader equities markets over the past 12 months also contributed to the Fund posting negative performance. The Fund beat the benchmark during the period, but lagged behind global equities. Over the period, the performance of the Fund’s transportation and utilities holdings were positive. Communications declined modestly, while energy was significantly negative.
The primary contributor to the Fund’s outperformance versus the benchmark was stock selection within the utilities sector. Utilities experienced heighten volatility throughout the period, and rallied sharply near the end when the Fed opted to hold interest rates steady and treasury yields fell. Our favored U.S. regulated utility companies posted strong performance resulting in the significant positive contribution. We are attracted to the strong fundamental underpinning of robust capital spending programs and supportive regulatory environments in the U.S. We continue to avoid companies with power price exposure given that merchant power markets are difficult worldwide due to excess capacity and downward pressure of fuel related commodities. However, we expect continued volatility in U.S. utilities as the road to Fed tightening is paved with interest rate concerns among investors.
Transportation was the Fund’s largest overweight during the period and the second largest contributor to outperformance versus the benchmark. A positive allocation effect and strong stock selection were the drivers. Our transportation holdings, primarily located in Europe and Australia, continued to post strong traffic and passenger numbers, even given a backdrop of wavering economies. Long-term concession agreements with government authorities, attractive cash flows, and stable or growing dividends support our overweight investment thesis.
Communications, which was the Fund’s largest underweight, was neutral versus the benchmark over the last 12 months. A positive selection impact was
essentially offset by a negative allocation effect. The significant underweight is due to concerns about the wireless competitive environment for U.S. integrated telecommunications companies. European telecommunications fundamentals are mixed, and M&A seems to have run into a regulatory roadblock. We remain comfortable with the overweight position in U.S. tower and European satellite companies as the revenue growth profiles and high margins provide for attractive long-term investment opportunities. The portfolio benefits from the attractive dividend yields communications companies provide, which are generally well supported by cash flows.
The energy sector had a negative impact on performance versus the benchmark during the 12-month period, as we had an overweight position allocated to the worst performing sector. Energy stocks were hammered, first early in the period when OPEC decided not to cut production, and then again toward the end of the period due to the China-related global commodities pullback and fears of earnings weakness related to drilling cuts. Early on, we decided to maintain our overweight given that our midstream-oriented holdings (pipelines, gatherers, and processors) generally have little short- or intermediate-term exposure to oil prices. However, our thesis failed to bear fruit as investors did not distinguish the mid-stream companies from the oil-price dependent exploration and production companies. However, we are maintaining our midstream oriented energy overweight as we remain confident that multi-year contracts and regulatory agreements underpin attractive revenues, cash flows, and dividends going forward.
Another detractor from the Fund’s performance versus the benchmark for the period was the social services sector, which benefited from the strength of health care stocks. However, the Fund does not invest in health care or education services companies as we do not believe they meet our investment criteria for revenue visibility, dividend yield, and geographic diversification.
The preceding information is the opinion of portfolio management. Any such opinions are subject to change at any time based upon market or other conditions and should not be relied upon as investment advice. Past performance is no guarantee of future results, and there is no guarantee that market forecasts will be realized.
For information regarding the indexes and certain investment terms, see the Key Investment Terms starting on page 4.
14
Table of Contents
| Global Infrastructure Fund (Continued) |
There is no guarantee that the Fund will meet its objectives.
| Asset Allocation | ||||
The following table presents asset allocations within certain sectors and as a percentage of total investments as of September 30, 2015.
|
| |||
Utilities | 37 | % | ||
Energy | 21 | |||
Telecommunication Services | 18 | |||
Industrials | 14 | |||
Financials | 5 | |||
Consumer Discretionary | 3 | |||
Other (includes short-term investments) | 2 | |||
|
| |||
Total | 100 | % | ||
|
| |||
Equity Securities: The market price of equity securities may be adversely affected by financial market, industry, or issuer-specific events. Focus on a particular style or on small or medium-sized companies may enhance that risk.
Foreign Investing: Investing internationally involves additional risks such as currency, political, accounting, economic, and market risk.
Industry/Sector Concentration: A fund that focuses its investments in a particular industry or sector will be more sensitive to conditions that affect that industry or sector than a non-concentrated fund.
Income: Income received from the Fund may vary widely over the short- and long-term.
Prospectus: For additional information on risks, please see the Fund’s prospectus.
For information regarding the indexes and certain investment terms, see the Key Investment Terms starting on page 4.
15
Table of Contents
Global Infrastructure Fund (Continued)
| Average Annual Total Returns1 for periods ended 9/30/15 | ||||||||||||||||||||
| 1 year | 5 years | 10 years | Since Inception | Inception Date | ||||||||||||||||
| Class A Shares at NAV2 | -8.27 | % | 8.36 | % | 6.29 | % | — | — | ||||||||||||
| Class A Shares at POP3,4 | -13.55 | 7.09 | 5.67 | — | — | |||||||||||||||
| Class C Shares at NAV2 and with CDSC4 | -8.94 | 7.56 | 5.50 | — | — | |||||||||||||||
| Class I Shares at NAV | -7.98 | 8.63 | — | 3.88 | % | 6/6/08 | ||||||||||||||
| S&P 500® Index | -0.61 | 13.34 | 6.80 | 7.12 | 5 | — | ||||||||||||||
| Global Infrastructure Linked Benchmark | -10.65 | 6.58 | 5.01 | 2.09 | 5 | — | ||||||||||||||
Fund Expense Ratios6: A Shares: 1.29%; C Shares: 2.04%, I Shares: 1.04%.
All returns represent past performance which is no guarantee of future results. Current performance may be higher or lower than the performance shown. The investment return and principal value of an investment will fluctuate so that an investor’s shares, when redeemed, may be worth more or less than their original cost. The above table and graph below do not reflect the deduction of taxes that a shareholder would pay on fund distributions or the redemption of shares. Please visit Virtus.com for performance data current to the most recent month-end.
| 1 | Total returns are historical and include changes in share price and the reinvestment of both dividends and capital gains distributions. |
| 2 | “NAV” (Net Asset Value) total returns do not include the effect of any sales charge. |
| 3 | “POP” (Public Offering Price) total returns include the effect of the maximum front-end 5.75% sales charge. |
| 4 | “CDSC” (Contingent Deferred Sales Charge) is applied to redemptions of certain classes of shares that do not have a sales charge applied at the time of purchase. CDSC charges for certain redemptions of Class A shares made within 18 months of purchase in which a finder’s fee was paid and all redemptions of Class C shares within the first year are 1% and 0% thereafter. |
| 5 | The since inception returns are from Class I inception date (6/6/08). |
| 6 | The expense ratios of the Fund are set forth according to the prospectus for the Fund effective January 28, 2015, as supplemented and revised, and may differ from the expense ratios disclosed in the Financial Highlights tables in this report. See the Financial Highlights for more current expense ratios. |
Growth of $10,000 For periods ended 9/30
This chart assumes an initial investment of $10,000 made on September 30, 2005, for Class A and Class C shares including any applicable sales charges or fees. Performance assumes reinvestment of dividends and capital gain distributions.
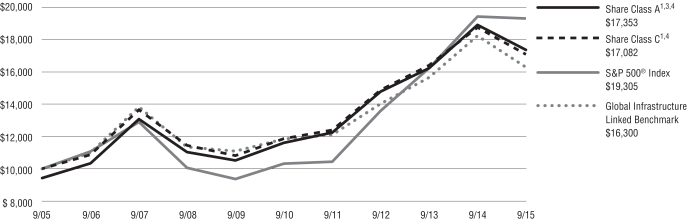
The indexes are unmanaged and not available for direct investment; therefore, their performance does not reflect the expenses associated with active management of an actual portfolio.
For information regarding the indexes and certain investment terms, see the Key Investment Terms starting on page 4.
16
Table of Contents
Fund Summary | Ticker Symbols: Class A: NWWOX Class B: WWOBX Class C: WWOCX Class I: WWOIX |
Portfolio Manager Commentary by Vontobel Asset Management, Inc.
| ¢ | The Fund is diversified and has an investment objective of capital appreciation. |
| ¢ | For the fiscal year ended September 30, 2015, the Fund’s Class A shares at NAV returned 2.15%, Class B shares returned 1.33%, Class C shares returned 1.42%, and Class I shares returned 2.37%. For the same period, the S&P 500® Index, a broad-based equity index, returned -0.61%, and the MSCI AC World Index (net), the Fund’s style-specific benchmark appropriate for comparison, returned -6.66%. |
All performance figures assume reinvestment of distributions and exclude the effect of sales charges. Past performance is no guarantee of future results, and current performance may be higher or lower than the performance shown above.
How did the market perform during the Fund’s fiscal year?
| ¢ | The MSCI All Country World Index (Total Return Net Dividends) was essentially flat in fiscal Q1, positive in fiscal Q2, essentially flat again in fiscal Q3, and negative in fiscal Q4 as global markets sold off. |
| ¢ | The U.S. stock market fell sharply in October 2014 and again in December 2014. However, its quick rebound in both months signified its underlying economic strength as it entered 2015 with strong momentum. For the first half of 2015, U.S. stocks gained approximately 1% as disappointing economic data, lackluster corporate earnings, uncertainties about an initial Federal Reserve rate hike, and concerns regarding the Greek debt crisis contributed to U.S. equity market volatility. Despite a relatively solid economic backdrop in the U.S., stocks suffered losses in the last three months of the period, amid concerns over global growth and further uncertainty driven by the U.S. Federal Reserve’s decision in September to postpone the pending rate hike. U.S. equities (as represented by the S&P 500® Index) returned -0.61% over the one-year period ended September 30, 2015. |
| ¢ | Towards the end of 2014, European equities struggled, as disappointing economic data was released |
and the European Central Bank lowered its growth forecasts for the eurozone economy. However, European equities entered positive territory in the beginning of 2015, bolstered by central bank bond purchases. By mid-year, the Greek debt crisis impacted European markets, which experienced losses through September, as the effects of the Chinese slowdown and a scandal at German auto manufacturer Volkswagen weighed on investor sentiment. Over the one-year period ended September 30, 2015, European equities (as represented by the MSCI Europe Index) returned -9.33% in U.S. dollar terms. The euro experienced a significant devaluation, declining more than 11.5% against the U.S. dollar over the period. |
| ¢ | Falling commodity prices and a strengthening U.S. dollar drove emerging markets to negative territory at the end of 2014. Emerging markets entered 2015 with positive momentum with promising developments occurring in India, where equities benefited from two unexpected central bank rate cuts and a greater government focus on infrastructure spending. After reaching highs in late April driven by soaring Chinese equity markets, emerging markets experienced steep declines as concerns over China’s weak macroeconomic data, Beijing’s unexpected move to devalue its currency, and substantial Chinese equity market volatility led to a global market sell-off in August. Emerging markets suffered far worse than their developed market counterparts. Currencies of many developing countries tumbled as well. Emerging market equities (as represented by the MSCI Emerging Markets Index) returned -19.28% (net) in U.S. dollar terms over the one-year period ended September 30, 2015. |
What factors affected the Fund’s performance during its fiscal year?
The following discussion highlights specific stocks – those that provided the largest contribution to absolute performance and those that were the largest detractors for the quarter. As bottom-up stock pickers, we hope shareholders find this useful and gain a greater understanding of how we invest their capital.
Stocks that Helped Absolute Performance
MasterCard is the second largest global payment network and is gaining share in a secularly growing
industry. Global payments volume has grown at greater than 10% annually for more than five years, and MasterCard may be capable of growing its volume at a 10-12% rate annually for the next several years. Global card penetration relative to cash and check transactions had been about 36% in the recent past and may grow to 45-50% by 2018. Certainly the trend of consumers buying more and more goods online is a strong impetus for the continued preference of cards over cash. MasterCard continued to show strong underlying growth throughout the period, and concerns over any regulatory issues directly related to the company have faded for the time being.
Visa posted solid FY3Q2015 results, including a slight FY2015 EPS guidance raise. Visa is a leader in debit/credit transaction processing for card-issuing banks around the world. The company is a beneficiary of the secular shift from cash and checks to credit and debit cards. We like the transaction processing sector and believe Visa is well-positioned for continued strong growth.
Stocks that Hurt Absolute Performance
Baidu disappointed over the period, with continued weakness in margins as the company is spending heavily on marketing to drive adoption of its online-to-offline (“O2O”) platforms. We agree that over the longer term O2O is the right strategy, as it allows Baidu to take a higher share of revenues from completed transactions in local services areas, such as food delivery. Longer term, as search revenue slows down, we think O2O transactions will become a more important growth driver for the company; however, shorter term the investment required is impacting margins. We believe the majority of these investments are discretionary and will be pulled back over the years. The core search business continues to perform well, with revenue growth in the 30-35% range as the investments the company has made in promoting mobile search are coming to fruition. However, the O2O strategy is not driving incremental revenue growth for the near term and intense competition for the O2O markets continues to be strong. This is necessitating Baidu to spend more aggressively on marketing and promotion to try to win market share, which is not value added from a shareholder’s perspective, and continues to drag down margins.
For information regarding the indexes and certain investment terms, see the Key Investment Terms starting on page 4.
17
Table of Contents
| Global Opportunities Fund (Continued) |
Las Vegas Sands, and other Macau-exposed gaming stocks, continued to be weak over the period due to the onslaught of incrementally bad news from a macroeconomic and policy standpoint. Macau is still under pressure as the Chinese government crackdown on corruption as well as the economic weakness on the mainland has hurt visitation growth and gambling appetite. In the July through September period, there was new negative news out of the junket space in Macau. Junkets are a key facilitator to the VIP business, which has already contracted meaningfully. Now, we have seen news of some higher profile weakness in the junket space – junkets closing or reducing operations. This does not shock us or change our investment thesis. In the coming year, we expect to see a turn in the underlying market performance as it lacks the previous year’s extreme weakness. We think the news regarding the crackdown on corruption and economic weakness in China will continue. We have, therefore, marginally reduced our exposure on the back of the inevitability of the ongoing pressure and have reallocated capital to better near-term opportunities. However, as we have detailed before, our conviction in the Macau space has not changed over the long term, even while the near- and medium-term horizon has been cloudy. We still believe it presents tremendous opportunities for highly profitable growth and strong cash returns for shareholders. In our opinion, continued patience, and the passage of time, is all that is needed here.
The preceding information is the opinion of portfolio management. Any such opinions are subject to change at any time based upon market or other conditions and should not be relied upon as investment advice. Past performance is no guarantee of future results, and there is no guarantee that market forecasts will be realized.
There is no guarantee that the Fund will meet its objective.
| Asset Allocation | ||||
The following table presents asset allocations within certain sectors and as a percentage of total investments as of September 30, 2015.
|
| |||
Consumer Staples | 31 | % | ||
Financials | 20 | |||
Health Care | 17 | |||
Information Technology | 17 | |||
Consumer Discretionary | 6 | |||
Materials | 2 | |||
Energy | 2 | |||
Other (includes short-term investments) | 5 | |||
|
| |||
Total | 100 | % | ||
|
| |||
Equity Securities: The market price of equity securities may be adversely affected by financial market, industry, or issuer-specific events. Focus on a particular style or on small or medium-sized companies may enhance that risk.
Foreign & Emerging Markets: Investing internationally, especially in emerging markets, involves additional risks such as currency, political, accounting, economic, and market risk.
Industry/Sector Concentration: A fund that focuses its investments in a particular industry or sector will be more sensitive to conditions that affect that industry or sector than a non-concentrated fund.
Geographic Concentration: A fund that focuses its investments in a particular geographic location will be highly sensitive to financial, economic, political, and other developments affecting the fiscal stability of that location.
Prospectus: For additional information on risks, please see the Fund’s prospectus.
For information regarding the indexes and certain investment terms, see the Key Investment Terms starting on page 4.
18
Table of Contents
Global Opportunities Fund (Continued)
| Average Annual Total Returns1 for periods ended 9/30/15 | ||||||||||||||||||||
| 1 year | 5 years | 10 years | Since Inception | Inception Date | ||||||||||||||||
| Class A Shares at NAV2 | 2.15 | % | 10.22 | % | 4.94 | % | — | — | ||||||||||||
| Class A Shares at POP3,4 | -3.72 | 8.93 | 4.32 | — | — | |||||||||||||||
| Class B Shares at NAV2 | 1.33 | 9.40 | 4.17 | — | — | |||||||||||||||
| Class B Shares with CDSC4 | -2.31 | 9.40 | 4.17 | — | — | |||||||||||||||
| Class C Shares at NAV2 and with CDSC4 | 1.42 | 9.42 | 4.17 | — | — | |||||||||||||||
| Class I Shares at NAV | 2.37 | — | — | 9.79 | % | 8/8/12 | ||||||||||||||
| S&P 500® Index | -0.61 | 13.34 | 6.80 | 12.89 | 5 | — | ||||||||||||||
| MSCI AC World Index (net) | -6.66 | 6.82 | 4.58 | 7.70 | 5 | — | ||||||||||||||
Fund Expense Ratios6: A Shares: 1.48%; B Shares: 2.23%; C Shares: 2.23%; I Shares: 1.23%.
All returns represent past performance which is no guarantee of future results. Current performance may be higher or lower than the performance shown. The investment return and principal value of an investment will fluctuate so that an investor’s shares, when redeemed, may be worth more or less than their original cost. The above table and graph below do not reflect the deduction of taxes that a shareholder would pay on fund distributions or the redemption of shares. Please visit Virtus.com for performance data current to the most recent month-end.
| 1 | Total returns are historical and include changes in share price and the reinvestment of both dividends and capital gains distributions. |
| 2 | “NAV” (Net Asset Value) total returns do not include the effect of any sales charge. |
| 3 | “POP” (Public Offering Price) total returns include the effect of the maximum front-end 5.75% sales charge. |
| 4 | “CDSC” (Contingent Deferred Sales Charge) is applied to redemptions of certain classes of shares that do not have a sales charge applied at the time of purchase. CDSC charges for B shares decline from 5% to 0% over a five year period. CDSC charges for certain redemptions of Class A shares made within 18 months of purchase in which a finder’s fee was paid and all redemptions of Class C shares within the first year are 1% and 0% thereafter. |
| 5 | The since inception index returns are from Class I inception date (8/8/12). |
| 6 | The expense ratios of the Fund are set forth according to the prospectus for the Fund effective January 28, 2015, as supplemented and revised, and may differ from the expense ratios disclosed in the Financial Highlights tables in this report. See the Financial Highlights for more current expense ratios. |
Growth of $10,000 For periods ended 9/30
This chart assumes an initial investment of $10,000 made on September 30, 2005, for Class A, Class B, and Class C shares including any applicable sales charges or fees. Performance assumes reinvestment of dividends and capital gain distributions.
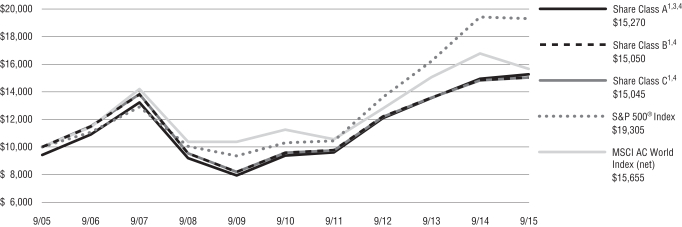
The indexes are unmanaged and not available for direct investment; therefore, their performance does not reflect the expenses associated with active management of an actual portfolio.
For information regarding the indexes and certain investment terms, see the Key Investment Terms starting on page 4.
19
Table of Contents
Global Real Estate Securities Fund
Fund Summary | Ticker Symbols: Class A: VGSAX Class C: VGSCX Class I: VGISX |
Portfolio Manager Commentary by Duff & Phelps Investment Management Co.
| ¢ | The Fund is diversified and has a primary investment objective of long-term capital appreciation, with a secondary investment objective of income. |
| ¢ | For the fiscal year ended September 30, 2015, the Fund’s Class A shares at NAV returned 6.83%, Class C shares returned 6.07%, and Class I shares returned 7.11%. For the same period, the S&P 500® Index, a broad-based equity index, returned -0.61%, and the FTSE EPRA/NAREIT Developed Rental Index (net), the Fund’s style specific benchmark appropriate for comparison, returned 5.32%. |
All performance figures assume reinvestment of distributions and exclude the effect of sales charges. Past performance is no guarantee of future results, and current performance may be higher or lower than the performance shown above.
How did the markets perform during the Fund’s fiscal year?
The performance of global real estate equities significantly outperformed global equities as demonstrated by the 5.3% increase in the benchmark FTSE EPRA NAREIT Developed Rental Index versus the 5.1% drop in the MSCI World Index, both expressed in U.S. dollar terms. Global real estate equities also outperformed U.S. equities during the period, but by a smaller margin, as represented by the 0.6% decrease in the S&P 500® Index during the fiscal year.
Taking a closer look at the performance of individual countries represented within the FTSE EPRA NAREIT Developed Rental Index, the five top-performing countries during the fiscal year on a total return basis measured in U.S. dollars were Germany, the U.K., Italy, Sweden, and the U.S. Not surprisingly, the top performers had a decidedly European flavor. The launch of European style quantitative easing was a powerful force behind the performance of several of the top countries, and its strength was more than enough to offset the decline in the euro relative to the U.S. dollar. Germany finished the period in the number one spot driven by the ongoing positive performance of its apartment companies, which are disproportionately represented in the Index. A positive
fundamental landscape and a strong bid for German apartments drove capitalization rates lower and asset values higher.
Following the surprise May election win by the Conservative party, U.K. real estate equities and the British pound posted healthy rallies relative to their global developed market peers, helping drive the second best total returns by country during the fiscal year. Moreover, similar to German apartments, U.K. real estate continues to benefit from the dual tailwinds of a positive rental rate and capital cycle, which is only present in a few other countries on a global basis.
Italian, Swedish, and U.S. real estate shares also outperformed during the period as institutional real estate capital continued to flow into these markets looking to participate in better expected economic growth and real estate fundamentals in the case of Sweden and the U.S. and recovering real estate values in the case of Italy.
The five bottom-performing countries during the fiscal year were Norway, Greece, Singapore, Canada, and Finland. All five delivered negative total returns. During the fiscal year, the Norwegian krone and the Canadian dollar took it on the chin relative to the U.S dollar as oil prices collapsed. This was a significant factor behind Norway’s and Canada’s poor return performance. A deteriorating political situation in Greece and a continued decline in the euro relative to the U.S. dollar were contributors to the weak returns from Greece. Finnish returns experienced a knock-on effect from the growing problems in Russia, which weighed on the performance of its economy. Singapore was one of the weaker performing countries during the period given its ties to China and poor underlying real estate fundamentals.
Thematically, real estate companies remained active on the capital raising front, particularly in the U.S., Europe excluding the U.K., and Japan as they looked to fund redevelopment, development, and acquisitions of recently acquired companies or portfolios of assets. Portfolio pruning and asset recycling as an additional source of capital was more evident in the U.S than other markets, as is often the case. We also witnessed a pick-up in mergers and acquisition activity as several privatization deals were announced in the U.S., and public-to-public mergers were announced in the U.S. and Europe excluding the U.K. With the significant amount of real estate private
equity capital that has been raised, but currently remains unspent, and the more attractive valuations on offer by publicly traded real estate securities, we expect M&A activity to continue, if not accelerate, over the coming year.
Our global travels during the period brought us to several countries and cities in the U.S., European and Asia Pacific regions and were helpful in providing timely updates on the space and asset markets in each respective locale. Additionally, quality time was spent with existing strategy holdings and conducting due diligence on potential new investment opportunities. At a high level, the strong appetite for high-quality commercial real estate from a wide and deep pool of institutional capital sources was evident across most locations as reflected in recent asset market pricing trends. Space market trends were more varied throughout the markets visited, but were notably robust for U.S. self-storage, apartment, and industrial real estate; Central London real estate; German residential; and Dublin office. The Hong Kong office space market, particularly in the central region, was also surprisingly healthy, benefiting from an increase in demand from Mainland China firms. Among the noted property sectors and markets, new development over the visible horizon remains contained with the exception of Dublin office.
What factors affected the Fund’s performance during its fiscal year?
For the one-year period ended September 30, 2015, the Fund outperformed its style-specific benchmark. The Fund’s performance was driven solely by security selection, as country allocation detracted from performance over the period.
From a country perspective, the most significant positive contributor to relative performance was our stock selection within the U.S., which drove the majority of the Fund’s excess return. At the security level within the U.S., our overweight exposure to a mid-capitalization self-storage REIT had the largest positive impact on performance, as this company benefited from a positive fundamental backdrop for self-storage properties, property sector leading results, and a very active transaction market for self-storage properties at firm values. Lack of exposure to a large capitalization triple-net REIT that posted a significant negative total return also contributed positively to our U.S. stock selection.
For information regarding the indexes and certain investment terms, see the Key Investment Terms starting on page 4.
20
Table of Contents
| Global Real Estate Securities Fund (Continued) |
The second most meaningful positive contributor at a country level to relative performance was our allocation to and stock selection within the U.K. At the security level within the U.K., our overweight exposure to a student housing real estate company had the largest positive impact on performance, as this company benefited from a positive fundamental backdrop for student housing and a very active transaction market for student housing properties at firm values. Overweight positions to the two largest publicly traded self-storage REITs in the U.K. also contributed positively to our U.K. stock selection.
From a country perspective, the most significant detractor from relative performance was our overweight allocation to Mexico. On a local currency basis, the combined performance of the Fund’s two Mexican industrial-focused REITs was positive; however, the significant decline in the Mexican peso over the period was a major headwind and drove the negative performance.
The second most meaningful detractor at a country level from relative performance was our overweight exposure to and stock selection within Singapore. Singapore real estate shares performed poorly over the period given its ties to China and generally weak real estate fundamentals. Our stock selection was negatively impacted by an overweight exposure to a global industrial real estate company based in Singapore, but with significant exposure to China.
The preceding information is the opinion of portfolio management. Any such opinions are subject to change at any time based upon market or other conditions and should not be relied upon as investment advice. Past performance is no guarantee of future results, and there is no guarantee that market forecasts will be realized.
There is no guarantee that the Fund will meet its objectives.
| Asset Allocation | ||||
The following table presents asset allocations within certain sectors and as a percentage of total investments as of September 30, 2015.
|
| |||
Financials | 38 | % | ||
Retail REITs | 17 | |||
Office REITs | 12 | |||
Diversified REITs | 9 | |||
Residential REITs | 9 | |||
Real Estate Operating Companies | 8 | |||
Specialized REITs | 5 | |||
Other (includes short-term investments) | 2 | |||
|
| |||
Total | 100 | % | ||
|
| |||
Equity Securities: The market price of equity securities may be adversely affected by financial market, industry, or issuer-specific events. Focus on a particular style or on small or medium-sized companies may enhance that risk.
Industry/Sector Concentration: A fund that focuses its investments in a particular industry or sector will be more sensitive to conditions that affect that industry or sector than a non-concentrated fund.
Real Estate: The Fund may be negatively affected by factors specific to the real estate market, including interest rates, leverage, property, and management.
Foreign & Emerging Markets: Investing internationally, especially in emerging markets, involves additional risks such as currency, political, accounting, economic, and market risk.
Prospectus: For additional information on risks, please see the Fund’s prospectus.
For information regarding the indexes and certain investment terms, see the Key Investment Terms starting on page 4.
21
Table of Contents
Global Real Estate Securities Fund (Continued)
| Average Annual Total Returns1 for periods ended 9/30/15 | ||||||||||||||||
| 1 year | 5 years | Since Inception | Inception Date | |||||||||||||
| Class A Shares at NAV2 | 6.83 | % | 9.78 | % | 21.37 | % | 3/2/09 | |||||||||
| Class A Shares at POP3,4 | 0.69 | 8.49 | 20.28 | 3/2/09 | ||||||||||||
| Class C Shares at NAV2 and with CDSC4 | 6.07 | 8.97 | 20.47 | 3/2/09 | ||||||||||||
| Class I Shares at NAV | 7.11 | 10.07 | 21.69 | 3/2/09 | ||||||||||||
| S&P 500® Index | -0.61 | 13.34 | 19.04 | 5 | — | |||||||||||
| FTSE EPRA/NAREIT Developed Rental Index (net) | 5.32 | 9.09 | 21.07 | 5 | — | |||||||||||
Fund Expense Ratios6: A Shares: Gross 1.57%, Net 1.40%; C Shares: Gross 2.32%, Net 2.15%; I Shares: Gross 1.32%, Net 1.15%.
All returns represent past performance which is no guarantee of future results. Current performance may be higher or lower than the performance shown. The investment return and principal value of an investment will fluctuate so that an investor’s shares, when redeemed, may be worth more or less than their original cost. The above table and graph below do not reflect the deduction of taxes that a shareholder would pay on fund distributions or the redemption of shares. Please visit Virtus.com for performance data current to the most recent month-end.
| 1 | Total returns are historical and include changes in share price and the reinvestment of both dividends and capital gains distributions. |
| 2 | “NAV” (Net Asset Value) total returns do not include the effect of any sales charge. |
| 3 | “POP” (Public Offering Price) total returns include the effect of the maximum front-end 5.75% sales charge. |
| 4 | “CDSC” (Contingent Deferred Sales Charge) is applied to redemptions of certain classes of shares that do not have a sales charge applied at the time of purchase. CDSC charges for certain redemptions of Class A shares made within 18 months of purchase in which a finder’s fee was paid and all redemptions of Class C shares within the first year are 1% and 0% thereafter. |
| 5 | The since inception index returns are from the Fund’s inception date. |
| 6 | The expense ratios of the Fund are set forth according to the prospectus for the Fund effective January 28, 2015, as supplemented and revised, and may differ from the expense ratios disclosed in the Financial Highlights tables in this report. See the Financial Highlights for more current expense ratios. Net Expense: Expenses reduced by the contractual fee waiver in effect through January 31, 2017. For the period of October 1, 2014, through August 31, 2015, the waiver was voluntary. Gross Expense: Does not reflect the effect of the fee waiver. |
Growth of $10,000 For periods ended 9/30
This chart assumes an initial investment of $10,000 made on March 2, 2009 (inception date of the Fund), for Class A, Class C, and Class I shares including any applicable sales charges or fees. Performance assumes reinvestment of dividends and capital gain distributions.
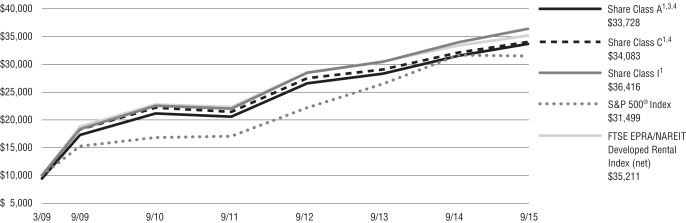
The indexes are unmanaged and not available for direct investment; therefore, their performance does not reflect the expenses associated with active management of an actual portfolio.
For information regarding the indexes and certain investment terms, see the Key Investment Terms starting on page 4.
22
Table of Contents
Greater European Opportunities Fund
Fund Summary | Ticker Symbols: Class A: VGEAX Class C: VGECX Class I: VGEIX |
Portfolio Manager Commentary by Vontobel Asset Management, Inc.
| ¢ | The Fund is diversified and has an investment objective of long-term capital appreciation. |
| ¢ | For the fiscal year ended September 30, 2015, the Fund’s Class A shares at NAV returned 1.19%, Class C shares returned 0.43%, and Class I shares returned 1.47%. For the same period, the S&P 500® Index, a broad-based equity index, returned -0.61%, and the MSCI Europe Index (net), the Fund‘s style-specific benchmark appropriate for comparison, returned -9.33%. |
All performance figures assume reinvestment of distributions and exclude the effect of sales charges. Past performance is no guarantee of future results, and current performance may be higher or lower than the performance shown above.
How did the market perform during the Fund’s fiscal year?
| ¢ | The MSCI Europe Index, in U.S. dollar terms, was negative in fiscal Q1, up in fiscal Q2, essentially flat in fiscal Q3, and negative in fiscal Q4 as global markets sold off. |
| ¢ | Towards the end of 2014, European equities struggled, as disappointing economic data was released and the European Central Bank lowered its growth forecasts for the eurozone economy. However, European equities entered positive territory in the beginning of 2015, bolstered by central bank bond purchases. By mid-year, the Greek debt crisis impacted European markets, which experienced losses through September, as the effects of the Chinese slowdown and a scandal at German auto manufacturer Volkswagen weighed on investor sentiment. Over the one-year period ended September 30, 2015, European equities (as represented by the MSCI Europe Index) returned -9.33% (net) in U.S. dollar terms. The euro experienced a significant devaluation, declining more than 11.5% against the U.S. dollar over the period. |
| ¢ | Concerns over China’s weak macroeconomic data, Beijing’s unexpected move to devalue its currency, and substantial Chinese equity market volatility led to a global market sell-off in August. Slow global growth and uncertainty driven by the U.S. Federal |
Reserve’s decision in September to postpone the pending rate hike also negatively impacted global equities at the end of the one-year period. |
What factors affected the Fund’s performance during its fiscal year?
The following discussion highlights specific stocks – those that provided the largest contribution to absolute performance and those that were the largest detractors for the quarter. As bottom-up stock pickers, we hope that shareholders find this useful and gain a greater understanding of how we invest their capital.
Stocks that Helped Absolute Performance
SABMiller performed well as the potential acquisition by Anheuser-Busch Inbev (ABI), which has been long talked about, seemed to be getting closer. The companies acknowledged in the press that they are discussing a merger. From our point of view, it would be sad to lose SABMiller as an independent company, as we believe it has a long runway of growth ahead of it. Its exposure to the fast growing emerging markets is the largest of any of the major brewers, and it has high market share in many of those regions. Per capita consumption should grow, along with rising discretionary income, and pricing as well as a mix to more premium beer should drive growth as well.
Imperial Tobacco performed well, and we consider this outperformance to be sustainable, given expected growth in operating margins, free cash flow, and dividends. Imperial Tobacco PLC is a leading international tobacco company that manufactures, markets and sells a comprehensive range of tobacco products, including cigarettes and cigars. It is the second largest cigarette manufacturer in Europe, the leader in Spain and the U.K., while being second in Germany and France. Globally, it is the top cigar maker. On May 26, 2015, the Federal Trade Commission’s proposed order required Reynolds American to divest to Imperial Tobacco four established cigarette brands: Winston, Kool, Salem, and Maverick. With the acquisition of the divested assets, Imperial will become a more substantial competitor in the United States.
Stocks that Hurt Absolute Performance
UBS’s stock declined, mostly in July and August of 2015, along with other market-sensitive financials.
With a large portion of the company’s revenues tied to the trends in global asset prices, there is a direct impact on earnings when asset values fall. In addition, the stock’s weakness reflected investors’ expectation for slower net flows into UBS’s private banking business, particularly in the emerging markets. There has not been significant company-specific news in the quarter, and we continue to like the name longer term. UBS is one of the better capitalized banks in the world. With its growth shifting to the less-capital intensive wealth management and asset management businesses, UBS should become a powerful cash-generating machine, while still achieving healthy earnings growth. We expect the pace of capital returns to accelerate over the coming years. UBS is the largest global wealth manager, with two-thirds of its earnings expected to come from its asset-gathering businesses, after the company made a strategic decision to shrink its investment bank.
Roche’s stock suffered after a clinical trial showed that adding Kadcyla to the existing regimen of Herceptin and Perjeta failed to improve survival outcomes in breast cancer. Perjeta and Kadcyla represented Roche’s strategy of moving beyond Herceptin and onto next generation products. While Kadcyla’s failure was a disappointment, Perjeta has already established itself as part of the standard of care. With Perjeta and other formulations of Herceptin, Roche still has flexibility to grow its breast cancer franchise after the eventual introduction of biosimilars. More broadly, Roche remains a dominant oncology franchise, which gives it better understanding of disease biology while the in-house diagnostics business provides synergies with drug development. Roche is a leader in the emerging class of immunotherapy drugs, which has the potential to become another major franchise for the company, and also has a rich pipeline in other therapeutic areas.
The preceding information is the opinion of portfolio management. Any such opinions are subject to change at any time based upon market or other conditions and should not be relied upon as investment advice. Past performance is no guarantee of future results, and there is no guarantee that market forecasts will be realized.
There is no guarantee that the Fund will meet its objective.
For information regarding the indexes and certain investment terms, see the Key Investment Terms starting on page 4.
23
Table of Contents
| Greater European Opportunities Fund (Continued) |
| Asset Allocation | ||||
The following table presents asset allocations within certain sectors and as a percentage of total investments as of September 30, 2015.
|
| |||
Consumer Staples | 38 | % | ||
Health Care | 20 | |||
Consumer Discretionary | 16 | |||
Financials | 8 | |||
Industrials | 5 | |||
Materials | 5 | |||
Information Technology | 3 | |||
Other (includes short-term investments) | 5 | |||
|
| |||
Total | 100 | % | ||
|
| |||
Equity Securities: The market price of equity securities may be adversely affected by financial market, industry, or issuer-specific events. Focus on a particular style or on small or medium-sized companies may enhance that risk.
Industry/Sector Concentration: A fund that focuses its investments in a particular industry or sector will be more sensitive to conditions that affect that industry or sector than a non-concentrated fund.
Foreign Investing: Investing internationally involves additional risks such as currency, political, accounting, economic, and market risk.
Geographic Concentration: A fund that focuses its investments in a particular geographic location will be highly sensitive to financial, economic, political, and other developments affecting the fiscal stability of that location.
Prospectus: For additional information on risks, please see the Fund’s prospectus.
For information regarding the indexes and certain investment terms, see the Key Investment Terms starting on page 4.
24
Table of Contents
Greater European Opportunities Fund (Continued)
| Average Annual Total Returns1 for periods ended 9/30/15 | ||||||||||||||||
| 1 year | 5 years | Since Inception | Inception Date | |||||||||||||
| Class A Shares at NAV2 | 1.19 | % | 7.61 | % | 11.71 | % | 4/21/09 | |||||||||
| Class A Shares at POP3,4 | -4.63 | 6.34 | 10.69 | 4/21/09 | ||||||||||||
| Class C Shares at NAV2 and with CDSC4 | 0.43 | 6.81 | 10.89 | 4/21/09 | ||||||||||||
| Class I Shares at NAV | 1.47 | 7.87 | 11.99 | 4/21/09 | ||||||||||||
| S&P 500® Index | -0.61 | 13.34 | 15.90 | 5 | — | |||||||||||
| MSCI Europe Index (net) | -9.33 | 4.28 | 10.03 | 5 | — | |||||||||||
Fund Expense Ratios6: A Shares: Gross 1.92%, Net 1.45%; C Shares: Gross 2.67%, Net 2.20%; I Shares: Gross 1.67%, Net 1.20%.
All returns represent past performance which is no guarantee of future results. Current performance may be higher or lower than the performance shown. The investment return and principal value of an investment will fluctuate so that an investor’s shares, when redeemed, may be worth more or less than their original cost. The above table and graph below do not reflect the deduction of taxes that a shareholder would pay on fund distributions or the redemption of shares. Please visit Virtus.com for performance data current to the most recent month-end.
| 1 | Total returns are historical and include changes in share price and the reinvestment of both dividends and capital gains distributions. |
| 2 | “NAV” (Net Asset Value) total returns do not include the effect of any sales charge. |
| 3 | “POP” (Public Offering Price) total returns include the effect of the maximum front-end 5.75% sales charge. |
| 4 | “CDSC” (Contingent Deferred Sales Charge) is applied to redemptions of certain classes of shares that do not have a sales charge applied at the time of purchase. CDSC charges for certain redemptions of Class A shares made within 18 months of purchase in which a finder’s fee was paid and all redemptions of Class C shares within the first year are 1% and 0% thereafter. |
| 5 | The since inception index returns are from the Fund’s inception date. |
| 6 | The expense ratios of the Fund are set forth according to the prospectus for the Fund effective January 28, 2015, as supplemented and revised, and may differ from the expense ratios disclosed in the Financial Highlights tables in this report. See the Financial Highlights for more current expense ratios. Net Expense: Expenses reduced by the contractual fee waiver in effect thru January 31, 2017. For the period of October 1, 2014, through August 31, 2015, the waiver was voluntary. Gross Expense: Does not reflect the effect of the fee waiver. |
Growth of $10,000 For periods ended 9/30
This chart assumes an initial investment of $10,000 made on April 21, 2009 (inception date of the Fund), for Class A, Class C, and Class I shares including any applicable sales charges or fees. Performance assumes reinvestment of dividends and capital gain distributions.
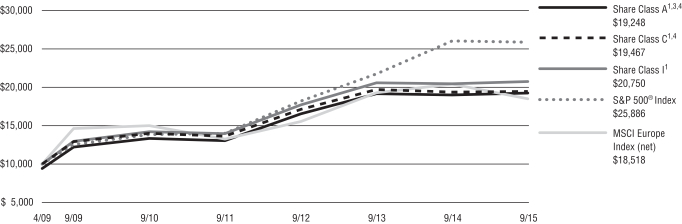
The indexes are unmanaged and not available for direct investment; therefore, their performance does not reflect the expenses associated with active management of an actual portfolio.
For information regarding the indexes and certain investment terms, see the Key Investment Terms starting on page 4.
25
Table of Contents
Fund Summary | Ticker Symbols: Class A: VIEAX Class C: VIECX Class I: VIIEX |
Portfolio Manager Commentary by Euclid Advisors LLC
| ¢ | The Fund is diversified and has an investment objective of long-term capital appreciation. |
| ¢ | For the fiscal year ended September 30, 2015, the Fund’s Class A shares at NAV returned -9.43%, Class C shares returned -10.01%, and Class I shares returned -9.14%. For the same period, the S&P 500® Index, a broad-based equity index, returned -0.61%, and the MSCI EAFE® Index (net), the Fund’s style-specific benchmark appropriate for comparison, returned -8.66%. |
All performance figures assume reinvestment of distributions and exclude the effect of sales charges. Past performance is no guarantee of future results, and current performance may be higher or lower than the performance shown above.
How did the markets perform during the Fund’s fiscal year?
Developed international stock markets, as represented by the MSCI EAFE® Index (net), declined 8.7% during the Fund’s fiscal year. It was a volatile year as weakness in the first fiscal quarter, gave way to optimism over economic growth that erased the deficit and produced a 4.0% gain through the end of July. Unfortunately, that optimism faded quickly and the MSCI EAFE® Index lost 12.1% in the final two months of the year on fears of a global economic slowdown as China devalued the yuan in an attempt to boost its export-driven economy. To place the move into perspective, it was the worst consecutive two-month performance period since May 2012 when Europe was in the throes of a banking crisis and Japan was just months away from embracing the fiscal, monetary, and structural reforms that would become known as Abenomics. Portfolios that were positioned in defensive or consumer-related sectors, with the exception of utilities, benefited from the stability of cash flows and non-cyclical nature of many of their businesses.
Energy stocks continued the pattern of weakness recently that they exhibited when OPEC surprised the markets last Thanksgiving by voting not to curtail production despite weaker prices. Not much had changed as of the end of the fiscal year, as demand continued to grow but supply continued to grow
faster. Brent crude oil declined about 40% in the first fiscal quarter. Prices then stabilized in the spring and summer before falling another 30% to close the fiscal year. Basic materials were also victims of global economic slowdown concerns. Copper, iron ore, and nickel suffered double-digit declines and currencies of commodity-producing nations weakened relative to the U.S. dollar. In fact, the stronger dollar reduced international investors’ returns by roughly 7% as the MSCI EAFE® Index (net) returned -1.7% in local currency terms.
Japanese equity markets continued to benefit from policy changes brought on by Prime Minister Abe. Many companies have embraced better corporate governance and put cash to more productive use. This has been reflective in corporate earnings which grew 24% to a record ¥20 trillion ($170 billion). We believe that there is room for continued upside as strong bottom-up fundamentals are supported by the tailwinds of economic reform and monetary policy.
What factors affected the Fund’s performance during its fiscal year?
For the fiscal year ended September 30, 2015, the Fund performed in line with its primary benchmark and peer group. In a volatile year, strong relative sector allocation performance was partially offset by individual stock selection.
The Fund added the greatest amount of relative performance in the health care, telecommunications, and industrial sectors. Reflecting superior stock selection, all three sectors posted positive absolute returns in the Fund while corresponding returns in the benchmark were negative. In addition, the significant overweight positions in health care and telecommunications combined with an underweight to industrials also contributed to additional performance gains.
Conversely, the Fund’s holdings in energy, financials, and consumer staples underperformed their benchmark counterparts. Overweight positions in energy and financials also detracted from relative returns, and an underweight to consumer staples, which was the only sector in the benchmark which managed a positive return, was likewise a negative factor. The Fund reduced its weighting in energy and financials over the course of the year, and still maintains a meaningful underweight to consumer
staples. We believe that the sector remains expensive and that stable cash flows may be purchased more cheaply in other areas.
From a regional perspective, the Fund maintained a significant overweight position to Japan for reasons outlined above, and the country exposure was the largest source of absolute and relative returns for the period. An underweight to commodity producer Australia, which struggled, was negated by an overweight to select Canadian names, which were weak. In aggregate, emerging markets holdings detracted from performance and were gradually eliminated throughout the year and replaced with holdings in Europe and the U.K., regions in the midst of a cyclical recovery with less volatility than their peers in the developing world.
The preceding information is the opinion of portfolio management. Any such opinions are subject to change at any time based upon market or other conditions and should not be relied upon as investment advice. Past performance is no guarantee of future results, and there is no guarantee that market forecasts will be realized.
There is no guarantee that the Fund will meet its objective.
| Asset Allocation | ||||
The following table presents asset allocations within certain sectors and as a percentage of total investments as of September 30, 2015.
|
| |||
Financials | 20 | % | ||
Consumer Discretionary | 16 | |||
Health Care | 15 | |||
Telecommunication Services | 11 | |||
Information Technology | 8 | |||
Industrials | 6 | |||
Consumer Staples | 3 | |||
Energy | 2 | |||
Other (includes short-term investments and securities lending collateral) | 19 | |||
|
| |||
Total | 100 | % | ||
|
| |||
Equity Securities: The market price of equity securities may be adversely affected by financial market, industry, or issuer-specific events. Focus on a particular style or on small or medium-sized companies may enhance that risk.
For information regarding the indexes and certain investment terms, see the Key Investment Terms starting on page 4.
26
Table of Contents
| International Equity Fund (Continued) |
Foreign & Emerging Markets: Investing internationally, especially in emerging markets, involves additional risks such as currency, political, accounting, economic, and market risk.
Derivatives: Investments in derivatives such as futures, options, forwards, and swaps may increase volatility or cause a loss greater than the principal investment.
Geographic Concentration: A fund that focuses its investments in a particular geographic location will be highly sensitive to financial, economic, political, and other developments affecting the fiscal stability of that location.
Prospectus: For additional information on risks, please see the Fund’s prospectus.
For information regarding the indexes and certain investment terms, see the Key Investment Terms starting on page 4.
27
Table of Contents
International Equity Fund (Continued)
| Average Annual Total Returns1 for periods ended 9/30/15 | ||||||||||||||||
| 1 year | 5 years | Since Inception | Inception Date | |||||||||||||
| Class A Shares at NAV2 | -9.43 | % | 4.56 | % | 4.87 | % | 9/16/10 | |||||||||
| Class A Shares at POP3,4 | -14.63 | 3.32 | 3.64 | 9/16/10 | ||||||||||||
| Class C Shares at NAV2 and with CDSC4 | -10.01 | 3.72 | 4.02 | 9/16/10 | ||||||||||||
| Class I Shares at NAV | -9.14 | 4.75 | 5.06 | 9/16/10 | ||||||||||||
| S&P 500® Index | -0.61 | 13.34 | 13.56 | 5 | — | |||||||||||
| MSCI EAFE® Index (net) | -8.66 | 3.98 | 4.46 | 5 | — | |||||||||||
Fund Expense Ratios6: A Shares: Gross 2.43%, Net 1.50%; C Shares: Gross 3.18%, Net 2.25%; I Shares: Gross 2.18%, Net 1.25%.
All returns represent past performance which is no guarantee of future results. Current performance may be higher or lower than the performance shown. The investment return and principal value of an investment will fluctuate so that an investor’s shares, when redeemed, may be worth more or less than their original cost. The above table and graph below do not reflect the deduction of taxes that a shareholder would pay on fund distributions or the redemption of shares. Please visit Virtus.com for performance data current to the most recent month-end.
| 1 | Total returns are historical and include changes in share price and the reinvestment of both dividends and capital gains distributions. |
| 2 | “NAV” (Net Asset Value) total returns do not include the effect of any sales charge. |
| 3 | “POP” (Public Offering Price) total returns include the effect of the maximum front-end 5.75% sales charge. |
| 4 | “CDSC” (Contingent Deferred Sales Charge) is applied to redemptions of certain classes of shares that do not have a sales charge applied at the time of purchase. CDSC charges for certain redemptions of Class A shares made within 18 months of purchase in which a finder’s fee was paid and all redemptions of Class C shares within the first year are 1% and 0% thereafter. |
| 5 | The since inception index returns are from the Fund’s inception date. |
| 6 | The expense ratios of the Fund are set forth according to the prospectus for the Fund effective January 28, 2015, as supplemented and revised, and may differ from the expense ratios disclosed in the Financial Highlights tables in this report. See the Financial Highlights for more current expense ratios. Net Expense: Expenses reduced by the contractual fee waiver in effect through January 31, 2017. For the period of October 1, 2014, through August 31, 2015, the waiver was voluntary. Gross Expense: Does not reflect the effect of the fee waiver. |
Growth of $10,000 For periods ended 9/30
This chart assumes an initial investment of $10,000 made on September 16, 2010 (inception date of the Fund), for Class A, Class C, and Class I shares including any applicable sales charges or fees. Performance assumes reinvestment of dividends and capital gain distributions.
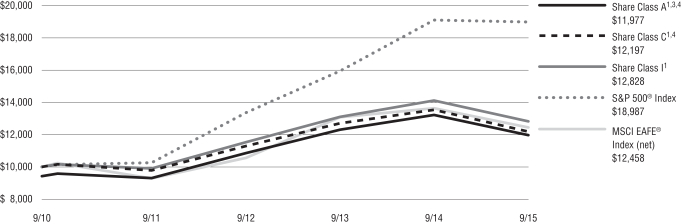
The indexes are unmanaged and not available for direct investment; therefore, their performance does not reflect the expenses associated with active management of an actual portfolio.
For information regarding the indexes and certain investment terms, see the Key Investment Terms starting on page 4.
28
Table of Contents
International Real Estate Securities Fund
Fund Summary | Ticker Symbols: Class A: PXRAX Class C: PXRCX Class I: PXRIX |
Portfolio Manager Commentary by Duff & Phelps Investment Management Co.
| ¢ | The Fund is diversified and has a primary investment objective of long-term capital appreciation, with a secondary investment objective of income. |
| ¢ | For the fiscal year ended September 30, 2015, the Fund’s Class A shares at NAV returned 0.94%, Class C shares returned 0.29%, and Class I shares returned 1.31%. For the same period, the S&P 500® Index, a broad-based equity index, returned -0.61%, and the FTSE EPRA/NAREIT Developed Rental ex U.S. Index (net), the Fund’s style-specific benchmark appropriate for comparison, returned 0.57%. |
All performance figures assume reinvestment of distributions and exclude the effect of sales charges. Past performance is no guarantee of future results, and current performance may be higher or lower than the performance shown above.
How did the markets perform during the Fund’s fiscal year?
The performance of international real estate equities significantly outperformed international equities as demonstrated by the 0.6% increase in the benchmark FTSE EPRA NAREIT Developed Rental ex U.S. Index versus the 8.7% drop in the MSCI EAFE® Index, both expressed in U.S. dollar terms. International real estate equities also outperformed U.S. equities during the period, but by a smaller margin, as represented by the 0.6% decrease in the S&P 500® Index during the fiscal year.
Taking a closer look at the performance of individual countries represented within the FTSE EPRA NAREIT Developed Rental ex U.S. Index, the five top-performing countries during the fiscal year on a total return basis measured in U.S. dollars were Germany, the U.K., Italy, Sweden, and Spain. Not surprisingly, the top performers had a decidedly European flavor. The launch of European style quantitative easing was a powerful force behind the performance for several of the top countries during the fiscal year, and its strength was more than enough to offset the decline in the euro relative to the U.S. dollar. Germany finished the period in the number one spot driven by the ongoing positive performance of its apartment companies, which are disproportionately represented in the Index. A positive fundamental landscape and a
strong bid for German apartments drove capitalization rates lower and asset values higher.
Following the surprise May election win by the Conservative party, U.K. real estate equities and the British pound posted healthy rallies relative to their global developed market peers, helping drive the second best total returns by country during the fiscal year. Moreover, similar to German apartments, U.K. real estate continues to benefit from the dual tailwinds of a positive rental rate and capital cycle, which is only present in a few other countries on a global basis.
Italian, Swedish, and Spanish real estate shares also outperformed during the period as institutional real estate capital continued to flow into these markets looking to participate in better expected economic growth in the case of Sweden and Spain and recovering real estate values in the case of Italy and Spain.
The five bottom-performing countries during the fiscal year were Norway, Greece, Singapore, Canada, and Finland. All five delivered negative total returns for the period. During the fiscal year, the Norwegian krone and the Canadian dollar took it on the chin relative to the U.S dollar as oil prices collapsed. This was a significant factor behind Norway and Canada’s poor return performance. A deteriorating political situation in Greece and a continued decline in the euro relative to the U.S. dollar were contributors to the weak returns from Greece. Finnish returns experienced a knock-on effect from the growing problems in Russia, which weighed on the performance of its economy. Singapore was one of the weaker performing countries during the period given its ties to China and poor underlying real estate fundamentals.
Thematically, real estate companies remained active on the capital raising front, particularly in the U.S., Europe excluding the U.K., and Japan as they looked to fund redevelopment, development, and acquisitions of recently acquired companies or portfolios of assets. Portfolio pruning and asset recycling as an additional source of capital was more evident in the U.S than other markets, as is often the case. We also witnessed a pick-up in mergers and acquisition activity as several privatization deals were announced in the U.S. and public-to-public mergers were announced in the U.S. and Europe excluding the
U.K. With the significant amount of real estate private equity capital that has been raised, but currently remains unspent, and the more attractive valuations on offer by publicly traded real estate securities, we expect M&A activity to continue, if not accelerate, over the coming year.
Our global travels during the period brought us to several countries and cities in the European and Asia Pacific regions and were helpful in providing timely updates on the space and asset markets in each respective locale. Additionally, quality time was spent with existing strategy holdings and conducting due diligence on potential new investment opportunities. At a high level, the strong appetite for high-quality commercial real estate from a wide and deep pool of institutional capital sources was evident across most locations as reflected in recent asset market pricing trends. Space market trends were more varied throughout the markets visited, but were notably robust for Central London real estate, German residential, and Dublin office. The Hong Kong office space market, particularly in the country’s central region, was also surprisingly healthy, benefiting from an increase in demand from Mainland China firms. Among the noted property sectors and markets, new development over the visible horizon remains contained with the exception of Dublin office.
What factors affected the Fund’s performance during its fiscal year?
For the one-year period ended September 30, 2015, the Fund outperformed its style-specific benchmark. The Fund’s performance was driven solely by security selection, as country allocation detracted from performance over the period.
From a country perspective, the most significant positive contributor to relative performance was our allocation to and stock selection within the U.K. At the security level within the U.K., our overweight exposure to a student housing real estate company had the largest positive impact on performance, as this company benefited from a positive fundamental backdrop for student housing and a very active transaction market for student housing properties at firm values. Overweight positions to the two largest publicly traded self-storage REITs in the U.K. also contributed positively to our U.K. stock selection.
For information regarding the indexes and certain investment terms, see the Key Investment Terms starting on page 4.
29
Table of Contents
| International Real Estate Securities Fund (Continued) |
The second most meaningful positive contributor at a country level to relative performance was our underweight allocation to and stock selection within Canada. Canadian real estate shares delivered a negative total return over the period as a weak economy and the significant depreciation of the Canadian dollar relative to the U.S. dollar weighed on the performance of the shares.
From a country perspective, the most significant detractor from relative performance during the fiscal year was our overweight allocation to Mexico. On a local currency basis, the combined performance of the Fund’s two Mexican industrial-focused REITs was positive; however, the significant decline in the Mexican peso over the period was a major headwind and drove the negative performance.
The second most meaningful detractor at a country level from relative performance was our underweight exposure to and stock selection within Sweden. Swedish real estate shares posted a positive total return over the period and benefited from a healthier economy relative to Europe as a whole and the positive inflow of institutional capital into its real estate market, which lifted the asset market in the country, particularly its major capital city of Stockholm.
The preceding information is the opinion of portfolio management. Any such opinions are subject to change at any time based upon market or other conditions and should not be relied upon as investment advice. Past performance is no guarantee of future results, and there is no guarantee that market forecasts will be realized.
There is no guarantee that the Fund will meet its objectives.
| Asset Allocation | ||||
The following table presents asset allocations within certain sectors and as a percentage of total investments as of September 30, 2015.
|
| |||
Financials | 31 | % | ||
Retail REITs | 30 | |||
Real Estate Operating Companies | 13 | |||
Diversified REITs | 12 | |||
Office REITs | 9 | |||
Specialized REITs | 3 | |||
Industrial REITs | 2 | |||
|
| |||
Total | 100 | % | ||
|
| |||
Equity Securities: The market price of equity securities may be adversely affected by financial market, industry, or issuer-specific events. Focus on a particular style or on small or medium-sized companies may enhance that risk.
Industry/Sector Concentration: A fund that focuses its investments in a particular industry or sector will be more sensitive to conditions that affect that industry or sector than a non-concentrated fund.
Real Estate: The Fund may be negatively affected by factors specific to the real estate market, including interest rates, leverage, property, and management.
Foreign Investing: Investing internationally involves additional risks such as currency, political, accounting, economic, and market risk.
Prospectus: For additional information on risks, please see the Fund’s prospectus.
For information regarding the indexes and certain investment terms, see the Key Investment Terms starting on page 4.
30
Table of Contents
International Real Estate Securities Fund (Continued)
| Average Annual Total Returns1 for periods ended 9/30/15 | ||||||||||||||||
| 1 year | 5 years | Since Inception | Inception Date | |||||||||||||
| Class A Shares at NAV2 | 0.94 | % | 7.23 | % | 0.61 | % | 10/1/07 | |||||||||
| Class A Shares at POP3,4 | -4.87 | 5.97 | -0.13 | 10/1/07 | ||||||||||||
| Class C Shares at NAV2 and with CDSC4 | 0.29 | 6.42 | -0.15 | 10/1/07 | ||||||||||||
| Class I Shares at NAV | 1.31 | 7.51 | 0.86 | 10/1/07 | ||||||||||||
| S&P 500® Index | -0.61 | 13.34 | 4.99 | 5 | — | |||||||||||
| FTSE EPRA/NAREIT Developed Rental ex U.S. Index (net) | 0.57 | 7.03 | -0.58 | 5 | — | |||||||||||
Fund Expense Ratios6: A Shares: Gross 1.73%, Net 1.50%; C Shares: Gross 2.48%, Net 2.25%; I Shares: Gross 1.48%, Net 1.25%.
All returns represent past performance which is no guarantee of future results. Current performance may be higher or lower than the performance shown. The investment return and principal value of an investment will fluctuate so that an investor’s shares, when redeemed, may be worth more or less than their original cost. The above table and graph below do not reflect the deduction of taxes that a shareholder would pay on fund distributions or the redemption of shares. Please visit Virtus.com for performance data current to the most recent month-end.
| 1 | Total returns are historical and include changes in share price and the reinvestment of both dividends and capital gains distributions. |
| 2 | “NAV” (Net Asset Value) total returns do not include the effect of any sales charge. |
| 3 | “POP” (Public Offering Price) total returns include the effect of the maximum front-end 5.75% sales charge. |
| 4 | “CDSC” (Contingent Deferred Sales Charge) is applied to redemptions of certain classes of shares that do not have a sales charge applied at the time of purchase. CDSC charges for certain redemptions of Class A shares made within 18 months of purchase in which a finder’s fee was paid and all redemptions of Class C shares within the first year are 1% and 0% thereafter. |
| 5 | The since inception index returns are from the Fund’s inception date. |
| 6 | The expense ratios of the Fund are set forth according to the prospectus for the Fund effective January 28, 2015, as supplemented and revised, and may differ from the expense ratios disclosed in the Financial Highlights tables in this report. See the Financial Highlights for more current expense ratios. Net Expense: Expenses reduced by the contractual fee waiver in effect through January 31, 2017. For the period of October 1, 2014, through August 31, 2015, the waiver was voluntary. Gross Expense: Does not reflect the effect of the fee waiver. |
Growth of $10,000 For periods ended 9/30
This chart assumes an initial investment of $10,000 made on October 1, 2007 (inception date of the Fund), for Class A, Class C, and Class I shares including any applicable sales charges or fees. Performance assumes reinvestment of dividends and capital gain distributions.
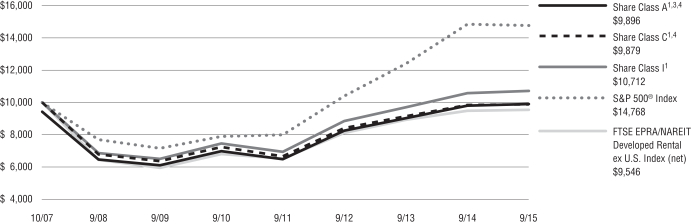
The indexes are unmanaged and not available for direct investment; therefore, their performance does not reflect the expenses associated with active management of an actual portfolio.
For information regarding the indexes and certain investment terms, see the Key Investment Terms starting on page 4.
31
Table of Contents
Fund Summary | Ticker Symbols: Class A: VISAX Class C: VCISX Class I: VIISX Class R6: VRISX |
Portfolio Manager Commentary by Kayne Anderson Rudnick Investment Management, LLC
| ¢ | The Fund is diversified and has an investment objective of capital appreciation. |
| ¢ | For the fiscal year ended September 30, 2015, the Fund’s Class A shares at NAV returned -12.58%, Class C shares returned -13.28%, Class I shares returned -12.43% and Class R6 shares from November 12, 2014 (inception date), through September 30, 2015, returned -10.41%*. For the same period, the S&P 500® Index, a broad-based equity index, returned -0.61%, and the MSCI AC World ex U.S. Small Cap Index (net), the Fund’s style-specific benchmark appropriate for comparison, returned -6.42%. |
| * | Returns less than 1 year are not annualized. |
All performance figures assume reinvestment of distributions and exclude the effect of sales charges. Past performance is no guarantee of future results, and current performance may be higher or lower than the performance shown above.
How did the markets perform during the Fund’s fiscal year?
The MSCI All Country World ex USA Small Cap Index declined 6.42% in a volatile year for global equity markets. While the benchmark return was positive in local currencies, the strong appreciation of the dollar meant that the return in dollar terms was negative. The strong dollar was fueled by the anticipation of an eventual increase in interest rates in the United States while at the same time the European Central Bank and the Bank of Japan continued to pursue monetary stimulus to bolster their economies. In addition, as macroeconomic uncertainty increased, many investors sought out the relative safety of U.S. dollar denominated assets.
The best performing regions over the last fiscal year were Europe and Japan, which benefited from ongoing quantitative easing. Asia ex-Japan, Latin America, and Africa all had significant declines. In
general, markets tied to China in one way or another performed poorly. This included countries where commodities play a large role in the economy, such as Australia, Canada, and Brazil. It also included markets closely tied to China economically, such as Hong Kong and Taiwan.
In terms of sectors, energy and materials were the worst performers, driven by increased supply and slowing demand from China. More defensive sectors, such as consumer staples and healthcare, had positive returns and significantly outperformed.
What factors affected the Fund’s performance during its fiscal year?
The Fund underperformed its benchmark during the fiscal year. The primary driver of the underperformance was geographic allocation. In general, the Fund had higher weights in regions that underperformed, such as Latin America and Asia ex-Japan, and lower weights in regions that performed well, such as Europe and Japan.
Fund performance was also negatively impacted by the severe decline in the shares of Tegma Gestao Logistica, the largest automotive logistics company in Brazil. Automotive sales and production in Brazil declined dramatically over the last two years as the challenging economic backdrop descended into a crisis. While this development certainly had a negative impact on the near-term profitability of Tegma, the current valuation is extremely depressed relative to what we believe is the fair value of the business. For this reason, we continue to hold our position.
The preceding information is the opinion of portfolio management. Any such opinions are subject to change at any time based upon market and or other conditions and should not be relied upon as investment advice. Past performance is no guarantee of future results, and there is no guarantee market forecasts will be realized.
There is no guarantee that the Fund will meet its objective.
| Asset Allocation | ||||
The following table presents asset allocations within certain sectors and as a percentage of total investments as of September 30, 2015.
|
| |||
Information Technology | 24 | % | ||
Financials | 21 | |||
Industrials | 16 | |||
Consumer Discretionary | 13 | |||
Consumer Staples | 8 | |||
Materials | 7 | |||
Health Care | 6 | |||
Other (includes short-term investments) | 5 | |||
|
| |||
Total | 100 | % | ||
|
| |||
Equity Securities: The market price of equity securities may be adversely affected by financial market, industry, or issuer-specific events. Focus on a particular style or on small or medium-sized companies may enhance that risk.
Foreign & Emerging Markets: Investing internationally, especially in emerging markets, involves additional risks such as currency, political, accounting, economic, and market risk.
Limited Number of Investments: Because the Fund has a limited number of securities, it may be more susceptible to factors adversely affecting its securities than a less concentrated fund.
Industry/Sector Concentration: A fund that focuses its investments in a particular industry or sector will be more sensitive to conditions that affect that industry or sector than a non-concentrated fund.
Prospectus: For additional information on risks, please see the Fund’s prospectus.
For information regarding the indexes and certain investment terms, see the Key Investment Terms starting on page 4.
32
Table of Contents
International Small-Cap Fund (Continued)
| Average Annual Total Returns1 for periods ended 9/30/15 | ||||||||||||
| 1 year | Since Inception | Inception Date | ||||||||||
| Class A Shares at NAV2 | -12.58 | % | 7.30 | % | 9/5/12 | |||||||
| Class A Shares at POP3,4 | -17.61 | 5.25 | 9/5/12 | |||||||||
| Class C Shares at NAV2 and with CDSC4 | -13.28 | 6.50 | 9/5/12 | |||||||||
| Class I Shares at NAV | -12.43 | 7.57 | 9/5/12 | |||||||||
| Class R6 Shares at NAV | — | -10.41 | 11/12/14 | |||||||||
| S&P 500® Index | -0.61 | — | 5 | — | ||||||||
| MSCI AC World ex U.S. Small Cap Index (net) | -6.42 | — | 6 | — | ||||||||
Fund Expense Ratios7: A Shares: Gross 1.75%, Net 1.60%; C Shares: Gross 2.50%, Net 2.35%; I Shares: Gross 1.50%, Net 1.35%; R6 Shares: Gross 1.41%, Net 1.26%.
All returns represent past performance which is no guarantee of future results. Current performance may be higher or lower than the performance shown. The investment return and principal value of an investment will fluctuate so that an investor’s shares, when redeemed, may be worth more or less than their original cost. The above table and graph below do not reflect the deduction of taxes that a shareholder would pay on fund distributions or the redemption of shares. Please visit Virtus.com for performance data current to the most recent month-end.
| 1 | Total returns are historical and include changes in share price and the reinvestment of both dividends and capital gains distributions. |
| 2 | “NAV” (Net Asset Value) total returns do not include the effect of any sales charge. |
| 3 | “POP” (Public Offering Price) total returns include the effect of the maximum front-end 5.75% sales charge. |
| 4 | “CDSC” (Contingent Deferred Sales Charge) is applied to redemptions of certain classes of shares that do not have a sales charge applied at the time of purchase. CDSC charges for certain redemptions of Class A shares made within 18 months of purchase in which a finder’s fee was paid and all redemptions of Class C shares within the first year are 1% and 0% thereafter. |
| 5 | The index returned -4.06% for Class R6 shares and 13.12% for Class I shares from the inception date of the respective share class. |
| 6 | The index returned -3.51% for Class R6 shares and 7.24% for Class I shares from the inception date of the respective share class. |
| 7 | The expense ratios of the Fund are set forth according to the prospectus for the Fund effective January 28, 2015, as supplemented and revised, and may differ from the expense ratios disclosed in the Financial Highlights tables in this report. See the Financial Highlights for more current expense ratios. Net Expense: Expenses reduced by the contractual fee waiver in effect through January 31, 2017. For the period of October 1, 2014, through August 31, 2015, the waiver was voluntary. Gross Expense: Does not reflect the effect of the fee waiver. |
Growth of $10,000 For periods ended 9/30
This chart assumes an initial investment of $10,000 made on September 5, 2012 (inception date of the Fund), for Class A, Class C, and Class I shares including any applicable sales charges or fees. Performance assumes reinvestment of dividends and capital gain distributions.
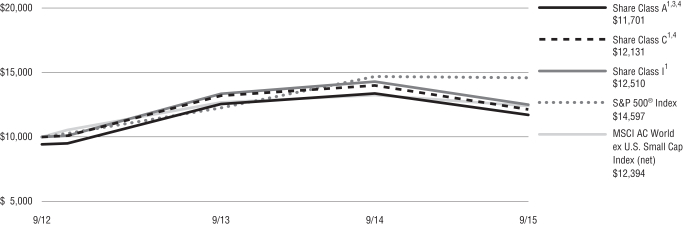
The indexes are unmanaged and not available for direct investment; therefore, their performance does not reflect the expenses associated with active management of an actual portfolio.
For information regarding the indexes and certain investment terms, see the Key Investment Terms starting on page 4.
33
Table of Contents
International Wealth Masters Fund
Fund Summary | Ticker Symbols: Class A: VIWAX Class C: VIWCX Class I: VWIIX |
Portfolio Manager Commentary by Horizon Asset Management, LLC
| ¢ | The Fund is diversified and has an investment objective of capital appreciation. |
| ¢ | For the fiscal period November 17, 2014 (inception date) through September 30, 2015, the Fund’s Class A shares at NAV returned -4.80%*, Class C shares returned -5.40%*, and Class I shares returned -4.60%*. For the same period, the S&P 500® Index, a broad-based equity index, returned -4.23%, and the MSCI EAFE® Index (net), the Fund’s style-specific benchmark appropriate for comparison, returned -6.77%*. |
| * | Returns less than 1 year are not annualized. |
All performance figures assume reinvestment of distributions and exclude the effect of sales charges. Past performance is no guarantee of future results, and current performance may be higher or lower than the performance shown above.
How did the markets perform during the Fund’s fiscal year?
During the period between the Fund’s inception on November 17, 2014 and September 30, 2015, the MSCI EAFE® Index returned -6.77%, while the S&P 500® Index returned -4.23%. The MSCI EAFE® Index fell at the end of 2014 as oil prices fell, then appreciated in the first half of 2015. The MSCI EAFE® Index fell again in July as investors weighed the prospect of Greek insolvency, and again in August as investors weighed a variety of headwinds facing the markets: oil prices remained low, concerns continued to grow regarding the strength of the Chinese economy, and the U.S. Federal Reserve did not raise interest rates.
Domestic equity mutual funds continued to experience net outflows, while international equity mutual funds had net inflows. At the same time, exchange-traded funds (ETFs) continued to gather assets. Given the float-adjusted, market cap weighted methodology used by most of the major indexes, the lion’s share of flows into ETFs tend to support the stock prices of the largest, most liquid companies. However, in our opinion, the business results of these companies have not necessarily improved; in fact, many of the largest companies have experienced
slowing revenue growth, and we believe that it will be increasingly difficult for them to expand revenues at a meaningful rate, even by acquisition.
What factors affected the Fund’s performance during its fiscal year?
The Fund is designed to track the Horizon Kinetics ISE International Wealth Index (the “International Wealth Index”), an index composed of non-U.S., exchange-listed companies owned and operated by some of the wealthiest, most successful investors, business executives, and entrepreneurs in the world (“owner-operators”). The Fund allows investors to readily leverage the business acumen of the highly-skilled individuals represented in the Index.
The Fund outperformed the benchmark during the period from November 17, 2014 to September 30, 2015. At the sector level, underweight exposure to financials and stock representation within that sector contributed positively to relative returns, as did stock representation within the industrials sector. Overweight exposure to consumer discretionary stocks also contributed meaningfully to outperformance. Stock selection within the materials and information technology sectors detracted from relative returns.
At the stock level, the five largest contributors to relative performance (and their owner-operators) were ACOM Co. Ltd. (Shigeyoshi Kinoshita), Pola Orbis Holdings Inc. (Satoshi Suzuki), Regus PLC S.A. (Mark Dixon), Start Today Co. Ltd. (Yusaku Maezawa), and Nexon Co. Ltd. (Kim Jungju). The five largest detractors from relative performance were Genel Energy plc (Nathaniel Rothschild), ArcelorMittal SA (Lakshmi Mittal), Seven West Media Ltd. (Kerry Stokes), Glencore plc. (Ivan Glasenberg), and Gree Inc. (Yoshikazu Tanaka).
The preceding information is the opinion of portfolio management. Any such opinions are subject to change at any time based upon market or other conditions and should not be relied upon as investment advice. Past performance is no guarantee of future results, and there is no guarantee that market forecasts will be realized.
There is no guarantee the Fund will meet its objective.
| Asset Allocation | ||||
The following table presents asset allocations within certain sectors and as a percentage of total investments as of September 30, 2015.
|
| |||
Consumer Discretionary | 30 | % | ||
Industrials | 15 | |||
Financials | 14 | |||
Consumer Staples | 11 | |||
Information Technology | 9 | |||
Materials | 6 | |||
Health Care | 4 | |||
Other (includes short-term investments and securities lending collateral) | 11 | |||
|
| |||
Total | 100 | % | ||
|
| |||
Equity Securities: The market price of equity securities may be adversely affected by financial market, industry, or issuer-specific events. Focus on a particular style or on small or medium-sized companies may enhance that risk.
Industry/Sector Concentration: A fund that focuses its investments in a particular industry or sector will be more sensitive to conditions that affect that industry or sector than a non-concentrated fund.
Foreign Investing: Investing internationally involves additional risks such as currency, political, accounting, economic, and market risk.
Prospectus: For additional information on risks, please see the Fund’s prospectus.
For information regarding the indexes and certain investment terms, see the Key Investment Terms starting on page 4.
34
Table of Contents
International Wealth Masters Fund (Continued)
| Average Annual Total Returns1 for periods ended 9/30/15 | ||||||||
| Since Inception | Inception Date | |||||||
| Class A Shares at NAV2 | -4.80 | % | 11/17/14 | |||||
| Class A Shares at POP3,4 | -10.27 | 11/17/14 | ||||||
| Class C Shares at NAV2 | -5.40 | 11/17/14 | ||||||
| Class C Shares with CDSC4 | -6.35 | 11/17/14 | ||||||
| Class I Shares at NAV2 | -4.60 | 11/17/14 | ||||||
| S&P 500® Index | -4.23 | 5 | — | |||||
| MSCI EAFE® Index (net) | -6.77 | 5 | — | |||||
Fund Expense Ratios6: A Shares: Gross 1.85%, Net 1.55%; C Shares: Gross 2.60%, Net 2.30%; I Shares: Gross 1.60%, Net 1.30%.
All returns represent past performance which is no guarantee of future results. Current performance may be higher or lower than the performance shown. The investment return and principal value of an investment will fluctuate so that an investor’s shares, when redeemed, may be worth more or less than their original cost. The above table and graph below do not reflect the deduction of taxes that a shareholder would pay on fund distributions or the redemption of shares. Please visit Virtus.com for performance data current to the most recent month-end.
| 1 | Total returns are historical and include changes in share price and the reinvestment of both dividends and capital gains distributions. |
| 2 | “NAV” (Net Asset Value) total returns do not include the effect of any sales charge. |
| 3 | “POP” (Public Offering Price) total returns include the effect of the maximum front-end 5.75% sales charge. |
| 4 | “CDSC” (Contingent Deferred Sales Charge) is applied to redemptions of certain classes of shares that do not have a sales charge applied at the time of purchase. CDSC charges for certain redemptions of Class A shares made within 18 months of purchase in which a finder’s fee was paid and all redemptions of Class C shares within the first year are 1% and 0% thereafter. |
| 5 | The since inception index returns are from the Fund’s inception date. |
| 6 | The expense ratios of the Fund are set forth according to the prospectus for the Fund effective January 28, 2015, as supplemented and revised, and may differ from the expense ratios disclosed in the Financial Highlights tables in this report. See the Financial Highlights for more current expense ratios. Net Expense: Expenses reduced by the contractual fee waiver in effect through January 31, 2016. Gross Expense: Does not reflect the effect of the fee waiver. |
Growth of $10,000 For periods ended 9/30
This chart assumes an initial investment of $10,000 made on November 17, 2014 (inception date of the Fund), for Class A, Class C, and Class I shares including any applicable sales charges or fees. Performance assumes reinvestment of dividends and capital gain distributions.
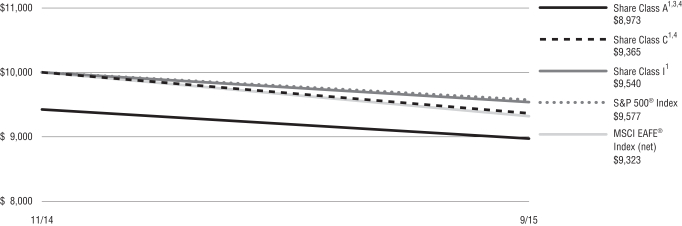
The indexes are unmanaged and not available for direct investment; therefore, their performance does not reflect the expenses associated with active management of an actual portfolio.
For information regarding the indexes and certain investment terms, see the Key Investment Terms starting on page 4.
35
Table of Contents
VIRTUS EMERGING MARKETS DEBT FUND
SCHEDULE OF INVESTMENTS
SEPTEMBER 30, 2015
($ reported in thousands)
| PAR VALUE | VALUE | |||||||
| FOREIGN GOVERNMENT SECURITIES—26.5% | ||||||||
Argentine Republic Series NY, | $ | 196 | $ | 201 | ||||
Bermuda RegS | 200 | 209 | ||||||
Bolivarian Republic of Venezuela | ||||||||
RegS | 30 | 25 | ||||||
RegS 7.750%, 10/13/19(4) | 140 | 49 | ||||||
7.650%, 4/21/25 | 285 | 95 | ||||||
9.375%, 1/13/34 | 325 | 115 | ||||||
Commonwealth of Jamaica | 200 | 201 | ||||||
Croatian Republic RegS | 200 | 211 | ||||||
Dominican Republic | ||||||||
144A | 100 | 99 | ||||||
144A | 100 | 96 | ||||||
Hellenic Republic | 200 | EUR | 157 | |||||
Hungary | ||||||||
5.375%, 2/21/23 | 146 | 159 | ||||||
5.750%, 11/22/23 | 22 | 25 | ||||||
5.375%, 3/25/24 | 60 | 65 | ||||||
Kingdom of Bahrain 144A | 200 | 169 | ||||||
Kingdom of Morocco 144A | 200 | 202 | ||||||
Mongolia 144A | 200 | 165 | ||||||
Pakistan Government International Bond 144A | 200 | 205 | ||||||
Republic of Armenia 144A | 200 | 189 | ||||||
Republic of Azerbaijan 144A | 200 | 187 | ||||||
Republic of Chile | 70,000 | CLP | 104 | |||||
Republic of Colombia Treasury Note, Series B, | 100,000 | COP | 36 | |||||
Republic of Costa Rica 144A | 200 | 177 | ||||||
Republic of Cote d’Ivoire 144A | 200 | 177 | ||||||
Republic of El Salvador | ||||||||
144A 6.375%, 1/18/27(3) | 155 | 137 | ||||||
144A 7.650%, 6/15/35(3) | 70 | 63 | ||||||
Republic of Indonesia | ||||||||
Series FR30, | 785,000 | IDR | 54 | |||||
Series FR63, | 624,000 | IDR | 33 | |||||
144A | 200 | 175 | ||||||
Republic of Iraq RegS | 250 | 173 | ||||||
Republic of Kazakhstan 144A | 200 | 159 | ||||||
Republic of Kenya 144A | 200 | 181 | ||||||
Republic of Lithuania 144A | 100 | 117 | ||||||
| PAR VALUE | VALUE | |||||||
| FOREIGN GOVERNMENT SECURITIES—continued | ||||||||
Republic of Panama | ||||||||
5.200%, 1/30/20 | $ | 200 | $ | 216 | ||||
3.750%, 3/16/25 | 200 | 193 | ||||||
Republic of Peru | 80 | 79 | ||||||
Republic of Poland | ||||||||
Series 1021, | 300 | PLN | 93 | |||||
4.000%, 1/22/24 | 149 | 158 | ||||||
Republic of Romania | ||||||||
144A 6.750%, 2/7/22(3) | 150 | 177 | ||||||
144A 4.875%, 1/22/24(3) | 84 | 91 | ||||||
RegS | 120 | 139 | ||||||
Republic of South Africa | ||||||||
Series R203, | 758 | ZAR | 56 | |||||
Series R208, | 1,470 | ZAR | 100 | |||||
Republic of Sri Lanka 144A | 200 | 194 | ||||||
Republic of Turkey | ||||||||
5.125%, 3/25/22 | 200 | 203 | ||||||
6.750%, 5/30/40 | 225 | 240 | ||||||
Republic of Uruguay | 400 | (8) | 351 | |||||
Russian Federal Bond - Ofz | 4,800 | 69 | ||||||
State of Qatar 144A | 200 | 245 | ||||||
United Mexican States Series M, | 614 | MXN | 38 | |||||
| TOTAL FOREIGN GOVERNMENT SECURITIES | ||||||||
| (Identified Cost $7,896) | 7,052 | |||||||
| CORPORATE BONDS AND NOTES—69.0% | ||||||||
| Barbados—0.8% | ||||||||
Columbus International, Inc. series B, 144A | 200 | 208 | ||||||
|
| |||||||
| Brazil—6.6% | ||||||||
Banco Santander Brasil SA 144A | 300 | BRL | 72 | |||||
Braskem America Finance Co. | 205 | 143 | ||||||
BRF SA | 400 | BRL | 82 | |||||
Fibria Overseas Finance Ltd. | 115 | 111 | ||||||
Itau Unibanco Holding SA RegS | 250 | 224 | ||||||
JBS Investments GmbH 144A | 200 | 193 | ||||||
Marfrig Overseas Ltd. 144A | 200 | 196 | ||||||
Odebrecht Finance Ltd. 144A | 200 | 115 | ||||||
| PAR VALUE | VALUE | |||||||
| Brazil—continued | ||||||||
Odebrecht Offshore Drilling Finance Ltd. 144A | $ | 181 | $ | 48 | ||||
Petrobras Global Finance BV | ||||||||
3.000%, 1/15/19 | 80 | 58 | ||||||
5.375%, 1/27/21 | 290 | 211 | ||||||
6.750%, 1/27/41 | 100 | 64 | ||||||
QGOG Constellation SA 144A | 200 | 89 | ||||||
Vale Overseas Ltd. | 200 | 159 | ||||||
|
| |||||||
| 1,765 | ||||||||
|
| |||||||
| Canada—0.1% | ||||||||
Eldorado Gold Corp. 144A | 45 | 40 | ||||||
|
| |||||||
| Chile—3.8% | ||||||||
Guanay Finance Ltd. 144A | 250 | 247 | ||||||
Inversiones CMPC S.A. 144A | 200 | 195 | ||||||
Latam Airlines Group SA 144A | 200 | 177 | ||||||
Transelec S.A. 144A | 200 | 197 | ||||||
VTR Finance B.V. 144A | 200 | 182 | ||||||
|
| |||||||
| 998 | ||||||||
|
| |||||||
| China—5.3% | ||||||||
Bank of China Ltd. 144A | 200 | 203 | ||||||
BOC Aviation Pte Ltd. | 200 | 206 | ||||||
China Cinda Finance Ltd. 144A | 200 | 202 | ||||||
CNOOC Finance USA LLC | 200 | 190 | ||||||
Kunlun Energy Co., Ltd. 144A | 200 | 192 | ||||||
State Grid Overseas Investment Ltd. 144A | 200 | 211 | ||||||
Tencent Holdings Ltd. 144A | 200 | 193 | ||||||
|
| |||||||
| 1,397 | ||||||||
|
| |||||||
| Colombia—0.8% | ||||||||
Bancolombia S.A. | 100 | 95 | ||||||
Ecopetrol SA | 70 | 61 | ||||||
Pacific Rubiales Energy Corp. 144A | 200 | 70 | ||||||
|
| |||||||
| 226 | ||||||||
|
| |||||||
| El Salvador—0.7% | ||||||||
AES El Salvador Trust II 144A | 200 | 179 | ||||||
|
| |||||||
See Notes to Financial Statements
36
Table of Contents
VIRTUS EMERGING MARKETS DEBT FUND
SCHEDULE OF INVESTMENTS (Continued)
SEPTEMBER 30, 2015
($ reported in thousands)
| PAR VALUE | VALUE | |||||||
| Georgia—0.8% | ||||||||
Bank of Georgia JSC 144A | $ | 200 | $ | 208 | ||||
|
| |||||||
| Guatemala—0.7% | ||||||||
Comcel Trust 144A | 200 | 197 | ||||||
|
| |||||||
| Hong Kong—2.1% | ||||||||
Bank of China Hong Kong Ltd. 144A | 200 | 216 | ||||||
Hutchison Whampoa International Ltd. Series 12, 144A | 325 | 338 | ||||||
|
| |||||||
| 554 | ||||||||
|
| |||||||
| India—4.2% | ||||||||
Bank of Baroda 144A | 200 | 213 | ||||||
Bharti Airtel International Netherlands BV 144A | 200 | 212 | ||||||
ICICI Bank Ltd. 144A | 300 | 305 | ||||||
Reliance Holdings USA, Inc. 144A | 250 | 273 | ||||||
Vedanta Resources plc 144A | 200 | 125 | ||||||
|
| |||||||
| 1,128 | ||||||||
|
| |||||||
| Indonesia—3.8% | ||||||||
Pelabuhan Indonesia II PT 144A | 200 | 175 | ||||||
Pertamina Persero PT | ||||||||
144A 4.875%, 5/3/22(3) | 200 | 191 | ||||||
144A 6.000%, 5/3/42(3) | 275 | 229 | ||||||
144A 5.625%, 5/20/43(3) | 200 | 156 | ||||||
Perusahaan Listrik Negara PT 144A | 250 | 252 | ||||||
|
| |||||||
| 1,003 | ||||||||
|
| |||||||
| Ireland—0.8% | ||||||||
Ardagh Finance Holdings SA PIK Interest Capitalization, 144A | 218 | 224 | ||||||
|
| |||||||
| Israel—0.8% | ||||||||
Israel Electric Corp. Ltd. RegS | 200 | 226 | ||||||
|
| |||||||
| Jamaica—0.7% | ||||||||
Digicel Group Ltd. 144A | 200 | 186 | ||||||
|
| |||||||
| PAR VALUE | VALUE | |||||||
| Kazakhstan—1.2% | ||||||||
Development Bank of Kazakhstan OJSC 144A | $ | 200 | $ | 171 | ||||
KazMunayGas National Co. JSC 144A | 200 | 145 | ||||||
|
| |||||||
| 316 | ||||||||
|
| |||||||
| Luxembourg—1.4% | ||||||||
Altice Financing SA Luxemborg, 144A | 200 | 176 | ||||||
Millicom International Cellular SA | 200 | 199 | ||||||
|
| |||||||
| 375 | ||||||||
|
| |||||||
| Mexico—7.0% | ||||||||
Alfa SAB de CV | 200 | 204 | ||||||
Alpek SA de C.V. 144A | 200 | 206 | ||||||
America Movil SAB de C.V. | 2,000 | MXN | 113 | |||||
Banco Bilbao Vizcaya Argentaria Bancomer S.A. 144A | 150 | 162 | ||||||
Banco Santander Mexico SA 144A | 200 | 206 | ||||||
Cemex SAB de CV 144A | 200 | 200 | ||||||
Fermaca Enterprises S de RL de CV 144A | 196 | 185 | ||||||
Fomento Economico Mexicano SAB de CV | 150 | 140 | ||||||
Grupo Televisa SAB | 2,000 | MXN | 100 | |||||
Petroleos Mexicanos | ||||||||
6.375%, 1/23/45 | 200 | 180 | ||||||
144A 5.625%, 1/23/46(3) | 200 | 164 | ||||||
|
| |||||||
| 1,860 | ||||||||
|
| |||||||
| Morocco—0.8% | ||||||||
Office Cherifien des Phosphates S.A. (OCP) 144A | 200 | 204 | ||||||
|
| |||||||
| Netherlands—0.7% | ||||||||
UPCB Finance IV Ltd. 144A | 200 | 189 | ||||||
|
| |||||||
| Panama—0.6% | ||||||||
Banco Latinoamericano de Comercio Exterior SA 144A | 150 | 152 | ||||||
|
| |||||||
| PAR VALUE | VALUE | |||||||
| Peru—2.3% | ||||||||
Banco de Credito del Peru | ||||||||
144A 5.375%, 9/16/20(3) | $ | 100 | $ | 107 | ||||
144A 6.125%, 4/24/27(2)(3) | 100 | 103 | ||||||
Banco Internacional del Peru SAA | ||||||||
144A 5.750%, 10/7/20(3) | 100 | 107 | ||||||
144A 6.625%, 3/19/29(2)(3) | 100 | 100 | ||||||
Transportadora de Gas del Peru SA 144A | 200 | 187 | ||||||
|
| |||||||
| 604 | ||||||||
|
| |||||||
| Poland—0.8% | ||||||||
PKO Finance AB 144A | 200 | 206 | ||||||
|
| |||||||
| Russia—5.5% | ||||||||
AHML Finance Ltd. 144A | 5,000 | RUB | 69 | |||||
EuroChem Mineral & Chemical Co. OJSC 144A | 200 | 199 | ||||||
Evraz Group S.A. 144A | 200 | 187 | ||||||
Gazprom OAO (Gaz Capital SA) 144A | 200 | 186 | ||||||
Lukoil OAO International Finance BV 144A | 200 | 178 | ||||||
Metalloinvest Finance Ltd. 144A | 200 | 189 | ||||||
Sberbank of Russia (Sberbank Capital SA) 144A | 200 | 184 | ||||||
Sberbank of Russia Via SB Capital SA REGS | 200 | 169 | ||||||
Severstal OAO (Steel Capital SA) 144A | 100 | 105 | ||||||
|
| |||||||
| 1,466 | ||||||||
|
| |||||||
| Singapore—0.8% | ||||||||
Oversea-Chinese Banking Corp. Ltd. 144A | 200 | 205 | ||||||
|
| |||||||
| South Africa—2.2% | ||||||||
Myriad International Holdings BV 144A | 200 | 196 | ||||||
Sappi Papier Holding GmbH 144A | 200 | 203 | ||||||
Transnet SOC Ltd. 144A | 200 | 185 | ||||||
|
| |||||||
| 584 | ||||||||
|
| |||||||
See Notes to Financial Statements
37
Table of Contents
VIRTUS EMERGING MARKETS DEBT FUND
SCHEDULE OF INVESTMENTS (Continued)
SEPTEMBER 30, 2015
($ reported in thousands)
| PAR VALUE | VALUE | |||||||
| South Korea—0.7% | ||||||||
Export-Import Bank of Korea | $ | 200 | $ | 195 | ||||
|
| |||||||
| Sri Lanka—0.8% | ||||||||
Bank of Ceylon 144A | 200 | 206 | ||||||
|
| |||||||
| Sultanate of Oman—0.7% | ||||||||
Lamar Funding Ltd. 144A | 200 | 187 | ||||||
|
| |||||||
| Supranational—2.3% | ||||||||
Africa Finance Corp. 144A | 200 | 201 | ||||||
Corp Andina de Fomento | 200 | 217 | ||||||
Eurasian Development Bank | 200 | 189 | ||||||
|
| |||||||
| 607 | ||||||||
|
| |||||||
| Thailand—0.8% | ||||||||
Bangkok Bank PLC 144A | 200 | 205 | ||||||
|
| |||||||
| Trinidad and Tobago—0.2% | ||||||||
Petroleum Co. of Trinidad & Tobago Ltd. RegS | 58 | 56 | ||||||
|
| |||||||
| Turkey—1.5% | ||||||||
Turkiye Garanti Bankasi AS 144A | 200 | 192 | ||||||
Turkiye Is Bankasi A.S 144A | 200 | 209 | ||||||
|
| |||||||
| 401 | ||||||||
|
| |||||||
| Ukraine—0.5% | ||||||||
Ukreximbank Via Biz Finance plc 144A | 150 | 132 | ||||||
|
| |||||||
| United Arab Emirates—2.2% | ||||||||
DP World Ltd. 144A | 250 | 264 | ||||||
IPIC GMTN Ltd. 144A | 250 | 330 | ||||||
|
| |||||||
| 594 | ||||||||
|
| |||||||
| United Kingdom—0.5% | ||||||||
EnQuest plc 144A | 200 | 125 | ||||||
|
| |||||||
| United States—1.6% | ||||||||
Aircastle Ltd. | 100 | 108 | ||||||
First Data Corp. | 107 | 119 | ||||||
Mallinckrodt International Finance S.A. 144A | 30 | 27 | ||||||
Owens-Brockway Glass Container, Inc. 144A 6.375%, 8/15/25(3) | 70 | 71 | ||||||
| PAR VALUE | VALUE | |||||||
| United States—continued | ||||||||
Parker Drilling Co. | $ | 50 | $ | 39 | ||||
Tronox Finance LLC | 80 | 51 | ||||||
|
| |||||||
| 415 | ||||||||
|
| |||||||
| Venezuela—1.9% | ||||||||
Petroleos de Venezuela SA | ||||||||
RegS 8.500%, 11/2/17(4) | 290 | 195 | ||||||
144A 6.000%, 5/16/24(3) | 555 | 180 | ||||||
RegS | 400 | 129 | ||||||
|
| |||||||
| 504 | ||||||||
| TOTAL CORPORATE BONDS AND NOTES (Identified Cost $20,338) | 18,327 | |||||||
| LOAN AGREEMENTS(2)—0.6% | ||||||||
| Consumer Discretionary—0.6% | ||||||||
Delta 2 (Lux) S.A.R.L. Tranche B-3, | 47 | 46 | ||||||
Laureate Education, Inc. 2018 Extended, | 148 | 124 | ||||||
| TOTAL LOAN AGREEMENTS (Identified Cost $193) | 170 | |||||||
| SHARES | ||||||||
| PREFERRED STOCK—0.7% | ||||||||
| Energy—0.7% | ||||||||
PTT Exploration & Production PCL 144A, | 200,000 | 193 | ||||||
| TOTAL PREFERRED STOCK (Identified Cost $201) | 193 | |||||||
| AFFILIATED MUTUAL FUND—0.6% | ||||||||
Virtus Credit Opportunities Fund | 14,824 | 144 | ||||||
| TOTAL AFFILIATED MUTUAL FUND (Identified Cost $148) | 144 | |||||||
| TOTAL LONG TERM INVESTMENTS—97.4% | ||||||||
| (Identified Cost $28,776) | 25,886 | |||||||
| SHORT-TERM INVESTMENTS—0.6% | ||||||||
| Money Market Mutual Fund—0.6% | ||||||||
Fidelity Money Market Portfolio – Institutional Shares (seven-day effective yield | 165,734 | 166 | ||||||
| TOTAL SHORT-TERM INVESTMENTS (Identified Cost $166) | 166 | |||||||
| TOTAL INVESTMENTS—98.0% (Identified Cost $28,942) | 26,052 | (1) | ||||||
Other assets and liabilities, net—2.0% |
| 524 | ||||||
|
| |||||||
| NET ASSETS—100.0% | $ | 26,576 | ||||||
|
| |||||||
Abbreviation:
| PIK | Payment-in-Kind Security |
Footnote Legend:
| (1) | Federal Income Tax Information: For tax information at September 30, 2015, see Note 10 Federal Income Tax Information in the Notes to Financial Statements. Non-income producing. |
| (2) | Variable or step coupon security; interest rate shown reflects the rate in effect at September 30, 2015. |
| (3) | Security exempt from registration under Rule 144A of the Securities Act of 1933. These securities may be resold in transactions exempt from registration, normally to qualified institutional buyers. At September 30, 2015, these securities amounted to a value of $17,952 or 67.5% of net assets. |
| (4) | Regulation S security. Security is offered and sold outside of the United States, therefore, it is exempt from registration with the SEC under rules 903 and 904 of the Securities Act of 1933. |
| (5) | This Note was issued for the sole purpose of funding a loan agreement between the issuer and the borrower. As the credit risk for this security lies solely with the borrower, the name represented here is that of the borrower. |
| (6) | No contractual maturity date. |
| (7) | Interest payments may be deferred. |
| (8) | Principal amount is adjusted pursuant to the change in the Index. |
| (9) | 100% of the income received was in cash. |
| (10) | Value shown as par value. |
| (11) | Security in default. |
Foreign Currencies:
| BRL | Brazilian Real |
| CLP | Chilean Peso |
| COP | Colombian Peso |
| EUR | Euro |
| IDR | Indonesian Rupiah |
| MXN | Mexican Peso |
| PLN | Polish Zloty |
| RUB | Russian Ruble |
| ZAR | South African Rand |
| Country Weightings (Unaudited)† | ||||
Brazil | 7 | % | ||
Mexico | 7 | |||
China | 6 | |||
Russia | 6 | |||
Indonesia | 5 | |||
Chile | 4 | |||
India | 4 | |||
Other | 61 | |||
Total | 100 | % | ||
† % of total investments as of September 30, 2015 |
| |||
Security abbreviation definitions are located under the Key Investment Terms starting on page 4.
See Notes to Financial Statements
38
Table of Contents
VIRTUS EMERGING MARKETS DEBT FUND
SCHEDULE OF INVESTMENTS (Continued)
SEPTEMBER 30, 2015
($ reported in thousands)
The following table provides a summary of inputs used to value the Fund’s investments as of September 30, 2015 (See Security Valuation Note 2A in the Notes to Financial Statements):
| Total Value at September 30, 2015 | Level 1 Quoted Prices | Level 2 Significant Observable Inputs | ||||||||||
Debt Securities: | ||||||||||||
Corporate Bonds and Notes | $ | 18,327 | $ | — | $ | 18,327 | ||||||
Foreign Government Securities | 7,052 | — | 7,052 | |||||||||
Loan Agreements | 170 | — | 170 | |||||||||
Equity Securities: | ||||||||||||
Preferred Stock | 193 | — | 193 | |||||||||
Affiliated Mutual Fund | 144 | 144 | | — | | |||||||
Short-Term Investments | 166 | 166 | — | |||||||||
|
|
|
|
|
| |||||||
Total Investments | $ | 26,052 | $ | 310 | $ | 25,742 | ||||||
|
|
|
|
|
| |||||||
There are no Level 3 (significant unobservable inputs) priced securities.
There were no transfers between Level 1 and Level 2 related to securities held at September 30, 2015.
See Notes to Financial Statements
39
Table of Contents
VIRTUS EMERGING MARKETS EQUITY INCOME FUND
SCHEDULE OF INVESTMENTS
SEPTEMBER 30, 2015
($ reported in thousands)
| SHARES | VALUE | |||||||
| PREFERRED STOCKS—2.2% | ||||||||
| Financials—1.3% | ||||||||
Banco Bradesco S.A. 0.660% (Brazil) | 77,300 | $ | 416 | |||||
Banco Davivienda S.A. 2.970% (Colombia) | 13,302 | 102 | ||||||
Banco do Estado do Rio Grande do Sul S.A., Class B 0.310% (Brazil) | 41,100 | 58 | ||||||
|
| |||||||
| 576 | ||||||||
|
| |||||||
| Materials—0.6% | ||||||||
Braskem SA (Brazil) | 19,900 | 84 | ||||||
Vale S.A. 8.250% (Brazil) | 51,900 | 174 | ||||||
|
| |||||||
| 258 | ||||||||
|
| |||||||
| Utilities—0.3% | ||||||||
Companhia Paranaense de Energia, Class B 2.560% (Brazil) | 15,900 | 132 | ||||||
| TOTAL PREFERRED STOCKS (Identified Cost $1,650) | 966 | |||||||
| COMMON STOCKS—98.2% | ||||||||
| Consumer Discretionary—8.7% | ||||||||
Astra International Tbk PT (Indonesia) | 478,000 | 171 | ||||||
Bajaj Auto Ltd. (India) | 7,982 | 282 | ||||||
Belle International Holdings Ltd. (China) | 198,000 | 172 | ||||||
Cheng Shin Rubber Industry Co., Ltd. (Taiwan) | 96,000 | 158 | ||||||
China Motor Corp. (Taiwan) | 338,000 | 238 | ||||||
Coway Co., Ltd. (South Korea) | 2,578 | 182 | ||||||
Cyrela Brazil Realty S.A. (Brazil) | 66,300 | 140 | ||||||
Estacio Participacoes SA (Brazil) | 36,800 | 129 | ||||||
Foschini Group Ltd. (The) (South Africa) | 23,592 | 239 | ||||||
Great Wall Motor Co., Ltd. Class H (China) | 160,500 | 179 | ||||||
Grupo Televisa S.A.B (Mexico) | 16,600 | 87 | ||||||
Halla Visteon Climate Control Corp. (South Korea) | 7,076 | 235 | ||||||
Kangwon Land, Inc. (South Korea) | 11,924 | 426 | ||||||
Kia Motors Corp. (South Korea) | 5,593 | 254 | ||||||
Lojas Americanas SA (Brazil) | 41,700 | 123 | ||||||
Lojas Renner S.A. (Brazil) | 40,500 | 189 | ||||||
Tofas Turk Otomobil Fabrikasi AS (Turkey) | 27,262 | 162 | ||||||
Truworths International Ltd. (South Africa) | 30,065 | 184 | ||||||
Tsogo Sun Holdings Ltd. (South Africa) | 132,372 | 231 | ||||||
|
| |||||||
| 3,781 | ||||||||
|
| |||||||
| Consumer Staples—6.2% | ||||||||
Ambev SA (Brazil) | 134,000 | 658 | ||||||
Fomento Economico Mexicano S.A.B. de CV (Mexico) | 42,300 | 378 | ||||||
Hindustan Unilever Ltd. (India) | 26,725 | 332 | ||||||
KT&G Corp. (South Korea) | 6,401 | 603 | ||||||
| SHARES | VALUE | |||||||
| Consumer Staples—continued | ||||||||
Raia Drogasil SA (Brazil) | 18,800 | $ | 185 | |||||
Spar Group Ltd. (The) (South Africa) | 28,600 | 382 | ||||||
Want Want China Holdings Ltd. (China) | 205,000 | 169 | ||||||
|
| |||||||
| 2,707 | ||||||||
|
| |||||||
| Energy—8.3% | ||||||||
China Petroleum & Chemical Corp. Class H (China) | 453,800 | 278 | ||||||
China Shenhua Energy Co., Ltd. Class H (China) | 190,000 | 292 | ||||||
CNOOC Ltd. (China) | 408,000 | 420 | ||||||
Coal India Ltd. (India) | 31,246 | 156 | ||||||
Cosan S.A. Industria e Comercio (Brazil) | 19,500 | 98 | ||||||
Empresas COPEC SA (Chile) | 12,825 | 116 | ||||||
Gazprom PAO (Gazstream S.A.) Sponsored ADR (Russia) | 131,390 | 534 | ||||||
Lukoil PJSC Sponsored ADR (Russia) | 4,700 | 160 | ||||||
PTT PCL (Thailand) | 34,100 | 227 | ||||||
Rosneft OJSC GDR (Russia) | 28,450 | 105 | ||||||
Sasol Ltd. (South Africa) | 14,060 | 393 | ||||||
Tambang Batubara Bukit Asam Persero Tbk PT (Indonesia) | 477,500 | 184 | ||||||
Tatneft PAO Sponsored ADR (Russia) | 13,522 | 379 | ||||||
Ultrapar Participacoes S.A. (Brazil) | 14,100 | 237 | ||||||
|
| |||||||
| 3,579 | ||||||||
|
| |||||||
| Financials—30.0% | ||||||||
Abu Dhabi Commercial Bank PJSC (United Arab Emirates) | 69,428 | 145 | ||||||
Agricultural Bank of China Ltd. Class H (China) | 1,063,000 | 404 | ||||||
AMMB Holdings Bhd (Malaysia) | 170,200 | 177 | ||||||
Banco de Chile (Chile) | 3,400,519 | 354 | ||||||
Banco do Brasil S.A. (Brazil) | 24,600 | 93 | ||||||
Banco Santander Chile SA (Chile) | 6,440,786 | 292 | ||||||
Bank of China Ltd. Class H (China) | 2,349,000 | 1,013 | ||||||
Barclays Africa Group Ltd. (South Africa) | 36,092 | 443 | ||||||
BB Seguridade Participacoes (Brazil) | 30,500 | 190 | ||||||
China Construction Bank Corp. Class H (China) | 1,923,000 | 1,283 | ||||||
China Everbright Bank Co., Ltd. (China) | 262,000 | 115 | ||||||
China Everbright Ltd. (China) | 66,000 | 152 | ||||||
China Life Insurance Co., Ltd. Class H (China) | 174,000 | 606 | ||||||
China Minsheng Banking Corp., Ltd. Class H (China) | 152,500 | 141 | ||||||
China Vanke Co., Ltd. Class H (China) | 87,500 | 188 | ||||||
Commercial Bank QSC (The) (Qatar) | 7,690 | 119 | ||||||
CTBC Financial Holding Co., Ltd. (Taiwan) | 732,236 | 379 | ||||||
| SHARES | VALUE | |||||||
| Financials—(continued) | ||||||||
Doha Bank QSC (Qatar) | 11,701 | $ | 162 | |||||
Dongbu Insurance Co., Ltd. (South Korea) | 6,376 | 331 | ||||||
Evergrande Real Estate Group Ltd. (China) | 608,000 | 347 | ||||||
Far East Horizon Ltd. (China) | 250,000 | 194 | ||||||
First Gulf Bank PJSC (United Arab Emirates) | 53,612 | 204 | ||||||
FirstRand Ltd. (South Africa) | 116,263 | 412 | ||||||
Gentera S.A.B de CV (Mexico) | 229,200 | 374 | ||||||
Hanwha Life Insurance Co., Ltd. (South Korea) | 43,370 | 299 | ||||||
Hyundai Marine & Fire Insurance Co., Ltd. (South Korea) | 17,217 | 439 | ||||||
Industrial & Commercial Bank of China Ltd. Class H (China) | 1,903,000 | 1,099 | ||||||
Komercni Banka A.S. (Czech Republic) | 1,796 | 389 | ||||||
Liberty Holdings Ltd. (South Africa) | 8,825 | 80 | ||||||
Malayan Banking Bhd (Malaysia) | 210,500 | 411 | ||||||
MMI Holdings Ltd. (South Africa) | 106,534 | 183 | ||||||
Power Finance Corp., Ltd. (India) | 79,324 | 279 | ||||||
Powszechny Zaklad Ubezpieczen S.A. (Poland) | 1,705 | 175 | ||||||
Qatar National Bank SAQ (Qatar) | 1,846 | 95 | ||||||
Redefine Properties Ltd. REIT (South Africa) | 403,351 | 341 | ||||||
Rural Electrification Corp., Ltd. (India) | 91,724 | 384 | ||||||
Samsung Life Insurance Co., Ltd. (South Korea) | 2,068 | 173 | ||||||
Siam Commercial Bank PCL (Thailand) | 37,500 | 139 | ||||||
Standard Bank Group Ltd. (South Africa) | 27,574 | 269 | ||||||
Sunac China Holdings Ltd. (China) | 298,000 | 156 | ||||||
|
| |||||||
| 13,029 | ||||||||
|
| |||||||
| Health Care—2.8% | ||||||||
Divi’s Laboratories Ltd. (India) | 22,996 | 392 | ||||||
Kalbe Farma Tbk PT (Indonesia) | 2,491,400 | 234 | ||||||
Richter Gedeon Nyrt (Hungary) | 22,424 | 356 | ||||||
Sinopharm Group Co., Ltd. Class H (China) | 69,600 | 245 | ||||||
|
| |||||||
| 1,227 | ||||||||
|
| |||||||
| Industrials—9.1% | ||||||||
Aboitiz Equity Ventures, Inc. (Philippines) | 154,710 | 191 | ||||||
Alfa S.A.B de C.V. Class A (Mexico) | 40,000 | 78 | ||||||
CTCI Corp. (Taiwan) | 204,000 | 244 | ||||||
Daewoo International Corp. (South Korea) | 17,859 | 314 | ||||||
Industries Qatar Qsc (Qatar) | 5,463 | 185 | ||||||
Jiangsu Expressway Co., Ltd. Class H (China) | 388,000 | 497 | ||||||
See Notes to Financial Statements
40
Table of Contents
VIRTUS EMERGING MARKETS EQUITY INCOME FUND
SCHEDULE OF INVESTMENTS (Continued)
SEPTEMBER 30, 2015
($ reported in thousands)
| SHARES | VALUE | |||||||
| Industrials—(continued) | ||||||||
LG Corp. (South Korea) | 6,781 | $ | 349 | |||||
LS Industrial Systems Co., Ltd. (South Korea) | 4,308 | 166 | ||||||
Pegatron Corp. (Taiwan) | 227,000 | 556 | ||||||
S-1 Corp. (South Korea) | 4,168 | 328 | ||||||
Shanghai Industrial Holdings Ltd. (China) | 120,000 | 266 | ||||||
Sinopec Engineering Group Co., Ltd. Class H (China) | 653,500 | 571 | ||||||
TAV Havalimanlari Holding AS (Turkey) | 27,476 | 216 | ||||||
|
| |||||||
| 3,961 | ||||||||
|
| |||||||
| Information Technology—17.3% | ||||||||
Asustek Computer, Inc. (Taiwan) | 62,000 | 533 | ||||||
Chicony Electronics Co., Ltd. (Taiwan) | 84,490 | 195 | ||||||
Cielo S.A. (Brazil) | 9,268 | 86 | ||||||
Compal Electronics, Inc. (Taiwan) | 294,000 | 167 | ||||||
Hon Hai Precision Industry Co., Ltd. (Taiwan) | 480,900 | 1,256 | ||||||
Infosys Ltd. (India) | 62,937 | 1,117 | ||||||
Lite-On Technology Corp. (Taiwan) | 149,950 | 138 | ||||||
NCSoft Corp. (South Korea) | 953 | 152 | ||||||
Powertech Technology, Inc. (Taiwan) | 134,000 | 243 | ||||||
Quanta Computer, Inc. (Taiwan) | 218,000 | 379 | ||||||
Radiant Opto-Electronics Corp. (Taiwan) | 207,260 | 644 | ||||||
Realtek Semiconductor Corp. (Taiwan) | 88,000 | 150 | ||||||
Taiwan Semiconductor Manufacturing Co., Ltd. (Taiwan) | 233,000 | 934 | ||||||
Tata Consultancy Services Ltd. (India) | 13,842 | 547 | ||||||
Transcend Information, Inc. (Taiwan) | 55,000 | 139 | ||||||
Vanguard International Semiconductor Corp. (Taiwan) | 143,000 | 163 | ||||||
Wipro Ltd. (India) | 34,040 | 311 | ||||||
WPG Holdings Ltd. (Taiwan) | 366,000 | 354 | ||||||
|
| |||||||
| 7,508 | ||||||||
|
| |||||||
| SHARES | VALUE | |||||||
| Materials—4.8% | ||||||||
Cementos Argos S.A. (Colombia) | 36,284 | $ | 111 | |||||
Eregli Demir Ve Celik Fabrikalari TAS (Turkey) | 68,108 | 84 | ||||||
Gold Fields Ltd. (South Africa) | 73,617 | 191 | ||||||
Grupo Mexico S.A.B. de C.V. Series B (Mexico) | 95,000 | 230 | ||||||
Jiangxi Copper Co., Ltd. Class H (China) | 254,000 | 310 | ||||||
MMC Norilsk Nickel PJSC ADR (Russia) | 14,597 | 210 | ||||||
PTT Global Chemical PCL (Thailand) | 302,100 | 449 | ||||||
Taiwan Cement Corp. (Taiwan) | 490,000 | 498 | ||||||
|
| |||||||
| 2,083 | ||||||||
|
| |||||||
| Telecommunication Services—8.1% | ||||||||
America Movil S.A.B. de C.V. Class C Series L (Mexico) | 599,200 | 498 | ||||||
Axiata Group Bhd (Malaysia) | 103,400 | 136 | ||||||
China Communications Services Corp. Ltd. (China) | 564,000 | 218 | ||||||
China Mobile Ltd. (China) | 106,500 | 1,275 | ||||||
MTN Group Ltd. (South Africa) | 44,146 | 567 | ||||||
Rostelecom PJSC Sponsored ADR (Russia) | 10,838 | 86 | ||||||
SK Telecom Co., Ltd. (South Korea) | 1,771 | 393 | ||||||
Telekomunikasi Indonesia Persero Tbk PT (Indonesia) | 1,908,400 | 344 | ||||||
|
| |||||||
| 3,517 | ||||||||
|
| |||||||
| Utilities—2.9% | ||||||||
China Resources Power Holdings Co., Ltd. (China) | 122,000 | 280 | ||||||
Enersis SA (Chile) | 284,195 | 72 | ||||||
Huaneng Power International, Inc. Class H (China) | 630,000 | 682 | ||||||
| SHARES | VALUE | |||||||
| Utilities—(continued) | ||||||||
Perusahaan Gas Negara Persero Tbk PT (Indonesia) | 1,372,000 | $ | 237 | |||||
|
| |||||||
| 1,271 | ||||||||
| TOTAL COMMON STOCKS (Identified Cost $47,841) | 42,663 | |||||||
| TOTAL LONG TERM INVESTMENTS—100.4% | ||||||||
| (Identified Cost $49,491) | 43,629 | |||||||
| TOTAL INVESTMENTS—100.4% | ||||||||
| (Identified Cost $49,491) | 43,629 | (1) | ||||||
Other assets and liabilities, net—(0.4)% |
| (168 | ) | |||||
|
| |||||||
| NET ASSETS—100.0% | $ | 43,461 | ||||||
|
| |||||||
Abbreviations:
| ADR | American Depositary Receipt |
| REIT | Real Estate Investment Trust |
Footnote Legend:
| (1) | Federal Income Tax Information: For tax information at September 30, 2015, see Note 10 Federal Income Tax Information in the Notes to Financial Statements. |
| (2) | Illiquid security. |
| Country Weightings (Unaudited)† | ||||
China | 26 | % | ||
Taiwan | 17 | |||
South Korea | 11 | |||
India | 9 | |||
South Africa | 9 | |||
Brazil | 7 | |||
Mexico | 4 | |||
Other | 17 | |||
Total | 100 | % | ||
† % of total investments as of September 30, 2015 |
| |||
The following table provides a summary of inputs used to value the Fund’s investments as of September 30, 2015 (See Security Valuation Note 2A in the Notes to Financial Statements):
| Total Value at September 30, 2015 | Level 1 Quoted Prices | Level 2 Significant Observable Inputs | ||||||||||
Equity Securities: | ||||||||||||
Common Stocks | $ | 42,663 | $ | 11,817 | $ | 30,846 | ||||||
Preferred Stock | 966 | 966 | — | |||||||||
|
|
|
|
|
| |||||||
Total Investments | $ | 43,629 | $ | 12,783 | $ | 30,846 | ||||||
|
|
|
|
|
| |||||||
There are no Level 3 (significant unobservable inputs) priced securities.
Securities held by the Fund with an end of period value of $19,345 were transferred from Level 1 to Level 2 based on our valuation procedures for non-U.S. securities.
(See Note 2A in the Notes to Financial Statements for more information.)
Security abbreviation definitions are located under the Key Investment Terms starting on page 4.
See Notes to Financial Statements
41
Table of Contents
VIRTUS EMERGING MARKETS SMALL-CAP FUND
SCHEDULE OF INVESTMENTS
SEPTEMBER 30, 2015
($ reported in thousands)
| SHARES | VALUE | |||||||
| COMMON STOCKS—92.8% | ||||||||
| Consumer Discretionary—8.2% | ||||||||
Ace Hardware Indonesia Tbk PT (Indonesia) | 1,487,000 | $ | 51 | |||||
Goldlion Holdings Ltd. (Hong Kong) | 256,000 | 105 | ||||||
Pico Far East Holdings Ltd. (Hong Kong) | 697,780 | 162 | ||||||
Truworths International Ltd. (South Africa) | 6,500 | 40 | ||||||
|
| |||||||
| 358 | ||||||||
|
| |||||||
| Consumer Staples—23.6% | ||||||||
AVI Ltd. (South Africa) | 23,200 | 147 | ||||||
Compania Cervecerias Unidas SA Sponsored ADR (Chile) | 2,190 | 48 | ||||||
Embotelladora Andina ADR S.A. Class-B (Chile) | 5,140 | 107 | ||||||
Grupo Herdez Sab de CV (Mexico) | 36,925 | 98 | ||||||
Guinness Anchor Bhd (Malaysia) | 30,200 | 95 | ||||||
Massmart Holdings Ltd. (South Africa) | 4,900 | 38 | ||||||
Oldtown Bhd (Malaysia) | 312,750 | 90 | ||||||
Pinar SUT Mamulleri Sanayii AS (Turkey) | 15,100 | 100 | ||||||
Premier Marketing PCL (Thailand) | 624,000 | 170 | ||||||
Wawel SA (Poland) | 320 | 107 | ||||||
Wumart Stores, Inc. Class-H (China)(2) | 58,000 | 24 | ||||||
|
| |||||||
| 1,024 | ||||||||
|
| |||||||
| Financials—14.1% | ||||||||
ARA Asset Management Ltd. (Singapore) | 166,000 | 154 | ||||||
BFI Finance Indonesia Tbk PT (Indonesia)(3) | 727,000 | 149 | ||||||
Bolsa Mexicana de Valores Sab de CV SA (Mexico) | 33,300 | 52 | ||||||
Equity Group Holdings Ltd. (Kenya) | 205,600 | 89 | ||||||
Korea Ratings Corp. (South Korea) | 3,000 | 104 | ||||||
Tisco Financial Group PCL (Thailand) | 62,700 | 61 | ||||||
|
| |||||||
| 609 | ||||||||
|
| |||||||
| Health Care—1.6% | ||||||||
OdontoPrev S.A. (Brazil) | 28,400 | 70 | ||||||
|
| |||||||
| Industrials—19.0% | ||||||||
Freight Management Holdings Bhd (Malaysia) | 211,029 | 73 | ||||||
Prosegur Cia de Seguridad SA (Spain) | 23,500 | 113 | ||||||
S-1 Corp. (South Korea) | 2,775 | 218 | ||||||
Sinmag Equipment Corp. (Taiwan) | 26,520 | 97 | ||||||
Taiwan Secom Co., Ltd. (Taiwan) | 53,874 | 151 | ||||||
Tegma Gestao Logistica (Brazil) | 95,000 | 87 | ||||||
Turk Traktor Ve Ziraat Makineleri AS (Turkey) | 3,500 | 85 | ||||||
|
| |||||||
| 824 | ||||||||
|
| |||||||
| SHARES | VALUE | |||||||
| Information Technology—12.8% | ||||||||
Autohome, Inc. ADR (China)(2) | 5,700 | $ | 186 | |||||
Bitauto Holdings Ltd. ADR (China)(2) | 1,285 | 38 | ||||||
Lumax International Corp., Ltd. (Taiwan) | 101,800 | 134 | ||||||
MercadoLibre, Inc. (United States) | 845 | 77 | ||||||
TOTVS SA (Brazil) | 10,600 | 78 | ||||||
Yandex NV Class A (Russia)(2) | 3,775 | 41 | ||||||
|
| |||||||
| 554 | ||||||||
|
| |||||||
| Materials—10.8% | ||||||||
Assore Ltd. (South Africa) | 9,900 | 53 | ||||||
KPX Chemical Co. Ltd. (South Korea) | 2,470 | 114 | ||||||
Synthos SA (Poland) | 37,000 | 37 | ||||||
Transpaco Ltd. (South Africa) | 98,400 | 160 | ||||||
Yung Chi Paint & Varnish Manufacturing Co. Ltd. (Taiwan) | 53,000 | 102 | ||||||
|
| |||||||
| 466 | ||||||||
|
| |||||||
| Telecommunication Services—2.7% | ||||||||
APT Satellite Holdings Ltd. (China) | 134,000 | 116 | ||||||
| TOTAL COMMON STOCKS (Identified Cost $5,274) | 4,021 | |||||||
| WARRANTS—3.8% | ||||||||
| Financials—1.4% | ||||||||
Crisil Ltd. Strike price $0.01 Expiration Date 06/06/16 (India) | 2,100 | 59 | ||||||
|
| |||||||
| Information Technology—2.4% | ||||||||
EClerx Services Ltd. Strike price $0.01 Expiration Date 12/16/16 (India) | 1,600 | 39 | ||||||
EClerx Services Ltd. Strike price $0.01 Expiration Date 12/31/18 (India) | 2,700 | 65 | ||||||
| 104 | ||||||||
| TOTAL WARRANTS (Identified Cost $147) | 163 | |||||||
| TOTAL LONG TERM INVESTMENTS—96.6% | ||||||||
| (Identified Cost $5,421) | 4,184 | |||||||
| SHORT-TERM INVESTMENTS—1.6% | ||||||||
| Money Market Mutual Fund—1.6% | ||||||||
Fidelity Money Market Portfolio – Institutional Shares (seven-day effective yield 0.170%) | 69,440 | 69 | ||||||
| TOTAL SHORT-TERM INVESTMENTS (Identified Cost $69) | 69 | |||||||
| TOTAL INVESTMENTS—98.2% (Identified Cost $5,490) | 4,253 | (1) | ||||||
Other assets and liabilities, net—1.8% |
| 78 | ||||||
|
| |||||||
| NET ASSETS—100.0% | $ | 4,331 | ||||||
|
| |||||||
Abbreviation:
| ADR | American Depositary Receipt |
Footnote Legend:
| (1) | Federal Income Tax Information: For tax information at September 30, 2015, see Note 10 Federal Income Tax Information in the Notes to Financial Statements. |
| (2) | Non-income producing. |
| (3) | Illiquid security. |
| Country Weightings (Unaudited)† | ||||
Taiwan | 11 | % | ||
South Africa | 10 | |||
South Korea | 10 | |||
China | 9 | |||
Brazil | 6 | |||
Hong Kong | 6 | |||
Malaysia | 6 | |||
Other | 42 | |||
Total | 100 | % | ||
† % of total investments as of September 30, 2015 |
| |||
The following table provides a summary of inputs used to value the Fund’s investments as of September 30, 2015 (See Security Valuation Note 2A in the Notes to Financial Statements):
| Total Value at September 30, 2015 | Level 1 Quoted Prices | Level 2 Significant Observable Inputs | ||||||||||
Equity Securities: | ||||||||||||
Common Stocks | $ | 4,021 | $ | 2,475 | $ | 1,546 | ||||||
Short-Term Invest | 69 | 69 | — | |||||||||
Warrants | 163 | — | 163 | |||||||||
|
|
|
|
|
| |||||||
Total Invest | $ | 4,253 | $ | 2,544 | $ | 1,709 | ||||||
|
|
|
|
|
| |||||||
There are no Level 3 (significant unobservable inputs) priced securities.
Securities held by the Fund with an end of period value of $1,169 were transferred from Level 1 to Level 2 based on our valuation procedures for non-U.S. securities.
(See Note 2A in the Notes to Financial Statements for more information.)
Security abbreviation definitions are located under the Key Investment Terms starting on page 4.
See Notes to Financial Statements
42
Table of Contents
VIRTUS GLOBAL INFRASTRUCTURE FUND
SCHEDULE OF INVESTMENTS
SEPTEMBER 30, 2015
($ reported in thousands)
| SHARES | VALUE | |||||||
| COMMON STOCKS—98.8% | ||||||||
| Consumer Discretionary—2.5% | ||||||||
Eutelsat Communications SA (France) | 57,245 | $ | 1,753 | |||||
SES SA (Luxembourg) | 67,155 | 2,114 | ||||||
|
| |||||||
| 3,867 | ||||||||
|
| |||||||
| Energy—20.7% | ||||||||
Columbia Pipeline Group, Inc. (United States) | 70,860 | 1,296 | ||||||
Enbridge, Inc. (Canada) | 160,570 | 5,962 | ||||||
Keyera Corp. (Canada) | 51,380 | 1,415 | ||||||
Kinder Morgan, Inc. (United States) | 246,190 | 6,814 | ||||||
Pembina Pipeline Corp. (Canada) | 78,865 | 1,898 | ||||||
Plains GP Holdings LP Class A (United States) | 60,545 | 1,059 | ||||||
Spectra Energy Corp. (United States) | 113,480 | 2,981 | ||||||
Targa Resources Corp. (United States) | 17,870 | 921 | ||||||
TransCanada Corp. (Canada) | 110,785 | 3,499 | ||||||
Williams Cos., Inc. (The) (United States) | 155,280 | 5,722 | ||||||
|
| |||||||
| 31,567 | ||||||||
|
| |||||||
| Financials—5.4% | ||||||||
American Tower Corp. REIT (United States) | 43,395 | 3,818 | ||||||
Crown Castle International Corp. REIT (United States) | 55,040 | 4,341 | ||||||
|
| |||||||
| 8,159 | ||||||||
|
| |||||||
| Industrials—14.3% | ||||||||
Abertis Infraestructuras SA (Spain) | 160,515 | 2,534 | ||||||
Atlantia SpA (Italy) | 143,696 | 4,013 | ||||||
Auckland International Airport Ltd. (New Zealand) | 548,404 | 1,717 | ||||||
Aurizon Holdings Ltd. (Australia) | 436,465 | 1,542 | ||||||
Ferrovial SA (Spain) | 87,820 | 2,094 | ||||||
Flughafen Zuerich AG (Switzerland) | 2,845 | 1,979 | ||||||
Sydney Airport (Australia) | 507,530 | 2,133 | ||||||
Transurban Group (Australia) | 617,715 | 4,327 | ||||||
Vinci SA (France) | 22,995 | 1,457 | ||||||
|
| |||||||
| 21,796 | ||||||||
|
| |||||||
| Telecommunication Services—18.5% | ||||||||
AT&T, Inc. (United States) | 199,095 | 6,486 | ||||||
BCE, Inc. (Canada) | 31,435 | 1,288 | ||||||
BT Group plc (United Kingdom) | 342,905 | 2,177 | ||||||
Deutsche Telekom AG Registered Shares (Germany) | 119,515 | 2,121 | ||||||
Nippon Telegraph & Telephone Corp. ADR (Japan) | 52,125 | 1,841 | ||||||
Singapore Telecommunications Ltd. (Singapore) | 883,600 | 2,236 | ||||||
| SHARES | VALUE | |||||||
| Telecommunication Services—(continued) | ||||||||
TELUS Corp. (Canada) | 61,350 | $ | 1,933 | |||||
Verizon Communications, Inc. (United States) | 144,194 | 6,274 | ||||||
Vodafone Group plc Sponsored ADR (United Kingdom) | 118,916 | 3,774 | ||||||
|
| |||||||
| 28,130 | ||||||||
|
| |||||||
| Utilities—37.4% | �� | |||||||
ALLETE, Inc. (United States) | 32,385 | 1,635 | ||||||
American Electric Power Co., Inc. (United States) | 31,080 | 1,767 | ||||||
American Water Works Co., Inc. (United States) | 47,525 | 2,618 | ||||||
APA Group (Australia) | 264,855 | 1,599 | ||||||
Atmos Energy Corp. (United States) | 33,250 | 1,934 | ||||||
CMS Energy Corp. (United States) | 57,740 | 2,039 | ||||||
Dominion Resources, Inc. (United States) | 45,080 | 3,173 | ||||||
DTE Energy Co. (United States) | 24,440 | 1,964 | ||||||
Duke Energy Corp. (United States) | 41,685 | 2,999 | ||||||
Edison International (United States) | 29,700 | 1,873 | ||||||
Eversource Energy (United States) | 37,335 | 1,890 | ||||||
Hera SpA (Italy) | 571,335 | 1,482 | ||||||
Iberdrola SA (Spain) | 303,750 | 2,018 | ||||||
National Grid plc (United Kingdom) | 400,995 | 5,574 | ||||||
NextEra Energy, Inc. (United States) | 51,975 | 5,070 | ||||||
NiSource, Inc. (United States) | 70,880 | 1,315 | ||||||
Pennon Group plc (United Kingdom) | 138,850 | 1,632 | ||||||
Portland General Electric Co. (United States) | 55,345 | 2,046 | ||||||
Public Service Enterprise Group, Inc. (United States) | 52,225 | 2,202 | ||||||
Questar Corp. (United States) | 57,235 | 1,111 | ||||||
Sempra Energy (United States) | 39,995 | 3,868 | ||||||
SevernTrent plc (United Kingdom) | 54,290 | 1,794 | ||||||
Suez Environnement SA (France) | 76,410 | 1,369 | ||||||
Vectren Corp. (United States) | 41,395 | 1,739 | ||||||
Veolia Environnement SA (France) | 97,400 | 2,224 | ||||||
|
| |||||||
| 56,935 | ||||||||
| TOTAL COMMON STOCKS (Identified Cost $151,798) | 150,454 | |||||||
| TOTAL LONG TERM INVESTMENTS—98.8% | ||||||||
| (Identified Cost $151,798) | 150,454 | |||||||
| SHARES | VALUE | |||||||
| SHORT-TERM INVESTMENTS—2.0% | ||||||||
| Money Market Mutual Fund—2.0% | ||||||||
Fidelity Money Market Portfolio – Institutional Shares (seven-day effective yield 0.170%) | 3,064,006 | $ | 3,064 | |||||
| TOTAL SHORT-TERM INVESTMENTS (Identified Cost $3,064) | 3,064 | |||||||
| TOTAL INVESTMENTS—100.8% (Identified Cost $154,862) | 153,518 | (1) | ||||||
Other assets and liabilities, net—(0.8)% |
| (1,213 | ) | |||||
|
| |||||||
| NET ASSETS—100.0% | $ | 152,305 | ||||||
|
| |||||||
Abbreviations:
| ADR | American Depositary Receipt |
| REIT | Real Estate Investment Trust |
Footnote Legend:
| (1) | Federal Income Tax Information: For tax information at September 30, 2015, see Note 10 Federal Income Tax Information in the Notes to Financial Statements. |
| Country Weightings (Unaudited)† | ||||
United States | 53 | % | ||
Canada | 10 | |||
United Kingdom | 10 | |||
Australia | 6 | |||
France | 5 | |||
Italy | 4 | |||
Spain | 4 | |||
Other | 8 | |||
Total | 100 | % | ||
† % of total investments as of September 30, 2015 |
| |||
The following table provides a summary of inputs used to value the Fund’s investments as of September 30, 2015 (See Security Valuation Note 2A in the Notes to Financial Statements):
| Total Value at September 30, 2015 | Level 1 Quoted Prices | Level 2 Significant Observable Inputs | ||||||||||
Equity Securities: | ||||||||||||
Common Stocks | $ | 150,454 | $ | 136,900 | $ | 13,554 | | |||||
Short-Term Investments | 3,064 | 3,064 | | — | | |||||||
|
|
|
|
|
| |||||||
Total Investments | $ | 153,518 | $ | 139,964 | $ | 13,554 | ||||||
|
|
|
|
|
| |||||||
There are no Level 3 (significant unobservable inputs) priced securities.
Securities held by the Fund with an end of period value of $12,012 were transferred from Level 1 to Level 2 based on our valuation procedures for non-U.S. securities.
(See Note 2A in the Notes to Financial Statements for more information.)
Security abbreviation definitions are located under the Key Investment Terms starting on page 4.
See Notes to Financial Statements
43
Table of Contents
VIRTUS GLOBAL OPPORTUNITIES FUND
SCHEDULE OF INVESTMENTS
SEPTEMBER 30, 2015
($ reported in thousands)
| SHARES | VALUE | |||||||
| COMMON STOCKS—95.9% | ||||||||
| Consumer Discretionary—6.2% | ||||||||
Alimentation Couche-Tard, Inc. Class B (Canada) | 38,556 | $ | 1,773 | |||||
Naspers Ltd. Class N | 11,331 | 1,415 | ||||||
Priceline Group, Inc. (The) (United States)(2) | 2,517 | 3,113 | ||||||
TJX Cos., Inc. (United States) | 34,313 | 2,451 | ||||||
|
| |||||||
| 8,752 | ||||||||
|
| |||||||
| Consumer Staples—32.0% | ||||||||
Altria Group, Inc. (United States) | 110,007 | 5,984 | ||||||
British American Tobacco plc (United Kingdom) | 131,824 | 7,265 | ||||||
Coca-Cola Co. (The) | 108,351 | 4,347 | ||||||
Hershey Co. (The) (United States) | 25,726 | 2,364 | ||||||
ITC Ltd. (India) | 526,683 | 2,641 | ||||||
Nestle S.A. Registered Shares (Switzerland) | 61,294 | 4,607 | ||||||
Philip Morris International, Inc. (United States) | 84,743 | 6,723 | ||||||
Reckitt Benckiser Group plc (United Kingdom) | 47,683 | 4,318 | ||||||
Reynolds American, Inc. | 77,868 | 3,447 | ||||||
Unilever N.V. CVA (Netherlands) | 82,920 | 3,325 | ||||||
|
| |||||||
| 45,021 | ||||||||
|
| |||||||
| Energy—1.6% | ||||||||
Enbridge, Inc. (Canada) | 59,580 | 2,212 | ||||||
|
| |||||||
| Financials—20.8% | ||||||||
American Tower Corp. REIT (United States) | 29,293 | 2,577 | ||||||
Berkshire Hathaway, Inc. Class B (United States)(2) | 30,779 | 4,013 | ||||||
CME Group, Inc. (United States) | 30,038 | 2,786 | ||||||
Housing Development Finance Corp. (India) | 290,368 | 5,380 | ||||||
Housing Development Finance Corp. Bank Ltd. (India) | 293,750 | 4,799 | ||||||
Housing Development Finance Corp. Bank Ltd. ADR (India) | 5,596 | 342 | ||||||
JPMorgan Chase & Co. | 33,011 | 2,013 | ||||||
Progressive Corp. (The) | 76,301 | 2,338 | ||||||
Wells Fargo & Co. (United States) | 97,460 | 5,004 | ||||||
|
| |||||||
| 29,252 | ||||||||
|
| |||||||
| Health Care—16.8% | ||||||||
Abbott Laboratories | 45,761 | 1,840 | ||||||
Bard (C.R.), Inc. (United States) | 7,322 | 1,364 | ||||||
Becton, Dickinson & Co. | 5,070 | 673 | ||||||
Biogen, Inc. (United States)(2) | 4,738 | 1,383 | ||||||
| SHARES | VALUE | |||||||
| Health Care—(continued) | ||||||||
Bristol-Myers Squibb Co. (United States) | 51,198 | $ | 3,031 | |||||
Celgene Corp. | 35,880 | 3,881 | ||||||
Medtronic plc | 26,957 | 1,804 | ||||||
Novo Nordisk A/S Class B (Denmark) | 49,568 | 2,659 | ||||||
Roche Holding AG (Switzerland) | 19,574 | 5,162 | ||||||
UnitedHealth Group, Inc. (United States) | 16,288 | 1,890 | ||||||
|
| |||||||
| 23,687 | ||||||||
|
| |||||||
| Information Technology—16.9% | ||||||||
Apple, Inc. (United States) | 25,713 | 2,836 | ||||||
Cognizant Technology Solutions Corp. Class A (United States)(2) | 37,591 | 2,354 | ||||||
Google, Inc. Class C (United States)(2) | 7,694 | 4,681 | ||||||
MasterCard, Inc. Class A (United States) | 78,230 | 7,050 | ||||||
PayPal Holdings, Inc. (United States)(2) | 73,150 | 2,271 | ||||||
Visa, Inc. Class A | 66,760 | 4,650 | ||||||
|
| |||||||
| 23,842 | ||||||||
|
| |||||||
| Materials—1.6% | ||||||||
Martin Marietta Materials, Inc. (United States) | 15,247 | 2,317 | ||||||
| TOTAL COMMON STOCKS (Identified Cost $107,627) | 135,083 | |||||||
| TOTAL LONG TERM INVESTMENTS—95.9% | ||||||||
| (Identified Cost $107,627) | 135,083 | |||||||
| SHORT-TERM INVESTMENTS—5.7% | ||||||||
| Money Market Mutual Fund—5.7% | ||||||||
Fidelity Money Market Portfolio – Institutional Shares (seven-day effective yield 0.170%) | 7,958,713 | 7,959 | ||||||
| TOTAL SHORT-TERM INVESTMENTS (Identified Cost $7,959) | 7,959 | |||||||
| TOTAL INVESTMENTS—101.6% (Identified Cost $115,586) | 143,042 | (1) | ||||||
Other assets and liabilities, net—(1.6)% |
| (2,264 | ) | |||||
|
| |||||||
| NET ASSETS—100.0% | $ | 140,778 | ||||||
|
| |||||||
Abbreviations:
| ADR | American Depositary Receipt |
| REIT | Real Estate Investment Trust |
Footnote Legend:
| (1) | Federal Income Tax Information: For tax information at September 30, 2015, see Note 10 Federal Income Tax Information in the Notes to Financial Statements. |
| (2) | Non-income producing. |
| Country Weightings (Unaudited)† | ||||
United States | 68 | % | ||
India | 9 | |||
United Kingdom | 8 | |||
Switzerland | 7 | |||
Canada | 3 | |||
Denmark | 2 | |||
Netherlands | 2 | |||
Other | 1 | |||
Total | 100 | % | ||
† % of total investments as of September 30, 2015 |
| |||
The following table provides a summary of inputs used to value the Fund’s investments as of September 30, 2015 (See Security Valuation Note 2A in the Notes to Financial Statements):
| Total Value at September 30, 2015 | Level 1 Quoted Prices | Level 2 Significant Observable Inputs | ||||||||||
Equity Securities: | ||||||||||||
Common Stocks | $ | 135,083 | $ | 122,264 | $ | 12,819 | ||||||
Short-Term Investments | 7,959 | 7,959 | — | |||||||||
|
|
|
|
|
| |||||||
Total Investments | $ | 143,042 | $ | 130,223 | $ | 12,819 | ||||||
|
|
|
|
|
| |||||||
There are no Level 3 (significant unobservable inputs) priced securities.
Securities held by the Fund with an end of period value of $12,819 were transferred from Level 1 to Level 2 based on our valuation procedures for non-U.S. securities.
(See Note 2A in the Notes to Financial Statements for more information.)
Security abbreviation definitions are located under the Key Investment Terms starting on page 4.
See Notes to Financial Statements
44
Table of Contents
VIRTUS GLOBAL REAL ESTATE SECURITIES FUND
SCHEDULE OF INVESTMENTS
SEPTEMBER 30, 2015
($ reported in thousands)
| SHARES | VALUE | |||||||
| COMMON STOCKS—99.1% | ||||||||
| Australia—4.2% | ||||||||
Dexus Property Group | 121,839 | $ | 614 | |||||
GPT Group | 115,300 | 367 | ||||||
GPT Group (The) – In Specie(2)(3)(5) | 13,566 | — | ||||||
Scentre Group | 402,789 | 1,109 | ||||||
Westfield Corp. | 162,750 | 1,145 | ||||||
|
| |||||||
| 3,235 | ||||||||
|
| |||||||
| Canada—3.1% | ||||||||
Allied Properties Real Estate Investment Trust | 29,535 | 773 | ||||||
Canadian Real Estate Investment Trust | 13,675 | 420 | ||||||
First Capital Realty, Inc. | 25,180 | 353 | ||||||
RioCan Real Estate Investment Trust | 43,562 | 831 | ||||||
|
| |||||||
| 2,377 | ||||||||
|
| |||||||
| Finland—0.9% | ||||||||
Citycon OYJ | 278,032 | 684 | ||||||
|
| |||||||
| France—2.3% | ||||||||
Fonciere Des Regions | 2,454 | 213 | ||||||
Klepierre | 24,020 | 1,087 | ||||||
Mercialys SA | 22,300 | 482 | ||||||
|
| |||||||
| 1,782 | ||||||||
|
| |||||||
| Germany—2.9% | ||||||||
ADO Properties SA(2)(4) | 8,642 | 209 | ||||||
Deutsche Annington Immobilien SE | 42,048 | 1,351 | ||||||
LEG Immobilien AG | 8,454 | 697 | ||||||
|
| |||||||
| 2,257 | ||||||||
|
| |||||||
| Hong Kong—2.4% | ||||||||
Hysan Development Co. Ltd. | 87,000 | 362 | ||||||
Link REIT (The) | 273,504 | 1,506 | ||||||
|
| |||||||
| 1,868 | ||||||||
|
| |||||||
| Italy—0.2% | ||||||||
Beni Stabili SpA | 179,062 | 139 | ||||||
|
| |||||||
| Japan—5.6% | ||||||||
GLP J-REIT | 551 | 527 | ||||||
Hulic Co., Ltd. | 77,200 | 698 | ||||||
Industrial & Infrastructure Fund Investment Corp. | 133 | 579 | ||||||
Japan Real Estate Investment Corp. | 111 | 511 | ||||||
Japan Rental Housing Investments, Inc. | 482 | 315 | ||||||
Kenedix Office Investment Corp. | 80 | 380 | ||||||
Kenedix Retail Reit Corp. | 64 | 123 | ||||||
Nippon Building Fund, Inc. | 108 | 523 | ||||||
Nippon Prologis REIT, Inc. | 222 | 403 | ||||||
Nomura Real Estate Office Fund, Inc.(5) | 59 | 266 | ||||||
|
| |||||||
| 4,325 | ||||||||
|
| |||||||
| SHARES | VALUE | |||||||
| Mexico—1.2% | ||||||||
PLA Administradora Industrial S de Rl de CV | 185,722 | $ | 339 | |||||
Prologis Property Mexico SA de CV | 367,800 | 565 | ||||||
|
| |||||||
| 904 | ||||||||
|
| |||||||
| Netherlands—2.7% | ||||||||
Unibail-Rodamco SE | 8,198 | 2,119 | ||||||
|
| |||||||
| Norway—0.4% | ||||||||
Entra ASA(4) | 23,000 | 186 | ||||||
Norwegian Property ASA(2) | 112,875 | 125 | ||||||
|
| |||||||
| 311 | ||||||||
|
| |||||||
| Singapore—1.7% | ||||||||
CapitaLand Mall Trust | 97,450 | 130 | ||||||
CapitaLand Retail China Trust | 370,331 | 356 | ||||||
Global Logistic Properties Ltd. | 553,500 | 796 | ||||||
|
| |||||||
| 1,282 | ||||||||
|
| |||||||
| Spain—0.5% | ||||||||
Axiare Patrimonio SOCIMI SA | 25,689 | 351 | ||||||
|
| |||||||
| Sweden—0.6% | ||||||||
Castellum AB | 35,640 | 501 | ||||||
|
| |||||||
| United Kingdom—8.4% | ||||||||
Big Yellow Group plc | 67,628 | 741 | ||||||
British Land Co. plc | 67,000 | 850 | ||||||
Derwent London plc | 9,110 | 501 | ||||||
Great Portland Estates plc | 17,476 | 226 | ||||||
Hammerson plc | 104,020 | 981 | ||||||
Land Securities Group plc | 50,931 | 970 | ||||||
Safestore Holdings plc | 134,457 | 600 | ||||||
SEGRO plc | 95,490 | 620 | ||||||
Unite Group plc (The) | 106,000 | 1,047 | ||||||
|
| |||||||
| 6,536 | ||||||||
|
| |||||||
| United States—62.0% | ||||||||
American Campus Communities, Inc. | 20,638 | 748 | ||||||
American Homes 4 Rent Class A | 50,000 | 804 | ||||||
AvalonBay Communities, Inc. | 14,465 | 2,529 | ||||||
Boston Properties, Inc. | 11,378 | 1,347 | ||||||
Brixmor Property Group, Inc. | 54,833 | 1,288 | ||||||
Camden Property Trust | 14,506 | 1,072 | ||||||
Cousins Properties, Inc. | 79,700 | 735 | ||||||
CubeSmart | 24,550 | 668 | ||||||
DCT Industrial Trust, Inc. | 53,698 | 1,808 | ||||||
Douglas Emmett, Inc. | 42,295 | 1,215 | ||||||
Duke Realty Corp. | 51,100 | 973 | ||||||
Equity Lifestyle Properties, Inc. | 10,846 | 635 | ||||||
Equity Residential | 37,315 | 2,803 | ||||||
Essex Property Trust, Inc. | 11,854 | 2,648 | ||||||
Extra Space Storage, Inc. | 23,595 | 1,821 | ||||||
Federal Realty Investment Trust | 12,750 | 1,740 | ||||||
General Growth Properties, Inc. | 69,019 | 1,792 | ||||||
HCP, Inc. | 6,329 | 236 | ||||||
Highwoods Properties, Inc. | 29,860 | 1,157 | ||||||
Host Hotels & Resorts, Inc. | 96,508 | 1,526 | ||||||
Kilroy Realty Corp. | 26,175 | 1,706 | ||||||
| SHARES | VALUE | |||||||
| United States—continued | ||||||||
LaSalle Hotel Properties | 37,915 | $ | 1,076 | |||||
Liberty Property Trust | 39,167 | 1,234 | ||||||
Macerich Co. (The) | 3,073 | 236 | ||||||
Paramount Group, Inc. | 29,240 | 491 | ||||||
Pebblebrook Hotel Trust | 34,509 | 1,223 | ||||||
Prologis, Inc. | 59,648 | 2,320 | ||||||
Public Storage | 11,134 | 2,356 | ||||||
Regency Centers Corp. | 19,400 | 1,206 | ||||||
RLJ Lodging Trust | 44,350 | 1,121 | ||||||
Simon Property Group, Inc. | 24,731 | 4,544 | ||||||
SL Green Realty Corp. | 5,386 | 583 | ||||||
Tanger Factory Outlet Centers | 44,350 | 1,462 | ||||||
Ventas, Inc. | 16,472 | 923 | ||||||
|
| |||||||
| 48,026 | ||||||||
| TOTAL COMMON STOCKS (Identified Cost $70,462) | 76,697 | |||||||
| TOTAL LONG TERM INVESTMENTS—99.1% | ||||||||
| (Identified Cost $70,462) | 76,697 | |||||||
| SHORT-TERM INVESTMENTS—0.9% | ||||||||
| Money Market Mutual Fund—0.9% | ||||||||
Fidelity Money Market | 706,177 | 706 | ||||||
| TOTAL SHORT-TERM INVESTMENTS (Identified Cost $706) | 706 | |||||||
| TOTAL INVESTMENTS—100.0% (Identified Cost $71,168) | 77,403 | (1) | ||||||
Other assets and liabilities, net—0.0% |
| (8 | ) | |||||
|
| |||||||
| NET ASSETS—100.0% | $ | 77,395 | ||||||
|
| |||||||
Abbreviation:
| REIT | Real Estate Investment Trust |
Footnote Legend:
| (1) | Federal Income Tax Information: For tax information at September 30, 2015, see Note 10 Federal Income Tax Information in the Notes to Financial Statements. |
| (2) | Non-income producing. |
| (3) | Illiquid security. |
| (4) | Security exempt from registration under Rule 144A of the Securities Act of 1933. These securities may be resold in transactions exempt from registration, normally to qualified institutional buyers. At September 30, 2015, these securities amounted to a value of $395 or 0.5% of net assets. |
| (5) | Security valued at fair value as determined in good faith by or under the direction of the Trustees. This security is disclosed as a Level 3 security in the disclosure table located after the Schedule of Investments. |
Security abbreviation definitions are located under the Key Investment Terms starting on page 4.
See Notes to Financial Statements
45
Table of Contents
VIRTUS GLOBAL REAL ESTATE SECURITIES FUND
SCHEDULE OF INVESTMENTS (Continued)
SEPTEMBER 30, 2015
($ reported in thousands)
| Country Weightings (Unaudited)† | ||||
United States | 63 | % | ||
United Kingdom | 8 | |||
Japan | 6 | |||
Australia | 4 | |||
Canada | 3 | |||
Germany | 3 | |||
Netherlands | 3 | |||
Other | 10 | |||
Total | 100 | % | ||
† % of total investments as of September 30, 2015 |
| |||
The following table provides a summary of inputs used to value the Fund’s investments as of September 30, 2015 (See Security Valuation Note 2A in the Notes to Financial Statements):
| Total Value at September 30, 2015 | Level 1 Quoted Prices | Level 2 Significant Observable Inputs | Level 3 Significant Unobservable Inputs | |||||||||||||
Equity Securities: | ||||||||||||||||
Common Stocks | $ | 76,697 | $ | 65,987 | $ | 10,710 | $ | 0 | (1) | |||||||
Short-Term Investments | 706 | 706 | — | — | ||||||||||||
|
|
|
|
|
|
|
| |||||||||
Total Investments | $ | 77,403 | $ | 66,693 | $ | 10,710 | $ | 0 | (1) | |||||||
|
|
|
|
|
|
|
| |||||||||
| (1) | Includes internally fair valued security currently priced at zero ($0). |
Securities held by the Fund with an end of period value of $10,272 were transferred from Level 1 to Level 2 based on our valuation procedures for non-U.S. securities.
(See Note 2A in the Notes to Financial Statements for more information.)
See Notes to Financial Statements
46
Table of Contents
VIRTUS GREATER EUROPEAN OPPORTUNITIES FUND
SCHEDULE OF INVESTMENTS
SEPTEMBER 30, 2015
($ reported in thousands)
| SHARES | VALUE | |||||||
| COMMON STOCKS—96.4% | ||||||||
| Consumer Discretionary—15.7% | ||||||||
Barrat Developments plc | 47,649 | $ | 464 | |||||
Compagnie Financiere Richemont SA Registered Shares (Switzerland) | 2,063 | 160 | ||||||
Domino’s Pizza Group plc | 21,109 | 284 | ||||||
Hermes International SA (France) | 1,566 | 569 | ||||||
Paddy Power plc (Ireland) | 3,528 | 407 | ||||||
Persimmon plc (United Kingdom) | 12,888 | 391 | ||||||
Priceline Group, Inc. (The) | 591 | 731 | ||||||
William Hill plc (United Kingdom) | 44,859 | 238 | ||||||
|
| |||||||
| 3,244 | ||||||||
|
| |||||||
| Consumer Staples—38.5% | ||||||||
Anheuser-Busch InBev N.V. (Belgium) | 3,758 | 399 | ||||||
British American Tobacco plc (United Kingdom) | 24,391 | 1,344 | ||||||
Chocoladefabrike Lindt & Spruengli AG (Switzerland) | 43 | 252 | ||||||
Diageo plc (United Kingdom) | 9,095 | 244 | ||||||
Imperial Tobacco Group plc (United Kingdom) | 12,904 | 666 | ||||||
L’Oreal SA (France) | 2,061 | 357 | ||||||
Nestle S.A. Registered Shares (Switzerland) | 14,039 | 1,055 | ||||||
Pernod-Ricard SA (France) | 2,476 | 250 | ||||||
Philip Morris International, Inc. (United States) | 12,205 | 968 | ||||||
Reckitt Benckiser Group plc (United Kingdom) | 11,736 | 1,063 | ||||||
SABMiller plc (United Kingdom) | 10,832 | 612 | ||||||
Unilever N.V. CVA (Netherlands) | 17,918 | 719 | ||||||
|
| |||||||
| 7,929 | ||||||||
|
| |||||||
| Financials—8.0% | ||||||||
Banco Bilbao Vizcaya Argentaria S.A. (Spain) | 42,935 | 364 | ||||||
Lloyds Banking Group plc | 254,783 | 290 | ||||||
Reinet Investments SCA (Luxembourg) | 8,716 | 170 | ||||||
Svenska Handelsbanken AB Class A (Sweden) | 16,652 | 238 | ||||||
UBS Group AG (Switzerland) | 32,200 | 595 | ||||||
|
| |||||||
| 1,657 | ||||||||
|
| |||||||
| Health Care—19.9% | ||||||||
Bayer AG Registered Shares (Germany) | 4,280 | 547 | ||||||
Coloplast A/S Class B (Denmark) | 2,723 | 193 | ||||||
Essilor International SA (France) | 4,227 | 514 | ||||||
Fresenius Medical Care AG & Co. KGaA (Germany) | 4,014 | 313 | ||||||
Grifols SA (Spain) | 9,973 | 411 | ||||||
| SHARES | VALUE | |||||||
| Health Care—continued | ||||||||
Novartis AG Registered Shares (Switzerland) | 1,335 | $ | 123 | |||||
Novo Nordisk A/S Class B (Denmark) | 11,901 | 639 | ||||||
Novozymes A/S Class B (Denmark) | 4,503 | 196 | ||||||
Roche Holding AG (Switzerland) | 4,433 | 1,169 | ||||||
|
| |||||||
| 4,105 | ||||||||
|
| |||||||
| Industrials—5.1% | ||||||||
Aena SA (Spain)(2)(3) | 2,655 | 293 | ||||||
Bureau Veritas SA (France) | 16,656 | 350 | ||||||
DKSH Holding AG (Switzerland) | 3,551 | 225 | ||||||
Zardoya Otis S.A. (Spain) | 16,054 | 173 | ||||||
|
| |||||||
| 1,041 | ||||||||
|
| |||||||
| Information Technology—3.1% | ||||||||
Accenture plc Class A | 1,370 | 135 | ||||||
SAP SE (Germany) | 7,789 | 504 | ||||||
|
| |||||||
| 639 | ||||||||
|
| |||||||
| Materials—5.0% | ||||||||
Air Liquide SA (France) | 4,961 | 586 | ||||||
HeidelbergCement AG (Germany) | 2,275 | 156 | ||||||
Randgold Resources Ltd. (Jersey) | 2,773 | 162 | ||||||
Randgold Resources Ltd. ADR (Jersey) | 2,269 | 134 | ||||||
|
| |||||||
| 1,038 | ||||||||
|
| |||||||
| Retail REIT—1.1% | ||||||||
Unibail-Rodamco SE (Netherlands) | 859 | 222 | ||||||
| TOTAL COMMON STOCKS (Identified Cost $17,525) | 19,875 | |||||||
| TOTAL LONG TERM INVESTMENTS—96.4% | ||||||||
| (Identified Cost $17,525) | 19,875 | |||||||
| SHORT-TERM INVESTMENTS—3.8% | ||||||||
| Money Market Mutual Fund—3.8% | ||||||||
Fidelity Money Market Portfolio – Institutional Shares (seven-day effective yield 0.170%) | 781,625 | 782 | ||||||
| TOTAL SHORT-TERM INVESTMENTS (Identified Cost $782) | 782 | |||||||
| TOTAL INVESTMENTS—100.2% (Identified Cost $18,307) | 20,657 | (1) | ||||||
Other assets and liabilities, net—(0.2)% |
| (36 | ) | |||||
|
| |||||||
| NET ASSETS—100.0% | $ | 20,621 | ||||||
|
| |||||||
Abbreviations:
| ADR | American Depositary Receipt |
| REIT | Real Estate Investment Trust |
Footnote Legend:
| (1) | Federal Income Tax Information: For tax information at September 30, 2015, see Note 10 Federal Income Tax Information in the Notes to Financial Statements. |
| (2) | Non-income producing. |
| (3) | Security exempt from registration under Rule 144A of the Securities Act of 1933. These securities may be resold in transactions exempt from registration, normally to qualified institutional buyers. At September 30, 2015, these securities amounted to a value of $293 or 1.4% of net assets. |
| Country Weightings (Unaudited)† | ||||
United Kingdom | 27 | % | ||
Switzerland | 17 | |||
France | 13 | |||
United States | 13 | |||
Germany | 7 | |||
Spain | 6 | |||
Denmark | 5 | |||
Other | 12 | |||
Total | 100 | % | ||
† % of total investments as of September 30, 2015 |
| |||
Security abbreviation definitions are located under the Key Investment Terms starting on page 4.
See Notes to Financial Statements
47
Table of Contents
VIRTUS GREATER EUROPEAN OPPORTUNITIES FUND
SCHEDULE OF INVESTMENTS (Continued)
SEPTEMBER 30, 2015
($ reported in thousands)
The following table provides a summary of inputs used to value the Fund’s investments as of September 30, 2015 (See Security Valuation Note 2A in the Notes to Financial Statements):
| Total Value at September 30, 2015 | Level 1 Quoted Prices | |||||||
Equity Securities: | ||||||||
Common Stocks | $ | 19,875 | $ | 19,875 | ||||
Short-Term Investments | 782 | 782 | ||||||
|
|
|
| |||||
Total Investments | $ | 20,657 | $ | 20,657 | ||||
|
|
|
| |||||
There are no Level 2 (significant observable inputs) or Level 3 (significant unobservable inputs) priced securities.
There were no transfers between Level 1 and Level 2 related to securities held at September 30, 2015.
See Notes to Financial Statements
48
Table of Contents
VIRTUS INTERNATIONAL EQUITY FUND
SCHEDULE OF INVESTMENTS
SEPTEMBER 30, 2015
($ reported in thousands)
| SHARES | VALUE | |||||||
| COMMON STOCKS—93.1% | ||||||||
| Consumer Discretionary—17.5% | ||||||||
Bridgestone Corp. (Japan) | 6,370 | $ | 220 | |||||
Fuji Heavy Industries Ltd. (Japan) | 7,560 | 272 | ||||||
RELX plc (United Kingdom) | 13,070 | 224 | ||||||
Sony Corp. Sponsored ADR (Japan)(2) | 9,630 | 236 | ||||||
Toyota Motor Corp. Sponsored ADR (Japan) | 1,830 | 215 | ||||||
WPP PLC (United Kingdom) | 10,670 | 221 | ||||||
|
| |||||||
| 1,388 | ||||||||
|
| |||||||
| Consumer Staples—3.1% | ||||||||
Marine Harvest ASA Sponsored ADR (Norway)(3) | 19,530 | 247 | ||||||
|
| |||||||
| Energy—2.7% | ||||||||
Cameco Corp. (Canada) | 17,420 | 212 | ||||||
|
| |||||||
| Financials—21.9% | ||||||||
Aegon NV American Registered Shares (Netherlands) | 32,940 | 189 | ||||||
Aviva plc (United Kingdom) | 30,512 | 209 | ||||||
Credit Agricole SA (France) | 16,527 | 189 | ||||||
ING Groep N.V. Sponsored ADR (Netherlands) | 15,430 | 218 | ||||||
Intesa Sanpaolo SpA (Italy) | 72,243 | 255 | ||||||
Mitsubishi Estate Co. (Japan) | 11,580 | 237 | ||||||
ORIX Corp. (Japan) | 16,360 | 211 | ||||||
Societe Generale SA (France) | 5,140 | 229 | ||||||
|
| |||||||
| 1,737 | ||||||||
|
| |||||||
| Health Care—16.1% | ||||||||
Allergan plc (Ireland) | 860 | 234 | ||||||
Icon plc (Ireland) | 3,800 | 270 | ||||||
Novartis AG Sponsored ADR (Switzerland) | 2,260 | 208 | ||||||
Shire plc ADR (United Kingdom) | 980 | 201 | ||||||
Teva Pharmaceutical Industries Ltd. Sponsored ADR (Israel) | 2,540 | 143 | ||||||
Valeant Pharmaceuticals International, Inc. (Canada)(2) | 1,240 | 221 | ||||||
|
| |||||||
| 1,277 | ||||||||
|
| |||||||
| SHARES | VALUE | |||||||
| Industrials—6.4% | ||||||||
CK Hutchison Holdings Ltd. | 19,122 | $ | 249 | |||||
Nidec Corp. (Japan) | 3,820 | 262 | ||||||
|
| |||||||
| 511 | ||||||||
|
| |||||||
| Information Technology—8.4% | ||||||||
Avago Technologies Ltd. (Singapore) | 1,560 | 195 | ||||||
NXP Semiconductors NV (Netherlands) | 2,730 | 238 | ||||||
SAP SE Sponsored ADR (Germany)(3) | 3,660 | 237 | ||||||
|
| |||||||
| 670 | ||||||||
|
| |||||||
| Materials—2.4% | ||||||||
Nitto Denko Corp. (Japan) | 3,200 | 192 | ||||||
|
| |||||||
| Telecommunication Services—12.3% | ||||||||
KDDI Corp. (Japan) | 10,590 | 237 | ||||||
Nippon Telegraph & Telephone Corp. ADR (Japan) | 7,880 | 278 | ||||||
Spark New Zealand Ltd. | 127,731 | 244 | ||||||
Vodafone Group plc Sponsored ADR (United Kingdom) | 6,920 | 220 | ||||||
|
| |||||||
| 979 | ||||||||
|
| |||||||
| Utilities—2.3% | ||||||||
Veolia Environnement SA (France) | 7,880 | 180 | ||||||
| TOTAL COMMON STOCKS (Identified Cost $7,295) | 7,393 | |||||||
| TOTAL LONG TERM INVESTMENTS—93.1% | ||||||||
| (Identified Cost $7,295) | 7,393 | |||||||
| SHORT-TERM INVESTMENTS—10.6% | ||||||||
| Money Market Mutual Fund—10.6% | ||||||||
Fidelity Money Market Portfolio – Institutional Shares (seven-day effective yield 0.170%) | 841,231 | 841 | ||||||
| TOTAL SHORT-TERM INVESTMENTS (Identified Cost $841) | 841 | |||||||
| SHARES | VALUE | |||||||
| SECURITIES LENDING COLLATERAL—5.7% | ||||||||
INVESCO Trust Short-Term Investments Liquid Assets Portfolio (The) Institutional Shares (seven-day effective yield 0.160%)(4) | 452,408 | $ | 452 | |||||
| TOTAL SECURITIES LENDING COLLATERAL (Identified Cost $452) | 452 | |||||||
| TOTAL INVESTMENTS—109.4% (Identified Cost $8,588) | 8,686 | (1) | ||||||
Other assets and liabilities, net—(9.4)% |
| (750 | ) | |||||
|
| |||||||
| NET ASSETS—100.0% | $ | 7,936 | ||||||
|
| |||||||
Abbreviation:
| ADR | American Depositary Receipt |
Footnote Legend:
| (1) | Federal Income Tax Information: For tax information at September 30, 2015, see Note 10 Federal Income Tax Information in the Notes to Financial Statements. |
| (2) | Non-income producing. |
| (3) | All or a portion of security is on loan. |
| (4) | Represents security purchased with cash collateral received for securities on loan. |
Security abbreviation definitions are located under the Key Investment Terms starting on page 4.
See Notes to Financial Statements
49
Table of Contents
VIRTUS INTERNATIONAL EQUITY FUND
SCHEDULE OF INVESTMENTS (Continued)
SEPTEMBER 30, 2015
($ reported in thousands)
| Country Weightings (Unaudited)† | ||||
Japan | 27 | % | ||
United States | 15 | |||
United Kingdom | 12 | |||
France | 7 | |||
Netherlands | 7 | |||
Ireland | 6 | |||
Canada | 5 | |||
Other | 21 | |||
Total | 100 | % | ||
† % of total investments as of September 30, 2015 |
| |||
The following table provides a summary of inputs used to value the Fund’s investments as of September 30, 2015 (See Security Valuation Note 2A in the Notes to Financial Statements):
| Total Value at September 30, 2015 | Level 1 Quoted Prices | Level 2 Significant Observable Inputs | ||||||||||
Equity Securities: | ||||||||||||
Common Stocks | $ | 7,393 | $ | 5,269 | $ | 2,124 | ||||||
Securities Lending Collateral | 452 | 452 | — | |||||||||
Short-Term Investments | 841 | 841 | — | |||||||||
|
|
|
|
|
| |||||||
Total Investments | $ | 8,686 | $ | 6,562 | $ | 2,124 | ||||||
|
|
|
|
|
| |||||||
There are no Level 3 (significant unobservable inputs) priced securities.
Securities held by the Fund with an end of period value of $1,447 were transferred from Level 1 to Level 2 based on our valuation procedures for non-U.S. securities.
(See Note 2A in the Notes to Financial Statements for more information.)
See Notes to Financial Statements
50
Table of Contents
VIRTUS INTERNATIONAL REAL ESTATE SECURITIES FUND
SCHEDULE OF INVESTMENTS
SEPTEMBER 30, 2015
($ reported in thousands)
| SHARES | VALUE | |||||||
| COMMON STOCKS—99.9% | ||||||||
| Australia—11.7% | ||||||||
Dexus Property Group | 166,018 | $ | 837 | |||||
GPT Group | 160,400 | 510 | ||||||
GPT Group (The) – In Specie(2)(3)(4) | 588,920 | — | ||||||
Scentre Group | 608,071 | 1,674 | ||||||
Westfield Corp. | 229,973 | 1,618 | ||||||
|
| |||||||
| 4,639 | ||||||||
|
| |||||||
| Canada—7.9% | ||||||||
Allied Properties Real Estate Investment Trust | 39,415 | 1,032 | ||||||
Canadian Real Estate Investment Trust | 19,195 | 589 | ||||||
First Capital Realty, Inc. | 33,805 | 474 | ||||||
RioCan Real Estate Investment Trust | 54,150 | 1,033 | ||||||
|
| |||||||
| 3,128 | ||||||||
|
| |||||||
| Finland—2.3% | ||||||||
Citycon OYJ | 374,691 | 921 | ||||||
|
| |||||||
| France—6.5% | ||||||||
Fonciere Des Regions | 3,460 | 301 | ||||||
Klepierre | 34,856 | 1,577 | ||||||
Mercialys SA | 31,800 | 687 | ||||||
|
| |||||||
| 2,565 | ||||||||
|
| |||||||
| Germany—7.9% | ||||||||
ADO Properties SA(2)(5) | 9,522 | 230 | ||||||
Deutsche Annington Immobilien SE | 60,445 | 1,942 | ||||||
LEG Immobilien AG | 11,861 | 978 | ||||||
|
| |||||||
| 3,150 | ||||||||
|
| |||||||
| Hong Kong—6.1% | ||||||||
Hysan Development Co. Ltd. | 123,000 | 512 | ||||||
Link REIT (The) | 348,441 | 1,919 | ||||||
|
| |||||||
| 2,431 | ||||||||
|
| |||||||
| Italy—0.5% | ||||||||
Beni Stabili SpA | 248,164 | 193 | ||||||
|
| |||||||
| Japan—14.4% | ||||||||
GLP J-REIT | 755 | 722 | ||||||
Hulic Co., Ltd. | 111,500 | 1,009 | ||||||
| SHARES | VALUE | |||||||
| Japan—continued | ||||||||
Industrial & Infrastructure Fund Investment Corp. | 173 | $ | 753 | |||||
Japan Real Estate Investment Corp. | 145 | 668 | ||||||
Japan Rental Housing Investments, Inc. | 653 | 426 | ||||||
Kenedix Office Investment Corp. | 92 | 437 | ||||||
Kenedix Retail Reit Corp. | 86 | 166 | ||||||
Nippon Building Fund, Inc. | 145 | 702 | ||||||
Nippon Prologis REIT, Inc. | 278 | 504 | ||||||
Nomura Real Estate Office Fund, Inc. | 70 | 316 | ||||||
|
| |||||||
| 5,703 | ||||||||
|
| |||||||
| Mexico—2.7% | ||||||||
PLA Administradora Industrial S de Rl de CV | 226,852 | 414 | ||||||
Prologis Property Mexico SA de CV | 439,200 | 675 | ||||||
|
| |||||||
| 1,089 | ||||||||
|
| |||||||
| Netherlands—7.7% | ||||||||
Unibail-Rodamco SE | 11,810 | 3,052 | ||||||
|
| |||||||
| Norway—1.1% | ||||||||
Entra ASA(5) | 30,000 | 242 | ||||||
Norwegian Property ASA(2) | 172,000 | 191 | ||||||
|
| |||||||
| 433 | ||||||||
|
| |||||||
| Singapore—4.6% | ||||||||
CapitaLand Mall Trust | 130,650 | 175 | ||||||
CapitaLand Retail China Trust | 518,868 | 498 | ||||||
Global Logistic Properties Ltd. | 802,000 | 1,153 | ||||||
|
| |||||||
| 1,826 | ||||||||
|
| |||||||
| Spain—1.3% | ||||||||
Axiare Patrimonio SOCIMI SA | 36,858 | 504 | ||||||
|
| |||||||
| Sweden—1.8% | ||||||||
Castellum AB | 49,366 | 694 | ||||||
|
| |||||||
| United Kingdom—23.4% | ||||||||
Big Yellow Group plc | 100,188 | 1,097 | ||||||
British Land Co. plc | 97,305 | 1,234 | ||||||
Derwent London plc | 13,346 | 735 | ||||||
Great Portland Estates plc | 24,918 | 322 | ||||||
Hammerson plc | 142,109 | 1,341 | ||||||
Land Securities Group plc | 71,885 | 1,369 | ||||||
Safestore Holdings plc | 192,276 | 857 | ||||||
SEGRO plc | 135,557 | 881 | ||||||
| SHARES | VALUE | |||||||
| United Kingdom—continued | ||||||||
Unite Group plc (The) | 146,800 | $ | 1,450 | |||||
|
| |||||||
| 9,286 | ||||||||
| TOTAL COMMON STOCKS (Identified Cost $32,315) | 39,614 | |||||||
| TOTAL LONG TERM INVESTMENTS—99.9% | ||||||||
| (Identified Cost $32,315) | 39,614 | |||||||
| TOTAL INVESTMENTS—99.9% | ||||||||
| (Identified Cost $32,315) | 39,614 | (1) | ||||||
Other assets and liabilities, net—0.1% |
| 26 | ||||||
|
| |||||||
| NET ASSETS—100.0% | $ | 39,640 | ||||||
|
| |||||||
Abbreviation:
| REIT | Real Estate Investment Trust |
Footnote Legend:
| (1) | Federal Income Tax Information: For tax information at September 30, 2015, see Note 10 Federal Income Tax Information in the Notes to Financial Statements. |
| (2) | Non-income producing. |
| (3) | Illiquid security. |
| (4) | Security valued at fair value as determined in good faith by or under the direction of the Trustees. This security is disclosed as a level 3 security in the disclosure table located after the Schedule of Investments. |
| (5) | Security exempt from registration under Rule 144A of the Securities Act of 1933. These securities may be resold in transactions exempt from registration, normally to qualified institutional buyers. At September 30, 2015, these securities amounted to a value of $472 or 1.2% of net assets. |
| Country Weightings (Unaudited)† | ||||
United Kingdom | 23 | % | ||
Japan | 14 | |||
Australia | 12 | |||
Germany | 8 | |||
Canada | 8 | |||
Netherlands | 8 | |||
France | 7 | |||
Other | 20 | |||
Total | 100 | % | ||
† % of total investments as of September 30, 2015 |
| |||
Security abbreviation definitions are located under the Key Investment Terms starting on page 4.
See Notes to Financial Statements
51
Table of Contents
VIRTUS INTERNATIONAL REAL ESTATE SECURITIES FUND
SCHEDULE OF INVESTMENTS (Continued)
SEPTEMBER 30, 2015
($ reported in thousands)
The following table provides a summary of inputs used to value the Fund’s investments as of September 30, 2015 (See Security Valuation Note 2A in the Notes to Financial Statements):
| Total Value at September 30, 2015 | Level 1 Quoted Prices | Level 2 Significant Observable Inputs | Level 3 Significant Unobservable Inputs | |||||||||||||
Equity Securities: | ||||||||||||||||
Common Stocks | $ | 39,614 | $ | 25,015 | $ | 14,599 | $ | 0 | * | |||||||
|
|
|
|
|
|
|
| |||||||||
Total Investments | $ | 39,614 | $ | 25,015 | $ | 14,599 | $ | 0 | * | |||||||
|
|
|
|
|
|
|
| |||||||||
| * | Includes internally fair valued security currently priced at zero ($0). |
Securities held by the Fund with an end of period value of $14,007 were transferred from Level 1 to Level 2 based on our valuation procedures for non-U.S. securities.
(See Note 2A in the Notes to Financial Statements for more information.)
See Notes to Financial Statements
52
Table of Contents
VIRTUS INTERNATIONAL SMALL-CAP FUND
SCHEDULE OF INVESTMENTS
SEPTEMBER 30, 2015
($ reported in thousands)
| SHARES | VALUE | |||||||
| COMMON STOCKS—97.0% | ||||||||
| Consumer Discretionary—13.0% | ||||||||
Colefax Group plc | 4,490 | $ | 33 | |||||
Goldlion Holdings Ltd. | 2,990,600 | 1,219 | ||||||
Pico Far East Holdings Ltd. (Hong Kong) | 5,317,668 | 1,234 | ||||||
REA Group Ltd. (Australia) | 72,000 | 2,255 | ||||||
Rightmove plc (United Kingdom) | 8,000 | 441 | ||||||
Watts Co. Ltd. (Japan) | 62,591 | 526 | ||||||
|
| |||||||
| 5,708 | ||||||||
|
| |||||||
| Consumer Staples—7.5% | ||||||||
Dongsuh Co., Inc. (South Korea) | 1 | — | ||||||
Guinness Anchor Bhd (Malaysia) | 295,000 | 924 | ||||||
Oldtown Bhd (Malaysia) | 1,797,550 | 520 | ||||||
Premier Marketing PCL (Thailand) | 4,415,029 | 1,203 | ||||||
Wawel SA (Poland) | 1,900 | 637 | ||||||
|
| |||||||
| 3,284 | ||||||||
|
| |||||||
| Energy—4.0% | ||||||||
Pason Systems, Inc. (Canada) | 47,500 | 667 | ||||||
Schoeller-Bleckmann Oilfield Equipment AG (Austria) | 19,548 | 1,102 | ||||||
|
| |||||||
| 1,769 | ||||||||
|
| |||||||
| Financials—20.8% | ||||||||
ARA Asset Management Ltd. (Singapore) | 1,449,760 | 1,345 | ||||||
Ashmore Group plc (United Kingdom) | 306,500 | 1,143 | ||||||
Austbrokers Holdings Ltd. (Australia) | 124,742 | 776 | ||||||
Euler Hermes Group (France) | 15,750 | 1,461 | ||||||
Euroz Ltd. (Australia) | 2,264,878 | 1,386 | ||||||
Financiere Marc de Lacharriere (France) | 5,811 | 544 | ||||||
Korea Ratings Corp. | 35,794 | 1,244 | ||||||
LSL Property Services plc (United Kingdom) | 239,001 | 1,238 | ||||||
|
| |||||||
| 9,137 | ||||||||
|
| |||||||
| Health Care—5.7% | ||||||||
Haw Par Corp. Ltd. (Singapore) | 142,719 | 817 | ||||||
Software Service, Inc. (Japan) | 11,753 | 462 | ||||||
WIN-Partners Co. Ltd. (Japan) | 90,710 | 1,256 | ||||||
|
| |||||||
| 2,535 | ||||||||
|
| |||||||
| Industrials—15.4% | ||||||||
AIT Corp. (Japan) | 170,700 | 1,326 | ||||||
Belimo Holding AG (Switzerland) | 380 | 799 | ||||||
Freight Management Holdings Bhd (Malaysia) | 1,205,174 | 417 | ||||||
Rotork plc. (United Kingdom) | 517,393 | 1,290 | ||||||
| SHARES | VALUE | |||||||
| Industrials—continued | ||||||||
Tegma Gestao Logistica (Brazil) | 1,067,071 | $ | 974 | |||||
Thermador Groupe (France) | 10,762 | 931 | ||||||
WABCO Holdings, Inc. (United States)(2) | 9,750 | 1,022 | ||||||
|
| |||||||
| 6,759 | ||||||||
|
| |||||||
| Information Technology—23.7% | ||||||||
Alten SA (France) | 16,700 | 857 | ||||||
Autohome, Inc. ADR (China)(2) | 71,200 | 2,316 | ||||||
Bouvet ASA (Norway) | 256,945 | 2,565 | ||||||
carsales.com Ltd. (Australia) | 164,467 | 1,133 | ||||||
Lumax International Corp., Ltd. (Taiwan) | 1,102,000 | 1,452 | ||||||
MercadoLibre, Inc. | 4,800 | 437 | ||||||
Pro-Ship, Inc. (Japan) | 42,000 | 695 | ||||||
Societe Pour L’informatique Industrielle (France) | 30,891 | 278 | ||||||
TOTVS SA (Brazil) | 93,000 | 688 | ||||||
|
| |||||||
| 10,421 | ||||||||
|
| |||||||
| Materials—6.9% | ||||||||
KPX Chemical Co. Ltd. (South Korea) | 27,394 | 1,264 | ||||||
Transpaco Ltd. | 903,921 | 1,468 | ||||||
Victrex plc | 11,800 | 316 | ||||||
|
| |||||||
| 3,048 | ||||||||
| TOTAL COMMON STOCKS (Identified Cost $51,655) | 42,661 | |||||||
| TOTAL LONG TERM INVESTMENTS—97.0% | ||||||||
| (Identified Cost $51,655) | 42,661 | |||||||
| SHORT-TERM INVESTMENTS—2.1% | ||||||||
| Money Market Mutual Fund—2.1% | ||||||||
Fidelity Money Market Portfolio – Institutional Shares (seven-day effective yield 0.170%) | 940,851 | 941 | ||||||
| TOTAL SHORT-TERM INVESTMENTS (Identified Cost $941) | 941 | |||||||
| TOTAL INVESTMENTS—99.1% (Identified Cost $52,596) | 43,602 | (1) | ||||||
Other assets and liabilities, net—0.9% |
| 380 | ||||||
|
| |||||||
| NET ASSETS—100.0% | $ | 43,982 | ||||||
|
| |||||||
Footnote Legend:
| (1) | Federal Income Tax Information: For tax information at September 30, 2015, see Note 10 Federal Income Tax Information in the Notes to Financial Statements. |
| (2) | Non-income producing. |
| Country Weightings (Unaudited)† | ||||
Australia | 13 | % | ||
Japan | 10 | |||
United Kingdom | 10 | |||
France | 9 | |||
Norway | 6 | |||
South Korea | 6 | |||
Hong Kong | 5 | |||
Other | 41 | |||
Total | 100 | % | ||
† % of total investments as of September 30, 2015 |
| |||
The following table provides a summary of inputs used to value the Fund’s investments as of September 30, 2015 (See Security Valuation Note 2A in the Notes to Financial Statements):
| Total Value at September 30, 2015 | Level 1 Quoted Prices | Level 2 Significant Observable Inputs | ||||||||||
Equity Securities: | ||||||||||||
Common Stocks | $ | 42,661 | $ | 23,797 | $ | 18,864 | ||||||
Short-Term Investments | 941 | 941 | — | |||||||||
|
|
|
|
|
| |||||||
Total Investments | $ | 43,602 | $ | 24,738 | $ | 18,864 | ||||||
|
|
|
|
|
| |||||||
There are no Level 3 (significant unobservable inputs) priced securities.
Securities held by the Fund with an end of period value of $13,314 were transferred from Level 1 to Level 2 based on our valuation procedures for non-U.S. securities.
(See Note 2A in the Notes to Financial Statements for more information.)
See Notes to Financial Statements
53
Table of Contents
VIRTUS INTERNATIONAL WEALTH MASTERS FUND
SCHEDULE OF INVESTMENTS
SEPTEMBER 30, 2015
($ reported in thousands)
| SHARES | VALUE | |||||||
| COMMON STOCKS—99.3% | ||||||||
| Consumer Discretionary—30.4% | ||||||||
Ainsworth Game Technology Ltd. | 9,809 | $ | 19 | |||||
Autogrill S.p.A(2) | 980 | 9 | ||||||
Autoneum Holding AG | 115 | 21 | ||||||
Axel Springer SE | 447 | 25 | ||||||
Bayerische Motoren Werke AG | 300 | 27 | ||||||
Benesse Holdings, Inc. | 1,450 | 39 | ||||||
Brembo S.p.A | 231 | 9 | ||||||
Brunello Cucinelli S.p.A | 503 | 9 | ||||||
Carnival plc | 854 | 44 | ||||||
Chow Tai Fook Jewellery Group Ltd. | 5,800 | 5 | ||||||
Christian Dior SA | 81 | 15 | ||||||
Compagnie Financiere Richemont SA Registered Shares | 281 | 22 | ||||||
Continental AG | 132 | 28 | ||||||
Crown Resorts Ltd. | 2,508 | 18 | ||||||
CTS Eventim AG & Co. KGaA | 734 | 27 | ||||||
Daily Mail & General Trust plc | 3,829 | 44 | ||||||
De’ Longhi | 364 | 9 | ||||||
Dixons Carphone plc | 6,971 | 45 | ||||||
Domino’s Pizza Enterprises Ltd. | 674 | 19 | ||||||
Don Quijote Holdings Co., Ltd. | 1,050 | 40 | ||||||
Dufry AG(2) | 174 | 20 | ||||||
Fast Retailing Co., Ltd. | 100 | 41 | ||||||
Fielmann AG | 405 | 28 | ||||||
Forbo Holding AG Registered Shares | 19 | 21 | ||||||
Galaxy Entertainment Group Ltd. | 1,750 | 4 | ||||||
Genting Singapore plc | 11,400 | 6 | ||||||
Global Brands Group Holding Ltd.(2) | 24,000 | 5 | ||||||
Harvey Norman Holdings Ltd. | 6,630 | 18 | ||||||
Hennes & Mauritz AB Class B | 250 | 9 | ||||||
Hermes International SA | 41 | 15 | ||||||
Hikari Tsushin, Inc. | 560 | 39 | ||||||
Inditex SA | 463 | 15 | ||||||
Jardine Cycle & Carriage Ltd. | 300 | 6 | ||||||
JCDecaux SA | 403 | 15 | ||||||
Kering | 89 | 15 | ||||||
Kingston Financial Group Ltd.(2) | 16,000 | 6 | ||||||
L’Occitane International SA | 6,750 | 14 | ||||||
Li & Fung Ltd. | 7,000 | 5 | ||||||
Lifestyle International Holdings Ltd. | 3,500 | 5 | ||||||
Luxottica Group S.p.A | 136 | 9 | ||||||
LVMH Moet Hennessy Louis Vuitton SA | 89 | 15 | ||||||
M6-Metropole Television SA | 752 | 14 | ||||||
Man Wah Holdings Ltd. | 5,200 | 5 | ||||||
Mediaset S.p.A. | 1,855 | 9 | ||||||
Mekonomen AB | 389 | 9 | ||||||
Melco Crown Entertainment Ltd. ADR | 306 | 4 | ||||||
Melco International Development Ltd. | 3,500 | 4 | ||||||
Melia Hotels International SA | 1,079 | 15 | ||||||
MGM China Holdings Ltd. | 3,600 | 4 | ||||||
Nitori Co., Ltd. | 485 | 38 | ||||||
Ocado Group plc(2) | 8,727 | 42 | ||||||
Osim International Ltd. | 5,200 | 6 | ||||||
Plastic Omnium SA | 647 | 15 | ||||||
Prada S.p.A | 2,100 | 8 | ||||||
Premier Investments Ltd. | 2,036 | 18 | ||||||
PT Multimedia Servicos de Telecomunicacoes e Multimedia SGPS SA | 424 | 3 | ||||||
| SHARES | VALUE | |||||||
| Consumer Discretionary—continued | ||||||||
Publicis Groupe SA | 220 | $ | 15 | |||||
Puma SE | 133 | 27 | ||||||
Rakuten, Inc. | 3,050 | 39 | ||||||
Royal Caribbean Cruises Ltd. | 55 | 5 | ||||||
SA International Holdings Ltd. | 12,000 | 5 | ||||||
Salvatore Ferragamo S.p.A | 350 | 9 | ||||||
Sands China Ltd. | 1,600 | 5 | ||||||
Sankyo Co., Ltd. | 1,050 | 37 | ||||||
Sega Sammy Holdings, Inc. | 3,700 | 36 | ||||||
Seven West Media Ltd. | 35,418 | 18 | ||||||
Shangri-La Asia Ltd. | 5,500 | 5 | ||||||
Shimanura Co., Ltd. | 400 | 43 | ||||||
Sincere Watch Ltd.(2) | 40,000 | 5 | ||||||
SJM Holdings Ltd. | 6,000 | 4 | ||||||
Societe Television Francaise 1 | 990 | 14 | ||||||
Sodexo | 181 | 15 | ||||||
Sports Direct International plc(2) | 3,847 | 44 | ||||||
Start Today Co., Ltd. | 1,300 | 43 | ||||||
Steinhoff International Holdings Ltd. | 4,451 | 27 | ||||||
Swatch Group AG (The) | 57 | 21 | ||||||
Techtronics Industries Co., Ltd. | 1,350 | 5 | ||||||
Tod’s S.p.A | 101 | 9 | ||||||
Universal Entertainment Corp | 2,100 | 37 | ||||||
Vivendi | 627 | 15 | ||||||
Wynn Macau Ltd. | 4,000 | 5 | ||||||
Yue Yuen Industrial Holdings Ltd. | 1,500 | 6 | ||||||
|
| |||||||
| 1,473 | ||||||||
|
| |||||||
| Consumer Staples—11.5% | ||||||||
AAK AB | 142 | 9 | ||||||
Anheuser-Busch InBev N.V. | 449 | 48 | ||||||
Associated British Foods plc(2) | 918 | 46 | ||||||
Axfood AB | 566 | 9 | ||||||
Beiersdorf AG | 323 | 29 | ||||||
Carrefour SA | 495 | 15 | ||||||
Casino Guichard Perrachon SA | 275 | 15 | ||||||
Davide Campari-Milano S.p.A | 1,152 | 9 | ||||||
First Resources Ltd. | 5,300 | 6 | ||||||
Golden Agri-Resources Ltd. | 28,300 | 7 | ||||||
Heineken Holding NV | 540 | 38 | ||||||
Henkel AG & KGaA | 309 | 27 | ||||||
Jeronimo Martins SPGS SA | 254 | 3 | ||||||
L’Oreal SA | 90 | 16 | ||||||
Marine Harvest ASA | 418 | 5 | ||||||
MARR SpA | 481 | 9 | ||||||
Metro AG | 981 | 27 | ||||||
Orkla ASA | 670 | 5 | ||||||
Pola Orbis Holdings, Inc. | 650 | 40 | ||||||
Rallye SA | 841 | 14 | ||||||
Remy Cointreau SA | 242 | 16 | ||||||
Sonae SGPS SA | 2,824 | 3 | ||||||
Sugi Holdings Co., Ltd. | 860 | 39 | ||||||
Sundrug Co., Ltd. | 730 | 38 | ||||||
Suntory Beverage & Food Ltd | 1,040 | 40 | ||||||
Unicharm Corp. | 2,100 | 37 | ||||||
Wilmar International Ltd. | 3,100 | 6 | ||||||
|
| |||||||
| 556 | ||||||||
|
| |||||||
| Diversified REIT—0.3% | ||||||||
Fonciere Des Regions | 175 | 15 | ||||||
|
| |||||||
| Energy—3.6% | ||||||||
Akastor ASA(2) | 3,666 | 5 | ||||||
| SHARES | VALUE | |||||||
| Energy—continued | ||||||||
Aker Solutions ASA | 1,325 | $ | 5 | |||||
Avance Gas Holding Ltd.(3) | 377 | 5 | ||||||
Brightoil Petroleum Holdings Ltd.(2) | 13,000 | 5 | ||||||
Delek Group Ltd. | 28 | 6 | ||||||
Det Norske Oljeselskap ASA(2) | 881 | 5 | ||||||
Galp Energia SGPS SA | 340 | 3 | ||||||
Genel Energy plc(2) | 9,118 | 38 | ||||||
Petrofac Ltd. | 3,731 | 43 | ||||||
Saras S.p.A(2) | 3,850 | 8 | ||||||
Seadrill Ltd. | 737 | 4 | ||||||
Ship Finance International Ltd. | 307 | 5 | ||||||
Tecnicas Reunidas SA | 328 | 14 | ||||||
Tenaris S.A. ADR | 355 | 9 | ||||||
Transocean Ltd.(4) | 1,467 | 19 | ||||||
|
| |||||||
| 174 | ||||||||
|
| |||||||
| Financials—14.4% | ||||||||
Abacus Property Group REIT | 8,430 | 19 | ||||||
ACOM Co. Ltd.(2) | 8,700 | 45 | ||||||
Admiral Group plc | 1,929 | 44 | ||||||
Ashmore Group plc(4) | 11,298 | 42 | ||||||
Assicurazioni Generali S.p.A | 508 | 9 | ||||||
Banco Santander SA | 2,794 | 15 | ||||||
Bank Hapoalim BM | 1,239 | 6 | ||||||
Bank of East Asia Ltd. | 1,400 | 5 | ||||||
Bankinter SA | 2,094 | 15 | ||||||
Champion REIT | 10,000 | 5 | ||||||
Cheung Kong Property Holdings Ltd. | 650 | 5 | ||||||
China LNG Group Ltd. | 120,000 | 5 | ||||||
City Developments Ltd. | 1,100 | 6 | ||||||
Emperor International Group Ltd. | 60,000 | 5 | ||||||
First Pacific Co., Ltd. | 8,000 | 5 | ||||||
Fortune REIT | 5,000 | 5 | ||||||
Goldin Financial Holdings Ltd.(2) | 2,400 | 5 | ||||||
Groupe Bruxelles Lambert SA | 652 | 49 | ||||||
Hang Lung Group Ltd. | 1,400 | 5 | ||||||
Hang Lung Properties Ltd. | 2,000 | 4 | ||||||
Hargreaves Lansdown plc | 2,389 | 44 | ||||||
Henderson Land Development Co., Ltd. | 800 | 5 | ||||||
Hongkong Land Holdings Ltd. | 900 | 6 | ||||||
Hufvudstaden AB | 714 | 9 | ||||||
Hysan Development Co. Ltd. | 1,200 | 5 | ||||||
Industrivarden AB | 490 | 9 | ||||||
Inmobiliaria Colonial SA(2) | 23,756 | 16 | ||||||
Intu Properties plc REIT | 9,145 | 46 | ||||||
Kerry Properties Ltd. | 1,800 | 5 | ||||||
Lundbergforetagen AB Class B | 193 | 9 | ||||||
Matsui Securities Co., Ltd. | 4,300 | 37 | ||||||
Mediolanum S.p.A | 1,233 | 9 | ||||||
New World Development Co., Ltd. | 5,000 | 5 | ||||||
Oversea-Chinese Banking Corp. | 900 | 6 | ||||||
Pargesa Holding SA | 361 | 21 | ||||||
Platinum Asset Management Ltd. | 4,027 | 19 | ||||||
Reinet Investments SCA | 21,147 | 45 | ||||||
Schroders plc | 1,020 | 43 | ||||||
Sino Land Co., Ltd. | 3,300 | 5 | ||||||
Sun Hung Kai Properties Ltd. | 375 | 5 | ||||||
Svenska Handelsbanken AB Class A | 624 | 9 | ||||||
United Overseas Bank Ltd. | 450 | 6 | ||||||
United Overseas Land Ltd. | 1,400 | 6 | ||||||
Wendel | 124 | 14 | ||||||
See Notes to Financial Statements
54
Table of Contents
VIRTUS INTERNATIONAL WEALTH MASTERS FUND
SCHEDULE OF INVESTMENTS (Continued)
SEPTEMBER 30, 2015
($ reported in thousands)
| SHARES | VALUE | |||||||
| Financials—continued | ||||||||
Wharf Holdings Ltd. (The) | 900 | $ | 5 | |||||
Wheelock & Co., Ltd. | 1,175 | 5 | ||||||
Yanlord Land Group Ltd. | 8,100 | 6 | ||||||
|
| |||||||
| 699 | ||||||||
|
| |||||||
| Health Care—4.2% | ||||||||
Barry Callebaut AG | 20 | 22 | ||||||
BioMerieux | 133 | 14 | ||||||
DiaSorin S.p.A | 200 | 9 | ||||||
Eurofins Scientific SE | 46 | 14 | ||||||
Galenica AG Registered Shares | 16 | 20 | ||||||
Getinge AB | 402 | 9 | ||||||
Ipsen SA | 217 | 14 | ||||||
Meda AB | 623 | 9 | ||||||
Roche Holding AG | 82 | 22 | ||||||
Straumann Holding AG | 73 | 21 | ||||||
Taisho Pharmaceutical Holdings Co., Ltd. | 650 | 37 | ||||||
Taro Pharmaceutical Industries Ltd.(2) | 42 | 6 | ||||||
Town Health International Medical Group Ltd. | 24,000 | 5 | ||||||
|
| |||||||
| 202 | ||||||||
|
| |||||||
| Industrials—15.0% | ||||||||
Abertis Infraestructuras SA | 985 | 16 | ||||||
Actividades de Construccion y Servicios SA | 511 | 15 | ||||||
Adecco SA Registered Shares | 292 | 21 | ||||||
Alfa Laval AB | 585 | 10 | ||||||
Alstom SA(2) | 473 | 15 | ||||||
ANDRITZ AG | 548 | 25 | ||||||
Assa Abloy AB | 499 | 9 | ||||||
Bollore SA | 2,967 | 14 | ||||||
Bouygues SA | 408 | 14 | ||||||
Cargotec Oyj | 885 | 24 | ||||||
Cheung Kong Infrastructure Holdings Ltd. | 550 | 5 | ||||||
CK Hutchison Holdings Ltd. | 400 | 5 | ||||||
Dassault Aviation SA | 12 | 14 | ||||||
easyJet plc | 1,673 | 45 | ||||||
Ferrovial SA | 635 | 15 | ||||||
Fomento de Construcciones y Contratas SA(2) | 1,889 | 14 | ||||||
Golden Ocean Group Ltd. | 1,750 | 4 | ||||||
Hopewell Holdings Ltd. | 1,500 | 5 | ||||||
Indutrade AB | 193 | 9 | ||||||
Jardine Matheson Holdings Ltd. | 125 | 6 | ||||||
Jardine Strategic Holdings Ltd. | 200 | 5 | ||||||
Johnson Electric Holdings Ltd. | 1,500 | 5 | ||||||
Kone Oyj Class B | 628 | 24 | ||||||
Kuehne & Nagel International AG | 167 | 21 | ||||||
Nidec Corp. | 510 | 35 | ||||||
Noble Group Ltd. | 18,200 | 5 | ||||||
Nordex SE(2) | 1,007 | 28 | ||||||
NWS Holdings Ltd. | 4,000 | 5 | ||||||
Obrascon Huarte Lain SA | 1,118 | 15 | ||||||
OC Oerlikon Corp. AG Registered Shares(2) | 2,165 | 21 | ||||||
Orient Overseas International Ltd. | 1,000 | 5 | ||||||
Prosegur Cia de Seguridad SA | 3,320 | 16 | ||||||
Regus plc | 9,279 | 43 | ||||||
Rieter Holding AG | 150 | 22 | ||||||
| SHARES | VALUE | |||||||
| Industrials—continued | ||||||||
Ryanair Holdings plc ADR | 546 | $ | 43 | |||||
Salini Impregilo S.p.A | 2,136 | 8 | ||||||
Securitas AB Class B | 731 | 9 | ||||||
Seven Group Holdings Ltd. | 5,555 | 17 | ||||||
SGL Carbon SE(2) | 1,655 | 26 | ||||||
SGS SA Registered Shares | 12 | 21 | ||||||
Shun Tak Holdings Ltd. | 12,000 | 5 | ||||||
Skanska AB Class B | 467 | 9 | ||||||
Sulzer AG | 210 | 21 | ||||||
Summit Ascent Holdings Ltd.(2) | 10,000 | 5 | ||||||
Vossloh AG(2) | 368 | 27 | ||||||
|
| |||||||
| 726 | ||||||||
|
| |||||||
| Information Technology—9.3% | ||||||||
Check Point Software Technologies Ltd. | 79 | 6 | ||||||
COLOPL, Inc.(2)(4) | 2,250 | 36 | ||||||
Dassault Systemes | 204 | 15 | ||||||
Gree, Inc. | 8,300 | 37 | ||||||
GungHo Online Entertainment ,Inc. | 12,400 | 37 | ||||||
Hexagon AB | 303 | 9 | ||||||
Keyence Corp. | 85 | 38 | ||||||
Konami Corp. | 1,800 | 39 | ||||||
Lenovo Group Ltd. | 6,000 | 5 | ||||||
Mixi, Inc. | 1,120 | 39 | ||||||
Nexon Co., Ltd. | 2,900 | 39 | ||||||
Otsuka Corp. | 800 | 39 | ||||||
SAP SE | 420 | 27 | ||||||
Silverlake Axis Ltd. | 15,000 | 6 | ||||||
Tower Semiconductor Ltd.(2) | 463 | 6 | ||||||
United Internet AG Registered Shares | 545 | 28 | ||||||
VTech Holdings Ltd. | 400 | 5 | ||||||
Yahoo Japan Corp. | 9,800 | 37 | ||||||
|
| |||||||
| 448 | ||||||||
|
| |||||||
| Materials—6.3% | ||||||||
APERAM SA(2) | 1,355 | 36 | ||||||
ArcelorMittal | 6,206 | 32 | ||||||
EMS-Chemie Holding AG | 52 | 21 | ||||||
Evolution Mining Ltd | 22,174 | 20 | ||||||
Fortescue Metals Group Ltd. | 13,779 | 18 | ||||||
Frutarom Industries Ltd. | 163 | 6 | ||||||
Glencore International plc | 26,751 | 37 | ||||||
HeidelbergCement AG | 379 | 26 | ||||||
Hexpol AB | 853 | 10 | ||||||
Holcim Ltd. Registered Shares | 389 | 20 | ||||||
Holmen AB B Shares | 334 | 9 | ||||||
Imerys SA | 221 | 14 | ||||||
Israel Corp. Ltd. (The) | 23 | 6 | ||||||
OCI NV(2) | 1,352 | 35 | ||||||
Vicat | 226 | 14 | ||||||
|
| |||||||
| 304 | ||||||||
|
| |||||||
| Retail REITs—0.8% | ||||||||
Scentre Group | 6,908 | 19 | ||||||
Westfield Corp. | 2,679 | 19 | ||||||
|
| |||||||
| 38 | ||||||||
|
| |||||||
| Telecommunication Services—2.3% | ||||||||
HKT Trust & HKT Ltd. | 4,350 | 5 | ||||||
| SHARES | VALUE | |||||||
| Telecommunication Services—continued | ||||||||
PCCW Ltd. | 10,000 | $ | 5 | |||||
Smartone Telecommunications Holdings Ltd. | 2,500 | 5 | ||||||
Softbank Corp. | 730 | 34 | ||||||
Talktalk Telecom Group plc | 9,113 | 43 | ||||||
TPG Telecom Ltd. | 2,639 | 20 | ||||||
|
| |||||||
| 112 | ||||||||
|
| |||||||
| Utilities—1.2% | ||||||||
CLP Holdings Ltd. | 600 | 5 | ||||||
GDF Suez | 896 | 15 | ||||||
Hong Kong & China Gas Co., Ltd. | 2,600 | 5 | ||||||
Iliad SA | 70 | 14 | ||||||
Kenon Holdings Ltd.(2) | 458 | 6 | ||||||
Rubis SCA | 200 | 15 | ||||||
|
| |||||||
| 60 | ||||||||
| TOTAL COMMON STOCKS (Identified Cost $5,187) | 4,807 | |||||||
| TOTAL LONG TERM INVESTMENTS—99.3% | ||||||||
| (Identified Cost $5,187) | 4,807 | |||||||
| SECURITIES LENDING COLLATERAL—1.9% | ||||||||
INVESCO Trust Short-Term Investments Liquid Assets Portfolio (The) Institutional Shares (seven-day effective yield 0.160%)(5) | 93,600 | 94 | ||||||
| TOTAL SECURITIES LENDING COLLATERAL (Identified Cost $94) | 94 | |||||||
| TOTAL INVESTMENTS—101.2% (Identified Cost $5,281) | 4,901 | (1) | ||||||
Other assets and liabilities, net—(1.2)% |
| (59 | ) | |||||
|
| |||||||
| NET ASSETS—100.0% | $ | 4,842 | ||||||
|
| |||||||
Abbreviations:
| ADR | American Depositary Receipt |
| REIT | Real Estate Investment Trust |
Footnote Legend:
| (1) | Federal Income Tax Information: For tax information at September 30, 2015, see Note 10 Federal Income Tax Information in the Notes to Financial Statements. |
| (2) | Non-income producing. |
| (3) | Security exempt from registration under Rule 144A of the Securities Act of 1933. These securities may be resold in transactions exempt from registration, normally to qualified institutional buyers. At September 30, 2015, these securities amounted to a value of $5 or 0.1% of net assets. |
| (4) | All or a portion of security is on loan. |
| (5) | Represents security purchased with cash collateral received for securities on loan. |
Security abbreviation definitions are located under the Key Investment Terms starting on page 4.
See Notes to Financial Statements
55
Table of Contents
VIRTUS INTERNATIONAL WEALTH MASTERS FUND
SCHEDULE OF INVESTMENTS (Continued)
SEPTEMBER 30, 2015
($ reported in thousands)
| Country Weightings (Unaudited)† | ||||
Japan | 24 | % | ||
United Kingdom | 17 | |||
France | 10 | |||
Germany | 9 | |||
Switzerland | 8 | |||
Australia | 5 | |||
Hong Kong | 5 | |||
Other | 22 | |||
Total | 100 | % | ||
† % of total investments as of September 30, 2015 |
| |||
The following table provides a summary of inputs used to value the Fund’s investments as of September 30, 2015 (See Security Valuation Note 2A in the Notes to Financial Statements):
| Total Value at September 30, 2015 | Level 1 Quoted Prices | Level 2 Significant Observable Inputs | ||||||||||
Equity Securities: | ||||||||||||
Common Stocks | $ | 4,807 | $ | 3,147 | $ | 1,660 | ||||||
Securities Lending Collateral | 94 | 94 | — | |||||||||
|
|
|
|
|
| |||||||
Total Investments | $ | 4,901 | $ | 3,241 | $ | 1,660 | ||||||
|
|
|
|
|
| |||||||
There are no Level 3 (significant unobservable inputs) priced securities.
See Notes to Financial Statements
56
Table of Contents
THIS PAGE INTENTIONALLY BLANK.
57
Table of Contents
VIRTUS OPPORTUNITIES TRUST
STATEMENTS OF ASSETS AND LIABILITIES
SEPTEMBER 30, 2015
($ reported in thousands except shares and per share amounts)
|
|
|
|
|
| |||||||
| Emerging Markets Debt Fund | Emerging Markets Equity Income Fund | Emerging Markets Small-Cap Fund | ||||||||||
| Assets | ||||||||||||
Investment in unaffiliated securities at value(1) | $ | 25,908 | $ | 43,629 | $ | 4,253 | ||||||
Investment in affiliated funds at value(4) | 144 | — | — | |||||||||
Foreign currency at value(2) | — | 182 | — | |||||||||
Cash | — | (3) | — | — | ||||||||
Receivables | ||||||||||||
Investment securities sold | 299 | — | 86 | |||||||||
Fund shares sold | — | (3) | 31 | — | ||||||||
Receivable from adviser | — | — | 6 | |||||||||
Dividends and interest receivable | 458 | 125 | 6 | |||||||||
Tax reclaims | 1 | — | — | (3) | ||||||||
Prepaid trustee retainer | — | (3) | — | (3) | — | (3) | ||||||
Prepaid expenses | 27 | 29 | 14 | |||||||||
|
|
|
|
|
| |||||||
Total assets | 26,837 | 43,996 | 4,365 | |||||||||
|
|
|
|
|
| |||||||
| Liabilities | ||||||||||||
Cash overdraft | — | 85 | — | |||||||||
Payables | ||||||||||||
Fund shares repurchased | 3 | 324 | — | |||||||||
Foreign capital gain taxes payable | — | 1 | — | |||||||||
Investment securities purchased | 194 | — | — | |||||||||
Dividend distributions | — | (3) | — | — | ||||||||
Investment advisory fees | 18 | 31 | — | |||||||||
Distribution and service fees | 1 | 1 | — | (3) | ||||||||
Administration fees | 3 | 5 | 1 | |||||||||
Transfer agent fees and expenses | 2 | 9 | — | (3) | ||||||||
Trustees’ fees and expenses | — | (3) | — | (3) | — | (3) | ||||||
Professional fees | 37 | 29 | 29 | |||||||||
Other accrued expenses | 3 | 50 | 4 | |||||||||
|
|
|
|
|
| |||||||
Total liabilities | 261 | 535 | 34 | |||||||||
|
|
|
|
|
| |||||||
| Net Assets | $ | 26,576 | $ | 43,461 | $ | 4,331 | ||||||
|
|
|
|
|
| |||||||
| Net Assets Consist of: | ||||||||||||
Capital paid in on shares of beneficial interest | $ | 31,420 | $ | 56,390 | $ | 5,552 | ||||||
Accumulated undistributed net investment income (loss) | (19 | ) | 860 | 77 | ||||||||
Accumulated undistributed net realized gain (loss) | (1,933 | ) | (7,930 | ) | (61 | ) | ||||||
Net unrealized appreciation (depreciation) on investments | (2,892 | ) | (5,859 | ) | (1,237 | ) | ||||||
|
|
|
|
|
| |||||||
| Net Assets | $ | 26,576 | $ | 43,461 | $ | 4,331 | ||||||
|
|
|
|
|
| |||||||
| Class A | ||||||||||||
Net asset value (net assets/shares outstanding) per share | $ | 8.54 | $ | 8.30 | $ | 7.85 | ||||||
Maximum offering price per share NAV/(1–3.75%) | $ | 8.87 | $ | — | $ | — | ||||||
Maximum offering price per share NAV/(1–5.75%) | $ | — | $ | 8.81 | $ | 8.33 | ||||||
Shares of beneficial interest outstanding, no par value, unlimited authorization | 84,083 | 87,685 | 42,237 | |||||||||
Net Assets | $ | 718 | $ | 727 | $ | 332 | ||||||
| Class C | ||||||||||||
Net asset value (net assets/shares outstanding) and offering price per share | $ | 8.54 | $ | 8.26 | $ | 7.80 | ||||||
Shares of beneficial interest outstanding, no par value, unlimited authorization | 66,224 | 77,316 | 16,395 | |||||||||
Net Assets | $ | 565 | $ | 638 | $ | 128 | ||||||
| Class I | ||||||||||||
Net asset value (net assets/shares outstanding) and offering price per share | $ | 8.54 | $ | 8.31 | $ | 7.88 | ||||||
Shares of beneficial interest outstanding, no par value, unlimited authorization | 2,963,356 | 5,067,025 | 491,357 | |||||||||
Net Assets | $ | 25,293 | $ | 42,096 | $ | 3,871 | ||||||
(1) Investment in unaffiliated securities at cost | $ | 28,794 | $ | 49,491 | $ | 5,490 | ||||||
(2) Foreign currency at cost | $ | — | $ | 180 | $ | — | ||||||
(3) Amount is less than $500. | ||||||||||||
(4) Investment in affiliated funds at cost | $ | 148 | $ | — | $ | — | ||||||
See Notes to Financial Statements
58
Table of Contents
VIRTUS OPPORTUNITIES TRUST
STATEMENTS OF ASSETS AND LIABILITIES (Continued)
SEPTEMBER 30, 2015
($ reported in thousands except shares and per share amounts)
|
|
|
| |||||
| Global Infrastructure Fund | Global Opportunities Fund | |||||||
| Assets | ||||||||
Investment in securities at value(1) | $ | 153,518 | $ | 143,042 | ||||
Receivables | ||||||||
Fund shares sold | 136 | 319 | ||||||
Dividends and interest receivable | 252 | 222 | ||||||
Tax reclaims | 83 | 174 | ||||||
Prepaid trustee retainer | 3 | 1 | ||||||
Prepaid expenses | 34 | 37 | ||||||
|
|
|
| |||||
Total assets | 154,026 | 143,795 | ||||||
|
|
|
| |||||
| Liabilities | ||||||||
Payables | ||||||||
Fund shares repurchased | 1,493 | 32 | ||||||
Investment securities purchased | — | 2,751 | ||||||
Foreign capital gain taxes payable | — | 11 | ||||||
Investment advisory fees | 85 | 98 | ||||||
Distribution and service fees | 48 | 30 | ||||||
Administration fees | 16 | 14 | ||||||
Transfer agent fees and expenses | 39 | 30 | ||||||
Trustees’ fees and expenses | — | (2) | — | (2) | ||||
Professional fees | 29 | 36 | ||||||
Other accrued expenses | 11 | 15 | ||||||
|
|
|
| |||||
Total liabilities | 1,721 | 3,017 | ||||||
|
|
|
| |||||
| Net Assets | $ | 152,305 | $ | 140,778 | ||||
|
|
|
| |||||
| Net Assets Consist of: | ||||||||
Capital paid in on shares of beneficial interest | $ | 146,192 | $ | 114,815 | ||||
Accumulated undistributed net investment income (loss) | 152 | 398 | ||||||
Accumulated undistributed net realized gain (loss) | 7,316 | (1,870 | ) | |||||
Net unrealized appreciation (depreciation) on investments | (1,355 | ) | 27,435 | |||||
|
|
|
| |||||
| Net Assets | $ | 152,305 | $ | 140,778 | ||||
|
|
|
| |||||
| Class A | ||||||||
Net asset value (net assets/shares outstanding) per share | $ | 13.62 | $ | 12.32 | ||||
Maximum offering price per share NAV/(1–5.75%) | $ | 14.45 | $ | 13.07 | ||||
Shares of beneficial interest outstanding, no par value, unlimited authorization | 4,459,917 | 7,127,017 | ||||||
Net Assets | $ | 60,744 | $ | 87,769 | ||||
| Class B | ||||||||
Net asset value (net assets/shares outstanding) and offering price per share | $ | — | $ | 10.85 | ||||
Shares of beneficial interest outstanding, no par value, unlimited authorization | — | 43,726 | ||||||
Net Assets | $ | — | $ | 474 | ||||
| Class C | ||||||||
Net asset value (net assets/shares outstanding) and offering price per share | $ | 13.57 | $ | 10.79 | ||||
Shares of beneficial interest outstanding, no par value, unlimited authorization | 3,024,834 | 1,338,305 | ||||||
Net Assets | $ | 41,039 | $ | 14,431 | ||||
| Class I | ||||||||
Net asset value (net assets/shares outstanding) and offering price per share | $ | 13.63 | $ | 12.32 | ||||
Shares of beneficial interest outstanding, no par value, unlimited authorization | 3,706,969 | 3,094,042 | ||||||
Net Assets | $ | 50,522 | $ | 38,104 | ||||
(1) Investment in securities at cost | $ | 154,862 | $ | 115,586 | ||||
(2) Amount is less than $500. | ||||||||
See Notes to Financial Statements
59
Table of Contents
VIRTUS OPPORTUNITIES TRUST
STATEMENTS OF ASSETS AND LIABILITIES (Continued)
SEPTEMBER 30, 2015
($ reported in thousands except shares and per share amounts)
|
|
|
|
|
| |||||||
| Global Real Estate Securities Fund | Greater European Opportunities Fund | International Equity Fund | ||||||||||
| Assets | ||||||||||||
Investment in securities at value(1)(2) | $ | 77,403 | $ | 20,657 | $ | 8,686 | ||||||
Receivables | ||||||||||||
Investment securities sold | 124 | 19 | — | |||||||||
Fund shares sold | 122 | 73 | 1 | |||||||||
Receivable from adviser | — | — | 1 | |||||||||
Dividends and interest receivable | 275 | 17 | 23 | |||||||||
Tax reclaims | 9 | 40 | 26 | |||||||||
Securities lending receivable | — | — | 1 | |||||||||
Prepaid trustee retainer | 1 | — | (3) | — | (3) | |||||||
Prepaid expenses | 24 | 20 | 27 | |||||||||
|
|
|
|
|
| |||||||
Total assets | 77,958 | 20,826 | 8,765 | |||||||||
|
|
|
|
|
| |||||||
| Liabilities | ||||||||||||
Cash overdraft | — | — | 337 | |||||||||
Collateral on securities loaned | — | — | 452 | |||||||||
Payables | ||||||||||||
Fund shares repurchased | 164 | 13 | — | |||||||||
Investment securities purchased | 278 | 133 | — | |||||||||
Investment advisory fees | 44 | 8 | — | |||||||||
Distribution and service fees | 14 | 4 | 2 | |||||||||
Administration fees | 8 | 2 | 1 | |||||||||
Transfer agent fees and expenses | 15 | 9 | 2 | |||||||||
Trustees’ fees and expenses | — | (3) | — | (3) | — | (3) | ||||||
Professional fees | 29 | 29 | 32 | |||||||||
Other accrued expenses | 11 | 7 | 3 | |||||||||
|
|
|
|
|
| |||||||
Total liabilities | 563 | 205 | 829 | |||||||||
|
|
|
|
|
| |||||||
| Net Assets | $ | 77,395 | $ | 20,621 | $ | 7,936 | ||||||
|
|
|
|
|
| |||||||
| Net Assets Consist of: | ||||||||||||
Capital paid in on shares of beneficial interest | $ | 70,196 | $ | 18,347 | $ | 8,816 | ||||||
Accumulated undistributed net investment income (loss) | 298 | 126 | (10 | ) | ||||||||
Accumulated undistributed net realized gain (loss) | 667 | (200 | ) | (966 | ) | |||||||
Net unrealized appreciation (depreciation) on investments | 6,234 | 2,348 | 96 | |||||||||
|
|
|
|
|
| |||||||
| Net Assets | $ | 77,395 | $ | 20,621 | $ | 7,936 | ||||||
|
|
|
|
|
| |||||||
| Class A | ||||||||||||
Net asset value (net assets/shares outstanding) per share | $ | 26.19 | $ | 15.20 | $ | 9.80 | ||||||
Maximum offering price per share NAV/(1–5.75%) | $ | 27.79 | $ | 16.13 | $ | 10.40 | ||||||
Shares of beneficial interest outstanding, no par value, unlimited authorization | 1,386,616 | 875,418 | 196,192 | |||||||||
Net Assets | $ | 36,315 | $ | 13,306 | $ | 1,923 | ||||||
| Class C | ||||||||||||
Net asset value (net assets/shares outstanding) and offering price per share | $ | 25.71 | $ | 14.95 | $ | 9.60 | ||||||
Shares of beneficial interest outstanding, no par value, unlimited authorization | 327,545 | 104,595 | 176,012 | |||||||||
Net Assets | $ | 8,421 | $ | 1,564 | $ | 1,689 | ||||||
| Class I | ||||||||||||
Net asset value (net assets/shares outstanding) and offering price per share | $ | 26.37 | $ | 15.26 | $ | 9.78 | ||||||
Shares of beneficial interest outstanding, no par value, unlimited authorization | 1,238,348 | 376,847 | 442,267 | |||||||||
Net Assets | $ | 32,659 | $ | 5,751 | $ | 4,324 | ||||||
(1) Investment in securities at cost | $ | 71,168 | $ | 18,307 | $ | 8,588 | ||||||
(2) Market value of securities on loan | $ | — | $ | — | $ | 443 | ||||||
(3) Amount is less than $500. | ||||||||||||
See Notes to Financial Statements
60
Table of Contents
VIRTUS OPPORTUNITIES TRUST
STATEMENTS OF ASSETS AND LIABILITIES (Continued)
SEPTEMBER 30, 2015
($ reported in thousands except shares and per share amounts)
|
|
|
|
|
| |||||||
| International Real Estate Securities Fund | International Small-Cap Fund | International Wealth Masters Fund | ||||||||||
| Assets | �� | |||||||||||
Investment in securities at value(1)(3) | $ | 39,614 | $ | 43,602 | $ | 4,901 | ||||||
Foreign currency at value(2) | — | — | (4) | — | ||||||||
Receivables | ||||||||||||
Investment securities sold | 132 | 541 | 419 | |||||||||
Fund shares sold | 31 | 122 | — | |||||||||
Receivable from adviser | — | — | 9 | |||||||||
Dividends and interest receivable | 86 | 68 | 11 | |||||||||
Tax reclaims | 14 | 22 | 5 | |||||||||
Securities lending receivable | — | — | — | (4) | ||||||||
Prepaid trustee retainer | — | (4) | — | (4) | — | (4) | ||||||
Prepaid expenses | 31 | 41 | 25 | |||||||||
|
|
|
|
|
| |||||||
Total assets | 39,908 | 44,396 | 5,370 | |||||||||
|
|
|
|
|
| |||||||
| Liabilities | ||||||||||||
Cash overdraft | 68 | — | 20 | |||||||||
Collateral on securities loaned | — | — | 94 | |||||||||
Payables | ||||||||||||
Fund shares repurchased | 120 | 291 | — | |||||||||
Investment securities purchased | — | 36 | 367 | |||||||||
Investment advisory fees | 11 | 30 | — | |||||||||
Distribution and service fees | 4 | 2 | — | (4) | ||||||||
Administration fees | 4 | 5 | 1 | |||||||||
Transfer agent fees and expenses | 8 | 7 | — | (4) | ||||||||
Trustees’ fees and expenses | 17 | — | (4) | — | (4) | |||||||
Professional fees | 28 | 29 | 29 | |||||||||
Other accrued expenses | 8 | 14 | 17 | |||||||||
|
|
|
|
|
| |||||||
Total liabilities | 268 | 414 | 528 | |||||||||
|
|
|
|
|
| |||||||
| Net Assets | $ | 39,640 | $ | 43,982 | $ | 4,842 | ||||||
|
|
|
|
|
| |||||||
| Net Assets Consist of: | ||||||||||||
Capital paid in on shares of beneficial interest | $ | 43,614 | $ | 51,646 | $ | 5,084 | ||||||
Accumulated undistributed net investment income (loss) | (1,123 | ) | 516 | 64 | ||||||||
Accumulated undistributed net realized gain (loss) | (10,148 | ) | 817 | 74 | ||||||||
Net unrealized appreciation (depreciation) on investments | 7,297 | (8,997 | ) | (380 | ) | |||||||
|
|
|
|
|
| |||||||
| Net Assets | $ | 39,640 | $ | 43,982 | $ | 4,842 | ||||||
|
|
|
|
|
| |||||||
| Class A | ||||||||||||
Net asset value (net assets/shares outstanding) per share | $ | 6.63 | $ | 10.85 | $ | 9.52 | ||||||
Maximum offering price per share NAV/(1–5.75%) | $ | 7.03 | $ | 11.51 | $ | 10.10 | ||||||
Shares of beneficial interest outstanding, no par value, unlimited authorization | 1,873,258 | 176,617 | 13,285 | |||||||||
Net Assets | $ | 12,415 | $ | 1,916 | $ | 126 | ||||||
| Class C | ||||||||||||
Net asset value (net assets/shares outstanding) and offering price per share | $ | 6.59 | $ | 10.72 | $ | 9.46 | ||||||
Shares of beneficial interest outstanding, no par value, unlimited authorization | 337,874 | 136,538 | 12,027 | |||||||||
Net Assets | $ | 2,226 | $ | 1,464 | $ | 114 | ||||||
| Class I | ||||||||||||
Net asset value (net assets/shares outstanding) and offering price per share | $ | 6.64 | $ | 10.89 | $ | 9.54 | ||||||
Shares of beneficial interest outstanding, no par value, unlimited authorization | 3,767,465 | 3,721,201 | 482,490 | |||||||||
Net Assets | $ | 24,999 | $ | 40,512 | $ | 4,602 | ||||||
| Class R6 | ||||||||||||
Net asset value (net assets/shares outstanding) and offering price per share | $ | — | $ | 10.89 | $ | — | ||||||
Shares of beneficial interest outstanding, no par value, unlimited authorizaton | — | 8,227 | — | |||||||||
Net Assets | $ | — | $ | 90 | $ | — | ||||||
(1) Investment in securities at cost | $ | 32,315 | $ | 52,596 | $ | 5,281 | ||||||
(2) Foreign currency at cost | $ | — | $ | — | (4) | $ | — | |||||
(3) Market value of securities on loan | $ | — | $ | — | $ | 89 | ||||||
(4) Amount is less than $500. | ||||||||||||
See Notes to Financial Statements
61
Table of Contents
VIRTUS OPPORTUNITIES TRUST
YEAR ENDED SEPTEMBER 30, 2015
($ reported in thousands)
|
|
|
|
|
| |||||||
| Emerging Markets Debt Fund | Emerging Markets Equity Income Fund | Emerging Markets Small-Cap Fund | ||||||||||
| Investment Income | ||||||||||||
Dividends | $ | 6 | $ | 2,867 | $ | 177 | ||||||
Dividends from affiliated funds | 1 | — | — | |||||||||
Interest | 1,795 | — | — | |||||||||
Foreign taxes withheld | (2 | ) | (360 | ) | (21 | ) | ||||||
|
|
|
|
|
| |||||||
Total investment income | 1,800 | 2,507 | 156 | |||||||||
|
|
|
|
|
| |||||||
| Expenses | ||||||||||||
Investment advisory fees | 220 | 722 | 54 | |||||||||
Service fees, Class A | 2 | 3 | 1 | |||||||||
Distribution and service fees, Class C | 7 | 8 | 2 | |||||||||
Administration fees | 35 | 82 | 5 | |||||||||
Transfer agent fees and expenses | 18 | 68 | 3 | |||||||||
Interest expense | — | 1 | — | |||||||||
Registration fees | 40 | 44 | 44 | |||||||||
Printing fees and expenses | 4 | 8 | 2 | |||||||||
Custodian fees | 3 | 66 | 7 | |||||||||
Professional fees | 37 | 37 | 29 | |||||||||
Trustees’ fees and expenses | 2 | 3 | — | (1) | ||||||||
Miscellaneous expenses | 3 | 5 | 6 | |||||||||
|
|
|
|
|
| |||||||
Total expenses | 371 | 1,047 | 153 | |||||||||
Less expenses reimbursed and/or waived by investment adviser | (40 | ) | (6 | ) | (79 | ) | ||||||
|
|
|
|
|
| |||||||
Net expenses | 331 | 1,041 | 74 | |||||||||
|
|
|
|
|
| |||||||
Net investment income (loss) | 1,469 | 1,466 | 82 | |||||||||
|
|
|
|
|
| |||||||
| Net Realized and Unrealized Gain (Loss) on Investments | ||||||||||||
Net realized gain (loss) on unaffiliated investments | (1,816 | ) | (7,537 | ) | (45 | ) | ||||||
Net realized gain (loss) on foreign currency transactions | (8 | ) | (75 | ) | (2 | ) | ||||||
Net change in unrealized appreciation (depreciation) on unaffiliated investments | (1,961 | ) | (6,281 | ) | (1,174 | ) | ||||||
Net change in unrealized appreciation (depreciation) on affiliated investments | (4 | ) | — | — | ||||||||
Net change in unrealized appreciation (depreciation) on foreign currency translation | — | (1) | 8 | — | (1) | |||||||
|
|
|
|
|
| |||||||
| Net gain (loss) on investments | (3,789 | ) | (13,885 | ) | (1,221 | ) | ||||||
|
|
|
|
|
| |||||||
Net increase (decrease) in net assets resulting from operations | $ | (2,320 | ) | $ | (12,419 | ) | $ | (1,139 | ) | |||
|
|
|
|
|
| |||||||
(1) Amount is less than $500.
See Notes to Financial Statements
62
Table of Contents
VIRTUS OPPORTUNITIES TRUST
STATEMENTS OF OPERATIONS (Continued)
YEAR ENDED SEPTEMBER 30, 2015
($ reported in thousands)
|
|
|
| |||||
| Global Infrastructure Fund | Global Opportunities Fund | |||||||
| Investment Income | ||||||||
Dividends | $ | 6,642 | $ | 2,502 | ||||
Interest | — | 2 | ||||||
Security lending | — | 4 | ||||||
Foreign taxes withheld | (324 | ) | (72 | ) | ||||
|
|
|
| |||||
Total investment income | 6,318 | 2,436 | ||||||
|
|
|
| |||||
| Expenses | ||||||||
Investment advisory fees | 1,139 | 1,168 | ||||||
Service fees, Class A | 179 | 225 | ||||||
Distribution and service fees, Class B | — | 6 | ||||||
Distribution and service fees, Class C | 421 | 90 | ||||||
Administration fees | 211 | 165 | ||||||
Transfer agent fees and expenses | 219 | 176 | ||||||
Registration fees | 51 | 53 | ||||||
Printing fees and expenses | 22 | 18 | ||||||
Custodian fees | 17 | 16 | ||||||
Professional fees | 31 | 43 | ||||||
Trustees’ fees and expenses | 6 | 6 | ||||||
Miscellaneous expenses | 9 | 9 | ||||||
|
|
|
| |||||
Total expenses | 2,305 | 1,975 | ||||||
|
|
|
| |||||
Net investment income (loss) | 4,013 | 461 | ||||||
|
|
|
| |||||
| Net Realized and Unrealized Gain (Loss) on Investments | ||||||||
Net realized gain (loss) on investments | 8,520 | 611 | ||||||
Net realized gain (loss) on foreign currency transactions | (15 | ) | (24 | ) | ||||
Net change in unrealized appreciation (depreciation) on investments | (28,057 | ) | 1,196 | |||||
Net change in unrealized appreciation (depreciation) on foreign currency translation | (4 | ) | (13 | ) | ||||
Net change in foreign taxes on unrealized capital gains | — | 17 | ||||||
|
|
|
| |||||
| Net gain (loss) on investments | (19,556 | ) | 1,787 | |||||
|
|
|
| |||||
Net increase (decrease) in net assets resulting from operations | $ | (15,543 | ) | $ | 2,248 | |||
|
|
|
| |||||
(1) Amount is less than $500.
See Notes to Financial Statements
63
Table of Contents
VIRTUS OPPORTUNITIES TRUST
STATEMENTS OF OPERATIONS (Continued)
YEAR ENDED SEPTEMBER 30, 2015
($ reported in thousands)
|
|
|
|
|
| |||||||
| Global Real Estate Securities Fund | Greater European Opportunities Fund | International Equity Fund | ||||||||||
| Investment Income | ||||||||||||
Dividends | $ | 2,747 | $ | 526 | $ | 188 | ||||||
Security lending | — | — | 3 | |||||||||
Foreign taxes withheld | (106 | ) | (33 | ) | (21 | ) | ||||||
|
|
|
|
|
| |||||||
Total investment income | 2,641 | 493 | 170 | |||||||||
|
|
|
|
|
| |||||||
| Expenses | ||||||||||||
Investment advisory fees | 645 | 165 | 78 | |||||||||
Service fees, Class A | 81 | 33 | 7 | |||||||||
Distribution and service fees, Class C | 77 | 13 | 13 | |||||||||
Administration fees | 91 | 23 | 10 | |||||||||
Transfer agent fees and expenses | 112 | 41 | 12 | |||||||||
Registration fees | 40 | 41 | 41 | |||||||||
Printing fees and expenses | 11 | 4 | 2 | |||||||||
Custodian fees | 13 | 7 | 5 | |||||||||
Professional fees | 32 | 32 | 34 | |||||||||
Trustees’ fees and expenses | 3 | 1 | 1 | |||||||||
Miscellaneous expenses | 5 | 3 | 2 | |||||||||
|
|
|
|
|
| |||||||
Total expenses | 1,110 | 363 | 205 | |||||||||
Less expenses reimbursed and/or waived by investment adviser | (79 | ) | (84 | ) | (71 | ) | ||||||
|
|
|
|
|
| |||||||
Net expenses | 1,031 | 279 | 134 | �� | ||||||||
|
|
|
|
|
| |||||||
Net investment income (loss) | 1,610 | 214 | 36 | |||||||||
|
|
|
|
|
| |||||||
| Net Realized and Unrealized Gain (Loss) on Investments | ||||||||||||
Net realized gain (loss) on investments | 450 | (80 | ) | (878 | ) | |||||||
Net realized gain (loss) on foreign currency transactions | (1 | ) | (24 | ) | 87 | |||||||
Net change in unrealized appreciation (depreciation) on investments | 626 | 184 | (293 | ) | ||||||||
Net change in unrealized appreciation (depreciation) on foreign currency translation | — | (1) | — | (1) | — | (1) | ||||||
|
|
|
|
|
| |||||||
| Net gain (loss) on investments | 1,075 | 80 | (1,084 | ) | ||||||||
|
|
|
|
|
| |||||||
Net increase (decrease) in net assets resulting from operations | $ | 2,685 | $ | 294 | $ | (1,048 | ) | |||||
|
|
|
|
|
| |||||||
(1) Amount is less than $500.
See Notes to Financial Statements
64
Table of Contents
VIRTUS OPPORTUNITIES TRUST
STATEMENTS OF OPERATIONS (Continued)
YEAR ENDED SEPTEMBER 30, 2015
($ reported in thousands)
|
|
|
|
|
| |||||||
| International Real Estate Securities Fund | International Small-Cap Fund | International Wealth Masters Fund(2) | ||||||||||
| Investment Income | ||||||||||||
Dividends | $ | 2,505 | $ | 1,673 | $ | 120 | ||||||
Security lending | — | — | 1 | |||||||||
Foreign taxes withheld | (141 | ) | (164 | ) | (10 | ) | ||||||
|
|
|
|
|
| |||||||
Total investment income | 2,364 | 1,509 | 111 | |||||||||
|
|
|
|
|
| |||||||
| Expenses | ||||||||||||
Investment advisory fees | 422 | 495 | 40 | |||||||||
Service fees, Class A | 31 | 5 | — | (1) | ||||||||
Distribution and service fees, Class C | 23 | 12 | 1 | |||||||||
Administration fees | 50 | 59 | 6 | |||||||||
Transfer agent fees and expenses | 59 | 66 | 2 | |||||||||
Registration fees | 41 | 55 | 41 | |||||||||
Printing fees and expenses | 7 | 6 | 8 | |||||||||
Custodian fees | 10 | 16 | 20 | |||||||||
Professional fees | 30 | 31 | 39 | |||||||||
Trustees’ fees and expenses | 18 | 2 | — | (1) | ||||||||
Miscellaneous expenses | 4 | 4 | 3 | |||||||||
|
|
|
|
|
| |||||||
Total expenses | 695 | 751 | 160 | |||||||||
Less expenses reimbursed and/or waived by investment adviser | (114 | ) | (67 | ) | (101 | ) | ||||||
|
|
|
|
|
| |||||||
Net expenses | 581 | 684 | 59 | |||||||||
|
|
|
|
|
| |||||||
Net investment income (loss) | 1,783 | 825 | 52 | |||||||||
|
|
|
|
|
| |||||||
| Net Realized and Unrealized Gain (Loss) on Investments | ||||||||||||
Net realized gain (loss) on investments | (135 | ) | 1,486 | 75 | ||||||||
Net realized gain (loss) on foreign currency transactions | (5 | ) | (19 | ) | 11 | |||||||
Net change in unrealized appreciation (depreciation) on investments | (1,402 | ) | (9,604 | ) | (380 | ) | ||||||
Net change in unrealized appreciation (depreciation) on foreign currency translation | 1 | 1 | — | (1) | ||||||||
|
|
|
|
|
| |||||||
| Net gain (loss) on investments | (1,541 | ) | (8,136 | ) | (294 | ) | ||||||
|
|
|
|
|
| |||||||
Net increase (decrease) in net assets resulting from operations | $ | 242 | $ | (7,311 | ) | $ | (242 | ) | ||||
|
|
|
|
|
| |||||||
(1) Amount is less than $500.
(2) From Inception date November 17, 2014.
See Notes to Financial Statements
65
Table of Contents
VIRTUS OPPORTUNITIES TRUST
STATEMENTS OF CHANGES IN NET ASSETS
($ reported in thousands)
|
|
|
| |||||||||||||
| Emerging Markets Debt Fund | Emerging Markets Equity Income Fund | |||||||||||||||
| Year Ended September 30, 2015 | Year Ended September 30, 2014 | Year Ended September 30, 2015 | Year Ended September 30, 2014 | |||||||||||||
| INCREASE/(DECREASE) IN NET ASSETS | ||||||||||||||||
| From Operations | ||||||||||||||||
Net investment income (loss) | $ | 1,469 | $ | 1,522 | $ | 1,466 | $ | 1,712 | ||||||||
Net realized gain (loss) | (1,824 | ) | (425 | ) | (7,612 | ) | 183 | |||||||||
Net change in unrealized appreciation (depreciation) | (1,965 | ) | 1,072 | (6,273 | ) | 34 | ||||||||||
|
|
|
|
|
|
|
| |||||||||
Increase (decrease) in net assets resulting from operations | (2,320 | ) | 2,169 | (12,419 | ) | 1,929 | ||||||||||
|
|
|
|
|
|
|
| |||||||||
| From Distributions to Shareholders | ||||||||||||||||
Net investment income, Class A | (30 | ) | (104 | ) | (22 | ) | (20 | ) | ||||||||
Net investment income, Class C | (20 | ) | (19 | ) | (11 | ) | (6 | ) | ||||||||
Net investment income, Class I | (1,082 | ) | (1,338 | ) | (1,735 | ) | (586 | ) | ||||||||
Net realized short-term gains, Class A | — | — | (6 | ) | — | |||||||||||
Net realized short-term gains, Class C | — | — | (4 | ) | — | |||||||||||
Net realized short-term gains, Class I | — | — | (397 | ) | — | |||||||||||
Tax return of capital, Class A | (7 | ) | (3 | ) | — | — | ||||||||||
Tax return of capital, Class C | (6 | ) | — | (1) | — | — | ||||||||||
Tax return of capital, Class I | (226 | ) | (44 | ) | — | — | ||||||||||
|
|
|
|
|
|
|
| |||||||||
Decrease in net assets from distributions to shareholders | (1,371 | ) | (1,508 | ) | (2,175 | ) | (612 | ) | ||||||||
|
|
|
|
|
|
|
| |||||||||
| From Share Transactions (See Note 6) | ||||||||||||||||
Change in net assets from share transactions, Class A | (159 | ) | (2,299 | ) | (271 | ) | 390 | |||||||||
Change in net assets from share transactions, Class C | (137 | ) | 410 | 10 | 373 | |||||||||||
Change in net assets from share transactions, Class I | (2,659 | ) | 6,190 | (24,438 | ) | 70,772 | ||||||||||
|
|
|
|
|
|
|
| |||||||||
Increase (decrease) in net assets from share transactions | (2,955 | ) | 4,301 | (24,699 | ) | 71,535 | ||||||||||
|
|
|
|
|
|
|
| |||||||||
Net increase (decrease) in net assets | (6,646 | ) | 4,962 | (39,293 | ) | 72,852 | ||||||||||
| Net Assets | ||||||||||||||||
Beginning of period | 33,222 | 28,260 | 82,754 | 9,902 | ||||||||||||
|
|
|
|
|
|
|
| |||||||||
End of period | $ | 26,576 | $ | 33,222 | $ | 43,461 | $ | 82,754 | ||||||||
|
|
|
|
|
|
|
| |||||||||
Accumulated undistributed net investment income (loss) at end of period | $ | (19 | ) | $ | (4 | ) | $ | 860 | $ | 1,246 | ||||||
(1) Amount is less than $500.
See Notes to Financial Statements
66
Table of Contents
VIRTUS OPPORTUNITIES TRUST
STATEMENTS OF CHANGES IN NET ASSETS (Continued)
($ reported in thousands)
|
| |||||||
| Emerging Markets Small-Cap Fund | ||||||||
| Year Ended September 30, 2015 | From Inception December 17, 2013 to September 30, 2014 | |||||||
| INCREASE/(DECREASE) IN NET ASSETS | ||||||||
| From Operations | ||||||||
Net investment income (loss) | $ | 82 | $ | 64 | ||||
Net realized gain (loss) | (47 | ) | 98 | |||||
Net change in unrealized appreciation (depreciation) | (1,174 | ) | (63 | ) | ||||
|
|
|
| |||||
Increase (decrease) in net assets resulting from operations | (1,139 | ) | 99 | |||||
|
|
|
| |||||
| From Distributions to Shareholders | ||||||||
Net investment income, Class A | (3 | ) | — | (1) | ||||
Net investment income, Class C | (1 | ) | — | (1) | ||||
Net investment income, Class I | (60 | ) | (7 | ) | ||||
Net realized short-term gains, Class A | (5 | ) | — | |||||
Net realized short-term gains, Class C | (3 | ) | — | |||||
Net realized short-term gains, Class I | (102 | ) | — | |||||
|
|
|
| |||||
Decrease in net assets from distributions to shareholders | (174 | ) | (7 | ) | ||||
|
|
|
| |||||
| From Share Transactions (See Note 6) | ||||||||
Change in net assets from share transactions, Class A | 210 | 215 | ||||||
Change in net assets from share transactions, Class C | 8 | 155 | ||||||
Change in net assets from share transactions, Class I | 1,570 | 3,394 | ||||||
|
|
|
| |||||
Increase (decrease) in net assets from share transactions | 1,788 | 3,764 | ||||||
|
|
|
| |||||
Net increase (decrease) in net assets | 475 | 3,856 | ||||||
| Net Assets | ||||||||
Beginning of period | 3,856 | — | ||||||
|
|
|
| |||||
End of period | $ | 4,331 | $ | 3,856 | ||||
|
|
|
| |||||
Accumulated undistributed net investment income (loss) at end of period | $ | 77 | $ | 61 | ||||
(1) Amount is less than $500.
See Notes to Financial Statements
67
Table of Contents
VIRTUS OPPORTUNITIES TRUST
STATEMENTS OF CHANGES IN NET ASSETS (Continued)
($ reported in thousands)
|
|
|
| |||||||||||||
| Global Infrastructure Fund | Global Opportunities Fund | |||||||||||||||
| Year Ended September 30, 2015 | Year Ended September 30, 2014 | Year Ended September 30, 2015 | Year Ended September 30, 2014 | |||||||||||||
| INCREASE/(DECREASE) IN NET ASSETS | ||||||||||||||||
| From Operations | ||||||||||||||||
Net investment income (loss) | $ | 4,013 | $ | 6,643 | $ | 461 | $ | 882 | ||||||||
Net realized gain (loss) | 8,505 | 11,967 | 587 | 5,221 | ||||||||||||
Net change in unrealized appreciation (depreciation) | (28,061 | ) | 1,563 | 1,200 | 5,240 | |||||||||||
|
|
|
|
|
|
|
| |||||||||
Increase (decrease) in net assets resulting from operations | (15,543 | ) | 20,173 | 2,248 | 11,343 | |||||||||||
|
|
|
|
|
|
|
| |||||||||
| From Distributions to Shareholders | ||||||||||||||||
Net investment income, Class A | (1,851 | ) | (2,550 | ) | (458 | ) | (512 | ) | ||||||||
Net investment income, Class B | — | — | (1 | ) | — | (1) | ||||||||||
Net investment income, Class C | (809 | ) | (820 | ) | (9 | ) | (3 | ) | ||||||||
Net investment income, Class I | (1,738 | ) | (2,785 | ) | (230 | ) | (313 | ) | ||||||||
Net realized long-term gains, Class A | (600 | ) | — | — | — | |||||||||||
Net realized long-term gains, Class C | (301 | ) | — | — | — | |||||||||||
Net realized long-term gains, Class I | (524 | ) | — | — | — | |||||||||||
|
|
|
|
|
|
|
| |||||||||
Decrease in net assets from distributions to shareholders | (5,823 | ) | (6,155 | ) | (698 | ) | (828 | ) | ||||||||
|
|
|
|
|
|
|
| |||||||||
| From Share Transactions (See Note 6) | ||||||||||||||||
Change in net assets from share transactions, Class A | 8,660 | 1,908 | 8,610 | (8,082 | ) | |||||||||||
Change in net assets from share transactions, Class B | — | — | (191 | ) | (213 | ) | ||||||||||
Change in net assets from share transactions, Class C | 20,385 | 6,599 | 11,375 | 213 | ||||||||||||
Change in net assets from share transactions, Class I | 2,074 | (21,781 | ) | 3,672 | 1,594 | |||||||||||
|
|
|
|
|
|
|
| |||||||||
Increase (decrease) in net assets from share transactions | 31,119 | (13,274 | ) | 23,466 | (6,488 | ) | ||||||||||
|
|
|
|
|
|
|
| |||||||||
Net increase (decrease) in net assets | 9,753 | 744 | 25,016 | 4,027 | ||||||||||||
| Net Assets | ||||||||||||||||
Beginning of period | 142,552 | 141,808 | 115,762 | 111,735 | ||||||||||||
|
|
|
|
|
|
|
| |||||||||
End of period | $ | 152,305 | $ | 142,552 | $ | 140,778 | $ | 115,762 | ||||||||
|
|
|
|
|
|
|
| |||||||||
Accumulated undistributed net investment income (loss) at end of period | $ | 152 | $ | 552 | $ | 398 | $ | 674 | ||||||||
(1) Amount is less than $500.
See Notes to Financial Statements
68
Table of Contents
VIRTUS OPPORTUNITIES TRUST
STATEMENTS OF CHANGES IN NET ASSETS (Continued)
($ reported in thousands)
|
|
|
| |||||||||||||
| Global Real Estate Securities Fund | Greater European Opportunities Fund | |||||||||||||||
| Year Ended September 30, 2015 | Year Ended September 30, 2014 | Year Ended September 30, 2015 | Year Ended September 30, 2014 | |||||||||||||
| INCREASE/(DECREASE) IN NET ASSETS | ||||||||||||||||
| From Operations | ||||||||||||||||
Net investment income (loss) | $ | 1,610 | $ | 720 | $ | 214 | $ | 95 | ||||||||
Net realized gain (loss) | 449 | 855 | (104 | ) | 140 | |||||||||||
Net change in unrealized appreciation (depreciation) | 626 | 2,778 | 184 | (600 | ) | |||||||||||
|
|
|
|
|
|
|
| |||||||||
Increase (decrease) in net assets resulting from operations | 2,685 | 4,353 | 294 | (365 | ) | |||||||||||
|
|
|
|
|
|
|
| |||||||||
| From Distributions to Shareholders | ||||||||||||||||
Net investment income, Class A | (613 | ) | (230 | ) | (82 | ) | (52 | ) | ||||||||
Net investment income, Class C | (119 | ) | (29 | ) | — | (1) | (2 | ) | ||||||||
Net investment income, Class I | (821 | ) | (440 | ) | (24 | ) | (12 | ) | ||||||||
Net realized short-term gains, Class A | (21 | ) | (21 | ) | — | (197 | ) | |||||||||
Net realized short-term gains, Class C | (5 | ) | (5 | ) | — | (15 | ) | |||||||||
Net realized short-term gains, Class I | (26 | ) | (34 | ) | — | (30 | ) | |||||||||
Net realized long-term gains, Class A | (66 | ) | (86 | ) | (153 | ) | (125 | ) | ||||||||
Net realized long-term gains, Class C | (17 | ) | (20 | ) | (13 | ) | (9 | ) | ||||||||
Net realized long-term gains, Class I | (81 | ) | (143 | ) | (31 | ) | (19 | ) | ||||||||
|
|
|
|
|
|
|
| |||||||||
Decrease in net assets from distributions to shareholders | (1,769 | ) | (1,008 | ) | (303 | ) | (461 | ) | ||||||||
|
|
|
|
|
|
|
| |||||||||
| From Share Transactions (See Note 6) | ||||||||||||||||
Change in net assets from share transactions, Class A | 14,600 | 4,968 | 732 | (83 | ) | |||||||||||
Change in net assets from share transactions, Class C | 2,509 | 2,073 | 472 | 576 | ||||||||||||
Change in net assets from share transactions, Class I | 5,033 | (232 | ) | 2,842 | 959 | |||||||||||
|
|
|
|
|
|
|
| |||||||||
Increase (decrease) in net assets from share transactions | 22,142 | 6,809 | 4,046 | 1,452 | ||||||||||||
|
|
|
|
|
|
|
| |||||||||
Net increase (decrease) in net assets | 23,058 | 10,154 | 4,037 | 626 | ||||||||||||
| Net Assets | ||||||||||||||||
Beginning of period | 54,337 | 44,183 | 16,584 | 15,958 | ||||||||||||
|
|
|
|
|
|
|
| |||||||||
End of period | $ | 77,395 | $ | 54,337 | $ | 20,621 | $ | 16,584 | ||||||||
|
|
|
|
|
|
|
| |||||||||
Accumulated undistributed net investment income (loss) at end of period | $ | 298 | $ | 259 | $ | 126 | $ | 41 | ||||||||
(1) Amount is less than $500.
See Notes to Financial Statements
69
Table of Contents
VIRTUS OPPORTUNITIES TRUST
STATEMENTS OF CHANGES IN NET ASSETS (Continued)
($ reported in thousands)
|
|
|
| |||||||||||||
| International Equity Fund | International Real Estate Securities Fund | |||||||||||||||
| Year Ended September 30, 2015 | Year Ended September 30, 2014 | Year Ended September 30, 2015 | Year Ended September 30, 2014 | |||||||||||||
| INCREASE/(DECREASE) IN NET ASSETS | ||||||||||||||||
| From Operations | ||||||||||||||||
Net investment income (loss) | $ | 36 | $ | 94 | $ | 1,783 | $ | 1,103 | ||||||||
Net realized gain (loss) | (791 | ) | (130 | ) | (140 | ) | 2,034 | |||||||||
Net change in unrealized appreciation (depreciation) | (293 | ) | 247 | (1,401 | ) | 320 | ||||||||||
|
|
|
|
|
|
|
| |||||||||
Increase (decrease) in net assets resulting from operations | (1,048 | ) | 211 | 242 | 3,457 | |||||||||||
|
|
|
|
|
|
|
| |||||||||
| From Distributions to Shareholders | ||||||||||||||||
Net investment income, Class A | (30 | ) | (61 | ) | (778 | ) | (188 | ) | ||||||||
Net investment income, Class C | (1 | ) | (7 | ) | (117 | ) | (27 | ) | ||||||||
Net investment income, Class I | (54 | ) | (69 | ) | (1,837 | ) | (696 | ) | ||||||||
Net realized short-term gains, Class A | — | (34 | ) | — | — | |||||||||||
Net realized short-term gains, Class C | — | (2 | ) | — | — | |||||||||||
Net realized short-term gains, Class I | — | (29 | ) | — | — | |||||||||||
|
|
|
|
|
|
|
| |||||||||
Decrease in net assets from distributions to shareholders | (85 | ) | (202 | ) | (2,732 | ) | (911 | ) | ||||||||
|
|
|
|
|
|
|
| |||||||||
| From Share Transactions (See Note 6) | ||||||||||||||||
Change in net assets from share transactions, Class A | (1,652 | ) | 3,770 | 1,872 | 427 | |||||||||||
Change in net assets from share transactions, Class C | 1,096 | 686 | (182 | ) | 525 | |||||||||||
Change in net assets from share transactions, Class I | (1,529 | ) | 4,210 | (2,108 | ) | (3,094 | ) | |||||||||
|
|
|
|
|
|
|
| |||||||||
Increase (decrease) in net assets from share transactions | (2,085 | ) | 8,666 | (418 | ) | (2,142 | ) | |||||||||
|
|
|
|
|
|
|
| |||||||||
Net increase (decrease) in net assets | (3,218 | ) | 8,675 | (2,908 | ) | 404 | ||||||||||
| Net Assets | ||||||||||||||||
Beginning of period | 11,154 | 2,479 | 42,548 | 42,144 | ||||||||||||
|
|
|
|
|
|
|
| |||||||||
End of period | $ | 7,936 | $ | 11,154 | $ | 39,640 | $ | 42,548 | ||||||||
|
|
|
|
|
|
|
| |||||||||
Accumulated undistributed net investment income (loss) at end of period | $ | (10 | ) | $ | 54 | $ | (1,123 | ) | $ | (140 | ) | |||||
See Notes to Financial Statements
70
Table of Contents
VIRTUS OPPORTUNITIES TRUST
STATEMENTS OF CHANGES IN NET ASSETS (Continued)
($ reported in thousands)
|
|
|
| |||||||||
| International Small-Cap Fund | International Wealth Masters Fund | |||||||||||
| Year Ended September 30, 2015 | Year Ended September 30, 2014 | From inception November 17, 2014 to September 30, 2015 | ||||||||||
| INCREASE/(DECREASE) IN NET ASSETS | ||||||||||||
| From Operations | ||||||||||||
Net investment income (loss) | $ | 825 | $ | 1,120 | $ | 52 | ||||||
Net realized gain (loss) | 1,467 | 2,642 | 86 | |||||||||
Net change in unrealized appreciation (depreciation) | (9,603 | ) | (1,455 | ) | (380 | ) | ||||||
|
|
|
|
|
| |||||||
Increase (decrease) in net assets resulting from operations | (7,311 | ) | 2,307 | (242 | ) | |||||||
|
|
|
|
|
| |||||||
| From Distributions to Shareholders | ||||||||||||
Net investment income, Class A | (31 | ) | (45 | ) | — | |||||||
Net investment income, Class C | (18 | ) | (14 | ) | — | |||||||
Net investment income, Class I | (770 | ) | (815 | ) | — | |||||||
Net investment income, Class R6 | (2 | ) | — | — | ||||||||
Net realized short-term gains, Class A | (84 | ) | (8 | ) | — | |||||||
Net realized short-term gains, Class C | (53 | ) | (9 | ) | — | |||||||
Net realized short-term gains, Class I | (1,927 | ) | (316 | ) | — | |||||||
Net realized short-term gains, Class R6 | (4 | ) | — | | — | | ||||||
Net realized long-term gains, Class A | (46 | ) | — | — | ||||||||
Net realized long-term gains, Class C | (29 | ) | — | — | ||||||||
Net realized long-term gains, Class I | (1,050 | ) | — | — | ||||||||
Net realized long-term gains, Class R6 | (2 | ) | — | | — | | ||||||
|
|
|
|
|
| |||||||
Decrease in net assets from distributions to shareholders | (4,016 | ) | (1,207 | ) | — | |||||||
|
|
|
|
|
| |||||||
| From Share Transactions (See Note 6) | ||||||||||||
Change in net assets from share transactions, Class A | (107 | ) | 2,059 | 135 | ||||||||
Change in net assets from share transactions, Class C | 612 | 802 | 124 | |||||||||
Change in net assets from share transactions, Class I | 4,425 | 27,409 | 4,825 | |||||||||
Change in net assets from share transactions, Class R6 | 109 | — | — | |||||||||
|
|
|
|
|
| |||||||
Increase (decrease) in net assets from share transactions | 5,039 | 30,270 | 5,084 | |||||||||
|
|
|
|
|
| |||||||
Net increase (decrease) in net assets | (6,288 | ) | 31,370 | 4,842 | ||||||||
| Net Assets | ||||||||||||
Beginning of period | 50,270 | 18,900 | — | |||||||||
|
|
|
|
|
| |||||||
End of period | $ | 43,982 | $ | 50,270 | $ | 4,842 | ||||||
|
|
|
|
|
| |||||||
Accumulated undistributed net investment income (loss) at end of period | $ | 516 | $ | 526 | $ | 64 | ||||||
See Notes to Financial Statements
71
Table of Contents
VIRTUS OPPORTUNITIES TRUST
SELECTED PER SHARE DATA AND RATIOS FOR A SHARE OUTSTANDING
THROUGHOUT EACH PERIOD
| Net Asset Value, Beginning of Period | Net Investment Income (Loss)(2) | Net Realized and Unrealized Gain (Loss) | Total from Investment Operations | Dividends from Net Investment Income | Distributions from Net Realized Gains | Tax Return of Capital | Total Distributions | Change in Net Asset Value | Net Asset Value, End of Period | Total Return(1) | Net Assets, End of Period (in thousands) | Ratio of Net Expenses to Average Net Assets(7) | Ratio of Gross Expenses to Average Net Assets (before waivers and reimbursements)(7) | Ratio of Net Investment Income (Loss) to Average Net Assets | Portfolio Turnover Rate | ||||||||||||||||||||||||||||||||||||||||||||||||||||||||||||||||||
| Emerging Markets | ||||||||||||||||||||||||||||||||||||||||||||||||||||||||||||||||||||||||||||||||||
Debt Fund | ||||||||||||||||||||||||||||||||||||||||||||||||||||||||||||||||||||||||||||||||||
Class A | ||||||||||||||||||||||||||||||||||||||||||||||||||||||||||||||||||||||||||||||||||
10/1/14 to 9/30/15 | $ | 9.69 | 0.44 | (1.18 | ) | (0.74 | ) | (0.33 | ) | — | (0.08 | ) | (0.41 | ) | (1.15 | ) | $ | 8.54 | (7.85 | )% | $ | 718 | 1.35 | % | 1.48 | % | 4.80 | % | 47 | % | ||||||||||||||||||||||||||||||||||||||||||||||||||||
10/1/13 to 9/30/14 | 9.43 | 0.47 | 0.26 | 0.73 | (0.46 | ) | — | (0.01 | ) | (0.47 | ) | 0.26 | 9.69 | 7.83 | 982 | 1.35 | 1.52 | 4.88 | 39 | |||||||||||||||||||||||||||||||||||||||||||||||||||||||||||||||
10/1/12 to 9/30/13 | 10.09 | 0.48 | (0.64 | ) | (0.16 | ) | (0.48 | ) | (0.02 | ) | — | (0.50 | ) | (0.66 | ) | 9.43 | (1.94 | ) | 3,200 | 1.35 | 1.55 | 4.92 | 60 | |||||||||||||||||||||||||||||||||||||||||||||||||||||||||||
9/5/12(6) to 9/30/12 | 10.00 | 0.02 | 0.07 | 0.09 | — | — | — | — | 0.09 | 10.09 | 0.90 | (4) | 101 | 1.35 | (3) | 3.49 | (3) | 3.35 | (3) | 13 | (4) | |||||||||||||||||||||||||||||||||||||||||||||||||||||||||||||
Class C | ||||||||||||||||||||||||||||||||||||||||||||||||||||||||||||||||||||||||||||||||||
10/1/14 to 9/30/15 | $ | 9.68 | 0.37 | (1.17 | ) | (0.80 | ) | (0.26 | ) | — | (0.08 | ) | (0.34 | ) | (1.14 | ) | $ | 8.54 | (8.44 | )% | $ | 565 | 2.10 | % | 2.23 | % | 4.06 | % | 47 | % | ||||||||||||||||||||||||||||||||||||||||||||||||||||
10/1/13 to 9/30/14 | 9.42 | 0.40 | 0.25 | 0.65 | (0.38 | ) | — | (0.01 | ) | (0.39 | ) | 0.26 | 9.68 | 7.03 | 788 | 2.10 | 2.21 | 4.08 | 39 | |||||||||||||||||||||||||||||||||||||||||||||||||||||||||||||||
10/1/12 to 9/30/13 | 10.09 | 0.41 | (0.66 | ) | (0.25 | ) | (0.40 | ) | (0.02 | ) | — | (0.42 | ) | (0.67 | ) | 9.42 | (2.68 | ) | 374 | 2.10 | 2.32 | 4.11 | 60 | |||||||||||||||||||||||||||||||||||||||||||||||||||||||||||
9/5/12(6) to 9/30/12 | 10.00 | 0.02 | 0.07 | 0.09 | — | — | — | — | 0.09 | 10.09 | 0.90 | (4) | 110 | 2.10 | (3) | 4.26 | (3) | 2.63 | (3) | 13 | (4) | |||||||||||||||||||||||||||||||||||||||||||||||||||||||||||||
Class I | ||||||||||||||||||||||||||||||||||||||||||||||||||||||||||||||||||||||||||||||||||
10/1/14 to 9/30/15 | $ | 9.68 | 0.46 | (1.17 | ) | (0.71 | ) | (0.35 | ) | — | (0.08 | ) | (0.43 | ) | (1.14 | ) | $ | 8.54 | (7.52 | )% | $ | 25,293 | 1.10 | % | 1.23 | % | 5.05 | % | 47 | % | ||||||||||||||||||||||||||||||||||||||||||||||||||||
10/1/13 to 9/30/14 | 9.42 | 0.49 | 0.26 | 0.75 | (0.48 | ) | — | (0.01 | ) | (0.49 | ) | 0.26 | 9.68 | 8.11 | 31,452 | 1.10 | 1.23 | 5.09 | 39 | |||||||||||||||||||||||||||||||||||||||||||||||||||||||||||||||
10/1/12 to 9/30/13 | 10.10 | 0.50 | (0.66 | ) | (0.16 | ) | (0.50 | ) | (0.02 | ) | — | (0.52 | ) | (0.68 | ) | 9.42 | (1.80 | ) | 24,686 | 1.10 | 1.33 | 4.99 | 60 | |||||||||||||||||||||||||||||||||||||||||||||||||||||||||||
9/5/12(6) to 9/30/12 | 10.00 | 0.02 | 0.08 | 0.10 | — | — | — | — | 0.10 | 10.10 | 1.00 | (4) | 25,036 | 1.10 | (3) | 3.24 | (3) | 3.61 | (3) | 13 | (4) | |||||||||||||||||||||||||||||||||||||||||||||||||||||||||||||
| Emerging Markets | ||||||||||||||||||||||||||||||||||||||||||||||||||||||||||||||||||||||||||||||||||
Equity Income Fund | ||||||||||||||||||||||||||||||||||||||||||||||||||||||||||||||||||||||||||||||||||
Class A | ||||||||||||||||||||||||||||||||||||||||||||||||||||||||||||||||||||||||||||||||||
10/1/14 to 9/30/15 | $ | 10.54 | 0.20 | (2.18 | ) | (1.98 | ) | (0.21 | ) | (0.05 | ) | — | (0.26 | ) | (2.24 | ) | $ | 8.30 | (19.13 | )% | $ | 727 | 1.75 | % | 1.76 | % | 2.04 | % | 72 | % | ||||||||||||||||||||||||||||||||||||||||||||||||||||
10/1/13 to 9/30/14 | 10.57 | 0.21 | (0.05 | ) | 0.16 | (0.19 | ) | — | — | (0.19 | ) | (0.03 | ) | 10.54 | 1.54 | 1,210 | 1.75 | 1.95 | 1.96 | 72 | ||||||||||||||||||||||||||||||||||||||||||||||||||||||||||||||
10/1/12 to 9/30/13 | 10.59 | 0.31 | (0.07 | ) | 0.24 | (0.07 | ) | (0.19 | ) | — | (0.26 | ) | (0.02 | ) | 10.57 | 2.19 | 830 | 1.75 | 2.90 | 3.00 | 100 | |||||||||||||||||||||||||||||||||||||||||||||||||||||||||||||
9/5/12(6) to 9/30/12 | 10.00 | (0.01 | ) | 0.60 | 0.59 | — | — | — | — | 0.59 | 10.59 | 5.90 | (4) | 106 | 1.75 | (3) | 10.28 | (3) | (0.78 | )(3) | 37 | (4) | ||||||||||||||||||||||||||||||||||||||||||||||||||||||||||||
Class C | ||||||||||||||||||||||||||||||||||||||||||||||||||||||||||||||||||||||||||||||||||
10/1/14 to 9/30/15 | $ | 10.50 | 0.14 | (2.19 | ) | (2.05 | ) | (0.14 | ) | (0.05 | ) | — | (0.19 | ) | (2.24 | ) | $ | 8.26 | (19.78 | )% | $ | 638 | 2.50 | % | 2.52 | % | 1.42 | % | 72 | % | ||||||||||||||||||||||||||||||||||||||||||||||||||||
10/1/13 to 9/30/14 | 10.54 | 0.15 | (0.07 | ) | 0.08 | (0.12 | ) | — | — | (0.12 | ) | (0.04 | ) | 10.50 | 0.80 | 799 | 2.50 | 2.65 | 1.39 | 72 | ||||||||||||||||||||||||||||||||||||||||||||||||||||||||||||||
10/1/12 to 9/30/13 | 10.58 | 0.20 | (0.03 | ) | 0.17 | (0.02 | ) | (0.19 | ) | — | (0.21 | ) | (0.04 | ) | 10.54 | 1.48 | 417 | 2.50 | 3.77 | 1.89 | 100 | |||||||||||||||||||||||||||||||||||||||||||||||||||||||||||||
9/5/12(6) to 9/30/12 | 10.00 | (0.01 | ) | 0.59 | 0.58 | — | — | — | — | 0.58 | 10.58 | 5.80 | (4) | 106 | 2.50 | (3) | 11.03 | (3) | (1.54 | )(3) | 37 | (4) | ||||||||||||||||||||||||||||||||||||||||||||||||||||||||||||
Class I | ||||||||||||||||||||||||||||||||||||||||||||||||||||||||||||||||||||||||||||||||||
10/1/14 to 9/30/15 | $ | 10.56 | 0.21 | (2.17 | ) | (1.96 | ) | (0.24 | ) | (0.05 | ) | — | (0.29 | ) | (2.25 | ) | $ | 8.31 | (18.95 | )% | $ | 42,096 | 1.50 | % | 1.51 | % | 2.14 | % | 72 | % | ||||||||||||||||||||||||||||||||||||||||||||||||||||
10/1/13 to 9/30/14 | 10.58 | 0.27 | (0.08 | ) | 0.19 | (0.21 | ) | — | — | (0.21 | ) | (0.02 | ) | 10.56 | 1.87 | 80,745 | 1.50 | 1.51 | 2.60 | 72 | ||||||||||||||||||||||||||||||||||||||||||||||||||||||||||||||
10/1/12 to 9/30/13 | 10.59 | 0.27 | (0.01 | ) | 0.26 | (0.08 | ) | (0.19 | ) | — | (0.27 | ) | (0.01 | ) | 10.58 | 2.39 | 8,655 | 1.50 | 2.87 | 2.56 | 100 | |||||||||||||||||||||||||||||||||||||||||||||||||||||||||||||
9/5/12(6) to 9/30/12 | 10.00 | — | (5) | 0.59 | 0.59 | — | — | — | — | 0.59 | 10.59 | 5.90 | (4) | 5,082 | 1.50 | (3) | 10.03 | (3) | (0.54 | )(3) | 37 | (4) | ||||||||||||||||||||||||||||||||||||||||||||||||||||||||||||
| Emerging Markets | ||||||||||||||||||||||||||||||||||||||||||||||||||||||||||||||||||||||||||||||||||
Small-Cap Fund | ||||||||||||||||||||||||||||||||||||||||||||||||||||||||||||||||||||||||||||||||||
Class A | ||||||||||||||||||||||||||||||||||||||||||||||||||||||||||||||||||||||||||||||||||
10/1/14 to 9/30/15 | $ | 10.32 | 0.16 | (2.28 | ) | (2.12 | ) | (0.12 | ) | (0.23 | ) | — | (0.35 | ) | (2.47 | ) | $ | 7.85 | (21.20 | )% | $ | 332 | 1.85 | % | 3.62 | % | 1.73 | % | 35 | % | ||||||||||||||||||||||||||||||||||||||||||||||||||||
12/17/13(6) to 9/30/14 | 10.00 | 0.18 | 0.16 | 0.34 | (0.02 | ) | — | — | (0.02 | ) | 0.32 | 10.32 | 3.45 | (4) | 217 | 1.85 | (3) | 4.82 | (3) | 2.25 | (3) | 44 | (4) | |||||||||||||||||||||||||||||||||||||||||||||||||||||||||||
Class C | ||||||||||||||||||||||||||||||||||||||||||||||||||||||||||||||||||||||||||||||||||
10/1/14 to 9/30/15 | $ | 10.26 | 0.07 | (2.24 | ) | (2.17 | ) | (0.06 | ) | (0.23 | ) | — | (0.29 | ) | (2.46 | ) | $ | 7.80 | (21.68 | )% | $ | 128 | 2.60 | % | 4.34 | % | 0.76 | % | 35 | % | ||||||||||||||||||||||||||||||||||||||||||||||||||||
12/17/13(6) to 9/30/14 | 10.00 | 0.12 | 0.16 | 0.28 | (0.02 | ) | — | — | (0.02 | ) | 0.26 | 10.26 | 2.82 | (4) | 159 | 2.60 | (3) | 5.59 | (3) | 1.54 | (3) | 44 | (4) | |||||||||||||||||||||||||||||||||||||||||||||||||||||||||||
Class I | ||||||||||||||||||||||||||||||||||||||||||||||||||||||||||||||||||||||||||||||||||
10/1/14 to 9/30/15 | $ | 10.34 | 0.18 | (2.28 | ) | (2.10 | ) | (0.13 | ) | (0.23 | ) | — | (0.36 | ) | (2.46 | ) | $ | 7.88 | (20.96 | )% | $ | 3,871 | 1.60 | % | 3.35 | % | 1.87 | % | 35 | % | ||||||||||||||||||||||||||||||||||||||||||||||||||||
12/17/13(6) to 9/30/14 | 10.00 | 0.20 | 0.17 | 0.37 | (0.03 | ) | — | — | (0.03 | ) | 0.34 | 10.34 | 3.66 | (4) | 3,480 | 1.60 | (3) | 4.64 | (3) | 2.50 | (3) | 44 | (4) | |||||||||||||||||||||||||||||||||||||||||||||||||||||||||||
The footnote legend is at the end of the financial highlights.
See Notes to Financial Statements
72
Table of Contents
VIRTUS OPPORTUNITIES TRUST
FINANCIAL HIGHLIGHTS
SELECTED PER SHARE DATA AND RATIOS FOR A SHARE OUTSTANDING
THROUGHOUT EACH PERIOD
| Net Asset Value, Beginning of Period | Net Investment Income (Loss)(2) | Net Realized and Unrealized Gain (Loss) | Total from Investment Operations | Dividends from Net Investment Income | Distributions from Net Realized Gains | Total Distributions | Change in Net Asset Value | Net Asset Value, End of Period | Total Return(1) | Net Assets, End of Period (in thousands) | Ratio of Net Expenses to Average Net Assets(7) | Ratio of Gross Expenses to Average Net Assets (before waivers and reimbursements)(7) | Ratio of Net Investment Income (Loss) to Average Net Assets | Portfolio Turnover Rate | ||||||||||||||||||||||||||||||||||||||||||||||||||||||||||||||
| Global Infrastructure | |||||||||||||||||||||||||||||||||||||||||||||||||||||||||||||||||||||||||||||
Fund | |||||||||||||||||||||||||||||||||||||||||||||||||||||||||||||||||||||||||||||
Class A | |||||||||||||||||||||||||||||||||||||||||||||||||||||||||||||||||||||||||||||
10/1/14 to 9/30/15 | $ | 15.38 | 0.36 | (1.60 | ) | (1.24 | ) | (0.39 | ) | (0.13 | ) | (0.52 | ) | (1.76 | ) | $ | 13.62 | (8.27 | )% | $ | 60,744 | 1.22 | % | 1.22 | % | 2.38 | % | 27 | % | ||||||||||||||||||||||||||||||||||||||||||||||||
10/1/13 to 9/30/14 | 13.94 | 0.71 | 1.40 | 2.11 | (0.67 | ) | — | (0.67 | ) | 1.44 | 15.38 | 15.21 | 60,673 | 1.29 | 1.29 | 4.69 | 24 | ||||||||||||||||||||||||||||||||||||||||||||||||||||||||||||
10/1/12 to 9/30/13 | 12.88 | 0.35 | 1.05 | 1.40 | (0.34 | ) | — | (0.34 | ) | 1.06 | 13.94 | 11.05 | 53,354 | 1.28 | 1.28 | 2.62 | 14 | ||||||||||||||||||||||||||||||||||||||||||||||||||||||||||||
10/1/11 to 9/30/12 | 10.97 | 0.31 | 1.95 | 2.26 | (0.35 | ) | — | (0.35 | ) | 1.91 | 12.88 | 20.80 | 36,347 | 1.32 | 1.32 | 2.59 | 21 | ||||||||||||||||||||||||||||||||||||||||||||||||||||||||||||
10/1/10 to 9/30/11 | 10.71 | 0.33 | 0.25 | 0.58 | (0.32 | ) | — | (0.32 | ) | 0.26 | 10.97 | 5.40 | 23,120 | 1.34 | 1.34 | 2.89 | 16 | ||||||||||||||||||||||||||||||||||||||||||||||||||||||||||||
Class C | |||||||||||||||||||||||||||||||||||||||||||||||||||||||||||||||||||||||||||||
10/1/14 to 9/30/15 | $ | 15.33 | 0.25 | (1.59 | ) | (1.34 | ) | (0.29 | ) | (0.13 | ) | (0.42 | ) | (1.76 | ) | $ | 13.57 | (8.94 | )% | $ | 41,039 | 1.97 | % | 1.97 | % | 1.66 | % | 27 | % | ||||||||||||||||||||||||||||||||||||||||||||||||
10/1/13 to 9/30/14 | 13.90 | 0.58 | 1.41 | 1.99 | (0.56 | ) | — | (0.56 | ) | 1.43 | 15.33 | 14.37 | 26,322 | 2.04 | 2.04 | 3.82 | 24 | ||||||||||||||||||||||||||||||||||||||||||||||||||||||||||||
10/1/12 to 9/30/13 | 12.85 | 0.25 | 1.05 | 1.30 | (0.25 | ) | — | (0.25 | ) | 1.05 | 13.90 | 10.23 | 17,969 | 2.03 | 2.03 | 1.85 | 14 | ||||||||||||||||||||||||||||||||||||||||||||||||||||||||||||
10/1/11 to 9/30/12 | 10.95 | 0.23 | 1.93 | 2.16 | (0.26 | ) | — | (0.26 | ) | 1.90 | 12.85 | 19.97 | 9,117 | 2.07 | 2.07 | 1.88 | 21 | ||||||||||||||||||||||||||||||||||||||||||||||||||||||||||||
10/1/10 to 9/30/11 | 10.69 | 0.24 | 0.26 | 0.50 | (0.24 | ) | — | (0.24 | ) | 0.26 | 10.95 | 4.51 | 6,138 | 2.09 | 2.09 | 2.11 | 16 | ||||||||||||||||||||||||||||||||||||||||||||||||||||||||||||
Class I | |||||||||||||||||||||||||||||||||||||||||||||||||||||||||||||||||||||||||||||
10/1/14 to 9/30/15 | $ | 15.38 | 0.39 | (1.58 | ) | (1.19 | ) | (0.43 | ) | (0.13 | ) | (0.56 | ) | (1.75 | ) | $ | 13.63 | (7.98 | )% | $ | 50,522 | 0.97 | % | 0.97 | % | 2.61 | % | 27 | % | ||||||||||||||||||||||||||||||||||||||||||||||||
10/1/13 to 9/30/14 | 13.94 | 0.74 | 1.41 | 2.15 | (0.71 | ) | — | (0.71 | ) | 1.44 | 15.38 | 15.49 | 55,557 | 1.04 | 1.04 | 4.87 | 24 | ||||||||||||||||||||||||||||||||||||||||||||||||||||||||||||
10/1/12 to 9/30/13 | 12.89 | 0.39 | 1.04 | 1.43 | (0.38 | ) | — | (0.38 | ) | 1.05 | 13.94 | 11.23 | 70,485 | 1.03 | 1.03 | 2.86 | 14 | ||||||||||||||||||||||||||||||||||||||||||||||||||||||||||||
10/1/11 to 9/30/12 | 10.97 | 0.35 | 1.95 | 2.30 | (0.38 | ) | — | (0.38 | ) | 1.92 | 12.89 | 21.19 | 48,830 | 1.07 | 1.07 | 2.85 | 21 | ||||||||||||||||||||||||||||||||||||||||||||||||||||||||||||
10/1/10 to 9/30/11 | 10.72 | 0.36 | 0.24 | 0.60 | (0.35 | ) | — | (0.35 | ) | 0.25 | 10.97 | 5.56 | 33,865 | 1.09 | 1.09 | 3.16 | 16 | ||||||||||||||||||||||||||||||||||||||||||||||||||||||||||||
| Global Opportunities | |||||||||||||||||||||||||||||||||||||||||||||||||||||||||||||||||||||||||||||
Fund | |||||||||||||||||||||||||||||||||||||||||||||||||||||||||||||||||||||||||||||
Class A | |||||||||||||||||||||||||||||||||||||||||||||||||||||||||||||||||||||||||||||
10/1/14 to 9/30/15 | $ | 12.12 | 0.05 | 0.21 | 0.26 | (0.06 | ) | — | (0.06 | ) | 0.20 | $ | 12.32 | 2.15 | % | $ | 87,769 | 1.45 | % | 1.45 | % | 0.42 | % | 40 | % | ||||||||||||||||||||||||||||||||||||||||||||||||||||
10/1/13 to 9/30/14 | 11.07 | 0.08 | 1.04 | 1.12 | (0.07 | ) | — | (0.07 | ) | 1.05 | 12.12 | 10.18 | 77,738 | 1.48 | 1.46 | 0.70 | 41 | ||||||||||||||||||||||||||||||||||||||||||||||||||||||||||||
10/1/12 to 9/30/13 | 9.91 | 0.07 | 1.12 | 1.19 | (0.03 | ) | — | (0.03 | ) | 1.16 | 11.07 | 12.05 | 78,434 | 1.55 | 1.50 | 0.69 | 61 | ||||||||||||||||||||||||||||||||||||||||||||||||||||||||||||
10/1/11 to 9/30/12 | 7.91 | 0.05 | 1.99 | 2.04 | (0.04 | ) | — | (0.04 | ) | 2.00 | 9.91 | 25.80 | 71,592 | 1.55 | 1.55 | 0.53 | 73 | ||||||||||||||||||||||||||||||||||||||||||||||||||||||||||||
10/1/10 to 9/30/11 | 7.79 | 0.05 | 0.15 | 0.20 | (0.08 | ) | — | (0.08 | ) | 0.12 | 7.91 | 2.54 | 54,916 | 1.55 | 1.67 | 0.65 | 56 | ||||||||||||||||||||||||||||||||||||||||||||||||||||||||||||
Class B | |||||||||||||||||||||||||||||||||||||||||||||||||||||||||||||||||||||||||||||
10/1/14 to 9/30/15 | $ | 10.73 | (0.06 | ) | 0.20 | 0.14 | (0.02 | ) | — | (0.02 | ) | 0.12 | $ | 10.85 | 1.33 | % | $ | 474 | 2.20 | % | 2.20 | % | (0.50 | )% | 40 | % | |||||||||||||||||||||||||||||||||||||||||||||||||||
10/1/13 to 9/30/14 | 9.81 | (0.01 | ) | 0.93 | 0.92 | — | — | — | 0.92 | 10.73 | 9.38 | 652 | 2.23 | 2.21 | (0.09 | ) | 41 | ||||||||||||||||||||||||||||||||||||||||||||||||||||||||||||
10/1/12 to 9/30/13 | 8.82 | (0.01 | ) | 1.00 | 0.99 | — | — | — | 0.99 | 9.81 | 11.22 | 798 | 2.30 | 2.25 | (0.10 | ) | 61 | ||||||||||||||||||||||||||||||||||||||||||||||||||||||||||||
10/1/11 to 9/30/12 | 7.06 | (0.02 | ) | 1.78 | 1.76 | — | — | — | 1.76 | 8.82 | 24.93 | 1,048 | 2.30 | 2.30 | (0.28 | ) | 73 | ||||||||||||||||||||||||||||||||||||||||||||||||||||||||||||
10/1/10 to 9/30/11 | 6.97 | (0.01 | ) | 0.13 | 0.12 | (0.03 | ) | — | (0.03 | ) | 0.09 | 7.06 | 1.76 | 915 | 2.30 | 2.42 | (0.14 | ) | 56 | ||||||||||||||||||||||||||||||||||||||||||||||||||||||||||
Class C | |||||||||||||||||||||||||||||||||||||||||||||||||||||||||||||||||||||||||||||
10/1/14 to 9/30/15 | $ | 10.66 | (0.01 | ) | 0.16 | 0.15 | (0.02 | ) | — | (0.02 | ) | 0.13 | $ | 10.79 | 1.42 | % | $ | 14,431 | 2.21 | % | 2.21 | % | (0.13 | )% | 40 | % | |||||||||||||||||||||||||||||||||||||||||||||||||||
10/1/13 to 9/30/14 | 9.76 | — | (5) | 0.91 | 0.91 | (0.01 | ) | — | (0.01 | ) | 0.90 | 10.66 | 9.32 | 3,455 | 2.23 | 2.21 | (0.04 | ) | 41 | ||||||||||||||||||||||||||||||||||||||||||||||||||||||||||
10/1/12 to 9/30/13 | 8.77 | — | (5) | 0.99 | 0.99 | — | — | — | 0.99 | 9.76 | 11.29 | 2,963 | 2.30 | 2.24 | (0.03 | ) | 61 | ||||||||||||||||||||||||||||||||||||||||||||||||||||||||||||
10/1/11 to 9/30/12 | 7.02 | (0.02 | ) | 1.77 | 1.75 | — | — | — | 1.75 | 8.77 | 24.93 | 1,700 | 2.30 | 2.30 | (0.25 | ) | 73 | ||||||||||||||||||||||||||||||||||||||||||||||||||||||||||||
10/1/10 to 9/30/11 | 6.93 | (0.01 | ) | 0.13 | 0.12 | (0.03 | ) | — | (0.03 | ) | 0.09 | 7.02 | 1.77 | 813 | 2.30 | 2.42 | (0.11 | ) | 56 | ||||||||||||||||||||||||||||||||||||||||||||||||||||||||||
The footnote legend is at the end of the financial highlights.
See Notes to Financial Statements
73
Table of Contents
VIRTUS OPPORTUNITIES TRUST
FINANCIAL HIGHLIGHTS
SELECTED PER SHARE DATA AND RATIOS FOR A SHARE OUTSTANDING
THROUGHOUT EACH PERIOD
| Net Asset Value, Beginning of Period | Net Investment Income (Loss)(2) | Net Realized and Unrealized Gain (Loss) | Total from Investment Operations | Dividends from Net Investment Income | Distributions from Net Realized Gains | Total Distributions | Change in Net Asset Value | Net Asset Value, End of Period | Total Return(1) | Net Assets, End of Period (in thousands) | Ratio of Net Expenses to Average Net Assets(7) | Ratio of Gross Expenses to Average Net Assets (before waivers and reimbursements)(7) | Ratio of Net Investment Income (Loss) to Average Net Assets | Portfolio Turnover Rate | ||||||||||||||||||||||||||||||||||||||||||||||||||||||||||||||
| Global Opportunities | |||||||||||||||||||||||||||||||||||||||||||||||||||||||||||||||||||||||||||||
Fund (Continued) | |||||||||||||||||||||||||||||||||||||||||||||||||||||||||||||||||||||||||||||
Class I | |||||||||||||||||||||||||||||||||||||||||||||||||||||||||||||||||||||||||||||
10/1/14 to 9/30/15 | $ | 12.11 | 0.08 | 0.21 | 0.29 | (0.08 | ) | — | (0.08 | ) | 0.21 | $ | 12.32 | 2.37 | % | $ | 38,104 | 1.20 | % | 1.20 | % | 0.67 | % | 40 | % | ||||||||||||||||||||||||||||||||||||||||||||||||||||
10/1/13 to 9/30/14 | 11.07 | 0.11 | 1.05 | 1.16 | (0.12 | ) | — | (0.12 | ) | 1.04 | 12.11 | 10.49 | 33,917 | 1.23 | 1.21 | 0.97 | 41 | ||||||||||||||||||||||||||||||||||||||||||||||||||||||||||||
10/1/12 to 9/30/13 | 9.91 | 0.10 | 1.12 | 1.22 | (0.06 | ) | — | (0.06 | ) | 1.16 | 11.07 | 12.36 | 29,540 | 1.30 | 1.30 | 0.94 | 61 | ||||||||||||||||||||||||||||||||||||||||||||||||||||||||||||
8/8/12(6) to 9/30/12 | 9.38 | — | (5) | 0.53 | 0.53 | — | — | — | 0.53 | 9.91 | 5.54 | (4) | 23,617 | 1.30 | (3) | 1.30 | (3) | 0.02 | (3) | 73 | (4) | ||||||||||||||||||||||||||||||||||||||||||||||||||||||||
| Global Real Estate | |||||||||||||||||||||||||||||||||||||||||||||||||||||||||||||||||||||||||||||
Securities Fund | |||||||||||||||||||||||||||||||||||||||||||||||||||||||||||||||||||||||||||||
Class A | |||||||||||||||||||||||||||||||||||||||||||||||||||||||||||||||||||||||||||||
10/1/14 to 9/30/15 | $ | 25.18 | 0.66 | 1.08 | 1.74 | (0.64 | ) | (0.09 | ) | (0.73 | ) | 1.01 | $ | 26.19 | 6.83 | % | $ | 36,315 | 1.40 | % | 1.50 | % | 2.45 | % | 27 | % | |||||||||||||||||||||||||||||||||||||||||||||||||||
10/1/13 to 9/30/14 | 23.14 | 0.38 | 2.19 | 2.57 | (0.36 | ) | (0.17 | ) | (0.53 | ) | 2.04 | 25.18 | 11.36 | 21,502 | 1.40 | 1.57 | 1.52 | 29 | |||||||||||||||||||||||||||||||||||||||||||||||||||||||||||
10/1/12 to 9/30/13 | 22.40 | 0.35 | 1.09 | 1.44 | (0.70 | ) | — | (0.70 | ) | 0.74 | 23.14 | 6.48 | 15,306 | 1.40 | 1.66 | 1.51 | 18 | ||||||||||||||||||||||||||||||||||||||||||||||||||||||||||||
10/1/11 to 9/30/12 | 17.78 | 0.33 | 4.77 | 5.10 | (0.11 | ) | (0.37 | ) | (0.48 | ) | 4.62 | 22.40 | 29.21 | 8,695 | 1.40 | 2.37 | 1.61 | 31 | |||||||||||||||||||||||||||||||||||||||||||||||||||||||||||
10/1/10 to 9/30/11 | 19.84 | 0.50 | (0.90 | ) | (0.40 | ) | (1.01 | ) | (0.65 | ) | (1.66 | ) | (2.06 | ) | 17.78 | (2.57 | ) | 5,275 | 1.40 | 3.16 | 2.48 | 41 | |||||||||||||||||||||||||||||||||||||||||||||||||||||||
Class C | |||||||||||||||||||||||||||||||||||||||||||||||||||||||||||||||||||||||||||||
10/1/14 to 9/30/15 | $ | 24.77 | 0.45 | 1.07 | 1.52 | (0.49 | ) | (0.09 | ) | (0.58 | ) | 0.94 | $ | 25.71 | 6.07 | % | $ | 8,421 | 2.15 | % | 2.26 | % | 1.68 | % | 27 | % | |||||||||||||||||||||||||||||||||||||||||||||||||||
10/1/13 to 9/30/14 | 22.78 | 0.22 | 2.13 | 2.35 | (0.19 | ) | (0.17 | ) | (0.36 | ) | 1.99 | 24.77 | 10.51 | 5,850 | 2.15 | 2.32 | 0.92 | 29 | |||||||||||||||||||||||||||||||||||||||||||||||||||||||||||
10/1/12 to 9/30/13 | 22.14 | 0.18 | 1.08 | 1.26 | (0.62 | ) | — | (0.62 | ) | 0.64 | 22.78 | 5.70 | 3,545 | 2.15 | 2.41 | 0.80 | 18 | ||||||||||||||||||||||||||||||||||||||||||||||||||||||||||||
10/1/11 to 9/30/12 | 17.65 | 0.17 | 4.72 | 4.89 | (0.03 | ) | (0.37 | ) | (0.40 | ) | 4.49 | 22.14 | 28.18 | 1,356 | 2.15 | 3.11 | 0.83 | 31 | |||||||||||||||||||||||||||||||||||||||||||||||||||||||||||
10/1/10 to 9/30/11 | 19.67 | 0.35 | (0.88 | ) | (0.53 | ) | (0.84 | ) | (0.65 | ) | (1.49 | ) | (2.02 | ) | 17.65 | (3.25 | ) | 486 | 2.15 | 3.91 | 1.73 | 41 | |||||||||||||||||||||||||||||||||||||||||||||||||||||||
Class I | |||||||||||||||||||||||||||||||||||||||||||||||||||||||||||||||||||||||||||||
10/1/14 to 9/30/15 | $ | 25.33 | 0.73 | 1.10 | 1.83 | (0.70 | ) | (0.09 | ) | (0.79 | ) | 1.04 | $ | 26.37 | 7.11 | % | $ | 32,659 | 1.15 | % | 1.25 | % | 2.69 | % | 27 | % | |||||||||||||||||||||||||||||||||||||||||||||||||||
10/1/13 to 9/30/14 | 23.28 | 0.41 | 2.22 | 2.63 | (0.41 | ) | (0.17 | ) | (0.58 | ) | 2.05 | 25.33 | 11.60 | 26,985 | 1.15 | 1.32 | 1.65 | 29 | |||||||||||||||||||||||||||||||||||||||||||||||||||||||||||
10/1/12 to 9/30/13 | 22.51 | 0.42 | 1.09 | 1.51 | (0.74 | ) | — | (0.74 | ) | 0.77 | 23.28 | 6.78 | 25,332 | 1.15 | 1.41 | 1.78 | 18 | ||||||||||||||||||||||||||||||||||||||||||||||||||||||||||||
10/1/11 to 9/30/12 | 17.85 | 0.45 | 4.71 | 5.16 | (0.13 | ) | (0.37 | ) | (0.50 | ) | 4.66 | 22.51 | 29.50 | 12,063 | 1.15 | 1.93 | 2.04 | 31 | |||||||||||||||||||||||||||||||||||||||||||||||||||||||||||
10/1/10 to 9/30/11 | 19.91 | 0.63 | (0.97 | ) | (0.34 | ) | (1.07 | ) | (0.65 | ) | (1.72 | ) | (2.06 | ) | 17.85 | (2.26 | ) | 609 | 1.15 | 2.92 | 3.07 | 41 | |||||||||||||||||||||||||||||||||||||||||||||||||||||||
| Greater European | |||||||||||||||||||||||||||||||||||||||||||||||||||||||||||||||||||||||||||||
Opportunities Fund | |||||||||||||||||||||||||||||||||||||||||||||||||||||||||||||||||||||||||||||
Class A | |||||||||||||||||||||||||||||||||||||||||||||||||||||||||||||||||||||||||||||
10/1/14 to 9/30/15 | $ | 15.32 | 0.16 | 0.01 | 0.17 | (0.10 | ) | (0.19 | ) | (0.29 | ) | (0.12 | ) | $ | 15.20 | 1.19 | % | $ | 13,306 | 1.45 | % | 1.89 | % | 1.02 | % | 35 | % | ||||||||||||||||||||||||||||||||||||||||||||||||||
10/1/13 to 9/30/14 | 15.87 | 0.09 | (0.22 | ) | (0.13 | ) | (0.06 | ) | (0.36 | ) | (0.42 | ) | (0.55 | ) | 15.32 | (0.88 | ) | 12,703 | 1.45 | 1.91 | 0.54 | 65 | |||||||||||||||||||||||||||||||||||||||||||||||||||||||
10/1/12 to 9/30/13 | 14.20 | 0.13 | 2.09 | 2.22 | (0.12 | ) | (0.43 | ) | (0.55 | ) | 1.67 | 15.87 | 15.92 | 13,433 | 1.45 | 2.22 | 0.86 | 75 | |||||||||||||||||||||||||||||||||||||||||||||||||||||||||||
10/1/11 to 9/30/12 | 11.80 | 0.16 | 2.87 | 3.03 | (0.15 | ) | (0.48 | ) | (0.63 | ) | 2.40 | 14.20 | 26.75 | 6,513 | 1.45 | 2.82 | 1.26 | 49 | |||||||||||||||||||||||||||||||||||||||||||||||||||||||||||
10/1/10 to 9/30/11 | 13.56 | 0.17 | (0.36 | ) | (0.19 | ) | (0.29 | ) | (1.28 | ) | (1.57 | ) | (1.76 | ) | 11.80 | (2.09 | ) | 4,571 | 1.45 | 3.03 | 1.26 | 46 | |||||||||||||||||||||||||||||||||||||||||||||||||||||||
Class C | |||||||||||||||||||||||||||||||||||||||||||||||||||||||||||||||||||||||||||||
10/1/14 to 9/30/15 | $ | 15.08 | 0.05 | 0.01 | 0.06 | — | (5) | (0.19 | ) | (0.19 | ) | (0.13 | ) | $ | 14.95 | 0.43 | % | $ | 1,564 | 2.20 | % | 2.64 | % | 0.34 | % | 35 | % | ||||||||||||||||||||||||||||||||||||||||||||||||||
10/1/13 to 9/30/14 | 15.71 | (0.02 | ) | (0.23 | ) | (0.25 | ) | (0.02 | ) | (0.36 | ) | (0.38 | ) | (0.63 | ) | 15.08 | (1.62 | ) | 1,130 | 2.20 | 2.67 | (0.12 | ) | 65 | |||||||||||||||||||||||||||||||||||||||||||||||||||||
10/1/12 to 9/30/13 | 14.10 | 0.03 | 2.07 | 2.10 | (0.06 | ) | (0.43 | ) | (0.49 | ) | 1.61 | 15.71 | 15.11 | 607 | 2.20 | 2.92 | 0.21 | 75 | |||||||||||||||||||||||||||||||||||||||||||||||||||||||||||
10/1/11 to 9/30/12 | 11.69 | 0.07 | 2.85 | 2.92 | (0.03 | ) | (0.48 | ) | (0.51 | ) | 2.41 | 14.10 | 25.73 | 187 | 2.20 | 3.57 | 0.52 | 49 | |||||||||||||||||||||||||||||||||||||||||||||||||||||||||||
10/1/10 to 9/30/11 | 13.45 | 0.07 | (0.36 | ) | (0.29 | ) | (0.19 | ) | (1.28 | ) | (1.47 | ) | (1.76 | ) | 11.69 | (2.77 | ) | 144 | 2.20 | 3.78 | 0.53 | 46 | |||||||||||||||||||||||||||||||||||||||||||||||||||||||
The footnote legend is at the end of the financial highlights.
See Notes to Financial Statements
74
Table of Contents
VIRTUS OPPORTUNITIES TRUST
FINANCIAL HIGHLIGHTS
SELECTED PER SHARE DATA AND RATIOS FOR A SHARE OUTSTANDING
THROUGHOUT EACH PERIOD
| Net Asset Value, Beginning of Period | Net Investment Income (Loss)(2) | Net Realized and Unrealized Gain (Loss) | Total from Investment Operations | Dividends from Net Investment Income | Distributions from Net Realized Gains | Total Distributions | Change in Net Asset Value | Net Asset Value, End of Period | Total Return(1) | Net Assets, End of Period (in thousands) | Ratio of Net Expenses to Average Net Assets(7) | Ratio of Gross Expenses to Average Net Assets (before waivers and reimbursements)(7) | Ratio of Net Investment Income (Loss) to Average Net Assets | Portfolio Turnover Rate | ||||||||||||||||||||||||||||||||||||||||||||||||||||||||||||||
Greater European | |||||||||||||||||||||||||||||||||||||||||||||||||||||||||||||||||||||||||||||
Opportunities Fund (Continued) | |||||||||||||||||||||||||||||||||||||||||||||||||||||||||||||||||||||||||||||
Class I | |||||||||||||||||||||||||||||||||||||||||||||||||||||||||||||||||||||||||||||
10/1/14 to 9/30/15 | $ | 15.38 | 0.24 | (0.02 | ) | 0.22 | (0.15 | ) | (0.19 | ) | (0.34 | ) | (0.12 | ) | $ | 15.26 | 1.47 | % | $ | 5,751 | 1.20 | % | 1.63 | % | 1.55 | % | 35 | % | |||||||||||||||||||||||||||||||||||||||||||||||||
10/1/13 to 9/30/14 | 15.92 | 0.14 | (0.24 | ) | (0.10 | ) | (0.08 | ) | (0.36 | ) | (0.44 | ) | (0.54 | ) | 15.38 | (0.64 | ) | 2,751 | 1.20 | 1.68 | 0.89 | 65 | |||||||||||||||||||||||||||||||||||||||||||||||||||||||
10/1/12 to 9/30/13 | 14.23 | 0.06 | 2.20 | 2.26 | (0.14 | ) | (0.43 | ) | (0.57 | ) | 1.69 | 15.92 | 16.19 | 1,918 | 1.20 | 1.96 | 0.39 | 75 | |||||||||||||||||||||||||||||||||||||||||||||||||||||||||||
10/1/11 to 9/30/12 | 11.83 | 0.17 | 2.90 | 3.07 | (0.19 | ) | (0.48 | ) | (0.67 | ) | 2.40 | 14.23 | 26.99 | 155 | 1.20 | 2.57 | 1.32 | 49 | |||||||||||||||||||||||||||||||||||||||||||||||||||||||||||
10/1/10 to 9/30/11 | 13.60 | 0.17 | (0.34 | ) | (0.17 | ) | (0.32 | ) | (1.28 | ) | (1.60 | ) | (1.77 | ) | 11.83 | (1.84 | ) | 206 | 1.20 | 2.78 | 1.33 | 46 | |||||||||||||||||||||||||||||||||||||||||||||||||||||||
International Equity Fund | |||||||||||||||||||||||||||||||||||||||||||||||||||||||||||||||||||||||||||||
Class A | |||||||||||||||||||||||||||||||||||||||||||||||||||||||||||||||||||||||||||||
10/1/14 to 9/30/15 | $ | 10.90 | 0.03 | (1.05 | ) | (1.02 | ) | (0.08 | ) | — | (0.08 | ) | (1.10 | ) | $ | 9.80 | (9.43 | )% | $ | 1,923 | 1.50 | % | 2.27 | % | 0.25 | % | 94 | % | |||||||||||||||||||||||||||||||||||||||||||||||||
10/1/13 to 9/30/14 | 10.50 | 0.13 | 0.64 | 0.77 | (0.24 | ) | (0.13 | ) | (0.37 | ) | 0.40 | 10.90 | 7.42 | 3,915 | 1.50 | 2.42 | 1.18 | 115 | |||||||||||||||||||||||||||||||||||||||||||||||||||||||||||
10/1/12 to 9/30/13 | 10.87 | 0.16 | 1.19 | 1.35 | (0.25 | ) | (1.47 | ) | (1.72 | ) | (0.37 | ) | 10.50 | 13.38 | 170 | 1.50 | 1.95 | 1.41 | 277 | ||||||||||||||||||||||||||||||||||||||||||||||||||||||||||
10/1/11 to 9/30/12 | 9.79 | 0.21 | 1.36 | 1.57 | (0.30 | ) | (0.19 | ) | (0.49 | ) | 1.08 | 10.87 | 16.58 | 193 | 1.50 | 1.80 | 2.02 | 25 | |||||||||||||||||||||||||||||||||||||||||||||||||||||||||||
10/1/10 to 9/30/11 | 10.17 | 0.29 | (0.57 | ) | (0.28 | ) | (0.10 | ) | — | (0.10 | ) | (0.38 | ) | 9.79 | (2.85 | ) | 952 | 1.50 | 2.11 | 2.73 | 65 | ||||||||||||||||||||||||||||||||||||||||||||||||||||||||
Class C | |||||||||||||||||||||||||||||||||||||||||||||||||||||||||||||||||||||||||||||
10/1/14 to 9/30/15 | $ | 10.68 | (0.02 | ) | (1.05 | ) | (1.07 | ) | (0.01 | ) | — | (0.01 | ) | (1.08 | ) | $ | 9.60 | (10.01 | )% | $ | 1,689 | 2.25 | % | 3.06 | % | (0.17 | )% | 94 | % | ||||||||||||||||||||||||||||||||||||||||||||||||
10/1/13 to 9/30/14 | 10.37 | 0.04 | 0.62 | 0.66 | (0.22 | ) | (0.13 | ) | (0.35 | ) | 0.31 | 10.68 | 6.56 | 804 | 2.25 | 3.13 | 0.38 | 115 | |||||||||||||||||||||||||||||||||||||||||||||||||||||||||||
10/1/12 to 9/30/13 | 10.77 | 0.08 | 1.20 | 1.28 | (0.21 | ) | (1.47 | ) | (1.68 | ) | (0.40 | ) | 10.37 | 12.53 | 124 | 2.25 | 2.73 | 0.70 | 277 | ||||||||||||||||||||||||||||||||||||||||||||||||||||||||||
10/1/11 to 9/30/12 | 9.76 | 0.20 | 1.25 | 1.45 | (0.25 | ) | (0.19 | ) | (0.44 | ) | 1.01 | 10.77 | 15.37 | 115 | 2.25 | 2.51 | 1.94 | 25 | |||||||||||||||||||||||||||||||||||||||||||||||||||||||||||
10/1/10 to 9/30/11 | 10.16 | 0.18 | (0.53 | ) | (0.35 | ) | (0.05 | ) | — | (0.05 | ) | (0.40 | ) | 9.76 | (3.58 | ) | 98 | 2.25 | 3.15 | 1.70 | 65 | ||||||||||||||||||||||||||||||||||||||||||||||||||||||||
Class I | |||||||||||||||||||||||||||||||||||||||||||||||||||||||||||||||||||||||||||||
10/1/14 to 9/30/15 | $ | 10.87 | 0.07 | (1.06 | ) | (0.99 | ) | (0.10 | ) | — | (0.10 | ) | (1.09 | ) | $ | 9.78 | (9.14 | )% | $ | 4,324 | 1.25 | % | 2.02 | % | 0.61 | % | 94 | % | |||||||||||||||||||||||||||||||||||||||||||||||||
10/1/13 to 9/30/14 | 10.45 | 0.14 | 0.65 | 0.79 | (0.24 | ) | (0.13 | ) | (0.37 | ) | 0.42 | 10.87 | 7.67 | 6,435 | 1.25 | 2.19 | 1.24 | 115 | |||||||||||||||||||||||||||||||||||||||||||||||||||||||||||
10/1/12 to 9/30/13 | 10.82 | 0.22 | 1.16 | 1.38 | (0.28 | ) | (1.47 | ) | (1.75 | ) | (0.37 | ) | 10.45 | 13.68 | 2,185 | 1.25 | 1.54 | 1.97 | 277 | ||||||||||||||||||||||||||||||||||||||||||||||||||||||||||
10/1/11 to 9/30/12 | 9.80 | 0.30 | 1.26 | 1.56 | (0.35 | ) | (0.19 | ) | (0.54 | ) | 1.02 | 10.82 | 16.47 | 26,398 | 1.25 | 1.50 | 2.94 | 25 | |||||||||||||||||||||||||||||||||||||||||||||||||||||||||||
10/1/10 to 9/30/11 | 10.18 | 0.34 | (0.60 | ) | (0.26 | ) | (0.12 | ) | — | (0.12 | ) | (0.38 | ) | 9.80 | (2.62 | ) | 17,689 | 1.25 | 1.88 | 3.16 | 65 | ||||||||||||||||||||||||||||||||||||||||||||||||||||||||
| International Real | |||||||||||||||||||||||||||||||||||||||||||||||||||||||||||||||||||||||||||||
Estate Securities Fund | |||||||||||||||||||||||||||||||||||||||||||||||||||||||||||||||||||||||||||||
Class A | |||||||||||||||||||||||||||||||||||||||||||||||||||||||||||||||||||||||||||||
10/1/14 to 9/30/15 | $ | 7.03 | 0.28 | (0.21 | ) | 0.07 | (0.47 | ) | — | (0.47 | ) | (0.40 | ) | $ | 6.63 | 0.94 | % | $ | 12,415 | 1.50 | % | 1.78 | % | 4.09 | % | 27 | % | ||||||||||||||||||||||||||||||||||||||||||||||||||
10/1/13 to 9/30/14 | 6.61 | 0.16 | 0.39 | 0.55 | (0.13 | ) | — | (0.13 | ) | 0.42 | 7.03 | 8.61 | 11,257 | 1.50 | 1.73 | 2.38 | 32 | ||||||||||||||||||||||||||||||||||||||||||||||||||||||||||||
10/1/12 to 9/30/13 | 6.50 | 0.15 | 0.45 | 0.60 | (0.49 | ) | — | (0.49 | ) | 0.11 | 6.61 | 9.39 | 10,234 | 1.50 | 1.75 | 2.23 | 22 | ||||||||||||||||||||||||||||||||||||||||||||||||||||||||||||
10/1/11 to 9/30/12 | 5.23 | 0.16 | 1.24 | 1.40 | (0.13 | ) | — | (0.13 | ) | 1.27 | 6.50 | 27.35 | 3,916 | 1.50 | 1.85 | 2.69 | 41 | ||||||||||||||||||||||||||||||||||||||||||||||||||||||||||||
10/1/10 to 9/30/11 | 6.30 | 0.31 | (0.69 | ) | (0.38 | ) | (0.69 | ) | — | (0.69 | ) | (1.07 | ) | 5.23 | (7.15 | ) | 3,243 | 1.50 | 1.77 | 5.03 | 41 | ||||||||||||||||||||||||||||||||||||||||||||||||||||||||
Class C | |||||||||||||||||||||||||||||||||||||||||||||||||||||||||||||||||||||||||||||
10/1/14 to 9/30/15 | $ | 6.97 | 0.23 | (0.20 | ) | 0.03 | (0.41 | ) | — | (0.41 | ) | (0.38 | ) | $ | 6.59 | 0.29 | % | $ | 2,226 | 2.25 | % | 2.52 | % | 3.36 | % | 27 | % | ||||||||||||||||||||||||||||||||||||||||||||||||||
10/1/13 to 9/30/14 | 6.56 | 0.12 | 0.38 | 0.50 | (0.09 | ) | — | (0.09 | ) | 0.41 | 6.97 | 7.75 | 2,553 | 2.25 | 2.48 | 1.68 | 32 | ||||||||||||||||||||||||||||||||||||||||||||||||||||||||||||
10/1/12 to 9/30/13 | 6.48 | 0.09 | 0.46 | 0.55 | (0.47 | ) | — | (0.47 | ) | 0.08 | 6.56 | 8.55 | 1,911 | 2.25 | 2.49 | 1.35 | 22 | ||||||||||||||||||||||||||||||||||||||||||||||||||||||||||||
10/1/11 to 9/30/12 | 5.20 | 0.12 | 1.24 | 1.36 | (0.08 | ) | — | (0.08 | ) | 1.28 | 6.48 | 26.36 | 1,531 | 2.25 | 2.60 | 2.04 | 41 | ||||||||||||||||||||||||||||||||||||||||||||||||||||||||||||
10/1/10 to 9/30/11 | 6.26 | 0.24 | (0.67 | ) | (0.43 | ) | (0.63 | ) | — | (0.63 | ) | (1.06 | ) | 5.20 | (7.90 | ) | 962 | 2.25 | 2.52 | 3.91 | 41 | ||||||||||||||||||||||||||||||||||||||||||||||||||||||||
The footnote legend is at the end of the financial highlights.
See Notes to Financial Statements
75
Table of Contents
VIRTUS OPPORTUNITIES TRUST
FINANCIAL HIGHLIGHTS
SELECTED PER SHARE DATA AND RATIOS FOR A SHARE OUTSTANDING
THROUGHOUT EACH PERIOD
| Net Asset Value, Beginning of Period | Net Investment Income (Loss)(2) | Net Realized and Unrealized Gain (Loss) | Total from Investment Operations | Dividends from Net Investment Income | Distributions from Net Realized Gains | Total Distributions | Change in Net Asset Value | Net Asset Value, End of Period | Total Return(1) | Net Assets, End of Period (in thousands) | Ratio of Net Expenses to Average Net Assets(7) | Ratio of Gross Expenses to Average Net Assets (before waivers and reimbursements)(7) | Ratio of Net Investment Income (Loss) to Average Net Assets | Portfolio Turnover Rate | ||||||||||||||||||||||||||||||||||||||||||||||||||||||||||||||
| International Real | |||||||||||||||||||||||||||||||||||||||||||||||||||||||||||||||||||||||||||||
Estate Securities Fund (Continued) | |||||||||||||||||||||||||||||||||||||||||||||||||||||||||||||||||||||||||||||
Class I | |||||||||||||||||||||||||||||||||||||||||||||||||||||||||||||||||||||||||||||
10/1/14 to 9/30/15 | $ | 7.03 | 0.30 | (0.20 | ) | 0.10 | (0.49 | ) | — | (0.49 | ) | (0.39 | ) | $ | 6.64 | 1.31 | % | $ | 24,999 | 1.25 | % | 1.52 | % | 4.36 | % | 27 | % | ||||||||||||||||||||||||||||||||||||||||||||||||||
10/1/13 to 9/30/14 | 6.61 | 0.18 | 0.39 | 0.57 | (0.15 | ) | — | (0.15 | ) | 0.42 | 7.03 | 8.87 | 28,738 | 1.25 | 1.48 | 2.64 | 32 | ||||||||||||||||||||||||||||||||||||||||||||||||||||||||||||
10/1/12 to 9/30/13 | 6.49 | 0.15 | 0.47 | 0.62 | (0.50 | ) | — | (0.50 | ) | 0.12 | 6.61 | 9.66 | 29,999 | 1.25 | 1.49 | 2.35 | 22 | ||||||||||||||||||||||||||||||||||||||||||||||||||||||||||||
10/1/11 to 9/30/12 | 5.23 | 0.17 | 1.25 | 1.42 | (0.16 | ) | — | (0.16 | ) | 1.26 | 6.49 | 27.74 | 28,095 | 1.25 | 1.59 | 2.92 | 41 | ||||||||||||||||||||||||||||||||||||||||||||||||||||||||||||
10/1/10 to 9/30/11 | 6.31 | 0.35 | (0.72 | ) | (0.37 | ) | (0.71 | ) | — | (0.71 | ) | (1.08 | ) | 5.23 | (7.04 | ) | 24,420 | 1.25 | 1.52 | 5.65 | 41 | ||||||||||||||||||||||||||||||||||||||||||||||||||||||||
| International | |||||||||||||||||||||||||||||||||||||||||||||||||||||||||||||||||||||||||||||
Small-Cap Fund | |||||||||||||||||||||||||||||||||||||||||||||||||||||||||||||||||||||||||||||
Class A | |||||||||||||||||||||||||||||||||||||||||||||||||||||||||||||||||||||||||||||
10/1/14 to 9/30/15 | $ | 13.70 | 0.17 | (1.83 | ) | (1.66 | ) | (0.23 | ) | (0.96 | ) | (1.19 | ) | (2.85 | ) | $ | 10.85 | (12.58 | )% | $ | 1,916 | 1.60 | % | 1.74 | % | 1.41 | % | 64 | % | ||||||||||||||||||||||||||||||||||||||||||||||||
10/1/13 to 9/30/14 | 13.20 | 0.47 | 0.41 | 0.88 | (0.25 | ) | (0.13 | ) | (0.38 | ) | 0.50 | 13.70 | 6.65 | 2,477 | 1.60 | 1.73 | 3.31 | 44 | |||||||||||||||||||||||||||||||||||||||||||||||||||||||||||
10/1/12 to 9/30/13 | 10.09 | 0.30 | 2.91 | 3.21 | (0.09 | ) | (0.01 | ) | (0.10 | ) | 3.11 | 13.20 | 31.97 | 403 | 1.60 | 2.51 | 2.52 | 26 | |||||||||||||||||||||||||||||||||||||||||||||||||||||||||||
9/5/12(6) to 9/30/12 | 10.00 | 0.02 | 0.07 | 0.09 | — | — | — | 0.09 | 10.09 | 0.90 | (4) | 101 | 1.60 | (3) | 16.64 | (3) | 3.65 | (3) | 0 | (4) | |||||||||||||||||||||||||||||||||||||||||||||||||||||||||
Class C | |||||||||||||||||||||||||||||||||||||||||||||||||||||||||||||||||||||||||||||
10/1/14 to 9/30/15 | $ | 13.63 | 0.08 | (1.82 | ) | (1.74 | ) | (0.21 | ) | (0.96 | ) | (1.17 | ) | (2.91 | ) | $ | 10.72 | (13.28 | )% | $ | 1,464 | 2.35 | % | 2.49 | % | 0.65 | % | 64 | % | ||||||||||||||||||||||||||||||||||||||||||||||||
10/1/13 to 9/30/14 | 13.16 | 0.24 | 0.54 | 0.78 | (0.18 | ) | (0.13 | ) | (0.31 | ) | 0.47 | 13.63 | 5.89 | 1,194 | 2.35 | 2.49 | 1.73 | 44 | |||||||||||||||||||||||||||||||||||||||||||||||||||||||||||
10/1/12 to 9/30/13 | 10.09 | 0.19 | 2.93 | 3.12 | (0.04 | ) | (0.01 | ) | (0.05 | ) | 3.07 | 13.16 | 30.92 | 374 | 2.35 | 3.34 | 1.62 | 26 | |||||||||||||||||||||||||||||||||||||||||||||||||||||||||||
9/5/12(6) to 9/30/12 | 10.00 | 0.02 | 0.07 | 0.09 | — | — | — | 0.09 | 10.09 | 0.90 | (4) | 107 | 2.35 | (3) | 17.43 | (3) | 2.86 | (3) | 0 | (4) | |||||||||||||||||||||||||||||||||||||||||||||||||||||||||
Class I | |||||||||||||||||||||||||||||||||||||||||||||||||||||||||||||||||||||||||||||
10/1/14 to 9/30/15 | $ | 13.74 | 0.21 | (1.85 | ) | (1.64 | ) | (0.25 | ) | (0.96 | ) | (1.21 | ) | (2.85 | ) | $ | 10.89 | (12.43 | )% | $ | 40,512 | 1.35 | % | 1.49 | % | 1.70 | % | 64 | % | ||||||||||||||||||||||||||||||||||||||||||||||||
10/1/13 to 9/30/14 | 13.21 | 0.36 | 0.57 | 0.93 | (0.27 | ) | (0.13 | ) | (0.40 | ) | 0.53 | 13.74 | 7.04 | 46,599 | 1.35 | 1.49 | 2.57 | 44 | |||||||||||||||||||||||||||||||||||||||||||||||||||||||||||
10/1/12 to 9/30/13 | 10.10 | 0.34 | 2.89 | 3.23 | (0.11 | ) | (0.01 | ) | (0.12 | ) | 3.11 | 13.21 | 32.13 | 18,123 | 1.35 | 2.23 | 2.82 | 26 | |||||||||||||||||||||||||||||||||||||||||||||||||||||||||||
9/5/12(6) to 9/30/12 | 10.00 | 0.03 | 0.07 | 0.10 | — | — | — | 0.10 | 10.10 | 1.00 | (4) | 2,834 | 1.35 | (3) | 16.39 | (3) | 3.89 | (3) | 0 | (4) | |||||||||||||||||||||||||||||||||||||||||||||||||||||||||
Class R6 | |||||||||||||||||||||||||||||||||||||||||||||||||||||||||||||||||||||||||||||
11/12/14(6) to 9/30/15 | $ | 13.43 | 0.22 | (1.55 | ) | (1.33 | ) | (0.25 | ) | (0.96 | ) | (1.21 | ) | (2.54 | ) | $ | 10.89 | (10.41 | )%(4) | $ | 90 | 1.27 | %(3) | 1.41 | %(3) | 2.02 | %(3) | 64 | %(4) | ||||||||||||||||||||||||||||||||||||||||||||||||
International Wealth | |||||||||||||||||||||||||||||||||||||||||||||||||||||||||||||||||||||||||||||
Masters Fund | |||||||||||||||||||||||||||||||||||||||||||||||||||||||||||||||||||||||||||||
Class A | |||||||||||||||||||||||||||||||||||||||||||||||||||||||||||||||||||||||||||||
11/17/14(6) to 9/30/15 | $ | 10.00 | 0.08 | (0.56 | ) | (0.48 | ) | — | — | — | (0.48 | ) | $ | 9.52 | (4.80 | )%(4) | $ | 126 | 1.55 | %(3) | 3.84 | %(3) | 0.91 | %(3) | 32 | %(4) | |||||||||||||||||||||||||||||||||||||||||||||||||||
Class C | |||||||||||||||||||||||||||||||||||||||||||||||||||||||||||||||||||||||||||||
11/17/14(6) to 9/30/15 | $ | 10.00 | 0.01 | (0.55 | ) | (0.54 | ) | — | — | — | (0.54 | ) | $ | 9.46 | (5.40 | )%(4) | $ | 114 | 2.30 | %(3) | 4.59 | %(3) | 0.14 | %(3) | 32 | %(4) | |||||||||||||||||||||||||||||||||||||||||||||||||||
Class I | |||||||||||||||||||||||||||||||||||||||||||||||||||||||||||||||||||||||||||||
11/17/14(6) to 9/30/15 | $ | 10.00 | 0.11 | (0.57 | ) | (0.46 | ) | — | — | — | (0.46 | ) | $ | 9.54 | (4.60 | )%(4) | $ | 4,602 | 1.30 | %(3) | 3.56 | %(3) | 1.19 | %(3) | 32 | %(4) | |||||||||||||||||||||||||||||||||||||||||||||||||||
The footnote legend is at the end of the financial highlights.
See Notes to Financial Statements
76
Table of Contents
VIRTUS OPPORTUNITIES TRUST
FINANCIAL HIGHLIGHTS
SELECTED PER SHARE DATA AND RATIOS FOR A SHARE OUTSTANDING
THROUGHOUT EACH PERIOD
Footnote Legend
| (1) | Sales charges, where applicable, are not reflected in the total return calculation. |
| (2) | Computed using average shares outstanding. |
| (3) | Annualized. |
| (4) | Not annualized. |
| (5) | Amount is less than $0.005. |
| (6) | Inception date. |
| (7) | The Funds will also indirectly bear their prorated share of expenses of the underlying funds in which they invest. Such expenses are not included in the calculation of this ratio. |
See Notes to Financial Statements
77
Table of Contents
VIRTUS OPPORTUNITIES TRUST
SEPTEMBER 30, 2015
| Note | 1. Organization |
Virtus Opportunities Trust (the “Trust”) is organized as a Delaware statutory trust and is registered under the Investment Company Act of 1940, as amended (the “1940 Act”), as an open-end management investment company.
As of the date of this report, 32 funds of the Trust are offered for sale, of which 11 (each a “Fund”) are reported in this annual report.
Each Fund has a distinct investment objective and ten Funds are diversified. The Emerging Markets Debt Fund is non-diversified.
The Funds’ investment objectives are outlined in each Fund’s summary page.
All of the Funds offer Class A shares, Class C shares, and Class I shares. Class B shares are no longer available for purchase by new or existing shareholders, except by existing shareholders through Qualifying Transactions. The International Small-Cap Fund also offers Class R6 shares. For information regarding Qualifying Transactions, refer to each Fund’s prospectus.
Class A shares of the Emerging Markets Debt Fund are sold with a front-end sales charge of up to 3.75%. Class A shares of the remaining Funds are sold with a front-end sales charge of up to 5.75% with some exceptions. Generally, Class A shares are not subject to any charges by the Funds when redeemed; however, a 0.50% – 1% contingent deferred sales charge (“CDSC”) may be imposed on certain redemptions made within a certain period following purchases on which a finder’s fee has been paid. The period for which the CDSC applies for the Funds is 18 months. The CDSC period begins on the last day of the month preceding the month in which the purchase was made.
Class B shares were generally sold with a CDSC, which declines from 5% to zero depending on the period of time the shares are held. Class C shares are generally sold with a 1% CDSC, applicable if redeemed within one year of purchase. Class I shares and Class R6 shares are sold without a front-end sales charge or CDSC. Class R6 shares are only available to participants in employer-sponsored retirement plans, such as 401(k) plans, profit-sharing plans, defined benefit plans and other employer-directed plans. Class R6 shares do not carry sales commissions or pay Rule 12b-1 fees.
Virtus Mutual Funds may impose an annual fee on accounts having balances of less than $2,500. The small account fee may be waived in certain circumstances, as disclosed in the prospectuses and/or statements of additional information. The fees collected will be used to offset certain expenses of the Funds.
Each Class of shares has identical voting, dividend, liquidation and other rights and the same terms and conditions, except that each Class bears different distribution and/or service fees under a Board-approved Rule 12b-1 and/or shareholder service plan (“12b-1 Plan”) and has exclusive voting rights with respect to such plans. Class I shares and Class R6 shares are not subject to a 12b-1 Plan. Income and other expenses as well as realized and unrealized gains and losses of each Fund are borne pro rata by the holders of each Class of shares.
| Note | 2. Significant Accounting Policies |
The significant accounting policies consistently followed by the Trust in the preparation of its financial statements are summarized below and for derivatives, included in Note 3 below. The preparation of financial statements in conformity with accounting principles generally accepted in the United States of America requires management to make estimates and assumptions that affect the reported amounts of assets and liabilities, and disclosure of contingent assets and liabilities at the date of the financial statements and the reported amounts of increases and decreases in net assets from operations during the reporting period. Actual results could differ from those estimates and those differences could be significant.
| A. | Security Valuation |
Security valuation procedures for each Fund, which include nightly price variance, as well as back-testing such as bi-weekly unchanged price, monthly secondary source and transaction analysis, have been approved by the Board of Trustees (the “Board”, or the “Trustees”). All internally fair valued securities are approved by a valuation committee (the “Valuation Committee”) appointed by the Board. The Valuation Committee is comprised of certain members of management as identified to the Board and convenes independently from portfolio management. All internally fair valued securities are updated daily and reviewed in detail by the Valuation Committee monthly unless changes occur within the period. The Valuation Committee reviews the validity of the model inputs and any changes to the model. Quarterly fair valuations are reviewed by the Board.
Each Fund utilizes a fair value hierarchy which prioritizes the inputs to valuation techniques used to measure fair value into three broad levels. The Funds’ policy is to recognize transfers between levels at the end of the reporting period.
| • Level 1 – | quoted prices in active markets for identical securities (security types generally include listed equities). |
| • Level 2 – | prices determined using other significant observable inputs (including quoted prices for similar securities, interest rates, prepayment speeds, credit risk, etc.). |
| • Level 3 – | prices determined using significant unobservable inputs (including the Valuation Committee’s own assumptions in determining the fair value of investments). |
A description of the valuation techniques applied to a Fund’s major categories of assets and liabilities measured at fair value on a recurring basis is as follows:
Equity securities are valued at the official closing price (typically last sale) on the exchange on which the securities are primarily traded or, if no closing price is available, at the last bid price and are categorized as Level 1 in the hierarchy. Restricted equity securities and private placements that are not widely traded, are illiquid, or are internally fair valued by the Valuation Committee, are generally categorized as Level 3 in the hierarchy.
Certain non-U.S. securities may be fair valued in cases where closing prices are not readily available or are deemed not reflective of readily available market prices. For example, significant events (such as movement in the U.S. securities market, or other regional and local developments) may occur between the time that non-U.S. markets close (where the security is principally traded) and the time that a Fund calculates its net asset value (“NAV”) (at the close of regular trading on the New York Stock Exchange (“NYSE”), generally 4 p.m. Eastern time)
78
Table of Contents
VIRTUS OPPORTUNITIES TRUST
NOTES TO FINANCIAL STATEMENTS (Continued)
SEPTEMBER 30, 2015
that may impact the value of securities traded in these non-U.S. markets. In such cases the Funds fair value non-U.S. securities using an independent pricing service which considers the correlation of the trading patterns of the non-U.S. security to the intraday trading in the U.S. markets for investments such as ADRs, financial futures, ETFs, and certain indexes, as well as prices for similar securities. Such fair valuations are categorized as Level 2 in the hierarchy. Because the frequency of significant events is not predictable, fair valuation of certain non-U.S. common stocks may occur on a frequent basis.
Debt securities, including restricted securities, are valued based on evaluated quotations received from independent pricing services or from dealers who make markets in such securities. For most bond types, the pricing service utilizes matrix pricing that considers one or more of the following factors: yield or price of bonds of comparable quality, coupon, maturity, current cash flows, type, and current day trade information, as well as dealer-supplied prices. These valuations are generally categorized as Level 2 in the hierarchy. Structured debt instruments, such as mortgage-backed and asset-backed securities, may also incorporate collateral analysis and utilize cash flow models for valuation and are generally categorized as Level 2 in the hierarchy. Pricing services do not provide pricing for all securities and therefore indicative bids from dealers are utilized which are based on pricing models used by market makers in the security and are generally categorized as Level 2 in the hierarchy. Debt securities that are not widely traded, are illiquid, or are internally fair valued by the Valuation Committee, are generally categorized as Level 3 in the hierarchy.
Listed derivatives, such as treasury futures, that are actively traded are valued based on quoted prices from the exchange and are categorized as Level 1 in the hierarchy. Over-the-counter derivative contracts, which include forward currency contracts and equity-linked instruments, do not require material subjectivity as pricing inputs are observed from actively quoted markets and are categorized as Level 2 in the hierarchy.
Investments in open-end mutual funds are valued at NAV. Investments in closed-end funds are valued as of the close of regular trading on the NYSE each business day. Both are categorized as Level 1 in the hierarchy.
A summary of the inputs used to value a Fund’s net assets by each major security type is disclosed at the end of the Schedule of Investments for each Fund. The inputs or methodologies used for valuing securities are not necessarily an indication of the risk associated with investing in those securities.
| B. | Security Transactions and Investment Income |
Security transactions are recorded on the trade date. Realized gains and losses from sales of securities are determined on the identified cost basis. Dividend income is recognized on the ex-dividend date or, in the case of certain foreign securities, as soon as a Fund is notified. Interest income is recorded on the accrual basis. Each Fund amortizes premiums and accretes discounts using the effective interest method. Any distributions from underlying funds are recorded in accordance with the character of the distributions as designated by the underlying funds.
Dividend income from REIT investments is recorded using management’s estimate of the income included in distributions received from the REIT investments. Distributions received in excess of this estimated amount are recorded as a reduction of the cost of investments or reclassified to capital gains. The actual amounts of income, return of capital, and capital gains are only determined by each Domestic REIT after its fiscal year-end, and may differ from the estimated amounts.
| C. | Income Taxes |
Each Fund is treated as a separate taxable entity. It is the intention of each Fund to comply with the requirements of Subchapter M of the Internal Revenue Code and to distribute substantially all of its taxable income to its shareholders. Therefore, no provision for federal income taxes or excise taxes has been made.
Certain Funds may be subject to foreign taxes on income, gains on investments or currency repatriation, a portion of which may be recoverable. Each Fund will accrue such taxes and recoveries as applicable based upon current interpretations of the tax rules and regulations that exist in the markets in which it invests.
Management of the Funds has concluded that there are no significant uncertain tax positions that would require recognition in the financial statements. As of September 30, 2015, the tax years that remain subject to examination by the major tax jurisdictions under the statute of limitations are from the year 2012 forward (with limited exceptions).
| D. | Distributions to Shareholders |
Distributions are recorded by each Fund on the ex-dividend date. Income and capital gain distributions are determined in accordance with income tax regulations that may differ from accounting principles generally accepted in the United States of America. These differences may include the treatment of non-taxable dividends, market premium and discount, non-deductible expenses, expiring capital loss carryovers, foreign currency gain or loss, gain or loss on futures contracts, partnerships, operating losses and losses deferred due to wash sales. Permanent book and tax basis differences relating to shareholder distributions will result in reclassifications to capital paid in on shares of beneficial interest.
| E. | Expenses |
Expenses incurred together by a Fund and other affiliated mutual funds are allocated in proportion to the net assets of each such fund, except where allocation of direct expense to each fund or an alternative allocation method can be more appropriately used.
In addition to the net annual operating expenses that a Fund bears directly, the shareholders of a Fund indirectly bear the pro rata expenses of any underlying mutual funds in which the Fund invests.
| F. | Foreign Currency Translation |
Non-U.S. investment securities and other assets and liabilities denominated in foreign currencies are translated into U.S. dollar amounts at the foreign currency exchange rate effective at the end of the reporting period. Cost of investments is translated at the currency exchange rate effective at the trade date. The gain or loss resulting from a change in currency exchange rates between the trade and settlement date of a portfolio transaction is treated as a gain or loss on foreign currency. Likewise, the gain or loss resulting from a change in currency exchange rates between
79
Table of Contents
VIRTUS OPPORTUNITIES TRUST
NOTES TO FINANCIAL STATEMENTS (Continued)
SEPTEMBER 30, 2015
the date income is accrued and the date it is paid is treated as a gain or loss on foreign currency. The Funds do not isolate that portion of the results of operations arising from changes in foreign exchange rates on investments from the fluctuations arising from changes in the market prices of securities held. Such fluctuations are included with the net realized and unrealized gain or loss on investments.
| G. | Loan Agreements |
Certain Funds may invest in direct debt instruments which are interests in amounts owed by a corporate, governmental, or other borrower to lenders or lending syndicates. Loan agreements are generally non-investment grade and often involve borrowers that are highly leveraged. The Funds may invest in obligations of borrowers who are in bankruptcy proceedings. Loan agreements are typically senior in the corporate capital structure of the borrower. A loan is often administered by a bank or other financial institution (the “lender”) that acts as agent for all holders. The agent administers the terms of the loan, as specified in the loan agreement. A Fund’s investments in loans may be in the form of participations in loans or assignments of all or a portion of loans from third parties. When investing in loan participations, a Fund has the right to receive payments of principal, interest and any fees to which it is entitled only from the lender selling the loan participation and only upon receipt by the lender of payments from the borrower. A Fund generally has no right to enforce compliance with the terms of the loan agreement with the borrower. As a result, a Fund may be subject to the credit risk of both the borrower and the lender that is selling the loan agreement. When a Fund purchases assignments from lenders it acquires direct rights against the borrower on the loan.
A Fund may invest in multiple series or tranches of a loan, which may have varying terms and carry different associated risks. Loan agreements may involve foreign borrowers and investments may be denominated in foreign currencies. Direct indebtedness of emerging countries involves a risk that the government entities responsible for the repayment of the debt may be unable, or unwilling, to pay the principal and interest when due.
The loan agreements have floating rate loan interests which generally pay interest at rates that are periodically determined by reference to a base lending rate plus a premium. The base lending rates are generally LIBOR (London Interbank Offered Rate), the prime rate offered by one or more U.S. banks or the certificate of deposit rate. When a loan agreement is purchased a Fund may pay an assignment fee. On an ongoing basis, a Fund may receive a commitment fee based on the undrawn portion of the underlying line of credit portion of a loan agreement. Prepayment penalty fees are received upon the prepayment of a loan agreement by a borrower. Prepayment penalty, facility, commitment, consent and amendment fees are recorded to income as earned or paid.
At September 30, 2015, the Funds only hold assignment loans.
| H. | Securities Lending |
Certain Funds may loan securities to qualified brokers through an agreement with Brown Brothers Harriman (“BBH”), as a third party lending agent. Under the terms of the agreement, a Fund doing so is required to maintain collateral with a market value not less than 100% of the market value of loaned securities. Collateral is adjusted daily in connection with changes in the market value of securities on loan. Collateral may consist of cash and securities issued by the U.S. Government or its agencies. Cash collateral is invested in a short-term money market fund. Dividends earned on the collateral and premiums paid by the broker are recorded as income by a Fund net of fees and rebates charged by BBH for its services as securities lending agent and in connection with this securities lending program. Lending portfolio securities involves a risk of delay in the recovery of the loaned securities or in the declining value of the collateral.
At September 30, 2015, the International Equity Fund and International Wealth Masters Fund had securities on loan with market values of $443 and $89 and cash collateral of $452 and $94, respectively ($ reported in thousands).
| Note | 3. Derivative Financial Instruments and Transactions |
($ reported in thousands)
Disclosures about derivative instruments and hedging activities are intended to enable investors to understand how and why a Fund uses derivatives, how derivatives are accounted for, and how derivative instruments affect a Fund’s results of operations and financial position. Summarized below are such disclosures and accounting policies for each specific type of derivative instrument used by certain Funds.
Forward Currency Contracts: A forward currency contract involves an obligation to purchase or sell a specific currency at a future date, which may be any number of days from the date of the contract agreed upon by the parties, at a price set at the time of the contract. These contracts are traded directly between currency traders and their customers. The contract is marked-to-market daily and the change in market value is recorded by the Funds as an unrealized gain or loss in the Statements of Operations. When the contract is closed or offset with the same counterparty, on settlement date, the Funds record a realized gain or loss equal to the change in the value of the contract when it was opened and the value at the time it was closed or offset. This is presented in the Statements of Operations as net realized gain (loss) from foreign currency transactions.
Funds enter into forward currency contracts in conjunction with the planned purchase or sale of foreign denominated securities in order to hedge the U.S. dollar cost or proceeds. The Funds also, from time to time, hedge the currency exposure of foreign denominated securities, held in the portfolio, back to U.S. dollars during perceived times of U.S. dollar strength. This is done in order to protect the U.S. dollar value of the portfolio. Forward currency contracts involve, to varying degrees, elements of market risk in excess of the amount recognized in the Statement of Assets and Liabilities. Risks arise from the possible movements in foreign exchange rates or if the counterparty does not perform under the contract.
The International Equity Fund invested in derivative instruments during the reporting period in the form of forward currency contracts. The primary type of risk associated with forward currency contracts is the risk associated with the conversion of foreign currency to U.S. dollars. The Fund may invest in forward currency contracts in an attempt to manage such risk and protect the U.S. dollar value of the portfolio.
These forward currency contracts were executed under the ISDA 2002 Master Agreement without any Schedule thereto and without the requirement of posting any collateral to the counterparty.
80
Table of Contents
VIRTUS OPPORTUNITIES TRUST
NOTES TO FINANCIAL STATEMENTS (Continued)
SEPTEMBER 30, 2015
For the period ended September 30, 2015, the International Equity Fund did not have any realized gain (loss) on foreign currency exchange contracts recognized in the Statement of Operations.
The Emerging Markets Small-Cap Fund invested in warrants during the reporting period. The primary type of risk associated with warrants is equity risk. As of September 30, 2015, the Emerging Markets Small-Cap Fund has an amount of $16 included in “unrealized appreciation (depreciation) on investments” in the Statements of Assets and Liabilities and Statements of Operations. As of September 30, 2015, the Emerging Markets Small-Cap Fund holds three warrants as disclosed in the Schedule of Investments with a value of $163. The amount of warrants outstanding at September 30, 2015, is indicative of the amount of warrants held during the year.
Emerging Markets Small-Cap Fund – Equity risk
Asset Derivatives | Liability Derivatives | |||||||||||||
Statement of Assets and | Fair Value | Statement of Assets and Liabilities Location | Fair Value | |||||||||||
Warrants | Investment in securities, at value | $ | 163 | — | $ | — | ||||||||
The effect of warrants on the Statement of Operations for the year ended September 30, 2015, was as follows:
Location of Gain (Loss) on Warrants | Realized Gain (Loss) on Warrants Recognized in Income | Change in Unrealized Appreciation (Depreciation) on Derivatives Recognized in Income | ||||||||
Warrants | Net realized gain (loss) on investments and net change in unrealized appreciation (depreciation) on investments | $ | 34 | $ | (34 | ) | ||||
| Note | 4. Investment Advisory Fees and Related Party Transactions |
($ reported in thousands except as noted)
| A. | Adviser |
Virtus Investment Advisers, Inc. (the “Adviser”), an indirect wholly owned subsidiary of Virtus Investment Partners, Inc. (“Virtus”), is the adviser to the Trust. The Adviser manages the Funds’ investment programs and general operations of the Funds, including oversight of the Funds’ subadvisers.
As compensation for its services to the Funds, the Adviser is entitled to a fee based upon the following annual rates as a percentage of the average daily net assets of each Fund:
| First $1 Billion | $1+ Billion | |||||||
Emerging Markets Debt Fund | 0.75 | % | 0.70 | % | ||||
Emerging Markets Equity Income Fund | 1.05 | 1.00 | ||||||
Emerging Markets Small-Cap Fund | 1.20 | 1.15 | ||||||
Greater European Opportunities Fund | 0.85 | 0.80 | ||||||
International Small-Cap Fund | 1.00 | 0.95 | ||||||
International Wealth Masters Fund | 0.90 | 0.85 | ||||||
| First $1 Billion | $1+ Billion through $2 Billion | $2+ Billion | ||||||||||
Global Infrastructure Fund | 0.65 | % | 0.60 | % | 0.55 | % | ||||||
Global Opportunities Fund | 0.85 | 0.80 | 0.75 | |||||||||
Global Real Estate Securities Fund | 0.85 | 0.80 | 0.75 | |||||||||
International Real Estate Securities Fund | 1.00 | 0.95 | 0.90 | |||||||||
| First $2 Billion | $2+ Billion through $4 Billion | $4+ Billion | ||||||||||
International Equity Fund | 0.85 | % | 0.80 | % | 0.75 | % | ||||||
During the period covered by these financial statements, the Emerging Markets Debt Fund invested a portion of its assets in Virtus Credit Opportunities Fund, an affiliated mutual fund. In order to avoid any duplication of advisory fees, the Adviser has voluntarily waived its advisory fees in an amount equal to that which would otherwise be paid by the Fund on the assets invested in the Credit Opportunities Fund. For the period covered by these financial statements, the waiver amounted to $—*. This waiver is in addition to the expense limitation and/or fee waiver covered elsewhere in these financial statements and is included in the Statement of Operations in “expenses reimbursed and/or waived by the investment adviser”.
| * | Amount is less than $500. |
81
Table of Contents
VIRTUS OPPORTUNITIES TRUST
NOTES TO FINANCIAL STATEMENTS (Continued)
SEPTEMBER 30, 2015
| B. | Subadvisers |
The subadvisers manage the investments of each Fund for which they are paid a fee by the Adviser. The subadvisers and the Funds they serve are as follows:
Fund | Subadviser | Fund | Subadviser | |||
Emerging Markets Debt Fund | NF(1) | Greater European Opportunities Fund | Vontobel(5) | |||
Emerging Markets Equity Income fund | KBI(2) | International Equity Fund | Euclid(6) | |||
| Emerging Markets Small-Cap Fund | KAR(3) | International Real Estate Securities Fund | DPIM(4) | |||
Global Infrastructure Fund | DPIM(4) | International Small-Cap Fund | KAR(3) | |||
Global Opportunities Fund | Vontobel(5) | International Wealth Masters Fund | Horizon(7) | |||
Global Real Estate Securities Fund | DPIM(4) |
| (1) | Newfleet Asset Management, LLC, an indirect wholly owned subsidiary of Virtus. |
| (2) | Kleinwort Benson Investors International, Ltd. |
| (3) | Kayne Anderson Rudnick Investment Management, LLC, an indirect wholly owned subsidiary of Virtus. |
| (4) | Duff & Phelps Investment Management Co., an indirect, wholly owned subsidiary of Virtus. |
| (5) | Vontobel Asset Management, Inc. |
| (6) | Euclid Advisors LLC, an indirect wholly owned subsidiary of Virtus. |
| (7) | Horizon Asset Management, LLC |
| C. | Expense Limits and Fee Waivers |
Effective September 1, 2015, the Adviser has contractually agreed to limit the following Fund’s total operating expenses (excluding dividend and interest expenses, taxes, brokerage commissions, extraordinary expenses, and acquired fund fees and expenses), so that such expenses do not exceed the following percentages of the Fund’s average daily net asset values as listed below.
| Class A | Class B | Class C | Class I | Class R6 | Through Date | |||||||||||||||||||
Emerging Markets Debt Fund† | 1.35 | % | — | % | 2.10 | % | 1.10 | % | — | % | 1/31/17 | |||||||||||||
Emerging Markets Equity Income Fund† | 1.75 | — | 2.50 | 1.50 | — | 1/31/17 | ||||||||||||||||||
Emerging Markets Small-Cap Fund† | 1.85 | — | 2.60 | 1.60 | — | 1/31/17 | ||||||||||||||||||
Global Opportunities Fund† | 1.55 | 2.30 | 2.30 | 1.30 | — | 1/31/17 | ||||||||||||||||||
Global Real Estate Securities Fund† | 1.40 | — | 2.15 | 1.15 | — | 1/31/17 | ||||||||||||||||||
Greater European Opportunities Fund† | 1.45 | — | 2.20 | 1.20 | — | 1/31/17 | ||||||||||||||||||
International Equity Fund† | 1.50 | — | 2.25 | 1.25 | — | 1/31/17 | ||||||||||||||||||
International Real Estate Securities Fund† | 1.50 | — | 2.25 | 1.25 | — | 1/31/17 | ||||||||||||||||||
International Small-Cap Fund† | 1.60 | — | 2.35 | 1.35 | 1.26 | 1/31/17 | ||||||||||||||||||
International Wealth Masters Fund | 1.55 | — | 2.30 | 1.30 | — | 1/31/16 | ||||||||||||||||||
| † | For the period of October 1, 2014, through August 31, 2015, the waiver was voluntary. |
| D. | Expense Recapture |
For certain Funds, the Adviser may recapture operating expenses waived or reimbursed under these arrangements, within three fiscal years following the end of the fiscal year in which such waiver or reimbursement occurred. A Fund must pay its ordinary operating expenses before the Adviser is entitled to any reimbursement and must remain in compliance with any applicable expense limitations or, if none, the expense limitation in effect at the time of the waiver or reimbursement. All or a portion of the following Adviser reimbursed expenses may be recaptured as follows:
| Fiscal Year Ended | ||||||||||||||||
| 2016 | 2017 | 2018 | Total | |||||||||||||
Emerging Markets Debt Fund | $ | 64 | $ | 40 | $ | 39 | $ | 143 | ||||||||
Emerging Markets Equity Income Fund | 95 | 13 | 6 | 114 | ||||||||||||
Emerging Markets Small-Cap Fund | — | 80 | 79 | 159 | ||||||||||||
Global Real Estate Securities Fund | 90 | 79 | 79 | 248 | ||||||||||||
Greater European Opportunities Fund | 87 | 80 | 85 | 252 | ||||||||||||
International Equity Fund | 67 | 74 | 72 | 213 | ||||||||||||
International Real Estate Securities Fund | 95 | 100 | 114 | 309 | ||||||||||||
International Small-Cap Fund | 85 | 60 | 67 | 212 | ||||||||||||
International Wealth Masters Fund | — | — | 101 | 101 | ||||||||||||
| E. | Distributor |
VP Distributors, LLC (“VP Distributors”), an indirect wholly owned subsidiary of Virtus, serves as the distributor of each Fund’s shares. VP Distributors has advised the Funds that for the fiscal year (the “period”) ended September 30, 2015, it retained net commissions of $52 for Class A shares and deferred sales charges of $36, $—*, and $19 for Class A shares, Class B shares, and Class C shares, respectively.
* Amount is less than $500.
In addition, each Fund pays VP Distributors distribution and/or service fees under a 12b-1 Plan as a percentage of the average daily net assets of each respective class at the annual rates as follows: Class A shares 0.25%; Class B shares 1.00%; Class C shares 1.00%; Class I shares and Class R6 shares are not subject to a 12b-1 Plan.
82
Table of Contents
VIRTUS OPPORTUNITIES TRUST
NOTES TO FINANCIAL STATEMENTS (Continued)
SEPTEMBER 30, 2015
Under certain circumstances, shares of certain Virtus Mutual Funds may be exchanged for shares of the same class of certain other Virtus Mutual Funds on the basis of the relative NAV per share at the time of the exchange. On exchanges with share classes that carry a CDSC, the CDSC schedule of the original shares purchased continues to apply.
| F. | Administrator and Transfer Agent |
Virtus Fund Services, LLC, an indirect wholly owned subsidiary of Virtus, serves as the administrator and transfer agent to the Funds.
For the period ended September 30, 2015, the Funds incurred administration fees totaling $588 which are included in the Statements of Operations.
For the period ended September 30, 2015, the Funds incurred transfer agent fees totaling $653 which are included in the Statements of Operations. A portion of these fees was paid to outside entities that also provide services to the Trust.
| G. | Affiliated Shareholders |
At September 30, 2015, Virtus and its affiliates held shares of certain Funds, which may be redeemed at any time, that aggregated the following:
| Shares | Aggregate Net Asset Value | |||||||
| Emerging Markets Debt Fund | ||||||||
Class A | 11,524 | $ | 98 | |||||
Class C | 11,268 | 96 | ||||||
Class I | 2,879,843 | 24,594 | ||||||
| Emerging Markets Equity Income Fund | ||||||||
Class A | 10,707 | 89 | ||||||
Class C | 10,511 | 87 | ||||||
Class I | 247,977 | 2,061 | ||||||
| Emerging Markets Small-Cap Fund | ||||||||
Class A | 10,384 | 82 | ||||||
Class C | 10,323 | 81 | ||||||
Class I | 291,131 | 2,294 | ||||||
| Global Infrastructure Fund | ||||||||
Class I | 1,199,102 | |||||||
| Global Real Estate Securities Fund | ||||||||
Class I | 286,002 | 7,542 | ||||||
| International Equity Fund | ||||||||
Class A | 9,872 | 97 | ||||||
Class C | 9,922 | 95 | ||||||
Class I | 79,565 | 778 | ||||||
| International Real Estate Securities Fund | ||||||||
Class A | 311,738 | |||||||
Class I | 1,160,713 | 7,707 | ||||||
| International Small-Cap Fund | ||||||||
Class R6 | 8,227 | 90 | ||||||
| International Wealth Masters Fund | ||||||||
Class A | 10,000 | 95 | ||||||
Class C | 10,000 | 95 | ||||||
Class I | 480,000 | |||||||
| H. | Investments in Affiliates |
A summary of the Emerging Markets Debt Fund’s total long-term and short-term purchases and sales of affiliated underlying funds during the period ended September 30, 2015, is as follows:
| Value, beginning of period | Purchases | Sales Proceeds | Value, end of period | Dividend Income | Distributions of Realized Gains | |||||||||||||||||||
Virtus Credit Opportunities Fund | $ | — | $ | 148 | $ | — | $ | 144 | $ | 1 | $ | — | ||||||||||||
The Emerging Markets Debt Fund does not invest in the underlying fund for the purpose of exercising management or control; however, investments made by the Fund within each of its principal investment strategies may represent a significant portion of an underlying fund’s net assets. At September 30, 2015, the Fund was the owner of record of approximately 0.15% of Virtus Credit Opportunities Fund.
83
Table of Contents
VIRTUS OPPORTUNITIES TRUST
NOTES TO FINANCIAL STATEMENTS (Continued)
SEPTEMBER 30, 2015
| Note | 5. Purchases and Sales of Securities |
($ reported in thousands)
Purchases and sales of securities (excluding U.S. Government and agency securities, forward currency contracts, futures and short-term securities) during the period ended September 30, 2015, were as follows:
| Purchases | Sales | |||||||
Emerging Markets Debt Fund | $ | 13,240 | $ | 16,166 | ||||
Emerging Markets Equity Income Fund | 48,439 | 70,660 | ||||||
Emerging Markets Small-Cap Fund | 3,250 | 1,517 | ||||||
Global Infrastructure Fund | 77,818 | 46,140 | ||||||
Global Opportunities Fund | 70,399 | 53,800 | ||||||
Global Real Estate Securities Fund | 42,675 | 19,550 | ||||||
Greater European Opportunities Fund | 9,883 | 6,626 | ||||||
International Equity Fund | 8,133 | 10,021 | ||||||
International Real Estate Securities Fund | 11,417 | 11,313 | ||||||
International Small-Cap Fund | 34,099 | 29,568 | ||||||
International Wealth Masters Fund | 6,613 | 1,507 | ||||||
There were no purchases or sales of long-term U.S. Government and agency securities for the Funds during the period ended September 30, 2015.
| Note | 6. Capital Share Transactions |
(reported in thousands)
Transactions in shares of capital stock, during the periods ended as indicated below, were as follows:
| Emerging Markets Debt Fund | Emerging Markets Equity Income Fund | |||||||||||||||||||||||||||||||
| Year Ended September 30, 2015 | Year Ended September 30, 2014 | Year Ended September 30, 2015 | Year Ended September 30, 2014 | |||||||||||||||||||||||||||||
| SHARES | AMOUNT | SHARES | AMOUNT | SHARES | AMOUNT | SHARES | AMOUNT | |||||||||||||||||||||||||
| Class A | ||||||||||||||||||||||||||||||||
| Sale of shares | 24 | $ | 221 | 103 | $ | 997 | 29 | $ | 291 | 64 | $ | 683 | ||||||||||||||||||||
| Reinvestment of distributions | 4 | 34 | 10 | 94 | 3 | 27 | 2 | 18 | ||||||||||||||||||||||||
| Shares repurchased | (45 | ) | (414 | ) | (350 | ) | (3,390 | ) | (59 | ) | (589 | ) | (29 | ) | (311 | ) | ||||||||||||||||
|
|
|
|
|
|
|
|
|
|
|
|
|
|
|
| |||||||||||||||||
| Net Increase / (Decrease) | (17 | ) | $ | (159 | ) | (237 | ) | $ | (2,299 | ) | (27 | ) | $ | (271 | ) | 37 | $ | 390 | ||||||||||||||
|
|
|
|
|
|
|
|
|
|
|
|
|
|
|
| |||||||||||||||||
| Class C | ||||||||||||||||||||||||||||||||
| Sale of shares | 44 | $ | 408 | 48 | $ | 471 | 26 | $ | 248 | 40 | $ | 408 | ||||||||||||||||||||
| Reinvestment of distributions | 3 | 26 | 2 | 19 | 1 | 15 | 1 | 6 | ||||||||||||||||||||||||
| Shares repurchased | (62 | ) | (571 | ) | (8 | ) | (80 | ) | (26 | ) | (253 | ) | (4 | ) | (41 | ) | ||||||||||||||||
|
|
|
|
|
|
|
|
|
|
|
|
|
|
|
| |||||||||||||||||
| Net Increase / (Decrease) | (15 | ) | $ | (137 | ) | 42 | $ | 410 | 1 | $ | 10 | 37 | $ | 373 | ||||||||||||||||||
|
|
|
|
|
|
|
|
|
|
|
|
|
|
|
| |||||||||||||||||
| Class I | ||||||||||||||||||||||||||||||||
| Sale of shares | 144 | $ | 1,329 | 505 | $ | 4,980 | 1,722 | $ | 16,430 | 9,101 | $ | 93,703 | ||||||||||||||||||||
| Reinvestment of distributions | 143 | 1,307 | 143 | 1,378 | 34 | 343 | 11 | 116 | ||||||||||||||||||||||||
| Shares repurchased | (574 | ) | (5,295 | ) | (17 | ) | (168 | ) | (4,333 | ) | (41,211 | ) | (2,286 | ) | (23,047 | ) | ||||||||||||||||
|
|
|
|
|
|
|
|
|
|
|
|
|
|
|
| |||||||||||||||||
| Net Increase / (Decrease) | (287 | ) | $ | (2,659 | ) | 631 | $ | 6,190 | (2,577 | ) | $ | (24,438 | ) | 6,826 | $ | 70,772 | ||||||||||||||||
|
|
|
|
|
|
|
|
|
|
|
|
|
|
|
| |||||||||||||||||
84
Table of Contents
VIRTUS OPPORTUNITIES TRUST
NOTES TO FINANCIAL STATEMENTS (Continued)
SEPTEMBER 30, 2015
| Emerging Markets Small-Cap Fund | Global Infrastructure Fund | |||||||||||||||||||||||||||||||
| Year Ended September 30, 2015 | From Inception December 17, 2013 to September 30, 2014 | Year Ended September 30, 2015 | Year Ended September 30, 2014 | |||||||||||||||||||||||||||||
| SHARES | AMOUNT | SHARES | AMOUNT | SHARES | AMOUNT | SHARES | AMOUNT | |||||||||||||||||||||||||
| Class A | ||||||||||||||||||||||||||||||||
| Sale of shares | 25 | $ | 240 | 22 | $ | 226 | 2,224 | $ | 33,956 | 1,305 | $ | 19,911 | ||||||||||||||||||||
| Reinvestment of distributions | 1 | 8 | — | (1) | — | (2) | 153 | 2,277 | 150 | 2,293 | ||||||||||||||||||||||
| Shares repurchased | (5 | ) | (38 | ) | (1 | ) | (11 | ) | (1,863 | ) | (27,573 | ) | (1,338 | ) | (20,296 | ) | ||||||||||||||||
|
|
|
|
|
|
|
|
|
|
|
|
|
|
|
| |||||||||||||||||
| Net Increase / (Decrease) | 21 | $ | 210 | 21 | $ | 215 | 514 | $ | 8,660 | 117 | $ | 1,908 | ||||||||||||||||||||
|
|
|
|
|
|
|
|
|
|
|
|
|
|
|
| |||||||||||||||||
| Class C | ||||||||||||||||||||||||||||||||
| Sale of shares | — | (1) | $ | 4 | 16 | $ | 155 | 2,414 | $ | 36,729 | 590 | $ | 9,117 | |||||||||||||||||||
| Reinvestment of distributions | 1 | 4 | — | (1) | — | (2) | 62 | 917 | 40 | 620 | ||||||||||||||||||||||
| Shares repurchased | — | — | — | — | (1,168 | ) | (17,261 | ) | (206 | ) | (3,138 | ) | ||||||||||||||||||||
|
|
|
|
|
|
|
|
|
|
|
|
|
|
|
| |||||||||||||||||
| Net Increase / (Decrease) | 1 | $ | 8 | 16 | $ | 155 | 1,308 | $ | 20,385 | 424 | $ | 6,599 | ||||||||||||||||||||
|
|
|
|
|
|
|
|
|
|
|
|
|
|
|
| |||||||||||||||||
| Class I | ||||||||||||||||||||||||||||||||
| Sale of shares | 274 | $ | 2,666 | 336 | $ | 3,387 | 1,858 | $ | 28,316 | 1,142 | $ | 17,698 | ||||||||||||||||||||
| Reinvestment of distributions | 17 | 161 | 1 | 7 | 135 | 2,016 | 164 | 2,501 | ||||||||||||||||||||||||
| Shares repurchased | (136 | ) | (1,257 | ) | — | — | (1,897 | ) | (28,258 | ) | (2,750 | ) | (41,980 | ) | ||||||||||||||||||
|
|
|
|
|
|
|
|
|
|
|
|
|
|
|
| |||||||||||||||||
| Net Increase / (Decrease) | 155 | $ | 1,570 | 337 | $ | 3,394 | 96 | $ | 2,074 | (1,444 | ) | $ | (21,781 | ) | ||||||||||||||||||
|
|
|
|
|
|
|
|
|
|
|
|
|
|
|
| |||||||||||||||||
| Global Opportunities Fund | Global Real Estate Securities Fund | |||||||||||||||||||||||||||||||
| Year Ended September 30, 2015 | Year Ended September 30, 2014 | Year Ended September 30, 2015 | Year Ended September 30, 2014 | |||||||||||||||||||||||||||||
| SHARES | AMOUNT | SHARES | AMOUNT | SHARES | AMOUNT | SHARES | AMOUNT | |||||||||||||||||||||||||
| Class A | ||||||||||||||||||||||||||||||||
| Sale of shares | 2,304 | $ | 28,851 | 572 | $ | 6,675 | 1,115 | $ | 30,347 | 500 | $ | 12,687 | ||||||||||||||||||||
| Reinvestment of distributions | 34 | 423 | 40 | 467 | 25 | 689 | 15 | 333 | ||||||||||||||||||||||||
| Shares repurchased | (1,625 | ) | (20,664 | ) | (1,282 | ) | (15,224 | ) | (608 | ) | (16,436 | ) | (323 | ) | (8,052 | ) | ||||||||||||||||
|
|
|
|
|
|
|
|
|
|
|
|
|
|
|
| |||||||||||||||||
| Net Increase / (Decrease) | 713 | $ | 8,610 | (670 | ) | $ | (8,082 | ) | 532 | $ | 14,600 | 192 | $ | 4,968 | ||||||||||||||||||
|
|
|
|
|
|
|
|
|
|
|
|
|
|
|
| |||||||||||||||||
| Class B | ||||||||||||||||||||||||||||||||
| Sale of shares | — | $ | — | 5 | $ | 52 | — | $ | — | — | $ | — | ||||||||||||||||||||
| Reinvestment of distributions | — | (1) | 1 | — | — | — | — | — | — | |||||||||||||||||||||||
| Shares repurchased | (17 | ) | (192 | ) | (25 | ) | (265 | ) | — | — | — | — | ||||||||||||||||||||
|
|
|
|
|
|
|
|
|
|
|
|
|
|
|
| |||||||||||||||||
| Net Increase / (Decrease) | (17 | ) | $ | (191 | ) | (20 | ) | $ | (213 | ) | — | $ | — | — | $ | — | ||||||||||||||||
|
|
|
|
|
|
|
|
|
|
|
|
|
|
|
| |||||||||||||||||
| Class C | ||||||||||||||||||||||||||||||||
| Sale of shares | 1,293 | $ | 14,518 | 87 | $ | 904 | 188 | $ | 5,085 | 115 | $ | 2,906 | ||||||||||||||||||||
| Reinvestment of distributions | 1 | 6 | — | (1) | 2 | 5 | 134 | 2 | 52 | |||||||||||||||||||||||
| Shares repurchased | (280 | ) | (3,149 | ) | (67 | ) | (693 | ) | (102 | ) | (2,710 | ) | (37 | ) | (885 | ) | ||||||||||||||||
|
|
|
|
|
|
|
|
|
|
|
|
|
|
|
| |||||||||||||||||
| Net Increase / (Decrease) | 1,014 | $ | 11,375 | 20 | $ | 213 | 91 | $ | 2,509 | 80 | $ | 2,073 | ||||||||||||||||||||
|
|
|
|
|
|
|
|
|
|
|
|
|
|
|
| |||||||||||||||||
| Class I | ||||||||||||||||||||||||||||||||
| Sale of shares | 650 | $ | 8,210 | 171 | $ | 2,037 | 734 | $ | 20,228 | 467 | $ | 11,814 | ||||||||||||||||||||
| Reinvestment of distributions | 3 | 43 | 22 | 252 | 33 | 912 | 27 | 609 | ||||||||||||||||||||||||
| Shares repurchased | (361 | ) | (4,581 | ) | (60 | ) | (695 | ) | (594 | ) | (16,107 | ) | (517 | ) | (12,655 | ) | ||||||||||||||||
|
|
|
|
|
|
|
|
|
|
|
|
|
|
|
| |||||||||||||||||
| Net Increase / (Decrease) | 292 | $ | 3,672 | 133 | $ | 1,594 | 173 | $ | 5,033 | (23 | ) | $ | (232 | ) | ||||||||||||||||||
|
|
|
|
|
|
|
|
|
|
|
|
|
|
|
| |||||||||||||||||
| (1) | Amount is less than 500. |
| (2) | Amount is less than $500. |
85
Table of Contents
VIRTUS OPPORTUNITIES TRUST
NOTES TO FINANCIAL STATEMENTS (Continued)
SEPTEMBER 30, 2015
| Greater European Opportunities Fund | International Equity Fund | |||||||||||||||||||||||||||||||
| Year Ended September 30, 2015 | Year Ended September 30, 2014 | Year Ended September 30, 2015 | Year Ended September 30, 2014 | |||||||||||||||||||||||||||||
| SHARES | AMOUNT | SHARES | AMOUNT | SHARES | AMOUNT | SHARES | AMOUNT | |||||||||||||||||||||||||
| Class A | ||||||||||||||||||||||||||||||||
| Sale of shares | 420 | $ | 6,463 | 701 | $ | 11,317 | 287 | $ | 3,013 | 416 | $ | 4,580 | ||||||||||||||||||||
| Reinvestment of distributions | 16 | 236 | 24 | 374 | 3 | 30 | 9 | 94 | ||||||||||||||||||||||||
| Shares repurchased | (390 | ) | (5,967 | ) | (743 | ) | (11,774 | ) | (453 | ) | (4,695 | ) | (82 | ) | (904 | ) | ||||||||||||||||
|
|
|
|
|
|
|
|
|
|
|
|
|
|
|
| |||||||||||||||||
| Net Increase / (Decrease) | 46 | $ | 732 | (18 | ) | $ | (83 | ) | (163 | ) | $ | (1,652 | ) | 343 | $ | 3,770 | ||||||||||||||||
|
|
|
|
|
|
|
|
|
|
|
|
|
|
|
| |||||||||||||||||
| Class C | ||||||||||||||||||||||||||||||||
| Sale of shares | 64 | $ | 995 | 59 | $ | 935 | 122 | $ | 1,322 | 67 | $ | 724 | ||||||||||||||||||||
| Reinvestment of distributions | 1 | 13 | 2 | 25 | — | (1) | 1 | 1 | 9 | |||||||||||||||||||||||
| Shares repurchased | (35 | ) | (536 | ) | (25 | ) | (384 | ) | (21 | ) | (227 | ) | (4 | ) | (47 | ) | ||||||||||||||||
|
|
|
|
|
|
|
|
|
|
|
|
|
|
|
| |||||||||||||||||
| Net Increase / (Decrease) | 30 | $ | 472 | 36 | $ | 576 | 101 | $ | 1,096 | 64 | $ | 686 | ||||||||||||||||||||
|
|
|
|
|
|
|
|
|
|
|
|
|
|
|
| |||||||||||||||||
| Class I | ||||||||||||||||||||||||||||||||
| Sale of shares | 415 | $ | 6,216 | 141 | $ | 2,287 | 178 | $ | 1,967 | 456 | $ | 5,025 | ||||||||||||||||||||
| Reinvestment of distributions | 3 | 46 | 2 | 36 | 5 | 53 | 8 | 83 | ||||||||||||||||||||||||
| Shares repurchased | (220 | ) | (3,420 | ) | (85 | ) | (1,364 | ) | (333 | ) | (3,549 | ) | (81 | ) | (898 | ) | ||||||||||||||||
|
|
|
|
|
|
|
|
|
|
|
|
|
|
|
| |||||||||||||||||
| Net Increase / (Decrease) | 198 | $ | 2,842 | 58 | $ | 959 | (150 | ) | $ | (1,529 | ) | 383 | $ | 4,210 | ||||||||||||||||||
|
|
|
|
|
|
|
|
|
|
|
|
|
|
|
| |||||||||||||||||
| International Real Estate Securities Fund | International Small-Cap Fund | |||||||||||||||||||||||||||||||
| Year Ended September 30, 2015 | Year Ended September 30, 2014 | Year Ended September 30, 2015 | Year Ended September 30, 2014 | |||||||||||||||||||||||||||||
| SHARES | AMOUNT | SHARES | AMOUNT | SHARES | AMOUNT | SHARES | AMOUNT | |||||||||||||||||||||||||
| Class A | ||||||||||||||||||||||||||||||||
| Sale of shares | 522 | $ | 3,606 | 601 | $ | 4,140 | 105 | $ | 1,306 | 307 | $ | 4,315 | ||||||||||||||||||||
| Reinvestment of distributions | 116 | 773 | 29 | 186 | 14 | 161 | 4 | 52 | ||||||||||||||||||||||||
| Shares repurchased | (367 | ) | (2,507 | ) | (577 | ) | (3,899 | ) | (123 | ) | (1,574 | ) | (161 | ) | (2,308 | ) | ||||||||||||||||
|
|
|
|
|
|
|
|
|
|
|
|
|
|
|
| |||||||||||||||||
| Net Increase / (Decrease) | 271 | $ | 1,872 | 53 | $ | 427 | (4 | ) | $ | (107 | ) | 150 | $ | 2,059 | ||||||||||||||||||
|
|
|
|
|
|
|
|
|
|
|
|
|
|
|
| |||||||||||||||||
| Class C | ||||||||||||||||||||||||||||||||
| Sale of shares | 140 | $ | 982 | 140 | $ | 986 | 71 | $ | 884 | 70 | $ | 958 | ||||||||||||||||||||
| Reinvestment of distributions | 17 | 114 | 4 | 25 | 9 | 100 | 2 | 23 | ||||||||||||||||||||||||
| Shares repurchased | (185 | ) | (1,278 | ) | (69 | ) | (486 | ) | (31 | ) | (372 | ) | (13 | ) | (179 | ) | ||||||||||||||||
|
|
|
|
|
|
|
|
|
|
|
|
|
|
|
| |||||||||||||||||
| Net Increase / (Decrease) | (28 | ) | $ | (182 | ) | 75 | $ | 525 | 49 | $ | 612 | 59 | $ | 802 | ||||||||||||||||||
|
|
|
|
|
|
|
|
|
|
|
|
|
|
|
| |||||||||||||||||
| Class I | ||||||||||||||||||||||||||||||||
| Sale of shares | 1,960 | $ | 13,578 | 1,686 | $ | 11,674 | 2,141 | $ | 26,540 | 2,604 | $ | 35,793 | ||||||||||||||||||||
| Reinvestment of distributions | 270 | 1,808 | 107 | 677 | 317 | 3,641 | 71 | 976 | ||||||||||||||||||||||||
| Shares repurchased | (2,548 | ) | (17,494 | ) | (2,245 | ) | (15,445 | ) | (2,129 | ) | (25,756 | ) | (653 | ) | (9,360 | ) | ||||||||||||||||
|
|
|
|
|
|
|
|
|
|
|
|
|
|
|
| |||||||||||||||||
| Net Increase / (Decrease) | (318 | ) | $ | (2,108 | ) | (452 | ) | $ | (3,094 | ) | 329 | $ | 4,425 | 2,022 | $ | 27,409 | ||||||||||||||||
|
|
|
|
|
|
|
|
|
|
|
|
|
|
|
| |||||||||||||||||
| Class R6(3) | ||||||||||||||||||||||||||||||||
| Sale of shares | — | $ | — | — | $ | — | 7 | $ | 100 | — | $ | — | ||||||||||||||||||||
| Reinvestment of distributions | — | — | — | — | 1 | 9 | — | — | ||||||||||||||||||||||||
| Shares repurchased | — | — | — | — | — | (1) | — | (2) | — | — | ||||||||||||||||||||||
|
|
|
|
|
|
|
|
|
|
|
|
|
|
|
| |||||||||||||||||
| Net Increase / (Decrease) | — | $ | — | — | $ | — | 8 | $ | 109 | — | $ | — | ||||||||||||||||||||
|
|
|
|
|
|
|
|
|
|
|
|
|
|
|
| |||||||||||||||||
| (1) | Amount is less than 500. |
| (2) | Amount is less than $500. |
| (3) | From Inception date November 12, 2014. |
86
Table of Contents
VIRTUS OPPORTUNITIES TRUST
NOTES TO FINANCIAL STATEMENTS (Continued)
SEPTEMBER 30, 2015
| International Wealth Masters Fund | ||||||||||||||||||||
| From Inception November 17, 2014 to September 30, 2015 | ||||||||||||||||||||
| SHARES | AMOUNT | |||||||||||||||||||
| Class A | ||||||||||||||||||||
| Sale of shares | 14 | $ | 142 | |||||||||||||||||
| Reinvestment of distributions | — | — | ||||||||||||||||||
| Shares repurchased | (1 | ) | (7 | ) | ||||||||||||||||
|
|
|
| |||||||||||||||||
| Net Increase / (Decrease) | 13 | $ | 135 | |||||||||||||||||
|
|
|
| |||||||||||||||||
| Class C | ||||||||||||||||||||
| Sale of shares | 15 | $ | 149 | |||||||||||||||||
| Reinvestment of distributions | — | — | ||||||||||||||||||
| Shares repurchased | (3 | ) | (25 | ) | ||||||||||||||||
|
|
|
| |||||||||||||||||
| Net Increase / (Decrease) | 12 | $ | 124 | |||||||||||||||||
|
|
|
| |||||||||||||||||
| Class I | ||||||||||||||||||||
| Sale of shares | 482 | $ | 4,826 | |||||||||||||||||
| Reinvestment of distributions | — | — | ||||||||||||||||||
| Shares repurchased | — | (1) | (1 | ) | ||||||||||||||||
|
|
|
| |||||||||||||||||
| Net Increase / (Decrease) | 482 | $ | 4,825 | |||||||||||||||||
|
|
|
| |||||||||||||||||
| (1) | Amount is less than 500. |
| Note | 7. 10% Shareholders |
As of September 30, 2015, certain Funds had individual shareholder account(s) and/or omnibus shareholder account(s) (comprised of a group of individual shareholders), which individually amounted to more than 10% of the total shares outstanding of each such Fund as detailed below:
| % of Shares Outstanding | Number of Accounts | |||||||
Emerging Markets Debt Fund | 92 | % | 1 | |||||
Emerging Markets Equity Income Fund | 11 | 1 | ||||||
Emerging Markets Small-Cap Fund | 84 | 2 | * | |||||
Global Infrastructure Fund# | 22 | 2 | * | |||||
Global Opportunities Fund | 20 | 1 | ||||||
Global Real Estate Securities Fund# | 31 | 1 | ||||||
Greater European Opportunities Fund | 53 | 3 | ||||||
International Equity Fund | 27 | 1 | ||||||
International Real Estate Securities Fund# | 50 | 3 | * | |||||
| International Small-Cap Fund | 78 | 1 | ||||||
| * | Includes affiliated shareholder accounts. |
| # | The Fund is owned by Virtus Alternatives Diversifier Fund. Virtus Alternatives Diversifier Fund does not invest in the underlying Funds for the purpose of exercising management or control; however, investments made may represent a significant portion of an underlying Fund’s net assets. At September 30, 2015, Virtus Alternatives Diversifier Fund was the owner of record of approximately 19% of the International Real Estate Securities Fund, 10% of the Global Infrastructure Fund, and 10% of the Global Real Estate Securities Fund. |
| Note | 8. Credit Risk and Asset Concentration |
In countries with limited or developing markets, investments may present greater risks than in more developed markets and the prices of such investments may be volatile. The consequences of political, social or economic changes in these markets may have disruptive effects on the market prices of these investments and the income they generate, as well as a Fund’s ability to repatriate such amounts.
High-yield/high-risk securities typically entail greater price volatility and/or principal and interest rate risk. There is a greater chance that an issuer will not be able to make principal and interest payments on time. Analysis of the creditworthiness of issuers of high-yield/high-risk securities may be complex, and as a result, it may be more difficult for the Adviser and/or subadviser to accurately predict risk.
Certain Funds may invest a high percentage of their assets in specific sectors of the market in the pursuit of their investment objectives. Fluctuations in these sectors of concentration may have a greater impact on a Fund, positive or negative, than if a Fund did not concentrate its investments in such sectors.
87
Table of Contents
VIRTUS OPPORTUNITIES TRUST
NOTES TO FINANCIAL STATEMENTS (Continued)
SEPTEMBER 30, 2015
At September 30, 2015, the following Funds held securities issued by various companies in specific sectors as detailed below:
Fund | Sector | Percentage of Total Investments | ||||
| Emerging Markets Debt Fund | Financials | 28 | % | |||
| Emerging Markets Equity Income Fund | Financials | 31 | % | |||
| Global Infrastructure Fund | Utilities | 37 | % | |||
| Global Opportunities Fund | Consumer Staples | 31 | % | |||
| Global Real Estate Fund | Financials | 38 | % | |||
| Greater European Opportunities Fund | Consumer Staples | 38 | % | |||
| International Real Estate Securities Fund | Financials | 31 | % | |||
| International Real Estate Securities Fund | Retail REITs | 30 | % | |||
| International Wealth Masters Fund | Consumer Discretionary | 30 | % | |||
| Note | 9. Indemnifications |
Under the Trust’s organizational documents, its Trustees and officers are indemnified against certain liabilities arising out of the performance of their duties to the Funds. Each Trustee has entered into an indemnification agreement with the Trust. In addition, in the normal course of business, the Funds enter into contracts that provide a variety of indemnifications to other parties. The Funds’ maximum exposure under these arrangements is unknown as this would involve future claims that may be made against the Funds and that have not occurred. However, the Funds have not had prior claims or losses pursuant to these arrangements and expect the risk of loss to be remote.
| Note | 10. Federal Income Tax Information |
($ reported in thousands)
At September 30, 2015, federal tax cost and aggregate gross unrealized appreciation (depreciation) of securities held by the Funds were as follows:
| Federal Tax Cost | Unrealized Appreciation | Unrealized (Depreciation) | Net Unrealized Appreciation (Depreciation) | |||||||||||||
Emerging Markets Debt Fund | $ | 28,961 | $ | 305 | $ | (3,214 | ) | $ | (2,909 | ) | ||||||
Emerging Markets Equity Income Fund | 51,206 | 1,646 | (9,223 | ) | (7,577 | ) | ||||||||||
Emerging Markets Small-Cap Fund | 5,499 | 87 | (1,333 | ) | (1,246 | ) | ||||||||||
Global Infrastructure Fund | 155,036 | 11,984 | (13,502 | ) | (1,518 | ) | ||||||||||
Global Opportunities Fund | 115,772 | 29,721 | (2,451 | ) | 27,270 | |||||||||||
Global Real Estate Securities Fund | 71,946 | 8,581 | (3,124 | ) | 5,457 | |||||||||||
Greater European Opportunities Fund | 18,417 | 2,696 | (456 | ) | 2,240 | |||||||||||
International Equity Fund | 8,657 | 502 | (473 | ) | 29 | |||||||||||
International Real Estate Securities Fund | 35,818 | 4,952 | (1,156 | ) | 3,796 | |||||||||||
International Small-Cap Fund | 52,645 | 1,545 | (10,588 | ) | (9,043 | ) | ||||||||||
International Wealth Masters Fund | 5,284 | 280 | (663 | ) | (383 | ) | ||||||||||
Certain Funds have capital loss carryovers available to offset future realized capital gains, through the indicated expiration dates shown below:
| 2018 | 2019 | No Expiration (Short-Term) | No Expiration (Long-Term) | Total | ||||||||||||||||
Emerging Markets Debt Fund | $ | — | $ | — | $ | 88 | $ | 450 | $ | 538 | ||||||||||
Emerging Markets Equity Income Fund | — | — | 230 | 13 | 243 | |||||||||||||||
Global Opportunities Fund | 422 | — | — | — | 422 | |||||||||||||||
Greater European Opportunities Fund | — | — | 5 | — | 5 | |||||||||||||||
International Equity Fund | — | — | 223 | — | 223 | |||||||||||||||
International Real Estate Securities Fund | 3,884 | 884 | 1,776 | 1,152 | 7,696 | |||||||||||||||
The Trust may not realize the benefit of these losses to the extent each Fund does not realize gains on investments prior to the expiration of the capital loss carryovers.
Under the Regulated Investment Company Modernization Act of 2010 (the “Act”), net capital losses recognized for tax years beginning after December 22, 2010, may be carried forward indefinitely, and their character is retained as short-term and/or long-term losses. Previously, net capital losses were carried forward for eight years and treated as short-term losses. As a transition rule, the Act requires that post-enactment net capital losses be used before pre-enactment net capital losses.
For the period ended September 30, 2015, the following Funds utilized losses deferred in prior years against current year capital gains:
Global Opportunities Fund | $ | 1,705 | ||
International Real Estate Securities Fund | 306 |
88
Table of Contents
VIRTUS OPPORTUNITIES TRUST
NOTES TO FINANCIAL STATEMENTS (Continued)
SEPTEMBER 30, 2015
Capital losses realized after October 31, and certain late year ordinary losses may be deferred and treated as occurring on the first day of the following fiscal year. For the fiscal period ended September 30, 2015, the Funds deferred and recognized losses as follows:
| Late Year Ordinary Losses Deferred | Capital Loss Deferred | Capital Loss Recognized | ||||||||||
Emerging Markets Debt Fund | $ | — | $ | 1,395 | $ | 385 | ||||||
Emerging Markets Equity Income Fund | — | 5,981 | — | |||||||||
Emerging Markets Small-Cap Fund | — | 52 | — | |||||||||
Global Opportunities Fund | — | 1,262 | — | |||||||||
Greater European Opportunities Fund | — | 129 | — | |||||||||
International Equity Fund | 8 | 676 | 120 | |||||||||
International Real Estate Securities Fund | — | 88 | 1,119 | |||||||||
The components of distributable earnings on a tax basis (excluding unrealized appreciation (depreciation) which are disclosed above) consist of the following:
| Undistributed Ordinary Income | Undistributed Long-Term Capital Gains | |||||||
Emerging Markets Equity Income Fund | $ | 869 | $ | — | ||||
Emerging Markets Small-Cap Fund | 77 | — | ||||||
Global Infrastructure Fund | 152 | 7,490 | ||||||
Global Opportunities Fund | 397 | — | ||||||
Global Real Estate Securities Fund | 1,011 | 733 | ||||||
Greater European Opportunities Fund | 171 | — | ||||||
International Real Estate Securities Fund | 15 | — | ||||||
International Small-Cap Fund | 906 | 477 | ||||||
International Wealth Masters Fund | 142 | — | ||||||
The tax character of dividends and distributions paid during the years ended September 30, 2015 and 2014 was as follows:
| 2015 | 2014 | |||||||||||||||||||||||||||||||
| Ordinary Income | Long-Term Capital Gains | Return of Capital | Total | Ordinary Income | Long-Term Capital Gains | Return of Capital | Total | |||||||||||||||||||||||||
Virtus Emerging Markets Debt Fund | $ | 1,132 | $ | — | $ | 239 | $ | 1,371 | $ | 1,461 | $ | — | $ | 47 | $ | 1,508 | ||||||||||||||||
Virtus Emerging Markets Equity Income Fund | 2,175 | — | — | 2,175 | 612 | — | — | 612 | ||||||||||||||||||||||||
Virtus Emerging Markets Small-Cap Fund | 174 | — | — | 174 | 7 | — | — | 7 | ||||||||||||||||||||||||
Virtus Global Infrastructure Fund | 4,398 | 1,425 | — | 5,823 | 6,155 | — | — | 6,155 | ||||||||||||||||||||||||
Virtus Global Opportunities Fund | 698 | — | — | 698 | 828 | — | — | 828 | ||||||||||||||||||||||||
Virtus Global Real Estate Securities Fund | 1,605 | 164 | — | 1,769 | 759 | 249 | — | 1,008 | ||||||||||||||||||||||||
Virtus Greater European Opportunities Fund | 107 | 196 | — | 303 | 308 | 153 | — | 461 | ||||||||||||||||||||||||
Virtus International Equity Fund | 85 | — | — | 85 | 202 | — | — | 202 | ||||||||||||||||||||||||
Virtus International Real Estate Securities Fund | 2,732 | — | — | 2,732 | 911 | — | — | 911 | ||||||||||||||||||||||||
Virtus International Small-Cap Fund | 2,889 | 1,127 | — | 4,016 | 1,207 | — | — | 1,207 | ||||||||||||||||||||||||
Virtus International Wealth Masters Fund | — | — | — | — | — | — | — | — | ||||||||||||||||||||||||
The differences between the book and tax basis components of distributable earnings relate principally to the timing of recognition of income and gains for federal income tax purposes. Short-term gain distributions reported in the Statements of Changes in Net Assets, if any, are reported as ordinary income for federal tax purposes. Distributions are determined on a tax basis and may differ from net investment income and realized capital gains for financial reporting purposes.
Certain funds have distributed more than its income and capital gains; therefore, a portion of the distribution is a taxable return of capital (“ROC”). The ROC amounts are reflected in the Statement of Changes and Financial Highlights.
89
Table of Contents
VIRTUS OPPORTUNITIES TRUST
NOTES TO FINANCIAL STATEMENTS (Continued)
SEPTEMBER 30, 2015
| Note | 11. Reclassifications of Capital Accounts |
($ reported in thousands)
For financial reporting purposes, book basis capital accounts are adjusted to reflect the tax character of permanent book/tax differences. Permanent reclassifications can arise from differing treatment of certain income and gain transactions, nondeductible current year net operating losses, expiring capital loss carryovers and investments in passive foreign investment companies. The reclassifications have no impact on the net assets or net asset value of the Funds. As of September 30, 2015, the Funds recorded reclassifications to increase (decrease) the accounts as listed below:
| Capital Paid in on Shares of Beneficial Interest | Undistributed Net Investment Income (Loss) | Accumulated Net Realized Gain (Loss) | ||||||||||
Emerging Markets Debt Fund | $ | — | $ | (351 | ) | $ | 351 | |||||
Emerging Markets Equity Income Fund | — | (1) | (83 | ) | 83 | |||||||
Emerging Markets Small-Cap Fund | — | (2 | ) | 2 | ||||||||
Global Infrastructure Fund | — | (15 | ) | 15 | ||||||||
Global Opportunities Fund | — | (41 | ) | 41 | ||||||||
Global Real Estate Securities Fund | — | (1) | (19 | ) | 19 | |||||||
Greater European Opportunities Fund | — | (1) | (22 | ) | 22 | |||||||
International Equity Fund | — | (1) | (15 | ) | 15 | |||||||
International Real Estate Securities Fund | — | (1) | (33 | ) | 33 | |||||||
International Small-Cap Fund | — | (1) | (10 | ) | 10 | |||||||
International Wealth Masters | — | (1) | 13 | (13 | ) | |||||||
| (1) | Amount is less than $500. |
| Note | 12. Borrowings |
($ reported in thousands)
On July 2, 2015, the Funds and other affiliated Funds entered into a $50,000 secured Line of Credit Agreement (the “Agreement”) with a commercial bank (the “Bank”) that allows the Funds to borrow cash from the Bank to manage large unexpected redemptions and trade fails, up to a limit of one-third or one-fifth of each Fund’s total net assets in accordance with the Agreement. Interest is charged at the higher of the LIBOR (London Interbank Offered Rate) or the Federal Funds rate plus an additional percentage rate on the amount borrowed. Commitment fees are charged on the undrawn balance. The Funds are individually, and not jointly, liable for their particular advances, if any, under the line of credit. The Bank has the ability to require repayment of outstanding borrowings under the Agreement upon certain circumstances such as an event of default.
For the period July 2, 2015 through September 30, 2015, the Emerging Markets Equity Income Fund made borrowings. The average daily borrowings under the Agreement and the daily weighted average interest rate were $118 and 1.20%, respectively. No other Funds made borrowings during the period and no Fund had any outstanding borrowings as of September 30, 2015.
| Note | 13. Illiquid and Restricted Securities |
Investments are generally considered illiquid if they cannot be disposed of within seven days in the ordinary course of business at the approximate amount at which such securities have been valued by a Fund. Additionally, the following information is also considered in determining liquidity: the frequency of trades and quotes for the investment, whether the investment is listed for trading on a recognized domestic exchange and/or whether two or more brokers are willing to purchase or sell the security at a comparable price, the extent of market making activity in the investment and the nature of the market for investment. Illiquid securities are footnoted as such at the end of each Fund’s Schedule of Investments, where applicable. However, a portion of such footnoted securities could be liquid where it is determined that some, though not all, of the position could be disposed of within seven days in the ordinary course of business at the approximate amount at which such securities have been valued by the applicable Fund.
Restricted securities are illiquid securities, as defined above, not registered under the Securities Act of 1933, as amended (the “1933 Act”). Generally, 144A securities are excluded from this category, except where defined as illiquid.
Each Fund will bear any costs, including those involved in registration under the 1933 Act, in connection with the disposition of such securities.
At September 30, 2015, the Funds did not hold any securities that were both illiquid and restricted.
| Note | 14. Regulatory Matters and Litigation |
From time to time, the Funds’ investment adviser and/or its affiliates and/or subadvisers may be involved in litigation and arbitration as well as examinations and investigations by various regulatory bodies, including the SEC, involving compliance with, among other things, securities laws, client investment guidelines, laws governing the activities of broker-dealers and other laws and regulations affecting their products and other activities. At this time, the Funds’ investment adviser believes that the outcomes of such matters are not likely, either individually or in the aggregate, to be material to these financial statements.
As part of an SEC non-public, confidential investigation of a matter entitled — In the Matter of F-Squared Investments Inc., the SEC staff informed the Funds’ investment adviser that it was inquiring into whether it had violated securities laws or regulations with respect to circumstances related to that matter. On November 16, 2015, without admitting or denying the SEC’s findings, the Funds’ investment adviser consented to the entry of an order providing that it cease and desist from committing or causing any violations and future violations of Sections 204, 206(2) and 206(4) of the Investment Advisers Act of 1940, as amended, and Rules 204-2, 206(4)-1, 206(4)-7 and 206(4)-8 thereunder, and Section 34(b) of the Investment Company Act of 1940, as amended; agreed to a censure; and paid $16.5 million, which included a civil money penalty of $2 million, disgorgement of $13.4 million and prejudgment interest of $1.1 million.
90
Table of Contents
VIRTUS OPPORTUNITIES TRUST
NOTES TO FINANCIAL STATEMENTS (Continued)
SEPTEMBER 30, 2015
On February 20, 2015, a putative class action complaint (In re Virtus Investment Partners, Inc. Securities Litigation; formerly styled as Tom Cummins v. Virtus Investment Partners Inc. et al) alleging violation of the federal securities laws was filed by an individual shareholder against Virtus and certain of its officers (the “defendants”) in the United States District Court for the Southern District of New York. On August 21, 2015, the lead plaintiff filed a Consolidated Class Action Complaint (the “Consolidated Complaint”) amending the originally filed complaint and adding the Trust as a defendant. The Consolidated Complaint was purportedly filed on behalf of all purchasers of Virtus common stock between January 25, 2013 and May 11, 2015 (the “Class Period”). The Consolidated Complaint alleges that during the Class Period, the defendants knowingly disseminated materially false and misleading statements and concealed material adverse facts relating to certain funds previously subadvised by F-Squared Investments, Inc. and/or its affiliates (“F-Squared”). The plaintiff seeks to recover unspecified damages. Virtus and its affiliates, including the Funds’ adviser, believe that the suit is without merit and intend to defend it vigorously. A motion to dismiss the Consolidated Complaint was filed on behalf of the defendants on October 21, 2015. The Trust believes that the risk of loss to the Funds as a result of this suit is remote. The adviser does not believe that the suit will have any impact on its ability to provide services to the Funds.
On May 8, 2015, a putative class action complaint (Mark Youngers v. Virtus Investment Partners, Inc. et al) alleging violations of certain provisions of the federal securities laws was filed in the United States District Court for the Central District of California. The complaint, which was purportedly filed on behalf of purchasers of certain Virtus Funds previously subadvised by F-Squared between May 8, 2010 and December 22, 2014, inclusive (the “Class Period”), alleges claims against Virtus, certain Virtus officers and affiliates (including the Funds’ investment adviser, Euclid Advisors LLC and VP Distributors, LLC), the trustees and certain officers of the Trust, and certain other parties (the “defendants”). The complaint alleges that during the Class Period the defendants knowingly disseminated materially false and misleading statements and concealed or omitted material facts necessary to make the statements made not misleading. On October 1, 2015, the plaintiff filed a First Amended Class Action Complaint which, among other things, added a derivative claim for breach of fiduciary duty on behalf of the Trust. On October 19, 2015, the Court entered an order transferring the action to the Southern District of New York. Virtus and its affiliates, including the Funds’ adviser, believe the plaintiff’s claims asserted in the complaint are frivolous and intend to defend them vigorously. The Trust believes that the risk of loss to the Funds as a result of this suit is remote. The adviser does not believe that the suit will have any impact on its ability to provide services to the Funds.
| Note | 15. Subsequent Events |
Management has evaluated the impact of all subsequent events on the Funds through the date the financial statements were issued, and has determined that there are no subsequent events requiring recognition or disclosure in these financial statements.
91
Table of Contents

REPORT OF INDEPENDENT REGISTERED PUBLIC ACCOUNTING FIRM
To the Board of Trustees of
Virtus Opportunities Trust and
Shareholders of the Funds, as defined:
In our opinion, the accompanying statements of assets and liabilities, including the schedules of investments, and the related statements of operations and of changes in net assets and the financial highlights present fairly, in all material respects, the financial position of Virtus Emerging Markets Debt Fund, Virtus Emerging Markets Equity Income Fund, Virtus Emerging Markets Small-Cap Fund, Virtus Global Infrastructure Fund, Virtus Global Opportunities Fund, Virtus Global Real Estate Securities Fund, Virtus Greater European Opportunities Fund, Virtus International Equity Fund, Virtus International Real Estate Securities Fund, Virtus International Small-Cap Fund and Virtus International Wealth Masters Fund, (constituting funds within Virtus Opportunities Trust, hereafter referred to as the “Funds”) at September 30, 2015, the results of each of their operations for the year or period then ended, the changes in each of their net assets and the financial highlights for each of the periods indicated, in conformity with accounting principles generally accepted in the United States of America. These financial statements and financial highlights (hereafter referred to as “financial statements”) are the responsibility of the Funds’ management. Our responsibility is to express an opinion on these financial statements based on our audits. We conducted our audits of these financial statements in accordance with the standards of the Public Company Accounting Oversight Board (United States). Those standards require that we plan and perform the audit to obtain reasonable assurance about whether the financial statements are free of material misstatement. An audit includes examining, on a test basis, evidence supporting the amounts and disclosures in the financial statements, assessing the accounting principles used and significant estimates made by management, and evaluating the overall financial statement presentation. We believe that our audits, which included confirmation of securities at September 30, 2015 by correspondence with the custodian and brokers, provide a reasonable basis for our opinion.
PricewaterhouseCoopers LLP
Philadelphia, Pennsylvania
November 20, 2015
92
Table of Contents
VIRTUS OPPORTUNITIES TRUST
SEPTEMBER 30, 2015
For the fiscal year ended September 30, 2015, the Funds make the following disclosures for federal income tax purposes. Below is listed the percentages, or the maximum amount allowable, of its ordinary income dividends (“QDI”) to qualify for the lower tax rates applicable to individual shareholders, and the percentage of ordinary income dividends earned by the Funds which qualifies for the dividends received deduction (“DRD”) for corporate shareholders. The actual percentage of QDI and DRD for the calendar year will be designated in year-end tax statements. The Funds designate the amounts below as long-term capital gains dividends (“LTCG”) taxable at a 20% rate, or lower depending on the shareholder’s income ($ reported in thousands). LTCG amounts, if subsequently different, will be designated in the next annual report.
| QDI | DRD | LTCG | ||||||||||
Emerging Markets Debt Fund | 0 | % | 0 | % | $ | — | ||||||
Emerging Markets Equity Income Fund | 91 | 0 | — | |||||||||
Emerging Markets Small-Cap Fund | 86 | 0 | — | |||||||||
Global Infrastructure Fund | 100 | 78 | 8,354 | |||||||||
Global Opportunities Fund | 100 | 100 | — | |||||||||
Global Real Estate Securities Fund | 42 | 0 | 769 | |||||||||
Greater European Opportunities Fund | 100 | 23 | — | |||||||||
International Equity Fund | 100 | 0 | — | |||||||||
International Real Estate Securities Fund | 100 | 0 | — | |||||||||
International Small-Cap Fund | 61 | 0 | 532 | |||||||||
International Wealth Masters | 65 | 0 | — | |||||||||
For the period ended September 30, 2015, certain Funds are disclosing the following information pursuant to notice requirements of Section 853(a) and 855(d) of the Internal Revenue Code, as amended, and the Treasury Regulations thereunder ($ reported in thousands).
| Foreign Source Income Recognized | Foreign Taxes Paid on Foreign Source Income | |||||||
Emerging Markets Equity Income Fund | $ | 2,866 | $ | 360 | ||||
Emerging Markets Small-Cap Fund | 173 | 21 | ||||||
Greater European Opportunities Fund | 484 | 33 | ||||||
International Equity Fund | 188 | 21 | ||||||
International Real Estate Securities Fund | 2,504 | 141 | ||||||
International Small-Cap Fund | 1,670 | 164 | ||||||
International Wealth Masters Fund | 120 | 10 | ||||||
93
Table of Contents
Information pertaining to the trustees and officers of the Trust as of September 30, 2015, is set forth below. The statement of additional information (SAI) includes additional information about the trustees and is available without charge, upon request, by calling (800) 243-1574. The address of each individual, unless otherwise noted, is 100 Pearl Street, Hartford, CT 06103-4506. There is no stated term of office for trustees of the Trust.
Independent Trustees
| Name, Year of Birth, Year Elected and Number of Funds Overseen | Principal Occupation(s) During Past 5 Years and Other Directorships Held by Trustee | |
McClellan, Hassell H. YOB: 1945 Elected: 2015 55 Portfolios | Retired. Professor (1984 to 2013), Wallace E. Carroll School of Management, Boston College; Trustee, Virtus Variable Insurance Trust (9 portfolios) (since 2008); Trustee (since 2015), Virtus Mutual Fund Complex (46 portfolios); Trustee, John Hancock Fund Complex (since 2000), John Hancock Funds (collectively, 234 portfolios); and Director (since 2010), Barnes Group, Inc. (diversified global components manufacturer and logistical services company). | |
McLoughlin, Philip YOB: 1946 Elected: 2006 69 Portfolios | Director (since 1991) and Chairman (since 2010), World Trust Fund (closed-end investment firm in Luxembourg); Director (since 1995), closed-end funds managed by Duff & Phelps Investment Management Co. (4 portfolios); Chairman (since 2002) and Trustee (since 1989), Virtus Mutual Fund Complex (46 portfolios); Chairman and Trustee (since 2003), Virtus Variable Insurance Trust (9 portfolios); Trustee/Director and Chairman (since 2011), Virtus Closed-End Funds (3 portfolios); Trustee and Chairman (since 2013), Virtus Alternative Solutions Trust (7 portfolios); Partner (2006 to 2010), Cross Pond Partners, LLC (investment management consultant); and Managing Director (2008 to 2010), SeaCap Partners, LLC (investment management). | |
McNamara, Geraldine M. YOB: 1951 Elected: 2006 59 Funds | Retired. Trustee (since 2001), Virtus Mutual Fund Complex (46 portfolios); and Director (since 2003), closed-end funds managed by Duff & Phelps Investment Management Co. (4 portfolios); and Trustee (since 2015), Virtus Variable Insurance Trust (9 portfolios) | |
Oates, James M. YOB: 1946 Elected: 2006 56 Funds | Managing Director (since 1994), Wydown Group (consulting firm). Trustee (since 1987), Virtus Mutual Fund Complex (46 portfolios); Director (since 1996), Stifel Financial; Director (1998 to 2014), Connecticut River Bancorp; Chairman and Director (1999 to 2014), Connecticut River Bank; Chairman (since 2000), Emerson Investment Management, Inc.; Director (2002 to 2014), New Hampshire Trust Company; Chairman and Trustee (since 2005), John Hancock Fund Complex (228 portfolios); Non-Executive Chairman (2007 to 2011), Hudson Castle Group, Inc. (formerly IBEX Capital Markets, Inc.) (financial services); Trustee/Director (since 2013), Virtus Closed-End Funds (3 portfolios); and Trustee (since 2013), Virtus Alternative Solutions Trust (7 portfolios). | |
Segerson, Richard E. YOB: 1948 Elected: 2006 46 Funds | Trustee (since 1983), Virtus Mutual Fund Complex (46 portfolios); and Managing Director (1998 to 2013), Northway Management Company. | |
Verdonck, Ferdinand L.J. YOB: 1942 Elected: 2006 46 Funds | Trustee (since 2002), Virtus Mutual Fund Complex (46 portfolios). | |
Interested Trustees
| Name, Year of Birth, Year Elected and Number of Funds Overseen | Principal Occupation(s) During Past 5 Years and Other Directorships Held by Trustee | |
Aylward, George R.* Trustee and President YOB: 1964 Elected: 2006 67 Funds | Director, President and Chief Executive Officer (since 2008), Virtus Investment Partners, Inc. and/or certain of its subsidiaries; various senior officer positions with Virtus affiliates (since 2005); Trustee (since 2006), Virtus Mutual Funds (46 portfolios); Chairman, President and Chief Executive Officer (since 2006), The Zweig Closed-End Funds (2 portfolios); Trustee (since 2012) and President (since 2010), Virtus Variable Insurance Trust (9 portfolios); Trustee and President (since 2011), Virtus Closed-End Funds (3 portfolios); Director (since 2013), Virtus Global Funds, PLC (2 portfolios); and Trustee (since 2013), Virtus Alternative Solutions Trust (7 portfolios). | |
94
Table of Contents
FUND MANAGEMENT TABLES (Continued)
Officers of the Trust Who Are Not Trustees
Name, Address and Year of Birth | Position(s) Held with Trust and Length of Time Served | Principal Occupation(s) During Past 5 Years | ||
Waltman, Francis G. YOB: 1962 | Executive Vice President (since 2013); Senior Vice President (2008-2013). | Virtus Investment Partners, Inc. and/or certain of its subsidiaries; various senior officer positions (since 2006) with Virtus affiliates; Executive Vice President (since 2013), Senior Vice President (2008 to 2013), Virtus Mutual Fund Complex; Executive Vice President (since 2013), Senior Vice President (2010 to 2013), Virtus Variable Insurance Trust; Executive Vice President (since 2013), Senior Vice President (2011 to 2013), Virtus Closed-End Funds; Director (since 2013), Virtus Global Funds PLC; and Executive Vice President (since 2013), Virtus Alternative Solutions Trust. | ||
Bradley, W. Patrick YOB: 1972 | Senior Vice President (since 2013); Vice President (2011 to 2013); Chief Financial Officer and Treasurer (since 2006). | Senior Vice President, Fund Services (since 2010), Virtus Investment Partners, Inc. and/or certain of its subsidiaries; various officer positions (since 2006) with Virtus affiliates; Senior Vice President (since 2013), Vice President (2011 to 2013), Chief Financial Officer and Treasurer (since 2004), Virtus Variable Insurance Trust; Senior Vice President (since 2013), Vice President (2011 to 2013), Chief Financial Officer and Treasurer (since 2006), Virtus Mutual Fund Complex; Senior Vice President (since 2013), Vice President (2012 to 2013) and Treasurer (Chief Financial Officer) (since 2007), The Zweig Closed-End Funds; Senior Vice President (since 2013), Vice President (2011 to 2013), Chief Financial Officer and Treasurer (since 2011), Virtus Closed-End Funds; Vice President and Assistant Treasurer (since 2011), Duff & Phelps Global Utility Income Fund Inc.; Director (since 2013), Virtus Global Funds, PLC; and Senior Vice President, Chief Financial Officer and Treasurer (since 2013), Virtus Alternative Solutions Trust. | ||
Carr, Kevin J. YOB: 1954 | Senior Vice President, since 2013; Vice President (2005-2013); Chief Legal Officer, Counsel and Secretary (since 2005). | Senior Vice President (since 2009), Vice President, Counsel and Secretary (2008 to 2009), Virtus Investment Partners, Inc. and/or certain of its subsidiaries; various senior officer positions (since 2005) with Virtus affiliates; Senior Vice President (since 2013), Vice President (2005 to 2013), Chief Legal Officer, Counsel and Secretary (since 2005), Virtus Mutual Fund Complex; Senior Vice President (2013 to 2014), Vice President (2012 to 2013) and Assistant Secretary (since 2012), Secretary and Chief Legal Officer (2005 to 2012), The Zweig Closed-End Funds; Assistant Secretary (since 2013), Vice President, Chief Legal Officer, Counsel and Secretary (2010 to 2013), Virtus Variable Insurance Trust; Vice President and Assistant Secretary (since 2011), Duff & Phelps Global Utility Income Fund Inc.; Senior Vice President and Assistant Secretary (2013 to 2014), Vice President and Assistant Secretary (2012 to 2013), Vice President, Chief Legal Officer, Counsel and Secretary (2011 to 2012), Virtus Closed-End Funds; and Assistant Secretary (since 2013), Virtus Alternative Solutions Trust. | ||
Engberg, Nancy J. YOB: 1956 | Vice President and Chief Compliance Officer since 2011. | Vice President (since 2008) and Chief Compliance Officer (2008 to 2011), Virtus Investment Partners, Inc. and/or certain of its subsidiaries; various officer positions (since 2003) with Virtus affiliates; Vice President and Chief Compliance Officer (since 2011), Virtus Mutual Fund Complex; Vice President (since 2010), Chief Compliance Officer (since 2011), Virtus Variable Insurance Trust; Vice President and Chief Compliance Officer (since 2011), Virtus Closed-End Funds; Vice President and Chief Compliance Officer (since 2012), The Zweig Closed-End Funds; and Vice President and Chief Compliance Officer (since 2013), Virtus Alternative Solutions Trust. | ||
95
Table of Contents
Virtus Emerging Markets Debt Fund, Virtus Emerging Markets Small-Cap Fund,
Virtus Emerging Markets Equity Income Fund, Virtus Global Opportunities Fund,
Virtus Global Real Estate Securities Fund, Virtus Greater European Opportunities Fund,
Virtus International Equity Fund, Virtus International Real Estate Securities Fund and
Virtus International Small-Cap Fund each a series of Virtus Opportunities Trust
Supplement dated September 1, 2015 to the Summary Prospectuses dated January 28, 2015,
as supplemented, and the Virtus Opportunities Trust Statutory Prospectus,
dated January 28, 2015, as supplemented.
IMPORTANT NOTICE TO INVESTORS
Virtus Emerging Markets Debt Fund
Under “Fees and Expenses” in the fund’s summary prospectus and the summary section of the statutory prospectus, the “Annual Fund Operating Expenses” table and associated footnotes are hereby replaced with the following:
| Annual Fund Operating Expenses (expenses that you pay each year as a percentage of the value of your investment) | Class A | Class C | Class I | |||||||||
Management Fees | 0.75 | % | 0.75 | % | 0.75 | % | ||||||
Distribution and Shareholder Servicing (12b-1) Fees | 0.25 | % | 1.00 | % | None | |||||||
Other Expenses | 0.52 | % | 0.52 | % | 0.52 | % | ||||||
Total Annual Fund Operating Expenses | 1.52 | % | 2.27 | % | 1.27 | % | ||||||
Less: Expense Reimbursement(b) | (0.17 | %) | (0.17 | %) | (0.17 | %) | ||||||
Total Annual Fund Operating Expenses After Expense | 1.35 | % | 2.10 | % | 1.10 | % | ||||||
| (b) | The fund’s investment adviser has contractually agreed to limit the fund’s total operating expenses (excluding dividend and interest expenses, taxes, brokerage commissions, extraordinary expenses and acquired fund fees and expenses) so that such expenses do not exceed 1.35% for Class A Shares, 2.10% for Class C Shares and 1.10% for Class I Shares through January 31, 2017. Following the contractual period, the adviser may discontinue these expense reimbursement arrangements at any time. Under certain conditions, the adviser may recapture operating expenses reimbursed under these arrangements for a period of three years following the fiscal year in which such reimbursement occurred. |
Under “Fees and Expenses, the “Example” table is hereby replaced with the following:
| Share Status | 1 Year | 3 Years | 5 Years | 10 Years | ||||||||||||||
Class A | Sold or Held | $ | 507 | $ | 804 | $ | 1,141 | $ | 2,091 | |||||||||
Class C | Sold | $ | 313 | $ | 676 | $ | 1,183 | $ | 2,578 | |||||||||
| Held | $ | 213 | $ | 676 | $ | 1,183 | $ | 2,578 | ||||||||||
Class I | Sold or Held | $ | 112 | $ | 368 | $ | 663 | $ | 1,503 | |||||||||
Virtus Emerging Markets Small-Cap Fund
Under “Fees and Expenses” in the fund’s summary prospectus and the summary section of the statutory prospectus, the “Annual Fund Operating Expenses” table and associated footnotes are hereby replaced with the following:
| Annual Fund Operating Expenses (expenses that you pay each year as a percentage of the value of your investment) | Class A | Class C | Class I | |||||||||
Management Fees | 1.20 | % | 1.20 | % | 1.20 | % | ||||||
Distribution and Shareholder Servicing (12b-1) Fees | 0.25 | % | 1.00 | % | None | |||||||
Other Expenses | 3.37 | % | 3.37 | % | 3.37 | % | ||||||
Acquired Fund Fees and Expenses | 0.02 | % | 0.02 | % | 0.02 | % | ||||||
Total Annual Fund Operating Expenses(b) | 4.84 | % | 5.59 | % | 4.59 | % | ||||||
Less: Expense Reimbursement(c) | (2.99 | %) | (2.99 | %) | (2.99 | %) | ||||||
Total Annual Fund Operating Expenses After Expense | 1.85 | % | 2.60 | % | 1.60 | % | ||||||
| (b) | The Total Annual Fund Operating Expenses do not correlate to the ratio of expenses to average net assets appearing in the Financial Highlights tables, which tables reflect only the operating expenses of the fund and do not include acquired fund fees and expenses. |
| (c) | The fund’s investment adviser has contractually agreed to limit the fund’s total operating expenses (excluding dividend and interest expenses, taxes, brokerage commissions, extraordinary expenses and acquired fund fees and expenses) so that such expenses do not exceed 1.85% for Class A Shares, 2.60% for Class C Shares and 1.60% for Class I Shares through January 31, 2017. Following the contractual period, the adviser may discontinue these expense reimbursement arrangements at any time. Under certain conditions, the adviser may recapture operating expenses reimbursed under these arrangements for a period of three years following the fiscal year in which such reimbursement occurred. |
Table of Contents
Under “Fees and Expenses, the “Example” table is hereby replaced with the following:
| Share Status | 1 Year | 3 Years | 5 Years | 10 Years | ||||||||||||||
Class A | Sold or Held | $ | 752 | $ | 1,421 | $ | 2,394 | $ | 4,843 | |||||||||
Class C | Sold | $ | 363 | $ | 1,117 | $ | 2,276 | $ | 5,113 | |||||||||
| Held | $ | 263 | $ | 1,117 | $ | 2,276 | $ | 5,113 | ||||||||||
Class I | Sold or Held | $ | 163 | $ | 823 | $ | 1,812 | $ | 4,322 | |||||||||
Virtus Global Real Estate Securities Fund
Under “Fees and Expenses” in the fund’s summary prospectus and the summary section of the statutory prospectus, the “Annual Fund Operating Expenses” table and associated footnotes are hereby replaced with the following:
| Annual Fund Operating Expenses (expenses that you pay each year as a percentage of the value of your investment) | Class A | Class C | Class I | |||||||||
Management Fees | 0.85 | % | 0.85 | % | 0.85 | % | ||||||
Distribution and Shareholder Servicing (12b-1) Fees | 0.25 | % | 1.00 | % | None | |||||||
Other Expenses | 0.47 | % | 0.47 | % | 0.47 | % | ||||||
Total Annual Fund Operating Expenses | 1.57 | % | 2.32 | % | 1.32 | % | ||||||
Less: Expense Reimbursement(b) | (0.17 | %) | (0.17 | %) | (0.17 | %) | ||||||
Total Annual Fund Operating Expenses After Expense | 1.40 | % | 2.15 | % | 1.15 | % | ||||||
| (b) | The fund’s investment adviser has contractually agreed to limit the fund’s total operating expenses (excluding dividend and interest expenses, taxes, brokerage commissions, extraordinary expenses and acquired fund fees and expenses) so that such expenses do not exceed 1.40% for Class A Shares, 2.15% for Class C Shares and 1.15% for Class I Shares through January 31, 2017. Following the contractual period, the adviser may discontinue these expense reimbursement arrangements at any time. Under certain conditions, the adviser may recapture operating expenses reimbursed under these arrangements for a period of three years following the fiscal year in which such reimbursement occurred. |
Under “Fees and Expenses, the “Example” table is hereby replaced with the following:
| Share Status | 1 Year | 3 Years | 5 Years | 10 Years | ||||||||||||||
Class A | Sold or Held | $ | 709 | $ | 1,010 | $ | 1,350 | $ | 2,307 | |||||||||
Class C | Sold | $ | 318 | $ | 691 | $ | 1,209 | $ | 2,629 | |||||||||
| Held | $ | 218 | $ | 691 | $ | 1,209 | $ | 2,629 | ||||||||||
Class I | Sold or Held | $ | 117 | $ | 384 | $ | 690 | $ | 1,560 | |||||||||
Virtus Greater European Opportunities Fund
Under “Fees and Expenses” in the fund’s summary prospectus and the summary section of the statutory prospectus, the “Annual Fund Operating Expenses” table and associated footnotes are hereby replaced with the following:
| Annual Fund Operating Expenses (expenses that you pay each year as a percentage of the value of your investment) | Class A | Class C | Class I | |||||||||
Management Fees | 0.85 | % | 0.85 | % | 0.85 | % | ||||||
Distribution and Shareholder Servicing (12b-1) Fees | 0.25 | % | 1.00 | % | None | |||||||
Other Expenses | 0.81 | % | 0.81 | % | 0.81 | % | ||||||
Acquired Fund Fees and Expenses | 0.01 | % | 0.01 | % | 0.01 | % | ||||||
Total Annual Fund Operating Expenses(b) | 1.92 | % | 2.67 | % | 1.67 | % | ||||||
Less: Expense Reimbursement(c) | (0.47 | %) | (0.47 | %) | (0.47 | %) | ||||||
Total Annual Fund Operating Expenses After Expense | 1.45 | % | 2.20 | % | 1.20 | % | ||||||
| (b) | The Total Annual Fund Operating Expenses do not correlate to the ratio of expenses to average net assets appearing in the Financial Highlights tables, which tables reflect only the operating expenses of the fund and do not include acquired fund fees and expenses. |
| (c) | The fund’s investment adviser has contractually agreed to limit the fund’s total operating expenses (excluding dividend and interest expenses, taxes, brokerage commissions, extraordinary expenses and acquired fund fees and expenses) so that such expenses do not exceed 1.45% for Class A Shares, 2.20% for Class C Shares and 1.20% for Class I Shares through January 31, 2017. Following the contractual period, the adviser may discontinue these expense reimbursement arrangements at any time. Under certain conditions, the adviser may recapture operating expenses reimbursed under these arrangements for a period of three years following the fiscal year in which such reimbursement occurred. |
Under “Fees and Expenses, the “Example” table is hereby replaced with the following:
| Share Status | 1 Year | 3 Years | 5 Years | 10 Years | ||||||||||||||
Class A | Sold or Held | $ | 714 | $ | 1,055 | $ | 1,468 | $ | 2,615 | |||||||||
Class C | Sold | $ | 323 | $ | 738 | $ | 1,329 | $ | 2,931 | |||||||||
| Held | $ | 223 | $ | 738 | $ | 1,329 | $ | 2,931 | ||||||||||
Class I | Sold or Held | $ | 122 | $ | 432 | $ | 816 | $ | 1,895 | |||||||||
Table of Contents
Virtus International Equity Fund
Under “Fees and Expenses” in the fund’s summary prospectus and the summary section of the statutory prospectus, the “Annual Fund Operating Expenses” table and associated footnotes are hereby replaced with the following:
| Annual Fund Operating Expenses (expenses that you pay each year as a percentage of the value of your investment) | Class A | Class C | Class I | |||||||||
Management Fees | 0.85 | % | 0.85 | % | 0.85 | % | ||||||
Distribution and Shareholder Servicing (12b-1) Fees | 0.25 | % | 1.00 | % | None | |||||||
Other Expenses | 1.32 | % | 1.32 | % | 1.32 | % | ||||||
Acquired Fund Fees and Expenses | 0.01 | % | 0.01 | % | 0.01 | % | ||||||
Total Annual Fund Operating Expenses(b) | 2.43 | % | 3.18 | % | 2.18 | % | ||||||
Less: Expense Reimbursement(c) | (0.93 | %) | (0.93 | %) | (0.93 | %) | ||||||
Total Annual Fund Operating Expenses After Expense | 1.50 | % | 2.25 | % | 1.25 | % | ||||||
| (b) | The Total Annual Fund Operating Expenses do not correlate to the ratio of expenses to average net assets appearing in the Financial Highlights tables, which tables reflect only the operating expenses of the fund and do not include acquired fund fees and expenses. |
| (c) | The fund’s investment adviser has contractually agreed to limit the fund’s total operating expenses (excluding dividend and interest expenses, taxes, brokerage commissions, extraordinary expenses and acquired fund fees and expenses) so that such expenses do not exceed 1.50% for Class A Shares, 2.25% for Class C Shares and 1.25% for Class I Shares through January 31, 2017. Following the contractual period, the adviser may discontinue these expense reimbursement arrangements at any time. Under certain conditions, the adviser may recapture operating expenses reimbursed under these arrangements for a period of three years following the fiscal year in which such reimbursement occurred. |
Under “Fees and Expenses, the “Example” table is hereby replaced with the following:
| Share Status | 1 Year | 3 Years | 5 Years | 10 Years | ||||||||||||||
Class A | Sold or Held | $ | 719 | $ | 1,116 | $ | 1,633 | $ | 3,044 | |||||||||
Class C | Sold | $ | 328 | $ | 801 | $ | 1,497 | $ | 3,352 | |||||||||
| Held | $ | 228 | $ | 801 | $ | 1,497 | $ | 3,352 | ||||||||||
Class I | Sold or Held | $ | 127 | $ | 497 | $ | 994 | $ | 2,362 | |||||||||
Virtus International Real Estate Securities Fund
Under “Fees and Expenses” in the fund’s summary prospectus and the summary section of the statutory prospectus, the “Annual Fund Operating Expenses” table and associated footnotes are hereby replaced with the following:
| Annual Fund Operating Expenses (expenses that you pay each year as a percentage of the value of your investment) | Class A | Class C | Class I | |||||||||
Management Fees | 1.00 | % | 1.00 | % | 1.00 | % | ||||||
Distribution and Shareholder Servicing (12b-1) Fees | 0.25 | % | 1.00 | % | None | |||||||
Other Expenses | 0.48 | % | 0.48 | % | 0.48 | % | ||||||
Total Annual Fund Operating Expenses | 1.73 | % | 2.48 | % | 1.48 | % | ||||||
Less: Expense Reimbursement(b) | (0.23 | %) | (0.23 | %) | (0.23 | %) | ||||||
Total Annual Fund Operating Expenses After Expense | 1.50 | % | 2.25 | % | 1.25 | % | ||||||
| (b) | The fund’s investment adviser has contractually agreed to limit the fund’s total operating expenses (excluding dividend and interest expenses, taxes, brokerage commissions, extraordinary expenses and acquired fund fees and expenses) so that such expenses do not exceed 1.50% for Class A Shares, 2.25% for Class C Shares and 1.25% for Class I Shares through January 31, 2017. Following the contractual period, the adviser may discontinue these expense reimbursement arrangements at any time. Under certain conditions, the adviser may recapture operating expenses reimbursed under these arrangements for a period of three years following the fiscal year in which such reimbursement occurred. |
Under “Fees and Expenses, the “Example” table is hereby replaced with the following:
| Share Status | 1 Year | 3 Years | 5 Years | 10 Years | ||||||||||||||
Class A | Sold or Held | $ | 719 | $ | 1,045 | $ | 1,418 | $ | 2,462 | |||||||||
Class C | Sold | $ | 328 | $ | 728 | $ | 1,278 | $ | 2,780 | |||||||||
| Held | $ | 228 | $ | 728 | $ | 1,278 | $ | 2,780 | ||||||||||
Class I | Sold or Held | $ | 127 | $ | 422 | $ | 763 | $ | 1,728 | |||||||||
Table of Contents
Virtus International Small-Cap Fund
Under “Fees and Expenses” in the fund’s summary prospectus and the summary section of the statutory prospectus, the “Annual Fund Operating Expenses” table and associated footnotes are hereby replaced with the following:
| Annual Fund Operating Expenses (expenses that you pay each year as a percentage of the value of your investment) | Class A | Class C | Class I | Class R6 | ||||||||||||
Management Fees | 1.00 | % | 1.00 | % | 1.00 | % | 1.00 | % | ||||||||
Distribution and Shareholder Servicing (12b-1) Fees | 0.25 | % | 1.00 | % | None | None | ||||||||||
Other Expenses | 0.48 | % | 0.48 | % | 0.48 | % | 0.39 | %(b) | ||||||||
Acquired Fund Fees and Expenses | 0.02 | % | 0.02 | % | 0.02 | % | 0.02 | % | ||||||||
Total Annual Fund Operating Expenses(c) | 1.75 | % | 2.50 | % | 1.50 | % | 1.41 | % | ||||||||
Less: Expense Reimbursement(d) | (0.15 | %) | (0.15 | %) | (0.15 | %) | (0.15 | %) | ||||||||
Total Annual Fund Operating Expenses After Expense | 1.60 | % | 2.35 | % | 1.35 | % | 1.26 | % | ||||||||
| (b) | Estimated for current fiscal year, as annualized. |
| (c) | The Total Annual Fund Operating Expenses do not correlate to the ratio of expenses to average net assets appearing in the Financial Highlights tables, which tables reflect only the operating expenses of the fund and do not include acquired fund fees and expenses. |
| (d) | The fund’s investment adviser has contractually agreed to limit the fund’s total operating expenses (excluding dividend and interest expenses, taxes, brokerage commissions, extraordinary expenses and acquired fund fees and expenses) so that such expenses do not exceed 1.60% for Class A Shares, 2.35% for Class C Shares, 1.35% for Class I Shares and 1.26% for Class R6 Shares through January 31, 2017. Following the contractual period, the adviser may discontinue these expense reimbursement arrangements at any time. Under certain conditions, the adviser may recapture operating expenses reimbursed under these arrangements for a period of three years following the fiscal year in which such reimbursement occurred. |
Under “Fees and Expenses, the “Example” table is hereby replaced with the following:
| Share Status | 1 Year | 3 Years | 5 Years | 10 Years | ||||||||||||||
Class A | Sold or Held | $ | 728 | $ | 1,066 | $ | 1,442 | $ | 2,495 | |||||||||
Class C | Sold | $ | 338 | $ | 749 | $ | 1,303 | $ | 2,813 | |||||||||
| Held | $ | 238 | $ | 749 | $ | 1,303 | $ | 2,813 | ||||||||||
Class I | Sold or Held | $ | 137 | $ | 444 | $ | 789 | $ | 1,764 | |||||||||
Class R6 | Sold or Held | $ | 128 | $ | 416 | $ | 742 | $ | 1,664 | |||||||||
Virtus Emerging Markets Debt Fund, Virtus Emerging Markets Small-Cap Fund, Virtus Emerging Markets Equity Income Fund, Virtus Global Opportunities Fund, Virtus Global Real Estate Securities Fund, Virtus Greater European Opportunities Fund, Virtus International Equity Fund, Virtus International Real Estate Securities Fund and Virtus International Small-Cap Fund.
The first paragraph and the information in the first table in the section “More Information About Fund Expenses” on page 139 of the statutory prospectus are hereby revised with the following information for the above referenced funds:
Virtus Investment Advisers, Inc. (“VIA”) has contractually agreed to limit the total operating expenses (excluding dividend and interest expenses, taxes, brokerage commissions, leverage expenses, extraordinary expenses and acquired fund fees and expenses, if any) of certain of the funds so that expenses do not exceed, on an annualized basis, the amounts indicated in the following table.
| Class A Shares | Class B Shares | Class C Shares | Class I Shares | Class R6 Shares | Class T Shares | Through Date | |||||||||||||||||||||
Virtus Emerging Markets Debt Fund | 1.35 | % | N/A | 2.10 | % | 1.10 | % | N/A | N/A | January 31, 2017 | ||||||||||||||||||
Virtus Emerging Markets Equity Income Fund(1) | 1.75 | % | N/A | 2.50 | % | 1.50 | % | N/A | N/A | January 31, 2017 | ||||||||||||||||||
Virtus Emerging Markets Small-Cap Fund | 1.85 | % | N/A | 2.60 | % | 1.60 | % | N/A | N/A | January 31, 2017 | ||||||||||||||||||
Virtus Global Opportunities Fund(1) | 1.55 | % | 2.30 | % | 2.30 | % | 1.30 | % | N/A | N/A | January 31, 2017 | |||||||||||||||||
Virtus Global Real Estate Securities Fund | 1.40 | % | N/A | 2.15 | % | 1.15 | % | N/A | N/A | January 31, 2017 | ||||||||||||||||||
Virtus Greater European Opportunities Fund | 1.45 | % | N/A | 2.20 | % | 1.20 | % | N/A | N/A | January 31, 2017 | ||||||||||||||||||
Virtus International Equity Fund | 1.50 | % | N/A | 2.25 | % | 1.25 | % | N/A | N/A | January 31, 2017 | ||||||||||||||||||
Virtus International Real Estate Securities Fund | 1.50 | % | N/A | 2.25 | % | 1.25 | % | N/A | N/A | January 31, 2017 | ||||||||||||||||||
Virtus International Small-Cap Fund | 1.60 | % | N/A | 2.35 | % | 1.35 | % | 1.26 | % | N/A | January 31, 2017 | |||||||||||||||||
| (1) | Fund expenses currently below the capped level. |
Investors should retain this supplement with the Prospectuses for future reference.
VOT 8020/9FundsNewExpCap&Waiver (09/15)
Table of Contents
VIRTUS OPPORTUNITIES TRUST
101 Munson Street
Greenfield, MA 01301-9668
Trustees
George R. Aylward
Hassell H. McClellan
Philip R. McLoughlin, Chairman
Geraldine M. McNamara
James M. Oates
Richard E. Segerson
Ferdinand L.J. Verdonck
Officers
George R. Aylward, President
Francis G. Waltman, Executive Vice President
W. Patrick Bradley, Senior Vice President, Chief Financial Officer and Treasurer
Kevin J. Carr, Senior Vice President, Chief Legal Officer, Counsel and Secretary
Nancy J. Engberg, Vice President and Chief Compliance Officer
Investment Adviser
Virtus Investment Advisers, Inc.
100 Pearl Street
Hartford, CT 06103-4506
Principal Underwriter
VP Distributors, LLC
100 Pearl Street
Hartford, CT 06103-4506
Administrator and Transfer Agent
Virtus Fund Services, LLC
100 Pearl Street
Hartford, CT 06103-4506
Custodian
JPMorgan Chase Bank, NA
1 Chase Manhattan Plaza
New York, NY 10005-1401
Independent Registered Public
Accounting Firm
PricewaterhouseCoopers LLP
2001 Market Street
Philadelphia, PA 19103-7042
How to Contact Us
Mutual Fund Services | 1-800-243-1574 | |
Adviser Consulting Group | 1-800-243-4361 | |
Web site | Virtus.com |
Important Notice to Shareholders
The Securities and Exchange Commission has modified mailing regulations for semiannual and annual shareholder fund reports to allow mutual fund companies to send a single copy of these reports to shareholders who share the same mailing address. If you would like additional copies, please call Mutual Fund Services at 1-800-243-1574.
Table of Contents
| ||
P.O. Box 9874 Providence, RI 02940-8074 |

For more information about Virtus Mutual Funds,
please call your financial representative, or contact us
at 1-800-243-1574 or Virtus.com.
8032 | 11-15 |
Table of Contents
Item 2. Code of Ethics.
| (a) | The registrant, as of the end of the period covered by this report, has adopted a code of ethics that applies to the registrant’s principal executive officer, principal financial officer, principal accounting officer or controller, or persons performing similar functions, regardless of whether these individuals are employed by the registrant or a third party. |
| (c) | Other than certain non-substantive changes, there have been no amendments, during the period covered by this report, to a provision of the code of ethics that applies to the registrant’s principal executive officer, principal financial officer, principal accounting officer or controller, or persons performing similar functions, regardless of whether these individuals are employed by the registrant or a third party, and that relates to any element of the code of ethics described in Item 2(b) of the instructions for completion of Form N-CSR. |
| (d) | The registrant has not granted any waivers, during the period covered by this report, including an implicit waiver, from a provision of the code of ethics that applies to the registrant’s principal executive officer, principal financial officer, principal accounting officer or controller, or persons performing similar functions, regardless of whether these individuals are employed by the registrant or a third party, that relates to one or more of the items set forth in paragraph (b) of the instructions for completion of this Item. |
Item 3. Audit Committee Financial Expert.
| (a)(1) | The Registrant’s Board of Trustees has determined that the Registrant has an “audit committee financial expert” serving on its Audit Committee. |
| (a)(2) | The Registrant’s Board of Trustees has determined that James M. Oates and Richard E. Segerson each possess the technical attributes identified in Instruction 2(b) of Item 3 to Form N-CSR to qualify as an “audit committee financial expert.” Each of Mr. Oates and Mr. Segerson is an “independent” trustee pursuant to paragraph (a)(2) of Item 3 to Form N-CSR. |
| (a)(3) | Not applicable. |
Item 4. Principal Accountant Fees and Services.
Audit Fees
| (a) | The aggregate fees billed for each of the last two fiscal years for professional services rendered by the principal accountant for the audit of the registrant’s annual financial statements or services |
Table of Contents
that are normally provided by the accountant in connection with statutory and regulatory filings or engagements for those fiscal years are $666,850 for 2014 and $673,744 for 2015. |
Audit-Related Fees
| (b) | The aggregate fees billed in each of the last two fiscal years for assurance and related services by the principal accountant that are reasonably related to the performance of the audit of the registrant’s financial statements and are not reported under paragraph (a) of this Item are $62,664 for 2014 and $90,281 for 2015. Such audit-related fees include out of pocket expenses and cross fund fees. |
Tax Fees
| (c) | The aggregate fees billed in each of the last two fiscal years for professional services rendered by the principal accountant for tax compliance, tax advice, and tax planning are $111,750 for 2014 and $129,550 for 2015. |
“Tax Fees” are those primarily associated with review of the Trust’s tax provision and qualification as a regulated investment company (RIC) in connection with audits of the Trust’s financial statement, review of year-end distributions by the Fund to avoid excise tax for the Trust, periodic discussion with management on tax issues affecting the Trust, and reviewing and signing the Fund’s federal income returns.
All Other Fees
| (d) | The aggregate fees billed in each of the last two fiscal years for products and services provided by the principal accountant, other than the services reported in paragraphs (a) through (c) of this Item are $0 for 2014 and $0 for 2015. |
| (e)(1) | Disclose the audit committee’s pre-approval policies and procedures described in paragraph (c)(7) of Rule 2-01 of Regulation S-X. |
The Virtus Opportunities Trust (the “Fund”) Board has adopted policies and procedures with regard to the pre-approval of services provided by PwC. Audit, audit-related and tax compliance services provided to the Fund on an annual basis require specific pre-approval by the Board. The Audit Committee must approve other non-audit services provided to the Fund and those non-audit services provided to the Fund’s Affiliated Service Providers that relate directly to the operations and financial reporting of the Fund. Certain of these non-audit services that the Audit Committee believes are a) consistent with the SEC’s auditor independence rules and b) routine and recurring services that will not impair the independence of the independent auditors may be approved by the Committee without consideration on a specific case-by-case basis (“general pre-approval”).
The Audit Committee has determined that James M. Oates, Chair of the Audit Committee, may provide pre-approval for such services that meet the above requirements in the event such approval is sought between regularly scheduled meetings. In any event, the Audit Committee is informed of each service approved subject to general pre-approval at the next regularly scheduled in-person board meeting.
Table of Contents
| (e)(2) | The percentage of services described in each of paragraphs (b) through (d) of this Item that were approved by the audit committee pursuant to paragraph (c)(7)(i)(C) of Rule 2-01 of Regulation S-X are as follows: |
(b) 0%
(c) 0%
(d) N/A
| (f) | The percentage of hours expended on the principal accountant’s engagement to audit the registrant’s financial statements for the most recent fiscal year that were attributed to work performed by persons other than the principal accountant’s full-time, permanent employees was less than fifty percent. |
| (g) | The aggregate non-audit fees billed by the registrant’s accountant for services rendered to the registrant, and rendered to the registrant’s investment adviser (not including any sub-adviser whose role is primarily portfolio management and is subcontracted with or overseen by another investment adviser), and any entity controlling, controlled by, or under common control with the adviser that provides ongoing services to the registrant for each of the last two fiscal years of the registrant was $490,517 for 2014 and $528,041 for 2015. |
| (h) | The registrant’s audit committee of the board of directors has considered whether the provision of non-audit services that were rendered to the registrant’s investment adviser (not including any sub-adviser whose role is primarily portfolio management and is subcontracted with or overseen by another investment adviser), and any entity controlling, controlled by, or under common control with the investment adviser that provides ongoing services to the registrant that were not pre-approved pursuant to paragraph (c)(7)(ii) of Rule 2-01 of Regulation S-X is compatible with maintaining the principal accountant’s independence. |
Item 5. Audit Committee of Listed Registrants.
Not applicable.
Item 6. Investments.
| (a) | Schedule of Investments in securities of unaffiliated issuers as of the close of the reporting period is included as part of the report to shareholders filed under Item 1 of this form. |
| (b) | Not applicable. |
| Item 7. | Disclosure of Proxy Voting Policies and Procedures for Closed-End Management Investment Companies. |
Not applicable.
Table of Contents
Item 8. Portfolio Managers of Closed-End Management Investment Companies.
Not applicable.
| Item 9. | Purchases of Equity Securities by Closed-End Management Investment Company and Affiliated Purchasers. |
Not applicable.
Item 10. Submission of Matters to a Vote of Security Holders.
There have been no material changes to the procedures by which the shareholders may recommend nominees to the registrant’s board of trustees, where those changes were implemented after the registrant last provided disclosure in response to the requirements of Item 407(c)(2)(iv) of Regulation S-K (17 CFR 229.407) (as required by Item 22(b)(15) of Schedule 14A (17 CFR 240.14a-101)), or this Item.
Item 11. Controls and Procedures.
| (a) | The registrant’s principal executive and principal financial officers, or persons performing similar functions, have concluded that the registrant’s disclosure controls and procedures (as defined in Rule 30a-3(c) under the Investment Company Act of 1940, as amended (the “1940 Act”) (17 CFR 270.30a-3(c))) are effective, as of a date within 90 days of the filing date of the report that includes the disclosure required by this paragraph, based on their evaluation of these controls and procedures required by Rule 30a-3(b) under the 1940 Act (17 CFR 270.30a-3(b)) and Rules 13a-15(b) or 15d-15(b) under the Securities Exchange Act of 1934, as amended (17 CFR 240.13a-15(b) or 240.15d-15(b)). |
| (b) | There were no changes in the registrant’s internal control over financial reporting (as defined in Rule 30a-3(d) under the 1940 Act (17 CFR 270.30a-3(d)) that occurred during the registrant’s second fiscal quarter of the period covered by this report that has materially affected, or is reasonably likely to materially affect, the registrant’s internal control over financial reporting. |
Item 12. Exhibits.
| (a)(1) | Code of ethics, or any amendment thereto, that is the subject of disclosure required by Item 2 is attached hereto. |
| (a)(2) | Certifications pursuant to Rule 30a-2(a) under the 1940 Act and Section 302 of the Sarbanes-Oxley Act of 2002 are attached hereto. |
| (a)(3) | Not applicable. |
Table of Contents
| (b) | Certifications pursuant to Rule 30a-2(b) under the 1940 Act and Section 906 of the Sarbanes-Oxley Act of 2002 are attached hereto. |
Table of Contents
SIGNATURES
Pursuant to the requirements of the Securities Exchange Act of 1934 and the Investment Company Act of 1940, the registrant has duly caused this report to be signed on its behalf by the undersigned, thereunto duly authorized.
(Registrant) | Virtus Opportunities Trust |
| By (Signature and Title)* | /s/ George R. Aylward | |
George R. Aylward, President | ||
(principal executive officer) |
Date 12/4/15
Pursuant to the requirements of the Securities Exchange Act of 1934 and the Investment Company Act of 1940, this report has been signed below by the following persons on behalf of the registrant and in the capacities and on the dates indicated.
| By (Signature and Title)* | /s/ George R. Aylward | |
George R. Aylward, President | ||
(principal executive officer) |
Date 12/4/15
| By (Signature and Title)* | /s/ W. Patrick Bradley | |||
W. Patrick Bradley, Senior Vice President, Chief Financial Officer, and Treasurer | ||||
(principal financial officer) | ||||
Date 12/4/15
* Print the name and title of each signing officer under his or her signature.