UNITED STATES
SECURITIES AND EXCHANGE COMMISSION
Washington, D.C. 20549
FORM N-CSR
CERTIFIED SHAREHOLDER REPORT
OF
REGISTERED MANAGEMENT INVESTMENT COMPANIES
Investment Company Act File Number: 811-07537
Name of Registrant: Royce Capital Fund
Address of Registrant: 745 Fifth Avenue
New York, NY 10151
| Name and address of agent for service: | John E. Denneen, Esquire
745 Fifth Avenue
New York, NY 10151 |
Registrant’s telephone number, including area code: (212) 508-4500
Date of fiscal year end: December 31
Date of reporting period: January 1, 2018 – December 31, 2018
Item 1. Reports to Shareholders.
| | | DECEMBER 31, 2018 |
| | | |
| | | |
| | | |
| | | 2018 Annual |
| | | Review and Report to Shareholders |
| | | |
| | | |
| | | |
| | | |
| | | |
| | | |
| | | |
| | | Royce Capital Fund– |
| | | Micro-Cap Portfolio |
| | | | |
| | | Royce Capital Fund– |
| | | Small-Cap Portfolio |
| | | | |
| | | | |
| | | | |
| | | | |
| | | | |
| | | | |
| | | | |
| | | | |
| | | | |
| | | | |
| | | | |
| | | | |
| | | Beginning on January 1, 2021, as permitted by regulations adopted by the U.S. Securities and Exchange Commission, paper copies of the Funds’ shareholder reports like this one will no longer be sent by mail, unless you specifically request paper copies of the reports from the Funds or from your financial intermediary (such as a broker-dealer or bank). Instead, the reports will be made available on the Funds’ website (www.roycefunds.com), and you will be notified by mail each time a report is posted and provided with a website link to access the report. If you already elected to receive shareholder reports electronically, you will not be affected by this change and you need not take any action. You may elect to receive shareholder reports and other communications from the Funds electronically anytime by contacting your financial intermediary or, if you are a direct investor with the Funds, by calling 1-800-841-1180. Beginning on January 1, 2019, you may elect to receive all future reports in paper free of charge. If you invest through a financial intermediary, you can contact your financial intermediary to request that you continue to receive paper copies of your shareholder reports. If you invest directly with the Funds, you can call 1-800-841-1180 to let the Funds know you wish to continue receiving paper copies of your shareholder reports. Your election to receive reports in paper will apply to all Funds held in your account if you invest through your financial intermediary or all Funds held with our fund complex if you invest directly with the Funds. |
| | | | |
| | | | |
| | | roycefunds.com |  |
| | | | |
| | | | |
| | | | |
| Table of Contents | | | |
| | | | |
| | | | |
| Annual Review | | | |
| | | | |
| Letter to Our Shareholders | | 1 | |
| | | | |
| Performance and Expenses | | 5 | |
| | | | |
| | | | |
| Annual Report to Shareholders | | | |
| | | | |
| Managers’ Discussions of Fund Performance and Schedules of Investments | | | |
| | | | |
Royce Capital Fund–Micro-Cap Portfolio | | 6 | |
| | | | |
Royce Capital Fund–Small-Cap Portfolio | | 12 | |
| | | | |
| Financial Statements | | 16 | |
| | | | |
| Notes to Financial Statements | | 20 | |
| | | | |
| Report of Independent Registered Public Accounting Firm | | 25 | |
| | | | |
| Understanding Your Fund’s Expenses | | 26 | |
| | | | |
| Trustees and Officers | | 27 | |
| | | | |
| Notes to Performance and Other Important Information | | 28 | |

| This page is not part of the Royce Capital Fund 2018 Annual Report to Shareholders |
Letter to Our Shareholders

2018: ANNUS HORRIBILIS
This was quite a memorable year for the equity markets—for reasons most investors would prefer to forget. A bull market ended with a bang that left many investors whimpering. Of course, the end of any upswing for share prices is bound to be disappointing—what made this pullback so jarring was its speed and severity. Back in the summer, everyone seemed to agree that valuations were stretched to the point where an adjustment to prices was all but inevitable, yet the force of the decline felt more like the engine of a precision-engineered sports car suddenly seizing than the anticipated tapping of the brakes. So while 2018’s downturn initially looked as if it would assume a place among the most predicted in history, no one, including us, was expecting a fall as steep and fast as this one has been. It has also, however, performed the role down markets do—which is to provide active managers with an ample supply of potential long-term opportunities.
Part of the reason the jolt was so unexpected may be due to the placid nature of the bull market it wrenched to a stop. For much of 2018, the U.S. market cruised confidently ahead, with very little congestion and few potholes. Through the first three quarters of the year, volatility barely registered in the small-cap market, with only 22% of the trading days having intraday moves of at least 1% in the small-cap Russell 2000 Index (and our chosen asset class has |
historically been the most volatile precinct of the equity world). Of course, this all changed dramatically later in the year. For small-caps, it began after the Russell 2000 reached an all-time high on August 31, following which a wave of volatility hit. In the fourth quarter, 54% of the trading days for the Russell 2000 had intraday moves of at least 1%.
The volatility itself would have perhaps been more bearable if it had not also taken returns in the year’s last three months from ‘bad’ to ‘historically awful’—the Russell 2000 fell 20.2% for the fourth quarter. Its worst month by far was December. In fact, the first few months of the corrective phase had enough push and pull that the year-to-date return at the end of November for the Russell 2000 was 1.0%. From our perspective, then, the downturn had two phases—the first was the widely expected recalibration from late August through mid-December. The second was a blur of panic selling between December 12th and 24th. Losses mounted as the gentler slope of the initial stage gave way to a wild downhill. The markets careened downhill at breakneck speed as the calendar approached year-end, with small-caps reaching a 2018 bottom on Christmas Eve before stabilizing over the next week, giving the Russell 2000 a loss of 11.9% for December. In the context of its 11.0% decline for calendar 2018, it may be easy to forget that year-to-date through August 31, the Russell 2000 was up 14.3%. |
| This page is not part of the Royce Capital Fund 2018 Annual Report to Shareholders | 1 |
LETTER TO OUR SHAREHOLDERS
| |
A Tale of Two Markets
Russell 2000 2018 |

So 2018 was truly A Tale of Two Markets, and offered yet another lesson from history that the market can—and often does—turn in a hurry. For an additional sense of the tumult and—we want to stress again—the opportunities the correction created, consider that the average stock in the Russell 2000 declined 37.2% from its previous 52-week high through year-end. Many declined more than that: energy stocks in the Russell 2000 fell more than 50%, materials slid 42.5%, and transportation was down 42.3% from their respective highs.
“WHAT JUST HAPPENED?” |
Retrospect offers the opportunity to look at the contour of the correction and at the confluence of factors that may have led to and exacerbated it. In spite of its historic awfulness, the downturn displayed some familiar traits: small-caps lost more than large-caps, for example, which is consistent with most bear markets, as is the fact that small-caps entered ‘classic’ bear market territory before their larger counterparts. (By a ‘classic’ bear, we mean a decline of 20% or more from a previous peak—the Russell 2000 lost 22.1% from 8/31/18-12/31/18.) Within small-cap, we also saw value beat growth, dividend payers lose less than non-payers, earners hold up better than non-earners, and defensives outpace cyclicals. All of this is also essentially consistent with history, which was reassuring (though painful in the short run).
Identifying this mix of the familiar and the unexpected helps to shed light on the question of what drove shares down in such
| |
| A Familiar Pattern in 4Q18 Decline |

precipitous fashion, turning what at first looked like a historically typical bull market detour into the bear market ditch. First, there was the by-now familiar cloud of tariffs and trade wars looming over the market, arguably the major factor in underperformance for economically sensitive cyclical stocks in 2018. Oil prices began to collapse in October, while shortly afterward slowdowns were reported in both housing and auto sales. Consumer confidence began to dip, and Europe and China continued to weaken. Yet all of this was, if not old news, then at least well established news by the end of November. Moreover, much of the economic news in the U.S. remained positive. Job and wage gain growth remained robust (as they continue to do as of this writing) as did corporate profits.
In mid-December, however, other factors came into play that helped to bring the witches’ brew to a boil. Investors looked at the coincidence of a flattening yield curve and the abrupt drop in oil prices as a surefire recession warning. Ratcheting up the already high level of anxiety, the December Fed meeting announcement and subsequent press conference were widely seen as conveying an unhealthy detachment from current financial conditions, which exacerbated the downward spiral. This is how ‘bad’ became ‘worse.’
A SENSE OF WHERE WE ARE
A month into 2019, which featured a welcome rally that recovered most of December’s losses, the signals remain decidedly mixed. The PMI (Purchasing Managers’ Index) report for December issued in early January perhaps best distills the mixed, if not confusing, state of play in the U.S. economy. The report is designed to show the health of the manufacturing and service sectors. The index hit a 15-month low in December, which is admittedly concerning, especially given the marked fall-off from November. However, of its 18 manufacturing sectors, 11 showed growth in December. Additionally, the 54.1% number reported for that month was comfortably in the range of a growing economy because any number north of 50% typically indicates growth. Even with the uncertain course of U.S. growth, it seems clear to us that in 2018 many investors reacted as if the economy has only two gears—forward and reverse. |
| 2 | This page is not part of the Royce Capital Fund 2018 Annual Report to Shareholders |
LETTER TO OUR SHAREHOLDERS
| We see a more nuanced picture that’s closer to the midpoint of these extremes. The economy looks essentially healthy and capable of expansion to us, though probably at a slower pace than we saw over the last two years. There are undoubtedly risks on the horizon—political, financial, and economic. Yet we believe that these have already been reflected, in some cases excessively so, in current small-cap valuations. The market shifted in short order from a period when small-cap’s extended valuations seemed out of sync in light of the index’s high levels of debt and low profitability, to one at the end of the year when valuations reflected more pessimism than we think is warranted—at least in select instances. |
THE LESSONS OF HISTORY
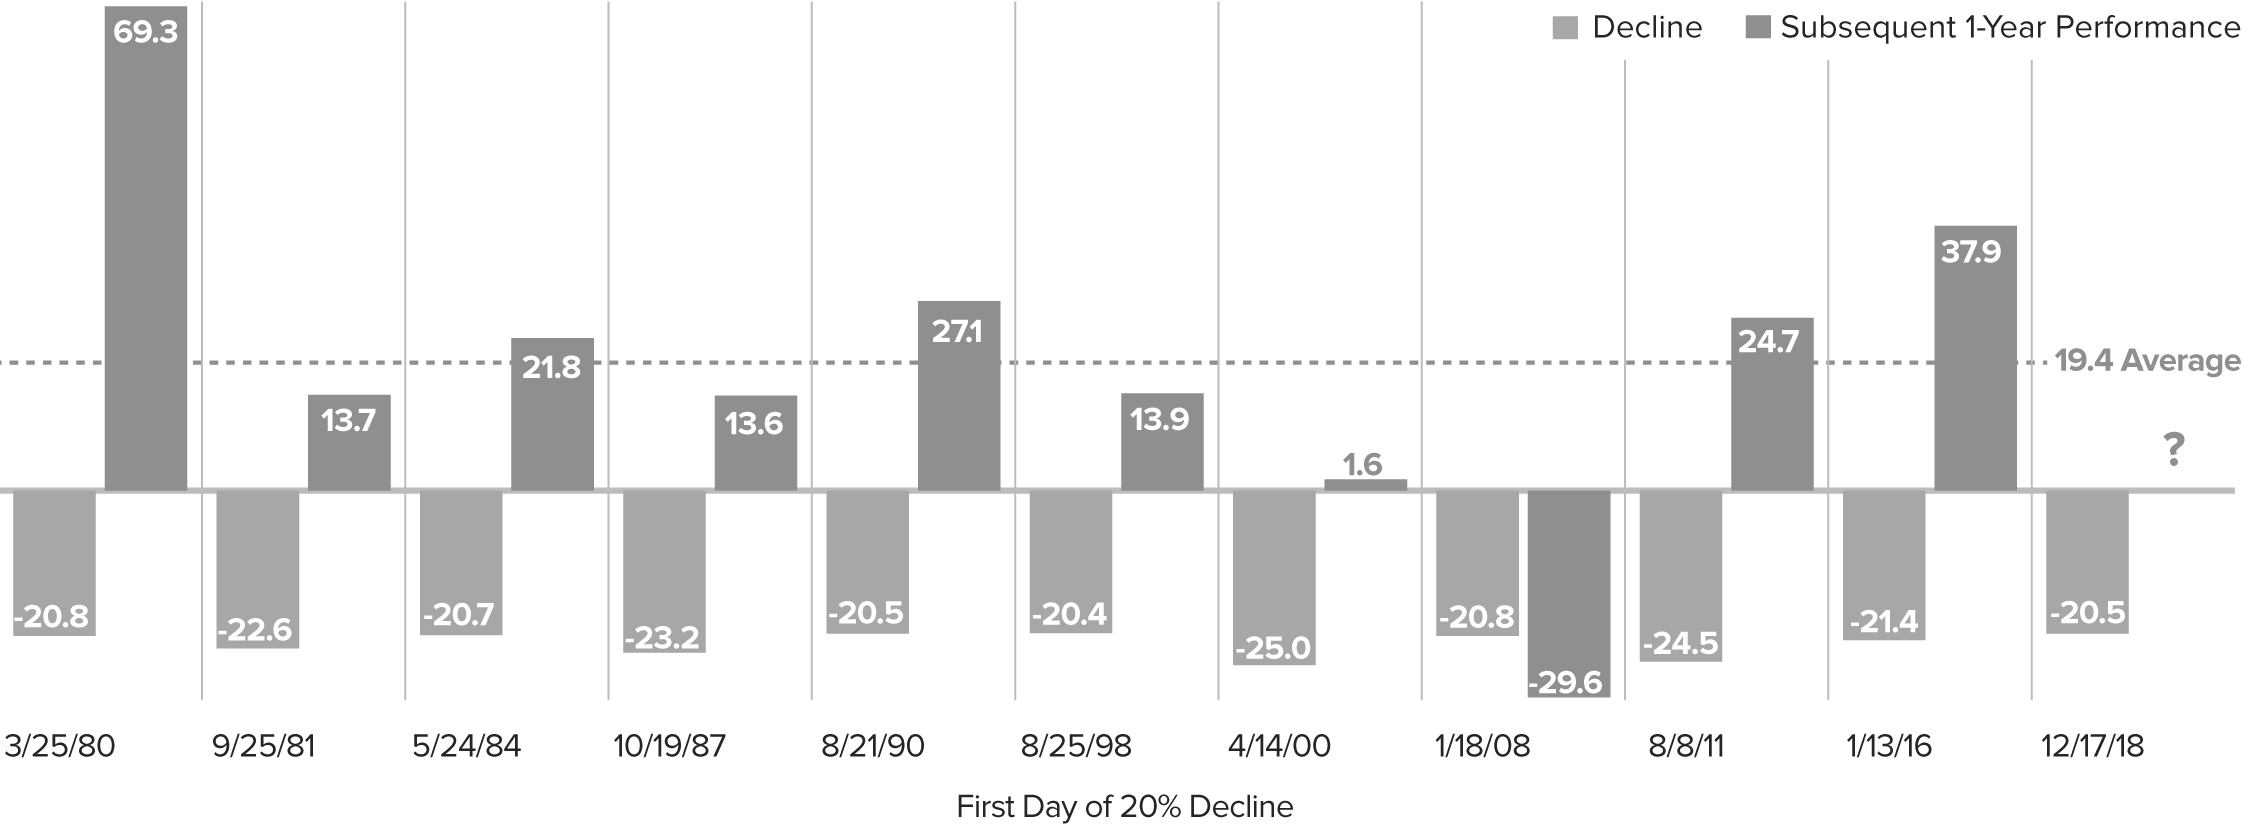
We examined the recent bear phase from a calendar-year and market cycle perspective and uncovered encouraging data. First, 2018 was the twelfth negative calendar year in the 40-year history of the Russell 2000. In 10 of the previous 11 years, a positive calendar-year return followed—with an average one-year return of 21.1%. (Unsurprisingly, the lone exception was 2007-08.) Turning to market cycles also shows compelling positive news. 2018 saw the eleventh decline of 20% or more from a previous small-cap peak. In nine of the previous 10 periods, the subsequent average one-year return from the first day on which the index declined 20% from its peak was a positive 19.4%. (The exception, again unsurprisingly, came in 2008-09.) These historical examples certainly suggest the possibility of a solid 2019. |
| |
Historical Comparison
CRSP 6-10 Declines and Subsequent 12-Month Performance |

| To be sure, our belief is that we are a long way from the crisis era of a decade ago. We are also in a stronger position economically than we were in the two prior bear markets in 2011-12 or 2015-16. In fact, we see the closest historical parallels farther back. In our view, 1987 or 1962 are the more relevant comparisons—two cases in which the markets experienced a deep decline before recovering in the midst of a still growing economy. Moreover, we also see little resemblance between the present and prior bearish periods such as 1998, 2001-02, or 2008-09, when there were more than enough reasons for investors to sell in the form of financial crises and/or recessions (while contrarians like us were casting about for opportunities). It’s worth emphasizing that the only decline over the last 10-plus years that featured both a recession and a financial crisis was 2008-09. Unless investors are expecting something in the way of a repeat performance—and we are obviously not—history suggests this may be a good time to consider committing more money to small-caps. |
| |
After the Bear Market, Then What?
Subsequent 1-Year Performance of Russell 2000 after a 20% Decline as of 12/31/18 |
| This page is not part of the Royce Capital Fund 2018 Annual Report to Shareholders | 3 |
LETTER TO OUR SHAREHOLDERS
A DELIBERATE PACE ON THE ROAD TO NORMAL
We would, however, add a note or two mixing intermediate-term caution for the small-cap market with long-term optimism for small-cap active management. 2019 may well be a terrific year for small-cap performance, particularly if January is any kind of bellwether. However, we suspect that annualized small-cap returns over the next three to five years may be in the mid to high single digits. From our perspective as disciplined small-cap specialists, this is not necessarily bad news. Lower-than-average returns for the Russell 2000 have historically benefited active management approaches, including a number of our own strategies, especially coming out of periods of deep pessimism such as we saw late in 2018, when investors often miss the long-term opportunities falling markets create.
We also believe that the long and winding road back to more normal terrain for the capital markets will be marked by three occurrences: a normalizing rate structure, with rates moving higher, resulting in a steepening yield curve; more historically average levels of volatility (which was higher in 2018 than it was over the previous two years); and the more historically typical returns that we mentioned above. All three of these market conditions have been supportive for small-cap active management in the past.
The overall state of small-cap, however, still has several unresolved issues. Of the three that worried us most about the Russell 2000 over the summer—lofty valuations, many companies with barely manageable debt, and too many with no earnings—only the first is no longer a pressing matter. We think that the fundamentals we value most—such as high returns on invested capital, positive cash flow, and an identifiable catalyst (or two) for earnings growth or recovery—should be rewarded in the coming market environment, as they have often been over the long term. |
IDENTIFYING OPPORTUNITIES IN A VOLATILE CLIMATE
In all of our strategies, we’ve been working to take advantage of long-term buying opportunities across a broad spectrum of sectors and industries. This includes companies involved in energy services, RV parts, infrastructure, laser-based photonics, shipping, trucking, banking, outpatient healthcare facilities that bend the cost curve, and semiconductor capital equipment, to name just a few. Within our high-quality strategies, we’ve also been buying more of the companies that we know best, those in which we have the highest confidence, because of their demonstrated ability to deal effectively with adversity in previous down markets.
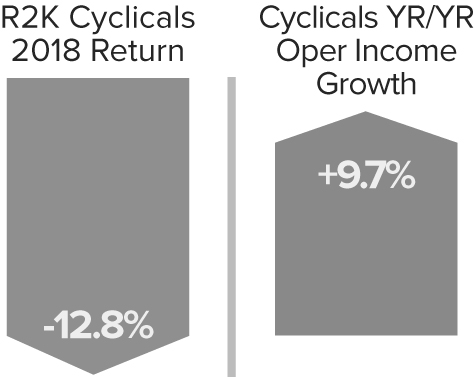
Within these cyclical sectors, especially in the broad industrial and technology spaces, there are diverse industry groups with distinct business cycle dynamics. Each responds to multiple company- or industry-specific factors that help to determine performance as a business—they seldom march in lockstep. That diversity is very attractive to us as selective active managers. So while there’s no question that we were incorrect in thinking that investors would more readily recognize and then close the gap between operating income and stock prices, we think that many small-cap cyclical companies were disproportionately punished in the downturn to the point where many look as if a recession has already been priced in—which makes them even more attractive to us. |
| |
| Cyclical Market Disconnect |
| Across each of our small-cap strategies, we are confident in our holdings, which generally possess some combination of solid cash flows, modest valuations, effective managements, and encouraging prospects. These are the businesses that look most likely to weather or even thrive in a period with even more volatility and uncertainty than usual. |
 | |  | |  |
| Charles M. Royce | | Christopher D. Clark | | Francis D. Gannon |
| Chairman, | | Chief Executive Officer, and | | Co-Chief Investment Officer, |
| Royce & Associates, LP | | Co-Chief Investment Officer, | | Royce & Associates, LP |
| | | Royce & Associates, LP | | |
| | | | | |
| January 31, 2019 | | | | |
| 4 | This page is not part of the Royce Capital Fund 2018 Annual Report to Shareholders |
Performance and Expenses
| |
| Performance and Expenses |
| As of December 31, 2018 |
| | | 1-YR | | 3-YR | | 5-YR | | 10-YR | | 15-YR | | 20-YR | | SINCE
INCEPTION
(12/27/96) | | ANNUAL OPERATING
EXPENSES (%)
GROSS/NET |
| |
| Royce Capital Fund–Micro-Cap Portfolio | | -9.04 | | 4.63 | | -0.67 | | 8.55 | | 4.94 | | 8.68 | | 9.01 | | 1.47/1.42 |
| |
| Royce Capital Fund–Small-Cap Portfolio | | -8.34 | | 5.32 | | 1.24 | | 9.78 | | 7.21 | | 9.40 | | 9.76 | | 1.11/1.08 |
| |
INDEX | | | | | | | | | | | | | | | | |
| |
| Russell Microcap Index | | -13.08 | | 5.79 | | 3.08 | | 11.71 | | 5.67 | | N/A | | N/A | | N/A |
| |
| Russell 2000 Index | | -11.01 | | 7.36 | | 4.41 | | 11.97 | | 7.50 | | 7.40 | | N/A | | N/A |
| |
Important Performance, Expense, and Risk Information
All performance information in this Review and Report reflects past performance, is presented on a total return basis, reflects the reinvestment of distributions, and does not reflect the deduction of taxes that a shareholder would pay on fund distributions or the redemption of fund shares. Past performance is no guarantee of future results. Investment return and principal value of an investment will fluctuate, so that shares may be worth more or less than their original cost when redeemed. Current performance may be higher or lower than performance quoted and may be obtained at www.roycefunds.com. The Funds’ total returns do not reflect any deduction for charges or expenses of the variable contracts investing in the Funds. All performance and expense information reflects the result for each Fund’s Investment Class Shares. Gross annual operating expenses reflect each Fund’s gross total annual operating expenses and include management fees, operating expenses, and any applicable acquired fund fees and expenses. Net annual operating expenses reflect contractual fee waivers and/or expense reimbursements. All expense information is reported as of each fund’s most current prospectus. Royce & Associates has contractually agreed to waive fees and/or reimburse operating expenses, excluding brokerage commissions, taxes, interest litigation expenses, acquired fund fees and expenses, and other expenses not borne in the ordinary cost of business, to the extent necessary to maintain net operating expenses at or below 1.33% for Royce Capital Fund–Micro-Cap Portfolio, and at or below 1.08% for Royce Capital Fund–Small-Cap Portfolio through April 30, 2019. Acquired fund fees and expenses reflect the estimated amount of fees and expenses incurred indirectly by the Fund through its investment in mutual funds, hedge funds, private equity funds, and other investment companies.
Service Class Shares bear an annual distribution expense that is not borne by the Investment Class; if those expenses were reflected, total returns would have been lower. Royce Micro-Cap Portfolio invests primarily in micro-cap companies while Royce Small-Cap Portfolio invests primarily in small-cap companies. Investments in micro-cap and small-cap companies may involve considerably more risk than investments in securities of larger-cap companies. (Please see “Primary Risks for Fund Investors” in the prospectus.) Each series of Royce Capital Fund may invest up to 25% of its net assets in foreign securities. Investments in foreign securities may involve political, economic, currency, and other risks not encountered in U.S. investments. (Please see “Investing in Foreign Securities” in the prospectus.) As of 12/31/18, Royce Small-Cap Portfolio invested a significant portion of its assets in a limited number of stocks, which may involve considerably more risk than a more broadly diversified portfolio because a decline in the value of any one of these stocks would cause the Portfolio’s overall value to decline to a greater degree. Royce Micro-Cap Portfolio’s broadly diversified portfolio does not ensure a profit or guarantee against loss. (Please see “Primary Risks for Fund Investors” in the prospectus.) This Review and Report must be preceded or accompanied by a prospectus. Please read the prospectus carefully before investing or sending money. Russell Investment Group is the source and owner of the trademarks, service marks, and copyrights related to the Russell Indexes. Russell® is a trademark of Russell Investment Group. The Russell Microcap Index includes 1,000 of the smallest securities in the small-cap Russell 2000 Index along with the next smallest eligible securities as determined by Russell. The Russell 2000 Index is an unmanaged, capitalization-weighted index of domestic small-cap stocks. It measures the performance of the 2,000 smallest publicly traded U.S. companies in the Russell 3000 Index. The performance of an index does not represent exactly any particular investment, as you cannot invest directly in an index. Distributor: Royce Fund Services, LLC.
| This page is not part of the Royce Capital Fund 2018 Annual Report to Shareholders | 5 |
| MANAGERS’ DISCUSSION |
| Royce Capital Fund–Micro-Cap Portfolio (RCM) |
 |
Jim Stoeffel
Brendan Hartman |
| |
| FUND PERFORMANCE |
| Royce Capital Fund–Micro-Cap Portfolio held an advantage over its benchmarks for the calendar-year period, in large part due to losing less during the downturn that hit the markets from September through the end of the year. The Fund fell 9.0% in 2018 compared to the Russell Microcap and Russell 2000 Indexes, which fell 13.1% and 11.0%, respectively, for the same period. |
| |
| WHAT WORKED... AND WHAT DIDN’T |
| Six of the portfolio’s 10 equity sectors detracted from performance in 2018. Financials, Industrials, and Energy made the largest negative impacts while Health Care made the biggest positive contribution, followed by Information Technology, historically one of our heaviest weightings. We were pleased to see these contributions because accruing positive performance was no small feat during such a difficult year. In fact, most of the cyclical areas where we focus struggled in 2018, including machinery (Industrials), which was the portfolio’s top detractor at the industry level. This group was followed by energy equipment & services holdings (Energy), which were mostly hurt by plummeting oil prices, while holdings in capital markets (Financials) slumped because most of our positions are asset management companies, an industry that is often sensitive to market pullbacks. |
| Lydall, the Fund’s top-detracting position in 2018, is a machinery company that manufactures an assortment of specialized products with automotive and industrial applications. A multi-year restructuring effort in the company’s Thermal/Acoustical Solutions segment has been slow to generate positive returns, a problem exacerbated by slowing light vehicle sales. We built our position as we believe recent data points to a bottom for its margins while we remain cognizant of the risks inherent in its end market exposure. Ultra Clean Holdings provides gas panel subsystems to semiconductor equipment manufacturers. Its shares were hurt by the global slowdown in semiconductor equipment production. We added to our position as we believe the recent acquisition of Quantum Global, which provides ultra-purity cleaning solutions to the semiconductor equipment industry, can strengthen Ultra Clean’s already formidable competitive position. |
| Health care equipment & supplies (Health Care) was the Fund’s top-contributing industry, with results driven by positive performance for five of our six holdings, including AtriCure, Tactile Systems Technology, and CryoLife. Positive results also came from electronic equipment, instruments & components (Information Technology), where Fabrinet and laser solutions company Electro Scientific Industries, which was acquired at a 100% premium, boosted performance. The Fund’s top contributor at the position level was Attunity, which makes database management software that addresses the increasing need for rapid access to data. Its shares benefited from the accelerating adoption of its products, which lifted enterprise sales. We trimmed our stake but maintained a position as we see its opportunity as relatively open ended in the intermediate term. |
| Relative to the Russell Microcap, stock selection drove calendar-year results while sector allocation detracted somewhat. The largest stock selection advantage came from Information Technology, where our holdings in electronic equipment, instruments & components, specifically Fabrinet and Electro Scientific Industries, did most to drive results. Stock picking in Health Care, Consumer Discretionary, and Industrials also boosted relative performance. In the first sector, health care equipment & supplies dominated. In Industrials, electrical equipment did best while auto components and household durables stood out in Consumer Discretionary. Financials was the largest detractor for the calendar-year period, mostly due to stock picking issues in the aforementioned capital markets group, where Westwood Holdings Group detracted most. Energy also had a negative relative effect, mostly due to poor stock selection in energy equipment & services. Smaller detractions came from Consumer Staples and Utilities. |
| | | | | |
| | Top Contributors to Performance | | | |
| | For 2018 (%)1 | | | |
| | | | | |
| | Attunity | | 1.03 | |
| | | |
| | American Superconducter | | 0.68 | |
| | | |
| | QuinStreet | | 0.55 | |
| | | |
| | Electro Scientific Industries | | 0.54 | |
| | | |
| | AtriCure | | 0.48 | |
| | | |
| | 1 Includes dividends | | | |
| | Top Detractors from Performance | | | |
| | For 2018 (%)2 | | | |
| | | | | |
| | Lydall | | -0.55 | |
| | | |
| | Ultra Clean Holdings | | -0.55 | |
| | | |
| | Paratek Pharmaceuticals | | -0.51 | |
| | | |
| | FreightCar America | | -0.47 | |
| | | |
| | Francesca’s Holdings | | -0.43 | |
| | | |
| | 2 Net of dividends | | | |
| | | | | |
| CURRENT POSITIONING AND OUTLOOK |
| We used the sharp pullback to allocate capital from lower-conviction names into those in which we had greater confidence, including several in Information Technology, which saw many stocks particularly hard hit on concerns over slowing global growth, a trade war with China, tariff-related supply chain issues, and short-term oversupply in memory semiconductors. We believe all of the longer-term positive demand drivers in the technology sector, a long list that includes growing storage demand, increasing mobility, and connectedness encompassing the “Internet of Things,” remain intact and should benefit the industry’s high-quality micro-cap companies. We also maintained a sizable exposure to Consumer Discretionary. Health Care was one of our most underweighted sectors, although we began to add a few new ideas in the fourth quarter when valuations looked particularly attractive to us. These weightings are consistent with the portfolio’s historical emphasis on cyclical areas while also reflecting our confidence in the ongoing growth of the U.S. economy. We remain optimistic about the prospects for micro-cap stocks in this still-vibrant environment. Anticipating more robust growth in the U.S. relative to the rest of the globe, we stayed primarily focused on companies that derive most of their revenues from the U.S. economy. |
| 6 | Royce Capital Fund 2018 Annual Report to Shareholders |
| PERFORMANCE AND PORTFOLIO REVIEW | | TICKER SYMBOLS RCMCX RCMSX |
| Performance and Expenses |
| Average Annual Total Return (%) Through 12/31/18 |
| | | JUL-DEC 20181 | | 1-YR | | 3-YR | | 5-YR | | 10-YR | | 15-YR | | 20-YR | | SINCE INCEPTION (12/27/96) |
| |
| RCM | | -17.54 | | -9.04 | | 4.63 | | -0.67 | | 8.55 | | 4.94 | | 8.68 | | 9.01 |
| |
| Annual Gross Operating Expenses: 1.47% Annual Net Operating Expenses: 1.42% |
| |
| 1 Not annualized | | | | | | | | | | | | | | | | |
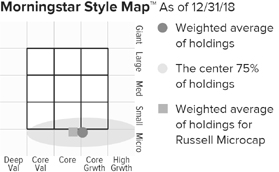
The Morningstar Style Map is the Morningstar Style BoxTM with the center 75% of fund holdings plotted as the Morningstar Ownership ZoneTM. The Morningstar Style Box is designed to reveal a fund’s investment strategy. The Morningstar Ownership Zone provides detail about a portfolio’s investment style by showing the range of stock sizes and styles. The Ownership Zone is derived by plotting each stock in the portfolio within the proprietary Morningstar Style Box. Over time, the shape and location of a fund’s ownership zone may vary. See page 28 for additional information. |
Value of $10,000Invested on 6/30/00 (Russell Microcap Inception)
as of 12/31/18 ($)
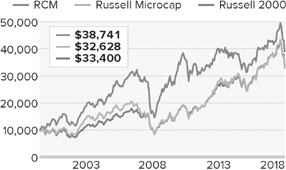
Includes reinvestment of distributions.
| |
| Top 10 Positions | | |
| % of Net Assets | | |
| | | |
| Attunity | | 1.1 |
| |
| American Superconducter | | 1.1 |
| |
| QuinStreet | | 1.1 |
| |
| Northwest Pipe | | 1.1 |
| |
| BioSpecifics Technologies | | 1.1 |
| |
| Stoneridge | | 1.1 |
| |
| Photronics | | 1.1 |
| |
| Kornit Digital | | 1.1 |
| |
| AtriCure | | 1.1 |
| |
| Graham Corporation | | 1.0 |
| |
| |
| Portfolio Sector Breakdown | | |
| % of Net Assets | | |
| | | |
| Industrials | | 22.0 |
| |
| Information Technology | | 20.5 |
| |
| Financials | | 13.7 |
| |
| Consumer Discretionary | | 13.6 |
| |
| Health Care | | 11.5 |
| |
| Energy | | 4.3 |
| |
| Materials | | 3.4 |
| |
| Consumer Staples | | 2.5 |
| |
| Real Estate | | 2.4 |
| |
| Communication Services | | 1.9 |
| |
| Cash and Cash Equivalents | | 4.2 |
| |
| |
| Calendar Year Total Returns (%) | | |
| | | |
| YEAR | | RCM |
| |
| 2018 | | -9.0 |
| |
| 2017 | | 5.2 |
| |
| 2016 | | 19.7 |
| |
| 2015 | | -12.5 |
| |
| 2014 | | -3.6 |
| |
| 2013 | | 21.0 |
| |
| 2012 | | 7.6 |
| |
| 2011 | | -12.1 |
| |
| 2010 | | 30.1 |
| |
| 2009 | | 57.9 |
| |
| 2008 | | -43.3 |
| |
| 2007 | | 4.0 |
| |
| 2006 | | 21.1 |
| |
| 2005 | | 11.6 |
| |
| 2004 | | 13.8 |
| |
| |
| Upside/Downside Capture Ratios | | | | |
| Periods Ended 12/31/18 (%) | | | | |
| | | UPSIDE | | DOWNSIDE |
| |
| 10-Year | | 77 | | 83 |
| |
From 6/30/00 (Russell
Microcap Inception) | | 89 | | 79 |
| |
| |
| Portfolio Diagnostics | | |
| | | |
| Fund Net Assets | | $142 million |
| |
| Number of Holdings | | 142 |
| |
| Turnover Rate | | 28% |
| |
| Average Market Capitalization1 | | $399 million |
| |
| Weighted Average P/B Ratio2 | | 1.7x |
| |
| Active Share3 | | 90% |
| |
| U.S. Investments (% of Net Assets) | | 84.0% |
| |
| Non-U.S. Investments (% of Net Assets) | | 11.8% |
| |
| 1 | Geometric Average. This weighted calculation uses each portfolio holding’s market cap in a way designed to not skew the effect of very large or small holdings; instead, it aims to better identify the portfolio’s center, which Royce believes offers a more accurate measure of average market cap than a simple mean or median. |
| 2 | Harmonic Average. This weighted calculation evaluates a portfolio as if it were a single stock and measures it overall. It compares the total market value of the portfolio to the portfolio’s share in the earnings or book value, as the case may be, of its underlying stocks. |
| 3 | Active Share is the sum of the absolute values of the different weightings of each holding in the Fund versus each holding in the benchmark, divided by two. |
| Important Performance and Expense Information
All performance information in this Report reflects past performance, is presented on a total return basis, reflects the reinvestment of distributions, and does not reflect the deduction of taxes that a shareholder would pay on fund distributions or the redemption of fund shares. Past performance is no guarantee of future results. Investment return and principal value of an investment will fluctuate, so that shares may be worth more or less than their original cost when redeemed. Current performance may be higher or lower than performance quoted. The Fund’s total returns do not reflect any deduction for charges or expenses of the variable contracts investing in the Fund. Returns as of the most recent month-end may be obtained at www.roycefunds.com. All performance and risk information reflects the result of the Investment Class (its oldest class). Shares of RCM’s Service Class bear an annual distribution expense that is not borne by the Investment Class; if those expenses were reflected, total returns would have been lower. Certain immaterial adjustments were made to the net assets of Royce Capital Fund-Micro-Cap Portfolio at 12/31/17 for financial reporting purposes, and as a result the calendar year total returns based on those net assets values differ from the adjusted net values and calendar year total returns reported in the Financial Highlights. The Fund’s total returns do not reflect any deduction for charges or expenses of the variable contracts investing in the Fund. Gross operating expenses reflect the Fund’s total gross operating expenses for the Investment Class and include management fees, other expenses, and acquired fund fees and expenses. Net operating expenses reflect contractual fee waivers and/or expense reimbursements. All expense information is reported as of the Fund’s most current prospectus. Royce & Associates has contractually agreed, without right of termination, to waive fees and/or reimburse expenses to the extent necessary to maintain the Investment Class’s net annual operating expenses (excluding brokerage commissions, taxes, interest, litigation expenses, acquired fund fees and expenses, and other expenses not borne in the ordinary course of business) at or below 1.33% through April 30, 2019. Acquired fund fees and expenses reflect the estimated amount of the fees and expenses incurred indirectly by the Fund through its investments in mutual funds, hedge funds, private equity funds, and other investment companies. Regarding the “Top Contributors” and “Top Detractors” tables shown above, the sum of all contributors to, and all detractors from, performance for all securities in the portfolio would approximate the Fund’s year-to-date performance for 2018. Upside Capture Ratio measures a manager’s performance in up markets relative to the Fund’s benchmark. It is calculated by measuring the Fund’s performance in quarters when the benchmark went up and dividing it by the benchmark’s return in those quarters. Downside Capture Ratio measures a manager’s performance in down markets relative to the Fund’s benchmark (Russell Microcap). It is calculated by measuring the Fund’s performance in quarters when the benchmark goes down and dividing it by the benchmark’s return in those quarters.
|
| Royce Capital Fund 2018 Annual Report to Shareholders | 7 |
Schedule of Investments
| |
| Royce Capital Fund - Micro-Cap Portfolio | | | | | | | |
| Common Stocks - 95.8% | | | | | | | |
| | | SHARES | | | | VALUE | |
| |
| |
| COMMUNICATION SERVICES – 1.9% | | | | | | | |
| DIVERSIFIED TELECOMMUNICATION SERVICES - 0.7% | | | | | | | |
ORBCOMM 1 | | 117,500 | | | $ | 970,550 | |
| | | | | | | |
| INTERACTIVE MEDIA & SERVICES - 1.1% | | | | | | | |
QuinStreet 1 | | 97,500 | | | | 1,582,425 | |
| | | | | | | |
| MEDIA - 0.1% | | | | | | | |
†Marchex Cl. B | | 77,500 | | | | 205,375 | |
| |
| Total (Cost $1,291,450) | | | | | | 2,758,350 | |
| |
| | | | | | | | |
| CONSUMER DISCRETIONARY – 13.6% | | | | | | | |
| AUTO COMPONENTS - 2.9% | | | | | | | |
Fox Factory Holding 1 | | 16,500 | | | | 971,355 | |
Standard Motor Products | | 18,900 | | | | 915,327 | |
Stoneridge 1 | | 63,400 | | | | 1,562,810 | |
Unique Fabricating | | 165,000 | | | | 696,300 | |
| | | | | | | |
| | | | | | | 4,145,792 | |
| | | | | | | |
| HOTELS, RESTAURANTS & LEISURE - 2.7% | | | | | | | |
†Century Casinos 1 | | 108,600 | | | | 802,554 | |
Del Taco Restaurants 1 | | 101,500 | | | | 1,013,985 | |
†Lindblad Expeditions Holdings 1 | | 62,400 | | | | 839,904 | |
Red Lion Hotels 1 | | 146,300 | | | | 1,199,660 | |
| | | | | | | |
| | | | | | | 3,856,103 | |
| | | | | | | |
| HOUSEHOLD DURABLES - 1.4% | | | | | | | |
Cavco Industries 1 | | 5,504 | | | | 717,611 | |
†Lovesac Company 1, 2 | | 56,600 | | | | 1,298,404 | |
| | | | | | | |
| | | | | | | 2,016,015 | |
| | | | | | | |
| INTERNET & DIRECT MARKETING RETAIL - 0.7% | | | | | | | |
Gaia Cl. A 1 | | 89,900 | | | | 931,364 | |
| | | | | | | |
| LEISURE PRODUCTS - 1.4% | | | | | | | |
MasterCraft Boat Holdings 1 | | 46,817 | | | | 875,478 | |
Nautilus 1 | | 102,500 | | | | 1,117,250 | |
| | | | | | | |
| | | | | | | 1,992,728 | |
| | | | | | | |
| SPECIALTY RETAIL - 3.5% | | | | | | | |
Build-A-Bear Workshop 1 | | 97,700 | | | | 385,915 | |
Citi Trends | | 47,886 | | | | 976,396 | |
Haverty Furniture | | 65,700 | | | | 1,233,846 | |
Kirkland’s 1 | | 113,900 | | | | 1,085,467 | |
Shoe Carnival | | 39,600 | | | | 1,326,996 | |
| | | | | | | |
| | | | | | | 5,008,620 | |
| | | | | | | |
| TEXTILES, APPAREL & LUXURY GOODS - 1.0% | | | | | | | |
Culp | | 30,649 | | | | 579,266 | |
Vera Bradley 1 | | 102,500 | | | | 878,425 | |
| | | | | | | |
| | | | | | | 1,457,691 | |
| |
| Total (Cost $18,385,203) | | | | | | 19,408,313 | |
| |
| | | | | | | | |
| CONSUMER STAPLES – 2.5% | | | | | | | |
| BEVERAGES - 0.7% | | | | | | | |
Primo Water 1 | | 69,900 | | | | 979,299 | |
| | | | | | | |
| FOOD PRODUCTS - 1.8% | | | | | | | |
Farmer Bros. 1 | | 47,800 | | | | 1,115,174 | |
John B. Sanfilippo & Son | | 18,100 | | | | 1,007,446 | |
†Landec Corporation 1 | | 34,900 | | | | 413,216 | |
| | | | | | | |
| | | | | | | 2,535,836 | |
| |
| Total (Cost $3,661,937) | | | | | | 3,515,135 | |
| |
| | | | | | | | |
| ENERGY – 4.3% | | | | | | | |
| ENERGY EQUIPMENT & SERVICES - 3.8% | | | | | | | |
Gulf Island Fabrication 1 | | 92,634 | | | | 668,818 | |
Independence Contract Drilling 1 | | 301,600 | | | | 940,992 | |
Natural Gas Services Group 1 | | 59,600 | | | | 979,824 | |
Newpark Resources 1 | | 164,300 | | | | 1,128,741 | |
Profire Energy 1 | | 486,229 | | | | 705,032 | |
Total Energy Services | | 139,300 | | | | 996,895 | |
| | | | | | | |
| | | | | | | 5,420,302 | |
| | | | | | | |
| OIL, GAS & CONSUMABLE FUELS - 0.5% | | | | | | | |
Ardmore Shipping 1 | | 136,000 | | | | 635,120 | |
| |
| Total (Cost $7,343,600) | | | | | | 6,055,422 | |
| |
| | | | | | | | |
| FINANCIALS – 13.7% | | | | | | | |
| BANKS - 7.3% | | | | | | | |
Allegiance Bancshares 1 | | 29,000 | | | | 938,730 | |
†BayCom Corporation 1 | | 34,682 | | | | 800,807 | |
Brookline Bancorp | | 64,200 | | | | 887,244 | |
Caribbean Investment Holdings 1 | | 1,751,547 | | | | 379,529 | |
County Bancorp | | 52,400 | | | | 910,188 | |
HarborOne Bancorp 1 | | 74,200 | | | | 1,179,038 | |
†HomeTrust Bancshares | | 44,700 | | | | 1,170,246 | |
†Investar Holding | | 46,200 | | | | 1,145,760 | |
Midway Investments 1, 3 | | 1,751,577 | | | | 0 | |
Stewardship Financial | | 92,000 | | | | 837,200 | |
TriState Capital Holdings 1 | | 51,072 | | | | 993,861 | |
Two River Bancorp | | 72,400 | | | | 1,104,824 | |
| | | | | | | |
| | | | | | | 10,347,427 | |
| | | | | | | |
| CAPITAL MARKETS - 2.9% | | | | | | | |
B. Riley Financial | | 71,600 | | | | 1,016,720 | |
Canaccord Genuity Group | | 260,000 | | | | 1,098,887 | |
Silvercrest Asset Management Group Cl. A | | 94,200 | | | | 1,246,266 | |
Westwood Holdings Group | | 23,427 | | | | 796,518 | |
| | | | | | | |
| | | | | | | 4,158,391 | |
| | | | | | | |
| DIVERSIFIED FINANCIAL SERVICES - 0.3% | | | | | | | |
Waterloo Investment Holdings 1, 3 | | 1,302,000 | | | | 390,600 | |
| | | | | | | |
| INSURANCE - 0.5% | | | | | | | |
†Health Insurance Innovations Cl. A 1, 2 | | 28,500 | | | | 761,805 | |
| | | | | | | |
| THRIFTS & MORTGAGE FINANCE - 2.7% | | | | | | | |
PCSB Financial | | 65,700 | | | | 1,285,092 | |
Territorial Bancorp | | 43,700 | | | | 1,135,326 | |
Western New England Bancorp | | 142,354 | | | | 1,429,234 | |
| | | | | | | |
| | | | | | | 3,849,652 | |
| |
| Total (Cost $22,816,140) | | | | | | 19,507,875 | |
| |
| | | | | | | | |
| HEALTH CARE – 11.5% | | | | | | | |
| BIOTECHNOLOGY - 3.2% | | | | | | | |
AMAG Pharmaceuticals 1 | | 19,600 | | | | 297,724 | |
BioSpecifics Technologies 1 | | 25,900 | | | | 1,569,540 | |
Dynavax Technologies 1 | | 53,900 | | | | 493,185 | |
Progenics Pharmaceuticals 1 | | 215,200 | | | | 903,840 | |
Zealand Pharma 1, 2 | | 101,258 | | | | 1,280,390 | |
| | | | | | | |
| | | | | | | 4,544,679 | |
| | | | | | | |
| HEALTH CARE EQUIPMENT & SUPPLIES - 5.0% | | | | | | | |
AtriCure 1 | | 48,800 | | | | 1,493,280 | |
†Chembio Diagnostics 1 | | 142,400 | | | | 805,984 | |
CryoLife 1 | | 49,489 | | | | 1,404,498 | |
OrthoPediatrics Corporation 1 | | 41,200 | | | | 1,437,056 | |
Surmodics 1 | | 23,178 | | | | 1,095,392 | |
Tactile Systems Technology 1, 2 | | 18,400 | | | | 838,120 | |
| | | | | | | |
| | | | | | | 7,074,330 | |
| | | | | | | |
| LIFE SCIENCES TOOLS & SERVICES - 2.4% | | | | | | | |
Harvard Bioscience 1 | | 336,868 | | | | 1,071,240 | |
| 8 | Royce Capital Fund 2018 Annual Report to Shareholders | | THE ACCOMPANYING NOTES ARE AN INTEGRAL PART OF THESE FINANCIAL STATEMENTS |
| |
| Royce Capital Fund - Micro-Cap Portfolio (continued) | | | | | | | |
| | | SHARES | | | | VALUE | |
| |
| |
| HEALTH CARE (continued) | | | | | | | |
| LIFE SCIENCES TOOLS & SERVICES (continued) | | | | | | | |
NeoGenomics 1 | | 88,900 | | | $ | 1,121,029 | |
†Quanterix Corporation 1 | | 67,800 | | | | 1,241,418 | |
| | | | | | | |
| | | | | | | 3,433,687 | |
| | | | | | | |
| PHARMACEUTICALS - 0.9% | | | | | | | |
Correvio Pharma 1 | | 198,800 | | | | 495,012 | |
Paratek Pharmaceuticals 1 | | 94,600 | | | | 485,298 | |
†Tetraphase Pharmaceuticals 1 | | 235,200 | | | | 265,776 | |
| | | | | | | |
| | | | | | | 1,246,086 | |
| |
| Total (Cost $13,969,418) | | | | | | 16,298,782 | |
| |
| | | | | | | | |
| INDUSTRIALS – 22.0% | | | | | | | |
| AEROSPACE & DEFENSE - 1.6% | | | | | | | |
Astronics Corporation 1 | | 37,226 | | | | 1,133,532 | |
CPI Aerostructures 1 | | 174,344 | | | | 1,110,571 | |
| | | | | | | |
| | | | | | | 2,244,103 | |
| | | | | | | |
| COMMERCIAL SERVICES & SUPPLIES - 2.1% | | | | | | | |
| Acme United | | 50,865 | | | | 724,826 | |
Heritage-Crystal Clean 1 | | 47,334 | | | | 1,089,155 | |
Viad Corporation | | 22,100 | | | | 1,106,989 | |
| | | | | | | |
| | | | | | | 2,920,970 | |
| | | | | | | |
| CONSTRUCTION & ENGINEERING - 1.7% | | | | | | | |
†Construction Partners Cl. A 1 | | 103,000 | | | | 909,490 | |
Northwest Pipe 1 | | 67,800 | | | | 1,579,062 | |
| | | | | | | |
| | | | | | | 2,488,552 | |
| | | | | | | |
| ELECTRICAL EQUIPMENT - 2.0% | | | | | | | |
American Superconducter 1 | | 144,300 | | | | 1,608,945 | |
Encore Wire | | 23,900 | | | | 1,199,302 | |
| | | | | | | |
| | | | | | | 2,808,247 | |
| | | | | | | |
| INDUSTRIAL CONGLOMERATES - 0.6% | | | | | | | |
Raven Industries | | 25,700 | | | | 930,083 | |
| | | | | | | |
| MACHINERY - 8.9% | | | | | | | |
Alimak Group | | 84,500 | | | | 1,048,748 | |
Exco Technologies | | 156,700 | | | | 1,036,479 | |
FreightCar America 1 | | 86,091 | | | | 575,949 | |
Global Brass and Copper Holdings | | 37,400 | | | | 940,610 | |
Graham Corporation | | 65,220 | | | | 1,489,625 | |
Greenbrier Companies (The) | | 16,600 | | | | 656,364 | |
Kadant | | 11,931 | | | | 971,899 | |
Kornit Digital 1, 2 | | 79,900 | | | | 1,495,728 | |
Lindsay Corporation | | 11,900 | | | | 1,145,375 | |
†Luxfer Holdings | | 42,000 | | | | 740,460 | |
Lydall 1 | | 37,000 | | | | 751,470 | |
Sun Hydraulics | | 20,100 | | | | 667,119 | |
†Twin Disc 1 | | 46,200 | | | | 681,450 | |
†Westport Fuel Systems 1 | | 312,300 | | | | 415,359 | |
| | | | | | | |
| | | | | | | 12,616,635 | |
| | | | | | | |
| MARINE - 0.6% | | | | | | | |
Clarkson | | 38,100 | | | | 922,683 | |
| | | | | | | |
| PROFESSIONAL SERVICES - 3.8% | | | | | | | |
CRA International | | 22,106 | | | | 940,610 | |
GP Strategies 1 | | 85,208 | | | | 1,074,473 | |
Heidrick & Struggles International | | 33,500 | | | | 1,044,865 | |
Kforce | | 32,600 | | | | 1,007,992 | |
Resources Connection | | 89,354 | | | | 1,268,827 | |
| | | | | | | |
| | | | | | | 5,336,767 | |
| | | | | | | |
| ROAD & RAIL - 0.7% | | | | | | | |
Marten Transport | | 59,841 | | | | 968,826 | |
| |
| Total (Cost $26,355,659) | | | | | | 31,236,866 | |
| |
| | | | | | | | |
| INFORMATION TECHNOLOGY – 20.5% | | | | | | | |
| COMMUNICATIONS EQUIPMENT - 1.2% | | | | | | | |
Digi International 1 | | 102,600 | | | | 1,035,234 | |
EMCORE Corporation 1 | | 149,300 | | | | 627,060 | |
| | | | | | | |
| | | | | | | 1,662,294 | |
| | | | | | | |
| ELECTRONIC EQUIPMENT, INSTRUMENTS & COMPONENTS - 5.9% | | | | | | | |
Airgain 1 | | 45,200 | | | | 447,932 | |
CUI Global 1 | | 298,762 | | | | 367,477 | |
ePlus 1 | | 13,792 | | | | 981,577 | |
Fabrinet 1 | | 23,769 | | | | 1,219,587 | |
Mesa Laboratories | | 6,100 | | | | 1,271,179 | |
†nLIGHT 1, 2 | | 40,300 | | | | 716,534 | |
Novanta 1 | | 16,200 | | | | 1,020,600 | |
PC Connection | | 40,000 | | | | 1,189,200 | |
Vishay Precision Group 1 | | 41,100 | | | | 1,242,453 | |
| | | | | | | |
| | | | | | | 8,456,539 | |
| | | | | | | |
| IT SERVICES - 0.9% | | | | | | | |
Cass Information Systems | | 24,048 | | | | 1,272,620 | |
| | | | | | | |
| SEMICONDUCTORS & SEMICONDUCTOR EQUIPMENT - 8.3% | | | | | | | |
†Adesto Technologies 1, 2 | | 223,100 | | | | 981,640 | |
†Aehr Test Systems 1 | | 349,500 | | | | 492,795 | |
AXT 1 | | 33,100 | | | | 143,985 | |
Brooks Automation | | 33,500 | | | | 877,030 | |
†Cohu | | 30,700 | | | | 493,349 | |
CyberOptics Corporation 1 | | 29,600 | | | | 521,848 | |
Everspin Technologies 1, 2 | | 92,500 | | | | 518,925 | |
NeoPhotonics Corporation 1 | | 165,900 | | | | 1,075,032 | |
†Nova Measuring Instruments 1 | | 53,900 | | | | 1,227,842 | |
PDF Solutions 1 | | 85,700 | | | | 722,451 | |
Photronics 1 | | 160,100 | | | | 1,549,768 | |
Rudolph Technologies 1 | | 66,793 | | | | 1,367,253 | |
Silicon Motion Technology ADR | | 26,900 | | | | 928,050 | |
Ultra Clean Holdings 1 | | 103,200 | | | | 874,104 | |
| | | | | | | |
| | | | | | | 11,774,072 | |
| | | | | | | |
| SOFTWARE - 3.6% | | | | | | | |
Agilysys 1 | | 71,700 | | | | 1,028,178 | |
Amber Road 1 | | 155,400 | | | | 1,278,942 | |
Attunity 1 | | 82,500 | | | | 1,623,600 | |
QAD Cl. A | | 31,700 | | | | 1,246,761 | |
| | | | | | | |
| | | | | | | 5,177,481 | |
| | | | | | | |
| TECHNOLOGY HARDWARE, STORAGE & PERIPHERALS - 0.6% | | | | | | | |
†AstroNova | | 43,700 | | | | 819,375 | |
| |
| Total (Cost $25,152,354) | | | | | | 29,162,381 | |
| |
| | | | | | | | |
| MATERIALS – 3.4% | | | | | | | |
| CHEMICALS - 2.1% | | | | | | | |
FutureFuel Corporation | | 62,400 | | | | 989,664 | |
Quaker Chemical | | 5,888 | | | | 1,046,356 | |
Trecora Resources 1 | | 115,400 | | | | 900,120 | |
| | | | | | | |
| | | | | | | 2,936,140 | |
| | | | | | | |
| METALS & MINING - 1.3% | | | | | | | |
Haynes International | | 38,570 | | | | 1,018,248 | |
Major Drilling Group International 1 | | 254,700 | | | | 858,204 | |
| | | | | | | |
| | | | | | | 1,876,452 | |
| |
| Total (Cost $4,952,111) | | | | | | 4,812,592 | |
| |
| | | | | | | | |
| REAL ESTATE – 2.4% | | | | | | | |
| EQUITY REAL ESTATE INVESTMENT TRUSTS (REITS) - 0.8% | | | | | | | |
Community Healthcare Trust | | 40,200 | | | | 1,158,966 | |
| | | | | | | |
| REAL ESTATE MANAGEMENT & DEVELOPMENT - 1.6% | | | | | | | |
FRP Holdings 1 | | 23,440 | | | | 1,078,474 | |
| THE ACCOMPANYING NOTES ARE AN INTEGRAL PART OF THESE FINANCIAL STATEMENTS | | Royce Capital Fund 2018 Annual Report to Shareholders | 9 |
Schedule of Investments
| |
| Royce Capital Fund - Micro-Cap Portfolio (continued) |
| | | SHARES | | | VALUE | |
| |
| |
| REAL ESTATE (continued) | | | | | | | |
| REAL ESTATE MANAGEMENT & DEVELOPMENT (continued) | | | | | | | |
Marcus & Millichap 1 | | 35,300 | | | $ | 1,211,849 | |
| | | | | | | |
| | | | | | | 2,290,323 | |
| |
| Total (Cost $2,478,277) | | | | | | 3,449,289 | |
| |
| | | | | | | | |
| TOTAL COMMON STOCKS | | | | | | | |
| |
| (Cost $126,406,149) | | | | | | 136,205,005 | |
| |
| | | | | | | | |
| REPURCHASE AGREEMENT – 3.7% | | | | | | | |
Fixed Income Clearing Corporation, 0.50% dated 12/31/18, due 1/2/19, maturity value
$5,267,146 (collateralized by obligations of various U.S. Government Agencies, 2.125%
due 07/31/24, valued at $5,372,613) |
| | | | | | | | |
| |
| (Cost $5,267,000) | | | | | | 5,267,000 | |
| |
| | | | | | | | |
| COLLATERAL RECEIVED FOR SECURITIES LOANED – 2.8% | | | | | | | |
| Money Market Funds | | | | | | | |
Federated Government Obligations Fund (7 day yield-2.2268%) | | | | | | | |
| |
| (Cost $3,911,179) | | | | | | 3,911,179 | |
| |
| | | | | | | | |
| TOTAL INVESTMENTS – 102.3% | | | | | | | |
| |
| (Cost $135,584,328) | | | | | | 145,383,184 | |
| |
| | | | | | | | |
| LIABILITIES LESS CASH AND OTHER ASSETS – (2.3)% | | | | | | (3,282,344 | ) |
| | | | | | | |
| | | | | | | | |
| |
| NET ASSETS – 100.0% | | | | | $ | 142,100,840 | |
| |
| | ADR – American Depository Receipt |
| | |
| † | New additions in 2018. |
| 1 | Non-income producing. |
| 2 | All or a portion of these securities were on loan at December 31, 2018. |
| 3 | Securities for which market quotations are not readily available represent 0.3% of net assets. These securities have been valued at their fair value under procedures approved by the Fund’s Board of Trustees. These securities are defined as Level 3 securities due to the use of significant unobservable inputs in the determination of fair value. See Notes to Financial Statements. |
| | |
| | Bold indicates the Fund’s 20 largest equity holdings in terms of December 31, 2018, market value. |
| 10 | Royce Capital Fund 2018 Annual Report to Shareholders | | THE ACCOMPANYING NOTES ARE AN INTEGRAL PART OF THESE FINANCIAL STATEMENTS |
This page is intentionally left blank.
| Royce Capital Fund 2018 Annual Report to Shareholders | 11 |
| MANAGER’S DISCUSSION |
| Royce Capital Fund—Small-Cap Portfolio (RCS) |
 |
| Jay Kaplan, CFA |
| |
| FUND PERFORMANCE |
| In the context of a down year, we were about as pleased as we could be with the performance for Royce Capital Fund–Small-Cap Portfolio. Demonstrating better downside protection, the Fund was down 8.3% in 2018 versus a loss of 11.0% for the Russell 2000 Index, its small-cap benchmark, for the same period. |
| |
| WHAT WORKED... AND WHAT DIDN’T |
| Six of the Fund’s 10 equity sectors finished 2018 in the red, with the largest negative impact coming from Financials, with Industrials following. These broad and diverse cyclical sectors were also the portfolio’s largest at year-end, along with Information Technology. Modest positive contributions could be found in Health Care, Consumer Staples, Real Estate, and Consumer Discretionary. Banks (Financials) detracted most at the industry level by a wide margin in 2018, followed by semiconductors & semiconductor equipment companies (Information Technology), capital markets, and thrifts & mortgage finance, the latter two also from Financials. We were overweight versus the benchmark in all three of these financial industries at the end of 2018. Our positive stance on banks—our largest exposure among Financials—is based on two factors: First is our belief that the long-term direction of interest rates is upward, with a steepening yield curve. Second, and at least equally important, is that the banks we hold are smaller, generally community-centered businesses that we chose because we saw attributes that go beyond overall improved conditions for the industry which should help them recover. They have some combination of a strong deposit franchise, impressive loan growth, and/or a strong geographic moat. |
| The electronic equipment, instruments & components (Information Technology) group was home to five of the portfolio’s top 20 contributors, including Electro Scientific Industries, which was acquired by MKS Instruments at a 100% premium, and contract manufacturer Fabrinet. However, this group was also home to the Fund’s biggest detractor at the position level, Methode Electronics, which has a global business in component manufacturing. The costs of an acquisition as well as a slowdown in its automotive end market helped to depress earnings. Wabash National is an industrial company that makes a variety of truck trailers. We like its core business and record of successful execution, but its earnings were adversely affected in 2018 by rising supply and labor costs as well as freight issues that made picking up trailers difficult for many customers. Hawaiian Holdings operates a regional airline in that state as well as on the West Coast and in the South Pacific. Weather-related scares and the prospect of increased competition helped to ground its stock, but we see the first issue as temporary and like the firm’s ability to successfully compete in its core geographic region. |
| For the portfolio as a whole in 2018, stock selection was a greater factor in relative outperformance than allocation, though both contributed. Energy was by far the worst-performing sector in the Russell 2000 in 2018. It also provided the Fund with its largest advantage versus the benchmark, driven by a combination of having no exposure to its oil, gas & consumable fuels group and better stock picking in its energy equipment & services industry. Savvy stock selection in Consumer Discretionary provided another significant relative edge, most impactfully in specialty retail where Shoe Carnival and DSW led. Stock selection was also a strength in Industrials, most notably in machinery. |
| A stock selection disadvantage in Financials hurt relative performance most, the capital markets group disappointing in large part due to poor results for asset managers such as Federated Investors, a position we exited in the fourth quarter. The portfolio’s low exposure to Utilities also dampened relative returns. The sector is often seen as a relatively safe haven during challenging markets, and 2018 was no exception as it was the only Russell 2000 sector to finish the year in the black. Both ineffective stock picking and our lower weighting also led to a modest detraction in Communication Services. |
| | | | | |
| | Top Contributors to Performance | | | |
| | For 2018 (%)1 | | | |
| | | | | |
| | Electro Scientific Industries | | 1.61 | |
| | | |
| | Fabrinet | | 1.09 | |
| | | |
| | Shoe Carnival | | 0.67 | |
| | | |
| | DSW Cl. A | | 0.51 | |
| | | |
| | Nutrisystem | | 0.49 | |
| | | |
| | 1 Includes dividends | | | |
| | Top Detractors from Performance | | | |
| | For 2018 (%)2 | | | |
| | | | | |
| | Methode Electronics | | -0.92 | |
| | | |
| | Wabash National | | -0.83 | |
| | | |
| | Hawaiian Holdings | | -0.77 | |
| | | |
| | Cooper-Standard Holdings | | -0.73 | |
| | | |
| | Advanced Energy Industries | | -0.72 | |
| | | |
| | 2 Net of dividends | | | |
| | | | | |
| CURRENT POSITIONING AND OUTLOOK |
| Risks can be found throughout the economy and markets. Stocks continue to trade as if investors see an imminent recession; inflation is apparent in supply chains and labor costs, which threatens margin expansion; the anniversary of the tax cuts has arrived, which will slow earnings growth; and the Fed’s subsequent path is unclear, even in light of Chair Powell’s slightly more dovish tone in early January. Our own view is that a recession looks unlikely over the next several months—and may be even further out than that. In our view, growth does not appear ready to contract but rather continue to slow. Given the severity of the market’s decline, we believe this has created interesting valuations within the small-cap marketplace. Within the portfolio, we think the risk/return relationship looks more attractive than it has in some time. We have therefore been adding to those holdings where we see both good value and strong potential while also initiating positions where our analyses have uncovered the same combination among a diverse set of companies involved in aerospace & defense, trucking, investment management, banks, and technology. |
| 12 | Royce Capital Fund 2018 Annual Report to Shareholders |
| PERFORMANCE AND PORTFOLIO REVIEW | | TICKER SYMBOLS RCPFX RCSSX |
| Performance and Expenses |
| Average Annual Total Return (%) Through 12/31/18 |
| | | JUL-DEC 20181 | | 1-YR | | 3-YR | | 5-YR | | 10-YR | | 15-YR | | 20-YR | | SINCE INCEPTION (12/27/96) |
| |
| RCS | | -14.39 | | -8.34 | | 5.32 | | 1.24 | | 9.78 | | 7.21 | | 9.40 | | 9.76 |
| |
| Annual Gross Operating Expenses: 1.11% Annual Net Operating Expenses: 1.08% |
| |
| 1 Not annualized | | | | | | | | | | | | | | | | |
Relative Returns: Monthly Rolling Average Annual Return Periods20 Years Through 12/31/18
| On a monthly rolling basis, the Fund outperformed the Russell 2000 in 64% of all 10-year periods; 61% of all 5-year periods; and 50% of all 1-year periods. |
| |
| | | PERIODS BEATING THE INDEX | | | | FUND AVG (%)1 | | INDEX AVG (%)1 |
| |
| 10-year | | 77/121 | | | | | | 64% | | 8.7 | | 7.2 |
| |
| 5-year | | 110/181 | | | | | | 61% | | 10.2 | | 8.8 |
| |
| 1-year | | 115/229 | | | | | | 50% | | 12.1 | | 10.3 |
| |
1Average of monthly rolling average annual total returns over the specified periods.

The Morningstar Style Map is the Morningstar Style BoxTM with the center 75% of fund holdings plotted as the Morningstar Ownership ZoneTM. The Morningstar Style Box is designed to reveal a fund’s investment strategy. The Morningstar Ownership Zone provides detail about a portfolio’s investment style by showing the range of stock sizes and styles. The Ownership Zone is derived by plotting each stock in the portfolio within the proprietary Morningstar Style Box. Over time, the shape and location of a fund’s ownership zone may vary. See page 28 for additional information. |
Value of $10,000Invested on 12/27/96 as of 12/31/18 ($)
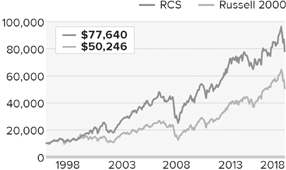
Includes reinvestment of distributions.
| |
| Top 10 Positions | | |
| % of Net Assets | | |
| | | |
| Insight Enterprises | | 2.5 |
| |
| Miller Industries | | 2.5 |
| |
| Genworth MI Canada | | 2.5 |
| |
| Vishay Intertechnology | | 2.4 |
| |
| Kulicke & Soffa Industries | | 2.3 |
| |
| Saga Communications Cl. A | | 2.2 |
| |
| PC Connection | | 2.2 |
| |
| Village Super Market Cl. A | | 2.2 |
| |
| Advanced Energy Industries | | 2.1 |
| |
| Celestica | | 2.1 |
| |
| |
| Portfolio Sector Breakdown | | |
| % of Net Assets | | |
| | | |
| Financials | | 27.7 |
| |
| Industrials | | 23.5 |
| |
| Information Technology | | 21.3 |
| |
| Consumer Discretionary | | 13.5 |
| |
| Communication Services | | 2.2 |
| |
| Consumer Staples | | 2.2 |
| |
| Energy | | 1.4 |
| |
| Real Estate | | 1.0 |
| |
| Health Care | | 0.7 |
| |
| Utilities | | 0.4 |
| |
| Cash and Cash Equivalents | | 6.1 |
| |
| |
| Calendar Year Total Returns (%) | | |
| | | |
| YEAR | | RCS |
| |
| 2018 | | -8.3 |
| |
| 2017 | | 5.4 |
| |
| 2016 | | 21.0 |
| |
| 2015 | | -11.8 |
| |
| 2014 | | 3.2 |
| |
| 2013 | | 34.8 |
| |
| 2012 | | 12.5 |
| |
| 2011 | | -3.3 |
| |
| 2010 | | 20.5 |
| |
| 2009 | | 35.2 |
| |
| 2008 | | -27.2 |
| |
| 2007 | | -2.1 |
| |
| 2006 | | 15.6 |
| |
| 2005 | | 8.6 |
| |
| 2004 | | 25.0 |
| |
| |
| Upside/Downside Capture Ratios | | | | |
| Periods Ended 12/31/18 (%) | | | | |
| | | UPSIDE | | DOWNSIDE |
| |
| 10-Year | | 76 | | 72 |
| |
From 12/31/96 (Start of
Fund’s First Full Quarter) | | 93 | | 75 |
| |
| |
| Portfolio Diagnostics | | |
| | | |
| Fund Net Assets | | $276 million |
| |
| Number of Holdings | | 77 |
| |
| Turnover Rate | | 56% |
| |
| Average Market Capitalization1 | | $1,023 million |
| |
| Weighted Average P/B Ratio2 | | 1.6x |
| |
| Active Share3 | | 96% |
| |
| U.S. Investments (% of Net Assets) | | 83.7% |
| |
| Non-U.S. Investments (% of Net Assets) | | 10.2% |
| |
| 1 | Geometric Average. This weighted calculation uses each portfolio holding’s market cap in a way designed to not skew the effect of very large or small holdings; instead, it aims to better identify the portfolio’s center, which Royce believes offers a more accurate measure of average market cap than a simple mean or median. |
| 2 | Harmonic Average. This weighted calculation evaluates a portfolio as if it were a single stock and measures it overall. It compares the total market value of the portfolio to the portfolio’s share in the earnings or book value, as the case may be, of its underlying stocks. |
| 3 | Active Share is the sum of the absolute values of the different weightings of each holding in the Fund versus each holding in the benchmark, divided by two. |
| Important Performance and Expense Information
All performance information in this Report reflects past performance, is presented on a total return basis, reflects the reinvestment of distributions, and does not reflect the deduction of taxes that a shareholder would pay on fund distributions or the redemption of fund shares. Past performance is no guarantee of future results. Investment return and principal value of an investment will fluctuate, so that shares may be worth more or less than their original cost when redeemed. Current performance may be higher or lower than performance quoted. The Fund’s total returns do not reflect any deduction for charges or expenses of the variable contracts investing in the Fund. Returns as of the most recent month-end may be obtained at www.roycefunds.com. All performance and risk information reflects the result of the Investment Class (its oldest class). Shares of RCS’s Service Class bear an annual distribution expense that is not borne by the Investment Class; if those expenses were reflected, total returns would have been lower. Certain immaterial adjustments were made to the net assets of Royce Capital Fund-Small-Cap Portfolio at 12/31/17 for financial reporting purposes, and as a result the calendar year total returns based on those net assets values differ from the adjusted net values and calendar year total returns reported in the Financial Highlights. All performance information reflects past performance, is presented on a total return basis, reflects the reinvestment of distributions, and does not reflect the deduction of taxes that a shareholder would pay on fund distributions or the redemption of fund shares. Past performance is no guarantee of future results. Investment return and principal value of an investment will fluctuate, so that shares may be worth more or less than their original cost when redeemed. Current month-end performance may be higher or lower than performance quoted and may be obtained at www.roycefunds.com. The Fund’s total returns do not reflect any deduction for charges or expenses of the variable contracts investing in the Fund. Gross operating expenses reflect the Fund’s total gross operating expenses for the Investment Class and include management fees and other expenses. Net operating expenses reflect contractual fee waivers and/or expense reimbursements. All expense information is reported as of the Fund’s most current prospectus. Royce & Associates has contractually agreed, without right of termination, to waive fees and/or reimburse expenses to the extent necessary to maintain the Investment Class’s net annual operating expenses (excluding brokerage commissions, taxes, interest, litigation expenses, acquired fund fees and expenses, and other expenses not borne in the ordinary course of business) at or below 1.08% through April 30, 2019. Regarding the “Top Contributors” and “Top Detractors” tables shown above, the sum of all contributors to, and all detractors from, performance for all securities in the portfolio would approximate the Fund’s year-to-date performance for 2018. Upside Capture Ratio measures a manager’s performance in up markets relative to the Fund’s benchmark. It is calculated by measuring the Fund’s performance in quarters when the benchmark went up and dividing it by the benchmark’s return in those quarters. Downside Capture Ratio measures a manager’s performance in down markets relative to the Fund’s benchmark (Russell 2000). It is calculated by measuring the Fund’s performance in quarters when the benchmark goes down and dividing it by the benchmark’s return in those quarters.
|
| Royce Capital Fund 2018 Annual Report to Shareholders | 13 |
Schedule of Investments
| |
| Royce Capital Fund - Small-Cap Portfolio |
| Common Stocks – 93.9% | | | | | | | |
| | | SHARES | | | VALUE | |
| |
| | | | | | | | |
| COMMUNICATION SERVICES – 2.2% | | | | | | | |
| MEDIA - 2.2% | | | | | | | |
Saga Communications Cl. A | | 185,596 | | | $ | 6,167,355 | |
| |
| Total (Cost $7,850,276) | | | | | | 6,167,355 | |
| |
| |
| CONSUMER DISCRETIONARY – 13.5% | | | | | | | |
| AUTO COMPONENTS - 5.3% | | | | | | | |
†Cooper-Standard Holdings 1 | | 70,800 | | | | 4,398,096 | |
Gentex Corporation | | 180,416 | | | | 3,646,208 | |
Stoneridge 1 | | 111,405 | | | | 2,746,133 | |
†Visteon Corporation 1 | | 67,100 | | | | 4,044,788 | |
| | | | | | | |
| | | | | | | 14,835,225 | |
| | | | | | | |
| HOTELS, RESTAURANTS & LEISURE - 1.9% | | | | | | | |
Cheesecake Factory | | 15,615 | | | | 679,408 | |
†Hilton Grand Vacations 1 | | 172,056 | | | | 4,540,558 | |
| | | | | | | |
| | | | | | | 5,219,966 | |
| | | | | | | |
| HOUSEHOLD DURABLES - 1.0% | | | | | | | |
La-Z-Boy | | 98,286 | | | | 2,723,505 | |
| | | | | | | |
| SPECIALTY RETAIL - 4.8% | | | | | | | |
American Eagle Outfitters | | 215,465 | | | | 4,164,939 | |
†Caleres | | 137,417 | | | | 3,824,315 | |
DSW Cl. A | | 106,816 | | | | 2,638,355 | |
Shoe Carnival | | 76,312 | | | | 2,557,215 | |
| | | | | | | |
| | | | | | | 13,184,824 | |
| | | | | | | |
| TEXTILES, APPAREL & LUXURY GOODS - 0.5% | | | | | | | |
Steven Madden | | 44,706 | | | | 1,352,804 | |
| |
| Total (Cost $38,409,324) | | | | | | 37,316,324 | |
| |
| |
| CONSUMER STAPLES – 2.2% | | | | | | | |
| FOOD & STAPLES RETAILING - 2.2% | | | | | | | |
Village Super Market Cl. A | | 223,677 | | | | 5,981,123 | |
| |
| Total (Cost $5,774,465) | | | | | | 5,981,123 | |
| |
| |
| ENERGY – 1.4% | | | | | | | |
| ENERGY EQUIPMENT & SERVICES - 1.4% | | | | | | | |
Helmerich & Payne | | 69,800 | | | | 3,346,212 | |
Unit Corporation 1 | | 32,413 | | | | 462,858 | |
| |
| Total (Cost $3,235,014) | | | | | | 3,809,070 | |
| |
| |
| FINANCIALS – 27.7% | | | | | | | |
| BANKS - 13.4% | | | | | | | |
Ames National | | 173,504 | | | | 4,410,472 | |
†Bar Harbor Bankshares | | 94,631 | | | | 2,122,573 | |
Camden National | | 155,096 | | | | 5,578,803 | |
City Holding Company | | 38,910 | | | | 2,629,927 | |
CNB Financial | | 169,185 | | | | 3,882,796 | |
Codorus Valley Bancorp | | 66,696 | | | | 1,417,290 | |
†Financial Institutions | | 112,082 | | | | 2,880,507 | |
Landmark Bancorp | | 47,091 | | | | 1,078,619 | |
MidWestOne Financial Group | | 134,574 | | | | 3,341,472 | |
National Bankshares | | 121,632 | | | | 4,431,054 | |
Northrim BanCorp | | 86,181 | | | | 2,832,770 | |
Unity Bancorp | | 108,936 | | | | 2,261,511 | |
| | | | | | | |
| | | | | | | 36,867,794 | |
| | | | | | | |
| CAPITAL MARKETS - 3.7% | | | | | | | |
Houlihan Lokey Cl. A | | 114,615 | | | | 4,217,832 | |
Moelis & Company Cl. A | | 119,020 | | | | 4,091,908 | |
†Pzena Investment Management Cl. A | | 228,000 | | | | 1,972,200 | |
| | | | | | | |
| | | | | | | 10,281,940 | |
| | | | | | | |
| INSURANCE - 3.1% | | | | | | | |
James River Group Holdings | | 74,635 | | | | 2,727,163 | |
Kingstone Companies | | 100,220 | | | | 1,772,892 |
Reinsurance Group of America | | 29,536 | | | | 4,141,833 |
| | | | | | |
| | | | | | | 8,641,888 |
| | | | | | |
| THRIFTS & MORTGAGE FINANCE - 7.5% | | | | | | |
Genworth MI Canada | | 229,950 | | | | 6,771,162 |
Southern Missouri Bancorp | | 93,351 | | | | 3,164,599 |
Timberland Bancorp | | 98,931 | | | | 2,206,161 |
TrustCo Bank Corp. NY | | 827,682 | | | | 5,677,898 |
†WSFS Financial | | 73,100 | | | | 2,771,221 |
| | | | | | |
| | | | | | | 20,591,041 |
| |
| Total (Cost $67,807,829) | | | | | | 76,382,663 |
| |
| |
| HEALTH CARE – 0.7% | | | | | | |
| HEALTH CARE PROVIDERS & SERVICES - 0.7% | | | | | | |
AMN Healthcare Services 1 | | 13,541 | | | | 767,233 |
Ensign Group (The) | | 29,214 | | | | 1,133,211 |
| |
| Total (Cost $1,180,143) | | | | | | 1,900,444 |
| |
| |
| INDUSTRIALS – 23.5% | | | | | | |
| AEROSPACE & DEFENSE - 0.4% | | | | | | |
†Magellan Aerospace | | 92,100 | | | | 1,010,590 |
| | | | | | |
| AIRLINES - 3.5% | | | | | | |
Allegiant Travel | | 26,893 | | | | 2,695,217 |
Hawaiian Holdings | | 209,255 | | | | 5,526,425 |
Spirit Airlines 1 | | 23,432 | | | | 1,357,181 |
| | | | | | |
| | | | | | | 9,578,823 |
| | | | | | |
| BUILDING PRODUCTS - 1.3% | | | | | | |
Apogee Enterprises | | 120,047 | | | | 3,583,403 |
| | | | | | |
| COMMERCIAL SERVICES & SUPPLIES - 3.0% | | | | | | |
Herman Miller | | 118,203 | | | | 3,575,641 |
Kimball International Cl. B | | 337,282 | | | | 4,786,031 |
| | | | | | |
| | | | | | | 8,361,672 |
| | | | | | |
| CONSTRUCTION & ENGINEERING - 0.6% | | | | | | |
Comfort Systems USA | | 36,969 | | | | 1,614,806 |
| | | | | | |
| ELECTRICAL EQUIPMENT - 0.5% | | | | | | |
EnerSys | | 17,400 | | | | 1,350,414 |
| | | | | | |
| MACHINERY - 7.6% | | | | | | |
Alamo Group | | 52,807 | | | | 4,083,037 |
Federal Signal | | 44,422 | | | | 883,998 |
†Meritor 1 | | 302,429 | | | | 5,114,075 |
Miller Industries | | 254,879 | | | | 6,881,733 |
Wabash National | | 315,754 | | | | 4,130,062 |
| | | | | | |
| | | | | | | 21,092,905 |
| | | | | | |
| PROFESSIONAL SERVICES - 4.4% | | | | | | |
Heidrick & Struggles International | | 87,508 | | | | 2,729,375 |
Kforce | | 89,746 | | | | 2,774,946 |
Korn Ferry | | 100,871 | | | | 3,988,439 |
Robert Half International | | 22,264 | | | | 1,273,501 |
TrueBlue 1 | | 59,368 | | | | 1,320,938 |
| | | | | | |
| | | | | | | 12,087,199 |
| | | | | | |
| ROAD & RAIL - 2.2% | | | | | | |
Old Dominion Freight Line | | 10,404 | | | | 1,284,790 |
Saia 1 | | 38,561 | | | | 2,152,475 |
Werner Enterprises | | 89,361 | | | | 2,639,724 |
| | | | | | |
| | | | | | | 6,076,989 |
| |
| Total (Cost $65,904,022) | | | | | | 64,756,801 |
| |
| 14 | Royce Capital Fund 2018 Annual Report to Shareholders | | THE ACCOMPANYING NOTES ARE AN INTEGRAL PART OF THESE FINANCIAL STATEMENTS |
| |
| Royce Capital Fund - Small-Cap Portfolio (continued) |
| | | SHARES | | | VALUE |
| |
| | | | | | | |
| INFORMATION TECHNOLOGY – 21.3% | | | | | | |
| ELECTRONIC EQUIPMENT, INSTRUMENTS & COMPONENTS - 13.4% | | | | | | |
Benchmark Electronics | | 194,435 | | | $ | 4,118,133 |
Celestica 1 | | 663,372 | | | | 5,817,772 |
Fabrinet 1 | | 26,486 | | | | 1,358,997 |
Insight Enterprises 1 | | 170,302 | | | | 6,939,807 |
Methode Electronics | | 92,815 | | | | 2,161,661 |
PC Connection | | 202,422 | | | | 6,018,006 |
Sanmina Corporation 1 | | 171,393 | | | | 4,123,716 |
Vishay Intertechnology | | 360,099 | | | | 6,485,383 |
| | | | | | |
| | | | | | | 37,023,475 |
| | | | | | |
| SEMICONDUCTORS & SEMICONDUCTOR EQUIPMENT - 7.9% | | | | | | |
Advanced Energy Industries 1 | | 137,950 | | | | 5,922,193 |
Kulicke & Soffa Industries | | 312,726 | | | | 6,338,956 |
MKS Instruments | | 84,691 | | | | 5,471,886 |
Silicon Motion Technology ADR | | 115,500 | | | | 3,984,750 |
| | | | | | |
| | | | | | | 21,717,785 |
| |
| Total (Cost $61,175,882) | | | | | | 58,741,260 |
| |
| |
| REAL ESTATE – 1.0% | | | | | | |
| REAL ESTATE MANAGEMENT & DEVELOPMENT - 1.0% | | | | | | |
Marcus & Millichap 1 | | 79,572 | | | | 2,731,707 |
| |
| Total (Cost $1,981,040) | | | | | | 2,731,707 |
| |
| |
| UTILITIES – 0.4% | | | | | | |
| GAS UTILITIES - 0.4% | | | | | | |
Star Group L.P. | | 112,383 | | | | 1,049,657 |
| |
| Total (Cost $1,032,389) | | | | | | 1,049,657 |
| |
| |
| TOTAL COMMON STOCKS | | | | | | |
| |
| (Cost $254,350,384) | | | | | | 258,836,404 |
| |
| | | | | | | |
| REPURCHASE AGREEMENT – 5.5% | | | | | | |
Fixed Income Clearing Corporation, 0.50% dated 12/31/18, due 1/2/19, maturity value
$15,137,420 (collateralized by obligations of various U.S. Government Agencies, 2.125%
due 07/31/24, valued at $15,443,802) |
| |
| (Cost $15,137,000) | | | | | | 15,137,000 |
| |
| |
| TOTAL INVESTMENTS – 99.4% | | | | | | |
| |
| (Cost $269,487,384) | | | | | | 273,973,404 |
| |
| | | | | | | |
| CASH AND OTHER ASSETS LESS LIABILITIES – 0.6% | | | | | | 1,716,567 |
| | | | | | |
| | | | | | | |
| |
| NET ASSETS – 100.0% | | | | | $ | 275,689,971 |
| |
| ADR- American Depository Receipt |
| |
| † New additions in 2018. |
| 1 Non-income producing. |
| |
| Bold indicates the Fund’s 20 largest equity holdings in terms of December 31, 2018, market value. |
| THE ACCOMPANYING NOTES ARE AN INTEGRAL PART OF THESE FINANCIAL STATEMENTS | | Royce Capital Fund 2018 Annual Report to Shareholders | 15 |
| Statements of Assets and Liabilities | | December 31, 2018 |
| | | Micro-Cap | | | Small-Cap |
| | | Portfolio | | | Portfolio |
| |
| ASSETS: | | | | | | | |
| Investments at value (including collateral on loaned securities)1 | | $ | 140,116,184 | | | $ | 258,836,404 |
| |
| Repurchase agreements (at cost and value) | | | 5,267,000 | | | | 15,137,000 |
| |
| Cash and foreign currency | | | 252 | | | | 18,657 |
| |
| Receivable for investments sold | | | 823,895 | | | | 2,372,436 |
| |
| Receivable for capital shares sold | | | 141,143 | | | | 185,971 |
| |
| Receivable for dividends and interest | | | 106,522 | | | | 429,867 |
| |
| Receivable for securities lending income | | | 5,451 | | | | – |
| |
| Prepaid expenses and other assets | | | 1,005 | | | | 2,728 |
| |
| Total Assets | | | 146,461,452 | | | | 276,983,063 |
| |
| LIABILITIES: | | | | | | | |
| Payable for collateral on loaned securities | | | 3,911,179 | | | | – |
| |
| Payable for investments purchased | | | 117,462 | | | | 666,688 |
| |
| Payable for capital shares redeemed | | | 108,341 | | | | 282,248 |
| |
| Payable for investment advisory fees | | | 146,773 | | | | 216,285 |
| |
| Payable for trustees’ fees | | | 11,132 | | | | 26,748 |
| |
| Accrued expenses | | | 65,725 | | | | 101,123 |
| |
| Total Liabilities | | | 4,360,612 | | | | 1,293,092 |
| |
| Net Assets | | $ | 142,100,840 | | | $ | 275,689,971 |
| |
| ANALYSIS OF NET ASSETS: | | | | | | | |
| Paid-in capital | | $ | 118,099,252 | | | $ | 224,001,311 |
| |
| Total distributable earnings (loss) | | | 24,001,588 | | | | 51,688,660 |
| |
| Net Assets | | $ | 142,100,840 | | | $ | 275,689,971 |
| |
Investment Class | | $ | 127,456,513 | | | $ | 171,560,517 |
| |
Service Class | | | 14,644,327 | | | | 104,129,454 |
| |
| SHARES OUTSTANDING (unlimited number of $.001 par value): | | | | | | | |
Investment Class | | | 14,206,762 | | | | 21,802,972 |
| |
Service Class | | | 1,664,076 | | | | 13,540,047 |
| |
| NET ASSET VALUES (Net Assets ÷ Shares Outstanding): | | | | | | | |
(offering and redemption price per share) | | | | | | | |
| |
Investment Class | | | $8.97 | | | | $7.87 |
| |
Service Class | | | 8.80 | | | | 7.69 |
| |
| Investments at identified cost | | $ | 130,317,328 | | | $ | 254,350,384 |
| |
| Market value of loaned securities2 | | | 5,038,999 | | | | – |
| |
| 1 See Notes to Financial Statements for information on non-cash collateral on loaned securities. |
| 2 Market value of loaned securities backed by non-cash collateral is as of prior business day. |
| 16 | Royce Capital Fund 2018 Annual Report to Shareholders | | THE ACCOMPANYING NOTES ARE AN INTEGRAL PART OF THESE FINANCIAL STATEMENTS |
Statements of Changes in Net Assets
| | | Micro-Cap Portfolio | | | | Small-Cap Portfolio | |
| | | Year Ended 12/31/18 | | | | Year Ended 12/31/17 | | | | Year Ended 12/31/18 | | | | Year Ended 12/31/17 | |
| |
| INVESTMENT OPERATIONS: | | | | | | | | | | | | | | | | | | | |
| Net investment income (loss) | | $ | (640,551 | ) | | | $ | (507,803 | ) | | | $ | 2,028,315 | | | | $ | 1,986,132 | |
| |
Net realized gain (loss) on investments and foreign
currency | | | 14,233,957 | | | | | 8,353,077 | | | | | 46,496,665 | | | | | 7,868,418 | |
| |
Net change in unrealized appreciation (depreciation)
on investments and foreign currency | | | (26,943,361 | ) | | | | 1,752,552 | | | | | (72,052,141 | ) | | | | 2,459,022 | |
| |
| Net increase (decrease) in net assets from investment operations | | | (13,349,955 | ) | | | | 9,597,826 | | | | | (23,527,161 | ) | | | | 12,313,572 | |
| |
| DISTRIBUTIONS: | | | | | | | | | | | | | | | | | | | |
| Total distributable earnings1 | | | | | | | | | | | | | | | | | | | |
| |
Investment Class | | | (6,692,693 | ) | | | | | | | | | (3,942,054 | ) | | | | | |
| |
Service Class | | | (764,616 | ) | | | | | | | | | (1,828,028 | ) | | | | | |
| |
| Net investment income | | | | | | | | | | | | | | | | | | | |
Investment Class | | | | | | | | (1,090,893 | ) | | | | | | | | | (2,075,505 | ) |
| |
Service Class | | | | | | | | (170,672 | ) | | | | | | | | | (2,047,296 | ) |
| |
| Net realized gain on investments and foreign currency | | | | | | | | | | | | | | | | | | | |
Investment Class | | | | | | | | (17,091,597 | ) | | | | | | | | | – | |
| |
Service Class | | | | | | | | (3,298,738 | ) | | | | | | | | | – | |
| |
| Total distributions | | | (7,457,309 | ) | | | | (21,651,900 | ) | | | | (5,770,082 | ) | | | | (4,122,801 | ) |
| |
| CAPITAL SHARE TRANSACTIONS: | | | | | | | | | | | | | | | | | | | |
| Value of shares sold | | | | | | | | | | | | | | | | | | | |
| |
Investment Class | | | 20,188,911 | | | | | 19,985,987 | | | | | 20,508,660 | | | | | 27,113,319 | |
| |
Service Class | | | 8,396,343 | | | | | 8,994,660 | | | | | 3,049,574 | | | | | 193,204,040 | |
| |
| Distributions reinvested | | | | | | | | | | | | | | | | | | | |
| |
Investment Class | | | 6,692,693 | | | | | 18,182,489 | | | | | 3,942,054 | | | | | 2,075,505 | |
| |
Service Class | | | 764,616 | | | | | 3,469,410 | | | | | 1,828,028 | | | | | 2,047,296 | |
| |
| Value of shares redeemed | | | | | | | | | | | | | | | | | | | |
| |
Investment Class | | | (45,283,517 | ) | | | | (41,333,398 | ) | | | | (62,882,019 | ) | | | | (57,799,564 | ) |
| |
Service Class | | | (24,574,409 | ) | | | | (12,640,986 | ) | | | | (153,628,193 | ) | | | | (198,351,118 | ) |
| |
| Net increase (decrease) in net assets from capital share transactions | | | (33,815,363 | ) | | | | (3,341,838 | ) | | | | (187,181,896 | ) | | | | (31,710,522 | ) |
| |
| Net Increase (Decrease) in Net Assets | | | (54,622,627 | ) | | | | (15,395,912 | ) | | | | (216,479,139 | ) | | | | (23,519,751 | ) |
| |
| NET ASSETS: | | | | | | | | | | | | | | | | | | | |
| |
| Beginning of year | | | 196,723,467 | | | | | 212,119,379 | | | | | 492,169,110 | | | | | 515,688,861 | |
| |
| End of year | | $ | 142,100,840 | | | | $ | 196,723,467 | | | | $ | 275,689,971 | | | | $ | 492,169,110 | |
| |
| Undistributed Net Investment Income (Loss) at End of Year 2 | | | | | | | $ | 37,944 | | | | | | | | | $ | 1,858,071 | |
| |
| 1 Distributions from net investment income and from realized gains are no longer required to be separately disclosed. See Notes to Financial Statements. |
| 2 Parenthetical disclosure of undistributed net investment income is no longer required. See Notes to Financial Statements. |
| THE ACCOMPANYING NOTES ARE AN INTEGRAL PART OF THESE FINANCIAL STATEMENTS | | Royce Capital Fund 2018 Annual Report to Shareholders | 17 |
| Statements of Operations | | Year Ended December 31, 2018 |
| | | Micro-Cap | | | Small-Cap | |
| | | Portfolio | | | Portfolio | |
| |
| INVESTMENT INCOME: | | | | | | | | |
| INCOME: | | | | | | | | |
| Dividends | | $ | 1,788,516 | | | $ | 7,352,771 | |
| |
| Foreign withholding tax | | | (42,326 | ) | | | (68,743 | ) |
| |
| Interest | | | 27,088 | | | | 91,464 | |
| |
| Securities lending | | | 141,439 | | | | 10,159 | |
| |
| Total income | | | 1,914,717 | | | | 7,385,651 | |
| |
| EXPENSES: | | | | | | | | |
| Investment advisory fees | | | 2,334,741 | | | | 4,426,274 | |
| |
| Distribution fees | | | 71,113 | | | | 576,970 | |
| |
| Administrative and office facilities | | | 62,094 | | | | 143,367 | |
| |
| Shareholder reports | | | 55,308 | | | | 64,845 | |
| |
| Trustees’ fees | | | 39,557 | | | | 98,299 | |
| |
| Audit | | | 34,469 | | | | 33,065 | |
| |
| Custody | | | 29,180 | | | | 57,404 | |
| |
| Shareholder servicing | | | 13,915 | | | | 13,597 | |
| |
| Legal | | | 6,609 | | | | 16,216 | |
| |
| Other expenses | | | 14,655 | | | | 31,072 | |
| |
| Total expenses | | | 2,661,641 | | | | 5,461,109 | |
| |
| Compensating balance credits | | | (169 | ) | | | (105 | ) |
| |
| Fees waived by investment adviser | | | (38,245 | ) | | | (40,355 | ) |
| |
| Expenses reimbursed by investment adviser | | | (67,959 | ) | | | (63,313 | ) |
| |
| Net expenses | | | 2,555,268 | | | | 5,357,336 | |
| |
| Net investment income (loss) | | | (640,551 | ) | | | 2,028,315 | |
| |
| REALIZED AND UNREALIZED GAIN (LOSS) ON INVESTMENTS AND FOREIGN CURRENCY: | | | | | | | | |
| NET REALIZED GAIN (LOSS): | | | | | | | | |
| |
| Investments | | | 14,236,548 | | | | 46,490,750 | |
| |
| Foreign currency transactions | | | (2,591 | ) | | | 5,915 | |
| |
| NET CHANGE IN UNREALIZED APPRECIATION (DEPRECIATION): | | | | | | | | |
| Investments | | | (26,940,816 | ) | | | (72,052,145 | ) |
| |
| Other assets and liabilities denominated in foreign currency | | | (2,545 | ) | | | 4 | |
| |
| Net realized and unrealized gain (loss) on investments and foreign currency | | | (12,709,404 | ) | | | (25,555,476 | ) |
| |
| NET INCREASE (DECREASE) IN NET ASSETS FROM INVESTMENT OPERATIONS | | $ | (13,349,955 | ) | | $ | (23,527,161 | ) |
| |
| 18 | Royce Capital Fund 2018 Annual Report to Shareholders | | THE ACCOMPANYING NOTES ARE AN INTEGRAL PART OF THESE FINANCIAL STATEMENTS |
Financial Highlights
This table is presented to show selected data for a share outstanding throughout each year and to assist shareholders in evaluating a Fund’s performance for the periods presented. Per share amounts have been determined on the basis of the weighted average number of shares outstanding during the period.
| | | | | | | | | | | | | | | | | | | | | | | | | | | | | | | | | | | | | | | | | Ratio of Expenses to Average Net Assets | | | | | | | | | |
| | | | | | | | | | | | | | | | | | | | | | | | | | | | | | | | | | | | | | | | | | | | | | | | | | |
| | Net Asset Value,
Beginning of
Period | | Net Investment
Income (Loss) | | Net Realized and
Unrealized Gain (Loss)
on Investments and
Foreign Currency | | Total from
Investment
Operations | | Distributions
from Net
Investment
Income | | Distributions from
Net Realized Gain on
Investments and
Foreign Currency | | Total
Distributions | | Net Asset
Value, End of
Period | | Total Return | | Net Assets,
End of Period
(in thousands) | | Prior to Fee
Waivers,
Expense
Reimbursements
and Balance
Credits | | Prior to Fee
Waivers and
Expense
Reimbursements | | Net of Fee
Waivers and
Expense
Reimbursements | | | Ratio of Net
Investment
Income (Loss) to
Average Net
Assets | | | Portfolio
Turnover Rate |
| |
| Micro-Cap Portfolio–Investment Class |
| 2018 | $ | 10.39 | | | $ | (0.03 | ) | | $ | (0.90 | ) | | $ | (0.93 | ) | | $ | – | | | $ | (0.49 | ) | | $ | (0.49 | ) | | $ | 8.97 | | | (9.13 | )% | | $ | 127,457 | | | 1.39 | % | | 1.39 | % | | | 1.33 | % | | | | (0.30 | )% | | | | 28 | % |
| |
| 2017 | | 11.11 | | | | (0.02 | ) | | | 0.58 | | | | 0.56 | | | | (0.08 | ) | | | (1.20 | ) | | | (1.28 | ) | | | 10.39 | | | 5.29 | | | | 164,656 | | | 1.38 | | | 1.38 | | | | 1.38 | | | | | (0.22 | ) | | | | 30 | |
| |
| 2016 | | 9.34 | | | | 0.03 | | | | 1.81 | | | | 1.84 | | | | (0.07 | ) | | | – | | | | (0.07 | ) | | | 11.11 | | | 19.71 | | | | 177,444 | | | 1.36 | | | 1.36 | | | | 1.36 | | | | | 0.02 | | | | | 57 | |
| |
| 2015 | | 11.37 | | | | 0.03 | | | | (1.45 | ) | | | (1.42 | ) | | | – | | | | (0.61 | ) | | | (0.61 | ) | | | 9.34 | | | (12.46 | ) | | | 369,991 | | | 1.32 | | | 1.32 | | | | 1.32 | | | | | 0.27 | | | | | 51 | |
| |
| 2014 | | 12.83 | | | | (0.04 | ) | | | (0.44 | ) | | | (0.48 | ) | | | – | | | | (0.98 | ) | | | (0.98 | ) | | | 11.37 | | | (3.58 | ) | | | 485,434 | | | 1.30 | | | 1.30 | | | | 1.30 | | | | | (0.32 | ) | | | | 25 | |
| |
| Micro-Cap Portfolio–Service Class |
| 2018 | $ | 10.21 | | | $ | (0.06 | ) | | $ | (0.87 | ) | | $ | (0.93 | ) | | $ | – | | | $ | (0.48 | ) | | $ | (0.48 | ) | | $ | 8.80 | | | (9.29 | )% | | $ | 14,644 | | | 1.64 | % | | 1.64 | % | | | 1.58 | % | | | | (0.57 | )% | | | | 28 | % |
| |
| 2017 | | 10.93 | | | | (0.04 | ) | | | 0.57 | | | | 0.53 | | | | (0.06 | ) | | | (1.19 | ) | | | (1.25 | ) | | | 10.21 | | | 5.02 | | �� | | 32,067 | | | 1.64 | | | 1.64 | | | | 1.58 | | | | | (0.43 | ) | | | | 30 | |
| |
| 2016 | | 9.20 | | | | (0.02 | ) | | | 1.80 | | | | 1.78 | | | | (0.05 | ) | | | – | | | | (0.05 | ) | | | 10.93 | | | 19.37 | | | | 34,675 | | | 1.65 | | | 1.65 | | | | 1.58 | | | | | (0.15 | ) | | | | 57 | |
| |
| 2015 | | 11.23 | | | | 0.00 | | | | (1.42 | ) | | | (1.42 | ) | | | – | | | | (0.61 | ) | | | (0.61 | ) | | | 9.20 | | | (12.61 | ) | | | 23,928 | | | 1.60 | | | 1.60 | | | | 1.56 | | | | | 0.01 | | | | | 51 | |
| |
| 2014 | | 12.72 | | | | (0.07 | ) | | | (0.44 | ) | | | (0.51 | ) | | | – | | | | (0.98 | ) | | | (0.98 | ) | | | 11.23 | | | (3.84 | ) | | | 27,362 | | | 1.57 | | | 1.57 | | | | 1.57 | | | | | (0.60 | ) | | | | 25 | |
| |
| Small-Cap Portfolio–Investment Class |
| 2018 | $ | 8.77 | | | $ | 0.06 | | | $ | (0.78 | ) | | $ | (0.72 | ) | | $ | (0.07 | ) | | $ | (0.11 | ) | | $ | (0.18 | ) | | $ | 7.87 | | | (8.24 | )% | | $ | 171,561 | | | 1.11 | % | | 1.11 | % | | | 1.08 | % | | | | 0.62 | % | | | | 56 | % |
| |
| 2017 | | 8.41 | | | | 0.05 | | | | 0.39 | | | | 0.44 | | | | (0.08 | ) | | | – | | | | (0.08 | ) | | | 8.77 | | | 5.26 | | | | 228,620 | | | 1.11 | | | 1.11 | | | | 1.11 | | | | | 0.55 | | | | | 91 | |
| |
| 2016 | | 8.43 | | | | 0.13 | | | | 1.66 | | | | 1.79 | | | | (0.17 | ) | | | (1.64 | ) | | | (1.81 | ) | | | 8.41 | | | 20.96 | | | | 248,244 | | | 1.09 | | | 1.09 | | | | 1.09 | | | | | 0.89 | | | | | 78 | |
| |
| 2015 | | 12.65 | | | | 0.17 | | | | (1.66 | ) | | | (1.49 | ) | | | (0.09 | ) | | | (2.64 | ) | | | (2.73 | ) | | | 8.43 | | | (11.80 | ) | | | 356,258 | | | 1.06 | | | 1.06 | | | | 1.06 | | | | | 1.26 | | | | | 59 | |
| |
| 2014 | | 13.92 | | | | 0.06 | | | | 0.35 | | | | 0.41 | | | | (0.02 | ) | | | (1.66 | ) | | | (1.68 | ) | | | 12.65 | | | 3.24 | | | | 577,222 | | | 1.05 | | | 1.05 | | | | 1.05 | | | | | 0.44 | | | | | 36 | |
| |
| Small-Cap Portfolio–Service Class |
| 2018 | $ | 8.55 | | | $ | 0.04 | | | $ | (0.76 | ) | | $ | (0.72 | ) | | $ | (0.03 | ) | | $ | (0.11 | ) | | $ | (0.14 | ) | | $ | 7.69 | | | (8.50 | )% | | $ | 104,129 | | | 1.34 | % | | 1.34 | % | | | 1.33 | % | | | | 0.31 | % | | | | 56 | % |
| |
| 2017 | | 8.20 | | | | 0.02 | | | | 0.40 | | | | 0.42 | | | | (0.07 | ) | | | – | | | | (0.07 | ) | | | 8.55 | | | 5.10 | | | | 263,549 | | | 1.34 | | | 1.34 | | | | 1.34 | | | | | 0.32 | | | | | 91 | |
| |
| 2016 | | 8.27 | | | | 0.03 | | | | 1.69 | | | | 1.72 | | | | (0.15 | ) | | | (1.64 | ) | | | (1.79 | ) | | | 8.20 | | | 20.53 | | | | 267,445 | | | 1.34 | | | 1.34 | | | | 1.34 | | | | | 0.69 | | | | | 78 | |
| |
| 2015 | | 12.44 | | | | 0.13 | | | | (1.62 | ) | | | (1.49 | ) | | | (0.04 | ) | | | (2.64 | ) | | | (2.68 | ) | | | 8.27 | | | (11.97 | ) | | | 128,285 | | | 1.31 | | | 1.31 | | | | 1.31 | | | | | 1.00 | | | | | 59 | |
| |
| 2014 | | 13.74 | | | | 0.03 | | | | 0.33 | | | | 0.36 | | | | – | | | | (1.66 | ) | | | (1.66 | ) | | | 12.44 | | | 2.92 | | | | 218,175 | | | 1.30 | | | 1.30 | | | | 1.30 | | | | | 0.21 | | | | | 36 | |
| |
| THE ACCOMPANYING NOTES ARE AN INTEGRAL PART OF THESE FINANCIAL STATEMENTS | | Royce Capital Fund 2018 Annual Report to Shareholders | 19 |
Notes to Financial Statements
| Summary of Significant Accounting Policies: |
| Royce Capital Fund – Micro-Cap Portfolio and Royce Capital Fund – Small-Cap Portfolio (the “Fund” or “Funds”) are the two series of Royce Capital Fund (the “Trust”), an open-end management investment company organized as a Delaware statutory trust. Shares of the Funds are offered to life insurance companies for allocation to certain separate accounts established for the purpose of funding qualified and non-qualified variable annuity contracts and variable life insurance contracts. Micro-Cap Portfolio and Small-Cap Portfolio commenced operations on December 27, 1996. |
| Classes of shares have equal rights as to earnings and assets, except that each class may bear different fees and expenses for distribution, shareholder servicing, registration and shareholder reports, and receive different compensating balance credits and expense reimbursements. Investment income, realized and unrealized capital gains or losses on investments and foreign currency, and expenses other than those attributable to a specific class are allocated to each class of shares based on its relative net assets. |
| The preparation of financial statements in conformity with accounting principles generally accepted in the United States requires management to make estimates and assumptions that affect the reported amounts of assets and liabilities and the disclosure of contingent assets and liabilities at the date of the financial statements and the reported amounts of income and expenses during the reporting period. Actual results could differ from those estimates. |
| Each Fund is an investment company and accordingly follows the investment company accounting and reporting guidance of the Financial Accounting Standards Board (FASB) Accounting Standard Codification Topic 946 “Financial Services-Investment Companies”. |
| |
| VALUATION OF INVESTMENTS: |
| Securities are valued as of the close of trading on the New York Stock Exchange (NYSE) (generally 4:00 p.m. Eastern time) on the valuation date. Securities that trade on an exchange, and securities traded on Nasdaq’s Electronic Bulletin Board, are valued at their last reported sales price or Nasdaq official closing price taken from the primary market in which each security trades or, if no sale is reported for such day, at their highest bid price. Other over-the-counter securities for which market quotations are readily available are valued at their highest bid price, except in the case of some bonds and other fixed income securities which may be valued by reference to other securities with comparable ratings, interest rates and maturities, using established independent pricing services. The Funds value their non-U.S. dollar denominated securities in U.S. dollars daily at the prevailing foreign currency exchange rates as quoted by a major bank. Securities for which market quotations are not readily available are valued at their fair value in accordance with the provisions of the 1940 Act, under procedures approved by the Trust’s Board of Trustees, and are reported as Level 3 securities. As a general principle, the fair value of a security is the amount which the Fund might reasonably expect to receive for the security upon its current sale. However, in light of the judgment involved in fair valuations, there can be no assurance that a fair value assigned to a particular security will be the amount which the Fund might be able to receive upon its current sale. In addition, if, between the time trading ends on a particular security and the close of the customary trading session on the NYSE, events occur that are significant and may make the closing price unreliable, a Fund may fair value the security. The Funds use an independent pricing service to provide fair value estimates for relevant non-U.S. equity securities on days when the U.S. market volatility exceeds a certain threshold. This pricing service uses proprietary correlations it has developed between the movement of prices of non-U.S. equity securities and indices of U.S.-traded securities, futures contracts and other indications to estimate the fair value of relevant non-U.S. securities. When fair value pricing is employed, the prices of securities used by a Fund may differ from quoted or published prices for the same security. Investments in money market funds are valued at net asset value per share. |
| Various inputs are used in determining the value of each Fund’s investments, as noted above. These inputs are summarized in the three broad levels below: |
| | | Level 1 | – | quoted prices in active markets for identical securities. |
| | | Level 2 | – | other significant observable inputs (including quoted prices for similar securities, foreign securities that may be fair valued and repurchase agreements). The table below includes all Level 2 securities. Level 2 securities with values based on quoted prices for similar securities would be noted in the Schedules of Investments. |
| | | Level 3 | – | significant unobservable inputs (including last trade price before trading was suspended, or at a discount thereto for lack of marketability or otherwise, market price information regarding other securities, information received from the company and/or published documents, including SEC filings and financial statements, or other publicly available information). |
| The inputs or methodology used for valuing securities are not necessarily an indication of the risk associated with investing in those securities. |
| The following is a summary of the inputs used to value each Fund’s investments as of December 31, 2018. For a detailed breakout of common stocks by sector classification, please refer to the Schedules of Investments. |
| | | LEVEL 1 | | LEVEL 2 | | LEVEL 3 | | TOTAL |
| |
| Micro-Cap Portfolio | | | | | | | | | | | | | | | |
| Common Stocks | | $ | 135,814,405 | | | $ | – | | | $ | 390,600 | | | $ | 136,205,005 |
| |
| Repurchase Agreement | | | – | | | | 5,267,000 | | | | – | | | | 5,267,000 |
| |
| Money Market Fund / Collateral Received For Securities Loaned | | | 3,911,179 | | | | – | | | | – | | | | 3,911,179 |
| |
| 20 | Royce Capital Fund 2018 Annual Report to Shareholders |
| VALUATION OF INVESTMENTS (continued): | | | | | | | | | | | | | |
| | | LEVEL 1 | | LEVEL 2 | | LEVEL 3 | | TOTAL |
| |
| Small-Cap Portfolio | | | | | | | | | | | | | | | |
| Common Stocks | | $ | 258,836,404 | | | $ | – | | | $ | – | | | $ | 258,836,404 |
| |
| Repurchase Agreement | | | – | | | | 15,137,000 | | | | – | | | | 15,137,000 |
| |
Certain securities have transferred in and out of Level 1 and Level 2 measurements during the reporting period. This is generally due to whether fair value factors have been applied. The Funds recognize transfers between levels as of the end of the reporting period. For the year ended December 31, 2018, securities valued at $3,251,820 were transferred from Level 2 to Level 1 for Royce Micro-Cap Portfolio within the fair value hierarchy.
| Level 3 Reconciliation: |
| | | BALANCE AS OF 12/31/17 | | PURCHASES | | SALES | | | REALIZED GAIN (LOSS) | | UNREALIZED GAIN (LOSS)1 | | BALANCE AS OF 12/31/18 |
| |
| Micro-Cap Portfolio | | | | | | | | | | | | | | | | | | | | | |
| |
| Common Stocks | | | $390,600 | | | | $ – | | | $ 0 | | | $ (46,911) | | | $ 46,911 | | | | $390,600 | |
| |
| 1 | The net change in unrealized appreciation (depreciation) is included in the accompanying Statement of Operations. Change in unrealized appreciation (depreciation) includes net unrealized appreciation (depreciation) resulting from changes in investment values during the reporting period and the reversal of previously recorded unrealized appreciation (depreciation) when gains or losses are realized. Net realized gain (loss) from investments and foreign currency transactions is included in the accompanying Statement of Operations. |
The following table summarizes the valuation techniques used and unobservable inputs approved by the Valuation Committee to determine the fair value of certain Level 3 investments. The table does not include Level 3 investments with values derived utilizing prices from prior transactions or third party pricing information with adjustments (e.g. broker quotes, pricing services, net asset values).
| | | | FAIR VALUE AT | | | | | | | | | | | | IMPACT TO VALUATION FROM |
| | | | 12/31/18 | | | VALUATION TECHNIQUE(S) | | | UNOBSERVABLE INPUT(S) | | | RANGE AVERAGE | | | AN INCREASE IN INPUT1 |
| |
| Micro-Cap Portfolio | | | | | | | | | | | | | | | |
| |
| Common Stocks | | | $390,600 | | | Discounted Present Value
Balance Sheet Analysis | | | Liquidity Discount | | | 30%-40% | | | Decrease |
| |
| 1 | This column represents the directional change in the fair value of the Level 3 investments that would result in an increase from the corresponding unobservable input. A decrease to the unobservable input would have the opposite effect. Significant increases and decreases in these unobservable inputs in isolation could result in significantly higher or lower fair value measurements. |
| REPURCHASE AGREEMENTS: |
| The Funds may enter into repurchase agreements with institutions that the Funds’ investment adviser has determined are creditworthy. Each Fund restricts repurchase agreements to maturities of no more than seven days. Securities pledged as collateral for repurchase agreements, which are held until maturity of the repurchase agreements, are marked-to-market daily and maintained at a value at least equal to the principal amount of the repurchase agreement (including accrued interest). Repurchase agreements could involve certain risks in the event of default or insolvency of the counter-party, including possible delays or restrictions upon the ability of each Fund to dispose of its underlying securities. The remaining contractual maturities of repurchase agreements held by the Funds at December 31, 2018 are overnight and continuous. |
| |
| FOREIGN CURRENCY: |
| Net realized foreign exchange gains or losses arise from sales and maturities of short-term securities, sales of foreign currencies, expiration of currency forward contracts, currency gains or losses realized between the trade and settlement dates on securities transactions, and the difference between the amounts of dividends, interest, and foreign withholding taxes recorded on each Fund’s books and the U.S. dollar equivalent of the amounts actually received or paid. Net unrealized foreign exchange gains and losses arise from changes in the value of assets and liabilities, other than investments in securities at the end of the reporting period, as a result of changes in foreign currency exchange rates. |
| The Funds do not isolate that portion of the results of operations resulting from fluctuations in foreign exchange rates on investments from the fluctuations arising from changes in market prices of securities held. Such fluctuations are included with the net realized and unrealized gain or loss on investments. |
| |
| SECURITIES LENDING: |
| The Funds loan securities through a lending agent to qualified institutional investors for the purpose of realizing additional income. Collateral for the Funds on all securities loaned is accepted in cash and cash equivalents, which are invested temporarily by the custodian, as well as non-cash collateral, which includes short and long-term U.S. Treasuries. The collateral maintained is at least 100% of the current market value of the loaned securities. The market value of the loaned securities is determined at the close of business of the Funds and any additional required collateral is delivered to the Funds on the next business day. The Funds retain the risk of any loss on the securities on loan as well as incurring the potential loss on investments purchased with cash collateral received for securities lending. In the event of default or bankruptcy by the other party to the agreement, realization and/or retention of the collateral may be subject to legal proceedings. If the borrower fails to return loaned securities, and cash collateral being maintained by the borrower is insufficient to cover the value of loaned securities and provided such collateral insufficiency is not the result of investment losses, the lending agent has |
| Royce Capital Fund 2018 Annual Report to Shareholders | 21 |
Notes to Financial Statements (continued)
| SECURITIES LENDING (continued): |
| agreed to pay the amount of the shortfall to the Funds or, at the option of the lending agent, to replace the securities. In the event of the bankruptcy of the borrower, the Funds could experience delay in recovering the loaned securities or only recover cash or a security of equivalent value. Loans of securities generally do not have stated maturity dates, and the Funds may recall a security at any time. The Funds’ securities lending income consists of the income earned on investing cash collateral, plus any premium payments received for lending certain securities, less any rebates paid to borrowers and lending agent fees associated with the loan. The lending agent is not affiliated with Royce. The market value of non-cash collateral held by the Funds at December 31, 2018 was $1,296,246 for Micro-Cap Portfolio. |
| The following table presents by financial instrument, a Fund’s assets and liabilities net of related collateral held by the Fund at December 31, 2018: |
| | | CASH COLLATERAL1 | | SECURITIES ON LOAN
COLLATERALIZED BY CASH COLLATERAL | | | NET AMOUNT |
| |
| Micro-Cap Portfolio | | | | | | | | | | | | | |
| |
| Collateral on Loaned Securities/Securities on Loan | | $ | 3,911,179 | | | $ | (3,769,889) | | | | $ | 141,290 | |
| |
| 1Absent an event of default, assets and liabilities are presented gross and not offset in the Statements of Assets and Liabilities. The remaining contractual maturity of cash collateral is overnight and continuous. |
| |
| DISTRIBUTIONS AND TAXES: |
| As qualified regulated investment companies under Subchapter M of the Internal Revenue Code, the Funds are not subject to income taxes to the extent that each Fund distributes substantially all of its taxable income for its fiscal year. |
| The Funds pay any dividends and capital gain distributions annually in December. Dividends from net investment income and distributions from capital gains are determined at a class level. Because federal income tax regulations differ from generally accepted accounting principles, income and capital gain distributions determined in accordance with tax regulations may differ from net investment income and realized gains recognized for financial reporting purposes. Accordingly, the character of distributions and composition of net assets for tax purposes differ from those reflected in the accompanying financial statements. |
| |
| INVESTMENT TRANSACTIONS AND RELATED INVESTMENT INCOME: |
| Investment transactions are accounted for on the trade date. Dividend income is recorded on the ex-dividend date. Non-cash dividend income is recorded at the fair market value of the securities received. Interest income is recorded on an accrual basis. Realized gains and losses from investment transactions are determined on the basis of identified cost for book and tax purposes. |
| |
| EXPENSES: |
| The Funds incur direct and indirect expenses. Expenses directly attributable to a Fund are charged to the Fund’s operations, while expenses applicable to more than one of the Royce Funds are allocated equitably. Certain personnel, occupancy costs and other administrative expenses related to the Funds are allocated by Royce & Associates (“Royce”) under an administration agreement and are included in administrative and office facilities and legal expenses. The Trust has adopted a deferred fee agreement that allows the Trustees to defer the receipt of all or a portion of trustees’ fees otherwise payable. The deferred fees are invested in certain Royce Funds until distributed in accordance with the agreement. |
| |
| COMPENSATING BALANCE CREDITS: |
| The Funds have arrangements with their custodian bank and transfer agent, whereby a portion of the custodian’s fee and transfer agent’s fee is paid indirectly by credits earned on a Fund’s cash on deposit with the bank and transfer agent. These deposit arrangements are an alternative to purchasing overnight investments. Conversely, a Fund pays interest to the custodian on any cash overdrafts, to the extent they are not offset by credits earned on positive cash balances. |
| |
| LINE OF CREDIT: |
| The Funds, along with certain other Royce Funds, participate in a $65 million line of credit (“Credit Agreement”) with State Street Bank and Trust Company to be used for temporary or emergency purposes. This revolving Credit Agreement expires on October 11, 2019. Pursuant to the Credit Agreement, each participating Fund is liable for a portion of the commitment fee for the credit facility and for principal and interest payments related to borrowings made by that Fund. Borrowings under the Credit Agreement bear interest at a rate equal to the higher of the federal funds rate or One-Month LIBOR rate, plus 1.25%. The Funds did not utilize the line of credit during the year ended December 31, 2018. |
| 22 | Royce Capital Fund 2018 Annual Report to Shareholders |
| Capital Share Transactions (in shares): | | | | | | | | | | | | | | | | | | | | | | |
| | | SHARES SOLD | | SHARES ISSUED FOR REINVESTMENT
OF DISTRIBUTIONS | SHARES REDEEMED | | NET INCREASE (DECREASE) IN
SHARES OUTSTANDING | |
| | | |
| | | Year Ended
12/31/18 | | | Year Ended
12/31/17 | | | Year Ended
12/31/18 | | Year Ended
12/31/17 | | Year Ended
12/31/18 | | | | Year Ended
12/31/17 | | | | Year Ended
12/31/18 | | | | Year Ended
12/31/17 | |
| |
| Micro-Cap Portfolio | | | | | | | | | | | | | | | | | | | | | | | | | | | |
| Investment Class | | 1,819,499 | | | 1,796,718 | | | 714,268 | | | 1,782,597 | | | (4,181,042 | ) | | | (3,703,922 | ) | | | (1,647,275 | ) | | | (124,607 | ) |
| |
| Service Class | | 801,841 | | | 802,872 | | | 83,201 | | | 345,903 | | | (2,360,627 | ) | | | (1,182,366 | ) | | | (1,475,585 | ) | | | (33,591 | ) |
| |
| Small-Cap Portfolio | | | | | | | | | | | | | | | | | | | | | | | | | | | |
| Investment Class | | 2,267,674 | | | 3,308,390 | | | 486,074 | | | 242,182 | | | (7,004,964 | ) | | | (7,022,710 | ) | | | (4,251,216 | ) | | | (3,472,138 | ) |
| |
| Service Class | | 351,826 | | | 23,847,980 | | | 230,521 | | | 245,185 | | | (17,851,746 | ) | | | (25,883,175 | ) | | | (17,269,399 | ) | | | (1,790,010 | ) |
| |
| Investment Adviser and Distributor: |
| |
| INVESTMENT ADVISER: |
| Under the Trust’s investment advisory agreements with Royce, Royce is entitled to receive investment advisory fees in respect of each Fund that are computed daily and payable monthly. Royce has contractually agreed, without right of termination, to waive fees and/or reimburse expenses (excluding brokerage commissions, taxes, interest, litigation expenses, acquired fund fees and expenses, and other expenses not borne in the ordinary course of business) to the extent necessary to maintain the Funds’ net annual operating expense ratios at specified levels through April 30, 2019, and is shown below to the extent that it impacted net expenses for the year ended December 31, 2018. See the Prospectus for contractual waiver expiration dates. |
| | | ANNUAL CONTRACTUAL
ADVISORY FEE AS A
PERCENTAGE OF AVERAGE
NET ASSETS | | COMMITTED NET ANNUAL OPERATING
EXPENSE RATIO CAP1 | | YEAR ENDED DECEMBER 31, 2018 |
| | | | |
| | | | Investment Class1 | | Service Class1 | | Net advisory fees | | Advisory fees
waived |
| |
| Micro-Cap Portfolio | | 1.25% | | 1.33% | | 1.58% | | $ 2,296,496 | | $ 38,245 |
| |
| Small-Cap Portfolio | | 1.00% | | 1.08% | | 1.33% | | 4,385,919 | | 40,355 |
| |
1Committed net annual operating expense ratio cap excludes acquired fund fees and expenses. |
| DISTRIBUTOR: |
| Royce Fund Services, LLC (“RFS”), the distributor of the Trust’s shares, is a wholly owned subsidiary of Royce. RFS is entitled to receive distribution fees from each Fund’s Service Class that are computed daily and payable monthly, at an annual rate of 0.25% of the average net assets of each Class. For the year ended December 31, 2018, Micro-Cap Portfolio-Service Class recorded net distribution fees of $71,113 and Small-Cap Portfolio-Service Class recorded net distribution fees of $576,970. |
| |
| Purchases and Sales of Investment Securities: |
| For the year ended December 31, 2018, the costs of purchases and the proceeds from sales of investment securities, other than short-term securities and collateral received for securities loaned, were as follows: |
| | | | PURCHASES | | | | SALES |
| |
| Micro-Cap Portfolio | | $ | 48,975,730 | | | $ | 80,280,081 |
| |
| Small-Cap Portfolio | | | 229,447,149 | | | | 394,434,514 |
| |
| Cross trades were executed by the Funds pursuant to Rule 17a-7 under the 1940 Act. Cross trading is the buying or selling of portfolio securities between funds to which Royce serves as investment adviser. At its regularly scheduled quarterly meetings, the Board reviews such transactions as of the most recent calendar quarter for compliance with the requirements and restrictions set forth by Rule 17a-7. Cross trades for the year ended December 31, 2018, were as follows: |
| | | COSTS OF PURCHASES | | PROCEEDS FROM SALES | | REALIZED GAIN (LOSS) |
| |
| Micro-Cap Portfolio | | $ | 491,777 | | | $ | – | | | $ | – | |
| |
| Small-Cap Portfolio | | | – | | | | 498,524 | | | | (236,892 | ) |
| |
| Class Specific Expenses: |
| Class specific expenses were as follows for the year ended December 31, 2018: |
| | | | | | | | | | | | | | | | | | | | | | | CLASS LEVEL |
| | | | | | | | | | | | | | | | | | | | | | | EXPENSES |
| | | | | | | | | | | | | | | | | | | | | | | REIMBURSED BY |
| | | NET DISTRIBUTION | | SHAREHOLDER | | SHAREHOLDER | | TRANSFER AGENT | | | | | | INVESTMENT |
| | | FEES | | SERVICING | | REPORTS | | BALANCE CREDITS | | TOTAL | | ADVISER |
| |
| Micro-Cap Portfolio – Investment Class | | $ | – | | | $ | 7,447 | | | $ | 48,038 | | | $ | (86 | ) | | $ | 55,399 | | | $ | 55,399 |
| |
| Micro-Cap Portfolio – Service Class | | | 71,113 | | | | 6,468 | | | | 7,270 | | | | (32 | ) | | | 84,819 | | | | 12,560 |
| |
| | | | 71,113 | | | | 13,915 | | | | 55,308 | | | | (118 | ) | | | | | | | 67,959 |
| |
| Small-Cap Portfolio – Investment Class | | | – | | | | 7,066 | | | | 43,291 | | | | (75 | ) | | | 50,282 | | | | 50,282 |
| |
| Small-Cap Portfolio – Service Class | | | 576,970 | | | | 6,531 | | | | 21,554 | | | | (30 | ) | | | 605,025 | | | | 13,031 |
| |
| | | | 576,970 | | | | 13,597 | | | | 64,845 | | | | (105 | ) | | | | | | | 63,313 |
| |
| Royce Capital Fund 2018 Annual Report to Shareholders | 23 |
| Notes to Financial Statements (continued) |
| TAX INFORMATION: |
| At December 31, 2018, net unrealized appreciation (depreciation) based on identified cost for tax purposes was as follows: |
| | | | | NET UNREALIZED | | GROSS UNREALIZED |
| | | | | | | |
| | | TAX BASIS COST | | APPRECIATION (DEPRECIATION) | | Appreciation | | Depreciation |
| |
| Micro-Cap Portfolio | | $135,558,112 | | $9,825,072 | | $32,930,053 | | $23,104,981 |
| |
| Small-Cap Portfolio | | 270,748,821 | | 3,224,583 | | 29,388,338 | | 26,163,755 |
| |
| The primary causes of the difference between book and tax basis cost are the timing of the recognition of losses on securities sold and investments in Real Estate Investment Trusts. |
| Distributions during the years ended December 31, 2018 and 2017, were characterized as follows for tax purposes: |
| | | ORDINARY INCOME | | LONG-TERM CAPITAL GAINS |
| | | |
| | | 2018 | | 2017 | | 2018 | | 2017 |
| |
| Micro-Cap Portfolio | | $ | 569,555 | | | $ | 1,261,565 | | | $ | 6,887,754 | | | $ | 20,390,335 | |
| |
| Small-Cap Portfolio | | | 1,850,693 | | | | 4,122,801 | | | | 3,919,389 | | | | – | |
| |
| The tax basis components of distributable earnings at December 31, 2018, were as follows: |
| | | | | | | NET UNREALIZED | | | | CAPITAL LOSS |
| | | UNDISTRIBUTED | | UNDISTRIBUTED | | APPRECIATION | | TOTAL DISTRIBUTABLE | | CARRYFORWARD |
| | | ORDINARY INCOME | | LONG-TERM CAPITAL GAINS | | (DEPRECIATION)1 | | EARNINGS | | UTILIZED |
| |
| Micro-Cap Portfolio | | $ – | | $ 14,177,700 | | $ 9,823,888 | | $ 24,001,588 | | $– |
| |
| Small-Cap Portfolio | | 12,962,311 | | 35,501,765 | | 3,224,584 | | 51,688,660 | | – |
| |
1 Includes timing differences on foreign currency, recognition of losses on securities sold and investments in Real Estate Investment Trusts and publicly traded partnerships. |
| For financial reporting purposes, capital accounts and distributions to shareholders are adjusted to reflect the tax character of permanent book/tax differences. For the year ended December 31, 2018, the Funds recorded the following permanent reclassifications, which relate primarily to current net operating losses, foreign currency transactions and investments in Real Estate Investment Trusts. Results of operations and net assets were not affected by these reclassifications. |
| | | TOTAL DISTRIBUTABLE | | PAID-IN |
| | | EARNINGS (LOSS) | | CAPITAL |
| |
| Micro-Cap Portfolio | | $ | 676,615 | | | $ | (676,615 | ) |
| |
| Small-Cap Portfolio | | | – | | | | – | |
| |
| Management has analyzed the Funds’ tax positions taken on federal income tax returns for all open tax years (2015 – 2018) and has concluded that as of December 31, 2018, no provision for income tax is required in the Funds’ financial statements. |
| |
| Recent Accounting Pronouncement: |
| In August 2018, the Securities and Exchange Commission released its Final Rule on Disclosure Update and Simplification (the “Final Rule”) which is intended to simplify an issuer’s disclosure compliance efforts by removing redundant or outdated disclosure requirements without significantly altering the mix of information provided to investors. Effective with the current reporting period, the Funds adopted the Final Rule with the most notable impacts being that the Funds are no longer required to present the components of distributable earnings on the Statement of Assets and Liabilities or the sources of distributions to shareholders and the amount of undistributed net investment income on the Statements of Changes in Net Assets. |
| |
| Subsequent Events: |
| Subsequent events have been evaluated through the date the financial statements were issued. |
| 24 | Royce Capital Fund 2018 Annual Report to Shareholders |
Report of Independent Registered Public Accounting Firm
To the Board of Trustees of Royce Capital Fund and Shareholders of Royce Capital Fund – Micro-Cap Portfolio and Royce Capital Fund – Small-Cap Portfolio:
Opinions on the Financial Statements
We have audited the accompanying statements of assets and liabilities, including the schedules of investments, of Royce Capital Fund – Micro-Cap Portfolio and Royce Capital Fund – Small-Cap Portfolio (constituting Royce Capital Fund, hereafter collectively referred to as the “Funds”) as of December 31, 2018, the related statements of operations for the year ended December 31, 2018, the statements of changes in net assets for each of the two years in the period ended December 31, 2018, including the related notes, and the financial highlights for each of the five years in the period ended December 31, 2018 (collectively referred to as the “financial statements”). In our opinion, the financial statements present fairly, in all material respects, the financial position of each of the Funds as of December 31, 2018, the results of each of their operations for the year then ended, the changes in each of their net assets for each of the two years in the period ended December 31, 2018 and each of the financial highlights for each of the five years in the period ended December 31, 2018 in conformity with accounting principles generally accepted in the United States of America.
Basis for Opinions
These financial statements are the responsibility of the Funds’ management. Our responsibility is to express an opinion on the Funds’ financial statements based on our audits. We are a public accounting firm registered with the Public Company Accounting Oversight Board (United States) (PCAOB) and are required to be independent with respect to the Fund in accordance with the U.S. federal securities laws and the applicable rules and regulations of the Securities and Exchange Commission and the PCAOB.
We conducted our audits of these financial statements in accordance with the standards of the PCAOB. Those standards require that we plan and perform the audit to obtain reasonable assurance about whether the financial statements are free of material misstatement, whether due to error or fraud.
Our audits included performing procedures to assess the risks of material misstatement of the financial statements, whether due to error or fraud, and performing procedures that respond to those risks. Such procedures included examining, on a test basis, evidence regarding the amounts and disclosures in the financial statements. Our audits also included evaluating the accounting principles used and significant estimates made by management, as well as evaluating the overall presentation of the financial statements. Our procedures included confirmation of securities owned as of December 31, 2018 by correspondence with the custodian and brokers; when replies were not received from brokers, we performed other auditing procedures. We believe that our audits provide a reasonable basis for our opinions.
/s/PricewaterhouseCoopers LLP
New York, New York
February 14, 2019
We have served as the auditor of one or more investment companies in the Royce investment company group since at least 1967. We have not been able to determine the specific year we began serving as auditor.
| Royce Capital Fund 2018 Annual Report to Shareholders | 25 |
| Understanding Your Fund’s Expenses (unaudited) |
| |
| As a shareholder of a mutual fund, you pay ongoing expenses, including management fees and other Fund expenses including, for some funds, distribution and/or service (12b-1) fees. Using the information below, you can estimate how these ongoing expenses (in dollars) affect your investment and compare them with the ongoing expenses of other funds. You may also incur one-time transaction expenses which are not shown in this section and would result in higher total costs. The example is based on an investment of $1,000 invested at July 1, 2018, and held for the entire six-month period ended December 31, 2018. Service Class shares are generally available only through certain insurance companies who receive service fees from the Fund for services that they perform. |
| |
| Actual Expenses |
| The first part of the table below provides information about actual account values and actual expenses. You may use the information in this section, together with the amount you invested, to estimate the expenses that you paid over the period. Simply divide your account value at December 31, 2018 by $1,000 (for example, an $8,600 account value divided by $1,000 = 8.6), then multiply the result by the number under the heading entitled “Expenses Paid During the Period” to estimate the expenses you paid on your account during this period. |
| |
| Hypothetical Example for Comparison Purposes |
| The second part of the table below provides information about hypothetical account values and hypothetical expenses based on the Fund’s actual expense ratio and an assumed rate of return of 5% per year before expenses, which is not the Fund’s actual return. The hypothetical account values and expenses may not be used to estimate the actual ending account balance or expenses you paid for the period. You may use this information to compare the ongoing costs of investing in the Fund and other funds. To do so, compare this 5% hypothetical example with the 5% hypothetical examples that appear in the shareholder reports of the other funds. |
| Please note that the expenses shown in the table are meant to highlight your ongoing costs only and do not reflect any transactional costs, such as sales charges (loads), redemption fees, or exchange fees. Therefore, this section is useful in comparing ongoing costs only, and will not help you determine the relative total costs of owning different funds. In addition, if these transactional costs were included, your costs would have been higher. |
| | | ACTUAL | | HYPOTHETICAL (5% PER YEAR BEFORE EXPENSES) |
| | | |
| | | Beginning Account
Value 7/1/18 | | Ending Account Value
12/31/18 | | Expenses Paid During
the Period1 | | Beginning Account
Value 7/1/18 | | Ending Account Value
12/31/18 | | Expenses Paid During
the Period1 | | Annualized Expense
Ratio2 |
| |
| Investment Class | | | | | | | | | | | | | | |
| Micro-Cap Portfolio | | $1,000.00 | | $824.56 | | $6.12 | | $1,000.00 | | $1,018.50 | | $6.77 | | 1.33% |
| |
| Small-Cap Portfolio | | 1,000.00 | | 856.14 | | 5.05 | | 1,000.00 | | 1,019.76 | | 5.50 | | 1.08% |
| |
| Service Class | | | | | | | | | | | | | | |
| Micro-Cap Portfolio | | 1,000.00 | | 823.28 | | 7.26 | | 1,000.00 | | 1,017.24 | | 8.03 | | 1.58% |
| |
| Small-Cap Portfolio | | 1,000.00 | | 855.02 | | 6.22 | | 1,000.00 | | 1,018.50 | | 6.77 | | 1.33% |
| |
| 1 | Expenses are equal to the Fund’s annualized expense ratio multiplied by the average account value for the period, multiplied by 184 days in the most recent fiscal half-year divided by 365 days (to reflect the half-year period). This information does not include fees or expenses of the variable annuity contracts investing in the Fund. |
| 2 | Annualized expense ratio used to derive figures in the table is based on the most recent fiscal half-year. |
| Federal Tax Information |
| In January 2019, taxable shareholders were mailed a Form 1099-DIV reporting the federal tax status of all distributions paid during the calendar year 2018. |
| |
| 2018 Supplemental Tax Information: |
| FUND | | %
QDI | | % U.S. GOVT
INCOME | | % INCOME QUALIFYING
FOR DRD | | LONG-TERM CAPITAL GAIN DISTRIBUTION
MAXIMUM ALLOWABLE (000’s) |
| |
| Micro-Cap Portfolio | | 100.00% | | N/A | | 100.00% | | $6,888 |
| |
| Small-Cap Portfolio | | 100.00% | | N/A | | 100.00% | | 3,919 |
| |
| Definitions: |
% QDI: Qualified Dividend Income; % of net investment income and/or short-term capital gains distributions that qualify for treatment at long-term capital gain rates. |
% U.S. Govt Income: % of investment income paid from U.S. Government obligations. |
% Income Qualifying for DRD: % of investment income eligible for the corporate dividend received deduction. |
| 26 | Royce Capital Fund 2018 Annual Report to Shareholders |
Trustees and Officers
All Trustees and Officers may be reached c/o The Royce Funds, 745 Fifth Avenue, New York, NY 10151
Charles M. Royce, Trustee1
Age: 79 | Number of Funds Overseen: 21 | Tenure: Since 1982
Non-Royce Directorships: Director of Oxford Square Capital Corp.
Principal Occupation(s) During Past Five Years: Chairman of the Board of Managers of Royce & Associates, LP (“Royce”), the Trust’s investment adviser; Chief Executive Officer (1972–June 2016), President (1972-June 2014) of Royce.
Christopher D. Clark, Trustee1, President
Age: 53 | Number of Funds Overseen: 21 | Tenure: Since 2014
Principal Occupation(s) During Past Five Years: Chief Executive Officer (since July 2016), President (since July 2014), Co-Chief Investment Officer (Since January 2014), Managing Director of Royce, a Member of the Board of Managers of Royce, having been employed by Royce since May 2007.
Patricia W. Chadwick, Trustee
Age: 70 | Number of Funds Overseen: 21 | Tenure: Since 2009
Non-Royce Directorships: Trustee of Voya Mutual Funds and Director of Wisconsin Energy Corp.
Principal Occupation(s) During Past 5 Years: Consultant and President of Ravengate Partners LLC (since 2000).
Christopher C. Grisanti, Trustee
Age: 57 | Number of Funds Overseen: 21 | Tenure: Since 2017
Non-Royce Directorships: None
Principal Occupation(s) During Past Five Years: Co-Founder and Chief Executive Officer of Grisanti Capital Management LLC, an investment advisory firm (since 1999). Mr. Grisanti’s prior business experience includes serving as Director of Research and Portfolio Manager at Spears Benzak, Salomon & Farrell (from 1994 to 1999) and a senior associate at the law firm of Simpson, Thacher & Bartlett (from 1988 to 1994).
Stephen L. Isaacs, Trustee
Age: 79 | Number of Funds Overseen: 21 | Tenure: Since 1989
Non-Royce Directorships: None
Principal Occupation(s) During Past Five Years: Attorney and President of Health Policy Associates, Inc., consultants. Mr. Isaacs’s prior business experience includes having served as President of the Center for Health and Social Policy (from 1996 to 2012); Director of Columbia University Development Law and Policy Program and Professor at Columbia University (until August 1996).
Arthur S. Mehlman, Trustee
Age: 76 | Number of Funds Overseen: 40 | Tenure: Since 2004
Non-Royce Directorships: Director/Trustee of registered investment companies constituting the 19 Legg Mason Funds.
Principal Occupation(s) During Past Five Years: Director of The League for People with Disabilities, Inc.; Director of University of Maryland Foundation (non-profits). Formerly: Director of Municipal Mortgage & Equity, LLC (from October 2004 to April 1, 2011); Director of University of Maryland College Park Foundation (non-profit) (from 1998 to 2005); Partner, KPMG LLP (international accounting firm) (from 1972 to 2002); Director of Maryland Business Roundtable for Education (from July 1984 to June 2002).
David L. Meister, Trustee
Age: 79 | Number of Funds Overseen: 21 | Tenure: Since 1982
Non-Royce Directorships: None
Principal Occupation(s) During Past Five Years: Consultant. Chairman and Chief Executive Officer of The Tennis Channel (from June 2000 to March 2005). Mr. Meister’s prior business experience includes having served as Chief Executive Officer of Seniorlife.com, a consultant to the communications industry, President of Financial News Network, Senior Vice President of HBO, President of Time-Life Films, and Head of Broadcasting for Major League Baseball.
G. Peter O’Brien, Trustee
Age: 73 | Number of Funds Overseen: 40 | Tenure: Since 2001
Non-Royce Directorships: Director/Trustee of registered investment companies constituting the 19 Legg Mason Funds.
Principal Occupation(s) During Past Five Years: Trustee Emeritus of Colgate University (since 2005); Board Member of Hill House, Inc. (since 1999); Formerly Director of TICC Capital Corp (from 2003-2017): Trustee of Colgate University (from 1996 to 2005), President of Hill House, Inc. (from 2001 to 2005) and Managing Director/Equity Capital Markets Group of Merrill Lynch & Co. (from 1971 to 1999).
Michael K. Shields, Trustee
Age: 60 | Number of Funds Overseen: 21 | Tenure: Since 2015
Principal Occupation(s) During Past Five Years: President and Chief Executive Officer of Piedmont Trust Company, a private North Carolina trust company (since May 2012). Mr. Shields’s prior business experience includes owning Shields Advisors, an investment consulting firm (from April 2010 to June 2012).
Francis D. Gannon, Vice President
Age: 51 | Tenure: Since 2014
Principal Occupation(s) During Past Five Years: Co-Chief Investment Officer (since January 2014) and Managing Director of Royce, having been employed by Royce since September 2006.
Daniel A. O’Byrne, Vice President
Age: 56 | Tenure: Since 1994
Principal Occupation(s) During Past Five Years: Principal and Vice President of Royce, having been employed by Royce since October 1986.
Peter K. Hoglund, Treasurer
Age: 52 | Tenure: Since 2015
Principal Occupation(s) During Past Five Years: Chief Financial Officer, Chief Administrative Officer, and Managing Director of Royce, having been employed by Royce since December 2014. Prior to joining Royce, Mr. Hoglund spent more than 20 years with Munder Capital Management in Birmingham, MI, serving as Managing Director and Chief Financial Officer and overseeing all financial aspects of the firm. He began his career at Munder as a portfolio manager.
John E. Denneen, Secretary and Chief Legal Officer
Age: 51 | Tenure: 1996-2001 and Since 2002
Principal Occupation(s) During Past Five Years: General Counsel, Managing Director, and, since June 2015, a Member of the Board of Managers of Royce. Chief Legal and Compliance Officer and Secretary of Royce.
Lisa Curcio, Chief Compliance Officer
Age: 59 | Tenure: Since 2004
Principal Occupation(s) During Past Five Years: Chief Compliance Officer of The Royce Funds (since October 2004) and Compliance Officer of Royce (since June 2004).
| 1 | Interested Trustee. |
| | Trustees will hold office until their successors have been duly elected and qualified or until their earlier resignation or removal. The Statement of Additional Information, which contains additional information about the Trust’s trustees and officers, is available and can be obtained without charge at www.roycefunds.com or by calling (800) 221-4268. |
| Royce Capital Fund 2018 Annual Report to Shareholders | 27 |
Notes to Performance and Other Important Information
The thoughts expressed in this report concerning recent market movements and future prospects for small company stocks are solely the opinion of Royce at December 31, 2018, and, of course, historical market trends are not necessarily indicative of future market movements. Statements regarding the future prospects for particular securities held in the Funds’ portfolios and Royce’s investment intentions with respect to those securities reflect Royce’s opinions as of December 31, 2018 and are subject to change at any time without notice. There can be no assurance that securities mentioned in this report will be included in any Royce-managed portfolio in the future.
Sector weightings are determined using the Global Industry Classification Standard (“GICS”). GICS was developed by, and is the exclusive property of, Standard & Poor’s Financial Services LLC (“S&P”) and MSCI Inc. (“MSCI”). GICS is the trademark of S&P and MSCI. “Global Industry Classification Standard (GICS)” and “GICS Direct” are service marks of S&P and MSCI.
All indexes referenced are unmanaged and capitalization weighted. Each index’s returns include net reinvested dividends and/or interest income. Frank Russell Company (“Russell”) is the source and owner of the trademarks, service marks and copyrights related to the Russell Indexes. Russell® is a trademark of Frank Russell Company. Neither Russell nor its licensors accept any liability for any errors or omissions in the Russell Indexes and / or Russell ratings or underlying data and no party may rely on any Russell Indexes and / or Russell ratings and / or underlying data contained in this communication. No further distribution of Russell Data is permitted without Russell’s express written consent. Russell does not promote, sponsor or endorse the content of this communication. The Russell 2000 is an index of domestic small-cap stocks. It measures the performance of the 2,000 smallest publicly traded U.S. companies in the Russell 3000 Index. The Russell 2000 Value and Growth Indexes consist of the respective value and growth stocks within the Russell 2000 as determined by Russell Investments. The Russell Microcap Index includes 1,000 of the smallest securities in the small-cap Russell 2000 Index along with the next smallest eligible securities as determined by Russell. The performance of an index does not represent exactly any particular investment, as you cannot invest directly in an index. Returns for the market indexes used in this report were based on information supplied to Royce by Russell Investments. Royce has not independently verified the above described information.
The Price-Earnings, or P/E, Ratio is calculated by dividing a company’s share price by its trailing 12-month earnings-per share (EPS). The Price-to-Book, or P/B, Ratio is calculated by dividing a company’s share price by its book value per share. Standard deviation is a statistical measure within which a fund’s total returns have varied overtime. The greater the standard deviation, the greater a fund’s volatility. The Morningstar Style Map uses proprietary scores of a stock’s value and growth characteristics to determine its placement in one of the five categories listed on the horizontal axis. These characteristics are then compared to those of other stocks within the same market capitalization band. Each is scored from zero to 100 for both value and growth attributes. The value score is subtracted from the growth score to determine the overall style score. For the vertical, market cap axis, Morningstar subdivides into size groups. Giant-cap stocks are defined as those that account for the top 40% of the capitalization of each style zone; large-cap stocks represent the next 30%; mid-cap stocks the next 20%; small-cap stocks the next 7%; micro-cap stocks the smallest 3%. Standard deviation is a statistical measure within which a fund’s total returns have varied over time. The greater the standard deviation, the greater a fund’s volatility. The value score is subtracted from the growth score to determine the overall style score. Cyclical and Defensive are defined as follows: Cyclical and Defensive are defined as follows: Cyclical: Communication Services, Consumer Discretionary, Energy, Financials, Industrials, Information Technology, and Materials. Defensive: Consumer Staples, Health Care, Real Estate, Utilities. The Royce Funds is a service mark of The Royce Funds. Distributor: Royce Fund Services, LLC.
Royce Capital Fund–Micro-Cap Portfolio invests primarily in securities of micro-cap companies and Royce Capital Fund–Small-Cap Portfolio invests primarily in securities of small-cap companies. Investments in these types of companies may involve considerably more risk than investments in securities of larger-cap companies. (Please see “Primary Risks for Fund Investors” in the prospectus.) Royce Capital Fund–Micro-Cap Portfolio and Royce Capital Fund–Small-Cap Portfolio may each invest up to 25% its assets in foreign securities that may involve political, economic, currency, and other risks not encountered in U.S. investments. (Please see “Investing in Foreign Securities” in the prospectus.) A Fund that invests a significant portion of its assets in a limited number of stocks may be subject to considerably more risk than a more broadly diversified Fund because a decline in the value of any of these stocks would cause that Fund’s overall value to decline to a greater degree. A broadly diversified portfolio does not, however, ensure a profit for a Fund or guarantee against loss. Please read the prospectus carefully before investing or sending money. A copy of the Funds’ current prospectus and a Statement of Additional Information may be obtained by calling (800) 221-4268 or by visiting www.roycefunds.com. All publicly released material Fund information is disclosed by the Funds on their website at www.roycefunds.com.
Forward-Looking Statements
This material contains forward-looking statements within the meaning of the Securities Exchange Act of 1934, as amended (the “Exchange Act”), that involve risks and uncertainties, including, among others, statements as to:
| • | the Funds’ future operating results, |
| • | the prospects of the Funds’ portfolio companies, |
| • | the impact of investments that the Funds have made or may make, |
| • | the dependence of the Funds’ future success on the general economy and its impact on the companies and industries in which the Funds invest, and |
| • | the ability of the Funds’ portfolio companies to achieve their objectives. |
This review and report use words such as “anticipates,” “believes,” “expects,” “future,” “intends,” and similar expressions to identify forward-looking statements. Actual results may differ materially from those projected in the forward-looking statements for any reason.
The Royce Funds have based the forward-looking statements included in this review and report on information available to us on the date of the report, and we assume no obligation to update any such forward-looking statements. Although The Royce Funds undertake no obligation to revise or update any forward-looking statements, whether as a result of new information, future events, or otherwise, you are advised to consult any additional disclosures that we may make through future shareholder communications or reports.
Proxy Voting
A copy of the policies and procedures that The Royce Funds use to determine how to vote proxies relating to portfolio securities and information regarding how each of The Royce Funds voted proxies relating to portfolio securities during the most recent 12-month period ended June 30 is available, without charge, on The Royce Funds’ website at www.roycefunds.com, by calling (800) 221-4268 (toll-free), and on the website of the Securities and Exchange Commission (“SEC”) at www.sec.gov.
Form N-Q Filing
The Funds file their complete schedules of investments with the SEC for the first and third quarters of each fiscal year on Form N-Q. The Funds’ Forms N-Q are available on The Royce Funds’ website at www.roycefunds.com and on the SEC’s website at www.sec.gov. The Funds’ Forms N-Q may also be reviewed and copied at the SEC’s Public Reference Room in Washington, D.C. To find out more about this public service, call the SEC at (202) 942-8090. The Funds’ complete schedules of investments are updated quarterly and are available at www.roycefunds.com.
| 28 | Royce Capital Fund 2018 Annual Report to Shareholders |
| | | | | |
| | | | | |
| | | | | |
| | | | | |
| | | | | |
| |
 | | | |
 | |
| | | | | |
| | | | | |
| | About The Royce Funds | | | |
| | | | | |
| | | | | |
| | Unparalleled Knowledge + Experience
Pioneers in small-cap investing, with 40+ years
of experience, depth of knowledge, and focus. | | | |
| | | | | |
| | Independent Thinking
The confidence to go against consensus, the insight
to uncover opportunities others might miss, and the
tenacity to stay the course through market cycles. | | | |
| | | | | |
| | Specialized Approaches
Strategies that use value, core, or growth investment
approaches to select micro-cap, small-cap, and
mid-cap companies. | | Contact Us
| |
| |
Unwavering Commitment
Our team of 18 portfolio managers have significant
personal investments in the strategies they manage.
| | GENERAL INFORMATION
Additional Report Copies
and Prospectus Inquiries
(800) 221-4268 | |
| | | | | |
| | | | | |
| | | | | |
| | | | | |
| | | | | |
| |  | | |  |
| | | | | |
| | | | | |
Item 2. Code(s) of Ethics. As of the end of the period covered by this report, the Registrant had adopted a code of ethics, as defined in Item 2 of Form N-CSR, applicable to its principal executive officer, principal financial officer, principal accounting officer or controller, or persons performing similar functions. A copy of this code of ethics is filed as an exhibit to this Form N-CSR. No substantive amendments were approved or waivers were granted to this code of ethics during the period covered by this report.
Item 3. Audit Committee Financial Expert.
| (a)(1) | The Board of Trustees of the Registrant has determined that it has an audit committee financial expert. |
| | |
| (a)(2) | Arthur S. Mehlman and Patricia W. Chadwick were designated by the Board of Trustees as the Registrant’s Audit Committee Financial Experts, effective April 15, 2004 and April 8, 2010, respectively. Mr. Mehlman and Ms. Chadwick are “independent” as defined under Item 3 of Form N-CSR. |
Item 4. Principal Accountant Fees and Services.
| (a) | Audit Fees: |
| | Year ended December 31, 2018 - $43,072 |
| | Year ended December 31, 2017 - $42,021 |
| | |
| (b) | Audit-Related Fees: |
| | Year ended December 31, 2018 - $0 |
| | Year ended December 31, 2017 - $0 |
| | |
| (c) | Tax Fees: |
| | Year ended December 31, 2018 - $18,380 – Preparation of tax returns and excise tax review |
| | Year ended December 31, 2017 - $19,000 – Preparation of tax returns and excise tax review |
| | |
| (d) | All Other Fees: |
| | Year ended December 31, 2018 - $0 |
| | Year ended December 31, 2017 - $0 |
(e)(1) Annual Pre-Approval: On an annual basis, the Registrant’s independent auditor submits to the Audit Committee a schedule of proposed audit, audit-related, tax and other non-audit services to be rendered to the Registrant and/or investment adviser(s) for the following year that require pre-approval by the Audit Committee. This schedule provides a description of each type of service that is expected to require pre-approval and the maximum fees that can be paid for each such service without further Audit Committee approval. The Audit Committee then reviews and determines whether to approve the types of scheduled services and the projected fees for them. Any subsequent revision to already pre-approved services or fees (including fee increases) are presented for consideration at the next regularly scheduled Audit Committee meeting, as needed.
If subsequent to the annual pre-approval of services and fees by the Audit Committee, the Registrant or one of its affiliates determines that it would like to engage the Registrant’s independent auditor to perform a service not already pre-approved, the request is to be submitted to the Registrant’s Chief Financial Officer, and if he or she determines that the service fits within the independence guidelines (e.g., it is not a prohibited service), he or she will then arrange for a discussion of the proposed service and fee to be included on the agenda for the next regularly scheduled Audit Committee meeting so that pre-approval can be considered.
Interim Pre-Approval: If, in the judgment of the Registrant’s Chief Financial Officer, a proposed engagement needs to commence before the next regularly scheduled Audit Committee meeting, he or she shall submit a written summary of the proposed engagement to all members of the Audit Committee, outlining the services, the estimated maximum cost, the category of the services (e.g., audit, audit-related, tax or other) and the rationale for engaging the Registrant’s independent auditor to perform the services. To the extent the proposed engagement involves audit, audit-related or tax services, any individual member of the Audit Committee who is an independent Board member is authorized to pre-approve the engagement. To the extent the proposed engagement involves non-audit services other than audit-related or tax, the Chairman of the Audit Committee is authorized to
pre-approve the engagement. The Registrant’s Chief Financial Officer will arrange for this interim review and coordinate with the appropriate member(s) of the Committee. The independent auditor may not commence the engagement under consideration until the Registrant’s Chief Financial Officer has informed the auditor in writing that pre-approval has been obtained from the Audit Committee or an individual member who is an independent Board member. The member of the Audit Committee who pre-approves any engagements in between regularly scheduled Audit Committee meetings is to report, for informational purposes only, any pre-approval decisions to the Audit Committee at its next regularly scheduled meeting.
| (e)(2) | Not Applicable |
| | |
| (f) | Not Applicable |
| | |
| (g) | Year ended December 31, 2018 - $18,380 |
| | Year ended December 31, 2017 - $19,000 |
| | |
| (h) | No such services were rendered during 2018 or 2017. |
Item 5. Audit Committee of Listed Registrants. Not Applicable.
Item 6. Investments.
(a) See Item 1.
(b) Not Applicable
Item 7. Disclosure of Proxy Voting Policies and Procedures for Closed-End Management Investment Companies. Not Applicable.
Item 8. Portfolio Managers of Closed-End Management Investment Companies.Not Applicable.
Item 9. Purchases of Equity Securities by Closed-End Management Investment Company and Affiliated Purchasers. Not Applicable
Item 10. Submission of Matters to a Vote of Security Holders. Not Applicable.
Item 11. Controls and Procedures.
(a) Disclosure Controls and Procedures. The Principal Executive and Financial Officers concluded that the Registrant’s Disclosure Controls and Procedures are effective based on their evaluation of the Disclosure Controls and Procedures as of a date within 90 days of the filing date of this report.
(b) Internal Control over Financial Reporting. There were no significant changes in Registrant’s internal control over financial reporting or in other factors that could significantly affect this control subsequent to the date of the evaluation, including any corrective actions with regard to significant deficiencies and material weaknesses during the second fiscal quarter of the period covered by this report.
Item 12. Exhibits. Attached hereto.
(a)(1) The Registrant’s code of ethics pursuant to Item 2 of Form N-CSR.
(a)(2) Separate certifications by the Registrant’s Principal Executive Officer and Principal Financial Officer as required by Rule 30a-2(a) under the Investment Company Act of 1940.
(a)(3) Not Applicable
(b) Separate certifications by the Registrant’s Principal Executive Officer and Principal Financial Officer, pursuant to Section 906 of the Sarbanes-Oxley Act of 2002 and required by Rule 30a-2(b) under the Investment Company Act of 1940.
Pursuant to the requirements of the Securities Exchange Act of 1934 and the Investment Company Act of 1940, the registrant has duly caused this report to be signed on its behalf by the undersigned, thereunto duly authorized.
ROYCE CAPITAL FUND
| BY: | /s/ Christopher D. Clark |
| | Christopher D. Clark |
| | President |
| | |
| Date: February 26, 2019 |
Pursuant to the requirements of the Securities Exchange Act of 1934 and the Investment Company Act of 1940, this report has been signed below by the following persons on behalf of the registrant and in the capacities and on the dates indicated.
| ROYCE CAPITAL FUND | | ROYCE CAPITAL FUND |
| | | | | |
| BY: | /s/ Christopher D. Clark | | BY: | /s/ Peter K. Hoglund |
| | Christopher D. Clark | | | Peter K. Hoglund |
| | President | | | Treasurer |
| | | | | |
| Date: February 26, 2019 | | Date: February 26, 2019 |