UNITED STATES
SECURITIES AND EXCHANGE COMMISSION
Washington, D.C. 20549
FORM N-CSR
CERTIFIED SHAREHOLDER REPORT
OF
REGISTERED MANAGEMENT INVESTMENT COMPANIES
Investment Company Act File Number: 811-07537
Name of Registrant: Royce Capital Fund
Address of Registrant: 745 Fifth Avenue
New York, NY 10151
| Name and address of agent for service: | John E. Denneen, Esquire |
| 745 Fifth Avenue | |
| New York, NY 10151 |
Registrant's telephone number, including area code: (212) 508-4500
Date of fiscal year end: December 31
Date of reporting period: January 1, 2019 – December 31, 2019
Item 1. Reports to Shareholders.
Royce Capital Fund 2019 Annual
Review and Report to Shareholders
December 31, 2019
Royce Capital Fund–Micro-Cap Portfolio
Royce Capital Fund–Small-Cap Portfolio
Beginning on January 1, 2021, as permitted by regulations adopted by the U.S. Securities and Exchange Commission, paper copies of the Funds’ shareholder reports like this one will no longer be sent by mail, unless you specifically request paper copies of the reports from the Funds or from your financial intermediary (such as a broker-dealer or bank). Instead, the reports will be made available on the Funds’ website (www.royceinvest.com), and you will be notified by mail each time a report is posted and provided with a website link to access the report. If you already elected to receive shareholder reports electronically, you will not be affected by this change and you need not take any action. You may elect to receive shareholder reports and other communications from the Funds electronically anytime by contacting your financial intermediary or, if you are a direct investor with the Funds, by calling 1-800-841-1180. Beginning on January 1, 2019, you may elect to receive all future reports in paper free of charge. If you invest through a financial intermediary, you can contact your financial intermediary to request that you continue to receive paper copies of your shareholder reports. If you invest directly with the Funds, you can call 1-800-841-1180 to let the Funds know you wish to continue receiving paper copies of your shareholder reports. Your election to receive reports in paper will apply to all Funds held in your account if you invest through your financial intermediary or all Funds held with our fund complex if you invest directly with the Funds.
Table of Contents
| Annual Review | ||
| Letter to Our Shareholders | 1 | |
| Performance and Expenses | 5 | |
| Annual Report to Shareholders | ||
| Managers’ Discussions of Fund Performance and Schedules of Investments | ||
| Royce Capital Fund–Micro-Cap Portfolio | 6 | |
| Royce Capital Fund–Small-Cap Portfolio | 12 | |
| Financial Statements | 16 | |
| Notes to Financial Statements | 20 | |
| Report of Independent Registered Public Accounting Firm | 25 | |
| Understanding Your Fund’s Expenses | 26 | |
| Trustees and Officers | 27 | |
| Notes to Performance and Other Important Information | 28 |

This page is not part of theRoyce Capital Fund2019 Annual Report to Shareholders

A BIG YEAR FOR STOCKS
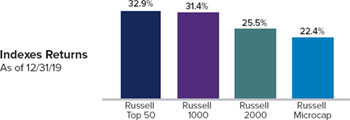
Aperiod of pauses, pivots, and rallies, 2019 ended as a highly rewarding year for equities. The major domestic and international indexes posted healthy double-digit returns, most in the range of 20-35%. The small-cap Russell 2000 Index gained 25.5% while the Russell Top 50 Mega Cap Index advanced 32.9%, the large-cap Russell 1000 Index was up 31.4%, and the Russell Microcap Index increased 22.4%—generally, bigger was better in 2019. Still, the 25.5% gain for the Russell 2000 placed it in the index’s top 27% of calendar-year showings since its 1978 inception. The advance was also impressively broad, with 70% of the stocks in the small-cap index posting positive returns, 61% advancing at least 10%, and 49% posting a calendar-year gain of 20% or more. Additionally, 10 of 11 Russell 2000 sectors were positive for the year (Energy was the sole detractor).
Although many investors think that some event, or series of events, must be present to propel share prices, there are times when the absence of negative developments is more than enough to push stocks consistently upward. This was the case in 2019, when both a
recession and a more hawkish Fed failed to materialize, which was all it took to kick-start the recovery that succeeded the dramatic downturn that saw out 2018. The Fed’s course was especially interesting. Arguably out of touch with the anxieties bred by slipping oil prices and an inverted yield curve in December 2018, the Fed raised rates and announced that 2019 would likely see at least two more hikes—all of this based on the central bank’s cautiously optimistic outlook on the U.S. economy. Once the market’s plunge showed that investors did not share this view, the Fed paused, saying it would hold the line on rates. The central bank then pivoted in July 2019, reversing course by lowering rates—which it proceeded to do again in September and October. These cuts fueled a healthy fourth quarter and helped stocks to end the year on a decidedly upbeat note.
WHAT WILL FOLLOW MEGA-CAP MANIA?
Performance in 2019 was mostly in line with previous snapbacks off precipitous declines—biotech, software, and other growth stocks were among those that did best, along with non-dividend payers and companies with high debt. The somewhat peculiar exception to the pattern was large-cap outperformance. In high-octane markets such as what we saw in 2019, small-cap stocks have typically contended with few, if any, competitors for leadership. This pattern was undone by the ongoing leadership of mega-cap stocks—including the now familiar “FAANG” group of Facebook, Apple, Amazon, Netflix, and Google—which have led the market by a substantial margin over the last 18 months. For example, from 6/30/18-12/31/19, the Russell
This page is not part of theRoyce Capital Fund2019 Annual Report to Shareholders | 1
Letter to Our Shareholders
Notable Index Performance Spreads
Russell Index Performance—6/30/18-12/31/19
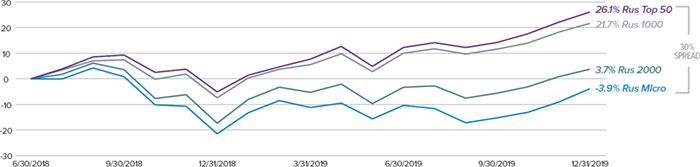
Source: FactSet
Top 50 Index advanced 26.1% cumulatively compared with a paltry 3.7% gain for small-caps—and a decline of 3.9% for micro-caps.
If the dominance of mega-caps were to unwind, or even pause, we see the potential for a subsequent rotation to small-caps. We think one point effectively illustrates the size of the potential opportunity: over the last 20 years, the 50 biggest stocks in the Russell 3000 Index have averaged a combined total market cap of about four times the total market cap of the Russell 2000. At the end of 2019, however, that ratio was more than six times, which is higher than it was even at the height of the Internet bubble in 2000. We’re certainly not expecting mega-caps to collapse any time soon, which would be anomalous behavior in what we think will be an advancing market. But we do think a performance pause at their current high valuations could occur, allowing small- and micro-cap stocks to catch up.
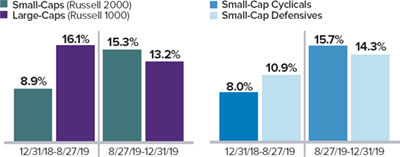
We may have seen the first seeds of such a leadership reversal in the last four months of 2019, which from our perspective provided the year’s most compelling developments. Beginning on August 27th, several reversals inverted previous market leadership patterns, each of which held through the end of 2019: small-caps outpaced large-caps, cyclicals outperformed defensives, small-cap value beat small-cap growth, and micro-caps led domestic equity performance.
August’s Reversals Held
Late August Saw Key Market Shifts That Held Through The End Of 2019
What was of particular interest to us about these reversals was their simultaneity. Leadership rotation is common, but the changes typically emerge over longer stretches of time before they take root.
Equally important, we would also argue that valuations—both relative and absolute—must be kept in mind when looking at returns. In spite of the performance boosts that came with the late August reversals, relative valuations for small-cap versus large-cap, small-cap cyclicals versus small-cap defensives, and small-cap value versus small-cap growth still looked attractive to us. At the end of 2019, each remained near the 20-year lows they hit in late August. As the chart below shows, small-cap stocks have lagged large-caps for so long that they were relatively cheaper at the end of 2019 than at any other time since 2001 based on our preferred valuation metric, EV/EBIT, enterprise value over earnings before interest and taxes.
Small-Cap’s Relative Valuation Is Below Its Long-Term Average
Russell 2000 vs. Russell 1000 Median LTM EV/EBIT¹ (ex. Negative EBIT Companies) from 12/31/01 to 12/31/19
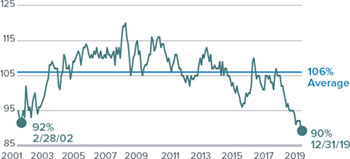
1Earnings before interest and taxes. Source: FactSet
BEWARE OF THE CALENDAR
When thinking about the prospects for small-cap performance, we think it’s important to avoid a common pitfall that we all stumble into occasionally—the tendency to put more emphasis on year-end
2 | This page is not part of theRoyce Capital Fund2019 Annual Report to Shareholders
LETTER TO OUR SHAREHOLDERS
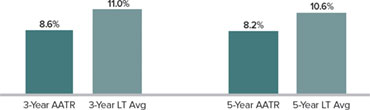
results than on other month-end periods. From the vantage point of the calendar year, small-cap performance certainly looks good. But if we look at the two-year annualized return for the Russell 2000, we see a markedly lower gain of 5.7%. Moreover, three- and five-year annualized returns for the Russell 2000 were below their respective monthly rolling averages since inception (12/31/78) at the end of 2019.
Recent 3- and 5-Year Returns Lower Than History
Russell 2000 Average Annual Total Returns vs. Long-Term Rolling Monthly Averages as of 12/31/19
Finally, the Russell 2000 finished 2019 2.2% off its most recent peak—and all-time high—reached on 8/31/18. What do these observations of historical performance suggest? Taken together, we think they suggest that, despite 2019’s strong calendar-year return, caution or pessimism about future small-cap returns and opportunities may be misplaced.
THE CASE FOR SMALL-CAP CYCLICALS
To be sure, we believe that small-cap stocks are more than capable of a strong run in 2020—and certainly resumed market leadership could be part of the equation. Even after a terrific 2019, many small-caps are still carrying what we would call a recession discount from the deep downturn at the end of 2018. Small-cap cyclicals continued to trade at a significant valuation discount to defensives at the end of 2019—based on EV/EBIT. In fact, the spread was wider than it was in October 2008, when a recession was exacerbated by the Great Financial Crisis.
These historically low relative valuations offer support for our view that late August’s performance reversals can be sustained in 2020. This confidence has led us to be active buyers in areas as diverse as energy services; healthcare devices, diagnostics, and testing; paper & packaging; semiconductors & semiconductor equipment; chemicals; and consumer finance.
Small-Cap Cyclicals Are Relatively Cheaper Than in 2008
Russell 2000 Relative Median EV/EBIT (Ex Negative EBIT)
From 12/31/99 to 12/31/19

Small-caps have also historically outpaced large-caps when the economy is growing and have lagged when it’s contracting. They have beaten large-caps, for example, in 70% of all trailing monthly rolling one-year periods—74 out of 106—when the ISM PMI rose over the last 20 years.1 This dynamic holds true for cyclicals versus defensives as well. So if the most recent slowdown is behind us, and the global economy is gradually improving (which appears to be the case), then renewed expansion supports a continuation of August’s reversals.
GOOD-BYE TO ALL THAT?
2019 closes out one of the most interesting—and challenging—decades that we have seen in more than 45 years of managing small-cap portfolios. It was a decade in which financial assets performed far better than the economy did—mostly due to frequent central bank interventions that suppressed rates and kept the capital markets flush with liquidity. We also saw developments that we would never have thought possible, such as negative interest rates. In addition, years of highly accommodative monetary policy had the unintended consequence of creating few, if any, penalties for companies that borrowed extensively.
We anticipate that each of these unusual developments should unwind to some extent over the next decade. This makes us highly confident about the prospects for select small-caps, particularly in cyclical areas, that haven’t fully participated in the decade that just passed. However, the persistence of these peculiar developments has thrown up numerous road blocks on the road back to normalization. (Indeed, one thing that has not changed over the last 10 years is the humbling nature of the prediction business.)
1The ISM PMI rose in 106 of 229 periods.
This page is not part of theRoyce Capital Fund 2019 Annual Report to Shareholders| 3
LETTER TO OUR SHAREHOLDERS
Does the Small-Cap Recovery Have Room to Run?
Russell 2000 Declines and Two Subsequent Calendar Year’s Performance from 12/31/78 through 12/31/19 (%)

Past performance is no guarantee of future results.
The question is whether or not the last decade-plus (stretching back to the 2007 market peaks and the Great Financial Crisis of 2008) of slow growth, historically low rates, and regular central bank interventions represents a “New Normal.” While our initial contention was that it did not, we now suspect that we will arrive at a blend of the old and the new. As Mark Twain is said to have quipped, “History doesn’t repeat itself, but it often rhymes.” Perhaps, then, this will result in a series of lows—low rates, low inflation, and low (by which we mean slow) economic growth—which will translate into lower U.S. equity returns than what we have seen over the last decade, along with more frequent bouts of volatility and wider variations in stock returns. While this menu may seem unpalatable, periods with more modest performance have historically been very favorable for disciplined active management approaches.
FAVORABLE CONDITIONS FOR SMALL-CAPS
The current backdrop looks quite promising to us for solid to strong small-cap performance overall thanks to the four favorable factors that we cited in July’s “Letter to Our Shareholders”—low inflation, modest valuations, moderate growth, and ample access
to capital. Together, they suggest that small-cap returns can go higher, especially the many small-cap cyclical areas that we typically like best. A few historical factors are also worth noting. Over the past 30 years, 76% of all monthly rolling one-year returns for the Russell 2000 have been positive—with an average return of 11.5%. So investors who are bearish on small-cap stocks are betting against the odds. To get a firmer sense of what 2020 may hold, we went back to the inception of the Russell 2000 and looked at the 11 calendar years when small-caps declined, as in 2018, and examined what happened in the second subsequent year. In nine of those 11 years the small-cap index advanced by an average of 14.5%. (2000 and 2002 were the exceptions.)
And two consecutive years of double-digit increases are fairly common for small-caps. Periods in which a healthy second year followed a strong one occurred in the following two-year spans: 1988-89, 1991-92, 1995-96, 2003-04, 2009-10, 2012-13, and 2016-17. With the favorable conditions we’ve outlined above in mind, we suspect that the current small-cap rally can continue, with the potential to add 2019-20 to this list.
| Sincerely, | ||
 |  |  |
Charles M. Royce | Christopher D. Clark | Francis D. Gannon |
| Chairman, | Chief Executive Officer, and | Co-Chief Investment Officer, |
| Royce Investment Partners | Co-Chief Investment Officer, | Royce Investment Partners |
| Royce Investment Partners | ||
January 31, 2020
4 | This page is not part of theRoyce Capital Fund2019 Annual Report to Shareholders
Performance and Expenses
As of December 31, 2019
| 1-YR | 3-YR | 5-YR | 10-YR | 15-YR | 20-YR | SINCE INCEPTION (12/27/96) | ANNUAL OPERATING EXPENSES (%) GROSS/NET |
| Royce Capital Fund–Micro-Cap Portfolio | 19.55 | 4.58 | 3.69 | 5.58 | 5.28 | 8.30 | 9.45 | 1.39/1.33 |
| Royce Capital Fund–Small-Cap Portfolio | 18.67 | 4.65 | 4.10 | 8.35 | 6.84 | 9.90 | 10.13 | 1.11/1.08 |
INDEX | ||||||||
| Russell Microcap Index | 22.43 | 6.39 | 6.57 | 11.26 | 6.16 | N/A | N/A | N/A |
| Russell 2000 Index | 25.52 | 8.59 | 8.23 | 11.83 | 7.92 | 7.59 | N/A | N/A |
| Russell 2000 Value Index | 22.39 | 4.77 | 6.99 | 10.56 | 6.92 | 9.41 | N/A | N/A |
Important Performance, Expense, and Risk Information
All performance information in thisReview and Report reflects past performance, is presented on a total return basis, reflects the reinvestment of distributions, and does not reflect the deduction of taxes that a shareholder would pay on fund distributions or the redemption of fund shares. Past performance is no guarantee of future results. Investment return and principal value of an investment will fluctuate, so that shares may be worth more or less than their original cost when redeemed. Current performance may be higher or lower than performance quoted and may be obtained at www.royceinvest.com. The Funds’ total returns do not reflect any deduction for charges or expenses of the variable contracts investing in the Funds. All performance and expense information reflects the result for each Fund’s Investment Class Shares. Gross annual operating expenses reflect each Fund’s gross total annual operating expenses and include management fees, operating expenses, and any applicable acquired fund fees and expenses. Net annual operating expenses reflect contractual fee waivers and/or expense reimbursements. All expense information is reported as of each fund’s most current prospectus. Royce & Associates has contractually agreed to waive fees and/or reimburse operating expenses, excluding brokerage commissions, taxes, interest litigation expenses, acquired fund fees and expenses, and other expenses not borne in the ordinary cost of business, to the extent necessary to maintain net operating expenses at or below 1.33% for Royce Capital Fund–Micro-Cap Portfolio, and at or below 1.08% for Royce Capital Fund–Small-Cap Portfolio through April 30, 2020.
Service Class Shares bear an annual distribution expense that is not borne by the Investment Class; if those expenses were reflected, total returns would have been lower. Royce Micro-Cap Portfolio invests primarily in micro-cap companies while Royce Small-Cap Portfolio invests primarily in small-cap companies. Investments in micro-cap and small-cap companies may involve considerably more risk than investments in securities of larger-cap companies. (Please see “Primary Risks for Fund Investors” in the prospectus.) Each series of Royce Capital Fund may invest up to 25% of its net assets in foreign securities. Investments in foreign securities may involve political, economic, currency, and other risks not encountered in U.S. investments. (Please see “Investing in Foreign Securities” in the prospectus.) As of 12/31/19, Royce Small-Cap Portfolio invested a significant portion of its assets in a limited number of stocks, which may involve considerably more risk than a more broadly diversified portfolio because a decline in the value of any one of these stocks would cause the Portfolio’s overall value to decline to a greater degree. Royce Micro-Cap Portfolio’s broadly diversified portfolio does not ensure a profit or guarantee against loss. (Please see “Primary Risks for Fund Investors” in the prospectus.) This Review and Report must be preceded or accompanied by a prospectus. Please read the prospectus carefully before investing or sending money. Russell Investment Group is the source and owner of the trademarks, service marks, and copyrights related to the Russell Indexes. Russell® is a trademark of Russell Investment Group. The Russell Microcap Index includes 1,000 of the smallest securities in the small-cap Russell 2000 Index along with the next smallest eligible securities as determined by Russell. The Russell 2000 Index is an unmanaged, capitalization-weighted index of domestic small-cap stocks. It measures the performance of the 2,000 smallest publicly traded U.S. companies in the Russell 3000 Index. The Russell 2000 Value Index consists of the respective value stocks within the Russell 2000 as determined by Russell Investments. The performance of an index does not represent exactly any particular investment, as you cannot invest directly in an index. Distributor: Royce Fund Services, LLC.
This page is not part of theRoyce Capital Fund 2019 Annual Report to Shareholders| 5
| MANAGERS’ DISCUSSION (UNAUDITED) |
| Royce Capital Fund–Micro-Cap Portfolio (RCM) |

| Jim Stoeffel Brendan Hartman |
| FUND PERFORMANCE |
Royce Capital Fund–Micro-Cap Portfolio advanced 19.6% in 2019, trailing the Russell Microcap and the Russell 2000 Indexes, which returned 22.4% and 25.5%, respectively, for the same period. |
| WHAT WORKED... AND WHAT DIDN’T |
Six of the Fund’s 10 equity sectors positively contributed to performance. Information Technology generated the most sizable impact by far, followed by Industrials and Health Care. Consumer Discretionary, Energy, and Communication Services detracted from performance, but did so modestly. On the industry level, semiconductors & semiconductor equipment (Information Technology) generated the biggest contribution, more than tripling the impact of banks (Financials) and machinery (Industrials), which followed. Conversely, energy equipment & services (Energy) was the worst-performing industry, followed by leisure products and hotels, restaurants & leisure (both in Consumer Discretionary).
The top-contributing position for the year was Ultra Clean Holdings, which develops critical subsystems for the semiconductor capital equipment and flat panel display industries. The company benefited from the recent semiconductor industry upturn and management’s decision to diversify both its customer base and service offerings. Zealand Pharma is a Copenhagen-based company that focuses on developing peptide-based therapeutics for metabolic and gastrointestinal diseases. Its two latest stage products had positive results during the year, and the company also completed its first ever acquisition, buying Encycle Therapeutics in October. Pharmaceuticals company Axsome Therapeutics also made a strong contribution, as the company had positive clinical results across its product portfolio, which includes developing therapies for central nervous system disorders. Axsome’s lead molecule, AXS-05, has been performing well in clinical trials that are expected to be finished relatively quickly because two of its ingredients were previously approved by the Food and Drug Administration.
Red Lion Hotels was the portfolio’s largest detractor in 2019, as the company suffered a setback in its efforts to transition from company-owned hotels to a franchise model. Selling its company-owned units took longer than anticipated, and Red Lion experienced greater-than-expected attrition in its newly acquired franchisees—factors that led us to sell our stake. We also saw poor performance from branded fitness and apparel product maker, Nautilus, which suffered through two consecutive failed product launches that resulted in a decision to remove the CEO. While we liked several strategic decisions that the company made over the past several years, we sold our position when our confidence in management’s ability to effectively judge the rapidly changing fitness markets was shaken. We also expected that it would take at least a year to rebuild its product pipeline. Correvio Pharma also hampered performance during the year. The pharmaceuticals company develops and discovers cardiovascular drugs for the treatment of atrial arrhythmia, congestive heart failure, and bacterial skin infections. We exited our position after the company’s atrial fibrillation drug, which is used extensively in Europe, failed to gain approval from an FDA Advisory Panel.
The Fund’s relative underperformance versus the Russell Microcap was driven entirely by sector allocation—stock selection was additive. Consumer Discretionary was the largest source of underperformance due to stock selection in multiple industries, including specialty retail and hotels, restaurants & leisure. Health Care also hurt relative performance due to our underexposure to the sector, particularly to biotechnology, which was the strongest contributor to the micro-cap index’s returns. The portfolio’s cash holdings were an additional drag on relative performance in 2019. Conversely, we saw very strong relative outperformance in Information Technology, driven mainly by savvy stock selection, though our overexposure to the sector helped modestly. Industrials and Materials were also additive thanks to successful stock selection. At the industry level, the aforementioned biotechnology group (Health Care) and energy equipment & services (Energy) hurt relative performance most, while semiconductors & semiconductor equipment and software (both in Information Technology) helped.
| Top Contributors to Performance | Top Detractors from Performance | |||||
| For 2019 (%)1 | For 2019 (%)2 | |||||
| Ultra Clean Holdings | 1.27 | Red Lion Hotels | -0.61 | |||
| Zealand Pharma | 1.25 | Nautilus | -0.48 | |||
| Axsome Therapeutics | 1.07 | Correvio Pharma | -0.46 | |||
| NeoGenomics | 0.95 | Kirkland’s | -0.45 | |||
| Adesto Technologies | 0.78 | Independence Contract Drilling | -0.41 | |||
| 1Includes dividends | 2Net of dividends | |||||
| CURRENT POSITIONING AND OUTLOOK |
While issues surrounding trade have finally begun to stabilize, we find ourselves in the midst of what promises to be an eventful U.S. election cycle, with outcomes that could have major implications for investors. Despite this uncertainty, we remain generally constructive on the U.S. economy, particularly because the current Fed tightening cycle appears to have ended. Along with a possible truce in the trade wars, we believe the favorable backdrop should support underlying growth for our overweighted sectors, such as Information Technology and Industrials. Valuations look relatively attractive to us in many corners of the micro-cap world, even as recent returns show that the performance gap between micro-caps and large-caps is gradually beginning to narrow. We took advantage of these opportunities for much of the second half of 2019 as micro-cap stocks were selling at their steepest discount to large-caps since 2001. We don’t know if this recent upward move will last, but after a long period of underperformance for micro-caps, we anticipate some degree of mean reversion. |
| 6 | Royce Capital Fund 2019 Annual Report to Shareholders |
|
| PERFORMANCE AND PORTFOLIO REVIEW (UNAUDITED) | TICKER SYMBOLS RCMCX RCMSX | |
| Performance and Expenses | ||||||||||||||||
| Average Annual Total Return (%) Through 12/31/19 | ||||||||||||||||
| JUL-DEC 20191 | 1-YR | 3-YR | 5-YR | 10-YR | 15-YR | 20-YR | SINCE INCEPTION (12/27/96) | |||||||||
| RCM | 7.99 | 19.55 | 4.58 | 3.69 | 5.58 | 5.28 | 8.30 | 9.45 | ||||||||
| Annual Gross Operating Expenses: 1.39% Annual Net Operating Expenses: 1.33% | ||||||||||||||||
| 1 Not annualized | ||||||||||||||||
Morningstar Style Map™As of 12/31/19
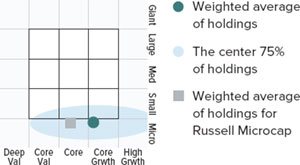
TheMorningstar Style Mapis theMorningstar Style BoxTM with the center 75% of fund holdings plotted as theMorningstar Ownership ZoneTM. The Morningstar Style Box is designed to reveal a fund’s investment strategy. The Morningstar Ownership Zone provides detail about a portfolio’s investment style by showing the range of stock sizes and styles. The Ownership Zone is derived by plotting each stock in the portfolio within the proprietary Morningstar Style Box. Over time, the shape and location of a fund’s ownership zone may vary. See page 28 for additional information.
Value of $10,000
Invested on 6/30/00 (Russell Microcap Inception) as of 12/31/19 ($)
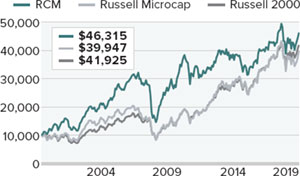
Includes reinvestment of distributions.
| Top 10 Positions | ||
| % of Net Assets | ||
| Photronics | 1.5 | |
| Ultra Clean Holdings | 1.4 | |
| Zealand Pharma | 1.3 | |
| Northwest Pipe | 1.3 | |
| Nova Measuring Instruments | 1.3 | |
| QAD Cl. A | 1.2 | |
| NeoPhotonics Corporation | 1.2 | |
| Adesto Technologies | 1.2 | |
| OrthoPediatrics Corporation | 1.2 | |
| Axsome Therapeutics | 1.1 | |
| Portfolio Sector Breakdown | ||
| % of Net Assets | ||
| Information Technology | 24.8 | |
| Industrials | 22.5 | |
| Financials | 13.6 | |
| Health Care | 11.5 | |
| Consumer Discretionary | 8.0 | |
| Materials | 3.7 | |
| Real Estate | 2.8 | |
| Energy | 2.6 | |
| Communication Services | 1.9 | |
| Consumer Staples | 0.2 | |
| Cash and Cash Equivalents | 8.4 | |
| Calendar Year Total Returns (%) | ||
| YEAR | RCM | |
| 2019 | 19.6 | |
| 2018 | -9.0 | |
| 2017 | 5.2 | |
| 2016 | 19.7 | |
| 2015 | -12.5 | |
| 2014 | -3.6 | |
| 2013 | 21.0 | |
| 2012 | 7.6 | |
| 2011 | -12.1 | |
| 2010 | 30.1 | |
| 2009 | 57.9 | |
| 2008 | -43.3 | |
| 2007 | 4.0 | |
| 2006 | 21.1 | |
| 2005 | 11.6 |
| Upside/Downside Capture Ratios | ||||
| Periods Ended 12/31/19 (%) | ||||
| UPSIDE | DOWNSIDE | |||
| 10-Year | 70 | 93 | ||
| From 6/30/00 (Russell Microcap Inception) | 88 | 78 | ||
| Portfolio Diagnostics | ||||
| Fund Net Assets | $159 million | |||
| Number of Holdings | 129 | |||
| Turnover Rate | 26% | |||
| Average Market Capitalization1 | $512 million | |||
| Weighted Average P/B Ratio2 | 2.0x | |||
| Active Share3 | 89% | |||
| U.S. Investments (% of Net Assets) | 78.1% | |||
| Non-U.S. Investments (% of Net Assets) | 13.5% | |||
| 1 | Geometric Average. This weighted calculation uses each portfolio holding’s market cap in a way designed to not skew the effect of very large or small holdings; instead, it aims to better identify the portfolio’s center, which Royce believes offers a more accurate measure of average market cap than a simple mean or median. |
| 2 | Harmonic Average.This weighted calculation evaluates a portfolio as if it were a single stock and measures it overall. It compares the total market value of the portfolio to the portfolio’s share in the earnings or book value, as the case may be, of its underlying stocks. |
| 3 | Active Shareis the sum of the absolute values of the different weightings of each holding in the Fund versus each holding in the benchmark, divided by two. |
Important Performance and Expense Information All performance information in thisReportreflects past performance, is presented on a total return basis, reflects the reinvestment of distributions, and does not reflect the deduction of taxes that a shareholder would pay on fund distributions or the redemption of fund shares. Past performance is no guarantee of future results. Investment return and principal value of an investment will fluctuate, so that shares may be worth more or less than their original cost when redeemed. Current performance may be higher or lower than performance quoted. The Fund’s total returns do not reflect any deduction for charges or expenses of the variable contracts investing in the Fund. Returns as of the most recent month-end may be obtained at www.royceinvest.com. All performance and risk information reflects the result of the Investment Class (its oldest class). Shares of RCM’s Service Class bear an annual distribution expense that is not borne by the Investment Class; if those expenses were reflected, total returns would have been lower. Certain immaterial adjustments were made to the net assets of Royce Capital Fund–Micro-Cap Portfolio at 12/31/17 for financial reporting purposes, and as a result the calendar year total returns based on those net asset values differ from the adjusted net asset values and calendar year total returns reported in the Financial Highlights. Gross operating expenses reflect the Fund’s total gross operating expenses for the Investment Class and include management fees and other expenses. Net operating expenses reflect contractual fee waivers and/or expense reimbursements. All expense information is reported as of the Fund’s most current prospectus. Royce & Associates has contractually agreed, without right of termination, to waive fees and/or reimburse expenses to the extent necessary to maintain the Investment Class’s net annual operating expenses (excluding brokerage commissions, taxes, interest, litigation expenses, acquired fund fees and expenses, and other expenses not borne in the ordinary course of business) at or below 1.33% through April 30, 2020. Regarding the “Top Contributors” and “Top Detractors” tables shown above, the sum of all contributors to, and all detractors from, performance for all securities in the portfolio would approximate the Fund’s year-to-date performance for 2019. Upside Capture Ratio measures a manager’s performance in up markets relative to the Fund’s benchmark. It is calculated by measuring the Fund’s performance in quarters when the benchmark went up and dividing it by the benchmark’s return in those quarters. Downside Capture Ratio measures a manager’s performance in down markets relative to the Fund’s benchmark (Russell Microcap). It is calculated by measuring the Fund’s performance in quarters when the benchmark goes down and dividing it by the benchmark’s return in those quarters. |
Royce Capital Fund 2019 Annual Report to Shareholders | 7
|
Schedule of Investments
| Royce Capital Fund – Micro-Cap Portfolio | |||||||
| Common Stocks – 91.6% | |||||||
| SHARES | VALUE | ||||||
| COMMUNICATION SERVICES – 1.9% | |||||||
| ENTERTAINMENT - 0.6% | |||||||
| Gaia Cl. A1 | 120,800 | $ | 965,192 | ||||
| INTERACTIVE MEDIA & SERVICES - 0.9% | |||||||
| QuinStreet1 | 99,800 | 1,527,938 | |||||
| MEDIA - 0.4% | |||||||
| Marchex Cl. B1 | 153,900 | 581,742 | |||||
| Total (Cost $2,497,112) | 3,074,872 | ||||||
| CONSUMER DISCRETIONARY – 8.0% | |||||||
| AUTO COMPONENTS - 2.2% | |||||||
| Fox Factory Holding1,2 | 16,000 | 1,113,120 | |||||
| Stoneridge1 | 61,000 | 1,788,520 | |||||
| Unique Fabricating1 | 173,300 | 668,938 | |||||
| 3,570,578 | |||||||
| HOTELS, RESTAURANTS & LEISURE - 1.5% | |||||||
| Century Casinos1 | 161,100 | 1,275,912 | |||||
| Lindblad Expeditions Holdings1 | 70,900 | 1,159,215 | |||||
| 2,435,127 | |||||||
| HOUSEHOLD DURABLES - 0.6% | |||||||
| Lovesac Company (The)1,2 | 64,000 | 1,027,200 | |||||
| INTERNET & DIRECT MARKETING RETAIL - 0.3% | |||||||
| Rubicon Project (The)1 | 50,200 | 409,632 | |||||
| LEISURE PRODUCTS - 0.7% | |||||||
| MasterCraft Boat Holdings1 | 69,117 | 1,088,593 | |||||
| SPECIALTY RETAIL - 1.9% | |||||||
| Citi Trends | 54,986 | 1,271,276 | |||||
| Shoe Carnival | 47,100 | 1,755,888 | |||||
| 3,027,164 | |||||||
| TEXTILES, APPAREL & LUXURY GOODS - 0.8% | |||||||
| Vera Bradley1 | 104,200 | 1,229,560 | |||||
| Total (Cost $9,943,918) | 12,787,854 | ||||||
| CONSUMER STAPLES – 0.2% | |||||||
| BEVERAGES - 0.2% | |||||||
| †Eastside Distilling1 | 88,300 | 260,485 | |||||
| Total (Cost $371,974) | 260,485 | ||||||
| ENERGY – 2.6% | |||||||
| ENERGY EQUIPMENT & SERVICES - 1.7% | |||||||
| Natural Gas Services Group1 | 52,100 | 638,746 | |||||
| Newpark Resources1 | 203,800 | 1,277,826 | |||||
| Pason Systems | 12,600 | 127,208 | |||||
| Profire Energy1 | 486,229 | 705,032 | |||||
| 2,748,812 | |||||||
| OIL, GAS & CONSUMABLE FUELS - 0.9% | |||||||
| Ardmore Shipping1 | 154,800 | 1,400,940 | |||||
| Total (Cost $4,070,913) | 4,149,752 | ||||||
| FINANCIALS – 13.6% | |||||||
| BANKS - 6.5% | |||||||
| Allegiance Bancshares1 | 29,400 | 1,105,440 | |||||
| BayCom Corporation1 | 52,182 | 1,186,619 | |||||
| Caribbean Investment Holdings1 | 1,751,547 | 777,233 | |||||
| County Bancorp | 59,600 | 1,527,548 | |||||
| HarborOne Bancorp1 | 134,691 | 1,480,254 | |||||
| HomeTrust Bancshares | 44,700 | 1,199,301 | |||||
| Investar Holding | 57,200 | 1,372,800 | |||||
| Midway Investments1,3 | 1,751,577 | 0 | |||||
| TriState Capital Holdings1 | 66,472 | 1,736,249 | |||||
| 10,385,444 | |||||||
| CAPITAL MARKETS - 3.7% | |||||||
| B. Riley Financial | 70,700 | 1,780,226 | |||||
| Canaccord Genuity Group | 222,500 | 829,310 | |||||
| INTL FCStone1 | 24,000 | 1,171,920 | |||||
| Silvercrest Asset Management Group Cl. A | 90,300 | 1,135,974 | |||||
| †Sprott | 410,400 | 941,813 | |||||
| 5,859,243 | |||||||
| DIVERSIFIED FINANCIAL SERVICES - 0.2% | |||||||
| Waterloo Investment Holdings1,3 | 1,302,000 | 390,600 | |||||
| INSURANCE - 0.2% | |||||||
| Health Insurance Innovations Cl. A1,2 | 17,000 | 327,930 | |||||
| THRIFTS & MORTGAGE FINANCE - 3.0% | |||||||
| Meridian Bancorp | 30,600 | 614,754 | |||||
| PCSB Financial | 71,300 | 1,443,825 | |||||
| Territorial Bancorp | 41,900 | 1,296,386 | |||||
| Western New England Bancorp | 141,254 | 1,360,276 | |||||
| 4,715,241 | |||||||
| Total (Cost $22,179,842) | 21,678,458 | ||||||
| HEALTH CARE – 11.5% | |||||||
| BIOTECHNOLOGY - 2.2% | |||||||
| BioSpecifics Technologies1 | 16,900 | 962,286 | |||||
| Dynavax Technologies1 | 94,000 | 537,680 | |||||
| Zealand Pharma1 | 59,358 | 2,097,446 | |||||
| 3,597,412 | |||||||
| HEALTH CARE EQUIPMENT & SUPPLIES - 5.5% | |||||||
| †Apyx Medical1 | 77,400 | 654,804 | |||||
| AtriCure1 | 38,600 | 1,254,886 | |||||
| Chembio Diagnostics1 | 169,300 | 772,008 | |||||
| CryoLife1 | 52,589 | 1,424,636 | |||||
| Mesa Laboratories | 4,700 | 1,172,180 | |||||
| OrthoPediatrics Corporation1 | 39,500 | 1,856,105 | |||||
| †Profound Medical1 | 35,300 | 400,966 | |||||
| Surmodics1 | 27,878 | 1,154,986 | |||||
| 8,690,571 | |||||||
| LIFE SCIENCES TOOLS & SERVICES - 2.7% | |||||||
| Harvard Bioscience1 | 376,668 | 1,148,838 | |||||
| NeoGenomics1 | 61,900 | 1,810,575 | |||||
| Quanterix Corporation1 | 54,300 | 1,283,109 | |||||
| 4,242,522 | |||||||
| PHARMACEUTICALS - 1.1% | |||||||
| †Axsome Therapeutics1,2 | 17,600 | 1,819,136 | |||||
| Total (Cost $9,895,277) | 18,349,641 | ||||||
| INDUSTRIALS – 22.5% | |||||||
| AEROSPACE & DEFENSE - 1.3% | |||||||
| Astronics Corporation1 | 31,026 | 867,177 | |||||
| CPI Aerostructures1 | 174,544 | 1,174,681 | |||||
| 2,041,858 | |||||||
| COMMERCIAL SERVICES & SUPPLIES - 1.7% | |||||||
| Acme United | 50,865 | 1,210,078 | |||||
| Heritage-Crystal Clean1 | 47,334 | 1,484,868 | |||||
| 2,694,946 | |||||||
| CONSTRUCTION & ENGINEERING - 3.5% | |||||||
| †Ameresco Cl. A1 | 94,000 | 1,645,000 | |||||
| Construction Partners Cl. A1 | 93,200 | 1,572,284 | |||||
| †IES Holdings1 | 9,000 | 230,940 | |||||
| Northwest Pipe1 | 62,900 | 2,095,199 | |||||
| 5,543,423 |
8 | Royce Capital Fund 2019 Annual Report to Shareholders | THE ACCOMPANYING NOTES ARE AN INTEGRAL PART OF THESE FINANCIAL STATEMENTS |
|
December 31, 2019
Royce Capital Fund – Micro-Cap Portfolio (continued) |
| SHARES | VALUE | ||||||
| INDUSTRIALS (continued) | |||||||
| ELECTRICAL EQUIPMENT - 1.5% | |||||||
| American Superconductor1 | 130,500 | $ | 1,024,425 | ||||
| Encore Wire | 22,800 | 1,308,720 | |||||
| 2,333,145 | |||||||
| INDUSTRIAL CONGLOMERATES - 0.4% | |||||||
| Raven Industries | 17,000 | 585,820 | |||||
| MACHINERY - 7.5% | |||||||
| Alimak Group | 80,300 | 1,196,825 | |||||
| CIRCOR International1 | 20,200 | 934,048 | |||||
| Exco Technologies | 125,900 | 768,847 | |||||
| Graham Corporation | 78,620 | 1,720,206 | |||||
| Lindsay Corporation | 12,200 | 1,171,078 | |||||
| Luxfer Holdings | 65,400 | 1,210,554 | |||||
| Lydall1 | 38,500 | 790,020 | |||||
| †Porvair | 133,350 | 1,179,924 | |||||
| Spartan Motors | 72,200 | 1,305,376 | |||||
| †Wabash National | 61,100 | 897,559 | |||||
| Westport Fuel Systems1 | 345,300 | 818,361 | |||||
| 11,992,798 | |||||||
| MARINE - 1.0% | |||||||
| Clarkson | 42,000 | 1,682,904 | |||||
| PROFESSIONAL SERVICES - 3.9% | |||||||
| CRA International | 22,106 | 1,204,114 | |||||
| GP Strategies1 | 88,608 | 1,172,284 | |||||
| Heidrick & Struggles International | 38,100 | 1,238,250 | |||||
| Kforce | 30,200 | 1,198,940 | |||||
| Resources Connection | 84,754 | 1,384,033 | |||||
| 6,197,621 | |||||||
| ROAD & RAIL - 0.7% | |||||||
| Marten Transport | 50,041 | 1,075,381 | |||||
| TRADING COMPANIES & DISTRIBUTORS - 1.0% | |||||||
| Lawson Products1 | 15,800 | 823,180 | |||||
| †Transcat1 | 25,300 | 806,058 | |||||
| 1,629,238 | |||||||
| Total (Cost $26,330,218) | 35,777,134 | ||||||
| INFORMATION TECHNOLOGY – 24.8% | |||||||
| COMMUNICATIONS EQUIPMENT - 1.6% | |||||||
| Digi International1 | 97,400 | 1,725,928 | |||||
| EMCORE Corporation1 | 149,300 | 453,872 | |||||
| Harmonic1 | 37,900 | 295,620 | |||||
| 2,475,420 | |||||||
| ELECTRONIC EQUIPMENT, INSTRUMENTS & COMPONENTS - 5.7% | |||||||
| Fabrinet1 | 21,369 | 1,385,566 | |||||
| FARO Technologies1 | 18,400 | 926,440 | |||||
| †LightPath Technologies Cl. A1 | 232,800 | 168,780 | |||||
| †Luna Innovations1 | 87,000 | 634,230 | |||||
| nLIGHT1 | 60,900 | 1,235,052 | |||||
| Novanta1 | 11,300 | 999,372 | |||||
| †PAR Technology1 | 15,300 | 470,322 | |||||
| PC Connection | 34,300 | 1,703,338 | |||||
| Vishay Precision Group1 | 44,700 | 1,519,800 | |||||
| 9,042,900 | |||||||
| IT SERVICES - 0.6% | |||||||
| Cass Information Systems | 16,148 | 932,385 | |||||
| SEMICONDUCTORS & SEMICONDUCTOR EQUIPMENT - 14.3% | |||||||
| Adesto Technologies1,2 | 219,100 | 1,862,350 | |||||
| Aehr Test Systems1 | 349,500 | 699,000 | |||||
| Axcelis Technologies1 | 19,800 | 477,081 | |||||
| AXT1 | 244,300 | 1,062,705 | |||||
| Brooks Automation | 23,500 | 986,060 | |||||
| †Camtek | 104,900 | 1,136,067 | |||||
| Cohu | 67,700 | 1,546,945 | |||||
| CyberOptics Corporation1 | 42,600 | 782,988 | |||||
| Everspin Technologies1 | 106,400 | 559,664 | |||||
| †Ichor Holdings1 | 45,300 | 1,507,131 | |||||
| NeoPhotonics Corporation1 | 221,200 | 1,950,984 | |||||
| Nova Measuring Instruments1 | 53,800 | 2,035,254 | |||||
| Onto Innovation1 | 11,300 | 412,902 | |||||
| PDF Solutions1 | 98,400 | 1,661,976 | |||||
| Photronics1 | 153,300 | 2,416,008 | |||||
| Silicon Motion Technology ADR | 26,900 | 1,364,099 | |||||
| Ultra Clean Holdings1 | 95,300 | 2,236,691 | |||||
| 22,697,905 | |||||||
| SOFTWARE - 2.2% | |||||||
| Agilysys1 | 61,800 | 1,570,338 | |||||
| QAD Cl. A | 38,800 | 1,976,084 | |||||
| 3,546,422 | |||||||
| TECHNOLOGY HARDWARE, STORAGE & PERIPHERALS - 0.4% | |||||||
| AstroNova | 50,700 | 695,604 | |||||
| Total (Cost $26,328,731) | 39,390,636 | ||||||
| MATERIALS – 3.7% | |||||||
| CHEMICALS - 1.1% | |||||||
| FutureFuel Corporation | 62,400 | 773,136 | |||||
| Trecora Resources1 | 133,200 | 952,380 | |||||
| 1,725,516 | |||||||
| METALS & MINING - 2.6% | |||||||
| †Altius Minerals | 46,300 | 426,436 | |||||
| Haynes International | 39,870 | 1,426,548 | |||||
| Major Drilling Group International1 | 299,700 | 1,308,613 | |||||
| Universal Stainless & Alloy Products1 | 61,400 | 914,860 | |||||
| 4,076,457 | |||||||
| Total (Cost $6,589,772) | 5,801,973 | ||||||
| REAL ESTATE – 2.8% | |||||||
| EQUITY REAL ESTATE INVESTMENT TRUSTS (REITS) - 1.4% | |||||||
| Community Healthcare Trust | 32,200 | 1,380,092 | |||||
| †Postal Realty Trust Cl. A | 50,400 | 854,280 | |||||
| 2,234,372 | |||||||
| REAL ESTATE MANAGEMENT & DEVELOPMENT - 1.4% | |||||||
| FRP Holdings1 | 23,440 | 1,167,546 | |||||
| Marcus & Millichap1 | 29,900 | 1,113,775 | |||||
| 2,281,321 | |||||||
| Total (Cost $2,998,434) | 4,515,693 | ||||||
| TOTAL COMMON STOCKS | |||||||
| (Cost $111,206,191) | 145,786,498 |
THE ACCOMPANYING NOTES ARE AN INTEGRAL PART OF THESE FINANCIAL STATEMENTS | Royce Capital Fund 2019 Annual Report to Shareholders | 9 |
|
| December 31, 2019 |
Schedule of Investments |
|
Royce Capital Fund – Micro-Cap Portfolio (continued) |
| VALUE | |||
| REPURCHASE AGREEMENT – 7.8% | |||
| Fixed Income Clearing Corporation, 0.25% dated 12/31/19, due 1/2/20, maturity value $12,409,172 (collateralized by obligations of various U.S. Government Agencies, 2.25% due 11/15/24, valued at $12,657,795) | |||
| (Cost $12,409,000) | $ | 12,409,000 | |
| COLLATERAL RECEIVED FOR SECURITIES LOANED – 0.2% | |||
| Money Market Funds | |||
| Federated Government Obligations Fund (7 day yield-1.49%) | |||
| (Cost $218,823) | 218,823 | ||
| TOTAL INVESTMENTS – 99.6% | |||
| (Cost $123,834,014) | 158,414,321 | ||
| CASH AND OTHER ASSETS LESS LIABILITIES – 0.4% | 684,157 | ||
| NET ASSETS – 100.0% | $ | 159,098,478 | |
ADR – American Depository Receipt
New additions in 2019. |
Non-income producing. |
All or a portion of these securities were on loan at December 31, 2019. |
Securities for which market quotations are not readily available represent 0.2% of net assets. These securities have been valued at their fair value under procedures approved by the Fund’s Board of Trustees. These securities are defined as Level 3 securities due to the use of significant unobservable inputs in the determination of fair value. See Notes to Financial Statements. |
Bold indicates the Fund’s 20 largest equity holdings in terms of December 31, 2019, market value.
10 | Royce Capital Fund 2019 Annual Report to Shareholders | THE ACCOMPANYING NOTES ARE AN INTEGRAL PART OF THESE FINANCIAL STATEMENTS |
|
This page is intentionally left blank.
Royce Capital Fund 2019 Annual Report to Shareholders | 11
MANAGER’S DISCUSSION (UNAUDITED)
Royce Capital Fund–Small-Cap Portfolio (RCS)

Jay Kaplan, CFA
FUND PERFORMANCE
Royce Capital Fund–Small-Cap Portfolio, which uses a disciplined contrarian value approach, increased 18.7% in 2019, trailing respective gains of 25.5% and 22.4% for its small-cap benchmarks, the Russell 2000 and Russell 2000 Value Indexes, for the same period.
WHAT WORKED… AND WHAT DIDN’T
For the calendar year, seven of the portfolio’s 11 equity sectors finished in the black. Three sectors dominated the positive contributors—Information Technology, Industrials, and Financials—while Utilities was essentially flat, and Energy, Consumer Staples, and Communication Services detracted. At the industry level, electronic equipment, instruments & components (Information Technology) led, followed by banks and thrifts & mortgage finance (both in Financials), as well as machinery (Industrials). Oil, gas & consumable fuels (Energy) was the largest detractor at the industry level, followed by specialty retail, textiles, apparel & luxury goods (both in Consumer Discretionary), and food & staples retailing (Consumer Staples).
Insight Enterprises contributed most at the position level, as it did for the six-month period ended 6/30/19. The company provides information technology hardware and software for large and small enterprises and was key to the electronic equipment, instruments & components group’s strong performance in 2019. Insight continued to execute profitably in 2019, with steadily increasing revenues and better-than-expected earnings. The company also saw its sales grow as a result of its acquisition of PCM in August, which expands the firm’s reach into higher-margin end markets that are expected to drive additional improvement in the future.
Another company in the same industry was also a top contributor—PC Connection, a direct marketer of technology products and services, including computer systems as well as software and peripheral equipment. The company beat earnings estimates in the second and third quarters while also exceeding consensus revenue estimates in three out of the last four quarters—both evidence of the kind of successful execution we like from our holdings. The contribution for Genworth MI Canada, which provides private residential mortgage insurance, also stood out. The company’s stock began to rise in July when Genworth Financial, a related U.S. firm, agreed to sell its shares of Genworth MI Canada to Brookfield Business Partners in order to win regulatory approval for its own acquisition by a Chinese company. The firm also had steadily growing revenues and net income throughout 2019.
The specialty retail industry was home to the Fund’s worst performing position, footwear retailer Designer Brands (formerly known as DSW). The company has faced challenges as many leading brands are opting for more direct customer relationships. In December, the company also reported a decline in its gross margins related to unseasonably warm fall weather, which hindered performance, and tariff concerns that led to an inventory pullback and a cut in marketing investments in anticipation of lower spending by consumers that didn’t materialize. Confident that the company can right itself and navigate the secular shifts affecting retailers, we added shares in 2019. We made the opposite decision with coal producer Alliance Resource Partners by selling our stake. We opted to build our position in ArcBest, a freight and logistics solutions specialist that saw its business stall in 2019. We think that the firm’s long-term prospects are solid, especially if the economy reaccelerates in 2020.
Both stock selection and, to a lesser degree, sector allocation hurt performance versus the Russell 2000 in 2019. Consumer Discretionary and Health Care hurt most. Underperformance in the first sector was almost entirely the result of poor stock selection while in Health Care both our lower exposure and ineffective stock picks created a disadvantage. Specialty retail (Consumer Discretionary) fared worst on an industry basis relative to the benchmark, followed by biotechnology, which dominated results in Health Care. The portfolio’s cash position also detracted from relative results. Conversely, our overweight in Information Technology and underweight in Utilities helped relative results. Electronic equipment, instruments & components (Information Technology) was the top relative contributing industry, followed by machinery (Industrials).
| Top Contributors to Performance | Top Detractors from Performance | |||||
| For 2019 (%)1 | For 2019 (%)2 | |||||
| Insight Enterprises | 1.46 | Designer Brands Cl. A | -0.62 | |||
| Genworth MI Canada | 1.32 | Alliance Resource Partners L.P. | -0.53 | |||
| PC Connection | 1.27 | ArcBest | -0.50 | |||
| Meritor | 1.00 | Spirit Airlines | -0.47 | |||
| Allegiant Travel | 0.94 | G-III Apparel Group | -0.45 | |||
| 1Includes dividends | 2Net of dividends | |||||
CURRENT POSITIONING AND OUTLOOK
The market’s shift to value proved short-lived as the Russell 2000 Value trailed its growth counterpart in 2019’s fourth quarter. Whether growth’s resurgence will last or value can reassert itself is of course an open question. The fear of recession has diminished, with green shoots indicating that the global slowdown may have bottomed. Details on a China trade deal are still vague, however, and this is not the first time that an agreement has appeared close, so economic reacceleration may remain elusive. In the meantime, the Fed is holding the line on rates, and yield curve inversion is over for now. In other words, the outlook remains uncertain before we even consider geopolitical tensions or the November elections. In this environment, we have been adding select positions that look attractively valued and capable of rebounding in energy services and pharmaceuticals.
| 12 | Royce Capital Fund 2019 Annual Report to Shareholders |
| PERFORMANCE AND PORTFOLIO REVIEW (UNAUDITED) | TICKER SYMBOLS RCPFX RCSSX |
Performance and Expenses
Average Annual Total Return (%) Through 12/31/19
| JUL-DEC 20191 | 1-YR | 3-YR | 5-YR | 10-YR | 15-YR | 20-YR | SINCE INCEPTION (12/27/96) | |||||||||
| RCS | 9.36 | 18.67 | 4.65 | 4.10 | 8.35 | 6.84 | 9.90 | 10.13 | ||||||||
Annual Gross Operating Expenses: 1.11% Annual Net Operating Expenses: 1.08%
1Not annualized
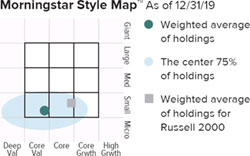
TheMorningstar Style Map is theMorningstar Style Box™ with the center 75% of fund holdings plotted as theMorningstar Ownership Zone™. The Morningstar Style Box is designed to reveal a fund’s investment strategy. The Morningstar Ownership Zone provides detail about a portfolio’s investment style by showing the range of stock sizes and styles. The Ownership Zone is derived by plotting each stock in the portfolio within the proprietary Morningstar Style Box. Over time, the shape and location of a fund’s ownership zone may vary. See page 28 for additional information.
Value of $10,000
Invested on 12/27/96 as of 12/31/19 ($)
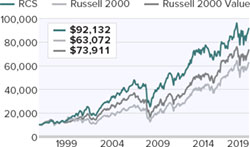
Includes reinvestment of distributions.
Top 10 Positions
% of Net Assets
| Insight Enterprises | 2.6 | |
| Genworth MI Canada | 2.5 | |
| Miller Industries | 2.5 | |
| Sanmina Corporation | 2.2 | |
| WSFS Financial | 2.2 | |
| Spirit Airlines | 2.1 | |
| Designer Brands Cl. A | 2.1 | |
| G-III Apparel Group | 2.1 | |
| Caleres | 2.0 | |
| Shoe Carnival | 1.9 |
Portfolio Sector Breakdown
% of Net Assets
| Industrials | 27.3 | |
| Financials | 26.3 | |
| Consumer Discretionary | 15.5 | |
| Information Technology | 11.8 | |
| Energy | 6.4 | |
| Health Care | 2.3 | |
| Real Estate | 1.5 | |
| Communication Services | 0.9 | |
| Consumer Staples | 0.9 | |
| Materials | 0.7 | |
| Cash and Cash Equivalents | 6.4 |
Calendar Year Total Returns (%)
| YEAR | RCS | |
| 2019 | 18.7 | |
| 2018 | -8.3 | |
| 2017 | 5.4 | |
| 2016 | 21.0 | |
| 2015 | -11.8 | |
| 2014 | 3.2 | |
| 2013 | 34.8 | |
| 2012 | 12.5 | |
| 2011 | -3.3 | |
| 2010 | 20.5 | |
| 2009 | 35.2 | |
| 2008 | -27.2 | |
| 2007 | -2.1 | |
| 2006 | 15.6 | |
| 2005 | 8.6 |
Upside/Downside Capture Ratios
Periods Ended 12/31/19 (%)
| UPSIDE | DOWNSIDE | |
| 10-Year | 68 | 66 |
| From 12/31/96 (Start of Fund’s First Full Quarter) | 91 | 74 |
Portfolio Diagnostics
| Fund Net Assets | $399 million | |
| Number of Holdings | 84 | |
| Turnover Rate | 111% | |
| Average Market Capitalization1 | $1,152 million | |
| Weighted Average P/B Ratio2 | 1.6x | |
| Active Share3 | 96% | |
| U.S. Investments (% of Net Assets) | 86.7% | |
| Non-U.S. Investments (% of Net Assets) | 6.9% |
| 1 | Geometric Average. This weighted calculation uses each portfolio holding’s market cap in a way designed to not skew the effect of very large or small holdings; instead, it aims to better identify the portfolio’s center, which Royce believes offers a more accurate measure of average market cap than a simple mean or median. |
| 2 | Harmonic Average.This weighted calculation evaluates a portfolio as if it were a single stock and measures it overall. It compares the total market value of the portfolio to the portfolio’s share in the earnings or book value, as the case may be, of its underlying stocks. |
| 3 | Active Shareis the sum of the absolute values of the different weightings of each holding in the Fund versus each holding in the benchmark, divided by two. |
Important Performance and Expense Information
All performance information in thisReportreflects past performance, is presented on a total return basis, reflects the reinvestment of distributions, and does not reflect the deduction of taxes that a shareholder would pay on fund distributions or the redemption of fund shares. Past performance is no guarantee of future results. Investment return and principal value of an investment will fluctuate, so that shares may be worth more or less than their original cost when redeemed. Current performance may be higher or lower than performance quoted. The Fund’s total returns do not reflect any deduction for charges or expenses of the variable contracts investing in the Fund. Returns as of the most recent month-end may be obtained at www.royceinvest.com. All performance and risk information reflects the result of the Investment Class (its oldest class). Shares of RCS’s Service Class bear an annual distribution expense that is not borne by the Investment Class; if those expenses were reflected, total returns would have been lower. Certain immaterial adjustments were made to the net assets of Royce Capital Fund-Small-Cap Portfolio at 12/31/17 for financial reporting purposes, and as a result the calendar year total returns based on those net asset values differ from the adjusted net asset values and calendar year total returns reported in the Financial Highlights. Gross operating expenses reflect the Fund’s total gross operating expenses for the Investment Class and include management fees and other expenses. Net operating expenses reflect contractual fee waivers and/or expense reimbursements. All expense information is reported as of the Fund’s most current prospectus. Royce & Associates has contractually agreed, without right of termination, to waive fees and/or reimburse expenses to the extent necessary to maintain the Investment Class’s net annual operating expenses (excluding brokerage commissions, taxes, interest, litigation expenses, acquired fund fees and expenses, and other expenses not borne in the ordinary course of business) at or below 1.08% through April 30, 2020. Regarding the “Top Contributors” and “Top Detractors” tables shown above, the sum of all contributors to, and all detractors from, performance for all securities in the portfolio would approximate the Fund’s year-to-date performance for 2019. Upside Capture Ratio measures a manager’s performance in up markets relative to the Fund’s benchmark. It is calculated by measuring the Fund’s performance in quarters when the benchmark went up and dividing it by the benchmark’s return in those quarters. Downside Capture Ratio measures a manager’s performance in down markets relative to the Fund’s benchmark (Russell 2000). It is calculated by measuring the Fund’s performance in quarters when the benchmark goes down and dividing it by the benchmark’s return in those quarters.
Royce Capital Fund 2019 Annual Report to Shareholders | 13
Schedule of Investments
Royce Capital Fund – Small-Cap Portfolio
Common Stocks – 93.6%
| SHARES | VALUE | ||||||
| COMMUNICATION SERVICES – 0.9% | |||||||
| MEDIA - 0.9% | |||||||
| Saga Communications Cl. A | 123,383 | $ | 3,750,843 | ||||
| Total (Cost $4,993,347) | 3,750,843 | ||||||
| CONSUMER DISCRETIONARY – 15.5% | |||||||
| AUTO COMPONENTS - 0.9% | |||||||
| Gentex Corporation | 66,516 | 1,927,634 | |||||
| Stoneridge1 | 58,805 | 1,724,162 | |||||
| 3,651,796 | |||||||
| HOTELS, RESTAURANTS & LEISURE - 1.5% | |||||||
| Hilton Grand Vacations1 | 171,509 | 5,898,195 | |||||
| HOUSEHOLD DURABLES - 1.0% | |||||||
| La-Z-Boy | 124,486 | 3,918,819 | |||||
| SPECIALTY RETAIL - 9.6% | |||||||
| American Eagle Outfitters | 456,965 | 6,717,385 | |||||
| Caleres | 334,917 | 7,954,279 | |||||
| Designer Brands Cl. A | 522,466 | 8,223,615 | |||||
| †Rent-A-Center | 262,133 | 7,559,916 | |||||
| Shoe Carnival | 205,836 | 7,673,566 | |||||
| 38,128,761 | |||||||
| TEXTILES, APPAREL & LUXURY GOODS - 2.5% | |||||||
| G-III Apparel Group1 | 244,665 | 8,196,278 | |||||
| Steven Madden | 45,506 | 1,957,213 | |||||
| 10,153,491 | |||||||
| Total (Cost $61,410,283) | 61,751,062 | ||||||
| CONSUMER STAPLES – 0.9% | |||||||
| FOOD & STAPLES RETAILING - 0.9% | |||||||
| Village Super Market Cl. A | 151,570 | 3,516,424 | |||||
| Total (Cost $4,131,932) | 3,516,424 | ||||||
| ENERGY – 6.4% | |||||||
| ENERGY EQUIPMENT & SERVICES - 2.3% | |||||||
| †DMC Global | 46,706 | 2,098,967 | |||||
| Helmerich & Payne | 111,500 | 5,065,445 | |||||
| †Solaris Oilfield Infrastructure Cl. A | 133,100 | 1,863,400 | |||||
| 9,027,812 | |||||||
| OIL, GAS & CONSUMABLE FUELS - 4.1% | |||||||
| †Bonanza Creek Energy1 | 221,308 | 5,165,329 | |||||
| †Dorchester Minerals L.P. | 40,700 | 794,057 | |||||
| †Laredo Petroleum1,2 | 1,976,400 | 5,672,268 | |||||
| †Penn Virginia1 | 161,226 | 4,893,209 | |||||
| 16,524,863 | |||||||
| Total (Cost $24,150,201) | 25,552,675 | ||||||
| FINANCIALS – 26.3% | |||||||
| BANKS - 12.3% | |||||||
| Ames National | 198,702 | 5,575,578 | |||||
| Bar Harbor Bankshares | 11,665 | 296,175 | |||||
| Camden National | 139,729 | 6,435,918 | |||||
| City Holding Company | 75,160 | 6,159,362 | |||||
| CNB Financial | 199,719 | 6,526,817 | |||||
| Codorus Valley Bancorp | 76,235 | 1,755,692 | |||||
| Financial Institutions | 94,182 | 3,023,242 | |||||
| Landmark Bancorp | 57,520 | 1,440,876 | |||||
| MidWestOne Financial Group | 83,692 | 3,032,161 | |||||
| National Bankshares | 145,868 | 6,553,849 | |||||
| Northrim BanCorp | 125,081 | 4,790,602 | |||||
| Unity Bancorp | 158,138 | 3,569,175 | |||||
| 49,159,447 | |||||||
| CAPITAL MARKETS - 2.9% | |||||||
| Houlihan Lokey Cl. A | 119,515 | 5,840,698 | |||||
| Moelis & Company Cl. A | 61,701 | 1,969,496 | |||||
| Pzena Investment Management Cl. A | 414,047 | 3,569,085 | |||||
| 11,379,279 | |||||||
| INSURANCE - 3.0% | |||||||
| James River Group Holdings | 96,135 | 3,961,724 | |||||
| Kingstone Companies | 227,675 | 1,764,481 | |||||
| Reinsurance Group of America | 38,836 | 6,332,598 | |||||
| 12,058,803 | |||||||
| THRIFTS & MORTGAGE FINANCE - 8.1% | |||||||
| Genworth MI Canada | 227,550 | 9,956,791 | |||||
| Southern Missouri Bancorp | 93,767 | 3,596,902 | |||||
| Timberland Bancorp | 110,777 | 3,294,508 | |||||
| TrustCo Bank Corp. NY | 758,182 | 6,573,438 | |||||
| WSFS Financial | 198,200 | 8,718,818 | |||||
| 32,140,457 | |||||||
| Total (Cost $89,963,274) | 104,737,986 | ||||||
| HEALTH CARE – 2.3% | |||||||
| BIOTECHNOLOGY - 0.5% | |||||||
| †Catalyst Pharmaceuticals1 | 542,600 | 2,034,750 | |||||
| HEALTH CARE PROVIDERS & SERVICES - 1.3% | |||||||
| AMN Healthcare Services1 | 31,541 | 1,965,320 | |||||
| Ensign Group (The) | 54,614 | 2,477,837 | |||||
| †Pennant Group1 | 22,357 | 739,346 | |||||
| 5,182,503 | |||||||
| PHARMACEUTICALS - 0.5% | |||||||
| †Supernus Pharmaceuticals1 | 91,900 | 2,179,868 | |||||
| Total (Cost $8,232,567) | 9,397,121 | ||||||
| INDUSTRIALS – 27.3% | |||||||
| AEROSPACE & DEFENSE - 1.3% | |||||||
| Magellan Aerospace | 357,100 | 3,866,487 | |||||
| †Vectrus1 | 24,171 | 1,239,005 | |||||
| 5,105,492 | |||||||
| AIRLINES - 5.6% | |||||||
| Allegiant Travel | 39,893 | 6,942,977 | |||||
| Hawaiian Holdings | 233,955 | 6,852,542 | |||||
| Spirit Airlines1 | 211,632 | 8,530,886 | |||||
| 22,326,405 | |||||||
| COMMERCIAL SERVICES & SUPPLIES - 2.5% | |||||||
| Herman Miller | 89,303 | 3,719,470 | |||||
| Kimball International Cl. B | 297,582 | 6,151,020 | |||||
| 9,870,490 | |||||||
| CONSTRUCTION & ENGINEERING - 0.5% | |||||||
| Comfort Systems USA | 38,169 | 1,902,725 | |||||
| ELECTRICAL EQUIPMENT - 0.5% | |||||||
| EnerSys | 25,987 | 1,944,607 | |||||
| MACHINERY - 6.5% | |||||||
| Alamo Group | 15,907 | 1,997,124 | |||||
| †Commercial Vehicle Group1 | 838,788 | 5,326,304 | |||||
| Federal Signal | 58,222 | 1,877,660 | |||||
| Meritor1 | 262,428 | 6,872,989 | |||||
| Miller Industries | 264,932 | 9,836,925 | |||||
| 25,911,002 | |||||||
| PROFESSIONAL SERVICES - 6.3% | |||||||
| Heidrick & Struggles International | 226,261 | 7,353,482 | |||||
| Kforce | 47,446 | 1,883,606 |
14 | Royce Capital Fund 2019 Annual Report to Shareholders | THE ACCOMPANYING NOTES ARE AN INTEGRAL PART OF THESE FINANCIAL STATEMENTS |
December 31, 2019
Royce Capital Fund – Small-Cap Portfolio (continued)
| SHARES | VALUE | ||||||
| INDUSTRIALS (continued) | |||||||
| PROFESSIONAL SERVICES (continued) | |||||||
| Korn Ferry | 167,007 | $ | 7,081,097 | ||||
| Resources Connection | 210,780 | 3,442,037 | |||||
| Robert Half International | 57,964 | 3,660,427 | |||||
| TrueBlue1 | 81,748 | 1,966,857 | |||||
| 25,387,506 | |||||||
| ROAD & RAIL - 3.3% | |||||||
| ArcBest | 220,818 | 6,094,577 | |||||
| Old Dominion Freight Line | 10,104 | 1,917,537 | |||||
| Saia1 | 19,800 | 1,843,776 | |||||
| Werner Enterprises | 92,539 | 3,367,494 | |||||
| 13,223,384 | |||||||
| TRADING COMPANIES & DISTRIBUTORS - 0.8% | |||||||
| †BMC Stock Holdings1 | 107,832 | 3,093,700 | |||||
| Total (Cost $98,395,309) | 108,765,311 | ||||||
| INFORMATION TECHNOLOGY – 11.8% | |||||||
| ELECTRONIC EQUIPMENT, INSTRUMENTS & COMPONENTS - 9.3% | |||||||
| Fabrinet1 | 60,802 | 3,942,402 | |||||
| Insight Enterprises1 | 145,952 | 10,258,966 | |||||
| PC Connection | 116,503 | 5,785,539 | |||||
| Sanmina Corporation1 | 260,093 | 8,905,584 | |||||
| Vishay Intertechnology | 277,299 | 5,903,696 | |||||
| Vishay Precision Group1 | 70,500 | 2,397,000 | |||||
| 37,193,187 | |||||||
| SEMICONDUCTORS & SEMICONDUCTOR EQUIPMENT - 2.5% | |||||||
| Advanced Energy Industries1 | 28,108 | 2,001,289 | |||||
| Kulicke & Soffa Industries | 220,326 | 5,992,867 | |||||
| MKS Instruments | 17,791 | 1,957,188 | |||||
| 9,951,344 | |||||||
| Total (Cost $34,657,353) | 47,144,531 | ||||||
| MATERIALS – 0.7% | |||||||
| METALS & MINING - 0.7% | |||||||
| †Mayville Engineering1 | 297,847 | 2,793,805 | |||||
| Total (Cost $4,001,430) | 2,793,805 | ||||||
| REAL ESTATE – 1.5% | |||||||
| REAL ESTATE MANAGEMENT & DEVELOPMENT - 1.5% | |||||||
| Marcus & Millichap1 | 157,119 | 5,852,683 | |||||
| Total (Cost $5,070,007) | 5,852,683 | ||||||
| TOTAL COMMON STOCKS | |||||||
| (Cost $335,005,703) | 373,262,441 | ||||||
| REPURCHASE AGREEMENT– 6.6% | |||||||
| Fixed Income Clearing Corporation, 0.25% dated 12/31/19, due 1/2/20, maturity value $26,456,367 (collateralized by obligations of various U.S. Government Agencies, 2.00%- 2.25% due 5/31/24-11/15/24, valued at $26,987,900) | |||||||
| (Cost $26,456,000) | 26,456,000 | ||||||
| TOTAL INVESTMENTS – 100.2% | |||||||
| (Cost $361,461,703) | 399,718,441 | ||||||
| LIABILITIES LESS CASH AND OTHER ASSETS – (0.2)% | (976,743 | ||||||
| NET ASSETS – 100.0% | $ | 398,741,698 |
ADR- American Depository Receipt
| † | New additions in 2019. |
| 1 | Non-income producing. |
| 2 | All or a portion of these securities were on loan at December 31, 2019. |
Bold indicates the Fund’s 20 largest equity holdings in terms of December 31, 2019, market value.
THE ACCOMPANYING NOTES ARE AN INTEGRAL PART OF THESE FINANCIAL STATEMENTS | Royce Capital Fund 2019 Annual Report to Shareholders | 15 |
| Statements of Assets and Liabilities | December 31, 2019 |
| Micro-Cap | Small-Cap | |||||||
| Portfolio | Portfolio | |||||||
| ASSETS: | ||||||||
| Investments at value (including collateral on loaned securities)1 | $ | 146,005,321 | $ | 373,262,441 | ||||
| Repurchase agreements (at cost and value) | 12,409,000 | 26,456,000 | ||||||
| Cash and foreign currency | 560 | 25,299 | ||||||
| Receivable for investments sold | 382,262 | 165,272 | ||||||
| Receivable for capital shares sold | 1,105,899 | 72,002 | ||||||
| Receivable for dividends and interest | 87,756 | 438,899 | ||||||
| Receivable for securities lending income | 689 | 331 | ||||||
| Prepaid expenses and other assets | 2,056 | 4,582 | ||||||
| Total Assets | 159,993,543 | 400,424,826 | ||||||
| LIABILITIES: | ||||||||
| Payable for collateral on loaned securities | 218,823 | – | ||||||
| Payable for investments purchased | 360,679 | 1,035,272 | ||||||
| Payable for capital shares redeemed | 88,697 | 188,352 | ||||||
| Payable for investment advisory fees | 155,259 | 323,176 | ||||||
| Payable for trustees’ fees | 9,205 | 19,225 | ||||||
| Accrued expenses | 62,402 | 117,103 | ||||||
| Total Liabilities | 895,065 | 1,683,128 | ||||||
| Net Assets | $ | 159,098,478 | $ | 398,741,698 | ||||
| ANALYSIS OF NET ASSETS: | ||||||||
| Paid-in capital | $ | 122,388,694 | $ | 354,930,532 | ||||
| Total distributable earnings (loss) | 36,709,784 | 43,811,166 | ||||||
| Net Assets | $ | 159,098,478 | $ | 398,741,698 | ||||
| Investment Class | $ | 132,008,250 | $ | 173,491,361 | ||||
| Service Class | 27,090,228 | 225,250,337 | ||||||
| SHARES OUTSTANDING (unlimited number of $.001 par value): | ||||||||
| Investment Class | 13,537,817 | 21,175,851 | ||||||
| Service Class | 2,839,477 | 28,117,574 | ||||||
| NET ASSET VALUES (Net Assets ÷ Shares Outstanding): | ||||||||
| (offering and redemption price per share) | ||||||||
| Investment Class | $9.75 | $8.19 | ||||||
| Service Class | 9.54 | 8.01 | ||||||
| Investments at identified cost | $ | 111,425,014 | $ | 335,005,703 | ||||
| Market value of loaned securities2 | 4,923,692 | 2,605,674 | ||||||
| See Notes to Financial Statements for information on non-cash collateral on loaned securities. |
| 2 | Market value of loaned securities backed by non-cash collateral is as of prior business day. |
| 16 |Royce Capital Fund 2019 Annual Report to Shareholders | THE ACCOMPANYING NOTES ARE AN INTEGRAL PART OF THESE FINANCIAL STATEMENTS |
| Statements of Operations | Year Ended December 31, 2019 |
| Micro-Cap | Small-Cap | |||||||
| Portfolio | Portfolio | |||||||
| INVESTMENT INCOME: | ||||||||
| INCOME: | ||||||||
| Dividends | $ | 1,265,678 | $ | 6,941,933 | ||||
| Foreign withholding tax | (24,787 | ) | (153,119 | ) | ||||
| Interest | 37,195 | 99,972 | ||||||
| Securities lending | 80,682 | 1,111 | ||||||
| Total income | 1,358,768 | 6,889,897 | ||||||
| EXPENSES: | ||||||||
| Investment advisory fees | 1,849,735 | 3,208,931 | ||||||
| Distribution fees | 43,849 | 375,151 | ||||||
| Administrative and office facilities | 86,323 | 157,912 | ||||||
| Shareholder reports | 58,323 | 68,532 | ||||||
| Trustees’ fees | 44,473 | 92,315 | ||||||
| Audit | 27,950 | 33,472 | ||||||
| Custody | 23,523 | 54,093 | ||||||
| Shareholder servicing | 14,687 | 14,314 | ||||||
| Legal | 6,451 | 13,728 | ||||||
| Other expenses | 9,054 | 24,719 | ||||||
| Total expenses | 2,164,368 | 4,043,167 | ||||||
| Compensating balance credits | (353 | ) | (571 | ) | ||||
| Fees waived by investment adviser | (82,461 | ) | (125,890 | ) | ||||
| Expenses reimbursed by investment adviser | (73,339 | ) | (81,511 | ) | ||||
| Net expenses | 2,008,215 | 3,835,195 | ||||||
| Net investment income (loss) | (649,447 | ) | 3,054,702 | |||||
| REALIZED AND UNREALIZED GAIN (LOSS) ON INVESTMENTS AND FOREIGN CURRENCY: | ||||||||
| NET REALIZED GAIN (LOSS): | ||||||||
| Investments | 2,085,590 | 3,755,867 | ||||||
| Foreign currency transactions | 6,706 | 8,487 | ||||||
| NET CHANGE IN UNREALIZED APPRECIATION (DEPRECIATION): | ||||||||
| Investments | 24,781,451 | 33,770,864 | ||||||
| Other assets and liabilities denominated in foreign currency | (1,490 | ) | (50 | ) | ||||
| Net realized and unrealized gain (loss) on investments and foreign currency | 26,872,257 | 37,535,168 | ||||||
| NET INCREASE (DECREASE) IN NET ASSETS FROM INVESTMENT OPERATIONS | $ | 26,222,810 | $ | 40,589,870 | ||||
| THE ACCOMPANYING NOTES ARE AN INTEGRAL PART OF THESE FINANCIAL STATEMENTS | Royce Capital Fund 2019 Annual Report to Shareholders | 17 |
Statements of Changes in Net Assets
| Micro-Cap Portfolio | Small-Cap Portfolio | |||||||||||||||
| Year Ended 12/31/19 | Year Ended 12/31/18 | Year Ended 12/31/19 | Year Ended 12/31/18 | |||||||||||||
| INVESTMENT OPERATIONS: | ||||||||||||||||
| Net investment income (loss) | $ | (649,447 | ) | $ | (640,551 | ) | $ | 3,054,702 | $ | 2,028,315 | ||||||
| Net realized gain (loss) on investments and foreign currency | 2,092,296 | 14,233,957 | 3,764,354 | 46,496,665 | ||||||||||||
| Net change in unrealized appreciation (depreciation) on investments and foreign currency | 24,779,961 | (26,943,361 | ) | 33,770,814 | (72,052,141 | ) | ||||||||||
| Net increase (decrease) in net assets from investment operations | 26,222,810 | (13,349,955 | ) | 40,589,870 | (23,527,161 | ) | ||||||||||
| DISTRIBUTIONS: | ||||||||||||||||
| Total distributable earnings | ||||||||||||||||
| Investment Class | (11,752,195 | ) | (6,692,693 | ) | (21,338,300 | ) | (3,942,054 | ) | ||||||||
| Service Class | (2,426,040 | ) | (764,616 | ) | (27,129,064 | ) | (1,828,028 | ) | ||||||||
| Total distributions | (14,178,235 | ) | (7,457,309 | ) | (48,467,364 | ) | (5,770,082 | ) | ||||||||
| CAPITAL SHARE TRANSACTIONS: | ||||||||||||||||
| Value of shares sold | ||||||||||||||||
| Investment Class | 10,068,959 | 20,188,911 | 15,075,395 | 20,508,660 | ||||||||||||
| Service Class | 16,944,428 | 8,396,343 | 315,873,262 | 3,049,574 | ||||||||||||
| Distributions reinvested | ||||||||||||||||
| Investment Class | 11,752,195 | 6,692,693 | 21,338,300 | 3,942,054 | ||||||||||||
| Service Class | 2,426,040 | 764,616 | 27,129,064 | 1,828,028 | ||||||||||||
| Value of shares redeemed | ||||||||||||||||
| Investment Class | (28,638,535 | ) | (45,283,517 | ) | (43,316,043 | ) | (62,882,019 | ) | ||||||||
| Service Class | (7,600,024 | ) | (24,574,409 | ) | (205,170,757 | ) | (153,628,193 | ) | ||||||||
| Net increase (decrease) in net assets from capital share transactions | 4,953,063 | (33,815,363 | ) | 130,929,221 | (187,181,896 | ) | ||||||||||
| Net Increase (Decrease) in Net Assets | 16,997,638 | (54,622,627 | ) | 123,051,727 | (216,479,139 | ) | ||||||||||
| NET ASSETS: | ||||||||||||||||
| Beginning of year | 142,100,840 | 196,723,467 | 275,689,971 | 492,169,110 | ||||||||||||
| End of year | $ | 159,098,478 | $ | 142,100,840 | $ | 398,741,698 | $ | 275,689,971 | ||||||||
| 18|Royce Capital Fund 2019 Annual Report to Shareholders | THE ACCOMPANYING NOTES ARE AN INTEGRAL PART OF THESE FINANCIAL STATEMENTS |
Financial Highlights
This table is presented to show selected data for a share outstanding throughout each year and to assist shareholders in evaluating a Fund’s performance for the periods presented. Per share amounts have been determined on the basis of the weighted average number of shares outstanding during the period.
| Ratio of Expenses to Average Net Assets | |||||||||||||||||||||||||||||||||||||||||||||||||||||||||||||
| Net Asset Value, Beginning of Period | Net Investment Income (Loss) | Net Realized and Unrealized Gain (Loss) on Investments and Foreign Currency | Total from Investment Operations | Distributions from Net Investment Income | Distributions from Net Realized Gain on Investments and Foreign Currency | Total Distributions | Net Asset Value, End of Period | Total Return | Net Assets, End of Period (in thousands) | Prior to Fee Waivers, Expense Reimbursements and Balance Credits | Prior to Fee Waivers and Expense Reimbursements | Net of Fee Waivers and Expense Reimbursements | Ratio of Net Investment Income (Loss) to Average Net Assets | Portfolio Turnover Rate | |||||||||||||||||||||||||||||||||||||||||||||||
| Micro-Cap Portfolio–Investment Class | |||||||||||||||||||||||||||||||||||||||||||||||||||||||||||||
| 2019 | $ | 8.97 | $ | (0.04 | ) | $ | 1.77 | $ | 1.73 | $ | – | $ | (0.95 | ) | $ | (0.95 | ) | $ | 9.75 | 19.55 | % | $ | 132,008 | 1.43 | % | 1.43 | % | 1.33 | % | (0.41 | )% | 26 | % | ||||||||||||||||||||||||||||
| 2018 | 10.39 | (0.03 | ) | (0.90 | ) | (0.93 | ) | – | (0.49 | ) | (0.49 | ) | 8.97 | (9.13 | ) | 127,457 | 1.39 | 1.39 | 1.33 | (0.30 | ) | 28 | |||||||||||||||||||||||||||||||||||||||
| 2017 | 11.11 | (0.02 | ) | 0.58 | 0.56 | (0.08 | ) | (1.20 | ) | (1.28 | ) | 10.39 | 5.29 | 164,656 | 1.38 | 1.38 | 1.38 | (0.22 | ) | 30 | |||||||||||||||||||||||||||||||||||||||||
| 2016 | 9.34 | 0.03 | 1.81 | 1.84 | (0.07 | ) | – | (0.07 | ) | 11.11 | 19.71 | 177,444 | 1.36 | 1.36 | 1.36 | 0.02 | 57 | ||||||||||||||||||||||||||||||||||||||||||||
| 2015 | 11.37 | 0.03 | (1.45 | ) | (1.42 | ) | – | (0.61 | ) | (0.61 | ) | 9.34 | (12.46 | ) | 369,991 | 1.32 | 1.32 | 1.32 | 0.27 | 51 | |||||||||||||||||||||||||||||||||||||||||
| Micro-Cap Portfolio–Service Class | |||||||||||||||||||||||||||||||||||||||||||||||||||||||||||||
| 2019 | $ | 8.80 | $ | (0.06 | ) | $ | 1.73 | $ | 1.67 | $ | – | $ | (0.93 | ) | $ | (0.93 | ) | $ | 9.54 | 19.24 | % | $ | 27,090 | 1.71 | % | 1.71 | % | 1.58 | % | (0.66 | )% | 26 | % | ||||||||||||||||||||||||||||
| 2018 | 10.21 | (0.06 | ) | (0.87 | ) | (0.93 | ) | – | (0.48 | ) | (0.48 | ) | 8.80 | (9.29 | ) | 14,644 | 1.64 | 1.64 | 1.58 | (0.57 | ) | 28 | |||||||||||||||||||||||||||||||||||||||
| 2017 | 10.93 | (0.04 | ) | 0.57 | 0.53 | (0.06 | ) | (1.19 | ) | (1.25 | ) | 10.21 | 5.02 | 32,067 | 1.64 | 1.64 | 1.58 | (0.43 | ) | 30 | |||||||||||||||||||||||||||||||||||||||||
| 2016 | 9.20 | (0.02 | ) | 1.80 | 1.78 | (0.05 | ) | – | (0.05 | ) | 10.93 | 19.37 | 34,675 | 1.65 | 1.65 | 1.58 | (0.15 | ) | 57 | ||||||||||||||||||||||||||||||||||||||||||
| 2015 | 11.23 | 0.00 | (1.42 | ) | (1.42 | ) | – | (0.61 | ) | (0.61 | ) | 9.20 | (12.61 | ) | 23,928 | 1.60 | 1.60 | 1.56 | 0.01 | 51 | |||||||||||||||||||||||||||||||||||||||||
| Small-Cap Portfolio–Investment Class | |||||||||||||||||||||||||||||||||||||||||||||||||||||||||||||
| 2019 | $ | 7.87 | $ | 0.09 | $ | 1.37 | $ | 1.46 | $ | (0.06 | ) | $ | (1.08 | ) | $ | (1.14 | ) | $ | 8.19 | 18.67 | % | $ | 173,492 | 1.15 | % | 1.15 | % | 1.08 | % | 1.04 | % | 111 | % | ||||||||||||||||||||||||||||
| 2018 | 8.77 | 0.06 | (0.78 | ) | (0.72 | ) | (0.07 | ) | (0.11 | ) | (0.18 | ) | 7.87 | (8.24 | ) | 171,561 | 1.11 | 1.11 | 1.08 | 0.62 | 56 | ||||||||||||||||||||||||||||||||||||||||
| 2017 | 8.41 | 0.05 | 0.39 | 0.44 | (0.08 | ) | – | (0.08 | ) | 8.77 | 5.26 | 228,620 | 1.11 | 1.11 | 1.11 | 0.55 | 91 | ||||||||||||||||||||||||||||||||||||||||||||
| 2016 | 8.43 | 0.13 | 1.66 | 1.79 | (0.17 | ) | (1.64 | ) | (1.81 | ) | 8.41 | 20.96 | 248,244 | 1.09 | 1.09 | 1.09 | 0.89 | 78 | |||||||||||||||||||||||||||||||||||||||||||
| 2015 | 12.65 | 0.17 | (1.66 | ) | (1.49 | ) | (0.09 | ) | (2.64 | ) | (2.73 | ) | 8.43 | (11.80 | ) | 356,258 | 1.06 | 1.06 | 1.06 | 1.26 | 59 | ||||||||||||||||||||||||||||||||||||||||
| Small-Cap Portfolio–Service Class | |||||||||||||||||||||||||||||||||||||||||||||||||||||||||||||
| 2019 | $ | 7.69 | $ | 0.06 | $ | 1.35 | $ | 1.41 | $ | (0.04 | ) | $ | (1.05 | ) | $ | (1.09 | ) | $ | 8.01 | 18.44 | % | $ | 225,250 | 1.39 | % | 1.39 | % | 1.33 | % | 0.86 | % | 111 | % | ||||||||||||||||||||||||||||
| 2018 | 8.55 | 0.04 | (0.76 | ) | (0.72 | ) | (0.03 | ) | (0.11 | ) | (0.14 | ) | 7.69 | (8.50 | ) | 104,129 | 1.34 | 1.34 | 1.33 | 0.31 | 56 | ||||||||||||||||||||||||||||||||||||||||
| 2017 | 8.20 | 0.02 | 0.40 | 0.42 | (0.07 | ) | – | (0.07 | ) | 8.55 | 5.10 | 263,549 | 1.34 | 1.34 | 1.34 | 0.32 | 91 | ||||||||||||||||||||||||||||||||||||||||||||
| 2016 | 8.27 | 0.03 | 1.69 | 1.72 | (0.15 | ) | (1.64 | ) | (1.79 | ) | 8.20 | 20.53 | 267,445 | 1.34 | 1.34 | 1.34 | 0.69 | 78 | |||||||||||||||||||||||||||||||||||||||||||
| 2015 | 12.44 | 0.13 | (1.62 | ) | (1.49 | ) | (0.04 | ) | (2.64 | ) | (2.68 | ) | 8.27 | (11.97 | ) | 128,285 | 1.31 | 1.31 | 1.31 | 1.00 | 59 | ||||||||||||||||||||||||||||||||||||||||
| THE ACCOMPANYING NOTES ARE AN INTEGRAL PART OF THESE FINANCIAL STATEMENTS | Royce Capital Fund 2019 Annual Report to Shareholders | 19 |
Summary of Significant Accounting Policies:
Royce Capital Fund – Micro-Cap Portfolio and Royce Capital Fund – Small-Cap Portfolio (the “Fund” or “Funds”) are the two series of Royce Capital Fund (the “Trust”), an open-end management investment company organized as a Delaware statutory trust. Shares of the Funds are offered to life insurance companies for allocation to certain separate accounts established for the purpose of funding qualified and non-qualified variable annuity contracts and variable life insurance contracts. Micro-Cap Portfolio and Small-Cap Portfolio commenced operations on December 27, 1996.
Classes of shares have equal rights as to earnings and assets, except that each class may bear different fees and expenses for distribution, shareholder servicing, registration and shareholder reports, and receive different compensating balance credits and expense reimbursements. Investment income, realized and unrealized capital gains or losses on investments and foreign currency, and expenses other than those attributable to a specific class are allocated to each class of shares based on its relative net assets.
The preparation of financial statements in conformity with accounting principles generally accepted in the United States requires management to make estimates and assumptions that affect the reported amounts of assets and liabilities and the disclosure of contingent assets and liabilities at the date of the financial statements and the reported amounts of income and expenses during the reporting period. Actual results could differ from those estimates.
Each Fund is an investment company and accordingly follows the investment company accounting and reporting guidance of the Financial Accounting Standards Board (FASB) Accounting Standard Codification Topic 946 “Financial Services-Investment Companies.”
VALUATION OF INVESTMENTS:
Securities are valued as of the close of trading on the New York Stock Exchange (NYSE) (generally 4:00 p.m. Eastern time) on the valuation date. Securities that trade on an exchange, and securities traded on Nasdaq’s Electronic Bulletin Board, are valued at their last reported sales price or Nasdaq official closing price taken from the primary market in which each security trades or, if no sale is reported for such day, at their highest bid price. Other over-the-counter securities for which market quotations are readily available are valued at their highest bid price, except in the case of some bonds and other fixed income securities which may be valued by reference to other securities with comparable ratings, interest rates and maturities, using established independent pricing services. The Funds value their non-U.S. dollar denominated securities in U.S. dollars daily at the prevailing foreign currency exchange rates as quoted by a major bank. Securities for which market quotations are not readily available are valued at their fair value in accordance with the provisions of the 1940 Act, under procedures approved by the Trust’s Board of Trustees, and are reported as Level 3 securities. As a general principle, the fair value of a security is the amount which the Fund might reasonably expect to receive for the security upon its current sale. However, in light of the judgment involved in fair valuations, there can be no assurance that a fair value assigned to a particular security will be the amount which the Fund might be able to receive upon its current sale. In addition, if, between the time trading ends on a particular security and the close of the customary trading session on the NYSE, events occur that are significant and may make the closing price unreliable, a Fund may fair value the security. The Funds use an independent pricing service to provide fair value estimates for relevant non-U.S. equity securities on days when the U.S. market volatility exceeds a certain threshold. This pricing service uses proprietary correlations it has developed between the movement of prices of non-U.S. equity securities and indices of U.S.-traded securities, futures contracts and other indications to estimate the fair value of relevant non-U.S. securities. When fair value pricing is employed, the prices of securities used by a Fund may differ from quoted or published prices for the same security. Investments in money market funds are valued at net asset value per share.
Various inputs are used in determining the value of each Fund’s investments, as noted above. These inputs are summarized in the three broad levels below:
| Level 1 – | quoted prices in active markets for identical securities. |
| Level 2 – | other significant observable inputs (including quoted prices for similar securities, foreign securities that may be fair valued and repurchase agreements). The table below includes all Level 2 securities. Any Level 2 securities with values based on quoted prices for similar securities would be noted in the Schedules of Investments. |
| Level 3 – | significant unobservable inputs (including last trade price before trading was suspended, or at a discount thereto for lack of marketability or otherwise, market price information regarding other securities, information received from the company and/or published documents, including SEC filings and financial statements, or other publicly available information). |
The inputs or methodology used for valuing securities are not necessarily an indication of the risk associated with investing in those securities.
The following is a summary of the inputs used to value each Fund’s investments as of December 31, 2019. For a detailed breakout of common stocks by sector classification, please refer to the Schedules of Investments.
| LEVEL 1 | LEVEL 2 | LEVEL 3 | TOTAL | |||||||||||||
| Micro-Cap Portfolio | ||||||||||||||||
| Common Stocks | $ | 145,395,898 | $ | – | $ | 390,600 | $ | 145,786,498 | ||||||||
| Repurchase Agreement | – | 12,409,000 | – | 12,409,000 | ||||||||||||
| Money Market Fund/Collateral Received for Securities Loaned | 218,823 | – | – | 218,823 | ||||||||||||
| 20 |Royce Capital Fund 2019 Annual Report to Shareholders |
VALUATION OF INVESTMENTS (continued):
| LEVEL 1 | LEVEL 2 | LEVEL 3 | TOTAL | |||||||||||||
| Small-Cap Portfolio | ||||||||||||||||
| Common Stocks | $ | 373,262,441 | $ | – | $ | – | $ | 373,262,441 | ||||||||
| Repurchase Agreement | – | 26,456,000 | – | 26,456,000 | ||||||||||||
Level 3 Reconciliation:
| BALANCE AS OF 12/31/18 | PURCHASES | SALES | REALIZED GAIN (LOSS) | UNREALIZED GAIN (LOSS)1 | BALANCE AS OF 12/31/19 | ||||||||||||
| Micro-Cap Portfolio | |||||||||||||||||
| Common Stocks | $ 390,600 | $ – | $ – | $ – | $ – | $ 390,600 |
| 1 | The net change in unrealized appreciation (depreciation) is included in the accompanying Statement of Operations. Change in unrealized appreciation (depreciation) includes net unrealized appreciation (depreciation) resulting from changes in investment values during the reporting period and the reversal of previously recorded unrealized appreciation (depreciation) when gains or losses are realized. Net realized gain (loss) from investments and foreign currency transactions is included in the accompanying Statement of Operations. |
The following table summarizes the valuation techniques used and unobservable inputs approved by the Valuation Committee to determine the fair value of certain Level 3 investments. The table does not include Level 3 investments with values derived utilizing prices from prior transactions or third party pricing information with adjustments (e.g. broker quotes, pricing services, net asset values).
FAIR 12/31/19 | VALUATION | UNOBSERVABLE | RANGE | IMPACT TO AN INCREASE | ||||||||||
| Micro-Cap Portfolio | ||||||||||||||
Common Stocks | $390,600 | Discounted Present Value Balance Sheet Analysis | Liquidity Discount | 30%-40% | Decrease |
| 1 | This column represents the directional change in the fair value of the Level 3 investments that would result in an increase from the corresponding unobservable input. A decrease to the unobservable input would have the opposite effect. Significant increases and decreases in these unobservable inputs in isolation could result in significantly higher or lower fair value measurements. |
REPURCHASE AGREEMENTS:
The Funds may enter into repurchase agreements with institutions that the Funds’ investment adviser has determined are creditworthy. Each Fund restricts repurchase agreements to maturities of no more than seven days. Securities pledged as collateral for repurchase agreements, which are held until maturity of the repurchase agreements, are marked-to-market daily and maintained at a value at least equal to the principal amount of the repurchase agreement (including accrued interest). Repurchase agreements could involve certain risks in the event of default or insolvency of the counter-party, including possible delays or restrictions upon the ability of each Fund to dispose of its underlying securities. The remaining contractual maturities of repurchase agreements held by the Funds at December 31, 2019 are overnight and continuous.
FOREIGN CURRENCY:
Net realized foreign exchange gains or losses arise from sales and maturities of short-term securities, sales of foreign currencies, expiration of currency forward contracts, currency gains or losses realized between the trade and settlement dates on securities transactions, and the difference between the amounts of dividends, interest, and foreign withholding taxes recorded on each Fund’s books and the U.S. dollar equivalent of the amounts actually received or paid. Net unrealized foreign exchange gains and losses arise from changes in the value of assets and liabilities, other than investments in securities at the end of the reporting period, as a result of changes in foreign currency exchange rates.
The Funds do not isolate that portion of the results of operations resulting from fluctuations in foreign exchange rates on investments from the fluctuations arising from changes in market prices of securities held. Such fluctuations are included with the net realized and unrealized gain or loss on investments.
SECURITIES LENDING:
The Funds loan securities through a lending agent, State Street Bank and Trust Company, to qualified institutional investors for the purpose of earning additional income. The lending agent receives and holds collateral from such borrowers to secure their obligations to the Funds. Such loans must be secured at all times by collateral in an amount at least equal to the market value of the loaned securities. The market values of the loaned securities and the collateral fluctuate and are determined at the close of each business day by the lending agent. Borrowers are required to post additional collateral to the lending agent on the next succeeding business day in the event of a collateral shortfall. Counterparty risk is further reduced by loaning securities only to parties that participate in a Global Securities Lending Program organized and monitored by the lending agent and that are deemed by it to satisfy its requirements and by having the lending agent enter into securities lending agreements with such borrowers. The lending agent is not affiliated with Royce & Associates (“Royce”).
Collateral may be in the form of cash or U.S. Treasuries. Cash collateral is invested in certain money market pooled investment vehicles. The Funds record a liability in their respective Statements of Assets and Liabilities for the return of such cash collateral during periods in which securities are on loan. The Funds bear the risk of loss for any decrease in the market value of the loaned securities or the investments purchased with cash collateral received from the borrowers.
| Royce Capital Fund 2019 Annual Report to Shareholders | 21 |
Notes to Financial Statements(continued)
SECURITIES LENDING (continued):
Pursuant to the agreement in place between the Funds and the lending agent, if a borrower fails to return loaned securities, and the cash collateral being maintained by the lending agent on behalf of such borrower is insufficient to cover the value of loaned securities and provided such collateral insufficiency is not the result of investment losses, the lending agent shall, at its option, either replace the loaned securities or pay the amount of the shortfall to the Funds. In the event of the bankruptcy of a borrower, the Funds could experience delay in recovering the loaned securities or only recover cash or a security of equivalent value.
Loans of securities generally do not have stated maturity dates, and the Funds may recall a security at any time. The Funds’ securities lending income consists of the income earned on investing cash collateral, plus any premium payments received for lending certain securities, less any rebates paid to borrowers and lending agent fees associated with the loan. Pursuant to the agreement in place between the Funds and the lending agent, the Funds are responsible for any shortfall in the event the value of the investments purchased with cash collateral is insufficient to pay the rebate fee to the borrower.
The following table presents cash collateral and the market value of securities on loan collateralized by cash collateral held by the Funds at December 31, 2019:
CASH COLLATERAL1 | SECURITIES ON LOAN | NET AMOUNT | ||||
| Micro-Cap Portfolio | $ 218,823 | $ (222,163) | $ (3,340) |
| 1 | Absent an event of default, assets and liabilities are presented gross and not offset in the Statements of Assets and Liabilities. The remaining contractual maturity of cash collateral is overnight and continuous. |
The following table presents non-cash collateral and the market value of securities on loan collateralized by non-cash collateral held by the Funds’ custodian at December 31, 2019:
NON-CASH COLLATERAL | SECURITIES ON LOAN COLLATERALIZED | NET AMOUNT | ||||
| Micro-Cap Portfolio | $4,808,955 | $(4,701,529) | $107,426 | |||
| Small-Cap Portfolio | 2,660,915 | (2,605,674) | 55,241 |
DISTRIBUTIONS AND TAXES:
As qualified regulated investment companies under Subchapter M of the Internal Revenue Code, the Funds are not subject to income taxes to the extent that each Fund distributes substantially all of its taxable income for its fiscal year.
The Funds pay any dividends and capital gain distributions annually in December. Dividends from net investment income and distributions from capital gains are determined at a class level. Because federal income tax regulations differ from generally accepted accounting principles, income and capital gain distributions determined in accordance with tax regulations may differ from net investment income and realized gains recognized for financial reporting purposes. Accordingly, the character of distributions and composition of net assets for tax purposes differ from those reflected in the accompanying financial statements.
INVESTMENT TRANSACTIONS AND RELATED INVESTMENT INCOME:
Investment transactions are accounted for on the trade date. Dividend income is recorded on the ex-dividend date. Non-cash dividend income is recorded at the fair market value of the securities received. Interest income is recorded on an accrual basis. Realized gains and losses from investment transactions are determined on the basis of identified cost for book and tax purposes.
EXPENSES:
The Funds incur direct and indirect expenses. Expenses directly attributable to a Fund are charged to the Fund’s operations, while expenses applicable to more than one of the Royce Funds are allocated equitably. Certain personnel, occupancy costs and other administrative expenses related to the Funds are allocated by Royce under an administration agreement and are included in administrative and office facilities and legal expenses. The Trust has adopted a deferred fee agreement that allows the Trustees to defer the receipt of all or a portion of trustees’ fees otherwise payable. The deferred fees are invested in certain Royce Funds until distributed in accordance with the agreement.
COMPENSATING BALANCE CREDITS:
The Funds have arrangements with their custodian bank and transfer agent, whereby a portion of the custodian’s fee and transfer agent’s fee is paid indirectly by credits earned on a Fund’s cash on deposit with the bank and transfer agent. These deposit arrangements are an alternative to purchasing overnight investments. Conversely, a Fund pays interest to the custodian on any cash overdrafts, to the extent they are not offset by credits earned on positive cash balances.
LINE OF CREDIT:
The Funds, along with certain other Royce Funds, participate in a $65 million line of credit (“Credit Agreement”) with State Street Bank and Trust Company to be used for temporary or emergency purposes. This revolving Credit Agreement expires on October 9, 2020. Pursuant to the Credit Agreement, each participating Fund is liable for a portion of the commitment fee for the credit facility and for principal and interest payments related to borrowings made by that Fund. Borrowings under the Credit Agreement bear interest at a rate equal to the higher of the federal funds rate or One-Month LIBOR rate, plus 1.25%. The Funds did not utilize the line of credit during the year ended December 31, 2019.
22 | Royce Capital Fund 2019 Annual Report to Shareholders |
|
Capital Share Transactions (in shares):
| SHARES SOLD | SHARES ISSUED FOR REINVESTMENT OF DISTRIBUTIONS | SHARES REDEEMED | NET INCREASE (DECREASE) IN SHARES OUTSTANDING | |||||||||||||||||||||
| Year Ended | Year Ended | Year Ended | Year Ended | Year Ended | Year Ended | Year Ended | Year Ended | |||||||||||||||||
| 12/31/19 | 12/31/18 | 12/31/19 | 12/31/18 | 12/31/19 | 12/31/18 | 12/31/19 | 12/31/18 | |||||||||||||||||
| Micro-Cap Portfolio | ||||||||||||||||||||||||
| Investment Class | 1,027,456 | 1,819,499 | 1,230,597 | 714,268 | (2,926,998 | ) | (4,181,042 | ) | (668,945 | ) | (1,647,275 | ) | ||||||||||||
| Service Class | 1,716,087 | 801,841 | 259,748 | 83,201 | (800,434 | ) | (2,360,627 | ) | 1,175,401 | (1,475,585 | ) | |||||||||||||
| Small-Cap Portfolio | ||||||||||||||||||||||||
| Investment Class | 1,764,136 | 2,267,674 | 2,624,637 | 486,074 | (5,015,894 | ) | (7,004,964 | ) | (627,121 | ) | (4,251,216 | ) | ||||||||||||
| Service Class | 35,891,966 | 351,826 | 3,412,461 | 230,521 | (24,726,900 | ) | (17,851,746 | ) | 14,577,527 | (17,269,399 | ) | |||||||||||||
Investment Adviser and Distributor:
INVESTMENT ADVISER:
Under the Trust’s investment advisory agreements with Royce, Royce is entitled to receive investment advisory fees in respect of each Fund that are computed daily and payable monthly. Royce has contractually agreed, without right of termination, to waive fees and/or reimburse expenses (excluding brokerage commissions, taxes, interest, litigation expenses, acquired fund fees and expenses, and other expenses not borne in the ordinary course of business) to the extent necessary to maintain the Funds’ net annual operating expense ratios at specified levels through April 30, 2020, and is shown below to the extent that it impacted net expenses for the year ended December 31, 2019. See the Prospectus for contractual waiver expiration dates.
| ANNUAL CONTRACTUAL ADVISORY FEE AS A | COMMITTED NET ANNUAL OPERATING EXPENSE RATIO CAP1 | YEAR ENDED | |||||||||||
PERCENTAGE OF AVERAGE NET ASSETS | Investment Class1 | Service Class1 | Net advisory fees | Advisory fees waived | |||||||||
| Micro-Cap Portfolio | 1.25% | 1.33% | 1.58% | $ | 1,767,274 | $ | 82,461 | ||||||
| Small-Cap Portfolio | 1.00% | 1.08% | 1.33% | 3,083,041 | 125,890 | ||||||||
1Committed net annual operating expense ratio cap excludes acquired fund fees and expenses.
DISTRIBUTOR:
Royce Fund Services, LLC (“RFS”), the distributor of the Trust’s shares, is a wholly owned subsidiary of Royce. RFS is entitled to receive distribution fees from each Fund’s Service Class that are computed daily and payable monthly, at an annual rate of 0.25% of the average net assets of each Class. For the year ended December 31, 2019, Micro-Cap Portfolio-Service Class recorded distribution fees of $43,849 and Small-Cap Portfolio-Service Class recorded distribution fees of $375,151.
Purchases and Sales of Investment Securities:
For the year ended December 31, 2019, the costs of purchases and the proceeds from sales of investment securities, other than short-term securities and collateral received for securities loaned, were as follows:
| PURCHASES | SALES | |||||||
| Micro-Cap Portfolio | $ | 35,864,285 | $ | 53,156,539 | ||||
| Small-Cap Portfolio | 408,475,518 | 331,584,553 | ||||||
Cross trades were executed by the Funds pursuant to Rule 17a-7 under the 1940 Act. Cross trading is the buying or selling of portfolio securities between funds to which Royce serves as investment adviser. The Trust’s Chief Compliance Officer reviews such transactions each quarter for compliance with the requirements and restrictions set forth by Rule 17a-7, and reports the results of her review to the Board of Trustees. Cross trades for the year ended December 31, 2019, were as follows:
| COSTS OF PURCHASES | PROCEEDS FROM SALES | REALIZED GAIN (LOSS) | |||||||||||
| Micro-Cap Portfolio | $ | – | $ | 1,183,197 | $ | 1,055,324 | |||||||
Class Specific Expenses:
Class specific expenses were as follows for the year ended December 31, 2019:
| DISTRIBUTION FEES | SHAREHOLDER SERVICING | SHAREHOLDER REPORTS | TRANSFER AGENT BALANCE CREDITS | TOTAL | CLASS LEVEL | ||||||||||||||||||||
| Micro-Cap Portfolio – Investment Class | $ | – | $ | 7,870 | $ | 51,644 | $ | (182 | ) | $ | 59,332 | $ | 59,332 | ||||||||||||
| Micro-Cap Portfolio – Service Class | 43,849 | 6,817 | 6,679 | (75 | ) | 57,270 | 14,007 | ||||||||||||||||||
| 43,849 | 14,687 | 58,323 | (257 | ) | 73,339 | ||||||||||||||||||||
| Small-Cap Portfolio – Investment Class | – | 7,462 | 42,322 | (148 | ) | 49,636 | 49,636 | ||||||||||||||||||
| Small-Cap Portfolio – Service Class | 375,151 | 6,852 | 26,210 | (61 | ) | 408,152 | 31,875 | ||||||||||||||||||
| 375,151 | 14,314 | 68,532 | (209 | ) | 81,511 | ||||||||||||||||||||
| Royce Capital Fund 2019 Annual Report to Shareholders | 23 |
��
Notes to Financial Statements(continued)
TAX INFORMATION:
At December 31, 2019, net unrealized appreciation (depreciation) based on identified cost for tax purposes was as follows:
|
|
|
|
|
|
|
|
|
|
|
|
|
|
|
|
|
|
|
|
|
|
|
|
|
|
|
|
| NET UNREALIZED |
|
| GROSS UNREALIZED |
| ||||||||||
|
|
| TAX BASIS COST |
|
| APPRECIATION (DEPRECIATION) |
|
| Appreciation |
|
| Depreciation |
| ||||||||
Micro-Cap Portfolio |
|
| $ | 123,797,937 |
|
|
| $ | 34,616,384 |
|
|
| $ | 44,654,051 |
|
|
| $ | 10,037,667 |
|
|
Small-Cap Portfolio |
|
|
| 364,580,988 |
|
|
|
| 35,137,453 |
|
|
|
| 49,661,028 |
|
|
|
| 14,523,575 |
|
|
The primary causes of the difference between book and tax basis cost are the timing of the recognition of losses on securities sold and investments in Real Estate Investment Trusts.
Distributions during the years ended December 31, 2019 and 2018, were characterized as follows for tax purposes:
|
|
|
|
|
|
|
|
|
|
|
|
|
|
|
|
|
|
|
|
|
|
|
|
| ORDINARY INCOME |
|
| LONG-TERM CAPITAL GAINS |
| ||||||||||||||
|
|
| 2019 |
|
| 2018 |
|
| 2019 |
|
| 2018 |
| ||||||||
Micro-Cap Portfolio |
|
| $ | – |
|
|
| $ | 569,555 |
|
|
| $ | 14,178,235 |
|
|
| $ | 6,887,754 |
|
|
Small-Cap Portfolio |
|
|
| 12,963,882 |
|
|
|
| 1,850,693 |
|
|
|
| 35,503,482 |
|
|
|
| 3,919,389 |
|
|
The tax basis components of distributable earnings at December 31, 2019, were as follows:
|
|
|
|
|
|
|
|
|
|
|
|
|
|
|
|
|
|
|
|
|
|
|
|
|
|
|
|
|
|
|
|
|
|
|
| NET UNREALIZED |
|
|
|
|
| CAPITAL LOSS |
| ||||||||||
|
|
| UNDISTRIBUTED |
|
| UNDISTRIBUTED |
|
| APPRECIATION |
| TOTAL DISTRIBUTABLE |
| CARRYFORWARD |
| ||||||||||||
|
|
| ORDINARY INCOME |
|
| LONG-TERM CAPITAL GAINS |
|
| (DEPRECIATION)1 |
|
| EARNINGS |
|
| UTILIZED |
| ||||||||||
Micro-Cap Portfolio |
|
| $ | – |
|
|
| $ | 2,096,074 |
|
|
| $ | 34,613,710 |
|
|
| $ | 36,709,784 |
|
|
| $ | – |
|
|
Small-Cap Portfolio |
|
|
| 2,838,480 |
|
|
|
| 5,835,137 |
|
|
|
| 35,137,549 |
|
|
|
| 43,811,166 |
|
|
|
| – |
|
|
1Includes timing differences on foreign currency, recognition of losses on securities sold and investments in Real Estate Investment Trusts.
For financial reporting purposes, capital accounts and distributions to shareholders are adjusted to reflect the tax character of permanent book/tax differences. For the year ended December 31, 2019, the Funds recorded the following permanent reclassifications, which relate primarily to current net operating losses, foreign currency transactions and investments in Real Estate Investment Trusts. Results of operations and net assets were not affected by these reclassifications.
|
|
|
|
|
|
|
|
|
|
|
|
|
|
| TOTAL DISTRIBUTABLE |
|
| PAID-IN |
| ||||
|
|
| EARNINGS (LOSS) |
|
| CAPITAL |
| ||||
Micro-Cap Portfolio |
|
| $ | 663,621 |
|
|
| $ | (663,621 | ) |
|
Small-Cap Portfolio |
|
|
| – |
|
|
|
| – |
|
|
Management has analyzed the Funds’ tax positions taken on federal income tax returns for all open tax years (2016 – 2019) and has concluded that as of December 31, 2019, no provision for income tax is required in the Funds’ financial statements.
Subsequent Events:
Subsequent events have been evaluated through the date the financial statements were issued.
24 | Royce Capital Fund 2019 Annual Report to Shareholders
Report of Independent Registered Public Accounting Firm
To the Board of Trustees of Royce Capital Fund and Shareholders of Royce Capital Fund – Micro-Cap Portfolio and Royce Capital Fund – Small-Cap Portfolio:
Opinions on the Financial Statements
We have audited the accompanying statements of assets and liabilities, including the schedules of investments, of Royce Capital Fund – Micro-Cap Portfolio and Royce Capital Fund – Small-Cap Portfolio (constituting Royce Capital Fund, hereafter collectively referred to as the “Funds”) as of December 31, 2019, the related statements of operations for the year ended December 31, 2019, the statements of changes in net assets for each of the two years in the period ended December 31, 2019, including the related notes, and the financial highlights for each of the five years in the period ended December 31, 2019 (collectively referred to as the “financial statements”). In our opinion, the financial statements present fairly, in all material respects, the financial position of each of the Funds as of December 31, 2019, the results of each of their operations for the year then ended, the changes in each of their net assets for each of the two years in the period ended December 31, 2019 and each of the financial highlights for each of the five years in the period ended December 31, 2019 in conformity with accounting principles generally accepted in the United States of America.
Basis for Opinions
These financial statements are the responsibility of the Funds’ management. Our responsibility is to express an opinion on the Funds’ financial statements based on our audits. We are a public accounting firm registered with the Public Company Accounting Oversight Board (United States) (PCAOB) and are required to be independent with respect to the Funds in accordance with the U.S. federal securities laws and the applicable rules and regulations of the Securities and Exchange Commission and the PCAOB.
We conducted our audits of these financial statements in accordance with the standards of the PCAOB. Those standards require that we plan and perform the audit to obtain reasonable assurance about whether the financial statements are free of material misstatement, whether due to error or fraud.
Our audits included performing procedures to assess the risks of material misstatement of the financial statements, whether due to error or fraud, and performing procedures that respond to those risks. Such procedures included examining, on a test basis, evidence regarding the amounts and disclosures in the financial statements. Our audits also included evaluating the accounting principles used and significant estimates made by management, as well as evaluating the overall presentation of the financial statements. Our procedures included confirmation of securities owned as of December 31, 2019 by correspondence with the custodian and brokers; when replies were not received from brokers, we performed other auditing procedures. We believe that our audits provide a reasonable basis for our opinions.
/s/PricewaterhouseCoopers LLP
New York, New York
February 12, 2020
We have served as the auditor of one or more investment companies in the Royce investment company group since at least 1967. We have not been able to determine the specific year we began serving as auditor.
| Royce Capital Fund 2019 Annual Report to Shareholders | 25 |
Understanding Your Fund’s Expenses(unaudited)
As a shareholder of a mutual fund, you pay ongoing expenses, including management fees and other Fund expenses including, for some funds, distribution and/or service (12b-1) fees. Using the information below, you can estimate how these ongoing expenses (in dollars) affect your investment and compare them with the ongoing expenses of other funds. You may also incur one-time transaction expenses which are not shown in this section and would result in higher total costs. The example is based on an investment of $1,000 invested at July 1, 2019, and held for the entire six-month period ended December 31, 2019. Service Class shares are generally available only through certain insurance companies who receive service fees from the Fund for services that they perform.
Actual Expenses
The first part of the table below provides information about actual account values and actual expenses. You may use the information in this section, together with the amount you invested, to estimate the expenses that you paid over the period. Simply divide your account value at December 31, 2019, by $1,000 (for example, an $8,600 account value divided by $1,000 = 8.6), then multiply the result by the number under the heading entitled “Expenses Paid During the Period” to estimate the expenses you paid on your account during this period.
Hypothetical Example for Comparison Purposes
The second part of the table below provides information about hypothetical account values and hypothetical expenses based on the Fund’s actual expense ratio and an assumed rate of return of 5% per year before expenses, which is not the Fund’s actual return. The hypothetical account values and expenses may not be used to estimate the actual ending account balance or expenses you paid for the period. You may use this information to compare the ongoing costs of investing in the Fund and other funds. To do so, compare this 5% hypothetical example with the 5% hypothetical examples that appear in the shareholder reports of the other funds.
Please note that the expenses shown in the table are meant to highlight your ongoing costs only and do not reflect any transactional costs, such as sales charges (loads), redemption fees, or exchange fees. Therefore, this section is useful in comparing ongoing costs only, and will not help you determine the relative total costs of owning different funds. In addition, if these transactional costs were included, your costs would have been higher.
|
| ACTUAL | HYPOTHETICAL (5% PER YEAR BEFORE EXPENSES) | |||||||||||||||||||||||||||||||
|
| Beginning |
| Ending |
| Expenses Paid During the Period1 |
| Beginning |
| Ending |
| Expenses Paid |
| Annualized | ||||||||||||||||||||
Investment Class |
|
|
|
|
|
|
|
|
|
|
|
|
|
|
|
|
|
|
|
|
|
| ||||||||||||
Micro-Cap Portfolio |
| $ |
| 1,000.00 |
|
| $ |
| 1,079.93 |
|
| $ |
| 6.97 |
|
| $ |
| 1,000.00 |
|
| $ |
| 1,018.50 |
|
| $ |
| 6.77 |
|
|
| 1.33 | % |
Small-Cap Portfolio |
|
|
| 1,000.00 |
|
|
|
| 1,093.56 |
|
|
|
| 5.70 |
|
|
|
| 1,000.00 |
|
|
|
| 1,019.76 |
|
|
|
| 5.50 |
|
|
| 1.08 | % |
Service Class |
|
|
|
|
|
|
|
|
|
|
|
|
|
|
|
|
|
|
|
|
|
|
|
|
|
|
|
|
|
|
|
|
|
|
Micro-Cap Portfolio |
|
|
| 1,000.00 |
|
|
|
| 1,078.39 |
|
|
|
| 8.28 |
|
|
|
| 1,000.00 |
|
|
|
| 1,017.24 |
|
|
|
| 8.03 |
|
|
| 1.58 | % |
Small-Cap Portfolio |
|
|
| 1,000.00 |
|
|
|
| 1,092.08 |
|
|
|
| 7.01 |
|
|
|
| 1,000.00 |
|
|
|
| 1,018.50 |
|
|
|
| 6.77 |
|
|
| 1.33 | % |
| 1 | Expenses are equal to the Fund’s annualized expense ratio multiplied by the average account value for the period, multiplied by 184 days in the most recent fiscal half-year divided by 365 days (to reflect the half-year period). This information does not include fees or expenses of the variable annuity contracts investing in the Fund. |
| 2 | Annualized expense ratio used to derive figures in the table is based on the most recent fiscal half-year. |
Federal Tax Information
In January 2020, taxable shareholders were mailed a Form 1099-DIV reporting the federal tax status of all distributions paid during the calendar year 2019.
2019 Supplemental Tax Information:
FUND |
|
| % |
|
| % U.S. GOVT |
|
| % INCOME QUALIFYING |
| LONG-TERM CAPITAL GAIN DISTRIBUTION |
| |||
Micro-Cap Portfolio |
|
| 0.00% |
|
| N/A |
|
| 0.00% |
|
| $ | 14,178 |
|
|
Small-Cap Portfolio |
|
| 52.84% |
|
| N/A |
|
| 45.67% |
|
|
| 35,503 |
|
|
Definitions:
% QDI:Qualified Dividend Income; % of net investment income and/or short-term capital gains distributions that qualify for treatment at long-term capital gain rates.
% U.S. Govt Income:% of investment income paid from U.S. Government obligations.
% Income Qualifying for DRD:% of investment income eligible for the corporate dividend received deduction.
26 | Royce Capital Fund 2019 Annual Report to Shareholders
All Trustees and Officers may be reached c/o The Royce Funds, 745 Fifth Avenue, New York, NY 10151
Charles M. Royce, Director1
Age: 80|Number of Funds Overseen: 16|Tenure: Since 1982
Non-Royce Directorships:Director of Oxford Square Capital Corp.
Principal Occupation(s) During Past Five Years:A member of the Board of Managers of Royce & Associates, LP (“Royce”), the Trust’s investment adviser; Chief Executive Officer (1972–June 2016), President (1972-June 2014) of Royce.
Christopher D. Clark, Director1, President
Age: 54|Number of Funds Overseen: 16|Tenure: Since 2014
Principal Occupation(s) During Past Five Years:Chief Executive Officer (since July 2016), President (since July 2014), Co-Chief Investment Officer (Since January 2014), Managing Director of Royce, a Member of the Board of Managers of Royce, having been employed by Royce since May 2007.
Patricia W. Chadwick, Director
Age: 71|Number of Funds Overseen: 16|Tenure: Since 2009
Non-Royce Directorships:Trustee of Voya Mutual Funds and Director of Wisconsin Energy Corp.
Principal Occupation(s) During Past 5 Years:Consultant and President of Ravengate Partners LLC (since 2000).
Christopher C. Grisanti, Director
Age: 58|Number of Funds Overseen: 16|Tenure: Since 2017
Non-Royce Directorships:None
Principal Occupation(s) During Past Five Years:Co-Founder and Chief Executive Officer of Grisanti Capital Management LLC, an investment advisory firm (since 1999). Mr. Grisanti’s prior business experience includes serving as Director of Research and Portfolio Manager at Spears Benzak, Salomon & Farrell (from 1994 to 1999) and a senior associate at the law firm of Simpson, Thacher & Bartlett (from 1988 to 1994).
Stephen L. Isaacs, Director2
Age: 80|Number of Funds Overseen: 16|Tenure: Since 1989
Non-Royce Directorships:None
Principal Occupation(s) During Past Five Years:Attorney and President of Health Policy Associates, Inc., consultants. Mr. Isaacs’s prior business experience includes having served as President of the Center for Health and Social Policy (from 1996 to 2012); Director of Columbia University Development Law and Policy Program and Professor at Columbia University (until August 1996).
Arthur S. Mehlman, Director
Age: 77|Number of Funds Overseen: 36|Tenure: Since 2004
Non-Royce Directorships:Director/Trustee of registered investment companies constituting the 19 Legg Mason Funds.
Principal Occupation(s) During Past Five Years:Director of The League for People with Disabilities, Inc.; Director of University of Maryland Foundation (non-profits). Formerly: Director of Municipal Mortgage & Equity, LLC (from October 2004 to April 1, 2011); Director of University of Maryland College Park Foundation (non-profit) (from 1998 to 2005); Partner, KPMG LLP (international accounting firm) (from 1972 to 2002); Director of Maryland Business Roundtable for Education (from July 1984 to June 2002).
David L. Meister, Director2
Age: 80|Number of Funds Overseen: 16|Tenure: Since 1982
Non-Royce Directorships:None
Principal Occupation(s) During Past Five Years:Consultant. Chairman and Chief Executive Officer of The Tennis Channel (from June 2000 to March 2005). Mr. Meister’s prior business experience includes having served as Chief Executive Officer of Seniorlife.com, a consultant to the communications industry, President of Financial News Network, Senior Vice President of HBO, President of Time-Life Films, and Head of Broadcasting for Major League Baseball.
G. Peter O’Brien, Director
Age: 74|Number of Funds Overseen: 36|Tenure: Since 2001
Non-Royce Directorships:Director/Trustee of registered investment companies constituting the 19 Legg Mason Funds.
Principal Occupation(s) During Past Five Years:Trustee Emeritus of Colgate University (since 2005); Board Member of Hill House, Inc. (since 1999); Formerly Director of TICC Capital Corp (from 2003-2017): Trustee of Colgate University (from 1996 to 2005), President of Hill House, Inc. (from 2001 to 2005) and Managing Director/Equity Capital Markets Group of Merrill Lynch & Co. (from 1971 to 1999).
Michael K. Shields, Director
Age: 61|Number of Funds Overseen: 16|Tenure: Since 2015
Principal Occupation(s) During Past Five Years:President and Chief Executive Officer of Piedmont Trust Company, a private North
Carolina trust company (since May 2012). Mr. Shields’s prior business experience includes owning Shields Advisors, an investment consulting firm (from April 2010 to June 2012).
Francis D. Gannon, Vice President
Age: 52|Tenure: Since 2014
Principal Occupation(s) During Past Five Years:Co-Chief Investment Officer (since January 2014) and Managing Director of Royce, having been employed by Royce since September 2006.
Daniel A. O’Byrne, Vice President
Age: 57|Tenure: Since 1994
Principal Occupation(s) During Past Five Years:Principal and Vice President of Royce, having been employed by Royce since October 1986.
Peter K. Hoglund, Treasurer
Age: 53|Tenure: Since 2015
Principal Occupation(s) During Past Five Years:Chief Financial Officer, Chief Administrative Officer, and Managing Director of Royce, having been employed by Royce since December 2014. Prior to joining Royce, Mr. Hoglund spent more than 20 years with Munder Capital Management in Birmingham, MI, serving as Managing Director and Chief Financial Officer and overseeing all financial aspects of the firm. He began his career at Munder as a portfolio manager.
John E. Denneen, Secretary and Chief Legal Officer
Age: 52|Tenure: 1996-2001 and Since 2002
Principal Occupation(s) During Past Five Years:General Counsel, Managing Director, and, since June 2015, a Member of the Board of Managers of Royce. Chief Legal and Compliance Officer and Secretary of Royce.
Lisa Curcio, Chief Compliance Officer
Age: 60|Tenure: Since 2004
Principal Occupation(s) During Past Five Years:Chief Compliance Officer of The Royce Funds (since October 2004) and Compliance Officer of Royce (since June 2004).
2Retired effective December 31, 2019.
Trustees will hold office until their successors have been duly elected and qualified or until their earlier resignation or removal. The Statement of Additional Information, which contains additional information about the Trust’s trustees and officers, is available and can be obtained without charge at www.royceinvest.com or by calling (800) 221-4268.
Royce Capital Fund2019 Annual Report to Shareholders|27
Notes to Performance and Other Important Information
The thoughts expressed in this report concerning recent market movements and future prospects for small company stocks are solely the opinion of Royce at December 31, 2019, and, of course, historical market trends are not necessarily indicative of future market movements. Statements regarding the future prospects for particular securities held in the Funds’ portfolios and Royce’s investment intentions with respect to those securities reflect Royce’s opinions as of December 31, 2019 and are subject to change at any time without notice. There can be no assurance that securities mentioned in this report will be included in any Royce-managed portfolio in the future.
Sector weightings are determined using the Global Industry Classification Standard (“GICS”). GICS was developed by, and is the exclusive property of, Standard & Poor’s Financial Services LLC (“S&P”) and MSCI Inc. (“MSCI”). GICS is the trademark of S&P and MSCI. “Global Industry Classification Standard (GICS)” and “GICS Direct” are service marks of S&P and MSCI.
All indexes referenced are unmanaged and capitalization weighted. Each index’s returns include net reinvested dividends and/or interest income. Frank Russell Company (“Russell”) is the source and owner of the trademarks, service marks and copyrights related to the Russell Indexes. Russell® is a trademark of Frank Russell Company. Neither Russell nor its licensors accept any liability for any errors or omissions in the Russell Indexes and/or Russell ratings or underlying data and no party may rely on any Russell Indexes and/or Russell ratings and/or underlying data contained in this communication. No further distribution of Russell Data is permitted without Russell’s express written consent. Russell does not promote, sponsor or endorse the content of this communication. The Russell 2000 is an index of domestic small-cap stocks. It measures the performance of the 2,000 smallest publicly traded U.S. companies in the Russell 3000 Index. The Russell 2000 Value and Growth Indexes consist of the respective value and growth stocks within the Russell 2000 as determined by Russell Investments. The Russell Microcap Index includes 1,000 of the smallest securities in the small-cap Russell 2000 Index along with the next smallest eligible securities as determined by Russell. The Russell 1000 Index is an index of domestic large-cap stocks. It measures the performance of the 1,000 publicly traded U.S. companies in the Russell 3000 Index. The Russell Top 50 Mega Cap Index is an index of domestic mega-cap stocks that measures the performance of the 50 largest publicly traded U.S. companies in the Russell 3000 Index. The performance of an index does not represent exactly any particular investment, as you cannot invest directly in an index. Returns for the market indexes used in this report were based on information supplied to Royce by Russell Investments. Royce has not independently verified the above described information. The ISM Manufacturing Index monitors employment, production, inventories, new orders and supplier deliveries.
The Price-Earnings, or P/E, Ratio is calculated by dividing a company’s share price by its trailing 12-month earnings-per-share (EPS). The Price-to-Book, or P/B, Ratio is calculated by dividing a company’s share price by its book value per share. Standard deviation is a statistical measure within which a fund’s total returns have varied over time. The greater the standard deviation, the greater a fund’s volatility. The Morningstar Style Map uses proprietary scores of a stock’s value and growth characteristics to determine its placement in one of the five categories listed on the horizontal axis. These characteristics are then compared to those of other stocks within the same market capitalization band. Each is scored from zero to 100 for both value and growth attributes. The value score is subtracted from the growth score to determine the overall style score. For the vertical, market cap axis, Morningstar subdivides into size groups. Giant-cap stocks are defined as those that account for the top 40% of the capitalization of each style zone; large-cap stocks represent the next 30%; mid-cap stocks the next 20%; small-cap stocks the next 7%; micro-cap stocks the smallest 3%. Standard deviation is a statistical measure within which a fund’s total returns have varied over time. The greater the standard deviation, the greater a fund’s volatility. The value score is subtracted from the growth score to determine the overall style score. Cyclical and Defensive are defined as follows: Cyclical: Communication Services, Consumer Discretionary, Energy, Financials, Industrials, Information Technology, and Materials. Defensive: Consumer Staples, Health Care, Real Estate, and Utilities. The Royce Funds is a service mark of The Royce Funds. Distributor: Royce Fund Services, LLC.
Royce Capital Fund–Micro-Cap Portfolio invests primarily in securities of micro-cap companies and Royce Capital Fund–Small-Cap Portfolio invests primarily in securities of small-cap companies. Investments in these types of companies may involve considerably more risk than investments in securities of larger-cap companies. (Please see “Primary Risks for Fund Investors” in the prospectus.) Royce Capital Fund–Micro-Cap Portfolio and Royce Capital Fund–Small-Cap Portfolio may each invest up to 25% its assets in foreign securities that may involve political, economic, currency, and other risks not encountered in U.S. investments. (Please see “Investing in Foreign Securities” in the prospectus.) A Fund that invests a significant portion of its assets in a limited number of stocks may be subject to considerably more risk than a more broadly diversified Fund because a decline in the value of any of these stocks would cause that Fund’s overall value to decline to a greater degree. A broadly diversified portfolio does not, however, ensure a profit for a Fund or guarantee against loss. Please read the prospectus carefully before investing or sending money. A copy of the Funds’ current prospectus and a Statement of Additional Information may be obtained by calling (800) 221-4268 or by visiting www.royceinvest.com. All publicly released material Fund information is disclosed by the Funds on their website at www.royceinvest.com.
Forward-Looking Statements
This material contains forward-looking statements within the meaning of the Securities Exchange Act of 1934, as amended (the “Exchange Act”), that involve risks and uncertainties, including, among others, statements as to:
| • | the Funds’ future operating results, |
| • | the prospects of the Funds’ portfolio companies, |
| • | the impact of investments that the Funds have made or may make, |
| • | the dependence of the Funds’ future success on the general economy and its impact on the companies and industries in which the Funds invest, and |
| • | the ability of the Funds’ portfolio companies to achieve their objectives. |
This review and report use words such as “anticipates,” “believes,” “expects,” “future,” “intends,” and similar expressions to identify forward-looking statements. Actual results may differ materially from those projected in the forward-looking statements for any reason.
The Royce Funds have based the forward-looking statements included in this review and report on information available to us on the date of the report, and we assume no obligation to update any such forward-looking statements. Although The Royce Funds undertake no obligation to revise or update any forward-looking statements, whether as a result of new information, future events, or otherwise, you are advised to consult any additional disclosures that we may make through future shareholder communications or reports.
Proxy Voting
A copy of the policies and procedures that The Royce Funds use to determine how to vote proxies relating to portfolio securities and information regarding how each of The Royce Funds voted proxies relating to portfolio securities during the most recent 12-month period ended June 30 is available, without charge, on The Royce Funds’ website at www.royceinvest.com, by calling (800) 221-4268 (toll-free), and on the website of the Securities and Exchange Commission (“SEC”) at www.sec.gov.
Disclosure of Portfolio Holdings
The Funds’ complete portfolio holdings are also available on Exhibit F to Form N-PORT, which filings are made with the SEC within 60 days of the end of the first and third fiscal quarters. The Funds’ Form N-PORT filings are available on the SEC’s website at http://www.sec.gov.
28|Royce Capital Fund2019 Annual Report to Shareholders
This page is intentionally left blank.
| About Royce Investment Partners | Contact Us | |||
Unparalleled Knowledge + Experience | GENERAL INFORMATION | |||
| Pioneers in small-cap investing, with 45+ years of experience, depth of knowledge, and focus. | Additional Report Copies and Prospectus Inquiries (800) 221-4268 | |||
| Independent Thinking | ||||
| The confidence to go against consensus, the insight to uncover opportunities others might miss, and the tenacity to stay the course through market cycles. | ||||
| Specialized Approaches | ||||
| U.S., international, and global investment strategies that pursue approaches with different risk profiles. | ||||
| Unwavering Commitment | ||||
| Our team of 17 portfolio managers has significant personal investments in the strategies they manage. | ||||
 |  | |||
RCF-REP-1219 | ||||
Item 2. Code(s) of Ethics. As of the end of the period covered by this report, the Registrant had adopted a code of ethics, as defined in Item 2 of Form N-CSR, applicable to its principal executive officer, principal financial officer, principal accounting officer or controller, or persons performing similar functions. A copy of this code of ethics is filed as an exhibit to this Form N-CSR. No substantive amendments were approved or waivers were granted to this code of ethics during the period covered by this report.
Item 3. Audit Committee Financial Expert.
| (a)(1) | The Board of Trustees of the Registrant has determined that it has an audit committee financial expert. |
| (a)(2) | Arthur S. Mehlman and Patricia W. Chadwick were designated by the Board of Trustees as the Registrant’s Audit Committee Financial Experts, effective April 15, 2004 and April 8, 2010, respectively. Mr. Mehlman and Ms. Chadwick are “independent” as defined under Item 3 of Form N-CSR. |
Item 4. Principal Accountant Fees and Services.
| (a) | Audit Fees: |
Year ended December 31, 2019 - $43,933
Year ended December 31, 2018 - $43,072
| (b) | Audit-Related Fees: |
Year ended December 31, 2019 - $0
Year ended December 31, 2018 - $0
| (c) | Tax Fees: |
Year ended December 31, 2019 - $18,748 – Preparation of tax returns and excise tax review
Year ended December 31, 2018 - $18,380 – Preparation of tax returns and excise tax review
| (d) | All Other Fees: |
Year ended December 31, 2019 - $0
Year ended December 31, 2018 - $0
(e)(1)Annual Pre-Approval: On an annual basis, the Registrant’s independent auditor submits to the Audit Committee a schedule of proposed audit, audit-related, tax and other non-audit services to be rendered to the Registrant and/or investment adviser(s) for the following year that require pre-approval by the Audit Committee. This schedule provides a description of each type of service that is expected to require pre-approval and the maximum fees that can be paid for each such service without further Audit Committee approval. The Audit Committee then reviews and determines whether to approve the types of scheduled services and the projected fees for them. Any subsequent revision to already pre-approved services or fees (including fee increases) are presented for consideration at the next regularly scheduled Audit Committee meeting, as needed.
If subsequent to the annual pre-approval of services and fees by the Audit Committee, the Registrant or one of its affiliates determines that it would like to engage the Registrant’s independent auditor to perform a service not already pre-approved, the request is to be submitted to the Registrant’s Chief Financial Officer, and if he or she determines that the service fits within the independence guidelines (e.g., it is not a prohibited service), he or she will then arrange for a discussion of the proposed service and fee to be included on the agenda for the next regularly scheduled Audit Committee meeting so that pre-approval can be considered.
Interim Pre-Approval: If, in the judgment of the Registrant's Chief Financial Officer, a proposed engagement needs to commence before the next regularly scheduled Audit Committee meeting, he or she shall submit a written summary of the proposed engagement to all members of the Audit Committee, outlining the services, the estimated maximum cost, the category of the services (e.g., audit, audit-related, tax or other) and the rationale for engaging the Registrant’s independent auditor to perform the services. To the extent the proposed engagement involves audit, audit-related or tax services, any individual member of the Audit Committee who is an independent Board member is authorized to pre-approve the engagement. To the extent the proposed engagement involves non-audit services other than audit-related or tax, the Chairman of the Audit Committee is authorized to pre-approve the engagement. The Registrant’s Chief Financial Officer will arrange for this interim review and coordinate with the appropriate member(s) of the Committee. The independent auditor may not commence the engagement under consideration until the Registrant’s Chief Financial Officer has informed the auditor in writing that pre-approval has been obtained from the Audit Committee or an individual member who is an independent Board member. The member of the Audit Committee who pre-approves any engagements in between regularly scheduled Audit Committee meetings is to report, for informational purposes only, any pre-approval decisions to the Audit Committee at its next regularly scheduled meeting.
| (e)(2) | Not Applicable |
| (f) | Not Applicable |
| (g) | Year ended December 31, 2019 - $18,748 |
Year ended December 31, 2018 - $18,380
| (h) | No such services were rendered during 2019 or 2018. |
Item 5. Audit Committee of Listed Registrants.Not Applicable.
Item 6. Investments.
(a) See Item 1.
(b) Not Applicable
Item 7. Disclosure of Proxy Voting Policies and Procedures for Closed-End Management Investment Companies.Not Applicable.
Item 8. Portfolio Managers of Closed-End Management Investment Companies.Not Applicable.
Item 9. Purchases of Equity Securities by Closed-End Management Investment Company and Affiliated Purchasers.Not Applicable
Item 10. Submission of Matters to a Vote of Security Holders.Not Applicable.
Item 11. Controls and Procedures.
(a) Disclosure Controls and Procedures. The Principal Executive and Financial Officers concluded that the Registrant's Disclosure Controls and Procedures are effective based on their evaluation of the Disclosure Controls and Procedures as of a date within 90 days of the filing date of this report.
(b) Internal Control over Financial Reporting. There were no significant changes in Registrant's internal control over financial reporting or in other factors that could significantly affect this control subsequent to the date of the evaluation, including any corrective actions with regard to significant deficiencies and material weaknesses during the period covered by this report.
Item 12. Exhibits. Attached hereto.
(a)(1) The Registrant’s code of ethics pursuant to Item 2 of Form N-CSR.
(a)(2) Separate certifications by the Registrant’s Principal Executive Officer and Principal Financial Officer as required by Rule 30a-2(a) under the Investment Company Act of 1940.
(a)(3) Not Applicable
(b) Separate certifications by the Registrant’s Principal Executive Officer and Principal Financial Officer, pursuant to Section 906 of the Sarbanes-Oxley Act of 2002 and required by Rule 30a-2(b) under the Investment Company Act of 1940.
Pursuant to the requirements of the Securities Exchange Act of 1934 and the Investment Company Act of 1940, the registrant has duly caused this report to be signed on its behalf by the undersigned, thereunto duly authorized.
ROYCE CAPITAL FUND
| BY: | /s/ Christopher D. Clark | |
| Christopher D. Clark | ||
| President |
Date: February 27, 2020
Pursuant to the requirements of the Securities Exchange Act of 1934 and the Investment Company Act of 1940, this report has been signed below by the following persons on behalf of the registrant and in the capacities and on the dates indicated.
| ROYCE CAPITAL FUND | ROYCE CAPITAL FUND | |||
| BY: | /s/ Christopher D. Clark | BY: | /s/ Peter K. Hoglund | |
| Christopher D. Clark | Peter K. Hoglund | |||
| President | Treasurer | |||
| Date: February 27, 2020 | Date: February 27, 2020 | |||