UNITED STATES
SECURITIES AND EXCHANGE COMMISSION
Washington, D.C. 20549
FORM N-CSR
CERTIFIED SHAREHOLDER REPORT
OF
REGISTERED MANAGEMENT INVESTMENT COMPANIES
Investment Company Act File Number: 811-07537
Name of Registrant: Royce Capital Fund
Address of Registrant: 745 Fifth Avenue
New York, NY 10151
Name of agent for service: John E. Denneen, Esquire
Address of agent for service: 745 Fifth Avenue
New York, NY 10151
Registrant's telephone number, including area code: (212) 508-4500
Date of fiscal year end: December 31
Date of reporting period: January 1, 2021 – December 31, 2021
| Item 1. | Reports to Shareholders. |

Royce Capital Fund 2021 Annual
Review and Report to Shareholders
December 31, 2021
Royce Capital Fund–Micro-Cap Portfolio
Royce Capital Fund–Small-Cap Portfolio

Table of Contents

| | This page is not part of the Royce Capital Fund 2021 Annual Report to Shareholders | 1 |
Letter to Our Shareholders

THE BEAR IS BACK—NOW WHAT?
2021 was a year of decelerating optimism for many small-cap investors as performance momentum slowed as the weeks passed by between April and December. With the benefit of a late January vantagepoint, we can now see that decreasing market momentum, increasing concerns about inflation throughout the last nine months of 2021, and a significant Fed pivot all foreshadowed a sharp small-cap decline to start 2022. So while the Russell 2000 Index enjoyed a strong year on an absolute basis, rising 14.8%, nearly all of the year’s gain came in the first quarter, when the Russell 2000 climbed 12.7%. Following this strong and promising start, the small-cap index gained only 1.9% from the second through the fourth quarter of 2021. Having so little to show for the last nine months was even more frustrating in light of the generally strong earnings growth from small-cap companies, many of which also raised guidance or offered optimistic outlooks in the second half of 2021.
Bigger Was Better After 2021’s First Quarter
1Q21 Returns and 2Q21-4Q21 for the Russell 2000 and Russell 1000 Indexes

In addition to the disappointment felt by making little progress after a strong start, small-cap investors also saw the asset class progressively cede its wide first-quarter lead over large-caps, with the Russell 2000 finishing the year substantially behind the large-cap Russell 1000 Index’s 26.5% advance in 2021. We suspect that many investors turned to mega-cap stocks during the year in a ‘flight to safety’ as concerns about the Omicron variant and the pace of economic growth emerged, especially when interest rates were still so low. As the early results in 2022 have indicated, we expect these same mega-cap stocks to struggle going forward because their valuations are particularly vulnerable to higher inflation, rising interest rates, and constrained liquidity.
Regardless of the more recent struggles for equities of all capitalization sizes, we recognize that it may seem odd to characterize small-cap investors as feeling let down after a year that provided a healthy 14.8% return—while also marking a third consecutive year of double-digit positive performance for the Russell 2000. Yet we are cognizant that 2021 might feel like a year of unfulfilled promise for many of these investors. After all, 2021 did begin with an ample dose of confidence in both the absolute and relative returns for the Russell 2000—which was rewarded in the first quarter. However, a closer look at small-cap returns in 2021 suggests that one’s perspective on the year probably differs considerably depending on how heavily an investor leaned towards small-cap value or small-cap growth.
| 2 | This page is not part of the Royce Capital Fund 2021 Annual Report to Shareholders | Past performance is no guarantee of future results. |
LETTER TO OUR SHAREHOLDERS
VALUE: SMALL-CAP’S HAPPY EXCEPTION
The best news for small-cap investors in 2021 arguably came from value stocks. The Russell 2000 Value Index had a wonderful year— advancing 28.3% (thus beating the Russell 1000). The small-cap value index also walloped the Russell 2000 Growth Index, which was up a paltry 2.8% for the year. 2021 marked the first calendar-year outperformance for the Russell 2000 Value over its small-cap growth sibling since 2016. We think small-cap value is just starting to flex its relative performance muscles, as it were, and we see three reasons to be optimistic about small-cap value’s prospects. First, in spite of the strength it’s shown since the fourth quarter of 2020, the Russell 2000 Value’s annualized three- and five-year returns still trailed those for its growth sibling at the end of 2021—by a significant amount on the five-year number. Equally important, this result stands in stark contrast to the average return spread for all five-year periods since 1979, which is about 300 basis points in favor of small-cap value. Based on history, then, it appears that the Russell 2000 Value has further to go before fully reverting to its historical outperformance of the Russell 2000 Growth over multi-year periods. This also suggests that the difficult times for small-cap growth investors may persist longer than its adherents would like.
Small-Cap Growth’s Recent 5-Year Outperformance Contrasts with Historical Pattern
As of 12/31/21

ADVANTAGE VALUE?
A second reason underscoring our confidence in the ongoing leadership for small-cap value is that significant differences exist in economic exposures among value and growth portfolios, which are mirrored by the meaningful divergences in composition between the two small-cap styles indexes. Looking into each index’s composition reveals certain factors that help explain why returns often have varied so much between the two style indexes over the last 40-plus years. The two industry groups where
the Russell 2000 Value is most overweight compared with the Russell 2000 Growth are banks and real estate, both traditional beneficiaries of inflation and cyclical activity. These industry groups, banks in particular, often have high exposures in active small-cap value portfolios. Conversely, the three industry groups where the Russell 2000 Value is most underweight—software & services; pharmaceuticals, biotechnology & life sciences; and health care equipment & services—are areas that have historically struggled in inflationary environments and tend not to participate in cyclical expansions. Notably, these three areas also have a large percentage of non-earning companies, and we expect that the forthcoming market environment of reduced liquidity will be much less supportive of non-earners than most of the past 10 years have been. We’ve also observed that these three areas are often lower weighted in active small-cap value portfolios. This compositional analysis corroborates our expectation that an economic environment of above-average growth and higher-than-average inflation is likely to favor the overweighted areas within small-cap value and create headwinds for those groups with greater exposure within small-cap growth.
Russell 2000 Value vs Russell 2000 Growth Top Three Underweights and Overweights by Industry Group
As of 12/31/21

Finally, as we have noted elsewhere, despite its significant outperformance, small-cap value is still priced near the bottom of its 20-year valuation range compared with small-cap growth, as measured by one of our preferred valuation metrics, the median last 12 months’ enterprise value over earnings before interest & taxes (LTM EV/EBIT), excluding companies with negative EBIT. For all these reasons, we think small-cap value may have many years left in its current outperformance trend.
| Past performance is no guarantee of future results. | This page is not part of the Royce Capital Fund 2021 Annual Report to Shareholders | 3 |
LETTER TO OUR SHAREHOLDERS
IN THE SHADOW OF THE BEAR
As of this writing, of course, most investors are wondering—and worrying—about the correction that pushed small-caps into bear territory (a decline of 20% or more). The Russell 2000 fell 20.7% from its most recent peak on 11/8/21 through 1/27/22, as share price weakness broadened and deepened considerably in January. The speed of this descent—just 49 days between the 52-week high in early November and its initial 52-week low in January—was the fourth fastest such move in the Russell 2000’s history. A genuinely startling fall, though steep, sharp declines have been more common than not since the Financial Crisis.
As we seek to understand the market’s latest movements, we think it’s important to note that bond market signals have yet to move in the direction they often took in prior equity declines—bond yields commonly fall, and high-yield spreads widen when there are heightened concerns about future economic growth. We have seen neither so far in 2022. The contrast between the dramatic volatility of stocks and the nonplussed reaction of the bond market leads us to view this decline as a resetting of equity valuations rather than an increased concern about, or signal of, recession. Even more important, this latter view is corroborated by our recent conversations with company managements, where their largest challenges remain supply channel issues and the shortage of skilled workers to keep pace with the demand these companies are seeing.
Still, in our view, it’s significant that the Federal Reserve is making such a consequential pivot—from extraordinary monetary accommodation to mitigate the effects of COVID to more aggressive, and opposite, actions in an attempt to tame inflation. Liquidity and inflation are therefore now center stage. They have pushed Omicron and the pace of GDP growth toward the wings, though it is fair to say that all these developments (along with lingering supply chain issues) are interrelated. Indeed, periods like the present offer a reminder, however sobering, that, while equity markets are connected to the economy the Fed functions in large part as the connective
tissue between the two because it’s the gatekeeper of liquidity. The consequence of this interrelationship is that any major move from the Fed will spur volatility. The central bank’s newest policies constitute two significant reversals—the shift from keeping a lid on rates to raising them and the move away from keeping the capital markets awash in liquidity to limiting it. After being in place for most of the last decade, these related Fed policy reversals happened in comparably short order, and thus it’s not surprising that the market has been reacting in an extreme fashion. From our perspective as experienced small-cap investors, this downturn is not about company fundamentals—it’s about valuations and liquidity. The days of generous monetary policy driving multiple expansion are over. It made sense to us, then, that more speculative assets— cryptocurrencies and growth stocks, for instance—experienced some of the most negative reactions to the Fed’s policy shift.
Importantly, if we are correct in suggesting that we are experiencing a valuation reset due to concerns about higher inflation, it’s worth recalling that, based on the CRSP (The Center for Research in Security Prices) data, small-caps are the only major asset class to have outpaced inflation in every decade since the 1970’s.
Small-Caps Have Beaten Inflation in Every Decade
Average Annual Consumer Price Index (CPI) versus Average Annual CRSP 6-10 Index
12/31/1930- 12/31/2020 (%)

Sources: Bureau of Labor Statistics (CPI) and CRSP
Additionally, since 2003, small-caps have on average delivered attractive returns when inflation expectations were
The best news for small-cap investors in 2021 arguably came from value stocks. The Russell 2000 Value Index had a wonderful year—advancing 28.3% (thus beating the Russell 1000). The small-cap value index also walloped the Russell 2000 Growth Index, which was up a paltry 2.8% for the year.
| 4 | This page is not part of the Royce Capital Fund 2021 Annual Report to Shareholders | Past performance is no guarantee of future results. |
LETTER TO OUR SHAREHOLDERS
From our perspective as experienced small-cap investors, this downturn is not about company fundamentals — it’s about valuations and liquidity. The days of generous monetary policy driving multiple expansion are over.
rising. Finally, if all equity assets are undergoing a valuation reset, then it may be comforting to know that small-caps are at the low end of their relative valuation range over the past 20 years versus large-caps, which may limit their downside exposure relative to their larger siblings.
We hasten to add that we live in a complex world where it’s critical for us to practice humility about attributing causes and effects. As of this writing, there is also heightened geopolitical tension, and the possibility of an armed conflict on a scale not seen in decades. It’s difficult for us to imagine that these events are not exerting downward pressure of their own on equity valuations.
THE VALUE IN SMALL-CAP
What, then, are small-cap investors to do? We have already outlined why we think small-cap value stocks look poised to endure the current spate of higher volatility and lower returns in better shape than their growth counterparts. Even amid a challenging and uncertain climate for equities, much about the small-cap earnings picture remains constructive—particularly in the more cyclical precincts where we are most active currently. As we noted above, the probability of a U.S. recession looks low for at least this year and perhaps longer. U.S. and global GDP growth continue to trend in a positive, if bumpy, fashion. While our portfolio teams pursue distinct investment strategies and tend to focus on different types of small-cap stocks, they have found some common ground in identifying opportunities in the Industrial and Financial sectors, as well as in the lower valuation areas of Information Technology. Four areas that appear attractive are the semiconductor and housing ecosystems, select capital goods companies, and regional banks.
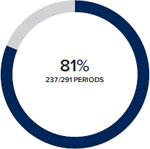
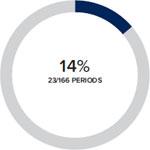
Given our confidence in the prospects for ongoing small-cap value leadership, we think it’s also useful for investors to know that a robust historical trend exists connecting value-led markets to success for active small-cap management. In 81% of value-led markets, active small-cap management outperformed the Russell 2000, a far more frequent record of success than in growth-led
markets, when active management outperformed the small-cap index in only 14% of the five-year periods ended 12/31/21.
Active Small Blend Management: Better in Value-Led Markets
% of Outperformance Periods for Morningstar Small Blend Category Average¹ vs. the Russell 2000
12/31/78- 12/31/21
| In value-led periods² | In growth-led periods² |
| | |
 |  |
| | |
| 64% were value-led periods | 36% were growth-led periods |
Small Blend outperformed in 68% of 10-year periods (270/397) with an average of 10.8% vs Russell 2000 average 10.0%. ¹There were 523 US Fund Small Blend Funds tracked by Morningstar with at least five years of performance history as of 12/31/21.² 5-Year Monthly Rolling Returns From 12/31/78 to 12/31/21 (457 Periods). Source: Morningstar
FACING THE GREAT UNKNOWN
How these various macroeconomic uncertainties play out is beyond our circle of competence. Our own expertise and focus lie in identifying attractively valued stocks. If pressed to offer a market outlook beyond our long-term confidence in small-cap value, we would be hard pressed to offer an expectation, starting from late January’s low levels, of other than an intermediate term-return similar to the Russell 2000’s historical average of about 10%. The favorable and unfavorable factors seem roughly in balance. For the latter, economic growth, though likely above average this year, will also likely slow next year; high-yield spreads, whose decline is often an accelerant for small-cap returns, remain at low levels; valuations, while not concerning, are also not so low that they offer much potential for expanding multiples, and a Federal Reserve that is removing monetary accommodation is rarely coincident with above-average equity returns. Still, on the positive side, we begin (as we often do) with the long term: Since 1945, based on data from CRSP, small-cap stocks have posted positive annualized three-year returns 88% of the time on a rolling monthly basis, with an average return in the low
| Past performance is no guarantee of future results. | This page is not part of the Royce Capital Fund 2021 Annual Report to Shareholders | 5 |
LETTER TO OUR SHAREHOLDERS
Subsequent 1-Year Performance of Russell 2000 after a 20% Decline
As of 1/31/22

First Day of 20% Decline
double digits. Moreover, there is the impressive record of small-cap rebounds from declines of 20% or more from a previous peak. The recent January 2022 low marked the twelfth such decline since the 1979 launch of the Russell 2000. The average subsequent one-year return from the first day of the eleven previous declines was 19.6%. In addition, the small-cap index produced positive returns over the subsequent year in all eleven periods, save one—which occurred in the Great Financial Crisis.
Even with the myriad challenges currently facing the world, we think it’s fair to say that current conditions do not resemble those of the Great Financial Crisis. However, another historical instance may be worth noting. The last time the Fed aggressively removed monetary accommodation with the move not triggering a recession occured in 1994, when the Russell 2000 was down 1.8% for the year. But that reset year was followed by
a glorious period for small-caps, with the annualized return for 1995-97 totaling 22.3% for the Russell 2000.
We also remain convinced that earnings ultimately drive individual company stock returns, and (as we mentioned above) the earnings prospects for many small-cap companies remain promising, specifically those with sound fundamentals, including low-debt balance sheets, positive cash flows, and the ability to pass on higher costs in this inflationary period. We have always believed that focusing on what we know and not worrying about what we cannot control are paramount to effective and successful active management. Our commitment to a disciplined process across each of our small-cap strategies is the best way to give our shareholders the greatest opportunities to build wealth over the long run. This remains true even in the most challenging times.
| Sincerely, | | |
| | | |
 |  |  |
| | | |
| Charles M. Royce | Christopher D. Clark | Francis D. Gannon |
| Chairman, | Chief Executive Officer, and | Co-Chief Investment Officer, |
| Royce Investment Partners | Co-Chief Investment Officer, | Royce Investment Partners |
| | Royce Investment Partners | |
| January 31, 2022 | | |
| 6 | This page is not part of the Royce Capital Fund 2021 Annual Report to Shareholders | Past performance is no guarantee of future results. |
Performance and Expenses
Performance and Expenses
As of December 31, 2021
| | 1-YR | 3-YR | 5-YR | 10-YR | 15-YR | 20-YR | SINCE
INCEPTION
(12/27/96) | ANNUAL OPERATING
EXPENSES (%)
GROSS/NET |
| Royce Capital Fund–Micro-Cap Portfolio | 29.98 | 24.37 | 12.97 | 9.24 | 6.52 | 8.54 | 10.74 | 1.47/1.33 |
| Royce Capital Fund–Small-Cap Portfolio | 28.82 | 12.38 | 6.51 | 8.63 | 6.50 | 8.27 | 10.07 | 1.19/1.08 |
| INDEX | | | | | | | | |
| Russell Microcap Index | 19.34 | 20.90 | 11.69 | 13.62 | 7.51 | 9.04 | N/A | N/A |
| Russell 2000 Value Index | 28.27 | 17.99 | 9.07 | 12.03 | 7.19 | 9.18 | N/A | N/A |
| Russell 2000 Index | 14.82 | 20.02 | 12.02 | 13.23 | 8.69 | 9.36 | N/A | N/A |
Important Performance, Expense, and Risk Information
All performance information in this Review and Report reflects past performance, is presented on a total return basis, reflects the reinvestment of distributions, and does not reflect the deduction of taxes that a shareholder would pay on fund distributions or the redemption of fund shares. Past performance is no guarantee of future results. Investment return and principal value of an investment will fluctuate, so that shares may be worth more or less than their original cost when redeemed. Current performance may be higher or lower than performance quoted and may be obtained at www.royceinvest.com. The Funds’ total returns do not reflect any deduction for charges or expenses of the variable contracts investing in the Funds. All performance and expense information reflects the result for each Fund’s Investment Class Shares. Gross annual operating expenses reflect each Fund’s gross total annual operating expenses and include management fees, operating expenses, and any applicable acquired fund fees and expenses. Net annual operating expenses reflect contractual fee waivers and/or expense reimbursements. All expense information is reported as of each fund’s most current prospectus. Royce & Associates has contractually agreed to waive fees and/or reimburse operating expenses, excluding brokerage commissions, taxes, interest litigation expenses, acquired fund fees and expenses, and other expenses not borne in the ordinary cost of business, to the extent necessary to maintain net operating expenses at or below 1.33% for Royce Capital Fund–Micro-Cap Portfolio, and at or below 1.08% for Royce Capital Fund–Small-Cap Portfolio, through April 30, 2022.
Service Class Shares bear an annual distribution expense that is not borne by the Investment Class; if those expenses were reflected, total returns would have been lower. Each series of Royce Capital Fund is subject to market risk—the possibility that common stock prices will decline, sometimes sharply and unpredictably, over short or extended periods of time. Such declines may be caused by various factors, including market, financial, and economic conditions, governmental or central bank actions, and other factors, such as the recent COVID-19 pandemic, that may not be directly related to the issuer of a security held by a Fund. This pandemic could adversely affect global market, financial, and economic conditions in ways that cannot necessarily be foreseen. Royce Micro-Cap Portfolio invests primarily in micro-cap companies while Royce Small-Cap Portfolio invests primarily in small-cap companies. Investments in micro-cap and small-cap companies may involve considerably more risk than investments in securities of larger-cap companies. (Please see “Primary Risks for Fund Investors” in the prospectus.) Each series of Royce Capital Fund may invest up to 25% of its net assets in foreign securities. Investments in foreign securities may involve political, economic, currency, and other risks not encountered in U.S. investments. (Please see “Investing in Foreign Securities” in the prospectus.) As of 12/31/21, Royce Small-Cap Portfolio invested a significant portion of its assets in a limited number of stocks, which may involve considerably more risk than a more broadly diversified portfolio because a decline in the value of any one of these stocks would cause the Portfolio’s overall value to decline to a greater degree. Royce Micro-Cap Portfolio’s broadly diversified portfolio does not ensure a profit or guarantee against loss. (Please see “Primary Risks for Fund Investors” in the prospectus.) This Review and Report must be preceded or accompanied by a prospectus. Please read the prospectus carefully before investing or sending money. Russell Investment Group is the source and owner of the trademarks, service marks, and copyrights related to the Russell Indexes. Russell® is a trademark of Russell Investment Group. The Russell Microcap Index includes 1,000 of the smallest securities in the small-cap Russell 2000 Index along with the next smallest eligible securities as determined by Russell. The Russell 2000 Index is an unmanaged, capitalization-weighted index of domestic small-cap stocks. It measures the performance of the 2,000 smallest publicly traded U.S. companies in the Russell 3000 Index. The Russell 2000 Value Index consists of the respective value stocks within the Russell 2000 as determined by Russell Investments. The performance of an index does not represent exactly any particular investment, as you cannot invest directly in an index. Distributor: Royce Fund Services, LLC.
This page is not part of the Royce Capital Fund 2021 Annual Report to Shareholders | 7
MANAGERS’ DISCUSSION (UNAUDITED)
Royce Capital Fund–Micro-Cap Portfolio (RCM)

Jim Stoeffel
Brendan Hartman
FUND PERFORMANCE
Royce Capital Fund–Micro-Cap Portfolio gained 30.0% in 2021, outpacing both the Russell Microcap Index (+19.3%), its primary benchmark, and the Russell 2000 (+14.8%) for the same period. The portfolio also beat both indexes for the 3- and 5-year periods ended 12/31/21. Additionally, the portfolio outpaced the Russell 2000 for the since inception period (12/27/96) ended 12/31/21 (Data for the Russell Microcap only goes back to June 2005).
WHAT WORKED… AND WHAT DIDN’T
All 10 equity sectors made positive contributions to performance for the calendar year. The most sizable positive impacts came from Information Technology, Industrials, and Financials while Consumer Staples, Real Estate, and Communication Services made the smallest. At the industry level, semiconductors & semiconductor equipment (Information Technology), specialty retail (Consumer Discretionary), and professional services (Industrials) contributed most. Auto components (Consumer Discretionary), electronic equipment, instruments & components (Information Technology), and electrical equipment (Industrials) were the largest detractors for the calendar-year period.
At the position level, the portfolio benefited most from Aehr Test Systems, which is a worldwide supplier of systems for testing and burning-in logic, memory, photonic, power devices and SiC (silicon carbide) wafers. The company is beginning to see significant traction in applications such as electric vehicles, where the cost of semiconductor failure is extremely high. Although we have trimmed shares given their significant price appreciation, we believe we are at the early stages of adoption in many of the company’s key end markets, which led us to hold a meaningful position at year-end. The next top contributor was Aspen Aerogels. Aspen sells proprietary insulation materials to the energy market—which rebounded in 2021—and to developing markets such as electric vehicles. In 2021, the company was able to meet its growing demand because it secured the necessary financing to double its production capacity over the next several years. In addition, it has several exciting new product applications in the research and development phase that hold potential growth opportunities. We continue to hold a large position as we believe electric vehicles are a significant long-term growth opportunity. B. Riley Financial, a capital markets firm that boasts operations spanning from investment banking to retailer bankruptcy liquidations, was the third top contributing position in 2021 as it continued to benefit from market share gains in its brokerage business.
| | | | | |
| | Top Contributors to Performance | | Top Detractors from Performance | |
| | For 2021 (%)1 | | | For 2021 (%)2 | |
| | Aehr Test Systems | 2.41 | | Motorsport Games Cl. A | -0.66 | |
| | Aspen Aerogels | 1.33 | | American Superconductor | -0.48 | |
| | B. Riley Financial | 1.28 | | CIRCOR International | -0.35 | |
| | Transcat | 1.20 | | Profound Medical | -0.35 | |
| | Citi Trends | 1.10 | | Stoneridge | -0.35 | |
| | 1 Includes dividends | | | 2 Net of dividends | | |
| | | | | | | |
On the other hand, Motorsport Games, which develops gaming software, detracted most for the calendar year. Unfortunately, a NASCAR-themed game that was its first software release following its IPO had technical glitches that resulted in lower-than-expected sales. We have been selling our position as we wait for more clarity as to whether this game’s failed launch has permanently damaged the company’s game development reputation. American Superconductor is an energy technologies company specializing in the design and manufacture of power systems and superconducting wire. As a smaller company dealing with state and local governments, utilities, and the U.S Navy, order flows and revenue generation tend to be unpredictable. Following a strong year in 2020, new flows were less robust in 2021, resulting in the shares declining. We view the company’s technology as vibrant and critical to improving electric grids and believe that as business opportunities gain scale, the company’s results will become less volatile. We have been adding to our position. In addition, Profound Medical develops and commercializes technology for the treatment of localized prostate cancer. It was impacted by limitations to sell its product given COVID restrictions in many hospitals.
The portfolio’s advantage over the Russell Microcap was primarily attributable to stock selection in 2021, though sector allocation was also additive. Our substantially lower exposure and stock selection in Health Care gave the portfolio its biggest advantage over the benchmark, followed by savvy stock picking in both Information Technology and Industrials. Conversely, our lower exposure to Financials—which was strong within the benchmark—caused a drag on relative results for the calendar year. Consumer Discretionary and Real Estate each detracted because of our lower weightings and stock selection.
CURRENT POSITIONING AND OUTLOOK
Micro-cap stocks began the year with very strong returns before struggling through the second half of 2021, which has created considerable opportunities in many sectors. In particular, we are optimistic about long-term opportunities in technology, where supply chain consolidation has allowed certain micro-cap names to secure greater market share in a growing, high-demand industry. We have added exposure on the margin to banks, where we remain underweight, as well as companies involved in energy. This latter group is mostly on the services side, with some holdings categorized in Industrials. Value names have been attractive to us due to both their long-term prospects and current valuations. We believe there is pent-up demand for autos and other consumer areas. With the global economy looking sound—especially once supply chain issues are resolved and COVID becomes more manageable—we are optimistic about the current environment, in particular for disciplined stock pickers with a long-term investment horizon like ourselves.
8 | Royce Capital Fund 2021 Annual Report to Shareholders
| PERFORMANCE AND PORTFOLIO REVIEW (UNAUDITED) | | TICKER SYMBOLS RCMCX RCMSX |
Performance and Expenses
Average Annual Total Return (%) Through 12/31/21
| | JUL-DEC 20211 | 1-YR | 3-YR | 5-YR | 10-YR | 15-YR | 20-YR | SINCE INCEPTION (12/27/96) |
| RCM | 3.83 | 29.98 | 24.37 | 12.97 | 9.24 | 6.52 | 8.54 | 10.74 |
| Annual Gross Operating Expenses: 1.47% | Annual Net Operating Expenses: 1.33% | | | |
1 Not annualized
Morningstar Style Map™ As of 12/31/21
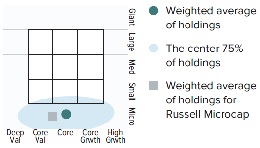
The Morningstar Style Map is the Morningstar Style Box™ with the center 75% of fund holdings plotted as the Morningstar Ownership Zone™. The Morningstar Style Box is designed to reveal a fund’s investment strategy. The Morningstar Ownership Zone provides detail about a portfolio’s investment style by showing the range of stock sizes and styles. The Ownership Zone is derived by plotting each stock in the portfolio within the proprietary Morningstar Style Box. Over time, the shape and location of a fund's ownership zone may vary. See page 30 for additional information.
Value of $10,000
Invested on 6/30/00 (Russell Microcap Inception) as of 12/31/21 ($)
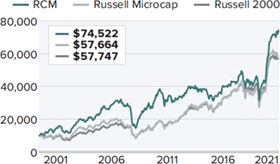
Includes reinvestment of distributions.
| Top 10 Positions | |
| % of Net Assets | |
| | |
| Photronics | 1.2 |
| Citi Trends | 1.2 |
| Haynes International | 1.2 |
| Axcelis Technologies | 1.2 |
| B. Riley Financial | 1.2 |
| Digi International | 1.1 |
| MeiraGTx Holdings | 1.1 |
| Legacy Housing | 1.1 |
| Ultra Clean Holdings | 1.1 |
| Sprott | 1.1 |
| Portfolio Sector Breakdown | |
| % of Net Assets | |
| | |
| Information Technology | 24.5 |
| Industrials | 23.5 |
| Financials | 13.0 |
| Health Care | 12.2 |
| Consumer Discretionary | 12.1 |
| Communication Services | 4.6 |
| Materials | 3.7 |
| Energy | 2.7 |
| Real Estate | 0.4 |
| Cash and Cash Equivalents | 3.3 |
| Calendar Year Total Returns (%) | |
| | |
| YEAR | RCM |
| 2021 | 30.0 |
| 2020 | 23.8 |
| 2019 | 19.6 |
| 2018 | -9.0 |
| 2017 | 5.2 |
| 2016 | 19.7 |
| 2015 | -12.5 |
| 2014 | -3.6 |
| 2013 | 21.0 |
| 2012 | 7.6 |
| 2011 | -12.1 |
| 2010 | 30.1 |
| 2009 | 57.9 |
| 2008 | -43.3 |
| 2007 | 4.0 |
Upside/Downside Capture Ratios
Periods Ended 12/31/21 (%)
| | UPSIDE | DOWNSIDE |
| 10-Year | 76 | 85 |
| From 6/30/00 (Russell Microcap Inception) | 90 | 77 |
| Portfolio Diagnostics | |
| Fund Net Assets | $186 million |
| Number of Holdings | 131 |
| Turnover Rate | 25% |
| Average Market Capitalization1 | $632 million |
| Weighted Average P/B Ratio 2 | 2.2x |
| Active Share 3 | 91% |
| U.S. Investments (% of Net Assets) | 85.1% |
| Non-U.S. Investments (% of Net Assets) | 11.6% |
| 1 | Geometric Average. This weighted calculation uses each portfolio holding’s market cap in a way designed to not skew the effect of very large or small holdings; instead, it aims to better identify the portfolio’s center, which Royce believes offers a more accurate measure of average market cap than a simple mean or median. |
| 2 | Harmonic Average. This weighted calculation evaluates a portfolio as if it were a single stock and measures it overall. It compares the total market value of the portfolio to the portfolio’s share in the earnings or book value, as the case may be, of its underlying stocks. |
| 3 | Active Share is the sum of the absolute values of the different weightings of each holding in the Fund versus each holding in the benchmark, divided by two. |
Important Performance and Expense Information
All performance information in this Report reflects past performance, is presented on a total return basis, reflects the reinvestment of distributions, and does not reflect the deduction of taxes that a shareholder would pay on fund distributions or the redemption of fund shares. Past performance is no guarantee of future results. Investment return and principal value of an investment will fluctuate, so that shares may be worth more or less than their original cost when redeemed. Current performance may be higher or lower than performance quoted. The Fund’s total returns do not reflect any deduction for charges or expenses of the variable contracts investing in the Fund. Returns as of the most recent month-end may be obtained at www.royceinvest.com. All performance and risk information reflects the result of the Investment Class (its oldest class). Shares of RCM’s Service Class bear an annual distribution expense that is not borne by the Investment Class; if those expenses were reflected, total returns would have been lower. Certain immaterial adjustments were made to the net assets of Royce Capital Fund-Micro-Cap Portfolio at 12/31/17 for financial reporting purposes, and as a result the calendar year total returns based on those net asset values differ from the adjusted net asset values and calendar year total returns reported in the Financial Highlights. Gross operating expenses reflect the Fund’s total gross operating expenses for the Investment Class and include management fees and other expenses. Net operating expenses reflect contractual fee waivers and/or expense reimbursements. All expense information is reported as of the Fund’s most current prospectus. Royce & Associates has contractually agreed, without right of termination, to waive fees and/or reimburse expenses to the extent necessary to maintain the Investment Class’s net annual operating expenses (excluding brokerage commissions, taxes, interest, litigation expenses, acquired fund fees and expenses, and other expenses not borne in the ordinary course of business) at or below 1.33% through April 30, 2022. Regarding the “Top Contributors” and “Top Detractors” tables shown above, the sum of all contributors to, and all detractors from, performance for all securities in the portfolio would approximate the Fund’s year-to-date performance for 2021. Upside Capture Ratio measures a manager’s performance in up markets relative to the Fund’s benchmark (Russell Microcap). It is calculated by measuring the Fund’s performance in quarters when the benchmark went up and dividing it by the benchmark’s return in those quarters. Downside Capture Ratio measures a manager’s performance in down markets relative to the Fund’s benchmark. It is calculated by measuring the Fund’s performance in quarters when the benchmark goes down and dividing it by the benchmark’s return in those quarters.
Royce Capital Fund 2021 Annual Report to Shareholders | 9
Schedule of Investments
Royce Capital Fund - Micro-Cap Portfolio
Common Stocks – 96.7%
| | | SHARES | | | VALUE |
| | | | | | |
| COMMUNICATION SERVICES – 4.6% | | | | | | | |
| ENTERTAINMENT - 2.1% | | | | | | | |
| Chicken Soup For The Soul Entertainment Cl. A 1 | | | 86,516 | | | $ | 1,197,382 |
| Gaia Cl. A 1 | | | 141,890 | | | | 1,215,997 |
| IMAX Corporation 1 | | | 76,300 | | | | 1,361,192 |
| †Motorsport Games Cl. A 1 | | | 49,135 | | | | 167,059 |
| | | | | | | | 3,941,630 |
| INTERACTIVE MEDIA & SERVICES - 1.3% | | | | | | | |
| †Enthusiast Gaming Holdings 1 | | | 257,200 | | | | 756,381 |
| QuinStreet 1 | | | 87,600 | | | | 1,593,444 |
| | | | | | | | 2,349,825 |
| MEDIA - 1.2% | | | | | | | |
| Magnite 1,2 | | | 29,800 | | | | 521,500 |
| †Thryv Holdings 1 | | | 42,900 | | | | 1,764,477 |
| | | | | | | | 2,285,977 |
| Total (Cost $8,240,483) | | | | | | | 8,577,432 |
| | | | | | | | |
| CONSUMER DISCRETIONARY – 12.1% | | | | | | | |
| AUTO COMPONENTS - 1.6% | | | | | | | |
| Modine Manufacturing 1 | | | 122,400 | | | | 1,235,016 |
| Stoneridge 1 | | | 67,300 | | | | 1,328,502 |
| Unique Fabricating 1 | | | 177,054 | | | | 347,026 |
| | | | | | | | 2,910,544 |
| HOTELS, RESTAURANTS & LEISURE - 2.0% | | | | | | | |
| Century Casinos 1 | | | 153,400 | | | | 1,868,412 |
| Lindblad Expeditions Holdings 1 | | | 93,000 | | | | 1,450,800 |
| †Lottery.com 1,2 | | | 70,100 | | | | 446,537 |
| | | | | | | | 3,765,749 |
| HOUSEHOLD DURABLES - 1.1% | | | | | | | |
| Legacy Housing 1 | | | 78,600 | | | | 2,080,542 |
| LEISURE PRODUCTS - 0.9% | | | | | | | |
| MasterCraft Boat Holdings 1 | | | 59,517 | | | | 1,686,117 |
| SPECIALTY RETAIL - 5.2% | | | | | | | |
| †Barnes & Noble Education 1 | | | 129,500 | | | | 881,895 |
| Chico's FAS 1 | | | 215,100 | | | | 1,157,238 |
| Citi Trends 1 | | | 23,186 | | | | 2,196,873 |
| OneWater Marine Cl. A | | | 32,300 | | | | 1,969,331 |
| Shoe Carnival | | | 49,800 | | | | 1,946,184 |
| Zumiez 1 | | | 31,400 | | | | 1,506,886 |
| | | | | | | | 9,658,407 |
| TEXTILES, APPAREL & LUXURY GOODS - 1.3% | | | | | | | |
| †Fossil Group 1 | | | 93,100 | | | | 957,999 |
| Vera Bradley 1 | | | 176,500 | | | | 1,502,015 |
| | | | | | | | 2,460,014 |
| Total (Cost $15,433,646) | | | | | | | 22,561,373 |
| | | | | | | | |
| ENERGY – 2.7% | | | | | | | |
| ENERGY EQUIPMENT & SERVICES - 2.7% | | | | | | | |
| Aspen Aerogels 1 | | | 31,317 | | | | 1,559,273 |
| Natural Gas Services Group 1 | | | 154,800 | | | | 1,620,756 |
| Newpark Resources 1 | | | 401,600 | | | | 1,180,704 |
| Profire Energy 1 | | | 612,129 | | | | 648,857 |
| Total (Cost $3,924,018) | | | | | | | 5,009,590 |
| | | | | | | | |
| FINANCIALS – 13.0% | | | | | | | |
| BANKS - 5.6% | | | | | | | |
| Allegiance Bancshares | | | 34,007 | | | | 1,435,436 |
| BayCom Corporation 1 | | | 75,982 | | | | 1,425,422 |
| Caribbean Investment Holdings 1,3 | | | 1,751,547 | | | | 628,264 |
| HarborOne Bancorp | | | 120,191 | | | | 1,783,634 |
| HBT Financial | | | 93,200 | | | | 1,745,636 |
| HomeTrust Bancshares | | | 61,000 | | | | 1,889,780 |
| Investar Holding Corporation | | | 79,410 | | | | 1,461,938 |
| Midway Investments 1,3 | | | 1,751,577 | | | | 0 |
| | | | | | | | 10,370,110 |
| CAPITAL MARKETS - 4.9% | | | | | | | |
| B. Riley Financial | | | 24,200 | | | | 2,150,412 |
| Canaccord Genuity Group | | | 169,900 | | | | 2,025,449 |
| Silvercrest Asset Management Group Cl. A | | | 90,300 | | | | 1,550,451 |
| Sprott | | | 45,580 | | | | 2,056,766 |
| StoneX Group 1 | | | 21,100 | | | | 1,292,375 |
| | | | | | | | 9,075,453 |
| DIVERSIFIED FINANCIAL SERVICES - 0.0% | | | | | | | |
| Waterloo Investment Holdings 1,3 | | | 1,302,000 | | | | 0 |
| THRIFTS & MORTGAGE FINANCE - 2.5% | | | | | | | |
| PCSB Financial | | | 78,400 | | | | 1,492,736 |
| Territorial Bancorp | | | 55,408 | | | | 1,399,052 |
| Western New England Bancorp | | | 206,754 | | | | 1,811,165 |
| | | | | | | | 4,702,953 |
| Total (Cost $20,943,843) | | | | | | | 24,148,516 |
| | | | | | | | |
| HEALTH CARE – 12.2% | | | | | | | |
| BIOTECHNOLOGY - 2.1% | | | | | | | |
| CareDx 1 | | | 15,200 | | | | 691,296 |
| Dynavax Technologies 1 | | | 87,200 | | | | 1,226,904 |
| MeiraGTx Holdings 1 | | | 88,700 | | | | 2,105,738 |
| | | | | | | | 4,023,938 |
| HEALTH CARE EQUIPMENT & SUPPLIES - 6.6% | | | | | | | |
| Apyx Medical 1 | | | 130,000 | | | | 1,666,600 |
| AtriCure 1 | | | 18,900 | | | | 1,314,117 |
| †Bioventus Cl. A 1 | | | 131,647 | | | | 1,907,565 |
| Chembio Diagnostics 1 | | | 53,300 | | | | 60,762 |
| CryoLife 1 | | | 63,189 | | | | 1,285,896 |
| Cutera 1 | | | 39,200 | | | | 1,619,744 |
| †IntriCon Corporation 1 | | | 27,809 | | | | 449,672 |
| OrthoPediatrics Corp. 1 | | | 25,600 | | | | 1,532,416 |
| Profound Medical 1 | | | 91,200 | | | | 1,028,113 |
| Surmodics 1 | | | 28,278 | | | | 1,361,586 |
| | | | | | | | 12,226,471 |
| HEALTH CARE PROVIDERS & SERVICES - 0.6% | | | | | | | |
| Sharps Compliance 1 | | | 160,743 | | | | 1,146,098 |
| LIFE SCIENCES TOOLS & SERVICES - 2.9% | | | | | | | |
| Harvard Bioscience 1 | | | 280,368 | | | | 1,976,594 |
| †Inotiv 1,2 | | | 40,069 | | | | 1,685,703 |
| NeoGenomics 1 | | | 19,500 | | | | 665,340 |
| Quanterix Corporation 1 | | | 24,700 | | | | 1,047,280 |
| | | | | | | | 5,374,917 |
| Total (Cost $12,013,494) | | | | | | | 22,771,424 |
| | | | | | | | |
| INDUSTRIALS – 23.5% | | | | | | | |
| AEROSPACE & DEFENSE - 1.9% | | | | | | | |
| Astronics Corporation 1 | | | 103,100 | | | | 1,237,200 |
| †Cadre Holdings | | | 66,505 | | | | 1,690,557 |
| CPI Aerostructures 1 | | | 212,231 | | | | 579,391 |
| | | | | | | | 3,507,148 |
| BUILDING PRODUCTS - 0.8% | | | | | | | |
| Quanex Building Products | | | 59,000 | | | | 1,462,020 |
| 10 | Royce Capital Fund 2021 Annual Report to Shareholders | THE ACCOMPANYING NOTES ARE AN INTEGRAL PART OF THESE FINANCIAL STATEMENTS |
December 31, 2021
| |
| Royce Capital Fund - Micro-Cap Portfolio (continued) |
| | | SHARES | | | VALUE |
| | | | | | |
| INDUSTRIALS (continued) | | | | | |
| COMMERCIAL SERVICES & SUPPLIES - 2.3% | | | | | |
| Acme United | | | 35,757 | | | $ | 1,205,011 |
| Heritage-Crystal Clean 1 | | | 54,934 | | | | 1,758,986 |
| †VSE Corporation | | | 23,000 | | | | 1,401,620 |
| | | | | | | | 4,365,617 |
| CONSTRUCTION & ENGINEERING - 4.7% | | | | | | | |
| Ameresco Cl. A 1 | | | 12,600 | | | | 1,026,144 |
| †Concrete Pumping Holdings 1 | | | 107,300 | | | | 879,860 |
| Construction Partners Cl. A 1 | | | 56,700 | | | | 1,667,547 |
| IES Holdings 1 | | | 24,000 | | | | 1,215,360 |
| Northwest Pipe 1 | | | 63,600 | | | | 2,022,480 |
| NV5 Global 1 | | | 13,600 | | | | 1,878,432 |
| | | | | | | | 8,689,823 |
| ELECTRICAL EQUIPMENT - 0.6% | | | | | | | |
| American Superconductor 1 | | | 101,400 | | | | 1,103,232 |
| MACHINERY - 5.8% | | | | | | | |
| Alimak Group | | | 86,400 | | | | 1,093,840 |
| CIRCOR International 1 | | | 52,900 | | | | 1,437,822 |
| Graham Corporation | | | 104,120 | | | | 1,295,253 |
| Luxfer Holdings | | | 73,300 | | | | 1,415,423 |
| Porvair | | | 139,600 | | | | 1,360,480 |
| Shyft Group (The) | | | 39,100 | | | | 1,920,983 |
| Wabash National | | | 91,900 | | | | 1,793,888 |
| Westport Fuel Systems 1 | | | 192,500 | | | | 456,225 |
| | | | | | | | 10,773,914 |
| MARINE - 1.0% | | | | | | | |
| Clarkson | | | 35,400 | | | | 1,859,128 |
| PROFESSIONAL SERVICES - 4.3% | | | | | | | |
| CRA International | | | 15,996 | | | | 1,493,387 |
| Forrester Research 1 | | | 26,400 | | | | 1,550,472 |
| Heidrick & Struggles International | | | 38,100 | | | | 1,666,113 |
| Kforce | | | 25,500 | | | | 1,918,110 |
| Resources Connection | | | 83,854 | | | | 1,495,955 |
| | | | | | | | 8,124,037 |
| TRADING COMPANIES & DISTRIBUTORS - 2.1% | | | | | | | |
| Lawson Products 1 | | | 34,787 | | | | 1,904,588 |
| Transcat 1 | | | 21,345 | | | | 1,972,919 |
| | | | | | | | 3,877,507 |
| Total (Cost $26,941,394) | | | | | | | 43,762,426 |
| | | | | | | | |
| INFORMATION TECHNOLOGY – 24.5% | | | | | | | |
| COMMUNICATIONS EQUIPMENT - 3.4% | | | | | | | |
| †Comtech Telecommunications | | | 44,163 | | | | 1,046,221 |
| Digi International 1 | | | 86,500 | | | | 2,125,305 |
| EMCORE Corporation 1 | | | 197,200 | | | | 1,376,456 |
| †Genasys 1 | | | 240,800 | | | | 958,384 |
| Harmonic 1 | | | 67,900 | | | | 798,504 |
| | | | | | | | 6,304,870 |
| ELECTRONIC EQUIPMENT, INSTRUMENTS & COMPONENTS - 5.0% | | | | | | | |
| †Arlo Technologies 1 | | | 38,800 | | | | 407,012 |
| FARO Technologies 1 | | | 19,600 | | | | 1,372,392 |
| LightPath Technologies Cl. A 1 | | | 368,300 | | | | 898,652 |
| Luna Innovations 1 | | | 193,500 | | | | 1,633,140 |
| nLIGHT 1 | | | 38,300 | | | | 917,285 |
| PAR Technology 1 | | | 24,200 | | | | 1,277,034 |
| PowerFleet 1 | | | 236,700 | | | | 1,121,958 |
| †VIA optronics ADR 1 | | | 22,450 | | | | 165,007 |
| Vishay Precision Group 1 | | | 42,400 | | | | 1,573,888 |
| | | | | | | | 9,366,368 |
| IT SERVICES - 1.4% | | | | | |
| Cass Information Systems | | | 29,948 | | | | 1,177,555 |
| Computer Task Group 1 | | | 149,320 | | | | 1,488,721 |
| | | | | | | | 2,666,276 |
| SEMICONDUCTORS & SEMICONDUCTOR EQUIPMENT - 12.6% | | | | | | | |
| Aehr Test Systems 1 | | | 78,200 | | | | 1,890,876 |
| Amtech Systems 1 | | | 46,407 | | | | 458,501 |
| Axcelis Technologies 1 | | | 28,900 | | | | 2,154,784 |
| AXT 1 | | | 202,800 | | | | 1,786,668 |
| Camtek 1 | | | 44,652 | | | | 2,055,778 |
| Cohu 1 | | | 43,400 | | | | 1,653,106 |
| CyberOptics Corporation 1 | | | 43,937 | | | | 2,043,071 |
| Ichor Holdings 1 | | | 37,600 | | | | 1,730,728 |
| Nova 1,2 | | | 13,800 | | | | 2,021,700 |
| NVE Corporation | | | 19,200 | | | | 1,311,360 |
| PDF Solutions 1 | | | 64,100 | | | | 2,037,739 |
| Photronics 1 | | | 117,800 | | | | 2,220,530 |
| Ultra Clean Holdings 1 | | | 36,200 | | | | 2,076,432 |
| | | | | | | | 23,441,273 |
| SOFTWARE - 1.3% | | | | | | | |
| Agilysys 1 | | | 32,600 | | | | 1,449,396 |
| †GTY Technology Holdings 1 | | | 152,061 | | | | 1,018,809 |
| | | | | | | | 2,468,205 |
| TECHNOLOGY HARDWARE, STORAGE & PERIPHERALS - 0.8% | | | | | | | |
| AstroNova 1 | | | 105,558 | | | | 1,425,033 |
| Total (Cost $24,908,748) | | | | | | | 45,672,025 |
| | | | | | | | |
| MATERIALS – 3.7% | | | | | | | |
| METALS & MINING - 3.7% | | | | | | | |
| Altius Minerals | | | 78,900 | | | | 1,085,931 |
| Ferroglobe 1 | | | 41,600 | | | | 258,336 |
| Haynes International | | | 54,470 | | | | 2,196,775 |
| Major Drilling Group International 1 | | | 312,200 | | | | 2,038,636 |
| Universal Stainless & Alloy Products 1 | | | 157,500 | | | | 1,242,675 |
| Total (Cost $6,064,911) | | | | | | | 6,822,353 |
| | | | | | | | |
| REAL ESTATE – 0.4% | | | | | | | |
| REAL ESTATE MANAGEMENT & DEVELOPMENT - 0.4% | | | | | | | |
| FRP Holdings 1 | | | 13,840 | | | | 799,952 |
| Total (Cost $264,652) | | | | | | | 799,952 |
| | | | | | | | |
| TOTAL COMMON STOCKS | | | | | | | |
| (Cost $118,735,189) | | | | | | | 180,125,091 |
| THE ACCOMPANYING NOTES ARE AN INTEGRAL PART OF THESE FINANCIAL STATEMENTS | Royce Capital Fund 2021 Annual Report to Shareholders | 11 |
| Schedule of Investments | December 31, 2021 |
Royce Capital Fund - Micro-Cap Portfolio (continued)
| | | SHARES | | | VALUE |
| | | | | | |
| REPURCHASE AGREEMENT– 3.5% | | | | | |
Fixed Income Clearing Corporation, 0.00% dated 12/31/21 due 1/3/22, maturity value $6,587,541 (collateralized by obligations of various U.S. Government Agencies, 2.50% due 1/15/29, valued at $6,719,374) |
| (Cost $6,587,541) | | | | | | $ | 6,587,541 |
| | | | | | | | |
| COLLATERAL RECEIVED FOR SECURITIES LOANED – 0.2% | | | | | | | |
| Money Market Funds | | | | | | | |
| Federated Government Obligations Fund - Institutional Shares (7 day yield-0.03%) | | | | | | | |
| (Cost $396,893) | | | 396,893 | | | | 396,893 |
| | | | | | | | |
| TOTAL INVESTMENTS – 100.4% | | | | | | | |
| (Cost $125,719,623) | | | | | | | 187,109,525 |
| | | | | | | | |
| LIABILITIES LESS CASH AND OTHER ASSETS – (0.4)% | | | | | | | (836,388) |
| | | | | | | | |
| NET ASSETS – 100.0% | | | | | | $ | 186,273,137 |
ADR- American Depository Receipt
| 2 | All or a portion of these securities were on loan at December 31, 2021. |
| 3 | Securities for which market quotations are not readily available represent 0.3% of net assets. These securities have been valued at their fair value under procedures approved by the Fund's Board of Trustees. These securities are defined as Level 3 securities due to the use of significant unobservable inputs in the determination of fair value. See Notes to Financial Statements. |
Bold indicates the Fund’s 20 largest equity holdings in terms of December 31, 2021, market value.
| 12 | Royce Capital Fund 2021 Annual Report to Shareholders | THE ACCOMPANYING NOTES ARE AN INTEGRAL PART OF THESE FINANCIAL STATEMENTS |
This page is intentionally left blank.
Royce Capital Fund 2021 Annual Report to Shareholders | 13
MANAGER’S DISCUSSION (UNAUDITED)
Royce Capital Fund–Small-Cap Portfolio (RCS)

Jay Kaplan, CFA
FUND PERFORMANCE
Royce Capital Fund–Small-Cap Portfolio advanced 28.8% in 2021, narrowly outpacing its primary benchmark, the Russell 2000 Value Index, which was up 28.3%, and beating the Russell 2000 Index, which rose 14.8% for the same period.
WHAT WORKED… AND WHAT DIDN’T
All of the portfolio’s nine equity sectors made a positive impact on calendar-year performance. The sectors making the largest positive contributions were Industrials, Information Technology, and Consumer Discretionary while the smallest positive impacts came from Consumer Staples, Real Estate, and Energy. At the industry level, specialty retail (Consumer Discretionary), electronic equipment, instruments & components (Information Technology), and road & rail (Industrials) contributed most in the calendar year period while communications equipment (Information Technology), insurance (Financials), and consumer finance (Financials) were the largest detractors.
The portfolio’s top contributor at the position level for 2021 was Arkansas-based freight and logistics solutions provider ArcBest. The company achieved record quarterly revenue and operating income, which was announced in its third-quarter earnings release, with consolidated quarterly revenues of more than $1 billion. ArcBest also benefited from its acquisition of MoLo Solutions, a Chicago-based truckload brokerage. Shoe Carnival, a discount footwear retailer, was the second top contributing position for the calendar year. Many of the company’s competitors have shut their doors, helping its business. In addition, Nike consolidated the number of stores that can sell its products, which included Shoe Carnival. Stronger demand allowed the company to discontinue deep discounting, leading to margin expansion. The third contributor was Kulicke & Soffa Industries, a leader in manufacturing equipment and tools used to assemble and package semiconductor devices. A full 60% or more of all semiconductors processed utilize the company’s wire bonding equipment. Kulicke is benefiting from record industry wafer fab equipment spending and a structural increase in the complexity of chip packaging due to increased advanced packaging or multi-die packaging techniques. Further, Kulicke has been benefiting from new product introductions in the mini-LED packaging market, which is growing quickly.
| | | | | |
| | Top Contributors to Performance | | Top Detractors from Performance | |
| | For 2021(%)1 | | | For 2021(%)2 | | |
| | ArcBest | 2.91 | | Nautilus | -0.65 | |
| | Shoe Carnival | 1.93 | | James River Group Holdings | -0.42 | |
| | Kulicke & Soffa Industries | 1.70 | | Heritage Insurance Holdings | -0.40 | |
| | OneWater Marine Cl. A | 1.65 | | NETGEAR | -0.39 | |
| | Rent-A-Center | 1.12 | | Haverty Furniture | -0.36 | |
| | 1 Includes dividends | | | 2 Net of dividends | | |
| | | | | | | |
The portfolio’s biggest detractor was Nautilus, which manufactures fitness equipment. The company’s third-quarter results were hurt by inflation as well as global shipping and supply chain challenges. With profitability unlikely this year, we chose to exit our position. The portfolio’s next biggest detractor, James River Group Holdings, focuses on the “Excess & Surplus” insurance niche. Its stock saw its most severe dip in 2021’s first half. The company then took a charge in the fourth quarter related to its non-core reinsurance division that, while fairly small, came on the heels of the much larger charge taken earlier in the year in its commercial auto business (specifically Uber), which led its shares to drift lower. Current management has been trying to fix the problems created by the prior team, though our own concerns about the timing and extent of the fixes led us to significantly reduce our position. Heritage Insurance Holdings, a super-regional property and casualty insurance holding company, also detracted. The company, which has significant business in coastal areas, was hurt by poor weather in Florida during 2021. We believe that Heritage Insurance can benefit from premium rate increases. The stock is inexpensive, and we maintained our position at year end.
The portfolio’s very narrow advantage over its benchmark was attributable to stock selection in 2021, which was especially strong in Industrials, Health Care, and Information Technology. Our underweight in the second sector was also beneficial. Conversely, Financials detracted due to stock selection while our cash position also hurt relative results, as did our significantly lower exposure to Real Estate.
Current Positioning And Outlook
We expect that 2022 will be a good year for small-cap value as all signs point to continued economic strength, though we’re mindful that continuing COVID resurgences could disrupt this positive backdrop. In addition, we believe the Fed has clearly signaled that interest rates will rise in 2022, which should bode well for value investors like us. There had been a disconnect between the stagnant 10-year Treasury yield and the Fed’s language until recently. The 10-year yield, however, is beginning to rise. We believe the equity market is incorporating this view, as seen by the weak performance of many long-duration assets like richly valued, non-earning, story-based growth stocks. We see the semiconductor supply chain issue lasting through most of 2022, and labor shortages and wage pressures look likely to continue. Inflation is with us now and is real. In this context, we have been buying selectively, adding, for example, to our technology weighting, pharmaceutical companies with proven products and promising pipelines, and homebuilders and other housing related companies in the area of home furnishings.
14 | Royce Capital Fund 2021 Annual Report to Shareholders
| PERFORMANCE AND PORTFOLIO REVIEW (UNAUDITED) | TICKER SYMBOLS RCPFX RCSSX |
Performance and Expenses
Average Annual Total Return (%) Through 12/31/21
| | JUL-DEC 20211 | 1-YR | 3-YR | 5-YR | 10-YR | 15-YR | 20-YR | SINCE INCEPTION (12/27/96) |
| RCS | 4.32 | 28.82 | 12.38 | 6.51 | 8.63 | 6.50 | 8.27 | 10.07 |
| Annual Gross Operating Expenses: 1.19% Annual Net Operating Expenses: 1.08% |
| 1 Not annualized | | | | | |
Morningstar Style Map™ As of 12/31/21

The Morningstar Style Map is the Morningstar Style Box™ with the center 75% of fund holdings plotted as the Morningstar Ownership Zone™. The Morningstar Style Box is designed to reveal a fund’s investment strategy. The Morningstar Ownership Zone provides detail about a portfolio’s investment style by showing the range of stock sizes and styles. The Ownership Zone is derived by plotting each stock in the portfolio within the proprietary Morningstar Style Box. Over time, the shape and location of a fund’s ownership zone may vary. See page 30 for additional information.
Value of $10,000
Invested on 12/27/96 as of 12/31/21 ($)

Includes reinvestment of distributions.
Top 10 Positions
% of Net Assets
| OneWater Marine Cl. A | 2.6 |
| Kulicke & Soffa Industries | 2.5 |
| Sanmina Corporation | 2.5 |
| PulteGroup | 2.5 |
| Shoe Carnival | 2.4 |
| Rent-A-Center | 2.4 |
| Aaron’s Company (The) | 2.2 |
| La-Z-Boy | 2.2 |
| Evercore Cl. A | 2.1 |
| PROG Holdings | 2.0 |
Portfolio Sector Breakdown
% of Net Assets
| Consumer Discretionary | 26.8 |
| Information Technology | 20.8 |
| Financials | 20.4 |
| Industrials | 19.1 |
| Health Care | 7.8 |
| Communication Services | 1.2 |
| Energy | 0.7 |
| Consumer Staples | 0.5 |
| Real Estate | 0.5 |
| Cash and Cash Equivalents | 2.2 |
Calendar Year Total Returns (%)
| YEAR | RCS |
| 2021 | 28.8 |
| 2020 | -7.2 |
| 2019 | 18.7 |
| 2018 | -8.3 |
| 2017 | 5.4 |
| 2016 | 21.0 |
| 2015 | -11.8 |
| 2014 | 3.2 |
| 2013 | 34.8 |
| 2012 | 12.5 |
| 2011 | -3.3 |
| 2010 | 20.5 |
| 2009 | 35.2 |
| 2008 | -27.2 |
| 2007 | -2.1 |
Upside/Downside Capture Ratios
Periods Ended 12/31/21 (%)
| | UPSIDE | DOWNSIDE |
| 10-Year | 85 | 101 |
| From 12/31/96 (Start of left First Full Quarter) | 97 | 91 |
Portfolio Diagnostics
| Fund Net Assets | $382 million |
| Number of Holdings | | 96 |
| Turnover Rate | | 51% |
| Average Market Capitalization 1 | $1,519 million |
| Weighted Average P/B Ratio 2 | | 1.9x |
| Active Share 3 | | 96% |
| U.S. Investments (% of Net Assets) | | 94.6% |
| Non-U.S. Investments (% of Net Assets) | 3.2% |
| 1 | Geometric Average. This weighted calculation uses each portfolio holding’s market cap in a way designed to not skew the effect of very large or small holdings; instead, it aims to better identify the portfolio’s center, which Royce believes offers a more accurate measure of average market cap than a simple mean or median. |
| 2 | Harmonic Average. This weighted calculation evaluates a portfolio as if it were a single stock and measures it overall. It compares the total market value of the portfolio to the portfolio’s share in the earnings or book value, as the case may be, of its underlying stocks. |
| 3 | Active Share is the sum of the absolute values of the different weightings of each holding in the Fund versus each holding in the benchmark, divided by two. |
Important Performance and Expense Information
All performance information in this Report reflects past performance, is presented on a total return basis, reflects the reinvestment of distributions, and does not reflect the deduction of taxes that a shareholder would pay on fund distributions or the redemption of fund shares. Past performance is no guarantee of future results. Investment return and principal value of an investment will fluctuate, so that shares may be worth more or less than their original cost when redeemed. Current performance may be higher or lower than performance quoted. The Fund’s total returns do not reflect any deduction for charges or expenses of the variable contracts investing in the Fund. Returns as of the most recent month-end may be obtained at www.royceinvest.com. All performance and risk information reflects the result of the Investment Class (its oldest class). Shares of RCS’s Service Class bear an annual distribution expense that is not borne by the Investment Class; if those expenses were reflected, total returns would have been lower. Certain immaterial adjustments were made to the net assets of Royce Capital Fund-Small-Cap Portfolio at 12/31/17 for financial reporting purposes, and as a result the calendar year total returns based on those net asset values differ from the adjusted net asset values and calendar year total returns reported in the Financial Highlights. Gross operating expenses reflect the Fund’s total gross operating expenses for the Investment Class and include management fees and other expenses. Net operating expenses reflect contractual fee waivers and/or expense reimbursements. All expense information is reported as of the Fund’s most current prospectus. Royce & Associates has contractually agreed, without right of termination, to waive fees and/or reimburse expenses to the extent necessary to maintain the Investment Class’s net annual operating expenses (excluding brokerage commissions, taxes, interest, litigation expenses, acquired fund fees and expenses, and other expenses not borne in the ordinary course of business) at or below 1.08% through April 30, 2022. Regarding the “Top Contributors” and “Top Detractors” tables shown above, the sum of all contributors to, and all detractors from, performance for all securities in the portfolio would approximate the Fund’s year-to-date performance for 2021. Upside Capture Ratio measures a manager’s performance in up markets relative to the Fund’s benchmark (Russell 2000 Value). It is calculated by measuring the Fund’s performance in quarters when the benchmark went up and dividing it by the benchmark’s return in those quarters. Downside Capture Ratio measures a manager’s performance in down markets relative to the Fund’s benchmark. It is calculated by measuring the Fund’s performance in quarters when the benchmark goes down and dividing it by the benchmark’s return in those quarters.
Royce Capital Fund 2021 Annual Report to Shareholders | 15
Schedule of Investments
| Royce Capital Fund - Small-Cap Portfolio | | | | | | | |
| Common Stocks – 97.8% | | | | | | | |
| | | | SHARES | | | | VALUE |
| | | | | | | | |
| COMMUNICATION SERVICES – 1.2% | | | | | | | |
| MEDIA - 1.2% | | | | | | | |
| Entravision Communications Cl. A | | | 343,380 | | | $ | 2,328,116 |
| Saga Communications Cl. A | | | 93,392 | | | | 2,242,342 |
| Total (Cost $5,610,859) | | | | | | | 4,570,458 |
| | | | | | | | |
| CONSUMER DISCRETIONARY – 26.8% | | | | | | | |
| AUTO COMPONENTS - 0.3% | | | | | | | |
| Gentex Corporation | | | 28,416 | | | | 990,298 |
| DIVERSIFIED CONSUMER SERVICES - 1.3% | | | | | | | |
| †Lincoln Educational Services1 | | | 679,551 | | | | 5,076,246 |
| HOUSEHOLD DURABLES - 7.9% | | | | | | | |
| La-Z-Boy | | | 229,660 | | | | 8,338,955 |
| †M/I Homes 1 | | | 88,924 | | | | 5,529,294 |
| †Meritage Homes 1 | | | 57,000 | | | | 6,957,420 |
| PulteGroup | | | 164,750 | | | | 9,417,110 |
| | | | | | | | 30,242,779 |
| LEISURE PRODUCTS - 3.1% | | | | | | | |
| Malibu Boats Cl. A 1 | | | 73,704 | | | | 5,065,676 |
| MasterCraft Boat Holdings 1 | | | 238,000 | | | | 6,742,540 |
| | | | | | | | 11,808,216 |
| SPECIALTY RETAIL - 14.2% | | | | | | | |
| Aaron's Company (The) | | | 339,573 | | | | 8,370,474 |
| American Eagle Outfitters | | | 222,453 | | | | 5,632,510 |
| †Container Store Group (The) 1 | | | 37,700 | | | | 376,246 |
| †Haverty Furniture | | | 185,845 | | | | 5,681,282 |
| †Lazydays Holdings 1 | | | 273,005 | | | | 5,880,528 |
| OneWater Marine Cl. A | | | 161,095 | | | | 9,821,962 |
| Rent-A-Center | | | 189,458 | | | | 9,101,562 |
| Shoe Carnival | | | 234,316 | | | | 9,157,069 |
| | | | | | | | 54,021,633 |
| Total (Cost $78,224,267) | | | | | | | 102,139,172 |
| | | | | | | | |
| CONSUMER STAPLES – 0.5% | | | | | | | |
| FOOD & STAPLES RETAILING - 0.5% | | | | | | | |
| Village Super Market Cl. A | | | 89,843 | | | | 2,101,428 |
| Total (Cost $2,025,074) | | | | | | | 2,101,428 |
| | | | | | | | |
| ENERGY – 0.7% | | | | | | | |
| OIL, GAS & CONSUMABLE FUELS - 0.7% | | | | | | | |
| Dorchester Minerals L.P. | | | 129,305 | | | | 2,558,946 |
| Total (Cost $1,593,085) | | | | | | | 2,558,946 |
| | | | | | | | |
| FINANCIALS – 20.4% | | | | | | | |
| BANKS - 6.7% | | | | | | | |
| Ames National | | | 81,637 | | | | 1,999,290 |
| Camden National | | | 42,894 | | | | 2,065,775 |
| †Chemung Financial | | | 42,724 | | | | 1,955,905 |
| †Citizens Community Bancorp | | | 112,382 | | | | 1,547,500 |
| City Holding Company | | | 23,086 | | | | 1,888,204 |
| CNB Financial | | | 91,552 | | | | 2,426,128 |
| Financial Institutions | | | 64,863 | | | | 2,062,643 |
| Landmark Bancorp | | | 64,169 | | | | 1,828,817 |
| MidWestOne Financial Group | | | 56,739 | | | | 1,836,641 |
| National Bankshares | | | 145,276 | | | | 5,267,708 |
| Unity Bancorp | | | 98,939 | | | | 2,597,149 |
| | | | | | | | 25,475,760 |
| CAPITAL MARKETS - 3.4% | | | | | | | |
| Evercore Cl. A | | | 59,100 | | | | 8,028,735 |
| Houlihan Lokey Cl. A | | | 11,915 | | | | 1,233,441 |
| Moelis & Company Cl. A | | | 59,801 | | | | 3,738,160 |
| | | | | | | | 13,000,336 |
| CONSUMER FINANCE - 2.0% | | | | | | | |
| PROG Holdings 1 | | | 170,798 | | | | 7,704,698 |
| INSURANCE - 5.7% | | | | | | | |
| CNO Financial Group | | | 251,700 | | | | 6,000,528 |
| †Crawford & Company Cl. A | | | 19,587 | | | | 146,707 |
| Donegal Group Cl. A | | | 127,341 | | | | 1,819,703 |
| †Employers Holdings | | | 137,477 | | | | 5,688,798 |
| Heritage Insurance Holdings | | | 310,341 | | | | 1,824,805 |
| James River Group Holdings | | | 40,182 | | | | 1,157,643 |
| Selective Insurance Group | | | 20,280 | | | | 1,661,743 |
| †Tiptree | | | 258,801 | | | | 3,579,218 |
| | | | | | | | 21,879,145 |
| THRIFTS & MORTGAGE FINANCE - 2.6% | | | | | | | |
| Southern Missouri Bancorp | | | 36,215 | | | | 1,889,337 |
| Timberland Bancorp | | | 146,670 | | | | 4,062,759 |
| TrustCo Bank Corp NY | | | 114,977 | | | | 3,829,884 |
| | | | | | | | 9,781,980 |
| Total (Cost $63,443,894) | | | | | | | 77,841,919 |
| | | | | | | | |
| HEALTH CARE – 7.8% | | | | | | | |
| BIOTECHNOLOGY - 2.3% | | | | | | | |
| Catalyst Pharmaceuticals 1 | | | 787,094 | | | | 5,328,627 |
| †Ironwood Pharmaceuticals Cl. A 1 | | | 227,811 | | | | 2,656,276 |
| Vanda Pharmaceuticals 1 | | | 56,200 | | | | 881,778 |
| | | | | | | | 8,866,681 |
| HEALTH CARE PROVIDERS & SERVICES - 1.9% | | | | | | | |
| Ensign Group (The) | | | 19,314 | | | | 1,621,603 |
| Molina Healthcare 1 | | | 17,600 | | | | 5,598,208 |
| | | | | | | | 7,219,811 |
| PHARMACEUTICALS - 3.6% | | | | | | | |
| †BioDelivery Sciences International 1 | | | 1,239,713 | | | | 3,843,110 |
| †Collegium Pharmaceutical 1,2 | | | 209,930 | | | | 3,921,493 |
| †SIGA Technologies 1 | | | 391,306 | | | | 2,942,621 |
| Supernus Pharmaceuticals 1 | | | 105,000 | | | | 3,061,800 |
| | | | | | | | 13,769,024 |
| Total (Cost $23,935,709) | | | | | | | 29,855,516 |
| | | | | | | | |
| INDUSTRIALS – 19.1% | | | | | | | |
| AEROSPACE & DEFENSE - 1.6% | | | | | | | |
| Vectrus 1 | | | 130,154 | | | | 5,957,149 |
| BUILDING PRODUCTS - 2.2% | | | | | | | |
| †Builders FirstSource 1 | | | 22,430 | | | | 1,922,475 |
| †Quanex Building Products | | | 111,223 | | | | 2,756,106 |
| UFP Industries | | | 40,700 | | | | 3,744,807 |
| | | | | | | | 8,423,388 |
| CONSTRUCTION & ENGINEERING - 4.9% | | | | | | | |
| Comfort Systems USA | | | 8,571 | | | | 848,015 |
| Great Lakes Dredge & Dock 1 | | | 145,031 | | | | 2,279,887 |
| MYR Group 1 | | | 12,441 | | | | 1,375,352 |
| Northwest Pipe 1 | | | 71,086 | | | | 2,260,535 |
| Primoris Services | | | 268,790 | | | | 6,445,584 |
| †Sterling Construction 1 | | | 209,949 | | | | 5,521,659 |
| | | | | | | | 18,731,032 |
| MACHINERY - 1.4% | | | | | | | |
| Alamo Group | | | 7,207 | | | | 1,060,726 |
| Federal Signal | | | 10,722 | | | | 464,692 |
| 16 | Royce Capital Fund 2021 Annual Report to Shareholders | THE ACCOMPANYING NOTES ARE AN INTEGRAL PART OF THESE FINANCIAL STATEMENTS |
December 31, 2021
Royce Capital Fund - Small-Cap Portfolio (continued)
| | | SHARES | | | VALUE |
| | | | | | |
| INDUSTRIALS (continued) | | | | | | | |
| MACHINERY (continued) | | | | | | | |
| Miller Industries | | | 116,793 | | | $ | 3,900,886 |
| | | | | | | | 5,426,304 |
| PROFESSIONAL SERVICES - 5.0% | | | | | | | |
| Barrett Business Services | | | 30,548 | | | | 2,109,645 |
| Heidrick & Struggles International | | | 132,369 | | | | 5,788,496 |
| Kforce | | | 22,614 | | | | 1,701,025 |
| Korn Ferry | | | 56,435 | | | | 4,273,823 |
| Resources Connection | | | 247,564 | | | | 4,416,542 |
| Robert Half International | | | 6,864 | | | | 765,473 |
| | | | | | | | 19,055,004 |
| ROAD & RAIL - 4.0% | | | | | | | |
| ArcBest | | | 43,849 | | | | 5,255,303 |
| Schneider National Cl. B | | | 262,300 | | | | 7,058,493 |
| Werner Enterprises | | | 61,050 | | | | 2,909,643 |
| | | | | | | | 15,223,439 |
| Total (Cost $47,016,316) | | | | | | | 72,816,316 |
| | | | | | | | |
| INFORMATION TECHNOLOGY – 20.8% | | | | | | | |
| ELECTRONIC EQUIPMENT, INSTRUMENTS & COMPONENTS - 14.3% | | | | | | | |
| ePlus 1 | | | 89,288 | | | | 4,810,837 |
| Fabrinet 1 | | | 12,480 | | | | 1,478,506 |
| †Flex 1 | | | 259,500 | | | | 4,756,635 |
| Insight Enterprises 1 | | | 23,854 | | | | 2,542,836 |
| †Jabil | | | 94,200 | | | | 6,626,970 |
| Kimball Electronics 1 | | | 264,316 | | | | 5,751,516 |
| Methode Electronics | | | 36,622 | | | | 1,800,704 |
| PC Connection | | | 40,054 | | | | 1,727,529 |
| Plexus Corporation 1 | | | 13,400 | | | | 1,284,926 |
| Sanmina Corporation 1 | | | 228,393 | | | | 9,469,174 |
| TD SYNNEX | | | 59,942 | | | | 6,854,967 |
| Vishay Intertechnology | | | 350,061 | | | | 7,655,834 |
| | | | | | | | 54,760,434 |
| IT SERVICES - 0.8% | | | | | | | |
| Concentrix Corporation | | | 7,600 | | | | 1,357,512 |
| IBEX 1 | | | 116,715 | | | | 1,504,457 |
| | | | | | | | 2,861,969 |
| SEMICONDUCTORS & SEMICONDUCTOR EQUIPMENT - 5.7% | | | | | | | |
| †Amkor Technology | | | 216,384 | | | | 5,364,159 |
| Cohu 1 | | | 135,616 | | | | 5,165,613 |
| Kulicke & Soffa Industries | | | 159,213 | | | | 9,638,755 |
| MKS Instruments | | | 9,091 | | | | 1,583,380 |
| | | | | | | | 21,751,907 |
| Total (Cost $54,796,894) | | | | | | | 79,374,310 |
| | | | | | | | |
| REAL ESTATE – 0.5% | | | | | | | |
| REAL ESTATE MANAGEMENT & DEVELOPMENT - 0.5% | | | | | | | |
| Marcus & Millichap 1 | | | 36,125 | | | | 1,858,992 |
| Total (Cost $1,016,123) | | | | | | | 1,858,992 |
| | | | | | | | |
| TOTAL COMMON STOCKS | | | | | | | |
| (Cost $277,662,221) | | | | | | | 373,117,057 |
| REPURCHASE AGREEMENT– 2.2% | | | |
Fixed Income Clearing Corporation, 0.00% dated 12/31/21, due 1/3/22, maturity value $8,492,332 (collateralized by obligations of various U.S. Government Agencies, 0.25% due 7/15/29, valued at $8,662,194) |
| (Cost $8,492,332) | | $ | 8,492,332 |
| | | | |
| TOTAL INVESTMENTS – 100.0% | | | |
| (Cost $286,154,553) | | | 381,609,389 |
| | | | |
| CASH AND OTHER ASSETS LESS LIABILITIES – 0.0% | | | 30,671 |
| | | | |
| NET ASSETS – 100.0% | | $ | 381,640,060 |
| 2 | All or a portion of these securities were on loan at December 31, 2021. |
Bold indicates the Fund’s 20 largest equity holdings in terms of December 31, 2021, market value.
| THE ACCOMPANYING NOTES ARE AN INTEGRAL PART OF THESE FINANCIAL STATEMENTS | Royce Capital Fund 2021 Annual Report to Shareholders | 17 |
| Statements of Assets and Liabilities | December 31, 2021 |
| | | | Micro-Cap
Portfolio | | | Small-Cap
Portfolio | |
| ASSETS: | | | | | | | |
| Investments at value (including collateral on loaned securities)1 | | $ | 180,521,984 | | $ | 373,117,057 | |
| Repurchase agreements (at cost and value) | | | 6,587,541 | | | 8,492,332 | |
| Receivable for investments sold | | | 40,379 | | | 2,413,385 | |
| Receivable for capital shares sold | | | 43,103 | | | 16,201 | |
| Receivable for dividends | | | 7,177 | | | 348,160 | |
| Receivable for securities lending income | | | 1,994 | | | 32 | |
| Prepaid expenses and other assets | | | 1,825 | | | 3,613 | |
| Total Assets | | | 187,204,003 | | | 384,390,780 | |
| LIABILITIES: | | | | | | | |
| Payable for collateral on loaned securities | | | 396,893 | | | – | |
| Payable for investments purchased | | | 126,237 | | | 1,969,022 | |
| Payable for capital shares redeemed | | | 145,571 | | | 327,952 | |
| Payable for investment advisory fees | | | 183,145 | | | 307,904 | |
| Payable for trustees' fees | | | 9,175 | | | 19,016 | |
| Accrued expenses | | | 69,845 | | | 126,826 | |
| Total Liabilities | | | 930,866 | | | 2,750,720 | |
| Net Assets | | $ | 186,273,137 | | $ | 381,640,060 | |
| ANALYSIS OF NET ASSETS: | | | | | | | |
| Paid-in capital | | $ | 84,970,197 | | $ | 280,399,451 | |
| Total distributable earnings (loss) | | | 101,302,940 | | | 101,240,609 | |
| Net Assets | | $ | 186,273,137 | | $ | 381,640,060 | |
| Investment Class | | $ | 157,042,047 | | $ | 172,388,254 | |
| Service Class | | | 29,231,090 | | | 209,251,806 | |
| SHARES OUTSTANDING (unlimited number of $.001 par value): | | | | | | | |
| Investment Class | | | 10,633,696 | | | 18,314,579 | |
| Service Class | | | 2,033,605 | | | 22,747,564 | |
| NET ASSET VALUES (Net Assets ÷ Shares Outstanding): | | | | | | | |
| (offering and redemption price per share) | | | | | | | |
| Investment Class | | | $14.77 | | | $9.41 | |
| Service Class | | | 14.37 | | | 9.20 | |
| Investments at identified cost | | $ | 119,132,082 | | $ | 277,662,221 | |
| Market value of loaned securities2 | | | 3,794,450 | | | 2,617,413 | |
1 See Notes to Financial Statements for information on non-cash collateral on loaned securities.
2 Market value of loaned securities backed by non-cash collateral is as of prior business day.
| 18 | Royce Capital Fund 2021 Annual Report to Shareholders | THE ACCOMPANYING NOTES ARE AN INTEGRAL PART OF THESE FINANCIAL STATEMENTS |
| Statements of Operations | Year Ended December 31, 2021 |
| | | Micro-Cap
Portfolio | | Small-Cap
Portfolio | |
| INVESTMENT INCOME: | | | | | | | |
| INCOME: | | | | | | | |
| Dividends | | $ | 1,451,729 | | $ | 5,563,543 | |
| Foreign withholding tax | | | (20,791 | ) | | – | |
| Securities lending | | | 11,648 | | | 779 | |
| Total income | | | 1,442,586 | | | 5,564,322 | |
| EXPENSES: | | | | | | | |
| Investment advisory fees | | | 2,339,441 | | | 3,865,688 | |
| Distribution fees | | | 79,614 | | | 537,913 | |
| Administrative and office facilities | | | 88,571 | | | 164,388 | |
| Trustees' fees | | | 38,390 | | | 80,637 | |
| Audit | | | 33,281 | | | 34,149 | |
| Custody | | | 29,044 | | | 50,739 | |
| Shareholder servicing | | | 15,079 | | | 14,666 | |
| Shareholder reports | | | 13,662 | | | 27,850 | |
| Legal | | | 7,098 | | | 14,589 | |
| Other expenses | | | 12,160 | | | 23,279 | |
| Total expenses | | | 2,656,340 | | | 4,813,898 | |
| Compensating balance credits | | | (9 | ) | | (11 | ) |
| Fees waived by investment adviser | | | (59,011 | ) | | (59,923 | ) |
| Expenses reimbursed by investment adviser | | | (28,550 | ) | | (41,119 | ) |
| Net expenses | | | 2,568,770 | | | 4,712,845 | |
| Net investment income (loss) | | | (1,126,184 | ) | | 851,477 | |
| REALIZED AND UNREALIZED GAIN (LOSS) ON INVESTMENTS AND FOREIGN CURRENCY: | | | | | | | |
| NET REALIZED GAIN (LOSS): | | | | | | | |
| Investments | | | 41,061,121 | | | 73,334,166 | |
| Foreign currency transactions | | | (1,567 | ) | | – | |
| NET CHANGE IN UNREALIZED APPRECIATION (DEPRECIATION): | | | | | | | |
| Investments | | | 7,347,078 | | | 23,002,833 | |
| Other assets and liabilities denominated in foreign currency | | | (60 | ) | | – | |
| Net realized and unrealized gain (loss) on investments and foreign currency | | | 48,406,572 | | | 96,336,999 | |
| NET INCREASE (DECREASE) IN NET ASSETS FROM INVESTMENT OPERATIONS | | $ | 47,280,388 | | $ | 97,188,476 | |
| THE ACCOMPANYING NOTES ARE AN INTEGRAL PART OF THESE FINANCIAL STATEMENTS | Royce Capital Fund 2021 Annual Report to Shareholders | 19 |
Statements of Changes in Net Assets
| | | | Micro-Cap Portfolio | | Small-Cap Portfolio | |
| | | | Year Ended 12/31/21 | | | Year Ended 12/31/20 | | | Year Ended 12/31/21 | | | Year Ended 12/31/20 | |
| INVESTMENT OPERATIONS: | | | | | | | | | | | | | |
| Net investment income (loss) | | $ | (1,126,184 | ) | $ | (715,479 | ) | $ | 851,477 | | $ | 2,114,816 | |
| Net realized gain (loss) on investments and foreign currency | | | 41,059,554 | | | 8,169,382 | | | 73,334,166 | | | (62,579,226 | ) |
| Net change in unrealized appreciation (depreciation) on investments and foreign currency | | | 7,347,018 | | | 19,465,169 | | | 23,002,833 | | | 34,195,166 | |
| Net increase (decrease) in net assets from investment operations | | | 47,280,388 | | | 26,919,072 | | | 97,188,476 | | | (26,269,244 | ) |
| DISTRIBUTIONS: | | | | | | | | | | | | | |
| Total distributable earnings | | | | | | | | | | | | | |
| Investment Class | | | (6,830,287 | ) | | (1,725,374 | ) | | (2,372,831 | ) | | (3,913,734 | ) |
| Service Class | | | (1,339,305 | ) | | (371,288 | ) | | (2,440,124 | ) | | (4,765,060 | ) |
| Total distributions | | | (8,169,592 | ) | | (2,096,662 | ) | | (4,812,955 | ) | | (8,678,794 | ) |
| CAPITAL SHARE TRANSACTIONS: | | | | | | | | | | | | | |
| Value of shares sold | | | | | | | | | | | | | |
| Investment Class | | | 26,804,964 | | | 11,192,683 | | | 23,770,159 | | | 22,407,979 | |
| Service Class | | | 9,163,274 | | | 11,856,775 | | | 2,580,610 | | | 93,586,484 | |
| Distributions reinvested | | | | | | | | | | | | | |
| Investment Class | | | 6,830,287 | | | 1,725,374 | | | 2,372,831 | | | 3,913,734 | |
| Service Class | | | 1,339,305 | | | 371,288 | | | 2,440,124 | | | 4,765,060 | |
| Value of shares redeemed | | | | | | | | | | | | | |
| Investment Class | | | (43,275,235 | ) | | (32,465,966 | ) | | (47,550,848 | ) | | (30,430,274 | ) |
| Service Class | | | (15,848,237 | ) | | (14,453,059 | ) | | (53,801,234 | ) | | (98,583,746 | ) |
| Net increase (decrease) in net assets from capital share transactions | | | (14,985,642 | ) | | (21,772,905 | ) | | (70,188,358 | ) | | (4,340,763 | ) |
| Net Increase (Decrease) in Net Assets | | | 24,125,154 | | | 3,049,505 | | | 22,187,163 | | | (39,288,801 | ) |
| NET ASSETS: | | | | | | | | | | | | | |
| Beginning of year | | | 162,147,983 | | | 159,098,478 | | | 359,452,897 | | | 398,741,698 | |
| End of year | | $ | 186,273,137 | | $ | 162,147,983 | | $ | 381,640,060 | | $ | 359,452,897 | |
| 20 | Royce Capital Fund 2021 Annual Report to Shareholders | THE ACCOMPANYING NOTES ARE AN INTEGRAL PART OF THESE FINANCIAL STATEMENTS |
Financial Highlights
This table is presented to show selected data for a share outstanding throughout each year and to assist shareholders in evaluating a Fund’s performance for the periods presented. Per share amounts have been determined on the basis of the weighted average number of shares outstanding during the period.
| | | | | | | | | | | | | | | | | | | | | | | | Ratio of Expenses to Average Net Assets | | | | |
| | | Net Asset Value,
Beginning of
Period | | Net Investment
Income (Loss) | | Net Realized and
Unrealized Gain (Loss) on
Investments and
Foreign Currency | | Total from
Investment
Operations | | Distributions
from Net
Investment
Income | | Distributions from
Net Realized Gain on
Investments and
Foreign Currency | | Total
Distributions | | Net Asset
Value, End of
Period | | Total Return | | Net Assets,
End of Period
(in thousands) | | Prior to Fee
Waivers,
Expense
Reimbursements
and Balance
Credits | | Prior to Fee
Waivers and
Expense
Reimbursements | | Net of Fee
Waivers and
Expense
Reimbursements | | Ratio of Net
Investment
Income (Loss) to
Average Net
Assets | | Portfolio
Turnover Rate |
| Micro-Cap Portfolio–Investment Class | | | | | | | | | | | | | | | | | | | | | | | | | |
| 2021 | | | $ | 11.91 | | | $ | (0.08 | ) | | $ | 3.61 | | | $ | 3.53 | | | $ | – | | | $ | (0.67 | ) | | $ | (0.67 | ) | | $ | 14.77 | | | 29 .98 | % | | $ | 157,042 | | | | 1.37 | % | | | 1.37 | % | | | 1.33 | % | | | (0.56 | )% | | | 25 | % |
| 2020 | | | | 9.75 | | | | (0.05 | ) | | | 2.36 | | | | 2.31 | | | | – | | | | (0.15 | ) | | | (0.15 | ) | | | 11.91 | | | 23 .79 | | | | 134,109 | | | | 1.47 | | | | 1.47 | | | | 1.33 | | | | (0.51 | ) | | | 25 | |
| 2019 | | | | 8.97 | | | | (0.04 | ) | | | 1.77 | | | | 1.73 | | | | – | | | | (0.95 | ) | | | (0.95 | ) | | | 9.75 | | | 19 .55 | | | | 132,008 | | | | 1.43 | | | | 1.43 | | | | 1.33 | | | | (0.41 | ) | | | 26 | |
| 2018 | | | | 10.39 | | | | (0.03 | ) | | | (0.90 | ) | | | (0.93 | ) | | | – | | | | (0.49 | ) | | | (0.49 | ) | | | 8.97 | | | (9 .13 | ) | | | 127,457 | | | | 1.39 | | | | 1.39 | | | | 1.33 | | | | (0.30 | ) | | | 28 | |
| 2017 | | | | 11.11 | | | | (0.02 | ) | | | 0.58 | | | | 0.56 | | | | (0.08 | ) | | | (1.20 | ) | | | (1.28 | ) | | | 10.39 | | | 5 .29 | | | | 164,656 | | | | 1.38 | | | | 1.38 | | | | 1.38 | | | | (0.22 | ) | | | 30 | |
| Micro-Cap Portfolio–Service Class | | | | | | | | | | | | | | | | | | | | | | | | | |
| 2021 | | | $ | 11.63 | | | $ | (0.11 | ) | | $ | 3.50 | | | $ | 3.39 | | | $ | – | | | $ | (0.65 | ) | | $ | (0.65 | ) | | $ | 14.37 | | | 29 .52 | % | | $ | 29,231 | | | | 1.64 | % | | | 1.64 | % | | | 1.58 | % | | | (0.81 | )% | | | 25 | % |
| 2020 | | | | 9.54 | | | | (0.07 | ) | | | 2.31 | | | | 2.24 | | | | – | | | | (0.15 | ) | | | (0.15 | ) | | | 11.63 | | | 23 .55 | | | | 28,039 | | | | 1.72 | | | | 1.72 | | | | 1.58 | | | | (0.75 | ) | | | 25 | |
| 2019 | | | | 8.80 | | | | (0.06 | ) | | | 1.73 | | | | 1.67 | | | | – | | | | (0.93 | ) | | | (0.93 | ) | | | 9.54 | | | 19 .24 | | | | 27,090 | | | | 1.71 | | | | 1.71 | | | | 1.58 | | | | (0.66 | ) | | | 26 | |
| 2018 | | | | 10.21 | | | | (0.06 | ) | | | (0.87 | ) | | | (0.93 | ) | | | – | | | | (0.48 | ) | | | (0.48 | ) | | | 8.80 | | | (9 .29 | ) | | | 14,644 | | | | 1.64 | | | | 1.64 | | | | 1.58 | | | | (0.57 | ) | | | 28 | |
| 2017 | | | | 10.93 | | | | (0.04 | ) | | | 0.57 | | | | 0.53 | | | | (0.06 | ) | | | (1.19 | ) | | | (1.25 | ) | | | 10.21 | | | 5 .02 | | | | 32,067 | | | | 1.64 | | | | 1.64 | | | | 1.58 | | | | (0.43 | ) | | | 30 | |
| Small-Cap Portfolio–Investment Class | | | | | | | | | | | | | | | | | | | | | | | | | |
| 2021 | | | $ | 7.41 | | | $ | 0.03 | | | $ | 2.10 | | | $ | 2.13 | | | $ | (0.13 | ) | | $ | – | | | $ | (0.13 | ) | | $ | 9.41 | | | 28 .82 | % | | $ | 172,388 | | | | 1.11 | % | | | 1.11 | % | | | 1.08 | % | | | 0.37 | % | | | 51 | % |
| 2020 | | | | 8.19 | | | | 0.06 | | | | (0.65 | ) | | | (0.59 | ) | | | (0.07 | ) | | | (0.12 | ) | | | (0.19 | ) | | | 7.41 | | | (7 .15 | ) | | | 153,953 | | | | 1.19 | | | | 1.19 | | | | 1.08 | | | | 0.90 | | | | 95 | |
| 2019 | | | | 7.87 | | | | 0.09 | | | | 1.37 | | | | 1.46 | | | | (0.06 | ) | | | (1.08 | ) | | | (1.14 | ) | | | 8.19 | | | 18 .67 | | | | 173,492 | | | | 1.15 | | | | 1.15 | | | | 1.08 | | | | 1.04 | | | | 111 | |
| 2018 | | | | 8.77 | | | | 0.06 | | | | (0.78 | ) | | | (0.72 | ) | | | (0.07 | ) | | | (0.11 | ) | | | (0.18 | ) | | | 7.87 | | | (8 .24) | | | | 171,561 | | | | 1.11 | | | | 1.11 | | | | 1.08 | | | | 0.62 | | | | 56 | |
| 2017 | | | | 8.41 | | | | 0.05 | | | | 0.39 | | | | 0.44 | | | | (0.08 | ) | | | – | | | | (0.08 | ) | | | 8.77 | | | 5 .26 | | | | 228,620 | | | | 1.11 | | | | 1.11 | | | | 1.11 | | | | 0.55 | | | | 91 | |
| Small-Cap Portfolio–Service Class | | | | | | | | | | | | |
| 2021 | | | $ | 7.25 | | | $ | 0.01 | | | $ | 2.05 | | | $ | 2.06 | | | $ | (0.11 | ) | | $ | – | | | $ | (0.11 | ) | | $ | 9.20 | | | 28 .45 | % | | $ | 209,252 | | | | 1.35 | % | | | 1.35 | % | | | 1.33 | % | | | 0.10 | % | | | 51 | % |
| 2020 | | | | 8.01 | | | | 0.05 | | | | (0.64 | ) | | | (0.59 | ) | | | (0.05 | ) | | | (0.12 | ) | | | (0.17 | ) | | | 7.25 | | | (7 .33 | ) | | | 205,500 | | | | 1.43 | | | | 1.43 | | | | 1.33 | | | | 0.73 | | | | 95 | |
| 2019 | | | | 7.69 | | | | 0.06 | | | | 1.35 | | | | 1.41 | | | | (0.04 | ) | | | (1.05 | ) | | | (1.09 | ) | | | 8.01 | | | 18 .44 | | | | 225,250 | | | | 1.39 | | | | 1.39 | | | | 1.33 | | | | 0.86 | | | | 111 | |
| 2018 | | | | 8.55 | | | | 0.04 | | | | (0.76 | ) | | | (0.72 | ) | | | (0.03 | ) | | | (0.11 | ) | | | (0.14 | ) | | | 7.69 | | | (8 .50 | ) | | | 104,129 | | | | 1.34 | | | | 1.34 | | | | 1.33 | | | | 0.31 | | | | 56 | |
| 2017 | | | | 8.20 | | | | 0.02 | | | | 0.40 | | | | 0.42 | | | | (0.07 | ) | | | – | | | | (0.07 | ) | | | 8.55 | | | 5 .10 | | | | 263,549 | | | | 1.34 | | | | 1.34 | | | | 1.34 | | | | 0.32 | | | | 91 | |
| THE ACCOMPANYING NOTES ARE AN INTEGRAL PART OF THESE FINANCIAL STATEMENTS | Royce Capital Fund 2021 Annual Report to Shareholders | 21 |
Notes to Financial Statements
Summary of Significant Accounting Policies:
Royce Capital Fund – Micro-Cap Portfolio and Royce Capital Fund – Small-Cap Portfolio (the “Fund” or “Funds”) are the two series of Royce Capital Fund (the “Trust”), an open-end management investment company organized as a Delaware statutory trust. Shares of the Funds are offered to life insurance companies for allocation to certain separate accounts established for the purpose of funding qualified and non-qualified variable annuity contracts and variable life insurance contracts. Micro-Cap Portfolio and Small-Cap Portfolio commenced operations on December 27, 1996.
Classes of shares have equal rights as to earnings and assets, except that each class may bear different fees and expenses for distribution, shareholder servicing, registration and shareholder reports, and receive different compensating balance credits and expense reimbursements. Investment income, realized and unrealized capital gains or losses on investments and foreign currency, and expenses other than those attributable to a specific class are allocated to each class of shares based on its relative net assets.
The preparation of financial statements in conformity with accounting principles generally accepted in the United States requires management to make estimates and assumptions that affect the reported amounts of assets and liabilities and the disclosure of contingent assets and liabilities at the date of the financial statements and the reported amounts of income and expenses during the reporting period. Actual results could differ from those estimates.
Each Fund is an investment company and accordingly follows the investment company accounting and reporting guidance of the Financial Accounting Standards Board (FASB) Accounting Standard Codification Topic 946 “Financial Services-Investment Companies.”
Royce & Associates, LP, the Funds’ investment adviser, is a majority-owned subsidiary of Franklin Resources, Inc. and primarily conducts business using the name Royce Investment Partners (“Royce”).
VALUATION OF INVESTMENTS:
Securities are valued as of the close of trading on the New York Stock Exchange (NYSE) (generally 4:00 p.m. Eastern time) on the valuation date. Securities that trade on an exchange, and securities traded on Nasdaq’s Electronic Bulletin Board, are valued at their last reported sales price or Nasdaq official closing price taken from the primary market in which each security trades or, if no sale is reported for such day, at their highest bid price. Other over-the-counter securities for which market quotations are readily available are valued at their highest bid price, except in the case of some bonds and other fixed income securities which may be valued by reference to other securities with comparable ratings, interest rates and maturities, using established independent pricing services. The Funds value their non-U.S. dollar denominated securities in U.S. dollars daily at the prevailing foreign currency exchange rates as quoted by a major bank. Securities for which market quotations are not readily available are valued at their fair value in accordance with the provisions of the 1940 Act, under procedures approved by the Trust’s Board of Trustees, and are reported as Level 3 securities. As a general principle, the fair value of a security is the amount which the Fund might reasonably expect to receive for the security upon its current sale. However, in light of the judgment involved in fair valuations, there can be no assurance that a fair value assigned to a particular security will be the amount which the Fund might be able to receive upon its current sale. In addition, if, between the time trading ends on a particular security and the close of the customary trading session on the NYSE, events occur that are significant and may make the closing price unreliable, a Fund may fair value the security. The Funds use an independent pricing service to provide fair value estimates for relevant non-U.S. equity securities on days when the U.S. market volatility exceeds a certain threshold. This pricing service uses proprietary correlations it has developed between the movement of prices of non-U.S. equity securities and indices of U.S.-traded securities, futures contracts and other indications to estimate the fair value of relevant non-U.S. securities. When fair value pricing is employed, the prices of securities used by a Fund may differ from quoted or published prices for the same security. Investments in money market funds are valued at net asset value per share.
Various inputs are used in determining the value of each Fund’s investments, as noted above. These inputs are summarized in the three broad levels below:
| | Level 1 | – | quoted prices in active markets for identical securities. |
| | Level 2 | – | other significant observable inputs (including quoted prices for similar securities, foreign securities that may be fair valued and repurchase agreements). The table below includes all Level 2 securities. Any Level 2 securities with values based on quoted prices for similar securities would be noted in the Schedules of Investments. |
| | Level 3 | – | significant unobservable inputs (including last trade price before trading was suspended, or at a discount thereto for lack of marketability or otherwise, market price information regarding other securities, information received from the company and/or published documents, including SEC filings and financial statements, or other publicly available information). |
The inputs or methodology used for valuing securities are not necessarily an indication of the risk associated with investing in those securities.
| 22 | Royce Capital Fund 2021 Annual Report to Shareholders |
VALUATION OF INVESTMENTS (continued):
The following is a summary of the inputs used to value each Fund’s investments as of December 31, 2021. For a detailed breakout of common stocks by sector classification, please refer to the Schedules of Investments.
| | | LEVEL 1 | | LEVEL 2 | | LEVEL 3 | | TOTAL |
| Micro-Cap Portfolio | | | | | | | | | | | | | | | | |
| Common Stocks | | $ | 179,496,827 | | | $ | – | | | $ | 628,264 | | | $ | 180,125,091 | |
| Repurchase Agreement | | | – | | | | 6,587,541 | | | | – | | | | 6,587,541 | |
| Money Market Fund/Collateral Received for Securities Loaned | | | 396,893 | | | | – | | | | – | | | | 396,893 | |
| Small-Cap Portfolio | | | | | | | | | | | | | | | | |
| Common Stocks | | | 373,117,057 | | | | – | | | | – | | | | 373,117,057 | |
| Repurchase Agreement | | | – | | | | 8,492,332 | | | | – | | | | 8,492,332 | |
Level 3 Reconciliation:
| | | BALANCE AS OF
12/31/20 | | PURCHASES | | TRANSFERS IN 1 | | SALES | | REALIZED GAIN (LOSS) 2 | | UNREALIZED GAIN (LOSS) 2 | | BALANCE AS OF
12/31/21 |
| Micro-Cap Portfolio | | | | | | | | | | | | | | | | | | | | | | | | | | | | |
| Common Stocks | | $ | 325,500 | | | $ | – | | | $ | 628,264 | | | $ | – | | | $ | – | | | $ | (325,500 | ) | | $ | 628,264 | |
| 1 | Transfers into Level 3 represent securities for which there were no longer readily available market quotations at December 31, 2021. |
| 2 | The net change in unrealized appreciation (depreciation) is included in the accompanying Statement of Operations. Change in unrealized appreciation (depreciation) includes net unrealized appreciation (depreciation) resulting from changes in investment values during the reporting period and the reversal of previously recorded unrealized appreciation (depreciation) when gains or losses are realized. Net realized gain (loss) from investments and foreign currency transactions is included in the accompanying Statement of Operations. |
REPURCHASE AGREEMENTS:
The Funds may enter into repurchase agreements with institutions that the Funds’ investment adviser has determined are creditworthy. Each Fund restricts repurchase agreements to maturities of no more than seven days. Securities pledged as collateral for repurchase agreements, which are held until maturity of the repurchase agreements, are marked-to-market daily and maintained at a value at least equal to the principal amount of the repurchase agreement (including accrued interest). Repurchase agreements could involve certain risks in the event of default or insolvency of the counter-party, including possible delays or restrictions upon the ability of each Fund to dispose of its underlying securities. The remaining contractual maturities of repurchase agreements held by the Funds at December 31, 2021 are overnight and continuous.
FOREIGN CURRENCY:
Net realized foreign exchange gains or losses arise from sales and maturities of short-term securities, sales of foreign currencies, expiration of currency forward contracts, currency gains or losses realized between the trade and settlement dates on securities transactions, and the difference between the amounts of dividends, interest, and foreign withholding taxes recorded on each Fund’s books and the U.S. dollar equivalent of the amounts actually received or paid. Net unrealized foreign exchange gains and losses arise from changes in the value of assets and liabilities, other than investments in securities at the end of the reporting period, as a result of changes in foreign currency exchange rates.
The Funds do not isolate that portion of the results of operations resulting from fluctuations in foreign exchange rates on investments from the fluctuations arising from changes in market prices of securities held. Such fluctuations are included with the net realized and unrealized gain or loss on investments.
SECURITIES LENDING:
The Funds loan securities through a lending agent, State Street Bank and Trust Company, to qualified institutional investors for the purpose of earning additional income. The lending agent receives and holds collateral from such borrowers to secure their obligations to the Funds. Such loans must be secured at all times by collateral in an amount at least equal to the market value of the loaned securities. The market values of the loaned securities and the collateral fluctuate and are determined at the close of each business day by the lending agent. Borrowers are required to post additional collateral to the lending agent on the next succeeding business day in the event of a collateral shortfall. Counterparty risk is further reduced by loaning securities only to parties that participate in a Global Securities Lending Program organized and monitored by the lending agent and that are deemed by it to satisfy its requirements and by having the lending agent enter into securities lending agreements with such borrowers. The lending agent is not affiliated with Royce.
Collateral may be in the form of cash or U.S. Treasuries. Cash collateral is invested in certain money market pooled investment vehicles. The Funds record a liability in their respective Statements of Assets and Liabilities for the return of such cash collateral during periods in which securities are on loan. The Funds bear the risk of loss for any decrease in the market value of the loaned securities or the investments purchased with cash collateral received from the borrowers.
Pursuant to the agreement in place between the Funds and the lending agent, if a borrower fails to return loaned securities, and the cash collateral being maintained by the lending agent on behalf of such borrower is insufficient to cover the value of loaned securities and provided such collateral insufficiency is not the result of investment losses, the lending agent shall, at its option, either replace the loaned
| Royce Capital Fund 2021 Annual Report to Shareholders | 23 |
Notes to Financial Statements (continued)
SECURITIES LENDING (continued):
securities or pay the amount of the shortfall to the Funds. In the event of the bankruptcy of a borrower, the Funds could experience delay in recovering the loaned securities or only recover cash or a security of equivalent value.
Loans of securities generally do not have stated maturity dates, and the Funds may recall a security at any time. The Funds’ securities lending income consists of the income earned on investing cash collateral, plus any premium payments received for lending certain securities, less any rebates paid to borrowers and lending agent fees associated with the loan. Pursuant to the agreement in place between the Funds and the lending agent, the Funds are responsible for any shortfall in the event the value of the investments purchased with cash collateral is insufficient to pay the rebate fee to the borrower.
The following table presents cash collateral and the market value of securities on loan collateralized by cash collateral held by the Funds at December 31, 2021:
| | CASH COLLATERAL1 | SECURITIES ON LOAN
COLLATERALIZED BY CASH COLLATERAL | NET AMOUNT |
| Micro-Cap Portfolio | $396,893 | $(374,550) | $22,343 |
| 1 | Absent an event of default, assets and liabilities are presented gross and not offset in the Statements of Assets and Liabilities. The contractual maturity of cash collateral is overnight and continuous. |
The following table presents non-cash collateral and the market value of securities on loan collateralized by non-cash collateral held by the Funds’ custodian at December 31, 2021:
| | | NON-CASH COLLATERAL | | SECURITIES ON LOAN
COLLATERALIZED BY NON-CASH COLLATERAL | | NET AMOUNT |
| Micro-Cap Portfolio | | | $3,497,005 | | | | $(3,419,900 | ) | | | $77,105 | |
| Small-Cap Portfolio | | | 2,674,087 | | | | (2,617,413 | ) | | | 56,674 | |
DISTRIBUTIONS AND TAXES:
As qualified regulated investment companies under Subchapter M of the Internal Revenue Code, the Funds are not subject to income taxes to the extent that each Fund distributes substantially all of its taxable income for its fiscal year.
The Funds pay any dividends and capital gain distributions annually in December. Dividends from net investment income and distributions from capital gains are determined at a class level. Because federal income tax regulations differ from generally accepted accounting principles, income and capital gain distributions determined in accordance with tax regulations may differ from net investment income and realized gains recognized for financial reporting purposes. Accordingly, the character of distributions and composition of net assets for tax purposes differ from those reflected in the accompanying financial statements.
INVESTMENT TRANSACTIONS AND RELATED INVESTMENT INCOME:
Investment transactions are accounted for on the trade date. Dividend income is recorded on the ex-dividend date. Non-cash dividend income is recorded at the fair market value of the securities received. Interest income is recorded on an accrual basis. Realized gains and losses from investment transactions are determined on the basis of identified cost for book and tax purposes.
EXPENSES:
The Funds incur direct and indirect expenses. Expenses directly attributable to a Fund are charged to the Fund’s operations, while expenses applicable to more than one of the Royce Funds are allocated equitably. Certain personnel, occupancy costs and other administrative expenses related to all of the Royce Funds are allocated by Royce under an administration agreement and are included in administrative and office facilities and legal expenses.
COMPENSATING BALANCE CREDITS:
The Funds have arrangements with their custodian bank and transfer agent, whereby a portion of the custodian’s fee and transfer agent’s fee is paid indirectly by credits earned on a Fund’s cash on deposit with the bank and transfer agent. These deposit arrangements are an alternative to purchasing overnight investments. Conversely, a Fund pays interest to the custodian on any cash overdrafts, to the extent they are not offset by credits earned on positive cash balances.
LINE OF CREDIT:
The Funds, along with certain other Royce Funds, participate in a $65 million line of credit (“Credit Agreement”) with State Street Bank and Trust Company to be used for temporary or emergency purposes. This revolving Credit Agreement expires on October 7, 2022. Pursuant to the Credit Agreement, each participating Fund is liable for a portion of the commitment fee for the credit facility and for principal and interest payments related to borrowings made by that Fund. Borrowings under the Credit Agreement bear interest at a variable rate equal to the Applicable Rate plus the Applicable Margin. The term Applicable Rate means, for any day, a rate equal to the sum of (a) 0.10%, plus (b) the higher of (i) the Federal Funds Effective Rate for such day, or (ii) the Overnight Bank Funding Rate for such day. The term Applicable Margin means 1.25%. The Funds did not utilize the line of credit during the year ended December 31, 2021.
| 24 | Royce Capital Fund 2021 Annual Report to Shareholders |
Capital Share Transactions (in shares):
| | | | | | | | | | | | | | | | | | | |
| | | SHARES SOLD | | | SHARES ISSUED FOR REINVESTMENT
OF DISTRIBUTIONS | | | SHARES REDEEMED | | | NET INCREASE (DECREASE) IN
SHARES OUTSTANDING | |
| | | Year Ended 12/31/21 | | | Year Ended 12/31/20 | | | Year Ended 12/31/21 | | | Year Ended 12/31/20 | | | Year Ended 12/31/21 | | | Year Ended 12/31/20 | | | Year Ended 12/31/21 | | | Year Ended 12/31/20 | |
| Micro-Cap Portfolio | | | | | | | | | | | | | | | | | | | | | | | | | | | | | | | | |
| Investment Class | | | 1,897,065 | | | | 1,277,467 | | | | 489,977 | | | | 150,556 | | | | (3,009,438 | ) | | | (3,709,748 | ) | | | (622,396 | ) | | | (2,281,725 | ) |
| Service Class | | | 663,833 | | | | 1,364,196 | | | | 98,696 | | | | 33,180 | | | | (1,140,542 | ) | | | (1,825,235 | ) | | | (378,013 | ) | | | (427,859 | ) |
| Small-Cap Portfolio | | | | | | | | | | | | | | | | | | | | | | | | | | | | | | | | |
| Investment Class | | | 2,660,185 | | | | 3,859,356 | | | | 262,481 | | | | 537,600 | | | | (5,372,952 | ) | | | (4,807,942 | ) | | | (2,450,286 | ) | | | (410,986 | ) |
| Service Class | | | 293,885 | | | | 14,258,227 | | | | 276,032 | | | | 669,250 | | | | (6,172,963 | ) | | | (14,694,441 | ) | | | (5,603,046 | ) | | | 233,036 | |
Investment Adviser and Distributor:
INVESTMENT ADVISER:
Under the Trust’s investment advisory agreements with Royce, Royce is entitled to receive investment advisory fees in respect of each Fund that are computed daily and payable monthly. Royce has contractually agreed, without right of termination, to waive fees and/or reimburse expenses (excluding brokerage commissions, taxes, interest, litigation expenses, acquired fund fees and expenses, and other expenses not borne in the ordinary course of business) to the extent necessary to maintain the Funds’ net annual operating expense ratios at specified levels through April 30, 2022. To the extent that they impacted net expenses for the year ended December 31, 2021, the effects of those arrangements are shown below. See the Prospectus for contractual waivers and expiration dates.
| | ANNUAL CONTRACTUAL
ADVISORY FEE AS A | | COMMITTED NET ANNUAL OPERATING EXPENSE RATIO CAP | | YEAR ENDED
DECEMBER 31, 2021 | |
| | PERCENTAGE OF AVERAGE
NET ASSETS | Investment Class | Service Class | | Net advisory fees | | | Advisory fees waived | |
| Micro-Cap Portfolio | | 1.25% | | 1.33% | | 1.58% | | $ | 2,280,430 | | | $ | 59,011 | |
| Small-Cap Portfolio | | 1.00% | | 1.08% | | 1.33% | | | 3,805,765 | | | | 59,923 | |
DISTRIBUTOR:
Royce Fund Services, LLC (“RFS”), the distributor of the Trust’s shares, is a wholly owned subsidiary of Royce. RFS is entitled to receive distribution fees from each Fund’s Service Class that are computed daily and payable monthly, at an annual rate of 0.25% of the average net assets of each Class. For the year ended December 31, 2021, Micro-Cap Portfolio-Service Class recorded distribution fees of $79,614 and Small-Cap Portfolio-Service Class recorded distribution fees of $537,913.
Purchases and Sales of Investment Securities:
For the year ended December 31, 2021, the costs of purchases and the proceeds from sales of investment securities, other than short-term securities and collateral received for securities loaned, were as follows:
| | | PURCHASES | | | SALES | |
| Micro-Cap Portfolio | | $ | 43,578,076 | | | $ | 71,320,319 | |
| Small-Cap Portfolio | | | 191,793,059 | | | | 262,638,829 | |
Cross trades were executed by the Funds pursuant to Rule 17a-7 under the 1940 Act. Cross trading is the buying or selling of portfolio securities between funds to which Royce serves as investment adviser. The Trust’s Chief Compliance Officer reviews such transactions each quarter for compliance with the requirements and restrictions set forth by Rule 17a-7, and reports the results of that review to the Board of Trustees. Cross trades for the year ended December 31, 2021, were as follows:
| | COSTS OF PURCHASES | PROCEEDS FROM SALES | REALIZED GAIN (LOSS) |
| Micro-Cap Portfolio | $236,265 | $ – | $ – |
Class Specific Expenses:
Class specific expenses were as follows for the year ended December 31, 2021:
| | | DISTRIBUTION
FEES | | | SHAREHOLDER
SERVICING | | | SHAREHOLDER
REPORTS | | | TRANSFER AGENT
BALANCE CREDITS | | | TOTAL | | | CLASS LEVEL
EXPENSES
REIMBURSED BY
INVESTMENT
ADVISER | |
| Micro-Cap Portfolio – Investment Class | | $ | – | | | $ | 8,045 | | | $ | 12,598 | | | $ | (4 | ) | | $ | 20,639 | | | $ | 20,639 | |
| Micro-Cap Portfolio – Service Class | | | 79,614 | | | | 7,034 | | | | 1,064 | | | | (1 | ) | | | 87,711 | | | | 7,911 | |
| | | | 79,614 | | | | 15,079 | | | | 13,662 | | | | (5 | ) | | | | | | | 28,550 | |
| Small-Cap Portfolio – Investment Class | | | – | | | | 7,587 | | | | 22,642 | | | | (3 | ) | | | 30,226 | | | | 30,226 | |
| Small-Cap Portfolio – Service Class | | | 537,913 | | | | 7,079 | | | | 5,208 | | | | (1 | ) | | | 550,199 | | | | 10,893 | |
| | | | 537,913 | | | | 14,666 | | | | 27,850 | | | | (4 | ) | | | | | | | 41,119 | |
Royce Capital Fund 2021 Annual Report to Shareholders | 25
Notes to Financial Statements (continued)
Tax Information:
At December 31, 2021, net unrealized appreciation (depreciation) based on identified cost for tax purposes was as follows:
| | | | | | | NET UNREALIZED | | GROSS UNREALIZED |
| | TAX BASIS COST | | APPRECIATION (DEPRECIATION) | | Appreciation | (Depreciation) |
| Micro-Cap Portfolio | | $ | 125,779,700 | | | $ | 61,329,825 | | | $ | 73,501,887 | | | $ | 12,172,062 | |
| Small-Cap Portfolio | | | 286,394,298 | | | | 95,215,091 | | | | 102,097,604 | | | | 6,882,513 | |
The primary causes of the difference between book and tax basis cost are the timing of the recognition of losses on securities sold and investments in publicly traded partnerships.
Distributions during the years ended December 31, 2021 and 2020, were characterized as follows for tax purposes:
| | | ORDINARY INCOME | | LONG-TERM CAPITAL GAINS | |
| | | | 2021 | | | | 2020 | | | | 2021 | | | | 2020 | |
| Micro-Cap Portfolio | | $ | – | | | $ | – | | | $ | 8,169,592 | | | $ | 2,096,662 | |
| Small-Cap Portfolio | | | 4,812,955 | | | | 2,911,798 | | | | – | | | | 5,766,996 | |
The tax basis components of distributable earnings at December 31, 2021, were as follows:
| | UNDISTRIBUTED
ORDINARY INCOME | UNDISTRIBUTED
LONG-TERM CAPITAL GAINS OR
(CAPITAL LOSS CARRYFORWARD) | NET UNREALIZED
APPRECIATION
(DEPRECIATION)1 | TOTAL DISTRIBUTABLE
EARNINGS | CAPITAL LOSS
CARRYFORWARD
UTILIZED |
| Micro-Cap Portfolio | | $ | 6,812,354 | | | $ | 33,160,844 | | | $ | 61,329,742 | | | $ | 101,302,940 | | | $ | – | |
| Small-Cap Portfolio | | | 663,147 | | | | 5,456,234 | | | | 95,121,228 | | | | 101,240,609 | | | | 67,213,990 | |
| 1 | Includes timing differences on foreign currency, recognition of losses on securities sold and investments in Real Estate Investment Trusts and publicly traded partnerships. |
For financial reporting purposes, capital accounts and distributions to shareholders are adjusted to reflect the tax character of permanent book/tax differences. For the year ended December 31, 2021, the Funds recorded the following permanent reclassifications, which relate primarily to current net operating losses and investments in publicly traded partnerships. Results of operations and net assets were not affected by these reclassifications.
| | TOTAL DISTRIBUTABLE | PAID-IN |
| | EARNINGS (LOSS) | CAPITAL |
| Micro-Cap Portfolio | $14,470 | $(14,470) |
| Small-Cap Portfolio | – | – |
Management has analyzed the Funds’ tax positions taken on federal income tax returns for all open tax years (2018 – 2021) and has concluded that as of December 31, 2021, no provision for income tax is required in the Funds’ financial statements.
Subsequent Events:
Subsequent events have been evaluated through the date the financial statements were issued and it has been determined that no events have occurred that require disclosure.
26 | Royce Capital Fund 2021 Annual Report to Shareholders
Report of Independent Registered Public Accounting Firm
To the Board of Trustees of Royce Capital Fund and Shareholders of Royce Capital Fund – Micro-Cap Portfolio and Royce Capital Fund – Small-Cap Portfolio:
Opinions on the Financial Statements
We have audited the accompanying statements of assets and liabilities, including the schedules of investments, of Royce Capital Fund – Micro-Cap Portfolio and Royce Capital Fund – Small-Cap Portfolio (constituting Royce Capital Fund, hereafter collectively referred to as the "Funds") as of December 31, 2021, the related statements of operations for the year ended December 31, 2021, the statements of changes in net assets for each of the two years in the period ended December 31, 2021, including the related notes, and the financial highlights for each of the five years in the period ended December 31, 2021 (collectively referred to as the “financial statements”). In our opinion, the financial statements present fairly, in all material respects, the financial position of each of the Funds as of December 31, 2021, the results of each of their operations for the year then ended, the changes in each of their net assets for each of the two years in the period ended December 31, 2021 and each of the financial highlights for each of the five years in the period ended December 31, 2021 in conformity with accounting principles generally accepted in the United States of America.
Basis for Opinions
These financial statements are the responsibility of the Funds’ management. Our responsibility is to express an opinion on the Funds’ financial statements based on our audits. We are a public accounting firm registered with the Public Company Accounting Oversight Board (United States) (PCAOB) and are required to be independent with respect to the Funds in accordance with the U.S. federal securities laws and the applicable rules and regulations of the Securities and Exchange Commission and the PCAOB.
We conducted our audits of these financial statements in accordance with the standards of the PCAOB. Those standards require that we plan and perform the audit to obtain reasonable assurance about whether the financial statements are free of material misstatement, whether due to error or fraud.
Our audits included performing procedures to assess the risks of material misstatement of the financial statements, whether due to error or fraud, and performing procedures that respond to those risks. Such procedures included examining, on a test basis, evidence regarding the amounts and disclosures in the financial statements. Our audits also included evaluating the accounting principles used and significant estimates made by management, as well as evaluating the overall presentation of the financial statements. Our procedures included confirmation of securities owned as of December 31, 2021 by correspondence with the custodian and brokers; when replies were not received from brokers, we performed other auditing procedures. We believe that our audits provide a reasonable basis for our opinions.
/s/PricewaterhouseCoopers LLP
New York, New York
February 11, 2022
We have served as the auditor of one or more investment companies in the Franklin Templeton Group of Funds since 1948.
Royce Capital Fund 2021 Annual Report to Shareholders | 27
Understanding Your Fund’s Expenses (unaudited)
As a shareholder of a mutual fund, you pay ongoing expenses, including management fees and other Fund expenses including, for some funds, distribution and/or service (12b-1) fees. Using the information below, you can estimate how these ongoing expenses (in dollars) affect your investment and compare them with the ongoing expenses of other funds. You may also incur one-time transaction expenses which are not shown in this section and would result in higher total costs. The example is based on an investment of $1,000 invested at July 1, 2021, and held for the entire six-month period ended December 31, 2021. Service Class shares are generally available only through certain insurance companies who receive service fees from the Fund for services that they perform.
Actual Expenses
The first part of the table below provides information about actual account values and actual expenses. You may use the information in this section, together with the amount you invested, to estimate the expenses that you paid over the period. Simply divide your account value at December 31, 2021, by $1,000 (for example, an $8,600 account value divided by $1,000 = 8.6), then multiply the result by the number under the heading entitled “Expenses Paid During the Period” to estimate the expenses you paid on your account during this period.
Hypothetical Example for Comparison Purposes
The second part of the table below provides information about hypothetical account values and hypothetical expenses based on the Fund’s actual expense ratio and an assumed rate of return of 5% per year before expenses, which is not the Fund’s actual return. The hypothetical account values and expenses may not be used to estimate the actual ending account balance or expenses you paid for the period. You may use this information to compare the ongoing costs of investing in the Fund and other funds. To do so, compare this 5% hypothetical example with the 5% hypothetical examples that appear in the shareholder reports of the other funds.
Please note that the expenses shown in the table are meant to highlight your ongoing costs only and do not reflect any transactional costs, such as sales charges (loads), redemption fees, or exchange fees. Therefore, this section is useful in comparing ongoing costs only, and will not help you determine the relative total costs of owning different funds. In addition, if these transactional costs were included, your costs would have been higher.
| | | ACTUAL | | | HYPOTHETICAL (5% PER YEAR BEFORE EXPENSES) | |
| | | Beginning Account
Value 7/1/21 | | | Ending Account Value
12/31/21 | | | Expenses Paid During
the Period1 | | | Beginning Account
Value 7/1/21 | | | Ending Account Value
12/31/21 | | | Expenses Paid During
the Period1 | | | Annualized Expense
Ratio2 | |
| Investment Class | | | | | | | | | | | | | | | | | | | | | | | | | | | | |
| Micro-Cap Portfolio | | $ | 1,000.00 | | | $ | 1,038.26 | | | $ | 6.83 | | | $ | 1,000.00 | | | $ | 1,018.50 | | | $ | 6.77 | | | | 1.33 | % |
| Small-Cap Portfolio | | | 1,000.00 | | | | 1,043.20 | | | | 5.56 | | | | 1,000.00 | | | | 1,019.76 | | | | 5.50 | | | | 1.08 | % |
| Service Class | | | | | | | | | | | | | | | | | | | | | | | | | | | | |
| Micro-Cap Portfolio | | | 1,000.00 | | | | 1,036.71 | | | | 8.11 | | | | 1,000.00 | | | | 1,017.24 | | | | 8.03 | | | | 1.58 | % |
| Small-Cap Portfolio | | | 1,000.00 | | | | 1,042.81 | | | | 6.85 | | | | 1,000.00 | | | | 1,018.50 | | | | 6.77 | | | | 1.33 | % |
| 1 | Expenses are equal to the Fund's annualized expense ratio multiplied by the average account value for the period, multiplied by 184 days in the most recent fiscal half-year divided by 365 days (to reflect the half-year period). This information does not include fees or expenses of the variable annuity contracts investing in the Fund. |
| 2 | Annualized expense ratio used to derive figures in the table is based on the most recent fiscal half-year. |
Federal Tax Information
In January 2022, taxable shareholders that opted out of e-delivery were mailed a Form 1099-DIV reporting the federal tax status of all distributions paid during the calendar year 2021. Shareholders who elected e-delivery have received electronic notification of the form being available for download via their Online Account Access.
2021 Supplemental Tax Information:
| FUND | %
QDI | % U.S. GOVT
INCOME | % INCOME QUALIFYING
FOR DRD | LONG-TERM CAPITAL GAIN DISTRIBUTION
MAXIMUM ALLOWABLE (OOO’s) |
| Micro-Cap Portfolio | 0.00% | N/A | 0.00% | $ 8,170 |
| Small-Cap Portfolio | 100.00% | N/A | 100.00% | – |
Definitions:
% QDI: Qualified Dividend Income; % of net investment income and/or short-term capital gains distributions that qualify for treatment at long-term capital gain rates.
% U.S. Govt Income: % of investment income paid from U.S. Government obligations.
% Income Qualifying for DRD: % of investment income eligible for the corporate dividend received deduction.
28 | Royce Capital Fund 2021 Annual Report to Shareholders
Trustees and Officers
All Trustees and Officers may be reached c/o The Royce Funds, 745 Fifth Avenue, New York, NY 10151
Christopher D. Clark, Trustee1, President
Age: 56 | Number of Funds Overseen: 16 | Tenure: Since 2014
Principal Occupation(s) During Past Five Years: Chief Executive Officer (since July 2016), President (since July 2014), Co-Chief Investment Officer (since January 2014), Managing Director of Royce, a Member of the Board of Managers of Royce, having been employed by Royce since May 2007.
Patricia W. Chadwick, Trustee
Age: 73 | Number of Funds Overseen: 16 | Tenure: Since 2009
Non-Royce Directorships: Trustee of Voya Mutual Funds and Director of Wisconsin Energy Corp.
Principal Occupation(s) During Past 5 Years: Consultant and President of Ravengate Partners LLC (since 2000).
Christopher C. Grisanti, Trustee
Age: 60 | Number of Funds Overseen: 16 | Tenure: Since 2017
Non-Royce Directorships: None
Principal Occupation(s) During Past Five Years: Chief Equity Strategist and Senior Portfolio Manager at MAI Capital Management LLC, an investment advisory firm (since May 2020). Previously, Mr. Grisanti was Co-Founder and Chief Executive Officer of Grisanti Capital Management LLC, an investment advisory firm (from 1999 to 2020). Mr. Grisanti’s prior business experience also includes serving as Director of Research and Portfolio Manager at Spears Benzak, Salomon & Farrell (from 1994 to 1999) and a senior associate at the law firm of Simpson, Thacher & Bartlett (from 1988 to 1994).
Cecile B. Harper, Trustee
Age: 58 | Number of Funds Overseen: 16 | Tenure: Since 2020
Non-Royce Directorships: None
Principal Occupation(s) During Past Five Years: Board Member of Pyramid Peak Foundation (since January 2012); and Chief Operating Officer at the College Foundation at the University of Virginia (since October 2019). Ms. Harper’s prior business experience includes serving as Principal of Southeastern Asset Management (from December 1993 to September 2019); and a Board Member of Regional One Health Foundation (from June 2013 to September 2019).
Arthur S. Mehlman, Trustee
Age: 79 | Number of Funds Overseen: 16 | Tenure: Since 2004
Principal Occupation(s) During Past Five Years: Director/Trustee of registered investment companies constituting the Legg Mason Funds until his retirement on June 30, 2021; Director of The League for People with Disabilities, Inc.; Director of University of Maryland Foundation (non-profits). Formerly: Director of Municipal Mortgage & Equity, LLC (from October 2004 to April 1, 2011); Director of University of Maryland College Park Foundation (non-profit) (from 1998 to 2005); Partner, KPMG LLP (international accounting firm) (from 1972 to 2002); Director of Maryland Business Roundtable for Education (from July 1984 to June 2002)
G. Peter O’Brien, Trustee
Age: 76 | Number of Funds Overseen: 76 | Tenure: Since 2001
Non-Royce Directorships: Director/Trustee of registered investment companies constituting the 60 Legg Mason Funds.
Principal Occupation(s) During Past Five Years: Trustee Emeritus of Colgate University (since 2005); Board Member of Hill House, Inc. (since 1999); Formerly Director of TICC Capital Corp (from 2003-2017): Trustee of Colgate University (from 1996 to 2005), President of Hill House, Inc. (from 2001 to 2005) and Managing Director/Equity Capital Markets Group of Merrill Lynch & Co. (from 1971 to 1999).
Michael K. Shields, Trustee
Age: 63 | Number of Funds Overseen: 16 | Tenure: Since 2015
Principal Occupation(s) During Past Five Years: President and Chief Executive Officer of Piedmont Trust Company, a privately-owned North Carolina trust company and wealth management firm (since May 2012). Mr. Shields’s prior business experience includes managing institutional and mutual fund equity portfolios in New York at Scudder, Stevens & Clark where he was a Principal in the Global Equity Group (1992 – 1997) and US Trust where he was President & CIO of a wholly-owned investment firm subsidiary (1997 – 2002).
Francis D. Gannon, Vice President
Age: 54 | Tenure: Since 2014
Principal Occupation(s) During Past Five Years: Co-Chief Investment Officer (since January 2014) and Managing Director of Royce, having been employed by Royce since September 2006.
Daniel A. O’Byrne, Vice President
Age: 59 | Tenure: Since 1994
Principal Occupation(s) During Past Five Years: Principal and Vice President of Royce, having been employed by Royce since October 1986.
Peter K. Hoglund, Treasurer
Age: 55 | Tenure: Since 2015
Principal Occupation(s) During Past Five Years: Chief Financial Officer, Chief Administrative Officer, and Managing Director of Royce, having been employed by Royce since December 2014. Prior to joining Royce, Mr. Hoglund spent more than 20 years with Munder Capital Management in Birmingham, MI, serving as Managing Director and Chief Financial Officer and overseeing all financial aspects of the firm. He began his career at Munder as a portfolio manager.
John E. Denneen, Secretary and Chief Legal Officer
Age: 54 | Tenure: 1996-2001 and Since 2002
Principal Occupation(s) During Past Five Years: General Counsel, Managing Director, and, since June 2015, a Member of the Board of Managers of Royce. Chief Legal and Compliance Officer and Secretary of Royce.
Lisa Curcio, Chief Compliance Officer
Age: 62 | Tenure: Since 2004
Principal Occupation(s) During Past Five Years: Chief Compliance Officer of The Royce Funds (since October 2004) and Compliance Officer of Royce (since June 2004).
1 Interested Trustee.
Trustees will hold office until their successors have been duly elected and qualified or until their earlier resignation or removal. The Statement of Additional Information, which contains additional information about the Trust’s trustees and officers, is available and can be obtained without charge at www.royceinvest.com or by calling (800) 221-4268.
Royce Capital Fund 2021 Annual Report to Shareholders | 29
Notes to Performance and Other Important Information
The thoughts expressed in this report concerning recent market movements and future prospects for small company stocks are solely the opinion of Royce at December 31, 2021, and, of course, historical market trends are not necessarily indicative of future market movements. Statements regarding the future prospects for particular securities held in the Funds’ portfolios and Royce’s investment intentions with respect to those securities reflect Royce’s opinions as of December 31, 2021 and are subject to change at any time without notice. There can be no assurance that securities mentioned in this report will be included in any Royce-managed portfolio in the future.
Sector weightings are determined using the Global Industry Classification Standard (“GICS”). GICS was developed by, and is the exclusive property of, Standard & Poor’s Financial Services LLC (“S&P”) and MSCI Inc. (“MSCI”). GICS is the trademark of S&P and MSCI. “Global Industry Classification Standard (GICS)” and “GICS Direct” are service marks of S&P and MSCI.
All indexes referenced are unmanaged and capitalization weighted. Each index’s returns include net reinvested dividends and/or interest income. Frank Russell Company (“Russell”) is the source and owner of the trademarks, service marks and copyrights related to the Russell Indexes. Russell® is a trademark of Frank Russell Company. Neither Russell nor its licensors accept any liability for any errors or omissions in the Russell Indexes and/or Russell ratings or underlying data and no party may rely on any Russell Indexes and/or Russell ratings and/or underlying data contained in this communication. No further distribution of Russell Data is permitted without Russell’s express written consent. Russell does not promote, sponsor or endorse the content of this communication. The Russell 2000 is an index of domestic small-cap stocks. It measures the performance of the 2,000 smallest publicly traded U.S. companies in the Russell 3000 Index. The Russell 2000 Value and Growth Indexes consist of the respective value and growth stocks within the Russell 2000 as determined by Russell Investments. The Russell Microcap Index includes 1,000 of the smallest securities in the small-cap Russell 2000 Index along with the next smallest eligible securities as determined by Russell. The Russell 1000 Index is an index of domestic large-cap stocks. It measures the performance of the 1,000 publicly traded U.S. companies in the Russell 3000 Index. Securities are weighted based on their style score. The performance of an index does not represent exactly any particular investment, as you cannot invest directly in an index. Returns for the market indexes used in this report were based on information supplied to Royce by Russell Investments. Royce has not independently verified the above described information.
The Price-Earnings, or P/E, Ratio is calculated by dividing a company’s share price by its trailing 12-month earnings-per-share (EPS). The Price-to-Book, or P/B, Ratio is calculated by dividing a company’s share price by its book value per share. Standard deviation is a statistical measure within which a fund’s total returns have varied over time. The greater the standard deviation, the greater a fund’s volatility. Beta is a measure of the volatility or risk of an investment compared to the market as a whole. Alpha describes an investment strategy’s ability to beat the market. The Morningstar Style Map uses proprietary scores of a stock’s value and growth characteristics to determine its placement in one of the five categories listed on the horizontal axis. These characteristics are then compared to those of other stocks within the same market capitalization band. Each is scored from zero to 100 for both value and growth attributes. The value score is subtracted from the growth score to determine the overall style score. For the vertical, market cap axis, Morningstar subdivides into size groups. Giant-cap stocks are defined as those that account for the top 40% of the capitalization of each style zone; large-cap stocks represent the next 30%; mid-cap stocks the next 20%; small-cap stocks the next 7%; micro-cap stocks the smallest 3%. Standard deviation is a statistical measure within which a fund’s total returns have varied over time. The greater the standard deviation, the greater a fund’s volatility. The value score is subtracted from the growth score to determine the overall style score. For the Morningstar Small Blend Category: © 2022 Morningstar. All Rights Reserved. The information regarding the category in this piece is: (1) is proprietary to Morningstar and/or its content providers; (2) may not be copied or distributed; and (3) is not warranted to be accurate, complete or timely. Neither Morningstar nor its content providers are responsible for any damages or losses arising from any use of this information. Cyclical and Defensive are defined as follows: Cyclical: Communication Services, Consumer Discretionary, Energy, Financials, Industrials, Information Technology, and Materials. Defensive: Consumer Staples, Health Care, Real Estate, and Utilities. The Royce Funds is a service mark of The Royce Funds. Distributor: Royce Fund Services, LLC.
Royce Capital Fund–Micro-Cap Portfolio invests primarily in securities of micro-cap companies and Royce Capital Fund–Small-Cap Portfolio invests primarily in securities of small-cap companies. Investments in these types of companies may involve considerably more risk than investments in securities of larger-cap companies. (Please see “Primary Risks for Fund Investors” in the prospectus.) Royce Capital Fund–Micro-Cap Portfolio and Royce Capital Fund–Small-Cap Portfolio may each invest up to 25% its assets in foreign securities that may involve political, economic, currency, and other risks not encountered in U.S. investments. (Please see “Investing in Foreign Securities” in the prospectus.) A Fund that invests a significant portion of its assets in a limited number of stocks may be subject to considerably more risk than a more broadly diversified Fund because a decline in the value of any of these stocks would cause that Fund’s overall value to decline to a greater degree. A broadly diversified portfolio does not, however, ensure a profit for a Fund or guarantee against loss. Please read the prospectus carefully before investing or sending money. A copy of the Funds’ current prospectus and a Statement of Additional Information may be obtained by calling (800) 221-4268 or by visiting www.royceinvest.com. All publicly released material Fund information is disclosed by the Funds on their website at www.royceinvest.com.
Forward-Looking Statements
This material contains forward-looking statements within the meaning of the Securities Exchange Act of 1934, as amended (the “Exchange Act”), that involve risks and uncertainties, including, among others, statements as to:
• the Funds’ future operating results,
• the prospects of the Funds’ portfolio companies,
• the impact of investments that the Funds have made or may make,
• the dependence of the Funds’ future success on the general economy and its impact on the companies and industries in which the Funds invest, and
• the ability of the Funds’ portfolio companies to achieve their objectives.
This review and report use words such as “anticipates,” “believes,” “expects,” “future,” “intends,” and similar expressions to identify forward-looking statements. Actual results may differ materially from those projected in the forward-looking statements for any reason.
The Royce Funds have based the forward-looking statements included in this review and report on information available to us on the date of the report, and we assume no obligation to update any such forward-looking statements. Although The Royce Funds undertake no obligation to revise or update any forward-looking statements, whether as a result of new information, future events, or otherwise, you
30 | Royce Capital Fund 2021 Annual Report to Shareholders
Notes to Performance and Other Important Information (continued)
are advised to consult any additional disclosures that we may make through future shareholder communications or reports.
Proxy Voting
A copy of the policies and procedures that The Royce Funds use to determine how to vote proxies relating to portfolio securities and information regarding how each of The Royce Funds voted proxies relating to portfolio securities during the most recent 12-month period ended June 30 is available, without charge, on The Royce Funds’ website at www.royceinvest.com, by calling (800) 221-4268 (toll-free), and on the website of the Securities and Exchange Commission (“SEC”) at www.sec.gov.
Disclosure of Portfolio Holdings
The Funds’ complete portfolio holdings are also available on Exhibit F to Form N-PORT, which filings are made with the SEC within 60 days of the end of the first and third fiscal quarters. The Funds’ Form N-PORT filings are available on the SEC’s website at http://www.sec.gov.
Royce Capital Fund 2021 Annual Report to Shareholders | 31
This page is intentionally left blank.
32 | Royce Capital Fund 2021 Annual Report to Shareholders


About Royce Investment Partners
Unparalleled Knowledge + Experience
Pioneers in small-cap investing, with 45+ years
of experience, depth of knowledge, and focus.
Independent Thinking
The confidence to go against consensus, the insight
to uncover opportunities others might miss, and the
tenacity to stay the course through market cycles.
Specialized Approaches
U.S., international, and global investment strategies
that pursue approaches with different risk profiles.
Unwavering Commitment
Our team of 16 portfolio managers has significant
personal investments in the strategies they manage.
Contact Us
GENERAL INFORMATION
Additional Report Copies and Prospectus Inquiries
(800) 221-4268
RCF-REP-1221
| Item 2. | Code(s) of Ethics. As of the end of the period covered by this report, the Registrant had adopted a code of ethics, as defined in Item 2 of Form N-CSR, applicable to its principal executive officer, principal financial officer, principal accounting officer or controller, or persons performing similar functions. A copy of this code of ethics is filed as an exhibit to this Form N-CSR. During the period covered by this report, the Registrant did not: (i) amend any provision of its code of ethics that applies to its principal executive officer, principal financial officer, principal accounting officer or controller, or persons performing similar functions or (ii) grant any waiver, including an implicit waiver, from a provision of such code of ethics to its principal executive officer, principal financial officer, principal accounting officer or controller, or persons performing similar functions. |
| Item 3. | Audit Committee Financial Expert. |
| (a)(1) | The Board of Trustees of the Registrant has determined that it has an audit committee financial expert serving on its audit committee. |
| (a)(2) | Arthur S. Mehlman and Patricia W. Chadwick were designated by the Board of Trustees as the Registrant’s Audit Committee Financial Experts, effective April 15, 2004, and April 8, 2010, respectively. Mr. Mehlman and Ms. Chadwick are “independent” as defined in Section 2(a)(19) of the Investment Company Act of 1940 (the “1940 Act”). |
| Item 4. | Principal Accountant Fees and Services. |
Year ended December 31, 2021 - $45,708
Year ended December 31, 2020 - $44,812
Year ended December 31, 2021 - $0
Year ended December 31, 2020 - $0
Year ended December 31, 2021 - $19,505 – Preparation of tax returns and excise tax review
Year ended December 31, 2020 - $19,122 – Preparation of tax returns and excise tax review
Year ended December 31, 2021 - $0
Year ended December 31, 2020 - $0
| (e)(1) | Annual Pre-Approval: On an annual basis, the Registrant’s independent auditor submits to the Audit Committee a schedule of proposed audit, audit-related, tax and other non-audit services to be rendered to the Registrant and/or its investment adviser and its affiliates for the following year that require pre-approval by the Audit Committee. This schedule provides a description of each type of service that is expected to require pre-approval and the maximum fees that can be paid for each such service without further Audit Committee approval. The Audit Committee then reviews and determines whether to approve the types of scheduled services and the projected fees associated with them. Any subsequent revision to already pre-approved services or fees are presented for consideration at the next regularly scheduled Audit Committee meeting, as needed. |
If subsequent to the annual pre-approval of services and fees by the Audit Committee, the Registrant and/or its investment adviser and its affiliates determines that it would like to engage the Registrant’s independent auditor to perform a service not already pre-approved, the request is to be submitted to the Registrant’s Chief Financial Officer, and if he or she determines that the service fits within the independence guidelines (i.e., it is not a prohibited service), he or she will then arrange for a discussion of the proposed service and fee to be included on the agenda for the next regularly scheduled Audit Committee meeting so that pre-approval can be considered.
Interim Pre-Approval: If, in the judgment of the Registrant's Chief Financial Officer, a proposed engagement needs to commence before the next regularly scheduled Audit Committee meeting, he or she shall submit a written summary of the proposed engagement to all members of the Audit Committee, outlining the services, the estimated maximum cost, the category of the services (e.g., audit, audit-related, tax or other) and the rationale for engaging the Registrant’s independent auditor to perform the services. To the extent the proposed engagement involves audit, audit-related or tax services, any individual member of the Audit Committee who is an independent Board member is authorized to pre-approve the engagement. To the extent the proposed engagement involves non-audit services other than audit-related or tax, only the Chairman of the Audit Committee is authorized to pre-approve the engagement. The Registrant’s Chief Financial Officer will arrange for this interim review and coordinate with the appropriate member(s) of the Audit Committee. The Registrant’s independent auditor may not commence the engagement under consideration until the Registrant’s Chief Financial Officer has informed the auditor in writing that the required pre-approval has been obtained from an individual member of the Audit Committee who is an independent Board member or the Chairman of the Audit Committee, as applicable. Each member of the Audit Committee who pre-approves any engagements in between regularly scheduled Audit Committee meetings is to report, for informational purposes only, any pre-approval decisions to the Audit Committee at its next regularly scheduled meeting.
(e)(2) Not Applicable
(f) Not Applicable
(g) Year ended December 31, 2021 - $19,505
Year ended December 31, 2020 - $19,122
| (h) | No such services were rendered during 2021 or 2020. |
Item 5. Audit Committee of Listed Registrants. Not Applicable.
Item 6. Investments.
(a) See Item 1.
(b) Not Applicable.
Item 7. Disclosure of Proxy Voting Policies and Procedures for Closed-End Management Investment Companies. Not Applicable.
Item 8. Portfolio Managers of Closed-End Management Investment Companies. Not Applicable.
Item 9. Purchases of Equity Securities by Closed-End Management Investment Company and Affiliated Purchasers. Not Applicable.
Item 10. Submission of Matters to a Vote of Security Holders. Not Applicable.
Item 11. Controls and Procedures.
(a) Disclosure Controls and Procedures. The Principal Executive and Financial Officers concluded that the Registrant's Disclosure Controls and Procedures are effective based on their evaluation of the Disclosure Controls and Procedures as of a date within 90 days of the filing date of this report.
(b) Internal Control over Financial Reporting. There were no significant changes in Registrant's internal control over financial reporting or in other factors that could significantly affect this control subsequent to the date of the evaluation, including any corrective actions with regard to significant deficiencies and material weaknesses during the second fiscal quarter of the period covered by this report.
Item 12. Disclosure of Securities Lending Activities for Closed-End Management Investment Companies. Not applicable.
Item 13. Exhibits. Attached hereto.
(a)(1) The Registrant’s code of ethics pursuant to Item 2 of Form N-CSR.
(a)(2) Separate certifications by the Registrant’s Principal Executive Officer and Principal Financial Officer as required by Rule 30a-2(a) under the 1940 Act.
(a)(3) Not Applicable.
(b) Separate certifications by the Registrant’s Principal Executive Officer and Principal Financial Officer, pursuant to Section 906 of the Sarbanes-Oxley Act of 2002 and required by Rule 30a-2(b) under the 1940 Act.
[Signature page to follow.]
Pursuant to the requirements of the Securities Exchange Act of 1934 (the “Exchange Act”) and the 1940 Act, the registrant has duly caused this report to be signed on its behalf by the undersigned, thereunto duly authorized.
ROYCE CAPITAL FUND
BY: /s/ Christopher D. Clark
Christopher D. Clark
President
Date: February 24, 2022
Pursuant to the requirements of the Exchange Act and the 1940 Act, this report has been signed below by the following persons on behalf of the registrant and in the capacities and on the dates indicated.
| ROYCE CAPITAL FUND | ROYCE CAPITAL FUND |
| BY: /s/ Christopher D. Clark | BY: /s/ Peter K. Hoglund |
| Christopher D. Clark | Peter K. Hoglund |
| Date: February 24, 2022 | Date: February 24, 2022 |