UNITED STATES
SECURITIES AND EXCHANGE COMMISSION
Washington, D.C. 20549
FORM N-CSR
CERTIFIED SHAREHOLDER REPORT
OF
REGISTERED MANAGEMENT INVESTMENT COMPANIES
Investment Company Act File Number: 811-07537
Name of Registrant: Royce Capital Fund
Address of Registrant: 745 Fifth Avenue
New York, NY 10151
Name of agent for service: John E. Denneen, Esquire
Address of agent for service: 745 Fifth Avenue
New York, NY 10151
Registrant's telephone number, including area code: (212) 508-4500
Date of fiscal year end: December 31
Date of reporting period: January 1, 2023 – December 31, 2023
| Item 1. | Reports to Shareholders. |

royceinvest.com
Royce Capital Fund 2023 Annual
Review and Report to Shareholders
December 31, 2023
Royce Capital Fund–Micro-Cap Portfolio
Royce Capital Fund–Small-Cap Portfolio

Table of Contents

This page is not part of the Royce Capital Fund 2023 Annual Report to Shareholders | 1
Letter to Our Shareholders
2023: THE DOG THAT DIDN’T BARK
While every year is eventful and interesting in its own right, we think 2023 held particular interest for equity investors—specifically those of us who focus on small-cap stocks. There was no shortage of consequential geopolitical developments. Some, like the war in Ukraine, showed no evidence of ending or abating, while others, like the terrorist attack on Israel and consequent bombings in Gaza, were new events, as were the well publicized implosions of Silicon Valley, Signature, and First Republic Banks. The contagion was contained, however, and the rest the of the economic news was much brighter, at least here in the U.S. The year began with inflation still stubbornly high and, as a consequence, the Fed still hiking rates and committed to doing so until the rate of rising prices slowed. This commitment bred a curious form of cognitive dissonance, with every public statement from a Fed official pledging adherence to the central bank’s target of 2% inflation almost immediately meeting with word from a financial or investment pundit insisting that they really meant 3-4%.
This was understandable to some degree. Many observers pointed to both inflation’s moderating pace (after peaking in June of 2022) and the resilience of the U.S. economy as evidence that the Fed should take a victory lap and leave rates untouched—or cut them. Many investors shared these views while no doubt hoping that the positive returns for equities through the first half of 2023 would not be put at risk by another round of rate hikes. To be sure, some investors were concerned that “higher for longer” might be all it took to snuff out a nascent recovery for stocks. We shared some of this anxiety. After all, 2022 saw the most aggressive rate hike cycle in the Fed’s history. And it was not just a bad year for the capital markets, it was historically awful: the third-worst calendar year performance for both the small-cap Russell 2000 Index and the large-cap Russell 1000 Index since their shared inception date at the end of 1978, with each posting their lowest respective returns since 2008. It was the seventh worst year for the S&P 500 since its inception in 1928, and the worst ever for the Bloomberg Barclays US Aggregate Bond Index since its inception in 1976. As we wrote one year ago, 2022 offered nowhere to run and nowhere to hide.
2 | This page is not part of the Royce Capital Fund 2023 Annual Report to Shareholders
LETTER TO OUR SHAREHOLDERS
The most interesting, and ultimately most significant, element to 2023 was perhaps what did not happen.
The most consistently predicted and regularly anticipated recession—said to be imminent since 2021—
once again failed to materialize in 2023.
In this context, the fear of a second straight down year for stocks, which periodically rattled the U.S. equity markets at various times in 2023, seemed almost logical, hitting small- and large-cap stocks at different points—and with different intensities—throughout the year. However, by the end of December these worries had mostly dissipated. With the Fed holding the line on rates, higher for longer ultimately did not hold back returns. A growing economy, burgeoning optimism about a soft landing for inflation, and confidence that the rate hike cycle had ended combined to lift share prices, as did optimism for rate reductions in 2024. Despite these developments, however, the most interesting, and ultimately most significant, element to 2023 was perhaps what did not happen. The most consistently predicted and regularly anticipated recession—said to be imminent since 2021—once again failed to materialize in 2023. Its absence reminded us of “the curious incident of the dog in the night-time” from the famous Sherlock Holmes story, “The Adventure of Silver Blaze.” The iconic detective solves the case by pointing out how odd it was that the dog guarding the pen where the titular racehorse was stabled failed to bark when Silver Blaze was stolen. The phrase has since been used as shorthand to describe situations when what doesn’t happen matters at least as much, if not more, than what does. Which is about as apt a description of 2023 as we think can be found.
THE STATE OF SMALL-CAP
As measured by the Russell 2000 Index, small-cap stocks did quite well in 2023, advancing 16.9%. Yet most of this gain came in a robust rally from the 2023 low on October 31st through the end of the year. So, although small-caps kicked off the year with high returns, they trended mostly downward from early February into Halloween. All told, the Russell 2000 had a positive return in just five months in 2023: January, June, July, November, and December, with the last two months combining to post an impressive gain of 22.4%. Thanks to this exceptional close, the Russell 2000 escaped a bear market at the end of
2023, though the small-cap index remained down -14.3% from its last peak on 11/8/21, while large-caps continued to establish new highs in December and into January 2024. Moreover, as of 12/31/23, the average stock in the small-cap index was -25.1% off its 52-week high. In this context, it was not terribly surprising that small-cap’s excellent finish could not lift its calendar-year return above large-cap’s. The Russell 1000 Index gained 26.5% in 2023 while also beating small-cap for the 3-, 5-, and 10-year periods ended 12/31/23. In fact, large-caps outpaced small-caps in nine of the last 10 calendar years.
Small-Caps Lagged Large-Caps from the Russell 2000’s Last Peak
Russell 2000 and Russell 1000 Cumulative Returns, 11/8/21-12/31/23
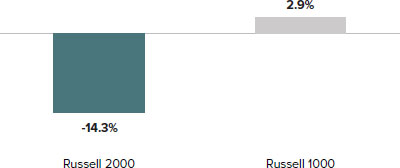
Past performance is no guarantee of future results.
This seemingly chronic bout of underperformance has made the current cycle a deeply frustrating one for small-cap investors. At the end of January 2024, 594 days had passed from the current cycle low for the Russell 2000, making it the second longest stretch without recovering its prior peak on record. The two other lengthy small-cap cycles each encompassed dramatic developments: the implosion of high-flying technology stocks in 2000-02, when the Russell 2000 needed 456 days from its trough to match its previous peak, and the 2008-09 Financial Crisis, when 704 days passed before small-caps recovered from the trough during that global financial catastrophe. So, while the current small-cap cycle has taken place amid ample uncertainty along with a record pace of interest rate increases, it
This page is not part of the Royce Capital Fund 2023 Annual Report to Shareholders | 3
LETTER TO OUR SHAREHOLDERS
has lacked the existential threats that characterized the Internet Bubble and, even more so, the Financial Crisis. The latter period also saw less bifurcation between small- and large-cap returns. The key question, then, is when will this cycle end and potentially usher in a small-cap outperformance run? It’s a point we’ll touch on later in this letter.
Within small-cap, both the value and growth indexes had strong finishes to the year, with the 4Q23 advantage squarely in value’s favor: the Russell 2000 Value Index advanced 15.3% versus 12.7% for the Russell 2000 Growth Index. It’s comparatively rare for small-cap value to beat its growth sibling in a positive quarter, particularly one with double-digit gains. It’s happened in only 42 of 119 positive quarters, or 35% of the time since the Russell 2000’s inception on 12/31/78. The Russell 2000 Value also led from the previous 2023 small-cap high on July 31st, up 4.0% versus -0.2% through the end of December. For 2023 as a whole, however, growth led, gaining 18.7% versus 14.6%. It’s worth noting that 2023’s results contributed to something of a sawtooth pattern of relative performance. The Russell 2000 Value led for the 3-year (in which the Russell 2000 Growth lost -3.5%) and 5-year periods while small-cap growth, in addition to its 1-year advantage, also outperformed for the 10-year period ended 12/31/23.
THE VALUATION SITUATION
Reviewing long-term performance patterns, we find that small-cap enjoyed a longstanding advantage over large-cap—just as small-cap value did versus small-cap growth. Each of these dynamics began to shift in the aftermath of the Financial Crisis, starting in earnest in 2011. In eight of the last 13 years, the Russell 1000 and Russell 2000 Growth each had higher returns than both the Russell 2000 and Russell 2000 Value. Yet prior to that, the long-term edge was with the Russell 2000 and Russell 2000 Value. In light of this dominance from large-caps—and more recently mega-cap stocks—it appears that many investors may have forgotten how anomalous the backdrop to the last 13 years has been until just recently, with anemic economic growth and record low interest rates.
Now that both GDP and rates are returning to more historically typical levels, we expect to see some meaningful long-term mean reversion going forward. To that end, large-cap outperformance cycles have historically peaked when a relatively small number of the largest stocks were winning the lion’s share of performance—which was the case with the S&P 500 and the Nasdaq Composite Indexes in 1973 and March 2000.
We therefore see something of a silver lining to the recent relative performance woes for small-cap stocks versus their
Large-Cap Cycles Peak at Market Tops Crowded with Mega-Caps
Weight of Top 5 S&P 500 Stocks vs. Small-Cap Relative Performance, 9/29/72-12/31/23

Source: Furey Research Partners
Past performance is no guarantee of future results.
4 | This page is not part of the Royce Capital Fund 2023 Annual Report to Shareholders
LETTER TO OUR SHAREHOLDERS
Relative Valuations for Small Caps vs. Large Caps Are Near Their Lowest in 25 Years
Russell 2000 vs. Russell 1000 Median LTM EV/EBIT¹ (ex. Negative EBIT Companies), 12/31/98 through 12/31/23

1 Earnings Before Interest and Taxes
Past performance is no guarantee of future results. Source: FactSet
larger peers. The Russell 2000 sported a far more attractive valuation than its large-cap counterpart at the end of last year. Using our preferred index valuation metric of enterprise value to earnings before interest and taxes, or EV/EBIT, the Russell 2000 finished 2023 not far from its 25-year low relative to the Russell 1000.
Similarly, small-cap value continued to sell at a below average valuation compared to small-cap growth at the end of the year, as measured by EV/EBIT. Micro-cap stocks also remain very attractively valued relative to large-cap based on EV/EBIT. As small-cap specialists, we see the combination of more attractive valuations and reversals in long-term performance patterns as showing the significant performance potential that exists for small-cap, small-cap value, and micro-cap stocks—especially when stacked against their large- and mega-cap counterparts.
SMALL-CAP OPPORTUNITIES
To be sure, with the Fed’s decision on 1/31/24 to leave interest rates unchanged for a third consecutive time, the backdrop of normalized interest rates, tamer inflation, and a growing, nicely resilient U.S. economy appears amenable to strong equity performance. It also looks to us that small-cap’s
lengthy stretch in the relative performance wilderness has run its course. Our reasoning is rooted in the notion that, as the economy continues to stabilize, valuations are likely to rise for those businesses that have largely sat out the mega-cap performance regime. Such a move looks more likely to benefit small-cap companies than larger ones. Moreover, the early tracking estimates for real GDP in 1Q24 are highly favorable, and ongoing positive GDP growth brings the U.S. economy that much closer to the Fed’s desired “soft landing.”
Of course, we are bottom-up stock pickers and portfolio managers, not economists—and we eschew predictions. But we also understand that long-term mean reversion to small-cap leadership requires a catalyst. For all of the encouraging developments, the U.S. economy is at this writing in something of a schizoid condition, with high levels of consumer spending on one hand and a manufacturing and industrial slowdown on the other. Yet in 2024, the U.S. economy will see more tangible benefits from reshoring, the CHIPS Act, and several infrastructure projects. Closer to our zone of expertise, earnings growth for small-cap companies is currently expected to be higher than for larger-cap businesses in 2024.
This page is not part of the Royce Capital Fund 2023 Annual Report to Shareholders | 5
LETTER TO OUR SHAREHOLDERS
We are looking forward to what we think should be a favorable cycle for small-cap stocks
and active management. We are more optimistic about the long-term prospects
for select small-caps than we have been in several years.
Small-Cap’s Estimated Earnings Growth Is Expected to Be Higher in 2024 than Large-Cap’s
One Year EPS Growth as of 12/31/23
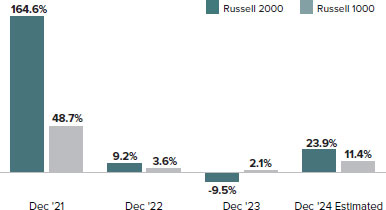
Earnings per share (EPS) is calculated as a company’s profit divided by the outstanding shares of its common stock. The EPS Growth Estimates are the pre-calculated mean long-term EPS growth rate estimates by brokerage analysts. Long Term Growth (LTG) is the annual EPS growth that the company can sustain over the next 3 or 5 years. Both estimates are the average of those provided by analysts working for brokerage firms who provide research coverage on each individual security as reported by FactSet. All non-equity securities, investment companies, and companies without brokerage analyst coverage are excluded.
One critical consequence of interest rates normalizing is that access to capital now has real costs—which should benefit conservatively capitalized, fiscally prudent small-cap companies and the asset managers who hold them. The price of carrying
leverage on the balance sheet began to climb when the Fed first started raising rates in March of 2022—and its increased cost means that advantages should accrue to those businesses with low debt, the ability to generate free cash flow, and proven skill allocating capital prudently and effectively. Returns are thus likely to be spread more widely over the next few years, with the reign of the Magnificent 7—the mega-cap cohort of Alphabet, Amazon, Apple, Meta, Microsoft, Nvidia, and Tesla—likely coming to an end and with it, small-cap’s long stretch of underperformance. To be sure, attractively priced, high-quality and/or growing small-cap businesses that have largely sat out the mega-cap performance regime could be clear beneficiaries. To us, this represents a great opportunity for active managers seeking to identify those small-cap businesses best positioned for long-term success. Our outlook is therefore constructive. Of course, we always put the most stock in what we’re hearing from management teams—most of whom remain cautiously optimistic about 2024. We are therefore looking forward to what we think should be a favorable cycle for small-cap stocks and active management. We are more optimistic about the long-term prospects for select small-caps than we have been in several years.
Sincerely,
 |  |  | |
| Charles M. Royce | Christopher D. Clark | Francis D. Gannon | |
| Chairman, | Chief Executive Officer, and | Co-Chief Investment Officer, | |
| Royce Investment Partners | Co-Chief Investment Officer, | Royce Investment Partners | |
| January 31, 2024 | Royce Investment Partners | | |
| | | |
6 | This page is not part of the Royce Capital Fund 2023 Annual Report to Shareholders
Performance and Expenses
Performance and Expenses
As of December 31, 2023
| | 1-YR | 3-YR | 5-YR | 10-YR | 15-YR | 20-YR | 25-YR | SINCE
INCEPTION
(12/27/96) | ANNUAL OPERATING
EXPENSES (%) |
| Royce Capital Fund–Micro-Cap Portfolio | 18.78 | 6.19 | 12.13 | 5.53 | 9.73 | 6.69 | 9.36 | 9.58 | 1.16 |
| Royce Capital Fund–Small-Cap Portfolio | 25.93 | 13.78 | 10.17 | 5.61 | 9.91 | 7.94 | 9.55 | 9.83 | 1.15 |
| INDEX | | | | | | | | | |
| Russell Microcap Index | 9.33 | 0.61 | 8.56 | 5.79 | 10.65 | 6.39 | N/A | N/A | N/A |
| Russell 2000 Value Index | 14.65 | 7.94 | 10.00 | 6.76 | 10.27 | 7.68 | 8.58 | N/A | N/A |
| Russell 2000 Index | 16.93 | 2.22 | 9.97 | 7.16 | 11.30 | 8.11 | 7.91 | N/A | N/A |
Important Performance, Expense, and Risk Information
All performance information in this Review and Report reflects past performance, is presented on a total return basis, reflects the reinvestment of distributions, and does not reflect the deduction of taxes that a shareholder would pay on Fund distributions or the redemption of Fund shares. Past performance is no guarantee of future results. Investment return and principal value of an investment will fluctuate, so that shares may be worth more or less than their original cost when redeemed. Current performance may be higher or lower than performance quoted and may be obtained at www.royceinvest.com. The Funds’ total returns do not reflect any deduction for charges or expenses of the variable contracts investing in the Funds. All performance and expense information reflects the result for each Fund’s Investment Class Shares. Annual operating expenses reflect the total gross operating expenses for each Fund’s Investment Class as of each Fund’s most current prospectus and include management fees and other expenses. All expense information is reported as of each Fund’s most current prospectus.
Service Class Shares bear an annual distribution expense that is not borne by the Investment Class; if those expenses were reflected, total returns would have been lower. Each series of Royce Capital Fund is subject to market risk—the possibility that common stock prices will decline, sometimes sharply and unpredictably, over short or extended periods of time. Such declines may be caused by various factors, including market, financial, and economic conditions, governmental or central bank actions, and other factors, such as the recent Covid pandemic or the recent conflicts in Ukraine and the Middle East, that may not be directly related to the issuer of a security held by a Fund. These conflicts and the recent pandemic could adversely affect global market, financial, and economic conditions in ways that cannot necessarily be foreseen. Royce Micro-Cap Portfolio invests primarily in micro-cap companies while Royce Small-Cap Portfolio invests primarily in small-cap companies. Investments in micro-cap and small-cap companies may involve considerably more risk than investments in securities of larger-cap companies. (Please see “Primary Risks for Fund Investors” in the prospectus.) Each series of Royce Capital Fund may invest up to 25% of its net assets in foreign securities. Investments in foreign securities may involve political, economic, currency, and other risks not encountered in U.S. investments. (Please see “Investing in Foreign Securities” in the prospectus.) As of 12/31/23, Royce Small-Cap Portfolio invested a significant portion of its assets in a limited number of stocks, which may involve considerably more risk than a more broadly diversified portfolio because a decline in the value of any one of these stocks would cause the Portfolio’s overall value to decline to a greater degree. Royce Micro-Cap Portfolio’s broadly diversified portfolio does not ensure a profit or guarantee against loss. (Please see “Primary Risks for Fund Investors” in the prospectus.) This Review and Report must be preceded or accompanied by a prospectus. Please read the prospectus carefully before investing or sending money. Russell Investment Group is the source and owner of the trademarks, service marks, and copyrights related to the Russell Indexes. Russell® is a trademark of Russell Investment Group. The Russell Microcap Index includes 1,000 of the smallest securities in the small-cap Russell 2000 Index along with the next smallest eligible securities as determined by Russell. The Russell 2000 Index is an unmanaged, capitalization-weighted index of domestic small-cap stocks. It measures the performance of the 2,000 smallest publicly traded U.S. companies in the Russell 3000 Index. The Russell 2000 Value Index consists of the respective value stocks within the Russell 2000 as determined by Russell Investments. The performance of an index does not represent exactly any particular investment, as you cannot invest directly in an index. Distributor: Royce Fund Services, LLC.
This page is not part of the Royce Capital Fund 2023 Annual Report to Shareholders | 7
MANAGERS’ DISCUSSION (UNAUDITED)
Royce Capital Fund–Micro-Cap Portfolio (RCM)

Jim Stoeffel
Brendan Hartman
FUND PERFORMANCE
Royce Capital Fund–Micro-Cap Portfolio advanced 18.8% in 2023, beating its primary benchmark, the Russell Microcap Index, which was up 9.3%, and its secondary benchmark, the Russell 2000 Index, which climbed 16.9% for the same period.
The Fund also beat the Russell Microcap for the 3-, 5-, and 20-year, periods ended 12/31/23.
WHAT WORKED… AND WHAT DIDN’T
Seven of the Fund’s 10 equity sectors finished 2023 in the black, led by Industrials, Information Technology, and Consumer Discretionary, while Health Care, Communication Services, and Consumer Staples made small detractions. At the industry level, semiconductors & semiconductor equipment (Information Technology), commercial services & supplies (Industrials), and metals & mining (Materials) contributed most, while health care equipment & supplies (Health Care), professional services (Industrials), and entertainment (Communication Services) were the largest detractors.
The Fund’s top-contributing position was Applied Optoelectronics, which manufactures optical communications products. Microsoft selected the company to provide a significant number of leading-edge components to support Microsoft’s build out of data centers for AI applications. While we were excited about Applied Optoelectronic’s prospects prior to this announcement, we see the relationship as a potential long-term game changer for the company. Modine Manufacturing provides thermal management systems for several industries and was added to the portfolio as a turnaround candidate as the company was moving from its historical core of automotive radiators toward newer high growth opportunities. The shift is now paying dividends as the company sees significant wins in areas such as data centers and electric vehicles. Camtek manufactures metrology and inspection tools for the semiconductor equipment industry. Its Advanced Packaging segment has been benefiting from the shrinking line widths of semiconductors and the corresponding need to stack many semiconductors together to drive improved performance. This phenomenon is even more acute for semiconductors being developed for AI applications, where Camtek is beginning to see significant orders.
| | | | | | | |
| | Top Contributors to Performance | | | Top Detractors from Performance | | |
| | For 2023 (%)1 | | | For 2023 (%)2 | | |
| | Applied Optoelectronics | 2.73 | | Cutera | -1.09 | |
| | Modine Manufacturing | 1.70 | | Clearfield | -0.89 | |
| | Camtek | 1.48 | | DZS | -0.84 | |
| | Universal Stainless & Alloy Products | 1.45 | | Territorial Bancorp | -0.67 | |
| | American Superconductor | 1.30 | | Chicken Soup for the Soul Entertainment Cl. A | -0.59 | |
| | 1 Includes dividends | | | 2 Net of dividends | | |
| | | | | | | |
The Fund’s top detractor was aesthetic medical device maker Cutera, whose acne treatment Aviclear was supposed to drive its business but has been slower to ramp up than anticipated. This combined with weakened demand for aesthetic procedures, which we see as relating to a weakening economy, and the general lack of insurer reimbursement for such procedures, caused the shares to correct meaningfully. Clearfield provides equipment and cable products principally to more rural cable companies. Like many telecom related infrastructure providers, it has been hurt by inventory corrections as supply chains have normalized post Covid. DZS manufactures mobile transport and broadband access solutions. Its telecom equipment end markets were weak throughout 2023 as customers worked off excess inventory. DZS also faced additional challenges managing its working capital as it faced payment issues with certain customers in Asia. Finally, the company announced that it would restate financials for 2023’s first quarter because a certain amount of inventory in Asia was not properly accounted for. However, DZS was able to execute a financing plan with its parent company, selling its Asian assets to the parent in early 2023, which we believe enables DZS to strengthen its balance sheet and focus on selling higher margin products into the North American and European markets.
The Fund’s advantage over the Russell Microcap came overwhelmingly from stock selection in 2023, though sector allocation was also additive. Stock selection boosted relative performance most in Industrials, Information Technology, and Consumer Discretionary—and our larger weighting in the first and third of these sectors also helped. Conversely, stock selection in Health Care, stock selection and a higher weighting in Communication Services, and stock selection in Financials each detracted from relative performance.
CURRENT POSITIONING AND OUTLOOK
The fourth quarter saw a much needed rally during an otherwise challenging year for most micro-cap stocks. As 2023 drew to a close, investors became more hopeful that the Fed had reached the end of its tightening cycle and may be on the verge of cutting rates in 2024. We view financial liquidity as a key element of micro-cap performance, which could be seen in 4Q23 results. Although we believe we have not yet seen the full lagged impact of the Fed’s tightening cycle, the U.S. economy remains fairly resilient and inflationary pressures have eased as supply chains have normalized from Covid related disruptions. In spite of lingering macro uncertainty, we remain upbeat on the intermediate to long-term opportunities for companies in our domestically focused portfolio. Key among these is the ongoing trend towards re-industrialization of the U.S. economy, which we believe is being driven by a desire to shorten supply chains as well as an increasing realization of the strategic importance of domestic semiconductor manufacturing. The increased fiscal spending on domestic infrastructure projects is also just beginning to take hold, which we expect to provide tailwinds to many of our companies in the near to intermediate term.
8 | Royce Capital Fund 2023 Annual Report to Shareholders
| PERFORMANCE AND PORTFOLIO REVIEW (UNAUDITED) | TICKER SYMBOLS RCMCX RCMSX |
Performance and Expenses
Average Annual Total Return (%) Through 12/31/23
| | JUL-DEC 20231 | 1-YR | 3-YR | 5-YR | 10-YR | 15-YR | 20-YR | 25-YR | SINCE INCEPTION (12/27/96) |
| RCM | 8.78 | 18.78 | 6.19 | 12.13 | 5.53 | 9.73 | 6.69 | 9.36 | 9.58 |
| Annual Operating Expenses: 1.16% | | | |
1 Not annualized
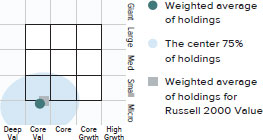
Morningstar Style Map™ As of 12/31/23
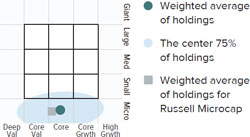
The Morningstar Style Map is the Morningstar Style Box™ with the center 75% of fund holdings plotted as the Morningstar Ownership Zone™. The Morningstar Style Box is designed to reveal a fund’s investment strategy. The Morningstar Ownership Zone provides detail about a portfolio’s investment style by showing the range of stock sizes and styles. The Ownership Zone is derived by plotting each stock in the portfolio within the proprietary Morningstar Style Box. Over time, the shape and location of a fund’s ownership zone may vary. See page 30 for additional information.
Value of $10,000
Invested on 6/30/00 (Russell Microcap Inception)
as of 12/31/23 ($)
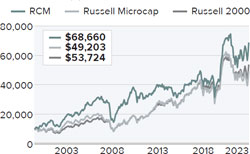
Includes reinvestment of distributions.
Top 10 Positions
% of Net Assets
| Hovnanian Enterprises Cl. A | 1.5 |
| Photronics | 1.5 |
| Modine Manufacturing | 1.4 |
| Applied Optoelectronics | 1.3 |
| Customers Bancorp | 1.3 |
| Universal Stainless & Alloy Products | 1.3 |
| Graham Corporation | 1.3 |
| Natural Gas Services Group | 1.3 |
| IES Holdings | 1.2 |
| Citi Trends | 1.2 |
Portfolio Sector Breakdown
% of Net Assets
| Information Technology | 24.4 |
| Industrials | 23.6 |
| Consumer Discretionary | 13.2 |
| Financials | 12.9 |
| Health Care | 6.4 |
| Materials | 6.2 |
| Communication Services | 4.1 |
| Energy | 3.4 |
| Real Estate | 0.6 |
| Consumer Staples | 0.5 |
| Cash and Cash Equivalents | 4.7 |
Calendar Year Total Returns (%)
| YEAR | RCM |
| 2023 | 18.8 |
| 2022 | -22.4 |
| 2021 | 30.0 |
| 2020 | 23.8 |
| 2019 | 19.6 |
| 2018 | -9.0 |
| 2017 | 5.2 |
| 2016 | 19.7 |
| 2015 | -12.5 |
| 2014 | -3.6 |
| 2013 | 21.0 |
| 2012 | 7.6 |
| 2011 | -12.1 |
| 2010 | 30.1 |
| 2009 | 57.9 |
Upside/Downside Capture Ratios
Periods Ended 12/31/23 (%)
| | UPSIDE | DOWNSIDE |
| 10-Year | 85 | 83 |
| From 6/30/00 (Russell Microcap Inception) | 91 | 79 |
Portfolio Diagnostics
| Fund Net Assets | $137 million |
| Number of Holdings | 125 |
| Turnover Rate | 24% |
| Average Market Capitalization 1 | $578 million |
| Weighted Average P/B Ratio 2 | 1.7x |
| Active Share 3 | 90% |
| U.S. Investments (% of Net Assets) | 84.8% |
| Non-U.S. Investments (% of Net Assets) | 10.5% |
| 1 | Geometric Average. This weighted calculation uses each portfolio holding’s market cap in a way designed to not skew the effect of very large or small holdings; instead, it aims to better identify the portfolio’s center, which Royce believes offers a more accurate measure of average market cap than a simple mean or median. |
| 2 | Harmonic Average. This weighted calculation evaluates a portfolio as if it were a single stock and measures it overall. It compares the total market value of the portfolio to the portfolio’s share in the earnings or book value, as the case may be, of its underlying stocks. |
| 3 | Active Share is the sum of the absolute values of the different weightings of each holding in the Fund versus each holding in the benchmark, divided by two. |
Important Performance and Expense Information
All performance information in this Report reflects past performance, is presented on a total return basis, reflects the reinvestment of distributions, and does not reflect the deduction of taxes that a shareholder would pay on Fund distributions or the redemption of Fund shares. Past performance is no guarantee of future results. Investment return and principal value of an investment will fluctuate, so that shares may be worth more or less than their original cost when redeemed. Current performance may be higher or lower than performance quoted. The Fund’s total returns do not reflect any deduction for charges or expenses of the variable contracts investing in the Fund. Returns as of the most recent month-end may be obtained at www.royceinvest.com. All performance and risk information reflects the result of the Investment Class (its oldest class). Shares of RCM’s Service Class bear an annual distribution expense that is not borne by the Investment Class; if those expenses were reflected, total returns would have been lower. Annual operating expenses reflect the total gross operating expenses for the Fund’s Investment Class as of the Fund’s most current prospectus and include management fees and other expenses. Regarding the “Top Contributors” and “Top Detractors” tables shown above, the sum of all contributors to, and all detractors from, performance for all securities in the portfolio would approximate the Fund’s year-to-date performance for 2023. Upside Capture Ratio measures a manager’s performance in up markets relative to the Fund’s primary benchmark. It is calculated by measuring the Fund’s performance in quarters when the primary benchmark went up and dividing it by such benchmark’s return in those quarters. Downside Capture Ratio measures a manager’s performance in down markets relative to the Fund’s primary benchmark. It is calculated by measuring the Fund’s performance in quarters when the primary benchmark goes down and dividing it by such benchmark’s return in those quarters.
Royce Capital Fund 2023 Annual Report to Shareholders | 9
Schedule of Investments
Royce Capital Fund - Micro-Cap Portfolio
Common Stocks – 95.3%
| | | SHARES | | | VALUE |
| COMMUNICATION SERVICES – 4.1% | | | | | | | |
| ENTERTAINMENT - 0.8% | | | | | | | |
| IMAX Corporation 1 | | | 70,200 | | | $ | 1,054,404 |
| INTERACTIVE MEDIA & SERVICES - 1.1% | | | | | | | |
| QuinStreet 1 | | | 115,500 | | | | 1,480,710 |
| MEDIA - 2.2% | | | | | | | |
| Entravision Communications Cl. A | | | 194,579 | | | | 811,394 |
| †Innovid Corp. 1 | | | 352,519 | | | | 528,779 |
| Magnite 1 | | | 96,900 | | | | 905,046 |
| Thryv Holdings 1 | | | 41,800 | | | | 850,630 |
| | | | | | | | 3,095,849 |
| Total (Cost $5,016,647) | | | | | | | 5,630,963 |
| CONSUMER DISCRETIONARY – 13.2% | | | | | | | |
| AUTOMOBILE COMPONENTS - 2.4% | | | | | | | |
| Modine Manufacturing 1 | | | 32,312 | | | | 1,929,027 |
| Stoneridge 1 | | | 65,400 | | | | 1,279,878 |
| | | | | | | | 3,208,905 |
| DIVERSIFIED CONSUMER SERVICES - 0.7% | | | | | | | |
| Lincoln Educational Services 1 | | | 90,776 | | | | 911,391 |
| HOTELS, RESTAURANTS & LEISURE - 1.4% | | | | | | | |
| Century Casinos 1 | | | 141,300 | | | | 689,544 |
| Lindblad Expeditions Holdings 1 | | | 112,000 | | | | 1,262,240 |
| | | | | | | | 1,951,784 |
| HOUSEHOLD DURABLES - 2.4% | | | | | | | |
| †Hovnanian Enterprises Cl. A 1 | | | 13,095 | | | | 2,037,844 |
| Legacy Housing 1 | | | 51,096 | | | | 1,288,641 |
| | | | | | | | 3,326,485 |
| LEISURE PRODUCTS - 1.3% | | | | | | | |
| American Outdoor Brands 1 | | | 115,545 | | | | 970,578 |
| MasterCraft Boat Holdings 1 | | | 36,317 | | | | 822,217 |
| | | | | | | | 1,792,795 |
| SPECIALTY RETAIL - 4.2% | | | | | | | |
| Beyond 1 | | | 27,900 | | | | 772,551 |
| Citi Trends 1 | | | 59,786 | | | | 1,690,748 |
| JOANN 1 | | | 95,388 | | | | 42,543 |
| OneWater Marine Cl. A 1 | | | 22,200 | | | | 750,138 |
| Shoe Carnival | | | 46,300 | | | | 1,398,723 |
| Zumiez 1 | | | 54,100 | | | | 1,100,394 |
| | | | | | | | 5,755,097 |
| TEXTILES, APPAREL & LUXURY GOODS - 0.8% | | | | | | | |
| Fossil Group 1 | | | 185,300 | | | | 270,538 |
| Vera Bradley 1 | | | 107,400 | | | | 826,980 |
| | | | | | | | 1,097,518 |
| Total (Cost $13,449,570) | | | | | | | 18,043,975 |
| CONSUMER STAPLES – 0.5% | | | | | | | |
| FOOD PRODUCTS - 0.5% | | | | | | | |
| †Seneca Foods Cl. A 1 | | | 12,156 | | | | 637,461 |
| Total (Cost $664,861) | | | | | | | 637,461 |
| ENERGY – 3.4% | | | | | | | |
| ENERGY EQUIPMENT & SERVICES - 3.4% | | | | | | | |
| Natural Gas Services Group 1 | | | 107,031 | | | | 1,721,058 |
| Newpark Resources 1 | | | 221,300 | | | | 1,469,432 |
| Profire Energy 1 | | | 597,729 | | | | 1,081,890 |
| †Ranger Energy Services Cl. A | | | 45,739 | | | | 467,910 |
| Total (Cost $2,739,012) | | | | | | | 4,740,290 |
| FINANCIALS – 12.9% | | | | | |
| BANKS - 8.3% | | | | | |
| BayCom Corporation | | | 64,651 | | | | 1,525,117 |
| Customers Bancorp 1 | | | 30,300 | | | | 1,745,886 |
| HarborOne Bancorp | | | 103,591 | | | | 1,241,020 |
| HBT Financial | | | 66,727 | | | | 1,408,607 |
| HomeTrust Bancshares | | | 48,800 | | | | 1,313,696 |
| Investar Holding Corporation | | | 78,710 | | | | 1,173,566 |
| Midway Investments 1,2 | | | 1,751,577 | | | | 0 |
| Stellar Bancorp | | | 42,845 | | | | 1,192,805 |
| Territorial Bancorp | | | 25,297 | | | | 282,062 |
| Western New England Bancorp | | | 170,062 | | | | 1,530,558 |
| | | | | | | | 11,413,317 |
| CAPITAL MARKETS - 3.7% | | | | | | | |
| B. Riley Financial | | | 33,380 | | | | 700,646 |
| Canaccord Genuity Group | | | 152,749 | | | | 876,112 |
| Silvercrest Asset Management Group Cl. A | | | 71,263 | | | | 1,211,471 |
| Sprott | | | 30,380 | | | | 1,028,984 |
| StoneX Group 1 | | | 17,181 | | | | 1,268,473 |
| | | | | | | | 5,085,686 |
| FINANCIAL SERVICES - 0.9% | | | | | | | |
| Cass Information Systems | | | 25,348 | | | | 1,141,927 |
| Total (Cost $14,080,926) | | | | | | | 17,640,930 |
| HEALTH CARE – 6.4% | | | | | | | |
| BIOTECHNOLOGY - 1.7% | | | | | | | |
| †ARS Pharmaceuticals 1,3 | | | 77,026 | | | | 422,102 |
| CareDx 1 | | | 12,900 | | | | 154,800 |
| Dynavax Technologies 1 | | | 80,400 | | | | 1,123,992 |
| MeiraGTx Holdings 1 | | | 93,600 | | | | 657,072 |
| | | | | | | | 2,357,966 |
| HEALTH CARE EQUIPMENT & SUPPLIES - 3.0% | | | | | | | |
| Apyx Medical 1 | | | 244,000 | | | | 639,280 |
| Artivion 1 | | | 78,089 | | | | 1,396,231 |
| AtriCure 1 | | | 17,000 | | | | 606,730 |
| OrthoPediatrics Corp. 1 | | | 21,600 | | | | 702,216 |
| Profound Medical 1 | | | 95,800 | | | | 802,521 |
| | | | | | | | 4,146,978 |
| LIFE SCIENCES TOOLS & SERVICES - 1.2% | | | | | | | |
| †BioLife Solutions 1 | | | 15,246 | | | | 247,748 |
| Harvard Bioscience 1 | | | 267,680 | | | | 1,432,088 |
| | | | | | | | 1,679,836 |
| PHARMACEUTICALS - 0.5% | | | | | | | |
| †Harrow 1,3 | | | 53,000 | | | | 593,600 |
| Total (Cost $8,084,455) | | | | | | | 8,778,380 |
| INDUSTRIALS – 23.6% | | | | | | | |
| AEROSPACE & DEFENSE - 1.0% | | | | | | | |
| Astronics Corporation 1 | | | 56,055 | | | | 976,478 |
| CPI Aerostructures 1 | | | 143,579 | | | | 391,971 |
| | | | | | | | 1,368,449 |
| BUILDING PRODUCTS - 1.1% | | | | | | | |
| Quanex Building Products | | | 51,200 | | | | 1,565,184 |
| COMMERCIAL SERVICES & SUPPLIES - 3.7% | | | | | | | |
| Acme United | | | 33,682 | | | | 1,443,610 |
| †CECO Environmental 1 | | | 82,700 | | | | 1,677,156 |
| †Montrose Environmental Group 1 | | | 9,147 | | | | 293,893 |
| VSE Corporation | | | 25,200 | | | | 1,628,172 |
| | | | | | | | 5,042,831 |
| 10 | Royce Capital Fund 2023 Annual Report to Shareholders | THE ACCOMPANYING NOTES ARE AN INTEGRAL PART OF THESE FINANCIAL STATEMENTS |
December 31, 2023
Royce Capital Fund - Micro-Cap Portfolio (continued)
| | | SHARES | | | VALUE |
| INDUSTRIALS (continued) | | | | | | | |
| CONSTRUCTION & ENGINEERING - 3.5% | | | | | | | |
| Concrete Pumping Holdings 1 | | | 138,400 | | | $ | 1,134,880 |
| Construction Partners Cl. A 1 | | | 15,400 | | | | 670,208 |
| IES Holdings 1 | | | 21,500 | | | | 1,703,230 |
| Northwest Pipe 1 | | | 43,846 | | | | 1,326,780 |
| | | | | | | | 4,835,098 |
| ELECTRICAL EQUIPMENT - 0.9% | | | | | | | |
| American Superconductor 1 | | | 109,700 | | | | 1,222,058 |
| MACHINERY - 5.3% | | | | | | | |
| Alimak Group | | | 87,303 | | | | 710,643 |
| Commercial Vehicle Group 1 | | | 111,945 | | | | 784,734 |
| Graham Corporation 1 | | | 91,281 | | | | 1,731,601 |
| Luxfer Holdings | | | 63,166 | | | | 564,704 |
| Porvair | | | 146,872 | | | | 1,153,216 |
| Shyft Group (The) | | | 60,333 | | | | 737,269 |
| Wabash National | | | 60,000 | | | | 1,537,200 |
| | | | | | | | 7,219,367 |
| MARINE TRANSPORTATION - 1.0% | | | | | | | |
| Clarkson | | | 32,700 | | | | 1,319,205 |
| PROFESSIONAL SERVICES - 4.7% | | | | | | | |
| CRA International | | | 11,596 | | | | 1,146,265 |
| Forrester Research 1 | | | 35,289 | | | | 946,098 |
| Kforce | | | 17,400 | | | | 1,175,544 |
| NV5 Global 1 | | | 10,300 | | | | 1,144,536 |
| Resources Connection | | | 90,854 | | | | 1,287,401 |
| †TrueBlue 1 | | | 51,200 | | | | 785,408 |
| | | | | | | | 6,485,252 |
| TRADING COMPANIES & DISTRIBUTORS - 2.4% | | | | | | | |
| Distribution Solutions Group 1 | | | 50,280 | | | | 1,586,837 |
| Transcat 1 | | | 14,945 | | | | 1,633,937 |
| | | | | | | | 3,220,774 |
| Total (Cost $21,573,169) | | | | | | | 32,278,218 |
| INFORMATION TECHNOLOGY – 24.4% | | | | | | | |
| COMMUNICATIONS EQUIPMENT - 4.3% | | | | | | | |
| Applied Optoelectronics 1 | | | 92,799 | | | | 1,792,877 |
| Clearfield 1 | | | 23,800 | | | | 692,104 |
| Comtech Telecommunications | | | 70,169 | | | | 591,524 |
| Digi International 1 | | | 42,359 | | | | 1,101,334 |
| EMCORE Corporation 1 | | | 241,100 | | | | 117,898 |
| Genasys 1 | | | 230,326 | | | | 467,562 |
| Harmonic 1 | | | 87,400 | | | | 1,139,696 |
| | | | | | | | 5,902,995 |
| ELECTRONIC EQUIPMENT, INSTRUMENTS & COMPONENTS - 6.8% | | | | | | | |
| Arlo Technologies 1 | | | 130,400 | | | | 1,241,408 |
| FARO Technologies 1 | | | 59,900 | | | | 1,349,547 |
| LightPath Technologies Cl. A 1 | | | 383,700 | | | | 483,462 |
| Luna Innovations 1 | | | 194,632 | | | | 1,294,303 |
| nLIGHT 1 | | | 114,500 | | | | 1,545,750 |
| PAR Technology 1 | | | 32,800 | | | | 1,428,112 |
| Powerfleet NJ 1,3 | | | 186,109 | | | | 636,493 |
| VIA optronics ADR 1 | | | 116,260 | | | | 90,810 |
| Vishay Precision Group 1 | | | 35,200 | | | | 1,199,264 |
| | | | | | | | 9,269,149 |
| SEMICONDUCTORS & SEMICONDUCTOR EQUIPMENT - 10.8% | | | | | | | |
| Aehr Test Systems 1,3 | | | 30,853 | | | | 818,530 |
| Amtech Systems 1 | | | 81,889 | | | | 343,934 |
| Axcelis Technologies 1 | | | 7,700 | | | | 998,613 |
| AXT 1 | | | 221,200 | | | | 530,880 |
| Camtek 1 | | | 24,302 | | | | 1,686,073 |
| Cohu 1 | | | 36,100 | | | | 1,277,579 |
| Ichor Holdings 1 | | | 38,200 | | | | 1,284,666 |
| †inTEST Corporation 1 | | | 53,831 | | | | 732,101 |
| †Kopin Corporation 1 | | | 183,596 | | | | 372,700 |
| Nova 1,3 | | | 10,400 | | | | 1,428,856 |
| NVE Corporation | | | 14,973 | | | | 1,174,332 |
| PDF Solutions 1 | | | 30,100 | | | | 967,414 |
| Photronics 1 | | | 64,870 | | | | 2,034,972 |
| Ultra Clean Holdings 1 | | | 35,400 | | | | 1,208,556 |
| | | | | | | | 14,859,206 |
| SOFTWARE - 0.8% | | | | | | | |
| Agilysys 1 | | | 13,000 | | | | 1,102,660 |
| TECHNOLOGY HARDWARE, STORAGE & PERIPHERALS - 1.7% | | | | | | | |
| AstroNova 1 | | | 81,515 | | | | 1,325,434 |
| Intevac 1 | | | 216,483 | | | | 935,207 |
| | | | | | | | 2,260,641 |
| Total (Cost $24,131,671) | | | | | | | 33,394,651 |
| MATERIALS – 6.2% | | | | | | | |
| CHEMICALS - 1.6% | | | | | | | |
| Aspen Aerogels 1 | | | 97,417 | | | | 1,537,240 |
| †Core Molding Technologies 1 | | | 35,152 | | | | 651,367 |
| | | | | | | | 2,188,607 |
| METALS & MINING - 4.6% | | | | | | | |
| Altius Minerals | | | 47,900 | | | | 666,598 |
| Ferroglobe 1 | | | 139,200 | | | | 906,192 |
| Haynes International | | | 27,538 | | | | 1,571,043 |
| Major Drilling Group International 1 | | | 212,700 | | | | 1,478,410 |
| Universal Stainless & Alloy Products 1 | | | 86,305 | | | | 1,733,004 |
| | | | | | | | 6,355,247 |
| Total (Cost $5,457,037) | | | | | | | 8,543,854 |
| REAL ESTATE – 0.6% | | | | | | | |
| REAL ESTATE MANAGEMENT & DEVELOPMENT - 0.6% | | | | | | | |
| FRP Holdings 1 | | | 12,440 | | | | 782,227 |
| Total (Cost $214,356) | | | | | | | 782,227 |
| TOTAL COMMON STOCKS | | | | | | | |
| (Cost $95,411,704) | | | | | | | 130,470,949 |
| THE ACCOMPANYING NOTES ARE AN INTEGRAL PART OF THESE FINANCIAL STATEMENTS | Royce Capital Fund 2023 Annual Report to Shareholders | 11 |
| Schedule of Investments | December 31, 2023 |
Royce Capital Fund - Micro-Cap Portfolio (continued)
| | | SHARES | | | VALUE |
REPURCHASE AGREEMENT – 4.9% | | | | | |
Fixed Income Clearing Corporation, 4.75% dated 12/29/23, due 1/2/24, maturity value $6,792,281 (collateralized by obligations of U.S. Government Agencies, 2.375% due 5/15/27, valued at $6,924,533) |
| (Cost $6,788,698) | | | | | | $ | 6,788,698 |
| | | | | | | | |
| COLLATERAL RECEIVED FOR SECURITIES LOANED – 0.8% | | | | | | | |
Money Market Funds Federated Hermes Government Obligations Fund - Institutional Shares (7 day yield-5.23%) | |
| (Cost $1,057,690) | | | 1,057,690 | | | | 1,057,690 |
| | | | | | | | |
| TOTAL INVESTMENTS – 101.0% | | | | | | | |
| (Cost $103,258,092) | | | | | | | 138,317,337 |
| | | | | | | | |
| LIABILITIES LESS CASH AND OTHER ASSETS – (1.0)% | | | | | | | (1,354,252) |
| | | | | | | | |
| NET ASSETS – 100.0% | | | | | | $ | 136,963,085 |
ADR- American Depository Receipt
| 2 | A security for which market quotations are not readily available represents 0.0% of net assets. This security has been valued at its fair value under procedures approved by the Fund’s Board of Trustees. This security is defined as a Level 3 security due to the use of significant unobservable inputs in the determination of fair value. See Notes to Financial Statements. |
| 3 | All or a portion of these securities were on loan as of December 31, 2023. |
Bold indicates the Fund’s 20 largest equity holdings in terms of December 31, 2023, market value.
| 12 | Royce Capital Fund 2023 Annual Report to Shareholders | THE ACCOMPANYING NOTES ARE AN INTEGRAL PART OF THESE FINANCIAL STATEMENTS |
This page is intentionally left blank.
Royce Capital Fund 2023 Annual Report to Shareholders | 13
MANAGER’S DISCUSSION (UNAUDITED)
Royce Capital Fund–Small-Cap Portfolio (RCS)

Jay Kaplan, CFA
FUND PERFORMANCE
Royce Capital Fund–Small-Cap Portfolio had a very strong year on both an absolute and relative basis. The Fund advanced 25.9% in 2023, handily outperforming its primary small-cap benchmark, the Russell 2000 Value Index, which was up 14.6%, and the 16.9% gain for its secondary benchmark, the Russell 2000 Index, for the same period. The Fund also beat both benchmarks for the 3-, 5-, 25-year, and since inception (12/27/96) periods ended 12/31/23—and outpaced the Russell 2000 Value for the 20-year period.
WHAT WORKED… AND WHAT DIDN’T
Eight of the portfolio’s 10 equity sectors made a positive impact on calendar year performance, led by Consumer Discretionary, Information Technology, and Industrials. The only negative impacts came from Health Care and Materials while Consumer Staples made the smallest contribution. At the industry level, electronic equipment, instruments & components (Information Technology), household durables (Consumer Discretionary), and specialty retail (Consumer Discretionary) contributed most for the calendar year period, while biotechnology (Health Care), leisure products (Consumer Discretionary), and metals & mining (Materials) were the largest detractors.
The portfolio’s top contributor at the position level in 2023 was Sterling Infrastructure, which provides advanced, large-scale site development services for data centers, manufacturing facilities, and e-commerce distribution centers. The company continues to execute effectively in fast-growing markets in the U.S. as it has transitioned from primarily being a highly levered highway builder to its current mix of businesses. M/I Homes builds single-family homes primarily in the Midwest and Southeast U.S. The company has a low-debt balance sheet, steady cash flows, and strong earnings. Perhaps counterintuitively, M/I benefited from higher mortgage rates as homeowners put off selling to avoid purchasing a new home at increased rates—which spurred demand for newly built homes for first-time home buyers. PulteGroup, which builds homes all over the U.S., benefited from this same dynamic. Each homebuilder company held by the portfolio was a top-10 holding at the end of December.
| | Top Contributors to Performance | | | Top Detractors from Performance | | |
| | For 2023 (%)1 | | | For 2023 (%)2 | | |
| | Sterling Infrastructure | 2.09 | | Resources Connection | -0.33 | |
| | M/I Homes | 1.73 | | Northwest Pipe | -0.24 | |
| | PulteGroup | 1.63 | | Financial Institutions | -0.22 | |
| | Jabil | 1.50 | | Cross Country Healthcare | -0.21 | |
| | ePlus | 1.09 | | Ironwood Pharmaceuticals Cl. A | -0.21 | |
| | 1 Includes dividends | | | 2 Net of dividends | | |
| | | | | | | |
Resources Connection was the top detractor in 2023. A professional services firm that provides accounting and finance, human resources management, and information technology professionals to clients on a project-by-project basis, the company faced slumping demand as many businesses cut back on spending for discretionary services. Northwest Pipe makes large diameter, high pressure steel pipe products used for water transmission and smaller diameter, electric resistance welded pipe for a variety of applications. Its stock suffered from the combination of higher steel prices and projects being pushed forward. We held small positions in both Resources Connection and Northwest Pipe at year end. We opted to sell our shares of Financial Institutions, an upstate New York community bank, based on the belief that it was undercapitalized in what we think may continue to be a challenging period for smaller regional players in the banking industry.
Both sector allocation decisions and, to a lesser degree, stock selection contributed to the Fund’s performance edge over the Russell 2000 Value in 2023. All told, eight of 10 equity sectors outperformed the benchmark, with the most impactful advantages coming from stock selection and our higher weighting in Consumer Discretionary, as well as our higher weighting and stock selection in both Information Technology and Industrials. Conversely, stock selection and a lower weight in Materials and stock selection in the Real Estate and Consumer Staples sectors detracted most (though marginally) from relative performance.
CURRENT POSITIONING AND OUTLOOK
The market rally that ushered out 2023 was rooted more in the momentum fueled by economic hope than in material earnings growth—which in our experience seldom if ever makes for a lasting recovery. This appears particularly true in our current situation as many stocks seem to have priced in significant rate cuts in 2024 in the absence of any clear signals from the Fed about the specific timing and magnitude of those decreases. In our view, the tension between investors’ assumptions and actual Fed actions creates a lot of risk for equity investors. We still do not know whether or not the U.S. economy will achieve the much desired soft landing or slide into recession. As investors are faced with the potential for underwhelming or disappointing earnings in the first half of 2024, we could endure a rough first six months. We would argue that an earnings recession is more likely to occur than an economic contraction. However, we also see the probability of more clarity about the state of the U.S. economy in the second half of 2024, which we see as a potentially rewarding period for small-cap investors. We have not made many significant changes to portfolio positioning. We trimmed positions, most prominently in banks, where we felt share prices had climbed past near-term earnings prospects. We added to holdings in trucking and transportation—which we think are well positioned for a stronger second half of the year. We otherwise held sector and industry weights more or less steadily.
14 | Royce Capital Fund 2023 Annual Report to Shareholders
| PERFORMANCE AND PORTFOLIO REVIEW (UNAUDITED) | TICKER SYMBOLS RCPFX RCSSX |
Performance and Expenses
Average Annual Total Return (%) Through 12/31/23
| | JUL-DEC 20231 | 1-YR | 3-YR | 5-YR | 10-YR | 15-YR | 20-YR | 25-YR | SINCE INCEPTION
(12/27/96) |
| RCS | 16.45 | 25.93 | 13.78 | 10.17 | 5.61 | 9.91 | 7.94 | 9.55 | 9.83 |
| Annual Operating Expenses: 1.15% | | | | | |
| 1 Not annualized | | | | | | | |
Morningstar Style Map™ As of 12/31/23
The Morningstar Style Map is the Morningstar Style Box™ with the center 75% of fund holdings plotted as the Morningstar Ownership Zone™. The Morningstar Style Box is designed to reveal a fund’s investment strategy. The Morningstar Ownership Zone provides detail about a portfolio’s investment style by showing the range of stock sizes and styles. The Ownership Zone is derived by plotting each stock in the portfolio within the proprietary Morningstar Style Box. Over time, the shape and location of a fund’s ownership zone may vary. See page 30 for additional information.
Value of $10,000
Invested on 12/27/96 as of 12/31/23 ($)

Includes reinvestment of distributions.
Top 10 Positions
| % of Net Assets | |
| M/I Homes | 2.0 |
| Evercore Cl. A | 2.0 |
| Flex | 2.0 |
| ePlus | 1.9 |
| PulteGroup | 1.9 |
| Tiptree | 1.8 |
| Shoe Carnival | 1.7 |
| Bloomin’ Brands | 1.7 |
| Buckle (The) | 1.7 |
| Jabil | 1.6 |
Portfolio Sector Breakdown
% of Net Assets
| Consumer Discretionary | 21.3 |
| Financials | 18.6 |
| Industrials | 18.4 |
| Information Technology | 17.2 |
| Energy | 7.9 |
| Health Care | 6.3 |
| Communication Services | 2.9 |
| Consumer Staples | 2.6 |
| Real Estate | 1.3 |
| Materials | 1.1 |
| Cash and Cash Equivalents | 2.4 |
Calendar Year Total Returns (%)
| YEAR | RCS |
| 2023 | 25.9 |
| 2022 | -9.2 |
| 2021 | 28.8 |
| 2020 | -7.2 |
| 2019 | 18.7 |
| 2018 | -8.3 |
| 2017 | 5.4 |
| 2016 | 21.0 |
| 2015 | -11.8 |
| 2014 | 3.2 |
| 2013 | 34.8 |
| 2012 | 12.5 |
| 2011 | -3.3 |
| 2010 | 20.5 |
| 2009 | 35.2 |
Upside/Downside Capture Ratios
Periods Ended 12/31/23 (%)
| | UPSIDE | DOWNSIDE |
| 10-Year | 88 | 91 |
| From 12/31/96 (Start of Fund’s First Full Quarter) | 98 | 90 |
Portfolio Diagnostics
| Fund Net Assets | $312 million |
| Number of Holdings | 83 |
| Turnover Rate | 69% |
| Average Market Capitalization 1 | $1,596 million |
| Weighted Average P/E Ratio 2,3 | 10.8x |
| Weighted Average P/B Ratio 2 | 1.7x |
| Active Share 4 | 94% |
| U.S. Investments (% of Net Assets) | 97.6% |
| Non-U.S. Investments (% of Net Assets) | 0.0% |
| 1 | Geometric Average. This weighted calculation uses each portfolio holding’s market cap in a way designed to not skew the effect of very large or small holdings; instead, it aims to better identify the portfolio’s center, which Royce believes offers a more accurate measure of average market cap than a simple mean or median. |
| 2 | Harmonic Average. This weighted calculation evaluates a portfolio as if it were a single stock and measures it overall. It compares the total market value of the portfolio to the portfolio’s share in the earnings or book value, as the case may be, of its underlying stocks. |
| 3 | The Fund’s P/E Ratio calculation excludes companies with zero or negative earnings (1% of portfolio holdings as of 12/31/23). |
| 4 | Active Share is the sum of the absolute values of the different weightings of each holding in the Fund versus each holding in the benchmark, divided by two. |
Important Performance and Expense Information
All performance information in this Report reflects past performance, is presented on a total return basis, reflects the reinvestment of distributions, and does not reflect the deduction of taxes that a shareholder would pay on Fund distributions or the redemption of Fund shares. Past performance is no guarantee of future results. Investment return and principal value of an investment will fluctuate, so that shares may be worth more or less than their original cost when redeemed. Current performance may be higher or lower than performance quoted. The Fund’s total returns do not reflect any deduction for charges or expenses of the variable contracts investing in the Fund. Returns as of the most recent month-end may be obtained at www.royceinvest.com. All performance and risk information reflects the result of the Investment Class (its oldest class). Shares of RCS’s Service Class bear an annual distribution expense that is not borne by the Investment Class; if those expenses were reflected, total returns would have been lower. Annual operating expenses reflect the total gross operating expenses for the Fund’s Investment Class as of the Fund’s most current prospectus and include management fees and other expenses. Regarding the “Top Contributors” and “Top Detractors” tables shown above, the sum of all contributors to, and all detractors from, performance for all securities in the portfolio would approximate the Fund’s year-to-date performance for 2023. Upside Capture Ratio measures a manager’s performance in up markets relative to the Fund’s primary benchmark. It is calculated by measuring the Fund’s performance in quarters when the primary benchmark went up and dividing it by such benchmark’s return in those quarters. Downside Capture Ratio measures a manager’s performance in down markets relative to the Fund’s primary benchmark. It is calculated by measuring the Fund’s performance in quarters when the primary benchmark goes down and dividing it by such benchmark’s return in those quarters.
Royce Capital Fund 2023 Annual Report to Shareholders | 15
Schedule of Investments
Royce Capital Fund - Small-Cap Portfolio
Common Stocks – 97.6%
| | | SHARES | | | VALUE |
| COMMUNICATION SERVICES – 2.9% | | | | | | | |
| MEDIA - 2.9% | | | | | | | |
| Entravision Communications Cl. A | | | 455,765 | | | $ | 1,900,540 |
| Saga Communications Cl. A | | | 153,519 | | | | 3,417,333 |
| †TEGNA | | | 240,987 | | | | 3,687,101 |
| Total (Cost $10,206,433) | | | | | | | 9,004,974 |
| | | | | | | | |
| CONSUMER DISCRETIONARY – 21.3% | | | | | | | |
| DIVERSIFIED CONSUMER SERVICES - 0.2% | | | | | | | |
| Lincoln Educational Services 1 | | | 67,356 | | | | 676,254 |
| HOTELS, RESTAURANTS & LEISURE - 1.7% | | | | | | | |
| Bloomin' Brands | | | 186,123 | | | | 5,239,363 |
| HOUSEHOLD DURABLES - 5.7% | | | | | | | |
| M/I Homes 1 | | | 44,871 | | | | 6,180,532 |
| Meritage Homes | | | 20,627 | | | | 3,593,223 |
| PulteGroup | | | 58,158 | | | | 6,003,069 |
| †Tri Pointe Homes 1 | | | 58,616 | | | | 2,075,006 |
| | | | | | | | 17,851,830 |
| SPECIALTY RETAIL - 9.3% | | | | | | | |
| †Arhaus Cl. A 1 | | | 118,602 | | | | 1,405,434 |
| Buckle (The) | | | 109,560 | | | | 5,206,291 |
| Caleres | | | 127,716 | | | | 3,924,713 |
| †Destination XL Group 1 | | | 573,553 | | | | 2,523,633 |
| Haverty Furniture | | | 90,420 | | | | 3,209,910 |
| Shoe Carnival | | | 174,234 | | | | 5,263,609 |
| †Signet Jewelers | | | 40,822 | | | | 4,378,568 |
| Williams-Sonoma | | | 15,958 | | | | 3,220,005 |
| | | | | | | | 29,132,163 |
| TEXTILES, APPAREL & LUXURY GOODS - 4.4% | | | | | | | |
| Carter's | | | 42,523 | | | | 3,184,547 |
| Kontoor Brands | | | 80,128 | | | | 5,001,590 |
| Movado Group | | | 75,858 | | | | 2,287,119 |
| Steven Madden | | | 73,131 | | | | 3,071,502 |
| | | | | | | | 13,544,758 |
| Total (Cost $45,569,847) | | | | | | | 66,444,368 |
| | | | | | | | |
| CONSUMER STAPLES – 2.6% | | | | | | | |
| CONSUMER STAPLES DISTRIBUTION & RETAIL - 2.6% | | | | | | | |
| Ingles Markets Cl. A | | | 44,281 | | | | 3,824,550 |
| Village Super Market Cl. A | | | 162,566 | | | | 4,264,106 |
| Total (Cost $7,489,123) | | | | | | | 8,088,656 |
| | | | | | | | |
| ENERGY – 7.9% | | | | | | | |
| OIL, GAS & CONSUMABLE FUELS - 7.9% | | | | | | | |
| †Berry Corporation | | | 65,690 | | | | 461,801 |
| Chord Energy | | | 29,820 | | | | 4,956,978 |
| Civitas Resources | | | 60,268 | | | | 4,121,126 |
| Dorchester Minerals L.P. | | | 141,886 | | | | 4,516,231 |
| Matador Resources | | | 64,652 | | | | 3,676,113 |
| Riley Exploration Permian | | | 112,683 | | | | 3,069,485 |
| SilverBow Resources 1 | | | 134,836 | | | | 3,921,031 |
| Total (Cost $20,142,634) | | | | | | | 24,722,765 |
| | | | | | | | |
| FINANCIALS – 18.6% | | | | | | | |
| BANKS - 13.4% | | | | | | | |
| Citizens Community Bancorp | | | 178,538 | | | | 2,090,680 |
| CNB Financial | | | 196,739 | | | | 4,444,334 |
| †Dime Community Bancshares | | | 160,078 | | | | 4,310,901 |
| †Heritage Financial | | | 121,370 | | | | 2,596,104 |
| Mid Penn Bancorp | | | 141,848 | | | | 3,444,069 |
| National Bankshares | | | 12,861 | | | | 416,053 |
| Princeton Bancorp | | | 45,514 | | | | 1,633,953 |
| Riverview Bancorp | | | 249,282 | | | | 1,595,405 |
| †Summit Financial Group | | | 101,569 | | | | 3,117,153 |
| Timberland Bancorp | | | 141,629 | | | | 4,455,648 |
| TrustCo Bank Corp NY | | | 117,790 | | | | 3,657,379 |
| Unity Bancorp | | | 151,471 | | | | 4,482,027 |
| †Univest Financial | | | 142,489 | | | | 3,139,033 |
| Western New England Bancorp | | | 282,565 | | | | 2,543,085 |
| | | | | | | | 41,925,824 |
| CAPITAL MARKETS - 2.0% | | | | | | | |
| Evercore Cl. A | | | 35,826 | | | | 6,128,037 |
| FINANCIAL SERVICES - 1.4% | | | | | | | |
| †International Money Express 1 | | | 203,086 | | | | 4,486,170 |
| INSURANCE - 1.8% | | | | | | | |
| Tiptree | | | 295,400 | | | | 5,600,784 |
| Total (Cost $46,269,420) | | | | | | | 58,140,815 |
| | | | | | | | |
| HEALTH CARE – 6.3% | | | | | | | |
| BIOTECHNOLOGY - 1.4% | | | | | | | |
| Catalyst Pharmaceuticals 1 | | | 255,552 | | | | 4,295,829 |
| HEALTH CARE PROVIDERS & SERVICES - 2.8% | | | | | | | |
| Cross Country Healthcare 1 | | | 169,965 | | | | 3,848,007 |
| Molina Healthcare 1 | | | 13,702 | | | | 4,950,670 |
| | | | | | | | 8,798,677 |
| PHARMACEUTICALS - 2.1% | | | | | | | |
| Collegium Pharmaceutical 1 | | | 71,629 | | | | 2,204,741 |
| SIGA Technologies | | | 795,885 | | | | 4,456,956 |
| | | | | | | | 6,661,697 |
| Total (Cost $15,430,428) | | | | | | | 19,756,203 |
| | | | | | | | |
| INDUSTRIALS – 18.4% | | | | | | | |
| AIR FREIGHT & LOGISTICS - 1.4% | | | | | | | |
| Hub Group Cl. A 1 | | | 46,113 | | | | 4,239,629 |
| BUILDING PRODUCTS - 2.9% | | | | | | | |
| Quanex Building Products | | | 152,637 | | | | 4,666,113 |
| UFP Industries | | | 35,277 | | | | 4,429,027 |
| | | | | | | | 9,095,140 |
| CONSTRUCTION & ENGINEERING - 2.1% | | | | | | | |
| Northwest Pipe 1 | | | 61,195 | | | | 1,851,760 |
| Sterling Infrastructure 1 | | | 53,961 | | | | 4,744,791 |
| | | | | | | | 6,596,551 |
| ELECTRICAL EQUIPMENT - 1.1% | | | | | | | |
| Preformed Line Products | | | 25,293 | | | | 3,385,721 |
| GROUND TRANSPORTATION - 3.6% | | | | | | | |
| ArcBest Corporation | | | 37,345 | | | | 4,489,243 |
| Schneider National Cl. B | | | 184,265 | | | | 4,689,544 |
| †Universal Logistics Holdings | | | 75,644 | | | | 2,119,545 |
| | | | | | | | 11,298,332 |
| MACHINERY - 1.0% | | | | | | | |
| Wabash National | | | 122,945 | | | | 3,149,851 |
| MARINE TRANSPORTATION - 2.0% | | | | | | | |
| †Genco Shipping & Trading | | | 172,800 | | | | 2,866,752 |
| †Pangaea Logistics Solutions | | | 423,032 | | | | 3,485,784 |
| | | | | | | | 6,352,536 |
| PROFESSIONAL SERVICES - 4.3% | | | | | | | |
| Barrett Business Services | | | 41,682 | | | | 4,826,776 |
| IBEX 1 | | | 254,885 | | | | 4,845,364 |
| Korn Ferry | | | 54,865 | | | | 3,256,238 |
| 16 | Royce Capital Fund 2023 Annual Report to Shareholders | THE ACCOMPANYING NOTES ARE AN INTEGRAL PART OF THESE FINANCIAL STATEMENTS |
December 31, 2023
Royce Capital Fund - Small-Cap Portfolio (continued)
| | | SHARES | | | VALUE |
| INDUSTRIALS (continued) | | | | | | | |
| PROFESSIONAL SERVICES (continued) | | | | | | | |
| Resources Connection | | | 35,325 | | | $ | 500,555 |
| | | | | | | | 13,428,933 |
| Total (Cost $39,797,038) | | | | | | | 57,546,693 |
| | | | | | | | |
| INFORMATION TECHNOLOGY – 17.2% | | | | | | | |
| COMMUNICATIONS EQUIPMENT - 1.4% | | | | | | | |
| Aviat Networks 1 | | | 127,318 | | | | 4,158,206 |
| ELECTRONIC EQUIPMENT, INSTRUMENTS & COMPONENTS - 14.0% | | | | | | | |
| Bel Fuse Cl. B | | | 35,832 | | | | 2,392,503 |
| ePlus 1 | | | 75,591 | | | | 6,035,186 |
| Flex 1 | | | 201,121 | | | | 6,126,146 |
| Insight Enterprises 1 | | | 18,702 | | | | 3,313,807 |
| Jabil | | | 39,268 | | | | 5,002,743 |
| Kimball Electronics 1 | | | 147,475 | | | | 3,974,451 |
| PC Connection | | | 66,421 | | | | 4,464,155 |
| Sanmina Corporation 1 | | | 82,682 | | | | 4,247,374 |
| TD SYNNEX | | | 31,888 | | | | 3,431,468 |
| Vishay Intertechnology | | | 200,486 | | | | 4,805,649 |
| | | | | | | | 43,793,482 |
| SEMICONDUCTORS & SEMICONDUCTOR EQUIPMENT - 1.1% | | | | | | | |
| Amkor Technology | | | 104,150 | | | | 3,465,070 |
| SOFTWARE - 0.7% | | | | | | | |
| Adeia | | | 183,963 | | | | 2,279,302 |
| Total (Cost $32,088,459) | | | | | | | 53,696,060 |
| | | | | | | | |
| MATERIALS – 1.1% | | | | | | | |
| METALS & MINING - 1.1% | | | | | | | |
| †Ryerson Holding Corporation | | | 101,801 | | | | 3,530,459 |
| Total (Cost $3,668,673) | | | | | | | 3,530,459 |
| | | | | | | | |
| REAL ESTATE – 1.3% | | | | | | | |
| REAL ESTATE MANAGEMENT & DEVELOPMENT - 1.3% | | | | | | | |
| RMR Group (The) Cl. A | | | 142,032 | | | | 4,009,563 |
| Total (Cost $3,820,050) | | | | | | | 4,009,563 |
| | | | | | | | |
| TOTAL COMMON STOCKS | | | | | | | |
| (Cost $224,482,105) | | | | | | | 304,940,556 |
| | | | | | | | |
| REPURCHASE AGREEMENT– 2.2% | | | | | | | |
Fixed Income Clearing Corporation, 4.75% dated 12/29/23, due 1/2/24, maturity value $6,870,811 (collateralized by obligations of U.S. Government Agencies, 2.75% due 2/15/28, valued at $7,004,545) |
| (Cost $6,867,186) | | | 6,867,186 |
| | | | |
| TOTAL INVESTMENTS – 99.8% | | | |
| (Cost $231,349,291) | | | 311,807,742 |
| | | | |
| CASH AND OTHER ASSETS LESS LIABILITIES – 0.2% | | | 511,988 |
| | | | |
| NET ASSETS – 100.0% | | $ | 312,319,730 |
† New additions in 2023.
1 Non-income producing.
Bold indicates the Fund’s 20 largest equity holdings in terms of December 31, 2023, market value.
| THE ACCOMPANYING NOTES ARE AN INTEGRAL PART OF THESE FINANCIAL STATEMENTS | Royce Capital Fund 2023 Annual Report to Shareholders | 17 |
| Statements of Assets and Liabilities | December 31, 2023 |
| | | Micro-Cap Portfolio | | | Small-Cap Portfolio | |
| ASSETS: | | | | | | |
| Investments at value (including collateral on loaned securities)1 | | $ | 131,528,639 | | | $ | 304,940,556 | |
| Repurchase agreements (at cost and value) | | | 6,788,698 | | | | 6,867,186 | |
| Cash | | | – | | | | 67,926 | |
| Receivable for capital shares sold | | | 11,588 | | | | 629,820 | |
| Receivable for dividends and interest | | | 17,822 | | | | 469,476 | |
| Receivable for securities lending income | | | 885 | | | | 40 | |
| Prepaid expenses and other assets | | | 1,790 | | | | 3,694 | |
| Total Assets | | | 138,349,422 | | | | 312,978,698 | |
| LIABILITIES: | | | | | | | | |
| Payable for collateral on loaned securities | | | 1,057,690 | | | | – | |
| Payable for investments purchased | | | 60,229 | | | | 176,121 | |
| Payable for capital shares redeemed | | | 82,921 | | | | 84,058 | |
| Payable for investment advisory fees | | | 111,261 | | | | 258,173 | |
| Payable for trustees’ fees | | | 11,756 | | | | 26,242 | |
| Accrued expenses | | | 62,480 | | | | 114,374 | |
| Total Liabilities | | | 1,386,337 | | | | 658,968 | |
| Net Assets | | $ | 136,963,085 | | | $ | 312,319,730 | |
| ANALYSIS OF NET ASSETS: | | | | | | | | |
| Paid-in capital | | $ | 92,850,390 | | | $ | 222,986,191 | |
| Total distributable earnings (loss) | | | 44,112,695 | | | | 89,333,539 | |
| Net Assets | | $ | 136,963,085 | | | $ | 312,319,730 | |
| Investment Class | | $ | 116,467,607 | | | $ | 146,549,073 | |
| Service Class | | | 20,495,478 | | | | 165,770,657 | |
| SHARES OUTSTANDING (unlimited number of $.001 par value): | | | | | | | | |
| Investment Class | | | 12,697,668 | | | | 15,281,423 | |
| Service Class | | | 2,307,764 | | | | 17,683,434 | |
| NET ASSET VALUES (Net Assets ÷ Shares Outstanding): | | | | | | | | |
| (offering and redemption price per share) | | | | | | | | |
| Investment Class | | $ | 9.17 | | | $ | 9.59 | |
| Service Class | | | 8.88 | | | | 9.37 | |
| Investments at identified cost | | $ | 96,469,394 | | | $ | 224,482,105 | |
| Market value of loaned securities2 | | | 3,896,989 | | | | – | |
1 See Notes to Financial Statements for information on non-cash collateral on loaned securities.
2 Market value of loaned securities backed by non-cash collateral is as of prior business day.
| 18 | Royce Capital Fund 2023 Annual Report to Shareholders | THE ACCOMPANYING NOTES ARE AN INTEGRAL PART OF THESE FINANCIAL STATEMENTS |
| Statements of Operations | Year Ended December 31, 2023 |
| | | Micro-Cap Portfolio | | | Small-Cap Portfolio | |
| INVESTMENT INCOME: | | | | | | |
| INCOME: | | | | | | |
| Dividends | | $ | 924,386 | | | $ | 6,611,888 | |
| Foreign withholding tax | | | (11,033 | ) | | | – | |
| Interest | | | 133,555 | | | | 237,834 | |
| Securities lending | | | 8,663 | | | | 579 | |
| Total income | | | 1,055,571 | | | | 6,850,301 | |
| EXPENSES: | | | | | | | | |
| Investment advisory fees | | | 1,289,621 | | | | 2,902,705 | |
| Distribution fees | | | 43,431 | | | | 371,627 | |
| Administrative and office facilities | | | 83,456 | | | | 162,638 | |
| Trustees’ fees | | | 40,652 | | | | 91,326 | |
| Audit | | | 35,663 | | | | 35,436 | |
| Custody | | | 31,734 | | | | 64,209 | |
| Shareholder servicing | | | 17,282 | | | | 16,608 | |
| Shareholder reports | | | 15,465 | | | | 8,901 | |
| Legal | | | 4,800 | | | | 10,835 | |
| Other expenses | | | 12,010 | | | | 23,592 | |
| Total expenses | | | 1,574,114 | | | | 3,687,877 | |
| Compensating balance credits | | | (225 | ) | | | (197 | ) |
| Fees waived by investment adviser | | | (29,797 | ) | | | (28,330 | ) |
| Expenses reimbursed by investment adviser | | | (12,268 | ) | | | (13,249 | ) |
| Net expenses | | | 1,531,824 | | | | 3,646,101 | |
| Net investment income (loss) | | | (476,253 | ) | | | 3,204,200 | |
| REALIZED AND UNREALIZED GAIN (LOSS) ON INVESTMENTS AND FOREIGN CURRENCY: | | | | | | | | |
| NET REALIZED GAIN (LOSS): | | | | | | | | |
| Investments | | | 10,050,510 | | | | 7,394,893 | |
| Foreign currency transactions | | | (546 | ) | | | – | |
| NET CHANGE IN UNREALIZED APPRECIATION (DEPRECIATION): | | | | | | | | |
| Investments | | | 11,624,313 | | | | 51,157,812 | |
| Other assets and liabilities denominated in foreign currency | | | 25 | | | | – | |
| Net realized and unrealized gain (loss) on investments and foreign currency | | | 21,674,302 | | | | 58,552,705 | |
| NET INCREASE (DECREASE) IN NET ASSETS FROM INVESTMENT OPERATIONS | | $ | 21,198,049 | | | $ | 61,756,905 | |
| THE ACCOMPANYING NOTES ARE AN INTEGRAL PART OF THESE FINANCIAL STATEMENTS | Royce Capital Fund 2023 Annual Report to Shareholders | 19 |
Statements of Changes in Net Assets
| | | Micro-Cap Portfolio | | | Small-Cap Portfolio | |
| | | Year Ended 12/31/23 | | | Year Ended 12/31/22 | | | Year Ended 12/31/23 | | | Year Ended 12/31/22 | |
| INVESTMENT OPERATIONS: | | | | | | | | | | | | | | | | |
| Net investment income (loss) | | $ | (476,253 | ) | | $ | (661,115 | ) | | $ | 3,204,200 | | | $ | 2,214,727 | |
| Net realized gain (loss) on investments and foreign currency | | | 10,049,964 | | | | (940,974 | ) | | | 7,394,893 | | | | 23,593,936 | |
| Net change in unrealized appreciation (depreciation) on investments and foreign currency | | | 11,624,338 | | | | (37,955,019 | ) | | | 51,157,812 | | | | (66,154,197 | ) |
| Net increase (decrease) in net assets from investment operations | | | 21,198,049 | | | | (39,557,108 | ) | | | 61,756,905 | | | | (40,345,534 | ) |
| DISTRIBUTIONS: | | | | | | | | | | | | | | | | |
| Total distributable earnings | | | | | | | | | | | | | | | | |
| Investment Class | | | – | | | | (35,639,401 | ) | | | (12,810,854 | ) | | | (3,069,857 | ) |
| Service Class | | | – | | | | (4,335,006 | ) | | | (14,399,565 | ) | | | (3,038,165 | ) |
| Total distributions | | | – | | | | (39,974,407 | ) | | | (27,210,419 | ) | | | (6,108,022 | ) |
| CAPITAL SHARE TRANSACTIONS: | | | | | | | | | | | | | | | | |
| Value of shares sold | | | | | | | | | | | | | | | | |
| Investment Class | | | 16,367,277 | | | | 9,925,000 | | | | 23,941,849 | | | | 10,505,441 | |
| Service Class | | | 20,890,050 | | | | 1,132,977 | | | | 96,770,854 | | | | 109,240,664 | |
| Distributions reinvested | | | | | | | | | | | | | | | | |
| Investment Class | | | – | | | | 35,639,401 | | | | 12,810,854 | | | | 3,069,857 | |
| Service Class | | | – | | | | 4,335,006 | | | | 14,399,565 | | | | 3,038,165 | |
| Value of shares redeemed | | | | | | | | | | | | | | | | |
| Investment Class | | | (28,684,375 | ) | | | (23,050,585 | ) | | | (49,910,329 | ) | | | (26,631,982 | ) |
| Service Class | | | (15,676,606 | ) | | | (11,854,731 | ) | | | (119,325,949 | ) | | | (135,322,249 | ) |
| Net increase (decrease) in net assets from capital share transactions | | | (7,103,654 | ) | | | 16,127,068 | | | | (21,313,156 | ) | | | (36,100,104 | ) |
| Net Increase (Decrease) in Net Assets | | | 14,094,395 | | | | (63,404,447 | ) | | | 13,233,330 | | | | (82,553,660 | ) |
| NET ASSETS: | | | | | | | | | | | | | | | | |
| Beginning of year | | | 122,868,690 | | | | 186,273,137 | | | | 299,086,400 | | | | 381,640,060 | |
| End of year | | $ | 136,963,085 | | | $ | 122,868,690 | | | $ | 312,319,730 | | | $ | 299,086,400 | |
| 20 | Royce Capital Fund 2023 Annual Report to Shareholders | THE ACCOMPANYING NOTES ARE AN INTEGRAL PART OF THESE FINANCIAL STATEMENTS |
Financial Highlights
This table is presented to show selected data for a share outstanding throughout each period and to assist shareholders in evaluating a Fund’s performance for the periods presented. Per share amounts have been determined on the basis of the weighted average number of shares outstanding during the period.
| | | | | | | | | | | | | | | | | | | | | | | | | | | | | | | | | Ratio of Expenses to Average Net Assets | | | | | | | |
| | | Net Asset Value, Beginning of Period | | | Net Investment Income (Loss) | | Net Realized and Unrealized Gain (Loss) on Investments and Foreign Currency | | | Total from Investment Operations | | | Distributions from Net Investment Income | | | Distributions from Net Realized Gain on Investments and Foreign Currency | | | Total Distributions | | | Net Asset Value, End of Period | | | Total Return | | | Net Assets, End of Period (in thousands) | | | Prior to Fee Waivers, Expense Reimbursements and Balance Credits | | | Prior to Fee Waivers and Expense Reimbursements | | | Net of Fee Waivers and Expense Reimbursements | | | Ratio of Net Investment Income (Loss) to Average Net Assets | | | Portfolio Turnover Rate | |
| Micro-Cap Portfolio–Investment Class | | | | | | | | | | | | | | | | | | | | | | | | | | | | | | | | | | |
| 2023 | | $ | 7.72 | | | $ | (0 .03 | ) | $ | 1.48 | | | $ | 1.45 | | | $ | – | | | $ | – | | | $ | – | | | $ | 9 .17 | | | | 18.78 | % | | $ | 116,468 | | | 1.18 | % | | 1.18 | % | | 1.15 | % | | (0.33 | )% | | 24 | % |
| 2022 | | | 14.77 | | | | (0 .05 | ) | | (3.28 | ) | | | (3.33 | ) | | | – | | | | (3.72 | ) | | | (3.72 | ) | | | 7 .72 | | | | (22.43 | ) | | | 109,600 | | | 1.31 | | | 1.31 | | | 1.21 | | | (0.46 | ) | | 12 | |
| 2021 | | | 11.91 | | | | (0 .08 | ) | | 3.61 | | | | 3.53 | | | | – | | | | (0.67 | ) | | | (0.67 | ) | | | 14 .77 | | | | 29.98 | | | | 157,042 | | | 1.37 | | | 1.37 | | | 1.33 | | | (0.56 | ) | | 25 | |
| 2020 | | | 9.75 | | | | (0 .05 | ) | | 2.36 | | | | 2.31 | | | | – | | | | (0.15 | ) | | | (0.15 | ) | | | 11 .91 | | | | 23.79 | | | | 134,109 | | | 1.47 | | | 1.47 | | | 1.33 | | | (0.51 | ) | | 25 | |
| 2019 | | | 8.97 | | | | (0 .04 | ) | | 1.77 | | | | 1.73 | | | | – | | | | (0.95 | ) | | | (0.95 | ) | | | 9 .75 | | | | 19.55 | | | | 132,008 | | | 1.43 | | | 1.43 | | | 1.33 | | | (0.41 | ) | | 26 | |
| Micro-Cap Portfolio–Service Class | | | | | | | | | | | | | | | | | | | | | | | | | | | | | | | | | | |
| 2023 | | $ | 7.49 | | | $ | (0 .05 | ) | $ | 1.44 | | | $ | 1.39 | | | $ | – | | | $ | – | | | $ | – | | | $ | 8 .88 | | | | 18.56 | % | | $ | 20,495 | | | 1.46 | % | | 1.46 | % | | 1.42 | % | | (0.61 | )% | | 24 | % |
| 2022 | | | 14.37 | | | | (0 .08 | ) | | (3.18 | ) | | | (3.26 | ) | | | – | | | | (3.62 | ) | | | (3.62 | ) | | | 7 .49 | | | | (22.65 | ) | | | 13,269 | | | 1.61 | | | 1.61 | | | 1.47 | | | (0.74 | ) | | 12 | |
| 2021 | | | 11.63 | | | | (0 .11 | ) | | 3.50 | | | | 3.39 | | | | – | | | | (0.65 | ) | | | (0.65 | ) | | | 14 .37 | | | | 29.52 | | | | 29,231 | | | 1.64 | | | 1.64 | | | 1.58 | | | (0.81 | ) | | 25 | |
| 2020 | | | 9.54 | | | | (0 .07 | ) | | 2.31 | | | | 2.24 | | | | – | | | | (0.15 | ) | | | (0.15 | ) | | | 11 .63 | | | | 23.55 | | | | 28,039 | | | 1.72 | | | 1.72 | | | 1.58 | | | (0.75 | ) | | 25 | |
| 2019 | | | 8.80 | | | | (0 .06 | ) | | 1.73 | | | | 1.67 | | | | – | | | | (0.93 | ) | | | (0.93 | ) | | | 9 .54 | | | | 19.24 | | | | 27,090 | | | 1.71 | | | 1.71 | | | 1.58 | | | (0.66 | ) | | 26 | |
| Small-Cap Portfolio–Investment Class | | | | | | | | | | | | | | | | | | | | | | | | | | | | | | | | | | |
| 2023 | | $ | 8.36 | | | $ | 0 .11 | | $ | 2.04 | | | $ | 2.15 | | | $ | (0.08 | ) | | $ | (0.84 | ) | | $ | (0.92 | ) | | $ | 9 .59 | | | | 25.93 | % | | $ | 146,549 | | | 1.15 | % | | 1.15 | % | | 1.13 | % | | 1.26 | % | | 69 | % |
| 2022 | | | 9.41 | | | | 0 .08 | | | (0.94 | ) | | | (0.86 | ) | | | (0.04 | ) | | | (0.15 | ) | | | (0.19 | ) | | | 8 .36 | | | | (9.20 | ) | | | 139,807 | | | 1.15 | | | 1.15 | | | 1.08 | | | 0.96 | | | 88 | |
| 2021 | | | 7.41 | | | | 0 .03 | | | 2.10 | | | | 2.13 | | | | (0.13 | ) | | | – | | | | (0.13 | ) | | | 9 .41 | | | | 28.82 | | | | 172,388 | | | 1.11 | | | 1.11 | | | 1.08 | | | 0.37 | | | 51 | |
| 2020 | | | 8.19 | | | | 0 .06 | | | (0.65 | ) | | | (0.59 | ) | | | (0.07 | ) | | | (0.12 | ) | | | (0.19 | ) | | | 7 .41 | | | | (7.15 | ) | | | 153,953 | | | 1.19 | | | 1.19 | | | 1.08 | | | 0.90 | | | 95 | |
| 2019 | | | 7.87 | | | | 0 .09 | | | 1.37 | | | | 1.46 | | | | (0.06 | ) | | | (1.08 | ) | | | (1.14 | ) | | | 8 .19 | | | | 18.67 | | | | 173,492 | | | 1.15 | | | 1.15 | | | 1.08 | | | 1.04 | | | 111 | |
| Small-Cap Portfolio–Service Class | | | | | | | | | | | | | | | | | | | | | | | | | | | | | | | | | | |
| 2023 | | $ | 8.18 | | | $ | 0 .08 | | $ | 1.99 | | | $ | 2.07 | | | $ | (0.06 | ) | | $ | (0.82 | ) | | $ | (0.88 | ) | | $ | 9 .37 | | | | 25.53 | % | | $ | 165,771 | | | 1.39 | % | | 1.39 | % | | 1.37 | % | | 0.96 | % | | 69 | % |
| 2022 | | | 9.20 | | | | 0 .06 | | | (0.92 | ) | | | (0.86 | ) | | | (0.01 | ) | | | (0.15 | ) | | | (0.16 | ) | | | 8 .18 | | | | (9.41 | ) | | | 159,279 | | | 1.40 | | | 1.40 | | | 1.33 | | | 0.68 | | | 88 | |
| 2021 | | | 7.25 | | | | 0 .01 | | | 2.05 | | | | 2.06 | | | | (0.11 | ) | | | – | | | | (0.11 | ) | | | 9 .20 | | | | 28.45 | | | | 209,252 | | | 1.35 | | | 1.35 | | | 1.33 | | | 0.10 | | | 51 | |
| 2020 | | | 8.01 | | | | 0 .05 | | | (0.64 | ) | | | (0.59 | ) | | | (0.05 | ) | | | (0.12 | ) | | | (0.17 | ) | | | 7 .25 | | | | (7.33 | ) | | | 205,500 | | | 1.43 | | | 1.43 | | | 1.33 | | | 0.73 | | | 95 | |
| 2019 | | | 7.69 | | | | 0 .06 | | | 1.35 | | | | 1.41 | | | | (0.04 | ) | | | (1.05 | ) | | | (1.09 | ) | | | 8 .01 | | | | 18.44 | | | | 225,250 | | | 1.39 | | | 1.39 | | | 1.33 | | | 0.86 | | | 111 | |
| THE ACCOMPANYING NOTES ARE AN INTEGRAL PART OF THESE FINANCIAL STATEMENTS | Royce Capital Fund 2023 Annual Report to Shareholders | 21 |
Notes to Financial Statements
Summary of Significant Accounting Policies:
Royce Capital Fund – Micro-Cap Portfolio and Royce Capital Fund – Small-Cap Portfolio (the “Fund” or “Funds”) are the two series of Royce Capital Fund (the “Trust”), an open-end management investment company organized as a Delaware statutory trust. Shares of the Funds are offered to life insurance companies for allocation to certain separate accounts established for the purpose of funding qualified and non-qualified variable annuity contracts and variable life insurance contracts. Micro-Cap Portfolio and Small-Cap Portfolio commenced operations on December 27, 1996.
Classes of shares have equal rights as to earnings and assets, except that each class may bear different fees and expenses for distribution, shareholder servicing and shareholder reports, and receive different transfer agent balance credits and expense reimbursements. Investment income, realized and unrealized capital gains or losses on investments and foreign currency, and expenses other than those attributable to a specific class are allocated to each class of shares based on its relative net assets.
The preparation of financial statements in conformity with accounting principles generally accepted in the United States of America requires management to make estimates and assumptions that affect the reported amounts of assets and liabilities and the disclosure of contingent assets and liabilities at the date of the financial statements and the reported amounts of income and expenses during the reporting period. Actual results could differ from those estimates.
Each Fund is an investment company registered under the Investment Company Act of 1940 (the “1940 Act”) and accordingly follows the investment company accounting and reporting guidance of the Financial Accounting Standards Board (FASB) Accounting Standard Codification Topic 946 “Financial Services-Investment Companies.”
Royce & Associates, LP, the Funds’ investment adviser, is a majority-owned subsidiary of Franklin Resources, Inc. and primarily conducts business using the name Royce Investment Partners (“Royce”).
VALUATION OF INVESTMENTS:
Portfolio securities held by the Funds are valued as of the close of trading on the New York Stock Exchange (“NYSE”) (generally 4:00 p.m. Eastern time) on the valuation date. Investments in money market funds are valued at net asset value per share. Values for non-U.S. dollar denominated equity securities are converted to U.S. dollars daily based upon prevailing foreign currency exchange rates as quoted by a major bank.
Equity securities that are listed on an exchange or Nasdaq, or traded on OTC Market Group Inc.’s OTC Link ATS or other alternative trading system, are valued: (i) on the basis of their last reported sales prices or official closing prices, as applicable, on a valuation date; or (ii) at their highest reported bid prices in the event such equity securities did not trade on a valuation date. Such inputs are generally referred to as “Level 1” inputs because they represent reliable quoted prices in active markets for identical securities.
If the value of a portfolio security held by a Fund cannot be determined solely by reference to Level 1 inputs, such portfolio security will be “fair valued.” The Trust’s Board of Trustees has designated Royce as valuation designee to perform fair value determinations for such portfolio securities in accordance with Rule 2a-5 under the 1940 Act (“Rule 2a-5”). Pursuant to Rule 2a-5, fair values are determined in accordance with policies and procedures approved by the Trust's Board of Trustees and policies and procedures adopted by Royce in its capacity as valuation designee for the Trust. Fair valued securities are reported as either “Level 2” or “Level 3” securities.
As a general principle, the fair value of a security is the amount which a Fund might reasonably expect to receive for the security upon its current sale. However, in light of the judgment involved in fair valuations, no assurance can be given that a fair value assigned to a particular portfolio security will be the amount which the Fund might be able to receive upon its current sale. When a fair value pricing methodology is used, the fair value prices used by the Fund for such securities will likely differ from the quoted or published prices for the same securities.
Level 2 inputs are other significant observable inputs (e.g., dealer bid side quotes and quoted prices for securities with comparable characteristics). Examples of situations in which Level 2 inputs are used to fair value portfolio securities held by the Funds on a particular valuation date include:
| ● | Over-the-counter equity securities other than those traded on OTC Market Group Inc.’s OTC Link ATS or other alternative trading system (collectively referred to herein as “Other OTC Equity Securities”) are fair valued at their highest bid price when Royce receives at least two bid side quotes from dealers who make markets in such securities; |
| ● | Certain bonds and other fixed income securities may be fair valued by reference to other securities with comparable ratings, interest rates, and maturities in accordance with valuation methodologies maintained by certain independent pricing services; and |
| ● | The Funds use an independent pricing service to fair value certain non-U.S. equity securities when U.S. market volatility exceeds a certain threshold. This pricing service uses proprietary correlations it has developed between the movement of prices of non-U.S. equity securities and indices of U.S.-traded securities, futures contracts, and other indications to estimate the fair value of such non-U.S. securities. |
22 | Royce Capital Fund 2023 Annual Report to Shareholders
VALUATION OF INVESTMENTS (continued):
Level 3 inputs are significant unobservable inputs. Examples of Level 3 inputs include (without limitation) the last trade price for a security before trading was suspended or terminated; discounts to last trade price for lack of marketability or otherwise; market price information regarding other securities; information received from the issuer and/or published documents, including SEC filings and financial statements; and other publicly available information. Pursuant to the above-referenced policies and procedures, Royce may use various techniques in making fair value determinations based upon Level 3 inputs, which techniques may include (without limitation): (i) workout valuation methods (e.g., earnings multiples, discounted cash flows, liquidation values, derivations of book value, firm or probable offers from qualified buyers for the issuer’s ongoing business, etc.); (ii) discount or premium from market, or compilation of other observable market information, for other similar freely traded securities; (iii) conversion from the readily available market price of a security into which an affected security is convertible or exchangeable; and (iv) pricing models or other formulas. In the case of restricted securities, fair value determinations generally start with the inherent or intrinsic worth of the relevant security, without regard to the restrictive feature, and are reduced for any diminution in value resulting from the restrictive feature. Due to the inherent uncertainty of such valuations, these fair values may differ significantly from the values that would have been used had an active market existed.
A security that is valued by reference to Level 1 or Level 2 inputs may drop to Level 3 on a particular valuation date for several reasons, including if:
| ● | an equity security that is listed on an exchange or Nasdaq, or traded on OTC Market Group Inc.’s OTC Link ATS or other alternative trading system, has not traded and there are no bids; |
| ● | Royce does not receive at least two bid side quotes for an Other OTC Equity Security; |
| ● | the independent pricing services are unable to supply fair value prices; or |
| ● | the Level 1 or Level 2 inputs become otherwise unreliable for any reason (e.g., a significant event occurs after the close of trading for a security but prior to the time a Fund prices its shares). |
The table below shows the aggregate value of the various Level 1, Level 2, and Level 3 securities held by the Funds as of December 31, 2023. Any Level 2 or Level 3 securities held by a Fund are noted in its Schedule of Investments. The inputs or methodology used for valuing securities are not necessarily an indication of the risk associated with owning those securities.
| | LEVEL 1 | LEVEL 2 | LEVEL 3 | TOTAL |
| Micro-Cap Portfolio | | | | | |
| Common Stocks | $130,470,949 | $ | – | $0 | $130,470,949 |
| Repurchase Agreement | – | | 6,788,698 | – | 6,788,698 |
| Money Market Fund/Collateral Received for Securities Loaned | 1,057,690 | | – | – | 1,057,690 |
| Small-Cap Portfolio | | | | | |
| Common Stocks | 304,940,556 | | – | – | 304,940,556 |
| Repurchase Agreement | – | | 6,867,186 | – | 6,867,186 |
REPURCHASE AGREEMENTS:
The Funds may enter into repurchase agreements with institutions that the Funds’ investment adviser has determined are creditworthy. Each Fund restricts repurchase agreements to maturities of no more than seven days. Securities pledged as collateral for repurchase agreements, which are held until maturity of the repurchase agreements, are marked-to-market daily and maintained at a value at least equal to the principal amount of the repurchase agreement (including accrued interest). Repurchase agreements could involve certain risks in the event of default or insolvency of the counter-party, including possible delays or restrictions upon the ability of each Fund to dispose of its underlying securities. The remaining contractual maturities of repurchase agreements held by the Funds as of December 31, 2023, are next business day and continuous.
FOREIGN CURRENCY:
Net realized foreign exchange gains or losses arise from sales and maturities of short-term securities, sales of foreign currencies, expiration of currency forward contracts, currency gains or losses realized between the trade and settlement dates on securities transactions, and the difference between the amounts of dividends, interest, and foreign withholding taxes recorded on each Fund’s books and the U.S. dollar equivalent of the amounts actually received or paid. Net unrealized foreign exchange gains and losses arise from changes in the value of assets and liabilities, other than investments in securities at the end of the reporting period, as a result of changes in foreign currency exchange rates.
The Funds do not isolate that portion of the results of operations resulting from fluctuations in foreign exchange rates on investments from the fluctuations arising from changes in market prices of securities held. Such fluctuations are included with the net realized and unrealized gain or loss on investments.
Royce Capital Fund 2023 Annual Report to Shareholders | 23
Notes to Financial Statements (continued)
SECURITIES LENDING:
The Funds loan securities through a lending agent, State Street Bank and Trust Company, to qualified institutional investors for the purpose of earning additional income. The lending agent receives and holds collateral from such borrowers to secure their obligations to the Funds. Such loans must be secured at all times by collateral in an amount at least equal to the market value of the loaned securities. The market values of the loaned securities and the collateral fluctuate and are determined at the close of each business day by the lending agent. Borrowers are required to post additional collateral to the lending agent on the next succeeding business day in the event of a collateral shortfall. Counterparty risk is further reduced by loaning securities only to parties that participate in a Global Securities Lending Program organized and monitored by the lending agent and that are deemed by it to satisfy its requirements and by having the lending agent enter into securities lending agreements with such borrowers. The lending agent is not affiliated with Royce.
Collateral may be in the form of cash or U.S. Treasuries. Cash collateral is invested in certain money market pooled investment vehicles. The Funds record a liability in their respective Statements of Assets and Liabilities for the return of such cash collateral during periods in which securities are on loan. The Funds bear the risk of loss for any decrease in the market value of the loaned securities or the investments purchased with cash collateral received from the borrowers.
Pursuant to the agreement in place between the Funds and the lending agent, if a borrower fails to return loaned securities, and the cash collateral being maintained by the lending agent on behalf of such borrower is insufficient to cover the value of loaned securities and provided such collateral insufficiency is not the result of investment losses, the lending agent shall, at its option, either replace the loaned securities or pay the amount of the shortfall to the Funds. In the event of the bankruptcy of a borrower, the Funds could experience delay in recovering the loaned securities or only recover cash or a security of equivalent value.
Loans of securities generally do not have stated maturity dates, and the Funds may recall a security at any time. The Funds’ securities lending income consists of the income earned on investing cash collateral, plus any premium payments received for lending certain securities, less any rebates paid to borrowers and lending agent fees associated with the loan. Pursuant to the agreement in place between the Funds and the lending agent, the Funds are responsible for any shortfall in the event the value of the investments purchased with cash collateral is insufficient to pay the rebate fee to the borrower.
The following table presents cash collateral and the market value of securities on loan collateralized by cash collateral held by the Funds as of December 31, 2023:
| | | SECURITIES ON LOAN COLLATERALIZED | |
| | CASH COLLATERAL1 | BY CASH COLLATERAL | NET AMOUNT |
| Micro-Cap Portfolio | $1,057,690 | $(1,022,947) | $34,743 |
| 1 | Absent an event of default, assets and liabilities are presented gross and not offset in the Statements of Assets and Liabilities. The contractual maturity of cash collateral is overnight and continuous. |
The following table presents non-cash collateral and the market value of securities on loan collateralized by non-cash collateral held by the Funds’ custodian as of December 31, 2023:
| | | SECURITIES ON LOAN COLLATERALIZED | |
| | NON-CASH COLLATERAL | BY NON-CASH COLLATERAL | NET AMOUNT |
| Micro-Cap Portfolio | $2,934,708 | $(2,874,042) | $60,666 |
DISTRIBUTIONS AND TAXES:
As qualified regulated investment companies under Subchapter M of the Internal Revenue Code, the Funds are not subject to income taxes to the extent that each Fund distributes substantially all of its taxable income for its fiscal year.
The Funds pay any dividends and capital gain distributions annually in December. Dividends from net investment income and distributions from capital gains are determined at a class level. Because federal income tax regulations differ from generally accepted accounting principles, income and capital gain distributions determined in accordance with tax regulations may differ from net investment income and realized gains recognized for financial reporting purposes. Accordingly, the character of distributions and composition of net assets for tax purposes differ from those reflected in the accompanying financial statements.
INVESTMENT TRANSACTIONS AND RELATED INVESTMENT INCOME:
Investment transactions are accounted for on the trade date. Dividend income is recorded on the ex-dividend date except for certain dividends from securities where the dividend rate is not available. In such cases, the dividend is recorded as soon as the information is received by the Funds. Non-cash dividend income is recorded at the fair market value of the securities received. Interest income is recorded on an accrual basis. Realized gains and losses from investment transactions are determined on the basis of identified cost for book and tax purposes.
EXPENSES:
The Funds incur direct and indirect expenses. Expenses directly attributable to a Fund are charged to the Fund, while expenses applicable to more than one of the Royce Funds are allocated equitably. Certain personnel, occupancy costs and other administrative expenses related to all of the Royce Funds are allocated by Royce under an administration agreement and are included in administrative and office facilities and legal expenses.
24 | Royce Capital Fund 2023 Annual Report to Shareholders
COMPENSATING BALANCE CREDITS:
The Funds have an arrangement with their transfer agent, whereby a portion of the transfer agent’s fee is paid indirectly by credits earned on a Fund’s cash on deposit with the transfer agent.
LINE OF CREDIT:
The Funds, along with certain other Royce Funds, participate in a $65 million line of credit (“Credit Agreement”) with State Street Bank and Trust Company to be used for temporary or emergency purposes. This revolving Credit Agreement expires on October 4, 2024. Pursuant to the Credit Agreement, each participating Fund is liable for a portion of the commitment fee for the credit facility (i.e., 0.25% of any unused portion of the line of credit) and for principal and interest payments related to borrowings made by that Fund. Borrowings under the Credit Agreement bear interest at a variable rate equal to the Applicable Rate plus the Applicable Margin. The term Applicable Rate means, for any day, a rate equal to the sum of (a) 0.10%, plus (b) the higher of (i) the Federal Funds Effective Rate for such day, or (ii) the Overnight Bank Funding Rate for such day. The term Applicable Margin means 1.25%. The Funds did not utilize the line of credit during the year ended December 31, 2023.
INDEMNIFICATION PROVISIONS:
Reference is made to Delaware law and the Trust’s Certificate of Trust, Trust Instrument, and By-laws, as amended and supplemented, each of which provides for the indemnification by the Trust of the Trust’s officers and trustees under the circumstances and to the extent set forth therein. Reference is also made to the investment advisory agreement between the Trust, on behalf of each Fund, and Royce which provides for the indemnification by the relevant Fund of Royce under the circumstances and to the extent set forth therein. Additionally, in the normal course of business, the Trust, on behalf of both Funds, enters into contracts with service providers that contain general indemnification provisions in favor of such service providers and other covered persons. The amount of any potential Fund liability under these indemnification arrangements, if any, currently cannot be determined with any degree of specificity. The Trust is not currently in possession of any information that would cause it to believe that any Fund is reasonably likely to be subject to any material adverse impact from the operation of these indemnification arrangements. No assurance can be given, however, that any Fund will not incur any liability from the operation of these indemnification arrangements. Any future liability to a Fund that may arise from the operation of such arrangements will be publicly disclosed to the extent required by relevant accounting guidance and applicable laws, rules, and regulations.
Capital Share Transactions (in shares):
| | | SHARES SOLD | | | SHARES ISSUED FOR REINVESTMENT
OF DISTRIBUTIONS | | | SHARES REDEEMED | | | NET INCREASE (DECREASE) IN
SHARES OUTSTANDING | |
| | | Year Ended
12/31/23 | | | Year Ended
12/31/22 | | | Year Ended
12/31/23 | | | Year Ended
12/31/22 | | | Year Ended
12/31/23 | | | Year Ended
12/31/22 | | | Year Ended
12/31/23 | | | Year Ended
12/31/22 | |
| Micro-Cap Portfolio | | | | | | | | | | | | | | | | | | | | | | | | | | | | | | | | |
| Investment Class | | | 2,000,011 | | | | 876,101 | | | | – | | | | 4,634,513 | | | | (3,507,726 | ) | | | (1,938,927 | ) | | | (1,507,715 | ) | | | 3,571,687 | |
| Service Class | | | 2,595,908 | | | | 98,642 | | | | – | | | | 580,322 | | | | (2,059,573 | ) | | | (941,140 | ) | | | 536,335 | | | | (262,176 | ) |
| Small-Cap Portfolio | | | | | | | | | | | | | | | | | | | | | | | | | | | | | | | | |
| Investment Class | | | 2,655,530 | | | | 1,233,648 | | | | 1,362,857 | | | | 363,727 | | | | (5,453,895 | ) | | | (3,195,023 | ) | | | (1,435,508 | ) | | | (1,597,648 | ) |
| Service Class | | | 11,036,795 | | | | 12,673,100 | | | | 1,566,873 | | | | 368,263 | | | | (14,391,550 | ) | | | (16,317,611 | ) | | | (1,787,882 | ) | | | (3,276,248 | ) |
Investment Adviser and Distributor:
INVESTMENT ADVISER:
Under the Trust’s investment advisory agreement with Royce, Royce is entitled to receive investment advisory fees in respect of each Fund that are computed daily and payable monthly.
| | | ANNUAL CONTRACTUAL ADVISORY FEE AS A | | | COMMITTED NET ANNUAL OPERATING EXPENSE RATIO CAP | | | YEAR ENDED DECEMBER 31, 2023 | |
| | | PERCENTAGE OF AVERAGE NET ASSETS | | | Investment Class | | Service Class | | | Net advisory fees | | | Advisory fees waived | |
| Micro-Cap Portfolio | | 1.00%1 | | | N/A2 | | N/A3 | | | $ | 1,259,824 | | | $ | 29,797 | |
| Small-Cap Portfolio | | 1.00% | | | N/A2 | | N/A3 | | | | 2,874,375 | | | | 28,330 | |
| 1 | The annual contractual advisory fee for Micro-Cap Portfolio was reduced to 1.00% from 1.25%, effective July 1, 2022. |
| 2 | Royce had contractually agreed, without right of termination, to waive fees and/or reimburse expenses (excluding brokerage commissions, taxes, interest, litigation expenses, acquired fund fees and expenses, and other expenses not borne in the ordinary course of business) to the extent necessary to maintain the Funds’ Investment Class net annual operating expense ratios at 1.08% through April 30, 2023. |
| 3 | Royce had contractually agreed, without right of termination, to waive fees and/or reimburse expenses (excluding brokerage commissions, taxes, interest, litigation expenses, acquired fund fees and expenses, and other expenses not borne in the ordinary course of business) to the extent necessary to maintain the Funds’ Service Class net annual operating expense ratios at 1.33% through April 30, 2023. |
DISTRIBUTOR:
Royce Fund Services, LLC (“RFS”), the distributor of the Trust’s shares, is a wholly owned subsidiary of Royce. RFS is entitled to receive distribution fees from each Fund’s Service Class that are computed daily and payable monthly, at an annual rate of 0.25% of the average net assets of each Class. For the year ended December 31, 2023, Micro-Cap Portfolio-Service Class recorded distribution fees of $43,431 and Small-Cap Portfolio-Service Class recorded distribution fees of $371,627.
Royce Capital Fund 2023 Annual Report to Shareholders | 25
Notes to Financial Statements (continued)
Purchases and Sales of Investment Securities:
For the year ended December 31, 2023, the costs of purchases and the proceeds from sales of investment securities, other than short-term securities and collateral received for securities loaned, were as follows:
| | PURCHASES | SALES |
| Micro-Cap Portfolio | $ | 29,277,310 | $ | 37,605,540 |
| Small-Cap Portfolio | | 196,528,852 | | 242,914,333 |
Class Specific Expenses:
Class specific expenses were as follows for the year ended December 31, 2023:
| | DISTRIBUTION
FEES | SHAREHOLDER
SERVICING | SHAREHOLDER
REPORTS | TRANSFER AGENT
BALANCE CREDITS | TOTAL | CLASS LEVEL
EXPENSES
REIMBURSED BY
INVESTMENT
ADVISER |
| Micro-Cap Portfolio – Investment Class | $ | – | $ | 9,854 | $ | 14,496 | $ | (161) | $ | 24,189 | $ | 8,891 |
| Micro-Cap Portfolio – Service Class | | 43,431 | | 7,428 | | 969 | | (64) | | 51,764 | | 3,377 |
| | | 43,431 | | 17,282 | | 15,465 | | (225) | | | | 12,268 |
| Small-Cap Portfolio – Investment Class | | – | | 8,914 | | 13,024 | | (139) | | 21,799 | | 7,984 |
| Small-Cap Portfolio – Service Class | | 371,627 | | 7,694 | | (4,123) | | (58) | | 375,140 | | 5,265 |
| | | 371,627 | | 16,608 | | 8,901 | | (197) | | | | 13,249 |
Tax Information:
As of December 31, 2023, net unrealized appreciation (depreciation) based on identified cost for tax purposes was as follows:
| | | NET UNREALIZED | GROSS UNREALIZED |
| | TAX BASIS COST | APPRECIATION (DEPRECIATION) | Appreciation | (Depreciation) |
| Micro-Cap Portfolio | $103,430,132 | $34,887,205 | $48,129,337 | $13,242,132 |
| Small-Cap Portfolio | 236,966,639 | 74,841,103 | 77,523,834 | 2,682,731 |
The primary causes of the difference between book and tax basis cost are the timing of the recognition of losses on securities sold and investments in publicly traded partnerships.
Distributions during the years ended December 31, 2023 and 2022, were characterized as follows for tax purposes:
| | | ORDINARY INCOME | | LONG-TERM CAPITAL GAINS | RETURN OF CAPITAL |
| | 2023 | 2022 | 2023 | 2022 | 2023 | 2022 |
| Micro-Cap Portfolio | $ | – | $6,812,803 | $ | – | $33,160,394 | $ – | $1,210 |
| Small-Cap Portfolio | | 2,146,622 | 683,291 | | 25,063,797 | 5,424,731 | – | – |
The tax basis components of distributable earnings as of December 31, 2023, were as follows:
| | UNDISTRIBUTED
ORDINARY INCOME | UNDISTRIBUTED
LONG-TERM CAPITAL GAINS OR
(CAPITAL LOSS CARRYFORWARD) | NET UNREALIZED
APPRECIATION
(DEPRECIATION)1 | TOTAL DISTRIBUTABLE
EARNINGS | CAPITAL LOSS
CARRYFORWARD
UTILIZED |
| Micro-Cap Portfolio | $ | – | $ 9,225,596 | $34,887,099 | $44,112,695 | $914,742 |
| Small-Cap Portfolio | | 3,126,310 | 11,366,132 | 74,841,097 | 89,333,539 | – |
| 1 | Includes timing differences on foreign currency, recognition of losses on securities sold and investments in publicly traded partnerships. |
For financial reporting purposes, capital accounts and distributions to shareholders are adjusted to reflect the tax character of permanent book/tax differences. For the year ended December 31, 2023, the Funds recorded the following permanent reclassifications, which relate primarily to current net operating losses. Results of operations and net assets were not affected by these reclassifications.
| | TOTAL DISTRIBUTABLE
EARNINGS (LOSS) | PAID-IN
CAPITAL |
| Micro-Cap Portfolio | $476,799 | $(476,799) |
| Small-Cap Portfolio | – | – |
Management has analyzed the Funds’ tax positions taken on federal income tax returns for all open tax years (2020 – 2023) and has concluded that as of December 31, 2023, no provision for income tax is required in the Funds’ financial statements.
New Accounting Pronouncements and Regulations:
On October 26, 2022, the SEC adopted rule and form amendments which require open-end mutual funds to transmit streamlined annual and semi-annual reports to shareholders that highlight key information to investors. In connection with these amendments, certain information that was previously disclosed in fund shareholder reports will instead be made available online, delivered free of charge upon request, and filed on a semi-annual basis on Form N-CSR. The rule and form amendments have a compliance date of July 24, 2024, and will have no effect on the Funds' accounting policies or financial statements.
Subsequent Events:
Subsequent events have been evaluated through the date the financial statements were issued and it has been determined that no events have occurred that require disclosure.
26 | Royce Capital Fund 2023 Annual Report to Shareholders
Report of Independent Registered Public Accounting Firm
To the Board of Trustees of Royce Capital Fund and Shareholders of Royce Capital Fund – Micro-Cap Portfolio and Royce Capital Fund – Small-Cap Portfolio:
Opinions on the Financial Statements
We have audited the accompanying statements of assets and liabilities, including the schedules of investments, of Royce Capital Fund – Micro-Cap Portfolio and Royce Capital Fund – Small-Cap Portfolio (constituting Royce Capital Fund, hereafter collectively referred to as the "Funds") as of December 31, 2023, the related statements of operations for the year ended December 31, 2023, the statements of changes in net assets for each of the two years in the period ended December 31, 2023, including the related notes, and the financial highlights for each of the five years in the period ended December 31, 2023 (collectively referred to as the “financial statements”). In our opinion, the financial statements present fairly, in all material respects, the financial position of each of the Funds as of December 31, 2023, the results of each of their operations for the year then ended, the changes in each of their net assets for each of the two years in the period ended December 31, 2023 and each of the financial highlights for each of the five years in the period ended December 31, 2023 in conformity with accounting principles generally accepted in the United States of America.
Basis for Opinions
These financial statements are the responsibility of the Funds’ management. Our responsibility is to express an opinion on the Funds’ financial statements based on our audits. We are a public accounting firm registered with the Public Company Accounting Oversight Board (United States) (PCAOB) and are required to be independent with respect to the Funds in accordance with the U.S. federal securities laws and the applicable rules and regulations of the Securities and Exchange Commission and the PCAOB.
We conducted our audits of these financial statements in accordance with the standards of the PCAOB. Those standards require that we plan and perform the audit to obtain reasonable assurance about whether the financial statements are free of material misstatement, whether due to error or fraud.
Our audits included performing procedures to assess the risks of material misstatement of the financial statements, whether due to error or fraud, and performing procedures that respond to those risks. Such procedures included examining, on a test basis, evidence regarding the amounts and disclosures in the financial statements. Our audits also included evaluating the accounting principles used and significant estimates made by management, as well as evaluating the overall presentation of the financial statements. Our procedures included confirmation of securities owned as of December 31, 2023, by correspondence with the custodian and brokers; when replies were not received from brokers, we performed other auditing procedures. We believe that our audits provide a reasonable basis for our opinions.
/s/PricewaterhouseCoopers LLP
New York, New York
February 14, 2024
We have served as the auditor of one or more investment companies in the Franklin Templeton Group of Funds since 1948.
Royce Capital Fund 2023 Annual Report to Shareholders | 27
Understanding Your Fund’s Expenses (unaudited)
As a shareholder of a mutual fund, you pay ongoing expenses, including management fees and other Fund expenses including, for some fund share classes, distribution and/or service (12b-1) fees. Using the information below, you can estimate how these ongoing expenses (in dollars) affect your investment and compare them with the ongoing expenses of other funds. You may also incur one-time transaction expenses which are not shown in this section and would result in higher total costs. The example is based on an investment of $1,000 invested at July 1, 2023, and held for the entire six-month period ended December 31, 2023. Service Class shares are generally available only through certain insurance companies who receive service fees from the Fund for services that they perform.
Actual Expenses
The first part of the table below provides information about actual account values and actual expenses. You may use the information in this section, together with the amount you invested, to estimate the expenses that you paid over the period. Simply divide your account value at December 31, 2023, by $1,000 (for example, an $8,600 account value divided by $1,000 = 8.6), then multiply the result by the number under the heading entitled “Expenses Paid During the Period” to estimate the expenses you paid on your account during this period.
Hypothetical Example for Comparison Purposes
The second part of the table below provides information about hypothetical account values and hypothetical expenses based on the Fund’s actual expense ratio and an assumed rate of return of 5% per year before expenses, which is not the Fund’s actual rate of return. The hypothetical account values and expenses may not be used to estimate the actual ending account balance or expenses you paid for the period. You may use this information to compare the ongoing costs of investing in the Fund and other funds. To do so, compare this 5% hypothetical example with the 5% hypothetical examples that appear in the shareholder reports of the other funds.
Please note that the expenses shown in the table are meant to highlight your ongoing costs only and do not reflect any transactional costs, such as sales charges (loads), redemption fees, or exchange fees. Therefore, this section is useful in comparing ongoing costs only, and will not help you determine the relative total costs of owning different funds. In addition, if these transactional costs were included, your costs would have been higher.
| | | ACTUAL | HYPOTHETICAL (5% PER YEAR BEFORE EXPENSES) |
| | | Beginning Account
Value 7/1/23 | Ending Account Value
12/31/23 | Expenses Paid During
the Period1 | Beginning Account
Value 7/1/23 | Ending Account Value
12/31/23 | Expenses Paid During
the Period1 | Net Annualized
Operating Expense
Ratio2 |
| Investment Class | | | | | | | | | | | | | | | | | | | | | |
| Micro-Cap Portfolio | | $ | 1,000.00 | | $ | 1,087.78 | | $ | 6.26 | | $ | 1,000.00 | | $ | 1,019.21 | | $ | 6.06 | | | 1.19 | % |
| Small-Cap Portfolio | | | 1,000.00 | | | 1,164.53 | | | 6.33 | | | 1,000.00 | | | 1,019.36 | | | 5.90 | | | 1.16 | % |
| Service Class | | | | | | | | | | | | | | | | | | | | | | |
| Micro-Cap Portfolio | | | 1,000.00 | | | 1,086.90 | | | 7.68 | | | 1,000.00 | | | 1,017.85 | | | 7.43 | | | 1.46 | % |
| Small-Cap Portfolio | | | 1,000.00 | | | 1,162.89 | | | 7.58 | | | 1,000.00 | | | 1,018.20 | | | 7.07 | | | 1.39 | % |
| 1 | Expenses are equal to the Fund's net annualized operating expense ratio multiplied by the average account value for the period, multiplied by 184 days in the most recent fiscal half-year divided by 365 days (to reflect the half-year period). This information does not include fees or expenses of the variable annuity contracts investing in the Funds. |
| 2 | Net annualized operating expense ratio used to derive figures in the table is based on the most recent fiscal half-year. |
Federal Tax Information
In January 2024, taxable shareholders that opted out of e-delivery were mailed a Form 1099-DIV reporting the federal tax status of all distributions paid during the calendar year 2023. Shareholders who elected e-delivery have received electronic notification of the form being available for download via their Online Account Access.
2023 Supplemental Tax Information:
| | % | % U.S. GOVT | % INCOME QUALIFYING | LONG-TERM CAPITAL GAIN DISTRIBUTION |
| | QDI | INCOME | FOR DRD | MAXIMUM ALLOWABLE (OOO’s) |
| Micro-Cap Portfolio | 0.00% | N/A | 0.00% | $ – |
| Small-Cap Portfolio | 100.00% | N/A | 100.00% | 25,064 |
Definitions:
% QDI: Qualified Dividend Income; % of net investment income and/or short-term capital gains distributions that qualify for treatment at long-term capital gain rates.
% U.S. Govt Income: % of investment income paid from U.S. Government obligations.
% Income Qualifying for DRD: % of investment income eligible for the corporate dividend received deduction.
28 | Royce Capital Fund 2023 Annual Report to Shareholders
Trustees and Officers
All Trustees and Officers may be reached c/o The Royce Funds, 745 Fifth Avenue, New York, NY 10151
Christopher D. Clark, Trustee 1, President
Age: 58 | Number of Funds Overseen: 16 | Tenure: Since 2014
Principal Occupation(s) During Past Five Years: Chief Executive Officer (since July 2016), President (since July 2014), Co-Chief Investment Officer (since January 2014), Managing Director of Royce, a Member of the Board of Managers of Royce, having been employed by Royce since May 2007.
Patricia W. Chadwick, Trustee
Age: 75 | Number of Funds Overseen: 16 | Tenure: Since 2009
Non-Royce Directorships: Trustee of Voya Mutual Funds
Principal Occupation(s) During Past 5 Years: Consultant and President, Ravengate Partners LLC (since 2000). Formerly Director, Wisconsin Energy Corp. (until 2022).
Christopher C. Grisanti, Trustee
Age: 62 | Number of Funds Overseen: 16 | Tenure: Since 2017
Non-Royce Directorships: None
Principal Occupation(s) During Past Five Years: Chief Equity Strategist and Senior Portfolio Manager, MAI Capital Management LLC (investment advisory firm) (since May 2020). Formerly Co-Founder and Chief Executive Officer, Grisanti Capital Management LLC (investment advisory firm) (from 1999 to 2020); Director of Research and Portfolio Manager, Spears Benzak, Salomon & Farrell (from 1994 to 1999); and Senior Associate, Simpson, Thacher & Bartlett (law firm) (from 1988 to 1994).
Cecile B. Harper, Trustee
Age: 60 | Number of Funds Overseen: 16 | Tenure: Since 2020
Non-Royce Directorships: None
Principal Occupation(s) During Past Five Years: Chief Financial Officer and Chief Operating Officer, College Foundation at the University of Virginia (since October 2019). Formerly Board Member, Pyramid Peak Foundation (January 2012 to 2022); Board Member, Regional One Health Foundation (from June 2013 to September 2019); and Principal, Southeastern Asset Management (from December 1993 to September 2019).
Arthur S. Mehlman, Trustee3
Age: 81 | Number of Funds Overseen: 16 | Tenure: Since 2004
Non-Royce Directorships: None
Principal Occupation(s) During Past Five Years: Director, University of Maryland Foundation (non-profits). Formerly Director/Trustee, registered investment companies constituting the Legg Mason Funds (from 2002 to June 2021); Director, The League for People with Disabilities, Inc. (from June 2003 to June 2018); Director, Municipal Mortgage & Equity, LLC (from October 2004 to April 2011); Director, University of Maryland College Park Foundation (non-profit) (from 1998 to 2005); Director, Maryland Business Roundtable for Education (from July 1984 to June 2002); and Partner, KPMG LLP (international accounting firm) (from 1972 to 2002)
G. Peter O’Brien, Trustee
Age: 78 | Number of Funds Overseen: 71 | Tenure: Since 2001
Non-Royce Directorships: Director/Trustee of registered investment companies constituting the 55 Legg Mason Funds.
Principal Occupation(s) During Past Five Years: Trustee Emeritus, Colgate University (since 2005); and Emeritus Board Member, Hill House, Inc. (since 2019). Formerly Director, TICC Capital Corp. (from 2003-2017); Trustee, Colgate University (from 1996 to 2005); President, Hill House, Inc. (from 2001 to 2005); Board Member, Hill House, Inc. (from 1999 to 2019); Director, Bridges School (from 2006 to 2018); and Managing Director/Equity Capital Markets Group, Merrill Lynch & Co. (from 1971 to 1999).
Julia W. Poston, Trustee2
Age: 63 | Number of Funds Overseen: 16 | Tenure: Since 2023
Non-Royce Directorships: Ohio National Fund, Inc. and The James Advantage Funds
Principal Occupation(s) During Past Five Years: Director, Member of Nominating/Governance Committee, and Chair of Audit Committee, Al. Neyer Corporation (since 2020); Director, Member of Governance Committee, and Chair of Audit Committee, Master Fluid Solutions (since 2021); Trustee and Chair of Finance/Audit Committee, Cincinnati Museum Center (non-profit) (since 2015); and Director and Founder, Cincinnati Women’s Executive Forum (non-profit) (since 2010). Formerly Senior Client Partner (2002-2020) and Assurance Practice Group Leader for Ohio Valley Region (2014-2019), Ernst & Young, LLP (international accounting and services firm); and Audit Partner, Arthur Andersen LLP (international accounting and services firm) (1982-2002).
Michael K. Shields, Trustee
Age: 65 | Number of Funds Overseen: 16 | Tenure: Since 2015
Non-Royce Directorships: None
Principal Occupation(s) During Past Five Years: President and Chief Executive Officer, Piedmont Trust Company (privately-owned North Carolina trust company) (since February 2012); Chairman, UNC Charlotte Investment Fund Board (since February 2016); and Chairman, Halftime Carolinas Board (since February 2011). Formerly Owner, Shields Advisors (investment consulting firm) (from April 2010 to June 2012); President and Chief Executive Officer, Eastover Capital Management (2005-2007); President and Chief Executive Officer, Campbell, Cowperthwait (investment subsidiary of U.S. Trust Corporation) (1997-2002); and equity portfolio manager and co-manager of Quality Growth Team, Scudder, Stevens and Clark (1992-1997).
Francis D. Gannon, Vice President
Age: 56 | Tenure: Since 2014
Principal Occupation(s) During Past Five Years: Co-Chief Investment Officer (since January 2014) and Managing Director of Royce, having been employed by Royce since September 2006.
Daniel A. O’Byrne, Vice President
Age: 61 | Tenure: Since 1994
Principal Occupation(s) During Past Five Years: Principal and Vice President of Royce, having been employed by Royce since October 1986.
Peter K. Hoglund, Treasurer
Age: 57 | Tenure: Since 2015
Principal Occupation(s) During Past Five Years: Chief Financial Officer, Chief Administrative Officer, and Managing Director of Royce, having been employed by Royce since December 2014. Prior to joining Royce, Mr. Hoglund spent more than 20 years with Munder Capital Management in Birmingham, MI, serving as Managing Director and Chief Financial Officer and overseeing all financial aspects of the firm. He began his career at Munder as a portfolio manager.
John E. Denneen, Secretary and Chief Legal Officer
Age: 56 | Tenure: 1996-2001 and Since 2002
Principal Occupation(s) During Past Five Years: General Counsel, Managing Director, and, since June 2015, a Member of the Board of Managers of Royce. Chief Legal and Compliance Officer and Secretary of Royce.
John P. Schwartz, Chief Compliance Officer
Age: 52 | Tenure: Since 2022
Principal Occupation(s) During Past Five Years: Chief Compliance Officer of The Royce Funds (since May 2022) and Associate General Counsel and Compliance Officer of Royce (since March 2013).
| 2 | Became a Trustee effective as of the close of business on July 12, 2023. |
| 3 | Retired as Trustee effective as of the close of business on December 31, 2023. |
Trustees will hold office until their successors have been duly elected and qualified or until their earlier resignation or removal. The Statement of Additional Information, which contains additional information about the Funds’ trustees and officers, is available and can be obtained without charge at www.royceinvest.com or by calling (800) 221-4268.
Royce Capital Fund 2023 Annual Report to Shareholders | 29
Notes to Performance and Other Important Information
The thoughts expressed in this report concerning recent market movements and future prospects for small company stocks are solely the opinion of Royce at December 31, 2023, and, of course, historical market trends are not necessarily indicative of future market movements. Statements regarding the future prospects for particular securities held in the Funds’ portfolios and Royce’s investment intentions with respect to those securities reflect Royce’s opinions as of December 31, 2023, and are subject to change at any time without notice. There can be no assurance that securities mentioned in this report will be included in any Royce-managed portfolio in the future.
Sector weightings are determined using the Global Industry Classification Standard (“GICS”). GICS was developed by, and is the exclusive property of, Standard & Poor’s Financial Services LLC (“S&P”) and MSCI Inc. (“MSCI”). GICS is the trademark of S&P and MSCI. “Global Industry Classification Standard (GICS)” and “GICS Direct” are service marks of S&P and MSCI.
All indexes referenced are unmanaged and capitalization-weighted. Each index’s returns include net reinvested dividends and/or interest income. Frank Russell Company (“Russell”) is the source and owner of the trademarks, service marks and copyrights related to the Russell Indexes. Russell® is a trademark of Frank Russell Company. Neither Russell nor its licensors accept any liability for any errors or omissions in the Russell Indexes and/or Russell ratings or underlying data and no party may rely on any Russell Indexes and/or Russell ratings and/or underlying data contained in this communication. No further distribution of Russell Data is permitted without Russell’s express written consent. Russell does not promote, sponsor or endorse the content of this communication. The Russell 2000 is an index of domestic small-cap stocks. It measures the performance of the 2,000 smallest publicly traded U.S. companies in the Russell 3000 Index. The Russell 2000 Value and Growth Indexes consist of the respective value and growth stocks within the Russell 2000 as determined by Russell Investments. The Russell Microcap Index includes 1,000 of the smallest securities in the small-cap Russell 2000 Index along with the next smallest eligible securities as determined by Russell. The Russell 1000 Index is an index of domestic large-cap stocks. It measures the performance of the 1,000 publicly traded U.S. companies in the Russell 3000 Index. The S&P 500 Index tracks the stock performance of 500 of the largest companies listed on stock exchanges in the U.S. The Nasdaq Composite Index is a market capitalization-weighted index of more than 3,700 stocks listed on the Nasdaq stock exchange. The performance of an index does not represent exactly any particular investment, as you cannot invest directly in an index. Returns for the market indexes used in this report were based on information supplied to Royce by Russell Investments. Royce has not independently verified the above described information.
The Price-Earnings, or P/E, Ratio is calculated by dividing a company’s share price by its trailing 12-month earnings-per-share (EPS). The Price-to-Book, or P/B, Ratio is calculated by dividing a company’s share price by its book value per share. Standard deviation is a statistical measure within which a fund’s total returns have varied over time. The greater the standard deviation, the greater a fund’s volatility. Beta is a measure of the volatility or risk of an investment compared to the market as a whole. Alpha describes an investment strategy’s ability to beat the market. The Morningstar Style Map uses proprietary scores of a stock’s value and growth characteristics to determine its placement in one of the five categories listed on the horizontal axis. These characteristics are then compared to those of other stocks within the same market capitalization band. Each is scored from zero to 100 for both value and growth attributes. The value score is subtracted from the growth score to determine the overall style score. For the vertical, market cap axis, Morningstar subdivides into size groups. Giant-cap stocks are defined as those that account for the top 40% of the capitalization of each style zone; large-cap stocks represent the next 30%; mid-cap stocks the next 20%; small-cap stocks the next 7%; micro-cap stocks the smallest 3%. Standard deviation is a statistical measure within which a fund’s total returns have varied over time. The greater the standard deviation, the greater a fund’s volatility. The value score is subtracted from the growth score to determine the overall style score. For the Morningstar Small Blend Category: © 2024 Morningstar. All Rights Reserved. The information regarding the category in this piece is: (1) is proprietary to Morningstar and/or its content providers; (2) may not be copied or distributed; and (3) is not warranted to be accurate, complete or timely. Neither Morningstar nor its content providers are responsible for any damages or losses arising from any use of this information. Cyclical and Defensive are defined as follows: Cyclical: Communication Services, Consumer Discretionary, Energy, Financials, Industrials, Information Technology, and Materials. Defensive: Consumer Staples, Health Care, Real Estate, and Utilities. The Royce Funds is a service mark of The Royce Fund. Distributor: Royce Fund Services, LLC.
Royce Capital Fund–Micro-Cap Portfolio invests primarily in securities of micro-cap companies and Royce Capital Fund–Small-Cap Portfolio invests primarily in securities of small-cap companies. Investments in these types of companies may involve considerably more risk than investments in securities of larger-cap companies. (Please see “Primary Risks for Fund Investors” in the prospectus.) Royce Capital Fund–Micro-Cap Portfolio and Royce Capital Fund–Small-Cap Portfolio may each invest up to 25% its assets in foreign securities that may involve political, economic, currency, and other risks not encountered in U.S. investments. (Please see “Investing in Foreign Securities” in the prospectus.) A Fund that invests a significant portion of its assets in a limited number of stocks may be subject to considerably more risk than a more broadly diversified Fund because a decline in the value of any of these stocks would cause that Fund’s overall value to decline to a greater degree. A broadly diversified portfolio does not, however, ensure a profit for a Fund or guarantee against loss. Please read the prospectus carefully before investing or sending money. A copy of the Funds’ current prospectus and a Statement of Additional Information may be obtained by calling (800) 221-4268 or by visiting www.royceinvest.com. All publicly released material Fund information is disclosed by the Funds on their website at www.royceinvest.com.
Forward-Looking Statements
This material contains forward-looking statements within the meaning of the Securities Exchange Act of 1934, as amended (the “Exchange Act”), that involve risks and uncertainties, including, among others, statements as to:
| • | the Funds’ future operating results, |
| • | the prospects of the Funds’ portfolio companies, |
| • | the impact of investments that the Funds have made or may make, |
| • | the dependence of the Funds’ future success on the general economy and its impact on the companies and industries in which the Funds invest, and |
| • | the ability of the Funds’ portfolio companies to achieve their objectives. |
This review and report use words such as “anticipates,” “believes,” “expects,” “future,” “intends,” and similar expressions to identify forward-looking statements. Actual results may differ materially from those projected in the forward-looking statements for any reason.
The Royce Funds have based the forward-looking statements included in this review and report on information available to us on the date of the report, and we assume no obligation to update any such forward-looking statements. Although The Royce Funds undertake no obligation to revise or update any forward-looking statements, whether as a result of new information, future events, or otherwise, you are advised to consult any additional disclosures that we may make through future shareholder communications or reports.
30 | Royce Capital Fund 2023 Annual Report to Shareholders
Notes to Performance and Other Important Information (continued)
Proxy Voting
A copy of the policies and procedures that The Royce Funds use to determine how to vote proxies relating to portfolio securities and information regarding how each of The Royce Funds voted proxies relating to portfolio securities during the most recent 12-month period ended June 30 is available, without charge, on The Royce Funds’ website at www.royceinvest.com, by calling (800) 221-4268 (toll-free), and on the website of the Securities and Exchange Commission (“SEC”) at www.sec.gov.
Disclosure of Portfolio Holdings
The Funds’ complete portfolio holdings are also available on Exhibit F to Form N-PORT, which filings are made with the SEC within 60 days of the end of the first and third fiscal quarters. The Funds’ Form N-PORT filings are available on the SEC’s website at http://www.sec.gov.
Royce Capital Fund 2023 Annual Report to Shareholders | 31
This page is intentionally left blank.
32 | Royce Capital Fund 2023 Annual Report to Shareholders

About Royce Investment Partners
Unparalleled Knowledge + Experience
Pioneers in small-cap investing, with 50+ years
of experience, depth of knowledge, and focus.
Independent Thinking
The confidence to go against consensus, the insight
to uncover opportunities others might miss, and the
tenacity to stay the course through market cycles.
Specialized Approaches
U.S., international, and global investment strategies
that pursue approaches with different risk profiles.
Unwavering Commitment
Our team of 17 portfolio managers has significant
personal investments in the strategies they manage.
Contact Us
GENERAL INFORMATION
Additional Report Copies and Prospectus
Inquiries (800) 221-4268
RCF-REP-1223
| Item 2. | Code(s) of Ethics. As of the end of the period covered by this report, the Registrant had adopted a code of ethics, as defined in Item 2 of Form N-CSR, applicable to its principal executive officer, principal financial officer, principal accounting officer or controller, or persons performing similar functions. A copy of this code of ethics is filed as an exhibit to this Form N-CSR. During the period covered by this report, the Registrant did not: (i) amend any provision of its code of ethics that applies to its principal executive officer, principal financial officer, principal accounting officer or controller, or persons performing similar functions or (ii) grant any waiver, including an implicit waiver, from a provision of such code of ethics to its principal executive officer, principal financial officer, principal accounting officer or controller, or persons performing similar functions. |
| Item 3. | Audit Committee Financial Expert. |
| (a)(1) | The Board of Trustees of the Registrant has determined that it has an audit committee financial expert serving on its audit committee. |
| | | |
| (a)(2) | Arthur S. Mehlman,[1] Patricia W. Chadwick, and Julia W. Poston[2] were designated by the Board of Trustees as the Registrant’s Audit Committee Financial Experts, effective April 15, 2004, April 8, 2010, and July 13, 2023, respectively. Mr. Mehlman, Ms. Chadwick, and Ms. Poston are “independent” as defined in Section 2(a)(19) of the Investment Company Act of 1940 (the “1940 Act”). |
| Item 4. | Principal Accountant Fees and Services. |
Year ended December 31, 2023 - $49,419
Year ended December 31, 2022 - $46,622
Year ended December 31, 2023 - $0
Year ended December 31, 2022 - $0
Year ended December 31, 2023 - $21,089 – Preparation of tax returns and excise tax review
Year ended December 31, 2022 - $19,895 – Preparation of tax returns and excise tax review
Year ended December 31, 2023 - $0
Year ended December 31, 2022 - $0
| (e)(1) | Annual Pre-Approval: On an annual basis, the Registrant’s independent auditor submits to the Audit Committee a schedule of proposed audit, audit-related, tax and other non-audit services to be rendered to the Registrant and/or its investment adviser and its affiliates for the following year that require pre-approval by the Audit Committee. This schedule provides a description of each type of service that is expected to require pre-approval and the maximum fees that can be paid for each such service without further Audit Committee approval. The Audit Committee then reviews and determines whether to approve the types of scheduled services and the projected fees associated with them. Any subsequent revision to already pre-approved services or fees are presented for consideration at the next regularly scheduled Audit Committee meeting, as needed. |
If subsequent to the annual pre-approval of services and fees by the Audit Committee, the Registrant and/or its investment adviser and its affiliates determines that it would like to engage the Registrant’s independent auditor to perform a service not already pre-approved, the request is to be submitted to the Registrant’s Chief Financial Officer, and if he or she determines that the service fits within the independence guidelines (i.e., it is not a prohibited service), he or she will then arrange for a discussion of the proposed service and fee to be
[1] Retired as Director effective as of the close of business December 31, 2023.
[2] Became a Director effective as of the close of business on July 12, 2023.
included on the agenda for the next regularly scheduled Audit Committee meeting so that pre-approval can be considered.
Interim Pre-Approval: If, in the judgment of the Registrant's Chief Financial Officer, a proposed engagement needs to commence before the next regularly scheduled Audit Committee meeting, he or she shall submit a written summary of the proposed engagement to all members of the Audit Committee, outlining the services, the estimated maximum cost, the category of the services (e.g., audit, audit-related, tax or other) and the rationale for engaging the Registrant’s independent auditor to perform the services. To the extent the proposed engagement involves audit, audit-related or tax services, any individual member of the Audit Committee who is an independent Board member is authorized to pre-approve the engagement. To the extent the proposed engagement involves non-audit services other than audit-related or tax, only the Chairman of the Audit Committee is authorized to pre-approve the engagement. The Registrant’s Chief Financial Officer will arrange for this interim review and coordinate with the appropriate member(s) of the Audit Committee. The Registrant’s independent auditor may not commence the engagement under consideration until the Registrant’s Chief Financial Officer has informed the auditor in writing that the required pre-approval has been obtained from an individual member of the Audit Committee who is an independent Board member or the Chairman of the Audit Committee, as applicable. Each member of the Audit Committee who pre-approves any engagements in between regularly scheduled Audit Committee meetings is to report, for informational purposes only, any pre-approval decisions to the Audit Committee at its next regularly scheduled meeting.
| (g) | Year ended December 31, 2023 - $21,089 |
| | Year ended December 31, 2022 - $19,895 |
| (h) | No such services were rendered during 2023 or 2022. |
Item 5. Audit Committee of Listed Registrants. Not Applicable.
Item 6. Investments.
Item 7. Disclosure of Proxy Voting Policies and Procedures for Closed-End Management Investment Companies. Not Applicable.
Item 8. Portfolio Managers of Closed-End Management Investment Companies. Not Applicable.
Item 9. Purchases of Equity Securities by Closed-End Management Investment Company and Affiliated Purchasers. Not Applicable.
Item 10. Submission of Matters to a Vote of Security Holders. Not Applicable.
Item 11. Controls and Procedures.
(a) Disclosure Controls and Procedures. The Principal Executive and Financial Officers concluded that the Registrant's Disclosure Controls and Procedures are effective based on their evaluation of the Disclosure Controls and Procedures as of a date within 90 days of the filing date of this report.
(b) Internal Control over Financial Reporting. There were no significant changes in Registrant's internal control over financial reporting or in other factors that could significantly affect this control subsequent to the date of the evaluation, including any corrective actions with regard to significant deficiencies and material weaknesses during the period covered by this report.
Item 12. Disclosure of Securities Lending Activities for Closed-End Management Investment Companies. Not applicable.
Item 13. Exhibits. Attached hereto.
(a)(1) The Registrant’s code of ethics pursuant to Item 2 of Form N-CSR.
(a)(2) Separate certifications by the Registrant’s Principal Executive Officer and Principal Financial Officer as required by Rule 30a-2(a) under the 1940 Act.
(a)(3) Not Applicable.
(b) Separate certifications by the Registrant’s Principal Executive Officer and Principal Financial Officer, pursuant to Section 906 of the Sarbanes-Oxley Act of 2002 and required by Rule 30a-2(b) under the 1940 Act.
[Signature page to follow.]
Pursuant to the requirements of the Securities Exchange Act of 1934 (the “Exchange Act”) and the 1940 Act, the registrant has duly caused this report to be signed on its behalf by the undersigned, thereunto duly authorized.
ROYCE CAPITAL FUND
BY: /s/ Christopher D. Clark
Christopher D. Clark
President
Date: February 24, 2024
Pursuant to the requirements of the Exchange Act and the 1940 Act, this report has been signed below by the following persons on behalf of the registrant and in the capacities and on the dates indicated.
| ROYCE CAPITAL FUND | ROYCE CAPITAL FUND |
| | |
| | |
| | |
| BY: /s/ Christopher D. Clark | BY: /s/ Peter K. Hoglund |
| Christopher D. Clark | Peter K. Hoglund |
| President | Treasurer |
| | |
| Date: February 24, 2024 | Date: February 24, 2024 |