UNITED STATES
SECURITIES AND EXCHANGE COMMISSION
Washington, D.C. 20549
FORM N-CSR
CERTIFIED SHAREHOLDER REPORT
OF
REGISTERED MANAGEMENT INVESTMENT COMPANIES
Investment Company Act File Number: 811-07537
Name of Registrant: Royce Capital Fund
Address of Registrant: 745 Fifth Avenue
New York, NY 10151
| Name and address of agent for service: | John E. Denneen, Esquire
745 Fifth Avenue
New York, NY 10151 |
Registrant's telephone number, including area code: (212) 508-4500
Date of fiscal year end: December 31
Date of reporting period: January 1, 2020 – December 31, 2020
Item 1. Reports to Shareholders.
Royce Capital Fund 2020 Annual
Review and Report to Shareholders
December 31, 2020
Royce Capital Fund–Micro-Cap Portfolio
Royce Capital Fund–Small-Cap Portfolio
Table of Contents

| This page is not part of the Royce Capital Fund 2020 Annual Report to Shareholders |
Letter to Our Shareholders

2020’S MARKET: DICKENSIAN DAYS
In a year that saw so much sorrow met by equal amounts of quiet heroism, it seems almost fitting that the market was subject to extremes of its own. For equity investors, particularly for those in small-cap stocks, the timing of these excesses was fortuitous, going from the worst of times through February and March to the best in 2020’s last three months. After beginning the year with the largest ever quarterly loss in its more than 40-year history (-30.6%), the small-cap Russell 2000 Index proceeded through two positive quarters before enjoying its best showing ever in the fourth quarter, when it gained 31.4%. While we have witnessed many extremes and oddities in our nearly five decades of small cap investing, we have never seen a year quite like 2020.
Prior to 2020, small cap had never experienced record-setting extremes in the same year during any decline and rebound period. The speed with which the market crashed and recovered was truly extraordinary. Moreover, from its 3/18/20 low through the end of December, the Russell 2000 rallied 101.3%, though deeper-than-average declines have always been followed by steeper than average recoveries. When all was said and done, the small-cap index rose a more than respectable 20.0% for the calendar year.
2020 also saw the striking contrast of the public health crisis with the buoyant stock market, which left many wondering if the market was detached from reality and therefore sure to fall.
However, it’s important to remember that the market is forward looking and often sees past difficulties, even formidable ones, that it deems temporary. And as we have often reminded investors, stocks are financial instruments. The level of support they receive from the Federal Reserve can often impact valuations as much as, if not more than, current economic conditions. During the pandemic, the Fed took several aggressively supportive steps to shore up the economy and financial system. These unprecedented efforts also led U.S. Treasury yields to all-time lows while pushing stock valuations close to all-time highs. This explains why, when viewed through the lens of 1% 10-year Treasury yields, small cap valuations in general look relatively reasonable to us—and thus may have farther to climb.
Having said that, we are also mindful that 2020 was a much better year for the markets than the economy or corporate profits, and that 2021 may well be its mirror image. The triple-digit advance for the Russell 2000 off the March trough has assuredly priced in much, though we think not all, of the improvement in profits many companies are likely to experience in 2021. To be sure, the U.S. economy appears to be decidedly in coiled spring mode. Numerous comparisons have already been made to the Roaring Twenties, when a wave of spending and other economic activity was spurred by the nearly coterminous ends of the flu epidemic and World War I. As vaccinations continue to roll out, 2021 may see more positive headlines for the economy than we do for the stock market.
| Past performance is no guarantee of future results. | This page is not part of the Royce Capital Fund 2020 Annual Report to Shareholders | 1 |
LETTER TO OUR SHAREHOLDERS
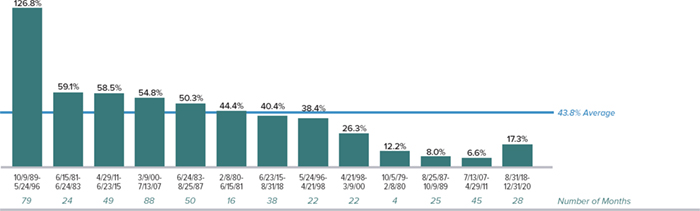
| Russell 2000 Peak-to-Peak Returns for Market Cycles Following Drawdowns of 15% or More from 12/31/78-12/31/20 |
Past performance is no guarantee of future results.
THE OLD CURIOSITY SHOP: WHERE ARE WE IN THE SMALL-CAP CYCLE?
Long-time readers will recall that we like to compare the current small cap market cycle to the patterns of the past to provide some guidance about potential returns. A historical analysis of small-cap cycles also signals the likelihood of further small cap advances. Going back to the Russell 2000’s 1979 inception, we looked at the 12 previous small-cap market cycles to get a sense of where we may be in the current one. We looked at the returns from the peak of one cycle to the next. While we found considerable variance in these peak-to-peak performances, they did cluster within a fairly narrow return range. The chart above shows the peak-to-peak returns for all 12 full market cycles (as well as what the Russell 2000 gained in the current cycle through the end of 2020). The average return for the 12 peak-to-peak periods was 43.8%, with seven of those 12 periods enjoying returns in the range of 38-59%. Contrasting those performances with the current small cap cycle’s 17.3% return since the most recent index peak suggests to us that the current small cap cycle has room to run—especially in a period of economic expansion.
To contextualize our optimistic outlook, it is worth noting that we expect the pace of small-cap’s advance to slow markedly. Although the average first-year return for the 12 previous market troughs was 58.1%, the average return for the subsequent 12 months was 13.6% for the eight peak-to-peak periods that lasted two years or more—still a historically high result.
A TALE OF TWO ASSET CLASSES
Small caps pulled ahead of large caps in 2020’s bullish fourth quarter after lagging by a wide margin through the first three. We see this as a sustainable leadership shift. While small-cap valuations sit at the high end of their historical range, they are nonetheless lower than average when compared with interest rates and notably less expensive than large caps. The chart below uses one of our preferred valuation metrics—LTM EV/EBIT (the last 12 months earnings versus earnings before interest and taxes, excluding companies with no earnings). This chart shows one crucial result of small cap’s long-term underperformance versus large caps: at the end of 2020, small caps were trading versus large caps at one of the cheapest relative valuations we have seen in 20 years. You would need to go back to the 2000 Internet Bubble to find a wider valuation disparity between the two.
| Russell 2000 vs. Russell 1000 Median LTM EV/EBIT1 (ex. Negative EBIT Companies) from 12/31/00 to 12/31/20 |
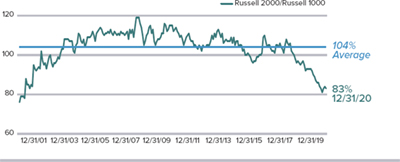
1 Earnings before interest and taxes.
Past performance is no guarantee of future results.
Source: FactSet
| 2 | This page is not part of the Royce Capital Fund 2020 Annual Report to Shareholders |
LETTER TO OUR SHAREHOLDERS
In addition, the long-running demand for stocks in the NASDAQ-100 Index, in particular the well-known FAAMG (Facebook, Apple, Amazon, Microsoft, and Google) group, has led to an unprecedented level of market capitalization concentration. If investors reallocated even a relatively small percentage of their assets out of these current favorites and into small cap, it would bring significant buying power to the asset class. Along with the prospect of a rebounding global economy, these factors underpin our optimism.
Finally, in addition to the relative valuation discount and the potential benefit from a rebalancing of investor interest, there is data to support the case for small-cap superiority during periods of robust economic growth. Small caps are more sensitive to economic cycles than large caps and thus often outperform their larger siblings in strengthening economies. We compared performance for the Russell 2000 and Russell 1000 when nominal GDP growth was 5% or higher over the last 20 years and found that small caps beat large caps 63% of the time in these periods—and did so by an average return margin of 4.4%. The current consensus for 2021 forecasts that nominal GDP growth will exceed 6%, which should be a supportive environment for small caps.
GREAT EXPECTATIONS FOR SMALL-CAP LEADERSHIP
If small-caps do lead large caps, which areas look likely to lead within the small-cap universe? For some time, many market observers have been expecting value stocks to take the leadership reins of small cap. Yet even as the Russell 2000 Value Index enjoyed a highly impressive fourth quarter in 2020, edging past the Russell 2000 Growth Index (+33.4% versus +29.6%), it also trailed its growth counterpart in calendar 2020 by one of the largest margins on record, up 4.6% versus 34.6%. 2020 marked the tenth of the last 12 calendar years of growth’s superiority.
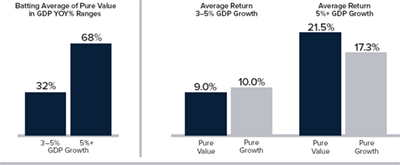
However, we do see some signs that a change may be coming. The same robust economic conditions that tend to favor small caps also have historically rewarded value. Specifically, when nominal GDP growth has exceeded 5% (the current consensus expectation for 2021 and 2022), small-cap value outperformed small-cap growth 68% of the time by an average of more than 4%. We would welcome such a leadership shift. At the same time, however, we are more confident in the likelihood of ongoing leadership for cyclicals (a status they assumed within small cap in May 2020) than we are in a sustained leadership stint for small-cap value.
| Rolling 12 Month Returns of Russell 2000 Pure Value vs Russell 2000 Pure Growth Indexes From 12/31/00 to 12/31/20 |
Past performance is no guarantee of future results.
When we talk to companies, they tell us about growing order books, scarcity of inventory, and strong, low-debt balance sheets, all of which support the idea that a cyclical rebound is under way. In addition to these supportive cyclical conditions, value will also need market leadership from Financials, Materials, and perhaps Energy to pull ahead of growth. These three, often referred to as the “reflationary” sectors, would benefit from sustained inflation and/or commodity price strength, both of which might occur if the dollar continues to weaken. While all of that seems plausible to us, this sort of macro projection lies beyond our core competencies. So while it’s true that there is substantial overlap between value and cyclicals, we feel more secure about the prospects for the latter. More important for our investors, the small-cap value index is not the best proxy for how our own value-oriented strategies invest, and we think these portfolios should be able to do well regardless of how the value index performs.
With all of this in mind, we have been actively investing in a variety of diverse cyclical companies. For example, we have been focusing on those businesses that look poised to benefit from those changes in consumer behaviors that have been precipitated or accelerated by the coronavirus. We also continue to invest in companies that help to manage the increased complexity of logistics for other businesses. The increased popularity of outdoor leisure activities, specifically for recreational vehicles and boating, has led us to manufacturers that should benefit from the sustainably higher demand for products and aftermarket services. Ongoing strength in the housing market is seeding opportunities across several of our strategies as more and more people can live farther from their employers, particularly in the absence of a daily commute. Workers requiring additional or reworked space for home offices is creating demand for new homes and home remodeling as well as consistently reliable connectivity. We therefore hold homebuilding, building
This page is not part of the Royce Capital Fund 2020 Annual Report to Shareholders | 3
LETTER TO OUR SHAREHOLDERS
Taking the long view, 88% of all rolling three-year return periods since 1945 have produced positive returns for small caps. The current probability might be even higher, due to below average valuations for small caps in the context of 1% Treasury bond yields, an accommodative Federal Reserve, and a recovering economy in the U.S. and for most of the globe.
products, and manufactured housing companies. We also own a number of companies in the semiconductor capital equipment space across several of our strategies as the secular shift toward work from home is intersecting fortuitously with both the longstanding trend toward more widespread use of semis and current highly favorable supply/demand dynamics.
HARD TIMES OR GOOD TIMES AHEAD?
Our outlook hinges on two percentages, 84% and 88%. Each can help to answer two of the most relevant investor questions for 2021. The first is, do we think that small caps will see a correction during the year? This seems probable. Taking the long view (as is our wont), in 84% of the past 25 calendar years, small caps have experienced a decline of at least 10%. It’s important to keep this in perspective by recalling two aspects of volatility: it is a regularly recurring feature of the small-cap landscape, one that investors should expect, and its sudden movements can benefit a disciplined active manager. The current environment somewhat increases our expectations for volatility. Needless to say, the market endured above-average volatility in 2020, and stocks do not typically transition seamlessly from high volatility periods to more placid ones. The three years that followed the wildly tumultuous 2008, for example, each experienced volatility spikes of their own. In addition, as we write this letter in
late January, we note that the small-cap market is seeing elements of frothiness, including a surge in SPAC (Special Purpose Acquisition Corporations) issuance and considerable intra-day volatility in certain stocks favored by day traders. While not a reason for any long-term concern, these developments echo past excesses.
The second question is, do we think that small caps can advance over the next several years? That seems likely to us. Again, taking the long view, 88% of all rolling three-year return periods since 1945 have produced positive returns for small caps, according to data from Center for Research into Security Prices, where the CRSP 6-10 serves as the small-cap proxy. The current probability might be even higher, due to the aforementioned below average valuations for small caps in the context of 1% Treasury bond yields, an accommodative Federal Reserve, and a recovering economy in the U.S. and for most of the globe. Even against this constructive backdrop, we expect selectivity to be key. The economy is likely to continue rebounding in an uneven fashion as growth revs up and ultimately stabilizes. Regardless, however, of the shape our collective “new normal” takes, we think 2021 will not only be different enough from pre-2020 to create potential advantages for disciplined active management but should also be a rewarding one for select cyclicals in the small-cap universe.
Sincerely,
 |  |  |
Charles M. Royce Chairman, Royce Investment Partners | Christopher D. Clark Chief Executive Officer, and Co-Chief Investment Officer, Royce Investment Partners | Francis D. Gannon Co-Chief Investment Officer, Royce Investment Partners |
February 1, 2021
| 4 | This page is not part of the Royce Capital Fund 2020 Annual Report to Shareholders | Past performance is no guarantee of future results. |
Performance and Expenses
| Performance and Expenses |
| As of December 31, 2020 |
| | 1 YR | 3 YR | 5 YR | 10 YR | 15 YR | 20 YR | SINCE INCEPTION (12/27/96) | ANNUAL OPERATING EXPENSES (%)
GROSS/NET |
| Royce Capital Fund–Micro-Cap Portfolio | 23.79 | 10.41 | 11.13 | 5.05 | 6.01 | 8.53 | 10.01 | 1.43/1.33 |
| Royce Capital Fund–Small-Cap Portfolio | -7.15 | 0.33 | 5.18 | 5.56 | 5.73 | 7.93 | 9.35 | 1.15/1.08 |
| | | | | | | | | |
| INDEX | | | | | | | | |
| Russell Microcap Index | 20.96 | 8.78 | 11.89 | 10.55 | 7.34 | 8.95 | N/A | N/A |
| Russell 2000 Value Index | 4.63 | 3.72 | 9.65 | 8.66 | 6.92 | 8.54 | N/A | N/A |
| Russell 2000 Index | 19.96 | 10.25 | 13.26 | 11.20 | 8.91 | 8.74 | N/A | N/A |
Important Performance, Expense, and Risk Information
All performance information in this Review and Report reflects past performance, is presented on a total return basis, reflects the reinvestment of distributions, and does not reflect the deduction of taxes that a shareholder would pay on fund distributions or the redemption of fund shares. Past performance is no guarantee of future results. Investment return and principal value of an investment will fluctuate, so that shares may be worth more or less than their original cost when redeemed. Current performance may be higher or lower than performance quoted and may be obtained at www.royceinvest.com. The Funds’ total returns do not reflect any deduction for charges or expenses of the variable contracts investing in the Funds. All performance and expense information reflects the result for each Fund’s Investment Class Shares. Gross annual operating expenses reflect each Fund’s gross total annual operating expenses and include management fees, operating expenses, and any applicable acquired fund fees and expenses. Net annual operating expenses reflect contractual fee waivers and/or expense reimbursements. All expense information is reported as of each fund’s most current prospectus. Royce & Associates has contractually agreed to waive fees and/or reimburse operating expenses, excluding brokerage commissions, taxes, interest litigation expenses, acquired fund fees and expenses, and other expenses not borne in the ordinary cost of business, to the extent necessary to maintain net operating expenses at or below 1.33% for Royce Capital Fund–Micro-Cap Portfolio, and at or below 1.08% for Royce Capital Fund–Small-Cap Portfolio through April 30, 2021.
Service Class Shares bear an annual distribution expense that is not borne by the Investment Class; if those expenses were reflected, total returns would have been lower. Each series of Royce Capital Fund is subject to market risk—the possibility that common stock prices will decline, sometimes sharply and unpredictably, over short or extended periods of time. Such declines may be caused by various factors, including market, financial, and economic conditions, governmental or central bank actions, and other factors, such as the recent COVID-19 pandemic, that may not be directly related to the issuer of a security held by a Fund. This pandemic could adversely affect global market, financial, and economic conditions in ways that cannot necessarily be foreseen. Royce Micro-Cap Portfolio invests primarily in micro-cap companies while Royce Small-Cap Portfolio invests primarily in small-cap companies. Investments in micro-cap and small-cap companies may involve considerably more risk than investments in securities of larger-cap companies. (Please see “Primary Risks for Fund Investors” in the prospectus.) Each series of Royce Capital Fund may invest up to 25% of its net assets in foreign securities. Investments in foreign securities may involve political, economic, currency, and other risks not encountered in U.S. investments. (Please see “Investing in Foreign Securities” in the prospectus.) As of 12/31/20, Royce Small-Cap Portfolio invested a significant portion of its assets in a limited number of stocks, which may involve considerably more risk than a more broadly diversified portfolio because a decline in the value of any one of these stocks would cause the Portfolio’s overall value to decline to a greater degree. Royce Micro-Cap Portfolio’s broadly diversified portfolio does not ensure a profit or guarantee against loss. (Please see “Primary Risks for Fund Investors” in the prospectus.) This Review and Report must be preceded or accompanied by a prospectus. Please read the prospectus carefully before investing or sending money. Russell Investment Group is the source and owner of the trademarks, service marks, and copyrights related to the Russell Indexes. Russell® is a trademark of Russell Investment Group. The Russell Microcap Index includes 1,000 of the smallest securities in the small-cap Russell 2000 Index along with the next smallest eligible securities as determined by Russell. The Russell 2000 Index is an unmanaged, capitalization-weighted index of domestic small-cap stocks. It measures the performance of the 2,000 smallest publicly traded U.S. companies in the Russell 3000 Index. The Russell 2000 Value Index consists of the respective value stocks within the Russell 2000 as determined by Russell Investments. The performance of an index does not represent exactly any particular investment, as you cannot invest directly in an index. Distributor: Royce Fund Services, LLC.
| This page is not part of the Royce Capital Fund 2020 Annual Report to Shareholders | 5 |
MANAGERS’ DISCUSSION (UNAUDITED)
Royce Capital Fund–Micro-Cap Portfolio (RCM)

Jim Stoeffel
Brendan Hartman
FUND PERFORMANCE
Royce Capital Fund–Micro-Cap Portfolio advanced 23.8% in 2020, outpacing both of its benchmarks, the Russell Microcap (+21.0%) and Russell 2000 (+20.0%) Indexes, for the calendar year. This year’s strong performance also allowed the Fund to beat both of its benchmarks for the three-year period ended 12/31/20.
WHAT WORKED… AND WHAT DIDN’T
Six of the Fund’s 10 equity sectors made positive contributions to performance in 2020. Information Technology made by far the largest impact, followed by Health Care and Consumer Discretionary while Energy, Financials, and Consumer Staples detracted most. At the industry level, the top two contributors for 2020 were in Information Technology—semiconductors & semiconductor equipment and electronic equipment, instruments & components—while construction & engineering (Industrials) was third. Conversely, banks and thrifts & mortgage finance, each in Financials, negatively impacted performance, with energy equipment & services (Energy) sandwiched in between.
The top contributing security in 2020 was diagnostic blood testing company Chembio Diagnostics. The company’s performance was driven by its receipt of FDA Emergency Use Authorization for its rapid COVID-19 antibody finger prick blood test. However, we reduced our position meaningfully after its shares appreciated sharply over uncertainty regarding the effectiveness and accuracy of COVID-19 tests. Ameresco, which provides services in energy efficiency, asset sustainability, infrastructure upgrades, and renewable energy, also contributed to results during the calendar year. The company’s strong performance was driven by the maturation of a number of early-stage projects, the addition of a new CFO, and exceeding earnings expectations. Rounding out the top three securities for the year was American Superconductor, which is an energy technologies company specializing in the design and manufacture of power systems and superconducting wire. The company benefited from diversifying its product portfolio, recent strong sales, and a shift towards favoring renewable energy generation, urbanization, and grid resilience.
Newpark Resources, which provides drilling fluid systems and composite matting systems used in oilfield and other commercial markets, detracted most for the year. The company was negatively impacted by collapsing oil prices as travel-related economic activity declined due to the coronavirus. We exited the position earlier this year as the company had financial leverage at the top end of our comfort level. Astronics Corporation also detracted from performance during 2020. The company is a New-York based aerospace electronics corporation known for its lighting and electronics integrations on military, commercial, and business aircraft and semiconductor test systems. Astronics’s shares underperformed in 2020 due to aerospace suppliers being severely impacted by both the COVID-19 travel shutdown and the grounding of the Boeing 737 MAX airplane. In addition, Investar Holding hindered performance. The company, which provides commercial banking products to individuals and small- to medium-sized south Louisiana businesses, was hurt in 2020 by a combination of the public health crisis and by its exposure to the energy industry, which suffered through most of 2020.
Relative to the micro-cap benchmark for 2020, sector allocation drove outperformance—stock selection detracted, albeit mildly. The largest source of relative outperformance was Financials due to our lower exposure and savvy stock selection. Our higher exposure to Information Technology made the sector additive to relative results, while Real Estate followed due to both stock selection and our lower weighting. On the detraction side, our lower exposure to Health Care and, to a lesser degree, ineffective stock selection made it the largest source of relative underperformance for the calendar year. Stock selection in Industrials also hampered results, as did our lower exposure to Consumer Discretionary.
| | Top Contributors to Performance | | Top Detractors from Performance | |
| | For 2020 (%)1 | | | For 2020 (%)2 | | |
| | | | | | | |
| | Chembio Diagnostics | 1.89 | | Newpark Resources | -1.09 | |
| | Ameresco Cl. A | 1.87 | | Astronics Corporation | -0.89 | |
| | American Superconductor | 1.76 | | Investar Holding | -0.79 | |
| | AXT | 1.63 | | BayCom Corporation | -0.75 | |
| | PAR Technology | 1.60 | | TriState Capital Holdings | -0.74 | |
| | 1 Includes dividends | | | 2 Net of dividends | | |
CURRENT POSITIONING AND OUTLOOK
The country has made its way through a contentious election with what might best be described as a “Blue Ripple”—a clear victory for the Democratic Party, but one that awards them the narrowest majority since the Wilson administration. Although the transition was chaotic, we expect policy priorities to rapidly become clear and remain hopeful that the most arduous tax proposals on profits and capital will be difficult to implement. We do expect regulatory burdens and spending to increase, though, with priorities shifting to infrastructure with an emphasis on environmental concerns. Although our investment decisions remain company specific, we will continue to factor in the rapidly changing political environment as an important investment consideration. We are pleased that the news on effective treatments for COVID-19 remains increasingly positive as numerous vaccines have been approved. Even with the fits and starts in distribution, we believe the effect will be highly positive. Despite all this, we believe the combination of the gradual reopening of the world’s economies and a step up in fiscal stimulus will provide a cyclical tailwind to the positive attributes in our portfolio investments as our value orientation tends to make our portfolio pro cyclical.
| 6 | Royce Capital Fund 2020 Annual Report to Shareholders |
| PERFORMANCE AND PORTFOLIO REVIEW (UNAUDITED) | TICKER SYMBOLS RCMCX RCMSX |
| |
| Performance and Expenses |
| Average Annual Total Return (%) Through 12/31/20 |
| | JUL-DEC 20201 | 1-YR | 3-YR | 5-YR | 10-YR | 15-YR | 20-YR | SINCE INCEPTION (12/27/96) |
| RCM | 39.70 | 23.79 | 10.41 | 11.13 | 5.05 | 6.01 | 8.53 | 10.01 |
| Annual Gross Operating Expenses: 1.43% | Annual Net Operating Expenses: 1.33% | |
1Not annualized
| Morningstar Style Map™ As of 12/31/20 |
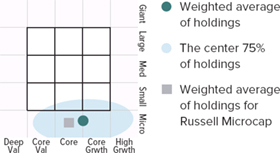
The Morningstar Style Map is the Morningstar Style Box™ with the center 75% of fund holdings plotted as the Morningstar Ownership Zone™. The Morningstar Style Box is designed to reveal a fund’s investment strategy. The Morningstar Ownership Zone provides detail about a portfolio’s investment style by showing the range of stock sizes and styles. The Ownership Zone is derived by plotting each stock in the portfolio within the proprietary Morningstar Style Box. Over time, the shape and location of a fund's ownership zone may vary. See page 28 for additional information.
Invested on 6/30/00 (Russell Microcap Inception) as of 12/31/20 ($)
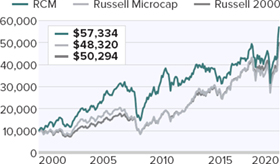
Includes reinvestment of distributions.
| Top 10 Positions | |
| % of Net Assets | |
| | |
| Magnite | 1.9 |
| Citi Trends | 1.7 |
| B. Riley Financial | 1.7 |
| American Superconductor | 1.6 |
| Ameresco Cl. A | 1.4 |
| PAR Technology | 1.4 |
| CIRCOR International | 1.3 |
| AXT | 1.3 |
| Agilysys | 1.3 |
| Westport Fuel Systems | 1.3 |
| | |
| Portfolio Sector Breakdown | |
| % of Net Assets | |
| | |
| Information Technology | 24.4 |
| Industrials | 23.3 |
| Health Care | 13.6 |
| Consumer Discretionary | 13.6 |
| Financials | 13.6 |
| Communication Services | 3.1 |
| Materials | 3.0 |
| Real Estate | 1.8 |
| Energy | 1.8 |
| Consumer Staples | 0.1 |
| Cash and Cash Equivalents | 1.7 |
| Calendar Year Total Returns (%) | |
| YEAR | RCM |
| 2020 | 23.8 |
| 2019 | 19.6 |
| 2018 | -9.0 |
| 2017 | 5.2 |
| 2016 | 19.7 |
| 2015 | -12.5 |
| 2014 | -3.6 |
| 2013 | 21.0 |
| 2012 | 7.6 |
| 2011 | -12.1 |
| 2010 | 30.1 |
| 2009 | 57.9 |
| 2008 | -43.3 |
| 2007 | 4.0 |
| 2006 | 21.1 |
| Upside/Downside Capture Ratios | | |
| Periods Ended 12/31/20 (%) | | |
| | UPSIDE | DOWNSIDE |
| 10-Year | 75 | 96 |
| From 6/30/00 (Russell Microcap Inception) | 90 | 81 |
| Portfolio Diagnostics | |
| Fund Net Assets | $162 million |
| Number of Holdings | 125 |
| Turnover Rate | 25% |
| Average Market Capitalization1 | $573 million |
| Weighted Average P/B Ratio 2 | 2.3x |
| Active Share 3 | 90% |
| U.S. Investments (% of Net Assets) | 84.6% |
| Non-U.S. Investments (% of Net Assets) | 13.7% |
| 1 | Geometric Average. This weighted calculation uses each portfolio holding’s market cap in a way designed to not skew the effect of very large or small holdings; instead, it aims to better identify the portfolio’s center, which Royce believes offers a more accurate measure of average market cap than a simple mean or median. |
| 2 | Harmonic Average. This weighted calculation evaluates a portfolio as if it were a single stock and measures it overall. It compares the total market value of the portfolio to the portfolio’s share in the earnings or book value, as the case may be, of its underlying stocks. |
| 3 | Active Share is the sum of the absolute values of the different weightings of each holding in the Fund versus each holding in the benchmark, divided by two. |
Important Performance and Expense Information
All performance information in this Report reflects past performance, is presented on a total return basis, reflects the reinvestment of distributions, and does not reflect the deduction of taxes that a shareholder would pay on fund distributions or the redemption of fund shares. Past performance is no guarantee of future results. Investment return and principal value of an investment will fluctuate, so that shares may be worth more or less than their original cost when redeemed. Current performance may be higher or lower than performance quoted. The Fund’s total returns do not reflect any deduction for charges or expenses of the variable contracts investing in the Fund. Returns as of the most recent month-end may be obtained at www.royceinvest.com. All performance and risk information reflects the result of the Investment Class (its oldest class). Shares of RCM’s Service Class bear an annual distribution expense that is not borne by the Investment Class; if those expenses were reflected, total returns would have been lower. Certain immaterial adjustments were made to the net assets of Royce Capital Fund-Micro-Cap Portfolio at 12/31/17 for financial reporting purposes, and as a result the calendar year total returns based on those net asset values differ from the adjusted net asset values and calendar year total returns reported in the Financial Highlights. Gross operating expenses reflect the Fund’s total gross operating expenses for the Investment Class and include management fees and other expenses. Net operating expenses reflect contractual fee waivers and/or expense reimbursements. All expense information is reported as of the Fund’s most current prospectus. Royce & Associates has contractually agreed, without right of termination, to waive fees and/or reimburse expenses to the extent necessary to maintain the Investment Class’s net annual operating expenses (excluding brokerage commissions, taxes, interest, litigation expenses, acquired fund fees and expenses, and other expenses not borne in the ordinary course of business) at or below 1.33% through April 30, 2021. Regarding the “Top Contributors” and “Top Detractors” tables shown above, the sum of all contributors to, and all detractors from, performance for all securities in the portfolio would approximate the Fund’s year-to-date performance for 2020. Upside Capture Ratio measures a manager’s performance in up markets relative to the Fund’s benchmark (Russell Microcap). It is calculated by measuring the Fund’s performance in quarters when the benchmark went up and dividing it by the benchmark’s return in those quarters. Downside Capture Ratio measures a manager’s performance in down markets relative to the Fund’s benchmark. It is calculated by measuring the Fund’s performance in quarters when the benchmark goes down and dividing it by the benchmark’s return in those quarters.
Royce Capital Fund 2020 Annual Report to Shareholders | 7
Schedule of Investments
| Royce Capital Fund - Micro-Cap Portfolio |
| Common Stocks – 98.3% |
| | | | SHARES | | | VALUE | |
| | | | | | | | |
| COMMUNICATION SERVICES – 3.1% | | | | | | | |
| ENTERTAINMENT - 1.9% | | | | | | | |
| †Chicken Soup For The Soul Entertainment Cl. A 1 | | | 46,416 | | $ | 927,856 | |
| Gaia Cl. A 1 | | | 112,800 | | | 1,114,464 | |
| †IMAX Corporation 1 | | | 22,400 | | | 403,648 | |
| †Score Media and Gaming Cl. A 1 | | | 500,800 | | | 590,148 | |
| | | | | | | 3,036,116 | |
| INTERACTIVE MEDIA & SERVICES - 1.2% | | | | | | | |
| QuinStreet 1 | | | 96,100 | | | 2,060,384 | |
| Total (Cost $2,823,389) | | | | | | 5,096,500 | |
| CONSUMER DISCRETIONARY – 13.6% | | | | | | | |
| AUTO COMPONENTS - 2.2% | | | | | | | |
| Modine Manufacturing 1 | | | 62,600 | | | 786,256 | |
| Stoneridge 1 | | | 62,300 | | | 1,883,329 | |
| Unique Fabricating 1 | | | 156,454 | | | 860,387 | |
| | | | | | | 3,529,972 | |
| DIVERSIFIED CONSUMER SERVICES - 0.7% | | | | | | | |
| Collectors Universe | | | 14,600 | | | 1,100,840 | |
| HOTELS, RESTAURANTS & LEISURE - 2.2% | | | | | | | |
| Century Casinos 1 | | | 192,100 | | | 1,227,519 | |
| †GAN 1,2 | | | 42,700 | | | 865,956 | |
| Lindblad Expeditions Holdings 1 | | | 87,400 | | | 1,496,288 | |
| | | | | | | 3,589,763 | |
| HOUSEHOLD DURABLES - 0.3% | | | | | | | |
| †Legacy Housing 1 | | | 32,300 | | | 488,053 | |
| INTERNET & DIRECT MARKETING RETAIL - 1.8% | | | | | | | |
| Magnite 1,2 | | | 98,200 | | | 3,015,722 | |
| LEISURE PRODUCTS - 1.1% | | | | | | | |
| MasterCraft Boat Holdings 1 | | | 70,217 | | | 1,744,190 | |
| SPECIALTY RETAIL - 4.5% | | | | | | | |
| Citi Trends | | | 55,486 | | | 2,756,545 | |
| †OneWater Marine Cl. A 1 | | | 49,800 | | | 1,448,682 | |
| Shoe Carnival | | | 46,300 | | | 1,814,034 | |
| Zumiez 1 | | | 36,300 | | | 1,335,114 | |
| | | | | | | 7,354,375 | |
| TEXTILES, APPAREL & LUXURY GOODS - 0.8% | | | | | | | |
| Vera Bradley 1 | | | 158,800 | | | 1,264,048 | |
| Total (Cost $13,113,358) | | | | | | 22,086,963 | |
| | | | | | | | |
| CONSUMER STAPLES – 0.1% | | | | | | | |
| BEVERAGES - 0.1% | | | | | | | |
| Eastside Distilling 1 | | | 116,900 | | | 149,632 | |
| Total (Cost $416,963) | | | | | | 149,632 | |
| ENERGY – 1.8% | | | | | | | |
| ENERGY EQUIPMENT & SERVICES - 1.8% | | | | | | | |
| †Aspen Aerogels 1 | | | 55,100 | | | 919,619 | |
| Natural Gas Services Group 1 | | | 147,000 | | | 1,393,560 | |
| Profire Energy 1 | | | 612,129 | | | 521,840 | |
| Total (Cost $2,957,853) | | | | | | 2,835,019 | |
| FINANCIALS – 13.6% | | | | | | | |
| BANKS - 5.2% | | | | | | | |
| Allegiance Bancshares | | | 37,200 | | | 1,269,636 | |
| BayCom Corporation 1 | | | 54,582 | | | 828,009 | |
| Caribbean Investment Holdings | | | 1,751,547 | | | 952,132 | |
| County Bancorp | | | 45,300 | | | 1,000,224 | |
| HarborOne Bancorp | | | 117,191 | | | 1,272,694 | |
| †HBT Financial | | | 41,700 | | | 631,755 | |
| Investar Holding | | | 59,100 | | | 977,514 | |
| Midway Investments 1,3 | | | 1,751,577 | | | 0 | |
| TriState Capital Holdings 1 | | | 85,772 | | | 1,492,433 | |
| | | | | | | 8,424,397 | |
| CAPITAL MARKETS - 5.2% | | | | | | | |
| B. Riley Financial | | | 60,800 | | | 2,688,576 | |
| Canaccord Genuity Group | | | 205,700 | | | 1,803,450 | |
| Silvercrest Asset Management Group Cl. A | | | 90,300 | | | 1,254,267 | |
| Sprott | | | 50,180 | | | 1,457,030 | |
| StoneX Group 1 | | | 22,400 | | | 1,296,960 | |
| | | | | | | 8,500,283 | |
| DIVERSIFIED FINANCIAL SERVICES - 0.2% | | | | | | | |
| Waterloo Investment Holdings 1,3 | | | 1,302,000 | | | 325,500 | |
| THRIFTS & MORTGAGE FINANCE - 3.0% | | | | | | | |
| Meridian Bancorp | | | 88,100 | | | 1,313,571 | |
| PCSB Financial | | | 78,400 | | | 1,249,696 | |
| Territorial Bancorp | | | 45,900 | | | 1,102,977 | |
| Western New England Bancorp | | | 169,054 | | | 1,164,782 | |
| | | | | | | 4,831,026 | |
| Total (Cost $21,763,858) | | | | | | 22,081,206 | |
| HEALTH CARE – 13.6% | | | | | | | |
| BIOTECHNOLOGY - 2.5% | | | | | | | |
| †CareDx 1 | | | 20,800 | | | 1,506,960 | |
| Dynavax Technologies 1 | | | 116,500 | | | 518,425 | |
| †MeiraGTx Holdings 1 | | | 53,700 | | | 813,018 | |
| Zealand Pharma 1 | | | 36,058 | | | 1,309,852 | |
| | | | | | | 4,148,255 | |
| HEALTH CARE EQUIPMENT & SUPPLIES - 6.8% | | | | | | | |
| Apyx Medical 1 | | | 163,100 | | | 1,174,320 | |
| AtriCure 1 | | | 23,100 | | | 1,285,977 | |
| Chembio Diagnostics 1 | | | 107,400 | | | 510,150 | |
| CryoLife 1 | | | 78,489 | | | 1,853,125 | |
| Cutera 1 | | | 25,400 | | | 612,394 | |
| Mesa Laboratories | | | 4,700 | | | 1,347,208 | |
| †Misonix 1 | | | 51,600 | | | 645,000 | |
| OrthoPediatrics Corporation 1 | | | 25,600 | | | 1,056,000 | |
| Profound Medical 1 | | | 63,200 | | | 1,300,344 | |
| Surmodics 1 | | | 29,278 | | | 1,274,179 | |
| | | | | | | 11,058,697 | |
| HEALTH CARE PROVIDERS & SERVICES - 0.6% | | | | | | | |
| †Sharps Compliance 1 | | | 104,500 | | | 987,525 | |
| LIFE SCIENCES TOOLS & SERVICES - 3.3% | | | | | | | |
| Harvard Bioscience 1 | | | 380,268 | | | 1,631,350 | |
| NeoGenomics 1 | | | 35,400 | | | 1,905,936 | |
| Quanterix Corporation 1 | | | 37,900 | | | 1,762,350 | |
| | | | | | | 5,299,636 | |
| PHARMACEUTICALS - 0.4% | | | | | | | |
| Axsome Therapeutics 1,2 | | | 7,700 | | | 627,319 | |
| Total (Cost $11,653,100) | | | | | | 22,121,432 | |
| INDUSTRIALS – 23.3% | | | | | | | |
| AEROSPACE & DEFENSE - 0.4% | | | | | | | |
| CPI Aerostructures 1 | | | 184,331 | | | 706,172 | |
| BUILDING PRODUCTS - 0.5% | | | | | | | |
| Quanex Building Products | | | 35,800 | | | 793,686 | |
| COMMERCIAL SERVICES & SUPPLIES - 1.6% | | | | | | | |
| Acme United | | | 44,965 | | | 1,354,796 | |
| 8 | Royce Capital Fund 2020 Annual Report to Shareholders | THE ACCOMPANYING NOTES ARE AN INTEGRAL PART OF THESE FINANCIAL STATEMENTS |
December 31, 2020
| Royce Capital Fund - Micro-Cap Portfolio (continued) | |
| | | | SHARES | | | VALUE | |
| | | | | | | | |
| INDUSTRIALS (continued) | | | | | | | |
| COMMERCIAL SERVICES & SUPPLIES (continued) | | | | | | | |
| Heritage-Crystal Clean 1 | | | 54,934 | | $ | 1,157,459 | |
| | | | | | | 2,512,255 | |
| CONSTRUCTION & ENGINEERING - 5.1% | | | | | | | |
| Ameresco Cl. A 1 | | | 44,500 | | | 2,324,680 | |
| Construction Partners Cl. A 1 | | | 63,300 | | | 1,842,663 | |
| IES Holdings 1 | | | 24,000 | | | 1,104,960 | |
| Northwest Pipe 1 | | | 58,000 | | | 1,641,400 | |
| † NV5 Global 1 | | | 16,600 | | | 1,307,748 | |
| | | | | | | 8,221,451 | |
| ELECTRICAL EQUIPMENT - 1.6% | | | | | | | |
| American Superconductor 1 | | | 113,100 | | | 2,648,802 | |
| MACHINERY - 6.9% | | | | | | | |
| Alimak Group | | | 80,300 | | | 1,278,106 | |
| CIRCOR International 1 | | | 56,400 | | | 2,168,016 | |
| Graham Corporation | | | 74,820 | | | 1,135,768 | |
| Porvair | | | 139,600 | | | 1,010,706 | |
| Shyft Group | | | 67,700 | | | 1,921,326 | |
| Wabash National | | | 96,300 | | | 1,659,249 | |
| Westport Fuel Systems 1 | | | 391,000 | | | 2,084,030 | |
| | | | | | | 11,257,201 | |
| MARINE - 0.9% | | | | | | | |
| Clarkson | | | 40,300 | | | 1,488,720 | |
| PROFESSIONAL SERVICES - 4.3% | | | | | | | |
| CRA International | | | 23,306 | | | 1,186,974 | |
| Forrester Research 1 | | | 19,500 | | | 817,050 | |
| GP Strategies 1 | | | 117,608 | | | 1,394,831 | |
| Heidrick & Struggles International | | | 44,400 | | | 1,304,472 | |
| Kforce | | | 25,500 | | | 1,073,295 | |
| Resources Connection | | | 89,254 | | | 1,121,923 | |
| | | | | | | 6,898,545 | |
| TRADING COMPANIES & DISTRIBUTORS - 2.0% | | | | | | | |
| Lawson Products 1 | | | 36,000 | | | 1,832,760 | |
| Transcat 1 | | | 40,300 | | | 1,397,604 | |
| | | | | | | 3,230,364 | |
| Total (Cost $23,480,002) | | | | | | 37,757,196 | |
| INFORMATION TECHNOLOGY – 24.4% | | | | | | | |
| COMMUNICATIONS EQUIPMENT - 2.1% | | | | | | | |
| Digi International 1 | | | 91,400 | | | 1,727,460 | |
| EMCORE Corporation 1 | | | 206,800 | | | 1,127,060 | |
| Harmonic 1 | | | 67,900 | | | 501,781 | |
| | | | | | | 3,356,301 | |
| ELECTRONIC EQUIPMENT, INSTRUMENTS & COMPONENTS - 8.0% | | | | | | | |
| Fabrinet 1 | | | 9,969 | | | 773,495 | |
| FARO Technologies 1 | | | 21,600 | | | 1,525,608 | |
| LightPath Technologies Cl. A 1 | | | 354,800 | | | 1,390,816 | |
| Luna Innovations 1 | | | 204,700 | | | 2,022,436 | |
| nLIGHT 1 | | | 48,700 | | | 1,590,055 | |
| PAR Technology 1 | | | 35,800 | | | 2,247,882 | |
| PC Connection 1 | | | 23,500 | | | 1,111,315 | |
| †PowerFleet 1 | | | 86,000 | | | 638,980 | |
| Vishay Precision Group 1 | | | 51,700 | | | 1,627,516 | |
| | | | | | | 12,928,103 | |
| IT SERVICES - 0.6% | | | | | | | |
| Cass Information Systems | | | 16,148 | | | 628,319 | |
| Computer Task Group 1 | | | 62,500 | | | 382,500 | |
| | | | | | | 1,010,819 | |
| SEMICONDUCTORS & SEMICONDUCTOR EQUIPMENT - 10.7% | | | | | | | |
| Aehr Test Systems 1 | | | 322,200 | | | 815,166 | |
| Axcelis Technologies 1 | | | 42,900 | | | 1,249,248 | |
| AXT 1 | | | 222,900 | | | 2,133,153 | |
| Camtek 1 | | | 93,800 | | | 2,055,158 | |
| Cohu | | | 53,100 | | | 2,027,358 | |
| CyberOptics Corporation 1 | | | 39,800 | | | 903,062 | |
| Everspin Technologies 1 | | | 15,100 | | | 69,460 | |
| Ichor Holdings 1 | | | 39,100 | | | 1,178,669 | |
| Nova Measuring Instruments 1 | | | 25,200 | | | 1,779,120 | |
| NVE Corporation | | | 8,800 | | | 494,384 | |
| PDF Solutions 1 | | | 64,400 | | | 1,391,040 | |
| Photronics 1 | | | 133,400 | | | 1,488,744 | |
| Ultra Clean Holdings 1 | | | 56,800 | | | 1,769,320 | |
| | | | | | | 17,353,882 | |
| SOFTWARE - 2.5% | | | | | | | |
| Agilysys 1 | | | 54,900 | | | 2,107,062 | |
| QAD Cl. A | | | 30,200 | | | 1,908,036 | |
| | | | | | | 4,015,098 | |
| TECHNOLOGY HARDWARE, STORAGE & PERIPHERALS - 0.5% | | | | | | | |
| AstroNova | | | 85,200 | | | 907,380 | |
| Total (Cost $21,644,137) | | | | | | 39,571,583 | |
| MATERIALS – 3.0% | | | | | | | |
| METALS & MINING - 3.0% | | | | | | | |
| Altius Minerals | | | 78,900 | | | 848,567 | |
| Haynes International | | | 44,170 | | | 1,053,013 | |
| Major Drilling Group International 1 | | | 322,600 | | | 1,948,931 | |
| Universal Stainless & Alloy Products 1 | | | 134,000 | | | 1,002,320 | |
| Total (Cost $5,424,551) | | | | | | 4,852,831 | |
| REAL ESTATE – 1.8% | | | | | | | |
| EQUITY REAL ESTATE INVESTMENT TRUSTS (REITS) - 0.6% | | | | | | | |
| Postal Realty Trust Cl. A | | | 54,700 | | | 923,336 | |
| REAL ESTATE MANAGEMENT & DEVELOPMENT - 1.2% | | | | | | | |
| FRP Holdings 1 | | | 19,140 | | | 871,827 | |
| Marcus & Millichap 1 | | | 29,900 | | | 1,113,177 | |
| | | | | | | 1,985,004 | |
| Total (Cost $2,140,667) | | | | | | 2,908,340 | |
| TOTAL COMMON STOCKS | | | | | | | |
| (Cost $105,417,878) | | | | | | 159,460,702 | |
| THE ACCOMPANYING NOTES ARE AN INTEGRAL PART OF THESE FINANCIAL STATEMENTS | Royce Capital Fund 2020 Annual Report to Shareholders | 9 |
| Schedule of Investments | December 31, 2020 |
| Royce Capital Fund - Micro-Cap Portfolio (continued) | |
| | | VALUE | |
| REPURCHASE AGREEMENT– 1.9% | | | | |
| Fixed Income Clearing Corporation, 0.00% dated 12/31/20, due 1/4/21, maturity value $3,015,383 (collateralized by obligations of various U.S. Government Agencies, 0.125% due 12/31/22, valued at $3,075,700) | |
| (Cost $3,015,383) | | $ | 3,015,383 | |
| COLLATERAL RECEIVED FOR SECURITIES LOANED – 0.4% | | | | |
| Money Market Funds | | | | |
| Federated Government Obligations Fund – Institutional Shares (7 day yield-0.01%) | | | | |
| (Cost $640,017) | | | 640,017 | |
| | | | | |
| TOTAL INVESTMENTS – 100.6% | | | | |
| (Cost $109,073,278) | | | 163,116,102 | |
| | | | | |
| LIABILITIES LESS CASH AND OTHER ASSETS – (0.6)% | | | (968,119) | |
| | | | | |
| NET ASSETS – 100.0% | | $ | 162,147,983 | |
| † | New additions in 2020. |
| 1 | Non-income producing. |
| 2 | All or a portion of these securities were on loan at December 31, 2020. |
| 3 | Securities for which market quotations are not readily available represent 0.2% of net assets. These securities have been valued at their fair value under procedures approved by the Fund's Board of Trustees. These securities are defined as Level 3 securities due to the use of significant unobservable inputs in the determination of fair value. See Notes to Financial Statements. |
Bold indicates the Fund’s 20 largest equity holdings in terms of December 31, 2020, market value.
| 10 | Royce Capital Fund 2020 Annual Report to Shareholders | THE ACCOMPANYING NOTES ARE AN INTEGRAL PART OF THESE FINANCIAL STATEMENTS |
This page is intentionally left blank.
| Royce Capital Fund 2020 Annual Report to Shareholders | 11 |
MANAGER’S DISCUSSION (UNAUDITED)
Royce Capital Fund–Small-Cap Portfolio (RCS)

Jay Kaplan, CFA
FUND PERFORMANCE Royce Capital Fund–Small-Cap Portfolio was down 7.2% in 2020, underperforming both of its small-caps benchmarks: the Russell 2000 Value Index was up 4.6% and the Russell 2000 gained 20.0% for the same period. |
| |
WHAT WORKED… AND WHAT DIDN’T
Four of the portfolio’s nine equity sectors detracted from performance in 2020. Financials, Energy, and Consumer Discretionary had the biggest negative impacts while Consumer Staples detracted modestly. The biggest positive contributions came from Information Technology (which led by a wide margin), Industrials, and Health Care. At the industry level, airlines (Industrials) and banks (Financials) detracted most, followed by thrifts & mortgage finance, also from Financials. Two of the portfolio’s three top contributing industries were from Industrials—construction & engineering and road & rail—and one came from Information Technology, electronic equipment, instruments & components.
At the beginning of 2020, we saw the possibility of accelerating economic growth and positioned the portfolio accordingly. The coronavirus soon unraveled this thesis, with lockdowns and other constraints plunging the U.S. and much of the globe rapidly into recession. Each of the Fund’s five top-detracting positions was in an industry that was hit especially hard by the effects of the pandemic (and each was also a holdover from the top five detractors for the six-month period ended 6/30/20). The position that detracted most was discount carrier Spirit Airlines as few industries were hurt more by the travel restrictions wrought by the coronavirus. These same developments caused major problems for the business of low-cost carrier Allegiant Travel. We exited both positions during the first half.
Retailers were another area that suffered markedly from contracting economic activity. Plummeting sales led us to sell our positions in footwear manufacturer Caleres and women’s dress shoe retailer Designer Brands, as we thought that neither looked capable of a complete recovery given the challenges afflicting brick-and-mortar retailers. Dramatic declines in sales prompted us to act in a similar fashion by exiting G-III Apparel Group, which sells outerwear and sportswear, has licensing agreements with several sports leagues and universities, and operates retail stores. Selling these holdings allowed us to buy companies in areas such as health care services & providers, biotech, and pharmaceuticals, where we found businesses with solid revenues and profits, ample cash, and promising progress in their respective pipelines. We also added or built positions in insurance, banking, and engineering & construction.
The top contributor at the position level in 2020 was BMC Stock Holdings, a building products company that merged with Builders FirstSource in the summer, creating more scale and a bigger footprint in its industry. We were initially attracted to the very low valuation for MYR Group, a national electrical contractor specializing in transmission and distribution, substation, and commercial and industrial construction. When the impact of COVID-19 proved to have only a minor impact on its business, its shares rose. Evercore is a global independent investment banking advisory firm that’s seen as a leader in large-scale M&A transactions. That business ground to a halt in spring before experiencing a strong rebound, lifting Evercore’s stock.
Relative to the Russell 2000 Value in 2020, the Fund’s disadvantage came from stock selection as our sector allocation decisions were additive. Stock picking in Consumer Discretionary hurt most by far, particularly in the specialty retail and hotels, restaurants & leisure industries. Stock selection also hampered relative performance in Health Care, Industrials, and Information Technology, though in the latter two sectors our higher weightings were a positive. Conversely, stock selection gave the portfolio an advantage in Financials while our lower weighting in Real Estate and lack of exposure to Utilities also helped versus the small-cap value index.
| Top Contributors to Performance | | Top Detractors from Performance |
| For 2020 (%)1 | | | For 2020 (%)2 | |
| BMC Stock Holdings | 1.69 | | Spirit Airlines | -3.01 |
| MYR Group | 1.62 | | Designer Brands Cl. A | -2.44 |
| Evercore Cl. A | 1.58 | | Caleres | -2.20 |
| Rent-A-Center | 1.53 | | G-III Apparel Group | -2.04 |
| ArcBest | 1.46 | | Allegiant Travel | -1.96 |
| 1 Includes dividends | | | 2 Net of dividends | |
CURRENT POSITIONING AND OUTLOOK
While it’s impossible to predict what 2021 has in store, we remain hopeful that the economy will recover. The question is, how much of this optimism is priced into current valuations? We are already seeing the market reflect considerable confidence in the form of share prices for many companies that are ahead—in some cases significantly so—of what even a robustly rebounding economy may provide. The result is a tension between what looks like unsustainably high stock prices on the one hand and the likelihood of a fast-growing U.S. economy on the other—with record low interest rates being an additional factor, one that will probably encourage investors to continue looking toward equities in the absence of viable alternatives. Wide distribution of the vaccine should spur a global rally that should benefit cyclical U.S. small caps, which are very economically sensitive. We have positioned the portfolio towards industrial, financial, and technology stocks as we believe they should fare well in a vibrant economy. We also continue to seek contrarian investments, some of which we currently see in small regional banks.
| 12 | | Royce Capital Fund 2020 Annual Report to Shareholders |
| PERFORMANCE AND PORTFOLIO REVIEW (UNAUDITED) | TICKER SYMBOLS | RCPFX RCSSX |
Performance and Expenses
Average Annual Total Return (%) Through 12/31/20
| | JUL-DEC 20201 | 1-YR | 3-YR | 5-YR | 10-YR | 15-YR | 20-YR | SINCE INCEPTION (12/27/96) |
| RCS | 29.77 | -7.15 | 0.33 | 5.18 | 5.56 | 5.73 | 7.93 | 9.35 |
| Annual Gross Operating Expenses: 1.15% Annual Net Operating Expenses: 1.08% |
1 Not annualized
| Morningstar Style Map™ As of 12/31/20 |
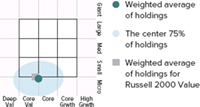
The Morningstar Style Map is the Morningstar Style Box™ with the center 75% of fund holdings plotted as the Morningstar Ownership Zone™. The Morningstar Style Box is designed to reveal a fund’s investment strategy. The Morningstar Ownership Zone provides detail about a portfolio’s investment style by showing the range of stock sizes and styles. The Ownership Zone is derived by plotting each stock in the portfolio within the proprietary Morningstar Style Box. Over time, the shape and location of a fund’s ownership zone may vary. See page 28 for additional information.
Value of $10,000
Invested on 12/27/96 as of 12/31/20 ($)
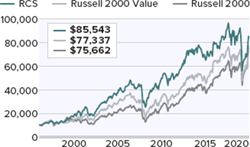
Includes reinvestment of distributions.
| Top 10 Positions | |
| % of Net Assets | |
| Insight Enterprises | 2.5 |
| Miller Industries | 2.4 |
| Rent-A-Center | 2.4 |
| Primoris Services | 2.3 |
| Great Lakes Dredge & Dock | 2.2 |
| Shoe Carnival | 2.1 |
| ArcBest | 2.1 |
| PulteGroup | 2.1 |
| Molina Healthcare | 2.1 |
| Evercore Cl. A | 2.1 |
| | |
| Portfolio Sector Breakdown | |
| % of Net Assets | |
| Industrials | 29.6 |
| Financials | 21.8 |
| Information Technology | 20.0 |
| Consumer Discretionary | 15.4 |
| Health Care | 7.0 |
| Communication Services | 1.5 |
| Real Estate | 0.7 |
| Energy | 0.4 |
| Consumer Staples | 0.3 |
| Cash and Cash Equivalents | 3.3 |
| | |
| Calendar Year Total Returns (%) | |
| YEAR | RCS |
| 2020 | -7.2 |
| 2019 | 18.7 |
| 2018 | -8.3 |
| 2017 | 5.4 |
| 2016 | 21.0 |
| 2015 | -11.8 |
| 2014 | 3.2 |
| 2013 | 34.8 |
| 2012 | 12.5 |
| 2011 | -3.3 |
| 2010 | 20.5 |
| 2009 | 35.2 |
| 2008 | -27.2 |
| 2007 | -2.1 |
| 2006 | 15.6 |
Upside/Downside Capture Ratios
Periods Ended 12/31/20 (%)
| | UPSIDE | DOWNSIDE |
| 10-Year | 82 | 95 |
| From 12/31/96 (Start of Fund’s First Full Quarter) | 96 | 91 |
| Portfolio Diagnostics | | |
| Fund Net Assets | | $359 million |
| Number of Holdings | | 87 |
| Turnover Rate | | 95% |
| Average Market Capitalization1 | | $1,454 million |
| Weighted Average P/B Ratio 2 | | 1.8x |
| Active Share 3 | | 95% |
| U.S. Investments (% of Net Assets) | | 93.2% |
| Non-U.S. Investments (% of Net Assets) | | 3.5% |
| 1 | Geometric Average. This weighted calculation uses each portfolio holding’s market cap in a way designed to not skew the effect of very large or small holdings; instead, it aims to better identify the portfolio’s center, which Royce believes offers a more accurate measure of average market cap than a simple mean or median. |
| 2 | Harmonic Average. This weighted calculation evaluates a portfolio as if it were a single stock and measures it overall. It compares the total market value of the portfolio to the portfolio’s share in the earnings or book value, as the case may be, of its underlying stocks. |
| 3 | Active Share is the sum of the absolute values of the different weightings of each holding in the Fund versus each holding in the benchmark, divided by two. |
Important Performance and Expense Information
All performance information in this Report reflects past performance, is presented on a total return basis, reflects the reinvestment of distributions, and does not reflect the deduction of taxes that a shareholder would pay on fund distributions or the redemption of fund shares. Past performance is no guarantee of future results. Investment return and principal value of an investment will fluctuate, so that shares may be worth more or less than their original cost when redeemed. Current performance may be higher or lower than performance quoted. The Fund’s total returns do not reflect any deduction for charges or expenses of the variable contracts investing in the Fund. Returns as of the most recent month-end may be obtained at www.royceinvest.com. All performance and risk information reflects the result of the Investment Class (its oldest class). Shares of RCS’s Service Class bear an annual distribution expense that is not borne by the Investment Class; if those expenses were reflected, total returns would have been lower. Certain immaterial adjustments were made to the net assets of Royce Capital Fund-Small-Cap Portfolio at 12/31/17 for financial reporting purposes, and as a result the calendar year total returns based on those net asset values differ from the adjusted net asset values and calendar year total returns reported in the Financial Highlights. Gross operating expenses reflect the Fund’s total gross operating expenses for the Investment Class and include management fees and other expenses. Net operating expenses reflect contractual fee waivers and/or expense reimbursements. All expense information is reported as of the Fund’s most current prospectus. Royce & Associates has contractually agreed, without right of termination, to waive fees and/or reimburse expenses to the extent necessary to maintain the Investment Class’s net annual operating expenses (excluding brokerage commissions, taxes, interest, litigation expenses, acquired fund fees and expenses, and other expenses not borne in the ordinary course of business) at or below 1.08% through April 30, 2021. Regarding the “Top Contributors” and “Top Detractors” tables shown above, the sum of all contributors to, and all detractors from, performance for all securities in the portfolio would approximate the Fund’s year-to-date performance for 2020. Upside Capture Ratio measures a manager’s performance in up markets relative to the Fund’s benchmark (Russell 2000 Value). It is calculated by measuring the Fund’s performance in quarters when the benchmark went up and dividing it by the benchmark’s return in those quarters. Downside Capture Ratio measures a manager’s performance in down markets relative to the Fund’s benchmark. It is calculated by measuring the Fund’s performance in quarters when the benchmark goes down and dividing it by the benchmark’s return in those quarters.
| Royce Capital Fund 2020 Annual Report to Shareholders | | 13 |
Schedule of Investments
| Royce Capital Fund - Small-Cap Portfolio |
| Common Stocks – 96.7% |
| | | SHARES | | VALUE | |
| | | | | | | | |
| COMMUNICATION SERVICES – 1.5% | | | | | | | |
| ENTERTAINMENT - 1.0% | | | | | | | |
| †SciPlay Corporation Cl. A 1 | | | 259,361 | | $ | 3,592,150 | |
| MEDIA - 0.5% | | | | | | | |
| Saga Communications Cl. A | | | 81,041 | | | 1,946,605 | |
| Total (Cost $6,638,769) | | | | | | 5,538,755 | |
| | | | | | | | |
| CONSUMER DISCRETIONARY – 15.4% | | | | | | | |
| AUTO COMPONENTS - 0.8% | | | | | | | |
| Gentex Corporation | | | 80,216 | | | 2,721,729 | |
| HOUSEHOLD DURABLES - 3.3% | | | | | | | |
| La-Z-Boy | | | 111,886 | | | 4,457,538 | |
| †PulteGroup | | | 175,550 | | | 7,569,716 | |
| | | | | | | 12,027,254 | |
| LEISURE PRODUCTS - 2.6% | | | | | | | |
| †Malibu Boats Cl. A 1 | | | 65,016 | | | 4,059,599 | |
| †MasterCraft Boat Holdings 1 | | | 207,100 | | | 5,144,364 | |
| | | | | | | 9,203,963 | |
| SPECIALTY RETAIL - 8.7% | | | | | | | |
| †Aaron's Company (The) | | | 257,985 | | | 4,891,396 | |
| American Eagle Outfitters | | | 239,965 | | | 4,816,098 | |
| †OneWater Marine Cl. A 1 | | | 176,984 | | | 5,148,465 | |
| Rent-A-Center | | | 225,560 | | | 8,636,692 | |
| Shoe Carnival | | | 197,036 | | | 7,719,870 | |
| | | | | | | 31,212,521 | |
| Total (Cost $43,487,968) | | | | | | 55,165,467 | |
| | | | | | | | |
| CONSUMER STAPLES – 0.3% | | | | | | | |
| FOOD & STAPLES RETAILING - 0.3% | | | | | | | |
| Village Super Market Cl. A | | | 48,990 | | | 1,080,719 | |
| Total (Cost $1,093,863) | | | | | | 1,080,719 | |
| | | | | | | | |
| ENERGY – 0.4% | | | | | | | |
| OIL, GAS & CONSUMABLE FUELS - 0.4% | | | | | | | |
| Dorchester Minerals L.P. | | | 132,850 | | | 1,449,394 | |
| Total (Cost $1,671,473) | | | | | | 1,449,394 | |
| | | | | | | | |
| FINANCIALS – 21.8% | | | | | | | |
| BANKS - 6.2% | | | | | | | |
| Ames National | | | 89,037 | | | 2,138,669 | |
| Camden National | | | 54,594 | | | 1,953,373 | |
| City Holding Company | | | 52,741 | | | 3,668,137 | |
| CNB Financial | | | 81,525 | | | 1,735,667 | |
| Financial Institutions | | | 105,734 | | | 2,379,015 | |
| Landmark Bancorp | | | 40,037 | | | 914,845 | |
| MidWestOne Financial Group | | | 121,092 | | | 2,966,754 | |
| National Bankshares | | | 134,553 | | | 4,212,854 | |
| Unity Bancorp | | | 138,310 | | | 2,427,341 | |
| | | | | | | 22,396,655 | |
| CAPITAL MARKETS - 4.2% | | | | | | | |
| †Evercore Cl. A | | | 67,600 | | | 7,411,664 | |
| Houlihan Lokey Cl. A | | | 42,015 | | | 2,824,668 | |
| Moelis & Company Cl. A | | | 107,101 | | | 5,008,043 | |
| | | | | | | 15,244,375 | |
| CONSUMER FINANCE - 1.2% | | | | | | | |
| †PROG Holdings | | | 83,270 | | | 4,485,755 | |
| INSURANCE - 7.4% | | | | | | | |
| †CNO Financial Group | | | 291,900 | | | 6,488,937 | |
| †Heritage Insurance Holdings | | | 165,024 | | | 1,671,693 | |
| James River Group Holdings | | | 88,388 | | | 4,344,270 | |
| †Kemper Corporation | | | 69,500 | | | 5,339,685 | |
| Reinsurance Group of America | | | 25,836 | | | 2,994,393 | |
| †Selective Insurance Group | | | 83,900 | | | 5,619,622 | |
| | | | | | | 26,458,600 | |
| THRIFTS & MORTGAGE FINANCE - 2.8% | | | | | | | |
| Southern Missouri Bancorp | | | 83,705 | | | 2,547,980 | |
| Timberland Bancorp | | | 121,077 | | | 2,937,328 | |
| TrustCo Bank Corp. NY | | | 396,385 | | | 2,643,888 | |
| WSFS Financial | | | 39,199 | | | 1,759,251 | |
| | | | | | | 9,888,447 | |
| Total (Cost $66,913,182) | | | | | | 78,473,832 | |
| | | | | | | | |
| HEALTH CARE – 7.0% | | | | | | | |
| BIOTECHNOLOGY - 1.9% | | | | | | | |
| Catalyst Pharmaceuticals 1 | | | 1,208,800 | | | 4,037,392 | |
| †Coherus BioSciences 1,2 | | | 108,812 | | | 1,891,153 | |
| †Vanda Pharmaceuticals 1 | | | 71,800 | | | 943,452 | |
| | | | | | | 6,871,997 | |
| HEALTH CARE PROVIDERS & SERVICES - 3.9% | | | | | | | |
| Ensign Group (The) | | | 66,714 | | | 4,864,785 | |
| Molina Healthcare 1 | | | 35,500 | | | 7,550,140 | |
| Pennant Group 1 | | | 24,157 | | | 1,402,555 | |
| | | | | | | 13,817,480 | |
| PHARMACEUTICALS - 1.2% | | | | | | | |
| Supernus Pharmaceuticals 1 | | | 173,000 | | | 4,352,680 | |
| Total (Cost $20,605,351) | | | | | | 25,042,157 | |
| | | | | | | | |
| INDUSTRIALS – 29.6% | | | | | | | |
| AEROSPACE & DEFENSE - 2.0% | | | | | | | |
| Vectrus 1 | | | 146,946 | | | 7,306,155 | |
| BUILDING PRODUCTS - 1.0% | | | | | | | |
| †UFP Industries | | | 62,800 | | | 3,488,540 | |
| COMMERCIAL SERVICES & SUPPLIES - 1.2% | | | | | | | |
| Herman Miller | | | 55,303 | | | 1,869,241 | |
| †IBEX Holdings 1 | | | 134,394 | | | 2,513,168 | |
| | | | | | | 4,382,409 | |
| CONSTRUCTION & ENGINEERING - 9.2% | | | | | | | |
| Comfort Systems USA | | | 33,271 | | | 1,752,051 | |
| †Great Lakes Dredge & Dock 1 | | | 593,313 | | | 7,813,932 | |
| †MasTec 1 | | | 70,100 | | | 4,779,418 | |
| MYR Group 1 | | | 82,287 | | | 4,945,449 | |
| †Northwest Pipe 1 | | | 200,096 | | | 5,662,717 | |
| †Primoris Services | | | 296,290 | | | 8,180,567 | |
| | | | | | | 33,134,134 | |
| MACHINERY - 3.3% | | | | | | | |
| Alamo Group | | | 12,007 | | | 1,656,366 | |
| Federal Signal | | | 47,422 | | | 1,572,988 | |
| Miller Industries | | | 231,271 | | | 8,792,923 | |
| | | | | | | 12,022,277 | |
| PROFESSIONAL SERVICES - 5.8% | | | | | | | |
| Barrett Business Services | | | 58,466 | | | 3,987,966 | |
| Heidrick & Struggles International | | | 165,151 | | | 4,852,136 | |
| Kforce | | | 81,135 | | | 3,414,972 | |
| Korn Ferry | | | 80,607 | | | 3,506,404 | |
| Resources Connection | | | 263,580 | | | 3,313,201 | |
| Robert Half International | | | 25,264 | | | 1,578,495 | |
| | | | | | | 20,653,174 | |
| ROAD & RAIL - 5.8% | | | | | | | |
| ArcBest | | | 177,589 | | | 7,577,723 | |
| 14 | Royce Capital Fund 2020 Annual Report to Shareholders | THE ACCOMPANYING NOTES ARE AN INTEGRAL PART OF THESE FINANCIAL STATEMENTS |
December 31, 2020
| Royce Capital Fund - Small-Cap Portfolio (continued) |
| | | | SHARES | | | VALUE | |
| | | | | | | | |
| INDUSTRIALS (continued) | | | | | | | |
| ROAD & RAIL (continued) | | | | | | | |
| Old Dominion Freight Line | | | 7,606 | | $ | 1,484,539 | |
| Saia 1 | | | 9,600 | | | 1,735,680 | |
| †Schneider National Cl. B | | | 221,100 | | | 4,576,770 | |
| Werner Enterprises | | | 135,739 | | | 5,323,683 | |
| | | | | | | 20,698,395 | |
| TRADING COMPANIES & DISTRIBUTORS - 1.3% | | | | | | | |
| BMC Stock Holdings 1 | | | 89,699 | | | 4,815,042 | |
| Total (Cost $78,975,232) | | | | | | 106,500,126 | |
| | | | | | | | |
| INFORMATION TECHNOLOGY – 20.0% | | | | | | | |
| ELECTRONIC EQUIPMENT, INSTRUMENTS & COMPONENTS - 13.2% | | | | | | | |
| †ePlus 1 | | | 57,862 | | | 5,088,963 | |
| Fabrinet 1 | | | 23,180 | | | 1,798,536 | |
| Insight Enterprises 1 | | | 118,552 | | | 9,020,622 | |
| †Kimball Electronics 1 | | | 278,134 | | | 4,447,363 | |
| Methode Electronics | | | 93,922 | | | 3,595,334 | |
| PC Connection 1 | | | 94,898 | | | 4,487,726 | |
| †Plexus Corporation 1 | | | 22,300 | | | 1,744,083 | |
| Sanmina Corporation 1 | | | 226,693 | | | 7,229,240 | |
| †SYNNEX Corporation 1 | | | 58,284 | | | 4,746,649 | |
| Vishay Intertechnology | | | 258,699 | | | 5,357,656 | |
| | | | | | | 47,516,172 | |
| IT SERVICES - 3.4% | | | | | | | |
| †Concentrix 1 | | | 44,400 | | | 4,382,280 | |
| †CSG Systems International | | | 43,540 | | | 1,962,348 | |
| Hackett Group (The) | | | 169,407 | | | 2,437,766 | |
| †Sykes Enterprises 1 | | | 95,564 | | | 3,599,896 | |
| | | | | | | 12,382,290 | |
| SEMICONDUCTORS & SEMICONDUCTOR EQUIPMENT - 3.4% | | | | | | | |
| Advanced Energy Industries 1 | | | 27,908 | | | 2,706,239 | |
| Kulicke & Soffa Industries | | | 207,426 | | | 6,598,221 | |
| MKS Instruments | | | 18,091 | | | 2,721,791 | |
| | | | | | | 12,026,251 | |
| Total (Cost $53,992,786) | | | | | | 71,924,713 | |
| | | | | | | | |
| REAL ESTATE – 0.7% | | | | | | | |
| REAL ESTATE MANAGEMENT & DEVELOPMENT - 0.7% | | | | | | | |
| Marcus & Millichap 1 | | | 65,825 | | | 2,450,665 | |
| Total (Cost $1,795,201) | | | | | | 2,450,665 | |
| | | | | | | | |
| TOTAL COMMON STOCKS | | | | | | | |
| (Cost $275,173,825) | | | | | | 347,625,828 | |
| | | | | |
| REPURCHASE AGREEMENT– 2.5% | | | | |
| Fixed Income Clearing Corporation, 0.00% dated 12/31/20, due 1/4/21, maturity value $9,064,543 (collateralized by obligations of various U.S. Government Agencies, 0.125%-2.125% due 12/31/22-8/15/23, valued at $9,245,848) | |
| (Cost $9,064,543) | | | 9,064,543 | |
| | | | | |
| TOTAL INVESTMENTS – 99.2% | | | | |
| (Cost $284,238,368) | | | 356,690,371 | |
| | | | | |
| CASH AND OTHER ASSETS LESS LIABILITIES – 0.8% | | | 2,762,526 | |
| | | | | |
| NET ASSETS – 100.0% | | $ | 359,452,897 | |
| 2 | All or a portion of these securities were on loan at December 31, 2020. |
Bold indicates the Fund’s 20 largest equity holdings in terms of December 31, 2020, market value.
| THE ACCOMPANYING NOTES ARE AN INTEGRAL PART OF THESE FINANCIAL STATEMENTS | Royce Capital Fund 2020 Annual Report to Shareholders | 15 |
| Statements of Assets and Liabilities | December 31, 2020 |
| | | | Micro-Cap
Portfolio | | | | Small-Cap
Portfolio | |
| ASSETS: | | | | | | | | |
| Investments at value (including collateral on loaned securities)1 | | $ | 160,100,719 | | | $ | 347,625,828 | |
| Repurchase agreements (at cost and value) | | | 3,015,383 | | | | 9,064,543 | |
| Receivable for investments sold | | | 162,697 | | | | 4,372,058 | |
| Receivable for capital shares sold | | | 59,686 | | | | 294,130 | |
| Receivable for dividends | | | 17,463 | | | | 248,502 | |
| Receivable for securities lending income | | | – | | | | 79 | |
| Prepaid expenses and other assets | | | 1,691 | | | | 3,360 | |
| Total Assets | | | 163,357,639 | | | | 361,608,500 | |
| LIABILITIES: | | | | | | | | |
| Payable for collateral on loaned securities | | | 640,017 | | | | – | |
| Payable for investments purchased | | | 23,203 | | | | 1,376,784 | |
| Payable for capital shares redeemed | | | 315,519 | | | | 374,264 | |
| Payable for investment advisory fees | | | 163,391 | | | | 303,071 | |
| Payable for trustees' fees | | | 9,648 | | | | 18,658 | |
| Accrued expenses | | | 57,878 | | | | 82,826 | |
| Total Liabilities | | | 1,209,656 | | | | 2,155,603 | |
| Net Assets | | $ | 162,147,983 | | | $ | 359,452,897 | |
| ANALYSIS OF NET ASSETS: | | | | | | | | |
| Paid-in capital | | $ | 99,970,309 | | | $ | 350,587,809 | |
| Total distributable earnings (loss) | | | 62,177,674 | | | | 8,865,088 | |
| Net Assets | | $ | 162,147,983 | | | $ | 359,452,897 | |
| Investment Class | | $ | 134,109,438 | | | $ | 153,952,985 | |
| Service Class | | | 28,038,545 | | | | 205,499,912 | |
| SHARES OUTSTANDING (unlimited number of $.001 par value): | | | | | | | | |
| Investment Class | | | 11,256,092 | | | | 20,764,865 | |
| Service Class | | | 2,411,618 | | | | 28,350,610 | |
| NET ASSET VALUES (Net Assets ÷ Shares Outstanding): | | | | | | | | |
| (offering and redemption price per share) | | | | | | | | |
| Investment Class | | $ | 11.91 | | | $ | 7.41 | |
| Service Class | | | 11.63 | | | | 7.25 | |
| Investments at identified cost | | $ | 106,057,895 | | | $ | 275,173,825 | |
| Market value of loaned securities2 | | | 4,295,344 | | | | 723,831 | |
| 1 | See Notes to Financial Statements for information on non-cash collateral on loaned securities. |
| 2 | Market value of loaned securities backed by non-cash collateral is as of prior business day. |
| 16 | Royce Capital Fund 2020 Annual Report to Shareholders | THE ACCOMPANYING NOTES ARE AN INTEGRAL PART OF THESE FINANCIAL STATEMENTS |
| Statements of Operations | Year Ended December 31, 2020 |
| | | Micro-Cap
Portfolio | | | Small-Cap
Portfolio | |
| INVESTMENT INCOME: | | | | | | | | |
| INCOME: | | | | | | | | |
| Dividends | | $ | 1,084,816 | | | $ | 5,350,416 | |
| Foreign withholding tax | | | (16,858 | ) | | | (140,344 | ) |
| Interest | | | 5,282 | | | | 7,131 | |
| Securities lending | | | 14,001 | | | | 1,870 | |
| Total income | | | 1,087,241 | | | | 5,219,073 | |
| EXPENSES: | | | | | | | | |
| Investment advisory fees | | | 1,646,542 | | | | 2,587,216 | |
| Distribution fees | | | 50,794 | | | | 310,052 | |
| Shareholder reports | | | 82,772 | | | | 120,031 | |
| Administrative and office facilities | | | 82,510 | | | | 154,114 | |
| Trustees' fees | | | 34,170 | | | | 69,928 | |
| Audit | | | 31,699 | | | | 29,887 | |
| Custody | | | 24,766 | | | | 39,951 | |
| Shareholder servicing | | | 15,070 | | | | 14,721 | |
| Legal | | | 7,297 | | | | 22,295 | |
| Other expenses | | | 11,738 | | | | 23,662 | |
| Total expenses | | | 1,987,358 | | | | 3,371,857 | |
| Compensating balance credits | | | (59 | ) | | | (44 | ) |
| Fees waived by investment adviser | | | (87,217 | ) | | | (139,873 | ) |
| Expenses reimbursed by investment adviser | | | (97,362 | ) | | | (127,683 | ) |
| Net expenses | | | 1,802,720 | | | | 3,104,257 | |
| Net investment income (loss) | | | (715,479 | ) | | | 2,114,816 | |
| REALIZED AND UNREALIZED GAIN (LOSS) ON INVESTMENTS AND FOREIGN CURRENCY: | | | | | | | | |
| NET REALIZED GAIN (LOSS): | | | | | | | | |
| Investments | | | 8,174,944 | | | | (62,554,558 | ) |
| Foreign currency transactions | | | (5,562 | ) | | | (24,668 | ) |
| NET CHANGE IN UNREALIZED APPRECIATION (DEPRECIATION): | | | | | | | | |
| Investments | | | 19,462,517 | | | | 34,195,124 | |
| Other assets and liabilities denominated in foreign currency | | | 2,652 | | | | 42 | |
| Net realized and unrealized gain (loss) on investments and foreign currency | | | 27,634,551 | | | | (28,384,060 | ) |
| NET INCREASE (DECREASE) IN NET ASSETS FROM INVESTMENT OPERATIONS | | $ | 26,919,072 | | | $ | (26,269,244 | ) |
| THE ACCOMPANYING NOTES ARE AN INTEGRAL PART OF THESE FINANCIAL STATEMENTS | Royce Capital Fund 2020 Annual Report to Shareholders | 17 |
Statements of Changes in Net Assets
| | | Micro-Cap Portfolio | | Small-Cap Portfolio | |
| | Year Ended 12/31/20 | | | Year Ended 12/31/19 | | Year Ended 12/31/20 | | | Year Ended 12/31/19 |
INVESTMENT OPERATIONS:
Net investment income (loss) | | $ | (715,479 | ) | $ | (649,447 | ) | $ | 2,114,816 | | $ | 3,054,702 | |
| Net realized gain (loss) on investments and foreign currency | | | 8,169,382 | | | 2,092,296 | | | (62,579,226 | ) | | 3,764,354 | |
| Net change in unrealized appreciation (depreciation) on investments and foreign currency | | | 19,465,169 | | | 24,779,961 | | | 34,195,166 | | | 33,770,814 | |
| Net increase (decrease) in net assets from investment operations | | | 26,919,072 | | | 26,222,810 | | | (26,269,244 | ) | | 40,589,870 | |
DISTRIBUTIONS:
Total distributable earnings | | | | | | | | | | | | | |
| Investment Class | | | (1,725,374 | ) | | (11,752,195 | ) | | (3,913,734 | ) | | (21,338,300 | ) |
| Service Class | | | (371,288 | ) | | (2,426,040 | ) | | (4,765,060 | ) | | (27,129,064 | ) |
| Total distributions | | | (2,096,662 | ) | | (14,178,235 | ) | | (8,678,794 | ) | | (48,467,364 | ) |
CAPITAL SHARE TRANSACTIONS:
Value of shares sold | | | | | | | | | | | | | |
| Investment Class | | | 11,192,683 | | | 10,068,959 | | | 22,407,979 | | | 15,075,395 | |
| Service Class | | | 11,856,775 | | | 16,944,428 | | | 93,586,484 | | | 315,873,262 | |
| Distributions reinvested | | | | | | | | | | | | | |
| Investment Class | | | 1,725,374 | | | 11,752,195 | | | 3,913,734 | | | 21,338,300 | |
| Service Class | | | 371,288 | | | 2,426,040 | | | 4,765,060 | | | 27,129,064 | |
| Value of shares redeemed | | | | | | | | | | | | | |
| Investment Class | | | (32,465,966 | ) | | (28,638,535 | ) | | (30,430,274 | ) | | (43,316,043 | ) |
| Service Class | | | (14,453,059 | ) | | (7,600,024 | ) | | (98,583,746 | ) | | (205,170,757 | ) |
| Net increase (decrease) in net assets from capital share transactions | | | (21,772,905 | ) | | 4,953,063 | | | (4,340,763 | ) | | 130,929,221 | |
| Net Increase (Decrease) in Net Assets | | | 3,049,505 | | | 16,997,638 | | | (39,288,801 | ) | | 123,051,727 | |
| NET ASSETS: | | | | | | | | | | | | | |
| Beginning of year | | | 159,098,478 | | | 142,100,840 | | | 398,741,698 | | | 275,689,971 | |
| End of year | | $ | 162,147,983 | | $ | 159,098,478 | | $ | 359,452,897 | | $ | 398,741,698 | |
| 18 | Royce Capital Fund 2020 Annual Report to Shareholders | THE ACCOMPANYING NOTES ARE AN INTEGRAL PART OF THESE FINANCIAL STATEMENTS |
Financial Highlights
This table is presented to show selected data for a share outstanding throughout each year and to assist shareholders in evaluating a Fund’s performance for the periods presented. Per share amounts have been determined on the basis of the weighted average number of shares outstanding during the period.
| | | | | | | | | | | | | | | | | | | | | | | Ratio of Expenses to Average Net Assets | | | | | |
| | | Net Asset Value,
Beginning of
Period | | Net Investment
Income (Loss) | | Net Realized and
Unrealized Gain (Loss)
on Investments and
Foreign Currency | | Total from
Investment
Operations | | Distributions
from Net
Investment
Income | | Distributions from
Net Realized Gain on
Investments and
Foreign Currency | | Total
Distributions | | Net Asset
Value, End of
Period | | Total Return | | Net Assets,
End of Period
(in thousands) | | Prior to Fee
Waivers,
Expense Reimbursements
and Balance
Credits | | Prior to Fee
Waivers and
Expense
Reimbursements | | Net of Fee
Waivers and
Expense
Reimbursements | | Ratio of Net
Investment
Income (Loss) to
Average Net
Assets | | Portfolio
Turnover Rate | |
| Micro-Cap Portfolio–Investment Class | | | | | | | | | | | | | | | | | | | | | | | | | | | | | | | | | | |
| 2020 | | $ | 9.75 | | $ | (0.05 | ) | $ | 2.36 | | $ | 2.31 | | $ | – | | $ | (0.15 | ) | $ | (0.15 | ) | $ | 11.91 | | | 23.79 | % | $ | 134,109 | | | 1.47 | % | | 1.47 | % | | 1.33 | % | | (0.51 | )% | | 25 | % |
| 2019 | | | 8.97 | | | (0.04 | ) | | 1.77 | | | 1.73 | | | – | | | (0.95 | ) | | (0.95 | ) | | 9.75 | | | 19.55 | | | 132,008 | | | 1.43 | | | 1.43 | | | 1.33 | | | (0.41 | ) | | 26 | |
| 2018 | | | 10.39 | | | (0.03 | ) | | (0.90 | ) | | (0.93 | ) | | – | | | (0.49 | ) | | (0.49 | ) | | 8.97 | | | (9.13 | ) | | 127,457 | | | 1.39 | | | 1.39 | | | 1.33 | | | (0.30 | ) | | 28 | |
| 2017 | | | 11.11 | | | (0.02 | ) | | 0.58 | | | 0.56 | | | (0.08 | ) | | (1.20 | ) | | (1.28 | ) | | 10.39 | | | 5.29 | | | 164,656 | | | 1.38 | | | 1.38 | | | 1.38 | | | (0.22 | ) | | 30 | |
| 2016 | | | 9.34 | | | 0.03 | | | 1.81 | | | 1.84 | | | (0.07 | ) | | – | | | (0.07 | ) | | 11.11 | | | 19.71 | | | 177,444 | | | 1.36 | | | 1.36 | | | 1.36 | | | 0.02 | | | 57 | |
| Micro-Cap Portfolio–Service Class | | | | | | | | | | | | | | | | | | | | | | | | | | | | | | | | | | | | |
| 2020 | | $ | 9.54 | | $ | (0.07 | ) | $ | 2.31 | | $ | 2.24 | | $ | – | | $ | (0.15 | ) | $ | (0.15 | ) | $ | 11.63 | | | 23.55 | % | $ | 28,039 | | | 1.72 | % | | 1.72 | % | | 1.58 | % | | (0.75 | )% | | 25 | % |
| 2019 | | | 8.80 | | | (0.06 | ) | | 1.73 | | | 1.67 | | | – | | | (0.93 | ) | | (0.93 | ) | | 9.54 | | | 19.24 | | | 27,090 | | | 1.71 | | | 1.71 | | | 1.58 | | | (0.66 | ) | | 26 | |
| 2018 | | | 10.21 | | | (0.06 | ) | | (0.87 | ) | | (0.93 | ) | | – | | | (0.48 | ) | | (0.48 | ) | | 8.80 | | | (9.29 | ) | | 14,644 | | | 1.64 | | | 1.64 | | | 1.58 | | | (0.57 | ) | | 28 | |
| 2017 | | | 10.93 | | | (0.04 | ) | | 0.57 | | | 0.53 | | | (0.06 | ) | | (1.19 | ) | | (1.25 | ) | | 10.21 | | | 5.02 | | | 32,067 | | | 1.64 | | | 1.64 | | | 1.58 | | | (0.43 | ) | | 30 | |
| 2016 | | | 9.20 | | | (0.02 | ) | | 1.80 | | | 1.78 | | | (0.05 | ) | | – | | | (0.05 | ) | | 10.93 | | | 19.37 | | | 34,675 | | | 1.65 | | | 1.65 | | | 1.58 | | | (0.15 | ) | | 57 | |
| Small-Cap Portfolio–Investment Class | | | | | | | | | | | | | | | | | | | | | | | | | | | | | | | | | |
| 2020 | | $ | 8.19 | | $ | 0.06 | | $ | (0.65 | ) | $ | (0.59 | ) | $ | (0.07 | ) | $ | (0.12 | ) | $ | (0.19 | ) | $ | 7.41 | | | (7.15 | )% | $ | 153,953 | | | 1.19 | % | | 1.19 | % | | 1.08 | % | | 0.90 | % | | 95 | % |
| 2019 | | | 7.87 | | | 0.09 | | | 1.37 | | | 1.46 | | | (0.06 | ) | | (1.08 | ) | | (1.14 | ) | | 8.19 | | | 18.67 | | | 173,492 | | | 1.15 | | | 1.15 | | | 1.08 | | | 1.04 | | | 111 | |
| 2018 | | | 8.77 | | | 0.06 | | | (0.78 | ) | | (0.72 | ) | | (0.07 | ) | | (0.11 | ) | | (0.18 | ) | | 7.87 | | | (8.24 | ) | | 171,561 | | | 1.11 | | | 1.11 | | | 1.08 | | | 0.62 | | | 56 | |
| 2017 | | | 8.41 | | | 0.05 | | | 0.39 | | | 0.44 | | | (0.08 | ) | | – | | | (0.08 | ) | | 8.77 | | | 5.26 | | | 228,620 | | | 1.11 | | | 1.11 | | | 1.11 | | | 0.55 | | | 91 | |
| 2016 | | | 8.43 | | | 0.13 | | | 1.66 | | | 1.79 | | | (0.17 | ) | | (1.64 | ) | | (1.81 | ) | | 8.41 | | | 20.96 | | | 248,244 | | | 1.09 | | | 1.09 | | | 1.09 | | | 0.89 | | | 78 | |
| Small-Cap Portfolio–Service Class | | | | | | | | | | | | | | | | | | | | | | | | | | | | | | | | | |
| 2020 | | $ | 8.01 | | $ | 0.05 | | $ | (0.64 | ) | $ | (0.59 | ) | $ | (0.05 | ) | $ | (0.12 | ) | $ | (0.17 | ) | $ | 7.25 | | | (7.33 | )% | $ | 205,500 | | | 1.43 | % | | 1.43 | % | | 1.33 | % | | 0.73 | % | | 95 | % |
| 2019 | | | 7.69 | | | 0.06 | | | 1.35 | | | 1.41 | | | (0.04 | ) | | (1.05 | ) | | (1.09 | ) | | 8.01 | | | 18.44 | | | 225,250 | | | 1.39 | | | 1.39 | | | 1.33 | | | 0.86 | | | 111 | |
| 2018 | | | 8.55 | | | 0.04 | | | (0.76 | ) | | (0.72 | ) | | (0.03 | ) | | (0.11 | ) | | (0.14 | ) | | 7.69 | | | (8.50 | ) | | 104,129 | | | 1.34 | | | 1.34 | | | 1.33 | | | 0.31 | | | 56 | |
| 2017 | | | 8.20 | | | 0.02 | | | 0.40 | | | 0.42 | | | (0.07 | ) | | – | | | (0.07 | ) | | 8.55 | | | 5.10 | | | 263,549 | | | 1.34 | | | 1.34 | | | 1.34 | | | 0.32 | | | 91 | |
| 2016 | | | 8.27 | | | 0.03 | | | 1.69 | | | 1.72 | | | (0.15 | ) | | (1.64 | ) | | (1.79 | ) | | 8.20 | | | 20.53 | | | 267,445 | | | 1.34 | | | 1.34 | | | 1.34 | | | 0.69 | | | 78 | |
| THE ACCOMPANYING NOTES ARE AN INTEGRAL PART OF THESE FINANCIAL STATEMENTS | Royce Capital Fund 2020 Annual Report to Shareholders | 19 |
Notes to Financial Statements
Summary of Significant Accounting Policies:
Royce Capital Fund – Micro-Cap Portfolio and Royce Capital Fund – Small-Cap Portfolio (the “Fund” or “Funds”) are the two series of Royce Capital Fund (the “Trust”), an open-end management investment company organized as a Delaware statutory trust. Shares of the Funds are offered to life insurance companies for allocation to certain separate accounts established for the purpose of funding qualified and non-qualified variable annuity contracts and variable life insurance contracts. Micro-Cap Portfolio and Small-Cap Portfolio commenced operations on December 27, 1996.
Classes of shares have equal rights as to earnings and assets, except that each class may bear different fees and expenses for distribution, shareholder servicing, registration and shareholder reports, and receive different compensating balance credits and expense reimbursements. Investment income, realized and unrealized capital gains or losses on investments and foreign currency, and expenses other than those attributable to a specific class are allocated to each class of shares based on its relative net assets.
The preparation of financial statements in conformity with accounting principles generally accepted in the United States requires management to make estimates and assumptions that affect the reported amounts of assets and liabilities and the disclosure of contingent assets and liabilities at the date of the financial statements and the reported amounts of income and expenses during the reporting period. Actual results could differ from those estimates.
Each Fund is an investment company and accordingly follows the investment company accounting and reporting guidance of the Financial Accounting Standards Board (FASB) Accounting Standard Codification Topic 946 “Financial Services-Investment Companies.”
Royce & Associates, LP, the Funds’ investment adviser, primarily conducts business using the name Royce Investment Partners (“Royce”).
VALUATION OF INVESTMENTS:
Securities are valued as of the close of trading on the New York Stock Exchange (NYSE) (generally 4:00 p.m. Eastern time) on the valuation date. Securities that trade on an exchange, and securities traded on Nasdaq’s Electronic Bulletin Board, are valued at their last reported sales price or Nasdaq official closing price taken from the primary market in which each security trades or, if no sale is reported for such day, at their highest bid price. Other over-the-counter securities for which market quotations are readily available are valued at their highest bid price, except in the case of some bonds and other fixed income securities which may be valued by reference to other securities with comparable ratings, interest rates and maturities, using established independent pricing services. The Funds value their non-U.S. dollar denominated securities in U.S. dollars daily at the prevailing foreign currency exchange rates as quoted by a major bank. Securities for which market quotations are not readily available are valued at their fair value in accordance with the provisions of the 1940 Act, under procedures approved by the Trust’s Board of Trustees, and are reported as Level 3 securities. As a general principle, the fair value of a security is the amount which the Fund might reasonably expect to receive for the security upon its current sale. However, in light of the judgment involved in fair valuations, there can be no assurance that a fair value assigned to a particular security will be the amount which the Fund might be able to receive upon its current sale. In addition, if, between the time trading ends on a particular security and the close of the customary trading session on the NYSE, events occur that are significant and may make the closing price unreliable, a Fund may fair value the security. The Funds use an independent pricing service to provide fair value estimates for relevant non-U.S. equity securities on days when the U.S. market volatility exceeds a certain threshold. This pricing service uses proprietary correlations it has developed between the movement of prices of non-U.S. equity securities and indices of U.S.-traded securities, futures contracts and other indications to estimate the fair value of relevant non-U.S. securities. When fair value pricing is employed, the prices of securities used by a Fund may differ from quoted or published prices for the same security. Investments in money market funds are valued at net asset value per share.
Various inputs are used in determining the value of each Fund’s investments, as noted above. These inputs are summarized in the three broad levels below:
| | Level 1 | – | quoted prices in active markets for identical securities. |
| | Level 2 | – | other significant observable inputs (including quoted prices for similar securities, foreign securities that may be fair valued and repurchase agreements). The table below includes all Level 2 securities. Any Level 2 securities with values based on quoted prices for similar securities would be noted in the Schedules of Investments. |
| | Level 3 | – | significant unobservable inputs (including last trade price before trading was suspended, or at a discount thereto for lack of marketability or otherwise, market price information regarding other securities, information received from the company and/or published documents, including SEC filings and financial statements, or other publicly available information). |
The inputs or methodology used for valuing securities are not necessarily an indication of the risk associated with investing in those securities.
20 | Royce Capital Fund 2020 Annual Report to Shareholders
VALUATION OF INVESTMENTS (continued):
The following is a summary of the inputs used to value each Fund’s investments as of December 31, 2020. For a detailed breakout of common stocks by sector classification, please refer to the Schedules of Investments.
| | | LEVEL 1 | | | LEVEL 2 | | | LEVEL 3 | | | TOTAL | |
| Micro-Cap Portfolio | | | | | | | | | | | | | | | | |
| Common Stocks | | $ | 153,095,685 | | | $ | 6,039,517 | | | $ | 325,500 | | | $ | 159,460,702 | |
| Repurchase Agreement | | | – | | | | 3,015,383 | | | | – | | | | 3,015,383 | |
| Money Market Fund/Collateral Received for Securities Loaned | | | 640,017 | | | | – | | | | – | | | | 640,017 | |
| Small-Cap Portfolio | | | | | | | | | | | | | | | | |
| Common Stocks | | | 347,625,828 | | | | – | | | | – | | | | 347,625,828 | |
| Repurchase Agreement | | | – | | | | 9,064,543 | | | | – | | | | 9,064,543 | |
Level 3 Reconciliation:
| | | BALANCE AS OF 12/31/19 | | PURCHASES | | SALES | | REALIZED GAIN (LOSS) | | UNREALIZED GAIN (LOSS )1 | | BALANCE AS OF 12/31/20 | |
| Micro-Cap Portfolio | | | | | | | | | | | | | |
| Common Stocks | | $390,600 | | $– | | $– | | $– | | $(65,100) | | $325,500 | |
| 1 | The net change in unrealized appreciation (depreciation) is included in the accompanying Statement of Operations. Change in unrealized appreciation (depreciation) includes net unrealized appreciation (depreciation) resulting from changes in investment values during the reporting period and the reversal of previously recorded unrealized appreciation (depreciation) when gains or losses are realized. Net realized gain (loss) from investments and foreign currency transactions is included in the accompanying Statement of Operations. |
REPURCHASE AGREEMENTS:
The Funds may enter into repurchase agreements with institutions that the Funds’ investment adviser has determined are creditworthy. Each Fund restricts repurchase agreements to maturities of no more than seven days. Securities pledged as collateral for repurchase agreements, which are held until maturity of the repurchase agreements, are marked-to-market daily and maintained at a value at least equal to the principal amount of the repurchase agreement (including accrued interest). Repurchase agreements could involve certain risks in the event of default or insolvency of the counter-party, including possible delays or restrictions upon the ability of each Fund to dispose of its underlying securities. The remaining contractual maturities of repurchase agreements held by the Funds at December 31, 2020 are overnight and continuous.
FOREIGN CURRENCY:
Net realized foreign exchange gains or losses arise from sales and maturities of short-term securities, sales of foreign currencies, expiration of currency forward contracts, currency gains or losses realized between the trade and settlement dates on securities transactions, and the difference between the amounts of dividends, interest, and foreign withholding taxes recorded on each Fund’s books and the U.S. dollar equivalent of the amounts actually received or paid. Net unrealized foreign exchange gains and losses arise from changes in the value of assets and liabilities, other than investments in securities at the end of the reporting period, as a result of changes in foreign currency exchange rates.
The Funds do not isolate that portion of the results of operations resulting from fluctuations in foreign exchange rates on investments from the fluctuations arising from changes in market prices of securities held. Such fluctuations are included with the net realized and unrealized gain or loss on investments.
SECURITIES LENDING:
The Funds loan securities through a lending agent, State Street Bank and Trust Company, to qualified institutional investors for the purpose of earning additional income. The lending agent receives and holds collateral from such borrowers to secure their obligations to the Funds. Such loans must be secured at all times by collateral in an amount at least equal to the market value of the loaned securities. The market values of the loaned securities and the collateral fluctuate and are determined at the close of each business day by the lending agent. Borrowers are required to post additional collateral to the lending agent on the next succeeding business day in the event of a collateral shortfall. Counterparty risk is further reduced by loaning securities only to parties that participate in a Global Securities Lending Program organized and monitored by the lending agent and that are deemed by it to satisfy its requirements and by having the lending agent enter into securities lending agreements with such borrowers. The lending agent is not affiliated with Royce.
Collateral may be in the form of cash or U.S. Treasuries. Cash collateral is invested in certain money market pooled investment vehicles. The Funds record a liability in their respective Statements of Assets and Liabilities for the return of such cash collateral during periods in which securities are on loan. The Funds bear the risk of loss for any decrease in the market value of the loaned securities or the investments purchased with cash collateral received from the borrowers.
Pursuant to the agreement in place between the Funds and the lending agent, if a borrower fails to return loaned securities, and the cash collateral being maintained by the lending agent on behalf of such borrower is insufficient to cover the value of loaned securities and provided such collateral insufficiency is not the result of investment losses, the lending agent shall, at its option, either replace the loaned securities or pay the amount of the shortfall to the Funds. In the event of the bankruptcy of a borrower, the Funds could experience delay in recovering the loaned securities or only recover cash or a security of equivalent value.
Royce Capital Fund 2020 Annual Report to Shareholders | 21
Notes to Financial Statements (continued)
SECURITIES LENDING (continued):
Loans of securities generally do not have stated maturity dates, and the Funds may recall a security at any time. The Funds’ securities lending income consists of the income earned on investing cash collateral, plus any premium payments received for lending certain securities, less any rebates paid to borrowers and lending agent fees associated with the loan. Pursuant to the agreement in place between the Funds and the lending agent, the Funds are responsible for any shortfall in the event the value of the investments purchased with cash collateral is insufficient to pay the rebate fee to the borrower.
The following table presents cash collateral and the market value of securities on loan collateralized by cash collateral held by the Funds at December 31, 2020:
| | CASH COLLATERAL1 | SECURITIES ON LOAN
COLLATERALIZED BY CASH COLLATERAL | NET AMOUNT |
| Micro-Cap Portfolio | $640,017 | $(618,074) | $21,943 |
| 1 | Absent an event of default, assets and liabilities are presented gross and not offset in the Statements of Assets and Liabilities. The remaining contractual maturity of cash collateral is overnight and continuous. |
The following table presents non-cash collateral and the market value of securities on loan collateralized by non-cash collateral held by the Funds’ custodian at December 31, 2020:
| | NON-CASH COLLATERAL | SECURITIES ON LOAN
COLLATERALIZED BY NON-CASH COLLATERAL | NET AMOUNT |
| Micro-Cap Portfolio | $3,766,996 | $(3,677,270) | $89,726 |
| Small-Cap Portfolio | 739,252 | (723,831) | 15,421 |
DISTRIBUTIONS AND TAXES:
As qualified regulated investment companies under Subchapter M of the Internal Revenue Code, the Funds are not subject to income taxes to the extent that each Fund distributes substantially all of its taxable income for its fiscal year.
The Funds pay any dividends and capital gain distributions annually in December. Dividends from net investment income and distributions from capital gains are determined at a class level. Because federal income tax regulations differ from generally accepted accounting principles, income and capital gain distributions determined in accordance with tax regulations may differ from net investment income and realized gains recognized for financial reporting purposes. Accordingly, the character of distributions and composition of net assets for tax purposes differ from those reflected in the accompanying financial statements.
INVESTMENT TRANSACTIONS AND RELATED INVESTMENT INCOME:
Investment transactions are accounted for on the trade date. Dividend income is recorded on the ex-dividend date. Non-cash dividend income is recorded at the fair market value of the securities received. Interest income is recorded on an accrual basis. Realized gains and losses from investment transactions are determined on the basis of identified cost for book and tax purposes.
EXPENSES:
The Funds incur direct and indirect expenses. Expenses directly attributable to a Fund are charged to the Fund’s operations, while expenses applicable to more than one of the Royce Funds are allocated equitably. Certain personnel, occupancy costs and other administrative expenses related to the Funds are allocated by Royce under an administration agreement and are included in administrative and office facilities and legal expenses.
COMPENSATING BALANCE CREDITS:
The Funds have arrangements with their custodian bank and transfer agent, whereby a portion of the custodian’s fee and transfer agent’s fee is paid indirectly by credits earned on a Fund’s cash on deposit with the bank and transfer agent. These deposit arrangements are an alternative to purchasing overnight investments. Conversely, a Fund pays interest to the custodian on any cash overdrafts, to the extent they are not offset by credits earned on positive cash balances.
LINE OF CREDIT:
The Funds, along with certain other Royce Funds, participate in a $65 million line of credit (“Credit Agreement”) with State Street Bank and Trust Company to be used for temporary or emergency purposes. This revolving Credit Agreement expires on October 8, 2021. Pursuant to the Credit Agreement, each participating Fund is liable for a portion of the commitment fee for the credit facility and for principal and interest payments related to borrowings made by that Fund. Borrowings under the Credit Agreement bear interest at a variable rate equal to the Applicable Rate plus the Applicable Margin. The term Applicable Rate means, for any day, a rate equal to the sum of (a) 0.10%, plus (b) the higher of (i) the Federal Funds Effective Rate for such day, or (ii) the Overnight Bank Funding Rate for such day. The term Applicable Margin means 1.25%. The Funds did not utilize the line of credit during the year ended December 31, 2020.
22 | Royce Capital Fund 2020 Annual Report to Shareholders
Capital Share Transactions (in shares):
| | | SHARES SOLD | | SHARES ISSUED FOR REINVESTMENT
OF DISTRIBUTIONS | | SHARES REDEEMED | | NET INCREASE (DECREASE) IN
SHARES OUTSTANDING |
| | | Year Ended
12/31/20 | | Year Ended
12/31/19 | | Year Ended
12/31/20 | | Year Ended
12/31/19 | | Year Ended
12/31/20 | | Year Ended
12/31/19 | | Year Ended
12/31/20 | | Year Ended
12/31/19 |
| Micro-Cap Portfolio | | | | | | | | | | | | | | | | | | | | | | | | | | | | | |
| Investment Class | | | 1,277,467 | | | | 1,027,456 | | | | 150,556 | | | | 1,230,597 | | | | (3,709,748 | ) | | | (2,926,998 | ) | | | (2,281,725 | ) | | | (668,945 | ) |
| Service Class | | | 1,364,196 | | | | 1,716,087 | | | | 33,180 | | | | 259,748 | | | | (1,825,235 | ) | | | (800,434 | ) | | | (427,859 | ) | | | 1,175,401 | |
| Small-Cap Portfolio | | | | | | | | | | | | | | | | | | | | | | | | | | | | | |
| Investment Class | | | 3,859,356 | | | | 1,764,136 | | | | 537,600 | | | | 2,624,637 | | | | (4,807,942 | ) | | | (5,015,894 | ) | | | (410,986 | ) | | | (627,121 | ) |
| Service Class | | | 14,258,227 | | | | 35,891,966 | | | | 669,250 | | | | 3,412,461 | | | | (14,694,441 | ) | | | (24,726,900 | ) | | | 233,036 | | | | 14,577,527 | |
Investment Adviser and Distributor:
INVESTMENT ADVISER:
On July 31, 2020, Franklin Resources, Inc. (“Franklin Resources”) acquired Legg Mason, Inc. in an all-cash transaction. As a result of the transaction, Royce, the investment adviser to each Fund, became an indirect, majority-owned subsidiary of Franklin Resources. Under the Investment Company Act of 1940, consummation of the transaction automatically terminated the investment advisory agreement that was in place for the Funds prior to the transaction. Royce continues to provide uninterrupted services to the Funds pursuant to a new investment advisory agreement that was approved by the Funds’ shareholders. The terms and conditions of the new investment advisory agreement for each Fund are substantially identical to those of its prior investment advisory agreement. The Funds’ contractual investment advisory fee rates under the new investment advisory agreement did not change from the prior investment advisory agreement. Royce has continued to operate as an independent investment organization with its own brand after completion of the transaction. There have been no changes to the management or investment teams at Royce as a result of the transaction.
Under the Trust’s investment advisory agreements with Royce, Royce is entitled to receive investment advisory fees in respect of each Fund that are computed daily and payable monthly. Royce has contractually agreed, without right of termination, to waive fees and/or reimburse expenses (excluding brokerage commissions, taxes, interest, litigation expenses, acquired fund fees and expenses, and other expenses not borne in the ordinary course of business) to the extent necessary to maintain the Funds’ net annual operating expense ratios at specified levels through April 30, 2021, and is shown below to the extent that it impacted net expenses for the year ended December 31, 2020. See the Prospectus for contractual waiver expiration dates.
| | | | | | COMMITTED NET ANNUAL OPERATING
EXPENSE RATIO CAP1 | | | YEAR ENDED DECEMBER 31, 2020 | |
| | |
ANNUAL CONTRACTUAL
ADVISORY FEE AS A PERCENTAGE OF AVERAGE
NET ASSETS | | | Investment Class1 | | | Service Class1 | | | Net advisory fees | | | Advisory fees waived | |
| Micro-Cap Portfolio | | | 1.25% | | | | 1.33% | | | | 1.58% | | | $ | 1,559,325 | | | $ | 87,217 | |
| Small-Cap Portfolio | | | 1.00% | | | | 1.08% | | | | 1.33% | | | | 2,447,343 | | | | 139,873 | |
1Committed net annual operating expense ratio cap excludes acquired fund fees and expenses.
DISTRIBUTOR:
Royce Fund Services, LLC (“RFS”), the distributor of the Trust’s shares, is a wholly owned subsidiary of Royce. RFS is entitled to receive distribution fees from each Fund’s Service Class that are computed daily and payable monthly, at an annual rate of 0.25% of the average net assets of each Class. For the year ended December 31, 2020, Micro-Cap Portfolio-Service Class recorded distribution fees of $50,794 and Small-Cap Portfolio-Service Class recorded distribution fees of $310,052.
Purchases and Sales of Investment Securities:
For the year ended December 31, 2020, the costs of purchases and the proceeds from sales of investment securities, other than short-term securities and collateral received for securities loaned, were as follows:
| | | PURCHASES | | | SALES | |
| Micro-Cap Portfolio | | $ | 32,251,965 | | | $ | 46,209,660 | |
| Small-Cap Portfolio | | | 241,146,682 | | | | 238,399,333 | |
Cross trades were executed by the Funds pursuant to Rule 17a-7 under the 1940 Act. Cross trading is the buying or selling of portfolio securities between funds to which Royce serves as investment adviser. The Trust’s Chief Compliance Officer reviews such transactions each quarter for compliance with the requirements and restrictions set forth by Rule 17a-7, and reports the results of her review to the Board of Trustees. Cross trades for the year ended December 31, 2020, were as follows:
| | | COSTS OF PURCHASES | | PROCEEDS FROM SALES | | REALIZED GAIN (LOSS) |
| Micro-Cap Portfolio | | | $238,225 | | | | $782,739 | | | | $156,364 | |
Royce Capital Fund 2020 Annual Report to Shareholders | 23
Notes to Financial Statements (continued)
Class Specific Expenses:
Class specific expenses were as follows for the year ended December 31, 2020:
| | | DISTRIBUTION
FEES | | | SHAREHOLDER
SERVICING | | | SHAREHOLDER
REPORTS | | | TRANSFER AGENT
BALANCE CREDITS | | | TOTAL | | | CLASS LEVEL
EXPENSES
REIMBURSED BY
INVESTMENT
ADVISER | |
| Micro-Cap Portfolio – Investment Class | | $ | – | | | $ | 8,036 | | | $ | 73,137 | | | $ | (39 | ) | | $ | 81,134 | | | $ | 81,134 | |
| Micro-Cap Portfolio – Service Class | | | 50,794 | | | | 7,034 | | | | 9,635 | | | | (16 | ) | | | 67,447 | | | | 16,228 | |
| | | | 50,794 | | | | 15,070 | | | | 82,772 | | | | (55 | ) | | | | | | | 97,362 | |
| Small-Cap Portfolio – Investment Class | | | – | | | | 7,668 | | | | 62,631 | | | | (31 | ) | | | 70,268 | | | | 70,268 | |
| Small-Cap Portfolio – Service Class | | | 310,052 | | | | 7,053 | | | | 57,400 | | | | (13 | ) | | | 374,492 | | | | 57,415 | |
| | | | 310,052 | | | | 14,721 | | | | 120,031 | | | | (44 | ) | | | | | | | 127,683 | |
Tax Information:
At December 31, 2020, net unrealized appreciation (depreciation) based on identified cost for tax purposes was as follows:
| | | | | | | | | GROSS UNREALIZED | |
| | | TAX BASIS COST | | | NET UNREALIZED
APPRECIATION (DEPRECIATION) | | | Appreciation | | | Depreciation | |
| Micro-Cap Portfolio | | | $109,110,147 | | | | $54,005,955 | | | | $62,701,777 | | | | $8,695,822 | |
| Small-Cap Portfolio | | | 285,377,572 | | | | 71,312,799 | | | | 75,974,976 | | | | 4,662,177 | |
The primary causes of the difference between book and tax basis cost are the timing of the recognition of losses on securities sold and investments in publicly traded partnerships.
Distributions during the years ended December 31, 2020 and 2019, were characterized as follows for tax purposes:
| | | ORDINARY INCOME | | LONG-TERM CAPITAL GAINS |
| | | | 2020 | | | | 2019 | | | | 2020 | | | | 2019 | |
| Micro-Cap Portfolio | | $ | – | | | $ | – | | | $ | 2,096,662 | | | $ | 14,178,235 | |
| Small-Cap Portfolio | | | 2,911,798 | | | | 12,963,882 | | | | 5,766,996 | | | | 35,503,482 | |
The tax basis components of distributable earnings at December 31, 2020, were as follows:
| | | UNDISTRIBUTED
ORDINARY INCOME | | | UNDISTRIBUTED
LONG-TERM CAPITAL
GAINS OR
(CAPITAL LOSS
CARRYFORWARD) | | | NET UNREALIZED
APPRECIATION
(DEPRECIATION)1 | | | TOTAL DISTRIBUTABLE
EARNINGS | | | CAPITAL LOSS
CARRYFORWARD
UTILIZED | |
| Micro-Cap Portfolio | | | $– | | | | $8,171,741 | | | | $54,005,933 | | | | $62,177,674 | | | | $– | |
| Small-Cap Portfolio | | | 4,766,860 | | | | (67,210,954 | ) | | | 71,309,181 | | | | 8,865,087 | | | | – | |
1 Includes timing differences on foreign currency, recognition of losses on securities sold and investments in Real Estate Investment Trusts and publicly traded partnerships.
For financial reporting purposes, capital accounts and distributions to shareholders are adjusted to reflect the tax character of permanent book/tax differences. For the year ended December 31, 2020, the Funds recorded the following permanent reclassifications, which relate primarily to current net operating losses and investments in publicly traded partnerships. Results of operations and net assets were not affected by these reclassifications.
| | | TOTAL DISTRIBUTABLE
EARNINGS (LOSS) | | PAID-IN
CAPITAL |
| Micro-Cap Portfolio | | | $645,480 | | | | $(645,480 | ) |
| Small-Cap Portfolio | | | 1,960 | | | | (1,960 | ) |
Management has analyzed the Funds’ tax positions taken on federal income tax returns for all open tax years (2017 – 2020) and has concluded that as of December 31, 2020, no provision for income tax is required in the Funds’ financial statements.
Subsequent Events:
Subsequent events have been evaluated through the date the financial statements were issued.
24 | Royce Capital Fund 2020 Annual Report to Shareholders
Report of Independent Registered Public Accounting Firm
To the Board of Trustees of Royce Capital Fund and Shareholders of Royce Capital Fund – Micro-Cap Portfolio and Royce Capital Fund – Small-Cap Portfolio:
Opinions on the Financial Statements
We have audited the accompanying statements of assets and liabilities, including the schedules of investments, of Royce Capital Fund – Micro-Cap Portfolio and Royce Capital Fund – Small-Cap Portfolio (constituting Royce Capital Fund, hereafter collectively referred to as the "Funds") as of December 31, 2020, the related statements of operations for the year ended December 31, 2020, the statements of changes in net assets for each of the two years in the period ended December 31, 2020, including the related notes, and the financial highlights for each of the five years in the period ended December 31, 2020 (collectively referred to as the “financial statements”). In our opinion, the financial statements present fairly, in all material respects, the financial position of each of the Funds as of December 31, 2020, the results of each of their operations for the year then ended, the changes in each of their net assets for each of the two years in the period ended December 31, 2020 and each of the financial highlights for each of the five years in the period ended December 31, 2020 in conformity with accounting principles generally accepted in the United States of America.
Basis for Opinions
These financial statements are the responsibility of the Funds’ management. Our responsibility is to express an opinion on the Funds’ financial statements based on our audits. We are a public accounting firm registered with the Public Company Accounting Oversight Board (United States) (PCAOB) and are required to be independent with respect to the Funds in accordance with the U.S. federal securities laws and the applicable rules and regulations of the Securities and Exchange Commission and the PCAOB.
We conducted our audits of these financial statements in accordance with the standards of the PCAOB. Those standards require that we plan and perform the audit to obtain reasonable assurance about whether the financial statements are free of material misstatement, whether due to error or fraud.
Our audits included performing procedures to assess the risks of material misstatement of the financial statements, whether due to error or fraud, and performing procedures that respond to those risks. Such procedures included examining, on a test basis, evidence regarding the amounts and disclosures in the financial statements. Our audits also included evaluating the accounting principles used and significant estimates made by management, as well as evaluating the overall presentation of the financial statements. Our procedures included confirmation of securities owned as of December 31, 2020 by correspondence with the custodian and brokers; when replies were not received from brokers, we performed other auditing procedures. We believe that our audits provide a reasonable basis for our opinions.
/s/PricewaterhouseCoopers LLP
New York, New York
February 12, 2021
We have served as the auditor of one or more investment companies in the Franklin Templeton Group of Funds since 1948.
Royce Capital Fund 2020 Annual Report to Shareholders | 25
Understanding Your Fund’s Expenses (unaudited)
As a shareholder of a mutual fund, you pay ongoing expenses, including management fees and other Fund expenses including, for some funds, distribution and/or service (12b-1) fees. Using the information below, you can estimate how these ongoing expenses (in dollars) affect your investment and compare them with the ongoing expenses of other funds. You may also incur one-time transaction expenses which are not shown in this section and would result in higher total costs. The example is based on an investment of $1,000 invested at July 1, 2020, and held for the entire six-month period ended December 31, 2020. Service Class shares are generally available only through certain insurance companies who receive service fees from the Fund for services that they perform.
Actual Expenses
The first part of the table below provides information about actual account values and actual expenses. You may use the information in this section, together with the amount you invested, to estimate the expenses that you paid over the period. Simply divide your account value at December 31, 2020, by $1,000 (for example, an $8,600 account value divided by $1,000 = 8.6), then multiply the result by the number under the heading entitled “Expenses Paid During the Period” to estimate the expenses you paid on your account during this period.
Hypothetical Example for Comparison Purposes
The second part of the table below provides information about hypothetical account values and hypothetical expenses based on the Fund’s actual expense ratio and an assumed rate of return of 5% per year before expenses, which is not the Fund’s actual return. The hypothetical account values and expenses may not be used to estimate the actual ending account balance or expenses you paid for the period. You may use this information to compare the ongoing costs of investing in the Fund and other funds. To do so, compare this 5% hypothetical example with the 5% hypothetical examples that appear in the shareholder reports of the other funds.
Please note that the expenses shown in the table are meant to highlight your ongoing costs only and do not reflect any transactional costs, such as sales charges (loads), redemption fees, or exchange fees. Therefore, this section is useful in comparing ongoing costs only, and will not help you determine the relative total costs of owning different funds. In addition, if these transactional costs were included, your costs would have been higher.
| | | ACTUAL | | | HYPOTHETICAL (5% PER YEAR BEFORE EXPENSES) | |
| | | Beginning Account
Value 7/1/20 | | | Ending Account Value
12/31/20 | | | Expenses Paid During
the Period1 | | | Beginning Account
Value 7/1/20 | | | Ending Account Value
12/31/20 | | | Expenses Paid During
the Period1 | | | Annualized Expense
Ratio2 | |
| Investment Class | | | | | | | | | | | | | | | | | | | | | | | | | | | | |
| Micro-Cap Portfolio | | $ | 1,000.00 | | | $ | 1,396.96 | | | $ | 8.01 | | | $ | 1,000.00 | | | $ | 1,018.45 | | | $ | 6.75 | | | | 1.33 | % |
| Small-Cap Portfolio | | | 1,000.00 | | | | 1,297.66 | | | | 6.24 | | | | 1,000.00 | | | | 1,019.71 | | | | 5.48 | | | | 1.08 | % |
| Service Class | | | | | | | | | | | | | | | | | | | | | | | | | | | | |
| Micro-Cap Portfolio | | | 1,000.00 | | | | 1,396.57 | | | | 9.52 | | | | 1,000.00 | | | | 1,017.19 | | | | 8.01 | | | | 1.58 | % |
| Small-Cap Portfolio | | | 1,000.00 | | | | 1,297.75 | | | | 7.68 | | | | 1,000.00 | | | | 1,018.45 | | | | 6.75 | | | | 1.33 | % |
| 1 | Expenses are equal to the Fund's annualized expense ratio multiplied by the average account value for the period, multiplied by 184 days in the most recent fiscal half-year divided by 366 days (to reflect the half-year period). This information does not include fees or expenses of the variable annuity contracts investing in the Fund. |
| 2 | Annualized expense ratio used to derive figures in the table is based on the most recent fiscal half-year. |
Federal Tax Information
In January 2021, taxable shareholders were mailed a Form 1099-DIV reporting the federal tax status of all distributions paid during the calendar year 2020.
2020 Supplemental Tax Information:
| FUND | | %
QDI | | % U.S. GOVT
INCOME | | % INCOME QUALIFYING
FOR DRD | | LONG-TERM CAPITAL GAIN DISTRIBUTION
MAXIMUM ALLOWABLE
(OOO’s) |
| Micro-Cap Portfolio | | | 0.00 | % | | | N/A | | | 0.00 | % | | | $2,097 | |
| Small-Cap Portfolio | | | 100.00 | % | | | N/A | | | 100.00 | % | | | 5,767 | |
Definitions:
% QDI: Qualified Dividend Income; % of net investment income and/or short-term capital gains distributions that qualify for treatment at long-term capital gain rates.
% U.S. Govt Income: % of investment income paid from U.S. Government obligations.
% Income Qualifying for DRD: % of investment income eligible for the corporate dividend received deduction.
26 | Royce Capital Fund 2020 Annual Report to Shareholders
Trustees and Officers
All Trustees and Officers may be reached c/o The Royce Funds, 745 Fifth Avenue, New York, NY 10151
Christopher D. Clark, Trustee1, President
Age: 55 | Number of Funds Overseen: 16 | Tenure: Since 2014
Principal Occupation(s) During Past Five Years: Chief Executive Officer (since July 2016), President (since July 2014), Co-Chief Investment Officer (since January 2014), Managing Director of Royce, a Member of the Board of Managers of Royce, having been employed by Royce since May 2007.
Patricia W. Chadwick, Trustee
Age: 72 | Number of Funds Overseen: 16 | Tenure: Since 2009
Non-Royce Directorships: Trustee of Voya Mutual Funds and Director of Wisconsin Energy Corp.
Principal Occupation(s) During Past 5 Years: Consultant and President of Ravengate Partners LLC (since 2000).
Christopher C. Grisanti, Trustee
Age: 59 | Number of Funds Overseen: 16 | Tenure: Since 2017
Non-Royce Directorships: None
Principal Occupation(s) During Past Five Years: Chief Equity Strategist and Senior Portfolio Manager at MAI Capital Management LLC, an investment advisory firm (since May 2020). Previously, Mr. Grisanti was Co-Founder and Chief Executive Officer of Grisanti Capital Management LLC, an investment advisory firm (from 1999 to 2020). Mr. Grisanti’s prior business experience also includes serving as Director of Research and Portfolio Manager at Spears Benzak, Salomon & Farrell (from 1994 to 1999) and a senior associate at the law firm of Simpson, Thacher & Bartlett (from 1988 to 1994).
Cecile B. Harper, Trustee2
Age: 57 | Number of Funds Overseen: 16 | Tenure: Since 2020
Non-Royce Directorships: None
Principal Occupation(s) During Past Five Years: Board Member of Pyramid Peak Foundation (since January 2012); and Chief Operating Officer at the College Foundation at the University of Virginia (since October 2019). Ms. Harper’s prior business experience includes serving as Principal of Southeastern Asset Management (from December 1993 to September 2019); and a Board Member of Regional One Health Foundation (from June 2013 to September 2019).
Arthur S. Mehlman, Trustee
Age: 78 | Number of Funds Overseen: 36 | Tenure: Since 2004
Non-Royce Directorships: Director/Trustee of registered investment companies constituting the 20 Legg Mason Funds.
Principal Occupation(s) During Past Five Years: Director of The League for People with Disabilities, Inc.; Director of University of Maryland Foundation (non-profits). Formerly: Director of Municipal Mortgage & Equity, LLC (from October 2004 to April 1, 2011); Director of University of Maryland College Park Foundation (non-profit) (from 1998 to 2005); Partner, KPMG LLP (international accounting firm) (from 1972 to 2002); Director of Maryland Business Roundtable for Education (from July 1984 to June 2002).
G. Peter O’Brien, Trustee
Age: 74 | Number of Funds Overseen: 36 | Tenure: Since 2001
Non-Royce Directorships: Director/Trustee of registered investment companies constituting the 20 Legg Mason Funds.
Principal Occupation(s) During Past Five Years: Trustee Emeritus of Colgate University (since 2005); Board Member of Hill House, Inc. (since 1999); Formerly Director of TICC Capital Corp (from 2003-2017): Trustee of Colgate University (from 1996 to 2005), President of Hill House, Inc. (from 2001 to 2005) and Managing Director/Equity Capital Markets Group of Merrill Lynch & Co. (from 1971 to 1999).
Michael K. Shields, Trustee
Age: 62 | Number of Funds Overseen: 16 | Tenure: Since 2015
Principal Occupation(s) During Past Five Years: President and Chief Executive Officer of Piedmont Trust Company, a private North Carolina trust company (since May 2012). Mr. Shields’s prior business experience includes owning Shields Advisors, an investment consulting firm (from April 2010 to June 2012).
Francis D. Gannon, Vice President
Age: 53 | Tenure: Since 2014
Principal Occupation(s) During Past Five Years: Co-Chief Investment Officer (since January 2014) and Managing Director of Royce, having been employed by Royce since September 2006.
Daniel A. O’Byrne, Vice President
Age: 58 | Tenure: Since 1994
Principal Occupation(s) During Past Five Years: Principal and Vice President of Royce, having been employed by Royce since October 1986.
Peter K. Hoglund, Treasurer
Age: 54 | Tenure: Since 2015
Principal Occupation(s) During Past Five Years: Chief Financial Officer, Chief Administrative Officer, and Managing Director of Royce, having been employed by Royce since December 2014. Prior to joining Royce, Mr. Hoglund spent more than 20 years with Munder Capital Management in Birmingham, MI, serving as Managing Director and Chief Financial Officer and overseeing all financial aspects of the firm. He began his career at Munder as a portfolio manager.
John E. Denneen, Secretary and Chief Legal Officer
Age: 53 | Tenure: 1996-2001 and Since 2002
Principal Occupation(s) During Past Five Years: General Counsel, Managing Director, and, since June 2015, a Member of the Board of Managers of Royce. Chief Legal and Compliance Officer and Secretary of Royce.
Lisa Curcio, Chief Compliance Officer
Age: 61 | Tenure: Since 2004
Principal Occupation(s) During Past Five Years: Chief Compliance Officer of The Royce Funds (since October 2004) and Compliance Officer of Royce (since June 2004).
1 Interested Trustee.
2 Became a trustee effective as of the close of business on September 24, 2020.
Trustees will hold office until their successors have been duly elected and qualified or until their earlier resignation or removal. The Statement of Additional Information, which contains additional information about the Trust’s trustees and officers, is available and can be obtained without charge at www.royceinvest.com or by calling (800) 221-4268.
Royce Capital Fund 2020 Annual Report to Shareholders | 27
Notes to Performance and Other Important Information
The thoughts expressed in this report concerning recent market movements and future prospects for small company stocks are solely the opinion of Royce at December 31, 2020, and, of course, historical market trends are not necessarily indicative of future market movements. Statements regarding the future prospects for particular securities held in the Funds’ portfolios and Royce’s investment intentions with respect to those securities reflect Royce’s opinions as of December 31, 2020 and are subject to change at any time without notice. There can be no assurance that securities mentioned in this report will be included in any Royce-managed portfolio in the future.
Sector weightings are determined using the Global Industry Classification Standard (“GICS”). GICS was developed by, and is the exclusive property of, Standard & Poor’s Financial Services LLC (“S&P”) and MSCI Inc. (“MSCI”). GICS is the trademark of S&P and MSCI. “Global Industry Classification Standard (GICS)” and “GICS Direct” are service marks of S&P and MSCI.
All indexes referenced are unmanaged and capitalization weighted. Each index’s returns include net reinvested dividends and/or interest income. Frank Russell Company (“Russell”) is the source and owner of the trademarks, service marks and copyrights related to the Russell Indexes. Russell® is a trademark of Frank Russell Company. Neither Russell nor its licensors accept any liability for any errors or omissions in the Russell Indexes and/or Russell ratings or underlying data and no party may rely on any Russell Indexes and/or Russell ratings and/or underlying data contained in this communication. No further distribution of Russell Data is permitted without Russell’s express written consent. Russell does not promote, sponsor or endorse the content of this communication. The Russell 2000 is an index of domestic small-cap stocks. It measures the performance of the 2,000 smallest publicly traded U.S. companies in the Russell 3000 Index. The Russell 2000 Value and Growth Indexes consist of the respective value and growth stocks within the Russell 2000 as determined by Russell Investments. The Russell Microcap Index includes 1,000 of the smallest securities in the small-cap Russell 2000 Index along with the next smallest eligible securities as determined by Russell. The Russell 1000 Index is an index of domestic large-cap stocks. It measures the performance of the 1,000 publicly traded U.S. companies in the Russell 3000 Index. The Russell 2000 Pure Value Index is an unmanaged index composed of securities with strong value characteristics selected from the Russell 2000 Index. Securities are weighted based on their style score. The Russell 2000 Pure Growth Index is an unmanaged index composed of securities with strong growth characteristics selected from the Russell 2000 Index. Securities are weighted based on their style score. The (Center for Research in Security Prices) CRSP (Center for Research in Security Pricing) equally divides the companies listed on the NYSE into 10 deciles based on market capitalization. Deciles 1-5 represent the largest domestic equity companies and Deciles 6-10 represent the smallest. CRSP then sorts all listed domestic equity companies based on these market cap ranges. By way of comparison, the CRSP 1-5 would have similar capitalization parameters to the S&P 500 and the CRSP 6-10 would have similar capitalization parameters to those of the Russell 2000. The Nasdaq 100 is an unmanaged, capitalization-weighted index. It measures the performance of the 100 largest domestic and international non-financial companies listed on the Nasdaq Stock Market based on market capitalization. The performance of an index does not represent exactly any particular investment, as you cannot invest directly in an index. Returns for the market indexes used in this report were based on information supplied to Royce by Russell Investments. Royce has not independently verified the above described information.
The Price-Earnings, or P/E, Ratio is calculated by dividing a company’s share price by its trailing 12-month earnings-per-share (EPS). The Price-to-Book, or P/B, Ratio is calculated by dividing a company’s share price by its book value per share. Standard deviation is a statistical measure within which a fund’s total returns have varied over time. The greater the standard deviation, the greater a fund’s volatility. The Morningstar Style Map uses proprietary scores of a stock’s value and growth characteristics to determine its placement in one of the five categories listed on the horizontal axis. These characteristics are then compared to those of other stocks within the same market capitalization band. Each is scored from zero to 100 for both value and growth attributes. The value score is subtracted from the growth score to determine the overall style score. For the vertical, market cap axis, Morningstar subdivides into size groups. Giant-cap stocks are defined as those that account for the top 40% of the capitalization of each style zone; large-cap stocks represent the next 30%; mid-cap stocks the next 20%; small-cap stocks the next 7%; micro-cap stocks the smallest 3%. Standard deviation is a statistical measure within which a fund’s total returns have varied over time. The greater the standard deviation, the greater a fund’s volatility. The value score is subtracted from the growth score to determine the overall style score. Cyclical and Defensive are defined as follows: Cyclical: Communication Services, Consumer Discretionary, Energy, Financials, Industrials, Information Technology, and Materials. Defensive: Consumer Staples, Health Care, Real Estate, and Utilities. The Royce Funds is a service mark of The Royce Funds. Distributor: Royce Fund Services, LLC.
Royce Capital Fund–Micro-Cap Portfolio invests primarily in securities of micro-cap companies and Royce Capital Fund–Small-Cap Portfolio invests primarily in securities of small-cap companies. Investments in these types of companies may involve considerably more risk than investments in securities of larger-cap companies. (Please see “Primary Risks for Fund Investors” in the prospectus.) Royce Capital Fund–Micro-Cap Portfolio and Royce Capital Fund– Small-Cap Portfolio may each invest up to 25% its assets in foreign securities that may involve political, economic, currency, and other risks not encountered in U.S. investments. (Please see “Investing in Foreign Securities” in the prospectus.) A Fund that invests a significant portion of its assets in a limited number of stocks may be subject to considerably more risk than a more broadly diversified Fund because a decline in the value of any of these stocks would cause that Fund’s overall value to decline to a greater degree. A broadly diversified portfolio does not, however, ensure a profit for a Fund or guarantee against loss. Please read the prospectus carefully before investing or sending money. A copy of the Funds’ current prospectus and a Statement of Additional Information may be obtained by calling (800) 221-4268 or by visiting www.royceinvest.com. All publicly released material Fund information is disclosed by the Funds on their website at www.royceinvest.com.
Forward-Looking Statements
This material contains forward-looking statements within the meaning of the Securities Exchange Act of 1934, as amended (the “Exchange Act”), that involve risks and uncertainties, including, among others, statements as to:
| ● | the Funds’ future operating results, |
| ● | the prospects of the Funds’ portfolio companies, |
28 | Royce Capital Fund 2020 Annual Report to Shareholders
Notes to Performance and Other Important Information (continued)
| ● | the impact of investments that the Funds have made or may make, |
| ● | the dependence of the Funds’ future success on the general economy and its impact on the companies and industries in which the Funds invest, and |
| ● | the ability of the Funds’ portfolio companies to achieve their objectives. |
This review and report use words such as “anticipates,” “believes,” “expects,” “future,” “intends,” and similar expressions to identify forward-looking statements. Actual results may differ materially from those projected in the forward-looking statements for any reason.
The Royce Funds have based the forward-looking statements included in this review and report on information available to us on the date of the report, and we assume no obligation to update any such forward-looking statements. Although The Royce Funds undertake no obligation to revise or update any forward-looking statements, whether as a result of new information, future events, or otherwise, you are advised to consult any additional disclosures that we may make through future shareholder communications or reports.
Proxy Voting
A copy of the policies and procedures that The Royce Funds use to determine how to vote proxies relating to portfolio securities and information regarding how each of The Royce Funds voted proxies relating to portfolio securities during the most recent 12-month period ended June 30 is available, without charge, on The Royce Funds’ website at www.royceinvest.com, by calling (800) 221-4268 (toll-free), and on the website of the Securities and Exchange Commission (“SEC”) at www.sec.gov.
Disclosure of Portfolio Holdings
The Funds’ complete portfolio holdings are also available on Exhibit F to Form N-PORT, which filings are made with the SEC within 60 days of the end of the first and third fiscal quarters. The Funds’ Form N-PORT filings are available on the SEC’s website at http://www.sec.gov.
Royce Capital Fund 2020 Annual Report to Shareholders | 29
Results of Shareholders Meeting
At a Special Meeting of Shareholders convened virtually on July 14, 2020, the shareholders of each of Royce Capital Fund−Micro-Cap Portfolio and Royce Capital Fund−Small-Cap Portfolio approved a new investment advisory agreement between the Fund and Royce & Associates, LP with respect to such Portfolios.
| | FOR | AGAINST | ABSTAIN |
| Royce Capital Fund Micro-Cap Portfolio | 12,073,810 | 241,923 | 708,478 |
| | | | |
| Royce Capital Fund Small-Cap Portfolio | 32,030,096 | 362,784 | 2,174,570 |
| | | | |
At the 2020 Annual Meeting of Shareholders convened virtually on September 24, 2020, the Fund's shareholders elected seven Trustees, consisting of:
| | VOTES FOR | VOTES WITHHELD |
| Christopher D. Clark | 47,025,086 | 2,012,945 |
| | | |
| Patricia W. Chadwick | 46,887,234 | 2,150,797 |
| | | |
| Christopher C. Grisanti | 47,028,631 | 2,009,401 |
| | | |
| Cecile B. Harper | 47,093,627 | 1,944,405 |
| | | |
| Arthur S. Mehlman | 46,726,201 | 2,311,831 |
| | | |
| G. Peter O’Brien | 46,750,947 | 2,287,084 |
| | | |
| Michael K. Shields | 46,926,228 | 2,111,803 |
| | | |
30 | Royce Capital Fund 2020 Annual Report to Shareholders
This page is intentionally left blank.
Royce Capital Fund 2020 Annual Report to Shareholders | 31
This page is intentionally left blank.
32 | Royce Capital Fund 2020 Annual Report to Shareholders
| | | | | |
| | | | | |
| | | | | |
| | | | | |
| | | | | |
| | | | | |
| | | | | |
| | | | | |
| | | | | |
| | | | | |
| | | | | |
| | | | | |
| | | | | |
| | | | | |
| | | | | |
| | | | | |
| | | | | |
| | | | | |
| | | | | |
| | | | | |
| |  | | | |
 | |
| | | | | |
| | About Royce Investment Partners | | Contact Us | |
| | | | | |
| | Unparalleled Knowledge + Experience | | GENERAL INFORMATION | |
| | Pioneers in small-cap investing, with 45+ years | | Additional Report Copies and Prospectus Inquiries | |
| | of experience, depth of knowledge, and focus. | | (800) 221-4268 | |
| | | | | |
| | Independent Thinking | | | |
| | The confidence to go against consensus, the insight | | | |
| | to uncover opportunities others might miss, and the | | | |
| | tenacity to stay the course through market cycles. | | | |
| | | | | |
| | Specialized Approaches | | | |
| | U.S., international, and global investment strategies | | | |
| | that pursue approaches with different risk profiles. | | | |
| | | | | |
| | Unwavering Commitment | | | |
| | Our team of 18 portfolio managers has significant | | | |
| | personal investments in the strategies they manage. | | | |
| | | | | |
| | | | | |
| | | | | |
| | | | | |
| | | | | |
| | | | | |
| | | | | |
| | | | | |
| |  | |  | |
| | | | RCF-REP-1220 | |
| | | | | |
| | | | | |
Item 2. Code(s) of Ethics. As of the end of the period covered by this report, the Registrant had adopted a code of ethics, as defined in Item 2 of Form N-CSR, applicable to its principal executive officer, principal financial officer, principal accounting officer or controller, or persons performing similar functions. A copy of this code of ethics is filed as an exhibit to this Form N-CSR. No substantive amendments were approved or waivers were granted to this code of ethics during the period covered by this report.
Item 3. Audit Committee Financial Expert.
| (a)(1) | The Board of Trustees of the Registrant has determined that it has an audit committee financial expert. |
| (a)(2) | Arthur S. Mehlman and Patricia W. Chadwick were designated by the Board of Trustees as the Registrant’s Audit Committee Financial Experts, effective April 15, 2004 and April 8, 2010, respectively. Mr. Mehlman and Ms. Chadwick are “independent” as defined under Item 3 of Form N-CSR. |
Item 4. Principal Accountant Fees and Services.
Year ended December 31, 2020 - $44,812
Year ended December 31, 2019 - $43,933
Year ended December 31, 2020 - $0
Year ended December 31, 2019 - $0
Year ended December 31, 2020 - $19,122 – Preparation of tax returns and excise tax review
Year ended December 31, 2019 - $18,748 – Preparation of tax returns and excise tax review
Year ended December 31, 2020 - $0
Year ended December 31, 2019 - $0
(e)(1) Annual Pre-Approval: On an annual basis, the Registrant’s independent auditor submits to the Audit Committee a schedule of proposed audit, audit-related, tax and other non-audit services to be rendered to the Registrant and/or investment adviser(s) for the following year that require pre-approval by the Audit Committee. This schedule provides a description of each type of service that is expected to require pre-approval and the maximum fees that can be paid for each such service without further Audit Committee approval. The Audit Committee then reviews and determines whether to approve the types of scheduled services and the projected fees for them. Any subsequent revision to already pre-approved services or fees (including fee increases) are presented for consideration at the next regularly scheduled Audit Committee meeting, as needed.
If subsequent to the annual pre-approval of services and fees by the Audit Committee, the Registrant or one of its affiliates determines that it would like to engage the Registrant’s independent auditor to perform a service not already pre-approved, the request is to be submitted to the Registrant’s Chief Financial Officer, and if he or she determines that the service fits within the independence guidelines (e.g., it is not a prohibited service), he or she will then arrange for a discussion of the proposed service and fee to be included on the agenda for the next regularly scheduled Audit Committee meeting so that pre-approval can be considered.
Interim Pre-Approval: If, in the judgment of the Registrant's Chief Financial Officer, a proposed engagement needs to commence before the next regularly scheduled Audit Committee meeting, he or she shall submit a written summary of the proposed engagement to all members of the Audit Committee, outlining the services, the estimated maximum cost, the category of the services (e.g., audit, audit-related, tax or other) and the rationale for engaging the Registrant’s independent auditor to perform the services. To the extent the proposed engagement involves audit, audit-related or tax services, any individual member of the Audit Committee who is an independent Board member is authorized to pre-approve the engagement. To the extent the proposed engagement involves non-audit services other than audit-related or tax, the Chairman of the Audit Committee is authorized to pre-approve the engagement. The Registrant’s Chief Financial Officer will arrange for this interim review and coordinate with the appropriate member(s) of the Committee. The independent auditor may not commence the engagement under consideration until the Registrant’s Chief Financial Officer has informed the auditor in writing that pre-approval has been obtained from the Audit Committee or an individual member who is an independent Board member. The member of the Audit Committee who pre-approves any engagements in between regularly scheduled Audit Committee meetings is to report, for informational purposes only, any pre-approval decisions to the Audit Committee at its next regularly scheduled meeting.
| (g) | Year ended December 31, 2020 - $19,122 |
Year ended December 31, 2019 - $18,748
| (h) | No such services were rendered during 2020 or 2019. |
Item 5. Audit Committee of Listed Registrants. Not Applicable.
Item 6. Investments.
(a) See Item 1.
(b) Not Applicable
Item 7. Disclosure of Proxy Voting Policies and Procedures for Closed-End Management Investment Companies. Not Applicable.
Item 8. Portfolio Managers of Closed-End Management Investment Companies. Not Applicable.
Item 9. Purchases of Equity Securities by Closed-End Management Investment Company and Affiliated Purchasers. Not Applicable
Item 10. Submission of Matters to a Vote of Security Holders. Not Applicable.
Item 11. Controls and Procedures.
(a) Disclosure Controls and Procedures. The Principal Executive and Financial Officers concluded that the Registrant's Disclosure Controls and Procedures are effective based on their evaluation of the Disclosure Controls and Procedures as of a date within 90 days of the filing date of this report.
(b) Internal Control over Financial Reporting. There were no significant changes in Registrant's internal control over financial reporting or in other factors that could significantly affect this control subsequent to the date of the evaluation, including any corrective actions with regard to significant deficiencies and material weaknesses during the period covered by this report.
Item 12. Exhibits. Attached hereto.
(a)(1) The Registrant’s code of ethics pursuant to Item 2 of Form N-CSR.
(a)(2) Separate certifications by the Registrant’s Principal Executive Officer and Principal Financial Officer as required by Rule 30a-2(a) under the Investment Company Act of 1940.
(a)(3) Not Applicable
(b) Separate certifications by the Registrant’s Principal Executive Officer and Principal Financial Officer, pursuant to Section 906 of the Sarbanes-Oxley Act of 2002 and required by Rule 30a-2(b) under the Investment Company Act of 1940.
Pursuant to the requirements of the Securities Exchange Act of 1934 and the Investment Company Act of 1940, the registrant has duly caused this report to be signed on its behalf by the undersigned, thereunto duly authorized.
ROYCE CAPITAL FUND
| BY: | /s/ Christopher D. Clark | |
| | Christopher D. Clark | |
| | President | |
Date: March 1, 2021
Pursuant to the requirements of the Securities Exchange Act of 1934 and the Investment Company Act of 1940, this report has been signed below by the following persons on behalf of the registrant and in the capacities and on the dates indicated.
| ROYCE CAPITAL FUND | | ROYCE CAPITAL FUND |
| | | | | |
| BY: | /s/ Christopher D. Clark | | BY: | /s/ Peter K. Hoglund |
| | Christopher D. Clark | | | Peter K. Hoglund |
| | President | | | Treasurer |
| | | | | |
| Date: March 1, 2021 | | Date: March 1, 2021 |