UNITED STATES
SECURITIES AND EXCHANGE COMMISSION
Washington, D.C. 20549
FORM N-CSR
CERTIFIED SHAREHOLDER REPORT
OF
REGISTERED MANAGEMENT INVESTMENT COMPANIES
Investment Company Act File Number: 811-07537
Name of Registrant: Royce Capital Fund
Address of Registrant: 745 Fifth Avenue
New York, NY 10151
Name of agent for service: John E. Denneen, Esquire
Address of agent for service: 745 Fifth Avenue
New York, NY 10151
Registrant's telephone number, including area code: (212) 508-4500
Date of fiscal year end: December 31
Date of reporting period: January 1, 2022 – December 31, 2022
| Item 1. | Reports to Shareholders. |

royceinvest.com
Royce Capital Fund 2022 Annual
Review and Report to Shareholders
December 31, 2022
Royce Capital Fund–Micro-Cap Portfolio
Royce Capital Fund–Small-Cap Portfolio

Table of Contents

This page is not part of the Royce Capital Fund 2022 Annual Report to Shareholders | 1
Letter to Our Shareholders

2022: THE MARKET’S ANNUS HORRIBILIS
Most investors were happy to see a miserable 2022 end. In a down year for U.S. equities, both small-and large-cap stocks suffered, with the Russell 2000 Index falling -20.4% while its large-cap sibling, the Russell 1000 Index, declined -19.1%. It was the third-worst calendar year performance for both indexes since their shared inception date of 12/31/78; each posted their lowest respective returns since 2008. The only two years that had lower returns were the same pair for both indexes: 2008 during the Financial Crisis and 2002 through the worst year of the Internet Bubble—which certainly puts the difficulties investors faced last year in context. The tech-heavy Nasdaq Composite fared even worse in 2022, losing -32.5%. Beyond the U.S., results were not much better: the MSCI ACWI ex USA Small Cap Index lost -20.0% for the calendar year, and the MSCI ACWI ex USA Large Cap Index fell -15.3%. Moreover, the double-digit losses were not limited to equities, as the Bloomberg Barclays U.S. Aggregate Bond Index was down -13.0% while its global counterpart, the Bloomberg Barclays Global Aggregate Bond Index, was off -16.2%.
Negative return years for both stocks and bonds are rare occurrences—it’s happened roughly a dozen times since
the Great Depression. The combined double-digit losses for large caps and bonds made 2022 even more exceptional for another, related reason: it was one of the worst years on record for that longstanding staple of diversified portfolios, the 60/40 mix of stocks and bonds. Since the 1930s, the 60/40 split has had double-digit calendar year losses only six times. So, while 2022’s final quarter saw positive results for many equity indexes, the entire year gave most investors “nowhere to run to, nowhere to hide,” beyond certain commodities and the U.S. dollar.
The steep declines for so many different investment vehicles made sense not simply due to the many challenges facing the world, but also because of the now familiar but still dizzying array of contradictory macro developments. On the negative side, we endured ongoing inflation, a decidedly hawkish Fed, the war in Ukraine, and a widely anticipated—though yet to occur—recession. On the positive end, we had strong labor markets and a surprisingly resilient U.S. economy, with real U.S. GDP (Gross Domestic Product) for the third quarter adjusted upward in December from 2.8% to 3.2%—and initial fourth quarter estimates being pegged at 2.8%. Although these figures do not equate to vibrant economic
2 | This page is not part of the Royce Capital Fund 2022 Annual Report to Shareholders
LETTER TO OUR SHAREHOLDERS
growth, they are far from indicating recession. The question is what comes next for stocks? If the bear market’s days are numbered, when will its number be up? While we make no claim to having a definitive answer, we have done our usual rounds of digging into history and current valuations to help us make sense of the present and to see what factors might be signaling a brighter course for small caps as well as for our own investment strategies. In our estimation, it makes sense for the bear to be feeling some high anxiety.
SMALL CAP’S BRIGHT(ER) FUTURE
The -38% decline for the average stock in the Russell 2000 is notable compared to the -27% slide for the average stock in the Russell 1000 from each index’s respective 52-week highs. Moreover, the Russell 2000 fell -31.9% from its peak on 11/8/21 through its most recent low on 6/16/22, while the Russell 1000 lost less from its peak on 1/3/22 through its most recent low on 9/30/22, down -25.0%. In addition, several years of small-cap underperformance have led to the Russell 2000 hitting an extreme point versus the Russell 1000 at year-end: apart from the Covid-related market trough in March of 2020, small caps fell to their lowest weighting in the Russell 3000 Index in more than 20 years on 12/31/22. Finally, and arguably most importantly, the Russell 2000’s valuation remained near its lowest rate in 20 years compared to the Russell 1000’s, based on our preferred valuation metric of the median last 12 months’ enterprise
value to earnings before taxes (LTM EV/EBIT)—even in the immediate aftermath of 2022’s correction.
Both the “Nifty Fifty” market of the early 1970s and the current period were marked by uncertainty and prominent worries of high inflation and recession. The Nifty Fifty was a group of mostly multinational large-cap companies that many believed offered a steady, sure, and safe road to growth—until they were badly bruised in the bear market of 1973-74. In the current period, a perception of safety was reserved until recently for an even smaller number of mega-cap stocks: the “FAAMG” group of Facebook, Apple, Amazon, Microsoft, and Google. Prior to each period’s bear market, the large-cap peak was crowded with these mega-cap stocks—which most recently reached their high in August of 2020. At 2020’s large-cap peak, these five stocks accounted for nearly 25% of the U.S. market’s total capitalization, much as AT&T, Eastman Kodak, Exxon, GM, and IBM did before the sharp correction of the 1970s. The earlier decline was followed by a long run of success for small-cap stocks on both an absolute and relative basis. Combined with small cap’s more favorable valuation and long, historically uncharacteristic period of underperformance, we think the stage is set for the asset class to retake market leadership from large cap.
Another important reversal suggests the likelihood of improved relative results for small caps in coming years: the pivot in Fed policy from the era of zero (or near zero)
Russell 2000 vs. Russell 1000 Median LTM EV/EBIT¹ (ex. Negative EBIT Companies)
From 12/31/02 through 12/31/22
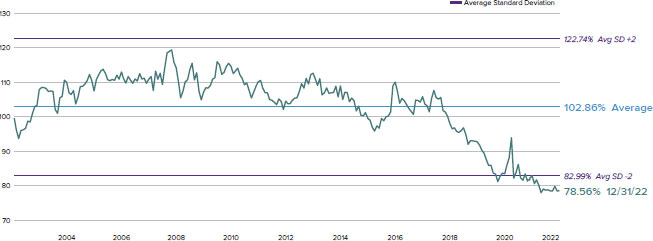
1Earnings before interest and taxes.
Past performance is no guarantee of future results. Source: FactSet
This page is not part of the Royce Capital Fund 2022 Annual Report to Shareholders | 3
LETTER TO OUR SHAREHOLDERS
interest rates and easy money and the knock-on effect of persistent inflation rate hikes and quantitative tightening. For equity investors, this shift means a radically altered investment landscape. We believe those stocks that were the biggest winners under the past decade’s zero interest rate, low inflation, and low nominal growth regime will no longer lead, and that the unfolding macro environment points to small caps being able to sustainably, and not just tactically, outpace large caps.
Further supporting our relative case for small caps is the asset class’s superior record in two varying inflationary climates. A comparison of the average annual U.S. consumer price index (CPI) to returns for the Center for Research in Security Prices (CRSP) 6-10 Index (the small-cap proxy we use when reaching farther back in history than the Russell 2000’s 1979 inception) shows that the CRSP 6-10 beat the CPI in every decade since the 1930s—a claim that cannot be made for large caps. In addition to their long-term historical edge during inflationary periods, small caps tend to be nimbler than large caps, which allows them to potentially act more quickly in a climate of contracting liquidity and Fed tightening. Of course, much of the data is indicating that inflation has peaked, outside of wage inflation which is proving much stickier (and will remain so for as long as the job market stays strong). 2022 saw sharp deflation in several areas. The Baltic Dry Index, which measures the cost of shipping goods worldwide, fell more than 70% from its high in May through the end of December, while lumber, steel, and copper prices also slipped precipitously. We expect this dynamic of persistent wage inflation accompanied by decreased goods inflation to continue. And historically, periods of falling inflations have also given small caps a relative advantage.
IS IT TIME FOR SMALL-CAP SUCCESS?
The performance advantage for large caps over small caps from 2011-2022 was somewhat paralleled by an edge for the Russell 2000 Growth Index over the Russell 2000 Value Index through most of that period. Over the last few years, the market has seen a deep and far-reaching re-rating of growth stocks, an unsurprising development following the Fed’s reversal. To be sure, we saw this most clearly at two ends of the equity market in 2022: in the deeper correction for small-cap growth stocks
Small-Cap (CRSP 6-10) Performance when Inflation is ≥6% and Decreasing vs All Periods
Monthly Average One-Year Returns from 12/31/45 through 12/31/22
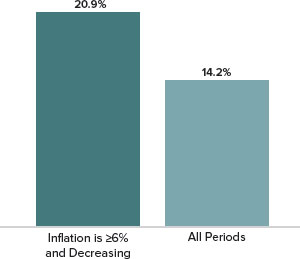
Past performance is no guarantee of future results.
Small-Cap (CRSP 6-10) vs Large-Cap (CRSP 1-5) Performance when Inflation is ≥6% and Decreasing vs All Periods
Monthly Average One-Year Return Spread from 12/31/45 through 12/31/22
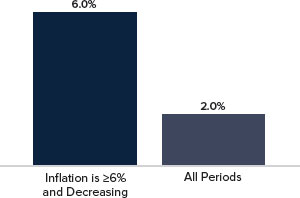
Past performance is no guarantee of future results. Inflation is being measured using The Consumer Price Index (CPI). The CPI is a measure of the average change over time in the prices paid by urban consumers for a market basket of consumer goods and services. Indexes are available for the U.S. and various geographic areas. Average price data for select utility, automotive fuel, and food items are also available.
and in the steep declines for many mega-cap companies we discussed above. To be sure, rising rates and inflation have led to a period of multiple compression that we expect will reorient investors’ attention, to some degree, at least, away from the crowded and uncertain macro environment and onto corporate fundamentals, which we view as an advantage for the kind of conservatively capitalized, free cash flow generating companies that most of our major strategies hold. We saw this in 2022, when quality small caps—defined as those with higher returns on invested capital (ROIC) and earnings—held up better than
4 | This page is not part of the Royce Capital Fund 2022 Annual Report to Shareholders
LETTER TO OUR SHAREHOLDERS
Russell 2000 Value and Growth Shifted Median Relative LTM EV/EBIT1
Russell 2000 Value/Growth from 3/31/00 through 12/31/22
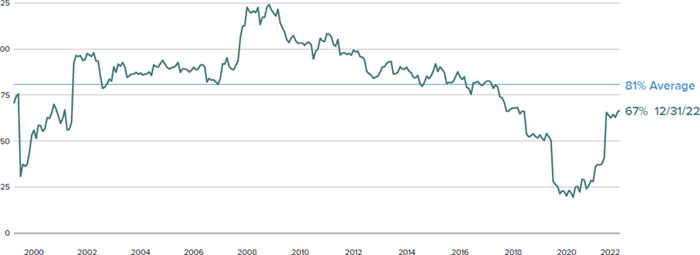
1 Last twelve months Enterprise Value/Earnings Before Interest and Taxes.
Past performance is no guarantee of future results. Source: FactSet
their lower-quality, non-earning siblings in three of 2022’s four quarters, including the fourth quarter’s upswing.
Unsurprisingly, then, the Russell 2000 Value lost significantly less than the Russell 2000 Growth in 2022, -14.5% versus -26.4%. We have been asserting for the last few years that small-cap value would recapture its long-term historical advantage over small-cap growth. One especially revealing support for this idea comes from looking at the five-year annualized return for the Russell 2000 Value as of 12/31/21, which was 9.1% versus a gain of 14.5% for the Russell 2000 Growth—a 540 basis point advantage for the latter. The relative resilience of small-cap value vis-à-vis small-cap growth in 2022 caused this spread to reverse by a considerable amount for the five-year period ended 12/31/22, when the Russell 2000 Value outpaced the growth index, up 4.1% versus 3.5%. Our confidence that value can maintain its performance edge over growth is further rooted in the fact that over all five-year monthly rolling average periods since their shared inception (12/31/78), the advantage was squarely in value’s favor, 11.8% versus 8.8%. Yet at the end of 2022, the Russell 2000 Value was at a lower valuation than its growth counterpart, based on the LTM EV/EBIT metric.
IS TIME ON SMALL-CAP’S SIDE?
Throughout 2022, we saw many small-cap stock prices hit hard regardless of their financial fundamentals and/or operating efficiency. While we were often struck by the contrast between the more confident—albeit cautious—outlooks from the many management teams our investment teams met with and the fatalistic headlines we were seeing almost every day, we are also accustomed to seeing valuations decouple from company attributes—often by what we deem to be highly disproportionate amounts. Our more than five decades of experience have taught us the value of patience—which is often hardest for investors to practice when it’s needed most.
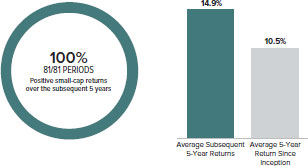
Related to this is the fact that small-cap’s historical performance patterns show that below-average longer-term return periods have typically been followed by positive returns—most often by periods of above-average longer-term returns. For example, subsequent annualized three-year returns from three-year entry points of less than 5% have been positive 99% of the time—that is, in 75 out of 76 three-year annualized periods—averaging 16.0% since the Russell 2000’s 12/31/78 inception. The small-cap index also enjoyed positive annualized five-year returns 100% of the time—that
This page is not part of the Royce Capital Fund 2022 Annual Report to Shareholders | 5
LETTER TO OUR SHAREHOLDERS
is, in all 81 five-year periods—and averaged an impressive 14.9% following five-year periods with annualized returns of 5% or less. This appears especially relevant now because the respective three- and five-year annualized returns for the Russell 2000 as of 12/31/22 were 3.1% and 4.1%.
Above-Average Returns Have Tended to Follow Low Return Periods
Subsequent Average Annualized 5-Year Performance for the Russell 2000 Following 5-Year Annualized Return Ranges of Less Than 5% from 12/31/83 through 12/31/22
Past performance is no guarantee of future results. Source: FactSet
THE WAITING IS THE HARDEST PART
It is of course possible that stock prices will get worse before they get better. As of this writing, inflation and earnings multiples are higher while interest rates, credit spreads, the VIX (Volatility Index), and the unemployment rate are lower. Many market observers are convinced that sales and earnings growth are much more likely to decline—or at least flatline—in 2023 than they are to climb, at least not
until late in the year. At the same time, however, margins for many companies are expected to expand in 2023, thus helping earnings. In other words, the signals continue to flash conflicting messages—which goes some distance to explain why the outlooks for our portfolio managers range from fear that stocks have yet to touch bottom to full-throated bullishness. The ongoing presence of these mixed signals did nothing to keep stocks from enjoying a highly robust January of 2023. Notably, the Russell 2000 was well ahead of the Russell 1000 for the one-year period ended 1/31/23, down -3.4% versus -8.6%.
So, while recession is still a possibility, none of us knows how long it will last or how deep it will go. What we do firmly believe is that any recession—like any bear market—is ultimately finite. We believe any recession will be followed by a recovery. It’s worth keeping in mind that history also shows that small caps will likely begin an upward move before many of us know for sure that the economy is rebounding in earnest. As difficult as bear markets are, they also present investors with the opportunity to build their small-cap allocation at attractively low prices. The aftermath of the three worst bear markets of the past 25 years—the Internet Bubble, the Great Financial Crisis, and the Covid period—were highly rewarding for investors who showed the fortitude to stay in the market. Regardless of what the near term brings, then, we see the currently uncertain period as a highly opportune time to actively invest in select small caps for the long run.
| Sincerely, | | |
| | | |
 |  |  |
| | | |
Charles M. Royce Chairman, Royce Investment Partners | Christopher D. Clark Chief Executive Officer, and Co-Chief Investment Officer, Royce Investment Partners | Francis D. Gannon Co-Chief Investment Officer, Royce Investment Partners |
| January 31, 2023 | | |
6 | This page is not part of the Royce Capital Fund 2022 Annual Report to Shareholders
Performance and Expenses
Performance and Expenses
As of December 31, 2022
| | 1-YR | 3-YR | 5-YR | 10-YR | 15-YR | 20-YR | 25-YR | SINCE INCEPTION (12/27/96) | ANNUAL OPERATING EXPENSES (%) GROSS/NET |
| Royce Capital Fund–Micro-Cap Portfolio | -22.43 | 7.67 | 6.30 | 5.73 | 4.46 | 7.92 | 8.78 | 9.24 | 1.12/1.08 |
| Royce Capital Fund–Small-Cap Portfolio | -9.20 | 2.79 | 3.39 | 6.33 | 5.97 | 8.55 | 8.92 | 9.26 | 1.11/1.08 |
| INDEX | | | | | | | | | |
| Russell Microcap Index | -21.96 | 4.05 | 3.69 | 8.86 | 6.34 | 8.64 | N/A | N/A | N/A |
| Russell 2000 Value Index | -14.48 | 4.70 | 4.13 | 8.48 | 6.81 | 8.99 | 7.70 | N/A | N/A |
| Russell 2000 Index | -20.44 | 3.10 | 4.13 | 9.01 | 7.16 | 9.36 | 7.13 | N/A | N/A |
Important Performance, Expense, and Risk Information
All performance information in this Review and Report reflects past performance, is presented on a total return basis, reflects the reinvestment of distributions, and does not reflect the deduction of taxes that a shareholder would pay on fund distributions or the redemption of fund shares. Past performance is no guarantee of future results. Investment return and principal value of an investment will fluctuate, so that shares may be worth more or less than their original cost when redeemed. Current performance may be higher or lower than performance quoted and may be obtained at www.royceinvest.com. The Funds’ total returns do not reflect any deduction for charges or expenses of the variable contracts investing in the Funds. All performance and expense information reflects the result for each Fund’s Investment Class Shares. Gross annual operating expenses reflect each Fund’s gross total annual operating expenses and include management fees, operating expenses, and any applicable acquired fund fees and expenses. Net annual operating expenses reflect contractual fee waivers and/or expense reimbursements. All expense information is reported as of each Fund’s most current prospectus. Royce & Associates has contractually agreed to waive fees and/or reimburse operating expenses, excluding brokerage commissions, taxes, interest litigation expenses, acquired fund fees and expenses, and other expenses not borne in the ordinary course of business, to the extent necessary to maintain net operating expenses at or below 1.08% for both Royce Capital Fund–Micro-Cap Portfolio and Royce Capital Fund–Small-Cap Portfolio through April 30, 2023.
Service Class Shares bear an annual distribution expense that is not borne by the Investment Class; if those expenses were reflected, total returns would have been lower. Each series of Royce Capital Fund is subject to market risk—the possibility that common stock prices will decline, sometimes sharply and unpredictably, over short or extended periods of time. Such declines may be caused by various factors, including market, financial, and economic conditions, governmental or central bank actions, and other factors, such as the recent Covid-19 pandemic, that may not be directly related to the issuer of a security held by a Fund. This pandemic could adversely affect global market, financial, and economic conditions in ways that cannot necessarily be foreseen. Royce Micro-Cap Portfolio invests primarily in micro-cap companies while Royce Small-Cap Portfolio invests primarily in small-cap companies. Investments in micro-cap and small-cap companies may involve considerably more risk than investments in securities of larger-cap companies. (Please see “Primary Risks for Fund Investors” in the prospectus.) Each series of Royce Capital Fund may invest up to 25% of its net assets in foreign securities. Investments in foreign securities may involve political, economic, currency, and other risks not encountered in U.S. investments. (Please see “Investing in Foreign Securities” in the prospectus.) As of 12/31/22, Royce Small-Cap Portfolio invested a significant portion of its assets in a limited number of stocks, which may involve considerably more risk than a more broadly diversified portfolio because a decline in the value of any one of these stocks would cause the Portfolio’s overall value to decline to a greater degree. Royce Micro-Cap Portfolio’s broadly diversified portfolio does not ensure a profit or guarantee against loss. (Please see “Primary Risks for Fund Investors” in the prospectus.) This Review and Report must be preceded or accompanied by a prospectus. Please read the prospectus carefully before investing or sending money. Russell Investment Group is the source and owner of the trademarks, service marks, and copyrights related to the Russell Indexes. Russell® is a trademark of Russell Investment Group. The Russell Microcap Index includes 1,000 of the smallest securities in the small-cap Russell 2000 Index along with the next smallest eligible securities as determined by Russell. The Russell 2000 Index is an unmanaged, capitalization-weighted index of domestic small-cap stocks. It measures the performance of the 2,000 smallest publicly traded U.S. companies in the Russell 3000 Index. The Russell 2000 Value Index consists of the respective value stocks within the Russell 2000 as determined by Russell Investments. The performance of an index does not represent exactly any particular investment, as you cannot invest directly in an index. Distributor: Royce Fund Services, LLC.
| This page is not part of the Royce Capital Fund 2022 Annual Report to Shareholders | 7 |
MANAGERS’ DISCUSSION (UNAUDITED)
Royce Capital Fund–Micro-Cap Portfolio (RCM)

Jim Stoeffel
Brendan Hartman
FUND PERFORMANCE
Royce Capital Fund–Micro-Cap Portfolio was down -22.4% in 2022 versus a loss of -22.0% for its primary benchmark, the Russell Microcap Index, and a -20.4% loss for the small-cap Russell 2000 Index, its secondary benchmark. The portfolio outperformed the Russell Microcap for the three- and five-year periods ended 12/31/22 and beat the Russell 2000 for the three-, five-, 25-year, and since inception (12/27/96) periods ended 12/31/22.
WHAT WORKED… AND WHAT DIDN’T
Eight of the portfolio’s nine equity sectors finished 2022 in the red, with Health Care, Consumer Discretionary, and Industrials detracting most. The lone positive impact came from Energy while Real Estate and Materials detracted least. At the industry level, health care equipment & supplies (Health Care), specialty retail (Consumer Discretionary), and electronic equipment, instruments & components (Information Technology) detracted most while software (Information Technology), auto components (Consumer Discretionary), and communications equipment (Information Technology) were the biggest contributors.
Shares of medical device company Bioventus declined sharply in 2022 following disappointing earnings that indicated greater complexity in integrating Misonix, which Bioventus acquired in October of 2021. We initially believed that the new entity’s greater scale could accelerate earnings growth, a view that shifted with November’s announcement that yearly guidance was being lowered, leading us to exit the stock. Shares of MeiraGTx Holdings, a clinical stage gene therapy company, declined despite progress in clinical trials for their retinal and salivary disease treatments and ongoing partnership with Johnson & Johnson. Rising rates seemed to drive the sell-off, as much of its earnings potential remains several years away. We remained confident in its long-term promise at year-end. Industrial insulation company Aspen Aerogels saw its shares slide as it completed a dilutive financing deal to fund the capacity expansion necessary to meet growing demand from original equipment manufacturers of electric vehicles. We increased our stake in 2022. While the need for a large new plant admittedly adds timing uncertainty and execution risk, Aspen’s proven solution has been winning ample new business.
Modine Manufacturing provides thermal management systems for an array of industries and is in the midst of a turnaround, moving from commoditized areas to higher-growth and margin segments, such as electric vehicles and data center infrastructure. We maintained our position as we believe the turnaround is in its early stages and not yet fully appreciated by investors. Software developer Agilysys offers a comprehensive suite of solutions targeting the hospitality industry. Management has spent the past several years developing add-on modules to its core Property Management software offering and thus increasing the firm’s competitive advantage. We held our shares at year-end as we view its recent win with Marriott as a potential game changer. Digi International is transitioning from a pure play networking hardware business to offering ancillary software products adjacent to its core offering. These new offerings have provided a significant base of high-margin, recurring revenues. We reduced our position as we believe the market has begun to more fully recognize the company’s successful transition.
| | | | | |
| | Top Contributors to Performance | | Top Detractors from Performance | |
| | For 2022 (%)1 | | | For 2022 (%)2 | | |
| | Modine Manufacturing | 0.98 | | Bioventus Cl. A | -1.28 | |
| | Agilysys | 0.88 | | MeiraGTx Holdings | -0.87 | |
| | Digi International | 0.74 | | Aspen Aerogels | -0.85 | |
| | Clearfield | 0.53 | | Apyx Medical | -0.82 | |
| | StoneX Group | 0.46 | | Harvard Bioscience | -0.82 | |
| | 1 Includes dividends | | | 2 Net of dividends | | |
| | | | | | | |
The portfolio’s advantage versus the Russell Microcap came from stock selection in 2022. Stock selection provided a sizable relative advantage in Information Technology (overcoming the negative impact of our significantly higher weighting) and Industrials while the Fund’s cash holdings also contributed to relative performance in 2022. Conversely, our lower exposure (and, to a lesser degree, stock selection) hampered relative results most in Energy. Stock picks hurt in Health Care, as did a combination of greater exposure and stock selection in Communication Services.
CURRENT POSITIONING AND OUTLOOK
We see micro-cap value stocks as increasingly well positioned for the next market upturn, as they were disproportionately hurt by the zero interest rate environment that favored long duration assets. While 2022’s pain was sharp for stocks, we believe the Federal Reserve’s pivot to a more normalized interest rate environment should lead to more thoughtful approaches to investing once we exit the current downturn. The key questions revolve around inflation: When will it abate and when will the Fed begin to ease financial conditions? We see their resolution as a prerequisite for a sustained move higher in equity prices. We suspect that many inflationary pressures were related to aggressive fiscal and monetary stimuli in demand-based economies juxtaposed against significant supply chain disruptions in supply-based economies—a classic supply/demand imbalance that, while persisting for longer than we initially thought, is already showing signs of rebalancing, with the price of many goods falling rapidly. Currently invested on a pro-cyclical basis with overweights in retailers, Information Technology, and Industrials, we have made no wholesale changes to our positioning. At the same time, we believe that any easing in financial conditions against a backdrop where earnings expectations still need to come down should create enough volatility for us to find exciting investment opportunities. In short, we are cautiously optimistic about 2023 being a year of normalization in which volatility should offer excellent opportunities to position ourselves for the next significant bull phase.
8 | Royce Capital Fund 2022 Annual Report to Shareholders
| PERFORMANCE AND PORTFOLIO REVIEW (UNAUDITED) | TICKER SYMBOLS RCMCX RCMSX |
| | |
Performance and Expenses
Average Annual Total Return (%) Through 12/31/22
| | JUL-DEC 20221 | 1-YR | 3-YR | 5-YR | 10-YR | 15-YR | 20-YR | 25-YR | SINCE INCEPTION (12/27/96) |
| RCM | 7.88 | -22.43 | 7.67 | 6.30 | 5.73 | 4.46 | 7.92 | 8.78 | 9.24 |
| Annual Gross Operating Expenses: 1.12% | Annual Net Operating Expenses: 1.08% |
1 Not annualized
Morningstar Style Map™ As of 12/31/22
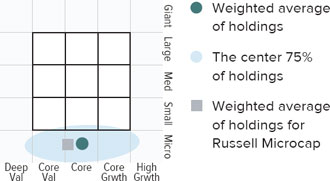
The Morningstar Style Map is the Morningstar Style Box™ with the center 75% of fund holdings plotted as the Morningstar Ownership Zone™. The Morningstar Style Box is designed to reveal a fund’s investment strategy. The Morningstar Ownership Zone provides detail about a portfolio’s investment style by showing the range of stock sizes and styles. The Ownership Zone is derived by plotting each stock in the portfolio within the proprietary Morningstar Style Box. Over time, the shape and location of a fund’s ownership zone may vary. See page 30 for additional information.
Value of $10,000
Invested on 6/30/00 (Russell Microcap Inception) as of 12/31/22 ($)

Includes reinvestment of distributions.
| Top 10 Positions | |
| % of Net Assets | |
| Agilysys | 1.5 |
| Luna Innovations | 1.4 |
| Heritage-Crystal Clean | 1.3 |
| CRA International | 1.3 |
| Western New England Bancorp | 1.3 |
| Modine Manufacturing | 1.3 |
| Investar Holding Corporation | 1.3 |
| Vishay Precision Group | 1.3 |
| HBT Financial | 1.2 |
| Axcelis Technologies | 1.2 |
| | |
| Portfolio Sector Breakdown | |
| % of Net Assets | |
| Information Technology | 26.9 |
| Industrials | 24.3 |
| Financials | 13.7 |
| Consumer Discretionary | 11.2 |
| Health Care | 7.1 |
| Materials | 4.7 |
| Communication Services | 4.1 |
| Energy | 2.8 |
| Real Estate | 0.5 |
| Cash and Cash Equivalents | 4.7 |
| Calendar Year Total Returns (%) | |
| YEAR | RCM |
| 2022 | -22.4 |
| 2021 | 30.0 |
| 2020 | 23.8 |
| 2019 | 19.6 |
| 2018 | -9.0 |
| 2017 | 5.2 |
| 2016 | 19.7 |
| 2015 | -12.5 |
| 2014 | -3.6 |
| 2013 | 21.0 |
| 2012 | 7.6 |
| 2011 | -12.1 |
| 2010 | 30.1 |
| 2009 | 57.9 |
| 2008 | -43.3 |
| Upside/Downside Capture Ratios | |
| Periods Ended 12/31/22 (%) | | |
| | UPSIDE | DOWNSIDE |
| 10-Year | 79 | 89 |
| From 6/30/00 (Russell Microcap Inception) | 91 | 81 |
| Portfolio Diagnostics | |
| Fund Net Assets | $123 million |
| Number of Holdings | 121 |
| Turnover Rate | 12% |
| Average Market Capitalization1 | $499 million |
| Weighted Average P/B Ratio 2 | 1.7x |
| Active Share 3 | 91% |
| U.S. Investments (% of Net Assets) | 85.1% |
| Non-U.S. Investments (% of Net Assets) | 10.2% |
| 1 | Geometric Average. This weighted calculation uses each portfolio holding’s market cap in a way designed to not skew the effect of very large or small holdings; instead, it aims to better identify the portfolio’s center, which Royce believes offers a more accurate measure of average market cap than a simple mean or median. |
| 2 | Harmonic Average. This weighted calculation evaluates a portfolio as if it were a single stock and measures it overall. It compares the total market value of the portfolio to the portfolio’s share in the earnings or book value, as the case may be, of its underlying stocks. |
| 3 | Active Share is the sum of the absolute values of the different weightings of each holding in the Fund versus each holding in the benchmark, divided by two. |
Important Performance and Expense Information
All performance information in this Report reflects past performance, is presented on a total return basis, reflects the reinvestment of distributions, and does not reflect the deduction of taxes that a shareholder would pay on fund distributions or the redemption of fund shares. Past performance is no guarantee of future results. Investment return and principal value of an investment will fluctuate, so that shares may be worth more or less than their original cost when redeemed. Current performance may be higher or lower than performance quoted. The Fund’s total returns do not reflect any deduction for charges or expenses of the variable contracts investing in the Fund. Returns as of the most recent month-end may be obtained at www.royceinvest.com. All performance and risk information reflects the result of the Investment Class (its oldest class). Shares of RCM’s Service Class bear an annual distribution expense that is not borne by the Investment Class; if those expenses were reflected, total returns would have been lower. Gross operating expenses reflect the Fund’s total gross operating expenses for the Investment Class and include management fees and other expenses. Net operating expenses reflect contractual fee waivers and/or expense reimbursements. All expense information is reported as of the Fund’s most current prospectus. Royce & Associates has contractually agreed, without right of termination, to waive fees and/or reimburse expenses to the extent necessary to maintain the Investment Class’s net annual operating expenses (excluding brokerage commissions, taxes, interest, litigation expenses, acquired fund fees and expenses, and other expenses not borne in the ordinary course of business) at or below 1.08% through April 30, 2023. Regarding the “Top Contributors” and “Top Detractors” tables shown above, the sum of all contributors to, and all detractors from, performance for all securities in the portfolio would approximate the Fund’s year-to-date performance for 2022. Upside Capture Ratio measures a manager’s performance in up markets relative to the Fund’s benchmark (Russell Microcap). It is calculated by measuring the Fund’s performance in quarters when the benchmark went up and dividing it by the benchmark’s return in those quarters. Downside Capture Ratio measures a manager’s performance in down markets relative to the Fund’s benchmark. It is calculated by measuring the Fund’s performance in quarters when the benchmark goes down and dividing it by the benchmark’s return in those quarters.
Royce Capital Fund 2022 Annual Report to Shareholders | 9
Schedule of Investments
Royce Capital Fund - Micro-Cap Portfolio
Common Stocks – 95.3%
| | | SHARES | | | VALUE |
| | | | | | |
| COMMUNICATION SERVICES – 4.1% | | | | | | | |
| ENTERTAINMENT - 1.5% | | | | | | | |
| Chicken Soup for the Soul Entertainment Cl. A 1 | | | 101,416 | | | $ | 519,250 |
| Gaia Cl. A 1 | | | 73,746 | | | | 175,515 |
| IMAX Corporation 1 | | | 78,200 | | | | 1,146,412 |
| | | | | | | | 1,841,177 |
| INTERACTIVE MEDIA & SERVICES - 1.2% | | | | | | | |
| QuinStreet 1 | | | 97,600 | | | | 1,400,560 |
| MEDIA - 1.4% | | | | | | | |
| Magnite 1 | | | 93,000 | | | | 984,870 |
| Thryv Holdings 1 | | | 41,000 | | | | 779,000 |
| | | | | | | | 1,763,870 |
| Total (Cost $5,857,775) | | | | | | | 5,005,607 |
| | | | | | | | |
| CONSUMER DISCRETIONARY – 11.2% | | | | | | | |
| AUTO COMPONENTS - 2.4% | | | | | | | |
| Modine Manufacturing 1 | | | 79,800 | | | | 1,584,828 |
| Stoneridge 1 | | | 62,800 | | | | 1,353,968 |
| | | | | | | | 2,938,796 |
| HOTELS, RESTAURANTS & LEISURE - 1.5% | | | | | | | |
| Century Casinos 1 | | | 141,300 | | | | 993,339 |
| Lindblad Expeditions Holdings 1,2 | | | 104,900 | | | | 807,730 |
| | | | | | | | 1,801,069 |
| HOUSEHOLD DURABLES - 0.7% | | | | | | | |
| Legacy Housing 1 | | | 48,796 | | | | 925,172 |
| LEISURE PRODUCTS - 1.5% | | | | | | | |
| †American Outdoor Brands 1 | | | 72,847 | | | | 729,927 |
| MasterCraft Boat Holdings 1 | | | 45,317 | | | | 1,172,351 |
| | | | | | | | 1,902,278 |
| SPECIALTY RETAIL - 4.3% | | | | | | | |
| Barnes & Noble Education 1 | | | 160,300 | | | | 280,525 |
| Chico’s FAS 1 | | | 196,400 | | | | 966,288 |
| Citi Trends 1 | | | 47,486 | | | | 1,257,429 |
| †JOANN | | | 62,400 | | | | 177,840 |
| OneWater Marine Cl. A 1 | | | 18,800 | | | | 537,680 |
| Shoe Carnival | | | 45,800 | | | | 1,095,078 |
| Zumiez 1 | | | 42,600 | | | | 926,124 |
| | | | | | | | 5,240,964 |
| TEXTILES, APPAREL & LUXURY GOODS - 0.8% | | | | | | | |
| Fossil Group 1 | | | 152,300 | | | | 656,413 |
| Vera Bradley 1 | | | 64,900 | | | | 293,997 |
| | | | | | | | 950,410 |
| Total (Cost $12,516,284) | | | | | | | 13,758,689 |
| | | | | | | | |
| ENERGY – 2.8% | | | | | | | |
| ENERGY EQUIPMENT & SERVICES - 2.8% | | | | | | | |
| Natural Gas Services Group 1 | | | 119,366 | | | | 1,367,934 |
| Newpark Resources 1 | | | 356,800 | | | | 1,480,720 |
| Profire Energy 1 | | | 612,129 | | | | 642,736 |
| Total (Cost $2,885,696) | | | | | | | 3,491,390 |
| | | | | | | | |
| FINANCIALS – 13.7% | | | | | | | |
| BANKS - 6.8% | | | | | | | |
| BayCom Corporation | | | 68,582 | | | | 1,301,686 |
| HarborOne Bancorp | | | 104,491 | | | | 1,452,425 |
| HBT Financial | | | 77,894 | | | | 1,524,386 |
| HomeTrust Bancshares | | | 51,400 | | | | 1,242,338 |
| Investar Holding Corporation | | | 73,510 | | | | 1,582,670 |
| Midway Investments 1,3 | | | 1,751,577 | | | | 0 |
| †Stellar Bancorp | | | 42,845 | | | | 1,262,214 |
| | | | | | | | 8,365,719 |
| CAPITAL MARKETS - 4.6% | | | | | | | |
| B. Riley Financial | | | 22,300 | | | | 762,660 |
| Canaccord Genuity Group | | | 156,782 | | | | 971,493 |
| Silvercrest Asset Management Group Cl. A | | | 72,484 | | | | 1,360,525 |
| Sprott | | | 30,380 | | | | 1,010,572 |
| StoneX Group 1 | | | 15,900 | | | | 1,515,270 |
| | | | | | | | 5,620,520 |
| THRIFTS & MORTGAGE FINANCE - 2.3% | | | | | | | |
| Territorial Bancorp | | | 50,308 | | | | 1,207,895 |
| Western New England Bancorp | | | 169,817 | | | | 1,606,469 |
| | | | | | | | 2,814,364 |
| Total (Cost $13,093,310) | | | | | | | 16,800,603 |
| | | | | | | | |
| HEALTH CARE – 7.1% | | | | | | | |
| BIOTECHNOLOGY - 1.2% | | | | | | | |
| CareDx 1 | | | 100 | | | | 1,141 |
| Dynavax Technologies 1 | | | 82,600 | | | | 878,864 |
| MeiraGTx Holdings 1 | | | 92,300 | | | | 601,796 |
| | | | | | | | 1,481,801 |
| HEALTH CARE EQUIPMENT & SUPPLIES - 4.7% | | | | | | | |
| Apyx Medical 1 | | | 146,900 | | | | 343,746 |
| Artivion 1 | | | 69,689 | | | | 844,631 |
| AtriCure 1 | | | 17,500 | | | | 776,650 |
| Cutera 1,2 | | | 22,800 | | | | 1,008,216 |
| OrthoPediatrics Corp. 1 | | | 22,100 | | | | 878,033 |
| Profound Medical 1 | | | 90,900 | | | | 972,106 |
| Surmodics 1 | | | 27,578 | | | | 940,962 |
| | | | | | | | 5,764,344 |
| LIFE SCIENCES TOOLS & SERVICES - 1.2% | | | | | | | |
| Harvard Bioscience 1 | | | 254,768 | | | | 705,707 |
| NeoGenomics 1 | | | 11,600 | | | | 107,184 |
| Quanterix Corporation 1 | | | 48,200 | | | | 667,570 |
| | | | | | | | 1,480,461 |
| Total (Cost $7,322,077) | | | | | | | 8,726,606 |
| | | | | | | | |
| INDUSTRIALS – 24.3% | | | | | | | |
| AEROSPACE & DEFENSE - 1.6% | | | | | | | |
| Astronics Corporation 1 | | | 67,555 | | | | 695,816 |
| Cadre Holdings | | | 40,205 | | | | 809,729 |
| CPI Aerostructures 1 | | | 142,379 | | | | 455,613 |
| | | | | | | | 1,961,158 |
| BUILDING PRODUCTS - 1.1% | | | | | | | |
| Quanex Building Products | | | 56,400 | | | | 1,335,552 |
| COMMERCIAL SERVICES & SUPPLIES - 3.0% | | | | | | | |
| Acme United | | | 29,879 | | | | 654,350 |
| Heritage-Crystal Clean 1 | | | 50,334 | | | | 1,634,849 |
| VSE Corporation | | | 29,000 | | | | 1,359,520 |
| | | | | | | | 3,648,719 |
| CONSTRUCTION & ENGINEERING - 3.7% | | | | | | | |
| Concrete Pumping Holdings 1 | | | 121,000 | | | | 707,850 |
| Construction Partners Cl. A 1 | | | 54,100 | | | | 1,443,929 |
| IES Holdings 1 | | | 24,400 | | | | 867,908 |
| Northwest Pipe 1 | | | 44,700 | | | | 1,506,390 |
| | | | | | | | 4,526,077 |
| ELECTRICAL EQUIPMENT - 0.4% | | | | | | | |
| American Superconductor 1 | | | 154,300 | | | | 567,824 |
| 10 | Royce Capital Fund 2022 Annual Report to Shareholders | THE ACCOMPANYING NOTES ARE AN INTEGRAL PART OF THESE FINANCIAL STATEMENTS |
December 31, 2022
Royce Capital Fund - Micro-Cap Portfolio (continued)
| | | SHARES | | | VALUE |
| | | | | | |
| INDUSTRIALS (continued) | | | | | | | |
| MACHINERY - 6.1% | | | | | | | |
| Alimak Group | | | 80,500 | | | $ | 575,504 |
| CIRCOR International 1 | | | 44,300 | | | | 1,061,428 |
| †Commercial Vehicle Group 1 | | | 97,645 | | | | 664,962 |
| Graham Corporation 1 | | | 96,296 | | | | 926,368 |
| Luxfer Holdings | | | 66,100 | | | | 906,892 |
| Porvair | | | 130,700 | | | | 973,340 |
| Shyft Group (The) | | | 38,300 | | | | 952,138 |
| Wabash National | | | 66,800 | | | | 1,509,680 |
| | | | | | | | 7,570,312 |
| MARINE - 1.1% | | | | | | | |
| Clarkson | | | 33,600 | | | | 1,314,080 |
| PROFESSIONAL SERVICES - 5.3% | | | | | | | |
| CRA International | | | 13,196 | | | | 1,615,586 |
| Forrester Research 1 | | | 28,700 | | | | 1,026,312 |
| Kforce | | | 17,400 | | | | 954,042 |
| NV5 Global 1 | | | 10,700 | | | | 1,415,824 |
| Resources Connection | | | 80,054 | | | | 1,471,393 |
| | | | | | | | 6,483,157 |
| TRADING COMPANIES & DISTRIBUTORS - 2.0% | | | | | | | |
| Distribution Solutions Group 1 | | | 29,187 | | | | 1,075,833 |
| Transcat 1 | | | 19,845 | | | | 1,406,415 |
| | | | | | | | 2,482,248 |
| Total (Cost $22,392,569) | | | | | | | 29,889,127 |
| | | | | | | | |
| INFORMATION TECHNOLOGY – 26.9% | | | | | | | |
| COMMUNICATIONS EQUIPMENT - 5.4% | | | | | | | |
| Applied Optoelectronics 1 | | | 115,900 | | | | 219,051 |
| Clearfield 1 | | | 13,200 | | | | 1,242,648 |
| Comtech Telecommunications | | | 56,563 | | | | 686,675 |
| Digi International 1 | | | 37,259 | | | | 1,361,816 |
| DZS 1 | | | 73,100 | | | | 926,908 |
| EMCORE Corporation 1 | | | 165,700 | | | | 159,486 |
| Genasys 1 | | | 193,378 | | | | 715,499 |
| Harmonic 1 | | | 104,100 | | | | 1,363,710 |
| | | | | | | | 6,675,793 |
| ELECTRONIC EQUIPMENT, INSTRUMENTS & COMPONENTS - 5.8% | | | | | | | |
| Arlo Technologies 1 | | | 106,600 | | | | 374,166 |
| FARO Technologies 1 | | | 31,200 | | | | 917,592 |
| LightPath Technologies Cl. A 1 | | | 368,300 | | | | 449,326 |
| Luna Innovations 1 | | | 189,800 | | | | 1,668,342 |
| nLIGHT 1 | | | 89,700 | | | | 909,558 |
| PAR Technology 1 | | | 24,100 | | | | 628,287 |
| PowerFleet 1 | | | 147,394 | | | | 396,490 |
| VIA optronics ADR 1 | | | 101,257 | | | | 161,626 |
| Vishay Precision Group 1 | | | 40,200 | | | | 1,553,730 |
| | | | | | | | 7,059,117 |
| IT SERVICES - 1.8% | | | | | | | |
| Cass Information Systems | | | 26,048 | | | | 1,193,519 |
| Computer Task Group 1 | | | 138,003 | | | | 1,043,303 |
| | | | | | | | 2,236,822 |
| SEMICONDUCTORS & SEMICONDUCTOR EQUIPMENT - 10.7% | | | | | | | |
| Aehr Test Systems 1,2 | | | 60,100 | | | | 1,208,010 |
| Amtech Systems 1 | | | 76,282 | | | | 579,743 |
| Axcelis Technologies 1 | | | 19,100 | | | | 1,515,776 |
| AXT 1 | | | 193,200 | | | | 846,216 |
| Camtek 1 | | | 39,752 | | | | 872,954 |
| Cohu 1 | | | 39,400 | | | | 1,262,770 |
| Ichor Holdings 1 | | | 35,000 | | | | 938,700 |
| Nova 1,2 | | | 11,300 | | | | 922,984 |
| NVE Corporation | | | 18,100 | | | | 1,171,975 |
| PDF Solutions 1 | | | 45,200 | | | | 1,289,104 |
| Photronics 1 | | | 86,200 | | | | 1,450,746 |
| Ultra Clean Holdings 1 | | | 33,600 | | | | 1,113,840 |
| | | | | | | | 13,172,818 |
| SOFTWARE - 1.5% | | | | | | | |
| Agilysys 1 | | | 23,600 | | | | 1,867,704 |
| TECHNOLOGY HARDWARE, STORAGE & PERIPHERALS - 1.7% | | | | | | | |
| AstroNova 1 | | | 90,862 | | | | 1,164,851 |
| Intevac 1 | | | 132,936 | | | | 860,096 |
| | | | | | | | 2,024,947 |
| Total (Cost $24,651,378) | | | | | | | 33,037,201 |
| | | | | | | | |
| MATERIALS – 4.7% | | | | | | | |
| CHEMICALS - 0.5% | | | | | | | |
| Aspen Aerogels 1 | | | 55,717 | | | | 656,904 |
| METALS & MINING - 4.2% | | | | | | | |
| Altius Minerals | | | 49,700 | | | | 815,241 |
| Ferroglobe 1 | | | 117,100 | | | | 450,835 |
| Haynes International | | | 30,270 | | | | 1,383,036 |
| Major Drilling Group International 1 | | | 187,900 | | | | 1,459,903 |
| Universal Stainless & Alloy Products 1 | | | 138,147 | | | | 990,514 |
| | | | | | | | 5,099,529 |
| Total (Cost $4,768,113) | | | | | | | 5,756,433 |
| | | | | | | | |
| REAL ESTATE – 0.5% | | | | | | | |
| REAL ESTATE MANAGEMENT & DEVELOPMENT - 0.5% | | | | | | | |
| FRP Holdings 1 | | | 12,240 | | | | 659,246 |
| Total (Cost $202,768) | | | | | | | 659,246 |
| | | | | | | | |
| TOTAL COMMON STOCKS | | | | | | | |
| (Cost $93,689,970) | | | | | | | 117,124,902 |
| THE ACCOMPANYING NOTES ARE AN INTEGRAL PART OF THESE FINANCIAL STATEMENTS | Royce Capital Fund 2022 Annual Report to Shareholders | 11 |
| Schedule of Investments | December 31, 2022 |
Royce Capital Fund - Micro-Cap Portfolio (continued)
| | | SHARES | | | VALUE |
| | | | | | |
| REPURCHASE AGREEMENT– 4.9% | | | | | | | |
Fixed Income Clearing Corporation, 1.28% dated 12/30/22, due 1/3/23, maturity value
$6,001,885 (collateralized by obligations of U.S. Government Agencies, 2.875%
due 5/31/25, valued at $6,121,078) | | | | | | | |
| (Cost $6,001,031) | | | | | | $ | 6,001,031 |
| | | | | | | | |
| COLLATERAL RECEIVED FOR SECURITIES LOANED – 0.9% | | | | | | | |
| Money Market Funds | | | | | | | |
| Federated Hermes Government Obligations Fund - Institutional Shares (7 day yield-4.10%) | | | | | | | |
| (Cost $1,072,870) | | | 1,072,870 | | | | 1,072,870 |
| | | | | | | | |
| TOTAL INVESTMENTS – 101.1% | | | | | | | |
| (Cost $100,763,871) | | | | | | | 124,198,803 |
| | | | | | | | |
| LIABILITIES LESS CASH AND OTHER ASSETS – (1.1)% | | | (1,330,113) |
| | | | | | | | |
| NET ASSETS – 100.0% | | | | | | $ | 122,868,690 |
ADR- American Depository Receipt
| 2 | All or a portion of these securities were on loan as of December 31, 2022. |
| 3 | A security for which market quotations are not readily available represents 0.0% of net assets. This security has been valued at its fair value under procedures approved by the Fund’s Board of Trustees. This security is defined as a Level 3 security due to the use of significant unobservable inputs in the determination of fair value. See Notes to Financial Statements. |
Bold indicates the Fund’s 20 largest equity holdings in terms of December 31, 2022, market value.
| 12 | Royce Capital Fund 2022 Annual Report to Shareholders | THE ACCOMPANYING NOTES ARE AN INTEGRAL PART OF THESE FINANCIAL STATEMENTS |
This page is intentionally left blank.
Royce Capital Fund 2022 Annual Report to Shareholders | 13
MANAGER’S DISCUSSION (UNAUDITED)
Royce Capital Fund–Small-Cap Portfolio (RCS)

Jay Kaplan, CFA
FUND PERFORMANCE
Royce Capital Fund–Small-Cap Portfolio outperformed both of its small-cap benchmarks in 2022, down -9.2% versus a decline of -14.5% for its primary benchmark, the Russell 2000 Value Index, and a fall of -20.4% for the Russell 2000 Index, its secondary benchmark.
WHAT WORKED… AND WHAT DIDN’T
Five of the portfolio’s nine equity sectors made a negative impact on calendar year period performance, with the largest detractions coming from Consumer Discretionary, Industrials, and Financials while the largest positive impacts came from Health Care, Energy, and Communication Services. At the industry level, specialty retail, household durables (both in Consumer Discretionary), and semiconductors & semiconductor equipment (Information Technology) were the largest detractors while biotechnology (Health Care), pharmaceuticals (Health Care), and oil, gas & consumable fuels (Energy) contributed most in 2022.
Recreational boat dealer OneWater Marine was the Fund’s top detractor. Investors appeared to worry that slowing demand—which has not materialized as of this writing—would sink its prospects, keeping its stock under water for most of 2022. In November, however, the company reported record revenue for the fiscal fourth quarter and full fiscal year of 2022 before closing an acquisition in December that, in our view, should help to shore up its presence in the Gulf Coast region. Wary of a possible slowdown in demand in 2023, we reduced our stake in 2022. Rent-A-Center operates rent-to-own stores. Investors shied away from its stock after the company said that both the end of Covid relief funds and rising inflation would likely hurt its customers’ ability to buy and/or make payments. We were equally concerned about how the company’s 2021 acquisition of lease-to-own solutions provider Acima Holdings put leverage on Rent-A-Center’s balance sheet while also adding credit losses to recent financial results. We sold the last of our shares in March. We also parted ways with apparel retailer American Eagle Outfitters, selling the last of our shares in September because we expect it and other mall-based retailers will face a particularly difficult period ahead given the likelihood of recession.
| | | | | |
| | Top Contributors to Performance | | Top Detractors from Performance | |
| | For 2022 (%)1 | | | For 2022 (%)2 | | |
| | Catalyst Pharmaceuticals | 1.76 | | OneWater Marine Cl. A | -1.14 | |
| | BioDelivery Sciences International | 0.73 | | Rent-A-Center | -1.05 | |
| | IBEX | 0.70 | | American Eagle Outfitters | -0.95 | |
| | Cross Country Healthcare | 0.66 | | Shoe Carnival | -0.94 | |
| | Sanmina Corporation | 0.62 | | Lazydays Holdings | -0.75 | |
| | 1 Includes dividends | | | 2 Net of dividends | | |
| | | | | | | |
The portfolio’s top contributor was Catalyst Pharmaceuticals, which focuses on the acquisition, development, and commercialization of prescription drugs that treat autoimmune disorders and rare diseases. We began building our position at what we judged to be a very favorable valuation, attracted to its strong balance sheet and its approved—and profitable—drug that treats Lambert-Eaton myasthenic syndrome (LEMS) in adults. In July, the company favorably settled patent litigation and then acquired the infringer. BioDelivery Sciences International was a specialty pharmaceutical company that makes pain management and neurology products which treat patients living with serious and complex conditions such as chronic pain and acute migraines. In February, Collegium Pharmaceutical, which we held until September 2022 and which also specializes in pain management medicines, announced it would acquire BioDelivery at a sizable premium, leading us to sell our position in February 2022. IBEX is a customer experience company that helps companies engage more effectively with their customers. The company’s services include digital marketing, outsourced sales and support, and brand management. We initiated a position when the company went public and was beginning to add new economy names in industries such as fintech and healthcare—which helped spur revenue and earnings growth in 2022.
The portfolio’s advantage over the Russell 2000 Value came entirely from stock selection in 2022. Stock picking was especially effective versus the benchmark in Health Care and Information Technology (overcoming the negative impact of our overweight), and Communication Services (where our slight underweight also helped). Conversely, a combination of our greater exposure and stock picks detracted from relative results in Consumer Discretionary, as did our lower weight and stock selection in Energy and lack of exposure to Utilities.
CURRENT POSITIONING AND OUTLOOK
We are not anticipating a durable end to the bear market over the short term because several formidable headwinds remain, including a still inverted yield curve, stubbornly high inflation, and a hawkish Fed that will likely not pause (much less pivot to reducing rates) until there is sufficient weakness in the labor market to curb inflation. In our view, these factors also contribute to making recession a strong likelihood in 2023. In any event, our expectation is for a more volatile market until we have greater clarity about the state of economic growth. Many companies over-earned coming out of Covid, and many are likely to see earnings decline in a more muted demand environment, which has made getting a read on normalized earnings challenging. In positioning the portfolio amid this uncertainty, we have been focusing on companies that have key fundamental strengths—specifically, low debt balance sheets and the ability to generate free cash flow—and look best positioned for a more stable market over the next 18 to 24 months. We ended 2022 overweight in Information Technology, Consumer Discretionary, and Industrials and underweight in Financials, Real Estate, Utilities, Materials, and Health Care.
| 14 | Royce Capital Fund 2022 Annual Report to Shareholders | |
| PERFORMANCE AND PORTFOLIO REVIEW (UNAUDITED) | TICKER SYMBOLS RCPFX RCSSX |
Performance and Expenses
Average Annual Total Return (%) Through 12/31/22
| | JUL-DEC 20221 | 1-YR | 3-YR | 5-YR | 10-YR | 15-YR | 20-YR | 25-YR | SINCE INCEPTION (12/27/96) |
| RCS | 12.14 | -9.20 | 2.79 | 3.39 | 6.33 | 5.97 | 8.55 | 8.92 | 9.26 |
| Annual Gross Operating Expenses: 1.11% Annual Net Operating Expenses: 1.08% |
1 Not annualized
Morningstar Style Map™ As of 12/31/22
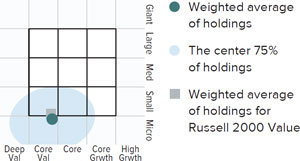
The Morningstar Style Map is the Morningstar Style Box™ with the center 75% of fund holdings plotted as the Morningstar Ownership Zone™. The Morningstar Style Box is designed to reveal a fund’s investment strategy. The Morningstar Ownership Zone provides detail about a portfolio’s investment style by showing the range of stock sizes and styles. The Ownership Zone is derived by plotting each stock in the portfolio within the proprietary Morningstar Style Box. Over time, the shape and location of a fund’s ownership zone may vary. See page 30 for additional information.
Value of $10,000
Invested on 12/27/96 as of 12/31/22 ($)

Includes reinvestment of distributions.
Top 10 Positions
% of Net Assets
| Sterling Infrastructure | 1.8 |
| Flex | 1.8 |
| Jabil | 1.7 |
| Sanmina Corporation | 1.6 |
| Timberland Bancorp | 1.6 |
| Evercore Cl. A | 1.6 |
| Kimball Electronics | 1.6 |
| SciPlay Corporation Cl. A | 1.6 |
| Vishay Intertechnology | 1.6 |
| Tiptree | 1.6 |
Portfolio Sector Breakdown
% of Net Assets
| Information Technology | 23.5 |
| Industrials | 18.9 |
| Financials | 16.4 |
| Consumer Discretionary | 16.0 |
| Energy | 7.7 |
| Health Care | 6.9 |
| Communication Services | 3.6 |
| Consumer Staples | 2.6 |
| Real Estate | 2.3 |
| Cash and Cash Equivalents | 2.1 |
Calendar Year Total Returns (%)
| YEAR | RCS |
| 2022 | -9.2 |
| 2021 | 28.8 |
| 2020 | -7.2 |
| 2019 | 18.7 |
| 2018 | -8.3 |
| 2017 | 5.4 |
| 2016 | 21.0 |
| 2015 | -11.8 |
| 2014 | 3.2 |
| 2013 | 34.8 |
| 2012 | 12.5 |
| 2011 | -3.3 |
| 2010 | 20.5 |
| 2009 | 35.2 |
| 2008 | -27.2 |
Upside/Downside Capture Ratios
Periods Ended 12/31/22 (%)
| | UPSIDE | DOWNSIDE |
| 10-Year | 88 | 97 |
| From 12/31/96 (Start of Fund’s First Full Quarter) | 98 | 92 |
Portfolio Diagnostics
| Fund Net Assets | $299 million |
| Number of Holdings | 92 |
| Turnover Rate | 88% |
| Average Market Capitalization1 | $1,200 million |
| Weighted Average P/B Ratio 2 | 1.6x |
| Active Share 3 | 96% |
| U.S. Investments (% of Net Assets) | 97.3% |
| Non-U.S. Investments (% of Net Assets) | 0.6% |
| 1 | Geometric Average. This weighted calculation uses each portfolio holding’s market cap in a way designed to not skew the effect of very large or small holdings; instead, it aims to better identify the portfolio’s center, which Royce believes offers a more accurate measure of average market cap than a simple mean or median. |
| 2 | Harmonic Average. This weighted calculation evaluates a portfolio as if it were a single stock and measures it overall. It compares the total market value of the portfolio to the portfolio’s share in the earnings or book value, as the case may be, of its underlying stocks. |
| 3 | Active Share is the sum of the absolute values of the different weightings of each holding in the Fund versus each holding in the benchmark, divided by two. |
Important Performance and Expense Information
All performance information in this Report reflects past performance, is presented on a total return basis, reflects the reinvestment of distributions, and does not reflect the deduction of taxes that a shareholder would pay on fund distributions or the redemption of fund shares. Past performance is no guarantee of future results. Investment return and principal value of an investment will fluctuate, so that shares may be worth more or less than their original cost when redeemed. Current performance may be higher or lower than performance quoted. The Fund’s total returns do not reflect any deduction for charges or expenses of the variable contracts investing in the Fund. Returns as of the most recent month-end may be obtained at www.royceinvest.com. All performance and risk information reflects the result of the Investment Class (its oldest class). Shares of RCS’s Service Class bear an annual distribution expense that is not borne by the Investment Class; if those expenses were reflected, total returns would have been lower. Gross operating expenses reflect the Fund’s total gross operating expenses for the Investment Class and include management fees and other expenses. Net operating expenses reflect contractual fee waivers and/or expense reimbursements. All expense information is reported as of the Fund’s most current prospectus. Royce & Associates has contractually agreed, without right of termination, to waive fees and/or reimburse expenses to the extent necessary to maintain the Investment Class’s net annual operating expenses (excluding brokerage commissions, taxes, interest, litigation expenses, acquired fund fees and expenses, and other expenses not borne in the ordinary course of business) at or below 1.08% through April 30, 2023. Regarding the “Top Contributors” and “Top Detractors” tables shown above, the sum of all contributors to, and all detractors from, performance for all securities in the portfolio would approximate the Fund’s year-to-date performance for 2022. Upside Capture Ratio measures a manager’s performance in up markets relative to the Fund’s benchmark (Russell 2000 Value). It is calculated by measuring the Fund’s performance in quarters when the benchmark went up and dividing it by the benchmark’s return in those quarters. Downside Capture Ratio measures a manager’s performance in down markets relative to the Fund’s benchmark. It is calculated by measuring the Fund’s performance in quarters when the benchmark goes down and dividing it by the benchmark’s return in those quarters.
Royce Capital Fund 2022 Annual Report to Shareholders | 15
Schedule of Investments
Royce Capital Fund - Small-Cap Portfolio
Common Stocks – 97.9%
| | | SHARES | | | VALUE | |
| | | | | | | |
| COMMUNICATION SERVICES – 3.6% | | | | | | | | |
| ENTERTAINMENT - 1.6% | | | | | | | | |
| SciPlay Corporation Cl. A 1 | | | 297,200 | | | $ | 4,778,976 | |
| MEDIA - 2.0% | | | | | | | | |
| Entravision Communications Cl. A | | | 712,542 | | | | 3,420,201 | |
| Saga Communications Cl. A | | | 113,553 | | | | 2,679,851 | |
| | | | | | | | 6,100,052 | |
| Total (Cost $11,559,055) | | | | | | | 10,879,028 | |
| | | | | | | | | |
| CONSUMER DISCRETIONARY – 16.0% | | | | | | | | |
| DIVERSIFIED CONSUMER SERVICES - 1.3% | | | | | | | | |
| Lincoln Educational Services 1 | | | 651,485 | | | | 3,772,098 | |
| HOTELS, RESTAURANTS & LEISURE - 1.1% | | | | | | | | |
| †Bloomin’ Brands | | | 162,400 | | | | 3,267,488 | |
| HOUSEHOLD DURABLES - 1.8% | | | | | | | | |
| M/I Homes 1 | | | 45,024 | | | | 2,079,208 | |
| PulteGroup | | | 72,150 | | | | 3,284,990 | |
| | | | | | | | 5,364,198 | |
| LEISURE PRODUCTS - 1.5% | | | | | | | | |
| Malibu Boats Cl. A 1 | | | 39,418 | | | | 2,100,979 | |
| MasterCraft Boat Holdings 1 | | | 91,734 | | | | 2,373,159 | |
| | | | | | | | 4,474,138 | |
| SPECIALTY RETAIL - 4.3% | | | | | | | | |
| Container Store Group (The) 1 | | | 452,058 | | | | 1,948,370 | |
| Haverty Furniture | | | 70,100 | | | | 2,095,990 | |
| Lazydays Holdings 1 | | | 232,857 | | | | 2,780,312 | |
| OneWater Marine Cl. A 1 | | | 71,233 | | | | 2,037,264 | |
| Shoe Carnival | | | 162,225 | | | | 3,878,800 | |
| | | | | | | | 12,740,736 | |
| TEXTILES, APPAREL & LUXURY GOODS - 6.0% | | | | | | | | |
| Carter’s | | | 30,266 | | | | 2,258,146 | |
| †Kontoor Brands | | | 89,300 | | | | 3,571,107 | |
| Movado Group | | | 122,927 | | | | 3,964,396 | |
| †Skechers U.S.A. Cl. A 1 | | | 87,800 | | | | 3,683,210 | |
| Steven Madden | | | 112,618 | | | | 3,599,271 | |
| †Tapestry | | | 26,300 | | | | 1,001,504 | |
| | | | | | | | 18,077,634 | |
| Total (Cost $48,027,849) | | | | | | | 47,696,292 | |
| | | | | | | | | |
| CONSUMER STAPLES – 2.6% | | | | | | | | |
| FOOD & STAPLES RETAILING - 2.6% | | | | | | | | |
| †Ingles Markets Cl. A | | | 41,111 | | | | 3,965,567 | |
| Village Super Market Cl. A | | | 166,049 | | | | 3,867,281 | |
| Total (Cost $7,490,763) | | | | | | | 7,832,848 | |
| | | | | | | | | |
| ENERGY – 7.7% | | | | | | | | |
| OIL, GAS & CONSUMABLE FUELS - 7.7% | | | | | | | | |
| †Chord Energy | | | 31,873 | | | | 4,360,545 | |
| Civitas Resources | | | 66,400 | | | | 3,846,552 | |
| Dorchester Minerals L.P. | | | 145,105 | | | | 4,342,993 | |
| †Matador Resources | | | 68,700 | | | | 3,932,388 | |
| †Riley Exploration Permian | | | 116,600 | | | | 3,431,538 | |
| †SilverBow Resources 1,2 | | | 108,696 | | | | 3,073,923 | |
| Total (Cost $20,896,212) | | | | | | | 22,987,939 | |
| | | | | | | | | |
| FINANCIALS – 16.4% | | | | | | | | |
| BANKS - 7.2% | | | | | | | | |
| †Bank of Princeton | | | 81,069 | | | | 2,571,509 | |
| Chemung Financial | | | 3,545 | | | | 162,609 | |
| Citizens Community Bancorp | | | 170,701 | | | | 2,053,533 | |
| CNB Financial | | | 130,956 | | | | 3,115,443 | |
| Financial Institutions | | | 96,663 | | | | 2,354,711 | |
| †First United | | | 11,665 | | | | 229,217 | |
| Landmark Bancorp | | | 37,921 | | | | 858,152 | |
| †Mid Penn Bancorp | | | 86,758 | | | | 2,600,137 | |
| National Bankshares | | | 51,655 | | | | 2,081,697 | |
| †Riverview Bancorp | | | 231,786 | | | | 1,780,116 | |
| Unity Bancorp | | | 138,708 | | | | 3,790,890 | |
| | | | | | | | 21,598,014 | |
| CAPITAL MARKETS - 3.4% | | | | | | | | |
| Evercore Cl. A | | | 44,300 | | | | 4,832,244 | |
| Houlihan Lokey Cl. A | | | 31,842 | | | | 2,775,349 | |
| Moelis & Company Cl. A | | | 71,201 | | | | 2,731,982 | |
| | | | | | | | 10,339,575 | |
| INSURANCE - 2.2% | | | | | | | | |
| Employers Holdings | | | 43,134 | | | | 1,860,369 | |
| Tiptree | | | 339,672 | | | | 4,701,061 | |
| | | | | | | | 6,561,430 | |
| THRIFTS & MORTGAGE FINANCE - 3.6% | | | | | | | | |
| Timberland Bancorp | | | 142,770 | | | | 4,872,740 | |
| TrustCo Bank Corp NY | | | 85,877 | | | | 3,228,116 | |
| †Western New England Bancorp | | | 273,695 | | | | 2,589,155 | |
| | | | | | | | 10,690,011 | |
| Total (Cost $42,719,381) | | | | | | | 49,189,030 | |
| | | | | | | | | |
| HEALTH CARE – 6.9% | | | | | | | | |
| BIOTECHNOLOGY - 2.3% | | | | | | | | |
| Catalyst Pharmaceuticals 1 | | | 147,683 | | | | 2,746,904 | |
| Ironwood Pharmaceuticals Cl. A 1 | | | 329,811 | | | | 4,086,358 | |
| | | | | | | | 6,833,262 | |
| HEALTH CARE PROVIDERS & SERVICES - 3.4% | | | | | | | | |
| Cross Country Healthcare 1 | | | 155,775 | | | | 4,138,942 | |
| Ensign Group (The) | | | 17,264 | | | | 1,633,347 | |
| Molina Healthcare 1 | | | 13,300 | | | | 4,391,926 | |
| | | | | | | | 10,164,215 | |
| PHARMACEUTICALS - 1.2% | | | | | | | | |
| SIGA Technologies | | | 478,499 | | | | 3,521,753 | |
| Total (Cost $16,926,711) | | | | | | | 20,519,230 | |
| | | | | | | | | |
| INDUSTRIALS – 18.9% | | | | | | | | |
| AIR FREIGHT & LOGISTICS - 1.3% | | | | | | | | |
| †Hub Group Cl. A 1 | | | 47,772 | | | | 3,797,396 | |
| BUILDING PRODUCTS - 3.8% | | | | | | | | |
| Builders FirstSource 1 | | | 33,230 | | | | 2,155,962 | |
| †Insteel Industries | | | 87,400 | | | | 2,405,248 | |
| Quanex Building Products | | | 152,823 | | | | 3,618,849 | |
| UFP Industries | | | 39,200 | | | | 3,106,600 | |
| | | | | | | | 11,286,659 | |
| CONSTRUCTION & ENGINEERING - 3.0% | | | | | | | | |
| Northwest Pipe 1 | | | 104,725 | | | | 3,529,233 | |
| Sterling Infrastructure 1 | | | 167,849 | | | | 5,505,447 | |
| | | | | | | | 9,034,680 | |
| ELECTRICAL EQUIPMENT - 1.1% | | | | | | | | |
| †Preformed Line Products | | | 40,125 | | | | 3,342,011 | |
| PROFESSIONAL SERVICES - 5.2% | | | | | | | | |
| Barrett Business Services | | | 40,448 | | | | 3,772,989 | |
| Heidrick & Struggles International | | | 84,805 | | | | 2,371,996 | |
| Kforce | | | 37,114 | | | | 2,034,961 | |
| Korn Ferry | | | 54,835 | | | | 2,775,748 | |
| 16 | Royce Capital Fund 2022 Annual Report to Shareholders | THE ACCOMPANYING NOTES ARE AN INTEGRAL PART OF THESE FINANCIAL STATEMENTS |
Royce Capital Fund - Small-Cap Portfolio (continued)
| | | SHARES | | | VALUE | |
| | | | | | | |
| INDUSTRIALS (continued) | | | | | | | | |
| PROFESSIONAL SERVICES (continued) | | | | | | | | |
| †Mastech Digital 1 | | | 73,802 | | | $ | 812,560 | |
| Resources Connection | | | 208,267 | | | | 3,827,947 | |
| | | | | | | | 15,596,201 | |
| ROAD & RAIL - 4.5% | | | | | | | | |
| ArcBest Corporation | | | 48,549 | | | | 3,400,372 | |
| Heartland Express | | | 185,567 | | | | 2,846,598 | |
| Schneider National Cl. B | | | 187,400 | | | | 4,385,160 | |
| Werner Enterprises | | | 72,350 | | | | 2,912,811 | |
| | | | | | | | 13,544,941 | |
| Total (Cost $49,120,761) | | | | | | | 56,601,888 | |
| | | | | | | | | |
| INFORMATION TECHNOLOGY – 23.5% | | | | | | | | |
| COMMUNICATIONS EQUIPMENT - 1.3% | | | | | | | | |
| †Aviat Networks 1 | | | 123,614 | | | | 3,855,521 | |
| ELECTRONIC EQUIPMENT, INSTRUMENTS & COMPONENTS - 13.3% | | | | | | | | |
| ePlus 1 | | | 82,388 | | | | 3,648,141 | |
| Flex 1 | | | 252,900 | | | | 5,427,234 | |
| Insight Enterprises 1 | | | 40,065 | | | | 4,017,318 | |
| Jabil | | | 75,400 | | | | 5,142,280 | |
| Kimball Electronics 1 | | | 213,516 | | | | 4,823,326 | |
| PC Connection | | | 74,426 | | | | 3,490,579 | |
| Sanmina Corporation 1 | | | 86,043 | | | | 4,929,403 | |
| TD SYNNEX | | | 36,842 | | | | 3,489,306 | |
| Vishay Intertechnology | | | 219,661 | | | | 4,738,088 | |
| | | | | | | | 39,705,675 | |
| IT SERVICES - 2.1% | | | | | | | | |
| †Computer Task Group 1 | | | 354,629 | | | | 2,680,995 | |
| IBEX 1 | | | 149,760 | | | | 3,721,536 | |
| | | | | | | | 6,402,531 | |
| SEMICONDUCTORS & SEMICONDUCTOR EQUIPMENT - 5.6% | | | | | | | | |
| †Alpha and Omega Semiconductor 1 | | | 116,746 | | | | 3,335,433 | |
| Amkor Technology | | | 161,384 | | | | 3,869,988 | |
| Cohu 1 | | | 111,460 | | | | 3,572,293 | |
| Kulicke & Soffa Industries | | | 41,413 | | | | 1,832,939 | |
| MKS Instruments | | | 4,091 | | | | 346,631 | |
| Ultra Clean Holdings 1 | | | 113,138 | | | | 3,750,525 | |
| | | | | | | | 16,707,809 | |
| SOFTWARE - 1.2% | | | | | | | | |
| Adeia | | | 369,600 | | | | 3,503,808 | |
| Total (Cost $59,551,448) | | | | | | | 70,175,344 | |
| | | | | | | | | |
| REAL ESTATE – 2.3% | | | | | | | | |
| REAL ESTATE MANAGEMENT & DEVELOPMENT - 2.3% | | | | | | | | |
| Marcus & Millichap | | | 108,025 | | | | 3,721,461 | |
| †RMR Group (The) Cl. A | | | 112,222 | | | | 3,170,272 | |
| Total (Cost $7,180,513) | | | | | | | 6,891,733 | |
| | | | | | | | | |
| TOTAL COMMON STOCKS | | | | | | | | |
| (Cost $263,472,693) | | | | | | | 292,773,332 | |
| | | | | | | | | |
| REPURCHASE AGREEMENT– 1.8% | | | | | | | | |
Fixed Income Clearing Corporation, 1.28% dated 12/30/22, due 1/3/23, maturity value
$5,361,025 (collateralized by obligations of U.S. Government Agencies, 0.375%
due 7/15/25, valued at $5,467,565) | | | | | | | | |
| (Cost $5,360,262) | | | | | | | 5,360,262 | |
| | | | | | | | | |
| COLLATERAL RECEIVED FOR SECURITIES LOANED – 0.3% | | | | | | | | |
| Money Market Funds | | | | | | | | |
| Federated Hermes Government Obligations Fund - Institutional Shares (7 day yield-4.10%) | | | | | | | | |
| (Cost $872,498) | | | 872,498 | | | | 872,498 | |
| | | | | | | | | |
| TOTAL INVESTMENTS – 100.0% | | | | | | | | |
| (Cost $269,705,453) | | | | | | | 299,006,092 | |
| | | | | | | | | |
| CASH AND OTHER ASSETS LESS LIABILITIES – 0.0% | | | | | | | 80,308 | |
| | | | | | | | | |
| NET ASSETS – 100.0% | | | | | | $ | 299,086,400 | |
| 2 | All or a portion of this security was on loan as of December 31, 2022. |
Bold indicates the Fund’s 20 largest equity holdings in terms of December 31, 2022, market value.
| THE ACCOMPANYING NOTES ARE AN INTEGRAL PART OF THESE FINANCIAL STATEMENTS | Royce Capital Fund 2022 Annual Report to Shareholders | 17 |
| Statements of Assets and Liabilities | December 31, 2022 |
| | | Micro-Cap
Portfolio | | | Small-Cap
Portfolio | |
| ASSETS: | | | | | | | | |
| Investments at value (including collateral on loaned securities)1 | | $ | 118,197,772 | | | $ | 293,645,830 | |
| Repurchase agreements (at cost and value) | | | 6,001,031 | | | | 5,360,262 | |
| Receivable for investments sold | | | – | | | | 2,176,475 | |
| Receivable for capital shares sold | | | 18,463 | | | | 5,788 | |
| Receivable for dividends and interest | | | 18,928 | | | | 368,987 | |
| Receivable for securities lending income | | | 567 | | | | 471 | |
| Prepaid expenses and other assets | | | 1,698 | | | | 3,301 | |
| Total Assets | | | 124,238,459 | | | | 301,561,114 | |
| LIABILITIES: | | | | | | | | |
| Payable for collateral on loaned securities | | | 1,072,870 | | | | 872,498 | |
| Payable for investments purchased | | | – | | | | 918,199 | |
| Payable for capital shares redeemed | | | 88,024 | | | | 213,349 | |
| Payable for investment advisory fees | | | 96,350 | | | | 245,953 | |
| Payable for trustees’ fees | | | 9,626 | | | | 18,512 | |
| Accrued expenses | | | 102,899 | | | | 206,203 | |
| Total Liabilities | | | 1,369,769 | | | | 2,474,714 | |
| Net Assets | | $ | 122,868,690 | | | $ | 299,086,400 | |
| ANALYSIS OF NET ASSETS: | | | | | | | | |
| Paid-in capital | | $ | 100,430,843 | | | $ | 244,299,347 | |
| Total distributable earnings (loss) | | | 22,437,847 | | | | 54,787,053 | |
| Net Assets | | $ | 122,868,690 | | | $ | 299,086,400 | |
| Investment Class | | $ | 109,599,573 | | | $ | 139,806,735 | |
| Service Class | | | 13,269,117 | | | | 159,279,665 | |
| SHARES OUTSTANDING (unlimited number of $.001 par value): | | | | | | | | |
| Investment Class | | | 14,205,383 | | | | 16,716,931 | |
| Service Class | | | 1,771,429 | | | | 19,471,316 | |
| NET ASSET VALUES (Net Assets ÷ Shares Outstanding): | | | | | | | | |
| (offering and redemption price per share) | | | | | | | | |
| Investment Class | | $ | 7.72 | | | $ | 8.36 | |
| Service Class | | | 7.49 | | | | 8.18 | |
| Investments at identified cost | | $ | 94,762,840 | | | $ | 264,345,191 | |
| Market value of loaned securities2 | | | 3,010,493 | | | | 843,564 | |
| 1 | See Notes to Financial Statements for information on non-cash collateral on loaned securities. |
| 2 | Market value of loaned securities backed by non-cash collateral is as of prior business day. |
| 18 | Royce Capital Fund 2022 Annual Report to Shareholders | THE ACCOMPANYING NOTES ARE AN INTEGRAL PART OF THESE FINANCIAL STATEMENTS |
| Statements of Operations | Year Ended December 31, 2022 |
| | | Micro-Cap
Portfolio | | | Small-Cap
Portfolio | |
| INVESTMENT INCOME: | | | | | | | | |
| INCOME: | | | | | | | | |
| Dividends | | $ | 977,469 | | | $ | 5,310,977 | |
| Foreign withholding tax | | | (16,531 | ) | | | – | |
| Interest | | | 23,713 | | | | 48,328 | |
| Securities lending | | | 10,633 | | | | 5,916 | |
| Total income | | | 995,284 | | | | 5,365,221 | |
| EXPENSES: | | | | | | | | |
| Investment advisory fees | | | 1,511,831 | | | | 2,644,926 | |
| Distribution fees | | | 37,883 | | | | 294,092 | |
| Administrative and office facilities | | | 83,734 | | | | 145,277 | |
| Trustees’ fees | | | 40,250 | | | | 76,885 | |
| Audit | | | 34,217 | | | | 34,404 | |
| Custody | | | 28,881 | | | | 72,793 | |
| Shareholder reports | | | 19,534 | | | | 20,876 | |
| Shareholder servicing | | | 16,860 | | | | 16,107 | |
| Legal | | | 7,796 | | | | 15,457 | |
| Other expenses | | | 12,243 | | | | 22,838 | |
| Total expenses | | | 1,793,229 | | | | 3,343,655 | |
| Compensating balance credits | | | (32 | ) | | | (34 | ) |
| Fees waived by investment adviser | | | (100,978 | ) | | | (160,289 | ) |
| Expenses reimbursed by investment adviser | | | (35,820 | ) | | | (32,838 | ) |
| Net expenses | | | 1,656,399 | | | | 3,150,494 | |
| Net investment income (loss) | | | (661,115 | ) | | | 2,214,727 | |
| REALIZED AND UNREALIZED GAIN (LOSS) ON INVESTMENTS AND FOREIGN CURRENCY: | | | | | | | | |
| NET REALIZED GAIN (LOSS): | | | | | | | | |
| Investments | | | (936,877 | ) | | | 23,593,936 | |
| Foreign currency transactions | | | (4,097 | ) | | | – | |
| NET CHANGE IN UNREALIZED APPRECIATION (DEPRECIATION): | | | | | | | | |
| Investments | | | (37,954,970 | ) | | | (66,154,197 | ) |
| Other assets and liabilities denominated in foreign currency | | | (49 | ) | | | – | |
| Net realized and unrealized gain (loss) on investments and foreign currency | | | (38,895,993 | ) | | | (42,560,261 | ) |
| NET INCREASE (DECREASE) IN NET ASSETS FROM INVESTMENT OPERATIONS | | $ | (39,557,108 | ) | | $ | (40,345,534 | ) |
| THE ACCOMPANYING NOTES ARE AN INTEGRAL PART OF THESE FINANCIAL STATEMENTS | Royce Capital Fund 2022 Annual Report to Shareholders | 19 |
| Statements of Changes in Net Assets | |
| | Micro-Cap Portfolio | | | Small-Cap Portfolio | |
| | | Year Ended 12/31/22 | | | Year Ended 12/31/21 | | | Year Ended 12/31/22 | | | Year Ended 12/31/21 | |
| INVESTMENT OPERATIONS: | | | | | | | | | | | | | | | | |
| Net investment income (loss) | | $ | (661,115 | ) | | $ | (1,126,184 | ) | | $ | 2,214,727 | | | $ | 851,477 | |
| Net realized gain (loss) on investments and foreign currency | | | (940,974 | ) | | | 41,059,554 | | | | 23,593,936 | | | | 73,334,166 | |
| Net change in unrealized appreciation (depreciation) on investments and foreign currency | | | (37,955,019 | ) | | | 7,347,018 | | | | (66,154,197 | ) | | | 23,002,833 | |
| Net increase (decrease) in net assets from investment operations | | | (39,557,108 | ) | | | 47,280,388 | | | | (40,345,534 | ) | | | 97,188,476 | |
| DISTRIBUTIONS: | | | | | | | | | | | | | | | | |
| Total distributable earnings | | | | | | | | | | | | | | | | |
| Investment Class | | | (35,639,401 | ) | | | (6,830,287 | ) | | | (3,069,857 | ) | | | (2,372,831 | ) |
| Service Class | | | (4,335,006 | ) | | | (1,339,305 | ) | | | (3,038,165 | ) | | | (2,440,124 | ) |
| Total distributions | | | (39,974,407 | ) | | | (8,169,592 | ) | | | (6,108,022 | ) | | | (4,812,955 | ) |
| CAPITAL SHARE TRANSACTIONS: | | | | | | | | | | | | | | | | |
| Value of shares sold | | | | | | | | | | | | | | | | |
| Investment Class | | | 9,925,000 | | | | 26,804,964 | | | | 10,505,441 | | | | 23,770,159 | |
| Service Class | | | 1,132,977 | | | | 9,163,274 | | | | 109,240,664 | | | | 2,580,610 | |
| Distributions reinvested | | | | | | | | | | | | | | | | |
| Investment Class | | | 35,639,401 | | | | 6,830,287 | | | | 3,069,857 | | | | 2,372,831 | |
| Service Class | | | 4,335,006 | | | | 1,339,305 | | | | 3,038,165 | | | | 2,440,124 | |
| Value of shares redeemed | | | | | | | | | | | | | | | | |
| Investment Class | | | (23,050,585 | ) | | | (43,275,235 | ) | | | (26,631,982 | ) | | | (47,550,848 | ) |
| Service Class | | | (11,854,731 | ) | | | (15,848,237 | ) | | | (135,322,249 | ) | | | (53,801,234 | ) |
| Net increase (decrease) in net assets from capital share transactions | | | 16,127,068 | | | | (14,985,642 | ) | | | (36,100,104 | ) | | | (70,188,358 | ) |
| Net Increase (Decrease) in Net Assets | | | (63,404,447 | ) | | | 24,125,154 | | | | (82,553,660 | ) | | | 22,187,163 | |
| NET ASSETS: | | | | | | | | | | | | | | | | |
| Beginning of year | | | 186,273,137 | | | | 162,147,983 | | | | 381,640,060 | | | | 359,452,897 | |
| End of year | | $ | 122,868,690 | | | $ | 186,273,137 | | | $ | 299,086,400 | | | $ | 381,640,060 | |
| 20 | Royce Capital Fund 2022 Annual Report to Shareholders | THE ACCOMPANYING NOTES ARE AN INTEGRAL PART OF THESE FINANCIAL STATEMENTS |
Financial Highlights
This table is presented to show selected data for a share outstanding throughout each year and to assist shareholders in evaluating a Fund’s performance for the periods presented. Per share amounts have been determined on the basis of the weighted average number of shares outstanding during the period.
| | | | | | | | | | | | | | | | | | | | | | | | | | | | | | | | | Ratio of Expenses to Average Net Assets | | | | | | | |
| | | Net Asset Value,
Beginning of
Period | | | Net Investment
Income (Loss) | | | Net Realized and
Unrealized Gain (Loss) on
Investments and
Foreign Currency | | | Total from
Investment
Operations | | | Distributions
from Net
Investment
Income | | | Distributions from
Net Realized Gain on
Investments and
Foreign Currency | | | Total
Distributions | | | Net Asset
Value, End of
Period | | | Total Return | | | Net Assets,
End of Period
(in thousands) | | | Prior to Fee
Waivers,
Expense
Reimbursements
and Balance
Credits | | | Prior to Fee
Waivers and
Expense
Reimbursements | | | Net of Fee
Waivers and
Expense
Reimbursements | | | Ratio of Net
Investment
Income (Loss) to
Average Net
Assets | | | Portfolio
Turnover Rate | |
| Micro-Cap Portfolio–Investment Class | | | | | | | | | | | | | | | | | | | | | | | | | | | | | | | | | | | | | | | | | | | | | | | |
| 2022 | | $ | 14.77 | | | $ | (0.05 | ) | | $ | (3.28 | ) | | $ | (3.33 | ) | | $ | – | | | $ | (3.72 | ) | | $ | (3.72 | ) | | $ | 7.72 | | | | (22.43 | )% | | $ | 109,600 | | | | 1.31 | % | | | 1.31 | % | | | 1.21 | % | | | (0.46 | )% | | | 12 | % |
| 2021 | | | 11.91 | | | | (0.08 | ) | | | 3.61 | | | | 3.53 | | | | – | | | | (0.67 | ) | | | (0.67 | ) | | | 14.77 | | | | 29.98 | | | | 157,042 | | | | 1.37 | | | | 1.37 | | | | 1.33 | | | | (0.56 | ) | | | 25 | |
| 2020 | | | 9.75 | | | | (0.05 | ) | | | 2.36 | | | | 2.31 | | | | – | | | | (0.15 | ) | | | (0.15 | ) | | | 11.91 | | | | 23.79 | | | | 134,109 | | | | 1.47 | | | | 1.47 | | | | 1.33 | | | | (0.51 | ) | | | 25 | |
| 2019 | | | 8.97 | | | | (0.04 | ) | | | 1.77 | | | | 1.73 | | | | – | | | | (0.95 | ) | | | (0.95 | ) | | | 9.75 | | | | 19.55 | | | | 132,008 | | | | 1.43 | | | | 1.43 | | | | 1.33 | | | | (0.41 | ) | | | 26 | |
| 2018 | | | 10.39 | | | | (0.03 | ) | | | (0.90 | ) | | | (0.93 | ) | | | – | | | | (0.49 | ) | | | (0.49 | ) | | | 8.97 | | | | (9.13 | ) | | | 127,457 | | | | 1.39 | | | | 1.39 | | | | 1.33 | | | | (0.30 | ) | | | 28 | |
| Micro-Cap Portfolio–Service Class | | | | | | | | | | | | | | | | | | | | | | | | | | | | | | | | | | | | | | | | | | | | | | | |
| 2022 | | $ | 14.37 | | | $ | (0.08 | ) | | $ | (3.18 | ) | | $ | (3.26 | ) | | $ | – | | | $ | (3.62 | ) | | $ | (3.62 | ) | | $ | 7.49 | | | | (22.65 | )% | | $ | 13,269 | | | | 1.61 | % | | | 1.61 | % | | | 1.47 | % | | | (0.74 | )% | | | 12 | % |
| 2021 | | | 11.63 | | | | (0.11 | ) | | | 3.50 | | | | 3.39 | | | | – | | | | (0.65 | ) | | | (0.65 | ) | | | 14.37 | | | | 29.52 | | | | 29,231 | | | | 1.64 | | | | 1.64 | | | | 1.58 | | | | (0.81 | ) | | | 25 | |
| 2020 | | | 9.54 | | | | (0.07 | ) | | | 2.31 | | | | 2.24 | | | | – | | | | (0.15 | ) | | | (0.15 | ) | | | 11.63 | | | | 23.55 | | | | 28,039 | | | | 1.72 | | | | 1.72 | | | | 1.58 | | | | (0.75 | ) | | | 25 | |
| 2019 | | | 8.80 | | | | (0.06 | ) | | | 1.73 | | | | 1.67 | | | | – | | | | (0.93 | ) | | | (0.93 | ) | | | 9.54 | | | | 19.24 | | | | 27,090 | | | | 1.71 | | | | 1.71 | | | | 1.58 | | | | (0.66 | ) | | | 26 | |
| 2018 | | | 10.21 | | | | (0.06 | ) | | | (0.87 | ) | | | (0.93 | ) | | | – | | | | (0.48 | ) | | | (0.48 | ) | | | 8.80 | | | | (9.29 | ) | | | 14,644 | | | | 1.64 | | | | 1.64 | | | | 1.58 | | | | (0.57 | ) | | | 28 | |
| Small-Cap Portfolio–Investment Class | | | | | | | | | | | | | | | | | | | | | | | | | | | | | | | | | | | | | | | | | | | | | | | | |
| 2022 | | $ | 9.41 | | | $ | 0.08 | | | $ | (0.94 | ) | | $ | (0.86 | ) | | $ | (0.04 | ) | | $ | (0.15 | ) | | $ | (0.19 | ) | | $ | 8.36 | | | | (9.20 | )% | | $ | 139,807 | | | | 1.15 | % | | | 1.15 | % | | | 1.08 | % | | | 0.96 | % | | | 88 | % |
| 2021 | | | 7.41 | | | | 0.03 | | | | 2.10 | | | | 2.13 | | | | (0.13 | ) | | | – | | | | (0.13 | ) | | | 9.41 | | | | 28.82 | | | | 172,388 | | | | 1.11 | | | | 1.11 | | | | 1.08 | | | | 0.37 | | | | 51 | |
| 2020 | | | 8.19 | | | | 0.06 | | | | (0.65 | ) | | | (0.59 | ) | | | (0.07 | ) | | | (0.12 | ) | | | (0.19 | ) | | | 7.41 | | | | (7.15 | ) | | | 153,953 | | | | 1.19 | | | | 1.19 | | | | 1.08 | | | | 0.90 | | | | 95 | |
| 2019 | | | 7.87 | | | | 0.09 | | | | 1.37 | | | | 1.46 | | | | (0.06 | ) | | | (1.08 | ) | | | (1.14 | ) | | | 8.19 | | | | 18.67 | | | | 173,492 | | | | 1.15 | | | | 1.15 | | | | 1.08 | | | | 1.04 | | | | 111 | |
| 2018 | | | 8.77 | | | | 0.06 | | | | (0.78 | ) | | | (0.72 | ) | | | (0.07 | ) | | | (0.11 | ) | | | (0.18 | ) | | | 7.87 | | | | (8.24 | ) | | | 171,561 | | | | 1.11 | | | | 1.11 | | | | 1.08 | | | | 0.62 | | | | 56 | |
| Small-Cap Portfolio–Service Class | | | | | | | | | | | | | | | | | | | | | | | | | | | | | | | | | | | | | | | | | | | | | | | | |
| 2022 | | $ | 9.20 | | | $ | 0.06 | | | $ | (0.92 | ) | | $ | (0.86 | ) | | $ | (0.01 | ) | | $ | (0.15 | ) | | $ | (0.16 | ) | | $ | 8.18 | | | | (9.41 | )% | | $ | 159,279 | | | | 1.40 | % | | | 1.40 | % | | | 1.33 | % | | | 0.68 | % | | | 88 | % |
| 2021 | | | 7.25 | | | | 0.01 | | | | 2.05 | | | | 2.06 | | | | (0.11 | ) | | | – | | | | (0.11 | ) | | | 9.20 | | | | 28.45 | | | | 209,252 | | | | 1.35 | | | | 1.35 | | | | 1.33 | | | | 0.10 | | | | 51 | |
| 2020 | | | 8.01 | | | | 0.05 | | | | (0.64 | ) | | | (0.59 | ) | | | (0.05 | ) | | | (0.12 | ) | | | (0.17 | ) | | | 7.25 | | | | (7.33 | ) | | | 205,500 | | | | 1.43 | | | | 1.43 | | | | 1.33 | | | | 0.73 | | | | 95 | |
| 2019 | | | 7.69 | | | | 0.06 | | | | 1.35 | | | | 1.41 | | | | (0.04 | ) | | | (1.05 | ) | | | (1.09 | ) | | | 8.01 | | | | 18.44 | | | | 225,250 | | | | 1.39 | | | | 1.39 | | | | 1.33 | | | | 0.86 | | | | 111 | |
| 2018 | | | 8.55 | | | | 0.04 | | | | (0.76 | ) | | | (0.72 | ) | | | (0.03 | ) | | | (0.11 | ) | | | (0.14 | ) | | | 7.69 | | | | (8.50 | ) | | | 104,129 | | | | 1.34 | | | | 1.34 | | | | 1.33 | | | | 0.31 | | | | 56 | |
| THE ACCOMPANYING NOTES ARE AN INTEGRAL PART OF THESE FINANCIAL STATEMENTS | Royce Capital Fund 2022 Annual Report to Shareholders | 21 |
Notes to Financial Statements
Summary of Significant Accounting Policies:
Royce Capital Fund – Micro-Cap Portfolio and Royce Capital Fund – Small-Cap Portfolio (the “Fund” or “Funds”) are the two series of Royce Capital Fund (the “Trust”), an open-end management investment company organized as a Delaware statutory trust. Shares of the Funds are offered to life insurance companies for allocation to certain separate accounts established for the purpose of funding qualified and non-qualified variable annuity contracts and variable life insurance contracts. Micro-Cap Portfolio and Small-Cap Portfolio commenced operations on December 27, 1996.
Classes of shares have equal rights as to earnings and assets, except that each class may bear different fees and expenses for distribution, shareholder servicing, registration and shareholder reports, and receive different compensating balance credits and expense reimbursements. Investment income, realized and unrealized capital gains or losses on investments and foreign currency, and expenses other than those attributable to a specific class are allocated to each class of shares based on its relative net assets.
The preparation of financial statements in conformity with accounting principles generally accepted in the United States of America requires management to make estimates and assumptions that affect the reported amounts of assets and liabilities and the disclosure of contingent assets and liabilities at the date of the financial statements and the reported amounts of income and expenses during the reporting period. Actual results could differ from those estimates.
Each Fund is an investment company and accordingly follows the investment company accounting and reporting guidance of the Financial Accounting Standards Board (FASB) Accounting Standard Codification Topic 946 “Financial Services-Investment Companies.”
Royce & Associates, LP, the Funds’ investment adviser, is a majority-owned subsidiary of Franklin Resources, Inc. and primarily conducts business using the name Royce Investment Partners (“Royce”).
VALUATION OF INVESTMENTS:
Portfolio securities held by the Funds are valued as of the close of trading on the New York Stock Exchange (“NYSE”) (generally 4:00 p.m. Eastern time) on the valuation date. Investments in money market funds are valued at net asset value per share. Values for non-U.S. dollar denominated equity securities are converted to U.S. dollars daily based upon prevailing foreign currency exchange rates as quoted by a major bank.
Equity securities that are listed on an exchange or Nasdaq, or traded on OTC Market Group Inc.’s OTC Link ATS or other alternative trading system, are valued: (i) on the basis of their last reported sales prices or official closing prices, as applicable, on a valuation date; or (ii) at their highest reported bid prices in the event such equity securities did not trade on a valuation date. Such inputs are generally referred to as “Level 1” inputs because they represent reliable quoted prices in active markets for identical securities.
If the value of a portfolio security held by a Fund cannot be determined solely by reference to Level 1 inputs, such portfolio security will be “fair valued.” The Trust’s Board of Trustees has designated Royce as valuation designee to perform fair value determinations for such portfolio securities in accordance with Rule 2a-5 under the Investment Company Act of 1940, (“Rule 2a-5”). Pursuant to Rule 2a-5, fair values are determined in accordance with policies and procedures approved by the Trust’s Board of Trustees and policies and procedures adopted by Royce in its capacity as valuation designee for the Trust. Fair valued securities are reported as either “Level 2” or “Level 3” securities.
As a general principle, the fair value of a security is the amount which a Fund might reasonably expect to receive for the security upon its current sale. However, in light of the judgment involved in fair valuations, no assurance can be given that a fair value assigned to a particular portfolio security will be the amount which the Fund might be able to receive upon its current sale. When a fair value pricing methodology is used, the fair value prices used by the Fund for such securities will likely differ from the quoted or published prices for the same securities.
Level 2 inputs are other significant observable inputs (e.g., dealer bid side quotes and quoted prices for securities with comparable characteristics). Examples of situations in which Level 2 inputs are used to fair value portfolio securities held by the Funds on a particular valuation date include:
| ● | Over-the-counter equity securities other than those traded on OTC Market Group Inc.’s OTC Link ATS or other alternative trading system (collectively referred to herein as “Other OTC Equity Securities”) are fair valued at their highest bid price when Royce receives at least two bid side quotes from dealers who make markets in such securities; |
| ● | Certain bonds and other fixed income securities may be fair valued by reference to other securities with comparable ratings, interest rates, and maturities in accordance with valuation methodologies maintained by certain independent pricing services; and |
| ● | The Funds use an independent pricing service to fair value certain non-U.S. equity securities when U.S. market volatility exceeds a certain threshold. This pricing service uses proprietary correlations it has developed between the movement of prices of non-U.S. equity securities and indices of U.S.-traded securities, futures contracts, and other indications to estimate the fair value of such non-U.S. securities. |
22 | Royce Capital Fund 2022 Annual Report to Shareholders
VALUATION OF INVESTMENTS (continued):
Level 3 inputs are significant unobservable inputs. Examples of Level 3 inputs include (without limitation) the last trade price for a security before trading was suspended or terminated; discounts to last trade price for lack of marketability or otherwise; market price information regarding other securities; information received from the issuer and/or published documents, including SEC filings and financial statements; and other publicly available information. Pursuant to the above-referenced policies and procedures, Royce may use various techniques in making fair value determinations based upon Level 3 inputs, which techniques may include (without limitation): (i) workout valuation methods (e.g., earnings multiples, discounted cash flows, liquidation values, derivations of book value, firm or probable offers from qualified buyers for the issuer’s ongoing business, etc.); (ii) discount or premium from market, or compilation of other observable market information, for other similar freely traded securities; (iii) conversion from the readily available market price of a security into which an affected security is convertible or exchangeable; and (iv) pricing models or other formulas. In the case of restricted securities, fair value determinations generally start with the inherent or intrinsic worth of the relevant security, without regard to the restrictive feature, and are reduced for any diminution in value resulting from the restrictive feature. Due to the inherent uncertainty of such valuations, these fair values may differ significantly from the values that would have been used had an active market existed.
A security that is valued by reference to Level 1 or Level 2 inputs may drop to Level 3 on a particular valuation date for several reasons, including if:
| ● | an equity security that is listed on an exchange or Nasdaq, or traded on OTC Market Group Inc.’s OTC Link ATS or other alternative trading system, has not traded and there are no bids; |
| ● | Royce does not receive at least two bid side quotes for an Other OTC Equity Security; |
| ● | the independent pricing services are unable to supply fair value prices; or |
| ● | the Level 1 or Level 2 inputs become otherwise unreliable for any reason (e.g., a significant event occurs after the close of trading for a security but prior to the time a Fund prices its shares). |
The table below shows the aggregate value of the various Level 1, Level 2, and Level 3 securities held by the Funds as of December 31, 2022. Any Level 2 or Level 3 securities held by a Fund are noted in its Schedule of Investments. The inputs or methodology used for valuing securities are not necessarily an indication of the risk associated with owning those securities.
| | LEVEL 1 | LEVEL 2 | LEVEL 3 | TOTAL |
| Micro-Cap Portfolio | | | | | |
| Common Stocks | $117,124,902 | $ | – | $0 | $117,124,902 |
| Repurchase Agreement | – | 6,001,031 | – | 6,001,031 |
| Money Market Fund/Collateral Received for Securities Loaned | 1,072,870 | | – | – | 1,072,870 |
| Small-Cap Portfolio | | | | | |
| Common Stocks | 292,773,332 | | – | – | 292,773,332 |
| Repurchase Agreement | – | 5,360,262 | – | 5,360,262 |
| Money Market Fund/Collateral Received for Securities Loaned | 872,498 | | – | – | 872,498 |
Level 3 Reconciliation:
| | | | | | UNREALIZED GAIN (LOSS) 1 | |
| | BALANCE AS OF
12/31/21 | PURCHASES | SALES | REALIZED
GAIN (LOSS) 1 | CURRENTLY HELD
SECURITIES | SECURITIES
NO LONGER HELD | BALANCE AS OF
12/31/22 |
| Micro-Cap Portfolio | | | | | | | |
| Common Stocks | $628,264 | $ – | $806,010 | $(3,336,482) | $0 | $3,514,228 | $0 |
| 1 | The net change in unrealized appreciation (depreciation) is included in the accompanying Statement of Operations. Change in unrealized appreciation (depreciation) includes net unrealized appreciation (depreciation) resulting from changes in investment values during the reporting period and the reversal of previously recorded unrealized appreciation (depreciation) when gains or losses are realized. Net realized gain (loss) from investments and foreign currency transactions is included in the accompanying Statement of Operations. |
REPURCHASE AGREEMENTS:
The Funds may enter into repurchase agreements with institutions that the Funds’ investment adviser has determined are creditworthy. Each Fund restricts repurchase agreements to maturities of no more than seven days. Securities pledged as collateral for repurchase agreements, which are held until maturity of the repurchase agreements, are marked-to-market daily and maintained at a value at least equal to the principal amount of the repurchase agreement (including accrued interest). Repurchase agreements could involve certain risks in the event of default or insolvency of the counter-party, including possible delays or restrictions upon the ability of each Fund to dispose of its underlying securities. The remaining contractual maturities of repurchase agreements held by the Funds as of December 31, 2022, are overnight and continuous.
FOREIGN CURRENCY:
Net realized foreign exchange gains or losses arise from sales and maturities of short-term securities, sales of foreign currencies, expiration of currency forward contracts, currency gains or losses realized between the trade and settlement dates on securities transactions, and the difference between the amounts of dividends, interest, and foreign withholding taxes recorded on each Fund’s books and the U.S. dollar equivalent of the amounts actually received or paid. Net unrealized foreign exchange gains and losses arise
Royce Capital Fund 2022 Annual Report to Shareholders | 23
Notes to Financial Statements (continued)
FOREIGN CURRENCY (continued):
from changes in the value of assets and liabilities, other than investments in securities at the end of the reporting period, as a result of changes in foreign currency exchange rates.
The Funds do not isolate that portion of the results of operations resulting from fluctuations in foreign exchange rates on investments from the fluctuations arising from changes in market prices of securities held. Such fluctuations are included with the net realized and unrealized gain or loss on investments.
SECURITIES LENDING:
The Funds loan securities through a lending agent, State Street Bank and Trust Company, to qualified institutional investors for the purpose of earning additional income. The lending agent receives and holds collateral from such borrowers to secure their obligations to the Funds. Such loans must be secured at all times by collateral in an amount at least equal to the market value of the loaned securities. The market values of the loaned securities and the collateral fluctuate and are determined at the close of each business day by the lending agent. Borrowers are required to post additional collateral to the lending agent on the next succeeding business day in the event of a collateral shortfall. Counterparty risk is further reduced by loaning securities only to parties that participate in a Global Securities Lending Program organized and monitored by the lending agent and that are deemed by it to satisfy its requirements and by having the lending agent enter into securities lending agreements with such borrowers. The lending agent is not affiliated with Royce.
Collateral may be in the form of cash or U.S. Treasuries. Cash collateral is invested in certain money market pooled investment vehicles. The Funds record a liability in their respective Statements of Assets and Liabilities for the return of such cash collateral during periods in which securities are on loan. The Funds bear the risk of loss for any decrease in the market value of the loaned securities or the investments purchased with cash collateral received from the borrowers.
Pursuant to the agreement in place between the Funds and the lending agent, if a borrower fails to return loaned securities, and the cash collateral being maintained by the lending agent on behalf of such borrower is insufficient to cover the value of loaned securities and provided such collateral insufficiency is not the result of investment losses, the lending agent shall, at its option, either replace the loaned securities or pay the amount of the shortfall to the Funds. In the event of the bankruptcy of a borrower, the Funds could experience delay in recovering the loaned securities or only recover cash or a security of equivalent value.
Loans of securities generally do not have stated maturity dates, and the Funds may recall a security at any time. The Funds’ securities lending income consists of the income earned on investing cash collateral, plus any premium payments received for lending certain securities, less any rebates paid to borrowers and lending agent fees associated with the loan. Pursuant to the agreement in place between the Funds and the lending agent, the Funds are responsible for any shortfall in the event the value of the investments purchased with cash collateral is insufficient to pay the rebate fee to the borrower.
The following table presents cash collateral and the market value of securities on loan collateralized by cash collateral held by the Funds as of December 31, 2022:
| | CASH COLLATERAL1 | SECURITIES ON LOAN COLLATERALIZED
BY CASH COLLATERAL | NET AMOUNT |
| Micro-Cap Portfolio | $1,072,870 | $(1,014,809) | $58,061 |
| Small-Cap Portfolio | 872,498 | (843,564) | 28,934 |
| 1 | Absent an event of default, assets and liabilities are presented gross and not offset in the Statements of Assets and Liabilities. The contractual maturity of cash collateral is overnight and continuous. |
The following table presents non-cash collateral and the market value of securities on loan collateralized by non-cash collateral held by the Funds’ custodian as of December 31, 2022:
| | NON-CASH COLLATERAL | SECURITIES ON LOAN COLLATERALIZED
BY NON-CASH COLLATERAL | NET AMOUNT |
| Micro-Cap Portfolio | $2,041,465 | $(1,995,684) | $45,781 |
DISTRIBUTIONS AND TAXES:
As qualified regulated investment companies under Subchapter M of the Internal Revenue Code, the Funds are not subject to income taxes to the extent that each Fund distributes substantially all of its taxable income for its fiscal year.
The Funds pay any dividends and capital gain distributions annually in December. Dividends from net investment income and distributions from capital gains are determined at a class level. Because federal income tax regulations differ from generally accepted accounting principles, income and capital gain distributions determined in accordance with tax regulations may differ from net investment income and realized gains recognized for financial reporting purposes. Accordingly, the character of distributions and composition of net assets for tax purposes differ from those reflected in the accompanying financial statements.
INVESTMENT TRANSACTIONS AND RELATED INVESTMENT INCOME:
Investment transactions are accounted for on the trade date. Dividend income is recorded on the ex-dividend date. Non-cash dividend income is recorded at the fair market value of the securities received. Interest income is recorded on an accrual basis. Realized gains and losses from investment transactions are determined on the basis of identified cost for book and tax purposes.
24 | Royce Capital Fund 2022 Annual Report to Shareholders
EXPENSES:
The Funds incur direct and indirect expenses. Expenses directly attributable to a Fund are charged to the Fund, while expenses applicable to more than one of the Royce Funds are allocated equitably. Certain personnel, occupancy costs and other administrative expenses related to all of the Royce Funds are allocated by Royce under an administration agreement and are included in administrative and office facilities and legal expenses.
COMPENSATING BALANCE CREDITS:
The Funds have arrangements with their custodian bank and transfer agent, whereby a portion of the custodian’s fee and transfer agent’s fee is paid indirectly by credits earned on a Fund’s cash on deposit with the bank and transfer agent. These deposit arrangements are an alternative to purchasing overnight investments. Conversely, a Fund pays interest to the custodian on any cash overdrafts, to the extent they are not offset by credits earned on positive cash balances.
LINE OF CREDIT:
The Funds, along with certain other Royce Funds, participate in a $65 million line of credit (“Credit Agreement”) with State Street Bank and Trust Company to be used for temporary or emergency purposes. This revolving Credit Agreement expires on October 6, 2023. Pursuant to the Credit Agreement, each participating Fund is liable for a portion of the commitment fee for the credit facility and for principal and interest payments related to borrowings made by that Fund. Borrowings under the Credit Agreement bear interest at a variable rate equal to the Applicable Rate plus the Applicable Margin. The term Applicable Rate means, for any day, a rate equal to the sum of (a) 0.10%, plus (b) the higher of (i) the Federal Funds Effective Rate for such day, or (ii) the Overnight Bank Funding Rate for such day. The term Applicable Margin means 1.25%. The Funds did not utilize the line of credit during the year ended December 31, 2022.
Capital Share Transactions (in shares):
| | SHARES SOLD | SHARES ISSUED FOR REINVESTMENT
OF DISTRIBUTIONS | SHARES REDEEMED | NET INCREASE (DECREASE) IN
SHARES OUTSTANDING |
| | Year Ended
12/31/22 | Year Ended
12/31/21 | Year Ended
12/31/22 | Year Ended
12/31/21 | Year Ended
12/31/22 | Year Ended
12/31/21 | Year Ended
12/31/22 | Year Ended
12/31/21 |
| Micro-Cap Portfolio | | | | | | | | |
| Investment Class | 876,101 | 1,897,065 | 4,634,513 | 489,977 | (1,938,927) | (3,009,438) | 3,571,687 | (622,396) |
| Service Class | 98,642 | 663,833 | 580,322 | 98,696 | (941,140) | (1,140,542) | (262,176) | (378,013) |
| Small-Cap Portfolio | | | | | | | | |
| Investment Class | 1,233,648 | 2,660,185 | 363,727 | 262,481 | (3,195,023) | (5,372,952) | (1,597,648) | (2,450,286) |
| Service Class | 12,673,100 | 293,885 | 368,263 | 276,032 | (16,317,611) | (6,172,963) | (3,276,248) | (5,603,046) |
Investment Adviser and Distributor:
INVESTMENT ADVISER:
Under the Trust’s investment advisory agreements with Royce, Royce is entitled to receive investment advisory fees in respect of each Fund that are computed daily and payable monthly. Royce has contractually agreed, without right of termination, to waive fees and/or reimburse expenses (excluding brokerage commissions, taxes, interest, litigation expenses, acquired fund fees and expenses, and other expenses not borne in the ordinary course of business) to the extent necessary to maintain the Funds’ net annual operating expense ratios at specified levels through April 30, 2023. To the extent that they impacted net expenses for the year ended December 31, 2022, the effects of those arrangements are shown below. See the Prospectus for contractual waivers and expiration dates.
| | ANNUAL CONTRACTUAL | COMMITTED NET ANNUAL | YEAR ENDED |
| | ADVISORY FEE AS A | OPERATING EXPENSE RATIO CAP | DECEMBER 31, 2022 |
| | PERCENTAGE OF AVERAGE | | | | |
| | NET ASSETS | Investment Class | Service Class | Net advisory fees | Advisory fees waived |
| Micro-Cap Portfolio | 1.00%1 | 1.08%2 | 1.33%3 | $ 1,410,853 | $ 100,978 |
| Small-Cap Portfolio | 1.00% | 1.08% | 1.33% | 2,484,637 | 160,289 |
| 1 | The annual contractual advisory fee for Micro-Cap Portfolio was reduced to 1.00% effective July 1, 2022. |
| 2 | Micro-Cap Portfolio’s committed net annual operating expense ratio cap was reduced from 1.33% to 1.08% for Investment Class, effective July 1, 2022. |
| 3 | Micro-Cap Portfolio’s committed net annual operating expense ratio cap was reduced from 1.58% to 1.33% for Service Class, effective July 1, 2022. |
DISTRIBUTOR:
Royce Fund Services, LLC (“RFS”), the distributor of the Trust’s shares, is a wholly owned subsidiary of Royce. RFS is entitled to receive distribution fees from each Fund’s Service Class that are computed daily and payable monthly, at an annual rate of 0.25% of the average net assets of each Class. For the year ended December 31, 2022, Micro-Cap Portfolio-Service Class recorded distribution fees of $37,883 and Small-Cap Portfolio-Service Class recorded distribution fees of $294,092.
Royce Capital Fund 2022 Annual Report to Shareholders | 25
Notes to Financial Statements (continued)
Purchases and Sales of Investment Securities:
For the year ended December 31, 2022, the costs of purchases and the proceeds from sales of investment securities, other than short-term securities and collateral received for securities loaned, were as follows:
| | | PURCHASES | | | SALES |
| Micro-Cap Portfolio | | $ | 15,759,487 | | | $ | 39,862,302 |
| Small-Cap Portfolio | | | 232,215,258 | | | | 269,782,471 |
Class Specific Expenses:
Class specific expenses were as follows for the year ended December 31, 2022:
| | | DISTRIBUTION
FEES | | | SHAREHOLDER
SERVICING | | | SHAREHOLDER
REPORTS | | | TRANSFER AGENT
BALANCE CREDITS | | | TOTAL | | | CLASS LEVEL
EXPENSES
REIMBURSED BY
INVESTMENT
ADVISER | |
| Micro-Cap Portfolio – Investment Class | | $ | – | | | $ | 9,607 | | | $ | 16,349 | | | $ | (23 | ) | | $ | 25,933 | | | $ | 25,933 | |
| Micro-Cap Portfolio – Service Class | | | 37,883 | | | | 7,253 | | | | 3,185 | | | | (9 | ) | | | 48,312 | | | | 9,887 | |
| | | | 37,883 | | | | 16,860 | | | | 19,534 | | | | (32 | ) | | | | | | | 35,820 | |
| Small-Cap Portfolio – Investment Class | | | – | | | | 8,684 | | | | 10,454 | | | | (20 | ) | | | 19,118 | | | | 19,118 | |
| Small-Cap Portfolio – Service Class | | | 294,092 | | | | 7,423 | | | | 10,422 | | | | (8 | ) | | | 311,929 | | | | 13,720 | |
| | | | 294,092 | | | | 16,107 | | | | 20,876 | | | | (28 | ) | | | | | | | 32,838 | |
Tax Information:
As of December 31, 2022, net unrealized appreciation (depreciation) based on identified cost for tax purposes was as follows:
| | | NET UNREALIZED | GROSS UNREALIZED |
| | TAX BASIS COST | APPRECIATION (DEPRECIATION) | Appreciation | (Depreciation) |
| Micro-Cap Portfolio | $100,846,083 | $23,352,720 | $37,403,087 | $14,050,367 |
| Small-Cap Portfolio | 271,273,100 | 27,732,992 | 38,165,345 | 10,432,353 |
The primary causes of the difference between book and tax basis cost are the timing of the recognition of losses on securities sold and investments in publicly traded partnerships.
Distributions during the years ended December 31, 2022 and 2021, were characterized as follows for tax purposes:
| | ORDINARY INCOME | LONG-TERM CAPITAL GAINS | RETURN OF CAPITAL |
| | 2022 | 2021 | 2022 | 2021 | 2022 | 2021 |
| Micro-Cap Portfolio | $6,812,803 | $ – | $33,160,394 | $8,169,592 | $1,210 | $ – |
| Small-Cap Portfolio | 683,291 | 4,812,955 | 5,424,731 | – | – | – |
The tax basis components of distributable earnings as of December 31, 2022, were as follows:
| | UNDISTRIBUTED
ORDINARY INCOME | UNDISTRIBUTED
LONG-TERM CAPITAL GAINS OR (CAPITAL LOSS CARRYFORWARD) | NET UNREALIZED
APPRECIATION
(DEPRECIATION)1 | TOTAL DISTRIBUTABLE
EARNINGS | CAPITAL LOSS
CARRYFORWARD
UTILIZED |
| Micro-Cap Portfolio | $ – | $ (914,742) | $23,352,589 | $22,437,847 | $ – |
| Small-Cap Portfolio | 1,816,162 | 25,237,904 | 27,732,987 | 54,787,053 | – |
| 1 | Includes timing differences on foreign currency, recognition of losses on securities sold and investments in publicly traded partnerships. |
For financial reporting purposes, capital accounts and distributions to shareholders are adjusted to reflect the tax character of permanent book/tax differences. For the year ended December 31, 2022, the Funds recorded the following permanent reclassifications, which relate primarily to current net operating losses. Results of operations and net assets were not affected by these reclassifications.
| | TOTAL DISTRIBUTABLE
EARNINGS (LOSS) | PAID-IN
CAPITAL |
| Micro-Cap Portfolio | $666,422 | $(666,422) |
| Small-Cap Portfolio | – | – |
Management has analyzed the Funds’ tax positions taken on federal income tax returns for all open tax years (2019 – 2022) and has concluded that as of December 31, 2022, no provision for income tax is required in the Funds’ financial statements.
Subsequent Events:
Subsequent events have been evaluated through the date the financial statements were issued and it has been determined that no events have occurred that require disclosure.
26 | Royce Capital Fund 2022 Annual Report to Shareholders
Report of Independent Registered Public Accounting Firm
To the Board of Trustees of Royce Capital Fund and Shareholders of Royce Capital Fund – Micro-Cap Portfolio and Royce Capital Fund – Small-Cap Portfolio:
Opinions on the Financial Statements
We have audited the accompanying statements of assets and liabilities, including the schedules of investments, of Royce Capital Fund – Micro-Cap Portfolio and Royce Capital Fund – Small-Cap Portfolio (constituting Royce Capital Fund, hereafter collectively referred to as the “Funds”) as of December 31, 2022, the related statements of operations for the year ended December 31, 2022, the statements of changes in net assets for each of the two years in the period ended December 31, 2022, including the related notes, and the financial highlights for each of the five years in the period ended December 31, 2022 (collectively referred to as the “financial statements”). In our opinion, the financial statements present fairly, in all material respects, the financial position of each of the Funds as of December 31, 2022, the results of each of their operations for the year then ended, the changes in each of their net assets for each of the two years in the period ended December 31, 2022 and each of the financial highlights for each of the five years in the period ended December 31, 2022 in conformity with accounting principles generally accepted in the United States of America.
Basis for Opinions
These financial statements are the responsibility of the Funds’ management. Our responsibility is to express an opinion on the Funds’ financial statements based on our audits. We are a public accounting firm registered with the Public Company Accounting Oversight Board (United States) (PCAOB) and are required to be independent with respect to the Funds in accordance with the U.S. federal securities laws and the applicable rules and regulations of the Securities and Exchange Commission and the PCAOB.
We conducted our audits of these financial statements in accordance with the standards of the PCAOB. Those standards require that we plan and perform the audit to obtain reasonable assurance about whether the financial statements are free of material misstatement, whether due to error or fraud.
Our audits included performing procedures to assess the risks of material misstatement of the financial statements, whether due to error or fraud, and performing procedures that respond to those risks. Such procedures included examining, on a test basis, evidence regarding the amounts and disclosures in the financial statements. Our audits also included evaluating the accounting principles used and significant estimates made by management, as well as evaluating the overall presentation of the financial statements. Our procedures included confirmation of securities owned as of December 31, 2022 by correspondence with the custodian and brokers; when replies were not received from brokers, we performed other auditing procedures. We believe that our audits provide a reasonable basis for our opinions.
/s/PricewaterhouseCoopers LLP
New York, New York
February 14, 2023
We have served as the auditor of one or more investment companies in the Franklin Templeton Group of Funds since 1948.
Royce Capital Fund 2022 Annual Report to Shareholders | 27
Understanding Your Fund’s Expenses (unaudited)
As a shareholder of a mutual fund, you pay ongoing expenses, including management fees and other Fund expenses including, for some funds, distribution and/or service (12b-1) fees. Using the information below, you can estimate how these ongoing expenses (in dollars) affect your investment and compare them with the ongoing expenses of other funds. You may also incur one-time transaction expenses which are not shown in this section and would result in higher total costs. The example is based on an investment of $1,000 invested at July 1, 2022, and held for the entire six-month period ended December 31, 2022. Service Class shares are generally available only through certain insurance companies who receive service fees from the Fund for services that they perform.
Actual Expenses
The first part of the table below provides information about actual account values and actual expenses. You may use the information in this section, together with the amount you invested, to estimate the expenses that you paid over the period. Simply divide your account value at December 31, 2022, by $1,000 (for example, an $8,600 account value divided by $1,000 = 8.6), then multiply the result by the number under the heading entitled “Expenses Paid During the Period” to estimate the expenses you paid on your account during this period.
Hypothetical Example for Comparison Purposes
The second part of the table below provides information about hypothetical account values and hypothetical expenses based on the Fund’s actual expense ratio and an assumed rate of return of 5% per year before expenses, which is not the Fund’s actual return. The hypothetical account values and expenses may not be used to estimate the actual ending account balance or expenses you paid for the period. You may use this information to compare the ongoing costs of investing in the Fund and other funds. To do so, compare this 5% hypothetical example with the 5% hypothetical examples that appear in the shareholder reports of the other funds.
Please note that the expenses shown in the table are meant to highlight your ongoing costs only and do not reflect any transactional costs, such as sales charges (loads), redemption fees, or exchange fees. Therefore, this section is useful in comparing ongoing costs only, and will not help you determine the relative total costs of owning different funds. In addition, if these transactional costs were included, your costs would have been higher.
| | | ACTUAL | | | HYPOTHETICAL (5% PER YEAR BEFORE EXPENSES) |
| | | Beginning Account
Value 7/1/22 | | Ending Account Value
12/31/22 | | Expenses Paid During the Period1 | | Beginning Account
Value 7/1/22 | | Ending Account Value
12/31/22 | | Expenses Paid
During
the Period1 | | Net Annualized
Operating
Expense Ratio2 |
| Investment Class | | | | | | | | | | | | | | | | | | | | | | | | | | |
| Micro-Cap Portfolio | | $ | 1,000.00 | | | $ | 1,078.76 | | | $ | 5.66 | | | $ | 1,000.00 | | | $ | 1,019.76 | | | $ | 5.50 | | | 1.08% |
| Small-Cap Portfolio | | | 1,000.00 | | | | 1,121.36 | | | | 5.77 | | | | 1,000.00 | | | | 1,019.76 | | | | 5.50 | | | 1.08% |
| Service Class | | | | | | | | | | | | | | | | | | | | | | | | | | |
| Micro-Cap Portfolio | | | 1,000.00 | | | | 1,077.05 | | | | 6.96 | | | | 1,000.00 | | | | 1,018.50 | | | | 6.77 | | | 1.33% |
| Small-Cap Portfolio | | | 1,000.00 | | | | 1,121.65 | | | | 7.11 | | | | 1,000.00 | | | | 1,018.50 | | | | 6.77 | | | 1.33% |
| 1 | Expenses are equal to the Fund’s net annualized operating expense ratio multiplied by the average account value for the period, multiplied by 184 days in the most recent fiscal half-year divided by 365 days (to reflect the half-year period). This information does not include fees or expenses of the variable annuity contracts investing in the Fund. |
| 2 | Net annualized operating expense ratio used to derive figures in the table is based on the most recent fiscal half-year. |
Federal Tax Information
In January 2023, taxable shareholders that opted out of e-delivery were mailed a Form 1099-DIV reporting the federal tax status of all distributions paid during the calendar year 2022. Shareholders who elected e-delivery have received electronic notification of the form being available for download via their Online Account Access.
2022 Supplemental Tax Information:
| | %
QDI | % U.S. GOVT
INCOME | % INCOME QUALIFYING
FOR DRD | LONG-TERM CAPITAL GAIN DISTRIBUTION
MAXIMUM ALLOWABLE (OOO’s) |
| Micro-Cap Portfolio | 21.24% | N/A | 11.61% | $33,161 |
| Small-Cap Portfolio | 100.00% | N/A | 100.00% | 5,425 |
Definitions:
% QDI: Qualified Dividend Income; % of net investment income and/or short-term capital gains distributions that qualify for treatment at long-term capital gain rates.
% U.S. Govt Income: % of investment income paid from U.S. Government obligations.
% Income Qualifying for DRD: % of investment income eligible for the corporate dividend received deduction.
28 | Royce Capital Fund 2022 Annual Report to Shareholders
Trustees and Officers
All Trustees and Officers may be reached c/o The Royce Funds, 745 Fifth Avenue, New York, NY 10151
Christopher D. Clark, Trustee 1, President
Age: 57 | Number of Funds Overseen: 16 | Tenure: Since 2014
Principal Occupation(s) During Past Five Years: Chief Executive Officer (since July 2016), President (since July 2014), Co-Chief Investment Officer (since January 2014), Managing Director of Royce, a Member of the Board of Managers of Royce, having been employed by Royce since May 2007.
Patricia W. Chadwick, Trustee
Age: 74 | Number of Funds Overseen: 16 | Tenure: Since 2009
Non-Royce Directorships: Trustee of Voya Mutual Funds
Principal Occupation(s) During Past 5 Years: Consultant and President, Ravengate Partners LLC (since 2000). Formerly Director, Wisconsin Energy Corp. (until 2022).
Christopher C. Grisanti, Trustee
Age: 61 | Number of Funds Overseen: 16 | Tenure: Since 2017
Non-Royce Directorships: None
Principal Occupation(s) During Past Five Years: Chief Equity Strategist and Senior Portfolio Manager, MAI Capital Management LLC (investment advisory firm) (since May 2020). Formerly Co-Founder and Chief Executive Officer, Grisanti Capital Management LLC (investment advisory firm) (from 1999 to 2020); Director of Research and Portfolio Manager, Spears Benzak, Salomon & Farrell (from 1994 to 1999); and Senior Associate, Simpson, Thacher & Bartlett (law firm) (from 1988 to 1994).
Cecile B. Harper, Trustee
Age: 59 | Number of Funds Overseen: 16 | Tenure: Since 2020
Non-Royce Directorships: None
Principal Occupation(s) During Past Five Years: Chief Financial Officer and Chief Operating Officer, College Foundation at the University of Virginia (since October 2019). Formerly Board Member, Pyramid Peak Foundation (January 2012 to 2022); Board Member, Regional One Health Foundation (from June 2013 to September 2019); and Principal, Southeastern Asset Management (from December 1993 to September 2019).
Arthur S. Mehlman, Trustee
Age: 80 | Number of Funds Overseen: 16 | Tenure: Since 2004
Non-Royce Directorships: None
Principal Occupation(s) During Past Five Years: Director, University of Maryland Foundation (non-profits). Formerly Director/Trustee, registered investment companies constituting the Legg Mason Funds (from 2002 to June 2021); Director, The League for People with Disabilities, Inc. (from June 2003 to June 2018); Director, Municipal Mortgage & Equity, LLC (from October 2004 to April 2011); Director, University of Maryland College Park Foundation (non-profit) (from 1998 to 2005); Director, Maryland Business Roundtable for Education (from July 1984 to June 2002); and Partner, KPMG LLP (international accounting firm) (from 1972 to 2002)
G. Peter O’Brien, Trustee
Age: 77 | Number of Funds Overseen: 73 | Tenure: Since 2001
Non-Royce Directorships: Director/Trustee of registered investment companies constituting the 57 Legg Mason Funds.
Principal Occupation(s) During Past Five Years: Trustee Emeritus, Colgate University (since 2005); and Emeritus Board Member, Hill House, Inc. (since 2019). Formerly Director, TICC Capital Corp. (from 2003-2017); Trustee, Colgate University (from 1996 to 2005); President, Hill House, Inc. (from 2001 to 2005); Board Member, Hill House, Inc. (from 1999 to 2019); Director, Bridges School (from 2006 to 2018); and Managing Director/Equity Capital Markets Group, Merrill Lynch & Co. (from 1971 to 1999).
Michael K. Shields, Trustee
Age: 64 | Number of Funds Overseen: 16 | Tenure: Since 2015
Non-Royce Directorships: None
Principal Occupation(s) During Past Five Years: President and Chief Executive Officer, Piedmont Trust Company (privately-owned North Carolina trust company) (since February 2012); Chairman, UNC Charlotte Investment Fund Board (since February 2016); and Chairman, Halftime Carolinas Board (since February 2011). Formerly Owner, Shields Advisors (investment consulting firm) (from April 2010 to June 2012); President and Chief Executive Officer, Eastover Capital Management (2005-2007); President and Chief Executive Officer, Campbell, Cowperthwait (investment subsidiary of U.S. Trust Corporation) (1997-2002); and equity portfolio manager and co-manager of Quality Growth Team, Scudder, Stevens and Clark (1992-1997).
Francis D. Gannon, Vice President
Age: 55 | Tenure: Since 2014
Principal Occupation(s) During Past Five Years: Co-Chief Investment Officer (since January 2014) and Managing Director of Royce, having been employed by Royce since September 2006.
Daniel A. O’Byrne, Vice President
Age: 60 | Tenure: Since 1994
Principal Occupation(s) During Past Five Years: Principal and Vice President of Royce, having been employed by Royce since October 1986.
Peter K. Hoglund, Treasurer
Age: 56 | Tenure: Since 2015
Principal Occupation(s) During Past Five Years: Chief Financial Officer, Chief Administrative Officer, and Managing Director of Royce, having been employed by Royce since December 2014. Prior to joining Royce, Mr. Hoglund spent more than 20 years with Munder Capital Management in Birmingham, MI, serving as Managing Director and Chief Financial Officer and overseeing all financial aspects of the firm. He began his career at Munder as a portfolio manager.
John E. Denneen, Secretary and Chief Legal Officer
Age: 55 | Tenure: 1996-2001 and Since 2002
Principal Occupation(s) During Past Five Years: General Counsel, Managing Director, and, since June 2015, a Member of the Board of Managers of Royce. Chief Legal and Compliance Officer and Secretary of Royce.
John P. Schwartz, Chief Compliance Officer
Age: 51 | Tenure: Since 2022
Principal Occupation(s) During Past Five Years: Chief Compliance Officer of The Royce Funds (since May 2022) and Associate General Counsel and Compliance Officer of Royce (since March 2013).
1 Interested Trustee.
Trustees will hold office until their successors have been duly elected and qualified or until their earlier resignation or removal. The Statement of Additional Information, which contains additional information about the Trust’s trustees and officers, is available and can be obtained without charge at www.royceinvest.com or by calling (800) 221-4268.
Royce Capital Fund 2022 Annual Report to Shareholders | 29
Notes to Performance and Other Important Information
The thoughts expressed in this report concerning recent market movements and future prospects for small company stocks are solely the opinion of Royce at December 31, 2022, and, of course, historical market trends are not necessarily indicative of future market movements. Statements regarding the future prospects for particular securities held in the Funds’ portfolios and Royce’s investment intentions with respect to those securities reflect Royce’s opinions as of December 31, 2022 and are subject to change at any time without notice. There can be no assurance that securities mentioned in this report will be included in any Royce-managed portfolio in the future.
Sector weightings are determined using the Global Industry Classification Standard (“GICS”). GICS was developed by, and is the exclusive property of, Standard & Poor’s Financial Services LLC (“S&P”) and MSCI Inc. (“MSCI”). GICS is the trademark of S&P and MSCI. “Global Industry Classification Standard (GICS)” and “GICS Direct” are service marks of S&P and MSCI.
All indexes referenced are unmanaged and capitalization weighted. Each index’s returns include net reinvested dividends and/or interest income. Frank Russell Company (“Russell”) is the source and owner of the trademarks, service marks and copyrights related to the Russell Indexes. Russell® is a trademark of Frank Russell Company. Neither Russell nor its licensors accept any liability for any errors or omissions in the Russell Indexes and/or Russell ratings or underlying data and no party may rely on any Russell Indexes and/or Russell ratings and/or underlying data contained in this communication. No further distribution of Russell Data is permitted without Russell’s express written consent. Russell does not promote, sponsor or endorse the content of this communication. The Russell 2000 is an index of domestic small-cap stocks. It measures the performance of the 2,000 smallest publicly traded U.S. companies in the Russell 3000 Index. The Russell 2000 Value and Growth Indexes consist of the respective value and growth stocks within the Russell 2000 as determined by Russell Investments. The Russell Microcap Index includes 1,000 of the smallest securities in the small-cap Russell 2000 Index along with the next smallest eligible securities as determined by Russell. The Russell 1000 Index is an index of domestic large-cap stocks. It measures the performance of the 1,000 publicly traded U.S. companies in the Russell 3000 Index. Securities are weighted based on their style score. Source: MSCI. MSCI makes no express or implied warranties or representations and shall have no liability whatsoever with respect to any MSCI data contained herein. The MSCI data may not be further redistributed or used as a basis for other indexes or any securities or financial products. This material is not approved, endorsed, reviewed or produced by MSCI. None of the MSCI data is intended to constitute investment advice or a recommendation to make (or refrain from making) any kind of investment decision and may not be relied on as such. The MSCI ACWI Small Cap Index is an unmanaged, capitalization-weighted index of global small-cap stocks. The MSCI ACWI ex USA Small Cap Index is an unmanaged, capitalization weighted index of global small-cap stocks, excluding the United States. The Nasdaq Composite Index is a market capitalization-weighted index of more than 3,700 stocks listed on the Nasdaq stock exchange. The Center for Research in Securities Prices (CRSP) equally divides the companies listed on the NYSE into 10 deciles based on market capitalization. Deciles 1-5 represent the largest domestic equity companies and Deciles 6-10 represent the smallest. CRSP then sorts all listed domestic equity companies based on these market cap ranges. By way of comparison, the CRSP 1-5 would have similar capitalization parameters to the S&P 500 and the CRSP 6-10 would have similar capitalization parameters to those of the Russell 2000. The Consumer Price Index (CPI) is a measure of the average change over time in the prices paid by urban consumers for a market basket of consumer goods and services. Indexes are available for the U.S. and various geographic areas. Average price data for select utility, automotive fuel, and food items are also available. The performance of an index does not represent exactly any particular investment, as you cannot invest directly in an index. Returns for the market indexes used in this report were based on information supplied to Royce by Russell Investments. Royce has not independently verified the above described information.
The Price-Earnings, or P/E, Ratio is calculated by dividing a company’s share price by its trailing 12-month earnings-per-share (EPS). The Price-to-Book, or P/B, Ratio is calculated by dividing a company’s share price by its book value per share. Standard deviation is a statistical measure within which a fund’s total returns have varied over time. The greater the standard deviation, the greater a fund’s volatility. Beta is a measure of the volatility or risk of an investment compared to the market as a whole. Alpha describes an investment strategy’s ability to beat the market. The Morningstar Style Map uses proprietary scores of a stock’s value and growth characteristics to determine its placement in one of the five categories listed on the horizontal axis. These characteristics are then compared to those of other stocks within the same market capitalization band. Each is scored from zero to 100 for both value and growth attributes. The value score is subtracted from the growth score to determine the overall style score. For the vertical, market cap axis, Morningstar subdivides into size groups. Giant-cap stocks are defined as those that account for the top 40% of the capitalization of each style zone; large-cap stocks represent the next 30%; mid-cap stocks the next 20%; small-cap stocks the next 7%; micro-cap stocks the smallest 3%. Standard deviation is a statistical measure within which a fund’s total returns have varied over time. The greater the standard deviation, the greater a fund’s volatility. The value score is subtracted from the growth score to determine the overall style score. For the Morningstar Small Blend Category: ©2023 Morningstar. All Rights Reserved. The information regarding the category in this piece is: (1) is proprietary to Morningstar and/or its content providers; (2) may not be copied or distributed; and (3) is not warranted to be accurate, complete or timely. Neither Morningstar nor its content providers are responsible for any damages or losses arising from any use of this information. Cyclical and Defensive are defined as follows: Cyclical: Communication Services, Consumer Discretionary, Energy, Financials, Industrials, Information Technology, and Materials. Defensive: Consumer Staples, Health Care, Real Estate, and Utilities. The Royce Funds is a service mark of The Royce Funds. Distributor: Royce Fund Services, LLC.
Royce Capital Fund–Micro-Cap Portfolio invests primarily in securities of micro-cap companies and Royce Capital Fund–Small-Cap Portfolio invests primarily in securities of small-cap companies. Investments in these types of companies may involve considerably more risk than investments in securities of larger-cap companies. (Please see “Primary Risks for Fund Investors” in the prospectus.) Royce Capital Fund–Micro-Cap Portfolio and Royce Capital Fund–Small-Cap Portfolio may each invest up to 25% its assets in foreign securities that may involve political, economic, currency, and other risks not encountered in U.S. investments. (Please see “Investing in Foreign Securities” in the prospectus.) A Fund that invests a significant portion of its assets in a limited number of stocks may be subject to considerably more risk than a more broadly diversified Fund because a decline in the value of any of these stocks would cause that Fund’s overall value to decline to a greater degree. A broadly diversified portfolio does not, however, ensure a profit for a Fund or guarantee against loss. Please read the prospectus carefully before investing or sending money. A copy of the Funds’ current prospectus and a Statement of Additional Information may be obtained by calling (800) 221-4268 or by visiting www.royceinvest.com. All publicly released material Fund information is disclosed by the Funds on their website at www.royceinvest.com.
30 | Royce Capital Fund 2022 Annual Report to Shareholders
Notes to Performance and Other Important Information (continued)
Forward-Looking Statements
This material contains forward-looking statements within the meaning of the Securities Exchange Act of 1934, as amended (the “Exchange Act”), that involve risks and uncertainties, including, among others, statements as to:
| • | the Funds’ future operating results, |
| • | the prospects of the Funds’ portfolio companies, |
| • | the impact of investments that the Funds have made or may make, |
| • | the dependence of the Funds’ future success on the general economy and its impact on the companies and industries in which the Funds invest, and |
| • | the ability of the Funds’ portfolio companies to achieve their objectives. |
This review and report use words such as “anticipates,” “believes,” “expects,” “future,” “intends,” and similar expressions to identify forward-looking statements. Actual results may differ materially from those projected in the forward-looking statements for any reason.
The Royce Funds have based the forward-looking statements included in this review and report on information available to us on the date of the report, and we assume no obligation to update any such forward-looking statements. Although The Royce Funds undertake no obligation to revise or update any forward-looking statements, whether as a result of new information, future events, or otherwise, you are advised to consult any additional disclosures that we may make through future shareholder communications or reports.
Proxy Voting
A copy of the policies and procedures that The Royce Funds use to determine how to vote proxies relating to portfolio securities and information regarding how each of The Royce Funds voted proxies relating to portfolio securities during the most recent 12-month period ended June 30 is available, without charge, on The Royce Funds’ website at www.royceinvest.com, by calling (800) 221-4268 (toll-free), and on the website of the Securities and Exchange Commission (“SEC”) at www.sec.gov.
Disclosure of Portfolio Holdings
The Funds’ complete portfolio holdings are also available on Exhibit F to Form N-PORT, which filings are made with the SEC within 60 days of the end of the first and third fiscal quarters. The Funds’ Form N-PORT filings are available on the SEC’s website at http://www.sec.gov.
Royce Capital Fund 2022 Annual Report to Shareholders | 31
This page is intentionally left blank.


About Royce Investment Partners
Unparalleled Knowledge + Experience
Pioneers in small-cap investing, with 50+ years
of experience, depth of knowledge, and focus.
Independent Thinking
The confidence to go against consensus, the insight
to uncover opportunities others might miss, and the
tenacity to stay the course through market cycles.
Specialized Approaches
U.S., international, and global investment strategies
that pursue approaches with different risk profiles.
Unwavering Commitment
Our team of 17 portfolio managers has significant
personal investments in the strategies they manage.
Contact Us
GENERAL INFORMATION
Additional Report Copies and Prospectus Inquiries
(800) 221-4268
RCF-REP-1222
| Item 2. | Code(s) of Ethics. As of the end of the period covered by this report, the Registrant had adopted a code of ethics, as defined in Item 2 of Form N-CSR, applicable to its principal executive officer, principal financial officer, principal accounting officer or controller, or persons performing similar functions. A copy of this code of ethics is filed as an exhibit to this Form N-CSR. During the period covered by this report, the Registrant did not: (i) amend any provision of its code of ethics that applies to its principal executive officer, principal financial officer, principal accounting officer or controller, or persons performing similar functions or (ii) grant any waiver, including an implicit waiver, from a provision of such code of ethics to its principal executive officer, principal financial officer, principal accounting officer or controller, or persons performing similar functions. |
| Item 3. | Audit Committee Financial Expert. |
| (a)(1) | The Board of Trustees of the Registrant has determined that it has an audit committee financial expert serving on its audit committee. |
| (a)(2) | Arthur S. Mehlman and Patricia W. Chadwick were designated by the Board of Trustees as the Registrant’s Audit Committee Financial Experts, effective April 15, 2004, and April 8, 2010, respectively. Mr. Mehlman and Ms. Chadwick are “independent” as defined in Section 2(a)(19) of the Investment Company Act of 1940 (the “1940 Act”). |
| Item 4. | Principal Accountant Fees and Services. |
Year ended December 31, 2022 - $46,622
Year ended December 31, 2021 - $45,708
Year ended December 31, 2022 - $0
Year ended December 31, 2021 - $0
Year ended December 31, 2022 - $19,895 – Preparation of tax returns and excise tax review
Year ended December 31, 2021 - $19,505 – Preparation of tax returns and excise tax review
Year ended December 31, 2022 - $0
Year ended December 31, 2021 - $0
| (e)(1) | Annual Pre-Approval: On an annual basis, the Registrant’s independent auditor submits to the Audit Committee a schedule of proposed audit, audit-related, tax and other non-audit services to be rendered to the Registrant and/or its investment adviser and its affiliates for the following year that require pre-approval by the Audit Committee. This schedule provides a description of each type of service that is expected to require pre-approval and the maximum fees that can be paid for each such service without further Audit Committee approval. The Audit Committee then reviews and determines whether to approve the types of scheduled services and the projected fees associated with them. Any subsequent revision to already pre-approved services or fees are presented for consideration at the next regularly scheduled Audit Committee meeting, as needed. |
If subsequent to the annual pre-approval of services and fees by the Audit Committee, the Registrant and/or its investment adviser and its affiliates determines that it would like to engage the Registrant’s independent auditor to perform a service not already pre-approved, the request is to be submitted to the Registrant’s Chief Financial Officer, and if he or she determines that the service fits within the independence guidelines (i.e., it is not a prohibited service), he or she will then arrange for a discussion of the proposed service and fee to be included on the agenda for the next regularly scheduled Audit Committee meeting so that pre-approval can be considered.
Interim Pre-Approval: If, in the judgment of the Registrant's Chief Financial Officer, a proposed engagement needs to commence before the next regularly scheduled Audit Committee meeting, he or she shall submit a written summary of the proposed engagement to all members of the Audit Committee, outlining the services, the estimated maximum cost, the category of the services (e.g., audit, audit-related, tax or other) and the rationale for engaging the Registrant’s independent auditor to perform the services. To the extent the proposed engagement involves audit, audit-related or tax services, any individual member of the Audit Committee who is an independent Board member is authorized to pre-approve the engagement. To the extent the proposed engagement involves non-audit services other than audit-related or tax, only the Chairman of the Audit Committee is authorized to pre-approve the engagement. The Registrant’s Chief Financial Officer will arrange for this interim review and coordinate with the appropriate member(s) of the Audit Committee. The Registrant’s independent auditor may not commence the engagement under consideration until the Registrant’s Chief Financial Officer has informed the auditor in writing that the required pre-approval has been obtained from an individual member of the Audit Committee who is an independent Board member or the Chairman of the Audit Committee, as applicable. Each member of the Audit Committee who pre-approves any engagements in between regularly scheduled Audit Committee meetings is to report, for informational purposes only, any pre-approval decisions to the Audit Committee at its next regularly scheduled meeting.
(e)(2) Not Applicable.
(f) Not Applicable.
(g) Year ended December 31, 2022 - $19,895
Year ended December 31, 2021 - $19,505
| (h) | No such services were rendered during 2022 or 2021. |
Item 5. Audit Committee of Listed Registrants. Not Applicable.
Item 6. Investments.
(a) See Item 1.
(b) Not Applicable.
Item 7. Disclosure of Proxy Voting Policies and Procedures for Closed-End Management Investment Companies. Not Applicable.
Item 8. Portfolio Managers of Closed-End Management Investment Companies. Not Applicable.
Item 9. Purchases of Equity Securities by Closed-End Management Investment Company and Affiliated Purchasers. Not Applicable.
Item 10. Submission of Matters to a Vote of Security Holders. Not Applicable.
Item 11. Controls and Procedures.
(a) Disclosure Controls and Procedures. The Principal Executive and Financial Officers concluded that the Registrant's Disclosure Controls and Procedures are effective based on their evaluation of the Disclosure Controls and Procedures as of a date within 90 days of the filing date of this report.
(b) Internal Control over Financial Reporting. There were no significant changes in Registrant's internal control over financial reporting or in other factors that could significantly affect this control subsequent to the date of the evaluation, including any corrective actions with regard to significant deficiencies and material weaknesses during the period covered by this report.
Item 12. Disclosure of Securities Lending Activities for Closed-End Management Investment Companies. Not applicable.
Item 13. Exhibits. Attached hereto.
(a)(1) The Registrant’s code of ethics pursuant to Item 2 of Form N-CSR.
(a)(2) Separate certifications by the Registrant’s Principal Executive Officer and Principal Financial Officer as required by Rule 30a-2(a) under the 1940 Act.
(a)(3) Not Applicable.
(b) Separate certifications by the Registrant’s Principal Executive Officer and Principal Financial Officer, pursuant to Section 906 of the Sarbanes-Oxley Act of 2002 and required by Rule 30a-2(b) under the 1940 Act.
[Signature page to follow.]
Pursuant to the requirements of the Securities Exchange Act of 1934 (the “Exchange Act”) and the 1940 Act, the registrant has duly caused this report to be signed on its behalf by the undersigned, thereunto duly authorized.
ROYCE CAPITAL FUND
BY: /s/ Christopher D. Clark
Christopher D. Clark
President
Date: February 27, 2023
Pursuant to the requirements of the Exchange Act and the 1940 Act, this report has been signed below by the following persons on behalf of the registrant and in the capacities and on the dates indicated.
| ROYCE CAPITAL FUND | ROYCE CAPITAL FUND |
| BY: /s/ Christopher D. Clark | BY: /s/ Peter K. Hoglund |
| Christopher D. Clark | Peter K. Hoglund |
| Date: February 27, 2023 | Date: February 27, 2023 |