UNITED STATES
SECURITIES AND EXCHANGE COMMISSION
Washington, D.C. 20549
FORM N-CSR
CERTIFIED SHAREHOLDER REPORT OF REGISTERED MANAGEMENT
INVESTMENT COMPANIES
Investment Company Act file number 811-07619
Nuveen Investment Trust
(Exact name of registrant as specified in charter)
Nuveen Investments
333 West Wacker Drive, Chicago, IL 60606
(Address of principal executive offices) (Zip code)
Kevin J. McCarthy
Nuveen Investments
333 West Wacker Drive
Chicago, IL 60606
(Name and address of agent for service)
Registrant’s telephone number, including area code: (312) 917-7700
Date of fiscal year end: June 30
Date of reporting period: June 30, 2007
Form N-CSR is to be used by management investment companies to file reports with the Commission not later than 10 days after the transmission to stockholders of any report that is required to be transmitted to stockholders under Rule 30e-1 under the Investment Company Act of 1940 (17 CFR 270.30e-1). The Commission may use the information provided on Form N-CSR in its regulatory, disclosure review, inspection, and policy making roles.
A registrant is required to disclose the information specified by Form N-CSR, and the Commission will make this information public. A registrant is not required to respond to the collection of information contained in Form N-CSR unless the Form displays a currently valid Office of Management and Budget (“OMB”) control number. Please direct comments concerning the accuracy of the information collection burden estimate and any suggestions for reducing the burden to Secretary, Securities and Exchange Commission, 450 Fifth Street, NW, Washington, DC 20549-0609. The OMB has reviewed this collection of information under the clearance requirements of 44 U.S.C. ss.3507.
ITEM 1. REPORTS TO STOCKHOLDERS.
NUVEEN INVESTMENTS VALUED AND BALANCED FUNDS
| | |
| | |
Annual Report dated June 30, 2007 | | For investors seeking long-term growth potential. |

Nuveen Investments
Value and Balanced Funds
Nuveen Large-Cap Value Fund
Nuveen Balanced Municipal and Stock Fund
Nuveen Balanced Stock and Bond Fund


NOW YOU CAN RECEIVE YOUR
NUVEEN INVESTMENTS FUND REPORTS FASTER.
NO MORE WAITING.
SIGN UP TODAY TO RECEIVE NUVEEN INVESTMENTS FUND INFORMATION BY E-MAIL.
It only takes a minute to sign up for E-Reports. Once enrolled, you’ll receive an e-mail as soon as your Nuveen Investments Fund information is ready — no more waiting for delivery by regular mail. Just click on the link within the e-mail to see the report, and save it on your computer if your wish.

IT’S FAST, EASY & FREE:
www.investordelivery.com
if you get your Nuveen Investments Fund dividends and statements from your financial advisor or brokerage account.
(Be sure to have the address sheet that accompanied this report handy. You’ll need it to complete the enrollment process.)
OR
www.nuveen.com/accountaccess
if you get your Nuveen Investments Fund dividends and statements directly from Nuveen Investments.

| | | | | | |
| Must be preceded by or accompanied by a prospectus. | | NOT FDIC INSURED | | MAY LOSE VALUE | | NO BANK GUARANTEE |

“No one knows
what the future
will bring, which
is why we think
a well-balanced
portfolio ... is
an important
component in
achieving your
long-term
financial goals.”
Dear Shareholder,
Detailed information on your Fund’s performance can be found in the Portfolio Managers’ Comments and Fund Spotlight sections of this report. The Funds feature portfolio management by Institutional Capital LLC (ICAP), with Nuveen Asset Management managing the municipal portion of the Nuveen Balanced Municipal and Stock Fund. I urge you to take the time to read the Portfolio Managers’ Comments.
I also wanted to take this opportunity to report some important news about Nuveen Investments. The company has accepted a buyout offer from a private equity investment firm. While this may affect the corporate structure of Nuveen Investments, it will have no impact on the investment objectives of the Funds, their portfolio management strategies or their dividend policies. We will provide you with additional information about this transaction as more details become available.
With the recent volatility in the stock market, many have begun to wonder which way the market is headed, and whether they need to adjust their holdings of investments. No one knows what the future will bring, which is why we think a well-balanced portfolio that is structured and carefully monitored with the help of an investment professional is an important component in achieving your long-term financial goals. A well-diversified portfolio may actually help to reduce your overall investment risk, and we believe that investments like your Nuveen Investments Fund can be important building blocks in a portfolio crafted to perform well through a variety of market conditions.
Since 1898, Nuveen Investments has offered financial products and solutions that incorporate careful research, diversification, and the application of conservative risk-management principles. We are grateful that you have chosen us as a partner as you pursue your financial goals. We look forward to continuing to earn your trust in the months and years ahead.
Sincerely,

Timothy R. Schwertfeger
Chairman of the Board
August 15, 2007
Annual Report Page 1
Portfolio Managers’ Comments
The Nuveen Large-Cap Value, Balanced Municipal and Stock, and Balanced Stock and Bond Funds feature equity management by Institutional Capital Corporation (ICAP). The municipal portion of the Balanced Municipal and Stock Fund is managed by Nuveen Asset Management (NAM). We recently asked Jerry Senser, chief executive officer and chief investment officer of ICAP, and Tom Spalding of NAM to discuss the key portfolio management strategies and the performance of these three Funds for the 12-month reporting period ended June 30, 2007.
On July 31, 2007, the Board of Trustees of the Large-Cap Value Fund approved HydePark Investment Strategies, LLC (“HydePark”) and Symphony Asset Management LLC (“Symphony”) as additional sub-advisors for the Fund. If approved by Large-Cap Value Fund shareholders on October 12, 2007, the additional sub-advisory agreements are anticipated to take effect on or about November 1, 2007. In the event shareholders of the Large-Cap Value Fund do not approve an additional sub-advisory agreement, the Fund’s portfolio will continue to be managed solely by its current sub-adviser.
What type of economic and stock market backdrop did the Funds encounter during the past year?
The market enjoyed strong gains, with the Standard & Poor’s 500 Index rising roughly 21 percent during the reporting period. Stock prices benefited from continued increases in corporate profits and stable monetary policy on the part of the U.S. Federal Reserve (Fed).
Nevertheless, the stock price gains came despite a variety of challenges for equity investors. Compared to the robust growth of 2005 and early 2006, the U.S. economy was slowing down, expanding by 2.0 percent in the third quarter of 2006, 2.5 percent in the fourth quarter, and just 0.7 percent in the first three months of the new year – although many economists were anticipating a rebound in 2007’s second quarter. One reason for the slower growth was the weaker housing market, whose fall was worsened by troubles in the subprime segment of the mortgage industry. Rising energy prices during the second half of the reporting period in particular also weighed on the economy. Yet despite higher oil costs, core inflation remained under control, enabling the Fed to maintain its benchmark short-term interest rate at 5.25 percent.
How did the Funds perform during the 12 months ending June 30, 2007?
The table on page three provides performance information for the three Funds (Class A shares at NAV). The table also compares the Funds’ performance to appropriate benchmarks.
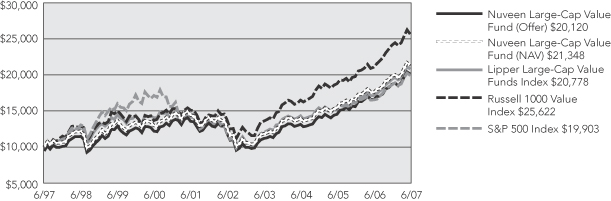
The Nuveen Large-Cap Value Fund (Class A shares at net asset value) outpaced the broad stock market, as measured by the S&P 500 Index, while very modestly trailing the large-cap value Russell 1000 Value Index. It outpaced its peer group, the Lipper Large-Cap Value Funds Index. Compared to the Russell index, the Fund benefited from favorable stock selection in the health care, consumer staples, and information technology sectors. On a sector basis, the Fund benefited from our stock selections and overweighting in basic industry stocks, despite the sector’s underperformance of the overall large-cap value stock market, as well as from an underweighting in the weak-performing financials sector. In contrast, the Fund’s performance was hampered by our stock selection in the energy, retail, and transportation sectors. In all three cases, the stocks chosen for the portfolio failed to go up as much as those in the benchmark. Our overweighting in the transportation sector and our underweighting in telecommunications stocks further detracted from performance.
Discussions of specific investments are for illustration only and are not intended as recommendations of individual investments. The views expressed herein represent those of the portfolio managers as of the date of this report and are subject to change at any time, based on market conditions and other factors. The Funds disclaim any obligation to advise shareholders of such changes.
Annual Report Page 2
Class A Shares
Average Annual Total Returns as of 6/30/07
| | | | | | |
| | | 1-Year | | 5-Year | | 10-Year |
Nuveen Large-Cap Value Fund | | | | | | |
A Shares at NAV | | 21.71% | | 11.14% | | 7.89% |
A Shares at Offer | | 14.71% | | 9.84% | | 7.26% |
Lipper Large-Cap Value Funds Index1 | | 21.46% | | 11.30% | | 7.59% |
Russell 1000 Value Index2 | | 21.87% | | 13.31% | | 9.87% |
S&P 500 Index3 | | 20.59% | | 10.71% | | 7.13% |
| | | |
Nuveen Balanced Municipal and
Stock Fund | | | | | | |
A Shares at NAV | | 10.90% | | 6.59% | | 5.02% |
A Shares at Offer | | 4.51% | | 5.33% | | 4.40% |
Lipper Mixed-Asset Target Allocation Moderate Funds Index4 | | 15.08% | | 9.30% | | 6.78% |
Market Benchmark Index5 | | 11.39% | | 8.10% | | 7.45% |
S&P 500 Index3 | | 20.59% | | 10.71% | | 7.13% |
| | | |
Nuveen Balanced Stock and
Bond Fund | | | | | | |
A Shares at NAV | | 14.40% | | 7.82% | | 6.84% |
A Shares at Offer | | 7.82% | | 6.55% | | 6.21% |
Lipper Mixed-Asset Target Allocation Growth Funds Index6 | | 17.52% | | 9.92% | | 7.50% |
Market Benchmark Index7 | | 15.04% | | 9.44% | | 8.27% |
S&P 500 Index3 | | 20.59% | | 10.71% | | 7.13% |
Returns quoted represent past performance, which is no guarantee of future results. Returns at NAV would be lower if the sales charge were included. Current performance may be higher or lower than the performance shown. Investment returns and principal value will fluctuate so that when shares are redeemed, they may be worth more or less than their original cost. Class A shares have a 5.75% maximum sales charge. Returns do not reflect the deduction of taxes that a shareholder would pay on Fund distributions or the redemption of shares. For the most recent month-end performance, visit www.nuveen.com or call (800) 257-8787.
Please see each Fund’s Spotlight Page later in this report for more complete performance data and expense ratios.
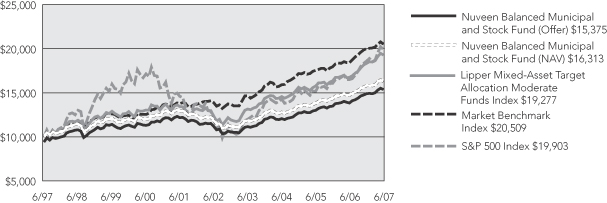
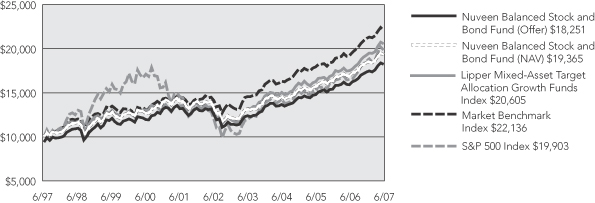
The Nuveen Balanced Municipal and Stock Fund (Class A shares at NAV) trailed its peer group, the Lipper Mixed-Asset Target Allocation Moderate Funds Index, as well as its blended benchmark, the 40% Russell 1000 Value Index/60% Lehman Brothers 10-Year Municipal Bond Index. The Nuveen Balanced Stock and Bond Fund (Class A shares at NAV) also trailed its peer group, the Lipper Mixed-Asset Target Allocation Growth Funds Index, and its blended benchmark, the 60% Russell 1000 Value Index/40% Lehman Brothers Intermediate Treasury Index.
What was your strategy in managing the equity portion of the Funds?
As the period began, the portfolios were positioned to benefit from what we believed was an imbalance between supply and demand in both the energy and transportation sectors. Because we believed this supply/demand imbalance could boost a number of stocks in these two areas of the market, we added to our oil-company investments as well as to railroad stocks, which we thought were well positioned to benefit from favorable macroeconomic trends. By the third quarter of 2006, however, we came to believe that these investment themes had largely run their course, leading us to reduce our relative allocation to the transportation sector. By period end, we were
| 1 | The Lipper Large-Cap Value Funds Index is a managed index that represents the average annualized total return of the 30 largest funds in the Lipper Large-Cap Value Funds category. The returns assume reinvestment of dividends and do not reflect any applicable sales charges. You cannot invest directly in an index. |
| 2 | The Russell 1000 Value Index is a market capitalization-weighted index of those firms in the Russell 1000 Index with lower price-to-book ratios and lower forecasted growth value. The index returns assume reinvestment of dividends and do not reflect any applicable sales charges. You cannot invest directly in an index. |
| 3 | The S&P 500 Index is an unmanaged index generally considered to be representative of the U.S. stock market. The index returns assume reinvestment of dividends and do not reflect any applicable sales charges. You cannot invest directly in an index. |
| 4 | The Lipper Mixed Asset Target Allocation Moderate Funds Index is a managed index that represents the average annualized total returns of the 10 largest funds in the Lipper Mixed Asset Target Allocation Moderate Fund category. The returns assume reinvestment of dividends and do not reflect any applicable sales charges. You cannot invest directly in an index. |
| 5 | The Market Benchmark Index is comprised of a 40% weighting in the Russell 1000 Value Index and 60% in the Lehman Brothers 10-Year Municipal Bond Index. The Russell 1000 Value Index is a market capitalization-weighted index of those firms in the Russell 1000 Index with lower price-to-book ratios and lower forecasted growth value. The Lehman Brothers 10-Year Municipal Bond Index is an unmanaged index comprised of a broad range of investment-grade municipal bonds with maturities ranging from 8 to 12 years. The index returns assume reinvestment of dividends and do not reflect any applicable sales charges. You cannot invest directly in an index. |
| 6 | The Lipper Mixed Asset Target Allocation Growth Funds Index is a managed index that represents the average annualized total returns of the 10 largest funds in the Lipper Mixed Asset Target Allocation Growth Fund category. The returns assume reinvestment of dividends and do not reflect any applicable sales charges. You cannot invest directly in an index. |
| 7 | The Market Benchmark Index is comprised of a 60% weighting in the Russell 1000 Value Index and 40% in the Lehman Brothers Intermediate Treasury Index. The Russell 1000 Value Index is a market capitalization-weighted index of those firms in the Russell 1000 Index with lower price-to-book ratios and lower forecasted growth value. The Lehman Brothers Intermediate Treasury Index is an unmanaged index comprised of treasury securities with maturities ranging from 1-10 years. The returns assume reinvestment of dividends and do not reflect any applicable sales charges. You cannot invest directly in an index. |
Annual Report Page 3
essentially neutrally weighted compared to the benchmark in the energy sector. We maintained only a modest overweighting in transportation, still favoring railroad companies, whose fundamentals remained favorable, in our view.
Overall, we continued to choose stocks for the portfolio based on company-specific reasons. For example, we identified catalysts, such as an expected restructuring, improved pricing power, or a new management team, that we believed could lead to a rising stock price and stronger future performance. As a result of this “bottom-up” security selection approach, we maintained overweightings in the technology, retail, basic industries, and consumer durables sectors; four areas of the market in which we found a number of individual opportunities that we believed offered good values and future investment potential for our shareholders.
What were some of the Funds’ best-performing stocks of the period?
Our strongest contributor to performance over the past 12 months was restaurant company McDonald’s, which benefited from continued growth in international markets, improved financial performance in the United States, and the successful introduction of new menu items. We sold our position in McDonald’s after the stock reached our target price and appeared to provide more limited appreciation potential. Another positive contributor was energy giant Exxon Mobil, which continued to generate record profits in line with historically high oil prices. Conglomerate Honeywell saw its shares rise on higher revenues and profits, while Australian metal and mining company Rio Tinto gained on increased raw material sales, particularly to emerging market countries. In the telecommunications sector, BellSouth contributed nicely to returns, as the company was acquired for a generous premium by rival AT&T.
Which stocks were recent disappointments?
Energy contractor Halliburton was our largest detractor. The company underperformed as the market became concerned about pricing power in its important U.S. pressure pumping business. We sold our shares of Halliburton in early 2007 because we believed they provided too much risk relative to their reward potential. Another underperformer was communications equipment company Motorola, whose flagship mobile telephone business weighed on the company’s stock. Consumer finance stock Capital One, which we sold from the portfolio early in the period, underperformed as the company spent more money than expected to integrate businesses it had previously acquired. Of final note, office supply retailer Office Depot fell on weaker-than-expected same-store sales.
How did you manage the municipal portion of the Balanced Municipal and Stock Fund?
Although municipal yields ended the 12-month period not far from where they began it, we actually saw two very different market environments during the past year. During most of the first half of the period, bonds rallied, causing their yields to fall and their prices to rise (bond yields and prices move in opposite directions). During most of the period’s second half, however, bond yields reversed course and began to rise, as the likelihood of an interest rate cut from the Fed appeared to wane.
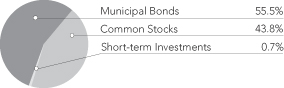
Throughout the past year, we kept the Fund’s duration, meaning its sensitivity to interest rates, relatively close to our internal target and made relatively few changes to the portfolio. As new assets requiring reinvestment came into the Fund, generally as the result of call activity, we established a variety of new positions that we believed offered good future performance potential. For example, we purchased some lower-rated holdings, including some tobacco revenue bonds, while balancing these securities with higher-rated debt that provided the portfolio with additional defensiveness. Many of our new additions focused on bonds with 15-year maturities, the part of the yield curve we believed offered investors the best relative values. At period end, 56 percent of the portfolio was invested in
Annual Report Page 4
municipal bond securities, compared with 44 percent invested in equities.
How did you manage the Treasury portion of the Balanced Stock and Bond Fund?
The Fund’s fixed-income portfolio, which consists entirely of U.S. Treasury securities of varying maturities, was managed conservatively during the past year. In July 2006 and again in June 2007, when yields on the 10-year Treasury note were above 5 percent, we lengthened the portfolio’s average maturity to take advantage of price weakness in the bond market.
Dividend Information
The Nuveen Balanced Municipal and Stock Fund seeks to pay dividends at a rate that reflects the past and projected performance of the Fund. To permit the Fund to maintain a more stable dividend, the Fund may pay dividends at a rate that may be more or less than the amount of net investment income actually earned by the Fund during the period. If the Fund has cumulatively earned more than it has paid in dividends, it will hold the excess in reserve as undistributed net investment income (UNII) as part of the Fund’s net asset value. Conversely, if the Fund has cumulatively paid out dividends more than it has earned, the excess will constitute a negative UNII, which will likewise be reflected in the Fund’s net asset value. The Fund will, over time, pay all its net investment income as dividends to shareholders. As of June 30, 2007, the Nuveen Balanced Municipal and Stock Fund had a positive UNII balance for both financial statement and income tax purposes.
Annual Report Page 5
Nuveen Large-Cap Value Fund
Growth of an Assumed $10,000 Investment
Nuveen Balanced Municipal and Stock Fund
Growth of an Assumed $10,000 Investment
The graphs do not reflect the deduction of taxes that a shareholder may pay on Fund distributions or the redemption of shares.
The index comparisons show the change in value of a $10,000 investment in the Class A shares of the Nuveen Funds compared with the corresponding indexes. The Lipper Large-Cap Value Funds Index is a managed index that represents the average annualized total returns of the 30 largest funds in the Lipper Large-Cap Value Funds category. The Russell 1000 Value Index is a market capitalization-weighted index of those firms in the Russell 1000 Index with lower price-to-book ratios and lower forecasted growth value. The S&P 500 Index is an unmanaged index generally considered to be representative of the U.S. stock market. The Lipper Mixed-Asset Target Allocation Moderate Funds Index is a managed index that represents the average annualized total returns of the 10 largest funds in the Lipper Mixed-Asset Target Allocation Moderate Funds category. The Market Benchmark Index is comprised of a 40% weighting in the Russell 1000 Value Index and 60% in the Lehman Brothers 10-Year Municipal Bond Index. The Lehman Brothers 10-Year Municipal Bond Index is an unmanaged index comprised of a broad range of investment-grade municipal bonds with maturities ranging from 8 to 12 years. The index returns assume reinvestment of dividends and do not reflect any initial or ongoing expenses. You cannot invest directly in an index. The Nuveen Funds’ total returns include reinvestment of all dividends and distributions, and the Funds’ total returns at the offer price depicted in the chart reflects the initial maximum sales charge applicable to A shares (5.75%) and all ongoing Fund expenses. The performance data quoted represents past performance, which is not indicative of future results. Current performance may be lower or higher than the performance shown.
Annual Report Page 6
Nuveen Balanced Stock and Bond Fund
Growth of an Assumed $10,000 Investment
The graph does not reflect the deduction of taxes that a shareholder may pay on Fund distributions or the redemption of shares.
The index comparisons show the change in value of a $10,000 investment in the Class A shares of the Nuveen Fund compared with the corresponding indexes. The Lipper Mixed-Asset Target Allocation Growth Funds Index is a managed index that represents the average annualized total returns of the 10 largest funds in the Lipper Mixed-Asset Target Allocation Growth Funds category. The Market Benchmark Index is comprised of a 60% weighting in the Russell 1000 Value Index and 40% in the Lehman Brothers Intermediate Treasury Index. The Russell 1000 Value Index is a market capitalization-weighted index of those firms in the Russell 1000 Index with lower price-to-book ratios and lower forecasted growth value. The Lehman Brothers Intermediate Treasury Index is an unmanaged index comprised of treasury securities with maturities ranging from 1-10 years. The S&P 500 Index is an unmanaged index generally considered to be representative of the U.S. stock market. The index returns assume reinvestment of dividends and do not reflect any initial or ongoing expenses. You cannot invest directly in an index. The Nuveen Fund’s total returns include reinvestment of all dividends and distributions, and the Fund’s total return at the offer price depicted in the chart reflects the initial maximum sales charge applicable to A shares (5.75%) and all ongoing Fund expenses. The performance data quoted represents past performance, which is not indicative of future results. Current performance may be lower or higher than the performance shown.
Annual Report Page 7
Fund Spotlight as of 6/30/07 Nuveen Large-Cap Value Fund
| | | | | | | | |
| Quick Facts | | | | | | | | |
| | | A Shares | | B Shares | | C Shares | | R Shares |
NAV | | $30.05 | | $29.32 | | $29.27 | | $30.18 |
Latest Capital Gain Distribution1 | | $1.8356 | | $1.8356 | | $1.8356 | | $1.8356 |
Latest Ordinary Income Distribution2 | | $1.0218 | | $0.8117 | | $0.8117 | | $1.0927 |
Inception Date | | 8/07/96 | | 8/07/96 | | 8/07/96 | | 8/07/96 |
Returns quoted represent past performance which is no guarantee of future performance. Returns without sales charges would be lower if the sales charge were included. Current performance may be higher or lower than the performance shown. Investment returns and principal value will fluctuate so that when shares are redeemed, they may be worth more or less than their original cost. Returns do not reflect the deduction of taxes that a shareholder would pay on Fund distributions or the redemption of shares. For the most recent month-end performance visit www.nuveen.com or call (800) 257-8787.
Fund returns assume reinvestment of dividends and capital gains. Class A shares have a 5.75% maximum sales charge. Class B shares have a contingent deferred sales charge (CDSC), also known as a back-end sales charge, that for redemptions begins at 5% and declines periodically until after 6 years when the charge becomes 0%. Class B shares automatically convert to Class A shares eight years after purchase. Class C shares have a 1% CDSC for redemptions within less than one year, which is not reflected in the one-year total return. Class R shares have no sales charge and may be purchased under limited circumstances or by specified classes of investors. Returns may reflect a voluntary expense limitation by the Fund’s investment adviser which may be modified or discontinued at any time without notice.
| | | | |
| Average Annual Total Returns as of 6/30/07 |
| | |
| A Shares | | NAV | | Offer |
1-Year | | 21.71% | | 14.71% |
5-Year | | 11.14% | | 9.84% |
10-Year | | 7.89% | | 7.26% |
| | |
| B Shares | | w/o CDSC | | w/CDSC |
1-Year | | 20.77% | | 16.77% |
5-Year | | 10.31% | | 10.18% |
10-Year | | 7.25% | | 7.25% |
| | |
| C Shares | | NAV | | |
1-Year | | 20.80% | | |
5-Year | | 10.32% | | |
10-Year | | 7.09% | | |
| | |
| R Shares | | NAV | | |
1-Year | | 22.03% | | |
5-Year | | 11.43% | | |
10-Year | | 8.18% | | |
| | |
| Top Five Common Stock Holdings3 |
Citigroup Inc. | | 4.5% |
AT&T Inc. | | 4.0% |
Bank of America Corporation | | 3.6% |
JPMorgan Chase & Co. | | 3.4% |
General Electric Company | | 3.3% |
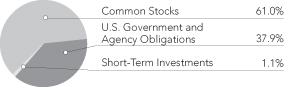
Portfolio Allocation3

| | |
| Portfolio Statistics |
Net Assets ($000) | | $573,077 |
Average Market Capitalization (Common Stocks) | | $122 billion |
Number of Stocks | | 44 |
| | | | | | |
| Expense Ratios | | | | | | |
| | | |
| Share Class | | Gross
Expense
Ratio | | Net
Expense
Ratio | | As of
Date |
Class A | | 1.28% | | 1.28% | | 6/30/06 |
Class B | | 2.03% | | 2.03% | | 6/30/06 |
Class C | | 2.03% | | 2.03% | | 6/30/06 |
Class R | | 1.03% | | 1.03% | | 6/30/06 |
The expense ratios shown factor in Total Annual Fund Operating Expenses including management fees and other fees and expenses.
| 2 | Ordinary income distribution consists of short-term capital gains paid on December 18, 2006 and ordinary income paid on December 29, 2006, if any. |
| 3 | As a percentage of total investments as of June 30, 2007. Holdings are subject to change. |
Annual Report Page 8
Fund Spotlight as of 6/30/07 Nuveen Large-Cap Value Fund
| | |
| Industries1 | | |
Oil, Gas & Consumable Fuels | | 11.6% |
Pharmaceuticals | | 8.2% |
Capital Markets | | 7.6% |
Commercial Banks | | 7.6% |
Communications Equipment | | 5.7% |
Beverages | | 5.5% |
Industrial Conglomerates | | 4.9% |
Diversified Financial Services | | 4.5% |
Diversified Telecommunication Services | | 4.0% |
Insurance | | 3.3% |
Chemicals | | 3.1% |
Household Products | | 2.9% |
Multi-Utilities | | 2.6% |
Metals & Mining | | 2.5% |
Semiconductors & Equipment | | 2.4% |
Aerospace & Defense | | 2.4% |
Computers & Peripherals | | 2.2% |
Food & Staples Retailing | | 2.1% |
Building Products | | 2.0% |
Short Term Investments | | 1.1% |
Other | | 13.8% |
| 1 | As a percentage of total investments as of June 30, 2007. Holdings are subject to change. |
Expense Example
As a shareholder of the Fund, you incur two types of costs: (1) transaction costs, including front and back end sales charges (loads) or redemption fees, where applicable; and (2) ongoing costs, including management fees; distribution and service (12b-1) fees, where applicable; and other Fund expenses. This Example is intended to help you understand your ongoing costs (in dollars) of investing in the Fund and to compare these costs with the ongoing costs of investing in other mutual funds.
The Example below is based on an investment of $1,000 invested at the beginning of the period and held for the period.
The information under “Actual Performance,” together with the amount you invested, allows you to estimate actual expenses incurred over the reporting period. Simply divide your account value by $1,000 (for example, an $8,600 account value divided by $1,000 = 8.60) and multiply the result by the cost shown for your share class, in the row entitled “Expenses Incurred During Period” to estimate the expenses incurred on your account during this period.
The information under “Hypothetical Performance,” provides information about hypothetical account values and hypothetical expenses based on the Fund’s actual expense ratio and an assumed rate of return of 5% per year before expenses, which is not the Fund’s actual return. The hypothetical account values and expenses may not be used to estimate the actual ending account balance or expense you incurred for the period. You may use this information to compare the ongoing costs of investing in the Fund and other Funds. To do so, compare this 5% hypothetical example with the 5% hypothetical examples that appear in the shareholder reports of the other funds.
Please note that the expenses shown in the table are meant to highlight your ongoing costs only and do not reflect any transactional costs, such as front and back end sales charges (loads) or redemption fees, where applicable. Therefore, the hypothetical information is useful in comparing ongoing costs only, and will not help you determine the relative total costs of owning different funds or share classes. In addition, if these transactional costs were included, your costs would have been higher.
| | | | | | | | | | | | | | | | | | | | | | | | | | |
| | | | | | | | | | | | | Hypothetical Performance
|
| | | Actual Performance | | | | (5% return before expenses) |
| | | | | | | | | |
| | | A Shares | | B Shares | | C Shares | | R Shares | | | | A Shares | | B Shares | | C Shares | | R Shares |
Beginning Account Value (1/01/07) | | $ | 1,000.00 | | $ | 1,000.00 | | $ | 1,000.00 | | $ | 1,000.00 | | | | $ | 1,000.00 | | $ | 1,000.00 | | $ | 1,000.00 | | $ | 1,000.00 |
Ending Account Value (6/30/07) | | $ | 1,077.40 | | $ | 1,073.20 | | $ | 1,073.70 | | $ | 1,078.60 | | | | $ | 1,018.55 | | $ | 1,014.78 | | $ | 1,014.83 | | $ | 1,019.79 |
Expenses Incurred During Period | | $ | 6.49 | | $ | 10.38 | | $ | 10.33 | | $ | 5.21 | | | | $ | 6.31 | | $ | 10.09 | | $ | 10.04 | | $ | 5.06 |
For each class of the Fund, expenses are equal to the Fund’s annualized expense ratio of 1.26%, 2.02%, 2.01% and 1.01% for Classes A, B, C and R, respectively, multiplied by the average account value over the period, multiplied by 181/365 (to reflect the one-half year period).
Annual Report Page 9
Fund Spotlight as of 6/30/07 Nuveen Balanced Municipal and Stock Fund
| | | | | | | | |
| Quick Facts | | | | | | | | |
| | | A Shares | | B Shares | | C Shares | | R Shares |
NAV | | $25.76 | | $27.36 | | $27.32 | | $25.15 |
Latest Dividend1 | | $0.0405 | | $0.0305 | | $0.0305 | | $0.0435 |
Inception Date | | 8/07/96 | | 8/07/96 | | 8/07/96 | | 8/07/96 |
Returns quoted represent past performance which is no guarantee of future performance. Returns without sales charges would be lower if the sales charge were included. Current performance may be higher or lower than the performance shown. Investment returns and principal value will fluctuate so that when shares are redeemed, they may be worth more or less than their original cost. Returns do not reflect the deduction of taxes that a shareholder would pay on Fund distributions or the redemption of shares. For the most recent month-end performance visit www.nuveen.com or call (800) 257-8787.
Fund returns assume reinvestment of dividends and capital gains. Class A shares have a 5.75% maximum sales charge. Class B shares have a contingent deferred sales charge (CDSC), also known as a back-end sales charge, that for redemptions begins at 5% and declines periodically until after 6 years when the charge becomes 0%. Class B shares automatically convert to Class A shares eight years after purchase. Class C shares have a 1% CDSC for redemptions within less than one year, which is not reflected in the one-year total return. Class R shares have no sales charge and may be purchased under limited circumstances or by specified classes of investors. Returns may reflect a voluntary expense limitation by the Fund’s investment adviser which may be modified or discontinued at any time without notice.
| | | | |
| Average Annual Total Returns as of 6/30/07 |
| A Shares | | NAV | | Offer |
1-Year | | 10.90% | | 4.51% |
5-Year | | 6.59% | | 5.33% |
10-Year | | 5.02% | | 4.40% |
| B Shares | | w/o CDSC | | w/CDSC |
1-Year | | 10.09% | | 6.09% |
5-Year | | 5.79% | | 5.63% |
10-Year | | 4.40% | | 4.40% |
| C Shares | | NAV | | |
1-Year | | 10.10% | | |
5-Year | | 5.79% | | |
10-Year | | 4.24% | | |
| R Shares | | NAV | | |
1-Year | | 11.17% | | |
5-Year | | 6.86% | | |
10-Year | | 5.29% | | |
| Bond Credit Quality2 | | | | |
AAA/U.S. Guaranteed | | | | 64.5% |
AA | | | | 15.9% |
A | | | | 2.9% |
BBB | | | | 14.7% |
BB or Lower | | | | 1.3% |
N/R | | | | 0.7% |
| | | | | | |
| Expense Ratios | | | | | | |
| | | |
| Share Class | | Gross
Expense
Ratio | | Net
Expense
Ratio | | As of
Date |
Class A | |
1.26% | |
1.22% | |
6/30/06 |
Class B | |
2.00% | |
1.97% | |
6/30/06 |
Class C | |
2.01% | |
1.97% | |
6/30/06 |
Class R | |
1.01% | |
0.96% | |
6/30/06 |
The net expense ratio reflects a contractual commitment by the Fund’s investment adviser to waive fees and reimburse expenses through July 31, 2007. The net ratio also reflects a custodian fee credit from the custodian bank whereby certain fees and expenses are reduced by credits earned on the Fund’s cash on deposit with the bank. There is no guarantee that the Fund will earn such credits in the future. Absent the waiver, reimbursement and credit, expenses would be higher and total returns would be less.
| | | | |
| Yields4 |
| A Shares | | NAV | | Offer |
SEC 30-Day Yield | | 2.62% | | 2.47% |
Distribution Rate | | 1.89% | | 1.78% |
| B Shares | | NAV | | |
SEC 30-Day Yield | | 1.85% | | |
Distribution Rate | | 1.34% | | |
| C Shares | | NAV | | |
SEC 30-Day Yield | | 1.88% | | |
Distribution Rate | | 1.34% | | |
| R Shares | | NAV | | |
SEC 30-Day Yield | | 2.88% | | |
Distribution Rate | | 2.08% | | |
Portfolio Allocation3
| | |
| Portfolio Statistics |
Net Assets ($000) | | $78,381 |
Average Market Capitalization (Common Stocks) | | $122 billion |
Number of Common Stocks | | 44 |
Average Duration (Municipal Bonds) | | 4.82 |
| | |
| Top Five Common Stock Holdings3 | | |
Citigroup Inc. | | 2.0% |
AT&T Inc. | | 1.7% |
Bank of America Corporation | | 1.6% |
JPMorgan Chase & Co. | | 1.5% |
Wells Fargo & Company | | 1.5% |
| 1 | Paid July 2, 2007. This is the latest monthly tax-exempt dividend declared during the period ended June 30, 2007. Income is generally exempt from regular federal income taxes. Income may be subject to state and local taxes and to the federal alternative minimum tax. Capital gains, if any, are subject to tax. |
| 2 | As a percentage of total municipal bond holdings as of June 30, 2007. Holdings are subject to change. |
| 3 | As a percentage of total investments as of June 30, 2007. Holdings are subject to change. |
| 4 | Distribution Rate Yields may differ from SEC 30-Day Yields due to, among other factors, amortization of post-purchase bond premiums and differences between portfolio earnings and distribution rates. |
Annual Report Page 10
Fund Spotlight as of 6/30/07 Nuveen Balanced Municipal and Stock Fund
| | |
Industries1
Common Stocks: | | |
Oil, Gas & Consumable Fuels | | 5.1% |
Pharmaceuticals | | 3.6% |
Commercial Banks | | 3.5% |
Capital Markets | | 3.4% |
Communications Equipment | | 2.6% |
Beverages | | 2.4% |
Industrial Conglomerates | | 2.1% |
Diversified Financial Services | | 2.0% |
Diversified Telecommunication Services | | 1.8% |
Insurance | | 1.4% |
Chemicals | | 1.4% |
Other | | 14.5% |
| | |
Municipal Bonds: | | |
Tax Obligation/Limited | | 11.0% |
U.S. Guaranteed | | 10.7% |
Health Care | | 9.1% |
Utilities | | 5.2% |
Transportation | | 4.8% |
Tax Obligation/General | | 4.0% |
Education and Civic Organizations | | 3.6% |
Consumer Staples | | 3.3% |
Long-Term Care | | 3.1% |
Water and Sewer | | 0.7% |
Housing/Single Family | | 0.7% |
| 1 | As a percentage of total investments as of June 30, 2007. Holdings are subject to change. |
Expense Example
As a shareholder of the Fund, you incur two types of costs: (1) transaction costs, including front and back end sales charges (loads) or redemption fees, where applicable; and (2) ongoing costs, including management fees; distribution and service (12b-1) fees, where applicable; and other Fund expenses. This Example is intended to help you understand your ongoing costs (in dollars) of investing in the Fund and to compare these costs with the ongoing costs of investing in other mutual funds.
The Example below is based on an investment of $1,000 invested at the beginning of the period and held for the period.
The information under “Actual Performance,” together with the amount you invested, allows you to estimate actual expenses incurred over the reporting period. Simply divide your account value by $1,000 (for example, an $8,600 account value divided by $1,000 = 8.60) and multiply the result by the cost shown for your share class, in the row entitled “Expenses Incurred During Period” to estimate the expenses incurred on your account during this period.
The information under “Hypothetical Performance,” provides information about hypothetical account values and hypothetical expenses based on the Fund’s actual expense ratio and an assumed rate of return of 5% per year before expenses, which is not the Fund’s actual return. The hypothetical account values and expenses may not be used to estimate the actual ending account balance or expense you incurred for the period. You may use this information to compare the ongoing costs of investing in the Fund and other Funds. To do so, compare this 5% hypothetical example with the 5% hypothetical examples that appear in the shareholder reports of the other funds.
Please note that the expenses shown in the table are meant to highlight your ongoing costs only and do not reflect any transactional costs, such as front and back end sales charges (loads) or redemption fees, where applicable. Therefore, the hypothetical information is useful in comparing ongoing costs only, and will not help you determine the relative total costs of owning different funds or share classes. In addition, if these transactional costs were included, your costs would have been higher.
| | | | | | | | | | | | | | | | | | | | | | | | | | |
| | | | | | | Hypothetical Performance
|
| | | Actual Performance | | | | (5% return before expenses) |
| | | | | | | | | |
| | | A Shares | | B Shares | | C Shares | | R Shares | | | | A Shares | | B Shares | | C Shares | | R Shares |
Beginning Account Value (1/01/07) | | $ | 1,000.00 | | $ | 1,000.00 | | $ | 1,000.00 | | $ | 1,000.00 | | | | $ | 1,000.00 | | $ | 1,000.00 | | $ | 1,000.00 | | $ | 1,000.00 |
Ending Account Value (6/30/07) | | $ | 1,032.80 | | $ | 1,029.00 | | $ | 1,029.40 | | $ | 1,034.00 | | | | $ | 1,018.89 | | $ | 1,015.08 | | $ | 1,015.12 | | $ | 1,020.13 |
Expenses Incurred During Period | | $ | 6.00 | | $ | 9.86 | | $ | 9.81 | | $ | 4.74 | | | | $ | 5.96 | | $ | 9.79 | | $ | 9.74 | | $ | 4.71 |
For each class of the Fund, expenses are equal to the Fund’s annualized expense ratio of 1.19%,1.96%, 1.95% and .94% for Classes A, B, C and R, respectively, multiplied by the average account value over the period, multiplied by 181/365 (to reflect the one-half year period).
Annual Report Page 11
Fund Spotlight as of 6/30/07 Nuveen Balanced Stock and Bond Fund
| | | | | | | | |
| Quick Facts | | | | | | | | |
| | | A Shares | | B Shares | | C Shares | | R Shares |
NAV | | $26.73 | | $26.73 | | $26.75 | | $26.73 |
Latest Capital Gain Distribution1 | | $1.1433 | | $1.1433 | | $1.1433 | | $1.1433 |
Latest Ordinary Income Distribution2 | | $0.6188 | | $0.5684 | | $0.5684 | | $0.6356 |
Inception Date | | 8/07/96 | | 8/07/96 | | 8/07/96 | | 8/07/96 |
Returns quoted represent past performance which is no guarantee of future performance. Returns without sales charges would be lower if the sales charge were included. Current performance may be higher or lower than the performance shown. Investment returns and principal value will fluctuate so that when shares are redeemed, they may be worth more or less than their original cost. Returns do not reflect the deduction of taxes that a shareholder would pay on Fund distributions or the redemption of shares. For the most recent month-end performance visit www.nuveen.com or call (800) 257-8787.
Fund returns assume reinvestment of dividends and capital gains. Class A shares have a 5.75% maximum sales charge. Class B shares have a contingent deferred sales charge (CDSC), also known as a back-end sales charge, that for redemptions begins at 5% and declines periodically until after 6 years when the charge becomes 0%. Class B shares automatically convert to Class A shares eight years after purchase. Class C shares have a 1% CDSC for redemptions within less than one year, which is not reflected in the one-year total return. Class R shares have no sales charge and may be purchased under limited circumstances or by specified classes of investors. Returns may reflect a voluntary expense limitation by the Fund’s investment adviser which may be modified or discontinued at any time without notice.
| | | | |
| Average Annual Total Returns as of 6/30/07 |
| | |
| A Shares | | NAV | | Offer |
1-Year | | 14.40% | | 7.82% |
5-Year | | 7.82% | | 6.55% |
10-Year | | 6.84% | | 6.21% |
| | |
| B Shares | | w/o CDSC | | w/CDSC |
1-Year | | 13.55% | | 9.55% |
5-Year | | 7.02% | | 6.87% |
10-Year | | 6.21% | | 6.21% |
| | |
| C Shares | | NAV | | |
1-Year | | 13.54% | | |
5-Year | | 7.03% | | |
10-Year | | 6.06% | | |
| | |
| R Shares | | NAV | | |
1-Year | | 14.68% | | |
5-Year | | 8.10% | | |
10-Year | | 7.11% | | |
| | |
| Top Five Common Stock Holdings3 |
Citigroup Inc. | |
2.8% |
AT&T Inc. | |
2.4% |
Bank of America Corporation | |
2.2% |
JPMorgan Chase & Co. | |
2.1% |
Wells Fargo & Co. | |
2.0% |
| | | | | | |
| Expense Ratios | | | | | | |
| | | |
| Share Class | | Gross
Expense
Ratio | | Net
Expense
Ratio | | As of
Date |
Class A | | 1.31% | | 1.24% | |
6/30/06 |
Class B | | 2.06% | | 1.99% | |
6/30/06 |
Class C | | 2.06% | | 1.99% | |
6/30/06 |
Class R | | 1.06% | | 0.99% | |
6/30/06 |
The net expense ratio reflects a contractual commitment by the Fund’s investment adviser to waive fees and reimburse expenses through July 31, 2007. The net ratio also reflects a custodian fee credit from the custodian bank whereby certain fees and expenses are reduced by credits earned on the Fund’s cash on deposit with the bank. There is no guarantee that the fund will earn such credits in the future. Absent the waiver, reimbursement and credit, expenses would be higher and total returns would be less.
| | | | |
| Yields4 |
| | |
| A Shares | | NAV | | Offer |
SEC 30-Day Yield | | 1.85% | | 1.74% |
Distribution Rate | |
2.59% | |
2.44% |
| | |
| B Shares | | NAV | | |
SEC 30-Day Yield | | 1.10% | | |
Distribution Rate | |
1.84% | | |
| | |
| C Shares | | NAV | | |
SEC 30-Day Yield | | 1.07% | | |
Distribution Rate | |
1.84% | | |
| | |
| R Shares | | NAV | | |
SEC 30-Day Yield | | 2.11% | | |
Distribution Rate | |
2.84% | | |
Portfolio Allocation3
| | |
| Portfolio Statistics |
Net Assets ($000) | | $58,280 |
Average Market Capitalization (Common Stocks) | |
$122 billion |
Number of Common Stocks | | 44 |
Average Duration (Bonds) | | 4.47 |
| 2 | Ordinary income distribution consists of short-term capital gains paid on December 18, 2006, and ordinary income paid on December 29, 2006, if any. |
| 3 | As a percentage of total investments as of June 30, 2007. Holdings are subject to change. |
| 4 | Distribution Rate Yields may differ from SEC 30-Day Yields due to, among other factors, amortization of post-purchase bond premiums and differences between portfolio earnings and distribution rates. |
Annual Report Page 12
Fund Spotlight as of 6/30/07 Nuveen Balanced Stock and Bond Fund
| | |
| Industries1 | | |
U.S. Treasury Notes | | 19.8% |
U.S. Treasury Bonds | | 13.0% |
Oil, Gas & Consumable Fuels | | 7.2% |
U.S. Treasury Obligations | | 5.1% |
Pharmaceuticals | | 5.0% |
Capital Markets | | 4.7% |
Commercial Banks | | 4.7% |
Communications Equipment | | 3.5% |
Beverages | | 3.4% |
Industrial Conglomerates | | 3.0% |
Diversified Financial Services | | 2.8% |
Diversified Telecommunication Services | | 2.4% |
Insurance | | 2.0% |
Chemicals | | 1.9% |
Household Products | | 1.8% |
Multi-Utilities | | 1.6% |
Metals & Mining | | 1.5% |
Semiconductors & Equipment | | 1.4% |
Aerospace & Defense | | 1.4% |
Short Term Investments | | 1.1% |
Other | | 12.7% |
| 1 | As a percentage of total investments as of June 30, 2007. Holdings are subject to change. |
Expense Example
As a shareholder of the Fund, you incur two types of costs: (1) transaction costs, including front and back end sales charges (loads) or redemption fees, where applicable; and (2) ongoing costs, including management fees; distribution and service (12b-1) fees, where applicable; and other Fund expenses. This Example is intended to help you understand your ongoing costs (in dollars) of investing in the Fund and to compare these costs with the ongoing costs of investing in other mutual funds.
The Example below is based on an investment of $1,000 invested at the beginning of the period and held for the period.
The information under “Actual Performance,” together with the amount you invested, allows you to estimate actual expenses incurred over the reporting period. Simply divide your account value by $1,000 (for example, an $8,600 account value divided by $1,000 = 8.60) and multiply the result by the cost shown for your share class, in the row entitled “Expenses Incurred During Period” to estimate the expenses incurred on your account during this period.
The information under “Hypothetical Performance,” provides information about hypothetical account values and hypothetical expenses based on the Fund’s actual expense ratio and an assumed rate of return of 5% per year before expenses, which is not the Fund’s actual return. The hypothetical account values and expenses may not be used to estimate the actual ending account balance or expense you incurred for the period. You may use this information to compare the ongoing costs of investing in the Fund and other Funds. To do so, compare this 5% hypothetical example with the 5% hypothetical examples that appear in the shareholder reports of the other funds.
Please note that the expenses shown in the table are meant to highlight your ongoing costs only and do not reflect any transactional costs, such as front and back end sales charges (loads) or redemption fees, where applicable. Therefore, the hypothetical information is useful in comparing ongoing costs only, and will not help you determine the relative total costs of owning different funds or share classes. In addition, if these transactional costs were included, your costs would have been higher.
| | | | | | | | | | | | | | | | | | | | | | | | | | |
| | | |
| | | Actual Performance | | | | Hypothetical Performance
(5% return before expenses) |
| | | | | | | | | |
| | | A Shares | | B Shares | | C Shares | | R Shares | | | | A Shares | | B Shares | | C Shares | | R Shares |
Beginning Account Value (1/01/07) | | $ | 1,000.00 | | $ | 1,000.00 | | $ | 1,000.00 | | $ | 1,000.00 | | | | $ | 1,000.00 | | $ | 1,000.00 | | $ | 1,000.00 | | $ | 1,000.00 |
Ending Account Value (6/30/07) | | $ | 1,048.40 | | $ | 1,044.50 | | $ | 1,044.50 | | $ | 1,049.70 | | | | $ | 1,018.50 | | $ | 1,014.73 | | $ | 1,014.73 | | $ | 1,019.74 |
Expenses Incurred During Period | | $ | 6.45 | | $ | 10.29 | | $ | 10.29 | | $ | 5.18 | | | | $ | 6.36 | | $ | 10.14 | | $ | 10.14 | | $ | 5.11 |
For each class of the Fund, expenses are equal to the Fund’s annualized expense ratio of 1.27%, 2.03%, 2.03% and 1.02% for Classes A, B, C and R, respectively, multiplied by the average account value over the period, multiplied by 181/365 (to reflect the one-half year period).
Annual Report Page 13
Portfolio of Investments
Nuveen Large-Cap Value Fund
June 30, 2007
| | | | | |
| Shares | | Description | | Value |
| | | | | |
| | COMMON STOCKS – 99.0% | | | |
| | |
| | Aerospace & Defense – 2.4% | | | |
| | |
| 240,550 | | Honeywell International Inc. | | $ | 13,538,154 |
| | Automobiles – 0.8% | | | |
| | |
| 75,500 | | Harley-Davidson, Inc. | | | 4,500,555 |
| | Beverages – 5.5% | | | |
| | |
| 279,800 | | Coca-Cola Company | | | 14,636,338 |
| | |
| 259,250 | | PepsiCo, Inc. | | | 16,812,363 |
| | Total Beverages | | | 31,448,701 |
| | |
| | Building Products – 2.0% | | | |
| | |
| 399,600 | | Masco Corporation | | | 11,376,612 |
| | Capital Markets – 7.6% | | | |
| | |
| 277,450 | | Bank of New York Company, Inc. | | | 11,497,528 |
| | |
| 401,250 | | JPMorgan Chase & Co. | | | 19,440,562 |
| | |
| 153,352 | | Morgan Stanley | | | 12,863,166 |
| | Total Capital Markets | | | 43,801,256 |
| | |
| | Chemicals – 3.1% | | | |
| | |
| 345,150 | | E.I. Du Pont de Nemours and Company | | | 17,547,426 |
| | Commercial Banks – 7.6% | | | |
| | |
| 422,850 | | Bank of America Corporation | | | 20,673,136 |
| | |
| 80,750 | | Wachovia Corporation | | | 4,138,438 |
| | |
| 537,400 | | Wells Fargo & Company | | | 18,900,358 |
| | Total Commercial Banks | | | 43,711,932 |
| | |
| | Communications Equipment – 5.7% | | | |
| | |
| 551,000 | | Cisco Systems, Inc., (1) | | | 15,345,350 |
| | |
| 258,400 | | Corning Incorporated, (1) | | | 6,602,120 |
| | |
| 610,750 | | Motorola, Inc. | | | 10,810,275 |
| | Total Communications Equipment | | | 32,757,745 |
| | |
| | Computers & Peripherals – 2.2% | | | |
| | |
| 283,450 | | Hewlett-Packard Company | | | 12,647,539 |
| | Containers & Packaging – 1.4% | | | |
| | |
| 133,950 | | Temple-Inland Inc. | | | 8,241,944 |
| | Diversified Financial Services – 4.5% | | | |
| | |
| 506,061 | | Citigroup Inc. | | | 25,955,868 |
| | Diversified Telecommunication Services – 4.0% | | | |
| | |
| 547,838 | | AT&T Inc. | | | 22,735,276 |
| | Energy Equipment & Services – 1.0% | | | |
| | |
| 65,200 | | Schlumberger Limited | | | 5,538,088 |
| | Food & Staples Retailing – 2.1% | | | |
| | |
| 336,650 | | CVS Caremark Corporation | | | 12,270,893 |
| | Health Care Equipment & Supplies – 1.0% | | | |
| | |
| 140,050 | | Hospira Inc., (1) | | | 5,467,552 |
| | Hotels, Restaurants & Leisure – 0.8% | | | |
| | |
| 195,847 | | Intercontinental Hotels Group PLC, ADR | | | 4,853,089 |
14
| | | | | |
| Shares | | Description | | Value |
| | | | | |
| | Household Products – 2.9% | | | |
| | |
| 274,300 | | Procter & Gamble Company | | $ | 16,784,417 |
| | Industrial Conglomerates – 4.9% | | | |
| | |
| 500,750 | | General Electric Company | | | 19,168,709 |
| | |
| 78,700 | | Textron Inc. | | | 8,665,657 |
| | Total Industrial Conglomerates | | | 27,834,366 |
| | |
| | Insurance – 3.3% | | | |
| | |
| 268,000 | | American International Group, Inc. | | | 18,768,040 |
| | Media – 1.7% | | | |
| | |
| 238,350 | | Viacom Inc., Class B, (1) | | | 9,922,511 |
| | Metals & Mining – 2.5% | | | |
| | |
| 47,475 | | Rio Tinto PLC, Sponsored ADR | | | 14,533,047 |
| | Multiline Retail – 1.8% | | | |
| | |
| 158,650 | | Target Corporation | | | 10,090,140 |
| | Multi-Utilities – 2.6% | | | |
| | |
| 171,050 | | Dominion Resources, Inc. | | | 14,763,326 |
| | Oil, Gas & Consumable Fuels – 11.6% | | | |
| | |
| 168,750 | | Exxon Mobil Corporation | | | 14,154,750 |
| | |
| 160,650 | | Hess Corporation | | | 9,471,924 |
| | |
| 247,050 | | Occidental Petroleum Corporation | | | 14,299,254 |
| | |
| 185,300 | | Total SA, Sponsored ADR | | | 15,005,594 |
| | |
| 224,650 | | XTO Energy, Inc. | | | 13,501,465 |
| | Total Oil, Gas & Consumable Fuels | | | 66,432,987 |
| | |
| | Paper & Forest Products – 1.7% | | | |
| | |
| 247,900 | | International Paper Company | | | 9,680,495 |
| | Pharmaceuticals – 8.2% | | | |
| | |
| 480,250 | | Bristol-Myers Squibb Company | | | 15,156,690 |
| | |
| 285,750 | | Merck & Co. Inc. | | | 14,230,350 |
| | |
| 310,000 | | Norvatis AG, ADR | | | 17,381,700 |
| | Total Pharmaceuticals | | | 46,768,740 |
| | |
| | Real Estate – 0.9% | | | |
| | |
| 229,950 | | Host Hotels & Resorts Inc. | | | 5,316,444 |
| | Road & Rail – 1.7% | | | |
| | |
| 190,600 | | Norfolk Southern Corporation | | | 10,019,842 |
| | Semiconductors & Equipment – 2.4% | | | |
| | |
| 360,650 | | Texas Instruments Incorporated | | | 13,571,260 |
| | Specialty Retail – 1.1% | | | |
| | |
| 205,750 | | Office Depot, Inc., (1) | | | 6,234,225 |
| | Total Common Stocks (cost $449,101,259) | | | 567,112,470 |
| | |
15
Portfolio of Investments
Nuveen Large-Cap Value Fund (continued)
June 30, 2007
| | | | | | | | | | |
Principal
Amount (000) | | Description | | Coupon | | Maturity | | Value |
| | | | | | | | | | |
| | | SHORT-TERM INVESTMENTS – 1.0% | | | | | | | |
| | | | |
| $ | 6,139 | | Repurchase Agreement with Fixed Income Clearing Corporation, dated 6/29/07, repurchase price $6,141,508, collateralized by $5,105,000 U.S. Treasury Bonds, 7.25%, due 8/15/22, value $6,266,388 | | 4.000% | | 7/02/07 | | $ | 6,139,462 |
| | | | | | | | | | | |
| | | Total Short-Term Investments (cost $6,139,462) | | | | | | | 6,139,462 |
| | | |
| | | Total Investments (cost $455,240,721) – 100.0% | | | | | | | 573,251,932 |
| | | |
| | | Other Assets Less Liabilities – (0.0)% | | | | | | | (175,164) |
| | | |
| | | Net Assets – 100% | | | | | | $ | 573,076,768 |
| | | |
| | ADR | American Depositary Receipt. |
See accompanying notes to financial statements.
16
Portfolio of Investments
Nuveen Balanced Municipal and Stock Fund
June 30, 2007
| | | | | |
| Shares | | Description | | Value |
| | | | | |
| | COMMON STOCKS – 42.8% | | | |
| | |
| | Aerospace & Defense – 1.0% | | | |
| | |
| 14,250 | | Honeywell International Inc. | | $ | 801,990 |
| | Automobiles – 0.2% | | | |
| | |
| 4,450 | | Harley-Davidson, Inc. | | | 265,265 |
| | Beverages – 2.4% | | | |
| | |
| 16,600 | | Coca-Cola Company | | | 868,346 |
| | |
| 15,350 | | PepsiCo, Inc. | | | 995,448 |
| | Total Beverages | | | 1,863,794 |
| | |
| | Building Products – 0.9% | | | |
| | |
| 23,700 | | Masco Corporation | | | 674,739 |
| | Capital Markets – 3.3% | | | |
| | |
| 16,450 | | Bank of New York Company, Inc. | | | 681,688 |
| | |
| 23,850 | | JPMorgan Chase & Co. | | | 1,155,533 |
| | |
| 9,105 | | Morgan Stanley | | | 763,727 |
| | Total Capital Markets | | | 2,600,948 |
| | |
| | Chemicals – 1.3% | | | |
| | |
| 20,400 | | E.I. Du Pont de Nemours and Company | | | 1,037,136 |
| | Commercial Banks – 3.4% | | | |
| | |
| 24,950 | | Bank of America Corporation | | | 1,219,806 |
| | |
| 6,250 | | Wachovia Corporation | | | 320,313 |
| | |
| 31,800 | | Wells Fargo & Company | | | 1,118,406 |
| | Total Commercial Banks | | | 2,658,525 |
| | |
| | Communications Equipment – 2.5% | | | |
| | |
| 32,650 | | Cisco Systems, Inc., (1) | | | 909,303 |
| | |
| 15,300 | | Corning Incorporated, (1) | | | 390,915 |
| | |
| 36,200 | | Motorola, Inc. | | | 640,740 |
| | Total Communications Equipment | | | 1,940,958 |
| | |
| | Computers & Peripherals – 1.0% | | | |
| | |
| 16,700 | | Hewlett-Packard Company | | | 745,154 |
| | Containers & Packaging – 0.6% | | | |
| | |
| 7,600 | | Temple-Inland Inc. | | | 467,628 |
| | Diversified Financial Services – 2.0% | | | |
| | |
| 29,910 | | Citigroup Inc. | | | 1,534,083 |
| | Diversified Telecommunication Services – 1.7% | | | |
| | |
| 32,312 | | AT&T Inc. | | | 1,340,947 |
| | Energy Equipment & Services – 0.4% | | | |
| | |
| 3,900 | | Schlumberger Limited | | | 331,266 |
| | Food & Staples Retailing – 0.9% | | | |
| | |
| 19,900 | | CVS Caremark Corporation | | | 725,355 |
| | Health Care Equipment & Supplies – 0.4% | | | |
| | |
| 8,100 | | Hospira Inc., (1) | | | 316,224 |
17
Portfolio of Investments
Nuveen Balanced Municipal and Stock Fund (continued)
June 30, 2007
| | | | | |
| Shares | | Description | | Value |
| | | | | |
| | Hotels, Restaurants & Leisure – 0.4% | | | |
| | |
| 11,582 | | Intercontinental Hotels Group PLC, ADR | | $ | 287,002 |
| | Household Products – 1.3% | | | |
| | |
| 16,200 | | Procter & Gamble Company | | | 991,278 |
| | Industrial Conglomerates – 2.1% | | | |
| | |
| 29,000 | | General Electric Company | | | 1,110,120 |
| | |
| 4,650 | | Textron Inc. | | | 512,012 |
| | Total Industrial Conglomerates | | | 1,622,132 |
| | |
| | Insurance – 1.4% | | | |
| | |
| 15,800 | | American International Group, Inc. | | | 1,106,474 |
| | Media – 0.7% | | | |
| | |
| 14,050 | | Viacom Inc., Class B, (1) | | | 584,902 |
| | Metals & Mining – 1.1% | | | |
| | |
| 2,825 | | Rio Tinto PLC, Sponsored ADR | | | 864,789 |
| | Multiline Retail – 0.8% | | | |
| | |
| 9,400 | | Target Corporation | | | 597,840 |
| | Multi-Utilities – 1.1% | | | |
| | |
| 10,150 | | Dominion Resources, Inc. | | | 876,047 |
| | Oil, Gas & Consumable Fuels – 5.0% | | | |
| | |
| 10,000 | | Exxon Mobil Corporation | | | 838,800 |
| | |
| 9,500 | | Hess Corporation | | | 560,120 |
| | |
| 14,650 | | Occidental Petroleum Corporation | | | 847,942 |
| | |
| 10,900 | | Total SA, Sponsored ADR | | | 882,682 |
| | |
| 13,300 | | XTO Energy, Inc. | | | 799,330 |
| | Total Oil, Gas & Consumable Fuels | | | 3,928,874 |
| | |
| | Paper & Forest Products – 0.7% | | | |
| | |
| 14,600 | | International Paper Company | | | 570,130 |
| | Pharmaceuticals – 3.5% | | | |
| | |
| 28,450 | | Bristol-Myers Squibb Company | | | 897,882 |
| | |
| 16,800 | | Merck & Co. Inc. | | | 836,640 |
| | |
| 18,350 | | Norvatis AG, ADR | | | 1,028,885 |
| | Total Pharmaceuticals | | | 2,763,407 |
| | |
| | Real Estate – 0.4% | | | |
| | |
| 13,550 | | Host Hotels & Resorts Inc. | | | 313,276 |
| | Road & Rail – 0.8% | | | |
| | |
| 11,250 | | Norfolk Southern Corporation | | | 591,413 |
| | Semiconductors & Equipment – 1.0% | | | |
| | |
| 21,300 | | Texas Instruments Incorporated | | | 801,519 |
| | Specialty Retail – 0.5% | | | |
| | |
| 12,150 | | Office Depot, Inc., (1) | | | 368,145 |
| | Total Common Stocks (cost $26,472,705) | | | 33,571,240 |
| | |
18
| | | | | | | | | | | |
| | | | |
Principal
Amount (000) | | Description | | Optional Call
Provisions (2) | | Ratings (3) | | | Value |
| | | | | | | | | | | |
| | | MUNICIPAL BONDS – 54.3% | | | | | | | | |
| | | | |
| | | California – 7.1% | | | | | | | | |
| | | | |
| $ | 1,000 | | Alameda Corridor Transportation Authority, California, Subordinate Lien Revenue Bonds, Series 2004A, 0.000%, 10/01/25 – AMBAC Insured | | 10/17 at 100.00 | | AAA | | | $ | 814,130 |
| | | | |
| | 500 | | Calleguas-Las Virgenes Public Finance Authority, California, Water Revenue Bonds, Calleguas Municipal Water District, Series 2003B, 5.250%, 7/01/19 – MBIA Insured | | 7/13 at 100.00 | | AAA | | | | 529,105 |
| | | | |
| | 445 | | Golden State Tobacco Securitization Corporation, California, Enhanced Tobacco Settlement Asset-Backed Bonds, Series 2007A-1, 4.500%, 6/01/27 | | 6/17 at 100.00 | | BBB | | | | 429,923 |
| | | | |
| | 735 | | Northern California Power Agency, Revenue Bonds, Geothermal Project 3, Series 1993,
5.650%, 7/01/07 | | No Opt. Call | | A2 | | | | 735,059 |
| | | | |
| | 250 | | Orange County, California, Refunding Recovery Bonds, Series 1995A, 6.000%, 6/01/10 – MBIA Insured (ETM) | | No Opt. Call | | AAA | | | | 265,033 |
| | | | |
| | 1,495 | | Palmdale Civic Authority, California, Revenue Refinancing Bonds, Civic Center Project, Series 1997A, 5.375%, 7/01/12 – MBIA Insured | | 7/07 at 102.00 | | AAA | | | | 1,526,648 |
| | | | |
| | 1,000 | | San Diego County, California, Certificates of Participation, Burnham Institute, Series 1999,
5.700%, 9/01/11 (Pre-refunded 9/01/09) | | 9/09 at 101.00 | | Baa3 | (4) | | | 1,038,320 |
| | | | |
| | 250 | | San Diego County, California, Certificates of Participation, Burnham Institute, Series 2006,
5.000%, 9/01/34 | | 9/15 at 102.00 | | Baa3 | | | | 249,245 |
| | 5,675 | | Total California | | | | | | | | 5,587,463 |
| | | Colorado – 5.5% | | | | | | | | |
| | | | |
| | 750 | | Colorado Health Facilities Authority, Revenue Bonds, Longmont United Hospital, Series 2006B, 5.000%, 12/01/23 – RAAI Insured | | 12/16 at 100.00 | | AA | | | | 770,678 |
| | | | |
| | 250 | | Colorado Health Facilities Authority, Revenue Bonds, Vail Valley Medical Center, Series 2004,
5.000%, 1/15/17 | | 1/15 at 100.00 | | BBB+ | | | | 255,668 |
| | | | |
| | 1,000 | | Denver City and County, Colorado, Airport Special Facilities Revenue Bonds, Rental Car Projects, Series 1999A, 6.000%, 1/01/13 – MBIA Insured (Alternative Minimum Tax) | | 1/09 at 101.00 | | AAA | | | | 1,034,790 |
| | | | |
| | | E-470 Public Highway Authority, Colorado, Toll Revenue Bonds, Series 2004B: | | | | | | | | |
| | 370 | | 0.000%, 9/01/28 – MBIA Insured | | 9/20 at 63.98 | | AAA | | | | 124,483 |
| | 2,000 | | 0.000%, 3/01/36 – MBIA Insured | | 9/20 at 41.72 | | AAA | | | | 434,260 |
| | | | |
| | 2,000 | | Metropolitan Football Stadium District, Colorado, Sales Tax Revenue Bonds, Series 1999A,
0.000%, 1/01/12 – MBIA Insured | | No Opt. Call | | AAA | | | | 1,665,759 |
| | | | |
| | 160 | | Northwest Parkway Public Highway Authority, Colorado, Senior Lien Revenue Bonds, Series 2001B,
0.000%, 6/15/27 – AMBAC Insured | | 6/11 at 38.04 | | AAA | | | | 50,755 |
| | 6,530 | | Total Colorado | | | | | | | | 4,336,393 |
| | | Connecticut – 0.7% | | | | | | | | |
| | | | |
| | 400 | | Connecticut Development Authority, First Mortgage Gross Revenue Refunding Healthcare Bonds, Elim Park Baptist Home Inc., Series 1998A, 4.875%, 12/01/07 | | 9/07 at 103.00 | | BBB+ | | | | 401,196 |
| | | | |
| | 185 | | Connecticut Health and Educational Facilities Authority, Revenue Bonds, Hospital for Special Care, Series 1997B, 5.125%, 7/01/07 (ETM) | | No Opt. Call | | BBB–(4) | | | | 185,011 |
| | 585 | | Total Connecticut | | | | | | | | 586,207 |
| | | District Of Columbia – 0.5% | | | | | | | | |
| | | | |
| | 255 | | District of Columbia, General Obligation Refunding Bonds, Series 1994A-1, 6.500%, 6/01/10 – MBIA Insured | | No Opt. Call | | AAA | | | | 272,661 |
| | | | |
| | 130 | | Washington Convention Center Authority, District of Columbia, Senior Lien Dedicated Tax Revenue Bonds, Series 1998, 5.000%, 10/01/21 (Pre-refunded 10/01/08) – AMBAC Insured | | 10/08 at 101.00 | | AAA | | | | 133,136 |
| | 385 | | Total District Of Columbia | | | | | | | | 405,797 |
19
Portfolio of Investments
Nuveen Balanced Municipal and Stock Fund (continued)
June 30, 2007
| | | | | | | | | | | |
| | | | |
Principal
Amount (000) | | Description | | Optional Call
Provisions (2) | | Ratings (3) | | | Value |
| | | | | | | | | | | |
| | | Florida – 0.5% | | | | | | | | |
| | | | |
| $ | 350 | | Jacksonville Economic Development Commission, Florida, Healthcare Facilities Revenue Bonds, Mayo Clinic, Series 2001A, 5.500%, 11/15/36 | | 11/11 at 101.00 | | AA | | | $ | 368,382 |
| | | Idaho – 0.1% | | | | | | | | |
| | | | |
| | 90 | | Idaho Housing and Finance Association, Single Family Mortgage Bonds, Series 1997D, 5.950%, 7/01/09 (Alternative Minimum Tax) | | 7/07 at 102.00 | | Aa3 | | | | 91,370 |
| | | Illinois – 5.1% | | | | | | | | |
| | | | |
| | 870 | | Bolingbrook, Will and DuPage Counties, Illinois, Residential Mortgage Revenue Bonds, Series 1979, 7.500%, 8/01/10 – FGIC Insured (ETM) | | No Opt. Call | | AAA | | | | 917,763 |
| | | | |
| | | Chicago Board of Education, Illinois, Unlimited Tax General Obligation Bonds, Dedicated Tax Revenues, Series 1998B-1: | | | | | | | | |
| | 2,205 | | 0.000%, 12/01/24 – FGIC Insured | | No Opt. Call | | AAA | | | | 979,858 |
| | 2,205 | | 0.000%, 12/01/29 – FGIC Insured | | No Opt. Call | | AAA | | | | 766,238 |
| | | | |
| | | Illinois Development Finance Authority, Economic Development Revenue Bonds, Latin School of Chicago, Series 1998: | | | | | | | | |
| | 270 | | 5.200%, 8/01/11 (Pre-refunded 8/01/08) | | 8/08 at 100.00 | | Baa2 | (4) | | | 273,731 |
| | 200 | | 5.250%, 8/01/12 (Pre-refunded 8/01/08) | | 8/08 at 100.00 | | Baa2 | (4) | | | 202,870 |
| | 580 | | 5.300%, 8/01/13 (Pre-refunded 8/01/08) | | 8/08 at 100.00 | | Baa2 | (4) | | | 588,630 |
| | | | |
| | 250 | | Illinois Health Facilities Authority, Revenue Bonds, Lake Forest Hospital, Series 2002A, 6.000%, 7/01/17 | | 7/12 at 100.00 | | A– | | | | 267,043 |
| | 6,580 | | Total Illinois | | | | | | | | 3,996,133 |
| | | Indiana – 1.5% | | | | | | | | |
| | | | |
| | 300 | | Anderson, Indiana, Economic Development Revenue Bonds, Anderson University, Series 2007, 5.000%, 10/01/24 | | 4/14 at 100.00 | | N/R | | | | 298,776 |
| | | | |
| | 860 | | St. Joseph County Hospital Authority, Indiana, Revenue Bonds, Memorial Health System, Series 1998A, 4.625%, 8/15/28 – MBIA Insured | | 2/08 at 101.00 | | AAA | | | | 846,283 |
| | 1,160 | | Total Indiana | | | | | | | | 1,145,059 |
| | | Iowa – 1.2% | | | | | | | | |
| | | | |
| | 970 | | Iowa Finance Authority, Health Facility Revenue Bonds, Care Initiatives Project, Series 2006A, 5.000%, 7/01/19 | | 7/16 at 100.00 | | BBB– | | | | 964,374 |
| | | Louisiana – 0.6% | | | | | | | | |
| | | | |
| | 340 | | Louisiana Public Facilities Authority, Revenue Bonds, Baton Rouge General Hospital, Series 2004, 5.250%, 7/01/24 – MBIA Insured | | 7/14 at 100.00 | | AAA | | | | 355,905 |
| | | Maine – 0.4% | | | | | | | | |
| | | | |
| | 255 | | Winslow, Maine, General Obligation Tax Increment Financing Bonds, Crowe Rope Industries, Series 1997A, 6.000%, 3/01/11 – MBIA Insured (Alternative Minimum Tax) | | 9/07 at 102.00 | | AAA | | | | 260,457 |
| | | Massachusetts – 1.9% | | | | | | | | |
| | | | |
| | 885 | | Massachusetts Development Finance Agency, Resource Recovery Revenue Bonds, Ogden Haverhill Associates, Series 1998B, 5.200%, 12/01/13 (Alternative Minimum Tax) | | 12/08 at 102.00 | | BBB | | | | 904,691 |
| | | | |
| | 545 | | Massachusetts Turnpike Authority, Western Turnpike Revenue Bonds, Series 1997A,
5.550%, 1/01/17 – MBIA Insured | | 7/07 at 100.00 | | AAA | | | | 562,516 |
| | 1,430 | | Total Massachusetts | | | | | | | | 1,467,207 |
| | | Michigan – 0.7% | | | | | | | | |
| | | | |
| | 540 | | Michigan State Hospital Finance Authority, Hospital Revenue Bonds, Detroit Medical Center Obligated Group, Series 1998A, 5.000%, 8/15/13 | | 8/08 at 101.00 | | BB– | | | | 540,022 |
| | | Minnesota – 0.6% | | | | | | | | |
| | | | |
| | 500 | | Minnesota, General Obligation Bonds, Series 1998, 5.000%, 11/01/17 (Pre-refunded 11/01/08) | | 11/08 at 100.00 | | AAA | | | | 508,050 |
20
| | | | | | | | | | | |
| | | | |
Principal
Amount (000) | | Description | | Optional Call
Provisions (2) | | Ratings (3) | | | Value |
| | | | | | | | | | | |
| | | Mississippi – 1.3% | | | | | | | | |
| | | | |
| $ | 500 | | Jones County, Mississippi, Hospital Revenue Bonds, South Central Regional Medical Center, Series 1997, 5.400%, 12/01/11 (Pre-refunded 12/01/07) | | 12/07 at 100.00 | | N/R | (4) | | $ | 503,155 |
| | | | |
| | 500 | | Mississippi Development Bank, Revenue Bonds, Mississippi Municipal Energy Agency, Mississippi Power, Series 2006A, 5.000%, 3/01/21 – XLCA Insured | | 3/16 at 100.00 | | AAA | | | | 520,490 |
| | 1,000 | | Total Mississippi | | | | | | | | 1,023,645 |
| | | Missouri – 1.2% | | | | | | | | |
| | | | |
| | 1,000 | | Kansas City Municipal Assistance Corporation, Missouri, Leasehold Revenue Bonds, Series 2004B-1, 0.000%, 4/15/27 – AMBAC Insured | | No Opt. Call | | AAA | | | | 394,090 |
| | | | |
| | 500 | | Missouri Joint Municipal Electric Utility Commission, Plum Point Project, Revenue Bonds, Series 2006, 5.000%, 1/01/21 – MBIA Insured | | 1/16 at 100.00 | | AAA | | | | 523,080 |
| | 1,500 | | Total Missouri | | | | | | | | 917,170 |
| | | Nevada – 0.7% | | | | | | | | |
| | | | |
| | 480 | | Clark County, Nevada, Motor Vehicle Fuel Tax Highway Improvement Revenue Bonds, Series 2003, 5.125%, 7/01/17 – AMBAC Insured | | 7/13 at 100.00 | | AAA | | | | 506,477 |
| | | | |
| | 15 | | Nevada Housing Division, Single Family Mortgage Bonds, Mezzanine Series 1997B-1, 6.000%, 4/01/15 (Alternative Minimum Tax) | | 10/07 at 102.00 | | Aa3 | | | | 15,114 |
| | 495 | | Total Nevada | | | | | | | | 521,591 |
| | | New Jersey – 1.0% | | | | | | | | |
| | | | |
| | 500 | | New Jersey Transportation Trust Fund Authority, Transportation System Bonds, Series 2006A, 5.250%, 12/15/22 – FSA Insured | | No Opt. Call | | AAA | | | | 548,185 |
| | | | |
| | 245 | | Tobacco Settlement Financing Corporation, New Jersey, Tobacco Settlement Asset-Backed Bonds, Series 2002, 5.750%, 6/01/32 (Pre-refunded 6/01/12) | | 6/12 at 100.00 | | AAA | | | | 260,768 |
| | 745 | | Total New Jersey | | | | | | | | 808,953 |
| | | New York – 4.1% | | | | | | | | |
| | | | |
| | 500 | | Dormitory Authority of the State of New York, FHA-Insured Mortgage Revenue Bonds, Montefiore Hospital, Series 2004, 5.000%, 2/01/19 – FGIC Insured | | 2/15 at 100.00 | | AAA | | | | 523,230 |
| | | | |
| | 125 | | New York City, New York, General Obligation Bonds, Fiscal Series 1997D, 5.875%, 11/01/11 | | 11/08 at 100.00 | | AA | | | | 127,061 |
| | | | |
| | 700 | | New York City, New York, General Obligation Bonds, Fiscal Series 1998D, 5.500%, 8/01/10 | | 8/07 at 101.00 | | AA | | | | 707,896 |
| | | | |
| | 300 | | New York City, New York, General Obligation Bonds, Fiscal Series 1998D, 5.500%, 8/01/10 (Pre-refunded 8/01/07) | | 8/07 at 101.00 | | AA | (4) | | | 303,438 |
| | | | |
| | | New York State Tobacco Settlement Financing Corporation, Tobacco Settlement Asset-Backed and State Contingency Contract-Backed Bonds, Series 2003B-1C: | | | | | | | | |
| | 1,000 | | 5.500%, 6/01/15 | | 6/10 at 100.00 | | AA– | | | | 1,039,970 |
| | 500 | | 5.500%, 6/01/16 | | 6/11 at 100.00 | | AA– | | | | 525,755 |
| | 3,125 | | Total New York | | | | | | | | 3,227,350 |
| | | North Carolina – 1.8% | | | | | | | | |
| | | | |
| | 515 | | North Carolina Eastern Municipal Power Agency, Power System Revenue Refunding Bonds, Series 1997A, 5.375%, 1/01/24 – MBIA Insured | | 1/08 at 101.00 | | AAA | | | | 523,477 |
| | | | |
| | 835 | | North Carolina Municipal Power Agency 1, Catawba Electric Revenue Bonds, Series 1980,
10.500%, 1/01/10 (ETM) | | No Opt. Call | | AAA | | | | 912,997 |
| | 1,350 | | Total North Carolina | | | | | | | | 1,436,474 |
21
Portfolio of Investments
Nuveen Balanced Municipal and Stock Fund (continued)
June 30, 2007
| | | | | | | | | | | |
| | | | |
Principal
Amount (000) | | Description | | Optional Call
Provisions (2) | | Ratings (3) | | | Value |
| | | | | | | | | | | |
| | | Ohio – 1.6% | | | | | | | | |
| | | | |
| $ | 250 | | Cuyahoga County, Ohio, Revenue Refunding Bonds, Cleveland Clinic Health System, Series 2003A, 5.750%, 1/01/22 | | 7/13 at 100.00 | | AA– | | | $ | 268,528 |
| | | | |
| | 1,000 | | Lorain County, Ohio, Healthcare Facilities Revenue Refunding Bonds, Kendal at Oberlin, Series 1998A, 5.375%, 2/01/12 | | 2/08 at 101.00 | | BBB | | | | 1,008,420 |
| | 1,250 | | Total Ohio | | | | | | | | 1,276,948 |
| | | Oklahoma – 1.9% | | | | | | | | |
| | | | |
| | 470 | | Edmond Public Works Authority, Oklahoma, Utility System Revenue Refunding Bonds, Series 1999, 5.600%, 7/01/19 (Pre-refunded 7/01/09) – AMBAC Insured | | 7/09 at 100.00 | | AAA | | | | 485,867 |
| | | | |
| | 1,000 | | Oklahoma State Industries Authority, Health System Revenue Refunding Bonds, Baptist Medical Center, Series 1995D, 6.000%, 8/15/07 – AMBAC Insured | | No Opt. Call | | AAA | | | | 1,002,760 |
| | 1,470 | | Total Oklahoma | | | | | | | | 1,488,627 |
| | | Oregon – 0.5% | | | | | | | | |
| | | | |
| | 410 | | Oregon Housing and Community Services Department, Single Family Mortgage Revenue Bonds, Series 2004H, 5.125%, 1/01/29 (Alternative Minimum Tax) | | 1/14 at 100.00 | | Aa2 | | | | 417,757 |
| | | South Carolina – 3.5% | | | | | | | | |
| | | | |
| | 250 | | Dorchester County School District 2, South Carolina, Installment Purchase Revenue Bonds, GROWTH, Series 2004, 5.250%, 12/01/20 | | 12/14 at 100.00 | | A | | | | 261,070 |
| | | | |
| | 1,000 | | Greenville County School District, South Carolina, Installment Purchase Revenue Bonds, Series 2002, 5.875%, 12/01/19 (Pre-refunded 12/01/12) | | 12/12 at 101.00 | | AA– | (4) | | | 1,097,340 |
| | | | |
| | 500 | | Medical University Hospital Authority, South Carolina, FHA-Insured Mortgage Revenue Bonds, Series 2004A, 5.250%, 8/15/20 – MBIA Insured | | 8/14 at 100.00 | | AAA | | | | 527,145 |
| | | | |
| | 775 | | Tobacco Settlement Revenue Management Authority, South Carolina, Tobacco Settlement Asset-Backed Bonds, Series 2001B, 6.000%, 5/15/22 | | 5/11 at 101.00 | | BBB | | | | 821,283 |
| | 2,525 | | Total South Carolina | | | | | | | | 2,706,838 |
| | | Texas – 4.1% | | | | | | | | |
| | | | |
| | 2,000 | | Abilene Higher Education Authority, Inc., Texas, Student Loan Revenue Bonds, Subordinate Series 1998B, 5.050%, 7/01/13 (Alternative Minimum Tax) | | 11/08 at 100.00 | | Aa3 | | | | 2,008,638 |
| | | | |
| | 500 | | Dallas Area Rapid Transit, Texas, Senior Lien Sales Tax Revenue Bonds, Series 2001, 5.000%, 12/01/31 (Pre-refunded 12/01/11) – AMBAC Insured | | 12/11 at 100.00 | | AAA | | | | 520,785 |
| | | | |
| | 1,550 | | Harris County-Houston Sports Authority, Texas, Junior Lien Revenue Bonds, Series 2001H, 0.000%, 11/15/30 – MBIA Insured | | No Opt. Call | | AAA | | | | 503,285 |
| | | | |
| | 630 | | Houston, Texas, Hotel Occupancy Tax and Special Revenue Bonds, Convention and Entertainment Project, Series 2001B, 0.000%, 9/01/30 – AMBAC Insured | | No Opt. Call | | AAA | | | | 209,418 |
| | 4,680 | | Total Texas | | | | | | | | 3,242,126 |
| | | Utah – 0.6% | | | | | | | | |
| | | | |
| | 260 | | Eagle Mountain, Utah, Gas and Electric Revenue Bonds, Series 2005, 5.000%, 6/01/24 – RAAI Insured | | 6/15 at 100.00 | | AA | | | | 266,050 |
| | | | |
| | 200 | | Utah State Board of Regents, Student Loan Revenue Bonds, Series 1995N, 6.000%, 5/01/08 – AMBAC Insured (Alternative Minimum Tax) | | 11/07 at 100.00 | | AAA | | | | 201,102 |
| | 460 | | Total Utah | | | | | | | | 467,152 |
| | | Virginia – 1.1% | | | | | | | | |
| | | | |
| | 250 | | Fairfax County Industrial Development Authority, Virginia, Healthcare Revenue Refunding Bonds, Inova Health System, Series 1998A, 5.000%, 8/15/25 | | 2/08 at 101.00 | | AA+ | | | | 251,208 |
| | | | |
| | 640 | | Metropolitan District of Columbia Airprots Authority, Virginia, Airport System Revenue Bonds, Series 1998B, 5.000%, 10/01/28 – MBIA Insured (Alternative Minimum Tax) | | 10/08 at 101.00 | | AAA | | | | 646,842 |
| | 890 | | Total Virginia | | | | | | | | 898,050 |
22
| | | | | | | | | | |
| | | | |
Principal
Amount (000) | | Description | | Optional Call
Provisions (2) | | Ratings (3) | | Value |
| | | | | | | | | | |
| | | Washington – 3.2% | | | | | | | |
| | | | |
| $ | 1,260 | | Central Puget Sound Regional Transit Authority, Washington, Sales Tax and Motor Vehicle Excise Tax Bonds, Series 1999, 4.750%, 2/01/28 – FGIC Insured | | 2/09 at 101.00 | | AAA | | $ | 1,262,230 |
| | | | |
| | 465 | | Cowlitz County Public Utilities District 1, Washington, Electric Production Revenue Bonds, Series 2004, 5.000%, 9/01/22 – FGIC Insured | | 9/14 at 100.00 | | AAA | | | 481,252 |
| | | | |
| | 680 | | Washington State Tobacco Settlement Authority, Tobacco Settlement Asset-Backed Revenue Bonds, Series 2002, 6.500%, 6/01/26 | | 6/13 at 100.00 | | BBB | | | 745,402 |
| | 2,405 | | Total Washington | | | | | | | 2,488,884 |
| | | West Virginia – 0.6% | | | | | | | |
| | | | |
| | 500 | | West Virginia Hospital Finance Authority, Revenue Bonds, United Hospital Center Inc. Project, Series 2006A, 4.500%, 6/01/26 – AMBAC Insured | | 6/16 at 100.00 | | AAA | | | 488,460 |
| | | Wisconsin – 0.7% | | | | | | | |
| | | | |
| | 520 | | Badger Tobacco Asset Securitization Corporation, Wisconsin, Tobacco Settlement Asset-Backed Bonds, Series 2002, 6.375%, 6/01/32 | | 6/12 at 100.00 | | BBB | | | 562,957 |
| | 48,715 | | Total Municipal Bonds (cost $41,761,926) | | | | | | | 42,585,801 |
| | | SHORT-TERM INVESTMENTS – 0.7% | | | | | | | |
| | | | |
| $ | 500 | | North Central Texas Health Facilities Development Corporation, Hospital Revenue Bonds, Presbyterian Medical Center, Variable Rate Demand Obligations, Series 1985C, 3.940%, 12/01/15 – MBIA Insured (5) | | | | VMIG-1 | | | 500,000 |
| | | | | | | | | | | |
| | | Total Short-Term Investments (cost $500,000) | | | | | | | 500,000 |
| | | |
| | | Total Investments (cost $68,734,631) – 97.8% | | | | | | | 76,657,041 |
| | | |
| | | Other Assets Less Liabilities – 2.2% | | | | | | | 1,723,493 |
| | | |
| | | Net Assets – 100% | | | | | | $ | 78,380,534 |
| | | |
| | | The Fund may invest in “zero coupon” securities. A zero coupon security does not pay a regular interest coupon to its holders during the life of the security. Tax-exempt income to the holder of the security comes from accretion of the difference between the original purchase price of the security at issuance and the par value of the security at maturity and is effectively paid at maturity. Such securities are included in the portfolio with a 0.00% coupon rate in their description. The market prices of zero coupon securities generally are more volatile than the market prices of securities that pay interest periodically. |
| | (2) | Optional Call Provisions (not covered by the report of independent registered public accounting firm): Dates (month and year) and prices of the earliest optional call or redemption. There may be other call provisions at varying prices at later dates. Certain mortgage-backed securities may be subject to periodic principal paydowns. |
| | (3) | Ratings (not covered by the report of independent registered public accounting firm): Using the higher of Standard & Poor’s or Moody’s rating. Ratings below BBB by Standard & Poor’s Group or Baa by Moody’s Investor Service, Inc. are considered to be below investment grade. |
| | (4) | Backed by an escrow or trust containing sufficient U.S. Government or U.S. Government agency securities which ensure the timely payment of principal and interest. Such investments are normally considered to be equivalent to AAA rated securities. |
| | (5) | Investment has a maturity of more than one year, but has variable rate and demand features which qualify it as a short-term investment. The rate disclosed is that in effect at the end of the reporting period. This rate changes periodically based on market conditions or a specified market index. |
| | (ETM) | Escrowed to maturity. |
| | ADR | American Depositary Receipt. |
See accompanying notes to financial statements.
23
Portfolio of Investments
Nuveen Balanced Stock and Bond Fund
June 30, 2007
| | | | | |
| Shares | | Description | | Value |
| | | | | |
| | COMMON STOCKS – 61.1% | | | |
| | |
| | Aerospace & Defense – 1.4% | | | |
| | |
| 14,900 | | Honeywell International Inc. | | $ | 838,572 |
| | Automobiles – 0.5% | | | |
| | |
| 4,750 | | Harley-Davidson, Inc. | | | 283,148 |
| | Beverages – 3.4% | | | |
| | |
| 17,700 | | Coca-Cola Company | | | 925,887 |
| | |
| 16,300 | | PepsiCo, Inc. | | | 1,057,055 |
| | Total Beverages | | | 1,982,942 |
| | |
| | Building Products – 1.2% | | | |
| | |
| 25,000 | | Masco Corporation | | | 711,750 |
| | Capital Markets – 4.7% | | | |
| | |
| 17,400 | | Bank of New York Company, Inc. | | | 721,056 |
| | |
| 25,400 | | JPMorgan Chase & Co. | | | 1,230,630 |
| | |
| 9,604 | | Morgan Stanley | | | 805,584 |
| | Total Capital Markets | | | 2,757,270 |
| | |
| | Chemicals – 1.9% | | | |
| | |
| 21,650 | | E.I. Du Pont de Nemours and Company | | | 1,100,686 |
| | Commercial Banks – 4.7% | | | |
| | |
| 26,550 | | Bank of America Corporation | | | 1,298,030 |
| | |
| 5,150 | | Wachovia Corporation | | | 263,938 |
| | |
| 33,700 | | Wells Fargo & Company | | | 1,185,229 |
| | Total Commercial Banks | | | 2,747,197 |
| | |
| | Communications Equipment – 3.5% | | | |
| | |
| 34,800 | | Cisco Systems, Inc., (1) | | | 969,180 |
| | |
| 16,250 | | Corning Incorporated, (1) | | | 415,188 |
| | |
| 38,400 | | Motorola, Inc. | | | 679,680 |
| | Total Communications Equipment | | | 2,064,048 |
| | |
| | Computers & Peripherals – 1.4% | | | |
| | |
| 17,850 | | Hewlett-Packard Company | | | 796,467 |
| | Containers & Packaging – 0.9% | | | |
| | |
| 8,400 | | Temple-Inland Inc. | | | 516,852 |
| | Diversified Financial Services – 2.8% | | | |
| | |
| 31,774 | | Citigroup Inc. | | | 1,629,688 |
| | Diversified Telecommunication Services – 2.4% | | | |
| | |
| 33,745 | | AT&T Inc. | | | 1,400,418 |
| �� | Energy Equipment & Services – 0.6% | | | |
| | |
| 4,200 | | Schlumberger Limited | | | 356,748 |
| | Food & Staples Retailing – 1.3% | | | |
| | |
| 20,900 | | CVS Caremark Corporation | | | 761,805 |
| | Health Care Equipment & Supplies – 0.6% | | | |
| | |
| 8,850 | | Hospira Inc., (1) | | | 345,504 |
24
| | | | | |
| Shares | | Description | | Value |
| | | | | |
| | Hotels, Restaurants & Leisure – 0.5% | | | |
| | |
| 12,169 | | Intercontinental Hotels Group PLC, ADR | | $ | 301,548 |
| | Household Products – 1.8% | | | |
| | |
| 17,200 | | Procter & Gamble Company | | | 1,052,468 |
| | Industrial Conglomerates – 3.0% | | | |
| | |
| 30,750 | | General Electric Company | | | 1,177,110 |
| | |
| 4,950 | | Textron Inc. | | | 545,045 |
| | Total Industrial Conglomerates | | | 1,722,155 |
| | |
| | Insurance – 2.0% | | | |
| | |
| 16,850 | | American International Group, Inc. | | | 1,180,006 |
| | Media – 1.1% | | | |
| | |
| 14,950 | | Viacom Inc., Class B, (1) | | | 622,369 |
| | Metals & Mining – 1.5% | | | |
| | |
| 2,950 | | Rio Tinto PLC, Sponsored ADR | | | 903,054 |
| | Multiline Retail – 1.1% | | | |
| | |
| 10,000 | | Target Corporation | | | 636,000 |
| | Multi-Utilities – 1.6% | | | |
| | |
| 10,700 | | Dominion Resources, Inc. | | | 923,517 |
| | Oil, Gas & Consumable Fuels – 7.2% | | | |
| | |
| 11,150 | | Exxon Mobil Corporation | | | 935,262 |
| | |
| 10,100 | | Hess Corporation | | | 595,496 |
| | |
| 15,600 | | Occidental Petroleum Corporation | | | 902,928 |
| | |
| 11,650 | | Total SA, Sponsored ADR | | | 943,417 |
| | |
| 14,000 | | XTO Energy, Inc. | | | 841,400 |
| | Total Oil, Gas & Consumable Fuels | | | 4,218,503 |
| | |
| | Paper & Forest Products – 1.0% | | | |
| | |
| 15,550 | | International Paper Company | | | 607,228 |
| | Pharmaceuticals – 5.1% | | | |
| | |
| 29,950 | | Bristol-Myers Squibb Company | | | 945,222 |
| | |
| 17,850 | | Merck & Co. Inc. | | | 888,930 |
| | |
| 19,850 | | Norvatis AG, ADR | | | 1,112,990 |
| | Total Pharmaceuticals | | | 2,947,142 |
| | |
| | Real Estate – 0.6% | | | |
| | |
| 14,300 | | Host Hotels & Resorts Inc. | | | 330,616 |
| | Road & Rail – 1.1% | | | |
| | |
| 12,050 | | Norfolk Southern Corporation | | | 633,469 |
| | Semiconductors & Equipment – 1.5% | | | |
| | |
| 22,500 | | Texas Instruments Incorporated | | | 846,675 |
| | Specialty Retail – 0.7% | | | |
| | |
| 12,800 | | Office Depot, Inc., (1) | | | 387,840 |
| | Total Common Stocks (cost $27,844,265) | | | 35,605,685 |
| | |
25
Portfolio of Investments
Nuveen Balanced Stock and Bond Fund (continued)
June 30, 2007
| | | | | | | | | | |
Principal
Amount (000) | | Description | | Coupon | | Maturity | | Value |
| | | | | | | | | | |
| | | U.S. GOVERNMENT AND AGENCY OBLIGATIONS – 38.0% | | | | | | | |
| | | | |
| $ | 2,935 | | United States of America Treasury Bonds | | 7.250% | | 5/15/16 | | $ | 3,392,906 |
| | | | |
| | 2,150 | | United States of America Treasury Bonds | | 7.250% | | 8/15/22 | | | 2,603,349 |
| | | | |
| | 1,480 | | United States of America Treasury Bonds | | 6.000% | | 2/15/26 | | | 1,615,976 |
| | | | |
| | 3,000 | | United States of America Treasury Inflation Indexed Obligations | | 4.250% | | 11/30/07 | | | 2,992,970 |
| | | | |
| | 4,275 | | United States of America Treasury Notes | | 4.750% | | 11/15/08 | | | 4,262,644 |
| | | | |
| | 3,880 | | United States of America Treasury Notes | | 5.750% | | 8/15/10 | | | 3,976,394 |
| | | | |
| | 3,435 | | United States of America Treasury Notes | | 4.250% | | 11/15/13 | | | 3,308,065 |
| | 21,155 | | Total U.S. Government and Agency Obligations (cost $22,176,465) | | | | | | | 22,152,304 |
| | | SHORT-TERM INVESTMENTS – 1.1% | | | | | | | |
| | | | |
| $ | 662 | | Repurchase Agreement with Fixed Income Clearing Corporation, dated 6/29/07, repurchase price $662,517, collateralized by $555,000 U.S. Treasury Bonds, 7.250%, due 8/15/22, value $681,263 | | 4.000% | | 7/02/07 | | | 662,296 |
| | | | | | | | | | | |
| | | Total Short-Term Investments (cost $662,296) | | | | | | | 662,296 |
| | | |
| | | Total Investments (cost $50,683,026) – 100.2% | | | | | | | 58,420,285 |
| | | |
| | | Other Assets Less Liabilities – (0.2)% | | | | | | | (140,524) |
| | | |
| | | Net Assets – 100% | | | | | | $ | 58,279,761 |
| | | |
| | ADR | American Depositary Receipt. |
See accompanying notes to financial statements.
26
Statement of Assets and Liabilities
June 30, 2007
| | | | | | | | | | |
| | | Large-Cap
Value | | Municipal
and Stock | | Stock and
Bond | |
Assets | | | | | | | | | | |
Investments, at value (cost $455,240,721, $68,734,631 and $50,683,026, respectively) | | $ | 573,251,932 | | $ | 76,657,041 | | $ | 58,420,285 | |
Cash | | | — | | | 406,644 | | | — | |
Receivables: | | | | | | | | | | |
Dividends | | | 569,504 | | | 33,623 | | | 35,657 | |
Interest | | | 1,364 | | | 669,595 | | | 258,441 | |
Investments sold | | | 8,904,109 | | | 1,329,134 | | | 554,313 | |
Reclaims | | | 25,170 | | | 1,441 | | | 1,561 | |
Shares sold | | | 128,244 | | | 925 | | | 26,323 | |
Other assets | | | 188,634 | | | 52,521 | | | 38,278 | |
Total assets | | | 583,068,957 | | | 79,150,924 | |
| 59,334,858
|
|
Liabilities | | | | | | | | | | |
Payables: | | | | | | | | | | |
Investments purchased | | | 8,423,360 | | | 509,877 | | | 542,316 | |
Shares redeemed | | | 674,500 | | | 10,304 | | | 44,322 | |
Accrued expenses: | | | | | | | | | | |
Management fees | | | 386,999 | | | 50,578 | | | 48,487 | |
12b-1 distribution and service fees | | | 143,252 | | | 25,295 | | | 18,662 | |
Other | | | 364,078 | | | 58,272 | | | 43,328 | |
Dividends payable | | | — | | | 116,064 | | | 357,982 | |
Total liabilities | | | 9,992,189 | | | 770,389 | | | 1,055,097 | |
Net assets | | $ | 573,076,768 | | $ | 78,380,534 | | $ | 58,279,761 | |
Class A Shares | | | | | | | | | | |
Net assets | | $ | 491,489,438 | | $ | 61,576,686 | | $ | 33,519,240 | |
Shares outstanding | | | 16,355,421 | | | 2,390,575 | | | 1,253,852 | |
Net asset value per share | | $ | 30.05 | | $ | 25.76 | | $ | 26.73 | |
Offering price per share (net asset value per share plus
maximum sales charge of 5.75% of offering price) | | $ | 31.88 | | $ | 27.33 | | $ | 28.36 | |
Class B Shares | | | | | | | | | | |
Net assets | | $ | 18,490,760 | | $ | 5,915,962 | | $ | 6,375,931 | |
Shares outstanding | | | 630,629 | | | 216,237 | | | 238,556 | |
Net asset value and offering price per share | | $ | 29.32 | | $ | 27.36 | | $ | 26.73 | |
Class C Shares | | | | | | | | | | |
Net assets | | $ | 31,218,532 | | $ | 9,362,934 | | $ | 7,694,133 | |
Shares outstanding | | | 1,066,412 | | | 342,652 | | | 287,647 | |
Net asset value and offering price per share | | $ | 29.27 | | $ | 27.32 | | $ | 26.75 | |
Class R Shares | | | | | | | | | | |
Net assets | | $ | 31,878,038 | | $ | 1,524,952 | | $ | 10,690,457 | |
Shares outstanding | | | 1,056,337 | | | 60,639 | | | 399,918 | |
Net asset value and offering price per share | | $ | 30.18 | | $ | 25.15 | | $ | 26.73 | |
| | | |
Net Assets Consist of: | | | | | | | | | | |
Capital paid-in | | $ | 391,710,671 | | $ | 69,184,308 | | $ | 47,096,206 | |
Undistributed (Over-distribution of) net investment income | | | 3,643,122 | | | 398,038 | | | (258,929 | ) |
Accumulated net realized gain (loss) from investments and foreign currencies | | | 59,711,764 | | | 875,778 | | | 3,705,225 | |
Net unrealized appreciation (depreciation) of investments | | | 118,011,211 | | | 7,922,410 | | | 7,737,259 | |
Net assets | | $ | 573,076,768 | | $ | 78,380,534 | | $ | 58,279,761 | |
See accompanying notes to financial statements.
27
Statement of Operations
Year Ended June 30, 2007
| | | | | | | | | | | | |
| | | Large-Cap
Value | | | Municipal
and Stock | | | Stock and
Bond | |
Investment Income | | | | | | | | | | | | |
Dividends (net of foreign tax withheld of $115,229, $6,758, and $7,176, respectively) | | $ | 13,169,326 | | | $ | 770,406 | | | $ | 823,064 | |
Interest | | | 442,626 | | | | 2,248,100 | | | | 1,153,878 | |
Total investment income | | | 13,611,952 | | | | 3,018,506 | | | | 1,976,942 | |
Expenses | | | | | | | | | | | | |
Management fees | | | 4,500,540 | | | | 574,090 | | | | 423,283 | |
12b-1 service fees – Class A | | | 1,172,880 | | | | 150,287 | | | | 81,846 | |
12b-1 distribution and service fees – Class B | | | 223,720 | | | | 79,167 | | | | 70,973 | |
12b-1 distribution and service fees – Class C | | | 303,437 | | | | 86,993 | | | | 76,651 | |
Shareholders’ servicing agent fees and expenses | | | 623,780 | | | | 62,224 | | | | 60,796 | |
Custodian’s fees and expenses | | | 99,391 | | | | 47,713 | | | | 26,547 | |
Trustees’ fees and expenses | | | 13,093 | | | | 2,652 | | | | 1,154 | |
Professional fees | | | 25,876 | | | | 7,649 | | | | 7,779 | |
Shareholders’ reports – printing and mailing expenses | | | 165,125 | | | | 18,155 | | | | 18,260 | |
Federal and state registration fees | | | 49,995 | | | | 43,058 | | | | 41,777 | |
Other expenses | | | 22,421 | | | | 5,078 | | | | 3,961 | |
Total expenses before custodian fee credit and expense reimbursement | | | 7,200,258 | | | | 1,077,066 | | | | 813,027 | |
Custodian fee credit | | | (993 | ) | | | (24,991 | ) | | | (449 | ) |
Expense reimbursement | | | — | | | | — | | | | (11,415 | ) |
Net expenses | | | 7,199,265 | | | | 1,052,075 | | | | 801,163 | |
Net investment income | | | 6,412,687 | | | | 1,966,431 | | | | 1,175,779 | |
Realized and Unrealized Gain (Loss) | | | | | | | | | | | | |
Net realized gain (loss) from investments | | | 76,534,871 | | | | 4,718,378 | | | | 5,193,418 | |
Net change in unrealized appreciation (depreciation) of investments | | | 24,730,433 | | | | 1,283,251 | | | | 1,270,350 | |
Net realized and unrealized gain (loss) | | | 101,265,304 | | | | 6,001,629 | | | | 6,463,768 | |
Net increase (decrease) in net assets from operations | | $ | 107,677,991 | | | $ | 7,968,060 | | | $ | 7,639,547 | |
See accompanying notes to financial statements.
28
Statement of Changes in Net Assets
| | | | | | | | |
| | | Large-Cap Value | |
| | | Year Ended
6/30/07 | | | Year Ended
6/30/06 | |
Operations | | | | | | | | |
Net investment income | | $ | 6,412,687 | | | $ | 3,946,791 | |
Net realized gain (loss) from investments and foreign currency transactions | | | 76,534,871 | | | | 61,963,102 | |
Net increase from payments by the Adviser for losses realized on the disposal
of investments purchased in violation of investment restrictions | | | — | | | | — | |
Net change in unrealized appreciation (depreciation) of investments | | | 24,730,433 | | | | 2,529,520 | |
Net increase (decrease) in net assets from operations | | | 107,677,991 | | | | 68,439,413 | |
Distributions to Shareholders | | | | | | | | |
From net investment income: | | | | | | | | |
Class A | | | (4,392,794 | ) | | | (3,858,364 | ) |
Class B | | | (42,199 | ) | | | (52,997 | ) |
Class C | | | (57,080 | ) | | | (42,413 | ) |
Class R | | | (345,055 | ) | | | (231,877 | ) |
From accumulated net realized gains: | | | | | | | | |
Class A | | | (40,781,978 | ) | | | (25,404,175 | ) |
Class B | | | (2,008,149 | ) | | | (2,324,281 | ) |
Class C | | | (2,703,325 | ) | | | (1,772,793 | ) |
Class R | | | (2,473,004 | ) | | | (1,181,667 | ) |
Decrease in net assets from distributions to shareholders | | | (52,803,584 | ) | | | (34,868,567 | ) |
Fund Share Transactions | | | | | | | | |
Proceeds from sale of shares | | | 31,514,790 | | | | 37,747,482 | |
Proceeds from shares issued to shareholders due
to reinvestment of distributions | | | 38,522,404 | | | | 24,741,918 | |
| | | 70,037,194 | | | | 62,489,400 | |
Cost of shares redeemed | | | (73,645,052 | ) | | | (88,922,290 | ) |
Net increase (decrease) in net assets from Fund share transactions | | | (3,607,858 | ) | | | (26,432,890 | ) |
Net increase (decrease) in net assets | | | 51,266,549 | | | | 7,137,956 | |
Net assets at the beginning of year | | | 521,810,219 | | | | 514,672,263 | |
Net assets at the end of year | | $ | 573,076,768 | | | $ | 521,810,219 | |
Undistributed (Over-distribution of) net investment income at the end of year | | $ | 3,643,122 | | | $ | 2,067,563 | |
See accompanying notes to financial statements.
29
| | | | | | | | | | | | | | | | |
| | | Municipal and Stock | | | Stock and Bond | |
| | | Year Ended
6/30/07 | | | Year Ended
6/30/06 | | | Year Ended
6/30/07 | | | Year Ended
6/30/06 | |
Operations | | | | | | | | | | | | | | | | |
Net investment income | | $ | 1,966,431 | | | $ | 1,883,933 | | | $ | 1,175,779 | | | $ | 1,005,283 | |
Net realized gain (loss) from investments and foreign currency transactions | | | 4,718,378 | | | | 5,013,199 | | | | 5,193,418 | | | | 4,643,595 | |
Net increase from payments by the Adviser for losses realized on the disposal of investments purchased in violation of investment restrictions | | | — | | | | — | | | | — | | | | 55,844 | |
Net change in unrealized appreciation (depreciation) of investments | | | 1,283,251 | | | | (1,932,063 | ) | | | 1,270,350 | | | | (1,463,090 | ) |
Net increase (decrease) in net assets from operations | | | 7,968,060 | | | | 4,965,069 | | | | 7,639,547 | | | | 4,241,632 | |
Distributions to Shareholders | | | | | | | | | | | | | | | | |
From net investment income: | | | | | | | | | | | | | | | | |
Class A | | | (1,623,074 | ) | | | (1,530,698 | ) | | | (764,847 | ) | | | (653,492 | ) |
Class B | | | (146,444 | ) | | | (190,777 | ) | | | (108,071 | ) | | | (128,206 | ) |
Class C | | | (162,325 | ) | | | (103,600 | ) | | | (119,957 | ) | | | (103,140 | ) |
Class R | | | (44,672 | ) | | | (33,596 | ) | | | (264,636 | ) | | | (206,695 | ) |
From accumulated net realized gains: | | | | | | | | | | | | | | | | |
Class A | | | — | | | | — | | | | (1,958,406 | ) | | | (2,220,095 | ) |
Class B | | | — | | | | — | | | | (431,620 | ) | | | (761,016 | ) |
Class C | | | — | | | | — | | | | (477,052 | ) | | | (550,514 | ) |
Class R | | | — | | | | — | | | | (600,140 | ) | | | (611,775 | ) |
Decrease in net assets from distributions to shareholders | | | (1,976,515 | ) | | | (1,858,671 | ) | | | (4,724,729 | ) | | | (5,234,933 | ) |
Fund Share Transactions | | | | | | | | | | | | | | | | |
Proceeds from sale of shares | | | 8,065,057 | | | | 10,692,997 | | | | 8,200,987 | | | | 9,533,361 | |
Proceeds from shares issued to shareholders due
to reinvestment of distributions | | | 1,445,739 | | | | 1,364,469 | | | | 3,273,179 | | | | 3,643,710 | |
| | | 9,510,796 | | | | 12,057,466 | | | | 11,474,166 | | | | 13,177,071 | |
Cost of shares redeemed | | | (15,049,637 | ) | | | (18,969,859 | ) | | | (11,358,671 | ) | | | (18,445,473 | ) |
Net increase (decrease) in net assets from Fund share transactions | | | (5,538,841 | ) | | | (6,912,393 | ) | | | 115,495 | | | | (5,268,402 | ) |
Net increase (decrease) in net assets | | | 452,704 | | | | (3,805,995 | ) | | | 3,030,313 | | | | (6,261,703 | ) |
Net assets at the beginning of year | | | 77,927,830 | | | | 81,733,825 | | | | 55,249,448 | | | | 61,511,151 | |
Net assets at the end of year | | $ | 78,380,534 | | | $ | 77,927,830 | | | $ | 58,279,761 | | | $ | 55,249,448 | |
Undistributed (Over-distribution of) net investment income at the end of year | | $ | 398,038 | | | $ | 408,145 | | | $ | (258,929 | ) | | $ | (222,756 | ) |
See accompanying notes to financial statements.
30
Notes to Financial Statements
1. General Information and Significant Accounting Policies
The Nuveen Investment Trust (the “Trust”) is an open-end management investment company registered under the Investment Company Act of 1940, as amended. The Trust is comprised of the Nuveen Large-Cap Value Fund (“Large-Cap Value”), Nuveen Balanced Municipal and Stock Fund (“Municipal and Stock”) and Nuveen Balanced Stock and Bond Fund (“Stock and Bond”) (collectively, the “Funds”), among others. The Trust was organized as a Massachusetts business trust in 1996.
Large-Cap Value invests primarily in a diversified portfolio of large and mid-cap equities of domestic companies in an attempt to provide capital growth.
Municipal and Stock invests in a mix of equities and tax-exempt securities in an attempt to provide capital growth, capital preservation and current tax-exempt income.
Stock and Bond invests in a mix of equities, taxable bonds and cash equivalents in an attempt to provide capital growth, capital preservation and current income.
The following is a summary of significant accounting policies followed by the Funds in the preparation of their financial statements in accordance with accounting principles generally accepted in the United States.
Investment Valuation
Exchange-listed securities are generally valued at the last sales price on the securities exchange on which such securities are primarily traded. Securities traded on a securities exchange for which there are no transactions on a given day or securities not listed on a securities exchange are valued at the mean of the closing bid and asked prices. Securities traded on Nasdaq are valued at the Nasdaq Official Closing Price. The prices of fixed-income securities are generally provided by an independent pricing service approved by the Funds’ Board of Trustees. When price quotes are not readily available, the pricing service or, in the absence of a pricing service for a particular investment, the Board of Trustees of the Funds, or its designee, may establish fair value using a wide variety of market data including yields or prices of investments of comparable quality, type of issue, coupon, maturity and rating, market quotes or indications of value from securities dealers, evaluations of anticipated cash flows or collateral, general market conditions and other information and analysis, including the obligor’s credit characteristics considered relevant by the pricing service or the Board of Trustees’ designee. If it is determined that the market price for an investment is unavailable or inappropriate, the Board of Trustees of the Funds, or its designee, may establish fair value in accordance with procedures established in good faith by the Board of Trustees. Short-term investments are valued at amortized cost, which approximates market value.
Investment Transactions
Investment transactions are recorded on a trade date basis. Realized gains and losses from investment transactions are determined on the specific identification method. Investments purchased on a when-issued/delayed delivery basis may have extended settlement periods. Any investments so purchased are subject to market fluctuation during this period. The Funds have instructed the custodian to segregate assets with a current value at least equal to the amount of the when-issued/delayed delivery purchase commitments. At June 30, 2007, there were no such outstanding purchase commitments in any of the Funds.
Investment Income
Dividend income is recorded on the ex-dividend date or, for foreign securities, when information is available. Interest income, which includes the amortization of premiums and accretion of discounts for financial reporting purposes, is recorded on an accrual basis. Interest income also includes paydown gains and losses, if any.
Dividends and Distributions to Shareholders
Distributions to shareholders are recorded on the ex-dividend date. The amount and timing of distributions are determined in accordance with federal income tax regulations, which may differ from accounting principles generally accepted in the United States.
Taxable net investment income is declared and distributed to shareholders annually for Large-Cap Value and Municipal and Stock, and quarterly for Stock and Bond. Tax-exempt net investment income is declared as a dividend monthly for Municipal and Stock. Net realized capital gains from investment transactions, if any, are declared and distributed to shareholders not less frequently than annually. Furthermore, capital gains are distributed only to the extent they exceed available capital loss carryforwards.
Federal Income Taxes
Each Fund is a separate taxpayer for federal income tax purposes. Each Fund intends to distribute substantially all net investment income and net capital gains to shareholders and to otherwise comply with the requirements of Subchapter M of the Internal Revenue Code applicable to regulated investment companies. Therefore, no federal income tax provision is required. In addition, Municipal and Stock intends to satisfy conditions which will enable interest from municipal securities, which is exempt from regular federal income tax, to retain such tax-exempt status when distributed to shareholders of the Fund. Net realized capital gains and ordinary income distributions paid by the Funds are subject to federal taxation.
31
Notes to Financial Statements (continued)
Flexible Sales Charge Program
Each Fund offers Class A, B, C and R Shares. Class A Shares are generally sold with an up-front sales charge and incur a .25% annual 12b-1 service fee. Class A Share purchases of $1 million or more are sold at net asset value without an up-front sales charge but may be subject to a contingent deferred sales charge (“CDSC”) if redeemed within 18 months of purchase. Class B Shares are sold without an up-front sales charge but incur a .75% annual 12b-1 distribution fee and a .25% annual 12b-1 service fee. An investor purchasing Class B Shares agrees to pay a CDSC of up to 5% depending upon the length of time the shares are held by the investor (CDSC is reduced to 0% at the end of six years). Class B Shares convert to Class A Shares eight years after purchase. Class C Shares are sold without an up-front sales charge but incur a .75% annual 12b-1 distribution fee and a .25% annual 12b-1 service fee. An investor purchasing Class C Shares agrees to pay a CDSC of 1% if Class C Shares are redeemed within one year of purchase. Class R Shares are not subject to any sales charge or 12b-1 distribution or service fees. Class R Shares are available only under limited circumstances.
Derivative Financial Instruments
The Funds are authorized to invest in certain derivative financial instruments. Although the Funds are authorized to invest in such financial instruments, and may do so in the future, they did not make any such investments during the fiscal year ended June 30, 2007.
Repurchase Agreements
In connection with transactions in repurchase agreements, it is the Funds’ policy that its custodian take possession of the underlying collateral securities, the fair value of which exceeds the principal amount of the repurchase transaction, including accrued interest, at all times. If the seller defaults, and the fair value of the collateral declines, realization of the collateral may be delayed or limited.
Expense Allocation
Expenses of the Funds that are not directly attributable to a specific class of shares are prorated among the classes based on the relative net assets of each class. Expenses directly attributable to a class of shares, which presently only include 12b-1 distribution and service fees, are recorded to the specific class.
Foreign Currency Transactions
The Funds are authorized to engage in foreign currency exchange transactions, including foreign currency forward, options and futures contracts. To the extent that the Funds invest in securities and/or contracts that are denominated in a currency other than U.S. dollars, the Funds will be subject to currency risk, which is the risk that an increase in the U.S. dollar relative to the foreign currency will reduce returns or portfolio value. Generally, when the U.S. dollar rises in value against a foreign currency, the Funds’ investments denominated in that currency will lose value because its currency is worth fewer U.S. dollars; the opposite effect occurs if the U.S. dollar falls in relative value. Investments and other assets and liabilities denominated in foreign currencies are converted into U.S. dollars on a spot (i.e. cash) basis at the spot rate prevailing in the foreign currency exchange market at the time of valuation. Purchases and sales of investments and dividend income denominated in foreign currencies are translated into U.S. dollars on the respective dates of such transactions. The gains or losses resulting from changes in foreign exchange rates are included with net realized and unrealized gain (loss) in the Statement of Operations.
The books and records of the Funds are maintained in U.S. dollars. Foreign currencies, investments and other assets and liabilities are translated into U.S. dollars at 4:00 p.m. Eastern time. Investments and income and expenses are translated on the respective dates of such transactions. Net realized foreign currency gains and losses resulting from changes in exchange rates include foreign currency gains and losses between trade date and settlement date of the transactions, foreign currency transactions, and the difference between the amounts of interest and dividends recorded on the books of a Fund and the amounts actually received.
Custodian Fee Credit
Each Fund has an arrangement with the custodian bank whereby certain custodian fees and expenses are reduced by credits earned on each Fund’s cash on deposit with the bank. Such deposit arrangements are an alternative to overnight investments. Credits for cash balances may be offset by changes for any days on which the Fund overdraws its account at the custodian bank.
Indemnifications
Under the Trust’s organizational documents, its Officers and Trustees are indemnified against certain liabilities arising out of the performance of their duties to the Trust. In addition, in the normal course of business, the Trust enters into contracts that provide general indemnifications to other parties. The Trust’s maximum exposure under these arrangements is unknown as this would involve future claims that may be made against the Trust that have not yet occurred. However, the Trust has not had prior claims or losses pursuant to these contracts and expects the risk of loss to be remote.
Use of Estimates
The preparation of financial statements in conformity with accounting principles generally accepted in the United States requires management to make estimates and assumptions that affect the reported amounts of assets and liabilities at the date of the financial statements and the reported amounts of increases and decreases in net assets from operations during the reporting period. Actual results may differ from those estimates.
32
2. Fund Shares
Transactions in Fund shares were as follows:
| | | | | | | | | | | | | | |
| | | Large-Cap Value | |
| | | Year Ended
6/30/07 | | | Year Ended
6/30/06 | |
| | | Shares | | | Amount | | | Shares | | | Amount | |
Shares sold: | | | | | | | | | | | | | | |
Class A | | 589,796 | | | $ | 16,843,317 | | | 635,413 | | | $ | 16,943,627 | |
Class A – automatic conversion of Class B shares | | 211,410 | | | | 6,045,121 | | | 355,884 | | | | 9,566,550 | |
Class B | | 52,323 | | | | 1,446,438 | | | 66,228 | | | | 1,729,560 | |
Class C | | 120,847 | | | | 3,341,766 | | | 106,547 | | | | 2,778,209 | |
Class R | | 132,239 | | | | 3,838,148 | | | 247,984 | | | | 6,729,536 | |
Shares issued to shareholders due to reinvestment
of distributions: | | | | | | | | | | | | | | |
Class A | | 1,181,266 | | | | 33,095,021 | | | 804,708 | | | | 21,039,230 | |
Class B | | 45,561 | | | | 1,242,036 | | | 56,295 | | | | 1,438,042 | |
Class C | | 52,581 | | | | 1,430,796 | | | 35,224 | | | | 898,356 | |
Class R | | 97,833 | | | | 2,754,551 | | | 52,067 | | | | 1,366,290 | |
| | | 2,483,856 | | | | 70,037,194 | | | 2,360,350 | | | | 62,489,400 | |
Shares redeemed: | | | | | | | | | | | | | | |
Class A | | (1,799,554 | ) | | | (51,667,507 | ) | | (1,902,950 | ) | | | (51,111,985 | ) |
Class B | | (264,126 | ) | | | (7,395,984 | ) | | (550,332 | ) | | | (14,459,366 | ) |
Class B – automatic conversion to Class A shares | | (216,354 | ) | | | (6,045,121 | ) | | (363,475 | ) | | | (9,566,550 | ) |
Class C | | (185,679 | ) | | | (5,219,044 | ) | | (289,578 | ) | | | (7,585,488 | ) |
Class R | | (114,704 | ) | | | (3,317,396 | ) | | (229,863 | ) | | | (6,198,901 | ) |
| | | (2,580,417 | ) | | | (73,645,052 | ) | | (3,336,198 | ) | | | (88,922,290 | ) |
Net increase (decrease) | | (96,561 | ) | | $ | (3,607,858 | ) | | (975,848 | ) | | $ | (26,432,890 | ) |
| |
| | | Municipal and Stock | |
| | | Year Ended
6/30/07 | | | Year Ended
6/30/06 | |
| | | Shares | | | Amount | | | Shares | | | Amount | |
Shares sold: | | | | | | | | | | | | | | |
Class A | | 132,891 | | | $ | 3,330,489 | | | 243,271 | | | $ | 5,748,229 | |
Class A – automatic conversion of Class B shares | | 125,746 | | | | 3,112,482 | | | 147,913 | | | | 3,513,967 | |
Class B | | 4,823 | | | | 128,147 | | | 14,020 | | | | 354,300 | |
Class C | | 46,026 | | | | 1,232,209 | | | 23,027 | | | | 577,227 | |
Class R | | 10,720 | | | | 261,730 | | | 21,682 | | | | 499,274 | |
Shares issued to shareholders due to reinvestment
of distributions: | | | | | | | | | | | | | | |
Class A | | 49,523 | | | | 1,240,603 | | | 49,389 | | | | 1,167,307 | |
Class B | | 3,088 | | | | 81,876 | | | 4,503 | | | | 112,504 | |
Class C | | 4,061 | | | | 107,905 | | | 2,698 | | | | 67,533 | |
Class R | | 627 | | | | 15,355 | | | 740 | | | | 17,125 | |
| | | 377,505 | | | | 9,510,796 | | | 507,243 | | | | 12,057,466 | |
Shares redeemed: | | | | | | | | | | | | | | |
Class A | | (351,285 | ) | | | (8,742,712 | ) | | (367,338 | ) | | | (8,698,020 | ) |
Class B | | (95,718 | ) | | | (2,546,404 | ) | | (225,880 | ) | | | (5,655,645 | ) |
Class B – automatic conversion to Class A shares | | (118,476 | ) | | | (3,112,482 | ) | | (139,678 | ) | | | (3,513,967 | ) |
Class C | | (23,453 | ) | | | (626,412 | ) | | (38,872 | ) | | | (964,375 | ) |
Class R | | (901 | ) | | | (21,627 | ) | | (5,948 | ) | | | (137,852 | ) |
| | | (589,833 | ) | | | (15,049,637 | ) | | (777,716 | ) | | | (18,969,859 | ) |
Net increase (decrease) | | (212,328 | ) | | $ | (5,538,841 | ) | | (270,473 | ) | | $ | (6,912,393 | ) |
33
Notes to Financial Statements (continued)
| | | | | | | | | | | | | | |
| | | Stock and Bond | |
| | | Year Ended
6/30/07 | | | Year Ended
6/30/06 | |
| | | Shares | | | Amount | | | Shares | | | Amount | |
Shares sold: | | | | | | | | | | | | | | |
Class A | | 128,966 | | | $ | 3,383,402 | | | 165,498 | | | $ | 4,281,193 | |
Class A – automatic conversion of Class B shares | | 55,247 | | | | 1,445,056 | | | 49,777 | | | | 1,284,510 | |
Class B | | 40,699 | | | | 1,071,284 | | | 38,630 | | | | 993,077 | |
Class C | | 59,994 | | | | 1,587,859 | | | 51,412 | | | | 1,311,552 | |
Class R | | 27,154 | | | | 713,386 | | | 63,847 | | | | 1,663,029 | |
Shares issued to shareholders due to reinvestment
of distributions: | | | | | | | | | | | | | | |
Class A | | 75,480 | | | | 1,957,274 | | | 84,862 | | | | 2,138,838 | |
Class B | | 11,549 | | | | 299,017 | | | 19,061 | | | | 478,808 | |
Class C | | 8,569 | | | | 222,038 | | | 9,732 | | | | 244,679 | |
Class R | | 30,646 | | | | 794,850 | | | 30,987 | | | | 781,385 | |
| | | 438,304 | | | | 11,474,166 | | | 513,806 | | | | 13,177,071 | |
Shares redeemed: | | | | | | | | | | | | | | |
Class A | | (212,229 | ) | | | (5,555,552 | ) | | (297,679 | ) | | | (7,728,324 | ) |
Class B | | (75,390 | ) | | | (1,986,262 | ) | | (136,424 | ) | | | (3,515,493 | ) |
Class B – automatic conversion to Class A shares | | (55,290 | ) | | | (1,445,056 | ) | | (49,817 | ) | | | (1,284,510 | ) |
Class C | | (69,756 | ) | | | (1,833,807 | ) | | (78,316 | ) | | | (2,026,429 | ) |
Class R | | (20,594 | ) | | | (537,994 | ) | | (146,432 | ) | | | (3,890,717 | ) |
| | | (433,259 | ) | | | (11,358,671 | ) | | (708,668 | ) | | | (18,445,473 | ) |
Net increase (decrease) | | 5,045 | | | $ | 115,495 | | | (194,862 | ) | | $ | (5,268,402 | ) |
3. Investment Transactions
Purchases and sales (including maturities but excluding short-term investments) for the fiscal year ended June 30, 2007, were as follows:
| | | | | | | | | |
| | | Large-Cap
Value | | Municipal
and Stock | | Stock and
Bond |
Purchases: | | | | | | | | | |
Investment Securities | | $ | 404,939,871 | | $ | 28,512,943 | | $ | 24,494,700 |
U.S. Government and agency obligations | | | — | | | — | | | 10,074,124 |
Sales and maturities: | | | | | | | | | |
Investment Securities | | | 438,811,594 | | | 33,632,795 | | | 29,084,567 |
U.S. Government and agency obligations | | | — | | | — | | | 7,671,836 |
4. Income Tax Information
The following information is presented on an income tax basis. Differences between amounts for financial statement and federal income tax purposes are primarily due to the treatment of paydown gains and losses on debt securities, if any, timing differences in recognizing taxable market discount, amortization of premium on taxable debt securities, and timing differences in recognizing certain gains and losses on investment transactions. To the extent that differences arise that are permanent in nature, such amounts are reclassified within the capital accounts on the Statement of Assets and Liabilities presented in the annual report, based on their federal tax basis treatment; temporary differences do not require reclassification. Temporary and permanent differences do not impact the net asset values of the Funds.
At June 30, 2007, the cost of investments was as follows:
| | | | | | | | | |
| | | Large-Cap
Value | | Municipal
and Stock | | Stock and
Bond |
Cost of investments | | $ | 457,173,936 | | $ | 68,823,752 | | $ | 51,139,294 |
34
Gross unrealized appreciation and gross unrealized depreciation of investments at June 30, 2007, were as follows:
| | | | | | | | | | | | |
| | | Large-Cap
Value | | | Municipal
and Stock | | | Stock and
Bond | |
Gross unrealized: | | | | | | | | | | | | |
Appreciation | | $ | 121,422,352 | | | $ | 8,250,006 | | | $ | 7,842,478 | |
Depreciation | | | (5,344,356 | ) | | | (416,717 | ) | | | (561,487 | ) |
Net unrealized appreciation (depreciation) of investments | | $ | 116,077,996 | | | $ | 7,833,289 | | | $ | 7,280,991 | |
The tax components of undistributed net tax-exempt income, net ordinary income and net long-term capital gains at June 30, 2007, the Funds’ tax year end, were as follows:
| | | | | | | | | |
| | | Large-Cap
Value | | Municipal
and Stock | | Stock and
Bond |
Undistributed net tax-exempt income* | | $ | — | | $ | 321,995 | | $ | — |
Undistributed net ordinary income** | | | 18,422,846 | | | 164,451 | | | 1,217,034 |
Undistributed net long-term capital gains | | | 46,865,250 | | | 992,556 | | | 3,043,511 |
| * | Undistributed net tax-exempt income (on a tax basis) has not been reduced for the dividends declared on June 8, 2007 for Municipal and Stock and June 28, 2007 for Stock and Bond, both of which were paid on July 2, 2007. |
| ** | Net ordinary income consists of net taxable income derived from dividends, interest, market discount accretion and net short-term capital gains, if any. |
The tax character of distributions paid during the Funds’ tax years ended June 30, 2007 and June 30, 2006, was designated for purposes of the dividends paid deduction as follows:
| | | | | | | | | |
| 2007 | | Large-Cap Value | | Municipal and Stock | | Stock and
Bond |
Distributions from net tax-exempt income*** | | $ | — | | $ | 1,421,668 | | $ | — |
Distributions from net ordinary income** | | | 18,894,924 | | | 559,542 | | | 2,176,221 |
Distributions from net long-term capital gains**** | | | 33,908,660 | | | — | | | 2,460,933 |
| 2006 | | Large-Cap Value | | Municipal and Stock | | Stock and
Bond |
Distributions from net tax-exempt income | | $ | — | | $ | 1,452,669 | | $ | — |
Distributions from net ordinary income** | | | 14,810,640 | | | 404,873 | | | 1,972,252 |
Distributions from net long-term capital gains | | | 20,057,927 | | | — | | | 3,334,108 |
| ** | Net ordinary income consists of net taxable income derived from dividends, interest, market discount accretion and net short-term capital gains, if any. |
| *** | The Funds hereby designate these amounts paid during the fiscal year ended June 30, 2007, as Exempt Interest Dividends. |
| **** | The Funds hereby designate these amounts paid during the fiscal year ended June 30, 2007, as long-term capital gain dividends pursuant to Internal Revenue Code Section 852(b)(3). |
5. Management Fee and Other Transactions with Affiliates
Each Fund’s management fee is separated into two components – a complex-level component, based on the aggregate amount of all fund assets managed by Nuveen Asset Management (the “Adviser”), a wholly owned subsidiary of Nuveen Investments, Inc. (“Nuveen”), and a specific fund-level component, based only on the amount of assets within each individual Fund. This pricing structure enables Nuveen fund shareholders to benefit from growth in the assets within each individual fund as well as from growth in the amount of complex-wide assets managed by the Adviser.
The annual fund-level fee, payable monthly, for each Fund is based upon the average daily net assets of each Fund as follows:
| | | | | | | | | |
| Average Daily Net Assets | | Large-Cap Value Fund-Level Fee Rate | | | Municipal and Stock Fund-Level Fee Rate | | | Stock and Bond Fund-Level Fee Rate | |
For the first $125 million | | .6500 | % | | .5500 | % | | .5500 | % |
For the next $125 million | | .6375 | | | .5375 | | | .5375 | |
For the next $250 million | | .6250 | | | .5250 | | | .5250 | |
For the next $500 million | | .6125 | | | .5125 | | | .5125 | |
For the next $1 billion | | .6000 | | | .5000 | | | .5000 | |
For net assets over $2 billion | | .5750 | | | .4750 | | | .4750 | |
35
Notes to Financial Statements (continued)
The annual complex-level fee, payable monthly, which is additive to the fund-level fee, for all Nuveen sponsored funds in the U.S., is based on the aggregate amount of total fund assets managed as stated in the tables below. As of June 30, 2007, the complex-level fee rate was .1828%.
Effective August 20, 2007, the complex-level fee schedule is as follows:
| | | |
| Complex-Level Asset Breakpoint Level (1) | | Effective Rate at Breakpoint Level | |
$55 billion | | .2000 | % |
$56 billion | | .1996 | |
$57 billion | | .1989 | |
$60 billion | | .1961 | |
$63 billion | | .1931 | |
$66 billion | | .1900 | |
$71 billion | | .1851 | |
$76 billion | | .1806 | |
$80 billion | | .1773 | |
$91 billion | | .1691 | |
$125 billion | | .1599 | |
$200 billion | | .1505 | |
$250 billion | | .1469 | |
$300 billion | | .1445 | |
Prior to August 20, 2007, the complex-level fee schedule was as follows:
| | | |
| Complex-Level Asset Breakpoint Level (1) | | Effective Rate at Breakpoint Level | |
$55 billion | | .2000 | % |
$56 billion | | .1996 | |
$57 billion | | .1989 | |
$60 billion | | .1961 | |
$63 billion | | .1931 | |
$66 billion | | .1900 | |
$71 billion | | .1851 | |
$76 billion | | .1806 | |
$80 billion | | .1773 | |
$91 billion | | .1698 | |
$125 billion | | .1617 | |
$200 billion | | .1536 | |
$250 billion | | .1509 | |
$300 billion | | .1490 | |
| (1) | The complex-level fee component of the management fee for the funds is calculated based upon the aggregate Managed Assets (“Managed Assets” means the average daily net assets of each fund including assets attributable to preferred stock issued by or borrowings by the Nuveen funds) of Nuveen-sponsored funds in the U.S. |
The management fee compensates the Adviser for overall investment advisory and administrative services and general office facilities. The Adviser has entered into a Sub-Advisory Agreement with Institutional Capital LLC (“ICAP”). ICAP manages the investment portfolios of Large-Cap Value, Stock and Bond, and the equity portion of Municipal and Stock’s investment portfolio. ICAP is compensated for its services to the Funds from the management fee paid to the Adviser.
In May 2006, ICAP announced that it had entered into a merger agreement with New York Life Investment Holdings LLC (“NYLIM Holdings”), pursuant to which ICAP would become a wholly-owned subsidiary of NYLIM Holdings. The transaction was consummated on June 30, 2006, and after that date, ICAP became Institutional Capital LLC. Pursuant to the Investment Company Act of 1940, the change in ownership of ICAP caused the existing sub-advisory agreements to terminate, requiring shareholders of the Funds to approve new sub-advisory agreements with Institutional Capital LLC. A special shareholder meeting was held on August 25, 2006, at which time the shareholders of the Funds approved the new sub-advisory agreements. Prior to June 30, 2006, Nuveen held a minority interest in ICAP. As part of the transaction, Nuveen sold its holdings and no longer owns any interest in ICAP.
The Adviser agreed to waive part of its management fees or reimburse certain expenses of Large-Cap, Municipal and Stock and Stock and Bond through October 31, 2008, in order to limit total operating expenses (excluding 12b-1 distribution and service fees, interest expense, taxes, fees incurred in acquiring and disposing of portfolio securities and extraordinary expenses) from exceeding 1.20%, 1.00%, and 1.00%, respectively, of the average daily net assets. The Adviser may also voluntarily reimburse additional expenses from time to time. Voluntary reimbursements may be terminated at any time at the Adviser’s discretion.
The Trust pays no compensation directly to those of its Trustees who are affiliated with the Adviser or to its Officers, all of whom receive remuneration for their services to the Trust from the Adviser or its affiliates. The Board of Trustees has adopted a deferred compensation plan for independent Trustees that enables Trustees to elect to defer receipt of all or a portion of the annual
36
compensation they are entitled to receive from certain Nuveen advised funds. Under the plan, deferred amounts are treated as though equal dollar amounts had been invested in shares of select Nuveen advised funds.
During the fiscal year ended June 30, 2007, Nuveen Investments, LLC (the “Distributor”), a wholly owned subsidiary of Nuveen, collected sales charges on purchases of Class A Shares, the majority of which were paid out as concessions to financial intermediaries as follows:
| | | | | | |
| | | Large-Cap
Value | | Municipal
and Stock | | Stock and
Bond |
Sales charges collected (unaudited) | | $116,020 | | $66,446 | | $72,805 |
Paid to financial intermediaries (unaudited) | | 101,838 | | 58,132 | | 64,029 |
The Distributor also received 12b-1 service fees on Class A Shares, substantially all of which were paid to compensate financial intermediaries for providing services to shareholders relating to their investments.
During the fiscal year ended June 30, 2007, the Distributor compensated financial intermediaries directly with commission advances at the time of purchase as follows:
| | | | | | | | | |
| | | Large-Cap
Value | | Municipal
and Stock | | Stock and
Bond |
Commission advances (unaudited) | | $ | 33,638 | | $ | 13,884 | | $ | 21,882 |
To compensate for commissions advanced to financial intermediaries, all 12b-1 service fees collected on Class B Shares during the first year following a purchase, all 12b-1 distribution fees collected on Class B Shares, and all 12b-1 service and distribution fees collected on Class C Shares during the first year following a purchase are retained by the Distributor. During the fiscal year ended June 30, 2007, the Distributor retained such 12b-1 fees as follows:
| | | | | | | | | |
| | | Large-Cap
Value | | Municipal
and Stock | | Stock and
Bond |
12b-1 fees retained (unaudited) | | $ | 303,448 | | $ | 68,764 | | $ | 62,849 |
The remaining 12b-1 fees charged to the Funds were paid to compensate financial intermediaries for providing services to shareholders relating to their investments.
The Distributor also collected and retained CDSC on share redemptions during the fiscal year ended June 30, 2007, as follows:
| | | | | | | | | |
| | | Large-Cap
Value | | Municipal
and Stock | | Stock and
Bond |
CDSC retained (unaudited) | | $ | 21,140 | | $ | 16,766 | | $ | 17,097 |
As a result of certain trading errors that occurred during the fiscal year ended June 30, 2006, Stock and Bond was reimbursed $55,844 by the Adviser for losses realized on the disposal of investments purchased in violation of investment restrictions.
Agreement and Plan of Merger
On June 20, 2007, Nuveen Investments announced that it had entered into a definitive Agreement and Plan of Merger (“Merger Agreement”) with an investor group majority-led by Madison Dearborn Partners, LLC. Madison Dearborn Partners, LLC is a private equity investment firm based in Chicago, Illinois. The investor group includes affiliates of Merrill Lynch, Wachovia, Citigroup, Deutsche Bank and Morgan Stanley. It is anticipated that Merrill Lynch and its affiliates will be indirect “affiliated persons” (as that term is defined in the Investment Company Act of 1940) of the Funds. One important implication of this is that the Funds will not be able to buy or sell securities to or from Merrill Lynch, but the portfolio management teams and Fund management do not expect that this will significantly impact the ability of the Funds to pursue their investment objectives and policies. Under the terms of the merger, each outstanding share of Nuveen Investments’ common stock (other than dissenting shares) will be converted into the right to receive a specified amount of cash, without interest. The merger is expected to be completed by the end of the year, subject to customary conditions, including obtaining the approval of Nuveen Investments shareholders, obtaining necessary fund and client consents sufficient to satisfy the terms of the Merger Agreement, and expiration of certain regulatory waiting periods. The obligations of Madison Dearborn Partners, LLC to consummate the merger are not conditioned on its obtaining financing.
The consummation of the merger will be deemed to be an “assignment” (as defined in the 1940 Act) of the investment management agreement between each Fund and the Adviser, and will result in the automatic termination of each Fund’s agreement. Prior to the consummation of the merger, it is anticipated that the Board of Trustees of each Fund will consider a new investment management agreement with the Adviser. If approved by the Board, the new agreement would be presented to the Fund’s shareholders for approval, and, if so approved by shareholders, would take effect upon consummation of the merger. There can be no assurance that the merger described above will be consummated as contemplated or that necessary shareholder approvals will be obtained.
37
Notes to Financial Statements (continued)
6. New Accounting Pronouncements
Financial Accounting Standards Board Interpretation No. 48
On July 13, 2006, the Financial Accounting Standards Board (FASB) released FASB Interpretation No. 48 “Accounting for Uncertainty in Income Taxes” (FIN 48). FIN 48 provides guidance for how uncertain tax positions should be recognized, measured, presented and disclosed in the financial statements. FIN 48 requires the evaluation of tax positions taken or expected to be taken in the course of preparing the Funds’ tax returns to determine whether the tax positions are “more-likely-than-not” of being sustained by the applicable tax authority. Tax positions not deemed to meet the more-likely-than-not threshold would be recorded as a tax benefit or expense in the current year. Adoption of FIN 48 is required for fiscal years beginning after December 15, 2006, and is to be applied to all open tax years as of the effective date. Recent SEC guidance allows funds to delay implementing FIN 48 into NAV calculations until the fund’s last NAV calculation in the first required financial statement reporting period. As a result, the Funds must begin to incorporate FIN 48 into their NAV calculations by December 31, 2007. At this time, management is continuing to evaluate the implications of FIN 48 and does not expect the adoption of FIN 48 will have a significant impact on the net assets or results of operations of the Funds.
Financial Accounting Standards Board Statement of Financial Accounting Standards No. 157
In September 2006, the Financial Accounting Standards Board (FASB) issued Statement of Financial Accounting Standards (SFAS) No. 157, “Fair Value Measurements.” This standard establishes a single authoritative definition of fair value, sets out a framework for measuring fair value and requires additional disclosures about fair value measurements. SFAS No. 157 applies to fair value measurements already required or permitted by existing standards. SFAS No. 157 is effective for financial statements issued for fiscal years beginning after November 15, 2007, and interim periods within those fiscal years. The changes to current generally accepted accounting principles from the application of this standard relate to the definition of fair value, the methods used to measure fair value, and the expanded disclosures about fair value measurements. As of June 30, 2007, the Funds do not believe the adoption of SFAS No. 157 will impact the financial statement amounts; however, additional disclosures may be required about the inputs used to develop the measurements and the effect of certain of the measurements included within the Statement of Operations for the period.
7. Subsequent Events
Distributions to Shareholders
Municipal and Stock declared a dividend distribution from its tax-exempt net investment income which was paid on August 1, 2007, to shareholders of record on July 9, 2007, as follows:
| | | |
| | | Municipal
and Stock |
Dividend per share: | | | |
Class A | | $ | .0405 |
Class B | | | .0305 |
Class C | | | .0305 |
Class R | | | .0435 |
Approval of Additional Sub-Advisory Agreements for Large-Cap Value
On July 31, 2007, the Board of Trustees of Large-Cap Value approved HydePark Investment Strategies, LLC (“HydePark”) and Symphony Asset Management LLC (“Symphony”) as additional sub-advisors for the Fund. If approved by Large-Cap Value shareholders on October 12, 2007, the additional sub-advisory agreements are anticipated to take effect on or about November 1, 2007. In the event shareholders of Large-Cap Value do not approve an additional sub-advisory agreement, the Fund’s portfolio will continue to be managed solely by its current sub-adviser.
38
Financial Highlights
Selected data for a share outstanding throughout each period:
| | | | | | | | | | | | | | | | | | | | | | | | | | | | | | | | | | | | | | | | | | | | | | | | | | | | | | | | | |
| Class (Inception Date) | | | | | | | | | | | | | | | | | | | | | | | | | | | | | | | | | | | | | | | | | | | | |
| | | | | Investment Operations | | | Less Distributions | | | | | | | | Ratios/Supplemental Data | |
| LARGE-CAP VALUE | | | | | | | | | | | | | | | | | | | | | | | | | | | Ratios to Average
Net Assets Before Credit/
Reimbursement | | | Ratios to Average
Net Assets After
Reimbursement(c) | | | Ratios to Average
Net Assets After Credit/
Reimbursement(d) | | | | |
Year Ended
June 30, | | Beginning
Net
Asset
Value | | Net
Invest-
ment
Income
(Loss)(a) | | | Net
Realized/
Unrealized
Gain
(Loss) | | | Total | | | Net
Invest-
ment
Income | | | Capital
Gains | | | Total | | | Ending
Net
Asset
Value | | Total
Return(b) | | | Ending
Net
Assets
(000) | | Expenses | | | Net
Invest-
ment
Income
(Loss) | | | Expenses | | | Net
Invest-
ment
Income
(Loss) | | | Expenses | | | Net
Invest-
ment
Income
(Loss) | | | Portfolio
Turnover
Rate | |
| Class A (8/96) | | | | | | | | | | | | | | | | | | | | | | | | | | | | | | | | | | | | | | | | | | | | | | | | | | | | | | |
2007 | | $ | 27.23 | | $ | .35 | | | $ | 5.33 | | | $ | 5.68 | | | $ | (.26 | ) | | $ | (2.60 | ) | | $ | (2.86 | ) | | $ | 30.05 | | 21.71 | % | | $ | 491,489 | | 1.25 | % | | 1.22 | % | | 1.25 | % | | 1.22 | % | | 1.25 | % | | 1.22 | % | | 75 | % |
2006 | | | 25.58 | | | .22 | | | | 3.26 | | | | 3.48 | | | | (.23 | ) | | | (1.60 | ) | | | (1.83 | ) | | | 27.23 | | 13.97 | | | | 440,403 | | 1.28 | | | .83 | | | 1.28 | | | .83 | | | 1.28 | | | .83 | | | 81 | |
2005 | | | 23.41 | | | .32 | | | | 2.13 | | | | 2.45 | | | | (.28 | ) | | | — | | | | (.28 | ) | | | 25.58 | | 10.51 | | | | 416,407 | | 1.31 | | | 1.31 | | | 1.31 | | | 1.31 | | | 1.31 | | | 1.31 | | | 81 | |
2004 | | | 19.93 | | | .12 | | | | 3.44 | | | | 3.56 | | | | (.08 | ) | | | — | | | | (.08 | ) | | | 23.41 | | 17.90 | | | | 434,121 | | 1.36 | | | .56 | | | 1.36 | | | .56 | | | 1.36 | | | .56 | | | 85 | |
2003 | | | 21.35 | | | .08 | | | | (1.43 | ) | | | (1.35 | ) | | | (.07 | ) | | | — | | | | (.07 | ) | | | 19.93 | | (6.28 | ) | | | 445,050 | | 1.45 | | | .45 | | | 1.45 | | | .45 | | | 1.45 | | | .45 | | | 90 | |
| Class B (8/96) | | | | | | | | | | | | | | | | | | | | | | | | | | | | | | | | | | | | | | | | | | | | | | | | | | | | | | |
2007 | | | 26.64 | | | .12 | | | | 5.21 | | | | 5.33 | | | | (.05 | ) | | | (2.60 | ) | | | (2.65 | ) | | | 29.32 | | 20.77 | | | | 18,491 | | 2.00 | | | .44 | | | 2.00 | | | .44 | | | 2.00 | | | .44 | | | 75 | |
2006 | | | 25.06 | | | .02 | | | | 3.20 | | | | 3.22 | | | | (.04 | ) | | | (1.60 | ) | | | (1.64 | ) | | | 26.64 | | 13.13 | | | | 26,995 | | 2.03 | | | .08 | | | 2.03 | | | .08 | | | 2.03 | | | .08 | | | 81 | |
2005 | | | 22.95 | | | .14 | | | | 2.08 | | | | 2.22 | | | | (.11 | ) | | | — | | | | (.11 | ) | | | 25.06 | | 9.66 | | | | 45,224 | | 2.06 | | | .57 | | | 2.06 | | | .57 | | | 2.06 | | | .57 | | | 81 | |
2004 | | | 19.62 | | | (.04 | ) | | | 3.37 | | | | 3.33 | | | | — | | | | — | | | | — | | | | 22.95 | | 16.97 | | | | 56,486 | | 2.11 | | | (.18 | ) | | 2.11 | | | (.18 | ) | | 2.11 | | | (.18 | ) | | 85 | |
2003 | | | 21.08 | | | (.06 | ) | | | (1.40 | ) | | | (1.46 | ) | | | — | | | | — | | | | — | | | | 19.62 | | (6.93 | ) | | | 55,129 | | 2.21 | | | (.31 | ) | | 2.21 | | | (.31 | ) | | 2.21 | | | (.31 | ) | | 90 | |
| Class C (8/96) | | | | | | | | | | | | | | | | | | | | | | | | | | | | | | | | | | | | | | | | | | | | | | | | | | | | | | |
2007 | | | 26.60 | | | .13 | | | | 5.19 | | | | 5.32 | | | | (.05 | ) | | | (2.60 | ) | | | (2.65 | ) | | | 29.27 | | 20.80 | | | | 31,219 | | 2.00 | | | .47 | | | 2.00 | | | .47 | | | 2.00 | | | .47 | | | 75 | |
2006 | | | 25.02 | | | .02 | | | | 3.20 | | | | 3.22 | | | | (.04 | ) | | | (1.60 | ) | | | (1.64 | ) | | | 26.60 | | 13.15 | | | | 28,692 | | 2.03 | | | .08 | | | 2.03 | | | .08 | | | 2.03 | | | .08 | | | 81 | |
2005 | | | 22.92 | | | .14 | | | | 2.07 | | | | 2.21 | | | | (.11 | ) | | | — | | | | (.11 | ) | | | 25.02 | | 9.63 | | | | 30,691 | | 2.06 | | | .57 | | | 2.06 | | | .57 | | | 2.06 | | | .57 | | | 81 | |
2004 | | | 19.58 | | | (.04 | ) | | | 3.38 | | | | 3.34 | | | | — | | | | — | | | | — | | | | 22.92 | | 17.06 | | | | 43,607 | | 2.11 | | | (.18 | ) | | 2.11 | | | (.18 | ) | | 2.11 | | | (.18 | ) | | 85 | |
2003 | | | 21.04 | | | (.06 | ) | | | (1.40 | ) | | | (1.46 | ) | | | — | | | | — | | | | — | | | | 19.58 | | (6.94 | ) | | | 42,105 | | 2.21 | | | (.31 | ) | | 2.21 | | | (.31 | ) | | 2.21 | | | (.31 | ) | | 90 | |
| Class R (8/96) | | | | | | | | | | | | | | | | | | | | | | | | | | | | | | | | | | | | | | | | | | | | | | | | | | | | | | |
2007 | | | 27.33 | | | .43 | | | | 5.35 | | | | 5.78 | | | | (.33 | ) | | | (2.60 | ) | | | (2.93 | ) | | | 30.18 | | 22.03 | | | | 31,878 | | 1.00 | | | 1.48 | | | 1.00 | | | 1.48 | | | 1.00 | | | 1.48 | | | 75 | |
2006 | | | 25.67 | | | .29 | | | | 3.27 | | | | 3.56 | | | | (.30 | ) | | | (1.60 | ) | | | (1.90 | ) | | | 27.33 | | 14.24 | | | | 25,720 | | 1.03 | | | 1.08 | | | 1.03 | | | 1.08 | | | 1.03 | | | 1.08 | | | 81 | |
2005 | | | 23.49 | | | .38 | | | | 2.14 | | | | 2.52 | | | | (.34 | ) | | | — | | | | (.34 | ) | | | 25.67 | | 10.77 | | | | 22,350 | | 1.06 | | | 1.56 | | | 1.06 | | | 1.56 | | | 1.06 | | | 1.56 | | | 81 | |
2004 | | | 19.99 | | | .18 | | | | 3.45 | | | | 3.63 | | | | (.13 | ) | | | — | | | | (.13 | ) | | | 23.49 | | 18.20 | | | | 20,533 | | 1.11 | | | .83 | | | 1.11 | | | .83 | | | 1.11 | | | .83 | | | 85 | |
2003 | | | 21.41 | | | .13 | | | | (1.43 | ) | | | (1.30 | ) | | | (.12 | ) | | | — | | | | (.12 | ) | | | 19.99 | | (5.99 | ) | | | 16,828 | | 1.20 | | | .70 | | | 1.20 | | | .70 | | | 1.20 | | | .70 | | | 90 | |
| (a) | Per share Net Investment Income (Loss) is calculated using the average daily shares method. |
| (b) | Total return is the combination of changes in net asset value, reinvested dividend income at net asset value and reinvested capital gains distributions at net asset value, if any. The last dividend declared in the period, which is typically paid on the first business day of the following month, is assumed to be reinvested at the ending net asset value. The actual reinvest price for the last dividend declared in the period may be different from the price used in the calculation. Total returns are not annualized. |
| (c) | After expense reimbursement from the Adviser, where applicable. |
| (d) | After custodian fee credit and expense reimbursement, where applicable. |
See accompanying notes to financial statements.
39
Financial Highlights (continued)
Selected data for a share outstanding throughout each period:
| | | | | | | | | | | | | | | | | | | | | | | | | | | | | | | | | | | | | | | | | | | | | | | | | | | | | | | |
| Class (Inception Date) | | | | | | | | | | | | | | | | | | | | | | | | | | | | | | | | | | | | | | | | | | |
| | | | | Investment Operations | | | Less Distributions | | | | | | Ratios/Supplemental Data | |
| MUNICIPAL and STOCK | | | | | | | | | | | | | | | | | | | | | | | Ratios to Average
Net Assets Before Credit/
Reimbursement | | | Ratios to Average
Net Assets After
Reimbursement(c) | | | Ratios to Average
Net Assets After Credit/
Reimbursement(d) | | | | |
Year Ended
June 30, | | Beginning
Net
Asset
Value | | Net
Invest-
ment
Income(a) | | Net
Realized/
Unrealized
Gain
(Loss) | | | Total | | | Net
Invest-
ment
Income | | | Capital
Gains | | Total | | | Ending
Net
Asset
Value | | Total
Return(b) | | | Ending
Net
Assets
(000) | | Expenses | | | Net
Invest-
ment
Income | | | Expenses | | | Net
Invest-
ment
Income | | | Expenses | | | Net
Invest-
ment
Income | | | Portfolio
Turnover
Rate | |
| Class A (8/96) | | | | | | | | | | | | | | | | | | | | | | | | | | | | | | | | | | | | | | | | | | | | | | | | | | | | |
2007 | | $ | 23.86 | | $ | .67 | | $ | 1.91 | | | $ | 2.58 | | | $ | (.68 | ) | | $ | — | | $ | (.68 | ) | | $ | 25.76 | | 10.90 | % | | $ | 61,577 | | 1.22 | % | | 2.64 | % | | 1.22 | % | | 2.64 | % | | 1.19 | % | | 2.67 | % | | 37 | % |
2006 | | | 23.01 | | | .60 | | | .89 | | | | 1.49 | | | | (.64 | ) | | | — | | | (.64 | ) | | | 23.86 | | 6.52 | | | | 58,064 | | 1.26 | | | 2.51 | | | 1.24 | | | 2.53 | | | 1.22 | | | 2.55 | | | 44 | |
2005 | | | 21.96 | | | .62 | | | 1.10 | | | | 1.72 | | | | (.67 | ) | | | — | | | (.67 | ) | | | 23.01 | | 7.91 | | | | 54,323 | | 1.24 | | | 2.76 | | | 1.24 | | | 2.76 | | | 1.23 | | | 2.77 | | | 47 | |
2004 | | | 20.79 | | | .54 | | | 1.14 | | | | 1.68 | | | | (.51 | ) | | | — | | | (.51 | ) | | | 21.96 | | 8.13 | | | | 56,787 | | 1.28 | | | 2.47 | | | 1.25 | | | 2.51 | | | 1.25 | | | 2.51 | | | 45 | |
2003 | | | 21.45 | | | .49 | | | (.57 | ) | | | (.08 | ) | | | (.58 | ) | | | — | | | (.58 | ) | | | 20.79 | | (.25 | ) | | | 59,780 | | 1.35 | | | 2.34 | | | 1.25 | | | 2.44 | | | 1.24 | | | 2.45 | | | 38 | |
| Class B (8/96) | | | | | | | | | | | | | | | | | | | | | | | | | | | | | | | | | | | | | | | | | | | | | | | | | | | | |
2007 | | | 25.32 | | | .50 | | | 2.04 | | | | 2.54 | | | | (.50 | ) | | | — | | | (.50 | ) | | | 27.36 | | 10.09 | | | | 5,916 | | 1.98 | | | 1.87 | | | 1.98 | | | 1.87 | | | 1.95 | | | 1.90 | | | 37 | |
2006 | | | 24.26 | | | .45 | | | .94 | | | | 1.39 | | | | (.33 | ) | | | — | | | (.33 | ) | | | 25.32 | | 5.73 | | | | 10,700 | | 2.00 | | | 1.75 | | | 1.99 | | | 1.76 | | | 1.97 | | | 1.79 | | | 44 | |
2005 | | | 22.99 | | | .47 | | | 1.15 | | | | 1.62 | | | | (.35 | ) | | | — | | | (.35 | ) | | | 24.26 | | 7.08 | | | | 18,671 | | 2.00 | | | 2.01 | | | 2.00 | | | 2.01 | | | 1.99 | | | 2.02 | | | 47 | |
2004 | | | 21.63 | | | .40 | | | 1.19 | | | | 1.59 | | | | (.23 | ) | | | — | | | (.23 | ) | | | 22.99 | | 7.36 | | | | 23,110 | | 2.03 | | | 1.72 | | | 2.00 | | | 1.76 | | | 2.00 | | | 1.76 | | | 45 | |
2003 | | | 22.14 | | | .36 | | | (.60 | ) | | | (.24 | ) | | | (.27 | ) | | | — | | | (.27 | ) | | | 21.63 | | (1.01 | ) | | | 26,534 | | 2.10 | | | 1.60 | | | 2.00 | | | 1.71 | | | 1.99 | | | 1.71 | | | 38 | |
| Class C (8/96) | | | | | | | | | | | | | | | | | | | | | | | | | | | | | | | | | | | | | | | | | | | | | | | | | | | | |
2007 | | | 25.29 | | | .51 | | | 2.02 | | | | 2.53 | | | | (.50 | ) | | | — | | | (.50 | ) | | | 27.32 | | 10.10 | | | | 9,363 | | 1.97 | | | 1.90 | | | 1.97 | | | 1.90 | | | 1.94 | | | 1.93 | | | 37 | |
2006 | | | 24.24 | | | .45 | | | .93 | | | | 1.38 | | | | (.33 | ) | | | — | | | (.33 | ) | | | 25.29 | | 5.70 | | | | 7,992 | | 2.01 | | | 1.76 | | | 1.99 | | | 1.77 | | | 1.97 | | | 1.80 | | | 44 | |
2005 | | | 22.96 | | | .48 | | | 1.15 | | | | 1.63 | | | | (.35 | ) | | | — | | | (.35 | ) | | | 24.24 | | 7.13 | | | | 7,979 | | 1.99 | | | 2.01 | | | 1.99 | | | 2.01 | | | 1.98 | | | 2.02 | | | 47 | |
2004 | | | 21.61 | | | .40 | | | 1.18 | | | | 1.58 | | | | (.23 | ) | | | — | | | (.23 | ) | | | 22.96 | | 7.32 | | | | 8,229 | | 2.03 | | | 1.72 | | | 2.00 | | | 1.75 | | | 2.00 | | | 1.76 | | | 45 | |
2003 | | | 22.12 | | | .35 | | | (.59 | ) | | | (.24 | ) | | | (.27 | ) | | | — | | | (.27 | ) | | | 21.61 | | (1.01 | ) | | | 9,083 | | 2.10 | | | 1.59 | | | 2.00 | | | 1.69 | | | 1.99 | | | 1.70 | | | 38 | |
| Class R (8/96) | | | | | | | | | | | | | | | | | | | | | | | | | | | | | | | | | | | | | | | | | | | | | | | | | | | | |
2007 | | | 23.34 | | | .72 | | | 1.86 | | | | 2.58 | | | | (.77 | ) | | | — | | | (.77 | ) | | | 25.15 | | 11.17 | | | | 1,525 | | .97 | | | 2.90 | | | .97 | | | 2.90 | | | .94 | | | 2.93 | | | 37 | |
2006 | | | 22.56 | | | .65 | | | .87 | | | | 1.52 | | | | (.74 | ) | | | — | | | (.74 | ) | | | 23.34 | | 6.79 | | | | 1,171 | | 1.01 | | | 2.77 | | | .99 | | | 2.79 | | | .96 | | | 2.81 | | | 44 | |
2005 | | | 21.57 | | | .68 | | | 1.07 | | | | 1.75 | | | | (.76 | ) | | | — | | | (.76 | ) | | | 22.56 | | 8.17 | | | | 761 | | .99 | | | 3.06 | | | .99 | | | 3.06 | | | .98 | | | 3.07 | | | 47 | |
2004 | | | 20.46 | | | .59 | | | 1.12 | | | | 1.71 | | | | (.60 | ) | | | — | | | (.60 | ) | | | 21.57 | | 8.48 | | | | 716 | | 1.03 | | | 2.72 | | | 1.00 | | | 2.75 | | | 1.00 | | | 2.76 | | | 45 | |
2003 | | | 21.17 | | | .53 | | | (.57 | ) | | | (.04 | ) | | | (.67 | ) | | | — | | | (.67 | ) | | | 20.46 | | (.02 | ) | | | 731 | | 1.10 | | | 2.58 | | | 1.00 | | | 2.69 | | | .99 | | | 2.69 | | | 38 | |
| (a) | Per share Net Investment Income is calculated using the average daily shares method. |
| (b) | Total return is the combination of changes in net asset value, reinvested dividend income at net asset value and reinvested capital gains distributions at net asset value, if any. The last dividend declared in the period, which is typically paid on the first business day of the following month, is assumed to be reinvested at the ending net asset value. The actual reinvest price for the last dividend declared in the period may be different from the price used in the calculation. Total returns are not annualized. |
| (c) | After expense reimbursement from the Adviser, where applicable. |
| (d) | After custodian fee credit and expense reimbursement, where applicable. |
See accompanying notes to financial statements.
40
| | | | | | | | | | | | | | | | | | | | | | | | | | | | | | | | | | | | | | | | | | | | | | | | | | | | | | | | |
| Class (Inception Date) | | | | | | | | | | | | | | | | | | | | | | | | | | | | | | | | | | | | | | | | | | | |
| | | | | Investment Operations | | | Less Distributions | | | | | | Ratios/Supplemental Data | |
| STOCK and BOND | | | | | | | | | | | | | | | | | | | | | | | | | | | | Ratios to Average
Net Assets Before Credit/
Reimbursement | | | Ratios to Average
Net Assets After
Reimbursement(c) | | | Ratios to Average
Net Assets After Credit/
Reimbursement(d) | | | | |
Year Ended
June 30, | | Beginning
Net
Asset
Value | | Net
Invest-
ment
Income(a) | | Net
Realized/
Unrealized
Gain
(Loss) | | | Total | | | Net
Invest-
ment
Income | | | Capital
Gains | | | Total | | | Ending
Net
Asset
Value | | Total
Return(b) | | | Ending
Net
Assets
(000) | | Expenses | | | Net
Invest-
ment
Income | | | Expenses | | | Net
Invest-
ment
Income | | | Expenses | | | Net
Invest-
ment
Income | | | Portfolio
Turnover
Rate | |
| Class A (8/96) | | | | | | | | | | | | | | | | | | | | | | | | | | | | | | | | | | | | | | | | | | | | | | | | | | | | | |
2007 | | $ | 25.40 | | $ | .58 | | $ | 2.97 | | | $ | 3.55 | | | $ | (.61 | ) | | $ | (1.61 | ) | | $ | (2.22 | ) | | $ | 26.73 | | 14.40 | % | | $ | 33,519 | | 1.26 | % | | 2.17 | % | | 1.24 | % | | 2.19 | % | | 1.24 | % | | 2.19 | % | | 61 | % |
2006 | | | 25.95 | | | .50 | | | 1.41 | | | | 1.91 | | | | (.54 | ) | | | (1.92 | ) | | | (2.46 | ) | | | 25.40 | | 7.60 | * | | | 30,644 | | 1.31 | | | 1.84 | | | 1.24 | | | 1.91 | | | 1.24 | | | 1.91 | | | 56 | |
2005 | | | 24.56 | | | .56 | | | 1.47 | | | | 2.03 | | | | (.64 | ) | | | — | | | | (.64 | ) | | | 25.95 | | 8.33 | | | | 31,248 | | 1.30 | | | 2.16 | | | 1.25 | | | 2.21 | | | 1.25 | | | 2.21 | | | 62 | |
2004 | | | 22.72 | | | .41 | | | 1.92 | | | | 2.33 | | | | (.49 | ) | | | — | | | | (.49 | ) | | | 24.56 | | 10.29 | | | | 33,312 | | 1.36 | | | 1.61 | | | 1.25 | | | 1.72 | | | 1.25 | | | 1.72 | | | 61 | |
2003 | | | 23.48 | | | .38 | | | (.65 | ) | | | (.27 | ) | | | (.43 | ) | | | (.06 | ) | | | (.49 | ) | | | 22.72 | | (.99 | ) | | | 36,751 | | 1.38 | | | 1.64 | | | 1.25 | | | 1.77 | | | 1.25 | | | 1.77 | | | 68 | |
| Class B (8/96) | | | | | | | | | | | | | | | | | | | | | | | | | | | | | | | | | | | | | | | | | | | | | | | | | | | | | |
2007 | | | 25.40 | | | .37 | | | 2.98 | | | | 3.35 | | | | (.41 | ) | | | (1.61 | ) | | | (2.02 | ) | | | 26.73 | | 13.55 | | | | 6,376 | | 2.02 | | | 1.40 | | | 1.99 | | | 1.42 | | | 1.99 | | | 1.42 | | | 61 | |
2006 | | | 25.95 | | | .30 | | | 1.41 | | | | 1.71 | | | | (.34 | ) | | | (1.92 | ) | | | (2.26 | ) | | | 25.40 | | 6.80 | * | | | 8,051 | | 2.06 | | | 1.09 | | | 1.99 | | | 1.15 | | | 1.99 | | | 1.15 | | | 56 | |
2005 | | | 24.56 | | | .37 | | | 1.47 | | | | 1.84 | | | | (.45 | ) | | | — | | | | (.45 | ) | | | 25.95 | | 7.53 | | | | 11,564 | | 2.05 | | | 1.41 | | | 2.00 | | | 1.46 | | | 2.00 | | | 1.47 | | | 62 | |
2004 | | | 22.72 | | | .23 | | | 1.92 | | | | 2.15 | | | | (.31 | ) | | | — | | | | (.31 | ) | | | 24.56 | | 9.48 | | | | 12,459 | | 2.11 | | | .86 | | | 2.00 | | | .97 | | | 2.00 | | | .97 | | | 61 | |
2003 | | | 23.48 | | | .22 | | | (.65 | ) | | | (.43 | ) | | | (.27 | ) | | | (.06 | ) | | | (.33 | ) | | | 22.72 | | (1.73 | ) | | | 12,255 | | 2.13 | | | .89 | | | 2.00 | | | 1.02 | | | 2.00 | | | 1.02 | | | 68 | |
| Class C (8/96) | | | | | | | | | | | | | | | | | | | | | | | | | | | | | | | | | | | | | | | | | | | | | | | | | | | | | |
2007 | | | 25.42 | | | .38 | | | 2.97 | | | | 3.35 | | | | (.41 | ) | | | (1.61 | ) | | | (2.02 | ) | | | 26.75 | | 13.54 | | | | 7,694 | | 2.01 | | | 1.42 | | | 1.99 | | | 1.44 | | | 1.99 | | | 1.44 | | | 61 | |
2006 | | | 25.97 | | | .30 | | | 1.41 | | | | 1.71 | | | | (.34 | ) | | | (1.92 | ) | | | (2.26 | ) | | | 25.42 | | 6.79 | * | | | 7,342 | | 2.06 | | | 1.08 | | | 1.99 | | | 1.16 | | | 1.99 | | | 1.16 | | | 56 | |
2005 | | | 24.58 | | | .37 | | | 1.47 | | | | 1.84 | | | | (.45 | ) | | | — | | | | (.45 | ) | | | 25.97 | | 7.53 | | | | 7,947 | | 2.05 | | | 1.41 | | | 2.00 | | | 1.46 | | | 2.00 | | | 1.46 | | | 62 | |
2004 | | | 22.73 | | | .23 | | | 1.93 | | | | 2.16 | | | | (.31 | ) | | | — | | | | (.31 | ) | | | 24.58 | | 9.52 | | | | 8,632 | | 2.11 | | | .87 | | | 2.00 | | | .98 | | | 2.00 | | | .98 | | | 61 | |
2003 | | | 23.49 | | | .22 | | | (.65 | ) | | | (.43 | ) | | | (.27 | ) | | | (.06 | ) | | | (.33 | ) | | | 22.73 | | (1.73 | ) | | | 7,541 | | 2.13 | | | .90 | | | 2.00 | | | 1.03 | | | 2.00 | | | 1.03 | | | 68 | |
| Class R (8/96) | | | | | | | | | | | | | | | | | | | | | | | | | | | | | | | | | | | | | | | | | | | | | | | | | | | | | |
2007 | | | 25.40 | | | .64 | | | 2.98 | | | | 3.62 | | | | (.68 | ) | | | (1.61 | ) | | | (2.29 | ) | | | 26.73 | | 14.68 | | | | 10,690 | | 1.01 | | | 2.42 | | | .99 | | | 2.44 | | | .99 | | | 2.44 | | | 61 | |
2006 | | | 25.95 | | | .56 | | | 1.41 | | | | 1.97 | | | | (.60 | ) | | | (1.92 | ) | | | (2.52 | ) | | | 25.40 | | 7.87 | * | | | 9,213 | | 1.06 | | | 2.08 | | | .99 | | | 2.15 | | | .99 | | | 2.15 | | | 56 | |
2005 | | | 24.56 | | | .62 | | | 1.47 | | | | 2.09 | | | | (.70 | ) | | | — | | | | (.70 | ) | | | 25.95 | | 8.60 | | | | 10,753 | | 1.05 | | | 2.41 | | | 1.00 | | | 2.46 | | | 1.00 | | | 2.46 | | | 62 | |
2004 | | | 22.72 | | | .47 | | | 1.92 | | | | 2.39 | | | | (.55 | ) | | | — | | | | (.55 | ) | | | 24.56 | | 10.56 | | | | 9,117 | | 1.11 | | | 1.87 | | | 1.00 | | | 1.98 | | | 1.00 | | | 1.98 | | | 61 | |
2003 | | | 23.47 | | | .44 | | | (.64 | ) | | | (.20 | ) | | | (.49 | ) | | | (.06 | ) | | | (.55 | ) | | | 22.72 | | (.70 | ) | | | 7,048 | | 1.13 | | | 1.90 | | | 1.00 | | | 2.03 | | | 1.00 | | | 2.03 | | | 68 | |
| * | During the fiscal year ended June 30, 2006, the Fund received a payment from the Adviser of $55,844, for losses realized on the disposal of investments purchased in violation of investment restrictions, which otherwise would have reduced total returns by .08%, .13%, .12% and .08% for Class A, B, C and R, respectively. |
| (a) | Per share Net Investment Income is calculated using the average daily shares method. |
| (b) | Total return is the combination of changes in net asset value, reinvested dividend income at net asset value and reinvested capital gains distributions at net asset value, if any. The last dividend declared in the period, which is typically paid on the first business day of the following month, is assumed to be reinvested at the ending net asset value. The actual reinvest price for the last dividend declared in the period may be different from the price used in the calculation. Total returns are not annualized. |
| (c) | After expense reimbursement from the Adviser, where applicable. |
| (d) | After custodian fee credit and expense reimbursement, where applicable. |
See accompanying notes to financial statements.
41
Report of Independent Registered Public Accounting Firm
To the Board of Trustees and Shareholders of
Nuveen Investment Trust:
In our opinion, the accompanying statements of assets and liabilities, including the portfolios of investments, and the related statements of operations and of changes in net assets and the financial highlights present fairly, in all material respects, the financial position of Nuveen Large-Cap Value Fund, Nuveen Balanced Municipal and Stock Fund and Nuveen Balanced Stock and Bond Fund (each a series of the Nuveen Investment Trust, hereafter referred to as the “Funds”) at June 30, 2007, the results of each of their operations for the year then ended, the changes in each of their net assets for each of the two years in the period then ended and the financial highlights for each of the five years in the period then ended, in conformity with accounting principles generally accepted in the United States of America. These financial statements and financial highlights (hereafter referred to as “financial statements”) are the responsibility of the Funds’ management; our responsibility is to express an opinion on these financial statements based on our audits. We conducted our audits of these financial statements in accordance with the standards of the Public Company Accounting Oversight Board, which require that we plan and perform the audit to obtain reasonable assurance about whether the financial statements are free of material misstatement. An audit includes examining, on a test basis, evidence supporting the amounts and disclosures in the financial statements, assessing the accounting principles used and significant estimates made by management, and evaluating the overall financial statement presentation. We believe that our audits, which included confirmation of securities at June 30, 2007 by correspondence with the custodian and brokers, provide a reasonable basis for our opinion.
PRICEWATERHOUSECOOPERS LLP
Chicago, IL
August 22, 2007
42
Annual Investment Management Agreement Approval Process
The Board Members are responsible for overseeing the performance of the investment adviser to the Funds and determining whether to continue the advisory arrangements. At the annual review meeting held on May 21, 2007 (the “May Meeting”), the Board Members of the Funds, including the Independent Board Members, unanimously approved the continuance of the Investment Management Agreement between each Fund and Nuveen Asset Management (“NAM” or “Adviser”) and the Sub-Advisory Agreement between NAM and Institutional Capital Corp. (“ICAP”) on behalf of each Fund. The foregoing Investment Management Agreements with NAM and Sub-Advisory Agreements with the Sub-Adviser are hereafter referred to as “Original Investment Management Agreements” and “Original Sub-Advisory Agreements,” respectively.
Subsequent to the May Meeting, Nuveen Investments, Inc. (“Nuveen”), the parent company of NAM, entered into a merger agreement providing for the acquisition of Nuveen by Windy City Investments, Inc., a corporation formed by investors led by Madison Dearborn Partners, LLC (“MDP”), a private equity investment firm (the “Transaction”). Each Original Investment Management Agreement and Original Sub-Advisory Agreement, as required by Section 15 of the Investment Company Act of 1940 (the “1940 Act”) provides for its automatic termination in the event of its “assignment” (as defined in the 1940 Act). Any change in control of the adviser is deemed to be an assignment. The consummation of the Transaction will result in a change of control of NAM as well as its affiliated sub-advisers and therefore cause the automatic termination of each Original Investment Management Agreement and Original Sub-Advisory Agreement, as required by the 1940 Act. Accordingly, in anticipation of the Transaction, at a meeting held on July 31, 2007 (the “July Meeting”), the Board Members, including the Independent Board Members, unanimously approved new Investment Management Agreements (the “New Investment Management Agreements”) with NAM on behalf of each Fund and new Sub-Advisory Agreements (the “New Sub-Advisory Agreements”) between NAM and ICAP on behalf of each Fund to take effect immediately after the Transaction or shareholder approval of the new advisory contracts, whichever is later. The 1940 Act also requires that each New Investment Management Agreement and New Sub-Advisory Agreement be approved by the respective Fund’s shareholders in order for it to become effective. Accordingly, to ensure continuity of advisory services, the Board Members, including the Independent Board Members, unanimously approved Interim Investment Management Agreements and Interim Sub-Advisory Agreements to take effect upon the closing of the Transaction if shareholders have not yet approved the New Investment Management Agreements and New Sub-Advisory Agreements.
In addition to the foregoing, with respect to the Nuveen Large-Cap Value Fund (the “Large-Cap Value Fund”), the Board has authorized a series of changes to such Fund’s investment policies, including adopting a multi-manager model for the Fund. In light of these changes, the Board Members approved as additional sub-advisers HydePark Investment Strategies LLC (“HydePark”) and Symphony Asset Management, LLC (“Symphony”) for the Large-Cap Value Fund. ICAP, HydePark and Symphony are each a “Sub-Adviser.” Further, NAM and each Sub-Adviser (other than Hyde Park) are also a “Fund Adviser.” Accordingly, at the July Meeting, the Board Members, including Independent Board Members, unanimously approved a Sub-Advisory Agreement between NAM and HydePark (the “HydePark Sub-Advisory Agreement”) and a Sub-Advisory Agreement between NAM and Symphony (the “Symphony Sub-Advisory Agreement” and together with the HydePark Sub-Advisory Agreement, the “Additional Sub-Advisory Agreements”). The 1940 Act requires the Symphony Sub-Advisory Agreement and HydePark Sub-Advisory Agreement be approved by the Large-Cap Value Fund’s shareholders to be effective.
Because the information provided and considerations made at the annual review at the May Meeting continue to be relevant with respect to the evaluation of the New Investment Management Agreements and New Sub-Advisory Agreements, the Board considered the foregoing as part of its deliberations of the New Investment Management Agreements and New Sub-Advisory Agreements. Accordingly, as indicated, the discussions immediately below outline the materials and information presented to the Board in connection with the Board’s prior annual review and the analysis undertaken and the conclusions reached by the Board Members when determining to continue the Original Investment Management Agreements and Original Sub-Advisory Agreements. In addition, as Symphony currently advises other Nuveen funds, the Board Members already have a good understanding of the organization, operations and personnel of Symphony. The information provided and considerations made regarding Symphony at the annual review continue to be relevant with respect to the evaluation of Symphony as a new Sub-Adviser to the Large-Cap Value Fund. HydePark, however, is a new sub-adviser for a Fund in the complex. Accordingly, the discussion below for prior approvals does not include HydePark as a Sub-Adviser or a Fund Adviser. The Board’s considerations for the Additional Sub-Advisory Agreements for the Large-Cap Value Fund have been set forth below under “Approval of the New Sub-Advisory Agreements for the Large-Cap Value Fund.”
I. Approval of the Original Investment Management Agreements and Original Sub-Advisory Agreements
During the course of the year, the Board received a wide variety of materials relating to the services provided by the Fund Advisers and the performance of the Funds (as applicable). At each of its quarterly meetings, the Board reviewed investment performance (as applicable) and various matters relating to the operations of the Funds and other Nuveen funds, including the compliance program, shareholder services, valuation, custody, distribution and other information relating to the nature, extent and quality of services provided by the Fund Adviser. Between the regularly scheduled quarterly meetings, the Board Members received information on particular matters as the need arose.
In preparation for their considerations of the Fund Adviser at the May Meeting, the Independent Board Members also received extensive materials, well in advance of the meeting, which outlined or are related to, among other things:
| • | | the nature, extent and quality of services provided by the Fund Adviser; |
43
Annual Investment Management Agreement Approval Process (continued)
| • | | the organization and business operations of the Fund Adviser, including the responsibilities of various departments and key personnel; |
| • | | each Fund’s past performance as well as the Fund’s performance compared to funds with similar investment objectives based on data and information provided by an independent third party and to recognized and/or customized benchmarks (as appropriate); |
| • | | the profitability of the Fund Adviser and certain industry profitability analyses for unaffiliated advisers; |
| • | | the expenses of the Fund Adviser in providing the various services; |
��
| • | | the advisory fees and total expense ratios of each Fund, including comparisons of such fees and expenses with those of comparable, unaffiliated funds based on information and data provided by an independent third party (the “Peer Universe”) as well as compared to a subset of funds within the Peer Universe (the “Peer Group”) of the respective Fund (as applicable); |
| • | | the advisory fees the Fund Adviser assesses to other types of investment products or clients; |
| • | | the soft dollar practices of the Fund Adviser, if any; and |
| • | | from independent legal counsel, a legal memorandum describing among other things, applicable laws, regulations and duties in reviewing and approving advisory contracts. |
At the May Meeting, NAM made a presentation to, and responded to questions from, the Board. At the May Meeting, the Independent Board Members met privately with their legal counsel to review the Board’s duties in reviewing advisory contracts and considering the renewal of the advisory contracts (which include the sub-advisory contracts). The Independent Board Members, in consultation with independent counsel, reviewed the factors set out in judicial decisions and Securities and Exchange Commission (“SEC”) directives relating to the renewal of advisory contracts. As outlined in more detail below, the Board Members considered all factors they believed relevant with respect to each Fund, including, but not limited to, the following: (a) the nature, extent and quality of the services to be provided by the Fund Adviser; (b) the investment performance of the Fund and the Fund Adviser (as applicable); (c) the costs of the services to be provided and profits to be realized by the Fund Adviser and its affiliates; (d) the extent to which economies of scale would be realized; and (e) whether fee levels reflect those economies of scale for the benefit of the Fund’s investors. In addition, as noted, the Board Members met regularly throughout the year to oversee the Funds. In evaluating the advisory contracts, the Board Members also relied upon their knowledge of the respective Fund Adviser, its services and the Funds resulting from their meetings and other interactions throughout the year. It is with this background that the Board Members considered each advisory contract.
A. Nature, Extent and Quality of Services
In considering the renewal of the Original Investment Management Agreements and Original Sub-Advisory Agreements, the Board Members considered the nature, extent and quality of the respective Fund Adviser’s services. The Board Members reviewed materials outlining, among other things, the Fund Adviser’s organization and business; the types of services that the Fund Adviser or its affiliates provide or are expected to provide to the Funds; the performance record of the Fund (as described in further detail below); and at the annual review, any initiatives Nuveen had taken for the applicable fund product line. As noted, the Board Members were already familiar with the organization, operations and personnel of each respective Fund Adviser due to the Board Members’ experience in governing the respective Funds and working with such Fund Advisers on matters relating to the Funds.
At the May Meeting, the Board Members also recognized NAM’s investment in additional qualified personnel throughout the various groups in the organization and recommended to NAM that it continue to review staffing needs as necessary. The Board Members also recognized NAM’s investment of resources and efforts to continue to enhance and refine its investment processes.
With respect to Sub-Advisers, the Board Members also received and reviewed an evaluation of ICAP (and Symphony on behalf of other Nuveen funds) from NAM at the annual review. Such evaluation outlined, among other things, the respective Sub-Adviser’s organizational history, client base, product mix, investment team and any changes thereto, investment process and any changes to its investment strategy, and the Funds’ investment objectives and performance (as applicable). At the May Meeting, the Board Members noted that NAM recommended the renewal of the applicable Original Sub-Advisory Agreements and considered the basis for such recommendations and any qualifications in connection therewith.
In its review of the Sub-Advisers, the Board Members also considered, among other things, the experience of the investment personnel, the quality of the Sub-Adviser’s investment processes in making portfolio management decisions and any additional refinements and improvements adopted to the portfolio management processes and Fund performance. As ICAP advises the Funds and Symphony advises other Nuveen funds, the Board Members are already familiar with the organization, operations, personnel and investment process of the respective Sub-Adviser. With respect to ICAP, the Board Members also noted the depth of experience of their respective personnel and disciplined investment process at the annual review.
In addition to advisory services, the Independent Board Members considered the quality of administrative and non-advisory services provided by NAM and noted that NAM and its affiliates provide the Funds with a wide variety of services and officers and other personnel as are necessary for the operations of the Funds, including:
44
| • | | oversight by shareholder services and other fund service providers; |
| • | | administration of Board relations; |
| • | | regulatory and portfolio compliance; and |
As the Funds operate in a highly regulated industry and given the importance of compliance, the Board Members considered, in particular, NAM’s compliance activities for the Funds and enhancements thereto. In this regard, the Board Members recognized the quality of NAM’s compliance team. The Board Members also considered NAM’s ability and procedures to monitor the respective Sub-Adviser’s performance, business practices and compliance policies and procedures. The Board Members further noted NAM’s negotiations with other service providers and the corresponding reduction in certain service providers’ fees at the May Meeting.
With respect to Sub-Advisers, the Board Members noted that the sub-advisory agreements were essentially agreements for portfolio management services only and the respective Sub-Adviser was not expected to supply other significant administrative services to the Funds.
Based on their review, the Board Members found that, overall, the nature, extent and quality of services provided (and expected to be provided) to the Funds under the respective Original Investment Management Agreement or Original Sub-Advisory Agreement, as applicable, were satisfactory.
B. The Investment Performance of the Funds and Fund Advisers
At the May Meeting, the Board considered the investment performance for each Fund, including the Fund’s historic performance as well as its performance compared to funds with similar investment objectives (the “Performance Peer Group”) based on data provided by an independent third party (as described below). In addition, the Board Members reviewed the respective Fund’s historic performance compared to recognized and/or customized benchmarks (as applicable).
In evaluating the performance information during the annual review at the May Meeting, in certain instances, the Board Members noted that the closest Performance Peer Group for a fund may not adequately reflect such fund’s investment objectives and strategies, thereby limiting the usefulness of the comparisons of such fund’s performance with that of the Performance Peer Group. These Performance Peer Groups include those for: the Nuveen Tradewinds Value Opportunities Fund, the Nuveen Santa Barbara Growth Fund, and the Nuveen Multi-Strategy Income Fund (although the Nuveen Multi-Strategy Income Fund has been reclassified in a more appropriate peer group for 2007).
The Board Members also reviewed performance information including, among other things, total return information compared with the Fund’s Performance Peer Group as well as recognized and/or customized benchmarks (as appropriate) for the one-, three- and five-year periods (as applicable) ending December 31, 2006. This information supplemented the performance information provided to the Board at each of its quarterly meetings. Based on their review at the May Meeting, the Board Members determined that the respective Fund’s investment performance over time had been satisfactory.
C. Fees, Expenses and Profitability
1. Fees and Expenses
During the annual review, the Board evaluated the management fees and expenses of each Fund reviewing, among other things, such Fund’s advisory fees (net and gross management fees) and total expense ratios (before and after expense reimbursements and/or waivers) in absolute terms as well as comparisons to the gross management fees (before waivers), net management fees (after waivers) and total expense ratios (before and after waivers) of comparable funds in the Peer Universe and the Peer Group. In reviewing the fee schedule for a Fund, the Board Members considered the fund-level and complex-wide breakpoint schedules (described in further detail below) and any fee waivers and reimbursements provided by Nuveen. The Board Members further reviewed data regarding the construction of Peer Groups as well as the methods of measurement for the fee and expense analysis and the performance analysis. In certain cases, due to the small number of peers in the Peer Universe, the Peer Universe and Peer Group had significant overlap or even consisted entirely of the same unaffiliated funds. In reviewing the comparisons of fee and expense information, the Board Members recognized that in certain cases, the size of the fund relative to peers, the small size and odd composition of the Peer Group (including differences in objectives and strategies), expense anomalies, timing of information used or other factors impacting the comparisons thereby limited some of the usefulness of the comparative data. Based on their review of the fee and expense information provided, the Board Members determined that each Fund’s net total expense ratio was within an acceptable range compared to peers.
2. Comparisons with the Fees of Other Clients
At the annual review, the Board Members further reviewed data comparing the advisory fees of NAM with fees NAM charges to other clients. Such clients include NAM’s separately managed accounts and funds that are not offered by Nuveen but are sub-advised by one of Nuveen’s investment management teams. In general, the advisory fees charged for separate accounts are somewhat lower than the advisory fees assessed to the Funds. The Board Members considered the differences in the product
45
Annual Investment Management Agreement Approval Process (continued)
types, including, but not limited to, the services provided, the structure and operations, product distribution and costs thereof, portfolio investment policies, investor profiles, account sizes and regulatory requirements. The Board Members noted, in particular, that the range of services provided to the Funds (as discussed above) is much more extensive than that provided to separately managed accounts. As described in further detail above, such additional services include, but are not limited to: product management, fund administration, oversight of third party service providers, administration of Board relations, and legal support. The Board Members noted that the Funds operate in a highly regulated industry requiring extensive compliance functions compared to other investment products. Given the inherent differences in the products, particularly the extensive services provided to the Funds, the Board Members believe such facts justify the different levels of fees.
With respect to ICAP, in considering the fees of ICAP at the annual review, the Board Members also considered the pricing schedule or fees that the Sub-Adviser charges for similar investment management services for other fund sponsors or clients, as applicable. The Board Members also noted that, with respect to sub-advisers unaffiliated with Nuveen, such as ICAP, such fees were the result of arm’s-length negotiations.
3. Profitability of Fund Advisers
In conjunction with its review of fees, the Board Members also considered the profitability of Nuveen for its advisory activities (which incorporated Nuveen’s wholly-owned affiliated sub-advisers other than HydePark which had been acquired by Nuveen as of May 1, 2007) and its financial condition. At the annual review, the Board Members reviewed the revenues and expenses of Nuveen’s advisory activities for the last three years, the allocation methodology used in preparing the profitability data as well as the 2006 Annual Report for Nuveen. The Board Members noted this information supplemented the profitability information requested and received during the year to help keep them apprised of developments affecting profitability (such as changes in fee waivers and expense reimbursement commitments). In this regard, the Board Members noted the enhanced dialogue and information regarding profitability with NAM during the year, including more frequent meetings and updates from Nuveen’s corporate finance group. The Board Members considered Nuveen’s profitability compared with other fund sponsors prepared by three independent third party service providers as well as comparisons of the revenues, expenses and profit margins of various unaffiliated management firms with similar amounts of assets under management prepared by Nuveen.
In reviewing profitability, the Board Members recognized the subjective nature of determining profitability which may be affected by numerous factors including the allocation of expenses. Further, the Board Members recognized the difficulties in making comparisons as the profitability of other advisers generally is not publicly available and the profitability information that is available for certain advisers or management firms may not be representative of the industry and may be affected by, among other things, the adviser’s particular business mix, capital costs, types of funds managed and expense allocations.
Notwithstanding the foregoing, the Board Members reviewed Nuveen’s methodology at the annual review and assumptions for allocating expenses across product lines to determine profitability. Last year, the Board Members also designated an Independent Board Member as a point person for the Board to review the methodology determinations during the year and any refinements thereto, which relevant information produced from such process was reported to the full Board. In reviewing profitability, the Board Members recognized Nuveen’s increased investment in its fund business. Based on its review, the Board Members concluded that Nuveen’s level of profitability for its advisory activities was reasonable in light of the services provided. With respect to sub-advisers unaffiliated with Nuveen, such as ICAP, the Board Members also considered the Sub-Adviser’s revenues from serving as sub-adviser to the applicable Funds, expenses (including the basis for allocating expenses) and profitability margins (pre- and post-tax). Based on their review, the Board Members were satisfied that the respective Fund Adviser’s level of profitability was reasonable in light of the services provided.
In evaluating the reasonableness of the compensation, the Board Members also considered other amounts paid to a Fund Adviser by the Funds as well as any indirect benefits (such as soft dollar arrangements, if any) the Fund Adviser and its affiliates receive, or are expected to receive, that are directly attributable to the management of the Funds, if any. See Section E below for additional information on indirect benefits a Fund Adviser may receive as a result of its relationship with the Funds. Based on their review of the overall fee arrangement of each Fund, the Board Members determined that the advisory fees and expenses were reasonable.
D. Economies of Scale and Whether Fee Levels Reflect These Economies of Scale
With respect to economies of scale, the Board Members recognized the potential benefits resulting from the costs of a Fund being spread over a larger asset base. To help ensure the shareholders share in these benefits, the Board Members reviewed and considered the breakpoints in the advisory fee schedules that reduce advisory fees. In addition to advisory fee breakpoints, the Board also approved a complex-wide fee arrangement in 2004. Pursuant to the complex-wide fee arrangement, the fees of the funds in the Nuveen complex, including the Funds, are reduced as the assets in the fund complex reach certain levels. In evaluating the complex-wide fee arrangement, the Board Members noted that the last complex-wide asset level breakpoint for the complex-wide fee schedule was at $91 billion and that the Board Members anticipated further review and/or negotiations prior to the assets of the Nuveen complex reaching such threshold. Based on their review, the Board Members concluded that the breakpoint schedule and complex-wide fee arrangement were acceptable and desirable in providing benefits from economies of scale to shareholders, subject to further evaluation of the complex-wide fee schedule as assets in the complex increase. See Section II, Paragraph D – “Approval of the New Investment Management Agreements and New Sub-Advisory Agreements – Economies of Scale and Whether Fee Levels Reflect These Economies of Scale” for information regarding subsequent modifications to the complex-wide fee.
46
E. Indirect Benefits
In evaluating fees, the Board Members also considered any indirect benefits or profits the respective Fund Adviser or its affiliates may receive as a result of its relationship with each Fund. In this regard, during the annual review, the Board Members considered, among other things, any sales charges and distribution fees received and retained by the Funds’ principal underwriter, Nuveen Investments, LLC, an affiliate of NAM. The Board Members also recognized that an affiliate of NAM provides distribution and shareholder services to the Funds and their shareholders for which it may be compensated pursuant to a 12b-1 plan. The Board Members, therefore, considered the 12b-1 fees retained by Nuveen during the last calendar year.
In addition to the above, the Board Members considered whether the Fund Adviser received any benefits from soft dollar arrangements whereby a portion of the commissions paid by a Fund for brokerage may be used to acquire research that may be useful to the Fund Adviser in managing the assets of the Funds and other clients. With respect to NAM, the Board Members noted that NAM does not currently have any soft dollar arrangements; however, to the extent certain bona fide agency transactions that occur on markets that traditionally trade on a principal basis and riskless principal transactions are considered as generating “commissions,” NAM intends to comply with the applicable safe harbor provisions. With respect to ICAP, the Board Members considered that such Sub-Adviser may benefit from its soft dollar arrangements pursuant to which it receives research from brokers that execute the applicable Fund’s portfolio transactions. The Board Members noted that such Sub-Adviser’s profitability may be lower if it were required to pay for this research with hard dollars.
Based on their review, the Board Members concluded that any indirect benefits received by a Fund Adviser as a result of its relationship with the Funds were reasonable and within acceptable parameters.
F. Other Considerations
The Board Members did not identify any single factor discussed previously as all-important or controlling in their considerations to continue an advisory contract. The Board Members, including the Independent Board Members, unanimously concluded that the terms of the Original Investment Management and Original Sub-Advisory Agreements are fair and reasonable, that the respective Fund Adviser’s fees are reasonable in light of the services provided to each Fund and that the Original Investment Management Agreements and the Original Sub-Advisory Agreements be renewed.
II. Approval of the New Investment Management Agreements and New Sub-Advisory Agreements
Following the May Meeting, the Board Members were advised of the potential Transaction. As noted above, the completion of the Transaction would terminate each of the Original Investment Management Agreements and Original Sub-Advisory Agreements. Accordingly, at the July Meeting, the Board of each Fund, including the Independent Board Members, unanimously approved the New Investment Management Agreements and New Sub-Advisory Agreements on behalf of the respective Funds. Leading up to the July Meeting, the Board Members had several meetings and deliberations with and without Nuveen management present, and with the advice of legal counsel, regarding the proposed Transaction as outlined below.
On June 8, 2007, the Board Members held a special telephonic meeting to discuss the proposed Transaction. At that meeting, the Board Members established a special ad hoc committee comprised solely of Independent Board Members to focus on the Transaction and to keep the Independent Board Members updated with developments regarding the Transaction. On June 15, 2007, the ad hoc committee discussed with representatives of NAM the Transaction and modifications to the complex-wide fee schedule that would generate additional fee savings at specified levels of complex-wide asset growth. Following the foregoing meetings and several subsequent telephonic conferences among Independent Board Members and independent counsel, and between Independent Board Members and representatives of Nuveen, the Board met on June 18, 2007 to further discuss the proposed Transaction. Immediately prior to and then again during the June 18, 2007 meeting, the Independent Board Members met privately with their independent legal counsel. At that meeting, the Board met with representatives of MDP, of Goldman Sachs, Nuveen’s financial adviser in the Transaction, and of the Nuveen Board to discuss, among other things, the history and structure of MDP, the terms of the proposed Transaction (including the financing terms), and MDP’s general plans and intentions with respect to Nuveen (including with respect to management, employees, and future growth prospects). On July 9, 2007, the Board also met to be updated on the Transaction as part of a special telephonic Board meeting. The Board Members were further updated at a special in-person Board meeting held on July 19, 2007 (one Independent Board Member participated telephonically). Subsequently, on July 27, 2007, the ad hoc committee held a telephonic conference with representatives of Nuveen and MDP to further discuss, among other things, the Transaction, the financing of the Transaction, retention and incentive plans for key employees, the effect of regulatory restrictions on transactions with affiliates after the Transaction, and current volatile market conditions and their impact on the Transaction.
In connection with their review of the New Investment Management Agreements and New Sub-Advisory Agreements, the Independent Board Members, through their independent legal counsel, also requested in writing and received additional information regarding the proposed Transaction and its impact on the provision of services by NAM and its affiliates.
47
Annual Investment Management Agreement Approval Process (continued)
The Independent Board Members received, well in advance of the July Meeting, materials which outlined, among other things:
| • | | the structure and terms of the Transaction, including MDP’s co-investor entities and their expected ownership interests, and the financing arrangements that will exist for Nuveen following the closing of the Transaction; |
| • | | the strategic plan for Nuveen following the Transaction; |
| • | | the governance structure for Nuveen following the Transaction; |
| • | | any anticipated changes in the operations of the Nuveen funds following the Transaction, including changes to NAM’s and Nuveen’s day-to-day management, infrastructure and ability to provide advisory, distribution or other applicable services to the Funds; |
| • | | any changes to senior management or key personnel who work on Fund related matters (including portfolio management, investment oversight, and legal/compliance) and any retention or incentive arrangements for such persons; |
| • | | any anticipated effect on each Fund’s expense ratio (including advisory fees) following the Transaction; |
| • | | any benefits or undue burdens imposed on the Funds as a result of the Transaction; |
| • | | any legal issues for the Funds as a result of the Transaction; |
| • | | the nature, quality and extent of services expected to be provided to the Funds following the Transaction, changes to any existing services and policies affecting the Funds, and cost-cutting efforts, if any, that may impact such services or policies; |
| • | | any conflicts of interest that may arise for Nuveen or MDP with respect to the Funds; |
| • | | the costs associated with obtaining necessary shareholder approvals and who would bear those costs; and |
| • | | from legal counsel, a memorandum describing the applicable laws, regulations and duties in approving advisory contracts, including, in particular, with respect to a change of control. |
Immediately preceding the July Meeting, representatives of MDP met with the Board to further respond to questions regarding the Transaction. After the meeting with MDP, the Independent Board Members met with independent legal counsel in executive session. At the July Meeting, Nuveen also made a presentation and responded to questions. Following the presentations and discussions of the materials presented to the Board, the Independent Board Members met again in executive session with their counsel. As outlined in more detail below, the Independent Board Members considered all factors they believed relevant with respect to each Fund, including the impact that the Transaction could be expected to have on the following: (a) the nature, extent and quality of services to be provided; (b) the investment performance of the Funds; (c) the costs of the services and profits to be realized by Nuveen and its affiliates; (d) the extent to which economies of scale would be realized; and (e) whether fee levels reflect those economies of scale for the benefit of investors. As noted above, during the past year, the Board Members had completed their annual review of the respective Original Investment Management Agreements and Original Sub-Advisory Agreements and many of the factors considered at such reviews were applicable to their evaluation of the New Investment Management Agreements and New Sub-Advisory Agreements. Accordingly, in evaluating such agreements, the Board Members relied upon their knowledge and experience with the Fund Advisers and considered the information received and their evaluations and conclusions drawn at the reviews. While the Board reviewed many Nuveen funds at the July Meeting, the Independent Board Members evaluated all information available to them on a fund-by-fund basis, and their determinations were made separately in respect of each Fund.
A. Nature, Extent and Quality of Services
In evaluating the nature, quality and extent of the services expected to be provided by the Fund Adviser under the applicable New Investment Management Agreement or New Sub-Advisory Agreement, the Independent Board Members considered, among other things, the expected impact, if any, of the Transaction on the operations, facilities, organization and personnel of NAM and the Sub-Adviser (if applicable); the potential implications of regulatory restrictions on the Funds following the Transaction; the ability of NAM and its affiliates to perform their duties after the Transaction; and any anticipated changes to the current investment and other practices of the Funds.
The Board noted that the terms of each New Investment Management Agreement, including the fees payable thereunder, are substantially identical to those of the Original Investment Management Agreement relating to the same Fund (with both reflecting reductions to fee levels in the complex-wide fee schedule for complex-wide assets in excess of $80 billion that have an effective date of August 20, 2007), subject to the following. There is no change in the fee rate payable by each Fund to the Fund Adviser, except for the Large-Cap Value Fund, which may have a decrease in the fee rate payable by such Fund to NAM subject to shareholder approval. Similarly, the terms of each New Sub-Advisory Agreement, including fees payable thereunder, are substantially identical to those of the Original Sub-Advisory Agreement relating to the same Fund. The Board considered that the services to be provided and the standard of care under the New Investment Advisory Agreements and the New Sub-Advisory Agreements are the same as the corresponding original agreements. The Board Members noted the Transaction does not alter the allocation of responsibilities between the Adviser and Sub-Adviser. The Sub-Adviser for the Funds will continue to furnish an investment program in respect of, make investment decisions for and place all orders for the purchase and sale of securities for the
48
portion of the Fund’s investment portfolio allocated by the Adviser to the Sub-Adviser, all on behalf of the applicable Fund and subject to oversight of the Board and the Adviser. The Board Members further noted that key personnel of the Adviser or Sub-Adviser who have responsibility for the Funds in each area, including portfolio management, investment oversight, fund management, fund operations, product management, legal/compliance and board support functions, are expected to be the same following the Transaction. The Board Members considered and are familiar with the qualifications, skills and experience of such personnel. The Board also considered certain information regarding any anticipated retention or incentive plans designed to retain key personnel. Further, the Board Members noted that no changes to Nuveen’s infrastructure (including at the affiliated sub-adviser level) or operations as a result of the Transaction were anticipated other than potential enhancements as a result of an expected increase in the level of investment in such infrastructure and personnel. The Board noted MDP’s representations that it does not plan to have a direct role in the management of Nuveen, appointing new management personnel, or directly impacting individual staffing decisions. The Board Members also noted that there were not any planned “cost cutting” measures that could be expected to reduce the nature, extent or quality of services. After consideration of the foregoing, the Board Members concluded that no diminution in the nature, quality and extent of services provided to the Funds and their shareholders by the respective Fund Advisers is expected.
In addition to the above, the Board Members considered potential changes in the operations of each Fund. In this regard, the Board Members considered the potential effect of regulatory restrictions on the Funds’ transactions with future affiliated persons. During their deliberations, it was noted that, after the Transaction, a subsidiary of Merrill Lynch is expected to have an ownership interest in Nuveen at a level that will make Merrill Lynch an affiliated person of Nuveen. The Board Members recognized that applicable law would generally prohibit the Funds from engaging in securities transactions with Merrill Lynch as principal, and would also impose restrictions on using Merrill Lynch for agency transactions. They recognized that having MDP and Merrill Lynch as affiliates may restrict the Nuveen funds’ ability to invest in securities of issuers controlled by MDP or issued by Merrill Lynch and its affiliates even if not bought directly from MDP or Merrill Lynch as principal. They also recognized that various regulations may require the Nuveen funds to apply investment limitations on a combined basis with affiliates of Merrill Lynch. The Board Members considered information provided by NAM regarding the potential impact on the Nuveen funds’ operations as a result of these regulatory restrictions. The Board Members considered, in particular, the Nuveen funds that may be impacted most by the restricted access to Merrill Lynch, including: municipal funds (particularly certain state-specific funds), senior loan funds, taxable fixed income funds, preferred security funds and funds that heavily use derivatives. The Board Members considered such funds’ historic use of Merrill Lynch as principal in their transactions and information provided by NAM regarding the expected impact resulting from Merrill Lynch’s affiliation with Nuveen and available measures that could be taken to minimize such impact. NAM informed the Board Members that, although difficult to determine with certainty, its management did not believe that MDP’s or Merrill Lynch’s status as an affiliate of Nuveen would have a material adverse effect on any Nuveen fund’s ability to pursue its investment objectives and policies.
In addition to the regulatory restrictions considered by the Board, the Board Members also considered potential conflicts of interest that could arise between the Nuveen funds and various parties to the Transaction and discussed possible ways of addressing such conflicts.
Based on its review along with its considerations regarding services at the annual review, the Board concluded that the Transaction was not expected to adversely affect the nature, quality or extent of services provided by the respective Fund Adviser and that the expected nature, quality and extent of such services supported approval of the New Investment Management Agreements and New Sub-Advisory Agreements.
B. Performance of the Funds
With respect to the performance of the Funds, the Board considered that the portfolio management personnel responsible for the management of the Funds’ portfolios were expected to continue to manage the portfolios following the completion of the Transaction.
In addition, the Board Members recently reviewed Fund performance at the May Meeting as described above and determined such Funds’ performance was satisfactory or better. The Board Members further noted that the investment policies and strategies were not expected to change as a result of the Transaction.
In light of the foregoing factors, along with the prior findings regarding performance at the annual review, the Board concluded that its findings with respect to performance supported approval of the New Investment Management Agreements and New Sub-Advisory Agreements.
C. Fees, Expenses and Profitability
As described in more detail above, during the annual review, the Board Members considered, among other things, the management fees and expenses of the Funds, the breakpoint schedules, and comparisons of such fees and expenses with peers. At the annual review, the Board Members determined that the respective Fund’s advisory fees and expenses were reasonable. In evaluating the profitability of the Fund Adviser under the New Investment Management Agreements and New Sub-Advisory Agreements, the Board Members considered their conclusions at their prior reviews and whether the management fees or other expenses would change as a result of the Transaction. As described above, the investment management fee for NAM is composed of two components – a
49
Annual Investment Management Agreement Approval Process (continued)
fund-level component and complex-wide level component. The fee schedule under the New Investment Management Agreements to be paid to NAM is identical to that under the Original Investment Management Agreements, including the modified complex-wide fee schedule except for a potential reduction in management fee paid by the Large-Cap Value Fund to NAM. As noted above, the Board recently approved a modified complex-wide fee schedule that would generate additional fee savings on complex-wide assets above $80 billion. The modifications have an effective date of August 20, 2007 and are part of the Original Investment Management Agreements. Accordingly, the terms of the complex-wide component under the New Investment Management Agreements are the same as under the Original Investment Management Agreements. The Board Members also noted that Nuveen has committed for a period of two years from the date of closing of the Transaction that it will not increase gross management fees for any Nuveen fund and will not reduce voluntary expense reimbursement levels for any Nuveen fund from their currently scheduled prospective levels (subject to certain potential adjustments noted below). Based on the information provided, the Board Members did not expect that overall Fund expenses would increase as a result of the Transaction.
In addition, the Board Members considered that additional fund launches were anticipated after the Transaction which would result in an increase in total assets under management in the complex and a corresponding decrease in overall management fees under the complex-wide fee schedule. Taking into consideration the Board’s prior evaluation of fees and expenses at the annual renewal, and the modification to the complex-wide fee schedule, the Board determined that the management fees and expenses were reasonable.
While it is difficult to predict with any degree of certainty the impact of the Transaction on Nuveen’s profitability for its advisory activities (which includes its affiliated sub-advisers), at the recent annual review, the Board Members were satisfied that Nuveen’s level of profitability for its advisory activities was reasonable. During the year, the Board Members had noted the enhanced dialogue regarding profitability and the appointment of an Independent Board Member as a point person to review methodology determinations and refinements in calculating profitability. Given their considerations at the annual review and the modifications to the complex-wide fee schedule, the Board Members were satisfied that Nuveen’s level of profitability for its advisory activities continues to be reasonable.
With respect to the Sub-Adviser, the fees paid under the New Sub-Advisory Agreements are the same as the Original Sub-Advisory Agreements. With respect to sub-advisers unaffiliated with Nuveen, such as ICAP, the Board Members considered the Sub-Adviser’s revenues from serving as Sub-Adviser to the applicable Funds, expenses (including the basis for allocating expenses) and profitability margins (pre- and post-tax) at the annual review. The Transaction is not anticipated to affect the profitability of such Sub-Adviser. At the annual review, the Board Members were satisfied that the respective Fund Adviser’s level of profitability was reasonable in light of the services provided. Taking into account the Board’s prior evaluation and the fact that sub-advisory fees will not change, the Board Members were satisfied that the respective Fund Advisers’ levels of profitability were reasonable in light of the services provided.
D. Economies of Scale and Whether Fee Levels Reflect These Economies of Scale
The Board Members have been cognizant of economies of scale and the potential benefits resulting from the costs of a Fund being spread over a larger asset base. To help ensure that shareholders share in the benefits derived from economies of scale, the Board adopted the complex-wide fee arrangement in 2004. At the May Meeting, the Board Members reviewed the complex-wide fee arrangements and noted that additional negotiations may be necessary or appropriate as the assets in the complex approached the $91 billion threshold. In light of this assessment coupled with the upcoming Transaction, at the June 15, 2007 meeting, the ad hoc committee met with representatives of Nuveen to further discuss modifications to the complex-wide fee schedule that would generate additional savings for shareholders as the assets of the complex grow. The proposed terms for the complex-wide fee schedule are expressed in terms of targeted cumulative savings at specified levels of complex-wide assets, rather than in terms of targeted marginal complex-wide fee rates. Under the modified schedule, the schedule would generate additional fee savings beginning at complex-wide assets of $80 billion in order to achieve targeted cumulative annual savings at $91 billion of $28 million on a complex-wide level (approximately $0.6 million higher than those generated under the then current schedule) and generate additional fee savings for asset growth above complex-wide assets of $91 billion in order to achieve targeted annual savings at $125 billion of assets of approximately $50 million on a complex-wide level (approximately $2.2 million higher annually than that generated under the then current schedule). At the July Meeting, the Board approved the modified complex-wide fee schedule for the Original Investment Management Agreements and these same terms will apply to the New Investment Management Agreements. Accordingly, the Board Members believe that the breakpoint schedules and revised complex-wide fee schedule are appropriate and desirable in ensuring that shareholders participate in the benefits derived from economies of scale.
E. Indirect Benefits
During their recent annual review, the Board Members considered any indirect benefits that the Fund Adviser may receive as a result of its relationship with the Funds, as described above. As the policies and operations of the Fund Advisers are not anticipated to change significantly after the Transaction, such indirect benefits should remain after the Transaction. The Board Members further considered any additional indirect benefits to be received by the Fund Adviser or its affiliates after the Transaction. The Board Members noted that other than benefits from its ownership interest in Nuveen and indirect benefits from fee revenues paid by the Funds under the management agreements and other Board-approved relationships, it was currently not expected that MDP or its affiliates would derive any benefit from the Funds as a result of the Transaction or transact any business with or on behalf of the
50
Funds (other than perhaps potential Fund acquisitions, in secondary market transactions, of securities issued by MDP portfolio companies); or that Merrill Lynch or its affiliates would derive any benefits from the Funds as a result of the Transaction (noting that, indeed, Merrill Lynch would stand to experience the discontinuation of principal transaction activity with the Nuveen funds and likely would experience a noticeable reduction in the volume of agency transactions with the Nuveen funds).
F. Other Considerations
In addition to the factors above, the Board Members also considered the following with respect to the Funds:
| • | | Nuveen would rely on the provisions of Section 15(f) of the 1940 Act. Section 15(f) provides, in substance, that when a sale of a controlling interest in an investment adviser occurs, the investment adviser or any of its affiliated persons may receive any amount or benefit in connection with the sale so long as (i) during the three-year period following the consummation of a transaction, at least 75% of the investment company’s board of directors must not be “interested persons” (as defined in the 1940 Act) of the investment adviser or predecessor adviser and (ii) an “unfair burden” (as defined in the 1940 Act, including any interpretations or no-action letters of the SEC) must not be imposed on the investment company as a result of the transaction relating to the sale of such interest, or any express or implied terms, conditions or understanding applicable thereto. In this regard, to help ensure that an unfair burden is not imposed on the Nuveen funds, Nuveen has committed for a period of two years from the date of the closing of the Transaction (i) not to increase gross management fees for any Nuveen fund; (ii) not to reduce voluntary expense reimbursement levels for any Nuveen fund from their currently scheduled prospective levels during that period (such commitment, however, may exclude or be adjusted for the impact or future class-specific expense allocation protocol changes for a particular mutual fund); (iii) that no Nuveen fund whose portfolio is managed by a Nuveen affiliate shall use Merrill Lynch as a broker with respect to portfolio transactions done on an agency basis, except as may be approved in the future by the Compliance Committee of the Board; and (iv) that each adviser/portfolio team affiliated with Nuveen shall not cause the Funds (or sleeves thereof) and other Nuveen funds that the team manages, as a whole, to enter into portfolio transactions with or through the other minority owners of Nuveen, on either a principal or an agency basis, to a significantly greater extent than both what one would expect an investment team to use such firm in the normal course of business, and what such team has historically done, without prior Board or Compliance Committee approval (excluding the impact of proportionally increasing the use of such other “minority owners” to fill the void necessitated by not being able to use Merrill Lynch). |
| • | | The Funds would not incur any costs in seeking the necessary shareholder approvals for the New Investment Management Agreements or New Sub-Advisory Agreements (except for any costs attributed to seeking shareholder approvals of Fund specific matters unrelated to the Transaction, such as approval of Board Members or changes to investment policies, in which case a portion of such costs will be borne by the applicable Funds). |
| • | | The reputation, financial strength and resources of MDP. |
| • | | The long-term investment philosophy of MDP and anticipated plans to grow Nuveen’s business to the benefit of the Nuveen funds. |
| • | | The benefits to the Nuveen funds as a result of the Transaction including: (i) as a private company, Nuveen may have more flexibility in making additional investments in its business; (ii) as a private company, Nuveen may be better able to structure compensation packages to attract and retain talented personnel; (iii) as certain of Nuveen’s distribution partners are expected to be equity or debt investors in Nuveen, Nuveen may be able to take advantage of new or enhanced distribution arrangements with such partners; and (iv) MDP’s experience, capabilities and resources that may help Nuveen identify and acquire investment teams or firms and finance such acquisitions. |
G. Conclusion
The Board Members did not identify any single factor discussed previously as all-important or controlling. The Board Members, including the Independent Board Members, unanimously concluded that the terms of the New Investment Management Agreements and New Sub-Advisory Agreements are fair and reasonable, that the fees therein are reasonable in light of the services to be provided to each Fund and that the New Investment Management Agreements and New Sub-Advisory Agreements should be approved and recommended to shareholders.
III. Approval of Interim Contracts
As noted above, at the July Meeting, the Board Members, including the Independent Board Members, unanimously approved the Interim Investment Management Agreements and Interim Sub-Advisory Agreements. If necessary to assure continuity of advisory services, the Interim Investment Management Agreements and Interim Sub-Advisory Agreements will take effect upon the closing of the Transaction if shareholders have not yet approved the New Investment Management Agreements and New Sub-Advisory Agreements. The terms of each Interim Investment Management Agreement and Interim Sub-Advisory Agreement are substantially identical to those of the corresponding Original Investment Management Agreement and New Investment Management Agreement and the Original Sub-Advisory Agreement and New Sub-Advisory Agreement, respectively, except for certain term and escrow provisions. In light of the foregoing, the Board Members, including the Independent Board Members, unanimously determined that the scope and quality of services to be provided to the Funds under the respective Interim Investment Management Agreement and
51
Annual Investment Management Agreement Approval Process (continued)
Interim Sub-Advisory Agreement are at least equivalent to the scope and quality of services provided under the applicable Original Investment Management Agreement and Original Sub-Advisory Agreement.
IV. Approval of the New Sub-Advisory Agreements for the Large-Cap Value Fund
In advance of a meeting held on August 1, 2007 (the “August Meeting”), the Board of the Large-Cap Value Fund received materials relating to the proposal to convert the Large-Cap Value Fund from a single-manager fund to a multi-manager fund, proposed changes to the investment objective and strategies of the Fund, the rationale for such changes and the proposed asset allocation among the managers. In this regard, NAM recommended that Symphony and HydePark be added as sub-advisers to the Large-Cap Value Fund. At the August Meeting, the Board Members, including the Independent Board Members of the Large-Cap Value Fund, unanimously approved the HydePark Sub-Advisory Agreement and Symphony Sub-Advisory Agreement. Symphony and HydePark are each a “New Large-Cap Value Sub-Adviser.”
The Approval Process
To assist the Board in its evaluation of the new sub-advisory contracts with the respective New Large-Cap Value Sub-Adviser, at the August Meeting and at prior meetings, the Independent Board Members received materials which outlined, among other things:
| • | | the nature, extent and quality of services to be provided by each New Large-Cap Value Sub-Adviser; |
| • | | the organization and business operations of each New Large-Cap Value sub-adviser; |
| • | | simulated performance information of Large-Cap Value Fund’s modified investment strategies; |
| • | | the profitability of Nuveen (which included its wholly-owned affiliated sub-advisers other than HydePark, a newly acquired Sub-Adviser); |
| • | | the proposed reduction in management fees, including comparisons of such reduced fees with the management fees of comparable, unaffiliated funds; |
| • | | the soft dollar practices of each New Large-Cap Value Sub-Adviser, if any; and |
| • | | the expected expenses of the Large-Cap Value Fund, including comparisons of the Fund’s expected expense ratio with the expense ratios of comparable, unaffiliated funds. |
At the August Meeting, NAM and HydePark made a presentation to and responded to questions from the Board. After the presentations and after reviewing the written materials, the Independent Board Members met privately with their legal counsel to review the Board’s duties under the 1940 Act and the general principles of state law in reviewing and approving advisory contracts, the standards used by courts in determining whether investment company boards of directors have fulfilled their duties and factors to be considered by the Board in voting on advisory contracts. It is with this background that the Board Members considered the new Sub-Advisory Agreements with HydePark and Symphony. As outlined in more detail below, the Board Members considered all factors they believed relevant with respect to the Large-Cap Value Fund, including the following: (a) the nature, extent and quality of the services to be provided by each New Large-Cap Value Sub-Adviser; (b) certain simulated performance information of the Large-Cap Value Fund (as described below); (c) the profitability of Nuveen and its affiliates; (d) the extent to which economies of scale would be realized as the Fund grows; and (e) whether fee levels reflect those economies of scale for the benefit of Large-Cap Value Fund investors.
A. Nature, Extent and Quality of Services
In reviewing the New Large-Cap Value Sub-Advisers, the Board Members considered the nature, extent and quality of the respective Sub-Adviser’s services. As Symphony already serves as a Sub-Adviser to various Nuveen funds, the Board has a good understanding of Symphony’s organization, operations and personnel. In this regard, the Board Members were familiar with and have evaluated the professional experience, qualifications and credentials of Symphony’s personnel. At the August Meeting (and/or at prior meetings with respect to Symphony), the Board Members reviewed materials outlining, among other things, each New Large-Cap Sub-Adviser’s organization and business; the types of services that the respective Sub-Adviser will provide to the Large-Cap Value Fund under the revised investment mandates; and the experience of each New Large-Cap Value Sub-Adviser with respect to the investment strategies. The Board Members noted that NAM recommended the New Large-Cap Value Sub-Advisers and considered the basis for such recommendation. At the May Meeting, the Board has also reviewed an evaluation from NAM of Symphony which outlined, among other things, such Sub-Adviser’s organizational history, client base, product mix, investment team and any changes thereto, investment process, and performance (as applicable). Given the Trustees’ experience with Symphony with respect to other Nuveen funds it sub-advises and the discussions and materials regarding HydePark presented at and prior to the August Meeting, the Board Members considered the investment processes of each in making portfolio management decisions.
In addition to advisory services, the Independent Board Members considered the quality of any administrative or non-advisory services provided. With respect to each New Large-Cap Value Sub-Adviser, the Independent Board Members noted that each respective new Sub-Advisory Agreement was essentially an agreement for portfolio management services only and such Sub-Advisers were not expected to supply other significant administrative services to the Large-Cap Value Fund.
52
Based on their review, the Board Members found that, overall, the nature, extent and quality of services expected to be provided to the Large-Cap Value Fund under the Symphony Sub-Advisory Agreement and HydePark Sub-Advisory Agreement, as applicable, were satisfactory.
B. The Investment Performance of the Large-Cap Value Fund and New Large-Cap Value Sub-Advisers
The Board Members recognized that the changes to the investment mandates are seeking, in part, to provide greater diversification within the Large-Cap Value Fund coupled with the potential for improved risk adjusted returns. As ICAP currently serves as sub-adviser and under the new proposal, the Large-Cap Value Fund would have multi-managers, the Board Members recognized that the changes limit some of the usefulness of reviewing the Large-Cap Value Fund’s past performance record. Accordingly, the Board Members reviewed certain simulated performance information of the Fund’s investment strategies under the multi-manager approach, including simulated total return information under the revised approach compared to the actual past performance for the Fund for calendar years (from December 1998 to December 2006). The Board Members are also familiar with the performance records of Symphony with respect to other Nuveen funds it advises.
C. Fees, Expenses and Profitability
1. Fees and Expenses
In evaluating the management fees and expenses under the multi-manager approach, the Board recognized that the overall advisory fee paid by the Large-Cap Value Fund to NAM is expected to be reduced, subject to shareholder approval of the New Large-Cap Value Fund Sub-Advisers. More specifically, the management fee is composed of the fund-level component and complex-wide level component. Subject to shareholder approval of the new Sub-Advisory Agreements with Symphony and HydePark, the fund-level component of the management fee will be reduced from 0.65% of average daily net assets to 0.55% of average daily net assets of the Large-Cap Value Fund with the complex-wide fee level component remaining at a maximum rate of 0.20% of the Fund’s net assets. In evaluating the overall management fees and expenses of the Fund under the proposed revised schedule, the Board Members considered the proposed management fee structure, its sub-advisory fee arrangements and the Fund’s expected expense ratios in absolute terms as well as compared with the fees and expense ratios of comparable, unaffiliated funds. In addition, the Board Members considered the fund-level breakpoint schedule and the complex-wide breakpoint schedule (described in further detail below) and any fee waivers and expense reimbursements provided by Nuveen. In this regard, the Board Members noted that subject to shareholder approval of the Additional Sub-Advisory Agreements, Nuveen has agreed to waive fees and reimburse expenses in order to prevent total fund operating expenses of any class of the Large-Cap Value Fund’s shares from exceeding 0.95% of average daily net assets (excluding 12b-1 distribution and service fees, interest and extraordinary expenses) until October 31, 2010 and 1.20% of average daily net assets (excluding 12b-1 distribution and service fees, interest and extraordinary expenses) thereafter. With respect to the New Large-Cap Value Sub-Advisers, NAM will pay the sub-advisory fees out of the management fee it receives from the Large-Cap Value Fund. The Board Members considered the proposed sub-advisory fees for HydePark and Symphony and the pricing schedule the respective New Large-Cap Value Sub-Adviser charges for similar investment management services for other client accounts or fund sponsors.
Based on their review of the fee and service information provided, including the potential reduced management fee, the Board Members determined that the proposed management fees, including sub-advisory fees for each respective New Large-Cap Value Sub-Adviser, was acceptable.
2. Profitability
In conjunction with its review of fees at the May Meeting, the Board Members have considered the profitability of Nuveen for advisory activities (which incorporated Nuveen’s wholly-owned affiliated sub-advisers other than HydePark, a newly acquired sub-adviser). As described above at the annual review, the Board Members have reviewed data comparing Nuveen’s profitability with other fund sponsors prepared by three independent third party service providers as well as comparisons of the revenues, expenses and profits margins of various unaffiliated management firms with similar amounts of assets under management prepared by Nuveen. In considering profitability, the Board Members have recognized the inherent limitations of determining profitability as well as the difficulties in comparing the profitability of other unaffiliated advisers. At the annual review at the May Meeting, the Board Members were satisfied that Nuveen’s level of profitability for its advisory activities was reasonable. In their review, the Board Members also noted that while the New Large-Cap Value Sub-Advisers are wholly-owned subsidiaries of Nuveen and therefore Nuveen may retain more of its management fees through such Sub-Advisers, the management fees paid to NAM are proposed to be reduced. Taking into account the foregoing along with their prior evaluation, the Board Members were satisfied that Nuveen’s level of profitability continues to be reasonable in light of the services provided. See also “Other Considerations” below.
In evaluating the reasonableness of the compensation, the Board Members also considered any other revenues paid to each New Large-Cap Value Sub-Adviser and its affiliates (including NAM) as well as any indirect benefits (such as soft dollar arrangements, if any) each expects to receive that are directly attributable to its management of the Large-Cap Value Fund, if any. See Section E below for additional information.
D. Economies of Scale and Whether Fee Levels Reflect These Economies of Scale
With respect to economies of scale, the Board Members have recognized the potential benefits resulting from the costs of a fund being spread over a larger asset base. To help ensure the shareholders share in these benefits, the Board Members have previously
53
Annual Investment Management Agreement Approval Process (continued)
reviewed and considered the breakpoints in the Large-Cap Value Fund’s advisory fee schedule that reduce advisory fees depending on such Fund’s size. The fund-level breakpoint schedule will remain the same but will reflect a corresponding reduction in the management fee discussed above, subject to shareholder approval of the New Large-Cap Value Sub-Advisers. In addition to advisory fee breakpoints, the Board considered the complex-wide fee arrangement pursuant to which the fees of the funds in the Nuveen complex, including the Large-Cap Value Fund, are reduced as the assets in the fund complex reach certain levels. As noted above, the Board recently approved a modified complex-wide fee schedule that would generate additional fee savings on complex-wide assets above $80 billion. See Section II, Paragraph D: “Approval of the New Investment Management Agreements and New Sub-Advisory Agreements – Economies of Scale and Whether Fee Levels Reflect These Economies of Scale” for additional information regarding the modified schedule. Based on the foregoing, the Board Members concluded that the breakpoint schedule and revised complex-wide fee arrangement were acceptable and desirable in providing benefits from economies of scale to shareholders.
E. Indirect Benefits
In evaluating fees, the Board Members also considered any indirect benefits or profits a New Large-Cap Value Sub-Adviser or its affiliates may receive as a result of its relationship with each Fund. In this regard, the Board Members considered, among other things, that an affiliate of NAM provides distribution and shareholder services to the Large-Cap Value Fund and will therefore receive sales charges as well as distribution and shareholder servicing fees pursuant to a Rule 12b-1 plan.
In addition to the above, the Board Members considered whether each New Large-Cap Value Sub-Adviser would receive any benefits from soft dollar arrangements. With respect to Symphony, Symphony currently does not enter into soft dollar arrangements; however, it has adopted a soft dollar policy in the event it does so in the future. With respect to HydePark, HydePark may benefit from soft-dollar arrangements pursuant to which HydePark may receive research from brokers that execute the Large-Cap Value Fund’s portfolio transactions, but the Board Members concluded that HydePark’s expected level of soft dollar usage and any corresponding benefits were reasonable.
F. Other Considerations
In addition to the above, the Board Members recognized that the modifications in the Funds’ investment strategies would result in changes to the Large-Cap Value Fund’s portfolio management. As noted above, the Board Members considered the New Large-Cap Value Sub-Advisers’ experience in light of the Large-Cap Value Fund’s new investment mandates. The Board Members also recognized that Symphony and HydePark are affiliated with Nuveen and will be managing a portion of the assets that were formerly managed solely by a Sub-Adviser unaffiliated with Nuveen. As Nuveen pays the Sub-Advisers out of the management fee it receives from the Large-Cap Value Fund, the Board Members recognized that Nuveen may be retaining more of the management fees through its affiliated Sub-Advisers; however, as noted above, the management fee to NAM is expected to be reduced if shareholders approve the New Large-Cap Value Sub-Advisers.
G. Conclusion
The Board Members did not identify any single factor discussed previously as all-important or controlling. The Board Members, including the Independent Board Members, concluded that the terms of the Symphony Sub-Advisory Agreement and HydePark Sub-Advisory Agreement were fair and reasonable, that the respective New Large-Cap Value Sub-Adviser’s fees are reasonable in light of the services provided to the Large-Cap Value Fund, and that the agreements be approved, and recommended that shareholders approve such Additional Sub-Advisory Agreements.
54
Notes
55
Notes
56
Trustees and Officers
The management of the Funds, including general supervision of the duties performed for the Funds by the Adviser, is the responsibility of the Board of Trustees of the Funds. The number of trustees of the Funds is currently set at eight. None of the trustees who are not “interested” persons of the Funds has ever been a director or employee of, or consultant to, Nuveen or its affiliates. The names and business addresses of the trustees and officers of the Funds, their principal occupations and other affiliations during the past five years, the number of portfolios each oversees and other directorships they hold are set forth below.
The Funds’ Statement of Additional Information (“SAI”) includes more information about the Trustees. To request a free copy, call Nuveen Investments at (800) 257-8787 or visit the Funds’ website at www.nuveen.com.
| | | | | | | | |
Name, Birthdate and Address | | Position(s) Held with the Funds | | Year First Elected or Appointed (2) | | Principal Occupation(s) Including other Directorships During Past 5 Years | | Number of Portfolios in Fund Complex Overseen by Trustee |
| |
| Trustee who is an interested person of the Funds: | | |
| | | | |
| | | | | | | | | |
Timothy R. Schwertfeger (1) 3/28/49 333 W. Wacker Drive Chicago, IL 60606 | | Chairman of the Board and Trustee | | 1994 | | Director and Chairman (since 1996) and Non-Executive Chairman (since July 1, 2007) formerly, Chief Executive Officer (1996-June 30, 2007) of Nuveen Investments, Inc., and Nuveen Asset Management and certain other subsidiaries of Nuveen Investments, Inc.; formerly, Director (1992-2006) of Institutional Capital Corporation. | | 176 |
| | |
| Trustees who are not interested persons of the Funds: | | | | |
| | | | |
| | | | | | | | | |
Robert P. Bremner 8/22/40 333 W. Wacker Drive Chicago, IL 60606 | | Lead Independent Trustee | | 1997 | | Private Investor and Management Consultant. | | 176
|
| | | | |
| | | | | | | | | |
Jack B. Evans 10/22/48 333 W. Wacker Drive Chicago, IL 60606 | | Trustee | | 1999 | | President, The Hall-Perrine Foundation, a private philanthropic corporation (since 1996); Director and Vice Chairman, United Fire Group, a publicly held company; Member of the Board of Regents for the State of Iowa University System; Director, Gazette Companies; Life Trustee of Coe College and Iowa College Foundation; Member of the Advisory Council of the Department of Finance in the Tippie College of Business, University of lowa; formerly, Director, Alliant Energy; formerly, Director, Federal Reserve Bank of Chicago; formerly, President and Chief Operating Officer, SCI Financial Group, Inc., a regional financial services firm. | | 176
|
| | | | |
| | | | | | | | | |
William C. Hunter 3/6/48 333 W. Wacker Drive Chicago, IL 60606 | | Trustee | | 2004 | | Dean, Tippie College of Business, University of Iowa (since July 2006); formerly, Dean and Distinguished Professor of Finance, School of Business at the University of Connecticut (2003-2006); previously, Senior Vice President and Director of Research at the Federal Reserve Bank of Chicago (1995-2003); Director (since 1997), Credit Research Center at Georgetown University; Director (since 2004) of Xerox Corporation; Director, SS&C Technologies, Inc. (May 2005-October 2005). | | 176
|
| | | | |
| | | | | | | | | |
David J. Kundert 10/28/42 333 W. Wacker Drive Chicago, IL 60606 | | Trustee | | 2005 | | Director, Northwestern Mutual Wealth Management Company; Retired (since 2004) as Chairman, JPMorgan Fleming Asset Management, President and CEO, Banc One Investment Advisors Corporation, and President, One Group Mutual Funds; prior thereto, Executive Vice President, Banc One Corporation and Chairman and CEO, Banc One Investment Management Group; Board of Regents, Luther College; member of the Wisconsin Bar Association; member of Board of Directors, Friends of Boerner Botanical Gardens; member of Board of Directors, Milwaukee Repertory Theater. | | 174
|
57
Trustees and Officers (continued)
| | | | | | | | |
Name, Birthdate and Address | | Position(s) Held with the Funds | | Year First Elected or Appointed (2) | | Principal Occupation(s) Including other Directorships During Past 5 Years | | Number of Portfolios in Fund Complex Overseen by Trustee |
William J. Schneider 9/24/44 333 W. Wacker Drive Chicago, IL 60606 | | Trustee | | 1997 | | Chairman of Miller-Valentine Partners Ltd., a real estate investment company; formerly, Senior Partner and Chief Operating Officer (retired, 2004) of Miller-Valentine Group; formerly, Vice President, Miller-Valentine Realty; Board Member, Chair of the Finance Committee and member of the Audit Committee of Premier Health Partners, the not-for-profit company of Miami Valley Hospital; Vice President, Dayton Philharmonic Orchestra Association; Board Member, Regional Leaders Forum, which promotes cooperation on economic development issues; Director, Dayton Development Coalition; formerly, Member, Community Advisory Board, National City Bank, Dayton, Ohio and Business Advisory Council, Cleveland Federal Reserve Bank. | | 176 |
| | | | |
| | | | | | | | | |
Judith M. Stockdale 12/29/47 333 W. Wacker Drive Chicago, IL 60606 | | Trustee | | 1997 | | Executive Director, Gaylord and Dorothy Donnelley Foundation (since 1994); prior thereto, Executive Director, Great Lakes Protection Fund (from 1990 to 1994). | | 176 |
| | | | |
| | | | | | | | | |
Carole E. Stone 6/28/47 333 West Wacker Drive Chicago, IL 60606 | | Trustee | | 2007 | | Director, Chicago Board Options Exchange (since 2006); Chair New York Racing Association Oversight Board (since 2005); Commissioner, New York State Commission on Public Authority Reform (since 2005); formerly Director, New York State Division of the Budget (2000-2004), Chair, Public Authorities Control Board (2000-2004) and Director, Local Government Assistance Corporation (2000-2004). | | 176 |
| | | | |
| | | | | | | | | |
Name, Birthdate and Address | | Position(s) Held with the Funds | | Year First Elected or Appointed (3) | | Principal Occupation(s) During Past 5 Years | | Number of Portfolios in Fund Complex Overseen by Officer |
| | |
| Officers of the Funds: | | | | |
| | | | |
| | | | | | | | | |
Gifford R. Zimmerman 9/9/56 333 W. Wacker Drive Chicago, IL 60606 | | Chief Administrative Officer | | 1988 | | Managing Director (since 2002), Assistant Secretary and Associate General Counsel, formerly, Vice President and Assistant General Counsel, of Nuveen Investments, LLC; Managing Director (since 2002) and Assistant Secretary and Associate General Counsel, formerly, Vice President (since 1997), of Nuveen Asset Management; Managing Director (since 2004) and Assistant Secretary (since 1994) of Nuveen Investments, Inc.; Assistant Secretary of NWQ Investment Management Company, LLC. (since 2002); Vice President and Assistant Secretary of Nuveen Investments Advisers Inc. (since 2002); Managing Director, Associate General Counsel and Assistant Secretary of Rittenhouse Asset Management, Inc., Symphony Asset Management LLC (since 2003), Tradewinds Global Investors, LLC and Santa Barbara Asset Management, LLC (since 2006); formerly, Managing Director (2002-2004), General Counsel (1998-2004) and Assistant Secretary, formerly, Vice President of Nuveen Advisory Corp. and Nuveen Institutional Advisory Corp.(4); Chartered Financial Analyst. | | 176 |
| | | | |
| | | | | | | | | |
Julia L. Antonatos 9/22/63 333 W. Wacker Drive Chicago, IL 60606 | | Vice President | | 2004 | | Managing Director (since 2005), formerly, Vice President (since 2002) of Nuveen Investments, LLC; Chartered Financial Analyst. | | 176 |
| | | | |
| | | | | | | | | |
Michael T. Atkinson 2/3/66 333 W. Wacker Drive Chicago, IL 60606 | | Vice President and Assistant Secretary | | 2000 | | Vice President (since 2002) of Nuveen Investments, LLC. | | 176 |
58
| | | | | | | | |
Name, Birthdate and Address | | Position(s) Held with the Funds | | Year First Elected or Appointed (3) | | Principal Occupation(s) Including other Directorships During Past 5 Years | | Number of Portfolios in Fund Complex Overseen by
Officer |
Alan A. Brown 8/1/62 333 West Wacker Drive Chicago, IL 60606 | | Vice President | | 2007 | | Executive Vice President, Mutual Funds, Nuveen Investments, LLC, (since 2005), previously, Managing Director and Chief Marketing Officer (2001-2005). | | 57 |
| | | | |
| | | | | | | | | |
Peter H. D’Arrigo 11/28/67 333 W. Wacker Drive Chicago, IL 60606 | | Vice President | | 1999 | | Vice President and Treasurer of Nuveen Investments, LLC and of Nuveen Investments, Inc. (since 1999); Vice President and Treasurer of Nuveen Asset Management (since 2002) and of Nuveen Investments Advisers Inc. (since 2002); Assistant Treasurer of NWQ Investment Management Company, LLC. (since 2002); Vice President and Treasurer of Nuveen Rittenhouse Asset Management, Inc. (since 2003); Treasurer of Symphony Asset Management LLC (since 2003) and Santa Barbara Asset Management, LLC (since 2006); Assistant Treasurer, Tradewinds Global Investors, LLC (since 2006); formerly, Vice President and Treasurer (1999-2004) of Nuveen Advisory Corp. and Nuveen Institutional Advisory Corp.(4); Chartered Financial Analyst. | | 176 |
| | | | |
| | | | | | | | | |
Lorna C. Ferguson 10/24/45 333 W. Wacker Drive Chicago, IL 60606 | | Vice President | | 1998 | | Managing Director (since 2004), formerly, Vice President of Nuveen Investments, LLC, Managing Director (2004) formerly, Vice President (1998-2004) of Nuveen Advisory Corp. and Nuveen Institutional Advisory Corp.(4); Managing Director (since 2005) of Nuveen Asset Management. | | 176 |
| | | | |
| | | | | | | | | |
William M. Fitzgerald 3/2/64 333 W. Wacker Drive Chicago, IL 60606 | | Vice President | | 1995 | | Managing Director (since 2002), formerly, Vice President of Nuveen Investments, LLC; Managing Director (1997-2004) of Nuveen Advisory Corp. and Nuveen Institutional Advisory Corp.(4); Managing Director (since 2001) of Nuveen Asset Management ; Vice President (since 2002) of Nuveen Investments Advisers Inc.; Chartered Financial Analyst. | | 176 |
| | | | |
| | | | | | | | | |
Stephen D. Foy 5/31/54 333 W. Wacker Drive Chicago, IL 60606 | | Vice President and Controller | | 1998 | | Vice President (since 1993) and Funds Controller (since 1998) of Nuveen Investments, LLC; formerly, Vice President and Funds Controller (1998-2004) of Nuveen Investments, Inc.; Certified Public Accountant. | | 176 |
| | | | |
| | | | | | | | | |
Walter M. Kelly 2/24/70 333 West Wacker Drive Chicago, IL 60606 | | Chief Compliance Officer and Vice President | | 2003 | | Assistant Vice President and Assistant Secretary of the Nuveen Funds (2003-2006); Assistant Vice President and Assistant General Counsel (since 2003) of Nuveen Investments, LLC; previously, Associate (2001-2003) at the law firm of Vedder, Price, Kaufman & Kammholz. | | 176 |
| | | | |
| | | | | | | | | |
David J. Lamb 3/22/63 333 W. Wacker Drive Chicago, IL 60606 | | Vice President | | 2000 | | Vice President (since 2000) of Nuveen Investments, LLC; Certified Public Accountant. | | 176 |
| | | | |
| | | | | | | | | |
Tina M. Lazar 8/27/61 333 W. Wacker Drive Chicago, IL 60606 | | Vice President | | 2002 | | Vice President of Nuveen Investments, LLC (since 1999). | | 176 |
59
Trustees and Officers (continued)
| | | | | | | | |
Name, Birthdate and Address | | Position(s) Held with the Funds | | Year First Elected or Appointed (3) | | Principal Occupation(s) Including other Directorships During Past 5 Years | | Number of Portfolios in Fund Complex Overseen by
Officer |
Larry W. Martin 7/27/51 333 W. Wacker Drive Chicago, IL 60606 | | Vice President and Assistant Secretary | | 1988 | | Vice President, Assistant Secretary and Assistant General Counsel of Nuveen Investments, LLC; formerly, Vice President and Assistant Secretary of Nuveen Advisory Corp. and Nuveen Institutional Advisory Corp.(4); Vice President (since 2005) and Assistant Secretary of Nuveen Investments, Inc.; Vice President (since 2005) and Assistant Secretary (since 1997) of Nuveen Asset Management; Vice President (since 2000), Assistant Secretary and Assistant General Counsel (since 1998) of Rittenhouse Asset Management, Inc.; Vice President and Assistant Secretary of Nuveen Investments Advisers Inc. (since 2002); Assistant Secretary of NWQ Investment Management Company, LLC (since 2002), Symphony Asset Management LLC (since 2003), and Tradewinds Global Investors, LLC and Santa Barbara Asset Management, LLC (since 2006). | | 176 |
| | | | |
| | | | | | | | | |
Kevin J. McCarthy 3/26/66 333 W. Wacker Drive Chicago, IL 60606 | | Vice President and Secretary | | 2007 | | Vice President and Assistant General Counsel, Nuveen Investments, Inc. (since 2007); Vice President, Nuveen Investments, LLC (since 2007); Vice President and Assistant Secretary, Nuveen Asset Management and Rittenhouse Asset Management, Inc. (since 2007) prior thereto, Partner, Bell, Boyd & Lloyd LLP (1997-2007). | | 176 |
| | | | |
| | | | | | | | | |
John V. Miller 4/10/67 333 W. Wacker Drive Chicago, IL 60606 | | Vice President | | 2007 | | Managing Director (since 2007), formerly, Vice President (2002-2007) of Nuveen Asset Management and Nuveen Investments, LLC; Chartered Financial Analyst. | | 176 |
| | | | |
| | | | | | | | | |
John S. White 5/12/67 333 West Wacker Drive Chicago, IL 60606 | | Vice President | | 2007 | | Vice President (since 2006) of Nuveen Investments, LLC, formerly, Assistant Vice President (since 2002); Lieutenant Colonel (since 2007), United States Marine Corps Reserve, formerly, Major (since 2001). | | 57 |
| (1) | Mr. Schwertfeger is an “interested person” of the Funds, as defined in the Investment Company Act of 1940, because he is an officer and trustee of the Adviser. |
| (2) | Trustees serve an indefinite term until his/her successor is elected or appointed. The year first elected or appointed represents the year in which the Trustee was first elected or appointed to any fund in the Nuveen Complex. |
| (3) | Officers serve one year terms through July of each year. The year first elected or appointed represents the year in which the Officer was first elected or appointed to any fund in the Nuveen Complex. |
| (4) | Nuveen Advisory Corp. and Nuveen Institutional Advisory Corp. were reorganized into Nuveen Asset Management, effective January 1, 2005. |
60
Fund Information
| | | | |
| | |
Fund Manager Nuveen Asset Management 333 West Wacker Drive Chicago, IL 60606 Sub-Adviser Institutional Capital LLC 225 West Wacker Drive Chicago, IL 60606 | | Legal Counsel Chapman and Cutler LLP Chicago, IL Independent Registered Public Accounting Firm PricewaterhouseCoopers LLP Chicago, IL Custodian State Street Bank & Trust Company Boston, MA | | Transfer Agent and Shareholder Services Boston Financial Data Services Nuveen Investor Services P.O. Box 8530 Boston, MA 02266-8530 (800) 257-8787 |
Glossary of Terms Used in this Report
Average Annual Total Return: This is a commonly used method to express an investment’s performance over a particular, usually multi-year time period. It expresses the return that would have been necessary each year to equal the investment’s actual cumulative performance (including change in NAV or offer price and reinvested dividends and capital gains distributions, if any) over the time period being considered.
Average Market Capitalization: The market capitalization of a company is equal to the number of the company’s common shares outstanding multiplied by the current price of the company’s stock. The average market capitalization of a mutual fund’s portfolio gives a measure of the size of the companies in which the fund invests.
Average Duration: Duration is a measure of the expected period over which a bond’s principal and interest will be paid, and consequently is a measure of the sensitivity of a bond (or bond fund’s) value to changes when interest rates change. Generally, the longer a bond or fund’s duration, the more the price of the bond or fund will change as interest rates change.
SEC 30-Day Yield: A standardized measure of a fund’s yield that accounts for the future amortization of premiums or discounts of bonds held in the fund’s portfolio.
Net Asset Value (NAV): A fund’s NAV is the dollar value of one share in the fund. It is calculated by subtracting the liabilities of the fund from its total assets and then dividing the remainder by the number of shares outstanding. Fund NAVs are calculated at the end of each business day.
Quarterly Portfolio of Investments and Proxy Voting Information: Each Fund’s (i) quarterly portfolio of investments, (ii) information regarding how the Funds voted proxies relating to portfolio securities held during the most recent 12-month period ended June 30, 2007, and (iii) a description of the policies and procedures that the Funds used to determine how to vote proxies relating to portfolio securities are available without charge, upon request, by calling Nuveen Investments at (800) 257-8787 or on Nuveen’s website at www.nuveen.com.
You may also obtain this and other Fund information directly from the Securities and Exchange Commission (“SEC”). The SEC may charge a copying fee for this information. Visit the SEC on-line at http://www.sec.gov or in person at the SEC’s Public Reference Room in Washington, D.C. Call the SEC at 1-202-942-8090 for room hours and operation. You may also request fund information by sending an e-mail request to publicinfo@sec.gov or by writing to the SEC’s Public Reference Section at 450 Fifth Street NW, Washington, D.C. 20549.
Distribution Information: Large-Cap Value, Municipal and Stock and Stock and Bond designate 58.18%, 100.00% and 31.56%, respectively, of dividends declared from net ordinary income as dividends qualifying for the 70% dividends received deduction for corporations and 69.70%, 100.00%, 37.79%, respectively, as qualified dividend income for individuals under the Jobs and Growth Tax Relief Reconciliation Act of 2003.
NASD Regulation, Inc. provides a Public Disclosure Program which supplies certain information regarding the disciplinary history of NASD members and their associated persons in response to either telephone inquiries at (800) 289-9999 or written inquiries at www.nasdr.com. NASD Regulation, Inc. also provides an investor brochure that includes information describing the Public Disclosure Program.
61
Learn more
about Nuveen Funds at
www.nuveen.com/mf
Nuveen Investments:
SERVING Investors
For GENERATIONS
Since 1898, financial advisors and their clients have relied on Nuveen Investments to provide dependable investment solutions. Over this time, Nuveen Investments has adhered to the belief that the best approach to investing is to apply conservative risk-management principles to help minimize volatility.
Building on this tradition, we today offer a range of high quality equity and fixed-income solutions that can be integral parts of a well-diversified core portfolio. Our clients have come to appreciate this diversity, as well as our continued adherence to proven, long-term investing principles.
We offer many different investing solutions for our clients’ different needs.
Managing approximately $172 billion in assets as of June 30, 2007, Nuveen Investments offers access to a number of different asset classes and investing solutions through a variety of products. Nuveen Investments markets its capabilities under six distinct brands: NWQ, specializing in value-style equities; Nuveen, managing fixed-income investments; Santa Barbara, committed to growth equities; Tradewinds, specializing in global value equities; Rittenhouse, focused on “blue-chip” growth equities; and Symphony, with expertise in alternative investments as well as equity and income portfolios.
Find out how we can help you reach your financial goals.
An investor should carefully consider the Fund’s objectives, risks, charges and expenses before investing. For a prospectus containing this and other information about the Fund, please contact your financial advisor or Nuveen Investments at (800) 257-8787. Read the prospectus carefully before you invest or send money.
MAN-GRINC-0607D
NUVEEN INVESTMENTS VALUE FUNDS
| | |
| | |
Annual Report dated June 30, 2007 | | For investors seeking long-term
capital appreciation. |

Nuveen Investments
Value Funds
Nuveen NWQ Multi-Cap Value Fund
Nuveen NWQ Large-Cap Value Fund
Nuveen NWQ Small/Mid-Cap Value Fund
Nuveen NWQ Small-Cap Value Fund
Nuveen NWQ Global Value Fund
Nuveen Tradewinds Value Opportunities Fund


NOW YOU CAN RECEIVE YOUR
NUVEEN INVESTMENTS FUND REPORTS FASTER.
NO MORE WAITING.
SIGN UP TODAY TO RECEIVE NUVEEN INVESTMENTS FUND INFORMATION BY
E-MAIL.
It only takes a minute to sign up for E-Reports. Once enrolled, you’ll receive an e-mail as soon as your Nuveen Investments Fund information is ready — no more waiting for delivery by regular mail. Just click on the link within the e-mail to see the report, and save it on your computer if your wish.

IT’S FAST, EASY & FREE:
www.investordelivery.com
if you get your Nuveen Investments Fund dividends and statements from your financial advisor or brokerage account.
(Be sure to have the address sheet that accompanied this report handy. You’ll need it to complete the enrollment process.)
OR
www.nuveen.com/accountaccess
if you get your Nuveen Investments Fund dividends and statements directly from Nuveen Investments.

Must be preceded by or accompanied by a prospectus.
NOT FDIC INSURED MAY LOSE VALUE NO BANK GUARANTEE

Dear Shareholder,
Detailed information on your Fund’s performance can be found in the Portfolio Managers’ Comments and Fund Spotlight sections of this report. The Value Funds feature portfolio management by NWQ Investment Management Company, LLC (NWQ) and Tradewinds Global Investors, LLC (Tradewinds). I urge you to take the time to read the Portfolio Managers’ Comments.
I also wanted to take this opportunity to report some important news about Nuveen Investments. The company has accepted a buyout offer from a private equity investment firm. While this may affect the corporate structure of Nuveen Investments, it will have no impact on the investment objectives of the Funds, their portfolio management strategies or their dividend policies. We will provide you with additional information about this transaction as more details become available.
With the recent volatility in the stock market, many have begun to wonder which way the market is headed, and whether they need to adjust their holdings of investments. No one knows what the future will bring, which is why we think a well-balanced portfolio that is structured and carefully monitored with the help of an investment professional is an important component in achieving your long-term financial goals. A well-diversified portfolio may actually help to reduce your overall investment risk, and we believe that investments like your Nuveen Investments Fund can be important building blocks in a portfolio crafted to perform well through a variety of market conditions.
Since 1898, Nuveen Investments has offered financial products and solutions that incorporate careful research, diversification, and the application of conservative risk-management principles. We are grateful that you have chosen us as a partner as you pursue your financial goals. We look forward to continuing to earn your trust in the months and years ahead.
Sincerely,

Timothy R. Schwertfeger
Chairman of the Board
August 15, 2007
“No one knows what the future will bring, which is why we think a well-balanced portfolio ... is an important component in achieving your long-term financial goals.”
Annual Report Page 1
Portfolio Managers’ Comments
The Nuveen NWQ Multi-Cap Value Fund, Nuveen NWQ Large-Cap Value Fund, Nuveen NWQ Small/Mid-Cap Value Fund, Nuveen NWQ Small-Cap Value Fund and the domestic portion of the Nuveen NWQ Global Value Fund feature equity management by NWQ Investment Management Company, LLC (NWQ), while the Nuveen Tradewinds Value Opportunities Fund and the international portion of the Nuveen NWQ Global Value Fund feature portfolio management by Tradewinds Global Investors, LLC (Tradewinds); both of which Nuveen Investments, Inc. owns a controlling interest. In the following discussion, portfolio managers Jon Bosse, Phyllis Thomas, Gregg Tenser, Mark Morris, Paul Hechmer and Dave Iben discuss key investment strategies and the performance of the Funds. Jon Bosse is the Chief Investment Officer of NWQ and manages the Nuveen NWQ Multi-Cap Value and Nuveen NWQ Large-Cap Value Funds, Phyllis Thomas manages the Nuveen NWQ Small-Cap Value and Nuveen NWQ Small/Mid-Cap Value Funds and Gregg Tenser along with Mark Morris co-manage the domestic portion of the Nuveen NWQ Global Value Fund. Paul Hechmer manages the international portion of the Nuveen NWQ Global Value Fund, while Dave Iben, Chief Investment Officer of Tradewinds, is the portfolio manager for the Nuveen Tradewinds Value Opportunities Fund.
What were the general market conditions during this reporting period?
With the Federal Reserve (“Fed”) on hold since last August, the U.S. stock market marched steadily higher to a series of multi-year highs spurred by corporate earnings before rising bond yields and subprime mortgage worries erased part of those gains in June. Much of the fuel for recent stock market gains during the period was the tremendous amount of world liquidity as evidenced by the explosion of private equity takeovers, corporate share buybacks, and merger activity. Also supporting the stock market have been corporate earnings gains, which although below the pace of the last few years, are still above what most analysts had been predicting.
How did the Funds perform during the twelve months ended June 30, 2007?
The table on page three provides performance information for the six Funds (Class A shares at net asset value) for the one-year, five-year and for since inception periods ended June 30, 2007. The table also compares the Funds’ performance to appropriate benchmarks. A more detailed account of each Funds’ relative performance is provided later in this report.
What strategies were used to manage the Funds during the reporting period? How did these strategies influence performance?
Nuveen NWQ Multi-Cap Value Fund
Although class A shares at net asset value for the Nuveen NWQ Multi-Cap Value Fund reported a double-digit gain, the Fund underperformed each of its comparative indexes for the twelve month period ended June 30, 2007. Weakness in our investments in stocks of mortgage-related companies was the main catalyst for our underperformance relative to our benchmarks. Conversely, our energy, metals, and technology stocks contributed gains.
Since its inception, the Fund has remained broadly diversified across many industries in companies that satisfy our investment criteria. In terms of trading activity, we increased our technology industry exposure with new stakes in Aeroflex, Inc., Motorola, Inc., and ECI Telecommunications. Aeroflex, Inc., ECI Telecommunications, as well as our investment in Freescale Semiconductor, which we sold during the twelve month period, all received takeout offers at attractive prices during the year. In the energy sector, our stake in Kerr McGee Corp. was bought out and we subsequently added exploration and production firms Apache Corp., Hess Corp., and Southwestern Energy. We believe these firms have attractive valuations given their strong growth profiles. We also added Amgen, Inc. after the shares had been under significant pressure due to safety and reimbursement issues related to its core anemia drugs.
Discussions of specific investments are for illustration only and are not intended as recommendations of individual investments. The views expressed herein represent those of the portfolio managers as of the date of this report and are subject to change at any time, based on market conditions and other factors. The Funds disclaim any obligation to advise shareholders of such changes.
Annual Report Page 2
Class A Shares
Average Annual Total Returns as of 6/30/07
| | | | | | |
| | | 1-Year | | 5-Year | | Since
inception1 |
Nuveen NWQ Multi-Cap Value Fund A Shares at NAV A Shares at Offer | | 15.51%
8.88% | | 17.41%
16.03% | | 13.49%
12.80% |
Lipper Multi-Cap Value Funds Index2 | | 20.17% | | 12.81% | | 8.29% |
Russell 3000 Value Index3 | | 21.33% | | 13.40% | | 9.19% |
S&P 500 Index3 | | 20.59% | | 10.71% | | 6.52% |
Nuveen NWQ Large-Cap Value Fund A Shares at NAV A Shares at Offer | | NA
NA | | NA
NA | | 6.90%
0.75% |
Lipper Multi-Cap Value Funds Index2 | | NA | | NA | | 7.03% |
Russell 1000 Value Index3 | | NA | | NA | | 6.23% |
Nuveen NWQ Small/Mid-Cap Value Fund A Shares at NAV A Shares at Offer | | NA
NA | | NA
NA | | 6.85%
0.71% |
Lipper Small-Cap Value Funds Index2 | | NA | | NA | | 7.68% |
Russell 2500 Value Index3 | | NA | | NA | | 6.09% |
| | | | | | |
| | | 1-Year | | 5-Year | | Since
inception1 |
Nuveen NWQ Small-Cap Value Fund A Shares at NAV A Shares at Offer | | 16.09%
9.42% | | NA
NA | | 18.28%
15.57% |
Lipper Small-Cap Value Funds Index2 | | 18.04% | | NA | | 13.32% |
Russell 2000 Value Index3 | | 16.05% | | NA | | 12.49% |
S&P SmallCap 600 Index3 | | 16.04% | | NA | | 15.39% |
Nuveen NWQ Global Value Fund A Shares at NAV A Shares at Offer | | 19.67%
12.79% | | NA
NA | | 15.53%
12.89% |
Lipper Global Multi-Cap Core Funds Index2 | | 21.17% | | NA | | 15.39% |
MSCI World Value Index3 | | 26.96% | | NA | | 18.21% |
Nuveen Tradewinds Value Opportunities Fund A Shares at NAV A Shares at Offer | | 22.98%
15.91% | | NA
NA | | 22.36%
19.57% |
Lipper Mid-Cap Core Funds Index2 | | 20.82% | | NA | | 13.73% |
Russell Midcap Value Index3 | | 22.09% | | NA | | 16.72% |
Russell 2500 Value Index3 | | 18.41% | | NA | | 13.54% |
Effective December 6, 2002, based on shareholder approval, the Nuveen NWQ Multi-Cap Value Fund acquired the assets and performance history of the PBHG Special Equity Fund. The Fund had no assets prior to the acquisition. In addition, on December 14, 2001, the PBHG Special Equity Fund acquired the assets of the NWQ Special Equity Portfolio. The information presented for the Nuveen NWQ Multi-Cap Value Fund prior to the acquisition date represents the expense adjusted performance of the predecessor funds.
On March 1, 2006, Tradewinds Global Investors, LLC assumed all of the sub-advisory responsibilities for the Nuveen NWQ Value Opportunities Fund and the international portion of the Nuveen NWQ Global Value Fund. Effective June 30, 2006, the name of the Nuveen NWQ Value Opportunities Fund changed to Nuveen Tradewinds Value Opportunities Fund. There have been no changes in the Funds’ portfolio management personnel, investment objectives, policies, or day-to-day portfolio management practices.
Returns quoted represent past performance, which is no guarantee of future results. Returns at NAV would be lower if the sales charge were included. Returns less than one year are cumulative. Current performance may be higher or lower than the performance shown. Investment returns and principal value will fluctuate so that when shares are redeemed, they may be worth more or less than their original cost. Class A shares have a 5.75% maximum sales charge. Returns do not reflect the deduction of taxes that a shareholder would pay on Fund distributions or the redemption of shares. Returns reflect a voluntary expense limitation by the Funds’ investment adviser that may be modified or discontinued at any time without notice. For the most recent month-end performance, visit www.nuveen.com or call (800) 257-8787.
Please see each Fund’s Spotlight Page later in this report for more complete performance data and expense ratios.
| 1 | The since-inception return for the Nuveen NWQ Multi-Cap Value Fund is calculated from 11/4/97, the Nuveen NWQ Large-Cap Value Fund and the Nuveen NWQ Small/Mid-Cap Value Fund are from 12/15/06 and the since-inception returns for all the remaining Funds are from 12/9/04. Since-inception returns for less than one year are cumulative. |
| 2 | The Lipper Funds Indexes are managed indexes that represent the average annualized returns of the 30 largest funds in each respective Lipper Funds category. The since inception data for the Lipper Multi-Cap Value Funds Index represents returns for the periods 11/30/97 - 6/30/07 for the Nuveen NWQ Multi-Cap Value Fund and 12/31/06 - 6/30/07 for the Nuveen NWQ Large-Cap Value Fund; for the Lipper Small-Cap Value Funds Index represents returns for the periods 12/31/06 - 6/30/07 for the Nuveen NWQ Small/Mid-Cap Value Fund and 12/31/04 - 6/30/07 for the Nuveen NWQ Small-Cap Value Fund; for the Lipper Global Multi-Cap Core Funds Index and Lipper Mid-Cap Core Funds Index represents returns for the period 12/31/04 - 6/30/07 as returns for the indexes are calculated on a calendar month basis. The returns assume reinvestment of dividends, but do not reflect any applicable sales charges. You cannot invest directly in an index. |
| 3 | The Russell 3000 Value Index is a market-capitalization weighted index of those firms in the Russell 3000 Index with lower price-to-book ratios and lower forecasted growth values. The Russell 3000 Index represents the 3000 largest U.S. companies. The since inception data for the index represents returns for the period 11/30/97 - 6/30/07, as returns for the index are calculated on a calendar month basis. The S&P 500 Index is an unmanaged index generally considered to be representative of the U.S. stock market. The since inception data for the index represents returns for the period 11/30/97 - 6/30/07, as returns for the index are calculated on a calendar month basis. The Russell 1000 Value Index is a market-capitalization weighted index of those firms in the Russell 1000 Index with lower price-to-book ratios and lower forecasted growth values. The Russell 2000 Value Index measures the performance of those Russell 2000 companies with lower price-to-book ratios and lower forecasted growth values. The since inception data for the index represents returns for the period 12/31/04 - 6/30/07, as returns for the index are calculated on a calendar month basis. The S&P SmallCap 600 Index is a capitalization-weighted index that measures the performance of selected U.S. stocks with a small market capitalization. The since inception data for the index represents returns for the period 12/31/04 - 6/30/07, as returns for the index are calculated on a calendar month basis. The Russell 2500 Value Index measures the performance of those Russell 2500 companies with lower price-to-book ratios and lower forecasted growth values. The since inception data for the index represents returns for the periods 12/31/06 - 6/30/07 for the Nuveen Small/Mid-Cap Value Fund and 12/31/04 - 6/30/07 for the Nuveen Tradewinds Value Opportunities Fund, as returns for the index are calculated on a calendar month basis. The MSCI World Value Index covers the full range of developed, emerging and All Country MSCI Equity Indices. The index uses a two dimensional framework for style segmentation in which value securities are categorized using three different attributes including forward looking variables. The objective of the index design is to divide constituents of an underlying MSCI Standard Country Index into a value index, targeting 50% of the free float adjusted market capitalization of the underlying country index. Country Value indices are then aggregated into regional Value indices. The since inception data for the index represents returns for the period 12/31/04 - 6/30/07, as returns for the index are calculated on a calendar month basis. The Russell Midcap Value Index measures the performance of those Russell Midcap companies with lower price-to-book ratios and lower forecasted growth values. The stocks are also members of the Russell 1000 Value index. The since inception data for the index represents returns for the period 12/31/04 - 6/30/07, as returns for the index are calculated on a calendar month basis. The index returns assume reinvestment of dividends and do not reflect any applicable sales charges. You cannot invest directly in an index. |
Annual Report Page 3
In the energy sector, our exploration and production investments Apache Corp., Noble Energy, Inc., and Southwestern Energy Co. posted gains during the reporting period as healthy industry fundamentals continue to drive earnings and cash flows. Also helping the stocks was the return of more normal winter weather back in February, which helped reduce excess natural gas inventories and improving the outlook for gas prices for the summer and fall. Apache Corp. trades at a material discount to its peers despite generating greater free cash flow and return on capital employed, and has a strong growth profile that includes a number of large development projects in Egypt and Australia. Noble Energy, Inc. also trades at a discount to its peers based on several valuation metrics, and we believe their international assets are underappreciated by the market. Southwestern Energy Co. has a strong management, and a cost structure that is among the lowest in the sector.
Ongoing consolidation, as well as persistent takeover speculation, contributed to the upward momentum (and volatility) of our steel investments POSCO and U.S. Steel Corp. Beyond these rumors, the fundamental trends in the steel industry remain very positive as industry consolidation and strong economic activity are driving growth in earnings and cash flows.
Another holding worth highlighting is our investment in electric utility, NRG Energy, Inc. The shares performed very well as the company is positioned to benefit from a fundamental shift in the Texas power market. Power supplies in Texas are expected to tighten due to increasing demand and a commitment from their regional competitor, TXU Corp., to scale back plans for several new coal plants as part of a leveraged buyout.
Beginning in February, financial stocks began to retreat on concerns about slower economic growth and lending troubles in the subprime mortgage industry (i.e. lenders that cater to borrowers with tarnished credit histories). Specifically, lax underwriting standards during 2006 created a sizable increase in the number of delinquencies and credit losses in many subprime portfolios.
At the end of the reporting period, the Fund’s largest industry holding was 12.5% in Thrifts and Mortgage Finance. Our mortgage origination stocks Countrywide Financial Corp. and IndyMac Bancorp, Inc. did decline as subprime concerns cast a dark cloud over the entire industry. While we acknowledge that 2007 will be challenging and potentially a trough year for the mortgage industry, and indeed these companies’ stock prices have extended their recent declines into the Fund’s new fiscal year, we continue to believe these companies will ultimately benefit from the ongoing shake-out in the market.
Expectations of lower mortgage origination volumes as well as strained gain-on-sale margins (i.e. profits from selling mortgages into the secondary market) also contributed to large declines in the share prices of our hybrid mortgage REIT investments American Home Mortgage Investment Corp. and Friedman, Billings, Ramsey Group, Inc. Friedman, Billings does have some subprime exposure, but we expect these losses to be controlled. Our investment in HomeBanc Corp., a mortgage REIT, suffered a significant decline as the company indicated that it will have to lower its dividend payout due to ongoing market pressures, including a challenging loan environment in Florida.
Nuveen NWQ Large-Cap Value Fund
The Nuveen NWQ Large-Cap Value Fund began operations during the reporting period on December 15, 2006. Class A shares at net asset value underperformed the Lipper Multi-Cap Value Funds Index but outperformed versus the Russell 1000 Value Index over the period since inception through June 30, 2007.
An overweight in oil and natural gas exploration and production companies positively contributed to performance during the period. Our holdings in this area were top contributors to performance based on the sustained pace of exploration spending, specifically Nobel Energy, Inc. and Apache Corp. During the period we also accumulated a stake in Hess Corp. Hess is an integrated oil company that has a solid list of
Annual Report Page 4
development and exploration projects. We believe Hess has significant undeveloped resources that are not fully recognized in the stock’s price, and that the company possesses an exploration portfolio that provides significant upside potential. Hess trades in-line with its peers on several valuation metrics despite having what we believe are better growth prospects and potentially more exploration opportunities.
Our investments in Fannie Mae, Ingersoll-Rand Co., and Tyson Foods, Inc. also generated strong gains. For Fannie Mae, a friendlier political environment and a strong possibility the company will be current with its financial accounting restatements in early 2008 contributed to the gain in its share price, while Ingersoll-Rand Co. rose as the company announced that it will sell or spin-off its Bobcat light construction equipment, as well as its utility and attachment businesses. Shares of Tyson Foods, Inc. climbed as last year’s production cuts drove strong appreciation in chicken prices, bolstering Tyson’s earnings outlook. In addition, the company announced a new product initiative to offer 100% all natural chicken raised without antibiotics. While we do not necessarily believe that this initiative will result in higher chicken market share, we do expect that it will help improve product mix and profit margins. This move also bolsters the company’s case to be valued more like a packaged food company and less as a commodity operator.
Beginning in February, financial stocks began to retreat on concerns about slower economic growth and lending troubles in the subprime mortgage industry (i.e. lenders that cater to borrowers with tarnished credit histories). Subsequently, many private and publicly-traded subprime originators have either gone out of business, or have been sold to larger financial firms at very depressed prices. While we had no investments in companies whose sole business is involved in subprime mortgages, our mortgage-related stocks declined as subprime concerns cast a dark cloud over the entire industry, particularly our investments in mortgage originator Countrywide Financial Corp., and mortgage insurers MGIC Investment Corp. and Radian Group, Inc. During the period MGIC and Radian announced plans to merge, however, after the close of the reporting period it was announced that the merger may not go through.
Nuveen NWQ Small-Cap Value Fund
In the twelve month period ending June 30, 2007, the total return of the Nuveen NWQ Small-Cap Value Fund (Class A shares at net asset value) performed quite well on an absolute basis and also in-line with the Russell 2000 Value Index. The Fund trailed the returns of the Lipper Small-Cap Value Funds Index. The markets have been quite strong through the second quarter of 2007, reflecting lessening concern about the economy and a flurry of mergers by strategic and private equity buyers. Corporate borrowing rates remain quite low relative to those of the U.S. Treasury, which has contributed to the positive bias for the stock market.
During the twelve month period, the portfolio benefited primarily from economic selection versus stock selection. The producer durables, materials and processing and consumer discretionary sectors provided the strongest returns over the one year period. The overweight producer durables sector, including top performer General Cable Corp., significantly contributed to the portfolio’s total return. The portfolio was underweight in the underperforming consumer discretionary sector, but stock selection in this sector, including Fossil, Inc., outperformed the benchmark. Although underweight in the underperforming finance sector, weakness among our mortgage-related securities negatively impacted performance. The Fund’s finance sector provided the only negative returns to the portfolio during the reporting period. The overweight consumer staples sector contributed to performance on an absolute basis, but stock selection resulted in the sector underperforming the benchmark.
Three of the top positive contributors to performance were General Cable Corp., CommScope, Inc., and Fossil, Inc. While we have
Annual Report Page 5
trimmed all of these positions, the stocks continue to offer appreciation potential. The management of General Cable Corp. continues to see strong demand in infrastructure projects which should remain stable for the next several years. Industry-wide capacity constraints among cable manufacturers are helping the company to realize improving margins. The company’s largest portion of operating profit continues to come from cables sold to the utility end market for the transmission and distribution of electric power. Electric utilities have made meaningful increases to investments in transmission infrastructure and the demand from this customer segment is forecasted to remain healthy over the next four years. CommScope, Inc. is a world leader in the design and manufacture of “last mile” cable and connectivity solutions for communications networks (data and wireless). CommScope, Inc. continued to increase its top-line sales growth and widen its margins on raw material price stability, greater plant efficiencies, and lower operating expenses. As a leading provider of coaxial and fiber cables, the company has been the beneficiary of the increased competition between cable operators and fiber cables. Fossil, Inc. designs, develops and distributes fashion watches and accessories. Strength in sales of accessories (specifically jewelry and women’s hand bags) and continued success from the company’s European business have been positive drivers of the stock performance. Management remains focused on launching new products and brands, as well as continuing to grow its retail store base, both domestically and abroad, with 30 new stores opened in 2006.
The three largest negative contributors to portfolio performance were IndyMac Bancorp, Inc., Gibraltar Industries, Inc., and Franklin Bank Corp. Mortgage originator, IndyMac Bancorp, Inc. has faced selling pressures as subprime problems have impacted the entire industry. With management focused on lowering expenses, the company should be positioned to gain market share as weaker participants leave the industry. Gibraltar Industries, Inc. is a manufacturer, processor and distributor of residential and commercial building products, and processed metal products for industrial application. Impacted by the slow down in the auto and residential construction markets, the company’s unique business model generates a majority of its revenue from value added manufactured products, enabling it to achieve fairly stable margins regardless of steel prices. Shares of Texas-based community bank operator, Franklin Bank Corp., declined during the reporting period. The stock continued to weaken as investors sold-off financials stocks with exposure to the residential mortgage market. Franklin Bank Corp. does underwrite residential mortgage loans, but has strong underwriting discipline. The company continued to experience strong commercial loan and core community deposit growth and modest margin expansion.
Nuveen NWQ Small/Mid-Cap Value Fund
The Nuveen NWQ Small/Mid-Cap Value Fund began operations during the reporting period on December 15, 2006. The total return of Class A Shares at net asset value underperformed the Lipper Small-Cap Value Funds Index but outperformed versus the Russell 2500 Value Index over the period since inception through June 30, 2007.
The portfolio benefited primarily from sector selection during the quarter. However, the combination of sector selection and strong stock selection within the producer durables sector contributed the largest performance gains for the portfolio. Overweight positions in the material and processing, energy and producer durables sectors outperformed the benchmark. Stock selection within the technology sector provided strong returns as well. While underweight, stock selection in the financial services sector and weakness among our mortgage-related securities impacted the portfolio posting negative absolute returns.
Three of the top contributors to performance were General Cable Corp., Kennametal, Inc. and Reliance Steel & Aluminum Co. The management of General Cable Corp. continued to see strong demand in infrastructure projects which should
Annual Report Page 6
remain stable for the next several years. Industry-wide capacity constraints among cable manufacturers are helping General Cable Corp. to realize improving margins. The company’s largest portion of operating profit continues to come from cables sold to the utility end market for the transmission and distribution of electric power. Electric utilities have made meaningful increases to investments in transmission infrastructure and the demand from this customer segment is forecasted to remain healthy over the next four years. Kennametal, Inc. is a leading global supplier of tooling, engineered components and advanced materials consumed in production processes. Kennametal, Inc. has shown its ability to expand and improve its portfolio of businesses through both acquisitions and organic growth, while also improving cost controls. The company has been successfully focusing on improving its capital returns through decreasing its tax rate and operating expenses. Also, through new product introductions and increased product penetration of its existing customer base, Kennametal, Inc. is expanding its top-line market growth potential. Reliance Steel & Aluminum Co. is one of the largest metals service centers companies in the United States. The company processes and distributes metal products through its network of more than 100 locations both domestically and internationally. Ongoing regional and global consolidation has resulted in much greater supply discipline and improved pricing power within the steel industry, which should lead to increased earnings power. Reliance Steel & Aluminum Co. also completed three earnings accretive acquisitions in 2006 which are expected to add about $450 million of annualized revenue. With a diversified product mix, wide geographic footprint, and strong demand from three key end markets (non-residential construction, aerospace, and energy), the company is well positioned to grow earnings and participate in future consolidation in a relatively fragmented steel services industry.
The three largest negative contributors were American Home Mortgage Investment Corp., IndyMac Bancorp, Inc. and Rait Financial Trust. Shares of American Home Mortgage Investment Corp., a hybrid mortgage real estate investment trust (REIT), declined during the reporting period as a result of lower origination volumes expectations and increased pressures on profits from selling mortgages in the secondary market. Mortgage originator, IndyMac Bancorp, Inc. has faced selling pressures as subprime problems have impacted the entire industry. With management focused on lowering expenses, the company should be positioned to gain market share as weaker participants leave the industry. Though focused primarily on commercial real estate, Rait Financial Trust underperformed during the period on investors’ concerns that a weakening residential mortgage market could spill over into the commercial space, specifically for collateralized debt obligation (CDO). While Rait Financial Trust does have some residential supbrime exposure through its recent acquisition of competitor Taberna, it remains limited with less than 1% of the company’s residential mortgage portfolio with a FICO score (a Fair Isaac Credit Organization score is a measure of credit risk calculated from a credit report using a standardized formula) under 640.
The portfolio also benefited from an acquisition announcement during the quarter. Avaya Communications, a telecommunication systems, applications and service provider, rose significantly in the second quarter on the announcement that the company accepted an offer to be acquired by Silver Lake Partners and TPG Capital for $8.2 billion, or $17.50 a share. The deal is scheduled to be completed this fall.
Nuveen NWQ Global Value Fund
The Nuveen NWQ Global Value Fund (Class A shares at net asset value) performed quite well in absolute terms, gaining nearly 20 percent overall for the twelve month reporting period. In relative terms, however, the Fund lagged the MSCI World Value Index as well as its peer group, the Lipper Global Multi-Cap Core Funds Index.
Although we benefited from being underweighted in the relatively weak-performing financial sector,
Annual Report Page 7
disappointing stock selection in this group had a negative impact on results. On the U.S. side of the portfolio, our exposure to mortgage-related companies hurt performance, especially Radian Group, Inc. and MGIC Investment Corp. Both companies were hurt by troubles in the subprime segment of the mortgage market, referring to loans made to home buyers with weak credit. As defaults increased, these two mortgage insurance companies both lagged significantly. Two Japanese consumer finance stocks, ACOM, which we sold during the twelve month period, and Takefuji Corp., saw their shares decline in response to the effects of new consumer lending regulations in Japan. Outside the financial sector, two additional Japanese stocks, gaming companies Sega Sammy Holdings, Inc. and Sankyo Co., fell on weaker-than-anticipated sales.
A handful of our investments in the technology sector also detracted. One notable laggard was U.S. communications technology manufacturer Motorola, which lost ground as the company looked for ways to turn around its struggling mobile telephone business. Also disappointing was South Korea’s Samsung SDI Co., which we sold during the twelve month period, one of the world’s largest makers of flat-screen displays. Samsung suffered from a weak pricing environment and fell on worse-than-expected sales. In Japan, semiconductor maker NEC Electronics Corp. saw its profits continue to lag analysts’ expectations during the year.
Despite our overall underperformance in the technology sector, we did benefit from positions in two U.S.-based software companies: CA (formerly Computer Associates) and Microsoft. CA has successfully turned around its business following earlier management troubles, while Microsoft, the world’s largest software maker, benefited from an improved revenue and earnings outlook stemming from several widely anticipated new products, including Vista, the long-awaited update to the Windows operating system.
Overall, our strongest contributor to returns during the past year was Premiere, the German pay-television company and a longtime portfolio holding. In past reports, we discussed how Premiere was hurt after it lost the rights to broadcast the Bundesliga, Germany’s soccer league. However, we continued to like the company for its market-leading position, an important factor in the company’s subsequent rebound. Premiere’s shares rose further when it agreed in February to reacquire the rights to broadcast the Bundesliga.
Another notable positive in the portfolio was mortgage-financing company Fannie Mae, whose shares rose off of a relatively low valuation coming into the reporting period. This government-sponsored corporation was helped by a more favorable political backdrop and a relative lack of exposure to the subprime mortgage market. The Fund further benefited from good stock picking in the energy sector. Energy stocks continued to turn in strong performance, as oil prices rose for much of the period and remained near historic highs. Our position in U.S. oil and natural gas drilling company Noble Energy, Inc. provided an especially positive performance impact.
During the past year, we continued to follow the Fund’s basic management approach, relying on our “bottom-up” security selection approach, meaning we choose stocks for the portfolio one-by-one, based on our assessment of their individual appreciation potential, as opposed to selecting investments based on a “top-down” evaluation of macroeconomic conditions. We continued to invest in a combination of U.S. and international stocks that we believed offered much better upside potential compared to their downside risk, an approach we consistently follow regardless of the overall economic and market backdrop.
Nuveen Tradewinds Value Opportunities Fund
The Nuveen Tradewinds Value Opportunities Fund (Class A shares at net asset value) outperformed versus the Lipper Mid-Cap Core Funds Index and the Russell Midcap Value Index over the twelve month period ending June 30, 2007.
The materials sector was the largest contributor to performance during the period. Base metal mining
Annual Report Page 8
holding Apex Silver Mines Ltd. had been plagued for most of the past twelve months by political concerns that Bolivia’s plan to nationalize its oil and gas industry would extend to the mining industry. However, in May, the Bolivian government stated that the country would honor previously issued mining licenses and favorably changed its tax stance. The company’s share price rose sharply after these announcements. Mosaic Co., which produces and markets crop nutrient and animal feed products, also performed well, due to rising demand for phosphate-based fertilizers and a successful operational and financial restructuring program. Gold and copper producer Ivanhoe Mines Limited rose sharply in late-October after Rio Tinto announced a strategic partnership with the company to jointly develop and operate a large Mongolian gold and copper complex, and continued to rise throughout the rest of the period as a result of higher metal prices, especially copper. While the portfolio’s materials sector generated solid performance overall, several gold industry holdings within the sector detracted from performance. Shares of gold producers generally dropped as gold prices declined over the past six months. We continue to believe in a long-term demand/supply imbalance for gold, and if this premise is incorrect, still believe the shares to be undervalued on a current asset valuation basis. The portfolio maintains a significant position in gold mining and processing companies.
Two other significant positive contributors to performance were Consumer Staples holdings Tyson Foods, Inc., the world’s largest diversified protein provider and supplier of beef, chicken, and pork to the global marketplace, and U.S. grocery retailer SUPERVALU, Inc. Tyson Foods, Inc. was the portfolio’s best individual contributor to performance, a result of a variety of favorable news over the period: increased poultry prices that more than offset higher feed prices, reports that South Korea may ease its restrictions on U.S. beef, and in late June, rumors that the company could be a takeover target. SUPERVALU, Inc. shares gained significantly in mid-April after the grocer posted a higher-than-expected fourth-quarter profit, partially attributed to the company’s purchase of Albertson’s in 2006, and raised its forecast for the current year.
In the producer durables sector, AGCO Corp. continued to reach new multi-year highs and was one of the top contributors to portfolio performance for the period. AGCO Corp. is a manufacturer and distributor of agricultural equipment throughout the world. The agricultural industry, which lagged the market for most of last year, started to work its way out of a cyclical bottom in early 2006 and continued its recovery throughout 2007 so far. In contrast, the stock price of Levitt Corp., a homebuilding and real estate development company in the Southeastern United States, declined considerably over the twelve month period, as concerns mounted over the company’s high inventory impairment charges due to the U.S. housing slowdown. Tecumseh Products Company, a global manufacturer of compressors, electric motors and components, experienced dramatic swings in its share price. The stock fell substantially in mid-March after a Brazilian court allowed debt collection proceedings to resume against the company’s Brazilian engine manufacturing subsidiary TMT Motoco. In mid-May, the company’s share price sharply reversed upward after reporting its first quarter results and forecasting second quarter operating improvements, but still ended the period as another poor performer.
Performance in the consumer discretionary sector was paced by CDW Corp., a provider of technology products and services for business, government and education. The company announced in late May that it will be acquired for $7.3 billion by private-equity firm Madison Dearborn Partners (the same firm that is leading the investment group that has agreed to aquire Nuveen Investments). The deal, which is expected to close in the fourth quarter of this year, values CDW at a sizeable premium. Sega Sammy Holdings, a Japanese developer of video game machines, video game software and pachinko pinball machines, was added to the Fund in late
Annual Report Page 9
April. Subsequently, the stock price fell after the company reported sluggish sales and negative profit, and forecast profit to fall in the coming year. Although the holding was still one of the larger individual laggards to performance, we added to the position on this weakness.
The portfolio was significantly underexposed versus the benchmark’s heavily weighted financial sector. Despite our underweight exposure, the portfolio’s financial sector was the largest detractor from performance. ACOM Co. Ltd. and Promise Co. Ltd. are among the top consumer finance companies in Japan but have experienced significant stock price declines due to investor concerns over regulatory changes and legal challenges. We continue to carefully monitor the potential risk/reward profile of these two companies.
Annual Report Page 10
Nuveen NWQ Multi-Cap Value Fund
Growth of an Assumed $10,000 Investment
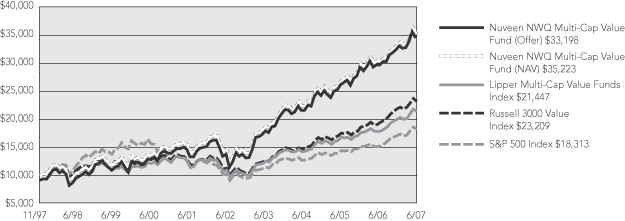
Nuveen NWQ Large-Cap Value Fund
Growth of an Assumed $10,000 Investment
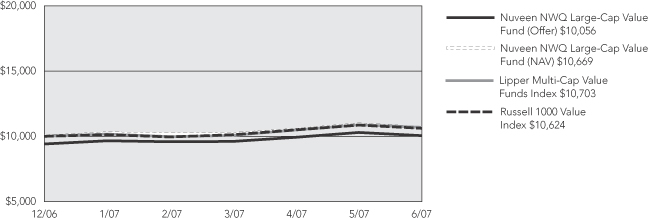
The graphs do not reflect the deduction of taxes that a shareholder may pay on Fund distributions or the redemption of shares.
The index comparisons show the change in value of a $10,000 investment in the Class A shares of the Nuveen Funds compared with the corresponding indexes. The Lipper Multi-Cap Value Funds Index is a managed index that represents the average annualized returns of the 30 largest funds in the Lipper Multi-Cap Value Funds category. The Russell 3000 Value Index is a market-capitalization weighted index of those firms in the Russell 3000 Index with lower price-to-book ratios and lower forecasted growth values. The Russell 3000 Index represents the 3000 largest U.S. companies. The S&P 500 Index is an unmanaged index generally considered to be representative of the U.S. stock market. The Lipper Large-Cap Value Funds Index is a managed index that represents the average annualized returns of the 30 largest funds in the Lipper Multi-Cap Value Funds category. The Russell 1000 Value Index is a market capitalization-weighted index of those firms in the Russell 1000 Index with lower price-to-book ratios and lower forecasted growth value. The index returns assume reinvestment of dividends and do not reflect any initial or ongoing expenses. You cannot invest directly in an index. The Nuveen Funds’ returns include reinvestment of all dividends and distributions, and the Funds’ return at the offer price depicted in the chart reflects the initial maximum sales charge applicable to A shares (5.75%) and all ongoing Fund expenses. The performance data quoted represents past performance, which is not indicative of future results. Current performance may be lower or higher than the performance shown.
Annual Report Page 11
Nuveen NWQ Small/Mid-Cap Value Fund
Growth of an Assumed $10,000 Investment
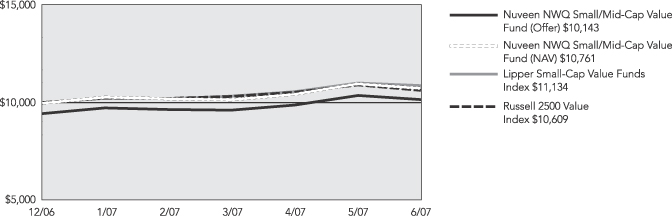
Nuveen NWQ Small-Cap Value Fund
Growth of an Assumed $10,000 Investment
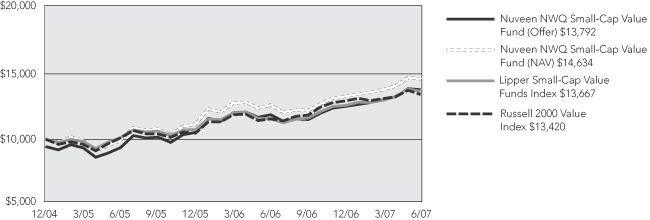
The graphs do not reflect the deduction of taxes that a shareholder may pay on Fund distributions or the redemption of shares.
The index comparisons show the change in value of a $10,000 investment in the Class A shares of the Nuveen Funds compared with the corresponding indexes. The Lipper Small-Cap Value Funds Index is a managed index that represents the average annualized returns of the 30 largest funds in the Lipper Small-Cap Value Funds category. The Russell 2500 Value Index is a market-capitalization weighted index of those firms in the Russell 2500 Index with lower price-to-book ratios and lower forecasted growth values. The Russell 2000 Value Index is a market capitalization-weighted index of those firms in the Russell 2000 Index with lower price-to-book ratios and lower forecasted growth value. The index returns assume reinvestment of dividends and do not reflect any initial or ongoing expenses. You cannot invest directly in an index. The Nuveen Funds’ returns include reinvestment of all dividends and distributions, and the Funds’ return at the offer price depicted in the chart reflects the initial maximum sales charge applicable to A shares (5.75%) and all ongoing Fund expenses. The performance data quoted represents past performance, which is not indicative of future results. Current performance may be lower or higher than the performance shown.
Annual Report Page 12
Nuveen NWQ Global Value Fund
Growth of an Assumed $10,000 Investment
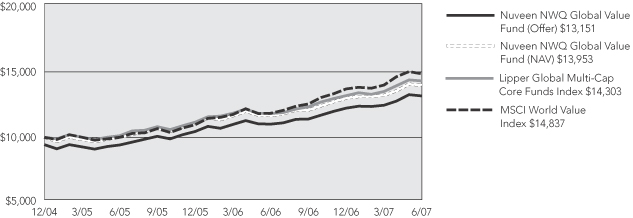
Nuveen Tradewinds Value Opportunities Fund
Growth of an Assumed $10,000 Investment
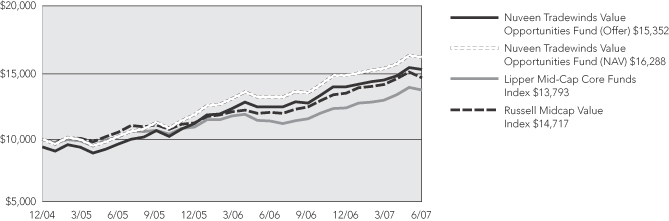
The graphs do not reflect the deduction of taxes that a shareholder may pay on Fund distributions or the redemption of shares.
The index comparisons show the change in value of a $10,000 investment in the Class A shares of the Nuveen Funds compared with the corresponding indexes. The Lipper Global Multi-Cap Core Funds Index is a managed index that represents the average annualized returns of the 30 largest funds in the Lipper Global Multi-Cap Core Funds category. The MSCI World Value Index is a free float-adjusted market capitalization index that is designed to measure global developed market equity performance. The Lipper Mid-Cap Core Funds Index is a managed index that represents the average annualized returns of the 30 largest funds in the Lipper Mid-Cap Core Funds category. The Russell Midcap Value Index measures the performance of those Russell Midcap companies with lower price-to-book ratios and lower forecasted growth values. The stocks are also members of the Russell 1000 Value Index. The index returns assume reinvestment of dividends and do not reflect any initial or ongoing expenses. You cannot invest directly in an index. The Nuveen Funds’ returns include reinvestment of all dividends and distributions, and the Funds’ return at the offer price depicted in the chart reflects the initial maximum sales charge applicable to A shares (5.75%) and all ongoing Fund expenses. The performance data quoted represents past performance, which is not indicative of future results. Current performance may be lower or higher than the performance shown.
Annual Report Page 13
Fund Spotlight as of 6/30/07Nuveen NWQ Multi-Cap Value Fund
| | | | | | | | |
| Quick Facts | | | | | | | | |
| | | A Shares | | B Shares | | C Shares | | R Shares |
NAV | | $26.15 | | $25.64 | | $25.64 | | $26.09 |
Latest Capital Gain Distribution1 | | $0.6352 | | $0.6352 | | $0.6352 | | $0.6352 |
Latest Ordinary Income Distribution2 | | $0.6314 | | $0.5017 | | $0.5017 | | $0.6908 |
Inception Date | | 12/09/02 | | 12/09/02 | | 12/09/02 | | 11/04/97 |
Effective December 6, 2002, based on shareholder approval, the Nuveen NWQ Multi-Cap Value Fund acquired the assets and performance history of the PBHG Special Equity Fund. The Fund had no assets prior to the acquisition. In addition, on December 14, 2001, the PBHG Special Equity Fund acquired the assets of the NWQ Special Equity Portfolio. The information presented for the Nuveen NWQ Multi-Cap Value Fund prior to the acquisition date represents the expense adjusted performance of the predecessor funds.
Returns quoted represent past performance which is no guarantee of future performance. Returns without sales charges would be lower if the sales charge were included. Current performance may be higher or lower than the performance shown. Investment returns and principal value will fluctuate so that when shares are redeemed, they may be worth more or less than their original cost. Returns do not reflect the deduction of taxes that a shareholder would pay on Fund distributions or the redemption of shares. For the most recent month-end performance visit www.nuveen.com or call (800) 257-8787.
Class R total returns are actual and reflect the performance of the predecessor funds. The returns for Class A, B and C shares are actual for the period since class inception; returns prior to class inception are Class R share returns adjusted for differences in sales charges and expenses, which are primarily differences in distribution and service fees. Fund returns assume reinvestment of dividends and capital gains. Class A shares have a 5.75% maximum sales charge. Class B shares have a contingent deferred sales charge (CDSC), also known as a back-end sales charge, that for redemptions begins at 5% and declines periodically until after 6 years when the charge becomes 0%. Class B shares automatically convert to Class A shares eight years after purchase. Class C shares have a 1% CDSC for redemptions within less than one year, which is not reflected in the one-year total return. Class R shares have no sales charge and may be purchased under limited circumstances or by specified classes of investors. Returns may reflect a voluntary expense limitation by the Fund’s investment adviser which may be modified or discontinued at any time without notice.
| | | | |
| Average Annual Total Returns as of 6/30/07 |
| | |
| A Shares | | NAV | | Offer |
1-Year | | 15.51% | | 8.88% |
5-Year | | 17.41% | | 16.03% |
Since Inception | | 13.49% | | 12.80% |
| | |
| B Shares | | w/o CDSC | | w/CDSC |
1-Year | | 14.65% | | 10.65% |
5-Year | | 16.53% | | 16.42% |
Since Inception | | 12.78% | | 12.78% |
| | |
| C Shares | | NAV | | |
1-Year | | 14.64% | | |
5-Year | | 16.53% | | |
Since Inception | | 12.64% | | |
| | |
| R Shares | | NAV | | |
1-Year | | 15.77% | | |
5-Year | | 17.71% | | |
Since Inception | | 13.78% | | |
| | |
| Top Five Common Stock Holdings3 |
CA Inc. | | 6.8% |
Noble Energy, Inc. | | 4.6% |
Viacom Inc., Class B | | 4.2% |
Fannie Mae | | 4.1% |
Hartford Financial Services Group, Inc. | | 3.6% |
Portfolio Allocation3
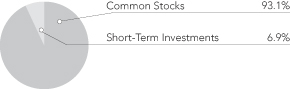
| | |
| Portfolio Statistics |
Net Assets ($000) | | $1,500,608 |
Average Market Capitalization (Common Stocks) | | $30 billion |
Number of Common Stocks | | 51 |
| | | | | | |
| Expense Ratios | | | | | | |
| | | |
| Share Class | | Gross
Expense
Ratio | | Net
Expense
Ratio | | As of
Date |
Class A | | 1.33% | | 1.33% | | 6/30/06 |
Class B | | 2.08% | | 2.08% | | 6/30/06 |
Class C | | 2.08% | | 2.08% | | 6/30/06 |
Class R | | 1.09% | | 1.09% | | 6/30/06 |
The expense ratios shown factor in Total Annual Fund Operating Expenses including management fees and other fees and expenses.
| 2 | Ordinary income distribution consists of short-term capital gains paid on December 18, 2006, and ordinary income paid on December 29, 2006, if any. |
| 3 | As a percentage of total investments as of June 30, 2007. Holdings are subject to change. |
Annual Report Page 14
Fund Spotlight as of 6/30/07 Nuveen NWQ Multi-Cap Value Fund
Industries1
| | |
Thrifts & Mortgage Finance | | 12.5% |
Insurance | | 11.4% |
Oil, Gas & Consumable Fuels | | 10.9% |
Media | | 10.5% |
Software | | 6.8% |
Communications Equipment | | 4.6% |
Aerospace & Defense | | 4.3% |
Metals & Mining | | 4.2% |
Consumer Finance | | 3.4% |
Paper & Forest Products | | 2.5% |
Tobacco | | 2.4% |
Real Estate | | 2.4% |
Capital Markets | | 1.9% |
Independent Power Producers & Energy Traders | | 1.8% |
Short-Term Investments | | 6.9% |
Other | | 13.5% |
| 1 | As a percentage of total investments as of June 30, 2007. Holdings are subject to change. |
Expense Example
As a shareholder of the Fund, you incur two types of costs: (1) transaction costs, including front and back end sales charges (loads) or redemption fees, where applicable; and (2) ongoing costs, including management fees; distribution and service (12b-1) fees, where applicable; and other Fund expenses. This Example is intended to help you understand your ongoing costs (in dollars) of investing in the Fund and to compare these costs with the ongoing costs of investing in other mutual funds.
The Example below is based on an investment of $1,000 invested at the beginning of the period and held for the period.
The information under “Actual Performance,” together with the amount you invested, allows you to estimate actual expenses incurred over the reporting period. Simply divide your account value by $1,000 (for example, an $8,600 account value divided by $1,000 = 8.60) and multiply the result by the cost shown for your share class, in the row entitled “Expenses Incurred During Period” to estimate the expenses incurred on your account during this period.
The information under “Hypothetical Performance,” provides information about hypothetical account values and hypothetical expenses based on the Fund’s actual expense ratio and an assumed rate of return of 5% per year before expenses, which is not the Fund’s actual return. The hypothetical account values and expenses may not be used to estimate the actual ending account balance or expense you incurred for the period. You may use this information to compare the ongoing costs of investing in the Fund and other Funds. To do so, compare this 5% hypothetical example with the 5% hypothetical examples that appear in the shareholder reports of the other funds.
Please note that the expenses shown in the table are meant to highlight your ongoing costs only and do not reflect any transactional costs, such as front and back end sales charges (loads) or redemption fees, where applicable. Therefore, the hypothetical information is useful in comparing ongoing costs only, and will not help you determine the relative total costs of owning different funds or share classes. In addition, if these transactional costs were included, your costs would have been higher.
| | | | | | | | | | | | | | | | | | | | | | | | | | |
| | | Actual Performance | | | | Hypothetical Performance
(5% return before expenses) |
| | | | | | | | | |
| | | A Shares | | B Shares | | C Shares | | R Shares | | | | A Shares | | B Shares | | C Shares | | R Shares |
Beginning Account Value (1/01/07) | | $ | 1,000.00 | | $ | 1,000.00 | | $ | 1,000.00 | | $ | 1,000.00 | | | | $ | 1,000.00 | | $ | 1,000.00 | | $ | 1,000.00 | | $ | 1,000.00 |
Ending Account Value (6/30/07) | | $ | 1,063.00 | | $ | 1,059.10 | | $ | 1,059.10 | | $ | 1,064.50 | | | | $ | 1,018.60 | | $ | 1,014.83 | | $ | 1,014.83 | | $ | 1,019.84 |
Expenses Incurred During Period | | $ | 6.39 | | $ | 10.26 | | $ | 10.26 | | $ | 5.12 | | | | $ | 6.26 | | $ | 10.04 | | $ | 10.04 | | $ | 5.01 |
For each class of the Fund, expenses are equal to the Fund’s annualized expense ratio of 1.25%, 2.01%, 2.01% and 1.00% for Classes A, B, C and R, respectively, multiplied by the average account value over the period, multiplied by 181/365 (to reflect the one-half year period).
Annual Report Page 15
Fund Spotlight as of 6/30/07 Nuveen NWQ Large-Cap Value Fund
| | | | | | | | |
| Quick Facts | | | | | | | | |
| | | A Shares | | B Shares | | C Shares | | R Shares |
NAV | | $21.38 | | $21.30 | | $21.30 | | $21.41 |
Inception Date | | 12/15/06 | | 12/15/06 | | 12/15/06 | | 12/15/06 |
Returns quoted represent past performance which is no guarantee of future performance. Returns without sales charges would be lower if the sales charge were included. Current performance may be higher or lower than the performance shown. Investment returns and principal value will fluctuate so that when shares are redeemed, they may be worth more or less than their original cost. Returns do not reflect the deduction of taxes that a shareholder would pay on Fund distributions or the redemption of shares. For the most recent month-end performance visit www.nuveen.com or call (800) 257-8787.
Fund returns assume reinvestment of dividends and capital gains. Class A shares have a 5.75% maximum sales charge. Class B shares have a contingent deferred sales charge (CDSC), also known as a back-end sales charge, that for redemptions begins at 5% and declines periodically until after 6 years when the charge becomes 0%. Class B shares automatically convert to Class A shares eight years after purchase. Class C shares have a 1% CDSC for redemptions within less than one year, which is not reflected in the one-year total return. Class R shares have no sales charge and may be purchased under limited circumstances or by specified classes of investors. Returns reflect a voluntary expense limitation by the Fund’s investment adviser which may be modified or discontinued at any time without notice.
| | | | |
| Cumulative Total Returns as of 6/30/07 |
| | |
| A Shares | | NAV | | Offer |
Since Inception | | 6.90% | | 0.75% |
| | |
| B Shares | | w/o CDSC | | w/CDSC |
Since Inception | | 6.50% | | 1.50% |
| | |
| C Shares | | NAV | | w/CDSC |
Since Inception | | 6.50% | | 5.50% |
| | |
| R Shares | | NAV | | |
Since Inception | | 7.05% | | |
| | |
| Top Five Common Stock Holdings1 |
| | |
CA Inc. | | 5.3% |
Viacom Inc., Class B | | 4.2% |
Citigroup Inc. | | 4.1% |
Hartford Financial Services Group Inc. | | 3.8% |
Apache Corporation | | 3.7% |
Portfolio Allocation1
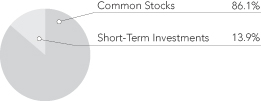
| | |
| Portfolio Statistics |
Net Assets ($000) | | $12,269 |
Average Market Capitalization (Common Stocks) | | $63 billion |
Number of Common Stocks | | 41 |
| | | | | | |
| Expense Ratios | | | | | | |
| | | |
| Share Class | | Gross
Expense
Ratio | | Net
Expense
Ratio | | As of
Date |
Class A | | 1.44% | | 1.35% | | 12/31/06 |
Class B | | 2.19% | | 2.10% | | 12/31/06 |
Class C | | 2.19% | | 2.10% | | 12/31/06 |
Class R | | 1.19% | | 1.10% | | 12/31/06 |
The net expense ratios are estimated for the first full fiscal year and reflect a contractual commitment by the fund’s investment adviser to waive fees and reimburse expenses through October 31, 2010. Absent the waiver and reimbursement, expenses would be higher and total returns would be less.
| 1 | As a percentage of total investments as of June 30, 2007. Holdings are subject to change. |
Annual Report Page 16
Fund Spotlight as of 6/30/07 Nuveen NWQ Large-Cap Value Fund
| | |
| Industries1 |
Insurance | | 12.5% |
Oil, Gas & Consumable Fuels | | 10.1% |
Media | | 9.7% |
Thrifts & Mortgage Finance | | 8.4% |
Software | | 7.5% |
Commercial Banks | | 4.6% |
Diversified Financial Services | | 4.1% |
Metals & Mining | | 3.4% |
Commercial Services & Supplies | | 3.2% |
Diversified Telecommunication Services | | 3.0% |
Aerospace & Defense | | 2.9% |
Communications Equipment | | 2.9% |
Short-Term Investments | | 13.9% |
Other | | 13.8% |
| 1 | As a percentage of total investments as of June 30, 2007. Holdings are subject to change. |
Expense Example
As a shareholder of the Fund, you incur two types of costs: (1) transaction costs, including front and back end sales charges (loads) or redemption fees, where applicable; and (2) ongoing costs, including management fees; distribution and service (12b-1) fees, where applicable; and other Fund expenses. This Example is intended to help you understand your ongoing costs (in dollars) of investing in the Fund and to compare these costs with the ongoing costs of investing in other mutual funds.
The Example below is based on an investment of $1,000 invested at the beginning of the period and held for the period.
The information under “Actual Performance,” together with the amount you invested, allows you to estimate actual expenses incurred over the reporting period. Simply divide your account value by $1,000 (for example, an $8,600 account value divided by $1,000 = 8.60) and multiply the result by the cost shown for your share class, in the row entitled “Expenses Incurred During Period” to estimate the expenses incurred on your account during this period.
The information under “Hypothetical Performance,” provides information about hypothetical account values and hypothetical expenses based on the Fund’s actual expense ratio and an assumed rate of return of 5% per year before expenses, which is not the Fund’s actual return. The hypothetical account values and expenses may not be used to estimate the actual ending account balance or expense you incurred for the period. You may use this information to compare the ongoing costs of investing in the Fund and other Funds. To do so, compare this 5% hypothetical example with the 5% hypothetical examples that appear in the shareholder reports of the other funds.
Please note that the expenses shown in the table are meant to highlight your ongoing costs only and do not reflect any transactional costs, such as front and back end sales charges (loads) or redemption fees, where applicable. Therefore, the hypothetical information is useful in comparing ongoing costs only, and will not help you determine the relative total costs of owning different funds or share classes. In addition, if these transactional costs were included, your costs would have been higher.
| | | | | | | | | | | | | | | | | | | | | | | | | | |
| | | Actual Performance | | | | Hypothetical Performance
(5% return before expenses) |
| | | | | | | | | |
| | | A Shares | | B Shares | | C Shares | | R Shares | | | | A Shares | | B Shares | | C Shares | | R Shares |
Beginning Account Value (1/01/07) | | $ | 1,000.00 | | $ | 1,000.00 | | $ | 1,000.00 | | $ | 1,000.00 | | | | $ | 1,000.00 | | $ | 1,000.00 | | $ | 1,000.00 | | $ | 1,000.00 |
Ending Account Value (6/30/07) | | $ | 1,066.90 | | $ | 1,063.40 | | $ | 1,063.40 | | $ | 1,068.40 | | | | $ | 1,018.60 | | $ | 1,014.73 | | $ | 1,014.88 | | $ | 1,019.84 |
Expenses Incurred During Period | | $ | 6.41 | | $ | 10.39 | | $ | 10.23 | | $ | 5.13 | | | | $ | 6.26 | | $ | 10.14 | | $ | 9.99 | | $ | 5.01 |
For each class of the Fund, expenses are equal to the Fund’s annualized expense ratio of 1.25%, 2.03%, 2.00% and 1.00% for Classes A, B, C and R, respectively, multiplied by the average account value over the period, multiplied by 181/365 (to reflect the one-half year period).
Annual Report Page 17
Fund Spotlight as of 6/30/07 Nuveen NWQ Small/Mid-Cap Value Fund
| | | | | | | | |
| Quick Facts | | | | | | | | |
| | | A Shares | | B Shares | | C Shares | | R Shares |
NAV | | $21.37 | | $21.29 | | $21.28 | | $21.41 |
Inception Date | | 12/15/06 | | 12/15/06 | | 12/15/06 | | 12/15/06 |
Returns quoted represent past performance which is no guarantee of future performance. Returns without sales charges would be lower if the sales charge were included. Current performance may be higher or lower than the performance shown. Investment returns and principal value will fluctuate so that when shares are redeemed, they may be worth more or less than their original cost. Returns do not reflect the deduction of taxes that a shareholder would pay on Fund distributions or the redemption of shares. For the most recent month-end performance visit www.nuveen.com or call (800) 257-8787.
Fund returns assume reinvestment of dividends and capital gains. Class A shares have a 5.75% maximum sales charge. Class B shares have a contingent deferred sales charge (CDSC), also known as a back-end sales charge, that for redemptions begins at 5% and declines periodically until after 6 years when the charge becomes 0%. Class B shares automatically convert to Class A shares eight years after purchase. Class C shares have a 1% CDSC for redemptions within less than one year, which is not reflected in the one-year total return. Class R shares have no sales charge and may be purchased under limited circumstances or by specified classes of investors. Returns reflect a voluntary expense limitation by the Fund’s investment adviser which may be modified or discontinued at any time without notice.
| | | | |
| Cumulative Total Returns as of 6/30/07 |
| | |
| A Shares | | NAV | | Offer |
Since Inception | | 6.85% | | 0.71% |
| | |
| B Shares | | w/o CDSC | | w/CDSC |
Since Inception | | 6.45% | | 1.45% |
| | |
| C Shares | | NAV | | w/CDSC |
Since Inception | | 6.40% | | 5.40% |
| | |
| R Shares | | NAV | | |
Since Inception | | 7.05% | | |
| | |
| Top Five Common Stock Holdings1 |
Griffon Corporation | | 4.0% |
Kennametal Inc. | | 3.7% |
Del Monte Foods Company | | 3.1% |
Hanover Insurance Group Inc. | | 3.1% |
Newell Rubbermaid Inc. | | 3.1% |
Portfolio Allocation1
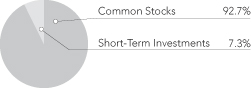
| | |
| Portfolio Statistics |
Net Assets ($000) | | $219,223 |
Average Market Capitalization (Common Stocks) | | $3 billion |
Number of Common Stocks | | 46 |
| | | | | | |
| Expense Ratios | | | | | | |
| | | |
| Share Class | | Gross
Expense
Ratio | | Net
Expense
Ratio | | As of
Date |
Class A | | 1.59% | | 1.45% | | 12/31/06 |
Class B | | 2.34% | | 2.20% | | 12/31/06 |
Class C | | 2.34% | | 2.20% | | 12/31/06 |
Class R | | 1.34% | | 1.20% | | 12/31/06 |
The net expense ratios are estimated for the first full fiscal year and reflect a contractual commitment by the fund’s investment adviser to waive fees and reimburse expenses through October 31, 2010. Absent the waiver and reimbursement, expenses would be higher and total returns would be less.
| 1 | As a percentage of total investments as of June 30, 2007. Holdings are subject to change. |
Annual Report Page 18
Fund Spotlight as of 6/30/07 Nuveen NWQ Small/Mid-Cap Value Fund
| | |
| Industries1 |
Oil, Gas & Consumable Fuels | | 11.7% |
Machinery | | 9.6% |
Electronic Equipment & Instruments | | 9.0% |
Real Estate | | 8.5% |
Paper & Forest Products | | 7.6% |
Metals & Mining | | 6.8% |
Chemicals | | 5.5% |
Insurance | | 5.4% |
Building Products | | 3.9% |
Containers & Packaging | | 3.7% |
Food Products | | 3.6% |
Household Durables | | 3.1% |
Short-Term Investments | | 7.3% |
Other | | 14.3% |
| 1 | As a percentage of total investments as of June 30, 2007. Holdings are subject to change. |
Expense Example
As a shareholder of the Fund, you incur two types of costs: (1) transaction costs, including front and back end sales charges (loads) or redemption fees, where applicable; and (2) ongoing costs, including management fees; distribution and service (12b-1) fees, where applicable; and other Fund expenses. This Example is intended to help you understand your ongoing costs (in dollars) of investing in the Fund and to compare these costs with the ongoing costs of investing in other mutual funds.
The Example below is based on an investment of $1,000 invested at the beginning of the period and held for the period.
The information under “Actual Performance,” together with the amount you invested, allows you to estimate actual expenses incurred over the reporting period. Simply divide your account value by $1,000 (for example, an $8,600 account value divided by $1,000 = 8.60) and multiply the result by the cost shown for your share class, in the row entitled “Expenses Incurred During Period” to estimate the expenses incurred on your account during this period.
The information under “Hypothetical Performance,” provides information about hypothetical account values and hypothetical expenses based on the Fund’s actual expense ratio and an assumed rate of return of 5% per year before expenses, which is not the Fund’s actual return. The hypothetical account values and expenses may not be used to estimate the actual ending account balance or expense you incurred for the period. You may use this information to compare the ongoing costs of investing in the Fund and other Funds. To do so, compare this 5% hypothetical example with the 5% hypothetical examples that appear in the shareholder reports of the other funds.
Please note that the expenses shown in the table are meant to highlight your ongoing costs only and do not reflect any transactional costs, such as front and back end sales charges (loads) or redemption fees, where applicable. Therefore, the hypothetical information is useful in comparing ongoing costs only, and will not help you determine the relative total costs of owning different funds or share classes. In addition, if these transactional costs were included, your costs would have been higher.
| | | | | | | | | | | | | | | | | | | | | | | | | | |
| | | Actual Performance | | | | Hypothetical Performance
(5% return before expenses) |
| | | | | | | | | |
| | | A Shares | | B Shares | | C Shares | | R Shares | | | | A Shares | | B Shares | | C Shares | | R Shares |
Beginning Account Value (1/01/07) | | $ | 1,000.00 | | $ | 1,000.00 | | $ | 1,000.00 | | $ | 1,000.00 | | | | $ | 1,000.00 | | $ | 1,000.00 | | $ | 1,000.00 | | $ | 1,000.00 |
Ending Account Value (6/30/07) | |
$ |
1,076.00 | |
$ |
1,072.50 | |
$ |
1,072.00 | |
$ |
1,078.00 | | | |
$ |
1,017.80 | |
$ |
1,013.88 | |
$ |
1,014.03 | |
$ |
1,019.09 |
Expenses Incurred During Period | |
$ |
7.26 | |
$ |
11.31 | |
$ |
11.15 | |
$ |
5.93 | | | |
$ |
7.05 | |
$ |
10.99 | |
$ |
10.84 | |
$ |
5.76 |
For each class of the Fund, expenses are equal to the Fund’s annualized expense ratio of 1.41%, 2.20%, 2.17% and 1.15% for Classes A, B, C and R, respectively, multiplied by the average account value over the period, multiplied by 181/365 (to reflect the one-half year period).
Annual Report Page 19
Fund Spotlight as of 6/30/07 Nuveen NWQ Small-Cap Value Fund
| | | | | | | | |
| Quick Facts | | | | | | | | |
| | | A Shares | | B Shares | | C Shares | | R Shares |
NAV | |
$30.12 | |
$29.69 | |
$29.73 | |
$30.18 |
Latest Capital Gain Distribution1 | |
$0.0161 | |
$0.0161 | |
$0.0161 | |
$0.0161 |
Latest Ordinary Income Distribution2 | | $0.1448 | | $0.1027 | | $0.1027 | | $0.2091 |
Inception Date | |
12/09/04 | |
12/09/04 | |
12/09/04 | |
12/09/04 |
Returns quoted represent past performance which is no guarantee of future performance. Returns without sales charges would be lower if the sales charge were included. Current performance may be higher or lower than the performance shown. Investment returns and principal value will fluctuate so that when shares are redeemed, they may be worth more or less than their original cost. Returns do not reflect the deduction of taxes that a shareholder would pay on Fund distributions or the redemption of shares. For the most recent month-end performance visit www.nuveen.com or call (800) 257-8787.
Fund returns assume reinvestment of dividends and capital gains, if any. Class A shares have a 5.75% maximum sales charge. Class B shares have a contingent deferred sales charge (CDSC), also known as a back-end sales charge, that for redemptions begins at 5% and declines periodically until after 6 years when the charge becomes 0%. Class B shares automatically convert to Class A shares eight years after purchase. Class C shares have a 1% CDSC for redemptions within less than one year, which is not reflected in the one-year total return. Class R shares have no sales charge and may be purchased under limited circumstances or by specified classes of investors. Returns reflect a voluntary expense limitation by the Fund’s investment adviser which may be modified or discontinued at any time without notice.
| | | | |
| Average Annual Total Returns as of 6/30/07 |
| | |
| A Shares | | NAV | | Offer |
1-Year | |
16.09% | |
9.42% |
Since Inception | |
18.28% | |
15.57% |
| | |
| B Shares | | w/o CDSC | | w/CDSC |
1-Year | |
15.15% | |
11.15% |
Since Inception | |
17.39% | |
16.17% |
| | |
| C Shares | | NAV | | |
1-Year | |
15.26% | | |
Since Inception | |
17.45% | | |
| | |
| R Shares | | NAV | | |
1-Year | |
16.41% | | |
Since Inception | |
18.59% | | |
| Top Five Common Stock Holdings3 |
Kennametal Inc. | | 4.3% |
Griffon Corporation | | 3.8% |
Lincoln Electric Holdings Inc. | | 3.7% |
CommScope Inc. | | 3.6% |
Del Monte Foods Company | | 3.1% |
Portfolio Allocation3
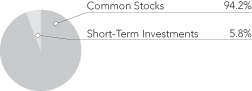
| | |
| Portfolio Statistics |
Net Assets ($000) | | $228,589 |
Average Market Capitalization (Common Stocks) | | $2 billion |
Number of Common Stocks | |
45 |
| | | | | | |
| Expense Ratios | | | | | | |
| | | |
| Share Class | | Gross
Expense
Ratio | | Net
Expense
Ratio | | As of
Date |
Class A | | 1.95% | | 1.40% | | 6/30/06 |
Class B | | 2.75% | | 2.14% | | 6/30/06 |
Class C | | 2.73% | | 2.15% | | 6/30/06 |
Class R | | 1.73% | | 1.15% | | 6/30/06 |
The net expense ratio reflects a contractual commitment by the fund’s investment adviser to waive fees and reimburse expenses through July 31, 2009. The net ratio also reflects a custodian fee credit from the custodian bank whereby certain fees and expenses are reduced by credits earned on the fund’s cash on deposit with the bank. There is no guarantee that the fund will earn such credits in the future. Absent the waiver, reimbursement and credit, expenses would be higher and total returns would be less.
| 2 | Ordinary income distribution consists of short-term capital gains paid on December 18, 2006, and ordinary income paid on December 29, 2006, if any. |
| 3 | As a percentage of total investments as of June 30, 2007. Holdings are subject to change. |
Annual Report Page 20
Fund Spotlight as of 6/30/07 Nuveen NWQ Small-Cap Value Fund
Industries1
| | |
Paper & Forest Products | | 13.0% |
Machinery | | 12.5% |
Oil, Gas & Consumable Fuels | | 11.6% |
Real Estate | | 7.2% |
Food Products | | 4.7% |
Electronic Equipment & Instruments | | 3.9% |
Building Products | | 3.8% |
Thrifts & Mortgage Finance | | 3.7% |
Electrical Equipment | | 3.7% |
Metals & Mining | | 3.6% |
Communications Equipment | | 3.6% |
Road & Rail | | 3.0% |
Multiline Retail | | 2.8% |
Household Products | | 2.5% |
Short-Term Investments | | 5.8% |
Other | | 14.6% |
| 1 | As a percentage of total investments as of June 30, 2007. Holdings are subject to change. |
Expense Example
As a shareholder of the Fund, you incur two types of costs: (1) transaction costs, including front and back end sales charges (loads) or redemption fees, where applicable; and (2) ongoing costs, including management fees; distribution and service (12b-1) fees, where applicable; and other Fund expenses. This Example is intended to help you understand your ongoing costs (in dollars) of investing in the Fund and to compare these costs with the ongoing costs of investing in other mutual funds.
The Example below is based on an investment of $1,000 invested at the beginning of the period and held for the period.
The information under “Actual Performance,” together with the amount you invested, allows you to estimate actual expenses incurred over the reporting period. Simply divide your account value by $1,000 (for example, an $8,600 account value divided by $1,000 = 8.60) and multiply the result by the cost shown for your share class, in the row entitled “Expenses Incurred During Period” to estimate the expenses incurred on your account during this period.
The information under “Hypothetical Performance,” provides information about hypothetical account values and hypothetical expenses based on the Fund’s actual expense ratio and an assumed rate of return of 5% per year before expenses, which is not the Fund’s actual return. The hypothetical account values and expenses may not be used to estimate the actual ending account balance or expense you incurred for the period. You may use this information to compare the ongoing costs of investing in the Fund and other Funds. To do so, compare this 5% hypothetical example with the 5% hypothetical examples that appear in the shareholder reports of the other funds.
Please note that the expenses shown in the table are meant to highlight your ongoing costs only and do not reflect any transactional costs, such as front and back end sales charges (loads) or redemption fees, where applicable. Therefore, the hypothetical information is useful in comparing ongoing costs only, and will not help you determine the relative total costs of owning different funds or share classes. In addition, if these transactional costs were included, your costs would have been higher.
| | | | | | | | | | | | | | | | | | | | | | | | | | |
| | | | | | | | | | | | | Hypothetical Performance |
| | | Actual Performance | | | | (5% return before expenses) |
| | | A Shares | | B Shares | | C Shares | | R Shares | | | | A Shares | | B Shares | | C Shares | | R Shares |
Beginning Account Value (1/01/07) | | $ | 1,000.00 | | $ | 1,000.00 | | $ | 1,000.00 | | $ | 1,000.00 | | | | $ | 1,000.00 | | $ | 1,000.00 | | $ | 1,000.00 | | $ | 1,000.00 |
Ending Account Value (6/30/07) | | $ | 1,102.90 | | $ | 1,098.40 | | $ | 1,098.70 | | $ | 1,104.70 | | | | $ | 1,017.21 | | $ | 1,013.49 | | $ | 1,013.44 | | $ | 1,018.70 |
Expenses Incurred During Period | | $ | 7.98 | | $ | 11.86 | | $ | 11.92 | | $ | 6.42 | | | | $ | 7.65 | | $ | 11.38 | | $ | 11.43 | | $ | 6.16 |
For each class of the Fund, expenses are equal to the Fund’s annualized expense ratio of 1.53%, 2.28%, 2.29% and 1.23% for Classes A, B, C and R, respectively, multiplied by the average account value over the period, multiplied by 181/365 (to reflect the one-half year period).
Annual Report Page 21
Fund Spotlight as of 6/30/07 Nuveen NWQ Global Value Fund
| | | | | | | | |
| Quick Facts | | | | | | | | |
| | | A Shares | | B Shares | | C Shares | | R Shares |
NAV | | $27.79 | | $27.51 | | $27.53 | | $27.85 |
Latest Capital Gain Distribution1 | | $0.2927 | | $0.2927 | | $0.2927 | | $0.2927 |
Latest Ordinary Income Distribution2 | | $0.5151 | | $0.3363 | | $0.3363 | | $0.5765 |
Inception Date | | 12/09/04 | | 12/09/04 | | 12/09/04 | | 12/09/04 |
Returns quoted represent past performance which is no guarantee of future performance. Returns without sales charges would be lower if the sales charge were included. Current performance may be higher or lower than the performance shown. Investment returns and principal value will fluctuate so that when shares are redeemed, they may be worth more or less than their original cost. Returns do not reflect the deduction of taxes that a shareholder would pay on Fund distributions or the redemption of shares. For the most recent month-end performance visit www.nuveen.com or call (800) 257-8787.
Fund returns assume reinvestment of dividends and capital gains, if any. Class A shares have a 5.75% maximum sales charge. Class B shares have a contingent deferred sales charge (CDSC), also known as a back-end sales charge, that for redemptions begins at 5% and declines periodically until after 6 years when the charge becomes 0%. Class B shares automatically convert to Class A shares eight years after purchase. Class C shares have a 1% CDSC for redemptions within less than one year, which is not reflected in the one-year total return. Class R shares have no sales charge and may be purchased under limited circumstances or by specified classes of investors. Returns reflect a voluntary expense limitation by the Fund’s investment adviser which may be modified or discontinued at any time without notice.
| | | | |
Average Annual Total Returns as of 6/30/07 |
| | |
| A Shares | | NAV | | Offer |
1-Year | | 19.67% | | 12.79% |
Since Inception | | 15.53% | | 12.89% |
| | |
| B Shares | | w/o CDSC | | w/CDSC |
1-Year | | 18.73% | | 14.73% |
Since Inception | | 14.67% | | 13.40% |
| | |
| C Shares | | NAV | | |
1-Year | | 18.76% | | |
Since Inception | | 14.70% | | |
| | |
| R Shares | | NAV | | |
1-Year | | 19.95% | | |
Since Inception | | 15.83% | | |
| Top Five Common Stock Holdings3 | | |
Fannie Mae | | | | 2.6% |
CA Inc. | | | | 2.4% |
Noble Energy, Inc. | | | | 2.1% |
Chunghwa Telecom Co. Ltd., Sponsored ADR | | | | 2.0% |
Telecom Italia S.p.A. | | | | 2.0% |
Portfolio Allocation3
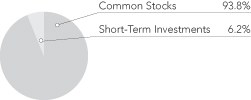
| | |
| Portfolio Statistics |
Net Assets ($000) | | $21,279 |
Average Market Capitalization (Common Stocks) | | $42 billion |
Number of Common Stocks | | 84 |
| | | | | | |
| Expense Ratios | | | | | | |
| | | |
| Share Class | | Gross
Expense
Ratio | | Net
Expense
Ratio | | As of
Date |
Class A | | 2.32% | | 1.61% | | 6/30/06 |
Class B | | 3.12% | | 2.36% | | 6/30/06 |
Class C | | 3.06% | | 2.36% | | 6/30/06 |
Class R | | 2.09% | | 1.36% | | 6/30/06 |
The net expense ratio reflects a contractual commitment by the fund’s investment adviser to waive fees and reimburse expenses through October 31, 2009. The net ratio also reflects a custodian fee credit from the custodian bank whereby certain fees and expenses are reduced by credits earned on the fund’s cash on deposit with the bank. There is no guarantee that the fund will earn such credits in the future. Absent the waiver, reimbursement and credit, expenses would be higher and total returns would be less.
| 2 | Ordinary income distribution consists of short-term capital gains paid on December 18, 2006, and ordinary income paid on December 29, 2006, if any. |
| 3 | As a percentage of total investments as of June 30, 2007. Holdings are subject to change. |
Annual Report Page 22
Fund Spotlight as of 6/30/07 Nuveen NWQ Global Value Fund
| | |
| Country Allocation1 | | |
United States | | 48.4% |
Japan | | 12.8% |
Canada | | 5.5% |
United Kingdom | | 5.2% |
France | | 3.6% |
Australia | | 3.3% |
South Korea | | 3.0% |
South Africa | | 2.7% |
Taiwan | | 2.0% |
Italy | | 2.0% |
Netherlands | | 1.7% |
Germany | | 1.5% |
Brazil | | 1.2% |
Belgium | | 0.9% |
Short-Term Investments | | 6.2% |
| | |
| Industries1 | | |
Metals & Mining | | 13.8% |
Oil, Gas & Consumable Fuels | | 10.1% |
Diversified Telecommunication Services | | 9.9% |
Media | | 7.4% |
Thrifts & Mortgage Finance | | 4.9% |
Insurance | | 4.8% |
Software | | 4.1% |
Commercial Services & Supplies | | 3.1% |
Leisure Equipment & Products | | 2.4% |
Wireless Telecommunication Services | | 2.3% |
Electric Utilities | | 2.1% |
Communications Equipment | | 2.0% |
Machinery | | 1.8% |
Beverages | | 1.8% |
Aerospace & Defense | | 1.7% |
Energy Equipment & Services | | 1.6% |
Diversified Financial Services | | 1.6% |
Capital Markets | | 1.6% |
Commercial Banks | | 1.6% |
Computers & Peripherals | | 1.4% |
Short-Term Investments | | 6.2% |
Other | | 13.8% |
| 1 | As a percentage of total investments as of June 30, 2007. Holdings are subject to change. |
Expense Example
As a shareholder of the Fund, you incur two types of costs: (1) transaction costs, including front and back end sales charges (loads) or redemption fees, where applicable; and (2) ongoing costs, including management fees; distribution and service (12b-1) fees, where applicable; and other Fund expenses. This Example is intended to help you understand your ongoing costs (in dollars) of investing in the Fund and to compare these costs with the ongoing costs of investing in other mutual funds.
The Example below is based on an investment of $1,000 invested at the beginning of the period and held for the period.
The information under “Actual Performance,” together with the amount you invested, allows you to estimate actual expenses incurred over the reporting period. Simply divide your account value by $1,000 (for example, an $8,600 account value divided by $1,000 = 8.60) and multiply the result by the cost shown for your share class, in the row entitled “Expenses Incurred During Period” to estimate the expenses incurred on your account during this period.
The information under “Hypothetical Performance,” provides information about hypothetical account values and hypothetical expenses based on the Fund’s actual expense ratio and an assumed rate of return of 5% per year before expenses, which is not the Fund’s actual return. The hypothetical account values and expenses may not be used to estimate the actual ending account balance or expense you incurred for the period. You may use this information to compare the ongoing costs of investing in the Fund and other Funds. To do so, compare this 5% hypothetical example with the 5% hypothetical examples that appear in the shareholder reports of the other funds.
Please note that the expenses shown in the table are meant to highlight your ongoing costs only and do not reflect any transactional costs, such as front and back end sales charges (loads) or redemption fees, where applicable. Therefore, the hypothetical information is useful in comparing ongoing costs only, and will not help you determine the relative total costs of owning different funds or share classes. In addition, if these transactional costs were included, your costs would have been higher.
| | | | | | | | | | | | | | | | | | | | | | | | | | |
| | | | | | | | | | | | | Hypothetical Performance |
| | | Actual Performance | | | | (5% return before expenses) |
| | | | | | | | | |
| | | A Shares | | B Shares | | C Shares | | R Shares | | | | A Shares | | B Shares | | C Shares | | R Shares |
Beginning Account Value (1/01/07) | | $ | 1,000.00 | | $ | 1,000.00 | | $ | 1,000.00 | | $ | 1,000.00 | | | | $ | 1,000.00 | | $ | 1,000.00 | | $ | 1,000.00 | | $ | 1,000.00 |
Ending Account Value (6/30/07) | | $ | 1,075.90 | | $ | 1,071.70 | | $ | 1,071.60 | | $ | 1,077.00 | | | | $ | 1,016.27 | | $ | 1,012.60 | | $ | 1,012.60 | | $ | 1,017.55 |
Expenses Incurred During Period | | $ | 8.85 | | $ | 12.64 | | $ | 12.64 | | $ | 7.52 | | | | $ | 8.60 | | $ | 12.28 | | $ | 12.28 | | $ | 7.30 |
For each class of the Fund, expenses are equal to the Fund’s annualized expense ratio of 1.72%, 2.46%, 2.46% and 1.46% for Classes A, B, C and R, respectively, multiplied by the average account value over the period, multiplied by 181/365 (to reflect the one-half year period).
Annual Report Page 23
Fund Spotlight as of 6/30/07 Nuveen Tradewinds Value Opportunities Fund
| | | | | | | | |
| Quick Facts | | | | | | | | |
| | | A Shares | | B Shares | | C Shares | | R Shares |
NAV | |
$32.48 | |
$32.15 | |
$32.16 | |
$32.54 |
Latest Capital Gain Distribution1 | | $0.0201 | | $0.0201 | | $0.0201 | | $0.0201 |
Latest Ordinary Income Distribution2 | | $0.5274 | | $0.3227 | | $0.3227 | | $0.5959 |
Inception Date | | 12/09/04 | | 12/09/04 | | 12/09/04 | | 12/09/04 |
Returns quoted represent past performance which is no guarantee of future performance. Returns without sales charges would be lower if the sales charge were included. Current performance may be higher or lower than the performance shown. Investment returns and principal value will fluctuate so that when shares are redeemed, they may be worth more or less than their original cost. Returns do not reflect the deduction of taxes that a shareholder would pay on Fund distributions or the redemption of shares. For the most recent month-end performance visit www.nuveen.com or call (800) 257-8787.
Fund returns assume reinvestment of dividends and capital gains, if any. Class A shares have a 5.75% maximum sales charge. Class B shares have a contingent deferred sales charge (CDSC), also known as a back-end sales charge, that for redemptions begins at 5% and declines periodically until after 6 years when the charge becomes 0%. Class B shares automatically convert to Class A shares eight years after purchase. Class C shares have a 1% CDSC for redemptions within less than one year, which is not reflected in the one-year total return. Class R shares have no sales charge and may be purchased under limited circumstances or by specified classes of investors. Returns reflect a voluntary expense limitation by the Fund’s investment adviser which may be modified or discontinued at any time without notice.
| | | | |
Average Annual Total Returns as of 6/30/07 |
| | |
| A Shares | | NAV | | Offer |
1-Year | |
22.98% | |
15.91% |
Since Inception | |
22.36% | |
19.57% |
| | |
| B Shares | | w/o CDSC | | w/CDSC |
1-Year | |
22.04% | |
18.04% |
Since Inception | |
21.44% | |
20.28% |
| | |
| C Shares | | NAV | | |
1-Year | |
22.04% | | |
Since Inception | |
21.44% | | |
| | |
| R Shares | | NAV | | |
1-Year | |
23.30% | | |
Since Inception | |
22.66% | | |
| Top Five Common Stock Holdings3 | | |
Newmont Mining Corporation | | | | 4.4% |
Apex Silver Mines Limited | | | | 3.6% |
Smithfield Foods, Inc. | | | | 3.4% |
Tyson Foods, Inc., Class A | | | | 2.9% |
AngloGold Ashanti Limited,
Sponsored ADR | | | | 2.4% |
Portfolio Allocation3
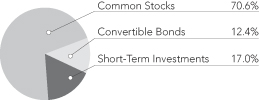
| | |
| Portfolio Statistics |
Net Assets ($000) | |
$515,927 |
Average Market Capitalization (Common Stocks) | |
$7 billion |
Number of Common Stocks | |
67 |
| | | | | | |
| Expense Ratios | | | | | | |
| | | |
| Share Class | | Gross
Expense
Ratio | | Net
Expense
Ratio | | As of
Date |
Class A | | 1.63% | | 1.48% | | 6/30/06 |
Class B | | 2.40% | | 2.23% | | 6/30/06 |
Class C | | 2.40% | | 2.23% | | 6/30/06 |
Class R | | 1.48% | | 1.23% | | 6/30/06 |
The net expense ratio reflects a contractual commitment by the fund’s investment adviser to waive fees and reimburse expenses through July 31, 2009. The net ratio also reflects a custodian fee credit from the custodian bank whereby certain fees and expenses are reduced by credits earned on the fund’s cash on deposit with the bank. There is no guarantee that the fund will earn such credits in the future. Absent the waiver, reimbursement and credit, expenses would be higher and total returns would be less.
| 2 | Ordinary income distribution consists of short-term capital gains paid on December 18, 2006, and ordinary income paid on December 29, 2006, if any. |
| 3 | As a percentage of total investments as of June 30, 2007. Holdings are subject to change. |
Annual Report Page 24
Fund Spotlight as of 6/30/07 Nuveen Tradewinds Value Opportunities Fund
| | |
| Country Allocation1 | | |
United States | | 54.7% |
Canada | | 7.1% |
Japan | | 5.9% |
South Africa | | 4.0% |
Australia | | 3.7% |
South Korea | | 2.2% |
Taiwan | | 1.8% |
Brazil | | 1.5% |
United Kingdom | | 1.2% |
France | | 0.9% |
Short-Term Investments | | 17.0% |
| | |
| Industries1 | | |
Metals & Mining | | 24.8% |
Electric Utilities | | 7.2% |
Food Products | | 6.5% |
Machinery | | 4.6% |
Commercial Services & Supplies | | 4.1% |
Oil, Gas & Consumable Fuels | | 4.0% |
Energy Equipment & Services | | 3.3% |
Paper & Forest Products | | 3.2% |
Electronic Equipment & Instruments | | 2.9% |
Diversified Telecommunication Services | | 2.4% |
Consumer Finance | | 2.0% |
Household Products | | 1.6% |
Food & Staples Retailing | | 1.4% |
Multi-Utilities | | 1.4% |
Short-Term Investments | | 17.0% |
Other | | 13.6% |
| 1 | As a percentage of total investments as of June 30, 2007. Holdings are subject to change. |
Expense Example
As a shareholder of the Fund, you incur two types of costs: (1) transaction costs, including front and back end sales charges (loads) or redemption fees, where applicable; and (2) ongoing costs, including management fees; distribution and service (12b-1) fees, where applicable; and other Fund expenses. This Example is intended to help you understand your ongoing costs (in dollars) of investing in the Fund and to compare these costs with the ongoing costs of investing in other mutual funds.
The Example below is based on an investment of $1,000 invested at the beginning of the period and held for the period.
The information under “Actual Performance,” together with the amount you invested, allows you to estimate actual expenses incurred over the reporting period. Simply divide your account value by $1,000 (for example, an $8,600 account value divided by $1,000 = 8.60) and multiply the result by the cost shown for your share class, in the row entitled “Expenses Incurred During Period” to estimate the expenses incurred on your account during this period.
The information under “Hypothetical Performance,” provides information about hypothetical account values and hypothetical expenses based on the Fund’s actual expense ratio and an assumed rate of return of 5% per year before expenses, which is not the Fund’s actual return. The hypothetical account values and expenses may not be used to estimate the actual ending account balance or expense you incurred for the period. You may use this information to compare the ongoing costs of investing in the Fund and other Funds. To do so, compare this 5% hypothetical example with the 5% hypothetical examples that appear in the shareholder reports of the other funds.
Please note that the expenses shown in the table are meant to highlight your ongoing costs only and do not reflect any transactional costs, such as front and back end sales charges (loads) or redemption fees, where applicable. Therefore, the hypothetical information is useful in comparing ongoing costs only, and will not help you determine the relative total costs of owning different funds or share classes. In addition, if these transactional costs were included, your costs would have been higher.
| | | | | | | | | | | | | | | | | | | | | | | | | | |
| | | | | | | | | | | | | Hypothetical Performance |
| | | Actual Performance | | | | (5% return before expenses) |
| | | | | | | | | |
| | | A Shares | | B Shares | | C Shares | | R Shares | | | | A Shares | | B Shares | | C Shares | | R Shares |
Beginning Account Value (1/01/07) | | $ | 1,000.00 | | $ | 1,000.00 | | $ | 1,000.00 | | $ | 1,000.00 | | | | $ | 1,000.00 | | $ | 1,000.00 | | $ | 1,000.00 | | $ | 1,000.00 |
Ending Account Value (6/30/07) | | $ | 1,094.70 | | $ | 1,090.50 | | $ | 1,090.50 | | $ | 1,096.00 | | | | $ | 1,017.75 | | $ | 1,014.08 | | $ | 1,014.08 | | $ | 1,019.04 |
Expenses Incurred During Period | | $ | 7.38 | | $ | 11.20 | | $ | 11.20 | | $ | 6.03 | | | | $ | 7.10 | | $ | 10.79 | | $ | 10.79 | | $ | 5.81 |
For each class of the Fund, expenses are equal to the Fund’s annualized expense ratio of 1.42%, 2.16%, 2.16% and 1.16% for Classes A, B, C and R, respectively, multiplied by the average account value over the period, multiplied by 181/365 (to reflect the one-half year period).
Annual Report Page 25
Portfolio of Investments
Nuveen NWQ Multi-Cap Value Fund
June 30, 2007
| | | | | |
| Shares | | Description | | Value |
| | | | | |
| | COMMON STOCKS – 93.1% | | | |
| | |
| | Aerospace & Defense – 4.3% | | | |
| | |
| 1,123,600 | | Aeroflex Incorporated, (1) | | $ | 15,921,412 |
| | |
| 253,200 | | Lockheed Martin Corporation | | | 23,833,716 |
| | |
| 450,000 | | Raytheon Company | | | 24,250,500 |
| | Total Aerospace & Defense | | | 64,005,628 |
| | |
| | Biotechnology – 1.6% | | | |
| | |
| 421,600 | | Amgen Inc., (1) | | | 23,310,264 |
| | Capital Markets – 1.9% | | | |
| | |
| 600,000 | | JPMorgan Chase & Co. | | | 29,070,000 |
| | Commercial Banks – 0.7% | | | |
| | |
| 200,000 | | Wachovia Corporation | | | 10,250,000 |
| | Commercial Services & Supplies – 1.7% | | | |
| | |
| 550,000 | | Pitney Bowes Inc. | | | 25,751,000 |
| | Communications Equipment – 4.6% | | | |
| | |
| 2,692,700 | | ECI Telecommunications Limited, (1) | | | 24,638,205 |
| | |
| 2,513,900 | | Motorola, Inc. | | | 44,496,030 |
| | Total Communications Equipment | | | 69,134,235 |
| | |
| | Computers & Peripherals – 0.6% | | | |
| | |
| 2,200,000 | | Quantum Corporation, (1) | | | 6,974,000 |
| | Consumer Finance – 3.4% | | | |
| | |
| 1,900,000 | | Americredit Corp., (1) | | | 50,445,000 |
| | Containers & Packaging – 1.1% | | | |
| | |
| 631,100 | | Packaging Corp. of America | | | 15,973,141 |
| | Diversified Financial Services – 1.4% | | | |
| | |
| 400,000 | | Citigroup Inc. | | | 20,516,000 |
| | Diversified Telecommunication Services – 1.5% | | | |
| | |
| 1,100,000 | | Sprint Nextel Corporation | | | 22,781,000 |
| | Electronic Equipment & Instruments – 1.5% | | | |
| | |
| 599,152 | | Agilent Technologies, Inc., (1) | | | 23,031,403 |
| | Food Products – 1.0% | | | |
| | |
| 675,400 | | Tyson Foods, Inc., Class A | | | 15,561,216 |
| | Health Care Providers & Services – 1.0% | | | |
| | |
| 308,500 | | Aetna Inc. | | | 15,239,900 |
| | Independent Power Producers & Energy Traders – 1.8% | | | |
| | |
| 648,200 | | NRG Energy Inc., (1) | | | 26,945,674 |
| | Insurance – 11.3% | | | |
| | |
| 889,800 | | Aon Corporation | | | 37,914,378 |
| | |
| 600,000 | | Genworth Financial Inc., Class A | | | 20,640,000 |
| | |
| 545,000 | | Hartford Financial Services Group, Inc. | | | 53,687,950 |
| | |
| 637,200 | | Loews Corporation | | | 32,484,456 |
| | |
| 450,000 | | MGIC Investment Corporation | | | 25,587,000 |
| | Total Insurance | | | 170,313,784 |
| | |
26
| | | | | |
| Shares | | Description | | Value |
| | | | | |
| | Machinery – 1.0% | | | |
| | |
| 6,000 | | Illinois Tool Works Inc. | | $ | 325,140 |
| | |
| 275,000 | | Ingersoll Rand Company Limited, Class A | | | 15,075,500 |
| | Total Machinery | | | 15,400,640 |
| | |
| | Media – 10.5% | | | |
| | |
| 675,000 | | CBS Corporation, Class B | | | 22,491,000 |
| | |
| 755,700 | | Clear Channel Communications, Inc. | | | 28,580,574 |
| | |
| 977,100 | | Comcast Corporation, Special Class A, (1) | | | 27,319,716 |
| | |
| 73,751 | | Liberty Media Holding Corporation Capital, Class A, (1) | | | 8,679,018 |
| | |
| 368,758 | | Liberty Media Holding Corporation Interactive, Class A, (1) | | | 8,234,366 |
| | |
| 1,500,000 | | Viacom Inc., Class B, (1) | | | 62,445,000 |
| | Total Media | | | 157,749,674 |
| | |
| | Metals & Mining – 4.1% | | | |
| | |
| 1,100,000 | | Barrick Gold Corporation | | | 31,977,000 |
| | |
| 128,900 | | POSCO, ADR | | | 15,468,000 |
| | |
| 136,200 | | United States Steel Corporation | | | 14,811,750 |
| | Total Metals & Mining | | | 62,256,750 |
| | |
| | Oil, Gas & Consumable Fuels – 10.9% | | | |
| | |
| 586,800 | | Apache Corporation | | | 47,877,012 |
| | |
| 254,300 | | Hess Corporation | | | 14,993,528 |
| | |
| 1,094,800 | | Noble Energy, Inc. | | | 68,304,572 |
| | |
| 469,000 | | Southwestern Energy Company, (1) | | | 20,870,500 |
| | |
| 988,800 | | Warren Resources Inc., (1) | | | 11,549,184 |
| | Total Oil, Gas & Consumable Fuels | | | 163,594,796 |
| | |
| | Paper & Forest Products – 2.5% | | | |
| | |
| 628,500 | | Bowater Incorporated | | | 15,681,075 |
| | |
| 1,200,000 | | Sappi Limited, Sponsored ADR | | | 22,020,000 |
| | Total Paper & Forest Products | | | 37,701,075 |
| | |
| | Real Estate/Mortgage – 2.4% | | | |
| | |
| 1,000,000 | | American Home Mortgage Investment Corp. (2) | | | 18,380,000 |
| | |
| 3,037,070 | | Friedman, Billings, Ramsey Group, Inc., Class A | | | 16,582,402 |
| | |
| 800,000 | | HomeBanc Corp. | | | 1,016,000 |
| | Total Real Estate | | | 35,978,402 |
| | |
| | Semiconductors & Equipment – 0.6% | | | |
| | |
| 907,783 | | Mattson Technology, Inc., (1) | | | 8,805,495 |
| | Software – 6.8% | | | |
| | |
| 3,950,677 | | CA Inc. | | | 102,045,987 |
| | Thrifts & Mortgage Finance – 12.5% | | | |
| | |
| 1,350,000 | | Countrywide Financial Corporation | | | 49,072,500 |
| | |
| 950,000 | | Fannie Mae | | | 62,063,500 |
| | |
| 1,695,000 | | IndyMac Bancorp, Inc. | | | 49,443,150 |
| | |
| 500,000 | | Radian Group Inc. | | | 27,000,000 |
| | Total Thrifts & Mortgage Finance | | | 187,579,150 |
| | |
27
Portfolio of Investments
Nuveen NWQ Multi-Cap Value Fund (continued)
June 30, 2007
| | | | | |
| Shares | | Description | | Value |
| | | | | |
| | Tobacco – 2.4% | | | |
| | |
| 515,400 | | Altria Group, Inc. | | $ | 36,150,156 |
| | Total Common Stocks (cost $1,193,655,379) | | | 1,396,564,370 |
| | |
| | | | | | | | | | |
Principal
Amount (000) | | Description | | Coupon | | Maturity | | Value |
| | | SHORT-TERM INVESTMENTS – 6.8% | | | | | | | |
| $ | 102,731 | | Repurchase Agreement with Fixed Income Clearing Corporation, dated 6/29/07, repurchase price $102,765,155, collateralized by $85,365,000 U.S. Treasury Bonds, 7.250%, due 8/15/22, value $104,785,538 | | 4.000% | | 7/02/07 | | $ | 102,730,911 |
| | | | | | | | | | | |
| | | Total Short-Term Investments (cost $102,730,911) | | | | | | | 102,730,911 |
| | | |
| | | Total Investments (cost $1,296,386,290) – 99.9% | | | | | | | 1,499,295,281 |
| | | |
| | | Other Assets Less Liabilities – 0.1% | | | | | | | 1,312,927 |
| | | |
| | | Net Assets – 100% | | | | | | $ | 1,500,608,208 |
| | | |
| | (2) | At or subsequent to June 30, 2007, this issue was under the protection of the Federal Bankruptcy Court. |
| | ADR | American Depositary Receipt. |
See accompanying notes to financial statements.
28
Portfolio of Investments
Nuveen NWQ Large-Cap Value Fund
June 30, 2007
| | | | | |
| Shares | | Description | | Value |
| | | | | |
| | COMMON STOCKS – 86.3% | | | |
| | |
| | Aerospace & Defense – 2.9% | | | |
| | |
| 2,400 | | Lockheed Martin Corporation | | $ | 225,912 |
| | |
| 2,500 | | Raytheon Company | | | 134,725 |
| | Total Aerospace & Defense | | | 360,637 |
| | |
| | Biotechnology – 1.2% | | | |
| | |
| 2,700 | | Amgen Inc., (1) | | | 149,283 |
| | Capital Markets – 2.5% | | | |
| | |
| 6,300 | | JPMorgan Chase & Co. | | | 305,235 |
| | Commercial Banks – 4.6% | | | |
| | |
| 5,200 | | Bank of America Corporation | | | 254,228 |
| | |
| 8,900 | | Wells Fargo & Company | | | 313,013 |
| | Total Commercial Banks | | | 567,241 |
| | |
| | Commercial Services & Supplies – 3.2% | | | |
| | |
| 8,500 | | Pitney Bowes Inc. | | | 397,970 |
| | Communications Equipment – 2.9% | | | |
| | |
| 20,000 | | Motorola, Inc. | | | 354,000 |
| | Diversified Financial Services – 4.1% | | | |
| | |
| 9,800 | | Citigroup Inc. | | | 502,642 |
| | Diversified Telecommunication Services – 3.0% | | | |
| | |
| 4,800 | | AT&T Inc. | | | 199,200 |
| | |
| 8,300 | | Sprint Nextel Corporation | | | 171,893 |
| | Total Diversified Telecommunication Services | | | 371,093 |
| | |
| | Electronic Equipment & Instruments – 1.0% | | | |
| | |
| 3,200 | | Agilent Technologies, Inc., (1) | | | 123,008 |
| | Food Products – 1.0% | | | |
| | |
| 2,776 | | Kraft Foods Inc. | | | 97,854 |
| | |
| 1,100 | | Tyson Foods, Inc., Class A | | | 25,344 |
| | Total Food Products | | | 123,198 |
| | |
| | Health Care Providers & Services – 0.9% | | | |
| | |
| 2,250 | | Aetna Inc. | | | 111,150 |
| | Household Products – 1.4% | | | |
| | |
| 2,600 | | Kimberly-Clark Corporation | | | 173,914 |
| | Insurance – 12.6% | | | |
| | |
| 2,800 | | Aon Corporation | | | 119,308 |
| | |
| 10,000 | | Genworth Financial Inc., Class A | | | 344,000 |
| | |
| 4,700 | | Hartford Financial Services Group, Inc. | | | 462,997 |
| | |
| 7,400 | | Loews Corporation | | | 377,252 |
| | |
| 4,200 | | MGIC Investment Corporation | | | 238,812 |
| | Total Insurance | | | 1,542,369 |
| | |
| | Machinery – 0.9% | | | |
| | |
| 2,000 | | Ingersoll Rand Company Limited, Class A | | | 109,640 |
29
Portfolio of Investments
Nuveen NWQ Large-Cap Value Fund (continued)
June 30, 2007
| | | | | |
| Shares | | Description | | Value |
| | | | | |
| | Media – 9.8% | | | |
| | |
| 1,500 | | CBS Corporation, Class B | | $ | 49,980 |
| | |
| 6,300 | | Clear Channel Communications, Inc. | | | 238,266 |
| | |
| 10,500 | | Comcast Corporation, Special Class A, (1) | | | 293,580 |
| | |
| 4,700 | | Liberty Media Holding Corporation Interactive, Class A, (1) | | | 104,951 |
| | |
| 12,300 | | Viacom Inc., Class B, (1) | | | 512,049 |
| | Total Media | | | 1,198,826 |
| | |
| | Metals & Mining – 3.4% | | | |
| | |
| 13,300 | | Barrick Gold Corporation | | | 386,631 |
| | |
| 300 | | United States Steel Corporation | | | 32,625 |
| | Total Metals & Mining | | | 419,256 |
| | |
| | Oil, Gas & Consumable Fuels – 10.1% | | | |
| | |
| 5,600 | | Apache Corporation | | | 456,904 |
| | |
| 3,300 | | ConocoPhillips | | | 259,050 |
| | |
| 2,300 | | Hess Corporation | | | 135,608 |
| | |
| 6,200 | | Noble Energy, Inc. | | | 386,818 |
| | Total Oil, Gas & Consumable Fuels | | | 1,238,380 |
| | |
| | Paper & Forest Products – 1.8% | | | |
| | |
| 5,600 | | International Paper Company | | | 218,680 |
| | Road & Rail – 0.4% | | | |
| | |
| 450 | | Union Pacific Corporation | | | 51,818 |
| | Software – 7.5% | | | |
| | |
| 25,200 | | CA Inc. | | | 650,916 |
| | |
| 9,200 | | Microsoft Corporation | | | 271,124 |
| | Total Software | | | 922,040 |
| | |
| | Thrifts & Mortgage Finance – 8.5% | | | |
| | |
| 12,300 | | Countrywide Financial Corporation | | | 447,105 |
| | |
| 6,000 | | Fannie Mae | | | 391,980 |
| | |
| 3,700 | | Radian Group Inc. | | | 199,800 |
| | Total Thrifts & Mortgage Finance | | | 1,038,885 |
| | |
| | Tobacco – 2.6% | | | |
| | |
| 4,500 | | Altria Group, Inc. | | | 315,630 |
| | Total Common Stocks (cost $10,520,607) | | | 10,594,895 |
| | |
| | | | | | | | | | | |
Principal
Amount (000) | | Description | | Coupon | | Maturity | | Value | |
| | | SHORT-TERM INVESTMENTS – 14.0% | | | | | | | | |
| $ | 1,717 | | Repurchase Agreement with State Street Bank, dated 6/29/07, repurchase price $1,717,344, collateralized by $1,370,000 U.S. Treasury Bonds, 8.000%, due 11/15/21, value $1,757,025 | | 4.000% | | 7/02/07 | | $ | 1,716,772 | |
| | | | | | | | | | | | |
| | | Total Short-Term Investments (cost $1,716,772) | | | | | | | 1,716,772 | |
| | | | |
| | | Total Investments (cost $12,237,379) – 100.3% | | | | | | | 12,311,667 | |
| | | | |
| | | Other Assets Less Liabilities – (0.3)% | | | | | | | (42,688 | ) |
| | | | |
| | | Net Assets – 100% | | | | | | $ | 12,268,979 | |
| | | | |
See accompanying notes to financial statements.
30
Portfolio of Investments
Nuveen Small/Mid-Cap Value Fund
June 30, 2007
| | | | | |
| Shares | | Description | | Value |
| | | | | |
| | COMMON STOCKS – 93.2% | | | |
| | |
| | Aerospace & Defense – 2.1% | | | |
| | |
| 93,550 | | Esterline Technologies Corporation, (1) | | $ | 4,519,401 |
| | Building Products – 4.0% | | | |
| | |
| 399,550 | | Griffon Corporation, (1) | | | 8,702,199 |
| | Chemicals – 5.5% | | | |
| | |
| 136,800 | | Agrium Inc., Sponsored ADR | | | 5,985,000 |
| | |
| 91,600 | | Ferro Corporation | | | 2,283,588 |
| | |
| 102,500 | | Rockwood Holdings Inc., (1) | | | 3,746,375 |
| | Total Chemicals | | | 12,014,963 |
| | |
| | Communications Equipment – 0.1% | | | |
| | |
| 10,000 | | Avaya Inc., (1) | | | 168,400 |
| | Consumer Finance – 2.4% | | | |
| | |
| 202,300 | | Americredit Corp., (1) | | | 5,371,065 |
| | Containers & Packaging – 3.7% | | | |
| | |
| 87,300 | | Packaging Corp. of America | | | 2,209,563 |
| | |
| 448,350 | | Smurfit-Stone Container Corporation, (1) | | | 5,967,539 |
| | Total Containers & Packaging | | | 8,177,102 |
| | |
| | Electrical Equipment – 2.1% | | | |
| | |
| 60,900 | | Lincoln Electric Holdings Inc. | | | 4,521,216 |
| | Electronic Equipment & Instruments – 9.1% | | | |
| | |
| 109,450 | | Arrow Electronics, Inc., (1) | | | 4,206,164 |
| | |
| 221,250 | | Coherent Inc., (1) | | | 6,750,338 |
| | |
| 39,500 | | General Cable Corporation, (1) | | | 2,992,125 |
| | |
| 177,709 | | Tektronix Inc. | | | 5,995,902 |
| | Total Electronic Equipment & Instruments | | | 19,944,529 |
| | |
| | Food Products – 3.6% | | | |
| | |
| 566,900 | | Del Monte Foods Company | | | 6,893,504 |
| | |
| 35,500 | | Smithfield Foods, Inc., (1) | | | 1,093,045 |
| | Total Food Products | | | 7,986,549 |
| | |
| | Household Durables – 3.1% | | | |
| | |
| 231,900 | | Newell Rubbermaid Inc. | | | 6,824,817 |
| | Independent Power Producers & Energy Traders – 0.9% | | | |
| | |
| 49,600 | | NRG Energy Inc., (1) | | | 2,061,872 |
| | Insurance – 5.4% | | | |
| | |
| 139,900 | | Hanover Insurance Group Inc. | | | 6,825,721 |
| | |
| 87,400 | | MGIC Investment Corporation | | | 4,969,564 |
| | Total Insurance | | | 11,795,285 |
| | |
| | Machinery – 9.6% | | | |
| | |
| 51,200 | | AGCO Corporation, (1) | | | 2,222,592 |
| | |
| 53,600 | | Gardner Denver, Inc., (1) | | | 2,280,680 |
| | |
| 99,250 | | Kennametal Inc. | | | 8,141,478 |
| | |
| 35,400 | | Oshkosh Truck Corporation | | | 2,227,368 |
| | |
| 209,970 | | Sauer-Danfoss, Inc. | | | 6,248,707 |
| | Total Machinery | | | 21,120,825 |
| | |
31
Portfolio of Investments
Nuveen Small/Mid-Cap Value Fund (continued)
June 30, 2007
| | | | | |
| Shares | | Description | | Value |
| | | | | |
| | Metals & Mining – 6.8% | | | |
| | |
| 17,000 | | Carpenter Technology Inc. | | $ | 2,215,270 |
| | |
| 62,950 | | Century Aluminum Company, (1) | | | 3,438,959 |
| | |
| 271,100 | | Gibraltar Industries Inc. | | | 6,004,865 |
| | |
| 57,350 | | Reliance Steel & Aluminum Company | | | 3,226,511 |
| | Total Metals & Mining | | | 14,885,605 |
| | |
| | Multiline Retail – 3.0% | | | |
| | |
| 244,750 | | Casey’s General Stores, Inc. | | | 6,671,885 |
| | Oil, Gas & Consumable Fuels – 11.8% | | | |
| | |
| 260,900 | | Acergy S.A., Sponsored ADR | | | 5,859,814 |
| | |
| 149,250 | | Denbury Resources Inc., (1) | | | 5,596,875 |
| | |
| 106,050 | | Noble Energy, Inc. | | | 6,616,460 |
| | |
| 55,100 | | Range Resources Corporation | | | 2,061,291 |
| | |
| 128,200 | | Southwestern Energy Company, (1) | | | 5,704,900 |
| | Total Oil, Gas & Consumable Fuels | | | 25,839,340 |
| | |
| | Paper & Forest Products – 7.7% | | | |
| | |
| 227,400 | | Bowater Incorporated | | | 5,673,630 |
| | |
| 184,300 | | MeadWestvaco Corporation | | | 6,509,476 |
| | |
| 235,300 | | Sappi Limited, Sponsored ADR | | | 4,317,755 |
| | |
| 20,950 | | Wausau Paper Corp. | | | 280,730 |
| | Total Paper & Forest Products | | | 16,781,591 |
| | |
| | Real Estate/Mortgage – 8.5% | | | |
| | |
| 307,950 | | American Home Mortgage Investment Corp. (2) | | | 5,660,121 |
| | |
| 540,000 | | Anthracite Capital, Inc. | | | 6,318,000 |
| | |
| 360,250 | | Friedman, Billings, Ramsey Group, Inc., Class A | | | 1,966,965 |
| | |
| 180,550 | | RAIT Investment Trust | | | 4,697,911 |
| | Total Real Estate | | | 18,642,997 |
| | |
| | Textiles, Apparel & Luxury Goods – 1.5% | | | |
| | |
| 109,750 | | Fossil Inc., (1) | | | 3,236,528 |
| | Thrifts & Mortgage Finance – 2.3% | | | |
| | |
| 5,800 | | IndyMac Bancorp, Inc. | | | 169,186 |
| | |
| 91,400 | | Radian Group Inc. | | | 4,935,596 |
| | Total Thrifts & Mortgage Finance | | | 5,104,782 |
| | |
| | Total Common Stocks (cost $209,587,998) | | | 204,370,951 |
| | |
| | | | | | | | | | | |
Principal
Amount (000) | | Description | | Coupon | | Maturity | | Value | |
| | | SHORT-TERM INVESTMENTS – 7.3% | | | | | | | | |
| $ | 16,028 | | Repurchase Agreement with State Street Bank, dated 6/29/07, repurchase price $16,033,449, collateralized by $12,460,000 U.S. Treasury Bonds, 8.125%, due 8/15/21, value $16,353,750 | | 4.000% | | 7/02/07 | | $ | 16,028,106 | |
| | | | | | | | | | | | |
| | | Total Short-Term Investments (cost $16,028,106) | | | | | | | 16,028,106 | |
| | | | |
| | | Total Investments (cost $225,616,104) – 100.5% | | | | | | | 220,399,057 | |
| | | | |
| | | Other Assets Less Liabilities – (0.5)% | | | | | | | (1,175,952 | ) |
| | | | |
| | | Net Assets – 100% | | | | | | $ | 219,223,105 | |
| | | | |
| | (2) | At or subsequent to June 30, 2007, this issue was under the protection of the Federal Bankruptcy Court. |
| | ADR | American Depositary Receipt. |
See accompanying notes to financial statements.
32
Portfolio of Investments
Nuveen NWQ Small-Cap Value Fund
June 30, 2007
| | | | | |
| Shares | | Description | | Value |
| | | | | |
| | COMMON STOCKS – 93.2% | | | |
| | |
| | Aerospace & Defense – 2.1% | | | |
| | |
| 343,400 | | Aeroflex Incorporated, (1) | | $ | 4,865,978 |
| | Building Products – 3.7% | | | |
| | |
| 389,650 | | Griffon Corporation, (1) | | | 8,486,577 |
| | Commercial Banks – 2.0% | | | |
| | |
| 206,765 | | Bancorp, Inc., (1) | | | 4,623,265 |
| | Communications Equipment – 3.6% | | | |
| | |
| 139,500 | | CommScope Inc., (1) | | | 8,139,825 |
| | Computers & Peripherals – 0.5% | | | |
| | |
| 402,300 | | Quantum Corporation, (1) | | | 1,275,291 |
| | Containers & Packaging – 1.0% | | | |
| | |
| 174,500 | | Smurfit-Stone Container Corporation, (1) | | | 2,322,595 |
| | Electrical Equipment – 3.6% | | | |
| | |
| 111,500 | | Lincoln Electric Holdings Inc. | | | 8,277,760 |
| | Electronic Equipment & Instruments – 3.9% | | | |
| | |
| 59,800 | | General Cable Corporation, (1) | | | 4,529,850 |
| | |
| 344,300 | | Keithley Instruments, Inc. | | | 4,320,965 |
| | Total Electronic Equipment & Instruments | | | 8,850,815 |
| | |
| | Food Products – 4.7% | | | |
| | |
| 567,900 | | Del Monte Foods Company | | | 6,905,664 |
| | |
| 122,412 | | Smithfield Foods, Inc., (1) | | | 3,769,065 |
| | Total Food Products | | | 10,674,729 |
| | |
| | Hotels, Restaurants & Leisure – 1.4% | | | |
| | |
| 89,400 | | Bob Evans Farms | | | 3,294,390 |
| | Household Durables – 2.2% | | | |
| | |
| 223,300 | | Hooker Furniture Corporation | | | 5,010,852 |
| | Household Products – 2.5% | | | |
| | |
| 174,349 | | WD 40 Company | | | 5,730,852 |
| | Insurance – 1.8% | | | |
| | |
| 214,800 | | PMA Capital Corporation, Class A, (1) | | | 2,296,212 |
| | |
| 722,500 | | Quanta Capital Holdings Limited, Sponsored ADR, (1) | | | 1,734,000 |
| | Total Insurance | | | 4,030,212 |
| | |
| | Machinery – 12.4% | | | |
| | |
| 144,100 | | Albany International Corporation, Class A | | | 5,827,404 |
| | |
| 135,359 | | Kadant Inc., (1) | | | 4,223,201 |
| | |
| 118,190 | | Kennametal Inc. | | | 9,695,126 |
| | |
| 59,900 | | RBC Bearings Inc., (1) | | | 2,470,875 |
| | |
| 205,400 | | Sauer-Danfoss, Inc. | | | 6,112,704 |
| | Total Machinery | | | 28,329,310 |
| | |
| | Metals & Mining – 3.6% | | | |
| | |
| 59,700 | | Century Aluminum Company, (1) | | | 3,261,411 |
| | |
| 222,100 | | Gibraltar Industries Inc. | | | 4,919,515 |
| | Total Metals & Mining | | | 8,180,926 |
| | |
33
Portfolio of Investments
Nuveen NWQ Small-Cap Value Fund (continued)
June 30, 2007
| | | | | |
| Shares | | Description | | Value |
| | | | | |
| | Multiline Retail – 2.8% | | | |
| | |
| 233,550 | | Casey’s General Stores, Inc. | | $ | 6,366,573 |
| | Oil, Gas & Consumable Fuels – 11.4% | | | |
| | |
| 304,000 | | Acergy S.A., Sponsored ADR | | | 6,827,840 |
| | |
| 125,800 | | Bill Barrett Corporation, (1) | | | 4,633,214 |
| | |
| 162,254 | | Denbury Resources Inc., (1) | | | 6,084,525 |
| | |
| 60,900 | | Range Resources Corporation | | | 2,278,269 |
| | |
| 540,350 | | Warren Resources Inc., (1) | | | 6,311,288 |
| | Total Oil, Gas & Consumable Fuels | | | 26,135,136 |
| | |
| | Paper & Forest Products – 12.8% | | | |
| | |
| 271,900 | | Bowater Incorporated | | | 6,783,905 |
| | |
| 237,600 | | Buckeye Technologies Inc., (1) | | | 3,675,672 |
| | |
| 402,700 | | Glatfelter | | | 5,472,693 |
| | |
| 355,700 | | Sappi Limited, Sponsored ADR | | | 6,527,095 |
| | |
| 510,994 | | Wausau Paper Corp. | | | 6,847,320 |
| | Total Paper & Forest Products | | | 29,306,685 |
| | |
| | Real Estate/Mortgage – 7.1% | | | |
| | |
| 505,700 | | Alesco Financial Inc. | | | 4,111,341 |
| | |
| 479,500 | | Anthracite Capital, Inc. | | | 5,610,150 |
| | |
| 93,700 | | HomeBanc Corp., (1) | | | 118,999 |
| | |
| 240,700 | | New York Mortgage Trust, Inc. | | | 459,737 |
| | |
| 230,300 | | RAIT Investment Trust | | | 5,992,406 |
| | Total Real Estate | | | 16,292,633 |
| | |
| | Road & Rail – 3.0% | | | |
| | |
| 375,800 | | Marten Transport, Ltd., (1) | | | 6,768,158 |
| | Semiconductors & Equipment – 0.6% | | | |
| | |
| 142,600 | | Mattson Technology, Inc., (1) | | | 1,383,220 |
| | Specialty Retail – 1.0% | | | |
| | |
| 325,591 | | Golfsmith International Holdings Inc., (1) | | | 2,249,834 |
| | Textiles, Apparel & Luxury Goods – 1.8% | | | |
| | |
| 135,800 | | Fossil Inc., (1) | | | 4,004,742 |
| | Thrifts & Mortgage Finance – 3.7% | | | |
| | |
| 298,100 | | Franklin Bank Corporation, (1) | | | 4,441,690 |
| | |
| 135,700 | | IndyMac Bancorp, Inc. | | | 3,958,368 |
| | Total Thrifts & Mortgage Finance | | | 8,400,058 |
| | |
| | Total Common Stocks (cost $191,030,474) | | | 213,000,416 |
| | |
| | | | | | | | | | |
Principal
Amount (000) | | Description | | Coupon | | Maturity | | Value |
| | | SHORT-TERM INVESTMENTS – 5.7% | | | | | | | |
| $ | 13,056 | | Repurchase Agreement with Fixed Income Clearing Corporation, dated 6/29/07, repurchase price $13,060,833, collateralized by $10,850,000 U.S. Treasury Bonds, 7.250%, due 8/15/22, value $13,318,375 | | 4.000% | | 7/02/07 | | $ | 13,056,481 |
| | | | | | | | | | | |
| | | Total Short-Term Investments (cost $13,056,481) | | | | | | | 13,056,481 |
| | | |
| | | Total Investments (cost $204,086,955) – 98.9% | | | | | | | 226,056,897 |
| | | |
| | | Other Assets Less Liabilities – 1.1% | | | | | | | 2,532,587 |
| | | |
| | | Net Assets – 100% | | | | | | $ | 228,589,484 |
| | | |
| | ADR | American Depositary Receipt. |
See accompanying notes to financial statements.
34
Portfolio of Investments
Nuveen NWQ Global Value Fund
June 30, 2007
| | | | | |
| Shares | | Description | | Value |
| | | | | |
| | COMMON STOCKS – 93.7% | | | |
| | |
| | Aerospace & Defense – 1.7% | | | |
| | |
| 1,850 | | Lockheed Martin Corporation | | $ | 174,141 |
| | |
| 3,450 | | Raytheon Company | | | 185,921 |
| | Total Aerospace & Defense | | | 360,062 |
| | |
| | Auto Components – 1.0% | | | |
| | |
| 2,310 | | Magna International Inc., Class A | | | 210,187 |
| | Beverages – 1.8% | | | |
| | |
| 7,500 | | Coca Cola West Holdings Company | | | 174,518 |
| | |
| 14,000 | | Kirin Brewery Company Limited | | | 209,559 |
| | Total Beverages | | | 384,077 |
| | |
| | Biotechnology – 0.8% | | | |
| | |
| 2,925 | | Amgen Inc., (1) | | | 161,723 |
| | Capital Markets – 1.6% | | | |
| | |
| 6,900 | | JPMorgan Chase & Co. | | | 334,305 |
| | Chemicals – 0.7% | | | |
| | |
| 75,100 | | Dyno Nobel, Limited | | | 152,171 |
| | Commercial Banks – 1.6% | | | |
| | |
| 9,400 | | Wells Fargo & Company | | | 330,598 |
| | Commercial Services & Supplies – 3.1% | | | |
| | |
| 1,650 | | Dai Nippon Printing Co., Ltd., ADR | | | 48,675 |
| | |
| 25,000 | | Dai Nippon Printing Co., Ltd. | | | 373,401 |
| | |
| 5,200 | | Pitney Bowes Inc. | | | 243,464 |
| | Total Commercial Services & Supplies | | | 665,540 |
| | |
| | Communications Equipment – 2.0% | | | |
| | |
| 8,200 | | Alcatel | | | 115,200 |
| | |
| 17,250 | | Motorola, Inc. | | | 305,325 |
| | Total Communications Equipment | | | 420,525 |
| | |
| | Computers & Peripherals – 1.4% | | | |
| | |
| 13,000 | | Gemalto NV, (1) | | | 302,279 |
| | Consumer Finance – 0.8% | | | |
| | |
| 4,790 | | Takefuji Corporation | | | 161,061 |
| | Diversified Financial Services – 1.6% | | | |
| | |
| 6,650 | | Citigroup Inc. | | | 341,079 |
| | Diversified Telecommunication Services – 9.9% | | | |
| | |
| 6,300 | | AT&T Inc. | | | 261,450 |
| | |
| 4,060 | | Belgacom S.A. | | | 180,511 |
| | |
| 22,356 | | Chunghwa Telecom Co., Ltd., Sponsored ADR | | | 421,633 |
| | |
| 11,870 | | KT Corporation, Sponsored ADR | | | 278,470 |
| | |
| 12,980 | | Nippon Telegraph and Telephone Corporation, ADR | | | 287,767 |
| | |
| 12,900 | | Sprint Nextel Corporation | | | 267,159 |
| | |
| 187,400 | | Telecom Italia S.p.A. | | | 416,724 |
| | Total Diversified Telecommunication Services | | | 2,113,714 |
| | |
35
Portfolio of Investments
Nuveen NWQ Global Value Fund (continued)
June 30, 2007
| | | | | |
| Shares | | Description | | Value |
| | | | | |
| | Electric Utilities – 2.1% | | | |
| | |
| 8,517,000 | | Centrais Electricas Brasileiras SA, Electrobras | | $ | 256,084 |
| | |
| 8,760 | | Korea Electric Power Corporation, Sponsored ADR | | | 191,844 |
| | Total Electric Utilities | | | 447,928 |
| | |
| | Electronic Equipment & Instruments – 1.0% | | | |
| | |
| 5,556 | | Agilent Technologies, Inc., (1) | | | 213,573 |
| | Energy Equipment & Services – 1.6% | | | |
| | |
| 220 | | Areva CI | | | 236,328 |
| | |
| 1,350 | | Technip SA | | | 112,005 |
| | Total Energy Equipment & Services | | | 348,333 |
| | |
| | Food Products – 1.2% | | | |
| | |
| 2,404 | | Kraft Foods Inc. | | | 84,741 |
| | |
| 7,200 | | Tyson Foods, Inc., Class A | | | 165,888 |
| | Total Food Products | | | 250,629 |
| | |
| | Health Care Providers & Services – 0.7% | | | |
| | |
| 3,100 | | Aetna Inc. | | | 153,140 |
| | Household Products – 1.3% | | | |
| | |
| 4,175 | | Kimberly-Clark Corporation | | | 279,266 |
| | Insurance – 4.8% | | | |
| | |
| 6,950 | | Aon Corporation | | | 296,140 |
| | |
| 8,450 | | Genworth Financial Inc., Class A | | | 290,680 |
| | |
| 3,150 | | Hartford Financial Services Group, Inc. | | | 310,307 |
| | |
| 2,300 | | MGIC Investment Corporation | | | 130,778 |
| | Total Insurance | | | 1,027,905 |
| | |
| | Leisure Equipment & Products – 2.4% | | | |
| | |
| 7,400 | | Fuji Photo Film Co., Ltd. | | | 331,159 |
| | |
| 4,100 | | Sankyo Company Ltd | | | 172,824 |
| | Total Leisure Equipment & Products | | | 503,983 |
| | |
| | Machinery – 1.8% | | | |
| | |
| 2,800 | | Illinois Tool Works Inc. | | | 151,732 |
| | |
| 4,300 | | Ingersoll Rand Company Limited, Class A | | | 235,726 |
| | Total Machinery | | | 387,458 |
| | |
| | Media – 7.4% | | | |
| | |
| 7,850 | | CBS Corporation, Class B | | | 261,562 |
| | |
| 3,500 | | Clear Channel Communications, Inc. | | | 132,370 |
| | |
| 6,450 | | Comcast Corporation, Special Class A, (1) | | | 180,342 |
| | |
| 1,032 | | Liberty Media Holding Corporation Capital, Class A, (1) | | | 121,446 |
| | |
| 5,962 | | Liberty Media Holding Corporation Interactive, Class A, (1) | | | 133,131 |
| | |
| 13,600 | | Premiere AG, (1) | | | 323,962 |
| | |
| 9,900 | | Viacom Inc., Class B, (1) | | | 412,137 |
| | Total Media | | | 1,564,950 |
| | |
36
| | | | | |
| Shares | | Description | | Value |
| | | | | |
| | Metals & Mining – 13.7% | | | |
| | |
| 32,440 | | Alumina Limited | | $ | 214,246 |
| | |
| 6,510 | | AngloGold Ashanti Limited, Sponsored ADR | | | 246,208 |
| | |
| 7,850 | | Apex Silver Mines Limited, (1) | | | 158,413 |
| | |
| 11,918 | | Barrick Gold Corporation | | | 346,456 |
| | |
| 8,800 | | Gold Fields Limited | | | 136,218 |
| | |
| 6,236 | | Impala Platinum Holdings Limited | | | 190,587 |
| | |
| 16,200 | | Ivanhoe Mines Ltd., (1) | | | 230,688 |
| | |
| 55,800 | | Lihir Gold Limited, (1) | | | 141,922 |
| | |
| 1,400 | | Lonmin PLC | | | 113,016 |
| | |
| 10,100 | | Newcrest Mining Limited | | | 195,660 |
| | |
| 6,800 | | Newmont Mining Corporation | | | 265,608 |
| | |
| 13,800 | | NovaGold Resources Inc., (1) | | | 207,414 |
| | |
| 4,380 | | Rio Tinto PLC | | | 336,603 |
| | |
| 1,300 | | United States Steel Corporation | | | 141,375 |
| | Total Metals & Mining | | | 2,924,414 |
| | |
| | Oil, Gas & Consumable Fuels – 10.1% | | | |
| | |
| 4,100 | | Apache Corporation | | | 334,519 |
| | |
| 27,800 | | BP PLC | | | 336,626 |
| | |
| 1,800 | | Hess Corporation | | | 106,128 |
| | |
| 27,000 | | Nippon Oil Corporation | | | 251,306 |
| | |
| 7,150 | | Noble Energy, Inc. | | | 446,088 |
| | |
| 2,400 | | Petro Canada | | | 127,584 |
| | |
| 4,417 | | Royal Dutch Shell PLC, Class B, Sponsored ADR | | | 368,157 |
| | |
| 2,000 | | Suncor Energy, Inc. | | | 179,840 |
| | Total Oil, Gas & Consumable Fuels | | | 2,150,248 |
| | |
| | Paper & Forest Products – 1.1% | | | |
| | |
| 6,200 | | International Paper Company | | | 242,110 |
| | Personal Products – 0.6% | | | |
| | |
| 6,000 | | Shiseido Company, Limited | | | 128,162 |
| | Pharmaceuticals – 1.0% | | | |
| | |
| 8,200 | | Daiichi Sankyo Company Limited | | | 217,779 |
| | Road & Rail – 1.1% | | | |
| | |
| 2,100 | | Union Pacific Corporation | | | 241,815 |
| | Semiconductors & Equipment – 0.6% | | | |
| | |
| 4,300 | | NEC Electronics Corporation, (1) | | | 113,153 |
| | Software – 4.0% | | | |
| | |
| 19,500 | | CA Inc. | | | 503,684 |
| | |
| 10,000 | | Microsoft Corporation | | | 294,700 |
| | |
| 3,900 | | Sega Sammy Holdings Inc. | | | 63,192 |
| | Total Software | | | 861,576 |
| | |
| | Textiles, Apparel & Luxury Goods – 0.9% | | | |
| | |
| 15,000 | | Wacoal Holdings Corporation | | | 185,178 |
37
Portfolio of Investments
Nuveen NWQ Global Value Fund (continued)
June 30, 2007
| | | | | |
| Shares | | Description | | Value |
| | | | | |
| | Thrifts & Mortgage Finance – 4.9% | | | |
| | |
| 8,050 | | Countrywide Financial Corporation | | $ | 292,618 |
| | |
| 8,550 | | Fannie Mae | | | 558,570 |
| | |
| 3,350 | | Radian Group Inc. | | | 180,900 |
| | Total Thrifts & Mortgage Finance | | | 1,032,088 |
| | |
| | Tobacco – 1.1% | | | |
| | |
| 3,475 | | Altria Group, Inc. | | | 243,737 |
| | Wireless Telecommunication Services – 2.3% | | | |
| | |
| 6,200 | | SK Telecom Company Limited, Sponsored ADR | | | 169,570 |
| | |
| 95,006 | | Vodafone Group PLC | | | 320,132 |
| | Total Wireless Telecommunication Services | | | 489,702 |
| | |
| | Total Common Stocks (cost $17,436,475) | | | 19,944,448 |
| | |
| | | | | | | | | | |
Principal
Amount (000) | | Description | | Coupon | | Maturity | | Value |
| | | SHORT-TERM INVESTMENTS – 6.2% | | | | | | | |
| $ | 1,307 | | Repurchase Agreement with Fixed Income Clearing Corporation, dated 6/29/07, repurchase price $1,307,653, collateralized by $1,090,000 U.S. Treasury Bonds, 7.250%, due 8/15/22, value $1,337,975 | | 4.000% | | 7/02/07 | | $ | 1,307,217 |
| | | | | | | | | | | |
| | | Total Short-Term Investments (cost $1,307,217) | | | | | | | 1,307,217 |
| | | |
| | | Total Investments (cost $18,743,692) – 99.9% | | | | | | | 21,251,665 |
| | | |
| | | Other Assets Less Liabilities – 0.1% | | | | | | | 27,611 |
| | | |
| | | Net Assets – 100% | | | | | | $ | 21,279,276 |
| | | |
| | ADR | American Depositary Receipt. |
See accompanying notes to financial statements.
38
Portfolio of Investments
Nuveen Tradewinds Value Opportunities Fund
June 30, 2007
| | | | | |
| Shares | | Description | | Value |
| | | | | |
| | COMMON STOCKS – 70.3% | | | |
| | |
| | Auto Components – 0.5% | | | |
| | |
| 27,700 | | Magna International Inc., Class A | | $ | 2,520,423 |
| | Chemicals – 0.8% | | | |
| | |
| 7,400 | | Aceto Corporation | | | 68,598 |
| | |
| 101,600 | | Mosaic Company, (1) | | | 3,964,432 |
| | Total Chemicals | | | 4,033,030 |
| | |
| | Commercial Services & Supplies – 3.6% | | | |
| | |
| 811,400 | | Allied Waste Industries, Inc., (1) | | | 10,921,444 |
| | |
| 147,300 | | Toppan Printing Company Limited, ADR | | | 7,880,550 |
| | Total Commercial Services & Supplies | | | 18,801,994 |
| | |
| | Construction & Engineering – 1.1% | | | |
| | |
| 128,000 | | Shaw Group Inc., (1) | | | 5,925,120 |
| | Consumer Finance – 2.0% | | | |
| | |
| 613,800 | | ACOM Company Limited, Sponsored ADR | | | 5,450,544 |
| | |
| 325,100 | | Promise Company Limited, Unsponsored ADR | | | 4,965,903 |
| | Total Consumer Finance | | | 10,416,447 |
| | |
| | Diversified Telecommunication Services – 2.4% | | | |
| | |
| 495,000 | | Chunghwa Telecom Co., Ltd., Sponsored ADR | | | 9,335,700 |
| | |
| 120,500 | | KT Corporation, Sponsored ADR | | | 2,826,930 |
| | Total Diversified Telecommunication Services | | | 12,162,630 |
| | |
| | Electric Utilities – 7.2% | | | |
| | |
| 16,600 | | Alliant Energy Corporation | | | 644,910 |
| | |
| 27,300 | | Ameren Corporation | | | 1,337,973 |
| | |
| 33,100 | | American Electric Power Company, Inc. | | | 1,490,824 |
| | |
| 370,000 | | Centrais Electricas Brasileiras S.A., ADR | | | 5,513,000 |
| | |
| 213,200 | | DTE Energy Company | | | 10,280,504 |
| | |
| 262,700 | | IDACORP, INC | | | 8,416,908 |
| | |
| 10,600 | | Korea Electric Power Corporation, Sponsored ADR | | | 232,140 |
| | |
| 323,200 | | PNM Resources Inc. | | | 8,981,728 |
| | Total Electric Utilities | | | 36,897,987 |
| | |
| | Electronic Equipment & Instruments – 2.9% | | | |
| | |
| 503,900 | | Samsung SDI Company Ltd., Series 144A | | | 8,181,068 |
| | |
| 175,700 | | Tech Data Corporation, (1) | | | 6,757,422 |
| | Total Electronic Equipment & Instruments | | | 14,938,490 |
| | |
| | Energy Equipment & Services – 1.7% | | | |
| | |
| 149,800 | | BJ Services Company | | | 4,260,312 |
| | |
| 52,750 | | Technip SA, ADR | | | 4,356,623 |
| | Total Energy Equipment & Services | | | 8,616,935 |
| | |
| | Food & Staples Retailing – 1.4% | | | |
| | |
| 58,500 | | Kroger Co. | | | 1,645,605 |
| | |
| 119,000 | | SUPERVALU INC. | | | 5,512,080 |
| | Total Food & Staples Retailing | | | 7,157,685 |
| | |
39
Portfolio of Investments
Nuveen Tradewinds Value Opportunities Fund (continued)
June 30, 2007
| | | | | |
| Shares | | Description | | Value |
| | | | | |
| | Food Products – 6.5% | | | |
| | |
| 500 | | Bunge Limited | | $ | 42,250 |
| | |
| 86,500 | | Sara Lee Corporation | | | 1,505,100 |
| | |
| 559,000 | | Smithfield Foods, Inc., (1) | | | 17,211,610 |
| | |
| 635,500 | | Tyson Foods, Inc., Class A | | | 14,641,920 |
| | Total Food Products | | | 33,400,880 |
| | |
| | Health Care Providers & Services – 0.5% | | | |
| | |
| 89,500 | | Apria Healthcare Group Inc., (1) | | | 2,574,915 |
| | Household Durables – 0.8% | | | |
| | |
| 435,000 | | Levitt Corporation, Class A | | | 4,102,050 |
| | Household Products – 1.6% | | | |
| | |
| 31,450 | | KAO Corporation, Sponsored ADR | | | 8,123,853 |
| | IT Services – 0.9% | | | |
| | |
| 56,600 | | CDW Corporation, (1) | | | 4,809,302 |
| | Machinery – 3.2% | | | |
| | |
| 273,200 | | AGCO Corporation, (1) | | | 11,859,612 |
| | |
| 4,800 | | Alamo Group Inc. | | | 120,960 |
| | |
| 72,000 | | Lindsay Manufacturing Company | | | 3,188,880 |
| | |
| 70,500 | | Tecumseh Products Company, Class A, (1) | | | 1,107,555 |
| | Total Machinery | | | 16,277,007 |
| | |
| | Media – 0.8% | | | |
| | |
| 120,000 | | Scholastic Corporation, (1) | | | 4,312,800 |
| | Metals & Mining – 22.2% | | | |
| | |
| 50,200 | | Alcoa Inc. | | | 2,034,606 |
| | |
| 116,900 | | Alumina Limited, Sponsored ADR | | | 3,103,695 |
| | |
| 329,700 | | AngloGold Ashanti Limited, Sponsored ADR | | | 12,469,254 |
| | |
| 927,300 | | Apex Silver Mines Limited, (1) | | | 18,712,914 |
| | |
| 2,300 | | Banro Corporation, (1) | | | 23,230 |
| | |
| 36,565 | | Barrick Gold Corporation | | | 1,062,945 |
| | |
| 810,000 | | Crystallex International Corporation, (1) | | | 3,361,500 |
| | |
| 121,200 | | Eldorado Gold Corporation, (1) | | | 706,596 |
| | |
| 734,200 | | Entree Gold Inc., (1) | | | 1,798,790 |
| | |
| 517,400 | | Gold Fields Limited | | | 8,123,180 |
| | |
| 327,500 | | Gold Reserve Inc., Class A, (1) | | | 1,827,450 |
| | |
| 440,100 | | Ivanhoe Mines Ltd., (1) | | | 6,267,024 |
| | |
| 996,883 | | Kinross Gold Corporation, (1) | | | 11,643,593 |
| | |
| 389,700 | | Lihir Gold Limited, Sponsored ADR | | | 10,007,496 |
| | |
| 313,600 | | Newcrest Mining Limited, Sponsored ADR | | | 6,099,520 |
| | |
| 573,500 | | Newmont Mining Corporation | | | 22,400,910 |
| | |
| 219,400 | | NovaGold Resources Inc., (1) | | | 3,297,582 |
| | |
| 1,054,100 | | Orezone Resources Inc., (1) | | | 1,770,888 |
| | Total Metals & Mining | | | 114,711,173 |
| | |
40
| | | | | |
| Shares | | Description | | Value |
| | | | | |
| | Multi-Utilities – 1.3% | | | |
| | |
| 287,300 | | Puget Energy, Inc. | | $ | 6,946,914 |
| | Oil, Gas & Consumable Fuels – 3.1% | | | |
| | |
| 100,000 | | Nexen Inc. | | | 3,095,000 |
| | |
| 208,500 | | Peabody Energy Corporation | | | 10,087,230 |
| | |
| 254,300 | | Warren Resources Inc., (1) | | | 2,970,224 |
| | Total Oil, Gas & Consumable Fuels | | | 16,152,454 |
| | |
| | Paper & Forest Products – 3.2% | | | |
| | |
| 348,000 | | Bowater Incorporated | | | 8,682,600 |
| | |
| 95,000 | | Buckeye Technologies Inc., (1) | | | 1,469,650 |
| | |
| 363,400 | | Domtar Corporation, (1) | | | 4,055,544 |
| | |
| 168,300 | | Wausau Paper Corp. | | | 2,255,220 |
| | Total Paper & Forest Products | | | 16,463,014 |
| | |
| | Road & Rail – 0.3% | | | |
| | |
| 9,000 | | Union Pacific Corporation | | | 1,036,350 |
| | Software – 0.8% | | | |
| | |
| 966,200 | | Sega Sammy Holdings Inc., Sponsored ADR | | | 3,937,265 |
| | Transportation Infrastructure – 1.1% | | | |
| | |
| 177,500 | | Stolt-Nielsen S.A | | | 5,914,710 |
| | Water Utilities – 0.4% | | | |
| | |
| 50,700 | | Companhia de Saneamento Basico do Estado de Sao Paulo, ADR | | | 2,234,856 |
| | Total Common Stocks (cost $315,456,190) | | | 362,468,284 |
| | |
| | | | | | | | | | | | | |
Principal
Amount (000) | | Description | | Coupon | | Maturity | | Ratings (2) | | | Value |
| | | CONVERTIBLE BONDS – 12.3% | | | | | | | | | | |
| | | | | |
| | | Aerospace & Defense – 1.2% | | | | | | | | | | |
| | | | | |
| $ | 5,440 | | Edo Corporation, Convertible Note | | 4.000% | | 11/15/25 | | N/R | | | $ | 6,290,000 |
| | | Airlines – 0.8% | | | | | | | | | | |
| | | | | |
| | 4,000 | | JetBlue Airways Corporation | | 3.500% | | 7/15/33 | | CCC | + | | | 3,900,000 |
| | | Commercial Services & Supplies – 0.3% | | | | | | | | | | |
| | | | | |
| | 2,115 | | Allied Waste Industries Inc., Convertible Debentures | | 4.250% | | 4/15/34 | | B | + | | | 2,033,044 |
| | | Computers & Peripherals – 0.8% | | | | | | | | | | |
| | 132 | | Adaptec Inc. | | 0.750% | | 12/22/23 | | CCC | + | | | 122,595 |
| | | | | |
| | 4,575 | | Hutchinson Technology Inc., Convertible Bond | | 3.250% | | 1/15/26 | | B | – | | | 3,945,938 |
| | 4,707 | | Total Computers & Peripherals | | | | | | | | | | 4,068,533 |
| | | Electrical Equipment – 1.0% | | | | | | | | | | |
| | | | | |
| | 4,492 | | GrafTech International Ltd. | | 1.625% | | 1/15/24 | | B2 | | | | 4,986,342 |
| | | Energy Equipment & Services – 1.7% | | | | | | | | | | |
| | | | | |
| | 8,715 | | Nabors Industries Inc., Convertible Bond Series 144A | | 0.940% | | 5/15/11 | | A | – | | | 8,540,700 |
| | | Health Care Providers & Services – 0.8% | | | | | | | | | | |
| | | | | |
| | 4,032 | | Apria Healthcare Group, Inc., Convertible Bonds | | 3.375% | | 9/01/33 | | Ba1 | | | | 4,238,640 |
| | | Machinery – 1.4% | | | | | | | | | | |
| | | | | |
| | 7,111 | | Albany International Corporation, Convertible Bond | | 2.250% | | 3/15/26 | | N/R | | | | 7,457,661 |
41
Portfolio of Investments
Nuveen Tradewinds Value Opportunities Fund (continued)
June 30, 2007
| | | | | | | | | | | | |
Principal
Amount (000) | | Description | | Coupon | | Maturity | | Ratings (2) | | Value |
| | | Metals & Mining – 2.5% | | | | | | | | | |
| | | | | |
| $ | 193 | | Apex Silver Mines Limited | | 2.875% | | 3/15/24 | | N/R | | $ | 178,766 |
| | | | | |
| | 13,047 | | Coeur d’Alene Mines Corporation, Convertible Bond | | 1.250% | | 1/15/24 | | B– | | | 11,660,756 |
| | | | | |
| | 786 | | Gold Reserve, Inc., Convertible Bonds | | 5.500% | | 6/15/22 | | NA | | | 826,283 |
| | 14,026 | | Total Metals & Mining | | | | | | | | | 12,665,805 |
| | | Oil, Gas & Consumable Fuels – 0.8% | | | | | | | | | |
| | | | | |
| | 4,004 | | Peabody Energy Corp., Convertible Bond | | 4.750% | | 12/15/66 | | Ba3 | | | 4,249,245 |
| | | Semiconductors & Equipment – 1.0% | | | | | | | | | |
| | | | | |
| | 1,808 | | Credence Systems Corporation, Convertible Bond | | 1.500% | | 5/15/08 | | N/R | | | 1,713,080 |
| | | | | |
| | 876 | | FEI Company, Convertible Notes | | 5.500% | | 8/15/08 | | B– | | | 873,810 |
| | | | | |
| | 2,638 | | International Rectifier Corporation, Convertible Subordinated Notes | | 4.250% | | 7/15/07 | | B+ | | | 2,644,594 |
| | 5,322 | | Total Semiconductors & Equipment | | | | | | | | | 5,231,484 |
| $ | 63,964 | | Total Convertible Bonds (cost $60,491,599) | | | | | | | | | 63,661,454 |
| | |
| | | | | | | | | | | | |
Principal
Amount (000) | | Description | | Coupon | | Maturity | | | | Value |
| | | SHORT-TERM INVESTMENTS – 17.0% | | | | | | | | | |
| $ | 87,481 | | Repurchase Agreement with Fixed Income Clearing Corporation, dated 6/29/07, repurchase price $87,510,048, collateralized by $67,990,000 U.S. Treasury Bonds, 8.125%, due 8/15/21, value $89,236,875 | | 4.000% | | 7/02/07 | | | | $ | 87,480,888 |
| | | | | | | | | | | | | |
| | | Total Short-Term Investments (cost $87,480,888) | | | | | | | | | 87,480,888 |
| | | |
| | | Total Investments (cost $463,428,677) – 99.6% | | | | | | | | | 513,610,626 |
| | | |
| | | Other Assets Less Liabilities – 0.4% | | | | | | | | | 2,316,376 |
| | | |
| | | Net Assets – 100% | | | | | | | | $ | 515,927,002 |
| | | |
| | (1) | | Non-income producing. |
| | (2) | | Ratings (not covered by the report of independent registered public accounting firm): Using the higher of Standard & Poor’s or Moody’s rating. Ratings below BBB by Standard & Poor’s Group or Baa by Moody’s Investor Service, Inc. are considered to be below investment grade. |
| | 144A | | Investment is exempt from registration under Rule 144A of the Securities Act of 1933, as amended. These investments may only be resold in transactions exempt from registration which are normally those transactions with qualified institutional buyers. |
| | NA | | This investment is not rated by Standard & Poor’s or Moody’s. |
| | ADR | | American Depositary Receipt. |
See accompanying notes to financial statements.
42
Statement of Assets and Liabilities
June 30, 2007
| | | | | | | | | | | | | | | | | | | |
| | | Multi-Cap
Value | | Large-Cap
Value | | Small/Mid- Cap Value | | | Small-Cap
Value | | Global
Value | | Value
Opportunities |
Assets | | | | | | | | | | | | | | | | | | | |
Investments, at value (cost $1,193,655,379, $10,520,607, $209,587,998, $191,030,474, $17,436,475 and $375,947,789, respectively) | | $
| 1,396,564,370
| | $
| 10,594,895
| | $
| 204,370,951
|
| | $
| 213,000,416
| | $
| 19,944,448
| | $
| 426,129,738
|
Short-term investments (at cost, which approximates value) | | | 102,730,911 | | | 1,716,772 | | | 16,028,106 | | | | 13,056,481 | | | 1,307,217 | | | 87,480,888 |
Cash | | | — | | | — | | | 3,918,506 | | | | 219,993 | | | 10,866 | | | — |
Cash denominated in foreign currencies (Cost $—, $—, $—, $—, $2,255 and $—, respectively) | | | — | | | — | | | — | | | | — | | | 2,250 | | | — |
Receivables: | | | | | | | | | | | | | | | | | | | |
Dividends | | | 1,566,503 | | | 8,366 | | | 394,137 | | | | 480,140 | | | 23,939 | | | 290,456 |
From Adviser | | | | | | 17,734 | | | — | | | | — | | | — | | | — |
Interest | | | 22,829 | | | 382 | | | 3,562 | | | | 2,901 | | | 290 | | | 499,777 |
Investments sold | | | — | | | — | | | — | | | | 2,124,158 | | | — | | | — |
Reclaims | | | 837 | | | — | | | — | | | | — | | | 2,300 | | | — |
Shares sold | | | 4,333,640 | | | 173,458 | | | 158,185 | | | | 1,698,768 | | | 48,450 | | | 10,804,195 |
Other assets | | | 25,970 | | | 5,258 | | | 11 | | | | 18 | | | 26,977 | | | 42,167 |
Total assets | | | 1,505,245,060 | | | 12,516,865 | | | 224,873,458 | | | | 230,582,875 | | | 21,366,737 | | | 525,247,221 |
Liabilities | | | | | | | | | | | | | | | | | | | |
Payables: | | | | | | | | | | | | | | | | | | | |
Due to broker | | | — | | | — | | | — | | | | 219,993 | | | — | | | — |
Investments purchased | | | — | | | 233,656 | | | 5,026,286 | | | | 1,027,051 | | | 34,828 | | | 8,068,438 |
Shares redeemed | | | 2,598,209 | | | — | | | 525,129 | | | | 443,749 | | | — | | | 578,607 |
Accrued expenses: | | | | | | | | | | | | | | | | | | | |
Management fees | | | 1,003,896 | | | — | | | 61,951 | | | | 233,630 | | | 29,124 | | | 431,535 |
12b-1 distribution and service fees | | | 567,310 | | | 1,547 | | | 1,175 | | | | 30,787 | | | 9,145 | | | 130,436 |
Other | | | 467,437 | | | 12,683 | | | 35,812 | | | | 38,181 | | | 14,364 | | | 111,203 |
Total liabilities | | | 4,636,852 | | | 247,886 | | | 5,650,353 | | | | 1,993,391 | | | 87,461 | | | 9,320,219 |
Net assets | | $ | 1,500,608,208 | | $ | 12,268,979 | | $ | 219,223,105 | | | $ | 228,589,484 | | $ | 21,279,276 | | $ | 515,927,002 |
Class A Shares | | | | | | | | | | | | | | | | | | | |
Net assets | | $ | 634,122,808 | | $ | 2,357,922 | | $ | 1,098,175 | | | $ | 78,081,003 | | $ | 6,887,940 | | $ | 248,826,617 |
Shares outstanding | | | 24,251,926 | | | 110,280 | | | 51,380 | | | | 2,592,379 | | | 247,880 | | | 7,661,419 |
Net asset value per share | | $ | 26.15 | | $ | 21.38 | | $ | 21.37 | | | $ | 30.12 | | $ | 27.79 | | $ | 32.48 |
Offering price per share (net asset value per share plus
maximum sales charge of 5.75% of offering price) | | $ | 27.75 | | $ | 22.68 | | $ | 22.67 | | | $ | 31.96 | | $ | 29.49 | | $ | 34.46 |
Class B Shares | | | | | | | | | | | | | | | | | | | |
Net assets | | $ | 75,067,529 | | $ | 281,157 | | $ | 278,459 | | | $ | 833,106 | | $ | 752,375 | | $ | 5,521,366 |
Shares outstanding | | | 2,927,731 | | | 13,200 | | | 13,079 | | | | 28,061 | | | 27,347 | | | 171,718 |
Net asset value and offering price per share | | $ | 25.64 | | $ | 21.30 | | $ | 21.29 | | | $ | 29.69 | | $ | 27.51 | | $ | 32.15 |
Class C Shares | | | | | | | | | | | | | | | | | | | |
Net assets | | $ | 441,047,863 | | $ | 1,116,880 | | $ | 974,173 | | | $ | 17,289,920 | | $ | 8,771,172 | | $ | 100,295,357 |
Shares outstanding | | | 17,200,343 | | | 52,444 | | | 45,776 | | | | 581,597 | | | 318,629 | | | 3,119,097 |
Net asset value and offering price per share | | $ | 25.64 | | $ | 21.30 | | $ | 21.28 | | | $ | 29.73 | | $ | 27.53 | | $ | 32.16 |
Class R Shares | | | | | | | | | | | | | | | | | | | |
Net assets | | $ | 350,370,008 | | $ | 8,513,020 | | $ | 216,872,298 | | | $ | 132,385,455 | | $ | 4,867,789 | | $ | 161,283,662 |
Shares outstanding | | | 13,428,329 | | | 397,680 | | | 10,130,705 | | | | 4,386,001 | | | 174,779 | | | 4,957,128 |
Net asset value and offering price per share | | $ | 26.09 | | $ | 21.41 | | $ | 21.41 | | | $ | 30.18 | | $ | 27.85 | | $ | 32.54 |
| | | | | | |
Net Assets Consist of: | | | | | | | | | | | | | | | | | | | |
Capital paid-in | | $ | 1,245,879,905 | | $ | 12,167,451 | | $ | 224,777,456 | | | $ | 201,262,394 | | $ | 18,110,726 | | $ | 456,090,959 |
Undistributed (Over-distribution of) net investment income | | | 3,301,502 | | | 24,811 | | | 488,462 | | | | 421,365 | | | 21,526 | | | 619,195 |
Accumulated net realized gain (loss) from investments, foreign
currency and derivative transactions | | | 48,517,810 | | | 2,429 | | | (825,766 | ) | | | 4,935,783 | | | 639,397 | | | 9,034,912 |
Net unrealized appreciation (depreciation) of investments and foreign currency | | | 202,908,991 | | | 74,288 | | | (5,217,047 | ) | | | 21,969,942 | | | 2,507,627 | | | 50,181,936 |
Net assets | | $ | 1,500,608,208 | | $ | 12,268,979 | | $ | 219,223,105 | | | $ | 228,589,484 | | $ | 21,279,276 | | $ | 515,927,002 |
See accompanying notes to financial statements.
43
Statement of Operations
| | | | | | | | | | | | | | | | | | | | | | | | |
| | | Multi-Cap Value | | | Large-Cap Value | | | Small/Mid-Cap Value | | | Small-Cap Value | | | Global
Value | | | Value Opportunities | |
| | | Year Ended
6/30/07 | | | For the Period
12/15/06
(commencement
of operations)
through 6/30/07 | | | For the Period
12/15/06
(commencement of operations) through 6/30/07 | | | Year Ended
6/30/07 | | | Year Ended
6/30/07 | | | Year Ended
6/30/07 | |
Investment Income | | | | | | | | | | | | | | | | | | | | | | | | |
Dividends (net of foreign tax withheld of $114,165, $214, $—, $—, $21,064 and $156,893, respectively) | | $ | 20,218,816 | | | $ | 30,832 | | | $ | 419,324 | | | $ | 2,275,642 | | | $ | 334,675 | | | $ | 3,280,429 | |
Interest | | | 4,814,847 | | | | 20,809 | | | | 209,518 | | | | 508,962 | | | | 65,684 | | | | 3,899,546 | |
Total investment income | | | 25,033,663 | | | | 51,641 | | | | 628,842 | | | | 2,784,604 | | | | 400,359 | | | | 7,179,975 | |
Expenses | | | | | | | | | | | | | | | | | | | | | | | | |
Management fees | | | 10,273,282 | | | | 18,842 | | | | 110,956 | | | | 1,377,470 | | | | 167,248 | | | | 2,922,543 | |
12b-1 service fees – Class A | | | 1,367,175 | | | | 1,095 | | | | 620 | | | | 144,359 | | | | 15,443 | | | | 389,953 | |
12b-1 distribution and service fees – Class B | | | 681,877 | | | | 1,417 | | | | 1,401 | | | | 6,066 | | | | 5,627 | | | | 30,460 | |
12b-1 distribution and service fees – Class C | | | 3,865,468 | | | | 2,990 | | | | 2,633 | | | | 132,762 | | | | 59,890 | | | | 569,935 | |
Shareholders’ servicing agent fees and expenses | | | 1,633,552 | | | | 378 | | | | 14,917 | | | | 189,058 | | | | 19,919 | | | | 255,520 | |
Custodian’s fees and expenses | | | 203,939 | | | | 3,468 | | | | 6,769 | | | | 37,578 | | | | 21,369 | | | | 59,276 | |
Trustees’ fees and expenses | | | 19,943 | | | | 61 | | | | 67 | | | | 2,960 | | | | 315 | | | | 6,940 | |
Professional fees | | | 61,173 | | | | 30,175 | | | | 30,175 | | | | 14,186 | | | | 7,447 | | | | 21,282 | |
Shareholders’ reports – printing and mailing expenses | | | 339,463 | | | | 5,947 | | | | 11,190 | | | | 41,171 | | | | 5,177 | | | | 68,338 | |
Federal and state registration fees | | | 155,808 | | | | 1,726 | | | | 8,031 | | | | 65,894 | | | | 41,721 | | | | 87,136 | |
Other expenses | | | 42,626 | | | | 2,300 | | | | 1,767 | | | | 4,826 | | | | 1,865 | | | | 8,884 | |
Total expenses before custodian fee credit and expense reimbursement | | | 18,644,306 | | | | 68,399 | | | | 188,526 | | | | 2,016,330 | | | | 346,021 | | | | 4,420,267 | |
Custodian fee credit | | | (1,864 | ) | | | (1,595 | ) | | | (2,063 | ) | | | (150 | ) | | | (482 | ) | | | (737 | ) |
Expense reimbursement | | | — | | | | (38,471 | ) | | | (44,718 | ) | | | (7,138 | ) | | | (21,281 | ) | | | — | |
Net expenses | | | 18,642,442 | | | | 28,333 | | | | 141,745 | | | | 2,009,042 | | | | 324,258 | | | | 4,419,530 | |
Net investment income | |
|
6,391,221 |
| | | 23,308 | | | | 487,097 | | | | 775,562 | | |
|
76,101 |
| | | 2,760,445 | |
Realized and Unrealized Gain (Loss) | | | | | | | | | | | | | | | | | | | | | | | | |
Net realized gain (loss) from: | | | | | | | | | | | | | | | | | | | | | | | | |
Investments | | | 91,028,279 | | | | 2,383 | | | | 36,933 | | | | 5,290,173 | | | | 884,733 | | | | 10,410,719 | |
Foreign currency | | | (283 | ) | | | — | | | | — | | | | — | | | | (9,282 | ) | | | 11 | |
Futures | | | — | | | | — | | | | (862,861 | ) | | | — | | | | — | | | | — | |
Change in net unrealized appreciation
(depreciation) of: | | | | | | | | | | | | | | | | | | | | | | | | |
Investments | | | 84,696,120 | | | | 74,288 | | | | (5,217,047 | ) | | | 19,476,662 | | | | 2,059,637 | | | | 47,264,768 | |
Foreign currency | | | 38 | | | | — | | | | — | | | | — | | | | (426 | ) | | | (10 | ) |
Net realized and unrealized gain (loss) | |
|
175,724,154 |
| | | 76,671 | | | | (6,042,975 | ) | | | 24,766,835 | | |
|
2,934,662 |
| | | 57,675,488 | |
Net increase (decrease) in net assets from operations | | $ | 182,115,375 | | | $ | 99,979 | | | $ | (5,555,878 | ) | | $ | 25,542,397 | | | $ | 3,010,763 | | | $ | 60,435,933 | |
See accompanying notes to financial statements.
44
Statement of Changes in Net Assets
| | | | | | | | | | | | | | | | | | | | | | | | |
| | | Multi-Cap Value | | | Large-Cap
Value | | | Small/Mid-Cap
Value | | | Small-Cap Value | |
| | | Year Ended
6/30/07 | | | Year Ended
6/30/06 | | | For the Period
12/15/06
(commencement
of operations)
through 6/30/07 | | | For the Period
12/15/06
(commencement
of operations)
through 6/30/07 | | | Year Ended
6/30/07 | | | Year Ended
6/30/06 | |
Operations | | | | | | | | | | | | | | | | | | | | | | | | |
Net investment income | | $ | 6,391,221 | | | $ | 2,760,555 | | | $ | 23,308 | | | $ | 487,097 | | | $ | 775,562 | | | $ | 74,814 | |
Net realized gain (loss) from: | | | | | | | | | | | | | | | | | | | | | | | | |
Investments | | | 91,028,279 | | | | 18,138,796 | | | | 2,383 | | | | 36,933 | | | | 5,290,173 | | | | 255,505 | |
Foreign currency | | | (283 | ) | | | — | | | | — | | | | — | | | | — | | | | — | |
Futures | | | — | | | | — | | | | — | | | | (862,861 | ) | | | — | | | | — | |
Change in net unrealized appreciation (depreciation) of: | | | | | | | | | | | | | | | | | | | | | | | | |
Investments | | | 84,696,120 | | | | 74,904,668 | | | | 74,288 | | | | (5,217,047 | ) | | | 19,476,662 | | | | 2,471,268 | |
Foreign currency | | | 38 | | | | — | | | | — | | | | — | | | | — | | | | — | |
Net increase (decrease) in net assets from operations | | | 182,115,375 | | | | 95,804,019 | | | | 99,979 | | | | (5,555,878 | ) | | | 25,542,397 | | | | 2,801,587 | |
Distributions to Shareholders | | | | | | | | | | | | | | | | | | | | | | | | |
From net investment income: | | | | | | | | | | | | | | | | | | | | | | | | |
Class A | | | (2,927,086 | ) | | | (645,331 | ) | | | — | | | | — | | | | (88,033 | ) | | | (12,619 | ) |
Class B | | | — | | | | — | | | | — | | | | — | | | | — | | | | — | |
Class C | | | — | | | | — | | | | — | | | | — | | | | — | | | | — | |
Class R | | | (2,069,137 | ) | | | (563,169 | ) | | | — | | | | — | | | | (303,731 | ) | | | (22,416 | ) |
From accumulated net realized gains: | | | | | | | | | | | | | | | | | | | | | | | | |
Class A | | | (24,405,454 | ) | | | (3,335,819 | ) | | | — | | | | — | | | | (229,525 | ) | | | (22,461 | ) |
Class B | | | (3,122,917 | ) | | | (600,391 | ) | | | — | | | | — | | | | (2,312 | ) | | | (906 | ) |
Class C | | | (17,573,222 | ) | | | (2,635,886 | ) | | | — | | | | — | | | | (57,179 | ) | | | (14,793 | ) |
Class R | | | (12,137,413 | ) | | | (1,502,118 | ) | | | — | | | | — | | | | (329,848 | ) | | | (29,134 | ) |
Decrease in net assets from distributions to shareholders | | | (62,235,229 | ) | | | (9,282,714 | ) | | | — | | | | — | | | | (1,010,628 | ) | | | (102,329 | ) |
Fund Share Transactions | | | | | | | | | | | | | | | | | | | | | | | | |
Proceeds from sale of shares | | | 556,975,927 | | | | 553,212,092 | | | | 12,296,588 | | | | 228,388,120 | | | | 170,488,119 | | | | 51,606,751 | |
Proceeds from shares issued to shareholders due
to reinvestment of distributions | | | 55,329,374 | | | | 8,082,954 | | | | — | | | | — | | | | 817,942 | | | | 42,571 | |
| | | 612,305,301 | | | | 561,295,046 | | | | 12,296,588 | | | | 228,388,120 | | | | 171,306,061 | | | | 51,649,322 | |
Cost of shares redeemed | | | (220,159,751 | ) | | | (83,168,952 | ) | | | (127,588 | ) | | | (3,609,137 | ) | | | (21,905,595 | ) | | | (1,787,227 | ) |
Net increase (decrease) in net assets from Fund share transactions | | | 392,145,550 | | | | 478,126,094 | | | | 12,169,000 | | | | 224,778,983 | | | | 149,400,466 | | | | 49,862,095 | |
Capital contribution from sub-adviser | | | — | | | | — | | | | — | | | | — | | | | — | | | | 9,060 | |
Net increase (decrease) in net assets | | | 512,025,696 | | | | 564,647,399 | | | | 12,268,979 | | | | 219,223,105 | | | | 173,932,235 | | | | 52,570,413 | |
Net assets at the beginning of period | | | 988,582,512 | | | | 423,935,113 | | | | — | | | | — | | | | 54,657,249 | | | | 2,086,836 | |
Net assets at the end of period | | $ | 1,500,608,208 | | | $ | 988,582,512 | | | $ | 12,268,979 | | | $ | 219,223,105 | | | $ | 228,589,484 | | | $ | 54,657,249 | |
Undistributed (Over-distribution of) net investment income at the end of period | | $ | 3,301,502 | | | $ | 1,906,787 | | | $ | 24,811 | | | $ | 488,462 | | | $ | 421,365 | | | $ | 47,996 | |
See accompanying notes to financial statements.
45
Statement of Changes in Net Assets (continued)
| | | | | | | | | | | | | | | | |
| | | Global Value | | | Value Opportunities | |
| | | Year Ended
6/30/07 | | | Year Ended
6/30/06 | | | Year Ended
6/30/07 | | | Year Ended
6/30/06 | |
Operations | | | | | | | | | | | | | | | | |
Net investment income | | $ | 76,101 | | | $ | 47,038 | | | $ | 2,760,445 | | | $ | 342,346 | |
Net realized gain (loss) from: | | | | | | | | | | | | | | | | |
Investments | | | 884,733 | | | | 194,326 | | | | 10,410,719 | | | | 1,069,411 | |
Foreign currency | | | (9,282 | ) | | | — | | | | 11 | | | | — | |
Futures | | | — | | | | — | | | | — | | | | — | |
Change in net unrealized appreciation (depreciation) of: | | | | | | | | | | | | | | | | |
Investments | | | 2,059,637 | | | | 387,992 | | | | 47,264,768 | | | | 2,879,289 | |
Foreign currency | | | (426 | ) | | | — | | | | (10 | ) | | | — | |
Net increase (decrease) in net assets from operations | | | 3,010,763 | | | | 629,356 | | | | 60,435,933 | | | | 4,291,046 | |
Distributions to Shareholders | | | | | | | | | | | | | | | | |
From net investment income: | | | | | | | | | | | | | | | | |
Class A | | | (46,899 | ) | | | (3,808 | ) | | | (1,500,116 | ) | | | (15,990 | ) |
Class B | | | — | | | | — | | | | (8,089 | ) | | | — | |
Class C | | | — | | | | — | | | | (155,520 | ) | | | — | |
Class R | | | (39,526 | ) | | | (11,540 | ) | | | (836,917 | ) | | | (14,230 | ) |
From accumulated net realized gains: | | | | | | | | | | | | | | | | |
Class A | | | (156,985 | ) | | | (6,911 | ) | | | (1,310,367 | ) | | | (51,530 | ) |
Class B | | | (13,787 | ) | | | (692 | ) | | | (24,048 | ) | | | (1,367 | ) |
Class C | | | (137,778 | ) | | | (8,414 | ) | | | (462,457 | ) | | | (27,359 | ) |
Class R | | | (102,310 | ) | | | (17,209 | ) | | | (563,686 | ) | | | (29,054 | ) |
Decrease in net assets from distributions to shareholders | | | (497,285 | ) | | | (48,574 | ) | | | (4,861,200 | ) | | | (139,530 | ) |
Fund Share Transactions | | | | | | | | | | | | | | | | |
Proceeds from sale of shares | | | 10,675,292 | | | | 8,810,547 | | | | 358,261,389 | | | | 133,672,285 | |
Proceeds from shares issued to shareholders due
to reinvestment of distributions | | | 343,018 | | | | 18,101 | | | | 3,418,775 | | | | 78,060 | |
| | | 11,018,310 | | | | 8,828,648 | | | | 361,680,164 | | | | 133,750,345 | |
Cost of shares redeemed | | | (3,464,488 | ) | | | (271,573 | ) | | | (35,252,078 | ) | | | (6,087,087 | ) |
Net increase (decrease) in net assets from Fund share
transactions | | | 7,553,822 | | | | 8,557,075 | | | | 326,428,086 | | | | 127,663,258 | |
Capital contribution from sub-adviser | | | — | | | | — | | | | — | | | | — | |
Net increase (decrease) in net assets | | | 10,067,300 | | | | 9,137,857 | | | | 382,002,819 | | | | 131,814,774 | |
Net assets at the beginning of period | | | 11,211,976 | | | | 2,074,119 | | | | 133,924,183 | | | | 2,109,409 | |
Net assets at the end of period | | $ | 21,279,276 | | | $ | 11,211,976 | | | $ | 515,927,002 | | | $ | 133,924,183 | |
Undistributed (Over-distribution of) net investment income at
the end of period | | $ | 21,526 | | | $ | 41,131 | | | $ | 619,195 | | | $ | 323,133 | |
See accompanying notes to financial statements.
46
Notes to Financial Statements
1. General Information and Significant Accounting Policies
The Nuveen Investment Trust (the “Trust”) is an open-end management investment company registered under the Investment Company Act of 1940, as amended. The Trust is comprised of the Nuveen NWQ Multi-Cap Value Fund (“Multi-Cap Value”), Nuveen NWQ Large-Cap Value Fund (“Large-Cap Value”), Nuveen NWQ Small/Mid-Cap Value Fund (“Small/Mid-Cap Value”), Nuveen NWQ Small-Cap Value Fund (“Small-Cap Value”), Nuveen NWQ Global Value Fund (“Global Value”) and Nuveen Tradewinds Value Opportunities Fund (“Value Opportunities”) (formerly Nuveen NWQ Value Opportunities Fund) (collectively, the “Funds”), among others. The Trust was organized as a Massachusetts business trust in 1996.
Effective March 1, 2006, NWQ Investment Management Company, LLC (“NWQ”) reorganized into two distinct entities: NWQ and Tradewinds Global Investors, LLC (“Tradewinds”). As a result of this reorganization, Tradewinds assumed all of the sub-advisory responsibilities for Value Opportunities. With respect to Global Value, NWQ continues to sub-advise the domestic portion of the Fund’s portfolio while Tradewinds assumed sub-advisory responsibilities for the international portion of the Fund’s portfolio. This reorganization did not impact NWQ’s sub-advisory responsibilities for Multi-Cap Value and Small-Cap Value. Additionally, this transition did not cause a change in the portfolio management of the Funds or their investment objectives or policies.
Multi-Cap Value ordinarily invests at least 80% of its assets in equity securities of companies with large, medium and small capitalizations that are selected on an opportunistic basis in an attempt to provide long-term capital appreciation.
Large-Cap Value ordinarily invests at least 80% of its assets in equity securities of companies with market capitalizations at the time of investment comparable to companies in the Russell 1000 Index in an attempt to provide long-term capital appreciation.
Small/Mid-Cap Value ordinarily invests at least 80% of its assets in equity securities of companies with market capitalizations at the time of investment comparable to companies in the Russell 2500 Index in an attempt to provide long-term capital appreciation.
Small-Cap Value ordinarily invests at least 80% of its assets in equity securities of companies with small capitalizations at the time of purchase that are selected on an opportunistic basis in an attempt to provide long-term capital appreciation.
Global Value ordinarily invests at least 80% of its assets in equity securities of U.S. and foreign companies in an attempt to provide long-term capital appreciation. The proportion of assets invested in foreign investments will fluctuate but generally will be within 15 percentage points of the proportion of foreign companies comprising the MSCI World Index. The Fund may also invest up to 10% of its assets in equity securities of foreign companies domiciled in emerging markets.
Value Opportunities ordinarily invests at least 80% of its assets in equity securities, including convertible securities, of companies with varying capitalizations generally ranging from $100 million to $15 billion in an attempt to provide long-term capital appreciation.
The following is a summary of significant accounting policies followed by the Funds in the preparation of their financial statements in accordance with accounting principles generally accepted in the United States.
Investment Valuation
Exchange-listed securities are generally valued at the last sales price on the securities exchange on which such securities are primarily traded. Securities traded on a securities exchange for which there are no transactions on a given day or securities not listed on a securities exchange are valued at the mean of the closing bid and asked prices. Securities traded on Nasdaq are valued at the Nasdaq Official Closing Price. The prices of fixed-income securities are generally provided by an independent pricing service approved by the Funds’ Board of Trustees and based on the mean between the bid and asked prices. Futures contracts are valued using the closing settlement price, or, in the absence of such a price, at the mean of the bid and asked prices. When price quotes are not readily available, the pricing service or, in the absence of a pricing service for a particular investment, the Board of Trustees of the Funds, or its designee, may establish fair value using a wide variety of market data including yields or prices of investments of comparable quality, type of issue, coupon, maturity and rating, market quotes or indications of value from securities dealers, evaluations of anticipated cash flows or collateral, general market conditions and other information and analysis, including the obligor’s credit characteristics considered relevant by the pricing service or the Board of Trustees’ designee. Short-term investments are valued at amortized cost, which approximates market value.
Investment Transactions
Investment transactions are recorded on a trade date basis. Realized gains and losses from investment transactions are determined on the specific identification method. Investments purchased on a when-issued/delayed delivery basis may have extended settlement periods. Any investments so purchased are subject to market fluctuation during this period. The Funds have instructed the custodian to segregate assets with a current value at least equal to the amount of the when issued/delayed delivery purchase commitments. At June 30, 2007, there were no such outstanding purchase commitments in any of the Funds.
Investment Income
Dividend income is recorded on the ex-dividend date or, for foreign securities, when information is available. Interest income, which includes the amortization of premiums and accretion of discounts for financial reporting purposes, is recorded on an accrual basis. Interest income also includes paydown gains and losses, if any.
47
Notes to Financial Statements (continued)
Dividends and Distributions to Shareholders
Distributions to shareholders are recorded on the ex-dividend date. The amount and timing of distributions are determined in accordance with federal income tax regulations, which may differ from accounting principles generally accepted in the United States.
Dividends from net investment income and net realized capital gains from investment transactions, if any, are declared and distributed to shareholders annually. Furthermore, capital gains are distributed only to the extent they exceed available capital loss carryforwards.
Federal Income Taxes
Each Fund is a separate taxpayer for federal income tax purposes. Each Fund intends to distribute substantially all net investment income and net capital gains to shareholders and to otherwise comply with the requirements of Subchapter M of the Internal Revenue Code applicable to regulated investment companies. Therefore, no federal income tax provision is required.
Flexible Sales Charge Program
Each Fund offers Class A, B, C and R Shares, however, Large-Cap Value and Small/Mid-Cap Value will issue Class B Shares only upon exchange of Class B Shares from another Nuveen fund or for purposes of dividend reinvestment. Class A Shares are generally sold with an up-front sales charge and incur a .25% annual 12b-1 service fee. Class A Share purchases of $1 million or more are sold at net asset value without an up-front sales charge but may be subject to a contingent deferred sales charge (“CDSC”) if redeemed within 18 months of purchase. Class B Shares are sold without an up-front sales charge but incur a .75% annual 12b-1 distribution fee and a .25% annual 12b-1 service fee. An investor purchasing Class B Shares agrees to pay a CDSC of up to 5% depending upon the length of time the shares are held by the investor (CDSC is reduced to 0% at the end of six years). Class B Shares convert to Class A Shares eight years after purchase. Class C Shares are sold without an up-front sales charge but incur a .75% annual 12b-1 distribution fee and a .25% annual 12b-1 service fee. An investor purchasing Class C Shares agrees to pay a CDSC of 1% if Class C Shares are redeemed within one year of purchase. Class R Shares are not subject to any sales charge or 12b-1 distribution or service fees. Class R Shares are available only under limited circumstances.
Futures Contracts
The Funds are authorized to invest in futures contracts. Upon entering into a futures contract, a Fund is required to deposit with the broker an amount of cash or liquid securities equal to a specified percentage of the contract amount. This is known as the “initial margin.” Subsequent payments (“variation margin”) are made or received by a Fund each day, depending on the daily fluctuation of the value of the contract.
During the period the futures contract is open, changes in the value of the contract are recognized as an unrealized gain or loss by “marking-to-market” on a daily basis to reflect the changes in market value of the contract. When the contract is closed or expired, a Fund records a realized gain or loss equal to the difference between the value of the contract on the closing date and the value of the contract when originally entered into. Cash held by the broker to cover initial margin requirements on open futures contracts, if any, is noted in the Statement of Assets and Liabilities. Additionally, the Statement of Assets and Liabilities reflects a receivable or payable for the variation margin when applicable. Small/Mid-Cap Value was the only Fund to invest in futures contracts during the fiscal year ended June 30, 2007.
Risks of investments in futures contracts include the possible adverse movement of the securities or indices underlying the contracts, the possibility that there may not be a liquid secondary market for the contracts and/or that a change in the value of the contract may not correlate with a change in the value of the underlying securities or indices.
Repurchase Agreements
In connection with transactions in repurchase agreements, it is the Funds’ policy that its custodian take possession of the underlying collateral securities, the fair value of which exceeds the principal amount of the repurchase transaction, including accrued interest, at all times. If the seller defaults, and the fair value of the collateral declines, realization of the collateral may be delayed or limited.
Expense Allocation
Expenses of the Funds that are not directly attributable to a specific class of shares are prorated among the classes based on the relative net assets of each class. Expenses directly attributable to a class of shares, which presently only include 12b-1 distribution and service fees, are recorded to the specific class.
Foreign Currency Transactions
The Funds are authorized to engage in foreign currency exchange transactions, including foreign currency forward, options and futures contracts. To the extent that the Funds invest in securities and/or contracts that are denominated in a currency other than U.S. dollars, the Funds will be subject to currency risk, which is the risk that an increase in the U.S. dollar relative to the foreign currency will reduce returns or portfolio value. Generally, when the U.S. dollar rises in value against a foreign currency, the Funds’ investments denominated in that currency will lose value because its currency is worth fewer U.S. dollars; the opposite effect occurs if the U.S. dollar falls in relative value. Investments and other assets and liabilities denominated in foreign currencies are converted into U.S. dollars on a spot (i.e. cash) basis at the spot rate prevailing in the foreign currency exchange market at the time of valuation. Purchases and sales of investments and dividend income denominated in foreign currencies are translated into U.S. dollars on the respective dates of such transactions. The gains or losses resulting from changes in foreign exchange rates are included with net realized and unrealized gain (loss) in the Statement of Operations.
48
The books and records of the Funds are maintained in U.S. dollars. Foreign currencies, investments and other assets and liabilities are translated into U.S. dollars at 4:00 p.m. Eastern time. Investments and income and expenses are translated on the respective dates of such transactions. Net realized foreign currency gains and losses resulting from changes in exchange rates include foreign currency gains and losses between trade date and settlement date of the transactions, foreign currency transactions, and the difference between the amounts of interest and dividends recorded on the books of a Fund and the amounts actually received.
Custodian Fee Credit
Each Fund has an arrangement with the custodian bank whereby certain custodian fees and expenses are reduced by credits earned on each Fund’s cash on deposit with the bank. Such deposit arrangements are an alternative to overnight investments. Credits for cash balances may be offset by charges for any days on which the Fund overdraws its account at the custodian bank.
Indemnifications
Under the Trust’s organizational documents, its Officers and Trustees are indemnified against certain liabilities arising out of the performance of their duties to the Trust. In addition, in the normal course of business, the Trust enters into contracts that provide general indemnifications to other parties. The Trust’s maximum exposure under these arrangements is unknown as this would involve future claims that may be made against the Trust that have not yet occurred. However, the Trust has not had prior claims or losses pursuant to these contracts and expects the risk of loss to be remote.
Use of Estimates
The preparation of financial statements in conformity with accounting principles generally accepted in the United States requires management to make estimates and assumptions that affect the reported amounts of assets and liabilities at the date of the financial statements and the reported amounts of increases and decreases in net assets from operations during the reporting period. Actual results may differ from those estimates.
2. Fund Shares
Transactions in Fund shares were as follows:
| | | | | | | | | | | | | | |
| | | Multi-Cap Value | |
| | | Year Ended 6/30/07 | | | Year Ended 6/30/06 | |
| | | Shares | | | Amount | | | Shares | | | Amount | |
Shares sold: | | | | | | | | | | | | | | |
Class A | | 10,818,605 | | | $ | 268,508,603 | | | 10,389,068 | | | $ | 236,857,999 | |
Class A – automatic conversion of Class B shares | | 42,800 | | | | 1,052,576 | | | 27,409 | | | | 626,109 | |
Class B | | 676,609 | | | | 16,516,601 | | | 1,082,888 | | | | 24,152,149 | |
Class C | | 5,346,510 | | | | 130,268,681 | | | 7,617,996 | | | | 170,099,973 | |
Class R | | 5,632,776 | | | | 140,629,466 | | | 5,319,603 | | | | 121,475,862 | |
Shares issued to shareholders due to reinvestment
of distributions: | | | | | | | | | | | | | | |
Class A | | 990,601 | | | | 24,368,770 | | | 156,347 | | | | 3,475,266 | |
Class B | | 112,666 | | | | 2,714,128 | | | 23,958 | | | | 524,687 | |
Class C | | 603,038 | | | | 14,533,204 | | | 97,137 | | | | 2,127,192 | |
Class R | | 558,136 | | | | 13,713,272 | | | 88,139 | | | | 1,955,809 | |
| | | 24,781,741 | | | | 612,305,301 | | | 24,802,545 | | | | 561,295,046 | |
Shares redeemed: | | | | | | | | | | | | | | |
Class A | | (4,812,101 | ) | | | (121,622,643 | ) | | (2,077,618 | ) | | | (47,011,348 | ) |
Class B | | (312,403 | ) | | | (7,741,099 | ) | | (215,562 | ) | | | (4,881,089 | ) |
Class B – automatic conversion to Class A shares | | (43,554 | ) | | | (1,052,576 | ) | | (27,791 | ) | | | (626,109 | ) |
Class C | | (1,913,409 | ) | | | (47,510,935 | ) | | (871,982 | ) | | | (19,528,196 | ) |
Class R | | (1,687,855 | ) | | | (42,232,498 | ) | | (492,772 | ) | | | (11,122,210 | ) |
| | | (8,769,322 | ) | | | (220,159,751 | ) | | (3,685,725 | ) | | | (83,168,952 | ) |
Net increase (decrease) | | 16,012,419 | | | $ | 392,145,550 | | | 21,116,820 | | | $ | 478,126,094 | |
49
Notes to Financial Statements (continued)
| | | | | | | |
| | | Large-Cap Value | |
| | | For the Period 12/15/06 (commencement of operations)
through 6/30/07 | |
| | | Shares | | | Amount | |
Shares sold: | | | | | | | |
Class A | | 113,028 | | | $ | 2,391,626 | |
Class B | | 13,200 | | | | 265,000 | |
Class C | | 52,444 | | | | 1,093,205 | |
Class R | | 400,872 | | | | 8,546,757 | |
Shares issued to shareholders due to reinvestment
of distributions: | | | | | | | |
Class A | | — | | | | — | |
Class B | | — | | | | — | |
Class C | | — | | | | — | |
Class R | | — | | | | — | |
| | | 579,544 | | | | 12,296,588 | |
Shares redeemed: | | | | | | | |
Class A | | (2,748 | ) | | | (59,050 | ) |
Class B | | — | | | | — | |
Class C | | — | | | | — | |
Class R | | (3,192 | ) | | | (68,538 | ) |
| | | (5,940 | ) | | | (127,588 | ) |
Net increase (decrease) | | 573,604 | | | $ | 12,169,000 | |
| |
| | | Small/Mid-Cap Value | |
| | | For the Period 12/15/06 (commencement of operations)
through 6/30/07 | |
| | | Shares | | | Amount | |
Shares sold: | | | | | | | |
Class A | |
52,945 |
| |
$ |
1,112,010 |
|
Class B | |
13,079 |
| |
|
262,319 |
|
Class C | |
45,776 |
| |
|
940,817 |
|
Class R | |
10,296,580 |
| |
|
226,072,974 |
|
Shares issued to shareholders due to reinvestment
of distributions: | | | | | | | |
Class A | | — | | | | — | |
Class B | | — | | | | — | |
Class C | | — | | | | — | |
Class R | | — | | | | — | |
| | | 10,408,380 | | | | 228,388,120 | |
Shares redeemed: | | | | | | | |
Class A | | (1,565 | ) | | | (34,014 | ) |
Class B | | — | | | | — | |
Class C | | — | | | | — | |
Class R | | (165,875 | ) | | | (3,575,123 | ) |
| | | (167,440 | ) | | | (3,609,137 | ) |
Net increase (decrease) | | 10,240,940 | | | $ | 224,778,983 | |
50
| | | | | | | | | | | | | | |
| | | Small-Cap Value | |
| | | Year Ended 6/30/07 | | | Year Ended 6/30/06 | |
| | | Shares | | | Amount | | | Shares | | | Amount | |
Shares sold: | | | | | | | | | | | | | | |
Class A | | 1,585,220 | | | $ | 42,258,545 | | | 1,333,486 | | | $ | 33,398,780 | |
Class B | | 16,522 | | | | 435,436 | | | 14,445 | | | | 360,053 | |
Class C | | 359,329 | | | | 9,444,793 | | | 285,367 | | | | 7,085,258 | |
Class R | | 4,293,788 | | | | 118,349,345 | | | 431,074 | | | | 10,762,660 | |
Shares issued to shareholders due to reinvestment
of distributions: | | | | | | | | | | | | | | |
Class A | | 9,390 | | | | 255,254 | | | 1,129 | | | | 26,264 | |
Class B | | 53 | | | | 1,421 | | | 14 | | | | 320 | |
Class C | | 969 | | | | 26,014 | | | 187 | | | | 4,321 | |
Class R | | 19,629 | | | | 535,253 | | | 501 | | | | 11,666 | |
| | | 6,284,900 | | | | 171,306,061 | | | 2,066,203 | | | | 51,649,322 | |
Shares redeemed: | | | | | | | | | | | | | | |
Class A | | (301,374 | ) | | | (8,326,649 | ) | | (35,597 | ) | | | (898,476 | ) |
Class B | | (2,799 | ) | | | (75,305 | ) | | (299 | ) | | | (7,425 | ) |
Class C | | (58,320 | ) | | | (1,644,194 | ) | | (6,060 | ) | | | (144,094 | ) |
Class R | | (429,839 | ) | | | (11,859,447 | ) | | (28,777 | ) | | | (737,232 | ) |
| | | (792,332 | ) | | | (21,905,595 | ) | | (70,733 | ) | | | (1,787,227 | ) |
Net increase (decrease) | | 5,492,568 | | | $ | 149,400,466 | | | 1,995,470 | | | $ | 49,862,095 | |
| |
| | | Global Value | |
| | | Year Ended 6/30/07 | | | Year Ended 6/30/06 | |
| | | Shares | | | Amount | | | Shares | | | Amount | |
Shares sold: | | | | | | | | | | | | | | |
Class A | | 167,536 | | | $ | 4,284,539 | | | 179,477 | | | $ | 4,178,364 | |
Class B | | 15,264 | | | | 383,152 | | | 12,409 | | | | 286,356 | |
Class C | | 180,091 | | | | 4,616,293 | | | 151,463 | | | | 3,483,915 | |
Class R | | 54,720 | | | | 1,391,308 | | | 36,647 | | | | 861,912 | |
Shares issued to shareholders due to reinvestment
of distributions: | | | | | | | | | | | | | | |
Class A | | 7,036 | | | | 182,275 | | | 444 | | | | 10,003 | |
Class B | | 497 | | | | 12,728 | | | 30 | | | | 671 | |
Class C | | 3,625 | | | | 92,832 | | | 291 | | | | 6,477 | |
Class R | | 2,125 | | | | 55,183 | | | 42 | | | | 950 | |
| | | 430,894 | | | | 11,018,310 | | | 380,803 | | | | 8,828,648 | |
Shares redeemed: | | | | | | | | | | | | | | |
Class A | | (99,043 | ) | | | (2,617,785 | ) | | (7,695 | ) | | | (178,947 | ) |
Class B | | (978 | ) | | | (26,311 | ) | | — | | | | — | |
Class C | | (13,434 | ) | | | (347,974 | ) | | (3,532 | ) | | | (82,394 | ) |
Class R | | (17,933 | ) | | | (472,418 | ) | | (447 | ) | | | (10,232 | ) |
| | | (131,388 | ) | | | (3,464,488 | ) | | (11,674 | ) | | | (271,573 | ) |
Net increase (decrease) | | 299,506 | | | $ | 7,553,822 | | �� | 369,129 | | | $ | 8,557,075 | |
51
Notes to Financial Statements (continued)
| | | | | | | | | | | | | | |
| | | Value Opportunities | |
| | | Year Ended 6/30/07 | | | Year Ended 6/30/06 | |
| | | Shares | | | Amount | | | Shares | | | Amount | |
Shares sold: | | | | | | | | | | | | | | |
Class A | | 5,707,916 | | | $ | 169,532,744 | | | 2,800,243 | | | $ | 73,168,991 | |
Class B | | 138,773 | | | | 4,104,593 | | | 42,433 | | | | 1,077,815 | |
Class C | | 2,395,820 | | | | 70,941,868 | | | 844,980 | | | | 21,566,757 | |
Class R | | 3,742,157 | | | | 113,682,184 | | | 1,423,561 | | | | 37,858,722 | |
Shares issued to shareholders due to reinvestment
of distributions: | | | | | | | | | | | | | | |
Class A | | 59,808 | | | | 1,779,441 | | | 2,387 | | | | 56,431 | |
Class B | | 764 | | | | 22,505 | | | 18 | | | | 420 | |
Class C | | 14,133 | | | | 416,563 | | | 685 | | | | 15,957 | |
Class R | | 40,295 | | | | 1,200,266 | | | 221 | | | | 5,252 | |
| | | 12,099,666 | | | | 361,680,164 | | | 5,114,528 | | | | 133,750,345 | |
Shares redeemed: | | | | | | | | | | | | | | |
Class A | | (834,321 | ) | | | (24,951,989 | ) | | (74,739 | ) | | | (1,990,582 | ) |
Class B | | (6,864 | ) | | | (211,210 | ) | | (3,531 | ) | | | (90,853 | ) |
Class C | | (119,869 | ) | | | (3,629,750 | ) | | (16,777 | ) | | | (444,505 | ) |
Class R | | (212,810 | ) | | | (6,459,129 | ) | | (135,921 | ) | | | (3,561,147 | ) |
| | | (1,173,864 | ) | | | (35,252,078 | ) | | (230,968 | ) | | | (6,087,087 | ) |
Net increase (decrease) | | 10,925,802 | | | $ | 326,428,086 | | | 4,883,560 | | | $ | 127,663,258 | |
3. Investment Transactions
Purchases and sales (including maturities but excluding short-term investments and derivative transactions) during the fiscal year ended June 30, 2007, were as follows:
| | | | | | | | | | | | | | | | | | |
| | | Multi-Cap
Value | | Large-Cap
Value* | | Small/Mid-Cap
Value* | | Small-Cap
Value | | Global
Value | | Value
Opportunities |
Purchases | | $ | 547,108,890 | | $ | 10,532,352 | | $ | 209,909,680 | | $ | 168,866,922 | | $ | 11,690,785 | | $ | 316,653,003 |
Sales and maturities | | | 228,301,500 | | | 14,172 | | | 358,708 | | | 31,760,222 | | | 4,887,419 | | | 58,796,344 |
* For the period December 15, 2006 (commencement of operations) through June 30, 2007.
4. Income Tax Information
The following information is presented on an income tax basis. Differences between amounts for financial statement and federal income tax purposes are primarily due to timing differences in recognizing certain gains and losses on investment transactions. To the extent that differences arise that are permanent in nature, such amounts are reclassified within the capital accounts on the Statement of Assets and Liabilities presented in the annual report, based on their federal tax basis treatment; temporary differences do not require reclassification. Temporary and permanent differences do not impact the net asset values of the Funds.
At June 30, 2007, the cost of investments was as follows:
| | | | | | | | | | | | | | | | | | |
| | | Multi-Cap Value | | Large-Cap
Value | | Small/Mid-Cap
Value | | Small-Cap
Value | | Global
Value | | Value
Opportunities |
Cost of investments | | $ | 1,296,425,095 | | $ | 12,237,379 | | $ | 225,617,758 | | $ | 204,264,173 | | $ | 18,748,743 | | $ | 470,206,078 |
Gross unrealized appreciation and gross unrealized depreciation of investments at June 30, 2007, were as follows:
| | | | | | | | | | | | | | | | | | | | | | | | |
| | | Multi-Cap
Value | | | Large-Cap
Value | | | Small/Mid-Cap
Value | | | Small-Cap
Value | | | Global
Value | | | Value
Opportunities | |
Gross unrealized: | | | | | | | | | | | | | | | | | | | | | | | | |
Appreciation | | $ | 252,756,224 | | | $ | 277,123 | | | $ | 1,858,438 | | | $ | 31,465,058 | | | $ | 2,984,834 | | | $ | 61,703,004 | |
Depreciation | | | (49,886,038 | ) | | | (202,835 | ) | | | (7,077,139 | ) | | | (9,672,334 | ) | | | (481,912 | ) | | | (18,298,456 | ) |
Net unrealized appreciation (depreciation) of investments | | $ | 202,870,186 | | | $ | 74,288 | | | $ | (5,218,701 | ) | | $ | 21,792,724 | | | $ | 2,502,922 | | | $ | 43,404,548 | |
52
The tax components of undistributed net ordinary income and net long-term capital gains at June 30, 2007, the Funds’ tax year end, were as follows:
| | | | | | | | | | | | | | | | | | |
| | | Multi-Cap
Value | | Large-Cap
Value | | Small/Mid-Cap
Value | | Small-Cap
Value | | Global
Value | | Value
Opportunities |
Undistributed net ordinary income * | | $ | 20,589,148 | | $ | 27,239 | | $ | 488,463 | | $ | 4,879,582 | | $ | 389,668 | | $ | 11,763,488 |
Undistributed net long-term capital gains | | | 31,305,510 | | | — | | | — | | | 654,786 | | | 276,331 | | | 4,669,221 |
* Net ordinary income consists of net taxable income derived from dividends, interest, and net short-term capital gains, if any.
The tax character of distributions paid during the Funds’ tax years ended June 30, 2007 and June 30, 2006, was designated for purposes of the dividends paid deduction as follows:
| | | | | | | | | | | | | | | | | | |
| 2007 | | Multi-Cap
Value | | Large-Cap
Value | | Small/Mid-Cap
Value | | Small-Cap
Value | | Global
Value | | Value
Opportunities |
Distributions from net ordinary income * | | $ | 30,245,242 | | $ | — | | $ | — | | $ | 926,758 | | $ | 306,095 | | $ | 4,678,640 |
Distributions from net long-term capital gains** | | | 31,980,136 | | | — | | | — | | | 83,870 | | | 191,190 | | | 182,560 |
| | | | | | | | | | | | |
| 2006 | | Multi-Cap
Value | | Small-Cap Value | | Global
Value | | Value
Opportunities |
Distributions from net ordinary income* | | $ | 3,801,830 | | $ | 102,331 | | $ | 48,574 | | $ | 139,508 |
Distributions from net long-term capital gains | | | 5,479,388 | | | — | | | — | | | — |
* Net ordinary income consists of net taxable income derived from dividends, interest, and net short-term capital gains, if any.
** The Funds hereby designate these amounts paid during the fiscal year ended June 30, 2007, as long-term Capital gain dividends pursuant to Internal Revenue Code Section 852(b)(3).
Post October Losses
The following Funds have elected to defer net realized losses from investments and foreign currency transactions incurred from November 1, 2006 through June 30, 2007 (“post-October losses”) in accordance with Federal income tax regulations. The following post-October losses are treated as having arisen on the first day of the following fiscal year:
| | | | | |
| | | Multi-Cap
Value | | Small/Mid-Cap
Value |
| | | $123 | | $ | 824,110 |
5. Management Fees and Other Transactions with Affiliates
Each Fund’s management fee is separated into two components – a complex-level component, based on the aggregate amount of all fund assets managed by Nuveen Asset Management (the “Adviser”), a wholly owned subsidiary of Nuveen Investments, Inc. (“Nuveen”), and a specific fund-level component, based only on the amount of assets within each individual fund. This pricing structure enables Nuveen fund shareholders to benefit from growth in the assets within each individual fund as well as from growth in the amount of complex-wide assets managed by the Adviser.
The annual fund-level fee, payable monthly, for each Fund is based upon the average daily net assets of each Fund as follows:
| | | | | | | | | | | | | | | | | | |
| Average Daily Net Assets | | Multi-Cap Value Fund-Level Fee Rate | | | Large-Cap
Value Fund-Level Fee Rate | | | Small/Mid-Cap
Value Fund-Level Fee Rate | | | Small-Cap Value Fund-Level Fee Rate | | | Global Value Fund-Level Fee Rate | | | Value Opportunities Fund-Level Fee Rate | |
For the first $125 million | | .6500 | % | | .6500 | % | | .7500 | % | | .8000 | % | | .8000 | % | | .8000 | % |
For the next $125 million | | .6375 | | | .6375 | | | .7375 | | | .7875 | | | .7875 | | | .7875 | |
For the next $250 million | | .6250 | | | .6250 | | | .7250 | | | .7750 | | | .7750 | | | .7750 | |
For the next $500 million | | .6125 | | | .6125 | | | .7125 | | | .7625 | | | .7625 | | | .7625 | |
For the next $1 billion | | .6000 | | | .6000 | | | .7000 | | | .7500 | | | .7500 | | | .7500 | |
For net assets over $2 billion | | .5750 | | | .5750 | | | .6750 | | | .7250 | | | .7250 | | | .7250 | �� |
53
Notes to Financial Statements (continued)
The annual complex-level fee, payable monthly, which is additive to the fund-level fee, for all Nuveen sponsored funds in the U.S., is based on the aggregate amount of total fund assets managed as stated in the tables below. As of June 30, 2007, the complex-level fee rate was .1828%.
Effective August 20, 2007, the complex-level fee schedule is as follows:
| | | |
| Complex-Level Asset Breakpoint Level (1) | | Effective Rate at Breakpoint Level | |
$55 billion | | .2000 | % |
$56 billion | | .1996 | |
$57 billion | | .1989 | |
$60 billion | | .1961 | |
$63 billion | | .1931 | |
$66 billion | | .1900 | |
$71 billion | | .1851 | |
$76 billion | | .1806 | |
$80 billion | | .1773 | |
$91 billion | | .1691 | |
$125 billion | | .1599 | |
$200 billion | | .1505 | |
$250 billion | | .1469 | |
$300 billion | | .1445 | |
Prior to August 20, 2007, the complex-level fee schedule was as follows:
| | | |
| Complex-Level Asset Breakpoint Level (1) | | Effective Rate at Breakpoint Level | |
$55 billion | | .2000 | % |
$56 billion | | .1996 | |
$57 billion | | .1989 | |
$60 billion | | .1961 | |
$63 billion | | .1931 | |
$66 billion | | .1900 | |
$71 billion | | .1851 | |
$76 billion | | .1806 | |
$80 billion | | .1773 | |
$91 billion | | .1698 | |
$125 billion | | .1617 | |
$200 billion | | .1536 | |
$250 billion | | .1509 | |
$300 billion | | .1490 | |
| (1) | The complex-level fee component of the management fee for the funds is calculated based upon the aggregate Managed Assets (“Managed Assets” means the average daily net assets of each fund including assets attributable to preferred stock issued by or borrowings by the Nuveen funds) of Nuveen-sponsored funds in the U.S. |
The management fee compensates the Adviser for overall investment advisory and administrative services and general office facilities. The Adviser has entered into Sub-Advisory Agreements with NWQ and Tradewinds, of which Nuveen owns a controlling interest while key management of NWQ and Tradewinds owns a non-controlling minority interest. NWQ and Tradewinds are compensated for their services to the Funds from the management fee paid to the Adviser.
The Adviser has agreed to waive part of its management fees or reimburse certain expenses of the Funds in order to limit operating expenses (excluding 12b-1 distribution and service fees, interest expense, taxes, fees incurred in acquiring and disposing of portfolio securities and extraordinary expenses) in the amounts and for the time periods stated in the table below. The Adviser may also voluntarily reimburse additional expenses from time to time in any of the Funds. Voluntary reimbursements may be terminated at any time at the Adviser's discretion.
| | | | | | | | |
| | | Current
Expense Cap | | | Current Expense Cap
Expiration Date | | Permanent
Expense Cap | |
NWQ Multi-Cap Value | | — | % | | — | | — | % |
NWQ Large-Cap Value | | 1.10 | | | October 31, 2010 | | 1.35 | |
NWQ Small/Mid-Cap Value | | 1.20 | | | October 31, 2010 | | 1.45 | |
NWQ Small-Cap Value | | 1.25 | | | July 31, 2009 | | 1.50 | |
NWQ Global Value | | 1.45 | | | October 31, 2009 | | 1.55 | |
Tradewinds Value Opportunities | | 1.25 | | | July 31, 2009 | | 1.50 | |
54
The Trust pays no compensation directly to those of its Trustees who are affiliated with the Adviser or to its Officers, all of whom receive remuneration for their services to the Trust from the Adviser or its affiliates. The Board of Trustees has adopted a deferred compensation plan for independent Trustees that enables Trustees to elect to defer receipt of all or a portion of the annual compensation they are entitled to receive from certain Nuveen advised Funds. Under the plan, deferred amounts are treated as though equal dollar amounts had been invested in shares of select Nuveen advised Funds.
During the fiscal year ended June 30, 2007, Nuveen Investments, LLC (the “Distributor”), a wholly owned subsidiary of Nuveen, collected sales charges on purchases of Class A Shares, the majority of which were paid out as concessions to financial intermediaries as follows:
| | | | | | | | | | | | |
| | | Multi-Cap
Value | | Large-Cap
Value* | | Small/Mid-Cap
Value* | | Small-Cap
Value | | Global
Value | | Value
Opportunities |
Sales charges collected (unaudited) | | $1,878,860 | | $23,525 | | $6,835 | | $129,540 | | $40,148 | | $1,159,933 |
Paid to financial intermediaries (unaudited) | | 1,652,989 | | 20,515 | | 6,094 | | 121,444 | | 35,474 | | 1,037,278 |
| * | For the period December 15, 2006 (commencement of operations) through June 30, 2007. |
The Distributor also received 12b-1 service fees on Class A Shares, substantially all of which were paid to compensate financial intermediaries for providing services to shareholders relating to their investments.
During the fiscal year ended June 30, 2007, the Distributor compensated financial intermediaries directly with commission advances at the time of purchase as follows:
| | | | | | | | | | | | | | | | | | |
| | | Multi-Cap
Value | | Large-Cap
Value* | | Small/Mid-Cap
Value* | | Small-Cap
Value | | Global
Value | | Value
Opportunities |
Commission advances (unaudited) | | $ | 1,946,955 | | $ | 8,207 | | $ | 7,736 | | $ | 173,462 | | $ | 53,173 | | $ | 995,713 |
| * | For the period December 15, 2006 (commencement of operations) through June 30, 2007. |
To compensate for commissions advanced to financial intermediaries, all 12b-1 service fees collected on Class B Shares during the first year following a purchase, all 12b-1 distribution fees collected on Class B Shares, and all 12b-1 service and distribution fees collected on Class C Shares during the first year following a purchase are retained by the Distributor. During the fiscal year ended June 30, 2007, the Distributor retained such 12b-1 fees as follows:
| | | | | | | | | | | | | | | | | | |
| | | Multi-Cap
Value | | Large-Cap
Value* | | Small/Mid-Cap
Value* | | Small-Cap
Value | | Global
Value | | Value
Opportunities |
12b-1 fees retained (unaudited) | | $ | 2,231,512 | | $ | 4,407 | | $ | 3,980 | | $ | 115,975 | | $ | 47,184 | | $ | 512,611 |
| * | For the period December 15, 2006 (commencement of operations) through June 30, 2007. |
The remaining 12b-1 fees charged to the Funds were paid to compensate financial intermediaries for providing services to shareholders relating to their investments.
The Distributor also collected and retained CDSC on share redemptions during the fiscal year ended June 30, 2007, as follows:
| | | | | | | | | | | | | | | | | | |
| | | Multi-Cap
Value | | Large-Cap
Value* | | Small/Mid-Cap Value* | | Small-Cap
Value | | Global
Value | | Value
Opportunities |
CDSC retained (unaudited) | | $ | 259,077 | | $ | — | | $ | — | | $ | 9,317 | | $ | 3,813 | | $ | 90,657 |
| * | For the period December 15, 2006 (commencement of operations) through June 30, 2007. |
During the fiscal year ended June 30, 2006, NWQ reimbursed Small-Cap Value $9,060, representing an earnings credit due to lost return opportunities attributable to its delay in investing a $500,000 inflow into the Fund. Although the amount was at all times invested in short-term fixed-income investments, NWQ reimbursed the Fund for an amount equivalent to the extra return it believed the Fund would have generated during the period had this amount been invested in securities held in the Fund’s portfolio of equity investments.
At June 30, 2007, Nuveen owned 12,500 shares of each class of Large-Cap Value and Small/Mid-Cap Value.
Agreement and Plan of Merger
On June 20, 2007, Nuveen Investments announced that it had entered into a definitive Agreement and Plan of Merger (“Merger Agreement”) with an investor group majority-led by Madison Dearborn Partners, LLC. Madison Dearborn Partners, LLC is a private equity investment firm based in Chicago, Illinois. The investor group includes affiliates of Merrill Lynch, Wachovia, Citigroup, Deutsche Bank and Morgan Stanley. It is anticipated that Merrill Lynch and its affiliates will be indirect “affiliated persons” (as that term is defined in the Investment Company Act of 1940) of the Funds. One important implication of this is that the Funds will not be able to buy or sell securities to or from Merrill Lynch, but the portfolio management teams and Fund management do not expect that this will significantly impact the ability of the Funds to pursue their investment objectives and policies. Under the terms of the
55
Notes to Financial Statements (continued)
merger, each outstanding share of Nuveen Investments’ common stock (other than dissenting shares) will be converted into the right to receive a specified amount of cash, without interest. The merger is expected to be completed by the end of the year, subject to customary conditions, including obtaining the approval of Nuveen Investments shareholders, obtaining necessary fund and client consents sufficient to satisfy the terms of the Merger Agreement, and expiration of certain regulatory waiting periods. The obligations of Madison Dearborn Partners, LLC to consummate the merger are not conditioned on its obtaining financing.
The consummation of the merger will be deemed to be an “assignment” (as defined in the 1940 Act) of the investment management agreement between each Fund and the Adviser, and will result in the automatic termination of each Fund’s agreement. Prior to the consummation of the merger, it is anticipated that the Board of Trustees of each Fund will consider a new investment management agreement with the Adviser. If approved by the Board, the new agreement would be presented to the Fund’s shareholders for approval, and, if so approved by shareholders, would take effect upon consummation of the merger. There can be no assurance that the merger described above will be consummated as contemplated or that necessary shareholder approvals will be obtained.
6. New Accounting Pronouncements
Financial Accounting Standards Board Interpretation No. 48
On July 13, 2006, the Financial Accounting Standards Board (FASB) released FASB Interpretation No. 48 “Accounting for Uncertainty in Income Taxes” (FIN 48). FIN 48 provides guidance for how uncertain tax positions should be recognized, measured, presented and disclosed in the financial statements. FIN 48 requires the evaluation of tax positions taken or expected to be taken in the course of preparing the Funds’ tax returns to determine whether the tax positions are “more-likely-than-not” of being sustained by the applicable tax authority. Tax positions not deemed to meet the more-likely-than-not threshold would be recorded as a tax benefit or expense in the current year. Adoption of FIN 48 is required for fiscal years beginning after December 15, 2006, and is to be applied to all open tax years as of the effective date. Recent SEC guidance allows funds to delay implementing FIN 48 into NAV calculations until the fund’s last NAV calculation in the first required financial statement reporting period. As a result, the Funds must begin to incorporate FIN 48 into their NAV calculations by December 31, 2007. At this time, management is continuing to evaluate the implications of FIN 48 and does not expect the adoption of FIN 48 will have a significant impact on the net assets or results of operations of the Funds.
Financial Accounting Standards Board Statement of Financial Accounting Standards No. 157
In September 2006, the Financial Accounting Standards Board (FASB) issued Statement of Financial Accounting Standards (SFAS) No. 157, “Fair Value Measurements.” This standard establishes a single authoritative definition of fair value, sets out a framework for measuring fair value and requires additional disclosures about fair value measurements. SFAS No. 157 applies to fair value measurements already required or permitted by existing standards. SFAS No. 157 is effective for financial statements issued for fiscal years beginning after November 15, 2007, and interim periods within those fiscal years. The changes to current generally accepted accounting principles from the application of this standard relate to the definition of fair value, the methods used to measure fair value, and the expanded disclosures about fair value measurements. As of June 30, 2007, the Funds do not believe the adoption of SFAS No. 157 will impact the financial statement amounts; however, additional disclosures may be required about the inputs used to develop the measurements and the effect of certain of the measurements included within the Statement of Operations for the period.
56
Financial Highlights
Selected data for a share outstanding throughout each period:
| | | | | | | | | | | | | | | | | | | | | | | | | | | | | | | | | | | | | | | | | | | | | | | | | | | | | | | | | |
| Class (Inception Date) | | | | | | | | | | | | | | | | | | | | | | | | | | | | | | | | | | | | | | | | | | | | | | |
| | | | | Investment Operations | | | Less Distributions | | | | | | | | Ratios/Supplemental Data | |
| MULTI-CAP VALUE | | | | | | | | | | | | | | | | | | | | | | | | | | | Ratios to Average
Net Assets
Before Credit/
Reimbursement | | | Ratios to Average
Net Assets
After
Reimbursement(c) | | | Ratios to Average
Net Assets
After Credit/
Reimbursement(d) | | | | |
| | | Beginning
Net
Asset
Value | | Net
Invest-
ment
Income
(Loss)(a) | | | Net
Realized/
Unrealized
Gain
(Loss) | | | Total | | | Net
Invest-
ment
Income | | | Capital
Gains | | | Total | | | Ending
Net
Asset
Value | | Total
Return(b) | | | Ending
Net
Assets
(000) | | Expenses | | | Net
Invest-
ment
Income
(Loss) | | | Expenses | | | Net
Invest-
ment
Income
(Loss) | | | Expenses | | | Net
Invest-
ment
Income
(Loss) | | | Portfolio
Turnover
Rate | |
Class A (12/02) | | | | | | | | | | | | | | | | | | | | | | | | | | | | | | | | | | | | | | | | | | | | | | | | | | | | | | | | | |
Year Ended 6/30: | | | | | | | | | | | | | | | | | | | | | | | | | | | | | | | | | | | | | | | | | | | | | | | | | | | | | | |
2007 | | $ | 23.81 | | $ | .18 | | | $ | 3.43 | | | $ | 3.61 | | | $ | (.13 | ) | | $ | (1.14 | ) | | $ | (1.27 | ) | | $ | 26.15 | | 15.51 | % | | $ | 634,123 | | 1.24 | % | | .71 | % | | 1.24 | % | | .71 | % | | 1.24 | % | | .71 | % | | 19 | % |
2006 | | | 20.60 | | | .15 | | | | 3.42 | | | | 3.57 | | | | (.06 | ) | | | (.30 | ) | | | (.36 | ) | | | 23.81 | | 17.45 | | | | 409,788 | | 1.33 | | | .65 | | | 1.33 | | | .65 | | | 1.33 | | | .65 | | | 9 | |
2005 | | | 18.56 | | | .11 | | | | 2.15 | | | | 2.26 | | | | (.05 | ) | | | (.17 | ) | | | (.22 | ) | | | 20.60 | | 12.20 | | | | 179,548 | | 1.36 | | | .54 | | | 1.36 | | | .54 | | | 1.36 | | | .54 | | | 14 | |
2004 | | | 14.60 | | | .04 | | | | 4.38 | | | | 4.42 | | | | (.02 | ) | | | (.44 | ) | | | (.46 | ) | | | 18.56 | | 30.75 | | | | 58,279 | | 1.48 | | | .20 | | | 1.48 | | | .20 | | | 1.48 | | | .20 | | | 21 | |
4/01/03–
6/30/03 | | | 11.54 | | | .02 | | | | 3.04 | | | | 3.06 | | | | — | | | | — | | | | — | | | | 14.60 | | 26.52 | | | | 4,732 | | 1.66 | * | | .59 | * | | 1.66 | * | | .59 | * | | 1.66 | * | | .60 | * | | 13 | |
12/09/02–
3/31/03 | | | 11.86 | | | — | | | | (.27 | ) | | | (.27 | ) | | | (.05 | ) | | | — | | | | (.05 | ) | | | 11.54 | | (2.26 | ) | | | 294 | | 1.78 | * | | (.07 | )* | | 1.75 | * | | (.04 | )* | | 1.75 | * | | (.04 | )* | | 52 | |
| Class B (12/02) | | | | | | | | | | | | | | | | | | | | | | | | | | | | | | | | | | | | | | | | | | | | | | | | | | | | | | | | | |
Year Ended 6/30: | | | | | | | | | | | | | | | | | | | | | | | | | | | | | | | | | | | | | | | | | | | | | | | | | | | | | | |
2007 | | | 23.42 | | | (.01 | ) | | | 3.37 | | | | 3.36 | | | | — | | | | (1.14 | ) | | | (1.14 | ) | | | 25.64 | | 14.65 | | | | 75,067 | | 2.00 | | | (.04 | ) | | 2.00 | | | (.04 | ) | | 2.00 | | | (.04 | ) | | 19 | |
2006 | | | 20.37 | | | (.02 | ) | | | 3.37 | | | | 3.35 | | | | — | | | | (.30 | ) | | | (.30 | ) | | | 23.42 | | 16.57 | | | | 58,423 | | 2.08 | | | (.10 | ) | | 2.08 | | | (.10 | ) | | 2.08 | | | (.10 | ) | | 9 | |
2005 | | | 18.45 | | | (.04 | ) | | | 2.13 | | | | 2.09 | | | | — | | | | (.17 | ) | | | (.17 | ) | | | 20.37 | | 11.35 | | | | 33,216 | | 2.10 | | | (.20 | ) | | 2.10 | | | (.20 | ) | | 2.10 | | | (.20 | ) | | 14 | |
2004 | | | 14.61 | | | (.09 | ) | | | 4.37 | | | | 4.28 | | | | — | | | | (.44 | ) | | | (.44 | ) | | | 18.45 | | 29.76 | | | | 9,322 | | 2.23 | | | (.53 | ) | | 2.23 | | | (.53 | ) | | 2.23 | | | (.53 | ) | | 21 | |
4/01/03–
6/30/03 | | | 11.58 | | | — | | | | 3.03 | | | | 3.03 | | | | — | | | | — | | | | — | | | | 14.61 | | 26.17 | | | | 193 | | 2.43 | * | | (.08 | )* | | 2.43 | * | | (.08 | )* | | 2.43 | * | | (.08 | )* | | 13 | |
12/09/02–
3/31/03 | | | 11.86 | | | (.04 | ) | | | (.24 | ) | | | (.28 | ) | | | — | | | | — | | | | — | | | | 11.58 | | (2.36 | ) | | | 20 | | 3.29 | * | | (1.95 | )* | | 2.50 | * | | (1.16 | )* | | 2.50 | * | | (1.16 | )* | | 52 | |
| Class C (12/02) | | | | | | | | | | | | | | | | | | | | | | | | | | | | | | | | | | | | | | | | | | | | | | | | | | | | | | | | | |
Year Ended 6/30: | | | | | | | | | | | | | | | | | | | | | | | | | | | | | | | | | | | | | | | | | | | | | | | | | | | | | | |
2007 | | | 23.42 | | | (.01 | ) | | | 3.37 | | | | 3.36 | | | | — | | | | (1.14 | ) | | | (1.14 | ) | | | 25.64 | | 14.64 | | | | 441,048 | | 1.99 | | | (.04 | ) | | 1.99 | | | (.04 | ) | | 1.99 | | | (.04 | ) | | 19 | |
2006 | | | 20.37 | | | (.02 | ) | | | 3.37 | | | | 3.35 | | | | — | | | | (.30 | ) | | | (.30 | ) | | | 23.42 | | 16.57 | | | | 308,339 | | 2.08 | | | (.10 | ) | | 2.08 | | | (.10 | ) | | 2.08 | | | (.10 | ) | | 9 | |
2005 | | | 18.45 | | | (.04 | ) | | | 2.13 | | | | 2.09 | | | | — | | | | (.17 | ) | | | (.17 | ) | | | 20.37 | | 11.35 | | | | 128,758 | | 2.11 | | | (.21 | ) | | 2.11 | | | (.21 | ) | | 2.10 | | | (.21 | ) | | 14 | |
2004 | | | 14.62 | | | (.09 | ) | | | 4.36 | | | | 4.27 | | | | — | | | | (.44 | ) | | | (.44 | ) | | | 18.45 | | 29.67 | | | | 30,085 | | 2.23 | | | (.53 | ) | | 2.23 | | | (.53 | ) | | 2.23 | | | (.53 | ) | | 21 | |
4/01/03–
6/30/03 | | | 11.58 | | | (.01 | ) | | | 3.05 | | | | 3.04 | | | | — | | | | — | | | | — | | | | 14.62 | | 26.25 | | | | 416 | | 2.44 | * | | (.33 | )* | | 2.44 | * | | (.33 | )* | | 2.44 | * | | (.33 | )* | | 13 | |
12/09/02–
3/31/03 | | | 11.86 | | | (.02 | ) | | | (.26 | ) | | | (.28 | ) | | | — | | | | — | | | | — | | | | 11.58 | | (2.36 | ) | | | 2 | | 2.50 | * | | (.62 | )* | | 2.50 | * | | (.62 | )* | | 2.50 | * | | (.62 | )* | | 52 | |
| Class R (11/97) | | | | | | | | | | | | | | | | | | | | | | | | | | | | | | | | | | | | | | | | | | | | | | | | | | | | | | | | | |
Year Ended 6/30: | | | | | | | | | | | | | | | | | | | | | | | | | | | | | | | | | | | | | | | | | | | | | | | | | | | | | | |
2007 | | | 23.76 | | | .24 | | | | 3.42 | | | | 3.66 | | | | (.19 | ) | | | (1.14 | ) | | | (1.33 | ) | | | 26.09 | | 15.77 | | | | 350,370 | | .99 | | | .96 | | | .99 | | | .96 | | | .99 | | | .96 | | | 19 | |
2006 | | | 20.55 | | | .20 | | | | 3.42 | | | | 3.62 | | | | (.11 | ) | | | (.30 | ) | | | (.41 | ) | | | 23.76 | | 17.77 | | | | 212,033 | | 1.09 | | | .90 | | | 1.09 | | | .90 | | | 1.09 | | | .90 | | | 9 | |
2005 | | | 18.52 | | | .15 | | | | 2.15 | | | | 2.30 | | | | (.10 | ) | | | (.17 | ) | | | (.27 | ) | | | 20.55 | | 12.43 | | | | 82,413 | | 1.10 | | | .78 | | | 1.10 | | | .78 | | | 1.10 | | | .78 | | | 14 | |
2004 | | | 14.57 | | | .06 | | | | 4.38 | | | | 4.44 | | | | (.05 | ) | | | (.44 | ) | | | (.49 | ) | | | 18.52 | | 31.02 | | | | 46,546 | | 1.24 | | | .39 | | | 1.24 | | | .39 | | | 1.24 | | | .39 | | | 21 | |
4/01/03–
6/30/03 | | | 11.51 | | | .02 | | | | 3.04 | | | | 3.06 | | | | — | | | | — | | | | — | | | | 14.57 | | 26.59 | | | | 26,777 | | 1.41 | * | | .56 | * | | 1.41 | * | | .56 | * | | 1.41 | * | | .56 | * | | 13 | |
Year Ended 3/31: | | | | | | | | | | | | | | | | | | | | | | | | | | | | | | | | | | | | | | | | | | | | | | | | | | | | | | |
2003(e) | | | 13.92 | | | .08 | | | | (2.38 | ) | | | (2.30 | ) | | | (.11 | ) | | | — | | | | (.11 | ) | | | 11.51 | | (16.52 | ) | | | 21,795 | | 1.61 | | | .37 | | | 1.36 | | | .62 | | | 1.36 | | | .62 | | | 52 | |
| (a) | Per share Net Investment Income (Loss) is calculated using the average daily shares method. |
| (b) | Total return is the combination of changes in net asset value, reinvested dividend income at net asset value and reinvested capital gains distributions at net asset value, if any. The last dividend declared in the period, which is typically paid on the first business day of the following month, is assumed to be reinvested at the ending net asset value. The actual reinvest price for the last dividend declared in the period may be different from the price used in the calculation. Total returns are not annualized. |
| (c) | After expense reimbursement from the Adviser, where applicable. |
| (d) | After custodian fee credit and expense reimbursement, where applicable. |
| (e) | Information represents the performance history of the PBHG Special Equity Fund prior to the December 6, 2002 reorganization and the Nuveen NWQ Multi-Cap Value Fund subsequent to the reorganization. |
See accompanying notes to financial statements.
57
Selected data for a share outstanding throughout the period:
| | | | | | | | | | | | | | | | | | | | | | | | | | | | | | | | | | | | | | | | | | | | | | | | | | | | |
| Class (Inception Date) | | | | | | | | | | | | | | | | | | | | | | | | | | | | | | | | | | | | | | | |
| | | | | Investment Operations | | Less Distributions | | | | | Ratios/Supplemental Data | |
| LARGE-CAP VALUE | | | | | | | | | | | | | | | | | | | | | | Ratios to Average
Net Assets
Before Credit/
Reimbursement | | | Ratios to Average
Net Assets After
Reimbursement(c) | | | Ratios to Average
Net Assets After
Credit/
Reimbursement(d) | | | | |
| | | Beginning
Net
Asset
Value | | Net
Invest-
ment
Income (Loss)(a) | | | Net
Realized/
Unrealized
Gain (Loss) | | Total | | Net
Invest-
ment
Income | | Capital
Gains | | Total | | Ending
Net
Asset
Value | | Total
Return(b) | | | Ending
Net
Assets
(000) | | Expenses | | | Net
Invest-
ment
Income
(Loss) | | | Expenses | | | Net
Invest-
ment
Income
(Loss) | | | Expenses | | | Net
Invest-
ment
Income
(Loss) | | | Portfolio
Turnover
Rate | |
| Class A (12/06) | | | | | | | | | | | | | | | | | | | | | | | | | | | | | | | | | | | | | | | | | | | | | | | | | |
Year Ended 6/30: | | | | | | | | | | | | | | | | | | | | | | | | | | | | | | | | | | | | | | | | | | | | | | | | | |
2007(e) | | $ | 20.00 | | $ | .12 | | | $ | 1.26 | | $ | 1.38 | | $ | — | | $ | — | | $ | — | | $ | 21.38 | | 6.90 | % | | $ | 2,358 | | 3.12 | %* | | (.84 | )%* | | 1.33 | %* | | .95 | %* | | 1.26 | %* | | 1.02 | %* | | — | % |
| Class B (12/06) | | | | | | | | | | | | | | | | | | | | | | | | | | | | | | | | | | | | | | | | | | | | | | | | | |
Year Ended 6/30: | | | | | | | | | | | | | | | | | | | | | | | | | | | | | | | | | | | | | | | | | | | | | | | | | |
2007(e) | | | 20.00 | | | — | ** | | | 1.30 | | | 1.30 | | | — | | | — | | | — | | | 21.30 | | 6.50 | | | | 281 | | 4.68 | * | | (2.66 | )* | | 2.08 | * | | (.06 | )* | | 2.01 | * | | .01 | * | | — | |
| Class C (12/06) | | | | | | | | | | | | | | | | | | | | | | | | | | | | | | | | | | | | | | | | | | | | | | | | | |
Year Ended 6/30: | | | | | | | | | | | | | | | | | | | | | | | | | | | | | | | | | | | | | | | | | | | | | | | | | |
2007(e) | | | 20.00 | | | .02 | | | | 1.28 | | | 1.30 | | | — | | | — | | | — | | | 21.30 | | 6.50 | | | | 1,117 | | 3.83 | * | | (1.62 | )* | | 2.08 | * | | .13 | * | | 2.01 | * | | .20 | * | | — | |
| Class R (12/06) | | | | | | | | | | | | | | | | | | | | | | | | | | | | | | | | | | | | | | | | | | | | | | | | | |
Year Ended 6/30: | | | | | | | | | | | | | | | | | | | | | | | | | | | | | | | | | | | | | | | | | | | | | | | | | |
2007(e) | | | 20.00 | | | .15 | | | | 1.26 | | | 1.41 | | | — | | | — | | | — | | | 21.41 | | 7.05 | | | | 8,513 | | 2.65 | * | | (.32 | )* | | 1.08 | * | | 1.25 | * | | 1.01 | * | | 1.32 | * | | — | |
| ** | Per share Net Investment Income (Loss) rounds to less than $.01 per share. |
| (a) | Per share Net Investment Income (Loss) is calculated using the average daily shares method. |
| (b) | Total return is the combination of changes in net asset value, reinvested dividend income at net asset value and reinvested capital gains distributions at net asset value, if any. The last dividend declared in the period, which is typically paid on the first business day of the following month, is assumed to be reinvested at the ending net asset value. The actual reinvest price for the last dividend declared in the period may be different from the price used in the calculation. Total returns are not annualized. |
| (c) | After expense reimbursement from the Adviser, where applicable. |
| (d) | After custodian fee credit and expense reimbursement, where applicable. |
| (e) | For the period December 15, 2006 (commencement of operations) through June 30, 2007. |
See accompanying notes to financial statements.
58
Financial Highlights (continued)
Selected data for a share outstanding throughout the period:
| | | | | | | | | | | | | | | | | | | | | | | | | | | | | | | | | | | | | | | | | | | | | | | | | | | |
| Class (Inception Date) | | | | | | | | | | | | | | | | | | | | | | | | | | | | | | | | | | | | | | | | |
| | | | | Investment Operations | | Less Distributions | | | | | Ratios/Supplemental Data | |
| SMALL/MID-CAP VALUE | | | | | | | | | | | | | | | | | | | | | Ratios to Average
Net Assets
Before Credit/
Reimbursement | | | Ratios to Average
Net Assets
After
Reimbursement(c) | | | Ratios to Average
Net Assets
After Credit/
Reimbursement(d) | | | | |
| | | Beginning
Net
Asset
Value | | Net
Invest-
ment
Income
(Loss)(a) | | Net
Realized/
Unrealized
Gain (Loss) | | Total | | Net
Invest-
ment
Income | | Capital
Gains | | Total | | Ending
Net
Asset
Value | | Total
Return(b) | | | Ending
Net
Assets
(000) | | Expenses | | | Net
Invest-
ment
Income
(Loss) | | | Expenses | | | Net
Invest-
ment
Income
(Loss) | | | Expenses | | | Net
Invest-
ment
Income
(Loss) | | | Portfolio
Turnover
Rate | |
| Class A (12/06) | | | | | | | | | | | | | | | | | | | | | | | | | | | | | | | | | | | | | | | | | | | | | | | | |
Year Ended 6/30: | | | | | | | | | | | | | | | | | | | | | | | | | | | | | | | | | | | | | | | | | | | | | | | | |
2007(e) | | $ | 20.00 | | $ | .15 | | $ | 1.22 | | $ | 1.37 | | $ | — | | $ | — | | $ | — | | $ | 21.37 | | 6.85 | % | | $ | 1,098 | | 2.54 | %* | | .23 | %* | | 1.43 | %* | | 1.34 | %* | | 1.41 | %* | | 1.36 | %* | | 1 | % |
| Class B (12/06) | | | | | | | | | | | | | | | | | | | | | | | | | | | | | | | | | | | | | | | | | | | | | | | | |
Year Ended 6/30: | | | | | | | | | | | | | | | | | | | | | | | | | | | | | | | | | | | | | | | | | | | | | | | | |
2007(e) | | | 20.00 | | | .02 | | | 1.27 | | | 1.29 | | | — | | | — | | | — | | | 21.29 | | 6.45 | | | | 279 | | 4.09 | * | | (1.70 | )* | | 2.19 | * | | .20 | * | | 2.17 | * | | .22 | * | | 1 | |
| Class C (12/06) | | | | | | | | | | | | | | | | | | | | | | | | | | | | | | | | | | | | | | | | | | | | | | | | |
Year Ended 6/30: | | | | | | | | | | | | | | | | | | | | | | | | | | | | | | | | | | | | | | | | | | | | | | | | |
2007(e) | | | 20.00 | | | .05 | | | 1.23 | | | 1.28 | | | — | | | — | | | — | | | 21.28 | | 6.40 | | | | 974 | | 3.22 | * | | (.65 | )* | | 2.18 | * | | .39 | * | | 2.16 | * | | .41 | * | | 1 | |
| Class R (12/06) | | | | | | | | | | | | | | | | | | | | | | | | | | | | | | | | | | | | | | | | | | | | | | | | |
Year Ended 6/30: | | | | | | | | | | | | | | | | | | | | | | | | | | | | | | | | | | | | | | | | | | | | | | | | |
2007(e) | | | 20.00 | | | .49 | | | .92 | | | 1.41 | | | — | | | — | | | — | | | 21.41 | | 7.05 | | | | 216,872 | | 1.49 | * | | 3.93 | * | | 1.16 | * | | 4.25 | * | | 1.15 | * | | 4.27 | * | | 1 | |
| (a) | Per share Net Investment Income (Loss) is calculated using the average daily shares method. |
| (b) | Total return is the combination of changes in net asset value, reinvested dividend income at net asset value and reinvested capital gains distributions at net asset value, if any. The last dividend declared in the period, which is typically paid on the first business day of the following month, is assumed to be reinvested at the ending net asset value. The actual reinvest price for the last dividend declared in the period may be different from the price used in the calculation. Total returns are not annualized. |
| (c) | After expense reimbursement from the Adviser, where applicable. |
| (d) | After custodian fee credit and expense reimbursement, where applicable. |
| (e) | For the period December 15, 2006 (commencement of operations) through June 30, 2007. |
See accompanying notes to financial statements.
59
Selected data for a share outstanding throughout each period:
| | | | | | | | | | | | | | | | | | | | | | | | | | | | | | | | | | | | | | | | | | | | | | | | | | | | | | | |
| Class (Inception Date) | | | | | | | | | | | | | | | | | | | | | | | | | | | | | | | | | | | | | | | | | | | | |
| | | | | Investment Operations | | Less Distributions | | | | | | | | Ratios/Supplemental Data | |
| SMALL-CAP VALUE | | | | | | | | | | | | | | | | | | | | | | | | | Ratios to Average
Net Assets
Before Credit/
Reimbursement | | | Ratios to Average
Net Assets After
Reimbursement(c) | | | Ratios to Average
Net Assets
After Credit/
Reimbursement(d) | | | | |
| | | Beginning
Net
Asset
Value | | Net
Invest-
ment
Income
(Loss)(a) | | | Net
Realized/
Unrealized
Gain
(Loss) | | Total | | Net
Invest-
ment
Income | | | Capital
Gains | | | Total | | | Ending
Net
Asset
Value | | Total
Return(b) | | | Ending
Net
Assets
(000) | | Expenses | | | Net
Invest-
ment
Income
(Loss) | | | Expenses | | | Net
Invest-
ment
Income
(Loss) | | | Expenses | | | Net
Invest-
ment
Income
(Loss) | | | Portfolio
Turnover
Rate | |
| Class A (12/04) | | | | | | | | | | | | | | | | | | | | | | | | | | | | | | | | | | | | | | | | | | | | | | | | | | | | |
Year Ended 6/30: | | | | | | | | | | | | | | | | | | | | | | | | | | | | | | | | | | | | | | | | | | | | | | | | | | | | |
2007 | | $ | 26.10 | | $ | .13 | | | $ | 4.05 | | $ | 4.18 | | $ | (.04 | ) | | $ | (.12 | ) | | $ | (.16 | ) | | $ | 30.12 | | 16.09 | % | | $ | 78,081 | | 1.50 | % | | .44 | % | | 1.49 | % | | .46 | % | | 1.49 | % | | .46 | % | | 24 | % |
2006 2005(e) | |
| 20.84
20.00 | |
| .13
.05 |
| |
| 5.48
.79 | |
| 5.61
.84 | |
| (.08
— | )
| |
| (.27
— | )
| |
| (.35
— | )
| |
| 26.10
20.84 | | 27.08
4.20 | **
| |
| 33,907
3 | | 1.95
2.85 |
* | | (.02
(.96 | )
)* | | 1.42
1.49 |
* | | .51
.40 |
* | | 1.40
1.42 |
* | | .53
.47 |
* | | 26
22 |
|
| Class B (12/04) | | | | | | | | | | | | | | | | | | | | | | | | | | | | | | | | | | | | | | | | | | | | | | | | | | | | |
Year Ended 6/30: | | | | | | | | | | | | | | | | | | | | | | | | | | | | | | | | | | | | | | | | | | | | | | | | | | | | |
2007 | | | 25.89 | | | (.08 | ) | | | 4.00 | | | 3.92 | | | — | | | | (.12 | ) | | | (.12 | ) | | | 29.69 | | 15.15 | | | | 833 | | 2.25 | | | (.31 | ) | | 2.24 | | | (.30 | ) | | 2.24 | | | (.30 | ) | | 24 | |
2006 2005(e) | |
| 20.76
20.00 | |
| (.07
(.03 | )
) | |
| 5.47
.79 | |
| 5.40
.76 | |
| —
— |
| |
| (.27
— | )
| |
| (.27
— | )
| |
| 25.89
20.76 | | 26.17
3.80 | **
| |
| 370
3 | | 2.75
3.60 |
* | | (.91
(1.70 | )
)* | | 2.16
2.24 |
* | | (.33
(.35 | )
)* | | 2.14
2.17 |
* | | (.31
(.28 | )
)* | | 26
22 |
|
| Class C (12/04) | | | | | | | | | | | | | | | | | | | | | | | | | | | | | | | | | | | | | | | | | | | | | | | | | | | | |
Year Ended 6/30: | | | | | | | | | | | | | | | | | | | | | | | | | | | | | | | | | | | | | | | | | | | | | | | | | | | | |
2007 | | | 25.91 | | | (.08 | ) | | | 4.02 | | | 3.94 | | | — | | | | (.12 | ) | | | (.12 | ) | | | 29.73 | | 15.26 | | | | 17,290 | | 2.25 | | | (.31 | ) | | 2.24 | | | (.30 | ) | | 2.24 | | | (.30 | ) | | 24 | |
2006 2005(e) | |
| 20.76
20.00 | |
| (.07
(.03 | )
) | |
| 5.49
.79 | |
| 5.42
.76 | |
| —
— |
| |
| (.27
— | )
| |
| (.27
— | )
| |
| 25.91
20.76 | | 26.22
3.80 | **
| |
| 7,244
3 | | 2.73
3.60 |
* | | (.86
(1.70 | )
)* | | 2.17
2.24 |
* | | (.30
(.35 | )
)* | | 2.15
2.17 |
* | | (.28
(.28 | )
)* | | 26
22 |
|
| Class R (12/04) | | | | | | | | | | | | | | | | | | | | | | | | | | | | | | | | | | | | | | | | | | | | | | | | | | | | |
Year Ended 6/30: | | | | | | | | | | | | | | | | | | | | | | | | | | | | | | | | | | | | | | | | | | | | | | | | | | | | |
2007 | | | 26.15 | | | .23 | | | | 4.03 | | | 4.26 | | | (.11 | ) | | | (.12 | ) | | | (.23 | ) | | | 30.18 | | 16.41 | | | | 132,385 | | 1.22 | | | .81 | | | 1.22 | | | .81 | | | 1.22 | | | .81 | | | 24 | |
2006 2005(e) | |
| 20.87
20.00 | |
| .16
.08 |
| |
| 5.52
.79 | |
| 5.68
.87 | |
| (.13
— | )
| |
| (.27
— | )
| |
| (.40
— | )
| |
| 26.15
20.87 | | 27.41
4.35 | **
| |
| 13,137
2,079 | | 1.73
2.61 |
* | | .07
(.72 |
)* | | 1.17
1.25 |
* | | .63
.64 |
* | | 1.15
1.17 |
* | | .65
.72 |
* | | 26
22 |
|
| ** | During the fiscal year ended June 30, 2006, NWQ reimbursed Small-Cap Value $9,060 for a cash balance maintained in the Fund. This reimbursement did not have an impact on the Fund’s Class A total return, but resulted in an increase of .05% in each of the total returns for Class B, C and R. |
| (a) | Per share Net Investment Income (Loss) is calculated using the average daily shares method. |
| (b) | Total return is the combination of changes in net asset value, reinvested dividend income at net asset value and reinvested capital gains distributions at net asset value, if any. The last dividend declared in the period, which is typically paid on the first business day of the following month, is assumed to be reinvested at the ending net asset value. The actual reinvest price for the last dividend declared in the period may be different from the price used in the calculation. Total returns are not annualized. |
| (c) | After expense reimbursement from the Adviser, where applicable. |
| (d) | After custodian fee credit and expense reimbursement, where applicable. |
| (e) | For the period December 9, 2004 (commencement of operations) through June 30, 2005. |
See accompanying notes to financial statements.
60
Financial Highlights (continued)
Selected data for a share outstanding throughout each period:
| | | | | | | | | | | | | | | | | | | | | | | | | | | | | | | | | | | | | | | | | | | | | | | | | | | | | | | |
| Class (Inception Date) | | | | | | | | | | | | | | | | | | | | | | | | | | | | | | | | | | | | | | | | | | |
| | | | | Investment Operations | | Less Distributions | | | | | | Ratios/Supplemental Data | |
| GLOBAL VALUE | | | | | | | | | | | | | | | | | | | | | | | | | | | Ratios to Average
Net Assets
Before Credit/
Reimbursement | | | Ratios to Average
Net Assets After
Reimbursement(c) | | | Ratios to Average
Net Assets After
Credit/
Reimbursement(d) | | | | |
| | | Beginning
Net
Asset
Value | | Net
Invest-
ment
Income (Loss)(a) | | | Net
Realized/
Unrealized
Gain (Loss) | | Total | | Net
Invest-
ment
Income | | | Capital
Gains | | | Total | | | Ending
Net
Asset
Value | | Total
Return(b) | | | Ending
Net
Assets
(000) | | Expenses | | | Net
Invest-
ment
Income
(Loss) | | | Expenses | | | Net
Invest-
ment
Income
(Loss) | | | Expenses | | | Net
Invest-
ment
Income
(Loss) | | | Portfolio
Turnover
Rate | |
| Class A (12/04) | | | | | | | | | | | | | | | | | | | | | | | | | | | | | | | | | | | | | | | | | | | | | | | | | | | | |
Year Ended 6/30: | | | | | | | | | | | | | | | | | | | | | | | | | | | | | | | | | | | | | | | | | | | | | | | | | | | | | | | |
2007 | | $ | 23.95 | | $ | .17 | | | $ | 4.48 | | $ | 4.65 | | $ | (.18 | ) | | $ | (.63 | ) | | $ | (.81 | ) | | $ | 27.79 | | 19.67 | % | | $ | 6,888 | | 1.82 | % | | .52 | % | | 1.68 | % | | .66 | % | | 1.68 | % | | .67 | % | | 31 | % |
2006 | | | 20.71 | | | .27 | | | | 3.20 | | | 3.47 | | | (.06 | ) | | | (.17 | ) | | | (.23 | ) | | | 23.95 | | 16.81 | | | | 4,128 | | 2.32 | | | .43 | | | 1.69 | | | 1.06 | | | 1.61 | | | 1.14 | | | 21 | |
2005(e) | | | 20.00 | | | .10 | | | | .61 | | | .71 | | | — | | | | — | | | | — | | | | 20.71 | | 3.55 | | | | 3 | | 2.87 | * | | (.41 | )* | | 1.72 | * | | .74 | * | | 1.58 | * | | .88 | * | | 6 | |
| Class B (12/04) | | | | | | | | | | | | | | | | | | | | | | | | | | | | | | | | | | | | | | | | | | | | | | | | | | | | |
Year Ended 6/30: | | | | | | | | | | | | | | | | | | | | | | | | | | | | | | | | | | | | | | | | | | | | | | | | | | | | | | | |
2007 | | | 23.74 | | | (.02 | ) | | | 4.42 | | | 4.40 | | | — | | | | (.63 | ) | | | (.63 | ) | | | 27.51 | | 18.73 | | | | 752 | | 2.54 | | | (.19 | ) | | 2.44 | | | (.09 | ) | | 2.44 | | | (.08 | ) | | 31 | |
2006 | | | 20.63 | | | .07 | | | | 3.21 | | | 3.28 | | | — | | | | (.17 | ) | | | (.17 | ) | | | 23.74 | | 15.94 | | | | 298 | | 3.12 | | | (.47 | ) | | 2.44 | | | .21 | | | 2.36 | | | .29 | | | 21 | |
2005(e) | | | 20.00 | | | .01 | | | | .62 | | | .63 | | | — | | | | — | | | | — | | | | 20.63 | | 3.15 | | | | 3 | | 3.62 | * | | (1.16 | )* | | 2.47 | * | | (.01 | )* | | 2.33 | * | | .13 | * | | 6 | |
| Class C (12/04) | | | | | | | | | | | | | | | | | | | | | | | | | | | | | | | | | | | | | | | | | | | | | | | | | | | | |
Year Ended 6/30: | | | | | | | | | | | | | | | | | | | | | | | | | | | | | | | | | | | | | | | | | | | | | | | | | | | | | | | |
2007 | | | 23.75 | | | (.02 | ) | | | 4.43 | | | 4.41 | | | — | | | | (.63 | ) | | | (.63 | ) | | | 27.53 | | 18.76 | | | | 8,771 | | 2.53 | | | (.17 | ) | | 2.44 | | | (.07 | ) | | 2.43 | | | (.07 | ) | | 31 | |
2006 | | | 20.63 | | | .07 | | | | 3.22 | | | 3.29 | | | — | | | | (.17 | ) | | | (.17 | ) | | | 23.75 | | 15.99 | | | | 3,524 | | 3.06 | | | (.39 | ) | | 2.44 | | | .22 | | | 2.36 | | | .31 | | | 21 | |
2005(e) | | | 20.00 | | | .01 | | | | .62 | | | .63 | | | — | | | | — | | | | — | | | | 20.63 | | 3.15 | | | | 3 | | 3.62 | * | | (1.16 | )* | | 2.47 | * | | (.01 | )* | | 2.33 | * | | .13 | * | | 6 | |
| Class R (12/04) | | | | | | | | | | | | | | | | | | | | | | | | | | | | | | | | | | | | | | | | | | | | | | | | | | | | |
Year Ended 6/30: | | | | | | | | | | | | | | | | | | | | | | | | | | | | | | | | | | | | | | | | | | | | | | | | | | | | | | | |
2007 | | | 24.00 | | | .24 | | | | 4.48 | | | 4.72 | | | (.24 | ) | | | (.63 | ) | | | (.87 | ) | | | 27.85 | | 19.95 | | | | 4,868 | | 1.58 | | | .78 | | | 1.43 | | | .93 | | | 1.43 | | | .93 | | | 31 | |
2006 | | | 20.74 | | | .22 | | | | 3.32 | | | 3.54 | | | (.11 | ) | | | (.17 | ) | | | (.28 | ) | | | 24.00 | | 17.15 | | | | 3,261 | | 2.09 | | | .22 | | | 1.44 | | | .88 | | | 1.36 | | | .96 | | | 21 | |
2005(e) | | | 20.00 | | | .13 | | | | .61 | | | .74 | | | — | | | | — | | | | — | | | | 20.74 | | 3.70 | | | | 2,066 | | 2.59 | * | | (.13 | )* | | 1.44 | * | | 1.02 | * | | 1.33 | * | | 1.13 | * | | 6 | |
| (a) | Per share Net Investment Income (Loss) is calculated using the average daily shares method. |
| (b) | Total return is the combination of changes in net asset value, reinvested dividend income at net asset value and reinvested capital gains distributions at net asset value, if any. The last dividend declared in the period, which is typically paid on the first business day of the following month, is assumed to be reinvested at the ending net asset value. The actual reinvest price for the last dividend declared in the period may be different from the price used in the calculation. Total returns are not annualized. |
| (c) | After expense reimbursement from the Adviser, where applicable. |
| (d) | After custodian fee credit and expense reimbursement, where applicable. |
| (e) | For the period December 9, 2004 (commencement of operations) through June 30, 2005. |
See accompanying notes to financial statements.
61
Selected data for a share outstanding throughout each period:
| | | | | | | | | | | | | | | | | | | | | | | | | | | | | | | | | | | | | | | | | | | | | | | | | | | | | | |
| Class (Inception Date) | | | | | | | | | | | | | | | | | | | | | | | | | | | | | | | | | | | | | | | | | | | |
| | | | | Investment Operations | | Less Distributions | | | | | | Ratios/Supplemental Data | |
| VALUE OPPORTUNITIES | | | | | | | | | | | | | | | | | | | | | | | | Ratios to Average
Net Assets
Before Credit/
Reimbursement | | | Ratios to Average
Net Assets
After
Reimbursement(c) | | | Ratios to Average
Net Assets
After Credit/
Reimbursement(d) | | | | |
| | | Beginning
Net
Asset
Value | | Net
Invest
-ment
Income
(Loss)(a) | | Net
Realized/
Unrealized
Gain (Loss) | | Total | | Net
Invest-
ment
Income | | | Capital
Gains | | | Total | | | Ending
Net
Asset
Value | | Total
Return(b) | | | Ending
Net
Assets
(000) | | Expenses | | | Net
Invest-
ment
Income
(Loss) | | | Expenses | | | Net
Invest-
ment
Income
(Loss) | | | Expenses | | | Net
Invest-
ment
Income
(Loss) | | | Portfolio
Turnover
Rate | |
| Class A (12/04) | | | | | | | | | | | | | | | | | | | | | | | | | | | | | | | | | | | | | | | | | | | | | | | | | | | |
Year Ended 6/30: | | | | | | | | | | | | | | | | | | | | | | | | | | | | | | | | | | | | | | | | | | | | | | | | | | | |
2007 | | $ | 26.90 | | $ | .30 | | $ | 5.83 | | $ | 6.13 | | $ | (.29 | ) | | $ | (.26 | ) | | $ | (.55 | ) | | $ | 32.48 | | 22.98 | % | | $ | 248,827 | | 1.39 | % | | .99 | % | | 1.39 | % | | .99 | % | | 1.39 | % | | .99 | % | | 23 | % |
2006 | | | 21.07 | | | .28 | | | 5.88 | | | 6.16 | | | (.07 | ) | | | (.26 | ) | | | (.33 | ) | | | 26.90 | | 29.45 | | | | 73,389 | | 1.63 | | | .94 | | | 1.49 | | | 1.09 | | | 1.48 | | | 1.09 | | | 29 | |
2005(e) | | | 20.00 | | | .08 | | | .99 | | | 1.07 | | | — | | | | — | | | | — | | | | 21.07 | | 5.35 | | | | 3 | | 3.12 | * | | (1.10 | )* | | 1.51 | * | | .52 | * | | 1.30 | * | | .73 | * | | 45 | |
| Class B (12/04) | | | | | | | | | | | | | | | | | | | | | | | | | | | | | | | | | | | | | | | | | | | | | | | | | | | |
Year Ended 6/30: | | | | | | | | | | | | | | | | | | | | | | | | | | | | | | | | | | | | | | | | | | | | | | | | | | | |
2007 | | | 26.66 | | | .07 | | | 5.76 | | | 5.83 | | | (.08 | ) | | | (.26 | ) | | | (.34 | ) | | | 32.15 | | 22.04 | | | | 5,521 | | 2.14 | | | .24 | | | 2.14 | | | .24 | | | 2.14 | | | .24 | | | 23 | |
2006 | | | 20.98 | | | .09 | | | 5.85 | | | 5.94 | | | — | | | | (.26 | ) | | | (.26 | ) | | | 26.66 | | 28.49 | | | | 1,041 | | 2.40 | | | .16 | | | 2.24 | | | .33 | | | 2.23 | | | .34 | | | 29 | |
2005(e) | | | 20.00 | | | — | | | .98 | | | .98 | | | — | | | | — | | | | — | | | | 20.98 | | 4.90 | | | | 3 | | 3.87 | * | | (1.85 | )* | | 2.26 | * | | (.23 | )* | | 2.05 | * | | (.02 | )* | | 45 | |
| Class C (12/04) | | | | | | | | | | | | | | | | | | | | | | | | | | | | | | | | | | | | | | | | | | | | | | | | | | | |
Year Ended 6/30: | | | | | | | | | | | | | | | | | | | | | | | | | | | | | | | | | | | | | | | | | | | | | | | | | | | |
2007 | | | 26.66 | | | .07 | | | 5.77 | | | 5.84 | | | (.08 | ) | | | (.26 | ) | | | (.34 | ) | | | 32.16 | | 22.04 | | | | 100,295 | | 2.14 | | | .24 | | | 2.14 | | | .24 | | | 2.14 | | | .24 | | | 23 | |
2006 | | | 20.98 | | | .08 | | | 5.86 | | | 5.94 | | | — | | | | (.26 | ) | | | (.26 | ) | | | 26.66 | | 28.49 | | | | 22,102 | | 2.40 | | | .15 | | | 2.24 | | | .31 | | | 2.23 | | | .32 | | | 29 | |
2005(e) | | | 20.00 | | | — | | | .98 | | | .98 | | | — | | | | — | | | | — | | | | 20.98 | | 4.90 | | | | 3 | | 3.87 | * | | (1.85 | )* | | 2.26 | * | | (.23 | )* | | 2.05 | * | | (.02 | )* | | 45 | |
| Class R (12/04) | | | | | | | | | | | | | | | | | | | | | | | | | | | | | | | | | | | | | | | | | | | | | | | | | | | |
Year Ended 6/30: | | | | | | | | | | | | | | | | | | | | | | | | | | | | | | | | | | | | | | | | | | | | | | | | | | | |
2007 | | | 26.95 | | | .39 | | | 5.82 | | | 6.21 | | | (.36 | ) | | | (.26 | ) | | | (.62 | ) | | | 32.54 | | 23.30 | | | | 161,284 | | 1.14 | | | 1.28 | | | 1.14 | | | 1.28 | | | 1.14 | | | 1.28 | | | 23 | |
2006 | | | 21.09 | | | .31 | | | 5.93 | | | 6.24 | | | (.12 | ) | | | (.26 | ) | | | (.38 | ) | | | 26.95 | | 29.80 | | | | 37,393 | | 1.48 | | | .98 | | | 1.24 | | | 1.22 | | | 1.23 | | | 1.23 | | | 29 | |
2005(e) | | | 20.00 | | | .11 | | | .98 | | | 1.09 | | | — | | | | — | | | | — | | | | 21.09 | | 5.45 | | | | 2,102 | | 2.86 | * | | (.84 | )* | | 1.24 | * | | .77 | * | | 1.05 | * | | .97 | * | | 45 | |
| (a) | Per share Net Investment Income (Loss) is calculated using the average daily shares method. |
| (b) | Total return is the combination of changes in net asset value, reinvested dividend income at net asset value and reinvested capital gains distributions at net asset value, if any. The last dividend declared in the period, which is typically paid on the first business day of the following month, is assumed to be reinvested at the ending net asset value. The actual reinvest price for the last dividend declared in the period may be different from the price used in the calculation. Total returns are not annualized. |
| (c) | After expense reimbursement from the Adviser, where applicable. |
| (d) | After custodian fee credit and expense reimbursement, where applicable. |
| (e) | For the period December 9, 2004 (commencement of operations) through June 30, 2005. |
See accompanying notes to financial statements.
62
Report of Independent Registered Public Accounting Firm
To the Board of Trustees and Shareholders of
Nuveen Investment Trust:
In our opinion, the accompanying statements of assets and liabilities, including the portfolios of investments, and the related statements of operations and of changes in net assets and the financial highlights present fairly, in all material respects, the financial position of Nuveen NWQ Multi-Cap Value Fund, Nuveen NWQ Large-Cap Value Fund, Nuveen NWQ Small/Mid-Cap Value Fund, Nuveen NWQ Small-Cap Value Fund, Nuveen NWQ Global Value Fund and Nuveen Tradewinds Value Opportunities Fund (each a series of the Nuveen Investment Trust, hereafter referred to as the “Funds”) at June 30, 2007, the results of each of their operations for the periods indicated, the changes in each of their net assets for each of the periods indicated and the financial highlights for each of the periods indicated, in conformity with accounting principles generally accepted in the United States of America. These financial statements and financial highlights (hereafter referred to as “financial statements”) are the responsibility of the Funds’ management; our responsibility is to express an opinion on these financial statements based on our audits. We conducted our audits of these financial statements in accordance with the standards of the Public Company Accounting Oversight Board (United States). These standards require that we plan and perform the audit to obtain reasonable assurance about whether the financial statements are free of material misstatement. An audit includes examining, on a test basis, evidence supporting the amounts and disclosures in the financial statements, assessing the accounting principles used and significant estimates made by management, and evaluating the overall financial statement presentation. We believe that our audits, which included confirmation of securities at June 30, 2007 by correspondence with the custodian and brokers, provide a reasonable basis for our opinion.
PricewaterhouseCoopers LLP
Chicago, IL
August 22, 2007
63
Annual Investment Management Agreement Approval Process
The Board Members are responsible for overseeing the performance of the investment adviser to the Funds and determining whether to approve or continue the advisory arrangements. At the annual review meeting held on May 21, 2007 (the “May Meeting”), the Board Members of the Funds, including the Independent Board Members, unanimously approved the continuance of the respective Investment Management Agreement between Nuveen Asset Management (“NAM” or “Adviser”) and each of the following Funds: NWQ Multi-Cap Value Fund, Nuveen NWQ Small-Cap Value Fund, Nuveen NWQ Global Value Fund and Nuveen Tradewinds Value Opportunities Fund (each an “Existing Fund”); the Sub-Advisory Agreement between NAM and NWQ Investment Management Company, LLC (“NWQ”) on behalf of each of the following Funds: NWQ Multi-Cap Value Fund, NWQ Small-Cap Value Fund and NWQ Global Value Fund; and the Sub-Advisory Agreement between NAM and Tradewinds Global Investors, LLC (“Tradewinds”) on behalf of NWQ Global Value Fund and the Tradewinds Value Opportunities Fund.
With respect to the Nuveen NWQ Large-Cap Value Fund and Nuveen NWQ Small/Mid-Cap Value Fund (each a “New Fund”), the Investment Management Agreement between each New Fund and NAM and the Sub-Advisory Agreement between NAM and NWQ were initially approved at a meeting held on November 14-16, 2006 (the “Initial Approval Meeting”), and therefore were not up for renewal at the May Meeting.
NWQ and Tradewinds are each a Sub-Adviser. The foregoing Investment Management Agreements with NAM and the Sub-Advisory Agreements with the Sub-Advisers are hereafter referred to as “Original Investment Management Agreements” and “Original Sub-Advisory Agreements,” respectively. Further, NAM and each Sub-Adviser are referred to herein as a “Fund Adviser.”
Subsequent to the May Meeting and Initial Approval Meeting, Nuveen Investments, Inc. (“Nuveen”), the parent company of NAM, entered into a merger agreement providing for the acquisition of Nuveen by Windy City Investments, Inc., a corporation formed by investors led by Madison Dearborn Partners, LLC (“MDP”), a private equity investment firm (the “Transaction”). Each Original Investment Management Agreement and Original Sub-Advisory Agreement, as required by Section 15 of the Investment Company Act of 1940 (the “1940 Act”) provides for its automatic termination in the event of its “assignment” (as defined in the 1940 Act). Any change in control of the adviser is deemed to be an assignment. The consummation of the Transaction will result in a change of control of NAM as well as its affiliated sub-advisers and therefore cause the automatic termination of each Original Investment Management Agreement and Original Sub-Advisory Agreement, as required by the 1940 Act. Accordingly, in anticipation of the Transaction, at a meeting held on July 31, 2007 (the “July Meeting”), the Board Members, including the Independent Board Members, unanimously approved new Investment Management Agreements (the “New Investment Management Agreements”) with NAM on behalf of each Fund and new Sub-Advisory Agreements (the “New Sub-Advisory Agreements”) between NAM and the respective Sub-Adviser on behalf of each Fund to take effect immediately after the Transaction or shareholder approval of the new advisory contracts, whichever is later. The 1940 Act also requires that each New Investment Management Agreement and New Sub-Advisory Agreement be approved by the respective Fund’s shareholders in order for it to become effective. Accordingly, to ensure continuity of advisory services, the Board Members, including the Independent Board Members, unanimously approved Interim Investment Management Agreements and Interim Sub-Advisory Agreements to take effect upon the closing of the Transaction if shareholders have not yet approved the New Investment Management Agreements and New Sub-Advisory Agreements.
Because the information provided and considerations made at the annual and initial reviews continue to be relevant with respect to the evaluation of the New Investment Management Agreements and New Sub-Advisory Agreements, the Board considered the foregoing as part of its deliberations of the New Investment Management Agreements and New Sub-Advisory Agreements. Accordingly, as indicated, the discussions immediately below outline the materials and information presented to the Board in connection with the Board’s prior annual or initial review and the analysis undertaken and the conclusions reached by the Board Members when determining to approve or continue the Original Investment Management Agreements and Original Sub-Advisory Agreements.
I. Approval of the Original Investment Management Agreements and Original Sub-Advisory Agreements
During the course of the year, the Board received a wide variety of materials relating to the services provided by the Fund Advisers and the performance of the Funds (as applicable). At each of its quarterly meetings, the Board reviewed investment performance (as applicable) and various matters relating to the operations of the Funds and other Nuveen funds, including the compliance program, shareholder services, valuation, custody, distribution and other information relating to the nature, extent and quality of services provided by the Fund Adviser. Between the regularly scheduled quarterly meetings, the Board Members received information on particular matters as the need arose. In addition, because the Adviser and Sub-Advisers to the New Funds already serve in such respective capacities for other Nuveen funds, the information provided regarding the applicable Fund Adviser at the annual review at the May Meeting supplemented the information received at the initial approvals.
In preparation for their considerations at the May Meeting, Independent Board Members also received extensive materials, well in advance of the meeting, which outlined or are related to, among other things:
| • | | the nature, extent and quality of services provided by the Fund Adviser; |
| • | | the organization and business operations of the Fund Adviser, including the responsibilities of various departments and key personnel; |
64
| • | | each Existing Fund’s past performance as well as the Existing Fund’s performance compared to funds with similar investment objectives based on data and information provided by an independent third party and to recognized and/or customized benchmarks (as appropriate); |
| • | | the profitability of the Fund Adviser and certain industry profitability analyses for unaffiliated advisers; |
| • | | the expenses of the Fund Adviser in providing the various services; |
| • | | the advisory fees and total expense ratios of each Existing Fund, including comparisons of such fees and expenses with those of comparable, unaffiliated funds based on information and data provided by an independent third party (the “Peer Universe”) as well as compared to a subset of funds within the Peer Universe (the “Peer Group”) of the respective Existing Fund (as applicable); |
| • | | the advisory fees the Fund Adviser assesses to other types of investment products or clients; |
| • | | the soft dollar practices of the Fund Adviser, if any; and |
| • | | from independent legal counsel, a legal memorandum describing among other things, applicable laws, regulations and duties in reviewing and approving advisory contracts. |
At the Initial Approval Meeting, the Board Members received in advance of such meeting or at prior meetings similar materials, including the nature, extent and quality of services expected to be provided; the organization and operations of the Fund Adviser (including the responsibilities of various departments and key personnel); the expertise and background of the Fund Adviser; the profitability of Nuveen (which includes its wholly-owned advisory subsidiaries); the proposed management fees, including comparisons with peers; the expected expenses of the respective New Fund, including comparisons of the expense ratios with peers; and the soft dollar practices of the Fund Adviser. However, unlike Existing Funds, the New Funds did not have actual past performance at the time of approval.
At the May Meeting, NAM made a presentation to, and responded to questions from, the Board. At the May Meeting and applicable Initial Approval Meeting, the Independent Board Members met privately with their legal counsel to review the Board’s duties in reviewing advisory contracts and considering the approval or renewal of the advisory contracts (which include the sub-advisory contracts). The Independent Board Members, in consultation with independent counsel, reviewed the factors set out in judicial decisions and Securities and Exchange Commission (“SEC”) directives relating to the approval or renewal of advisory contracts. As outlined in more detail below, the Board Members considered all factors they believed relevant with respect to each Fund, including, but not limited to, the following: (a) the nature, extent and quality of the services to be provided by the Fund Adviser; (b) the investment performance of the Fund and the Fund Adviser (as applicable); (c) the costs of the services to be provided and profits to be realized by the Fund Adviser and its affiliates; (d) the extent to which economies of scale would be realized; and (e) whether fee levels reflect those economies of scale for the benefit of the Fund’s investors. In addition, as noted, the Board Members met regularly throughout the year to oversee the Nuveen funds. In evaluating the advisory contracts, the Board Members also relied upon their knowledge of the respective Fund Adviser, its services and the Funds resulting from their meetings and other interactions throughout the year. It is with this background that the Board Members considered each advisory contract.
A. Nature, Extent and Quality of Services
In considering the approval or renewal of the Original Investment Management Agreements and Original Sub-Advisory Agreements, the Board Members considered the nature, extent and quality of the respective Fund Adviser’s services. The Board Members reviewed materials outlining, among other things, the Fund Adviser’s organization and business; the types of services that the Fund Adviser or its affiliates provide or are expected to provide to the Funds; the performance record of the Fund (as described in further detail below); and at the annual review, any initiatives Nuveen had taken for the applicable fund product line. As noted, the Board Members were already familiar with the organization, operations and personnel of each respective Fund Adviser due to the Board Members’ experience in governing the respective Funds and working with such Fund Advisers on matters relating to the Nuveen funds. At the May Meeting, the Board Members also recognized NAM’s investment in additional qualified personnel throughout the various groups in the organization and recommended to NAM that it continue to review staffing needs as necessary. The Board Members recognized NAM’s investment of resources and efforts to continue to enhance and refine its investment processes.
With respect to Sub-Advisers, the Board Members also received and reviewed an evaluation of each Sub-Adviser from NAM at the annual review. Such evaluation outlined, among other things, the respective Sub-Adviser’s organizational history, client base, product mix, investment team and any changes thereto, investment process and any changes to its investment strategy, and the Funds’ investment objectives and performance (as applicable). At the May Meeting, the Board Members noted that NAM recommended the renewal of the applicable Original Sub-Advisory Agreements and considered the basis for such recommendations and any qualifications in connection therewith.
In its review of the Sub-Advisers, the Board Members also considered, among other things, the experience of the investment personnel, the quality of the Sub-Adviser’s investment processes in making portfolio management decisions and any additional refinements and improvements adopted to the portfolio management processes and Fund performance. As the Sub-Advisers advise various Nuveen funds, the Board Members are already familiar with the organization, operations, personnel and investment process
65
Annual Investment Management Agreement Approval Process (continued)
of the respective Sub-Adviser. During the last year, the Board Members noted that they visited several Sub-Advisers meeting their key investment and business personnel. In this regard, the Board Members visited NWQ and Tradewinds in February, 2007. The Board Members noted such Sub-Advisers’ experienced investment teams. With respect to the Funds sub-advised by NWQ, the Board Members also noted the depth of experience of their respective personnel and disciplined investment process at the annual review.
In addition to advisory services, the Independent Board Members considered the quality of administrative and non-advisory services provided by NAM and noted that NAM and its affiliates provide the Funds with a wide variety of services and officers and other personnel as are necessary for the operations of the Funds, including:
| • | | oversight by shareholder services and other fund service providers; |
| • | | administration of Board relations; |
| • | | regulatory and portfolio compliance; and |
As the Funds operate in a highly regulated industry and given the importance of compliance, the Board Members considered, in particular, NAM’s compliance activities for the Funds and enhancements thereto. In this regard, the Board Members recognized the quality of NAM’s compliance team. The Board Members also considered NAM’s ability and procedures to monitor the respective Sub-Adviser’s performance, business practices and compliance policies and procedures. The Board Members further noted NAM’s negotiations with other service providers and the corresponding reduction in certain service providers’ fees at the May Meeting.
With respect to Sub-Advisers, the Board Members noted that the sub-advisory agreements were essentially agreements for portfolio management services only and the respective Sub-Adviser was not expected to supply other significant administrative services to the Funds.
Based on their review, the Board Members found that, overall, the nature, extent and quality of services provided (and expected to be provided) to the Funds under the respective Original Investment Management Agreement or Original Sub-Advisory Agreement, as applicable, were satisfactory.
B. The Investment Performance of the Funds and Fund Advisers
At the May Meeting, the Board considered the investment performance for each Existing Fund, including the Existing Fund’s historic performance as well as its performance compared to funds with similar investment objectives (the “Performance Peer Group”) based on data provided by an independent third party (as described below). The Board Members also reviewed the respective Existing Fund’s historic performance compared to recognized and/or customized benchmarks (as applicable).
In evaluating the performance information during the annual review at the May Meeting, in certain instances, the Board Members noted that the closest Performance Peer Group for an Existing Fund may not adequately reflect such Existing Fund’s investment objectives and strategies, thereby limiting the usefulness of the comparisons of such Fund’s performance with that of the Performance Peer Group. These Performance Peer Groups include those for: the Nuveen Tradewinds Value Opportunities Fund, the Nuveen Santa Barbara Growth Fund, and the Nuveen Multi-Strategy Income Fund (although the Nuveen Multi-Strategy Income Fund has been reclassified in a more appropriate peer group for 2007).
The Board Members reviewed performance information including, among other things, total return information compared with the Existing Fund’s Performance Peer Group as well as recognized and/or customized benchmarks (as appropriate) for the one-, three- and five-year periods (as applicable) ending December 31, 2006. This information supplemented the performance information provided to the Board at each of its quarterly meetings. Based on their review at the May Meeting, the Board Members determined that the respective Existing Fund’s investment performance over time had been satisfactory.
With respect to New Funds, the Funds did not have their own performance history at their Initial Approval Meeting. However, in certain cases, the Board Members received performance information regarding the proposed investment strategies for the applicable New Fund (if available). In addition, the Board Members were also familiar with the Fund Adviser’s performance record on other Nuveen funds (as applicable).
C. Fees, Expenses and Profitability
1. Fees and Expenses
During the annual review, the Board evaluated the management fees and expenses of each Existing Fund reviewing, among other things, such Fund’s advisory fees (net and gross management fees) and total expense ratios (before and after expense reimbursements and/or waivers) in absolute terms as well as comparisons to the gross management fees (before waivers), net management fees (after waivers) and total expense ratios (before and after waivers) of comparable funds in the Peer Universe and the Peer Group. In reviewing the fee schedule for an Existing Fund, the Board Members considered the fund-level and complex-wide breakpoint schedules (described in further detail below) and any fee waivers and reimbursements provided by
66
Nuveen. The Board Members further reviewed data regarding the construction of Peer Groups as well as the methods of measurement for the fee and expense analysis and the performance analysis. In certain cases, due to the small number of peers in the Peer Universe, the Peer Universe and Peer Group had significant overlap or even consisted entirely of the same unaffiliated funds. In reviewing the comparisons of fee and expense information, the Board Members recognized that in certain cases, the size of the Existing Fund relative to peers, the small size and odd composition of the Peer Group (including differences in objectives and strategies), expense anomalies, timing of information used or other factors impacting the comparisons thereby limited some of the usefulness of the comparative data. Based on their review of the fee and expense information provided, the Board Members determined that each Existing Fund’s net total expense ratio was within an acceptable range compared to peers.
With respect to New Funds at the Initial Approval Meeting, the Board similarly considered the New Fund’s proposed management fee structure, its sub-advisory fee arrangements and expected expense ratios in absolute terms as well as compared with the fees and expense ratios of comparable, unaffiliated funds and comparable, affiliated funds (if any). The Board Members also considered the applicable fund-level breakpoint schedule and complex-wide breakpoint schedule. Based on their review of the overall fee arrangements of the respective New Funds, the Board Members determined that the advisory fees and expected expenses of the applicable New Funds were reasonable.
2. Comparisons with the Fees of Other Clients
At the annual review, the Board Members further reviewed data comparing the advisory fees of NAM with fees NAM charges to other clients. Such clients include NAM’s separately managed accounts and funds that are not offered by Nuveen but are sub-advised by one of Nuveen’s investment management teams. In general, the advisory fees charged for separate accounts are somewhat lower than the advisory fees assessed to the Nuveen funds (including the Funds). The Board Members considered the differences in the product types, including, but not limited to, the services provided, the structure and operations, product distribution and costs thereof, portfolio investment policies, investor profiles, account sizes and regulatory requirements. The Board Members noted, in particular, that the range of services provided to the Nuveen funds (as discussed above) is much more extensive than that provided to separately managed accounts. As described in further detail above, such additional services include, but are not limited to: product management, fund administration, oversight of third party service providers, administration of Board relations, and legal support. The Board Members noted that the Nuveen funds operate in a highly regulated industry requiring extensive compliance functions compared to other investment products. Given the inherent differences in the products, particularly the extensive services provided to the Nuveen funds, the Board Members believe such facts justify the different levels of fees.
With respect to Sub-Advisers, in considering the fees of a Sub-Adviser at the annual review, the Board Members also considered the pricing schedule or fees that the Sub-Adviser charges for similar investment management services for other fund sponsors or clients, as applicable.
3. Profitability of Fund Advisers
In conjunction with its review of fees, the Board Members also considered the profitability of Nuveen for its advisory activities (which incorporated Nuveen’s wholly-owned affiliated sub-advisers) and its financial condition. At the annual review, the Board Members reviewed the revenues and expenses of Nuveen’s advisory activities for the last three years, the allocation methodology used in preparing the profitability data as well as the 2006 Annual Report for Nuveen. The Board Members noted this information supplemented the profitability information requested and received during the year to help keep them apprised of developments affecting profitability (such as changes in fee waivers and expense reimbursement commitments). In this regard, the Board Members noted the enhanced dialogue and information regarding profitability with NAM during the year, including more frequent meetings and updates from Nuveen’s corporate finance group. The Board Members considered Nuveen’s profitability compared with other fund sponsors prepared by three independent third party service providers as well as comparisons of the revenues, expenses and profit margins of various unaffiliated management firms with similar amounts of assets under management prepared by Nuveen.
In reviewing profitability, the Board Members recognized the subjective nature of determining profitability which may be affected by numerous factors, including the allocation of expenses. Further, the Board Members recognized the difficulties in making comparisons as the profitability of other advisers generally is not publicly available and the profitability information that is available for certain advisers or management firms may not be representative of the industry and may be affected by, among other things, the adviser’s particular business mix, capital costs, types of funds managed and expense allocations.
Notwithstanding the foregoing, the Board Members reviewed Nuveen’s methodology at the annual review and assumptions for allocating expenses across product lines to determine profitability. Last year, the Board Members also designated an Independent Board Member as a point person for the Board to review the methodology determinations during the year and any refinements thereto, which relevant information produced from such process was reported to the full Board. In reviewing profitability, the Board Members recognized Nuveen’s increased investment in its fund business. Based on its review, the Board Members concluded that Nuveen’s level of profitability for its advisory activities was reasonable in light of the services provided.
In evaluating the reasonableness of the compensation, the Board Members also considered other amounts paid to a Fund Adviser by the Funds as well as any indirect benefits (such as soft dollar arrangements, if any) the Fund Adviser and its affiliates receive, or are
67
Annual Investment Management Agreement Approval Process (continued)
expected to receive, that are directly attributable to the management of the Funds, if any. See Section E below for additional information on indirect benefits a Fund Adviser may receive as a result of its relationship with the Funds. Based on their review of the overall fee arrangement of each Existing Fund, the Board Members determined that the advisory fees and expenses were reasonable.
D. Economies of Scale and Whether Fee Levels Reflect These Economies of Scale
With respect to economies of scale, the Board Members recognized the potential benefits resulting from the costs of a Fund being spread over a larger asset base. To help ensure the shareholders share in these benefits, the Board Members reviewed and considered the breakpoints in the advisory fee schedules that reduce advisory fees. In addition to advisory fee breakpoints, the Board also approved a complex-wide fee arrangement in 2004. Pursuant to the complex-wide fee arrangement, the fees of the funds in the Nuveen complex, including the Funds, are reduced as the assets in the fund complex reach certain levels. In evaluating the complex-wide fee arrangement, the Board Members noted that the last complex-wide asset level breakpoint for the complex-wide fee schedule was at $91 billion and that the Board Members anticipated further review and/or negotiations prior to the assets of the Nuveen complex reaching such threshold. Based on their review, the Board Members concluded that the breakpoint schedule and complex-wide fee arrangement were acceptable and desirable in providing benefits from economies of scale to shareholders, subject to further evaluation of the complex-wide fee schedule as assets in the complex increase. See Section II, Paragraph D – “Approval of the New Investment Management Agreements and New Sub-Advisory Agreements – Economies of Scale and Whether Fee Levels Reflect These Economies of Scale” for information regarding subsequent modifications to the complex-wide fee.
E. Indirect Benefits
In evaluating fees, the Board Members also considered any indirect benefits or profits the respective Fund Adviser or its affiliates may receive as a result of its relationship with each Fund. In this regard, during the annual review, the Board Members considered, among other things, any sales charges and distribution fees received and retained by the Funds’ principal underwriter, Nuveen Investments, LLC, an affiliate of NAM. The Board Members also recognized that an affiliate of NAM provides distribution and shareholder services to the Funds and their shareholders for which it may be compensated pursuant to a 12b-1 plan. The Board Members, therefore, considered the 12b-1 fees retained by Nuveen during the last calendar year.
In addition to the above, the Board Members considered whether the Fund Adviser received any benefits from soft dollar arrangements whereby a portion of the commissions paid by a Fund for brokerage may be used to acquire research that may be useful to the Fund Adviser in managing the assets of the Funds and other clients. With respect to NAM, the Board Members noted that NAM does not currently have any soft dollar arrangements; however, to the extent certain bona fide agency transactions that occur on markets that traditionally trade on a principal basis and riskless principal transactions are considered as generating “commissions,” NAM intends to comply with the applicable safe harbor provisions. With respect to NWQ and Tradewinds, the Board Members considered that such Sub-Advisers may benefit from their soft dollar arrangements pursuant to which the respective Sub-Adviser receives research from brokers that execute the applicable Fund’s portfolio transactions. For these Sub-Advisers, the Board Members noted that such Sub-Advisers’ profitability may be lower if they were required to pay for this research with hard dollars.
Based on their review, the Board Members concluded that any indirect benefits received by a Fund Adviser as a result of its relationship with the Funds were reasonable and within acceptable parameters.
F. Other Considerations
The Board Members did not identify any single factor discussed previously as all-important or controlling in their considerations to initially approve or continue an advisory contract. The Board Members, including the Independent Board Members, unanimously concluded that the terms of the Original Investment Management and Original Sub-Advisory Agreements are fair and reasonable, that the respective Fund Adviser’s fees are reasonable in light of the services provided to each Fund and that the Original Investment Management Agreements and the Original Sub-Advisory Agreements be approved or renewed (as applicable).
II. Approval of the New Investment Management Agreements and New Sub-Advisory Agreements
Following the May Meeting, the Board Members were advised of the potential Transaction. As noted above, the completion of the Transaction would terminate each of the Original Investment Management Agreements and Original Sub-Advisory Agreements. Accordingly, at the July Meeting, the Board of each Fund, including the Independent Board Members, unanimously approved the New Investment Management Agreements and New Sub-Advisory Agreements on behalf of the respective Funds. Leading up to the July Meeting, the Board Members had several meetings and deliberations with and without Nuveen management present, and with the advice of legal counsel, regarding the proposed Transaction as outlined below.
On June 8, 2007, the Board Members held a special telephonic meeting to discuss the proposed Transaction. At that meeting, the Board Members established a special ad hoc committee comprised solely of Independent Board Members to focus on the Transaction and to keep the Independent Board Members updated with developments regarding the Transaction. On June 15, 2007, the ad hoc committee discussed with representatives of NAM the Transaction and modifications to the complex-wide fee schedule that would generate additional fee savings at specified levels of complex-wide asset growth. Following the foregoing meetings and several subsequent telephonic conferences among Independent Board Members and independent counsel, and between Independent Board Members and representatives of Nuveen, the Board met on June 18, 2007 to further discuss the proposed
68
Transaction. Immediately prior to and then again during the June 18, 2007 meeting, the Independent Board Members met privately with their independent legal counsel. At that meeting, the Board met with representatives of MDP, of Goldman Sachs, Nuveen’s financial adviser in the Transaction, and of the Nuveen Board to discuss, among other things, the history and structure of MDP, the terms of the proposed Transaction (including the financing terms), and MDP’s general plans and intentions with respect to Nuveen (including with respect to management, employees, and future growth prospects). On July 9, 2007, the Board also met to be updated on the Transaction as part of a special telephonic Board meeting. The Board Members were further updated at a special in-person Board meeting held on July 19, 2007 (one Independent Board Member participated telephonically). Subsequently, on July 27, 2007, the ad hoc committee held a telephonic conference with representatives of Nuveen and MDP to further discuss, among other things, the Transaction, the financing of the Transaction, retention and incentive plans for key employees, the effect of regulatory restrictions on transactions with affiliates after the Transaction, and current volatile market conditions and their impact on the Transaction.
In connection with their review of the New Investment Management Agreements and New Sub-Advisory Agreements, the Independent Board Members, through their independent legal counsel, also requested in writing and received additional information regarding the proposed Transaction and its impact on the provision of services by NAM and its affiliates.
The Independent Board Members received, well in advance of the July Meeting, materials which outlined, among other things:
| • | | the structure and terms of the Transaction, including MDP’s co-investor entities and their expected ownership interests, and the financing arrangements that will exist for Nuveen following the closing of the Transaction; |
| • | | the strategic plan for Nuveen following the Transaction; |
| • | | the governance structure for Nuveen following the Transaction; |
| • | | any anticipated changes in the operations of the Nuveen funds following the Transaction, including changes to NAM’s and Nuveen’s day-to-day management, infrastructure and ability to provide advisory, distribution or other applicable services to the Funds; |
| • | | any changes to senior management or key personnel who work on Fund related matters (including portfolio management, investment oversight, and legal/compliance) and any retention or incentive arrangements for such persons; |
| • | | any anticipated effect on each Fund’s expense ratio (including advisory fees) following the Transaction; |
| • | | any benefits or undue burdens imposed on the Funds as a result of the Transaction; |
| • | | any legal issues for the Funds as a result of the Transaction; |
| • | | the nature, quality and extent of services expected to be provided to the Funds following the Transaction, changes to any existing services and policies affecting the Funds, and cost-cutting efforts, if any, that may impact such services or policies; |
| • | | any conflicts of interest that may arise for Nuveen or MDP with respect to the Funds; |
| • | | the costs associated with obtaining necessary shareholder approvals and who would bear those costs; and |
| • | | from legal counsel, a memorandum describing the applicable laws, regulations and duties in approving advisory contracts, including, in particular, with respect to a change of control. |
Immediately preceding the July Meeting, representatives of MDP met with the Board to further respond to questions regarding the Transaction. After the meeting with MDP, the Independent Board Members met with independent legal counsel in executive session. At the July Meeting, Nuveen also made a presentation and responded to questions. Following the presentations and discussions of the materials presented to the Board, the Independent Board Members met again in executive session with their counsel. As outlined in more detail below, the Independent Board Members considered all factors they believed relevant with respect to each Fund, including the impact that the Transaction could be expected to have on the following: (a) the nature, extent and quality of services to be provided; (b) the investment performance of the Funds; (c) the costs of the services and profits to be realized by Nuveen and its affiliates; (d) the extent to which economies of scale would be realized; and (e) whether fee levels reflect those economies of scale for the benefit of investors. As noted above, during the past year, the Board Members had completed their annual review of, or initially approved, the respective Original Investment Management Agreements and Original Sub-Advisory Agreements and many of the factors considered at such reviews were applicable to their evaluation of the New Investment Management Agreements and New Sub-Advisory Agreements. Accordingly, in evaluating such agreements, the Board Members relied upon their knowledge and experience with the Fund Advisers and considered the information received and their evaluations and conclusions drawn at the reviews. While the Board reviewed many Nuveen funds at the July Meeting, the Independent Board Members evaluated all information available to them on a fund-by-fund basis, and their determinations were made separately in respect of each Fund.
A. Nature, Extent and Quality of Services
In evaluating the nature, quality and extent of the services expected to be provided by the Fund Adviser under the applicable New Investment Management Agreement or New Sub-Advisory Agreement, the Independent Board Members considered, among other
69
Annual Investment Management Agreement Approval Process (continued)
things, the expected impact, if any, of the Transaction on the operations, facilities, organization and personnel of NAM and each Sub-Adviser (if applicable); the potential implications of regulatory restrictions on the Funds following the Transaction; the ability of NAM and its affiliates to perform their duties after the Transaction; and any anticipated changes to the current investment and other practices of the Funds.
The Board noted that the terms of each New Investment Management Agreement, including the fees payable thereunder, are substantially identical to those of the Original Investment Management Agreement relating to the same Fund (with both reflecting reductions to fee levels in the complex-wide fee schedule for complex-wide assets in excess of $80 billion that have an effective date of August 20, 2007). Similarly, the terms of each New Sub-Advisory Agreement, including fees payable thereunder, are substantially identical to those of the Original Sub-Advisory Agreement relating to the same Fund. The Board considered that the services to be provided and the standard of care under the New Investment Advisory Agreements and the New Sub-Advisory Agreements are the same as the corresponding original agreements. For Funds with Sub-Advisers, the Board Members noted the Transaction does not alter the allocation of responsibilities between the Adviser and Sub-Adviser. The respective Sub-Adviser for the applicable Funds will continue to furnish an investment program in respect of, make investment decisions for and place all orders for the purchase and sale of securities for the portion of the Fund’s investment portfolio allocated by the Adviser to the respective Sub-Adviser, all on behalf of the applicable Fund and subject to oversight of the Board and the Adviser. The Board Members further noted that key personnel of the Adviser or Sub-Adviser who have responsibility for the Funds in each area, including portfolio management, investment oversight, fund management, fund operations, product management, legal/compliance and board support functions, are expected to be the same following the Transaction. The Board Members considered and are familiar with the qualifications, skills and experience of such personnel. The Board also considered certain information regarding any anticipated retention or incentive plans designed to retain key personnel. Further, the Board Members noted that no changes to Nuveen’s infrastructure (including at the affiliated sub-adviser level) or operations as a result of the Transaction were anticipated other than potential enhancements as a result of an expected increase in the level of investment in such infrastructure and personnel. The Board noted MDP’s representations that it does not plan to have a direct role in the management of Nuveen, appointing new management personnel, or directly impacting individual staffing decisions. The Board Members also noted that there were not any planned “cost cutting” measures that could be expected to reduce the nature, extent or quality of services. After consideration of the foregoing, the Board Members concluded that no diminution in the nature, quality and extent of services provided to the Funds and their shareholders by the respective Fund Advisers is expected.
In addition to the above, the Board Members considered potential changes in the operations of each Fund. In this regard, the Board Members considered the potential effect of regulatory restrictions on the Funds’ transactions with future affiliated persons. During their deliberations, it was noted that, after the Transaction, a subsidiary of Merrill Lynch is expected to have an ownership interest in Nuveen at a level that will make Merrill Lynch an affiliated person of Nuveen. The Board Members recognized that applicable law would generally prohibit the Funds from engaging in securities transactions with Merrill Lynch as principal, and would also impose restrictions on using Merrill Lynch for agency transactions. They recognized that having MDP and Merrill Lynch as affiliates may restrict the Nuveen funds’ ability to invest in securities of issuers controlled by MDP or issued by Merrill Lynch and its affiliates even if not bought directly from MDP or Merrill Lynch as principal. They also recognized that various regulations may require the Nuveen funds to apply investment limitations on a combined basis with affiliates of Merrill Lynch. The Board Members considered information provided by NAM regarding the potential impact on the Nuveen funds’ operations as a result of these regulatory restrictions. The Board Members considered, in particular, the Nuveen funds that may be impacted most by the restricted access to Merrill Lynch, including: municipal funds (particularly certain state-specific funds), senior loan funds, taxable fixed income funds, preferred security funds and funds that heavily use derivatives. The Board Members considered such funds’ historic use of Merrill Lynch as principal in their transactions and information provided by NAM regarding the expected impact resulting from Merrill Lynch’s affiliation with Nuveen and available measures that could be taken to minimize such impact. NAM informed the Board Members that, although difficult to determine with certainty, its management did not believe that MDP’s or Merrill Lynch’s status as an affiliate of Nuveen would have a material adverse effect on any Nuveen fund’s ability to pursue its investment objectives and policies.
In addition to the regulatory restrictions considered by the Board, the Board Members also considered potential conflicts of interest that could arise between the Nuveen funds and various parties to the Transaction and discussed possible ways of addressing such conflicts.
Based on its review along with its considerations regarding services at the annual and/or initial review, the Board concluded that the Transaction was not expected to adversely affect the nature, quality or extent of services provided by the respective Fund Adviser and that the expected nature, quality and extent of such services supported approval of the New Investment Management Agreements and New Sub-Advisory Agreements.
B. Performance of the Funds
With respect to the performance of the Funds, the Board considered that the portfolio management personnel responsible for the management of the Funds’ portfolios were expected to continue to manage the portfolios following the completion of the Transaction.
70
In addition, the Board Members recently reviewed Existing Fund performance at the May Meeting as described above and determined such Funds’ performance was satisfactory or better. With respect to New Funds, the Funds did not have their own performance history at their respective Initial Approval Meeting. However, in certain cases, the Board Members received performance information regarding the proposed investment strategies for the applicable New Fund (if available). The Board Members noted that the New Funds have only been operating for a short period since inception. The Board Members further noted that the investment policies and strategies were not expected to change as a result of the Transaction.
In light of the foregoing factors, along with the prior findings regarding performance at the annual review, the Board concluded that its findings with respect to performance supported approval of the New Investment Management Agreements and New Sub-Advisory Agreements.
C. Fees, Expenses and Profitability
As described in more detail above, during the annual or initial reviews, the Board Members considered, among other things, the management fees and expenses of the Funds, the breakpoint schedules, and comparisons of such fees and expenses with peers. At the annual or initial review, the Board Members determined that the respective Fund’s advisory fees and expenses were reasonable. In evaluating the profitability of the Fund Adviser under the New Investment Management Agreements and New Sub-Advisory Agreements, the Board Members considered their conclusions at their prior reviews and whether the management fees or other expenses would change as a result of the Transaction. As described above, the investment management fee for NAM is composed of two components – a fund-level component and complex-wide level component. The fee schedule under the New Investment Management Agreements to be paid to NAM is identical to that under the Original Investment Management Agreements, including the modified complex-wide fee schedule. As noted above, the Board recently approved a modified complex-wide fee schedule that would generate additional fee savings on complex-wide assets above $80 billion. The modifications have an effective date of August 20, 2007 and are part of the Original Investment Management Agreements. Accordingly, the terms of the complex-wide component under the New Investment Management Agreements are the same as under the Original Investment Management Agreements. The Board Members also noted that Nuveen has committed for a period of two years from the date of closing of the Transaction that it will not increase gross management fees for any Nuveen fund and will not reduce voluntary expense reimbursement levels for any Nuveen fund from their currently scheduled prospective levels (subject to certain potential adjustments noted below). Based on the information provided, the Board Members did not expect that overall Fund expenses would increase as a result of the Transaction.
In addition, the Board Members considered that additional fund launches were anticipated after the Transaction which would result in an increase in total assets under management in the complex and a corresponding decrease in overall management fees under the complex-wide fee schedule. Taking into consideration the Board’s prior evaluation of fees and expenses at the annual renewal or initial approval, and the modification to the complex-wide fee schedule, the Board determined that the management fees and expenses were reasonable.
While it is difficult to predict with any degree of certainty the impact of the Transaction on Nuveen’s profitability for its advisory activities (which includes its affiliated sub-advisers), at the recent annual review, the Board Members were satisfied that Nuveen’s level of profitability for its advisory activities was reasonable. During the year, the Board Members had noted the enhanced dialogue regarding profitability and the appointment of an Independent Board Member as a point person to review methodology determinations and refinements in calculating profitability. Given their considerations at the annual or initial review and the modifications to the complex-wide fee schedule, the Board Members were satisfied that Nuveen’s level of profitability for its advisory activities continues to be reasonable.
With respect to the Sub-Advisers, the fees paid under the New Sub-Advisory Agreements are the same as the Original Sub-Advisory Agreements. At the annual review, the Board Members were satisfied that the respective Fund Adviser’s level of profitability was reasonable in light of the services provided. The Transaction is not anticipated to affect profitability of such Sub-Advisers. Taking into account the Board’s prior evaluation and the fact that sub-advisory fees will not change, the Board Members were satisfied that the respective Fund Advisers’ levels of profitability were reasonable in light of the services provided.
D. Economies of Scale and Whether Fee Levels Reflect These Economies of Scale
The Board Members have been cognizant of economies of scale and the potential benefits resulting from the costs of a Fund being spread over a larger asset base. To help ensure that shareholders share in the benefits derived from economies of scale, the Board adopted the complex-wide fee arrangement in 2004. At the May Meeting, the Board Members reviewed the complex-wide fee arrangements and noted that additional negotiations may be necessary or appropriate as the assets in the complex approached the $91 billion threshold. In light of this assessment coupled with the upcoming Transaction, at the June 15, 2007 meeting, the ad hoc committee met with representatives of Nuveen to further discuss modifications to the complex-wide fee schedule that would generate additional savings for shareholders as the assets of the complex grow. The proposed terms for the complex-wide fee schedule are expressed in terms of targeted cumulative savings at specified levels of complex-wide assets, rather than in terms of targeted marginal complex-wide fee rates. Under the modified schedule, the schedule would generate additional fee savings beginning at complex-wide assets of $80 billion in order to achieve targeted cumulative annual savings at $91 billion of $28 million on a complex-wide level (approximately $0.6 million higher than those generated under the then current schedule) and generate additional fee savings for asset growth above complex-wide assets of $91 billion in order to achieve targeted annual savings at
71
Annual Investment Management Agreement Approval Process (continued)
$125 billion of assets of approximately $50 million on a complex-wide level (approximately $2.2 million higher annually than that generated under the then current schedule). At the July Meeting, the Board approved the modified complex-wide fee schedule for the Original Investment Management Agreements and these same terms will apply to the New Investment Management Agreements. Accordingly, the Board Members believe that the breakpoint schedules and revised complex-wide fee schedule are appropriate and desirable in ensuring that shareholders participate in the benefits derived from economies of scale.
E. Indirect Benefits
During their recent annual or initial review, the Board Members considered any indirect benefits that the Fund Adviser may receive as a result of its relationship with the Funds, as described above. As the policies and operations of the Fund Advisers are not anticipated to change significantly after the Transaction, such indirect benefits should remain after the Transaction. The Board Members further considered any additional indirect benefits to be received by the Fund Adviser or its affiliates after the Transaction. The Board Members noted that other than benefits from its ownership interest in Nuveen and indirect benefits from fee revenues paid by the Funds under the management agreements and other Board-approved relationships, it was currently not expected that MDP or its affiliates would derive any benefit from the Funds as a result of the Transaction or transact any business with or on behalf of the Funds (other than perhaps potential Fund acquisitions, in secondary market transactions, of securities issued by MDP portfolio companies); or that Merrill Lynch or its affiliates would derive any benefits from the Funds as a result of the Transaction (noting that, indeed, Merrill Lynch would stand to experience the discontinuation of principal transaction activity with the Nuveen funds and likely would experience a noticeable reduction in the volume of agency transactions with the Nuveen funds).
F. Other Considerations
In addition to the factors above, the Board Members also considered the following with respect to the Funds:
| • | | Nuveen would rely on the provisions of Section 15(f) of the 1940 Act. Section 15(f) provides, in substance, that when a sale of a controlling interest in an investment adviser occurs, the investment adviser or any of its affiliated persons may receive any amount or benefit in connection with the sale so long as (i) during the three-year period following the consummation of a transaction, at least 75% of the investment company’s board of directors must not be “interested persons” (as defined in the 1940 Act) of the investment adviser or predecessor adviser and (ii) an “unfair burden” (as defined in the 1940 Act, including any interpretations or no-action letters of the SEC) must not be imposed on the investment company as a result of the transaction relating to the sale of such interest, or any express or implied terms, conditions or understanding applicable thereto. In this regard, to help ensure that an unfair burden is not imposed on the Nuveen funds, Nuveen has committed for a period of two years from the date of the closing of the Transaction (i) not to increase gross management fees for any Nuveen fund; (ii) not to reduce voluntary expense reimbursement levels for any Nuveen fund from their currently scheduled prospective levels during that period (such commitment, however, may exclude or be adjusted for the impact or future class-specific expense allocation protocol changes for a particular mutual fund); (iii) that no Nuveen fund whose portfolio is managed by a Nuveen affiliate shall use Merrill Lynch as a broker with respect to portfolio transactions done on an agency basis, except as may be approved in the future by the Compliance Committee of the Board; and (iv) that each adviser/portfolio team affiliated with Nuveen shall not cause the Funds (or sleeves thereof) and other Nuveen funds that the team manages, as a whole, to enter into portfolio transactions with or through the other minority owners of Nuveen on either a principal or an agency basis, to a significantly greater extent than both what one would expect an investment team to use such firm in the normal course of business and what such team has historically done, without prior Board or Compliance Committee approval (excluding the impact of proportionally increasing the use of such other “minority owners” to fill the void necessitated by not being able to use Merrill Lynch). |
| • | | The Funds would not incur any costs in seeking the necessary shareholder approvals for the New Investment Management Agreements or New Sub-Advisory Agreements (except for any costs attributed to seeking shareholder approvals of Fund specific matters unrelated to the Transaction, such as approval of Board Members or changes to investment policies, in which case a portion of such costs will be borne by the applicable Funds). |
| • | | The reputation, financial strength and resources of MDP. |
| • | | The long-term investment philosophy of MDP and anticipated plans to grow Nuveen’s business to the benefit of the Nuveen funds. |
| • | | The benefits to the Nuveen funds as a result of the Transaction including: (i) as a private company, Nuveen may have more flexibility in making additional investments in its business; (ii) as a private company, Nuveen may be better able to structure compensation packages to attract and retain talented personnel; (iii) as certain of Nuveen’s distribution partners are expected to be equity or debt investors in Nuveen, Nuveen may be able to take advantage of new or enhanced distribution arrangements with such partners; and (iv) MDP’s experience, capabilities and resources that may help Nuveen identify and acquire investment teams or firms and finance such acquisitions. |
G. Conclusion
The Board Members did not identify any single factor discussed previously as all-important or controlling. The Board Members, including the Independent Board Members, unanimously concluded that the terms of the New Investment Management Agreements
72
and New Sub-Advisory Agreements are fair and reasonable, that the fees therein are reasonable in light of the services to be provided to each Fund and that the New Investment Management Agreements and New Sub-Advisory Agreements should be approved and recommended to shareholders.
III. Approval of Interim Contracts
As noted above, at the July Meeting, the Board Members, including the Independent Board Members, unanimously approved the Interim Investment Management Agreements and Interim Sub-Advisory Agreements. If necessary to assure continuity of advisory services, the Interim Investment Management Agreements and Interim Sub-Advisory Agreements will take effect upon the closing of the Transaction if shareholders have not yet approved the New Investment Management Agreements and New Sub-Advisory Agreements. The terms of each Interim Investment Management Agreement and Interim Sub-Advisory Agreement are substantially identical to those of the corresponding Original Investment Management Agreement and New Investment Management Agreement and the Original Sub-Advisory Agreement and New Sub-Advisory Agreement, respectively, except for certain term and escrow provisions. In light of the foregoing, the Board Members, including the Independent Board Members, unanimously determined that the scope and quality of services to be provided to the Funds under the respective Interim Investment Management Agreement and Interim Sub-Advisory Agreement are at least equivalent to the scope and quality of services provided under the applicable Original Investment Management Agreement and Original Sub-Advisory Agreement.
73
Notes
74
Notes
75
Notes
76
Trustees and Officers
The management of the Funds, including general supervision of the duties performed for the Funds by the Adviser, is the responsibility of the Board of Trustees of the Funds. The number of trustees of the Funds is currently set at eight. None of the trustees who are not “interested” persons of the Funds has ever been a director or employee of, or consultant to, Nuveen or its affiliates. The names and business addresses of the trustees and officers of the Funds, their principal occupations and other affiliations during the past five years, the number of portfolios each oversees and other directorships they hold are set forth below.
The Funds’ Statement of Additional Information (“SAI”) includes more information about the Trustees. To request a free copy, call Nuveen Investments at (800) 257-8787 or visit the Funds’ website at www.nuveen.com.
| | | | | | | | |
Name, Birthdate and Address | | Position(s) Held with the Funds | | Year First Elected or Appointed (2) | | Principal Occupation(s) Including other Directorships During Past 5 Years | | Number of Portfolios in Fund Complex Overseen by Trustee |
| |
| Trustee who is an interested person of the Funds: | | |
| | | | |
| | | | | | | | | |
Timothy R. Schwertfeger (1) 3/28/49 333 W. Wacker Drive Chicago, IL 60606 | | Chairman of the Board and Trustee | | 1994 | | Director and Chairman (since 1996) and Non-Executive Chairman (since July 1, 2007) formerly, Chief Executive Officer (1996-June 30, 2007) of Nuveen Investments, Inc., and Nuveen Asset Management and certain other subsidiaries of Nuveen Investments, Inc.; formerly, Director (1992-2006) of Institutional Capital Corporation. | | 176 |
| | |
| Trustees who are not interested persons of the Funds: | | | | |
| | | | |
| | | | | | | | | |
Robert P. Bremner 8/22/40 333 W. Wacker Drive Chicago, IL 60606 | | Lead Independent Trustee | | 1997 | | Private Investor and Management Consultant. | | 176
|
| | | | |
| | | | | | | | | |
Jack B. Evans 10/22/48 333 W. Wacker Drive Chicago, IL 60606 | | Trustee | | 1999 | | President, The Hall-Perrine Foundation, a private philanthropic corporation (since 1996); Director and Vice Chairman, United Fire Group, a publicly held company; Member of the Board of Regents for the State of Iowa University System; Director, Gazette Companies; Life Trustee of Coe College and Iowa College Foundation; Member of the Advisory Council of the Department of Finance in the Tippie College of Business, University of lowa; formerly, Director, Alliant Energy; formerly, Director, Federal Reserve Bank of Chicago; formerly, President and Chief Operating Officer, SCI Financial Group, Inc., a regional financial services firm. | | 176
|
| | | | |
| | | | | | | | | |
William C. Hunter 3/6/48 333 W. Wacker Drive Chicago, IL 60606 | | Trustee | | 2004 | | Dean, Tippie College of Business, University of Iowa (since July 2006); formerly, Dean and Distinguished Professor of Finance, School of Business at the University of Connecticut (2003-2006); previously, Senior Vice President and Director of Research at the Federal Reserve Bank of Chicago (1995-2003); Director (since 1997), Credit Research Center at Georgetown University; Director (since 2004) of Xerox Corporation; Director, SS&C Technologies, Inc. (May 2005-October 2005). | | 176
|
| | | | |
| | | | | | | | | |
David J. Kundert 10/28/42 333 W. Wacker Drive Chicago, IL 60606 | | Trustee | | 2005 | | Director, Northwestern Mutual Wealth Management Company; Retired (since 2004) as Chairman, JPMorgan Fleming Asset Management, President and CEO, Banc One Investment Advisors Corporation, and President, One Group Mutual Funds; prior thereto, Executive Vice President, Banc One Corporation and Chairman and CEO, Banc One Investment Management Group; Board of Regents, Luther College; member of the Wisconsin Bar Association; member of Board of Directors, Friends of Boerner Botanical Gardens; member of Board of Directors, Milwaukee Repertory Theater. | | 174
|
77
Trustees and Officers (continued)
| | | | | | | | |
Name, Birthdate and Address | | Position(s) Held with the Funds | | Year First Elected or Appointed (2) | | Principal Occupation(s) Including other Directorships During Past 5 Years | | Number of Portfolios in Fund Complex Overseen by Trustee |
William J. Schneider 9/24/44 333 W. Wacker Drive Chicago, IL 60606 | | Trustee | | 1997 | | Chairman of Miller-Valentine Partners Ltd., a real estate investment company; formerly, Senior Partner and Chief Operating Officer (retired, 2004) of Miller-Valentine Group; formerly, Vice President, Miller-Valentine Realty; Board Member, Chair of the Finance Committee and member of the Audit Committee of Premier Health Partners, the not-for-profit company of Miami Valley Hospital; Vice President, Dayton Philharmonic Orchestra Association; Board Member, Regional Leaders Forum, which promotes cooperation on economic development issues; Director, Dayton Development Coalition; formerly, Member, Community Advisory Board, National City Bank, Dayton, Ohio and Business Advisory Council, Cleveland Federal Reserve Bank. | | 176 |
| | | | |
| | | | | | | | | |
Judith M. Stockdale 12/29/47 333 W. Wacker Drive Chicago, IL 60606 | | Trustee | | 1997 | | Executive Director, Gaylord and Dorothy Donnelley Foundation (since 1994); prior thereto, Executive Director, Great Lakes Protection Fund (from 1990 to 1994). | | 176 |
| | | | |
| | | | | | | | | |
Carole E. Stone 6/28/47 333 West Wacker Drive Chicago, IL 60606 | | Trustee | | 2007 | | Director, Chicago Board Options Exchange (since 2006); Chair New York Racing Association Oversight Board (since 2005); Commissioner, New York State Commission on Public Authority Reform (since 2005); formerly Director, New York State Division of the Budget (2000-2004), Chair, Public Authorities Control Board (2000-2004) and Director, Local Government Assistance Corporation (2000-2004). | | 176 |
| | | | |
| | | | | | | | | |
Name, Birthdate and Address | | Position(s) Held with the Funds | | Year First Elected or Appointed (3) | | Principal Occupation(s) During Past 5 Years | | Number of Portfolios in Fund Complex Overseen by Officer |
| | |
| Officers of the Funds: | | | | |
| | | | |
| | | | | | | | | |
Gifford R. Zimmerman 9/9/56 333 W. Wacker Drive Chicago, IL 60606 | | Chief Administrative Officer | | 1988 | | Managing Director (since 2002), Assistant Secretary and Associate General Counsel, formerly, Vice President and Assistant General Counsel, of Nuveen Investments, LLC; Managing Director (since 2002) and Assistant Secretary and Associate General Counsel, formerly, Vice President (since 1997), of Nuveen Asset Management; Managing Director (since 2004) and Assistant Secretary (since 1994) of Nuveen Investments, Inc.; Assistant Secretary of NWQ Investment Management Company, LLC. (since 2002); Vice President and Assistant Secretary of Nuveen Investments Advisers Inc. (since 2002); Managing Director, Associate General Counsel and Assistant Secretary of Rittenhouse Asset Management, Inc., Symphony Asset Management LLC (since 2003), Tradewinds Global Investors, LLC and Santa Barbara Asset Management, LLC (since 2006); formerly, Managing Director (2002-2004), General Counsel (1998-2004) and Assistant Secretary, formerly, Vice President of Nuveen Advisory Corp. and Nuveen Institutional Advisory Corp.(4); Chartered Financial Analyst. | | 176 |
| | | | |
| | | | | | | | | |
Julia L. Antonatos 9/22/63 333 W. Wacker Drive Chicago, IL 60606 | | Vice President | | 2004 | | Managing Director (since 2005), formerly, Vice President (since 2002) of Nuveen Investments, LLC; Chartered Financial Analyst. | | 176 |
| | | | |
| | | | | | | | | |
Michael T. Atkinson 2/3/66 333 W. Wacker Drive Chicago, IL 60606 | | Vice President and Assistant Secretary | | 2000 | | Vice President (since 2002) of Nuveen Investments, LLC. | | 176 |
78
| | | | | | | | |
Name, Birthdate and Address | | Position(s) Held with the Funds | | Year First Elected or Appointed (3) | | Principal Occupation(s) Including other Directorships During Past 5 Years | | Number of Portfolios in Fund Complex Overseen by
Officer |
Alan A. Brown 8/1/62 333 West Wacker Drive Chicago, IL 60606 | | Vice President | | 2007 | | Executive Vice President, Mutual Funds, Nuveen Investments, LLC, (since 2005), previously, Managing Director and Chief Marketing Officer (2001-2005). | | 57 |
| | | | |
| | | | | | | | | |
Peter H. D’Arrigo 11/28/67 333 W. Wacker Drive Chicago, IL 60606 | | Vice President | | 1999 | | Vice President and Treasurer of Nuveen Investments, LLC and of Nuveen Investments, Inc. (since 1999); Vice President and Treasurer of Nuveen Asset Management (since 2002) and of Nuveen Investments Advisers Inc. (since 2002); Assistant Treasurer of NWQ Investment Management Company, LLC. (since 2002); Vice President and Treasurer of Nuveen Rittenhouse Asset Management, Inc. (since 2003); Treasurer of Symphony Asset Management LLC (since 2003) and Santa Barbara Asset Management, LLC (since 2006); Assistant Treasurer, Tradewinds Global Investors, LLC (since 2006); formerly, Vice President and Treasurer (1999-2004) of Nuveen Advisory Corp. and Nuveen Institutional Advisory Corp.(4); Chartered Financial Analyst. | | 176 |
| | | | |
| | | | | | | | | |
Lorna C. Ferguson 10/24/45 333 W. Wacker Drive Chicago, IL 60606 | | Vice President | | 1998 | | Managing Director (since 2004), formerly, Vice President of Nuveen Investments, LLC, Managing Director (2004) formerly, Vice President (1998-2004) of Nuveen Advisory Corp. and Nuveen Institutional Advisory Corp.(4); Managing Director (since 2005) of Nuveen Asset Management. | | 176 |
| | | | |
| | | | | | | | | |
William M. Fitzgerald 3/2/64 333 W. Wacker Drive Chicago, IL 60606 | | Vice President | | 1995 | | Managing Director (since 2002), formerly, Vice President of Nuveen Investments, LLC; Managing Director (1997-2004) of Nuveen Advisory Corp. and Nuveen Institutional Advisory Corp.(4); Managing Director (since 2001) of Nuveen Asset Management ; Vice President (since 2002) of Nuveen Investments Advisers Inc.; Chartered Financial Analyst. | | 176 |
| | | | |
| | | | | | | | | |
Stephen D. Foy 5/31/54 333 W. Wacker Drive Chicago, IL 60606 | | Vice President and Controller | | 1998 | | Vice President (since 1993) and Funds Controller (since 1998) of Nuveen Investments, LLC; formerly, Vice President and Funds Controller (1998-2004) of Nuveen Investments, Inc.; Certified Public Accountant. | | 176 |
| | | | |
| | | | | | | | | |
Walter M. Kelly 2/24/70 333 West Wacker Drive Chicago, IL 60606 | | Chief Compliance Officer and Vice President | | 2003 | | Assistant Vice President and Assistant Secretary of the Nuveen Funds (2003-2006); Assistant Vice President and Assistant General Counsel (since 2003) of Nuveen Investments, LLC; previously, Associate (2001-2003) at the law firm of Vedder, Price, Kaufman & Kammholz. | | 176 |
| | | | |
| | | | | | | | | |
David J. Lamb 3/22/63 333 W. Wacker Drive Chicago, IL 60606 | | Vice President | | 2000 | | Vice President (since 2000) of Nuveen Investments, LLC; Certified Public Accountant. | | 176 |
| | | | |
| | | | | | | | | |
Tina M. Lazar 8/27/61 333 W. Wacker Drive Chicago, IL 60606 | | Vice President | | 2002 | | Vice President of Nuveen Investments, LLC (since 1999). | | 176 |
79
Trustees and Officers (continued)
| | | | | | | | |
Name, Birthdate and Address | | Position(s) Held with the Funds | | Year First Elected or Appointed (3) | | Principal Occupation(s) Including other Directorships During Past 5 Years | | Number of Portfolios in Fund Complex Overseen by
Officer |
Larry W. Martin 7/27/51 333 W. Wacker Drive Chicago, IL 60606 | | Vice President and Assistant Secretary | | 1988 | | Vice President, Assistant Secretary and Assistant General Counsel of Nuveen Investments, LLC; formerly, Vice President and Assistant Secretary of Nuveen Advisory Corp. and Nuveen Institutional Advisory Corp.(4); Vice President (since 2005) and Assistant Secretary of Nuveen Investments, Inc.; Vice President (since 2005) and Assistant Secretary (since 1997) of Nuveen Asset Management; Vice President (since 2000), Assistant Secretary and Assistant General Counsel (since 1998) of Rittenhouse Asset Management, Inc.; Vice President and Assistant Secretary of Nuveen Investments Advisers Inc. (since 2002); Assistant Secretary of NWQ Investment Management Company, LLC (since 2002), Symphony Asset Management LLC (since 2003), and Tradewinds Global Investors, LLC and Santa Barbara Asset Management, LLC (since 2006). | | 176 |
| | | | |
| | | | | | | | | |
Kevin J. McCarthy 3/26/66 333 W. Wacker Drive Chicago, IL 60606 | | Vice President and Secretary | | 2007 | | Vice President and Assistant General Counsel, Nuveen Investments, Inc. (since 2007); Vice President, Nuveen Investments, LLC (since 2007); Vice President and Assistant Secretary, Nuveen Asset Management and Rittenhouse Asset Management, Inc. (since 2007) prior thereto, Partner, Bell, Boyd & Lloyd LLP (1997-2007). | | 176 |
| | | | |
| | | | | | | | | |
John V. Miller 4/10/67 333 W. Wacker Drive Chicago, IL 60606 | | Vice President | | 2007 | | Managing Director (since 2007), formerly, Vice President (2002-2007) of Nuveen Asset Management and Nuveen Investments, LLC; Chartered Financial Analyst. | | 176 |
| | | | |
| | | | | | | | | |
John S. White 5/12/67 333 West Wacker Drive Chicago, IL 60606 | | Vice President | | 2007 | | Vice President (since 2006) of Nuveen Investments, LLC, formerly, Assistant Vice President (since 2002); Lieutenant Colonel (since 2007), United States Marine Corps Reserve, formerly, Major (since 2001). | | 57 |
| (1) | Mr. Schwertfeger is an “interested person” of the Funds, as defined in the Investment Company Act of 1940, because he is an officer and trustee of the Adviser. |
| (2) | Trustees serve an indefinite term until his/her successor is elected or appointed. The year first elected or appointed represents the year in which the Trustee was first elected or appointed to any fund in the Nuveen Complex. |
| (3) | Officers serve one year terms through July of each year. The year first elected or appointed represents the year in which the Officer was first elected or appointed to any fund in the Nuveen Complex. |
| (4) | Nuveen Advisory Corp. and Nuveen Institutional Advisory Corp. were reorganized into Nuveen Asset Management, effective January 1, 2005. |
80
Fund Information
| | | | |
| | |
Fund Manager Nuveen Asset Management 333 West Wacker Drive Chicago, IL 60606 Sub-Advisers NWQ Investment Management Company, LLC 2049 Century Park East Los Angeles, CA 90067 Tradewinds Global Investors, LLC 2049 Century Park East Los Angeles, CA 90067 | | Legal Counsel Chapman and Cutler LLP Chicago, IL Independent Registered Public Accounting Firm PricewaterhouseCoopers LLP Chicago, IL Custodian State Street Bank & Trust Company Boston, MA | | Transfer Agent and Shareholder Services Boston Financial Data Services, Inc. Nuveen Investor Services P.O. Box 8530 Boston, MA 02266-8530 (800) 257-8787 |
Glossary of Terms Used in this Report
Average Annual Total Return: This is a commonly used method to express an investment’s performance over a particular, usually multi-year time period. It expresses the return that would have been necessary each year to equal the investment’s actual cumulative performance (including change in NAV or offer price and reinvested dividends and capital gains distributions, if any) over the time period being considered.
Average Market Capitalization: The market capitalization of a company is equal to the number of the company’s common shares outstanding multiplied by the current price of the company’s stock. The average market capitalization of a mutual fund’s portfolio gives a measure of the size of the companies in which the fund invests.
Net Asset Value (NAV): A fund’s NAV is the dollar value of one share in the fund. It is calculated by subtracting the liabilities of the fund from its total assets and then dividing the remainder by the number of shares outstanding. Fund NAVs are calculated at the end of each business day.
Quarterly Portfolio of Investments and Proxy Voting Information: Each Fund’s (i) quarterly portfolio of investments, (ii) information regarding how the Funds voted proxies relating to portfolio securities held during the most recent 12-month period ended June 30, 2007, and (iii) a description of the policies and procedures that the Funds used to determine how to vote proxies relating to portfolio securities are available without charge, upon request, by calling Nuveen Investments at (800) 257-8787 or on Nuveen’s website at www.nuveen.com.
You may also obtain this and other Fund information directly from the Securities and Exchange Commission (“SEC”). The SEC may charge a copying fee for this information. Visit the SEC on-line at http://www.sec.gov or in person at the SEC’s Public Reference Room in Washington, D.C. Call the SEC at 1-202-942-8090 for room hours and operation. You may also request fund information by sending an e-mail request to publicinfo@sec.gov or by writing to the SEC’s Public Reference Section at 450 Fifth Street NW, Washington, D.C. 20549.
Distribution Information: Multi-Cap Value, Large-Cap Value, Small/Mid-Cap Value, Small-Cap Value, Global Value and Value Opportunities designate 52.16%, 00.00%, 00.00%, 100.00%, 43.81% and 36.27%, respectively, of dividends declared from net ordinary income as dividends qualifying for the 70% dividends received deduction for corporations and 55.52%, 00.00%, 00.00%, 100.00%, 99.24% and 50.74%, respectively, as qualified dividend income for individuals under the Jobs and Growth Tax Relief Reconciliation Act of 2003.
NASD Regulation, Inc. provides a Public Disclosure Program which supplies certain information regarding the disciplinary history of NASD members and their associated persons in response to either telephone inquiries at (800) 289-9999 or written inquiries at www.nasdr.com. NASD Regulation, Inc. also provides an investor brochure that includes information describing the Public Disclosure Program.
81
Learn more
about Nuveen Funds at
www.nuveen.com/mf
Nuveen Investments:
SERVING Investors
For GENERATIONS
Since 1898, financial advisors and their clients have relied on Nuveen Investments to provide dependable investment solutions. Over this time, Nuveen Investments has adhered to the belief that the best approach to investing is to apply conservative risk-management principles to help minimize volatility.
Building on this tradition, we today offer a range of high quality equity and fixed-income solutions that can be integral parts of a well-diversified core portfolio. Our clients have come to appreciate this diversity, as well as our continued adherence to proven, long-term investing principles.
We offer many different investing solutions for our clients’ different needs.
Managing approximately $172 billion in assets as of June 30, 2007, Nuveen Investments offers access to a number of different asset classes and investing solutions through a variety of products. Nuveen Investments markets its capabilities under six distinct brands: NWQ, specializing in value-style equities; Nuveen, managing fixed-income investments; Santa Barbara, committed to growth equities; Tradewinds, specializing in global value equities; Rittenhouse, focused on “blue-chip” growth equities; and Symphony, with expertise in alternative investments as well as equity and income portfolios.
Find out how we can help you reach your financial goals.
An investor should carefully consider the Fund’s objectives, risks, charges and expenses before investing. For a prospectus containing this and other information about the Fund, please contact your financial advisor or Nuveen Investments at (800) 257-8787. Read the prospectus carefully before you invest or send money.
MAN-NWQ-0607D
ITEM 2. CODE OF ETHICS.
As of the end of the period covered by this report, the registrant has adopted a code of ethics that applies to the registrant’s principal executive officer, principal financial officer, principal accounting officer or controller, or persons performing similar functions. There were no amendments to or waivers from the code during the period covered by this report. The registrant has posted the code of ethics on its website at www.nuveen.com/mf. (To view the code, click on the Investor Resources drop down menu box, click on Fund Governance and then click on Code of Conduct.)
ITEM 3. AUDIT COMMITTEE FINANCIAL EXPERT.
The registrant’s board of directors determined that the registrant has at least one “audit committee financial expert” (as defined in Item 3 of Form N-CSR) serving on its Audit Committee. The registrant’s audit committee financial expert is Jack B. Evans, Chairman of the Audit Committee, who is “independent” for purposes of Item 3 of Form N-CSR.
Mr. Evans was formerly President and Chief Operating Office of SCI Financial Group, Inc., a full service registered broker-dealer and registered investment adviser (“SCI”). As part of his role as President and Chief Operating Officer, Mr. Evans actively supervised the Chief Financial Officer (the “CFO”) and actively supervised the CFO’s preparation of financial statements and other filings with various regulatory authorities. In such capacity, Mr. Evans was actively involved in the preparation of SCI’s financial statements and the resolution of issues raised in connection therewith. Mr. Evans has also served on the audit committee of various reporting companies. At such companies, Mr. Evans was involved in the oversight of audits, audit plans, and the preparation of financial statements. Mr. Evans also formerly chaired the audit committee of the Federal Reserve Bank of Chicago.
ITEM 4. PRINCIPAL ACCOUNTANT FEES AND SERVICES.
The following tables show the amount of fees that PricewaterhouseCoopers LLP, the Trust’s auditor, billed to the Trust during the Trust’s last two full fiscal years. The Audit Committee approved in advance all audit services and non-audit services that PricewaterhouseCoopers LLP provided to the Trust, except for those non-audit services that were subject to the pre-approval exception under Rule 2-01 of Regulation S-X (the “pre-approval exception”). The pre-approval exception for services provided directly to the Trust waives the pre-approval requirement for services other than audit, review or attest services if: (A) the aggregate amount of all such services provided constitutes no more than 5% of the total amount of revenues paid by the Trust during the fiscal year in which the services are provided; (B) the Trust did not recognize the services as non-audit services at the time of the engagement; and (C) the services are promptly brought to the Audit Committee’s attention, and the Committee (or its delegate) approves the services before the audit is completed.
The Audit Committee has delegated certain pre-approval responsibilities to its Chairman (or, in his absence, any other member of the Audit Committee).
SERVICES THAT THE TRUST’S AUDITOR BILLED TO THE TRUST
| | | | | | | | | | | | |
Fiscal Year Ended June 30, 2007 | | Audit Fees Billed
to Funds 1 | | Audit-Related Fees Billed to Funds 2 | | Tax Fees
Billed to Funds 3 | | All Other Fees
Billed to Funds 4 |
Name of Series | | | | | | | | | | | | |
Balanced Stock and Bond Fund | | | 7,506 | | | 0 | | | 262 | | | 0 |
Balanced Municipal and Stock Fund | | | 8,210 | | | 0 | | | 348 | | | 0 |
Large Cap Value Fund | | | 24,408 | | | 0 | | | 2,475 | | | 0 |
NWQ Multi-Cap Value Fund | | | 53,292 | | | 0 | | | 5,447 | | | 0 |
NWQ Global Value Fund | | | 6,230 | | | 0 | | | 70 | | | 0 |
NWQ Small-Cap Value Fund | | | 12,222 | | | 0 | | | 423 | | | 0 |
Tradewinds Value Opportunities Fund | | | 18,475 | | | 0 | | | 1,051 | | | 0 |
NWQ Large-Cap Value Fund | | | 5,629 | | | 0 | | | 0 | | | 0 |
NWQ Small-/Mid-Cap Value Fund | | | 5,664 | | | 0 | | | 0 | | | 0 |
| | | | | | | | | | | | |
Total | | $ | 141,636 | | $ | 0 | | $ | 10,076 | | $ | 0 |
1 | | “Audit Fees” are the aggregate fees billed for professional services for the audit of the Fund's annual financial statements and services provided in connection with statutory and regulatory filings or engagements. |
2 | | “Audit Related Fees” are the aggregate fees billed for assurance and related services reasonably related to the performance of the audit or review of financial statements and are not reported under "Audit Fees". |
3 | | “Tax Fees” are the aggregate fees billed for professional services for tax advice, tax compliance, and tax planning. |
4 | | “All Other Fees” are the aggregate fees billed for products and services other than “Audit Fees”, “Audit Related Fees”, and “Tax Fees”. |
| | | | | | | | |
| | | Percentage Approved Pursuant to Pre-approval Exception |
| | | Audit Fees Billed
to Funds | | Audit-Related Fees Billed to Funds | | Tax Fees
Billed to Funds | | All Other Fees
Billed to Funds |
Name of Series | | | | | | | | |
Balanced Stock and Bond Fund | | 0 | | 0 | | 0 | | 0 |
Balanced Municipal and Stock Fund | | 0 | | 0 | | 0 | | 0 |
Large Cap Value Fund | | 0 | | 0 | | 0 | | 0 |
NWQ Multi-Cap Value Fund | | 0 | | 0 | | 0 | | 0 |
NWQ Global Value Fund | | 0 | | 0 | | 0 | | 0 |
NWQ Small-Cap Value Fund | | 0 | | 0 | | 0 | | 0 |
Tradewinds Value Opportunities Fund | | 0 | | 0 | | 0 | | 0 |
NWQ Large-Cap Value Fund | | 0 | | 0 | | 0 | | 0 |
NWQ Small-/Mid-Cap Value Fund | | 0 | | 0 | | 0 | | 0 |
The above "Tax Fees" were billed for professional services for tax advice, tax compliance, and tax planning.
| | | | | | | | | | | | |
Fiscal Year Ended June 30, 2006 | | Audit Fees Billed
to Funds 1 | | Audit-Related Fees Billed to Funds 2 | | Tax Fees
Billed to Funds 3 | | All Other Fees
Billed to Funds 4 |
Name of Series | | | | | | | | | | | | |
Balanced Stock and Bond Fund | | | 7,434 | | | 0 | | | 932 | | | 0 |
Balanced Municipal and Stock Fund | | | 8,258 | | | 0 | | | 932 | | | 0 |
Large Cap Value Fund | | | 25,178 | | | 0 | | | 932 | | | 0 |
NWQ Multi-Cap Value Fund | | | 34,314 | | | 0 | | | 932 | | | 0 |
NWQ Global Value Fund | | | 5,490 | | | 0 | | | 1,319 | | | 0 |
NWQ Small-Cap Value Fund | | | 5,864 | | | 0 | | | 1,703 | | | 0 |
Tradewinds Value Opportunities Fund | | | 7,045 | | | 0 | | | 2,123 | | | 0 |
NWQ Large-Cap Value Fund | | | N/A | | | N/A | | | N/A | | | N/A |
NWQ Small-/Mid-Cap Value Fund | | | N/A | | | N/A | | | N/A | | | N/A |
| | | | | | | | | | | | |
Total | | $ | 93,583 | | $ | 0 | | $ | 8,873 | | $ | 0 |
1 | | “Audit Fees” are the aggregate fees billed for professional services for the audit of the Fund's annual financial statements and services provided in connection with statutory and regulatory filings or engagements. |
2 | | “Audit Related Fees” are the aggregate fees billed for assurance and related services reasonably related to the performance of the audit or review of financial statements and are not reported under “Audit Fees”. |
3 | | “Tax Fees” are the aggregate fees billed for professional services for tax advice, tax compliance, and tax planning. |
4 | | “All Other Fees” are the aggregate fees billed for products and services other than “Audit Fees”, “Audit Related Fees”, and “Tax Fees”. |
| | | | | | | | |
| | | Percentage Approved Pursuant to Pre-approval Exception |
| | | Audit Fees Billed
to Funds | | Audit-Related Fees
Billed to Funds | | Tax Fees
Billed to Funds | | All Other Fees
Billed to Funds |
Name of Series | | | | | | | | |
Balanced Stock and Bond Fund | | 0 | | 0 | | 0 | | 0 |
Balanced Municipal and Stock Fund | | 0 | | 0 | | 0 | | 0 |
Large Cap Value Fund | | 0 | | 0 | | 0 | | 0 |
NWQ Multi-Cap Value Fund | | 0 | | 0 | | 0 | | 0 |
NWQ Global Value Fund | | 0 | | 0 | | 0 | | 0 |
NWQ Small-Cap Value Fund | | 0 | | 0 | | 0 | | 0 |
Tradewinds Value Opportunities Fund | | 0 | | 0 | | 0 | | 0 |
NWQ Large-Cap Value Fund | | 0 | | 0 | | 0 | | 0 |
NWQ Small-/Mid-Cap Value Fund | | 0 | | 0 | | 0 | | 0 |
The above "Tax Fees" were billed for professional services for tax advice, tax compliance, and tax planning.
SERVICES THAT THE TRUST’S AUDITOR BILLED TO THE
ADVISER AND AFFILIATED FUND SERVICE PROVIDERS
The following tables show the amount of fees billed by PricewaterhouseCoopers LLP to Nuveen Asset Management (“NAM” or the “Adviser”), and any entity controlling, controlled by or under common control with NAM (“Control Affiliate”) that provides ongoing services to the Trust (“Affiliated Fund Service Provider”), for engagements directly related to the Trust’s operations and financial reporting, during the Trust’s last two full fiscal years.
| | | | | | | | | | | | |
Fiscal Year Ended June 30, 2007 | | Audit-Related Fees
Billed to Adviser and
Affiliated Fund
Service Providers | | | Tax Fees Billed to
Adviser and
Affiliated Fund
Service Providers | | | All Other Fees
Billed to Adviser
and Affiliated Fund
Service Providers | |
Nuveen Investment Trust | | $ | 0 | | | $ | 0 | | | $ | 0 | |
| |
| | | Percentage Approved Pursuant to Pre-approval Exception | |
| | | Audit-Related Fees
Billed to Adviser and
Affiliated Fund
Service Providers | | | Tax Fees Billed to
Adviser and
Affiliated Fund
Service Providers | | | All Other Fees
Billed to Adviser
and Affiliated Fund
Service Providers | |
| | | 0 | % | | | 0 | % | | | 0 | % |
| | | |
Fiscal Year Ended June 30, 2006 | | Audit-Related Fees
Billed to Adviser and
Affiliated Fund
Service Providers | | | Tax Fees Billed to
Adviser and
Affiliated Fund
Service Providers 1 | | | All Other Fees
Billed to Adviser
and Affiliated Fund
Service Providers | |
Nuveen Investment Trust | | $ | 0 | | | $ | 17,150 | | | $ | 0 | |
| |
| | | Percentage Approved Pursuant to Pre-approval Exception | |
| | | Audit-Related Fees
Billed to Adviser and
Affiliated Fund
Service Providers | | | Tax Fees Billed to
Adviser and
Affiliated Fund
Service Providers | | | All Other Fees
Billed to Adviser
and Affiliated Fund
Service Providers | |
| | | 0 | % | | | 0 | % | | | 0 | % |
1 | | The amounts reported for the Trust under the column heading “Tax Fees” represents amounts billed to the Adviser exclusively for the preparation for the Fund’s tax return, the cost of which is borne by the Adviser. In the aggregate, for all Nuveen funds for which PricewaterhouseCoopers LLP serves as independent registered public accounting firm, these fees amounted to $113,550 in 2006. Beginning with fund fiscal years ending August 31, 2006, PricewaterhouseCoopers, LLC will no longer prepare the fund tax returns. |
The tables also show the percentage of fees subject to the pre-approval exception. The pre-approval exception for services provided to the Adviser and any Affiliated Fund Service Provider (other than audit, review or attest services) waives the pre-approval requirement if: (A) the aggregate amount of all such services provided constitutes no more than 5% of the total amount of revenues paid to PricewaterhouseCoopers LLP by the Trust, the Adviser and Affiliated Fund Service Providers during the fiscal year in which the services are provided that would have to be pre-approved by the Audit Committee; (B) the Trust did not recognize the services as non-audit services at the time of the engagement; and (C) the services are promptly brought to the Audit Committee’s attention, and the Committee (or its delegate) approves the services before the Trust’s audit is completed.
NON-AUDIT SERVICES
| | | | | | | | | |
Fiscal Year Ended June 30, 2007 | | Total Non-Audit Fees Billed to Trust | | Total Non-Audit Fees
billed to Adviser and
Affiliated Fund Service
Providers (engagements
related directly to the
operations and financial
reporting of the Trust) | | Total Non-Audit Fees
billed to Adviser and
Affiliated Fund Service
Providers (all other
engagements) | | Total |
Name of Series | | | | | | | | | |
Balanced Stock and Bond Fund | | | 262 | | 0 | | 0 | | 262 |
Balanced Municipal and Stock Fund | | | 348 | | 0 | | 0 | | 348 |
Large Cap Value Fund | | | 2,475 | | 0 | | 0 | | 2,475 |
NWQ Multi-Cap Value Fund | | | 5,447 | | 0 | | 0 | | 5,447 |
NWQ Global Value Fund | | | 70 | | 0 | | 0 | | 70 |
NWQ Small-Cap Value Fund | | | 423 | | 0 | | 0 | | 423 |
Tradewinds Value Opportunities Fund | | | 1,051 | | 0 | | 0 | | 1,051 |
NWQ Large-Cap Value Fund | | | 0 | | 0 | | 0 | | 0 |
NWQ Small-/Mid-Cap Value Fund | | | 0 | | 0 | | 0 | | 0 |
| | | | | | | | | |
Total | | $ | 10,076 | | | | | | |
“Non-Audit Fees billed to Adviser” for both fiscal year ends represent “Tax Fees” billed to Adviser in their respective amounts from the previous table.
| | | | | | | | | |
Fiscal Year Ended June 30, 2006 | | Total Non-Audit Fees Billed to Trust | | Total Non-Audit Fees
billed to Adviser and
Affiliated Fund Service
Providers (engagements
related directly to the
operations and financial
reporting of the Trust) 1 | | Total Non-Audit Fees
billed to Adviser and
Affiliated Fund Service
Providers (all other
engagements) | | Total |
Name of Series | | | | | | | | | |
Balanced Stock and Bond Fund | | | 932 | | 2,450 | | 0 | | 3,382 |
Balanced Municipal and Stock Fund | | | 932 | | 2,450 | | 0 | | 3,382 |
Large Cap Value Fund | | | 932 | | 2,450 | | 0 | | 3,382 |
NWQ Multi-Cap Value Fund | | | 932 | | 2,450 | | 0 | | 3,382 |
NWQ Global Value Fund | | | 1,319 | | 2,450 | | 0 | | 3,769 |
NWQ Small-Cap Value Fund | | | 1,703 | | 2,450 | | 0 | | 4,153 |
Tradewinds Value Opportunities Fund | | | 2,124 | | 2,450 | | 0 | | 4,574 |
NWQ Large-Cap Value Fund | | | N/A | | N/A | | N/A | | N/A |
NWQ Small-/Mid-Cap Value Fund | | | N/A | | N/A | | N/A | | N/A |
| | | | | | | | | |
Total | | $ | 8,873 | | | | | | |
“Non-Audit Fees billed to Adviser” for both fiscal year ends represent “Tax Fees” billed to Adviser in their respective amounts from the previous table.
Audit Committee Pre-Approval Policies and Procedures. Generally, the Audit Committee must approve (i) all non-audit services to be performed for the Trust by the Trust’s independent accountants and (ii) all audit and non-audit services to be performed by the Trust’s independent accountants for the Affiliated Fund Service Providers with respect to the operations and financial reporting of the Trust. Regarding tax and research projects conducted by the independent accountants for the Trust and Affiliated Fund Service Providers (with respect to operations and financial reports of the Trust) such engagements will be (i) pre-approved by the Audit Committee if they are expected to be for amounts greater than $10,000; (ii) reported to the Audit Committee Chairman for his verbal approval prior to engagement if they are expected to be for amounts under $10,000 but greater than $5,000; and (iii) reported to the Audit Committee at the next Audit Committee meeting if they are expected to be for an amount under $5,000.
ITEM 5. AUDIT COMMITTEE OF LISTED REGISTRANTS
Not applicable to this registrant.
ITEM 6. SCHEDULE OF INVESTMENTS
See Portfolio of Investments in Item 1
ITEM 7. DISCLOSURE OF PROXY VOTING POLICIES AND PROCEDURES FOR CLOSED-END
MANAGEMENT INVESTMENT COMPANIES
Not applicable to this registrant.
ITEM 8. PORTFOLIO MANAGERS OF CLOSED-END MANAGEMENT INVESTMENT COMPANIES
Not applicable to this registrant.
ITEM 9. PURCHASES OF EQUITY SECURITIES BY CLOSED-END MANAGEMENT INVESTMENT COMPANY AND AFFILIATED PURCHASERS
Not applicable to this registrant.
ITEM 10. SUBMISSION OF MATTERS TO A VOTE OF SECURITY HOLDERS
There have been no material changes to the procedures by which shareholders may recommend nominees to the registrant’s Board implemented after the registrant last provided disclosure in response to this Item.
ITEM 11. CONTROLS AND PROCEDURES.
| | (a) | | The registrant’s principal executive and principal financial officers, or persons performing similar functions, have concluded that the registrant’s disclosure controls and procedures (as defined in Rule 30a-3(c) under the Investment Company Act of 1940, as amended (the “1940 Act”) (17 CFR 270.30a-3(c))) are effective, as of a date within 90 days of the filing date of this report that includes the disclosure required by this paragraph, based on their evaluation of the controls and procedures required by Rule 30a-3(b) under the 1940 Act (17 CFR 270.30a-3(b)) and Rules 13a-15(b) or 15d-15(b) under the Securities Exchange Act of 1934, as amended (the “Exchange Act”) (17 CFR 240.13a-15(b) or 240.15d-15(b)). |
| | (b) | | There were no changes in the registrant’s internal control over financial reporting (as defined in Rule 30a-3(d) under the 1940 Act (17 CFR 270.30a-3(d)) that occurred during the second fiscal quarter of the period covered by this report that has materially affected, or is reasonably likely to materially affect, the registrant’s internal control over financial reporting. |
ITEM 12. EXHIBITS
File the exhibits listed below as part of this Form.
| | |
| (a)(1) | | Any code of ethics, or amendment thereto, that is the subject of the disclosure required by Item 2, to the extent that the registrant intends to satisfy the Item 2 requirements through filing of an exhibit: Not applicable because the code is posted on registrant’s website at www.nuveen.com/mf and there were no amendments during the period covered by this report. (To view the code, click on the Investors Resources drop down menu box, click on Fund governance and then Code of Conduct.) |
| |
| (a)(2) | | A separate certification for each principal executive officer and principal financial officer of the registrant as required by Rule 30a-2(a) under the 1940 Act (17 CFR 270.30a-2(a)) in the exact form set forth below: EX-99.CERT Attached hereto. |
| |
| (a)(3) | | Any written solicitation to purchase securities under Rule 23c-1 under the 1940 Act (17 CFR 270.23c-1) sent or given during the period covered by the report by or on behalf of the registrant to 10 or more persons: Not applicable to this registrant. |
| |
| (b) | | If the report is filed under Section 13(a) or 15(d) of the Exchange Act, provide the certifications required by Rule 30a-2(b) under the 1940 Act (17 CFR 270.30a-2(b)), Rule 13a-14(b) or Rule 15d-14(b) under the Exchange Act (17 CFR 240.13a-14(b) or 240.15d-14(b)), and Section 1350 of Chapter 63 of Title 18 of the United States Code (18 U.S.C. 1350) as an Exhibit. A certification furnished pursuant to this paragraph will not be deemed “filed” for purposes of Section 18 of the Exchange Act (15 U.S.C. 78r), or otherwise subject to the liability of that section. Such certification will not be deemed to be incorporated by reference into any filing under the Securities Act of 1933 or the Exchange Act, except to the extent that the registration specifically incorporates it by reference. EX-99.906 CERT attached hereto. |
SIGNATURES
Pursuant to the requirements of the Securities Exchange Act of 1934 and the Investment Company Act of 1940, the registrant has duly caused this report to be signed on its behalf by the undersigned, thereunto duly authorized.
(Registrant) Nuveen Investment Trust
| | |
| |
By (Signature and Title)* | | /s/ Kevin J. McCarthy |
| | Kevin J. McCarthy |
| | Vice President and Secretary |
Date September 6, 2007
Pursuant to the requirements of the Securities Exchange Act of 1934 and the Investment Company Act of 1940, this report has been signed below by the following persons on behalf of the registrant and in the capacities and on the dates indicated.
| | |
| |
By (Signature and Title)* | | /s/ Gifford R. Zimmerman |
| | Gifford R. Zimmerman |
| | Chief Administrative Officer |
| | (principal executive officer) |
Date September 6, 2007
| | |
| |
| By (Signature and Title)* | | /s/ Stephen D. Foy |
| | Stephen D. Foy |
| | Vice President and Controller |
| | (principal financial officer) |
Date September 6, 2007
| * | | Print the name and title of each signing officer under his or her signature. |