UNITED STATES
SECURITIES AND EXCHANGE COMMISSION
Washington, D.C. 20549
FORM N-CSR
CERTIFIED SHAREHOLDER REPORT OF REGISTERED MANAGEMENT
INVESTMENT COMPANIES
Investment Company Act file number 811-07619
Nuveen Investment Trust
(Exact name of registrant as specified in charter)
Nuveen Investments
333 West Wacker Drive, Chicago, IL 60606
(Address of principal executive offices) (Zip code)
Kevin J. McCarthy
Nuveen Investments
333 West Wacker Drive
Chicago, IL 60606
(Name and address of agent for service)
Registrant’s telephone number, including area code: (312) 917-7700
Date of fiscal year end: June 30
Date of reporting period: June 30, 2009
Form N-CSR is to be used by management investment companies to file reports with the Commission not later than 10 days after the transmission to stockholders of any report that is required to be transmitted to stockholders under Rule 30e-1 under the Investment Company Act of 1940 (17 CFR 270.30e-1). The Commission may use the information provided on Form N-CSR in its regulatory, disclosure review, inspection, and policy making roles.
A registrant is required to disclose the information specified by Form N-CSR, and the Commission will make this information public. A registrant is not required to respond to the collection of information contained in Form N-CSR unless the Form displays a currently valid Office of Management and Budget (“OMB”) control number. Please direct comments concerning the accuracy of the information collection burden estimate and any suggestions for reducing the burden to Secretary, Securities and Exchange Commission, 450 Fifth Street, NW, Washington, DC 20549-0609. The OMB has reviewed this collection of information under the clearance requirements of 44 U.S.C. ss.3507.
ITEM 1. REPORTS TO STOCKHOLDERS.

Mutual Funds
Nuveen Asset Allocation Funds
For investors seeking attractive long-term total return.
Annual Report
June 30, 2009
| | | | | | | | | | | | |
| Nuveen Growth Allocation Fund | | | | Nuveen Moderate Allocation Fund | | | | Nuveen Conservative Allocation Fund | | | | |
LIFE IS COMPLEX.
Nuveen makes things e-simple.
It only takes a minute to sign up for e-Reports. Once enrolled, you’ll receive an e-mail as soon as your Nuveen Investments Fund information is ready. No more waiting for delivery by regular mail. Just click on the link within the e-mail to see the report and save it on your computer if you wish.
Free e-Reports right to your e-mail!
www.investordelivery.com
If you receive your Nuveen Fund dividends and statements from your financial advisor or brokerage account.
OR
www.nuveen.com/accountaccess
If you receive your Nuveen Fund dividends and statements directly from Nuveen.
| | | | | | |
| Must be preceded by or accompanied by a prospectus. | | NOT FDIC INSURED | | MAY LOSE VALUE | | NO BANK GUARANTEE |
Chairman’s
Letter to Shareholders

Dear Shareholder,
The problems in the U.S. financial system and the slowdown in global economic activity continue to create a very difficult environment for the U.S. economy. The administration, the Federal Reserve System and Congress have initiated a variety of programs directed at restoring liquidity to the financial markets, providing financial support for critical financial institutions and stimulating economic activity. There are encouraging signs that these initiatives are beginning to have a constructive impact. It is not possible to predict whether the actions taken to date will be sufficient to restore more normal conditions in the financial markets or enable the economy to stabilize and set a course toward recovery. However, the speed and scope of the government’s actions are very encouraging and more importantly, reflect a commitment to act decisively to meet the economic challenges we face.
The performance information in the attached report reflects the impact of many forces at work in the equity and fixed-income markets. The comments by the portfolio managers describe the strategies being used to pursue your Fund’s long-term investment goals. Parts of the financial markets continue to experience serious dislocations and thorough research and strong investment disciplines have never been more important in identifying risks and opportunities. I hope you will read this information carefully.
Your Board is particularly sensitive to our shareholders’ concerns in these uncertain times. We believe that frequent and thorough communication is essential in this regard and encourage you to visit the Nuveen website: www.nuveen.com, for recent developments in all Nuveen funds. We also encourage you to communicate with your financial consultant for answers to your questions and to seek advice on your long-term investment strategy in the current market environment.
On behalf of myself and the other members of your Fund’s Board, we look forward to continuing to earn your trust in the months and years ahead.
Sincerely,

Robert P. Bremner
Chairman of the Nuveen Fund Board
August 24, 2009
Fund Name and Management Changes
Effective July 7, 2008, based upon the determination of the Fund’s Board of Trustees and a shareholder vote, the Nuveen Balanced Municipal and Stock Fund’s sub-adviser and primary investment objective were changed. Nuveen Investment Solutions, Inc. (formerly Richards & Tierney, Inc.) was appointed as the Fund’s sub-adviser and the new investment objective is to provide attractive long-term total return with a conservative risk profile. The Fund became a “fund of funds” that invests principally in shares of other registered investment companies, including open-end mutual funds and exchange-traded funds (the Underlying Funds). The Fund will invest principally in Underlying Funds within the Nuveen family of funds. The Fund also changed its name from the Nuveen Balanced Municipal and Stock Fund to the Nuveen Conservative Allocation Fund.
Effective August 1, 2008, based upon the determination of the Funds’ Board of Trustees and shareholder votes, both the Nuveen Balanced Stock and Bond Fund and the Nuveen Global Value Fund changed sub-advisers and primary investment objectives. Nuveen Investment Solutions, Inc. (formerly Richards & Tierney, Inc.) was appointed as the Funds’ sub-adviser and the new investment objective for the Nuveen Balanced Stock and Bond Fund is to provide attractive long term total return with a moderate risk profile and the new investment objective for the Nuveen Global Value Fund is to provide attractive long-term total return with a growth risk profile. The Funds became “funds of funds” that invest principally in shares of other registered investment companies, including open-end mutual funds and exchange-traded funds (the Underlying Funds). The Funds will invest principally in Underlying Funds within the Nuveen family of funds. The Funds also changed their names from the Nuveen Balanced Stock and Bond Fund to the Nuveen Moderate Allocation Fund and from the Nuveen Global Value Fund to the Nuveen Growth Allocation Fund.
On October 15, 2008, Richards & Tierney, Inc. changed its name to Nuveen Investment Solutions, Inc. (NIS). There were no changes made to the Funds’ portfolio management personnel, investment objectives, policies or day-to-day portfolio management practices.
Portfolio Managers’ Comments
Certain statements in this report are forward-looking statements. Discussions of specific investments are for illustration only and are not intended as recommendations of individual investments. The forward-looking statements and other views expressed herein are those of the portfolio managers as of the date of this report. Actual future results or occurrences may differ significantly from those anticipated in any forward-looking statements and the views expressed herein are subject to change at any time, due to numerous market and other factors. The Funds disclaim any obligation to update publicly or revise any forward-looking statements or views expressed herein.
The Nuveen Growth Allocation, the Nuveen Moderate Allocation and the Nuveen Conservative Allocation Funds feature portfolio management by Nuveen Investment Solutions, Inc. (NIS), an affiliate of Nuveen Investments. The Funds are co-managed by Thomas Richards, CFA, Senior Managing Director of NIS and James Colon, CFA, Vice President of NIS. We recently asked Tom and James to discuss the key portfolio management strategies and the performance of these three Funds for the twelve-month reporting period ended June 30, 2009.
What were the general economic conditions during the reporting period?
This twelve-month period was among the most volatile in the history of the capital markets. Equity markets across the globe fell as the United States economy pushed further into recession. After IndyMac’s bankruptcy filing on August 1, 2008, the U.S. Government engaged in one of the most dramatic market interventions in years and placed the Federal National Mortgage Association (Fannie Mae) and the Federal Home Loan Mortgage Corporation (Freddie Mac) into receivership. In September, Lehman Brothers, a major Wall Street broker/dealer, filed for bankruptcy protection. Merrill Lynch, concerned about its own solvency, quickly negotiated a deal to be acquired by Bank of America. The following months included major financial write-downs across the U.S. economy, the uncovering of the largest Ponzi scheme in history, continual declines in real U.S. Gross Domestic Product, and significant spikes in market volatility.
While the U.S. economy moved further into recession, the international capital markets experienced their own severe downturn. Economic policy responses by the U.S. Federal Reserve were followed, in part, by its counterparts at the Bank of England, the European Central Bank, and the Chinese Government.
Although the S&P 500 and the MSCI EAFE indices were down 37% and 43%, respectively, in 2008, signs of global economic stability began to emerge toward the end of the first quarter in 2009. By the end of June, the 2009 year-to-date returns of these two equity indices were 3% and 8%, respectively. In addition, emerging markets, which fell 53% in 2008, rebounded 36% during the first half of 2009.
In the fixed-income markets, credit-oriented holdings fell while investors sought stability via U.S. Treasuries. Long-term Treasuries, as measured by the Barclays Capital Long-Term Treasury Index, gained 24% in 2008, while the shorter-duration Barclays Capital Intermediate Treasury Index gained 11%.
Year-to-date performance in 2009 for the High Yield market, as measured by the Barclays Capital High Yield Index, was particularly strong. After losing 26% in 2008, the High Yield index finished the second quarter with a gain of 30% for the first six months of the year.
As of the end of June, market volatility has fallen significantly from its November 2008 high (as measured by the CBOE VIX Index). However, the volatility levels remain approximately double those experienced from 2004 through 2006.
How did the Funds perform during the twelve-month period ended June 30, 2009?
The table on page nine provides performance information for the three Funds (Class A shares at net asset value) for the one-year, five-year, ten-year and since inception periods ended June 30, 2009. The table also compares each Fund’s performance to an appropriate benchmark. A more detailed discussion of each Fund’s relative performance is provided later in this report.
What strategies were used to manage the Funds during the reporting period?
All of these Funds are managed using the same strategic approach. This involves seeking to: (1) identify a universe of investable asset classes with different risks, returns and relationships, (2) determine an allocation policy among these asset classes that produces the highest expected return consistent with a targeted level of investment risk, (3) utilize liquid, transparent, and value-added investment funds within each asset class, (4) structure these Funds to produce value-added performance consistent with the Funds’ active management risk budgets, and (5) monitor, refine and revise all the investment inputs that go into each Fund’s portfolio building process.
How did these strategies influence performance?
Nuveen Growth Allocation Fund
Class A Shares at net asset value for the Nuveen Growth Allocation Fund outperformed the Lipper Global Multi-Cap Core Funds Index, the Growth Allocation Composite and the S&P 500 Index during the twelve-month reporting period.
NIS assumed management of the Nuveen Growth Allocation Fund on August 1, 2008, and transitioned the portfolio during the month of August. Subsequently, beginning September 1, 2008, we implemented an investment management information and risk control process that provides ongoing feedback, with respect to the risk factors affecting the performance of the Fund. Most of the following commentary covers the last ten months of the reporting period.
The Growth Allocation Fund’s policy allocation as of June 30, 2009, is presented below:
| | |
| Asset Class | | Asset Class Policy Weight |
Domestic Equity | | 23% |
International Equity | | 38% |
Global Resources | | 6% |
U.S. Public Real Estate | | 3% |
Domestic Fixed Income | | 6% |
Domestic High Yield | | 14% |
TIPS | | 6% |
Short Duration & Cash | | 4% |
| | | 100% |
As noted above, NIS monitors and manages the risk factors that impact the Fund’s performance, including (1) Investment Policy/Capital Market Risk, (2) Style Risk, (3) Active Management Risk, and (4) Allocation Tactics Risk. The impact of each of these factors is quantified and analyzed as a part of our ongoing feedback and control management process.
Investment policy/capital market risk will typically have the largest performance impact on the Fund. From September 1, 2008 through June 30, 2009, our investment policy/capital markets allocations produced a return of -16.25%. With the exception of the Domestic (core) Fixed Income and Short Duration asset classes, returns across asset classes were negative during this recessionary period.
Investment style risk involves an allocation policy to investment managers whose styles, in aggregate, differ from the asset class market target. NIS attempts to minimize this risk by investing in the Nuveen U.S. Equity Completeness Fund in the Domestic Equity asset class and various exchange-traded funds in the International Equity class. The return impact from investment style risk was negligible, as targeted, during the last ten months of the reporting period.
Active management risk consists of the performance differential between the investment managers’ actual performance and the performance of their benchmarks. NIS manages active management risk by structuring teams of managers within asset classes that are believed to have the best chance of outperforming their asset class target. Over the last ten months of the period, the Fund’s investment managers, in aggregate, generated positive incremental returns, relative to their benchmarks. Manager allocations within the International Equity asset class, which consists of one mutual fund manager and two exchange-traded funds, generated the greatest level of outperformance. Strong manager performance was also realized in the Domestic Equity asset class.
Allocation tactics involves the deviations of actual allocations versus the policy allocation weights. These deviations are often due to movements in the capital markets and cash flows in and out of the Fund. During the last ten months of the reporting period, the performance impact due to allocation tactics has had a small, negative impact on total Fund performance.
The ten-month period from September 1, 2008, to June 30, 2009, was among the most volatile in the history of the capital markets. By diversifying across asset classes and investments, the Fund was able to reduce overall volatility and limit the potential downside.
Nuveen Moderate Allocation Fund
Class A Shares at net asset value for the Nuveen Moderate Allocation Fund outperformed the Lipper Mixed-Asset Target Allocation Moderate Funds Index, the Moderate Allocation Composite and the S&P 500 Index during the twelve-month reporting period.
NIS assumed management of the Nuveen Moderate Allocation Fund on August 1, 2008, and transitioned the portfolio during the month of August. Subsequently, beginning September 1, 2008, we implemented an investment management information and risk control process that provides ongoing feedback, with respect to the risk factors affecting
the performance of the Fund. Most of the following commentary covers the last ten months of the reporting period.
The Moderate Allocation Fund’s policy allocation as of June 30, 2009, is presented below:
| | |
| Asset Class | | Asset Class Policy Weight |
Domestic Equity | | 21% |
International Equity | | 29% |
Global Resources | | 5% |
U.S. Public Real Estate | | 3% |
Domestic Fixed Income | | 10% |
Domestic High Yield | | 15% |
TIPS | | 9% |
Short Duration & Cash | | 8% |
| | | 100% |
As noted above, NIS monitors and manages the risk factors that impact the Fund’s performance, including (1) Investment Policy/Capital Market Risk, (2) Style Risk, (3) Active Management Risk, and (4) Allocation Tactics Risk. The impact of each of these factors is quantified and analyzed as a part of our ongoing feedback and control management process.
Investment policy/capital market risk will typically have the largest performance impact on the Fund. From September 1, 2008, though June 30, 2009, our investment policy/capital markets allocations produced a return of -12.12%. With the exception of the Domestic (core) Fixed Income and Short Duration asset classes, returns across asset classes were negative during this recessionary period.
Investment style risk involves an allocation policy to investment managers whose styles, in aggregate, differ from the asset class market target. NIS attempts to minimize this risk by investing in the Nuveen U.S. Equity Completeness Fund in the Domestic Equity asset class and various exchange traded funds in the International Equity class. The return impact from investment style risk was negligible, as targeted, during the last ten months of the reporting period.
Active management risk consists of the performance differential between the investment managers’ actual performance and the performance of their benchmarks. NIS manages active management risk by structuring teams of managers within asset classes that are believed to have the best chance of outperforming their asset class target. Over the last
ten months of the period, the Fund’s investment managers, in aggregate, generated positive incremental returns, relative to their benchmarks. Manager allocations within the International Equity asset class, which consists of one mutual fund manager and two exchange-traded funds, generated the greatest level of outperformance. Strong manager performance was also realized in the Domestic Equity asset class.
Allocation tactics involves the deviations of actual allocations versus the policy allocation weights. These deviations are often due to movements in the capital markets and cash flows in and out of the Fund. During the last ten months of the reporting period the performance impact due to allocation tactics has had a small, negative impact on total Fund performance.
The ten-month period from September 1, 2008, to June 30, 2009, was among the most volatile in the history of the capital markets. By diversifying across asset classes and investments, the Fund was able to reduce overall volatility and limit the potential downside.
Nuveen Conservative Allocation Fund
Class A Shares at net asset value for the Fund outperformed the Lipper Mixed-Asset Target Allocation Conservative Funds Index and the S&P 500 Index, but underperformed the Conservative Allocation Composite during the twelve-month reporting period.
NIS assumed management of the Nuveen Conservative Allocation Fund on July 7, 2008, and transitioned the portfolio during the months of July and August. Subsequently, beginning September 1, 2008, we implemented an investment management information and risk control process that provides ongoing feedback, with respect to the risk factors affecting the performance of the Fund. Most of the following commentary covers the last ten months of the reporting period.
The Conservative Allocation Fund’s policy allocation as of June 30, 2009, is presented below:
| | |
| Asset Class | | Asset Class Policy Weight |
Domestic Equity | | 14% |
International Equity | | 16% |
Global Resources | | 5% |
U.S. Public Real Estate | | 3% |
Domestic Fixed Income | | 20% |
Domestic High Yield | | 10% |
TIPS | | 10% |
Short Duration & Cash | | 22% |
| | | 100% |
As noted above, NIS monitors and manages the risk factors that impact the Fund’s performance, including (1) Investment Policy/Capital Market Risk, (2) Style Risk, (3) Active Management Risk, and (4) Allocation Tactics Risk. The impact of each of these factors is quantified and analyzed as a part of our ongoing feedback and control management process.
Investment policy/capital market risk will typically have the largest performance impact on the Fund. From September 1, 2008 through June 30, 2009, our investment policy/capital markets allocations produced a return of -8.22%. With the exception of the Domestic (core) Fixed Income and Short Duration asset classes, returns across asset classes were negative during this recessionary period.
Investment style risk involves an allocation policy to investment managers whose styles, in aggregate, differ from the asset class market target. NIS attempts to minimize this risk by investing in the Nuveen U.S. Equity Completeness Fund in the domestic equity asset class and various exchange traded funds in the international equity class. The return impact from investment style risk was negligible during the last ten months of the reporting period.
Active management risk consists of the performance differential between the investment managers’ actual performance and the performance of their benchmarks. NIS manages active management risk by structuring teams of managers within asset classes that are believed to have the best chance of outperforming their asset class target. Over the last ten months of the period, the Fund’s investment managers, in aggregate, generated positive incremental returns, relative to their benchmarks. Manager allocations within the International Equity asset class, which consists of one mutual fund manager and two exchange-traded funds, generated the greatest level of outperformance. Strong manager performance was also realized in the Domestic Equity asset class.
Allocation tactics involves the deviations of actual allocations versus the policy allocation weights. These deviations are often due to movements in the capital markets and cash flows in and out of the Fund. During the last ten months of the reporting period the performance impact due to allocation tactics has had a small, negative impact on total Fund performance.
The ten-month period from September 1, 2008, to June 30, 2009, was among the most volatile in the history of the capital markets. By diversifying across asset classes and investments, the Fund was able to reduce overall volatility and limit the potential downside.
| 1 | The since inception dates for the Funds are 12/09/04 for the Nuveen Growth Allocation Fund, and 8/7/96 for the Nuveen Moderate Allocation and Nuveen Conservative Allocation Funds. |
| 2 | The Lipper Global Multi-Cap Core Funds Index is a managed index that represents the average annualized total return of the 10 largest funds in the Lipper Global Multi-Cap Core Funds category. The returns assume reinvestment of dividends and do not reflect any applicable sales charges. You cannot invest directly in an index. |
| 3 | The Growth Allocation Composite is an index comprised of a 76% weighting in the S&P 500 Index, a 19% weighting in the Barclays Capital U.S. Aggregate Bond Index, and a 5% weighting in Citigroup 3-Month U.S. Treasury Bill Index. The since inception data for the Composite were calculated as of 12/31/04, as composite returns are calculated on a calendar-month basis. The composite returns assume reinvestment of dividends and do not reflect any applicable sales charges. You cannot invest directly in a composite. |
| 4 | The S&P 500 Index is an unmanaged index generally considered representative of the U.S. stock market. The index returns assume reinvestment of dividends, but do not reflect any applicable sales charges. You cannot invest directly in an index. |
| 5 | The Lipper Mixed-Asset Target Allocation Moderate Funds Index is a managed index that represents the average annualized total return of the 10 largest funds in the Lipper Mixed-Asset Target Allocation Moderate Funds category. The returns assume reinvestment of dividends and do not reflect any applicable sales charges. You cannot invest directly in an index. |
| 6 | The Moderate Allocation Composite is an index comprised of a 57% weighting in the S&P 500 Index, a 38% weighting in the Barclays Capital U.S. Aggregate Bond Index, and a 5% weighting in Citigroup 3-Month U.S. Treasury Bill Index. The since inception data for the Composite were calculated as of 8/31/96, as composite returns are calculated on a calendar-month basis. The composite returns assume reinvestment of dividends and do not reflect any applicable sales charges. You cannot invest directly in a composite. |
| 7 | The Lipper Mixed-Asset Target Allocation Conservative Funds Index is a managed index that represents the average annualized total return of the 10 largest funds in the Lipper Mixed-Asset Target Allocation Conservative Funds category. The returns assume reinvestment of dividends and do not reflect any applicable sales charges. You cannot invest directly in an index. |
| 8 | The Conservative Allocation Composite is an index comprised of a 38% weighting in the S&P 500 Index, a 57% weighting in the Barclays Capital U.S. Aggregate Bond Index, and a 5% weighting in Citigroup 3-Month U.S. Treasury Bill Index. The since inception data for the Composite were calculated as of 8/31/96, as composite returns are calculated on a calendar-month basis. The composite returns assume reinvestment of dividends and do not reflect any applicable sales charges. You cannot invest directly in a composite. |
Class A Shares – Average Annual Total Returns
As of 6/30/09
| | | | | | | | |
| | | 1-Year | | 5-Year | | 10-Year | | Since
Inception1 |
Nuveen Growth Allocation Fund | | | | | | | | |
A Shares at NAV | | -19.00% | | N/A | | N/A | | 1.23% |
A Shares at Offer | | -23.66% | | N/A | | N/A | | -0.08% |
Lipper Global Multi-Cap Core Funds Index2 | | -23.95% | | N/A | | N/A | | 0.14% |
Growth Allocation Composite3 | | -19.11% | | N/A | | N/A | | -1.81% |
S&P 500 Index4 | | -26.21% | | -2.24% | | -2.22% | | 4.35% |
Nuveen Moderate Allocation Fund | | | | | | | | |
A Shares at NAV | | -11.28% | | 2.08% | | 2.28% | | 5.38% |
A Shares at Offer | | -16.37% | | 0.87% | | 1.67% | | 4.90% |
Lipper Mixed-Asset Target Allocation Moderate Funds Index5 | | -17.04% | | 0.72% | | 1.59% | | 4.80% |
Moderate Allocation Composite6 | | -13.14% | | 1.02% | | 1.44% | | 5.53% |
S&P 500 Index4 | | -26.21% | | -2.24% | | -2.22% | | 4.35% |
Nuveen Conservative Allocation Fund | | | | | | | | |
A Shares at NAV | | -7.25% | | 2.09% | | 1.61% | | 4.09% |
A Shares at Offer | | -12.57% | | 0.88% | | 1.01% | | 3.61% |
Lipper Mixed-Asset Target Allocation Conservative Funds Index7 | | -9.01% | | 2.14% | | 2.73% | | 4.83% |
Conservative Allocation Composite8 | | -6.99% | | 2.39% | | 2.99% | | 5.86% |
S&P 500 Index4 | | -26.21% | | -2.24% | | -2.22% | | 4.35% |
Returns quoted represent past performance which is no guarantee of future results. Investment returns and principal value will fluctuate so that when shares are redeemed, they may be worth more or less than their original cost. Current performance may be higher or lower than the performance shown. Class A Shares have a 5.75% maximum sales charge. Returns at NAV would be lower if sales charges were included. Returns do not reflect the deduction of taxes that a shareholder would pay on Fund distributions or the redemption of shares. For the most recent month-end performance, visit www.nuveen.com or call (800) 257-8787.
Please see each Fund’s Spotlight Page later in this report for more complete performance data and expense ratios.
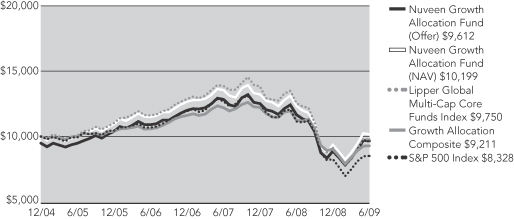
Nuveen Growth Allocation Fund
Growth of an Assumed $10,000 Investment
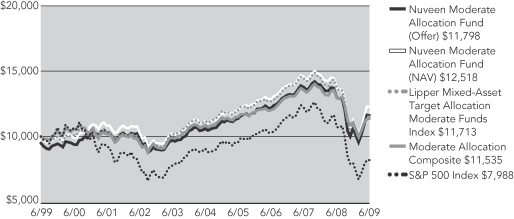
Nuveen Moderate Allocation Fund
Growth of an Assumed $10,000 Investment
The graphs do not reflect the deduction of taxes that a shareholder may pay on Fund distributions or the redemption of shares.
The index comparisons show the change in value of a $10,000 investment in the Class A Shares of the Nuveen Funds compared with the corresponding indexes. The Lipper Global Multi-Cap Core Funds Index is a managed index that represents the average annualized returns of the 10 largest funds in the Lipper Global Multi-Cap Core Funds category. The Growth Allocation Composite is an index comprised of a 76% weighting in the S&P 500 Index, a 19% weighting in the Barclays Capital U.S. Aggregate Bond Index, and a 5% weighting in Citigroup 3-Month U.S. Treasury Bill Index. The Lipper Mixed-Asset Target Allocation Moderate Funds Index is a managed index that represents the average annualized total return of the 10 largest funds in the Lipper Mixed-Asset Target Allocation Moderate Funds category. The Moderate Allocation Composite is an index comprised of a 57% weighting in the S&P 500 Index, a 38% weighting in the Barclays Capital U.S. Aggregate Bond Index, and a 5% weighting in Citigroup 3-Month U.S. Treasury Bill Index. The S&P 500 Index is an unmanaged index generally considered representative of the U.S. stock market. The index returns assume reinvestment of dividends and do not reflect any initial or ongoing expenses. You cannot invest directly in an index. The Nuveen Funds’ returns include reinvestment of all dividends and distributions, and the Funds’ returns at the offer price depicted in the charts reflect the initial maximum sales charge applicable to Class A Shares (5.75%) and all ongoing Fund expenses. The performance data quoted represents past performance, which is not indicative of future results. Current performance may be lower or higher than the performance shown.
Nuveen Conservative Allocation Fund
Growth of an Assumed $10,000 Investment
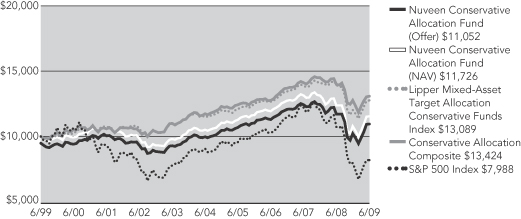
The graph does not reflect the deduction of taxes that a shareholder may pay on Fund distributions or the redemption of shares.
The index comparisons show the change in value of a $10,000 investment in the Class A Shares of the Nuveen Conservative Allocation Fund compared with the corresponding indexes. The Lipper Mixed-Asset Target Allocation Conservative Funds Index is a managed index that represents the average annualized total return of the 10 largest funds in the Lipper Mixed-Asset Target Allocation Conservative Funds category. The Conservative Allocation Composite is an index comprised of a 38% weighting in the S&P 500 Index, a 57% weighting in the Barclays Capital U.S. Aggregate Bond Index, and a 5% weighting in Citigroup 3-Month U.S. Treasury Bill Index. The S&P 500 Index is an unmanaged index generally considered representative of the U.S. stock market. The index returns assume reinvestment of dividends and do not reflect any initial or ongoing expenses. You cannot invest directly in an index. The Nuveen Conservative Allocation Fund’s returns include reinvestment of all dividends and distributions, and the Fund’s returns at the offer price depicted in the chart reflects the initial maximum sales charge applicable to Class A Shares (5.75%) and all ongoing Fund expenses. The performance data quoted represents past performance, which is not indicative of future results. Current performance may be lower or higher than the performance shown.
Fund Spotlight as of 6/30/09 Nuveen Growth Allocation Fund
| | | | | | | | | | |
| Quick Facts | | | | | | | | | | |
| | | A Shares | | B Shares1 | | C Shares | | R3 Shares | | I Shares1 |
Fund Symbols | | NGOAX | | NGVBX | | NGVCX | | NGATX | | NGVRX |
NAV | | $17.69 | | $17.42 | | $17.44 | | $17.76 | | $17.72 |
Latest Capital Gain Distribution2 | | $0.8140 | | $0.8140 | | $0.8140 | | $0.8140 | | $0.8140 |
Latest Ordinary Income Distribution3 | | $0.3791 | | $0.3231 | | $0.3231 | | $0.3244 | | $0.4341 |
Inception Date | | 12/09/04 | | 12/09/04 | | 12/09/04 | | 8/04/08 | | 12/09/04 |
Returns quoted represent past performance which is no guarantee of future results. Investment returns and principal value will fluctuate so that when shares are redeemed, they may be worth more or less than their original cost. Current performance may be higher or lower than the performance shown. Returns without sales charges would be lower if the sales charge were included. Returns do not reflect the deduction of taxes that a shareholder would pay on Fund distributions or the redemption of shares. For the most recent month-end performance visit www.nuveen.com or call (800) 257-8787.
Class A, B, C and I Share returns are actual. The returns for Class R3 Shares are actual for the period since class inception; returns prior to class inception are Class I Share returns adjusted for differences in sales charges and expenses, which are primarily differences in distribution and service fees. Fund returns assume reinvestment of dividends and capital gains. Class A Shares have a 5.75% maximum sales charge. Class A Share purchases of $1 million or more are sold at net asset value without an up-front sales charge but may be subject to a contingent deferred sales charge (CDSC), also known as a back-end sales charge, if redeemed within twelve months of purchase. Class B Shares have a CDSC that begins at 5% for redemptions during the first year and declines periodically until after six years when the charge becomes 0%. Class B Shares automatically convert to Class A Shares eight years after purchase. Class C Shares have a 1% CDSC for redemptions within less than one year, which is not reflected in the one-year total return. Class R3 Shares have no sales charge and are available to only certain retirement plans. Class I Shares have no sales charge and may be purchased under limited circumstances or by specified classes of investors. Returns may reflect an expense limitation by the Fund’s investment adviser.
Returns prior to August 1, 2008, are not indicative of the performance that the Fund, as currently managed, would have generated.
| | | | |
| Average Annual Total Returns as of 6/30/09 |
| | |
| A Shares | | NAV | | Offer |
1-Year | | -19.00% | | -23.66% |
Since Inception | | 1.23% | | -0.08% |
| | |
| B Shares | | w/o CDSC | | w/CDSC |
1-Year | | -19.61% | | -22.60% |
Since Inception | | 0.47% | | 0.09% |
| | |
| C Shares | | NAV | | |
1-Year | | -19.56% | | |
Since Inception | | 0.50% | | |
| | |
| R3 Shares | | NAV | | |
1-Year | | -19.17% | | |
Since Inception | | 0.98% | | |
| | |
| I Shares | | NAV | | |
1-Year | | -18.77% | | |
Since Inception | | 1.49% | | |
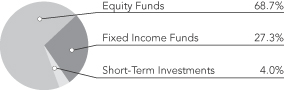
Portfolio Allocation4
| | |
| Portfolio Statistics |
| Net Assets ($000) | | $8,638 |
| Number of Holdings | | 16 |
| | | | | | |
| Expense Ratios | | | | | | |
| Share Class | | Gross
Expense
Ratios | | Net
Expense
Ratios | | As of
Date |
| Class A | | 1.58% | | 1.36% | | 10/31/08 |
| Class B | | 2.33% | | 2.11% | | 10/31/08 |
| Class C | | 2.33% | | 2.11% | | 10/31/08 |
| Class R3 | | 1.83% | | 1.61% | | 10/31/08 |
| Class I | | 1.33% | | 1.11% | | 10/31/08 |
The expense ratios reflect the Fund’s management fees, 12b-1 distribution and service fees and estimated other expenses, as well as the estimated fees and expenses of the Underlying Funds in which the Fund invests. The Net Expense Ratios reflect a contractual commitment by the Fund’s investment adviser to waive fees and reimburse expenses through October 31, 2011. Absent the fee waivers and expense reimbursements, the Net Expense Ratios would have been higher and total returns would have been less. These expense ratios will vary from the expense ratios included in the Financial Highlights in this report, as they reflect expenses incurred over different time periods.
| 1 | Effective May 1, 2008, Class B Shares will only be issued upon exchange of Class B Shares from another Nuveen Fund or for purposes of dividend reinvestment. Effective December 31, 2008, the reinvestment privilege for Class B is no longer available. Effective May 1, 2008, Class R Shares were renamed Class I Shares. See the Fund’s prospectus for more information. |
| 3 | Ordinary income distribution consists of short-term capital gains paid on December 16, 2008, and ordinary income paid on December 31, 2008, if any. |
| 4 | As a percentage of total investments as of June 30, 2009. Holdings are subject to change. |
Fund Spotlight as of 6/30/09 Nuveen Growth Allocation Fund
| | |
| Description | | Weighting1 |
Nuveen NWQ Large-Cap Value Fund (Class I) | | 3.9% |
Nuveen Santa Barbara Growth Fund (Class I) | | 1.7% |
Nuveen Symphony Large-Cap Growth Fund (Class I) | | 5.3% |
Nuveen Tradewinds Global Resources Fund (Class I) | | 5.8% |
Nuveen Tradewinds International Value Fund (Class I) | | 11.3% |
Nuveen Tradewinds Value Opportunities Fund (Class I) | | 3.2% |
Nuveen U.S. Equity Completeness Fund | | 6.9% |
Nuveen Winslow Large-Cap Growth Fund (Class I) | | 1.9% |
Total Affiliated Equity Funds | | 40.0% |
| |
iShares Dow Jones U.S. Real Estate Index Fund | | 2.8% |
iShares MSCI EAFE Growth Index Fund | | 11.1% |
iShares MSCI Emerging Markets Index Fund | | 14.8% |
Total Non-Affiliated Equity Funds | | 28.7% |
| Total Equity Funds | | 68.7% |
| |
Nuveen High Yield Bond Fund (Class I) | | 13.9% |
Nuveen Multi-Strategy Income Fund (Class I) | | 6.0% |
Nuveen Short Duration Bond Fund (Class I) | | 1.5% |
Total Affiliated Fixed Income Funds | | 21.4% |
| |
iShares Barclays U.S. Treasury Inflation Protected Securities Index Fund | | 5.9% |
Total Non-Affiliated Fixed Income Funds | | 5.9% |
| Total Fixed Income Funds | | 27.3% |
| Total Short-Term Investments | | 4.0% |
| Total Investments | | 100.0% |
| | |
| Affiliated Equity Funds | | 1-Year Average Annual Total Returns as of 6/30/09 |
Nuveen NWQ Large-Cap Value Fund (Class I) | | -26.35% |
Nuveen Santa Barbara Growth Fund (Class I) | | -27.51% |
Nuveen Symphony Large-Cap Growth Fund (Class I) | | -25.88% |
Nuveen Tradewinds Global Resources Fund (Class I) | | -29.38% |
Nuveen Tradewinds International Value Fund (Class I) | | -20.78% |
Nuveen Tradewinds Value Opportunities Fund (Class I) | | -13.29% |
Nuveen U.S. Equity Completeness Fund | | -28.96% |
Nuveen Winslow Large-Cap Growth Fund (Class I) | | 6.60%* |
| |
| Non-Affiliated Equity Funds | | |
iShares Dow Jones U.S. Real Estate Index Fund | | -42.48% |
iShares MSCI EAFE Growth Index Fund | | -33.41% |
iShares MSCI Emerging Markets Index Fund | | -27.16% |
| |
| Affiliated Fixed Income Funds | | |
Nuveen High Yield Bond Fund (Class I) | | -13.15% |
Nuveen Multi-Strategy Income Fund (Class I) | | 9.75% |
Nuveen Short Duration Bond Fund (Class I) | | 5.11% |
| |
| Non-Affiliated Fixed Income Funds | | |
iShares Barclays U.S. Treasury Inflation Protected Securities Index Fund | | -1.24% |
| 1 | As a percentage of total investments as of June 30, 2009. Holdings are subject to change. |
| * | Since inception cumulative return for the period May 15, 2009 (commencement of operations) through June 30, 2009. |
Expense Example
As a shareholder of the Fund, you incur two types of costs: (1) transaction costs, including front- and back-end sales charges (loads) or redemption fees, where applicable; and (2) ongoing costs, including management fees; distribution and service (12b-1) fees, where applicable; and other Fund expenses. This Example is intended to help you understand your ongoing costs (in dollars) of investing in the Fund and to compare these costs with the ongoing costs of investing in other mutual funds.
The Example below is based on an investment of $1,000 invested at the beginning of the period and held for the period.
The information under “Actual Performance,” together with the amount you invested, allows you to estimate actual expenses incurred over the reporting period. Simply divide your account value by $1,000 (for example, an $8,600 account value divided by $1,000 = 8.60) and multiply the result by the cost shown for your share class, in the row entitled “Expenses Incurred During Period” to estimate the expenses incurred on your account during this period.
The information under “Hypothetical Performance,” provides information about hypothetical account values and hypothetical expenses based on the Fund’s actual expense ratio and an assumed rate of return of 5% per year before expenses, which is not the Fund’s actual return. The hypothetical account values and expenses may not be used to estimate the actual ending account balance or expense you incurred for the period. You may use this information to compare the ongoing costs of investing in the Fund and other Funds. To do so, compare this 5% hypothetical example with the 5% hypothetical examples that appear in the shareholder reports of the other funds.
Please note that the expenses shown in the table are meant to highlight your ongoing costs only and do not reflect any transactional costs, such as front- and back-end sales charges (loads) or redemption fees, where applicable. Therefore, the hypothetical information is useful in comparing ongoing costs only, and will not help you determine the relative total costs of owning different funds or share classes. In addition, if these transactional costs were included, your costs would have been higher.
| | | | | | | | | | | | | | | | | | | | | | | | | | | | | | | | |
| | | | | | | | | | | | | | | Hypothetical Performance |
| | | Actual Performance | | | | (5% return before expenses) |
| | | A Shares | | B Shares | | C Shares | | R3 Shares | | I Shares | | | | A Shares | | B Shares | | C Shares | | R3 Shares | | I Shares |
| Beginning Account Value (1/01/09) | | $ | 1,000.00 | | $ | 1,000.00 | | $ | 1,000.00 | | $ | 1,000.00 | | $ | 1,000.00 | | | | $ | 1,000.00 | | $ | 1,000.00 | | $ | 1,000.00 | | $ | 1,000.00 | | $ | 1,000.00 |
| Ending Account Value (6/30/09) | | $ | 1,098.80 | | $ | 1,094.90 | | $ | 1,095.50 | | $ | 1,097.70 | | $ | 1,100.60 | | | | $ | 1,021.57 | | $ | 1,017.85 | | $ | 1,017.85 | | $ | 1,020.33 | | $ | 1,022.81 |
| Expenses Incurred During Period | | $ | 3.38 | | $ | 7.27 | | $ | 7.27 | | $ | 4.68 | | $ | 2.08 | | | | $ | 3.26 | | $ | 7.00 | | $ | 7.00 | | $ | 4.51 | | $ | 2.01 |
For each class of the Fund, expenses are equal to the Fund’s annualized net expense ratio of 0.65%, 1.40%, 1.40%, 0.90% and 0.40% for Classes A, B, C, R3 and I respectively, multiplied by the average account value over the period, multiplied by 181/365 (to reflect the one-half year period).
Fund Spotlight as of 6/30/09 Nuveen Moderate Allocation Fund
| | | | | | | | | | |
| Quick Facts | | | | | | | | | | |
| | | A Shares | | B Shares1 | | C Shares | | R3 Shares | | I Shares1 |
Fund Symbols | | NNSAX | | NNSBX | | NUVCX | | NMATX | | NNSRX |
NAV | | $18.90 | | $18.91 | | $18.94 | | $18.91 | | $18.89 |
Latest Capital Gain Distribution2 | | $0.4613 | | $0.4613 | | $0.4613 | | $0.4613 | | $0.4613 |
Latest Ordinary Income Distribution3 | | $0.3440 | | $0.1968 | | $0.1970 | | $0.2976 | | $0.3932 |
Inception Date | | 8/07/96 | | 8/07/96 | | 8/07/96 | | 8/04/08 | | 8/07/96 |
Returns quoted represent past performance which is no guarantee of future results. Investment returns and principal value will fluctuate so that when shares are redeemed, they may be worth more or less than their original cost. Current performance may be higher or lower than the performance shown. Returns without sales charges would be lower if the sales charge were included. Returns do not reflect the deduction of taxes that a shareholder would pay on Fund distributions or the redemption of shares. For the most recent month-end performance visit www.nuveen.com or call (800) 257-8787.
Class A, B, C and I Share returns are actual. The returns for Class R3 Shares are actual for the period since class inception; returns prior to class inception are Class I Share returns adjusted for differences in sales charges and expenses, which are primarily differences in distribution and service fees. Fund returns assume reinvestment of dividends and capital gains. Class A Shares have a 5.75% maximum sales charge. Class A Share purchases of $1 million or more are sold at net asset value without an up-front sales charge but may be subject to a contingent deferred sales charge (CDSC), also known as a back-end sales charge, if redeemed within twelve months of purchase. Class B Shares have a CDSC that begins at 5% for redemptions during the first year and declines periodically until after six years when the charge becomes 0%. Class B Shares automatically convert to Class A Shares eight years after purchase. Class C Shares have a 1% CDSC for redemptions within less than one year, which is not reflected in the one-year total return. Class R3 Shares have no sales charge and are available to only certain retirement plans. Class I Shares have no sales charge and may be purchased under limited circumstances or by specified classes of investors. Returns may reflect an expense limitation by the Fund’s investment adviser.
Returns prior to August 1, 2008, are not indicative of the performance that the Fund, as currently managed, would have generated.
| | | | |
| Average Annual Total Returns as of 6/30/09 |
| | |
| A Shares | | NAV | | Offer |
1-Year | | -11.28% | | -16.37% |
5-Year | | 2.08% | | 0.87% |
10-Year | | 2.28% | | 1.67% |
| | |
| B Shares | | w/o CDSC | | w/CDSC |
1-Year | | -11.98% | | -15.37% |
5-Year | | 1.31% | | 1.16% |
10-Year | | 1.67% | | 1.67% |
| | |
| C Shares | | NAV | | |
1-Year | | -11.93% | | |
5-Year | | 1.32% | | |
10-Year | | 1.52% | | |
| | |
| R3 Shares | | NAV | | |
1-Year | | -11.51% | | |
5-Year | | 1.81% | | |
10-Year | | 2.02% | | |
| | |
| I Shares | | NAV | | |
1-Year | | -11.08% | | |
5-Year | | 2.33% | | |
10-Year | | 2.53% | | |
Portfolio Allocation4

| | |
| Portfolio Statistics |
| Net Assets ($000) | | $35,337 |
| Number of Holdings | | 16 |
| | | | | | |
| Expense Ratios | | | | | | |
| Share Class | | Gross
Expense
Ratios | | Net
Expense
Ratios | | As of
Date |
| Class A | | 1.29% | | 1.19% | | 10/31/08 |
| Class B | | 2.04% | | 1.94% | | 10/31/08 |
| Class C | | 2.04% | | 1.94% | | 10/31/08 |
| Class R3 | | 1.54% | | 1.44% | | 10/31/08 |
| Class I | | 1.04% | | 0.94% | | 10/31/08 |
The expense ratios reflect the Fund’s management fees, 12b-1 distribution and service fees and estimated other expenses, as well as the estimated fees and expenses of the Underlying Funds in which the Fund invests. The Net Expense Ratios reflect a contractual commitment by the Fund’s investment adviser to waive fees and reimburse expenses through October 31, 2011. Absent the fee waivers and expense reimbursements, the Net Expense Ratios would have been higher and total returns would have been less. These expense ratios will vary from the expense ratios included in the Financial Highlights in this report, as they reflect expenses incurred over different time periods.
| 1 | Effective May 1, 2008, Class B Shares will only be issued upon exchange of Class B Shares from another Nuveen Fund or for purposes of dividend reinvestment. Effective December 31, 2008, the reinstatement privilege for Class B Shares is no longer available. Effective May 1, 2008, Class R Shares were renamed Class I Shares. See the Fund’s prospectus for more information. |
| 4 | As a percentage of total investments as of June 30, 2009. Holdings are subject to change. |
Fund Spotlight as of 6/30/09 Nuveen Moderate Allocation Fund
| | |
| Description | | Weighting1 |
Nuveen NWQ Large-Cap Value Fund (Class I) | | 3.5% |
Nuveen Santa Barbara Growth Fund (Class I) | | 1.7% |
Nuveen Symphony Large-Cap Growth Fund (Class I) | | 4.8% |
Nuveen Tradewinds Global Resources Fund (Class I) | | 4.8% |
Nuveen Tradewinds International Value Fund (Class I) | | 9.1% |
Nuveen Tradewinds Value Opportunities Fund (Class I) | | 2.9% |
Nuveen U.S. Equity Completeness Fund | | 6.4% |
Nuveen Winslow Large-Cap Growth Fund (Class I) | | 1.7% |
Total Affiliated Equity Funds | | 34.9% |
| |
iShares Dow Jones U.S. Real Estate Index Fund | | 2.9% |
iShares MSCI EAFE Growth Index Fund | | 8.9% |
iShares MSCI Emerging Markets Index Fund | | 10.8% |
Total Non-Affiliated Equity Funds | | 22.6% |
| Total Equity Funds | | 57.5% |
| |
Nuveen High Yield Bond Fund (Class I) | | 14.7% |
Nuveen Multi-Strategy Income Fund (Class I) | | 10.1% |
Nuveen Short Duration Bond Fund (Class I) | | 5.5% |
Total Affiliated Fixed Income Funds | | 30.3% |
| |
iShares Barclays U.S. Treasury Inflation Protected Securities Index Fund | | 9.1% |
Total Non-Affiliated Fixed Income Funds | | 9.1% |
| Total Fixed Income Funds | | 39.4% |
| Total Short-Term Investments | | 3.1% |
| Total Investments | | 100.0% |
| | |
| Affiliated Equity Funds | | 1-Year Average
Annual Total Returns
as of 6/30/09 |
Nuveen NWQ Large-Cap Value Fund (Class I) | | -26.35% |
Nuveen Santa Barbara Growth Fund (Class I) | | -27.51% |
Nuveen Symphony Large-Cap Growth Fund (Class I) | | -25.88% |
Nuveen Tradewinds Global Resources Fund (Class I) | | -29.38% |
Nuveen Tradewinds International Value Fund (Class I) | | -20.78% |
Nuveen Tradewinds Value Opportunities Fund (Class I) | | -13.29% |
Nuveen U.S. Equity Completeness Fund | | -28.96% |
Nuveen Winslow Large-Cap Growth Fund (Class I) | | 6.60%* |
| |
| Non-Affiliated Equity Funds | | |
iShares Dow Jones U.S. Real Estate Index Fund | | -42.48% |
iShares MSCI EAFE Growth Index Fund | | -33.41% |
iShares MSCI Emerging Markets Index Fund | | -27.16% |
| |
| Affiliated Fixed Income Funds | | |
Nuveen High Yield Bond Fund (Class I) | | -13.15% |
Nuveen Multi-Strategy Income Fund (Class I) | | 9.75% |
Nuveen Short Duration Bond Fund (Class I) | | 5.11% |
| |
| Non-Affiliated Fixed Income Funds | | |
iShares Barclays U.S. Treasury Inflation Protected Securities Index Fund | | -1.24% |
| 1 | As a percentage of total investments as of June 30, 2009. Holdings are subject to change. |
| * | Since inception cumulative return for the period May 15, 2009 (commencement of operations) through June 30, 2009. |
Expense Example
As a shareholder of the Fund, you incur two types of costs: (1) transaction costs, including front- and back-end sales charges (loads) or redemption fees, where applicable; and (2) ongoing costs, including management fees; distribution and service (12b-1) fees, where applicable; and other Fund expenses. This Example is intended to help you understand your ongoing costs (in dollars) of investing in the Fund and to compare these costs with the ongoing costs of investing in other mutual funds.
The Example below is based on an investment of $1,000 invested at the beginning of the period and held for the period.
The information under “Actual Performance,” together with the amount you invested, allows you to estimate actual expenses incurred over the reporting period. Simply divide your account value by $1,000 (for example, an $8,600 account value divided by $1,000 = 8.60) and multiply the result by the cost shown for your share class, in the row entitled “Expenses Incurred During Period” to estimate the expenses incurred on your account during this period.
The information under “Hypothetical Performance,” provides information about hypothetical account values and hypothetical expenses based on the Fund’s actual expense ratio and an assumed rate of return of 5% per year before expenses, which is not the Fund’s actual return. The hypothetical account values and expenses may not be used to estimate the actual ending account balance or expense you incurred for the period. You may use this information to compare the ongoing costs of investing in the Fund and other Funds. To do so, compare this 5% hypothetical example with the 5% hypothetical examples that appear in the shareholder reports of the other funds.
Please note that the expenses shown in the table are meant to highlight your ongoing costs only and do not reflect any transactional costs, such as front- and back-end sales charges (loads) or redemption fees, where applicable. Therefore, the hypothetical information is useful in comparing ongoing costs only, and will not help you determine the relative total costs of owning different funds or share classes. In addition, if these transactional costs were included, your costs would have been higher.
| | | | | | | | | | | | | | | | | | | | | | | | | | | | | | | | |
| | | | | | | | | | | | | | | Hypothetical Performance |
| | | Actual Performance | | | | (5% return before expenses) |
| | | A Shares | | B Shares | | C Shares | | R3 Shares | | I Shares | | | | A Shares | | B Shares | | C Shares | | R3 Shares | | I Shares |
| Beginning Account Value (1/01/09) | | $ | 1,000.00 | | $ | 1,000.00 | | $ | 1,000.00 | | $ | 1,000.00 | | $ | 1,000.00 | | | | $ | 1,000.00 | | $ | 1,000.00 | | $ | 1,000.00 | | $ | 1,000.00 | | $ | 1,000.00 |
| Ending Account Value (6/30/09) | | $ | 1,102.70 | | $ | 1,098.10 | | $ | 1,098.60 | | $ | 1,101.30 | | $ | 1,104.00 | | | | $ | 1,022.12 | | $ | 1,018.40 | | $ | 1,018.40 | | $ | 1,020.88 | | $ | 1,023.36 |
| Expenses Incurred During Period | | $ | 2.82 | | $ | 6.71 | | $ | 6.71 | | $ | 4.12 | | $ | 1.51 | | | | $ | 2.71 | | $ | 6.46 | | $ | 6.46 | | $ | 3.96 | | $ | 1.45 |
For each class of the Fund, expenses are equal to the Fund’s annualized net expense ratio of 0.54%, 1.29%, 1.29%, 0.79% and 0.29% for Classes A, B, C, R3 and I, respectively, multiplied by the average account value over the period, multiplied by 181/365 (to reflect the one-half year period).
Fund Spotlight as of 6/30/09 Nuveen Conservative Allocation Fund
| | | | | | | | | | |
| Quick Facts | | | | | | | | | | |
| | | A Shares | | B Shares1 | | C Shares | | R3 Shares | | I Shares1 |
Fund Symbols | | NBMSX | | NMNBX | | NBMCX | | NALTX | | NMNRX |
NAV | | $20.24 | | $21.72 | | $21.69 | | $19.71 | | $19.69 |
Latest Capital Gain Distribution2 | | $0.4806 | | $0.4806 | | $0.4806 | | $0.4806 | | $0.4806 |
Latest Ordinary Income Distribution3 | | $0.3252 | | $0.1692 | | $0.1689 | | $0.2658 | | $0.3709 |
Inception Date | | 8/07/96 | | 8/07/96 | | 8/07/96 | | 8/04/08 | | 8/07/96 |
Returns quoted represent past performance which is no guarantee of future results. Investment returns and principal value will fluctuate so that when shares are redeemed, they may be worth more or less than their original cost. Current performance may be higher or lower than the performance shown. Returns without sales charges would be lower if the sales charge were included. Returns do not reflect the deduction of taxes that a shareholder would pay on Fund distributions or the redemption of shares. For the most recent month-end performance visit www.nuveen.com or call (800) 257-8787.
Class A, B, C and I Share returns are actual. The returns for Class R3 Shares are actual for the period since class inception; returns prior to class inception are Class I Share returns adjusted for differences in sales charges and expenses, which are primarily differences in distribution and service fees. Fund returns assume reinvestment of dividends and capital gains. Class A Shares have a 5.75% maximum sales charge. Class A Share purchases of $1 million or more are sold at net asset value without an up-front sales charge but may be subject to a contingent deferred sales charge (CDSC), also known as a back-end sales charge, if redeemed within twelve months of purchase. Class B Shares have a CDSC that begins at 5% for redemptions during the first year and declines periodically until after six years when the charge becomes 0%. Class B Shares automatically convert to Class A Shares eight years after purchase. Class C Shares have a 1% CDSC for redemptions within less than one year, which is not reflected in the one-year total return. Class R3 Shares have no sales charge and are available to only certain retirement plans. Class I Shares have no sales charge and may be purchased under limited circumstances or by specified classes of investors. Returns may reflect an expense limitation by the Fund’s investment adviser.
Returns prior to July 7, 2008, are not indicative of the performance that the Fund, as currently managed, would have generated.
| | | | |
| Average Annual Total Returns as of 6/30/09 |
| | |
| A Shares | | NAV | | Offer |
1-Year | | -7.25% | | -12.57% |
5-Year | | 2.09% | | 0.88% |
10-Year | | 1.61% | | 1.01% |
| | |
| B Shares | | w/o CDSC | | w/CDSC |
1-Year | | -7.97% | | -11.52% |
5-Year | | 1.32% | | 1.14% |
10-Year | | 1.01% | | 1.01% |
| | |
| C Shares | | NAV | | |
1-Year | | -7.94% | | |
5-Year | | 1.33% | | |
10-Year | | 0.85% | | |
| | |
| R3 Shares | | NAV | | |
1-Year | | -7.45% | | |
5-Year | | 1.83% | | |
10-Year | | 1.36% | | |
| | |
| I Shares | | NAV | | |
1-Year | | -6.98% | | |
5-Year | | 2.35% | | |
10-Year | | 1.87% | | |
Portfolio Allocation4
| | |
| Portfolio Statistics |
| Net Assets ($000) | | $44,232 |
| Number of Holdings | | 16 |
| | | | | | |
| Expense Ratios | | | | | | |
| Share Class | | Gross
Expense
Ratios | | Net
Expense
Ratios | | As of
Date |
| Class A | | 1.21% | | 1.21% | | 10/31/08 |
| Class B | | 1.96% | | 1.96% | | 10/31/08 |
| Class C | | 1.96% | | 1.96% | | 10/31/08 |
| Class R3 | | 1.46% | | 1.46% | | 10/31/08 |
| Class I | | 0.96% | | 0.96% | | 10/31/08 |
The expense ratios reflect the Fund’s management fees, 12b-1 distribution and service fees and estimated other expenses, as well as the estimated fees and expenses of the Underlying Funds in which the Fund invests. These expense ratios will vary from the expense ratios included in the Financial Highlights in this report, as they reflect expenses incurred over different time periods.
| 1 | Effective May 1, 2008, Class B Shares will only be issued upon exchange of Class B Shares from another Nuveen Fund or for purposes of dividend reinvestment. Effective December 31, 2008, the reinstatement privilege for Class B Shares is no longer available. Effective May 1, 2008, Class R Shares were renamed Class I Shares. See the Fund’s prospectus for more information. |
| 4 | As a percentage of total investments as of June 30, 2009. Holdings are subject to change. |
Fund Spotlight as of 6/30/09 Nuveen Conservative Allocation Fund
| | |
| Description | | Weighting1 |
Nuveen NWQ Large-Cap Value Fund (Class I) | | 2.4% |
Nuveen Santa Barbara Growth Fund (Class I) | | 1.2% |
Nuveen Symphony Large-Cap Growth Fund (Class I) | | 3.3% |
Nuveen Tradewinds Global Resources Fund (Class I) | | 4.9% |
Nuveen Tradewinds International Value Fund (Class I) | | 5.0% |
Nuveen Tradewinds Value Opportunities Fund (Class I) | | 1.9% |
Nuveen U.S. Equity Completeness Fund | | 4.2% |
Nuveen Winslow Large-Cap Growth Fund (Class I) | | 1.1% |
Total Affiliated Equity Funds | | 24.0% |
| |
iShares Dow Jones U.S. Real Estate Index Fund | | 2.9% |
iShares MSCI EAFE Growth Index Fund | | 4.9% |
iShares MSCI Emerging Markets Index Fund | | 6.0% |
Total Non-Affiliated Equity Funds | | 13.8% |
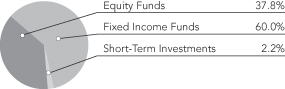
| Total Equity Funds | | 37.8% |
| |
Nuveen High Yield Bond Fund (Class I) | | 10.1% |
Nuveen Multi-Strategy Income Fund (Class I) | | 20.4% |
Nuveen Short Duration Bond Fund (Class I) | | 19.5% |
Total Affiliated Fixed Income Funds | | 50.0% |
| |
iShares Barclays U.S. Treasury Inflation Protected Securities Index Fund | | 10.0% |
Total Non-Affiliated Fixed Income Funds | | 10.0% |
| Total Fixed Income Funds | | 60.0% |
| Total Short-Term Investments | | 2.2% |
| Total Investments | | 100.0% |
| | |
| Affiliated Equity Funds | | 1-Year Average
Annual Total Returns
as of 6/30/09 |
Nuveen NWQ Large-Cap Value Fund (Class I) | | -26.35% |
Nuveen Santa Barbara Growth Fund (Class I) | | -27.51% |
Nuveen Symphony Large-Cap Growth Fund (Class I) | | -25.88% |
Nuveen Tradewinds Global Resources Fund (Class I) | | -29.38% |
Nuveen Tradewinds International Value Fund (Class I) | | -20.78% |
Nuveen Tradewinds Value Opportunities Fund (Class I) | | -13.29% |
Nuveen U.S. Equity Completeness Fund | | -28.96% |
Nuveen Winslow Large-Cap Growth Fund (Class I) | | 6.60%* |
| |
| Non-Affiliated Equity Funds | | |
iShares Dow Jones U.S. Real Estate Index Fund | | -42.48% |
iShares MSCI EAFE Growth Index Fund | | -33.41% |
iShares MSCI Emerging Markets Index Fund | | -27.16% |
| |
| Affiliated Fixed Income Funds | | |
Nuveen High Yield Bond Fund (Class I) | | -13.15% |
Nuveen Multi-Strategy Income Fund (Class I) | | 9.75% |
Nuveen Short Duration Bond Fund (Class I) | | 5.11% |
| |
| Non-Affiliated Fixed Income Funds | | |
iShares Barclays U.S. Treasury Inflation Protected Securities Index Fund | | -1.24% |
| 1 | As a percentage of total investments as of June 30, 2009. Holdings are subject to change. |
| * | Since inception cumulative return for the period May 15, 2009 (commencement of operations) through June 30, 2009. |
Expense Example
As a shareholder of the Fund, you incur two types of costs: (1) transaction costs, including front- and back-end sales charges (loads) or redemption fees, where applicable; and (2) ongoing costs, including management fees; distribution and service (12b-1) fees, where applicable; and other Fund expenses. This Example is intended to help you understand your ongoing costs (in dollars) of investing in the Fund and to compare these costs with the ongoing costs of investing in other mutual funds.
The Example below is based on an investment of $1,000 invested at the beginning of the period and held for the period.
The information under “Actual Performance,” together with the amount you invested, allows you to estimate actual expenses incurred over the reporting period. Simply divide your account value by $1,000 (for example, an $8,600 account value divided by $1,000 = 8.60) and multiply the result by the cost shown for your share class, in the row entitled “Expenses Incurred During Period” to estimate the expenses incurred on your account during this period.
The information under “Hypothetical Performance,” provides information about hypothetical account values and hypothetical expenses based on the Fund’s actual expense ratio and an assumed rate of return of 5% per year before expenses, which is not the Fund’s actual return. The hypothetical account values and expenses may not be used to estimate the actual ending account balance or expense you incurred for the period. You may use this information to compare the ongoing costs of investing in the Fund and other Funds. To do so, compare this 5% hypothetical example with the 5% hypothetical examples that appear in the shareholder reports of the other funds.
Please note that the expenses shown in the table are meant to highlight your ongoing costs only and do not reflect any transactional costs, such as front- and back-end sales charges (loads) or redemption fees, where applicable. Therefore, the hypothetical information is useful in comparing ongoing costs only, and will not help you determine the relative total costs of owning different funds or share classes. In addition, if these transactional costs were included, your costs would have been higher.
| | | | | | | | | | | | | | | | | | | | | | | | | | | | | | | | |
| | | | | | | Hypothetical Performance |
| | | Actual Performance | | | | (5% return before expenses) |
| | | A Shares | | B Shares | | C Shares | | R3 Shares | | I Shares | | | | A Shares | | B Shares | | C Shares | | R3 Shares | | I Shares |
| Beginning Account Value (1/01/09) | | $ | 1,000.00 | | $ | 1,000.00 | | $ | 1,000.00 | | $ | 1,000.00 | | $ | 1,000.00 | | | | $ | 1,000.00 | | $ | 1,000.00 | | $ | 1,000.00 | | $ | 1,000.00 | | $ | 1,000.00 |
| Ending Account Value (6/30/09) | | $ | 1,078.30 | | $ | 1,074.70 | | $ | 1,074.30 | | $ | 1,077.00 | | $ | 1,080.10 | | | | $ | 1,021.72 | | $ | 1,018.00 | | $ | 1,018.00 | | $ | 1,020.48 | | $ | 1,022.96 |
| Expenses Incurred During Period | | $ | 3.19 | | $ | 7.05 | | $ | 7.05 | | $ | 4.48 | | $ | 1.91 | | | | $ | 3.11 | | $ | 6.85 | | $ | 6.85 | | $ | 4.36 | | $ | 1.86 |
For each class of the Fund, expenses are equal to the Fund’s annualized net expense ratio of 0.62%, 1.37%, 1.37%, 0.87% and 0.37% for Classes A, B, C, R3 and I, respectively, multiplied by the average account value over the period, multiplied by 181/365 (to reflect the one-half year period).
Report of
Independent Registered Public Accounting Firm
To the Board of Trustees and Shareholders of
Nuveen Investment Trust:
In our opinion, the accompanying statements of assets and liabilities, including the portfolios of investments, and the related statements of operations, of changes in net assets and the financial highlights present fairly, in all material respects, the financial position of Nuveen Growth Allocation Fund, Nuveen Moderate Allocation Fund, and Nuveen Conservative Allocation (each a series of the Nuveen Investment Trust, hereafter referred to as the “Funds”) at June 30, 2009, the results of their operations for the year then ended, the changes in their net assets for each of the two years in the period then ended and the financial highlights for each of the five years in the period then ended in conformity with accounting principles generally accepted in the United States of America. These financial statements and financial highlights (hereafter referred to as “financial statements”) are the responsibility of the Funds’ management; our responsibility is to express an opinion on these financial statements based on our audits. We conducted our audits of these financial statements in accordance with the standards of the Public Company Accounting Oversight Board (United States). Those standards require that we plan and perform the audit to obtain reasonable assurance about whether the financial statements are free of material misstatement. An audit includes examining, on a test basis, evidence supporting the amounts and disclosures in the financial statements, assessing the accounting principles used and significant estimates made by management, and evaluating the overall financial statement presentation. We believe that our audits, which included confirmation of securities at June 30, 2009 by correspondence with the custodian and brokers, provide a reasonable basis for our opinion.
PRICEWATERHOUSECOOPERS LLP
Chicago, IL
August 24, 2009
Portfolio of Investments
Nuveen Growth Allocation Fund
June 30, 2009
| | | | | | | | | | | | |
| Shares | | Description (1) | | | | | | | | Value |
| | | | | | | | | | | | |
| | | EQUITY FUNDS – 68.7% | | | | | | | | | |
| | | | | |
| | | Affiliated Equity Funds – 40.0% | | | | | | | | | |
| | | | | |
| | 26,471 | | Nuveen NWQ Large-Cap Value Fund (Class I) | | | | | | | | $ | 336,708 |
| | | | | |
| | 10,266 | | Nuveen Santa Barbara Growth Fund (Class I) | | | | | | | | | 151,735 |
| | | | | |
| | 29,551 | | Nuveen Symphony Large-Cap Growth Fund (Class I) | | | | | | | | | 456,264 |
| | | | | |
| | 29,835 | | Nuveen Tradewinds Global Resources Fund (Class I) | | | | | | | | | 500,333 |
| | | | | |
| | 46,130 | | Nuveen Tradewinds International Value Fund (Class I) | | | | | | | | | 977,953 |
| | | | | |
| | 11,307 | | Nuveen Tradewinds Value Opportunities Fund (Class I) | | | | | | | | | 273,513 |
| | | | | |
| | 42,111 | | Nuveen U.S. Equity Completeness Fund | | | | | | | | | 595,443 |
| | | | | |
| | 7,618 | | Nuveen Winslow Large-Cap Growth Fund (Class I) | | | | | | | | | 162,421 |
| | | Total Affiliated Equity Funds (cost $4,479,148) | | | | | | | | | 3,454,370 |
| | | | | |
| | | Non-Affiliated Equity Funds – 28.7% | | | | | | | | | |
| | | | | |
| | 7,400 | | iShares Dow Jones U.S. Real Estate Index Fund | | | | | | | | | 239,316 |
| | | | | |
| | 20,800 | | iShares MSCI EAFE Growth Index Fund | | | | | | | | | 960,752 |
| | | | | |
| | 39,640 | | iShares MSCI Emerging Markets Index Fund | | | | | | | | | 1,277,597 |
| | | Total Non-Affiliated Equity Funds (cost $2,869,989) | | | | | | | | | 2,477,665 |
| | | Total Equity Funds (cost $7,349,137) | | | | | | | | | 5,932,035 |
| | | | | |
| | | FIXED INCOME FUNDS – 27.2% | | | | | | | | | |
| | | | | |
| | | Affiliated Fixed Income Funds – 21.3% | | | | | | | | | |
| | | | | |
| | 82,407 | | Nuveen High Yield Bond Fund (Class I) | | | | | | | | | 1,195,722 |
| | | | | |
| | 26,320 | | Nuveen Multi-Strategy Income Fund (Class I) | | | | | | | | | 517,970 |
| | | | | |
| | 6,709 | | Nuveen Short Duration Bond Fund (Class I) | | | | | | | | | 129,952 |
| | | Total Affiliated Fixed Income Funds (cost $1,823,912) | | | | | | | | | 1,843,644 |
| | | | | |
| | | Non-Affiliated Fixed Income Funds – 5.9% | | | | | | | | | |
| | | | | |
| | 5,050 | | iShares Barclays U.S. Treasury Inflation Protected Securities Index Fund | | | | | | | | | 513,232 |
| | | Total Non-Affiliated Fixed Income Funds (cost $525,464) | | | | | | | | | 513,232 |
| | | Total Fixed Income Funds (cost $2,349,376) | | | | | | | | | 2,356,876 |
| | | | | |
Principal
Amount (000) | | Description (1) | | Coupon | | | | Maturity | | Value |
| | | Short-Term Investments – 4.0% | | | | | | | | | |
| | | | | |
| $ | 341 | | Repurchase Agreement with Fixed Income Clearing Corporation, dated 6/30/09,
repurchase price $341,449, collateralized by $340,000 U.S. Treasury Notes,
2.750%, due 7/31/10, value $351,900 | | 0.000% | | | | 7/01/09 | | $ | 341,449 |
| | | Total Short-Term Investments (cost $341,449) | | | | | | | | | 341,449 |
| | | Total Investments (cost $10,039,962) – 99.9% | | | | | | | | | 8,630,360 |
| | | Other Assets Less Liabilities – 0.1% | | | | | | | | | 7,826 |
| | | Net Assets – 100% | | | | | | | | $ | 8,638,186 |
| | (1) | | All percentages shown in the Portfolio of Investments are based on net assets. |
See accompanying notes to financial statements.
Portfolio of Investments
Nuveen Moderate Allocation Fund
June 30, 2009
| | | | | | | | | | | | |
| Shares | | Description (1) | | | | | | | | Value |
| | | | | | | | | | | | |
| | | EQUITY FUNDS – 57.4% | | | | | | | | | |
| | | | | |
| | | Affiliated Equity Funds – 34.8% | | | | | | | | | |
| | | | | |
| | 97,297 | | Nuveen NWQ Large-Cap Value Fund (Class I) | | | | | | | | $ | 1,237,623 |
| | | | | |
| | 39,783 | | Nuveen Santa Barbara Growth Fund (Class I) | | | | | | | | | 587,988 |
| | | | | |
| | 110,601 | | Nuveen Symphony Large-Cap Growth Fund (Class I) | | | | | | | | | 1,707,681 |
| | | | | |
| | 100,305 | | Nuveen Tradewinds Global Resources Fund (Class I) | | | | | | | | | 1,682,118 |
| | | | | |
| | 150,980 | | Nuveen Tradewinds International Value Fund (Class I) | | | | | | | | | 3,200,769 |
| | | | | |
| | 42,727 | | Nuveen Tradewinds Value Opportunities Fund (Class I) | | | | | | | | | 1,033,572 |
| | | | | |
| | 159,963 | | Nuveen U.S. Equity Completeness Fund | | | | | | | | | 2,261,881 |
| | | | | |
| | 27,654 | | Nuveen Winslow Large-Cap Growth Fund (Class I) | | | | | | | | | 589,580 |
| | | Total Affiliated Equity Funds (cost $15,394,700) | | | | | | | | | 12,301,212 |
| | | | | |
| | | Non-Affiliated Equity Funds – 22.6% | | | | | | | | | |
| | | | | |
| | 31,790 | | iShares Dow Jones U.S. Real Estate Index Fund | | | | | | | | | 1,028,089 |
| | | | | |
| | 67,920 | | iShares MSCI EAFE Growth Index Fund | | | | | | | | | 3,137,225 |
| | | | | |
| | 118,600 | | iShares MSCI Emerging Markets Index Fund | | | | | | | | | 3,822,478 |
| | | Total Non-Affiliated Equity Funds (cost $8,302,998) | | | | | | | | | 7,987,792 |
| | | Total Equity Funds (cost $23,697,698) | | | | | | | | | 20,289,004 |
| | | | | |
| | | FIXED INCOME FUNDS – 39.4% | | | | | | | | | |
| | | | | |
| | | Affiliated Fixed Income Funds – 30.3% | | | | | | | | | |
| | | | | |
| | 357,728 | | Nuveen High Yield Bond Fund (Class I) | | | | | | | | | 5,190,637 |
| | | | | |
| | 181,916 | | Nuveen Multi-Strategy Income Fund (Class I) | | | | | | | | | 3,580,098 |
| | | | | |
| | 100,395 | | Nuveen Short Duration Bond Fund (Class I) | | | | | | | | | 1,944,652 |
| | | Total Affiliated Fixed Income Funds (cost $10,469,425) | | | | | | | | | 10,715,387 |
| | | | | |
| | | Non-Affiliated Fixed Income Funds – 9.1% | | | | | | | | | |
| | | | | |
| | 31,500 | | iShares Barclays U.S. Treasury Inflation Protected Securities Index Fund | | | | | | | | | 3,201,345 |
| | | Total Non-Affiliated Fixed Income Funds (cost $3,311,314) | | | | | | | | | 3,201,345 |
| | | Total Fixed Income Funds (cost $13,780,739) | | | | | | | | | 13,916,732 |
| | | | | |
Principal
Amount (000) | | Description (1) | | | | Coupon | | Maturity | | Value |
| | | Short-Term Investments – 3.1% | | | | | | | | | |
| | | | | |
| $ | 1,110 | | Repurchase Agreement with Fixed Income Clearing Corporation, dated 6/30/09, repurchase price $1,109,997, collateralized by $1,095,000 U.S. Treasury Notes, 2.750%, due 7/31/10, value $1,133,325 | | | | 0.000% | | 7/01/09 | | $ | 1,109,997 |
| | | Total Short-Term Investments (cost $1,109,997) | | | | | | | | | 1,109,997 |
| | | Total Investments (cost $38,588,434) – 99.9% | | | | | | | | | 35,315,733 |
| | | Other Assets Less Liabilities – 0.1% | | | | | | | | | 21,672 |
| | | Net Assets – 100% | | | | | | | | $ | 35,337,405 |
| | (1) | | All percentages shown in the Portfolio of Investments are based on net assets. |
See accompanying notes to financial statements.
Portfolio of Investments
Nuveen Conservative Allocation Fund
June 30, 2009
| | | | | | | | | | | | |
| Shares | | Description (1) | | | | | | | | Value |
| | | | | | | | | | | | |
| | | EQUITY FUNDS – 37.7% | | | | | | | | | |
| | | | | |
| | | Affiliated Equity Funds – 24.0% | | | | | | | | | |
| | | | | |
| | 82,565 | | Nuveen NWQ Large-Cap Value Fund (Class I) | | | | | | | | $ | 1,050,230 |
| | | | | |
| | 34,976 | | Nuveen Santa Barbara Growth Fund (Class I) | | | | | | | | | 516,947 |
| | | | | |
| | 93,882 | | Nuveen Symphony Large-Cap Growth Fund (Class I) | | | | | | | | | 1,449,532 |
| | | | | |
| | 128,896 | | Nuveen Tradewinds Global Resources Fund (Class I) | | | | | | | | | 2,161,583 |
| | | | | |
| | 104,117 | | Nuveen Tradewinds International Value Fund (Class I) | | | | | | | | | 2,207,270 |
| | | | | |
| | 35,209 | | Nuveen Tradewinds Value Opportunities Fund (Class I) | | | | | | | | | 851,700 |
| | | | | |
| | 131,950 | | Nuveen U.S. Equity Completeness Fund | | | | | | | | | 1,865,779 |
| | | | | |
| | 23,596 | | Nuveen Winslow Large-Cap Growth Fund (Class I) | | | | | | | | | 503,060 |
| | | Total Affiliated Equity Funds (cost $12,963,667) | | | | | | | | | 10,606,101 |
| | | | | |
| | | Non-Affiliated Equity Funds – 13.7% | | | | | | | | | |
| | | | | |
| | 39,500 | | iShares Dow Jones U.S. Real Estate Index Fund | | | | | | | | | 1,277,430 |
| | | | | |
| | 46,830 | | iShares MSCI EAFE Growth Index Fund | | | | | | | | | 2,163,078 |
| | | | | |
| | 82,160 | | iShares MSCI Emerging Markets Index Fund | | | | | | | | | 2,648,017 |
| | | Total Non-Affiliated Equity Funds (cost $7,193,767) | | | | | | | | | 6,088,525 |
| | | Total Equity Funds (cost $20,157,434) | | | | | | | | | 16,694,626 |
| | | | | |
| | | FIXED INCOME FUNDS – 60.0% | | | | | | | | | |
| | | | | |
| | | Affiliated Fixed Income Funds – 49.9% | | | | | | | | | |
| | | | | |
| | 306,950 | | Nuveen High Yield Bond Fund (Class I) | | | | | | | | | 4,453,839 |
| | | | | |
| | 457,358 | | Nuveen Multi-Strategy Income Fund (Class I) | | | | | | | | | 9,000,809 |
| | | | | |
| | 445,619 | | Nuveen Short Duration Bond Fund (Class I) | | | | | | | | | 8,631,646 |
| | | Total Affiliated Fixed Income Funds (cost $21,959,670) | | | | | | | | | 22,086,294 |
| | | | | |
| | | Non-Affiliated Fixed Income Funds – 10.1% | | | | | | | | | |
| | | | | |
| | 43,750 | | iShares Barclays U.S. Treasury Inflation Protected Securities Index Fund | | | | | | | | | 4,446,312 |
| | | Total Non-Affiliated Fixed Income Funds (cost $4,694,747) | | | | | | | | | 4,446,312 |
| | | Total Fixed Income Funds (cost $26,654,417) | | | | | | | | | 26,532,606 |
| | | | | |
Principal
Amount (000) | | Description (1) | | Coupon | | | | Maturity | | Value |
| | | Short-Term Investments – 2.2% | | | | | | | | | |
| | | | | |
| $ | 982 | | Repurchase Agreement with Fixed Income Clearing Corporation, dated 6/30/09, repurchase price $981,890, collateralized by $1,000,000 U.S. Treasury Notes, 1.375%, due 2/15/12, value $1,003,750 | | 0.000% | | | | 7/01/09 | | $ | 981,890 |
| | | Total Short-Term Investments (cost $981,890) | | | | | | | | | 981,890 |
| | | Total Investments (cost $47,793,741) – 99.9% | | | | | | | | | 44,209,122 |
| | | Other Assets Less Liabilities – 0.1% | | | | | | | | | 22,393 |
| | | Net Assets – 100% | | | | | | | | $ | 44,231,515 |
| | (1) | | All percentages shown in the Portfolio of Investments are based on net assets. |
See accompanying notes to financial statements.
Statement of Assets and Liabilities
June 30, 2009
| | | | | | | | | | | | |
| | | Growth
Allocation (1) | | | Moderate
Allocation (2) | | | Conservative
Allocation (3) | |
Assets | | | | | | | | | | | | |
Affiliated investments, at value (cost $6,303,060, $25,864,125 and $34,923,337, respectively) | | $ | 5,298,014 | | | $ | 23,016,599 | | | $ | 32,692,395 | |
Non-affiliated investments, at value (cost $3,736,902, $12,724,309 and $12,870,404, respectively) | | | 3,332,346 | | | | 12,299,134 | | | | 11,516,727 | |
Receivables: | | | | | | | | | | | | |
Dividends | | | 12,809 | | | | 66,055 | | | | 106,419 | |
From Adviser | | | 39,979 | | | | 62,647 | | | | 53,865 | |
Reclaims | | | 957 | | | | 6,058 | | | | 5,489 | |
Shares sold | | | 4,726 | | | | 2,025 | | | | 8,286 | |
Other assets | | | 20 | | | | 9,393 | | | | 16,359 | |
Total assets | | | 8,688,851 | | | | 35,461,911 | | | | 44,399,540 | |
Liabilities | | | | | | | | | | | | |
Payable for shares redeemed | | | 4,852 | | | | 35,463 | | | | 67,917 | |
Accrued expenses: | | | | | | | | | | | | |
12b-1 distribution and service fees | | | 3,585 | | | | 10,798 | | | | 14,201 | |
Other | | | 42,228 | | | | 78,245 | | | | 85,907 | |
Total liabilities | | | 50,665 | | | | 124,506 | | | | 168,025 | |
Net assets | | $ | 8,638,186 | | | $ | 35,337,405 | | | $ | 44,231,515 | |
Class A Shares | | | | | | | | | | | | |
Net assets | | $ | 1,922,051 | | | $ | 21,135,991 | | | $ | 35,247,010 | |
Shares outstanding | | | 108,646 | | | | 1,118,287 | | | | 1,741,342 | |
Net asset value per share | | $ | 17.69 | | | $ | 18.90 | | | $ | 20.24 | |
Offering price per share (net asset value per share plus maximum sales charge of 5.75% of offering price) | | $ | 18.77 | | | $ | 20.05 | | | $ | 21.47 | |
Class B Shares | | | | | | | | | | | | |
Net assets | | $ | 434,433 | | | $ | 3,054,385 | | | $ | 1,730,189 | |
Shares outstanding | | | 24,937 | | | | 161,482 | | | | 79,663 | |
Net asset value and offering price per share | | $ | 17.42 | | | $ | 18.91 | | | $ | 21.72 | |
Class C Shares | | | | | | | | | | | | |
Net assets | | $ | 3,364,261 | | | $ | 4,684,882 | | | $ | 6,649,395 | |
Shares outstanding | | | 192,928 | | | | 247,385 | | | | 306,528 | |
Net asset value and offering price per share | | $ | 17.44 | | | $ | 18.94 | | | $ | 21.69 | |
Class R3 Shares | | | | | | | | | | | | |
Net assets | | $ | 117,578 | | | $ | 127,776 | | | $ | 133,418 | |
Shares outstanding | | | 6,619 | | | | 6,757 | | | | 6,769 | |
Net asset value and offering price per share | | $ | 17.76 | | | $ | 18.91 | | | $ | 19.71 | |
Class I Shares | | | | | | | | | | | | |
Net assets | | $ | 2,799,863 | | | $ | 6,334,371 | | | $ | 471,503 | |
Shares outstanding | | | 158,017 | | | | 335,262 | | | | 23,947 | |
Net asset value and offering price per share | | $ | 17.72 | | | $ | 18.89 | | | $ | 19.69 | |
Net Assets Consist of: | | | | | | | | | | | | |
Capital paid-in | | $ | 12,045,047 | | | $ | 42,197,472 | | | $ | 50,940,234 | |
Undistributed (Over-distribution of) net investment income | | | 205,950 | | | | 696,819 | | | | 1,585,855 | |
Accumulated net realized gain (loss) from investments | | | (2,203,088 | ) | | | (4,284,185 | ) | | | (4,709,955 | ) |
Net unrealized appreciation (depreciation) of investments | | | (1,409,723 | ) | | | (3,272,701 | ) | | | (3,584,619 | ) |
Net assets | | $ | 8,638,186 | | | $ | 35,337,405 | | | $ | 44,231,515 | |
(1) Prior to August 1, 2008, the Fund was known as Nuveen Global Value Fund.
(2) Prior to August 1, 2008, the Fund was known as Nuveen Balanced Stock and Bond Fund.
(3) Prior to July 7, 2008, the Fund was known as Nuveen Balanced Municipal and Stock Fund.
See accompanying notes to financial statements.
Statement of Operations
Year Ended June 30, 2009
| | | | | | | | | | | | |
| | | Growth
Allocation (1) | | | Moderate
Allocation (2) | | | Conservative
Allocation (3) | |
Investment Income | | | | | | | | | | | | |
Dividends (net of foreign tax withheld of $457, $0 and $0, respectively) | | $ | 146,559 | | | $ | 558,122 | | | $ | 574,204 | |
Dividends from affiliated investment company shares | | | 215,326 | | | | 985,813 | | | | 1,646,542 | |
Interest | | | 1,729 | | | | 98,476 | | | | 168,191 | |
Total investment income | | | 363,614 | | | | 1,642,411 | | | | 2,388,937 | |
Expenses | | | | | | | | | | | | |
Management fees | | | 24,249 | | | | 83,722 | | | | 78,966 | |
12b-1 service fees – Class A | | | 5,197 | | | | 55,278 | | | | 96,339 | |
12b-1 distribution and service fees – Class B | | | 4,381 | | | | 37,078 | | | | 25,109 | |
12b-1 distribution and service fees – Class C | | | 38,968 | | | | 51,126 | | | | 66,793 | |
12b-1 distribution and service fees – Class R3 | | | 517 | | | | 551 | | | | 580 | |
Shareholders’ servicing agent fees and expenses | | | 19,058 | | | | 53,989 | | | | 48,513 | |
Custodian’s fees and expenses | | | 5,080 | | | | 9,477 | | | | 16,379 | |
Trustees’ fees and expenses | | | 75 | | | | 869 | | | | 778 | |
Professional fees | | | 44,604 | | | | 54,505 | | | | 57,496 | |
Shareholders’ reports – printing and mailing expenses | | | 70,047 | | | | 132,583 | | | | 113,000 | |
Federal and state registration fees | | | 55,761 | | | | 60,027 | | | | 61,876 | |
Other expenses | | | 3,037 | | | | 4,237 | | | | 4,520 | |
Total expenses before custodian fee credit and expense reimbursement | | | 270,974 | | | | 543,442 | | | | 570,349 | |
Custodian fee credit | | | (52 | ) | | | (227 | ) | | | (1,362 | ) |
Expense reimbursement | | | (171,357 | ) | | | (256,615 | ) | | | (195,929 | ) |
Net expenses | | | 99,565 | | | | 286,600 | | | | 373,058 | |
Net investment income | | | 264,049 | | | | 1,355,811 | | | | 2,015,879 | |
Realized and Unrealized Gain (Loss) | | | | | | | | | | | | |
Net realized gain (loss) from: | | | | | | | | | | | | |
Affiliated investments | | | (345,789 | ) | | | (1,074,256 | ) | | | (1,720,126 | ) |
Non-affiliated investments | | | (1,953,634 | ) | | | (3,028,307 | ) | | | (3,063,903 | ) |
Distributions from affiliated investment company shares | | | 91,675 | | | | 311,003 | | | | 280,840 | |
Total net realized gain (loss) | | | (2,207,748 | ) | | | (3,791,560 | ) | | | (4,503,189 | ) |
Change in net unrealized appreciation (depreciation) of: | | | | | | | | | | | | |
Affiliated investments | | | (1,005,046 | ) | | | (2,847,526 | ) | | | (2,230,942 | ) |
Non-affiliated investments | | | 26,815 | | | | (1,268,050 | ) | | | (755,129 | ) |
Total change in net unrealized appreciation (depreciation) | | | (978,231 | ) | | | (4,115,576 | ) | | | (2,986,071 | ) |
Net realized and unrealized gain (loss) | | | (3,185,979 | ) | | | (7,907,136 | ) | | | (7,489,260 | ) |
Net increase (decrease) in net assets from operations | | $ | (2,921,930 | ) | | $ | (6,551,325 | ) | | $ | (5,473,381 | ) |
(1) Prior to August 1, 2008, the Fund was known as Nuveen Global Value Fund.
(2) Prior to August 1, 2008, the Fund was known as Nuveen Balanced Stock and Bond Fund.
(3) Prior to July 7, 2008, the Fund was known as Nuveen Balanced Municipal and Stock Fund.
See accompanying notes to financial statements.
Statement of Changes in Net Assets
| | | | | | | | |
| | | Growth Allocation (1) | |
| | | Year Ended
6/30/09 | | | Year Ended
6/30/08 | |
Operations | | | | | | | | |
Net investment income | | $ | 264,049 | | | $ | 7,170 | |
Total net realized gain (loss) | | | (2,207,748 | ) | | | 972,580 | |
Total change in net unrealized appreciation (depreciation) | | | (978,231 | ) | | | (2,939,119 | ) |
Net increase (decrease) in net assets from operations | | | (2,921,930 | ) | | | (1,959,369 | ) |
Distributions to Shareholders | | | | | | | | |
From net investment income: | | | | | | | | |
Class A | | | (6,103 | ) | | | (45,537 | ) |
Class B | | | — | | | | (488 | ) |
Class C | | | — | | | | (5,220 | ) |
Class R3 | | | (9 | ) | | | N/A | |
Class I (4) | | | (20,152 | ) | | | (53,512 | ) |
From accumulated net realized gains: | | | | | | | | |
Class A | | | (115,060 | ) | | | (269,734 | ) |
Class B | | | (26,345 | ) | | | (39,043 | ) |
Class C | | | (245,868 | ) | | | (421,581 | ) |
Class R3 | | | (7,527 | ) | | | N/A | |
Class I (4) | | | (199,754 | ) | | | (238,207 | ) |
Decrease in net assets from distributions to shareholders | | | (620,818 | ) | | | (1,073,322 | ) |
Fund Share Transactions | | | | | | | | |
Proceeds from sale of shares | | | 1,315,813 | | | | 2,945,414 | |
Proceeds from shares issued to shareholders due to reinvestment of
distributions | | | 387,345 | | | | 690,894 | |
| | | 1,703,158 | | | | 3,636,308 | |
Cost of shares redeemed | | | (4,019,656 | ) | | | (7,385,461 | ) |
Net increase (decrease) in net assets from Fund share transactions | | | (2,316,498 | ) | | | (3,749,153 | ) |
Net increase (decrease) in net assets | | | (5,859,246 | ) | | | (6,781,844 | ) |
Net assets at the beginning of year | | | 14,497,432 | | | | 21,279,276 | |
Net assets at the end of year | | $ | 8,638,186 | | | $ | 14,497,432 | |
Undistributed (Over-distribution of) net investment income at the
end of year | | $ | 205,950 | | | $ | (24,960 | ) |
| | | | | | | | | | | | | | | | |
| | | Moderate Allocation (2) | | | Conservative Allocation (3) | |
| | | Year Ended
6/30/09 | | | Year Ended
6/30/08 | | | Year Ended
6/30/09 | | | Year Ended
6/30/08 | |
Operations | | | | | | | | | | | | | | | | |
Net investment income | | $ | 1,355,811 | | | $ | 1,135,708 | | | $ | 2,015,879 | | | $ | 1,812,071 | |
Total net realized gain (loss) | | | (3,791,560 | ) | | | 2,148,936 | | | | (4,503,189 | ) | | | 2,127,878 | |
Total change in net unrealized appreciation (depreciation) | | | (4,115,576 | ) | | | (6,894,384 | ) | | | (2,986,071 | ) | | | (8,520,958 | ) |
Net increase (decrease) in net assets from operations | | | (6,551,325 | ) | | | (3,609,740 | ) | | | (5,473,381 | ) | | | (4,581,009 | ) |
Distributions to Shareholders | | | | | | | | | | | | | | | | |
From net investment income: | | | | | | | | | | | | | | | | |
Class A | | | (416,933 | ) | | | (735,128 | ) | | | (698,165 | ) | | | (1,587,051 | ) |
Class B | | | (38,487 | ) | | | (88,440 | ) | | | (25,577 | ) | | | (69,672 | ) |
Class C | | | (53,396 | ) | | | (119,994 | ) | | | (66,243 | ) | | | (133,017 | ) |
Class R3 | | | (2,011 | ) | | | N/A | | | | (1,799 | ) | | | N/A | |
Class I (4) | | | (164,574 | ) | | | (267,654 | ) | | | (11,104 | ) | | | (46,479 | ) |
From accumulated net realized gains: | | | | | | | | | | | | | | | | |
Class A | | | (543,190 | ) | | | (2,893,413 | ) | | | (897,527 | ) | | | (1,673,617 | ) |
Class B | | | (89,182 | ) | | | (506,849 | ) | | | (57,601 | ) | | | (125,373 | ) |
Class C | | | (123,859 | ) | | | (713,526 | ) | | | (152,912 | ) | | | (244,548 | ) |
Class R3 | | | (3,117 | ) | | | N/A | | | | (3,253 | ) | | | N/A | |
Class I (4) | | | (187,599 | ) | | | (925,907 | ) | | | (13,800 | ) | | | (42,817 | ) |
Decrease in net assets from distributions to shareholders | | | (1,622,348 | ) | | | (6,250,911 | ) | | | (1,927,981 | ) | | | (3,922,574 | ) |
Fund Share Transactions | | | | | | | | | | | | | | | | |
Proceeds from sale of shares | | | 3,611,691 | | | | 9,934,186 | | | | 4,028,251 | | | | 5,775,698 | |
Proceeds from shares issued to shareholders due to reinvestment of distributions | | | 1,247,934 | | | | 4,812,675 | | | | 1,411,246 | | | | 3,132,749 | |
| | | 4,859,625 | | | | 14,746,861 | | | | 5,439,497 | | | | 8,908,447 | |
Cost of shares redeemed | | | (13,423,543 | ) | | | (11,090,975 | ) | | | (19,625,123 | ) | | | (12,966,895 | ) |
Net increase (decrease) in net assets from Fund share transactions | | | (8,563,918 | ) | | | 3,655,886 | | | | (14,185,626 | ) | | | (4,058,448 | ) |
Net increase (decrease) in net assets | | | (16,737,591 | ) | | | (6,204,765 | ) | | | (21,586,988 | ) | | | (12,562,031 | ) |
Net assets at the beginning of year | | | 52,074,996 | | | | 58,279,761 | | | | 65,818,503 | | | | 78,380,534 | |
Net assets at the end of year | | $ | 35,337,405 | | | $ | 52,074,996 | | | $ | 44,231,515 | | | $ | 65,818,503 | |
Undistributed (Over-distribution of) net investment income at the
end of year | | $ | 696,819 | | | $ | (297,012 | ) | | $ | 1,585,855 | | | $ | 373,852 | |
(1) Prior to August 1, 2008, the Fund was known as Nuveen Global Value Fund.
(2) Prior to August 1, 2008, the Fund was known as Nuveen Balanced Stock and Bond Fund.
(3) Prior to July 7, 2008, the Fund was known as Nuveen Balanced Municipal and Stock Fund.
(4) Effective May 1, 2008, Class R Shares were renamed Class I Shares.
N/A The Fund did not offer Class R3 Shares prior to August 4, 2008.
See accompanying notes to financial statements.
Notes to Financial Statements
1. General Information and Significant Accounting Policies
The Nuveen Investment Trust (the “Trust”) is an open-end management investment company registered under the Investment Company Act of 1940, as amended. The Trust is comprised of Nuveen Growth Allocation Fund (“Growth Allocation”), (formerly, Nuveen Global Value Fund), Nuveen Moderate Allocation Fund (“Moderate Allocation”) (formerly, Nuveen Balanced Stock and Bond Fund) and Nuveen Conservative Allocation Fund (“Conservative Allocation”) (formerly, Nuveen Balanced Municipal and Stock Fund) (collectively, the “Funds”), among others. The Trust was organized as a Massachusetts business trust in 1996.
As previously approved by each Fund’s Board of Trustees and shareholders, each Fund changed its name, investment strategy and sub-adviser effective August 1, 2008, for Growth Allocation and Moderate Allocation and effective July 7, 2008, for Conservative Allocation. Each Fund now operates as a “fund of funds” investing substantially all of its assets in other Nuveen mutual funds and non-affiliated exchange-traded funds (collectively, the “Underlying Funds”). The Underlying Funds, in turn, invest in a variety of U.S. and non-U.S. equity and fixed income securities. Each Fund has a strategic allocation between equity and fixed income investments that correlate with each Fund’s targeted level of investment risk. Nuveen Asset Management (the “Adviser”), a wholly-owned subsidiary of Nuveen Investments, Inc. (“Nuveen”) has selected Nuveen Investment Solutions, Inc. (“NIS”) (formerly, Richards & Tierney, Inc.), also a wholly-owned subsidiary of Nuveen, to serve as sub-adviser to the Funds and will adjust each Fund’s allocations from time to time consistent with their respective investment risk targets. These changes were designed to improve the risk/return profile of the Funds by (a) diversifying the investments across a broader number of asset classes and (b) diversifying the investments across the multiple investment managers which advise the Underlying Funds.
Growth Allocation invests principally in shares of other registered investment companies, including open-end mutual funds and exchange-traded funds, in an attempt to provide attractive long-term total return with a growth risk profile. Prior to August 1, 2008, the Fund invested at least 80% of its net assets in equity securities of U.S. and non-U.S. companies, including up to 10% in equity securities of non-U.S. companies domiciled in emerging markets, in an attempt to provide long-term capital appreciation.
Moderate Allocation invests principally in shares of other registered investment companies, including open-end mutual funds and exchange-traded funds, in an attempt to provide attractive long-term total return with a moderate risk profile. Prior to August 1, 2008, the Fund invested in a mix of equity securities, taxable bonds and cash equivalents in an attempt to provide capital growth, capital preservation and current income.
Conservative Allocation invests principally in shares of other registered investment companies, including open-end mutual funds and exchange-traded funds, in an attempt to provide attractive long-term total return with a conservative risk profile. Prior to July 7, 2008, the Fund invested in a mix of equity and tax-exempt securities in an attempt to provide capital growth, capital preservation and current tax-exempt income.
Effective May 1, 2008, Class B Shares will only be issued upon the exchange of Class B Shares from another Nuveen fund or for purposes of dividend reinvestment. The reinstatement privilege for Class B Shares is no longer available as of December 31, 2008.
On August 4, 2008, each Fund began offering Class R3 Shares to certain retirement plans.
The following is a summary of significant accounting policies followed by the Funds in the preparation of their financial statements in accordance with accounting principles generally accepted in the United States.
Investment Valuation
Investments in the Underlying Funds within each Fund’s investment portfolio are valued at their respective net asset value as reported by the Underlying Funds. Short-term investments are valued at amortized cost, which approximates value.
Investment Transactions
Investment transactions are recorded on a trade date basis. Realized gains and losses from investment transactions are determined on the specific identification method.
Investment Income
Dividend income and realized gain distributions from Underlying Funds are recorded on the ex-dividend date or, for foreign securities, when information is available. Interest income, which includes the amortization of premiums and accretion of discounts for financial reporting purposes, is recorded on an accrual basis.
Income Taxes
Each Fund is a separate taxpayer for federal income tax purposes. Each Fund intends to distribute substantially all of its net investment income and net capital gains to shareholders and to otherwise comply with the requirements of Subchapter M of the Internal Revenue Code applicable to regulated investment companies. Therefore, no federal income tax provision is required.
For all open tax years and all major taxing jurisdictions, management of the Funds has concluded that there are no significant uncertain tax positions that would require recognition in the financial statements. Open tax years are those that are open for examination by taxing authorities (i.e., generally the last four tax year ends and the interim tax period since then). Furthermore management of the Funds is also not aware of any tax positions for which it is reasonably possible that the total amounts of unrecognized tax benefits will significantly change in the next twelve months.
Dividends and Distributions to Shareholders
The Funds intend to pay income dividends and taxable gains, if any, annually. Prior to their changes in investment strategies, taxable net investment income was declared and distributed to shareholders annually for Growth Allocation and Conservative Allocation, and quarterly for Moderate Allocation. Tax-exempt net investment income was declared as a dividend monthly for Conservative Allocation. Net realized capital gains from investment transactions, if any, were declared and distributed to shareholders at least annually. Capital gains are distributed only to the extent they exceed available capital loss carryforwards.
Distributions to shareholders are recorded on the ex-dividend date. The amount and timing of distributions are determined in accordance with federal income tax regulations, which may differ from accounting principles generally accepted in the United States.
Flexible Sales Charge Program
Class A Shares are generally sold with an up-front sales charge and incur a .25% annual 12b-1 service fee. Class A Share purchases of $1 million or more are sold at net asset value without an up-front sales charge but may be subject to a contingent deferred sales charge (“CDSC”) if redeemed within twelve months of purchase. Class B Shares are sold without an up-front sales charge but incur a .75% annual 12b-1 distribution fee and a .25% annual 12b-1 service fee. Class B Shares are subject to a CDSC of up to 5% depending upon the length of time the shares are held by the investor (CDSC is reduced to 0% at the end of six years). Class B Shares convert to Class A Shares eight years after purchase. Class C Shares are sold without an up-front sales charge but incur a .75% annual 12b-1 distribution fee and a .25% annual 12b-1 service fee. Class C Shares are subject to a CDSC of 1% if redeemed within one year of purchase. Class R3 Shares are sold without an up-front sales charge but incur a .50% annual 12b-1 distribution and service fee. Class I Shares are not subject to any sales charge or 12b-1 distribution or service fees.
Repurchase Agreements
In connection with transactions in repurchase agreements, it is each Fund’s policy that its custodian take possession of the underlying collateral securities, the fair value of which exceeds the principal amount of the repurchase transaction, including accrued interest, at all times. If the seller defaults, and the fair value of the collateral declines, realization of the collateral may be delayed or limited.
Expense Allocation
Expenses of the Funds that are not directly attributable to a specific class of shares are prorated among the classes based on the relative net assets of each class. Expenses directly attributable to a class of shares, which presently only include 12b-1 distribution and service fees, are recorded to the specific class.
Custodian Fee Credit
Each Fund has an arrangement with the custodian bank whereby certain custodian fees and expenses are reduced by net credits earned on each Fund’s cash on deposit with the bank. Such deposit arrangements are an alternative to overnight investments. Credits for cash balances may be offset by charges for any days on which a Fund overdraws its account at the custodian bank.
Indemnifications
Under the Trust’s organizational documents, its Officers and Trustees are indemnified against certain liabilities arising out of the performance of their duties to the Trust. In addition, in the normal course of business, the Trust enters into contracts that provide general indemnifications to other parties. The Trust’s maximum exposure under these arrangements is unknown as this would involve future claims that may be made against the Trust that have not yet occurred. However, the Trust has not had prior claims or losses pursuant to these contracts and expects the risk of loss to be remote.
Use of Estimates
The preparation of financial statements in conformity with accounting principles generally accepted in the United States requires management to make estimates and assumptions that affect the reported amounts of assets and liabilities at the date of the financial statements and the reported amounts of increases and decreases in net assets from operations during the reporting period. Actual results may differ from those estimates.
2. Fair Value Measurements
During the current fiscal period, the Funds adopted the provisions of Statement of Financial Accounting Standards No. 157 (SFAS No. 157) “Fair Value Measurements.” SFAS No. 157 defines fair value, establishes a framework for measuring fair value in generally accepted accounting principles and expands disclosure about fair value measurements. In determining the value of each Fund’s investments various inputs are used. These inputs are summarized in the three broad levels listed below:
| | |
| Level 1 – | | Quoted prices in active markets for identical securities. |
| Level 2 – | | Other significant observable inputs (including quoted prices for similar securities, interest rates, prepayment speeds, credit risk, etc.). |
| Level 3 – | | Significant unobservable inputs (including management’s assumptions in determining the fair value of investments). |
Notes to Financial Statements (continued)
The inputs or methodology used for valuing securities are not an indication of the risk associated with investing in those securities.
The following is a summary of each Fund’s fair value measurements as of June 30, 2009:
| | | | | | | | | | | | |
| Growth Allocation | | Level 1 | | Level 2 | | Level 3 | | Total |
Investments: | | | | | | | | | | | | |
Equity Funds | | $ | 5,336,592 | | $ | 595,443 | | $ | — | | $ | 5,932,035 |
Fixed Income Funds | | | 2,356,876 | | | — | | | — | | | 2,356,876 |
Short-Term Investments | | | 341,449 | | | — | | | — | | | 341,449 |
Total | | $ | 8,034,917 | | $ | 595,443 | | $ | — | | $ | 8,630,360 |
| Moderate Allocation | | Level 1 | | Level 2 | | Level 3 | | Total |
Investments: | | | | | | | | | | | | |
Equity Funds | | $ | 18,027,123 | | $ | 2,261,881 | | $ | — | | $ | 20,289,004 |
Fixed Income Funds | | | 13,916,732 | | | — | | | — | | | 13,916,732 |
Short-Term Investments | | | 1,109,997 | | | — | | | — | | | 1,109,997 |
Total | | $ | 33,053,852 | | $ | 2,261,881 | | $ | — | | $ | 35,315,733 |
| Conservative Allocation | | Level 1 | | Level 2 | | Level 3 | | Total |
Investments: | | | | | | | | | | | | |
Equity Funds | | $ | 14,828,847 | | $ | 1,865,779 | | $ | — | | $ | 16,694,626 |
Fixed Income Funds | | | 26,532,606 | | | — | | | — | | | 26,532,606 |
Short-Term Investments | | | 981,890 | | | — | | | — | | | 981,890 |
Total | | $ | 42,343,343 | | $ | 1,865,779 | | $ | — | | $ | 44,209,122 |
3. Fund Shares
Transactions in Fund shares were as follows:
| | | | | | | | | | | | | | |
| | | Growth Allocation | |
| | | Year Ended
6/30/09 | | | Year Ended
6/30/08 | |
| | | Shares | | | Amount | | | Shares | | | Amount | |
Shares sold: | | | | | | | | | | | | | | |
Class A | | 22,684 | | | $ | 381,631 | | | 29,903 | | | $ | 782,276 | |
Class A – automatic conversion of Class B Shares | | 2,327 | | | | 52,210 | | | 1,343 | | | | 33,180 | |
Class B | | 1,035 | | | | 18,994 | | | 4,041 | | | | 105,777 | |
Class C | | 23,026 | | | | 376,709 | | | 40,305 | | | | 1,054,689 | |
Class R3 | | 6,619 | | | | 149,998 | | | N/A | | | | N/A | |
Class I | | 18,761 | | | | 336,271 | | | 37,643 | | | | 969,492 | |
Shares issued to shareholders due to reinvestment of distributions: | | | | | | | | | | | | | | |
Class A | | 6,667 | | | | 100,070 | | | 10,235 | | | | 256,492 | |
Class B | | 1,542 | | | | 22,743 | | | 1,390 | | | | 34,237 | |
Class C | | 11,463 | | | | 169,194 | | | 10,980 | | | | 270,641 | |
Class R3 | | — | | | | — | | | N/A | | | | N/A | |
Class I | | 6,314 | | | | 95,338 | | | 5,146 | | | | 129,524 | |
| | | 100,438 | | | | 1,703,158 | | | 140,986 | | | | 3,636,308 | |
Shares redeemed: | | | | | | | | | | | | | | |
Class A | | (68,059 | ) | | | (1,241,023 | ) | | (144,334 | ) | | | (3,676,826 | ) |
Class B | | (2,995 | ) | | | (54,166 | ) | | (3,743 | ) | | | (90,081 | ) |
Class B – automatic conversion to Class A Shares | | (2,353 | ) | | | (52,210 | ) | | (1,327 | ) | | | (33,180 | ) |
Class C | | (99,980 | ) | | | (1,749,840 | ) | | (111,495 | ) | | | (2,775,694 | ) |
Class R3 | | — | | | | — | | | N/A | | | | N/A | |
Class I | | (53,072 | ) | | | (922,417 | ) | | (31,554 | ) | | | (809,680 | ) |
| | | (226,459 | ) | | | (4,019,656 | ) | | (292,453 | ) | | | (7,385,461 | ) |
Net increase (decrease) | | (126,021 | ) | | $ | (2,316,498 | ) | | (151,467 | ) | | $ | (3,749,153 | ) |
N/A – The Fund did not offer Class R3 Shares prior to August 4, 2008.
| | | | | | | | | | | | | | |
| | | Moderate Allocation | |
| | | Year Ended
6/30/09 | | | Year Ended
6/30/08 | |
| | | Shares | | | Amount | | | Shares | | | Amount | |
Shares sold: | | | | | | | | | | | | | | |
Class A | | 102,436 | | | $ | 1,834,279 | | | 177,010 | | | $ | 4,491,373 | |
Class A – automatic conversion of Class B Shares | | 29,602 | | | | 582,726 | | | 19,334 | | | | 487,364 | |
Class B | | 13,050 | | | | 243,195 | | | 68,381 | | | | 1,663,900 | |
Class C | | 19,715 | | | | 372,822 | | | 92,418 | | | | 2,334,301 | |
Class R3 | | 6,757 | | | | 150,000 | | | N/A | | | | N/A | |
Class I | | 23,941 | | | | 428,669 | | | 38,368 | | | | 957,248 | |
Shares issued to shareholders due to reinvestment of distributions: | | | | | | | | | | | | | | |
Class A | | 44,517 | | | | 738,267 | | | 114,850 | | | | 2,811,167 | |
Class B | | 5,358 | | | | 88,276 | | | 17,167 | | | | 418,881 | |
Class C | | 4,762 | | | | 78,400 | | | 14,244 | | | | 347,605 | |
Class R3 | | — | | | | — | | | N/A | | | | N/A | |
Class I | | 20,652 | | | | 342,991 | | | 50,417 | | | | 1,235,022 | |
| | | 270,790 | | | | 4,859,625 | | | 592,189 | | | | 14,746,861 | |
Shares redeemed: | | | | | | | | | | | | | | |
Class A | | (383,365 | ) | | | (6,991,944 | ) | | (239,949 | ) | | | (6,071,920 | ) |
Class B | | (75,050 | ) | | | (1,375,894 | ) | | (57,044 | ) | | | (1,424,732 | ) |
Class B – automatic conversion to Class A Shares | | (29,582 | ) | | | (582,726 | ) | | (19,354 | ) | | | (487,364 | ) |
Class C | | (101,891 | ) | | | (1,868,363 | ) | | (69,510 | ) | | | (1,717,368 | ) |
Class R3 | | — | | | | — | | | N/A | | | | N/A | |
Class I | | (141,726 | ) | | | (2,604,616 | ) | | (56,308 | ) | | | (1,389,591 | ) |
| | | (731,614 | ) | | | (13,423,543 | ) | | (442,165 | ) | | | (11,090,975 | ) |
Net increase (decrease) | | (460,824 | ) | | $ | (8,563,918 | ) | | 150,024 | | | $ | 3,655,886 | |
| |
| | | Conservative Allocation | |
| | | Year Ended
6/30/09 | | | Year Ended
6/30/08 | |
| | | Shares | | | Amount | | | Shares | | | Amount | |
Shares sold: | | | | | | | | | | | | | | |
Class A | | 79,504 | | | $ | 1,516,830 | | | 144,034 | | | $ | 3,561,688 | |
Class A – automatic conversion of Class B Shares | | 42,217 | | | | 823,945 | | | 30,256 | | | | 744,559 | |
Class B | | 14,022 | | | | 303,204 | | | 7,118 | | | | 187,254 | |
Class C | | 59,012 | | | | 1,193,915 | | | 44,722 | | | | 1,186,819 | |
Class R3 | | 6,769 | | | | 149,999 | | | N/A | | | | N/A | |
Class I | | 2,168 | | | | 40,358 | | | 4,085 | | | | 95,378 | |
Shares issued to shareholders due to reinvestment of distributions: | | | | | | | | | | | | | | |
Class A | | 65,040 | | | | 1,198,430 | | | 109,684 | | | | 2,703,707 | |
Class B | | 2,454 | | | | 48,167 | | | 4,374 | | | | 114,905 | |
Class C | | 7,544 | | | | 147,431 | | | 10,003 | | | | 261,976 | |
Class R3 | | — | | | | — | | | N/A | | | | N/A | |
Class I | | 960 | | | | 17,218 | | | 2,168 | �� | | | 52,161 | |
| | | 279,690 | | | | 5,439,497 | | | 356,444 | | | | 8,908,447 | |
Shares redeemed: | | | | | | | | | | | | | | |
Class A | | (756,055 | ) | | | (15,105,375 | ) | | (363,913 | ) | | | (8,963,389 | ) |
Class B | | (39,958 | ) | | | (853,943 | ) | | (56,867 | ) | | | (1,503,160 | ) |
Class B – automatic conversion to Class A Shares | | (39,336 | ) | | | (823,945 | ) | | (28,381 | ) | | | (744,559 | ) |
Class C | | (95,838 | ) | | | (1,982,801 | ) | | (61,567 | ) | | | (1,620,340 | ) |
Class R3 | | — | | | | — | | | N/A | | | | N/A | |
Class I | | (40,361 | ) | | | (859,059 | ) | | (5,712 | ) | | | (135,447 | ) |
| | | (971,548 | ) | | | (19,625,123 | ) | | (516,440 | ) | | | (12,966,895 | ) |
Net increase (decrease) | | (691,858 | ) | | $ | (14,185,626 | ) | | (159,996 | ) | | $ | (4,058,448 | ) |
N/A – The Fund did not offer Class R3 Shares prior to August 4, 2008.
Notes to Financial Statements (continued)
4. Investment Transactions
Purchases and sales (including maturities but excluding short-term investments) during the fiscal year ended June 30, 2009, were as follows:
| | | | | | | | | |
| | | Growth
Allocation | | Moderate
Allocation | | Conservative
Allocation |
Purchases: | | | | | | | | | |
Affiliated investments | | $ | 8,984,376 | | $ | 36,725,310 | | $ | 55,024,713 |
Non-affiliated investments | | | 7,570,457 | | | 29,538,741 | | | 24,722,861 |
| | | |
Sales and maturities: | | | | | | | | | |
Affiliated investments | | | 2,400,526 | | | 9,786,928 | | | 18,381,250 |
Non-affiliated investments | | | 16,876,022 | | | 44,062,089 | | | 75,088,906 |
U.S. Government and agency obligations | | | 76,461 | | | 21,179,580 | | | — |
5. Income Tax Information
The following information is presented on an income tax basis. Differences between amounts for financial statement and federal income tax purposes are primarily due to timing differences in recognizing taxable market discount, amortization of premium on taxable debt securities and timing differences in recognizing certain gains and losses on investment transactions. To the extent that differences arise that are permanent in nature, such amounts are reclassified within the capital accounts on the Statement of Assets and Liabilities presented in the annual report, based on their federal tax basis treatment; temporary differences do not require reclassification. Temporary and permanent differences do not impact the net asset values of the Funds.
At June 30, 2009, the cost of investments was as follows:
| | | | | | | | | |
| | | Growth
Allocation | | Moderate
Allocation | | Conservative
Allocation |
Cost of investments | | $ | 10,153,520 | | $ | 39,562,718 | | $ | 47,941,321 |
Gross unrealized appreciation and gross unrealized depreciation of investments at June 30, 2009, were as follows:
| | | | | | | | | | | | |
| | | Growth
Allocation | | | Moderate
Allocation | | | Conservative
Allocation | |
Gross unrealized: | | | | | | | | | | | | |
Appreciation | | $ | 26,126 | | | $ | 570,651 | | | $ | 918,475 | |
Depreciation | | | (1,549,286 | ) | | | (4,817,636 | ) | | | (4,650,674 | ) |
Net unrealized appreciation (depreciation) of investments | | $ | (1,523,160 | ) | | $ | (4,246,985 | ) | | $ | (3,732,199 | ) |
The tax components of undistributed net ordinary income and net long-term capital gains at June 30, 2009, the Funds’ tax year end, were as follows:
| | | | | | | | | |
| | | Growth
Allocation | | Moderate
Allocation | | Conservative
Allocation |
Undistributed net ordinary income* | | $ | 205,950 | | $ | 696,816 | | $ | 1,585,858 |
Undistributed net long-term capital gains | | | — | | | — | | | — |
| * | Net ordinary income consists of net taxable income derived from dividends, interest and net short-term capital gains, if any. |
The tax character of distributions paid during the Funds’ tax years ended June 30, 2009 and June 30, 2008, was designated for purposes of the dividends paid deduction as follows:
| | | | | | | | | |
| 2009 | | Growth
Allocation | | Moderate
Allocation | | Conservative
Allocation |
Distributions from net tax-exempt income** | | $ | — | | $ | — | | $ | 218,845 |
Distributions from net ordinary income* | | | 194,562 | | | 990,267 | | | 700,213 |
Distributions from net long-term capital gains*** | | | 426,256 | | | 946,947 | | | 1,126,739 |
| | | | | | | | | |
| 2008 | | Growth
Allocation | | Moderate
Allocation | | Conservative
Allocation |
Distributions from net tax-exempt income | | $ | — | | $ | — | | $ | 1,424,542 |
Distributions from net ordinary income* | | | 688,341 | | | 2,326,899 | | | 617,045 |
Distributions from net long-term capital gains | | | 384,981 | | | 3,967,128 | | | 1,879,234 |
| * | Net ordinary income consists of net taxable income derived from dividends, interest, market discount accretion and net short-term capital gains, if any. |
| ** | The Funds hereby designate these amounts paid during the fiscal year ended June 30, 2009, as Exempt Interest Dividends. |
| *** | The Funds designated as a long-term capital gain dividend, pursuant to the Internal Revenue Code Section 852(b)(3), the amount necessary to reduce earnings and profits of the Funds related to net capital gain to zero for the tax year ended June 30, 2009. |
At June 30, 2009, the Funds’ tax year end, the Funds’ had unused capital loss carryforwards available for federal income tax purposes to be applied against future capital gains, if any. If not applied, the carryforwards will expire as follows:
| | | | | | | | | |
| | | Growth
Allocation | | Moderate
Allocation | | Conservative
Allocation |
Expiration: | | | | | | | | | |
June 30, 2017 | | $ | 993,554 | | $ | 165,573 | | $ | 1,329,027 |
The Funds have elected to defer net realized losses from investments incurred from November 1, 2008 through June 30, 2009, the Funds’ tax year end, (“post-October losses”) in accordance with federal income tax regulations. Post-October losses are treated as having arisen on the first day of the following fiscal year:
| | | | | | | | | |
| | | Growth
Allocation | | Moderate
Allocation | | Conservative
Allocation |
Post-October capital losses | | $ | 1,095,975 | | $ | 3,144,326 | | $ | 3,233,346 |
6. Management Fees and Other Transactions with Affiliates
Effective August 1, 2008, for Growth Allocation and Moderate Allocation and July 7, 2008, for Conservative Allocation, each Fund adopted a revised fund of funds management fee schedule. The new management fee for each Fund, payable monthly, is .15% of the average daily net assets of each Fund.
Prior to August 1, 2008, for Growth Allocation and Moderate Allocation and July 7, 2008, for Conservative Allocation each Fund’s management fee was separated into two components – a complex-level component, based on the aggregate amount of all fund assets managed by the Adviser, and a specific fund-level component, based only on the amount of assets within each individual Fund. This pricing structure enables Nuveen fund shareholders to benefit from growth in the assets within each individual fund as well as from growth in the amount of complex-wide assets managed by the Adviser.
Prior to August 1, 2008, for Growth Allocation and Moderate Allocation and July 7, 2008, for Conservative Allocation the annual fund-level fee, which was payable monthly, for each Fund was based upon the average daily net assets of each Fund as follows:
| | | | | | | | | |
| Average Daily Net Assets (1) | | Growth
Allocation | | | Moderate
Allocation | | | Conservative
Allocation | |
For the first $125 million | | .8000 | % | | .5500 | % | | .5500 | % |
For the next $125 million | | .7875 | | | .5375 | | | .5375 | |
For the next $250 million | | .7750 | | | .5250 | | | .5250 | |
For the next $500 million | | .7625 | | | .5125 | | | .5125 | |
For the next $1 billion | | .7500 | | | .5000 | | | .5000 | |
For net assets over $2 billion | | .7250 | | | .4750 | | | .4750 | |
Notes to Financial Statements (continued)
The annual complex-level fee, which was payable monthly, which was additive to the fund-level fee, for all Nuveen sponsored funds in the U.S., was based on the aggregate amount of total fund net assets managed as stated in the following table.
| | | |
| Complex-Level Net Asset Breakpoint Level (1) | | Effective Rate at Breakpoint Level | |
$55 billion | | .2000 | % |
$56 billion | | .1996 | |
$57 billion | | .1989 | |
$60 billion | | .1961 | |
$63 billion | | .1931 | |
$66 billion | | .1900 | |
$71 billion | | .1851 | |
$76 billion | | .1806 | |
$80 billion | | .1773 | |
$91 billion | | .1691 | |
$125 billion | | .1599 | |
$200 billion | | .1505 | |
$250 billion | | .1469 | |
$300 billion | | .1445 | |
| (1) | The complex-level fee component of the management fee for the funds is calculated based upon the aggregate daily managed net assets of all Nuveen funds, with such daily managed net assets defined separately for each fund in its management agreement, but excluding assets attributable to investments in other Nuveen funds. |
The management fee compensates the Adviser for overall investment advisory and administrative services and general office facilities. Effective August 1, 2008, for Growth Allocation and Moderate Allocation and July 7, 2008, for Conservative Allocation, the Adviser selected NIS to serve as sub-adviser to the Funds. Prior to August 1, 2008, for Growth Allocation, NWQ Investment Management Company, LLC (“NWQ”), a subsidiary of Nuveen, served as the sub-adviser for the domestic equity portion of the Fund’s investment portfolio and Tradewinds Global Investors, LLC (“Tradewinds”), a subsidiary of Nuveen, served as the sub-adviser for the international portion of the Fund’s investment portfolio. Prior to August 1, 2008, for Moderate Allocation, Institutional Capital LLC (“ICAP”) served as the Fund’s sub-adviser. Prior to July 7, 2008, for Conservative Allocation, ICAP served as the sub-adviser for the equity portion of the Fund’s investment portfolio while the Adviser managed the municipal portion of the Fund’s investment portfolio. Each sub-adviser is/was compensated for their services to the Funds from the management fee paid to the Adviser.
Effective August 1, 2008, for Growth Allocation and Moderate Allocation and July 7, 2008, for Conservative Allocation, the Adviser agreed to waive fees and reimburse expenses through October 31, 2011, so that total annual fund operating expenses (excluding 12b-1 distribution and service fees, interest expenses, taxes, fees incurred in the acquiring and disposing of portfolio securities, Underlying Fund fees and expenses and extraordinary expenses) do not exceed .40%, .29% and .37% of the average daily net assets of any class of shares, respectively. Prior to August 1, 2008, for Growth Allocation and Moderate Allocation and July 7, 2008, for Conservative Allocation, the Adviser agreed to waive fees and reimburse expenses so that total annual operating expenses (excluding 12b-1 distribution and service fees, interest expenses, taxes, fees incurred in the acquiring and disposing of portfolio securities, and extraordinary expenses) did not exceed 1.45%, 1.00% and 1.00% of the average daily net assets of any class of shares, respectively.
The Adviser may also voluntarily reimburse additional expenses from time to time in any of the Funds. Voluntary reimbursements may be terminated at any time at the Adviser’s discretion.
The Trust pays no compensation directly to those of its Trustees who are affiliated with the Adviser or to its Officers, all of whom receive remuneration for their services to the Trust from the Adviser or its affiliates. The Board of Trustees has adopted a deferred compensation plan for independent Trustees that enables Trustees to elect to defer receipt of all or a portion of the annual compensation they are entitled to receive from certain Nuveen advised funds. Under the plan, deferred amounts are treated as though equal dollar amounts had been invested in shares of select Nuveen advised funds.
During the fiscal year ended June 30, 2009, Nuveen Investments, LLC (the “Distributor”), a wholly owned subsidiary of Nuveen, collected sales charges on purchases of Class A Shares, the majority of which were paid out as concessions to financial intermediaries as follows:
| | | | | | | | | |
| | | Growth
Allocation | | Moderate
Allocation | | Conservative
Allocation |
Sales charges collected (Unaudited) | | $ | 4,437 | | $ | 18,428 | | $ | 19,193 |
Paid to financial intermediaries (Unaudited) | | | 3,948 | | | 16,439 | | | 16,693 |
The Distributor also received 12b-1 service fees on Class A Shares, substantially all of which were paid to compensate financial intermediaries for providing services to shareholders relating to their investments.
During the fiscal year ended June 30, 2009, the Distributor compensated financial intermediaries directly with commission advances at the time of purchase as follows:
| | | | | | | | | |
| | | Growth
Allocation | | Moderate
Allocation | | Conservative
Allocation |
Commission advances (Unaudited) | | $ | 1,334 | | $ | 4,793 | | $ | 3,377 |
To compensate for commissions advanced to financial intermediaries, all 12b-1 service fees collected on Class B Shares during the first year following a purchase, all 12b-1 distribution fees collected on Class B Shares, and all 12b-1 service and distribution fees collected on Class C Shares during the first year following a purchase are retained by the Distributor. During the fiscal year ended June 30, 2009, the Distributor retained such 12b-1 fees as follows:
| | | | | | | | | |
| | | Growth
Allocation | | Moderate
Allocation | | Conservative
Allocation |
12b-1 fees retained (Unaudited) | | $ | 7,866 | | $ | 34,754 | | $ | 28,672 |
The remaining 12b-1 fees charged to the Funds were paid to compensate financial intermediaries for providing services to shareholders relating to their investments.
The Distributor also collected and retained CDSC on share redemptions during the fiscal year ended June 30, 2009, as follows:
| | | | | | | | | |
| | | Growth
Allocation | | Moderate
Allocation | | Conservative
Allocation |
CDSC retained (Unaudited) | | $ | 1,833 | | $ | 12,049 | | $ | 6,342 |
7. Subsequent Events
In May 2009, the Financial Accounting Standards Board issued Statement of Financial Accounting Standards No. 165 (SFAS No. 165) “Subsequent Events.” SFAS No. 165 requires an entity to recognize in the financial statements the effects of all subsequent events that provide additional evidence about conditions that existed at the date of the balance sheet. SFAS No. 165 is intended to establish general standards of accounting and for disclosure of events that occur after the balance sheet date but before financial statements are issued or are available to be issued. SFAS No. 165 requires the disclosure of the date through which an entity has evaluated subsequent events and the basis for that date – that is, whether that date represents the date the financial statements were issued or were available to be issued. SFAS No. 165 is effective for interim and annual periods ending after June 15, 2009. The Funds have performed an evaluation of subsequent events through August 24, 2009, which is the date the financial statements were issued.
Financial Highlights
| | | | | | | | | | | | | | | | | | | | | | | | | | | | | | | | | |
| Selected data for a share outstanding throughout each period: | |
| | | | | | | |
| Class (Commencement Date) | | | | | | | | | | | | | | | | | | | | | |
| | | | | Investment Operations | | | Less Distributions | | | | |
| | | | | | | |
| GROWTH ALLOCATION | | | | | | | | | | | | | | | | | | | | | |
Year Ended
June 30, | | Beginning
Net
Asset
Value | | Net
Invest-
ment
Income (Loss)(a) | | | Net
Realized/
Unrealized
Gain (Loss) | | | Total | | | Net
Invest-
ment
Income | | | Capital
Gains | | | Total | | | Ending
Net
Asset
Value | | Total
Return(b) | |
Class A (12/04) | | | | | | | | | | | | | | | | | | | | | | | | | | | | | | |
2009 | | $ | 23.58 | | $ | .49 | | | $ | (5.18 | ) | | $ | (4.69 | ) | | $ | (.06 | ) | | $ | (1.14 | ) | | $ | (1.20 | ) | | $ | 17.69 | | (19.00 | )% |
2008 | | | 27.79 | | | .08 | | | | (2.73 | ) | | | (2.65 | ) | | | (.22 | ) | | | (1.34 | ) | | | (1.56 | ) | | | 23.58 | | (9.84 | ) |
2007 | | | 23.95 | | | .17 | | | | 4.48 | | | | 4.65 | | | | (.18 | ) | | | (.63 | ) | | | (.81 | ) | | | 27.79 | | 19.67 | |
2006 | | | 20.71 | | | .27 | | | | 3.20 | | | | 3.47 | | | | (.06 | ) | | | (.17 | ) | | | (.23 | ) | | | 23.95 | | 16.81 | |
2005(f) | | | 20.00 | | | .10 | | | | .61 | | | | .71 | | | | — | | | | — | | | | — | | | | 20.71 | | 3.55 | |
Class B (12/04) | | | | | | | | | | | | | | | | | | | | | | | | | | | | | | |
2009 | | | 23.34 | | | .41 | | | | (5.19 | ) | | | (4.78 | ) | | | — | | | | (1.14 | ) | | | (1.14 | ) | | | 17.42 | | (19.61 | ) |
2008 | | | 27.51 | | | (.11 | ) | | | (2.70 | ) | | | (2.81 | ) | | | (.02 | ) | | | (1.34 | ) | | | (1.36 | ) | | | 23.34 | | (10.49 | ) |
2007 | | | 23.74 | | | (.02 | ) | | | 4.42 | | | | 4.40 | | | | — | | | | (.63 | ) | | | (.63 | ) | | | 27.51 | | 18.73 | |
2006 | | | 20.63 | | | .07 | | | | 3.21 | | | | 3.28 | | | | — | | | | (.17 | ) | | | (.17 | ) | | | 23.74 | | 15.94 | |
2005(f) | | | 20.00 | | | .01 | | | | .62 | | | | .63 | | | | — | | | | — | | | | — | | | | 20.63 | | 3.15 | |
Class C (12/04) | | | | | | | | | | | | | | | | | | | | | | | | | | | | | | |
2009 | | | 23.35 | | | .41 | | | | (5.18 | ) | | | (4.77 | ) | | | — | | | | (1.14 | ) | | | (1.14 | ) | | | 17.44 | | (19.56 | ) |
2008 | | | 27.53 | | | (.11 | ) | | | (2.71 | ) | | | (2.82 | ) | | | (.02 | ) | | | (1.34 | ) | | | (1.36 | ) | | | 23.35 | | (10.52 | ) |
2007 | | | 23.75 | | | (.02 | ) | | | 4.43 | | | | 4.41 | | | | — | | | | (.63 | ) | | | (.63 | ) | | | 27.53 | | 18.76 | |
2006 | | | 20.63 | | | .07 | | | | 3.22 | | | | 3.29 | | | | — | | | | (.17 | ) | | | (.17 | ) | | | 23.75 | | 15.99 | |
2005(f) | | | 20.00 | | | .01 | | | | .62 | | | | .63 | | | | — | | | | — | | | | — | | | | 20.63 | | 3.15 | |
Class R3 (8/08) | | | | | | | | | | | | | | | | | | | | | | | | | | | | | | |
2009(h) | | | 22.66 | | | .53 | | | | (4.29 | ) | | | (3.76 | ) | | | — | ** | | | (1.14 | ) | | | (1.14 | ) | | | 17.76 | | (15.68 | ) |
Class I (12/04)(g) | | | | | | | | | | | | | | | | | | | | | | | | | | | | | | |
2009 | | | 23.63 | | | .61 | | | | (5.27 | ) | | | (4.66 | ) | | | (.11 | ) | | | (1.14 | ) | | | (1.25 | ) | | | 17.72 | | (18.77 | ) |
2008 | | | 27.85 | | | .16 | | | | (2.75 | ) | | | (2.59 | ) | | | (.29 | ) | | | (1.34 | ) | | | (1.63 | ) | | | 23.63 | | (9.62 | ) |
2007 | | | 24.00 | | | .24 | | | | 4.48 | | | | 4.72 | | | | (.24 | ) | | | (.63 | ) | | | (.87 | ) | | | 27.85 | | 19.95 | |
2006 | | | 20.74 | | | .22 | | | | 3.32 | | | | 3.54 | | | | (.11 | ) | | | (.17 | ) | | | (.28 | ) | | | 24.00 | | 17.15 | |
2005(f) | | | 20.00 | | | .13 | | | | .61 | | | | .74 | | | | — | | | | — | | | | — | | | | 20.74 | | 3.70 | |
| | | | | | | | | | | | | | | | | | | | | | |
| | | | | | | | | | | | | | | | | | | | | | |
| | | | | | | |
| | | | | | | | | | | | | | | | | | | | | | |
| Ratios/Supplemental Data | |
| | | Ratios to Average
Net Assets
Before Credit/
Reimbursement | | | Ratios to Average
Net Assets After
Reimbursement(c) | | | Ratios to Average
Net Assets
After Credit/
Reimbursement(d) | | | | |
Ending
Net
Assets
(000) | | Expenses(e) | | | Net
Invest-
ment
Income
(Loss) | | | Expenses(e) | | | Net
Invest-
ment
Income
(Loss) | | | Expenses(e) | | | Net
Invest-
ment
Income
(Loss) | | | Portfolio
Turnover
Rate | |
| | | | | | | | | | | | | | | | | | | | | | |
| $ | 1,922 | | 2.52 | % | | 1.01 | % | | .79 | % | | 2.74 | % | | .79 | % | | 2.74 | % | | 173 | % |
| | 3,420 | | 2.04 | | | (.07 | ) | | 1.69 | | | .28 | | | 1.66 | | | .30 | | | 34 | |
| | 6,888 | | 1.82 | | | .52 | | | 1.68 | | | .66 | | | 1.68 | | | .67 | | | 31 | |
| | 4,128 | | 2.32 | | | .43 | | | 1.69 | | | 1.06 | | | 1.61 | | | 1.14 | | | 21 | |
| | 3 | | 2.87 | * | | (.41 | )* | | 1.72 | * | | .74 | * | | 1.58 | * | | .88 | * | | 6 | |
| | | | | | | | | | | | | | | | | | | | | | |
| | 434 | | 3.35 | | | .52 | | | 1.52 | | | 2.34 | | | 1.52 | | | 2.34 | | | 173 | |
| | 647 | | 2.79 | | | (.79 | ) | | 2.44 | | | (.44 | ) | | 2.42 | | | (.42 | ) | | 34 | |
| | 752 | | 2.54 | | | (.19 | ) | | 2.44 | | | (.09 | ) | | 2.44 | | | (.08 | ) | | 31 | |
| | 298 | | 3.12 | | | (.47 | ) | | 2.44 | | | .21 | | | 2.36 | | | .29 | | | 21 | |
| | 3 | | 3.62 | * | | (1.16 | )* | | 2.47 | * | | (.01 | )* | | 2.33 | * | | .13 | * | | 6 | |
| | | | | | | | | | | | | | | | | | | | | | |
| | 3,364 | | 3.30 | | | .53 | | | 1.53 | | | 2.30 | | | 1.53 | | | 2.30 | | | 173 | |
| | 6,035 | | 2.80 | | | (.81 | ) | | 2.45 | | | (.46 | ) | | 2.42 | | | (.44 | ) | | 34 | |
| | 8,771 | | 2.53 | | | (.17 | ) | | 2.44 | | | (.07 | ) | | 2.43 | | | (.07 | ) | | 31 | |
| | 3,524 | | 3.06 | | | (.39 | ) | | 2.44 | | | .22 | | | 2.36 | | | .31 | | | 21 | |
| | 3 | | 3.62 | * | | (1.16 | )* | | 2.47 | * | | (.01 | )* | | 2.33 | * | | .13 | * | | 6 | |
| | | | | | | | | | | | | | | | | | | | | | |
| | 118 | | 3.01 | * | | 1.29 | * | | .90 | * | | 3.39 | * | | .90 | * | | 3.39 | * | | 173 | |
| | | | | | | | | | | | | | | | | | | | | | |
| | 2,800 | | 2.36 | | | 1.55 | | | .52 | | | 3.39 | | | .52 | | | 3.39 | | | 173 | |
| | 4,396 | | 1.76 | | | .25 | | | 1.41 | | | .60 | | | 1.39 | | | .62 | | | 34 | |
| | 4,868 | | 1.58 | | | .78 | | | 1.43 | | | .93 | | | 1.43 | | | .93 | | | 31 | |
| | 3,261 | | 2.09 | | | .22 | | | 1.44 | | | .88 | | | 1.36 | | | .96 | | | 21 | |
| | 2,066 | | 2.59 | * | | (.13 | )* | | 1.44 | * | | 1.02 | * | | 1.33 | * | | 1.13 | * | | 6 | |
| ** | Rounds to less than $.01 per share. |
| (a) | Per share Net Investment Income (Loss) is calculated using the average daily shares method. |
| (b) | •Total return is the combination of changes in net asset value without any sales charge, reinvested dividend income at net asset value and |
| | reinvested capital gains distributions at net asset value, if any. Total returns are not annualized. |
| | •Total returns for the year ended June 30, 2008 and prior reflect the performance of the Nuveen Global Value Fund. Total return for the year ended |
| | June 30, 2009, includes performance of the Nuveen Global Value Fund for the period July 1, 2008 through July 31, 2008. Returns prior to August 1, 2008, are not indicative of the performance that the Fund, as currently managed, would have generated. |
| (c) | After expense reimbursement from the Adviser, where applicable. |
| (d) | After custodian fee credit and expense reimbursement, where applicable. |
| (e) | The expense ratios for the year ended June 30, 2009, do not reflect the expenses of the Underlying Funds in which the Fund invests. |
| (f) | For the period December 9, 2004 (commencement of operations) through June 30, 2005. |
| (g) | Effective May 1, 2008, Class R Shares were renamed Class I Shares. |
| (h) | For the period August 4, 2008 (commencement of operations) through June 30, 2009. |
See accompanying notes to financial statements.
Financial Highlights (continued)
| | | | | | | | | | | | | | | | | | | | | | | | | | | | | | | | |
| Selected data for a share outstanding throughout each period: | | | | | | | | | |
| | | | | | | |
| Class (Commencement Date) | | | | | | | | | | | | | | | | | | | | |
| | | | | Investment Operations | | | Less Distributions | | | | |
| | | | | | | |
| MODERATE ALLOCATION | | | | | | | | | | | | | | | | | | | | |
Year Ended
June 30, | | Beginning
Net
Asset
Value | | Net
Invest-
ment
Income(a) | | Net
Realized/
Unrealized
Gain
(Loss) | | | Total | | | Net
Invest-
ment
Income | | | Capital
Gains | | | Total | | | Ending
Net
Asset
Value | | Total
Return(b) | |
Class A (8/96) | | | | | | | | | | | | | | | | | | | | | | | | | | | | | |
2009 | | $ | 22.35 | | $ | .67 | | $ | (3.32 | ) | | $ | (2.65 | ) | | $ | (.34 | ) | | $ | (.46 | ) | | $ | (.80 | ) | | $ | 18.90 | | (11.28 | )% |
2008 | | | 26.73 | | | .54 | | | (2.04 | ) | | | (1.50 | ) | | | (.56 | ) | | | (2.32 | ) | | | (2.88 | ) | | | 22.35 | | (6.31 | ) |
2007 | | | 25.40 | | | .58 | | | 2.97 | | | | 3.55 | | | | (.61 | ) | | | (1.61 | ) | | | (2.22 | ) | | | 26.73 | | 14.40 | |
2006 | | | 25.95 | | | .50 | | | 1.41 | | | | 1.91 | | | | (.54 | ) | | | (1.92 | ) | | | (2.46 | ) | | | 25.40 | | 7.60 | ** |
2005 | | | 24.56 | | | .56 | | | 1.47 | | | | 2.03 | | | | (.64 | ) | | | — | | | | (.64 | ) | | | 25.95 | | 8.33 | |
Class B (8/96) | | | | | | | | | | | | | | | | | | | | | | | | | | | | | |
2009 | | | 22.35 | | | .52 | | | (3.30 | ) | | | (2.78 | ) | | | (.20 | ) | | | (.46 | ) | | | (.66 | ) | | | 18.91 | | (11.98 | ) |
2008 | | | 26.73 | | | .35 | | | (2.04 | ) | | | (1.69 | ) | | | (.37 | ) | | | (2.32 | ) | | | (2.69 | ) | | | 22.35 | | (7.02 | ) |
2007 | | | 25.40 | | | .37 | | | 2.98 | | | | 3.35 | | | | (.41 | ) | | | (1.61 | ) | | | (2.02 | ) | | | 26.73 | | 13.55 | |
2006 | | | 25.95 | | | .30 | | | 1.41 | | | | 1.71 | | | | (.34 | ) | | | (1.92 | ) | | | (2.26 | ) | | | 25.40 | | 6.80 | ** |
2005 | | | 24.56 | | | .37 | | | 1.47 | | | | 1.84 | | | | (.45 | ) | | | — | | | | (.45 | ) | | | 25.95 | | 7.53 | |
Class C (8/96) | | | | | | | | | | | | | | | | | | | | | | | | | | | | | |
2009 | | | 22.37 | | | .53 | | | (3.30 | ) | | | (2.77 | ) | | | (.20 | ) | | | (.46 | ) | | | (.66 | ) | | | 18.94 | | (11.93 | ) |
2008 | | | 26.75 | | | .35 | | | (2.04 | ) | | | (1.69 | ) | | | (.37 | ) | | | (2.32 | ) | | | (2.69 | ) | | | 22.37 | | (7.01 | ) |
2007 | | | 25.42 | | | .38 | | | 2.97 | | | | 3.35 | | | | (.41 | ) | | | (1.61 | ) | | | (2.02 | ) | | | 26.75 | | 13.54 | |
2006 | | | 25.97 | | | .30 | | | 1.41 | | | | 1.71 | | | | (.34 | ) | | | (1.92 | ) | | | (2.26 | ) | | | 25.42 | | 6.79 | ** |
2005 | | | 24.58 | | | .37 | | | 1.47 | | | | 1.84 | | | | (.45 | ) | | | — | | | | (.45 | ) | | | 25.97 | | 7.53 | |
Class R3 (8/08) | | | | | | | | | | | | | | | | | | | | | | | | | | | | | |
2009(g) | | | 22.20 | | | .59 | | | (3.12 | ) | | | (2.53 | ) | | | (.30 | ) | | | (.46 | ) | | | (.76 | ) | | | 18.91 | | (10.87 | ) |
Class I (8/96)(f) | | | | | | | | | | | | | | | | | | | | | | | | | | | | | |
2009 | | | 22.35 | | | .71 | | | (3.32 | ) | | | (2.61 | ) | | | (.39 | ) | | | (.46 | ) | | | (.85 | ) | | | 18.89 | | (11.08 | ) |
2008 | | | 26.73 | | | .60 | | | (2.04 | ) | | | (1.44 | ) | | | (.62 | ) | | | (2.32 | ) | | | (2.94 | ) | | | 22.35 | | (6.07 | ) |
2007 | | | 25.40 | | | .64 | | | 2.98 | | | | 3.62 | | | | (.68 | ) | | | (1.61 | ) | | | (2.29 | ) | | | 26.73 | | 14.68 | |
2006 | | | 25.95 | | | .56 | | | 1.41 | | | | 1.97 | | | | (.60 | ) | | | (1.92 | ) | | | (2.52 | ) | | | 25.40 | | 7.87 | ** |
2005 | | | 24.56 | | | .62 | | | 1.47 | | | | 2.09 | | | | (.70 | ) | | | — | | | | (.70 | ) | | | 25.95 | | 8.60 | |
| | | | | | | | | | | | | | | | | | | | | | |
| | | | | | | |
| | | | | | | | | | | | | | | | | | | | | | |
| Ratios/Supplemental Data | |
| | | Ratios to Average
Net Assets
Before Credit/
Reimbursement | | | Ratios to Average
Net Assets After
Reimbursement(c) | | | Ratios to Average
Net Assets
After Credit/
Reimbursement(d) | | | | |
| | | | | | | |
Ending
Net
Assets
(000) | | Expenses(e) | | | Net
Invest-
ment
Income | | | Expenses(e) | | | Net
Invest-
ment
Income | | | Expenses(e) | | | Net
Invest-
ment
Income | | | Portfolio
Turnover
Rate | |
| | | | | | | | | | | | | | | | | | | | | | |
| $ | 21,136 | | 1.29 | % | | 2.97 | % | | .62 | % | | 3.64 | % | | .62 | % | | 3.64 | % | | 171 | % |
| | 29,612 | | 1.32 | | | 2.04 | | | 1.23 | | | 2.12 | | | 1.23 | | | 2.13 | | | 51 | |
| | 33,519 | | 1.26 | | | 2.17 | | | 1.24 | | | 2.19 | | | 1.24 | | | 2.19 | | | 61 | |
| | 30,644 | | 1.31 | | | 1.84 | | | 1.24 | | | 1.91 | | | 1.24 | | | 1.91 | | | 56 | |
| | 31,248 | | 1.30 | | | 2.16 | | | 1.25 | | | 2.21 | | | 1.25 | | | 2.21 | | | 62 | |
| | | | | | | | | | | | | | | | | | | | | | |
| | 3,054 | | 2.02 | | | 2.18 | | | 1.38 | | | 2.81 | | | 1.38 | | | 2.81 | | | 171 | |
| | 5,535 | | 2.07 | | | 1.29 | | | 1.98 | | | 1.38 | | | 1.98 | | | 1.38 | | | 51 | |
| | 6,376 | | 2.02 | | | 1.40 | | | 1.99 | | | 1.42 | | | 1.99 | | | 1.42 | | | 61 | |
| | 8,051 | | 2.06 | | | 1.09 | | | 1.99 | | | 1.15 | | | 1.99 | | | 1.15 | | | 56 | |
| | 11,564 | | 2.05 | | | 1.41 | | | 2.00 | | | 1.46 | | | 2.00 | | | 1.47 | | | 62 | |
| | | | | | | | | | | | | | | | | | | | | | |
| | 4,685 | | 2.03 | | | 2.19 | | | 1.37 | | | 2.85 | | | 1.37 | | | 2.85 | | | 171 | |
| | 7,265 | | 2.07 | | | 1.29 | | | 1.98 | | | 1.38 | | | 1.98 | | | 1.38 | | | 51 | |
| | 7,694 | | 2.01 | | | 1.42 | | | 1.99 | | | 1.44 | | | 1.99 | | | 1.44 | | | 61 | |
| | 7,342 | | 2.06 | | | 1.08 | | | 1.99 | | | 1.16 | | | 1.99 | | | 1.16 | | | 56 | |
| | 7,947 | | 2.05 | | | 1.41 | | | 2.00 | | | 1.46 | | | 2.00 | | | 1.46 | | | 62 | |
| | | | | | | | | | | | | | | | | | | | | | |
| | 128 | | 1.57 | * | | 2.84 | * | | .79 | * | | 3.62 | * | | .79 | * | | 3.62 | * | | 171 | |
| | | | | | | | | | | | | | | | | | | | | | |
| | 6,334 | | 1.02 | | | 3.19 | | | .36 | | | 3.84 | | | .36 | | | 3.84 | | | 171 | |
| | 9,662 | | 1.07 | | | 2.29 | | | .98 | | | 2.38 | | | .98 | | | 2.38 | | | 51 | |
| | 10,690 | | 1.01 | | | 2.42 | | | .99 | | | 2.44 | | | .99 | | | 2.44 | | | 61 | |
| | 9,213 | | 1.06 | | | 2.08 | | | .99 | | | 2.15 | | | .99 | | | 2.15 | | | 56 | |
| | 10,753 | | 1.05 | | | 2.41 | | | 1.00 | | | 2.46 | | | 1.00 | | | 2.46 | | | 62 | |
| ** | During the fiscal year ended June 30, 2006, the Fund received a payment from the Adviser of $55,844, for losses realized on the disposal of investments purchased in violation of investment restrictions, which otherwise would have reduced total returns by .08%, .13%, .12% and .08% for Class A, B, C and I, respectively. |
| (a) | Per share Net Investment Income is calculated using the average daily shares method. |
| (b) | •Total return is the combination of changes in net asset value without any sales charge, reinvested dividend income at net asset value and |
| | reinvested capital gains distributions at net asset value, if any. Total returns are not annualized. |
| | •Total returns for the year ended June 30, 2008 and prior reflect the performance of the Nuveen Balanced Stock and Bond Fund. Total return for |
| | the year ended June 30, 2009, includes performance of the Nuveen Balanced Stock and Bond Fund for the period July 1, 2008 through July 31, 2008. Returns prior to August 1, 2008, are not indicative of the performance that the Fund, as currently managed, would have generated. |
| (c) | After expense reimbursement from the Adviser, where applicable. |
| (d) | After custodian fee credit and expense reimbursement, where applicable. |
| (e) | The expense ratios for the year ended June 30, 2009, do not reflect the expenses of the Underlying Funds in which the Fund invests. |
| (f) | Effective May 1, 2008, Class R Shares were renamed Class I Shares. |
| (g) | For the period August 4, 2008 (commencement of operations) through June 30, 2009. |
See accompanying notes to financial statements.
Financial Highlights (continued)
| | | | | | | | | | | | | | | | | | | | | | | | | | | | | | | | |
| Selected data for a share outstanding throughout each period: | |
|
| Class (Commencement Date) | |
| | | | | Investment Operations | | | Less Distributions | | | | |
| | | | | | | |
| CONSERVATIVE ALLOCATION | | | | | | | | | | | | | | | | | | | | |
Year Ended
June 30, | | Beginning
Net
Asset
Value | | Net
Invest-
ment
Income(a) | | Net
Realized/
Unrealized
Gain
(Loss) | | | Total | | | Net
Invest-
ment
Income | | | Capital
Gains | | | Total | | | Ending
Net
Asset
Value | | Total
Return(b) | |
Class A (8/96) | | | | | | | | | | | | | | | | | | | | | | | | | | | | | |
2009 | | $ | 22.84 | | $ | .85 | | $ | (2.60 | ) | | $ | (1.75 | ) | | $ | (.37 | ) | | $ | (.48 | ) | | $ | (.85 | ) | | $ | 20.24 | | (7.25 | )% |
2008 | | | 25.76 | | | .64 | | | (2.17 | ) | | | (1.53 | ) | | | (.67 | ) | | | (.72 | ) | | | (1.39 | ) | | | 22.84 | | (6.23 | ) |
2007 | | | 23.86 | | | .67 | | | 1.91 | | | | 2.58 | | | | (.68 | ) | | | — | | | | (.68 | ) | | | 25.76 | | 10.90 | |
2006 | | | 23.01 | | | .60 | | | .89 | | | | 1.49 | | | | (.64 | ) | | | — | | | | (.64 | ) | | | 23.86 | | 6.52 | |
2005 | | | 21.96 | | | .62 | | | 1.10 | | | | 1.72 | | | | (.67 | ) | | | — | | | | (.67 | ) | | | 23.01 | | 7.91 | |
Class B (8/96) | | | | | | | | | | | | | | | | | | | | | | | | | | | | | |
2009 | | | 24.43 | | | .77 | | | (2.80 | ) | | | (2.03 | ) | | | (.20 | ) | | | (.48 | ) | | | (.68 | ) | | | 21.72 | | (7.97 | ) |
2008 | | | 27.36 | | | .48 | | | (2.30 | ) | | | (1.82 | ) | | | (.39 | ) | | | (.72 | ) | | | (1.11 | ) | | | 24.43 | | (6.90 | ) |
2007 | | | 25.32 | | | .50 | | | 2.04 | | | | 2.54 | | | | (.50 | ) | | | — | | | | (.50 | ) | | | 27.36 | | 10.09 | |
2006 | | | 24.26 | | | .45 | | | .94 | | | | 1.39 | | | | (.33 | ) | | | — | | | | (.33 | ) | | | 25.32 | | 5.73 | |
2005 | | | 22.99 | | | .47 | | | 1.15 | | | | 1.62 | | | | (.35 | ) | | | — | | | | (.35 | ) | | | 24.26 | | 7.08 | |
Class C (8/96) | | | | | | | | | | | | | | | | | | | | | | | | | | | | | |
2009 | | | 24.39 | | | .77 | | | (2.79 | ) | | | (2.02 | ) | | | (.20 | ) | | | (.48 | ) | | | (.68 | ) | | | 21.69 | | (7.94 | ) |
2008 | | | 27.32 | | | .49 | | | (2.31 | ) | | | (1.82 | ) | | | (.39 | ) | | | (.72 | ) | | | (1.11 | ) | | | 24.39 | | (6.94 | ) |
2007 | | | 25.29 | | | .51 | | | 2.02 | | | | 2.53 | | | | (.50 | ) | | | — | | | | (.50 | ) | | | 27.32 | | 10.10 | |
2006 | | | 24.24 | | | .45 | | | .93 | | | | 1.38 | | | | (.33 | ) | | | — | | | | (.33 | ) | | | 25.29 | | 5.70 | |
2005 | | | 22.96 | | | .48 | | | 1.15 | | | | 1.63 | | | | (.35 | ) | | | — | | | | (.35 | ) | | | 24.24 | | 7.13 | |
Class R3 (8/08) | | | | | | | | | | | | | | | | | | | | | | | | | | | | | |
2009(g) | | | 22.16 | | | .70 | | | (2.40 | ) | | | (1.70 | ) | | | (.27 | ) | | | (.48 | ) | | | (.75 | ) | | | 19.71 | | (7.27 | ) |
Class I (8/96)(f) | | | | | | | | | | | | | | | | | | | | | | | | | | | | | |
2009 | | | 22.24 | | | .88 | | | (2.53 | ) | | | (1.65 | ) | | | (.42 | ) | | | (.48 | ) | | | (.90 | ) | | | 19.69 | | (6.98 | ) |
2008 | | | 25.15 | | | .69 | | | (2.12 | ) | | | (1.43 | ) | | | (.76 | ) | | | (.72 | ) | | | (1.48 | ) | | | 22.24 | | (5.99 | ) |
2007 | | | 23.34 | | | .72 | | | 1.86 | | | | 2.58 | | | | (.77 | ) | | | — | | | | (.77 | ) | | | 25.15 | | 11.17 | |
2006 | | | 22.56 | | | .65 | | | .87 | | | | 1.52 | | | | (.74 | ) | | | — | | | | (.74 | ) | | | 23.34 | | 6.79 | |
2005 | | | 21.57 | | | .68 | | | 1.07 | | | | 1.75 | | | | (.76 | ) | | | — | | | | (.76 | ) | | | 22.56 | | 8.17 | |
| | | | | | | | | | | | | | | | | | | | | | |
| | | | | | | | | | | | | | | | | | | | | | |
| | | | | | | |
| | | | | | | | | | | | | | | | | | | | | | |
| Ratios/Supplemental Data | |
| | | Ratios to Average
Net Assets
Before Credit/
Reimbursement | | | Ratios to Average
Net Assets After
Reimbursement(c) | | | Ratios to Average
Net Assets
After Credit/
Reimbursement(d) | | | | |
Ending
Net
Assets
(000) | | Expenses(e) | | | Net
Invest-
ment
Income | | | Expenses(e) | | | Net
Invest-
ment
Income | | | Expenses(e) | | | Net
Invest-
ment
Income | | | Portfolio
Turnover
Rate | |
| | | | | | | | | | | | | | | | | | | | | | |
| $ | 35,247 | | 1.04 | % | | 3.88 | % | | .63 | % | | 4.28 | % | | .63 | % | | 4.29 | % | | 166 | % |
| | 52,785 | | 1.28 | | | 2.53 | | | 1.23 | | | 2.58 | | | 1.21 | | | 2.60 | | | 37 | |
| | 61,577 | | 1.22 | | | 2.64 | | | 1.22 | | | 2.64 | | | 1.19 | | | 2.67 | | | 37 | |
| | 58,064 | | 1.26 | | | 2.51 | | | 1.24 | | | 2.53 | | | 1.22 | | | 2.55 | | | 44 | |
| | 54,323 | | 1.24 | | | 2.76 | | | 1.24 | | | 2.76 | | | 1.23 | | | 2.77 | | | 47 | |
| | | | | | | | | | | | | | | | | | | | | | |
| | 1,730 | | 1.77 | | | 3.22 | | | 1.38 | | | 3.60 | | | 1.38 | | | 3.60 | | | 166 | |
| | 3,480 | | 2.03 | | | 1.76 | | | 1.98 | | | 1.81 | | | 1.96 | | | 1.83 | | | 37 | |
| | 5,916 | | 1.98 | | | 1.87 | | | 1.98 | | | 1.87 | | | 1.95 | | | 1.90 | | | 37 | |
| | 10,700 | | 2.00 | | | 1.75 | | | 1.99 | | | 1.76 | | | 1.97 | | | 1.79 | | | 44 | |
| | 18,671 | | 2.00 | | | 2.01 | | | 2.00 | | | 2.01 | | | 1.99 | | | 2.02 | | | 47 | |
| | | | | | | | | | | | | | | | | | | | | | |
| | 6,649 | | 1.81 | | | 3.21 | | | 1.38 | | | 3.63 | | | 1.38 | | | 3.63 | | | 166 | |
| | 8,192 | | 2.03 | | | 1.78 | | | 1.98 | | | 1.83 | | | 1.96 | | | 1.85 | | | 37 | |
| | 9,363 | | 1.97 | | | 1.90 | | | 1.97 | | | 1.90 | | | 1.94 | | | 1.93 | | | 37 | |
| | 7,992 | | 2.01 | | | 1.76 | | | 1.99 | | | 1.77 | | | 1.97 | | | 1.80 | | | 44 | |
| | 7,979 | | 1.99 | | | 2.01 | | | 1.99 | | | 2.01 | | | 1.98 | | | 2.02 | | | 47 | |
| | | | | | | | | | | | | | | | | | | | | | |
| | 133 | | 1.35 | * | | 3.59 | * | | .87 | * | | 4.08 | * | | .87 | * | | 4.08 | * | | 166 | |
| | | | | | | | | | | | | | | | | | | | | | |
| | 472 | | .76 | | | 4.09 | | | .39 | | | 4.46 | | | .39 | | | 4.47 | | | 166 | |
| | 1,361 | | 1.03 | | | 2.78 | | | .98 | | | 2.83 | | | .96 | | | 2.86 | | | 37 | |
| | 1,525 | | .97 | | | 2.90 | | | .97 | | | 2.90 | | | .94 | | | 2.93 | | | 37 | |
| | 1,171 | | 1.01 | | | 2.77 | | | .99 | | | 2.79 | | | .96 | | | 2.81 | | | 44 | |
| | 761 | | .99 | | | 3.06 | | | .99 | | | 3.06 | | | .98 | | | 3.07 | | | 47 | |
| (a) | Per share Net Investment Income is calculated using the average daily shares method. |
| (b) | •Total return is the combination of changes in net asset value without any sales charge, reinvested dividend income at net asset value and |
| | reinvested capital gains distributions at net asset value, if any. Total returns are not annualized. |
| | •Total returns for the year ended 2008 and prior reflect the performance of the Nuveen Balanced Municipal and Stock Fund. Total return for the |
| | year ended June 30, 2009, includes performance of the Nuveen Balanced Municipal and Stock Fund for the period July 1, 2008 through July 6, 2008. Returns prior to July 7, 2008, are not indicative of the performance that the Fund, as currently managed, would have generated. |
| (c) | After expense reimbursement from the Adviser, where applicable. |
| (d) | After custodian fee credit and expense reimbursement, where applicable. |
| (e) | The expense ratios for the year ended June 30, 2009, do not reflect the expenses of the Underlying Funds in which the Fund invests. |
| (f) | Effective May 1, 2008, Class R Shares were renamed Class I Shares. |
| (g) | For the period August 4, 2008 (commencement of operations) through June 30, 2009. |
See accompanying notes to financial statements.
Annual Investment Management Agreement Approval Process
The Investment Company Act of 1940, as amended (the “1940 Act”), provides, in substance, that each investment advisory agreement between a fund and its investment adviser (including sub-advisers) will continue in effect from year to year only if its continuance is approved at least annually by the fund’s board members, including by a vote of a majority of the board members who are not parties to the advisory agreement or “interested persons” of any parties (the “Independent Board Members”), cast in person at a meeting called for the purpose of considering such approval. In connection with such approvals, the fund’s board members must request and evaluate, and the investment adviser is required to furnish, such information as may be reasonably necessary to evaluate the terms of the advisory agreement. Accordingly, at a meeting held on May 27-29, 2009 (the “May Meeting”), the Boards of Trustees (each, a “Board” and each Trustee, a “Board Member”) of the Funds, including a majority of the Independent Board Members, considered and approved the continuation of the advisory and sub-advisory agreements for the Funds for an additional one-year period. These agreements include the investment advisory agreements between Nuveen Asset Management (“NAM”) and each Fund and the sub-advisory agreements between NAM and Nuveen Investment Solutions, Inc. (the “Sub-Adviser”). In preparation for their considerations at the May Meeting, the Board also held a separate meeting on April 21-22, 2009 (the “April Meeting”). Accordingly, the factors considered and determinations made regarding the renewals by the Independent Board Members include those made at the April Meeting.
In addition, in evaluating the applicable advisory agreements (each an “Investment Management Agreement”) and sub-advisory agreements (each a “Sub-advisory Agreement,” and each Investment Management Agreement and Sub-advisory Agreement, an “Advisory Agreement”), the Independent Board Members reviewed a broad range of information relating to the Funds, NAM and the Sub-Adviser (NAM and the Sub-Adviser are each a “Fund Adviser”), including absolute performance, fee and expense information for the Funds as well as comparative performance, fee and expense information for a comparable peer group of funds, the performance information of recognized and/or customized benchmarks (as applicable) of the Funds, the profitability of Nuveen for its advisory activities (which includes its wholly owned subsidiaries other than Winslow Capital Management, Inc. (“Winslow Capital”), which was recently acquired in December 2008), and other information regarding the organization, personnel, and services provided by the respective Fund Adviser. The Independent Board Members also met quarterly as well as at other times as the need arose during the year and took into account the information provided at such meetings and the knowledge gained therefrom. Prior to approving the renewal of the Advisory Agreements, the Independent Board Members reviewed the foregoing information with their independent legal counsel and with management, reviewed materials from independent legal counsel describing applicable law and their duties in reviewing advisory contracts, and met with independent legal counsel in private sessions without management present. The Independent Board Members considered the legal advice provided by independent legal counsel and relied upon their knowledge of the Fund Adviser, its services and the Funds resulting from their meetings and other interactions throughout the year and their own business judgment in determining the factors to be considered in evaluating the Advisory Agreements. Each Board Member may have accorded different weight to the various factors in reaching his or her conclusions with respect to a Fund’s Advisory Agreements. The Independent Board Members did not identify any single factor as all-important or controlling. The Independent Board Members’ considerations were instead based on a comprehensive consideration of all the information presented. The principal factors considered by the Board and its conclusions are described below.
A. Nature, Extent and Quality of Services
In considering renewal of the Advisory Agreements, the Independent Board Members considered the nature, extent and quality of the Fund Adviser’s services, including advisory services and administrative services. The Independent Board Members reviewed materials outlining, among other things, the Fund Adviser’s organization and business; the types of services that the Fund Adviser or its affiliates provide and are expected to provide to the Funds; the performance record of the applicable Fund (as described in further detail below); and any initiatives Nuveen had taken for the applicable fund product line.
In reviewing the services provided and the initiatives undertaken during the past year, the Independent Board Members recognized the severe market turmoil experienced in the capital markets during recent periods, including sustained periods of high volatility, credit disruption and government intervention. The Independent Board Members considered the Fund Adviser’s efforts, expertise and other actions taken to address matters as they arose that impacted the Funds. The Independent Board Members recognized the role of the Investment Services group which, among other things, monitors the various positions throughout the Nuveen fund complex to identify and address any systematic risks. In addition, the Capital Markets Committee of NAM provides a multi-departmental venue for developing new policies to mitigate any risks. The Independent Board Members further recognized NAM’s continuous review of the Nuveen funds’ investment strategies and mandates in seeking to continue to refine and improve the investment process for the funds, particularly in light of market conditions. In this regard, the Independent Board Members noted the changes recommended by NAM to various investment mandates for the Nuveen funds in seeking to take advantage of market opportunities and to improve the tools available for managing liquidity and market exposure; the establishment of a team responsible for coordinating the handling of large trades in or out of the Nuveen funds; and the ongoing monitoring of investment management processes.
As part of their review, the Independent Board Members also evaluated the background, experience and track record of the Fund Adviser’s investment personnel. In this regard, the Independent Board Members considered any changes in the personnel, and the impact on the level of services provided to the Funds, if any. The Independent Board Members also reviewed information regarding portfolio manager compensation arrangements to evaluate the Fund Adviser’s ability to attract and retain high quality investment personnel, preserve stability, and reward performance but not provide an incentive for taking undue risks.
In addition to advisory services, the Independent Board Members considered the quality of administrative services provided by NAM and its affiliates including product management, fund administration, oversight of service providers, shareholder services, administration of Board relations, regulatory and portfolio compliance and legal support. Given the importance of compliance, the Independent Board Members considered NAM’s compliance program, including the report of the chief compliance officer regarding the Funds’ compliance policies and procedures.
The Independent Board Members also considered NAM’s oversight of the performance, business activities and compliance of the Sub-Adviser. In that regard, the Independent Board Members reviewed an evaluation of the Sub-Adviser from NAM. The evaluation also included information relating to the Sub-Adviser’s organization, operations, personnel, assets under management, investment philosophy, strategies and techniques in managing the Funds, developments affecting the Sub-Adviser, and an analysis of the Sub-Adviser. As described in further detail below, the Board considered the performance of the Funds. The Board also recognized that the Sub-advisory Agreements were essentially agreements for portfolio management services only and the Sub-Adviser was not expected to supply other significant administrative services to the Funds. As part of their oversight, the Independent Board Members also continued their program of seeking to visit each sub-adviser to the Nuveen funds at least once over a multiple year rotation, meeting with key investment and business personnel. The Independent Board Members noted that NAM recommended the renewal of the applicable Sub-advisory Agreements and considered the basis for such recommendations and any qualifications in connection therewith.
Based on their review, the Independent Board Members found that, overall, the nature, extent and quality of services provided (and expected to be provided) to the Funds under the respective Investment Management Agreement or Sub-advisory Agreement, as applicable, were satisfactory.
B. The Investment Performance of the Funds and Fund Advisers
The Board considered the investment performance of each Fund, including the Fund’s historic performance as well as its performance compared to funds with similar investment objectives (the “Performance Peer Group”) based on data provided by an independent provider of mutual fund data as well as recognized and/or customized benchmarks. The Independent Board Members reviewed performance information including, among other things, total return information compared with the Fund’s Performance Peer Group and recognized and/or customized benchmarks for the quarter-, one-, three- and five-year periods (as applicable) ending December 31, 2008 and for the same periods (as applicable) ending March 31, 2009. The Independent Board Members also reviewed performance information of the Nuveen funds managed by the Sub-Adviser in the aggregate ranked by peer group and the performance of such funds, in the aggregate, relative to their benchmark. This information supplemented the Fund performance information provided to the Board at each of its quarterly meetings.
In comparing a fund’s performance with that of its Performance Peer Group, the Independent Board Members took into account that the closest Performance Peer Group in certain instances may not adequately reflect the respective fund’s investment objectives and strategies thereby hindering a meaningful comparison of the fund’s performance with that of the Performance Peer Group. In addition, the Independent Board Members noted that the previous changes to the investment strategies of the Funds limit somewhat the usefulness of reviewing the Funds’ past performance beyond recent periods. The Independent Board Members further considered the performance of the Funds in the context of the volatile market conditions during the past year, and their impact on various asset classes and the portfolio management of the Funds.
Based on their review and factoring in the severity of market turmoil in 2008, the Independent Board Members determined that each Fund’s investment performance over time had been satisfactory.
C. Fees, Expenses and Profitability
1. Fees and Expenses
The Independent Board Members recognized that the Funds were launched in their present fund-of-funds form in the summer of 2008. Prior to that time, each Fund’s investment strategy and structure were materially different. The Independent Board Members recognized that the fee and expense arrangement of a fund-of-funds structure differs from that of a traditional fund format. The Independent Board Members noted that, in light of their fund-of-funds structure, the Funds will indirectly pay a portion of the expenses incurred by the underlying funds, including their advisory fees. Accordingly, the Independent Board Members reviewed, among other things, the gross management fees, net expense ratios (including indirect fees) and indirect fees of each Fund compared to such fee and expense information for a comparable set of unaffiliated fund-of-funds (the “Peer Universe”) and a subset thereof (the “Peer Group”). In that regard, the Independent Board Members further reviewed data regarding the construction of the applicable Peer Universe and Peer Group. In reviewing the comparisons of fee and expense information, the Independent Board Members took into account that in certain instances various factors such as the asset level of a fund relative to peers, the size and particular composition of the Peer Universe or Peer Group, the investment objectives of the peers, expense anomalies, changes in the funds comprising the Peer Universe or Peer Group from year to year, levels of reimbursement and the timing of information used may impact the comparative data, thereby limiting the ability to make a meaningful comparison.
In addition, the Independent Board Members considered that many of the underlying funds may be advised by NAM and sub-advised by an affiliated person of NAM. Accordingly, NAM and affiliated sub-advisers may receive advisory fees from the underlying funds in which the Funds invest, and the Funds will indirectly bear their pro rata portion of these fees as well as the
Annual Investment Management Agreement Approval Process (continued)
other expenses of the underlying funds. In considering the services provided by the Fund Advisers to the Funds and the fee arrangements, the Board determined, however, that the fees were for services in addition to, rather than duplicative of, the services provided under any underlying fund’s advisory contracts.
Based on their review of the fee and expense information provided, the Independent Board Members determined that each Fund’s management fees and net total expense ratio were reasonable in light of the nature, extent and quality of services provided to the respective Fund.
2. Comparisons with the Fees of Other Clients
The Independent Board Members further reviewed information regarding the nature of services and fee rates offered by NAM to other clients. Such clients include separately managed accounts (both retail and institutional accounts) and funds that are not offered by Nuveen but are sub-advised by one of Nuveen’s investment management teams. In evaluating the comparisons of fees, the Independent Board Members noted that the fee rates charged to the Funds and other clients vary, among other things, because of the different services involved and the additional regulatory and compliance requirements associated with registered investment companies, such as the Funds. Accordingly, the Independent Board Members considered the differences in the product types, including, but not limited to, the services provided, the structure and operations, product distribution and costs thereof, portfolio investment policies, investor profiles, account sizes and regulatory requirements. The Independent Board Members noted, in particular, that the range of services provided to the Funds (as discussed above) is much more extensive than that provided to separately managed accounts. The Independent Board Members also recognized that NAM and the Sub-Adviser do not currently advise other fund-of-funds and, therefore, meaningful comparisons of fees for similar types of clients were not available. Given the inherent differences in the products, particularly the extensive services provided to the Funds, the Independent Board Members believe such facts justify the different levels of fees.
In considering the fees of the Sub-Adviser, the Independent Board Members also considered the pricing schedule or fees that the affiliated sub-advisers charge for similar investment management services for other fund sponsors or clients (such as retail and/or institutional managed accounts) as applicable.
3. Profitability of Fund Advisers
In conjunction with its review of fees, the Independent Board Members also considered the profitability of Nuveen for its advisory activities (which incorporated Nuveen’s wholly-owned affiliated sub-advisers other than Winslow Capital) and its financial condition. The Independent Board Members reviewed the revenues and expenses of Nuveen’s advisory activities for the last two years, the allocation methodology used in preparing the profitability data and an analysis of the key drivers behind the changes in revenues and expenses that impacted profitability in 2008. In addition, the Independent Board Members reviewed information regarding the financial results of Nuveen for 2008 based on its Form 8-K filed on March 31, 2009. The Independent Board Members noted this information supplemented the profitability information requested and received during the year to help keep them apprised of developments affecting profitability (such as changes in fee waivers and expense reimbursement commitments). In this regard, the Independent Board Members noted that they had also appointed an Independent Board Member as a point person to review and keep them apprised of changes to the profitability analysis and/or methodologies during the year. The Independent Board Members also considered Nuveen’s revenues for advisory activities, expenses, and profit margin compared to that of various unaffiliated management firms with similar amounts of assets under management and relatively comparable asset composition prepared by Nuveen.
In reviewing profitability, the Independent Board Members recognized the subjective nature of determining profitability which may be affected by numerous factors including the allocation of expenses. Further, the Independent Board Members recognized the difficulties in making comparisons as the profitability of other advisers generally is not publicly available and the profitability information that is available for certain advisers or management firms may not be representative of the industry and may be affected by, among other things, the adviser’s particular business mix, capital costs, types of funds managed and expense allocations. Notwithstanding the foregoing, the Independent Board Members reviewed Nuveen’s methodology and assumptions for allocating expenses across product lines to determine profitability. In reviewing profitability, the Independent Board Members recognized Nuveen’s investment in its fund business. Based on their review, the Independent Board Members concluded that Nuveen’s level of profitability for its advisory activities was reasonable in light of the services provided.
In evaluating the reasonableness of the compensation, the Independent Board Members also considered other amounts paid to a Fund Adviser by the Funds as well as any indirect benefits (such as soft dollar arrangements, if any) the Fund Adviser and its affiliates receive, or are expected to receive, that are directly attributable to the management of the Funds, if any. See Section E below for additional information on indirect benefits the Fund Adviser may receive as a result of its relationship with the Funds. Based on their review of the overall fee arrangements of each Fund, the Independent Board Members determined that the advisory fees and expenses of the respective Fund were reasonable.
D. Economies of Scale and Whether Fee Levels Reflect These Economies of Scale
With respect to economies of scale, the Independent Board Members have recognized the potential benefits resulting from the costs of a fund being spread over a larger asset base, although economies of scale are difficult to measure and predict with precision, particularly on a fund-by-fund basis. One method to help ensure the shareholders share in these benefits is to include breakpoints in
the advisory fee schedule. Generally, management fees for funds in the Nuveen complex are comprised of a fund-level component and a complex-level component. With respect to the fund-level breakpoint schedules, the Independent Board Members generally review and consider the applicable fund-level breakpoints in the advisory fee schedules for the funds in the Nuveen fund complex that reduce advisory fees as asset levels increase. The Independent Board Members recognized, however, that the Funds do not have fund-level breakpoints given their unique structures. In addition, pursuant to the complex-wide fee arrangement, the fees of the funds in the Nuveen complex generally are reduced as the assets in the fund complex reach certain levels. The Funds, however, are not assessed a complex-level fee as this is assessed at the Nuveen underlying fund level. The Independent Board Members further recognized that the Funds nevertheless will benefit from reductions in complex-level fees and fund-level fees indirectly as the complex and Nuveen underlying funds reach breakpoint levels and reduce the fees of the Nuveen underlying funds.
Based on their review, the Independent Board Members concluded that the absence of a breakpoint schedule and of a complex-level fee arrangement for the Funds was acceptable.
E. Indirect Benefits
In evaluating fees, the Independent Board Members received and considered information regarding potential “fall out” or ancillary benefits the respective Fund Adviser or its affiliates may receive as a result of its relationship with each Fund. In this regard, the Independent Board Members considered, among other things, any sales charges, distribution fees and shareholder services fees received and retained by the Funds’ principal underwriter, an affiliate of NAM, which includes fees received pursuant to any 12b-1 plan. The Independent Board Members, therefore, considered the 12b-1 fees retained by Nuveen during the last calendar year.
In addition to the above, the Independent Board Members considered whether the Fund Adviser received any benefits from soft dollar arrangements whereby a portion of the commissions paid by a Fund for brokerage may be used to acquire research that may be useful to the Fund Adviser in managing the assets of the Funds and other clients. With respect to NAM, the Independent Board Members noted that NAM does not currently have any soft dollar arrangements; however, to the extent certain bona fide agency transactions that occur on markets that traditionally trade on a principal basis and riskless principal transactions are considered as generating “commissions,” NAM intends to comply with the applicable safe harbor provisions. With respect to the Sub-Adviser the Independent Board Members considered that the Sub-Adviser may benefit from its soft dollar arrangements pursuant to which it receives research from brokers that execute the applicable Fund’s portfolio transactions. The Independent Board Members further noted that the Sub-Adviser’s profitability may be lower if it were required to pay for this research with hard dollars.
Based on their review, the Independent Board Members concluded that any indirect benefits received by a Fund Adviser as a result of its relationship with the Funds were reasonable and within acceptable parameters.
F. Other Considerations
The Independent Board Members did not identify any single factor discussed previously as all-important or controlling. The Board Members, including the Independent Board Members, unanimously concluded that the terms of the Investment Management Agreements and Sub-advisory Agreements are fair and reasonable, that the respective Fund Adviser’s fees are reasonable in light of the services provided to each Fund and that the Investment Management Agreements and the Sub-advisory Agreements be renewed.
Trustees and Officers
The management of the Fund, including general supervision of the duties performed for the Fund by the Adviser, is the responsibility of the Board of Trustees of the Fund. The number of trustees of the Fund is currently set at nine. None of the trustees who are not “interested” persons of the Fund (referred to herein as “independent trustees”) has ever been a director or employee of, or consultant to, Nuveen or its affiliates. The names and business addresses of the trustees and officers of the Fund, their principal occupations and other affiliations during the past five years, the number of portfolios each oversees and other directorships they hold are set forth below.
The Fund’s Statement of Additional Information (“SAI”) includes more information about the trustees. To request a free copy, call Nuveen Investments at (800) 257-8787 or visit the Funds’ website at www.nuveen.com.
| | | | | | | | |
Name, Birthdate and Address | | Position(s) Held with the Fund | | Year First Elected or Appointed (1) | | Principal Occupation(s) Including other Directorships During Past 5 Years | | Number of Portfolios in Fund Complex Overseen by Trustee |
| | |
| Independent Trustees: | | | | |
Robert P. Bremner 8/22/40 333 W. Wacker Drive Chicago, IL 60606 | | Chairman of the Board and Trustee | | 1997 | | Private Investor and Management Consultant; Treasurer and Director, Humanities Council of Washington D.C. | | 199 |
Jack B. Evans 10/22/48 333 W. Wacker Drive Chicago, IL 60606 | | Trustee | | 1999 | | President, The Hall-Perrine Foundation, a private philanthropic corporation (since 1996); Director and Vice Chairman, United Fire Group, a publicly held company; Member of the Board of Regents for the State of Iowa University System; Director, Gazette Companies; Life Trustee of Coe College; Director, Iowa College Foundation; Member of the Advisory Council of the Department of Finance in the Tippie College of Business, University of lowa; formerly, Director, Alliant Energy; formerly, Director, Federal Reserve Bank of Chicago; formerly, President and Chief Operating Officer, SCI Financial Group, Inc., a regional financial services firm. | | 199 |
William C. Hunter 3/6/48 333 W. Wacker Drive Chicago, IL 60606 | | Trustee | | 2004 | | Dean, Tippie College of Business, University of Iowa (since 2006); Director (since 2004) of Xerox Corporation; Director (since 2005), Beta Gamma Sigma International Honor Society; formerly, Dean and Distinguished Professor of Finance, School of Business at the University of Connecticut (2003-2006); previously, Senior Vice President and Director of Research at the Federal Reserve Bank of Chicago (1995-2003); Director, SS&C Technologies, Inc. (May 2005-October 2005); formerly, Director (1997-2007), Credit Research Center at George Washington University. | | 199 |
David J. Kundert 10/28/42 333 W. Wacker Drive Chicago, IL 60606 | | Trustee | | 2005 | | Director, Northwestern Mutual Wealth Management Company; retired (since 2004) as Chairman, JPMorgan Fleming Asset Management, President and CEO, Banc One Investment Advisors Corporation, and President, One Group Mutual Funds; prior thereto, Executive Vice President, Banc One Corporation and Chairman and CEO, Banc One Investment Management Group; Member, Board of Regents, Luther College; member of the Wisconsin Bar Association; member of Board of Directors, Friends of Boerner Botanical Gardens; member of Investment Committee, Greater Milwaukee Foundation. | | 199 |
William J. Schneider 9/24/44 333 W. Wacker Drive Chicago, IL 60606 | | Trustee | | 1997 | | Chairman of Miller-Valentine Partners Ltd., a real estate investment company; formerly, Senior Partner and Chief Operating Officer (retired, 2004) of Miller-Valentine Group; Member, Dayton Philharmonic Orchestra Association; formerly, Member, Business Advisory Council, Cleveland Federal Reserve Bank; formerly, Director, Dayton Development Coalition. | | 199 |
Judith M. Stockdale 12/29/47 333 W. Wacker Drive Chicago, IL 60606 | | Trustee | | 1997 | | Executive Director, Gaylord and Dorothy Donnelley Foundation (since 1994); prior thereto, Executive Director, Great Lakes Protection Fund (from 1990 to 1994). | | 199 |
Carole E. Stone 6/28/47 333 W. Wacker Drive Chicago, IL 60606 | | Trustee | | 2007 | | Director, Chicago Board Options Exchange (since 2006); Director, C2 Options Exchange, Incorporated (since 2009); Commissioner, New York State Commission on Public Authority Reform (since 2005); formerly, Chair, New York Racing Association Oversight Board (2005-2007). | | 199 |
| | | | | | | | |
Name, Birthdate and Address | | Position(s) Held with the Fund | | Year First Elected or Appointed (1) | | Principal Occupation(s) Including other Directorships During Past 5 Years | | Number of Portfolios in Fund Complex Overseen by Trustee |
Terence J. Toth 9/29/59 333 W. Wacker Drive Chicago, IL 60606 | | Trustee | | 2008 | | Director, Legal & General Investment Management America, Inc. (since 2008); Managing Partner, Musso Capital Management (since 2008); CEO and President, Northern Trust Investments (2004-2007); Executive Vice President, Quantitative Management & Securities Lending (2000-2004); prior thereto, various positions with Northern Trust Company (since 1994); Member: Goodman Theatre Board (since 2004); Chicago Fellowship Board (since 2005), University of Illinois Leadership Council Board (since 2007) and Catalyst Schools of Chicago Board (since 2008); formerly, Member: Northern Trust Mutual Funds Board (2005-2007), Northern Trust Investments Board (2004-2007), Northern Trust Japan Board (2004-2007), Northern Trust Securities Inc. Board (2003-2007) and Northern Trust Hong Kong Board (1997-2004). | | 199 |
| | |
| Interested Trustee: | | | | |
John P. Amboian (2) 6/14/61 333 W. Wacker Drive Chicago, IL 60606 | | Trustee | | 2008 | | Chief Executive Officer (since July 2007) and Director (since 1999) of Nuveen Investments, Inc.; Chief Executive Officer (since 2007) of Nuveen Asset Management, Nuveen Investments Advisors, Inc. formerly, President (1999-2004) of Nuveen Advisory Corp. and Nuveen Institutional Advisory Corp. (3) | | 199 |
Name, Birthdate and Address | | Position(s) Held with the Fund | | Year First Elected or Appointed (4) | | Principal Occupation(s) During Past 5 Years | | Number of Portfolios in Fund Complex Overseen by Officer |
| | |
| Officers of the Fund: | | | | |
Gifford R. Zimmerman 9/9/56 333 W. Wacker Drive Chicago, IL 60606 | | Chief Administrative Officer | | 1988 | | Managing Director (since 2002), Assistant Secretary and Associate General Counsel of Nuveen Investments, LLC; Managing Director (since 2002), Associate General Counsel and Assistant Secretary, of Nuveen Asset Management (since 2002) and of Symphony Asset Management LLC (since 2003); Vice President and Assistant Secretary of NWQ Investment Management Company, LLC. (since 2002), Nuveen Investments Advisers Inc. (since 2002), Tradewinds Global Investors, LLC, and Santa Barbara Asset Management, LLC (since 2006), Nuveen HydePark Group LLC and Nuveen Investment Solutions, Inc. (since 2007); Managing Director (since 2004) and Assistant Secretary (since 1994) of Nuveen Investments, Inc.; formerly, Managing Director (2002-2004), General Counsel (1998-2004) and Assistant Secretary of Nuveen Advisory Corp. and Nuveen Institutional Advisory Corp. (3); Chartered Financial Analyst. | | 199 |
Mark J.P. Anson 6/10/59 333 W. Wacker Drive Chicago, IL 60606 | | Vice President | | 2009 | | President and Executive Director of Nuveen Investments, Inc. (since 2007); President of Nuveen Investments Institutional Services Group LLC (since 2007); previously, Chief Executive Officer of the British Telecom Pension Scheme (2006-2007) and Chief Investment Officer of Calpers (1999-2006); PhD, Chartered Financial Analyst, Chartered Alternative Investment Analyst, Certified Public Accountant, Certified Management Accountant and Certified Internal Auditor. | | 199 |
Nizida Arriaga 6/1/1968 333 W. Wacker Drive Chicago, IL 60606 | | Vice President | | 2009 | | Vice President (since 2007) of Nuveen Investments, LLC; previously, Portfolio Manager, Allstate Investments, LLC (1996-2006); Chartered Financial Analyst. | | 199 |
Trustees and Officers (continued)
| | | | | | | | |
Name, Birthdate and Address | | Position(s) Held with the Fund | | Year First Elected or Appointed (4) | | Principal Occupation(s) During Past 5 Years | | Number of Portfolios in Fund Complex Overseen by Officer |
Michael T. Atkinson 2/3/66 333 W. Wacker Drive Chicago, IL 60606 | | Vice President and Assistant Secretary | | 2000 | | Vice President (since 2002) of Nuveen Investments, LLC; Vice President of Nuveen Asset Management (since 2005). | | 199 |
Margo L. Cook 4/11/64 333 W. Wacker Drive Chicago, IL 60606 | | Vice President | | 2009 | | Executive Vice President (since Oct 2008) of Nuveen Investments, Inc.; previously, Head of Institutional Asset Management (2007-2008) of Bear Stearns Asset Management; Head of Institutional Asset Mgt (1986-2007) of Bank of NY Mellon; Chartered Financial Analyst. | | 199 |
Alan A. Brown 8/1/62 333 W. Wacker Drive Chicago, IL 60606 | | Vice President | | 2007 | | Executive Vice President, Mutual Funds, Nuveen Investments, LLC, (since 2005), previously, Managing Director and Chief Marketing Officer (2001-2005). | | 74 |
Name, Birthdate and Address | | Position(s) Held with the Fund | | Year First Elected or Appointed (4) | | Principal Occupation(s) Including other Directorships During Past 5 Years | | Number of Portfolios in Fund Complex Overseen by Officer |
Lorna C. Ferguson 10/24/45 333 W. Wacker Drive Chicago, IL 60606 | | Vice President | | 1998 | | Managing Director (since 2004) of Nuveen Investments, LLC; Managing Director (since 2005) of Nuveen Asset Management; Managing Director (2004-2005) of Nuveen Advisory Corp. and Nuveen Institutional Advisory Corp. (3). | | 199 |
Stephen D. Foy 5/31/54 333 W. Wacker Drive Chicago, IL 60606 | | Vice President and Controller | | 1998 | | Vice President (since 1993) and Funds Controller (since 1998) of Nuveen Investments, LLC; Vice President (since 2005) of Nuveen Asset Management; Certified Public Accountant. | | 199 |
William T. Huffman 5/7/1969 333 W. Wacker Drive Chicago, IL 60606 | | Vice President | | 2009 | | Chief Operating Officer, Municipal Fixed Income (since 2008) of Nuveen Asset Management; previously, Chairman, President and Chief Executive Officer (2002 – 2007) of Northern Trust Global Advisors, Inc. and Chief Executive Officer (2007) of Northern Trust Global Investments Limited; CPA. | | 199 |
Walter M. Kelly 2/24/70 333 W. Wacker Drive Chicago, IL 60606 | | Chief Compliance Officer and Vice President | | 2003 | | Senior Vice President (since 2008), Vice President (2006- 2008) formerly, Assistant Vice President and Assistant General Counsel (2003-2006) of Nuveen Investments, LLC; Vice President (since 2006) and Assistant Secretary (since 2003) of Nuveen Asset Management. | | 199 |
David J. Lamb 3/22/63 333 W. Wacker Drive Chicago, IL 60606 | | Vice President | | 2000 | | Senior Vice President (since 2009), formerly, Vice President (2000-2009) of Nuveen Investments, LLC; Vice President (since 2005) of Nuveen Asset Management, Certified Public Accountant. | | 199 |
Tina M. Lazar 8/27/61 333 W. Wacker Drive Chicago, IL 60606 | | Vice President | | 2002 | | Senior Vice President (since 2009), formerly, Vice President of Nuveen Investments, LLC (1999-2009); Vice President of Nuveen Asset Management (since 2005). | | 199 |
Larry W. Martin 7/27/51 333 W. Wacker Drive Chicago, IL 60606 | | Vice President and Assistant Secretary | | 1988 | | Vice President, Assistant Secretary and Assistant General Counsel of Nuveen Investments, LLC; Vice President (since 2005) and Assistant Secretary of Nuveen Investments, Inc.; Vice President and Assistant Secretary of Nuveen Investments Advisers Inc. (since 2002), NWQ Investment Management Company, LLC (since 2002), Symphony Asset Management LLC (since 2003), Tradewinds Global Investors, LLC, Santa Barbara Asset Management, LLC (since 2006) and of Nuveen HydePark Group, LLC and Nuveen Investment Solutions, Inc. (since 2007); formerly, Vice President and Assistant Secretary of Nuveen Advisory Corp. and Nuveen Institutional Advisory Corp. (3) | | 199 |
| | | | | | | | |
Name, Birthdate and Address | | Position(s) Held with the Fund | | Year First Elected or Appointed (4) | | Principal Occupation(s) Including other Directorships During Past 5 Years | | Number of Portfolios in Fund Complex Overseen by Officer |
Kevin J. McCarthy 3/26/66 333 W. Wacker Drive Chicago, IL 60606 | | Vice President and Secretary | | 2007 | | Managing Director (since 2008), formerly, Vice President (2007-2008), Nuveen Investments, LLC; Managing Director (since 2008), formerly, Vice President and Assistant Secretary, Nuveen Asset Management and Nuveen Investments Holdings, Inc.; Vice President (since 2007) and Assistant Secretary, Nuveen Investment Advisers Inc., Nuveen Investment Institutional Services Group LLC, NWQ Investment Management Company, LLC, Tradewinds Global Investors LLC, NWQ Holdings, LLC, Symphony Asset Management LLC, Santa Barbara Asset Management LLC, Nuveen HydePark Group, LLC and Nuveen Investment Solutions, Inc. (since 2007); prior thereto, Partner, Bell, Boyd & Lloyd LLP (1997-2007). | | 199 |
John V. Miller 4/10/67 333 W. Wacker Drive Chicago, IL 60606 | | Vice President | | 2007 | | Managing Director (since 2007), formerly, Vice President (2002-2007) of Nuveen Asset Management and Nuveen Investments, LLC; Chartered Financial Analyst. | | 199 |
Gregory Mino 1/4/1971 333 W. Wacker Drive Chicago, IL 60606 | | Vice President | | 2009 | | Vice President of Nuveen Investments, LLC (since 2008); previously, Director (2004-2007) and Executive Director (2007-2008) of UBS Global Asset Management; previously, Vice President (2000-2003) and Director (2003-2004) of Merrill Lynch Investment Managers; Chartered Financial Analyst. | | 199 |
Christopher M. Rohrbacher 8/1/71 333 W. Wacker Drive Chicago, IL 60606 | | Vice President and Assistant Secretary | | 2008 | | Vice President, Nuveen Investments, LLC (since 2008); Vice President and Assistant Secretary, Nuveen Asset Management (since 2008); prior thereto, Associate, Skadden, Arps, Slate Meagher & Flom LLP (2002-2008) | | 199 |
James F. Ruane 7/3/62 333 W. Wacker Drive Chicago, IL 60606 | | Vice President and Assistant Secretary | | 2007 | | Vice President, Nuveen Investments (since 2007); prior thereto, Partner, Deloitte & Touche USA LLP (2005-2007), formerly, senior tax manager (2002-2005); Certified Public Accountant. | | 199 |
John S. White 5/12/67 333 W. Wacker Drive Chicago, IL 60606 | | Vice President | | 2007 | | Senior Vice President (since 2009), formerly, Vice President (2006-2009) of Nuveen Investments, LLC, formerly, Assistant Vice President (since 2002); Lieutenant Colonel (since 2007), United States Marine Corps Reserve, formerly, Major (since 2001). | | 74 |
Mark L. Winget 12/21/68 333 W. Wacker Drive Chicago, IL 60606 | | Vice President and Assistant Secretary | | 2008 | | Vice President, Nuveen Investments, LLC (since 2008); Vice President and Assistant Secretary, Nuveen Asset Management (since 2008); prior thereto, Counsel, VedderPrice P.C. (1997-2007). | | 199 |
| (1) | Trustees serve an indefinite term until his/her successor is elected or appointed. The year first elected or appointed represents the year in which the trustee was first elected or appointed to any fund in the Nuveen Fund Complex. |
| (2) | Mr. Amboian is an interested trustee because of his position with Nuveen Investments, Inc. and certain of its subsidiaries, which are affiliates of the Nuveen Funds. |
| (3) | Nuveen Advisory Corp. and Nuveen Institutional Advisory Corp. were reorganized into Nuveen Asset Management, effective January 1, 2005. |
| (4) | Officers serve one year terms through July of each year. The year first elected or appointed represents the year in which the officer was first elected or appointed to any fund in the Nuveen Fund Complex. |
Glossary of Terms Used in this Report
Average Annual Total Return: This is a commonly used method to express an investment’s performance over a particular, usually multi-year time period. It expresses the return that would have been necessary each year to equal the investment’s actual cumulative performance (including change in NAV or offer price and reinvested dividends and capital gains distributions, if any) over the time period being considered.
Net Asset Value (NAV): A Fund’s NAV is the dollar value of one share in the Fund. It is calculated by subtracting the liabilities of the Fund from its total assets and then dividing the remainder by the number of shares outstanding. Fund NAVs are calculated at the end of each business day.
Fund Information
Fund Manager
Nuveen Asset Management
333 West Wacker Drive
Chicago, IL 60606
Sub-Adviser
Nuveen Investment Solutions, Inc.
111 West Jackson Blvd.
Suite 1411
Chicago, IL 60604
Legal Counsel
Chapman and Cutler LLP
Chicago, IL
Independent Registered Public Accounting Firm
PricewaterhouseCoopers LLP
Chicago, IL
Custodian
State Street Bank & Trust Company
Boston, MA
Transfer Agent and Shareholder Services
Boston Financial
Data Services
Nuveen Investor Services
P.O. Box 8530
Boston, MA 02266-8530
(800) 257-8787
Distribution Information: Growth Allocation, Moderate Allocation and Conservative Allocation hereby designate 31.88%, 38.61% and 78.52%, respectively, of dividends paid from net ordinary income as dividends qualifying for the 70% dividends received deduction for corporations and 71.84%, 53.65% and 91.25%, respectively, as qualified dividend income for individuals under Section 1 (h)(11) of the Internal Revenue Code. The actual qualified dividend income distributions will be reported to shareholders on Form 1099-DIV which will be sent to shareholders shortly after calendar year end.
Quarterly Portfolio of Investments and Proxy Voting Information: You may obtain (i) each Fund’s quarterly portfolio of investments, (ii) information regarding how the Funds voted proxies relating to portfolio securities held during the most recent twelve-month period ended June 30, 2009, and (iii) a description of the policies and procedures that the Funds used to determine how to vote proxies relating to portfolio securities without charge, upon request, by calling Nuveen Investments at (800) 257-8787 or on Nuveen’s website at www.nuveen.com.
You may also obtain this and other Fund information directly from the Securities and Exchange Commission (“SEC”). The SEC may charge a copying fee for this information. Visit the SEC on-line at http://www.sec.gov or in person at the SEC’s Public Reference Room in Washington, D.C. Call the SEC at (202) 942-8090 for room hours and operation. You may also request Fund information by sending an e-mail request to publicinfo@sec.gov or by writing to the SEC’s Public Reference Section at 100 F Street NE, Washington, D.C. 20549.
The Financial Industry Regulatory Authority (FINRA) provides a Public Disclosure Program which supplies certain information regarding the disciplinary history of FINRA members and their associated persons in response to either telephone inquiries at (800) 289-9999 or written inquiries at www.finra.org. Financial Industry Regulatory Authority also provides an investor brochure that includes information describing the Public Disclosure Program.
Nuveen Investments:
Serving Investors For Generations
Since 1898, financial advisors and their clients have relied on Nuveen Investments to provide dependable investment solutions. Over this time, Nuveen Investments has adhered to the belief that the best approach to investing is to apply conservative risk-management principles to help minimize volatility.
Building on this tradition, we today offer a range of high quality equity and fixed-income solutions that can be integral parts of a well-diversified core portfolio. Our clients have come to appreciate this diversity, as well as our continued adherence to proven, long-term investing principles.
We offer many different investing solutions
for our clients’ different needs.
Nuveen Investments is a global investment management firm that seeks to help secure the long-term goals of institutions and high net worth investors as well as the consultants and financial advisors who serve them. Nuveen Investments markets its growing range of specialized investment solutions under the high-quality brands of HydePark, NWQ, Nuveen, Santa Barbara, Symphony, Tradewinds and Winslow Capital. In total, the Company managed $128 billion of assets on June 30, 2009.
Find out how we can help you reach your financial goals.
An investor should carefully consider the Fund’s objectives, risks, charges and expenses before investing. For a prospectus containing this and other information about the Fund, please contact your financial advisor or Nuveen Investments at (800) 257-8787. Read the prospectus carefully before you invest or send money.
Learn more about Nuveen Funds at www.nuveen.com/mf
| | |
Distributed by Nuveen Investments, LLC 333 West Wacker Drive Chicago, IL 60606 www.nuveen.com | | |
MAN-ALLO-0609P

Mutual Funds
Nuveen Value Funds
For investors seeking long-term capital appreciation.
Annual Report
June 30, 2009
| | | | | | | | | | | | | | | | |
| Nuveen Multi-Manager Large-Cap Value Fund | | | | Nuveen NWQ
Multi-Cap
Value Fund | | | | Nuveen NWQ
Large-Cap
Value Fund | | | | Nuveen NWQ
Small/Mid-Cap
Value Fund | | | | Nuveen NWQ
Small-Cap
Value Fund |
| | | | | | | | | | | | | | | | |
Nuveen Tradewinds Value Opportunities Fund | | | | | | | | | | | | | | | | |
LIFE IS COMPLEX.
Nuveen makes things e-simple.
It only takes a minute to sign up for e-Reports. Once enrolled, you’ll receive an e-mail as soon as your Nuveen Investments Fund information is ready. No more waiting for delivery by regular mail. Just click on the link within the e-mail to see the report and save it on your computer if you wish.
Free e-Reports right to your e-mail!
www.investordelivery.com
If you receive your Nuveen Fund dividends and statements from your financial advisor or brokerage account.
OR
www.nuveen.com/accountaccess
If you receive your Nuveen Fund dividends and statements directly from Nuveen.
| | | | | | |
| Must be preceded by or accompanied by a prospectus. | | NOT FDIC INSURED | | MAY LOSE VALUE | | NO BANK GUARANTEE |
Chairman’s
Letter to Shareholders

Dear Shareholder,
The problems in the U.S. financial system and the slowdown in global economic activity continue to create a very difficult environment for the U.S. economy. The administration, the Federal Reserve System and Congress have initiated a variety of programs directed at restoring liquidity to the financial markets, providing financial support for critical financial institutions and stimulating economic activity. There are encouraging signs that these initiatives are beginning to have a constructive impact. It is not possible to predict whether the actions taken to date will be sufficient to restore more normal conditions in the financial markets or enable the economy to stabilize and set a course toward recovery. However, the speed and scope of the government’s actions are very encouraging and more importantly, reflect a commitment to act decisively to meet the economic challenges we face.
The performance information in the attached report reflects the impact of many forces at work in the equity and fixed-income markets. The comments by the portfolio managers describe the strategies being used to pursue your Fund’s long-term investment goals. Parts of the financial markets continue to experience serious dislocations and thorough research and strong investment disciplines have never been more important in identifying risks and opportunities. I hope you will read this information carefully.
Your Board is particularly sensitive to our shareholders’ concerns in these uncertain times. We believe that frequent and thorough communication is essential in this regard and encourage you to visit the Nuveen website: www.nuveen.com, for recent developments in all Nuveen funds. We also encourage you to communicate with your financial consultant for answers to your questions and to seek advice on your long-term investment strategy in the current market environment.
On behalf of myself and the other members of your Fund’s Board, we look forward to continuing to earn your trust in the months and years ahead.
Sincerely,

Robert P. Bremner
Chairman of the Nuveen Fund Board
August 24, 2009
Portfolio Managers’ Comments
Certain statements in this report are forward-looking statements. Discussions of specific investments are for illustration only and are not intended as recommendations of individual investments. The forward-looking statements and other views expressed herein are those of the portfolio managers as of the date of this report. Actual future results or occurrences may differ significantly from those anticipated in any forward-looking statements and the views expressed herein are subject to change at any time, due to numerous market and other factors. The Funds disclaim any obligation to update publicly or revise any forward-looking statements or views expressed herein.
The Nuveen Multi-Manager Large-Cap Value Fund is co-managed by Institutional Capital LLC (ICAP), Nuveen HydePark Group, LLC (HydePark), and Symphony Asset Management, LLC (Symphony). Both HydePark and Symphony are affiliates of Nuveen Investments. Jerrold Sensor oversees the portion of the Fund’s assets managed by ICAP, while David Tierney, PhD, John Gambla, CFA, and Rob Guttschow, CFA, perform a similar function at HydePark. David Wang oversees the portion of the Fund’s assets managed by Symphony. All these individuals have more than 15 years of investment industry experience.
The Nuveen NWQ Multi-Cap Value Fund, Nuveen NWQ Large-Cap Value Fund, Nuveen NWQ Small/Mid-Cap Value Fund and Nuveen NWQ Small-Cap Value Fund feature equity management by NWQ Investment Management Company, LLC (NWQ), an affiliate of Nuveen Investments. Jon Bosse is the Chief Investment Officer of NWQ and manages the Nuveen NWQ Multi-Cap Value and the Nuveen NWQ Large-Cap Value Funds, Phyllis Thomas manages the Nuveen NWQ Small-Cap Value and the Nuveen NWQ Small/Mid-Cap Value Funds. Both Jon and Phyllis have more than 20 years of investment industry experience.
The Nuveen Tradewinds Value Opportunities Fund features portfolio management by Tradewinds Global Investors, LLC (Tradewinds), an affiliate of Nuveen Investments. Dave Iben, Chief Investment Officer of Tradewinds, is the portfolio manager for the Nuveen Tradewinds Value Opportunities Fund. Dave has more than 25 years of investment management experience.
In the following discussion, representatives from each management team review general market conditions, key investment strategies and the performance of the Funds for the twelve-month period ended June 30, 2009.
What were the general market conditions during the period?
This twelve-month period was among the most volatile in the history of the capital markets. Equity markets across the globe fell as the United States economy pushed further into recession. After IndyMac’s bankruptcy filing in August 2008, the U.S. Government engaged in one of the most dramatic market interventions in years and placed the Federal National Mortgage Association (Fannie Mae) and the Federal Home Loan Mortgage Corporation (Freddie Mac) into receivership. In September, Lehman Brothers, a major Wall Street broker/dealer, filed for bankruptcy protection. AIG, one of the world’s largest insurers, effectively was nationalized by the US government, and Wachovia, Washington Mutual and other financial institutions were seized by U.S. regulators and/or merged into stronger banks. Merrill Lynch, concerned about its own solvency, negotiated a deal to be acquired by Bank of America. Goldman Sachs and Morgan Stanley converted to commercial banks, possibly signaling the end of the
independent broker/dealer model. The following months included major financial write-downs in many areas of the U.S. economy, the uncovering of the largest Ponzi scheme in history, continued declines in real U.S. Gross Domestic Product, and significant spikes in market volatility.
While the U.S. economy moved further into recession, the international capital markets experienced their own severe downturn. Unemployment rose quickly. Economic policy responses by the U.S. Federal Reserve were followed, in part, by its counterparts at the Bank of England, the European Central Bank, and the Chinese Government.
Although the S&P 500 and the MSCI EAFE indices were down 37% and 43%, respectively, in 2008, signs of global economic stability began to emerge toward the end of the first quarter in 2009. By the end of June, the 2009 year-to-date returns of these two equity indices were 3% and 8%, respectively. In addition, emerging markets, which fell 53% in 2008, rebounded 36% during the first half of 2009.
In an effort to improve overall conditions, the Federal Reserve (Fed) lowered the fed funds rate from 2.00% on July 1, 2008, to a target range of zero to 0.25% in December 2008, its lowest level on record. In March 2009, the Fed announced that, in addition to maintaining the current target rate, it would buy $300 billion in long-term Treasury securities in an effort to support private credit markets and up to an additional $750 billion (for a total of $1.25 trillion) in agency mortgage-backed securities to bolster the housing market. Additionally, the federal government passed a $700 billion financial industry rescue package in October 2008, which was followed by a $787 billion stimulus package approved in February 2009.
By the second quarter of 2009, some positive signals began to emerge. Many major banks appeared to have raised the necessary capital for them to survive in the current downturn, with several of them even appearing to thrive. Domestic equity markets, as measured by the S&P 500 Index, have rocketed up from the lows experienced in March. Ten-year bond yields have come off their multi-decade lows as well.
How did the Funds perform during the twelve months ended June 30, 2009?
The table on page 18 provides performance information for the six Funds (Class A shares at net asset value) for the one-year, five-year, ten-year and since inception periods ended June 30, 2009. The table also compares the Funds’ performance to appropriate benchmarks and general market indexes. A more detailed discussion of each Fund’s relative performance is provided later in this report.
What strategies were used to manage the Funds during the reporting period? How did these strategies influence performance?
Nuveen Multi-Manager Large-Cap Value Fund
The Nuveen Multi-Manager Large-Cap Value Fund’s Class A Shares at net asset value underperformed its comparative indexes over the past twelve months ending June 30, 2009.
The Fund uses three separate sub-advisors to seek large capitalization value stocks with the potential for long-term capital appreciation. ICAP uses a value-oriented investment strategy that attempts to identify stocks offering the best relative value and stable to rising earnings from a universe of large and mid-sized companies. It then selects a portion of those stocks that are identified to have a catalyst for change, and monitors these holdings closely to determine if circumstances change. HydePark’s investment process does not endeavor to pick individual stocks. Rather, the investment process is implemented through proprietary software that takes a given benchmark, along with specified tracking risk, and produces a portfolio that seeks to maximize value-added performance within the defined risk parameters relative to the benchmark. Symphony’s investment process consists of a combination of quantitative screens and fundamental research which seek to create portfolios that deliver consistent returns. The portfolio construction process utilizes a proprietary optimizer designed to potentially generate an optimal risk reward balance versus the stated benchmark.
Within the ICAP-managed portion of the Fund, both stock selection and sector allocation added to relative performance. Specifically, this portion of the portfolio benefited from strong stock selection in the energy, consumer staples, and health care sectors, while a large overweighting in technology stocks relative to the index also helped. In contrast, stock selection in communications, capital spending, and consumer services hampered performance, as did an underweighting in the relatively strong-performing consumer services sector.
During the reporting period, ICAP maintained its established, bottom-up stock-selection process by choosing investments one-by-one based on an assessment of their business fundamentals. Noteworthy portfolio changes included increased exposure to the technology, transportation, and health care sectors. ICAP also decreased its allocation to consumer services and communications stocks. Between March 2009 and the end of the period, the exposure of this portion of the portfolio to economically sensitive stocks rose considerably, as ICAP saw more reasons to be optimistic about corporate profits and the economy’s growth potential. ICAP continued to emphasize companies with strong
financial positions and operational capabilities – qualities they believe can help these firms gain market share from weaker competitors and more easily grow their earnings.
ICAP’s top performance contributor was pharmaceutical maker Schering-Plough Corp., whose shares rose sharply after the company agreed to be acquired by rival Merck. Financial services firm JPMorgan Chase, which because of its stronger financial position outperformed many of its competitors during last fall’s credit crisis, also added to results. Qualcomm, a maker of chips for mobile telephones, contributed further. This stock rose as investors became more optimistic about the technology sector’s growth prospects. We sold our stake in Qualcomm after its stock hit our target price. A recovering semiconductor market also helped industry-leading chipmaker Intel. Elsewhere, international oil and gas company Occidental Petroleum Corp. saw its shares rise as a result of strong growth in energy production and free cash flows.
Given the turmoil in the financial sector for much of the period, many of ICAP’s biggest performance detractors came from that group. Fund performance was hampered by an investment in Bank of America. Banking and credit card company Capital One Financial Corp. also underperformed, with the credit crisis and the economic downturn weighing on its profits. In the health care sector, medical insurance provider CIGNA Corp. lost ground, as the economic downturn threatened to reduce enrollment in its health care plans, while weaker advertising revenues weighed on media company News Corporation. Of final note, oilfield services company Baker Hughes Inc. was hurt by lower oil prices for much of the period, which meant less demand for the firm’s energy-exploration services. As of period end, the Fund continued to own Baker Hughes but no longer held CIGNA or News Corporation in ICAP’s portion of its portfolio.
The proprietary risk-controlled HydePark wealth creation model was used to manage its portion of the Fund. This model utilizes both fundamental and momentum-related criteria to create a portfolio designed to maximize the reward-to-risk ratio.
HydePark’s investment process is a combination of traditional fundamental security valuation and quantitative risk-control techniques. The philosophy that underlies our value-added process is that a stock’s price must follow the wealth creation fundamentals of the company. A stock’s weight in the portfolio is directly related to its wealth creation fundamentals. Our process has five “wealth creation” factors. Four are fundamentally oriented; two are traditional measures of revenues in excess of expenses (specifically, earnings and cash flow), and two are traditional measures of the uses for those excess monies (book value and dividends). The fifth factor is a proprietary measure of stock price momentum. Importantly, the process also considers a stock’s liquidity. Due to the
quantitative, model-driven process, top-down macroeconomic “themes” do not influence the model nor how HydePark select stocks for the Fund.
The model evaluates all the securities contained in the benchmark portfolio (Russell 1000 Value Index) for possible inclusion in the portfolio. The process will not consider a stock for possible inclusion if it is not contained in the respective benchmark portfolio. This process produces what HydePark believes are well-diversified, efficient portfolios that attempt to perform within a specific, narrow tracking range (the degree of difference) versus the stated benchmark. The portfolio typically contains a large number of holdings with each relative weighting reflecting the five-dimensional view of that stock’s wealth creation characteristics. The portfolio is monitored daily with rebalances occurring quarterly.
HydePark believes that the quantitative, risk-controlled process described above should, under normal circumstances, cause its portion of the Fund’s portfolio to track its benchmark portfolio closely, with value-added potential coming from relative overweights/underweights of each stock versus the index. HydePark attempts to express an overweight/underweight opinion on every stock in the benchmark based on our analysis of its five wealth creation factors.
The sum of the Fund’s individual security overweights/underweights versus the index is, by definition, equal to zero; however, the HydePark process does not constrain the portfolio to be industry or sector neutral relative to the benchmark. As a result, our portion of the Fund sometimes was overweight stocks within a sector because the individual stocks within that sector had what we judged to be attractive wealth creation fundamentals versus the benchmark in aggregate. Performance for this portion of the portfolio can then be viewed in two parts: return attributable to the Fund’s sector weightings and return attributable to the performance of individual stocks within each sector.
On average, during the twelve-month period, the HydePark portion of the Fund was relatively overweighted in energy, telecommunication services, and utilities. The largest single sector overweight was in energy where we were, on average, 2.7% overweight versus the index. The Fund was underweight the following sectors, on average: industrials, consumer staples, health care, financials, and information technology. The largest single underweight was, on average, in health care stocks where we were 2.4% underweight versus the index. Overall, the sector overweights/underweights were a small drag on this portion of the Fund’s portfolio relative performance versus the index.
Performance attributable to the individual stock weightings within each sector was a strong positive for the HydePark portfolio during this period, with our individual holdings in financials outperforming the financials sector by a large margin. The correct choice of individual stocks within the financial sector was the biggest positive for this portion of the
Fund during this reporting period. Our stock choices within telecommunication and utilities were also a plus for the Fund while our stock picks in energy and information technology were negatives.
In the Symphony portion of the Fund, our overarching theme was an aversion to credit sensitive names, high financial leverage and vulnerable capital structures, and a preference for companies with strong cash flow generation, conservative management and market leadership.
From the beginning of 2009 until March 9th, the Symphony strategy performed well, as the market was fundamentally challenged and in our opinion differentiating perceived winners such as JPMorgan from weaker, more vulnerable companies such as Citigroup. Our aversion to these credit sensitive and high leveraged names led us to significantly underweight life insurance, regional banks, broker dealers, and real estate investment trusts. Following Citigroup’s announcement on March 9th regarding its return to profitability for the quarter, our strategy did not do as well because investors’ risk appetite swelled and propelled a rally among stocks that previously had suffered from liquidity and operational concerns.
The Symphony portion of the portfolio benefited from strong stock selection in the energy and industrial sectors. Freeport-McMoran, the world’s largest publicly traded copper mining firm, advanced due to the rising price of copper resulting from Chinese government stimulus and apparent restocking of Chinese inventories. Shares rallied 87% in the first half 2009. The Fund also benefited versus the index by avoiding owning General Electric, which fell 25% in the first half of 2009. Occidental Petroleum Corp. helped relative performance as the firm reported strong results in the first quarter of 2009 and late in the second quarter announced a new discovery in California.
The portfolio was negatively impacted by holdings in the financials and technology sectors. Underperformance was primarily centered on the month of April, given the Fund’s relatively defensive initial posture. We were hurt primarily by the rally in lower quality names that we did not own. Although the relative safety of Hudson City Bancorp, Inc. helped the Fund in 2008, it lagged its peers in the first six months of 2009.
Nuveen NWQ Multi-Cap Value Fund
Class A Shares at net asset value for the Nuveen NWQ Multi-Cap Value Fund underperformed each of its comparative indexes for the twelve-month period ended June 30, 2009. As noted, this twelve-month period proved to be one of the worst for equity markets since the Great Depression. This is reflected in the one-year returns for the general market indexes, as well as in the Fund’s performance.
While the Fund’s managers sought to mitigate the effects of the poor market environment where possible, they did not alter the Fund’s basic investment strategy. The Fund seeks long-term capital appreciation by investing in equity securities of companies with large, medium and small market capitalizations that are selected on an opportunistic basis. Generally, the Fund’s managers look for undervalued companies where catalysts exist that may help unlock value or improve profitability. Such catalysts can be new management, improving fundamentals, renewed management focus, industry consolidation or company restructuring.
Disruptions in the financial markets during the period plagued most of the Fund’s financial services sector holdings, including Genworth Financial Inc. and Hartford Financial Services Group, Inc., as investors became increasingly wary of the insurance industry. Capital adequacy for insurance companies came into question in the face of rising realized and unrealized losses and declining equity markets, which put a strain on regulatory capital for firms with exposure to equity-sensitive products, such as variable life and variable annuities. Rising losses in Genworth’s U.S. mortgage insurance business was also a major concern for that company, and uncertainty over potential rating agency downgrades within the life insurance group has compounded the issue. We would note, however, that Genworth shares more than doubled in the first six months of 2009.
The Fund’s investment in Viacom Inc. also declined as the downturn in the economy led to lower cable network advertising spending and placed pressure on the company’s earnings for the year. Additionally, the stock faced overhang pressures from the forced selling of shares by Chairman Sumner Redstone to refinance his personal loans. While Viacom’s near-term earnings potential will continue to be weakened by a soft advertising environment, we believe the company’s strong free cash flow, growth in affiliate fees, and lack of credit concerns makes the company attractively valued.
U.S. Steel Corp. declined as management warned that earnings would be pressured due to seasonal weakness, the slowdown in the global economy, and declines in overall steel prices.
The Fund did have several selections that positively impacted performance. Despite volatility in the price of gold over the year, AngloGold Ashanti was one of the best performing stocks among the senior gold producers. AngloGold continued to post strong operational results, as the company sold its Boddington project in Australia for $907 million in after-tax proceeds and will use the cash to strengthen its balance sheet.
Amgen Inc. shares also appreciated after the company disclosed the results of its Phase 3 data for denosumab, its novel biologic drug to combat osteoporosis. In addition, Amgen continued to post solid quarterly results on the back of significant cost reductions and prudent free cash flow redeployment into share buyback and strategic tack-on acquisitions.
We took advantage of the extreme dislocations in the market over the twelve-month period to add a number of new investments to the Fund. In December 2008, we established a new position in CF Industries Holdings Inc., one of the largest manufacturers and distributors of nitrogen and phosphate fertilizer in North America. The stock rose in the first part of 2009 as nitrogen and phosphate prices have begun to rebound. In the energy sector, we added new positions in BJ Services and EOG Resources after significant corrections in their share prices. BJ Services is a leading worldwide provider of pressure pumping and oilfield services. We felt the stock offered attractive downside protection, and was well positioned to benefit from any increase in pumping demand from unconventional natural gas projects. We sold this position before the end of the period. EOG Resources is a crude oil and natural gas exploration and production (E&P) company that has historically sold at a significant premium to other E&P companies. We were able to initiate a position in EOG at only a slight premium to its peers.
We also made an investment in Loews Corp. as our analysis showed the stock’s discount to the sum of its parts exceeded 30%, more than double its historical average. We believe the stock would remain undervalued even if Loews wrote off its entire CNA position. After initiating a position in the Reinsurance Group of America Inc. (RGA) in the fourth quarter of 2008, we substantially increased our weighting on price weakness during the first quarter of 2009. We believe that RGA is well positioned to take advantage of the current turmoil and need for life insurance companies to use reinsurance as an alternative to raising capital.
We initiated a position in Redwood Trust Inc., a mortgage Real Estate Investment Trust (REIT), after the company had completed a secondary equity offering in January 2009. Redwood Trust invests primarily in residential mortgage backed securities and differs from many traditional mortgage REITs in that it has extremely low leverage.
The Fund also eliminated a number of portfolio holdings during the year. In October 2008, we eliminated our position in Citigroup, Inc. after Wells Fargo & Company topped Citigroup’s U.S. government-assisted bid for Wachovia’s banking assets. We believed that acquiring Wachovia would have strengthened Citigroup’s financial position. Without those assets, we believed Citigroup was in a weakened position. Additionally, we sold our position in pork producer, Smithfield Foods Inc., due to weak fundamentals and balance sheet leverage. We eliminated Sprint Nextel Corp. after concluding that a recession, negative trends in industry wireless subscriber growth, and the company’s debt level introduced greater risk for equity holders. Other eliminated holdings included Altria Group Inc., BJ Services Co., Comcast Corp., Liberty Media Interactive, Microsoft Corp., Quantum Corp., and Sappi Ltd.
Nuveen NWQ Large-Cap Value Fund
Class A Shares at net asset value for the Nuveen NWQ Large-Cap Value Fund underperformed each of its comparative indexes for the twelve-month period ended June 30, 2009.
The Fund continued to pursue a consistent investment strategy during this difficult period. The Fund seeks undervalued large- and mid-sized companies with identifiable catalysts that have the potential to improve profitability and appreciate over time. The Fund’s manager seeks to provide superior risk-adjusted returns through an analyst-driven, value-oriented process. Portfolio managers look for undervalued companies where catalysts exist to unlock value or improve profitability. Such catalysts can be new management, improving fundamentals, renewed management focus, industry consolidation or company restructuring.
As mentioned previously, weak economic conditions and disruptions in the financial markets plagued most of the financial services sector, including the Fund’s investments in Genworth Financial Inc. and Hartford Financial Services Group, Inc., as investors became increasingly wary of the insurance industry. Capital adequacy for insurance companies came into question in the face of rising realized and unrealized losses and declining equity markets, which put a strain on regulatory capital for firms with exposure to equity-sensitive products, such as variable life and variable annuities. Rising losses in Genworth’s U.S. mortgage insurance business was also a major concern for that company, and uncertainty over potential rating agency downgrades within the life insurance group has compounded the issue. We would note, however, that Genworth shares more than doubled in the first six months of 2009.
The Fund’s investment in Viacom Inc. also declined as the downturn in the economy led to lower cable network advertising spending and placed pressure on the company’s earnings for the year. Additionally, the stock faced overhang pressures from the forced selling of shares by Chairman Sumner Redstone to refinance his personal loans. While Viacom’s near-term earnings potential will continue to be weakened by a soft advertising environment, we believe the company’s strong free cash flow, growth in affiliate fees, and lack of credit concerns makes the company attractively valued.
U.S. Steel Corp. declined as management warned that earnings would be pressured due to seasonal weakness, the slowdown in the global economy, and declines in overall steel prices.
The Fund did have several selections that positively impacted performance. Despite volatility in the price of gold over the year, AngloGold Ashanti was one of the best
performing stocks among the senior gold producers. AngloGold continued to post strong operational results, as the company sold its Boddington project in Australia for $907 million in after-tax proceeds and will use the cash to strengthen its balance sheet.
Amgen Inc. shares also appreciated after the company disclosed the results of its Phase 3 data for denosumab, its novel biologic drug to combat osteoporosis. In addition, Amgen continued to post solid quarterly results on the back of significant cost reductions and prudent free cash flow redeployment into share buyback and strategic tack-on acquisitions.
We continued to take advantage of the extreme dislocations in the market to make adjustments to the portfolio. In December 2008, we eliminated our position in International Paper in favor of establishing a new position in Mosaic Company, a manufacturer of feed and fertilizer products. The dramatic market decline in late 2008 as well as fears of further fertilizer price deterioration had caused a dramatic sell-off in the stock price. Subsequent to our purchase, shares of Mosaic appreciated strongly (over 100%) as fundamentals in the nitrogen and phosphate markets have begun to rebound.
The Fund also established a new position in MetLife, Inc. on the heels of a public capital raise by the company. Although significant challenges remain within the financial sector, we believe MetLife possesses one of the best franchises in the life insurance industry, and its capital raise strengthened its capital position which may allow them to take advantage of acquisition opportunities.
We established a position in Merck & Co. Inc. as we thought the stock offered a compelling valuation and a disciplined management team that has not historically diluted its shareholders. In the energy sector, we added new positions in Halliburton Company and EOG Resources, Inc. after significant corrections in their share prices. Other new holdings include CBS Corp., Travelers Companies, Inc., and Union Pacific Corp.
The Fund also eliminated a number of portfolio holdings during the year. In October 2008, we sold our position in Citigroup, Inc. after Wells Fargo & Company topped Citigroup’s U.S. government-assisted bid for Wachovia’s banking assets. We believed that acquiring Wachovia would have strengthened Citigroup’s financial position. Without those assets, we believed Citigroup was in a weakened position. We sold Bank of America Corp. from the portfolio in September as its announced acquisition of Merrill Lynch introduced heightened risk in the short/intermediate term in exchange for purported long term benefits. We also sold Sprint Nextel Corp. given that a recession, negative trends in industry wireless subscriber growth, and its debt level introduced greater risk for equity holders. Other eliminated holdings include Altria Group Inc., ConocoPhillips, Illinois Tool Works Inc., and Liberty Media Interactive, among others.
Nuveen NWQ Small/Mid-Cap Value Fund
Class A Shares at net asset value for the Nuveen NWQ Small/Mid-Cap Value Fund underperformed each of its comparative indexes for the twelve-month period ended June 30, 2009.
As noted, the twelve-month period presented an especially challenging environment for all equities, including small- and mid-cap issues. Nevertheless, the Fund continued to follow its disciplined investment approach. The Fund seeks long-term capital appreciation by investing in equity securities of companies with small- to mid-market capitalizations selected using an analyst-driven, value-oriented process. Portfolio managers look for undervalued companies where catalysts exist to unlock value or improve profitability. Such catalysts can be new management, improving fundamentals, renewed management focus, industry consolidation or company restructuring.
While the generally negative market environment was a large factor in the Fund’s negative return during the period, several of the Fund’s holdings were particularly stressed. Sauer, a competitor in the mobile hydraulics industry, was negatively impacted by significantly weakened end market demand. This decreasing demand led to increased scrutiny of the company’s balance sheet even after it was able to refinance its debt by entering into a $490 million line of credit with majority shareholder Danfoss A/S. We sold this position before the end of the period. Early in the period, we also eliminated a position in Pacific Sunwear of California after a period of poor performance as the company suffered from very weak consumer demand. Reliant Energy also negatively impacted performance and was sold before the period ended. Higher coal prices and lower natural gas prices narrowed the pricing difference between the two energy components, contracting operating margins.
However, several holdings did contribute positively to performance throughout the period. Despite volatility in the price of gold over the year, AngloGold Ashanti was one of the best performing stocks among the senior gold producers. AngloGold continued to post strong operational results, as the company sold its Boddington project in Australia for $907 million in after-tax proceeds and will use the cash to strengthen its balance sheet. We sold our position in AngloGold before the end of the period.
We re-established a position in Denbury Resources Inc. toward the end of 2008, after having sold the stock at higher levels earlier in the year. The company subsequently rebounded from what we believed was an oversold position toward the end of 2008 and was one of the portfolio’s top performers during the annual reporting period. We believe the company remains very leveraged to increasing oil and gas prices. Casey’s General Stores, Inc. continued to meet expectations in its three operating segments – gasoline,
grocery & other merchandise, and prepared food and fountain – which led to attractive performance.
We took advantage of the extreme dislocations in the market to add a number of new investments to the Fund over the past twelve months. We initiated a position in Continental Resources, Inc., an independent oil and natural gas exploration and production company that we believe has very attractive prospects for production growth in its portfolio.
In December 2008, we established a new position in CF Industries Holdings Inc., one of the largest manufacturers and distributors of nitrogen and phosphate fertilizer in North America. The stock rose in the first part of 2009 as nitrogen and phosphate prices began to rebound. We sold the position before the period ended. After initiating a position in the Reinsurance Group of America Inc. (RGA) in the fourth quarter of 2008, we substantially increased our weighting on price weakness during the first quarter of 2009. We believe that RGA is well positioned to take advantage of the current turmoil and need for life insurance companies to use reinsurance as an alternative to raising capital.
We also initiated a position in StanCorp Financial Group, Inc., a leading provider of financial products and services, including disability and life insurance, retirement products and services, individual annuities, and investment advice.
We eliminated a number of portfolio holdings during the year, including Community Health Systems, Fossil, Newell Rubbermaid, Pacific Sunwear of California, Sappi, Acuity Brands, Domtar, Reliant Energy, Smithfield Foods, Agrium, Kennametal and Unum Group.
Nuveen NWQ Small-Cap Value Fund
Class A Shares at net asset value for the Nuveen NWQ Small-Cap Value Fund underperformed each of its comparative indexes for the twelve-month period ended June 30, 2009.
This period presented a challenging environment for all equities, including small-cap stocks. In spite of this market turmoil, the Fund continued to follow its disciplined investment approach. The Fund seeks long-term capital appreciation by investing in equity securities of companies with small market capitalizations selected using an analyst-driven, value-oriented process. NWQ seeks to provide superior risk-adjusted returns through an analyst-driven, value-oriented process. Portfolio managers look for undervalued companies where catalysts exist to unlock value or improve profitability. Such catalysts can be new management, improving fundamentals, renewed management focus, industry consolidation or company restructuring.
The Fund’s positions in Warren Resources Inc., Sauer-Danfoss, Pacific Sunwear of California and GSI Group all negatively impacted performance during the period. Warren
Resources was hurt by a sell-off in commodity prices during the reporting period and we sold our position before the period ended. Sauer, a competitor in the mobile hydraulics industry, was negatively impacted by significantly weakened end market demand. This decreasing demand led to increased scrutiny of the company’s balance sheet even after it was able to refinance its debt by entering into a $490 million line of credit with majority shareholder Danfoss A/S. We eliminated these positions in the first half of 2009. Early in the period, we also eliminated a position in Pacific Sunwear of California as the company suffered from very weak consumer demand. While we have had a lot of confidence in Pacific Sunwear’s management team, we believed a turnaround in this retail environment is extremely difficult. We also sold GSI Group during the year.
Brocade Communications Systems Inc. was the portfolio’s top performer during the period. Brocade’s stock benefited from a successful integration of its Network Foundry acquisition. In the second quarter of 2009 Brocade took significant share in the storage switch market, and those looking for a networking alternative to Cisco now have potential logical choice.
Denbury Resources rebounded from what we believed was an oversold position toward the end of 2008 and was one of the portfolio’s top performers for the annual reporting period. While we believe the company remains very leveraged to increasing oil and gas prices, we eliminated the position from the portfolio before the end of the reporting period as the company’s market cap significantly exceeded the upper market capitalization level of the Russell 2000 Value Index.
Yamana Gold also did well. A Canadian-based gold and precious metals producer, Yamana owns gold development stage properties, exploration properties, and land positions. We sold the Yamana position before the end of the period.
We took advantage of the extreme dislocations in the market to add a number of new investments to the Fund over the twelve months. After initiating a position in the Reinsurance Group of America Inc. (RGA) in the fourth quarter of 2008, we substantially increased our weighting on price weakness during the first quarter of 2009. We believe that RGA is well positioned to take advantage of the current turmoil and need for life insurance companies to use reinsurance as an alternative to raising capital.
Assurant Inc. is a provider of creditor-placed homeowner’s insurance, as well as other insurance lines. Assurant has a leading market position strong balance sheet and solid investment portfolio. We took a position in the stock close to the 2008 low, and it rebounded to close the reporting period as one of the portfolio’s top performers. PacWest Bancorp., a bank holding company, provides commercial banking services to small- and medium-sized businesses in southern California, Arizona, and Texas. We initiated our position based on the company’s strong capital position, quality management team, superior underwriting
standards, and attractive valuation. Texas Capital Bancshares, Inc. (TCBI) caters to business and private clients through its full-service locations in Texas. We initiated our position based on TCBI’s strong capital position, experienced management team, manageable credit quality position, and attractive valuation.
CIRCOR International Inc. provides fluid control valves to specialty niche markets including oil and gas and aerospace. New management in 2006 has dramatically improved the company’s competitive position through product innovation and improvements in operational efficiency. While the stock has weakened significantly in the last year reflecting industrial market weakness and a down cycle in energy capital spending, we believe the stock is very attractive at a price close to book value and with a debt free balance sheet.
We also initiated a holding in WABCO Holdings Inc., a leading producer of electric and electromechanical parts for trucks and buses. A dominant manufacturer in Europe, the company is expanding in Asia and North America.
We eliminated a number of portfolio holdings during the year. In addition to those already mentioned, others included Commscope, Community Health Systems, Fossil, Quantum, Sappi, Acuity Brands, Century Aluminum, Domtar, Smithfield Foods, CF Industries, Kennametal, and WD-40.
Nuveen Tradewinds Value Opportunities Fund
The Nuveen Tradewinds Value Opportunities Fund’s Class A Shares at net asset value outperformed both the Russell and Lipper indexes over the past twelve months ending June 30, 2009.
The Fund seeks long-term capital appreciation by investing in equity securities of companies with varying market capitalizations selected using an eclectic, value-oriented process. Tradewinds seeks to provide superior risk-adjusted returns through an analyst-driven, value-oriented approach. Portfolio managers look for undervalued companies where catalysts exist to unlock value or improve profitability. Such catalysts can be new management, improving fundamentals, renewed management focus, industry consolidation or company restructuring.
While we are bottom up, value investors, we are also keenly aware of the ever-changing world in which we live and its implications for the Fund’s portfolio. We are assessing the longer term implications for the global economy of increased government involvement in what were private enterprises and the recent rhetoric regarding protectionism of sovereign industries that is appearing. Also, as the world’s central banks continue to “print” money and inject unprecedented amounts of liquidity into markets, we have to be cognizant of the intended, and more importantly, unintended consequences of such actions. This has helped
markets to rally in the short term, and means that right now many individual companies are very attractively valued, while markets are generally attractively valued for long term investors. Given the fact that Tradewinds’ focus is to buy good businesses at attractive prices rather than timing markets, as well as to focus on the supply side of industry dynamics rather than the demand side, we have been trying to take advantage of investor over-optimism or pessimism to analyze and buy those companies other investors shun. We are currently finding good opportunities in the technology, telecommunications, transportation and utilities sectors, while we have recently been reducing exposure in the energy, materials and processing and producer durables sectors.
A significant portion of the Fund’s relative outperformance over the period was due to its relative overweight exposure to comparative strong returning sectors or stocks. The one exception was the technology sector, where the Fund underperformed the Russell Index on both an absolute and relative basis. The Fund’s return also was aided by its relative underexposure to the financials sector, which was the worst performing sector in the index.
Materials and processing was the Fund’s top performing sector, with three of the portfolio’s top ten performers, all gold companies. Though gold stocks performed particularly poorly in the third quarter of 2008 due to general underperformance by the gold mining industry and somewhat indiscriminate selling of these stocks, they rebounded and were the best performers in the fourth quarter of 2008 and first quarter of 2009. Lihir Gold Limited was the portfolio’s top performer, a gold producer in the Australasian region. Three of its primary assets – Lihir Island in Papua New Guinea, Bonikro in Cote d’Ivoire and Mt. Rawdon in Australia – performed well. Gold Fields Limited, a South Africa-based gold producing company, operates mines in South Africa, Ghana, Australia and Peru. The depreciation of the South African Rand reduced the company’s input costs and improved profitability margins. Kinross Gold Corporation is a senior gold producer with operations located in the United States, Brazil, Chile and Russia. The company has had a strong production growth and lowered its unit costs. Generally, gold companies were aided by strengthening gold prices and a slowly returning level of normalcy in equity markets.
Another strong performer was Tata Motors Limited, ADR, a member of the producer durables sector. The company is India’s largest truck maker, and its principal activities are to manufacture and market commercial, utility and passenger vehicles. The company was able to arrange refinancing for a bridge loan. This eased investor concerns and the stock rallied at the news.
Whole Foods Market, Inc. in the consumer staples sector also performed well. The company has taken positive steps to reduce its development costs due to its rapid store expansion and in March 2009 announced that it had reached its antitrust settlement with the Federal over its proposed merger with competitor Wild Oats. Despite the strong return from Whole Foods, the sector also had one of the worst detractors to Fund performance.
Smithfield Foods, Inc., a hog producer, and pork processor, saw its share price declined significantly during the second half of 2008 and first quarter of 2009 due to the fish disease problems in South America, low product pricing, oversupply of hogs, weak domestic demand and concerns regarding the company’s debt covenants.
Health care was the third best performing sector for the Fund. Its top holding was Apria Healthcare Group Incorporated, a provider of a range of home health care services with three service lines: home respiratory therapy, home infusion therapy and home medical equipment. In October 2008, the company was acquired by The Blackstone Group L.P.. We no longer hold Blackstone Group at the end of the reporting period. Another positive contributor to performance from this sector was Amgen Incorporated. The company develops, manufactures and markets human therapeutics based on advances in cellular and molecular biology. While the health care sector outperformed, one of its members, Health Net Inc., was a detractor to Fund performance. The company delivers managed healthcare services and its stock price fell in the fourth quarter of 2008 after the company forecasted lower revenue and higher costs, primarily in its commercial business. The stock price did rebound somewhat in the first half of 2009, spurred by better than expected first quarter earnings.
Despite the relative outperformance of the materials and processing sector, two of its members were also among the worst detractors in the Fund for this period. Domtar Corp., a manufacturer and marketer of paper and pulp in North America, underperformed due to oversupply, decreasing demand for paper and looming concerns over the company’s ability to refinance its 2011 debt maturities. AngloGold Ashanti Limited was another poor performer recently. The stock enjoyed a strong run in 2008, but its short-term outlook looks cloudy because of safety-related work stoppages and contentious labor unions relations. The position was sold before the end of the period.
The unprecedented drop in energy commodity prices in the second half of 2008 led the energy sector to be the worst performing sector for the period on an absolute basis. Shares of coal related stocks declined significantly as oil and gas prices continued to decline. The biggest detractor to Fund’s performance from this sector was Arch Coal Inc., whose investors are concerned by the recent company’s weaker than expected earnings. Another significant detractor to performance was Warren Resources Inc. an independent energy company engaged in the exploration and development of onshore oil and gas reserves.
Sprint Nextel Corp., a global communication company, was another detractor to performance. The company performed poorly in the second half of 2008 because it was unable to moderate subscriber losses and its significant balance sheet debt as it continued to navigate the merger of Sprint and Nextel. The position was sold before the end of the period.
| 1 | The since-inception return for the Nuveen Multi-Manager Large-Cap Value Fund is as of 8/7/96, Nuveen NWQ Multi-Cap Value Fund is calculated from 11/4/97, and the Nuveen NWQ Large-Cap Value Fund is from 12/15/06 |
| 2 | The Lipper Funds Indexes are managed indexes that represent the average annualized returns of the 30 largest funds in each respective Lipper Funds category. The since inception return for the Lipper Multi-Cap Value Funds Index for the Nuveen NWQ Multi-Cap Value Fund represent returns for the period 11/30/97-6/30/08 as returns for that time period are only available on a calendar month basis. The returns assume reinvestment of dividends, but do not reflect any applicable sales charges. You cannot invest directly in an index. |
| 3 | The Russell 1000 Value Index is a market-capitalization weighted index of those firms in the Russell 1000 Index with lower price-to-book ratios and lower forecasted growth values. The S&P 500 Index is an unmanaged index generally considered to be representative of the U.S. stock market. The Russell 3000 Value Index is a market-capitalization weighted index of those firms in the Russell 3000 Index with lower price-to-book ratios and lower forecasted growth values. The stocks in this index are also members of either the Russell 1000 Value or the Russell 2000 Value Indexes. The index returns assume reinvestment of dividends and do not reflect any applicable sales charges. You cannot invest directly in an index. |
Class A Shares – Average Annual Total Returns
As of 6/30/09
| | | | | | | | |
| | | 1-Year | | 5-Year | | 10-Year | | Since
Inception1 |
Nuveen Multi-Manager Large-Cap Value Fund | | | | | | | | |
A Shares at NAV | | -28.95% | | -0.56% | | -0.08% | | 4.88% |
A Shares at Offer | | -33.03% | | -1.74% | | -0.67% | | 4.40% |
Lipper Large-Cap Value Funds Index2 | | -26.95% | | -2.40% | | -0.62% | | 4.11% |
Russell 1000 Value Index3 | | -29.03% | | -2.13% | | -0.15% | | 5.44% |
S&P 500 Index3 | | -26.21% | | -2.24% | | -2.22% | | 4.35% |
Nuveen NWQ Multi-Cap Value Fund | | | | | | | | |
A Shares at NAV | | -34.12% | | -5.70% | | 2.56% | | 4.45% |
A Shares at Offer | | -37.91% | | -6.81% | | 1.95% | | 3.93% |
Lipper Multi-Cap Value Funds Index2 | | -26.87% | | -2.45% | | 1.26% | | 2.13% |
Russell 3000 Value Index3 | | -28.73% | | -2.14% | | 0.21% | | 2.56% |
S&P 500 Index3 | | -26.21% | | -2.24% | | -2.22% | | 1.39% |
Nuveen NWQ Large-Cap Value Fund | | | | | | | | |
A Shares at NAV | | -26.57% | | N/A | | N/A | | -16.01% |
A Shares at Offer | | -30.79% | | N/A | | N/A | | -17.94% |
Lipper Multi-Cap Value Funds Index2 | | -26.87% | | N/A | | N/A | | -16.48% |
Russell 1000 Value Index3 | | -29.03% | | N/A | | N/A | | -17.57% |
Effective December 6, 2002, based on shareholder approval, the Nuveen NWQ Multi-Cap Value Fund acquired the assets and performance history of the PBHG Special Equity Fund. The Fund had no assets prior to the acquisition. In addition, on December 14, 2001, the PBHG Special Equity Fund acquired the assets of the NWQ Special Equity Portfolio. The information presented for the Nuveen NWQ Multi-Cap Value Fund prior to the acquisition date represents the expense adjusted performance of the predecessor funds.
Returns quoted represent past performance, which is no guarantee of future results. Current performance may be higher or lower than the performance shown. Investment returns and principal value will fluctuate so that when shares are redeemed, they may be worth more or less than their original cost. Class A shares have a 5.75% maximum sales charge. Returns at NAV would be lower if sales charges were included. Returns do not reflect the deduction of taxes that a shareholder would pay on Fund distributions or the redemption of shares. Returns reflect a voluntary expense limitation by the Funds’ investment adviser that may be modified or discontinued at any time without notice. For the most recent month-end performance, visit www.nuveen.com or call (800) 257-8787.
Please see each Fund’s Spotlight Page later in this report for more complete performance data and expense ratios.
| 1 | The since-inception return for the Nuveen NWQ Small/Mid-Cap Value Fund is as of 12/15/06 while the Nuveen NWQ Small-Cap Value Fund and Nuveen Tradewinds Value Opportunities Fund are calculated as of 12/9/04. |
| 2 | The Lipper Funds Indexes are managed indexes that represent the average annualized returns of the 30 largest funds in each respective Lipper Funds category. The returns assume reinvestment of dividends, but do not reflect any applicable sales charges. You cannot invest directly in an index. |
| 3 | The Russell 2500 Value Index measures the performance of those Russell 2500 companies with lower price-to-book ratios and lower forecasted growth values. The Russell 2000 Value Index measures the performance of those Russell 2000 companies with lower price-to-book ratios and lower forecasted growth values. The Russell 3000 Value Index is a market-capitalization weighted index of those firms in the Russell 3000 Index with lower price-to-book ratios and lower forecasted growth values. The stocks in this index are also members of either the Russell 1000 Value or the Russell 2000 Value Indexes. The index returns assume reinvestment of dividends and do not reflect any applicable sales charges. You cannot invest directly in an index. |
Class A Shares – Average Annual Total Returns
As of 6/30/09
| | | | | | | | |
| | | 1-Year | | 5-Year | | 10-Year | | Since
Inception1 |
Nuveen NWQ Small/Mid-Cap Value Fund | | | | | | | | |
A Shares at NAV | | -35.34% | | N/A | | N/A | | -20.81% |
A Shares at Offer | | -39.05% | | N/A | | N/A | | -22.63% |
Lipper Small-Cap Value Funds Index2 | | -24.24% | | N/A | | N/A | | -15.50% |
Russell 2500 Value Index3 | | -26.24% | | N/A | | N/A | | -17.05% |
Nuveen NWQ Small-Cap Value Fund | | | | | | | | |
A Shares at NAV | | -39.29% | | N/A | | N/A | | -6.31% |
A Shares at Offer | | -42.78% | | N/A | | N/A | | -7.52% |
Lipper Small-Cap Value Funds Index2 | | -24.24% | | N/A | | N/A | | -3.47% |
Russell 2000 Value Index3 | | -25.24% | | N/A | | N/A | | -5.20% |
Nuveen Tradewinds Value Opportunities Fund | | | | | | | | |
A Shares at NAV | | -13.47% | | N/A | | N/A | | 7.87% |
A Shares at Offer | | -18.46% | | N/A | | N/A | | 6.48% |
Lipper Multi-Cap Core Funds Index2 | | -26.35% | | N/A | | N/A | | -2.88% |
Russell 3000 Value Index3 | | -28.73% | | N/A | | N/A | | -4.84% |
Returns quoted represent past performance, which is no guarantee of future results. Current performance may be higher or lower than the performance shown. Investment returns and principal value will fluctuate so that when shares are redeemed, they may be worth more or less than their original cost. Class A shares have a 5.75% maximum sales charge. Returns do not reflect the deduction of taxes that a shareholder would pay on Fund distributions or the redemption of shares. Returns at NAV would be lower if sales charges were included. Returns reflect a voluntary expense limitation by the Funds’ investment adviser that may be modified or discontinued at any time without notice. For the most recent month-end performance, visit www.nuveen.com or call (800) 257-8787.
Please see each Fund’s Spotlight Page later in this report for more complete performance data and expense ratios.
Nuveen Multi-Manager Large-Cap Value Fund
Growth of an Assumed $10,000 Investment
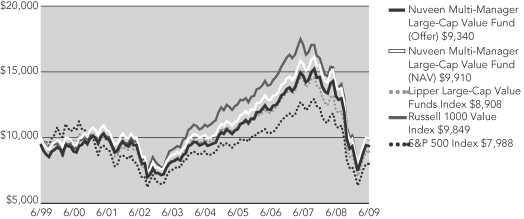
Nuveen NWQ Multi-Cap Value Fund
Growth of an Assumed $10,000 Investment
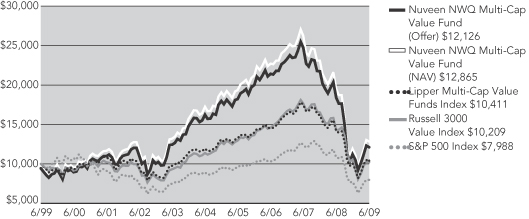
The graphs do not reflect the deduction of taxes that a shareholder may pay on Fund distributions or the redemption of shares.
The index comparisons show the change in value of a $10,000 investment in the Class A Shares of the Nuveen Funds compared with the corresponding indexes. The Lipper Large-Cap Value Funds Index is a managed index that represents the average annualized returns of the 30 largest funds in the Lipper Large-Cap Value Funds category. The Russell 1000 Value Index is a market capitalization-weighted index of those firms in the Russell 1000 Index with lower price-to-book ratios and lower forecasted growth value. The S&P 500 Index is an unmanaged index generally considered to be representative of the U.S. stock market. The Lipper Multi-Cap Value Funds Index is a managed index that represents the average annualized returns of the 30 largest funds in the Lipper Multi-Cap Value Funds category. The Russell 3000 Value Index is a market-capitalization weighted index of those firms in the Russell 3000 Index with lower price-to-book ratios and lower forecasted growth values. The Russell 3000 Index represents the 3000 largest U.S. companies. The index returns assume reinvestment of dividends and do not reflect any initial or ongoing expenses. You cannot invest directly in an index. The Nuveen Funds’ returns include reinvestment of all dividends and distributions, and the Funds’ returns at the offer price depicted in the charts reflect the initial maximum sales charge applicable to Class A Shares (5.75%) and all ongoing Fund expenses. The performance data quoted represents past performance, which is not indicative of future results. Current performance may be lower or higher than the performance shown.
Nuveen NWQ Large-Cap Value Fund
Growth of an Assumed $10,000 Investment
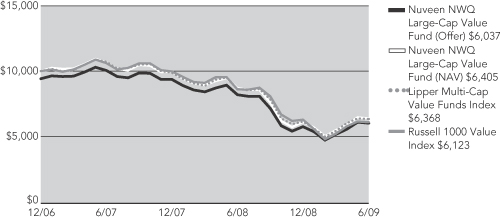
Nuveen NWQ Small/Mid-Cap Value Fund
Growth of an Assumed $10,000 Investment
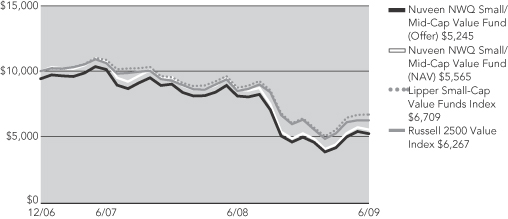
The graphs do not reflect the deduction of taxes that a shareholder may pay on Fund distributions or the redemption of shares.
The index comparisons show the change in value of a $10,000 investment in the Class A Shares of the Nuveen Funds compared with the corresponding indexes. The Lipper Multi-Cap Value Funds Index is a managed index that represents the average annualized returns of the 30 largest funds in the Lipper Multi-Cap Value Funds category. The Russell 1000 Value Index is a market capitalization-weighted index of those firms in the Russell 1000 Index with lower price-to-book ratios and lower forecasted growth value. The Lipper Small-Cap Value Funds Index is a managed index that represents the average annualized returns of the 30 largest funds in the Lipper Small-Cap Value Funds category. The Russell 2500 Value Index is a market capitalization-weighted index of those firms in the Russell 2500 Index with lower price-to-book ratios and lower forecasted growth value. The index returns assume reinvestment of dividends and do not reflect any initial or ongoing expenses. You cannot invest directly in an index. The Nuveen Funds’ returns include reinvestment of all dividends and distributions, and the Funds’ returns at the offer price depicted in the charts reflect the initial maximum sales charge applicable to Class A Shares (5.75%) and all ongoing Fund expenses. The performance data quoted represents past performance, which is not indicative of future results. Current performance may be lower or higher than the performance shown.
Nuveen NWQ Small-Cap Value Fund
Growth of an Assumed $10,000 Investment
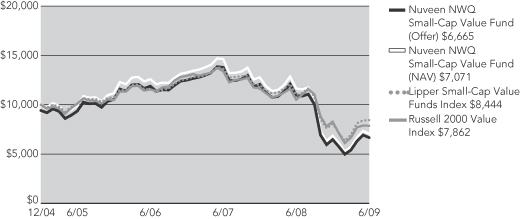
Nuveen Tradewinds Value Opportunities Fund
Growth of an Assumed $10,000 Investment
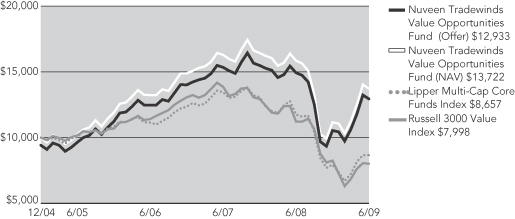
The graphs do not reflect the deduction of taxes that a shareholder may pay on Fund distributions or the redemption of shares.
The index comparisons show the change in value of a $10,000 investment in the Class A Shares of the Nuveen Funds compared with the corresponding indexes. The Lipper Small-Cap Value Funds Index is a managed index that represents the average annualized returns of the 30 largest funds in the Lipper Small-Cap Value Funds category. The Russell 2000 Value Index is a market capitalization-weighted index of those firms in the Russell 2000 Index with lower price-to-book ratios and lower forecasted growth value. The Lipper Multi-Cap Core Funds Index is a managed index that represents the average annualized returns of the 30 largest funds in the Lipper Multi-Cap Core Funds category. The Russell 3000 Value Index is a market capitalization-weighted index of those firms in the Russell 3000 Index with lower price-to-book ratios and lower forecasted growth value. The index returns assume reinvestment of dividends and do not reflect any initial or ongoing expenses. You cannot invest directly in an index. The Nuveen Funds’ returns include reinvestment of all dividends and distributions, and the Funds’ returns at the offer price depicted in the charts reflect the initial maximum sales charge applicable to Class A Shares (5.75%) and all ongoing Fund expenses. The performance data quoted represents past performance, which is not indicative of future results. Current performance may be lower or higher than the performance shown.
Fund Spotlight as of 6/30/09 Nuveen Multi-Manager Large-Cap Value Fund
| | | | | | | | | | |
| Quick Facts | | | | | | | | | | |
| | | A Shares | | B Shares1 | | C Shares | | R3 Shares | | I Shares1 |
Fund Symbol | | NNGAX | | NNGBX | | NNGCX | | NMMTX | | NNGRX |
NAV | | $14.23 | | $13.84 | | $13.80 | | $14.31 | | $14.28 |
Latest Capital Gain Distribution2 | | $1.5761 | | $1.5761 | | $1.5761 | | $1.5761 | | $1.5761 |
Latest Ordinary Income Distribution3 | | $0.1890 | | $0.0289 | | $0.0289 | | $0.1395 | | $0.2432 |
Inception Date | | 8/07/96 | | 8/07/96 | | 8/07/96 | | 8/04/08 | | 8/07/96 |
Returns quoted represent past performance which is no guarantee of future results. Investment returns and principal value will fluctuate so that when shares are redeemed, they may be worth more or less than their original cost. Current performance may be higher or lower than the performance shown. Returns without sales charges would be lower if the sales charge were included. Returns do not reflect the deduction of taxes that a shareholder would pay on Fund distributions or the redemption of shares. For the most recent month-end performance visit www.nuveen.com or call (800) 257-8787.
Class A, B, C and I Share returns are actual. The returns for Class R3 Shares are actual for the period since class inception; returns prior to class inception are Class I Share returns adjusted for differences in sales charges and expenses, which are primarily differences in distribution and service fees. Fund returns assume reinvestment of dividends and capital gains. Class A Shares have a 5.75% maximum sales charge. Class A Share purchases of $1 million or more are sold at net asset value without an up-front sales charge but may be subject to a contingent deferred sales charge (CDSC), also known as a backend sales charge, if redeemed within twelve months of purchase. Class B Shares have a CDSC that begins at 5% for redemptions during the first year and declines periodically until after six years when the charge becomes 0%. Class B Shares automatically convert to Class A Shares eight years after purchase. Class C Shares have a 1% CDSC for redemptions within less than one year, which is not reflected in the one-year total return. Class I Shares have no sales charge and may be purchased under limited circumstances or by specified classes of investors. Class R3 Shares have no sales charge and are available to only certain retirement plan clients of financial intermediaries. Returns may reflect an expense limitation by the Fund’s investment adviser.
| | | | |
| Average Annual Total Returns as of 6/30/09 |
| | |
| A Shares | | NAV | | Offer |
1-Year | | -28.95% | | -33.03% |
5-Year | | -0.56% | | -1.74% |
10-Year | | -0.08% | | -0.67% |
| | |
| B Shares | | w/o CDSC | | w/CDSC |
1-Year | | -29.46% | | -31.99% |
5-Year | | -1.30% | | -1.43% |
10-Year | | -0.67% | | -0.67% |
| | |
| C Shares | | NAV | | |
1-Year | | -29.52% | | |
5-Year | | -1.32% | | |
10-Year | | -0.83% | | |
| | |
| R3 Shares | | NAV | | |
1-Year | | -29.21% | | |
5-Year | | -0.87% | | |
10-Year | | -0.36% | | |
| | |
| I Shares | | NAV | | |
1-Year | | -28.83% | | |
5-Year | | -0.33% | | |
10-Year | | 0.17% | | |
| | |
| Top Five Common Stock Holdings4 |
JPMorgan Chase & Co. | | 3.8% |
Chevron Corporation | | 2.8% |
Exxon Mobil Corporation | | 2.3% |
Wells Fargo & Company | | 2.1% |
Occidental Petroleum Corporation | | 2.1% |
Portfolio Allocation4
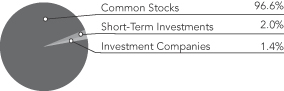
| | |
| Portfolio Statistics |
| Net Assets ($000) | | $274,747 |
| Number of Stocks | | 623 |
| | | | | | |
| Expense Ratios | | | | | | |
| Share Class | | Gross
Expense
Ratios | | Net
Expense
Ratios | | As of
Date |
| Class A | | 1.23% | | 1.20% | | 10/31/08 |
| Class B | | 1.98% | | 1.95% | | 10/31/08 |
| Class C | | 1.98% | | 1.95% | | 10/31/08 |
| Class R3 | | 1.48% | | 1.45% | | 10/31/08 |
| Class I | | 0.98% | | 0.95% | | 10/31/08 |
The expense ratios shown factor in Total Annual Fund Operating Expenses including management fees and other fees and expenses. The Gross and Net Expense Ratios were restated to reflect current expense reimbursements as if such expense reimbursements had been in effect during the previous fiscal year, and to better reflect the expected ratios of the Fund for the current fiscal year. The Gross and Net Expense Ratios for Class R3 are estimated based on the actual expenses for the Fund during the most recent fiscal year. The Net Expense Ratios reflect a contractual a contractual commitment by the Fund’s investment adviser to waive fees and reimburse certain expenses through October 31, 2010. Absent the waiver and reimbursement, the Net Expense Ratios would be higher and total returns would be less. These expense ratios may vary from the expense ratios shown elsewhere in this report.
| 1 | Effective May 1, 2008, Class B Shares will only be issued upon exchange of Class B Shares from another Nuveen Fund or for purposes of dividend reinvestment. Effective December 31, 2008, the reinstatement privilege for Class B Shares is no longer available. Effective May 1, 2008, Class R Shares were renamed Class I Shares. See the Fund’s prospectus for more information. |
| 3 | Ordinary income distribution consists of ordinary income paid on December 31, 2008. |
| 4 | As a percentage of total investments as of June 30, 2009. Holdings are subject to change. |
Fund Spotlight as of 6/30/09 Nuveen Multi-Manager Large-Cap Value Fund
| | |
| Industries1 | | |
Oil, Gas & Consumable Fuels | | 14.0% |
Pharmaceuticals | | 9.1% |
Insurance | | 5.0% |
Diversified Financial Services | | 4.8% |
Commercial Banks | | 4.0% |
Capital Markets | | 3.5% |
Diversified Telecommunication Services | | 3.3% |
Beverages | | 3.0% |
Media | | 3.0% |
Electric Utilities | | 3.0% |
Specialty Retail | | 2.8% |
Aerospace & Defense | | 2.8% |
Semiconductors & Equipment | | 2.5% |
Food & Staples Retailing | | 2.4% |
Road & Rail | | 2.2% |
Metal & Mining | | 2.1% |
Energy Equipment & Services | | 2.0% |
Software | | 1.7% |
Chemicals | | 1.6% |
Machinery | | 1.5% |
Computers & Peripherals | | 1.5% |
Investment Companies | | 1.4% |
IT Services | | 1.3% |
Health Care Equipment & Supplies | | 1.3% |
Food Products | | 1.1% |
Tobacco | | 1.1% |
Biotechnology | | 1.1% |
Short-Term Investments | | 2.0% |
Other | | 14.9% |
| 1 | As a percentage of total investments as of June 30, 2009. Holdings are subject to change. |
Expense Example
As a shareholder of the Fund, you incur two types of costs: (1) transaction costs, including front and back end sales charges (loads) or redemption fees, where applicable; and (2) ongoing costs, including management fees; distribution and service (12b-1) fees, where applicable; and other Fund expenses. This Example is intended to help you understand your ongoing costs (in dollars) of investing in the Fund and to compare these costs with the ongoing costs of investing in other mutual funds.
The Example below is based on an investment of $1,000 invested at the beginning of the period and held for the period.
The information under “Actual Performance,” together with the amount you invested, allows you to estimate actual expenses incurred over the reporting period. Simply divide your account value by $1,000 (for example, an $8,600 account value divided by $1,000 = 8.60) and multiply the result by the cost shown for your share class, in the row entitled “Expenses Incurred During Period” to estimate the expenses incurred on your account during this period.
The information under “Hypothetical Performance,” provides information about hypothetical account values and hypothetical expenses based on the Fund’s actual expense ratio and an assumed rate of return of 5% per year before expenses, which is not the Fund’s actual return. The hypothetical account values and expenses may not be used to estimate the actual ending account balance or expense you incurred for the period. You may use this information to compare the ongoing costs of investing in the Fund and other Funds. To do so, compare this 5% hypothetical example with the 5% hypothetical examples that appear in the shareholder reports of the other funds.
Please note that the expenses shown in the table are meant to highlight your ongoing costs only and do not reflect any transactional costs, such as front and back end sales charges (loads) or redemption fees, where applicable. Therefore, the hypothetical information is useful in comparing ongoing costs only, and will not help you determine the relative total costs of owning different funds or share classes. In addition, if these transactional costs were included, your costs would have been higher.
| | | | | | | | | | | | | | | | | | | | | | | | | | | | | | | | |
| | | | | | | | | | | | | | | Hypothetical Performance
|
| | | Actual Performance | | | | (5% return before expenses) |
| | | A Shares | | B Shares | | C Shares | | R3 Shares | | I Shares | | | | A Shares | | B Shares | | C Shares | | R3 Shares | | I Shares |
| Beginning Account Value (1/01/09) | | $ | 1,000.00 | | $ | 1,000.00 | | $ | 1,000.00 | | $ | 1,000.00 | | $ | 1,000.00 | | | | $ | 1,000.00 | | $ | 1,000.00 | | $ | 1,000.00 | | $ | 1,000.00 | | $ | 1,000.00 |
| Ending Account Value (6/30/09) | | $ | 1,002.10 | | $ | 998.60 | | $ | 997.80 | | $ | 1,000.70 | | $ | 1,002.80 | | | | $ | 1,018.99 | | $ | 1,015.27 | | $ | 1,015.27 | | $ | 1,017.60 | | $ | 1,020.23 |
| Expenses Incurred During Period | | $ | 5.81 | | $ | 9.51 | | $ | 9.51 | | $ | 7.19 | | $ | 4.57 | | | | $ | 5.86 | | $ | 9.59 | | $ | 9.59 | | $ | 7.25 | | $ | 4.61 |
For each class of the Fund, expenses are equal to the Fund’s annualized net expense ratio of 1.17%, 1.92%, 1.92%, 1.45% and 0.92% for Classes A, B, C, R3 and I, respectively, multiplied by the average account value over the period, multiplied by 181/365 (to reflect the one-half year period).
Fund Spotlight as of 6/30/09 Nuveen NWQ Multi-Cap Value Fund
| | | | | | | | | | |
| Quick Facts | | | | | | | | | | |
| | | A Shares | | B Shares1 | | C Shares | | R3 Shares | | I Shares1 |
Fund Symbols | | NQVAX | | NQVBX | | NQVCX | | NMCTX | | NQVRX |
NAV | | $12.22 | | $11.84 | | $11.84 | | $12.16 | | $12.22 |
Inception Date | | 12/09/02 | | 12/09/02 | | 12/09/02 | | 8/04/08 | | 11/04/97 |
Effective December 6, 2002, based on shareholder approval, the Nuveen NWQ Multi-Cap Value Fund acquired the assets and performance history of the PBHG Special Equity Fund. The Fund had no assets prior to the acquisition. In addition, on December 14, 2001, the PBHG Special Equity Fund acquired the assets of the NWQ Special Equity Portfolio. The information presented for the Nuveen NWQ Multi-Cap Value Fund prior to the acquisition date represents the expense adjusted performance of the predecessor funds.
Returns quoted represent past performance which is no guarantee of future results. Investment returns and principal value will fluctuate so that when shares are redeemed, they may be worth more or less than their original cost. Current performance may be higher or lower than the performance shown. Returns without sales charges would be lower if the sales charge were included. Returns do not reflect the deduction of taxes that a shareholder would pay on Fund distributions or the redemption of shares. For the most recent month-end performance visit www.nuveen.com or call (800) 257-8787.
Class A, B, C and I Share returns are actual. The returns for Class R3 Shares are actual for the period since class inception; returns prior to class inception are Class I Share returns adjusted for differences in sales charges and expenses, which are primarily differences in distribution and service fees. Fund returns assume reinvestment of dividends and capital gains. Class A Shares have a 5.75% maximum sales charge. Class A Share purchases of $1 million or more are sold at net asset value without an up-front sales charge but may be subject to a contingent deferred sales charge (CDSC), also known as a backend sales charge, if redeemed within twelve months of purchase. Class B Shares have a CDSC that begins at 5% for redemptions during the first year and declines periodically until after six years when the charge becomes 0%. Class B Shares automatically convert to Class A Shares eight years after purchase. Class C Shares have a 1% CDSC for redemptions within less than one year, which is not reflected in the one-year total return. Class I Shares have no sales charge and may be purchased under limited circumstances or by specified classes of investors. Class R3 Shares have no sales charge and are available to only certain retirement plan clients of financial intermediaries. Returns may reflect an expense limitation by the Fund’s investment adviser.
| | | | |
| Average Annual Total Returns as of 6/30/09 |
| | |
| A Shares | | NAV | | Offer |
1-Year | | -34.12% | | -37.91% |
5-Year | | -5.70% | | -6.81% |
10-Year | | 2.56% | | 1.95% |
| | |
| B Shares | | w/o CDSC | | w/CDSC |
1-Year | | -34.62% | | -37.24% |
5-Year | | -6.41% | | -6.58% |
10-Year | | 1.94% | | 1.94% |
| | |
| C Shares | | NAV | | |
1-Year | | -34.62% | | |
5-Year | | -6.41% | | |
10-Year | | 1.79% | | |
| | |
| R3 Shares | | NAV | | |
1-Year | | -34.31% | | |
5-Year | | -5.98% | | |
10-Year | | 2.26% | | |
| | |
| I Shares | | NAV | | |
1-Year | | -33.95% | | |
5-Year | | -5.48% | | |
10-Year | | 2.82% | | |
| | |
| Top Five Common Stock Holdings2 |
CA Inc. | | 6.6% |
Viacom Inc., Class B | | 5.7% |
Noble Energy, Inc. | | 4.6% |
Motorola, Inc. | | 4.6% |
Reinsurance Group America Inc. | | 4.4% |
Portfolio Allocation2

| | |
| Portfolio Statistics |
| Net Assets ($000) | | $399,034 |
| Number of Common Stocks | | 38 |
| | | | | | |
| Expense Ratios | | | | | | |
| Share Class | | Gross
Expense
Ratios | | Net
Expense
Ratios | | As of
Date |
| Class A | | 1.33% | | 1.33% | | 6/30/08 |
| Class B | | 2.08% | | 2.08% | | 6/30/08 |
| Class C | | 2.08% | | 2.08% | | 6/30/08 |
| Class R3 | | 1.58% | | 1.58% | | 10/31/08 |
| Class I | | 1.09% | | 1.09% | | 6/30/08 |
The expense ratios shown factor in Total Annual Fund Operating Expenses including management fees and other fees and expenses. The Gross and Net Expense Ratios for Class R3 are estimated based on the actual expenses for the Fund during the most recent fiscal year. These expense ratios may vary from the expense ratios shown elsewhere in this report.
| 1 | Effective May 1, 2008, Class B Shares will only be issued upon exchange of Class B Shares from another Nuveen Fund or for purposes of dividend reinvestment. Effective December 31, 2008, the reinvestment privilege for Class B is no longer available. Effective May 1, 2008, Class R Shares were renamed Class I Shares. See the Fund’s prospectus for more information. |
| 2 | As a percentage of total investments as of June 30, 2009. Holdings are subject to change. |
Fund Spotlight as of 6/30/09 Nuveen NWQ Multi-Cap Value Fund
| | |
| Industries1 | | |
Insurance | | 15.2% |
Oil, Gas & Consumable Fuels | | 13.6% |
Metals & Mining | | 8.9% |
Media | | 8.7% |
Software | | 6.6% |
Pharmaceuticals | | 6.2% |
Aerospace & Defense | | 5.4% |
Communications Equipment | | 4.6% |
Tobacco | | 4.1% |
Machinery | | 3.8% |
Biotechnology | | 3.6% |
Diversified Financial Services | | 3.5% |
Short-Term Investments | | 1.6% |
Other | | 14.2% |
| 1 | As a percentage of total investments as of June 30, 2009. Holdings are subject to change. |
Expense Example
As a shareholder of the Fund, you incur two types of costs: (1) transaction costs, including front and back end sales charges (loads) or redemption fees, where applicable; and (2) ongoing costs, including management fees; distribution and service (12b-1) fees, where applicable; and other Fund expenses. This Example is intended to help you understand your ongoing costs (in dollars) of investing in the Fund and to compare these costs with the ongoing costs of investing in other mutual funds.
The Example below is based on an investment of $1,000 invested at the beginning of the period and held for the period.
The information under “Actual Performance,” together with the amount you invested, allows you to estimate actual expenses incurred over the reporting period. Simply divide your account value by $1,000 (for example, an $8,600 account value divided by $1,000 = 8.60) and multiply the result by the cost shown for your share class, in the row entitled “Expenses Incurred During Period” to estimate the expenses incurred on your account during this period.
The information under “Hypothetical Performance,” provides information about hypothetical account values and hypothetical expenses based on the Fund’s actual expense ratio and an assumed rate of return of 5% per year before expenses, which is not the Fund’s actual return. The hypothetical account values and expenses may not be used to estimate the actual ending account balance or expense you incurred for the period. You may use this information to compare the ongoing costs of investing in the Fund and other Funds. To do so, compare this 5% hypothetical example with the 5% hypothetical examples that appear in the shareholder reports of the other funds.
Please note that the expenses shown in the table are meant to highlight your ongoing costs only and do not reflect any transactional costs, such as front and back end sales charges (loads) or redemption fees, where applicable. Therefore, the hypothetical information is useful in comparing ongoing costs only, and will not help you determine the relative total costs of owning different funds or share classes. In addition, if these transactional costs were included, your costs would have been higher.
| | | | | | | | | | | | | | | | | | | | | | | | | | | | | | | | |
| | | | | | | Hypothetical Performance |
| | | Actual Performance | | | | (5% return before expenses) |
| �� | | A Shares | | B Shares | | C Shares | | R3 Shares | | I Shares | | | | A Shares | | B Shares | | C Shares | | R3 Shares | | I Shares |
| Beginning Account Value (1/01/09) | | $ | 1,000.00 | | $ | 1,000.00 | | $ | 1,000.00 | | $ | 1,000.00 | | $ | 1,000.00 | | | | $ | 1,000.00 | | $ | 1,000.00 | | $ | 1,000.00 | | $ | 1,000.00 | | $ | 1,000.00 |
| Ending Account Value (6/30/09) | | $ | 1,081.40 | | $ | 1,077.30 | | $ | 1,077.30 | | $ | 1,079.90 | | $ | 1,083.30 | | | | $ | 1,016.81 | | $ | 1,013.09 | | $ | 1,013.09 | | $ | 1,015.62 | | $ | 1,018.10 |
| Expenses Incurred During Period | | $ | 8.31 | | $ | 12.16 | | $ | 12.16 | | $ | 9.54 | | $ | 6.97 | | | | $ | 8.05 | | $ | 11.78 | | $ | 11.78 | | $ | 9.25 | | $ | 6.76 |
For each class of the Fund, expenses are equal to the Fund’s annualized net expense ratio of 1.61%, 2.36%, 2.36%, 1.85% and 1.35% for Classes A, B, C, R3 and I, respectively, multiplied by the average account value over the period, multiplied by 181/365 (to reflect the one-half year period).
Fund Spotlight as of 6/30/09 Nuveen NWQ Large-Cap Value Fund
| | | | | | | | |
| Quick Facts | | | | | | | | |
| | | A Shares | | B Shares1 | | C Shares | | I Shares1 |
Fund Symbols | | NQCAX | | NQCBX | | NQCCX | | NQCRX |
NAV | | $12.71 | | $12.60 | | $12.60 | | $12.72 |
Latest Ordinary Income Distribution2 | | $0.0695 | | $ — | | $ — | | $0.1105 |
Inception Date | | 12/15/06 | | 12/15/06 | | 12/15/06 | | 12/15/06 |
Returns quoted represent past performance which is no guarantee of future results. Investment returns and principal value will fluctuate so that when shares are redeemed, they may be worth more or less than their original cost. Current performance may be higher or lower than the performance shown. Returns without sales charges would be lower if the sales charge were included. Returns do not reflect the deduction of taxes that a shareholder would pay on Fund distributions or the redemption of shares. For the most recent month-end performance visit www.nuveen.com or call (800) 257-8787.
Returns reflect differences in sales charges and expenses, which are primarily differences in distribution and service fees. Fund returns assume reinvestment of dividends and capital gains. Class A Shares have a 5.75% maximum sales charge. Class A Share purchases of $1 million or more are sold at net asset value without an up-front sales charge but may be subject to a contingent deferred sales charge (CDSC), also known as a backend sales charge, if redeemed within twelve months of purchase. Class B Shares have a CDSC that begins at 5% for redemptions during the first year and declines periodically until after six years when the charge becomes 0%. Class B Shares automatically convert to Class A Shares eight years after purchase. Class C Shares have a 1% CDSC for redemptions within less than one year, which is not reflected in the one-year total return. Class I Shares have no sales charge and may be purchased under limited circumstances or by specified classes of investors. Returns may reflect an expense limitation by the Fund’s investment adviser.
| | | | |
| Average Annual Total Returns as of 6/30/09 |
| | |
| A Shares | | NAV | | Offer |
1-Year | | -26.57% | | -30.79% |
Since Inception | | -16.01% | | -17.94% |
| | |
| B Shares | | w/o CDSC | | w/CDSC |
1-Year | | -27.13% | | -30.04% |
Since Inception | | -16.61% | | -17.94% |
| | |
| C Shares | | NAV | | |
1-Year | | -27.13% | | |
Since Inception | | -16.61% | | |
| | |
| I Shares | | NAV | | |
1-Year | | -26.35% | | |
Since Inception | | -15.78% | | |
| | |
| Top Five Common Stock Holdings3 |
CA Inc. | | 6.4% |
Viacom Inc., Class B | | 4.0% |
Apache Corporation | | 4.0% |
Noble Energy, Inc. | | 3.9% |
AngloGold Ashanti Limited, Sponsored ADR | | 3.7% |
Portfolio Allocation3
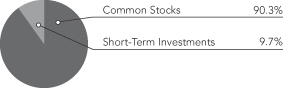
| | |
| Portfolio Statistics |
| Net Assets ($000) | | $61,315 |
| Number of Common Stocks | | 40 |
| | | | | | |
| Expense Ratios | | | | | | |
| Share Class | | Gross
Expense
Ratios | | Net
Expense
Ratios | | As of
Date |
| Class A | | 1.66% | | 1.33% | | 6/30/08 |
| Class B | | 2.43% | | 2.08% | | 6/30/08 |
| Class C | | 2.42% | | 2.08% | | 6/30/08 |
| Class I | | 1.40% | | 1.08% | | 6/30/08 |
The expense ratios shown factor in Total Annual Fund Operating Expenses including management fees and other fees and expenses. The Net Expense Ratios reflect a contractual commitment by the Fund’s investment adviser to waive fees and reimburse expenses through October 31, 2010. Absent the waiver and reimbursement, the Net Expense Ratios would be higher and total returns would be less.
| 1 | Effective May 1, 2008, Class B Shares will only be issued upon exchange of Class B Shares from another Nuveen Fund or for purposes of dividend reinvestment. Effective December 31, 2008, the reinvestment privilege for Class B is no longer available. Effective May 1, 2008, Class R Shares were renamed Class I Shares. See the Fund’s prospectus for more information. |
| 2 | Ordinary income distribution consists of ordinary income paid on December 31, 2008. |
| 3 | As a percentage of total investments as of June 30, 2009. Holdings are subject to change. |
Fund Spotlight as of 6/30/09 Nuveen NWQ Large-Cap Value Fund
| | |
| Industries1 |
Insurance | | 13.6% |
Oil, Gas & Consumable Fuels | | 12.3% |
Software | | 8.4% |
Metals & Mining | | 8.1% |
Media | | 6.0% |
Aerospace & Defense | | 4.5% |
Pharmaceuticals | | 4.3% |
Communications Equipment | | 3.6% |
Commercial Services & Supplies | | 3.6% |
Biotechnology | | 3.5% |
Tobacco | | 3.1% |
Diversified Financial Services | | 3.0% |
Commercial Banks | | 2.1% |
Short-Term Investments | | 9.7% |
Other | | 14.2% |
| 1 | As a percentage of total investments as of June 30, 2009. Holdings are subject to change. |
Expense Example
As a shareholder of the Fund, you incur two types of costs: (1) transaction costs, including front and back end sales charges (loads) or redemption fees, where applicable; and (2) ongoing costs, including management fees; distribution and service (12b-1) fees, where applicable; and other Fund expenses. This Example is intended to help you understand your ongoing costs (in dollars) of investing in the Fund and to compare these costs with the ongoing costs of investing in other mutual funds.
The Example below is based on an investment of $1,000 invested at the beginning of the period and held for the period.
The information under “Actual Performance,” together with the amount you invested, allows you to estimate actual expenses incurred over the reporting period. Simply divide your account value by $1,000 (for example, an $8,600 account value divided by $1,000 = 8.60) and multiply the result by the cost shown for your share class, in the row entitled “Expenses Incurred During Period” to estimate the expenses incurred on your account during this period.
The information under “Hypothetical Performance,” provides information about hypothetical account values and hypothetical expenses based on the Fund’s actual expense ratio and an assumed rate of return of 5% per year before expenses, which is not the Fund’s actual return. The hypothetical account values and expenses may not be used to estimate the actual ending account balance or expense you incurred for the period. You may use this information to compare the ongoing costs of investing in the Fund and other Funds. To do so, compare this 5% hypothetical example with the 5% hypothetical examples that appear in the shareholder reports of the other funds.
Please note that the expenses shown in the table are meant to highlight your ongoing costs only and do not reflect any transactional costs, such as front and back end sales charges (loads) or redemption fees, where applicable. Therefore, the hypothetical information is useful in comparing ongoing costs only, and will not help you determine the relative total costs of owning different funds or share classes. In addition, if these transactional costs were included, your costs would have been higher.
| | | | | | | | | | | | | | | | | | | | | | | | | | |
| | | | | | | Hypothetical Performance |
| | | Actual Performance | | | | (5% return before expenses) |
| | | A Shares | | B Shares | | C Shares | | I Shares | | | | A Shares | | B Shares | | C Shares | | I Shares |
| Beginning Account Value (1/01/09) | | $ | 1,000.00 | | $ | 1,000.00 | | $ | 1,000.00 | | $ | 1,000.00 | | | | $ | 1,000.00 | | $ | 1,000.00 | | $ | 1,000.00 | | $ | 1,000.00 |
| Ending Account Value (6/30/09) | | $ | 1,043.50 | | $ | 1,040.50 | | $ | 1,040.50 | | $ | 1,045.20 | | | | $ | 1,018.10 | | $ | 1,014.33 | | $ | 1,014.38 | | $ | 1,019.39 |
| Expenses Incurred During Period | | $ | 6.84 | | $ | 10.68 | | $ | 10.62 | | $ | 5.53 | | | | $ | 6.76 | | $ | 10.49 | | $ | 10.49 | | $ | 5.46 |
For each class of the Fund, expenses are equal to the Fund’s annualized net expense ratio of 1.35%, 2.10%, 2.10% and 1.09% for Classes A, B, C and I, respectively, multiplied by the average account value over the period, multiplied by 181/365 (to reflect the one-half year period).
Fund Spotlight as of 6/30/09 Nuveen NWQ Small/Mid-Cap Value Fund
| | | | | | | | |
| Quick Facts | | | | | | | | |
| | | A Shares | | B Shares1 | | C Shares | | I Shares1 |
Fund Symbols | | NSMAX | | NSMBX | | NSMCX | | NSMRX |
NAV | | $11.05 | | $10.82 | | $10.83 | | $10.96 |
Inception Date | | 12/15/06 | | 12/15/06 | | 12/15/06 | | 12/15/06 |
Returns quoted represent past performance which is no guarantee of future results. Investment returns and principal value will fluctuate so that when shares are redeemed, they may be worth more or less than their original cost. Current performance may be higher or lower than the performance shown. Returns without sales charges would be lower if the sales charge were included. Returns do not reflect the deduction of taxes that a shareholder would pay on Fund distributions or the redemption of shares. For the most recent month-end performance visit www.nuveen.com or call (800) 257-8787.
Returns reflect differences in sales charges and expenses, which are primarily differences in distribution and service fees. Fund returns assume reinvestment of dividends and capital gains. Class A Shares have a 5.75% maximum sales charge. Class A Share purchases of $1 million or more are sold at net asset value without an up-front sales charge but may be subject to a contingent deferred sales charge (CDSC), also known as a backend sales charge, if redeemed within twelve months of purchase. Class B Shares have a CDSC that begins at 5% for redemptions during the first year and declines periodically until after six years when the charge becomes 0%. Class B Shares automatically convert to Class A Shares eight years after purchase. Class C Shares have a 1% CDSC for redemptions within less than one year, which is not reflected in the one-year total return. Class I Shares have no sales charge and may be purchased under limited circumstances or by specified classes of investors. Returns may reflect an expense limitation by the Fund’s investment adviser.
| | | | |
| Average Annual Total Returns as of 6/30/09 |
| | |
| A Shares | | NAV | | Offer |
1-Year | | -35.34% | | -39.05% |
Since Inception | | -20.81% | | -22.63% |
| | |
| B Shares | | w/o CDSC | | w/CDSC |
1-Year | | -35.98% | | -38.54% |
Since Inception | | -21.47% | | -22.72% |
| | |
| C Shares | | NAV | | |
1-Year | | -35.88% | | |
Since Inception | | -21.44% | | |
| | |
| I Shares | | NAV | | |
1-Year | | -35.98% | | |
Since Inception | | -20.98% | | |
| | |
| Top Five Common Stock Holdings2 |
Elizabeth Arden, Inc. | | 4.9% |
Griffon Corporation | | 4.0% |
Reinsurance Group of America Inc. | | 4.0% |
Hanover Insurance Group Inc. | | 3.7% |
Acergy S.A., ADR | | 3.6% |
Portfolio Allocation2

| | |
| Portfolio Statistics |
| Net Assets ($000) | | $5,818 |
| Number of Common Stocks | | 44 |
| | | | | | |
| Expense Ratios | | | | | | |
| Share Class | | Gross
Expense
Ratios | | Net
Expense
Ratios | | As of
Date |
| Class A | | 1.65% | | 1.43% | | 6/30/08 |
| Class B | | 2.12% | | 2.11% | | 6/30/08 |
| Class C | | 2.39% | | 2.18% | | 6/30/08 |
| Class I | | 1.16% | | 1.15% | | 6/30/08 |
The expense ratios shown factor in Total Annual Fund Operating Expenses including management fees and other fees and expenses. The Net Expense Ratios reflect a contractual commitment by the Fund’s investment adviser to waive fees and reimburse expenses through October 31, 2010. The Net Expense Ratios also reflect a custodian fee credit whereby certain fees and expenses are reduced by credits earned on the Fund’s cash on deposit with the bank. There is no guarantee that the Fund will earn such credits in the future. Absent the waiver, reimbursement and custodian fee credit, the Net Expense Ratios would be higher and total returns would be less.
| 1 | Effective May 1, 2008, Class B Shares will only be issued upon exchange of Class B Shares from another Nuveen Fund or for purposes of dividend reinvestment. Effective December 31, 2008, the reinvestment privilege for Class B is no longer available. Effective May 1, 2008, Class R Shares were renamed Class I Shares. See the Fund’s prospectus for more information. |
| 2 | As a percentage of total investments as of June 30, 2009. Holdings are subject to change. |
Fund Spotlight as of 6/30/09 Nuveen NWQ Small/Mid-Cap Value Fund
| | |
| Industries1 |
Insurance | | 19.3% |
Oil, Gas & Consumable Fuels | | 9.7% |
Electronic Equipment & Instruments | | 9.2% |
Machinery | | 8.2% |
Communications Equipment | | 6.3% |
Metals & Mining | | 5.9% |
Building Products | | 5.6% |
Personal Products | | 4.9% |
Pharmaceuticals | | 4.7% |
Energy Equipment & Services | | 4.4% |
Thrifts & Mortgage Finance | | 2.9% |
Containers & Packaging | | 2.9% |
Short-Term Investments | | 2.0% |
Other | | 14.0% |
| 1 | As a percentage of total investments as of 6/30/09. Holdings are subject to change. |
Expense Example
As a shareholder of the Fund, you incur two types of costs: (1) transaction costs, including front and back end sales charges (loads) or redemption fees, where applicable; and (2) ongoing costs, including management fees; distribution and service (12b-1) fees, where applicable; and other Fund expenses. This Example is intended to help you understand your ongoing costs (in dollars) of investing in the Fund and to compare these costs with the ongoing costs of investing in other mutual funds.
The Example below is based on an investment of $1,000 invested at the beginning of the period and held for the period.
The information under “Actual Performance,” together with the amount you invested, allows you to estimate actual expenses incurred over the reporting period. Simply divide your account value by $1,000 (for example, an $8,600 account value divided by $1,000 = 8.60) and multiply the result by the cost shown for your share class, in the row entitled “Expenses Incurred During Period” to estimate the expenses incurred on your account during this period.
The information under “Hypothetical Performance,” provides information about hypothetical account values and hypothetical expenses based on the Fund’s actual expense ratio and an assumed rate of return of 5% per year before expenses, which is not the Fund’s actual return. The hypothetical account values and expenses may not be used to estimate the actual ending account balance or expense you incurred for the period. You may use this information to compare the ongoing costs of investing in the Fund and other Funds. To do so, compare this 5% hypothetical example with the 5% hypothetical examples that appear in the shareholder reports of the other funds.
Please note that the expenses shown in the table are meant to highlight your ongoing costs only and do not reflect any transactional costs, such as front and back end sales charges (loads) or redemption fees, where applicable. Therefore, the hypothetical information is useful in comparing ongoing costs only, and will not help you determine the relative total costs of owning different funds or share classes. In addition, if these transactional costs were included, your costs would have been higher.
| | | | | | | | | | | | | | | | | | | | | | | | | | |
| | | | | | | | | | | | | Hypothetical Performance |
| | | Actual Performance | | | | (5% return before expenses) |
| | | A Shares | | B Shares | | C Shares | | I Shares | | | | A Shares | | B Shares | | C Shares | | I Shares |
| Beginning Account Value (1/01/09) | | $ | 1,000.00 | | $ | 1,000.00 | | $ | 1,000.00 | | $ | 1,000.00 | | | | $ | 1,000.00 | | $ | 1,000.00 | | $ | 1,000.00 | | $ | 1,000.00 |
| Ending Account Value (6/30/09) | | $ | 1,054.40 | | $ | 1,051.50 | | $ | 1,054.50 | | $ | 1,055.90 | | | | $ | 1,017.60 | | $ | 1,013.88 | | $ | 1,013.88 | | $ | 1,018.74 |
| Expenses Incurred During Period | | $ | 7.39 | | $ | 11.19 | | $ | 11.24 | | $ | 6.22 | | | | $ | 7.25 | | $ | 10.99 | | $ | 10.99 | | $ | 6.11 |
For each class of the Fund, expenses are equal to the Fund’s annualized net expense ratio of 1.45%, 2.20%, 2.20% and 1.22% for Classes A, B, C and I, respectively, multiplied by the average account value over the period, multiplied by 181/365 (to reflect the one-half year period).
Fund Spotlight as of 6/30/09 Nuveen NWQ Small-Cap Value Fund
| | | | | | | | |
| Quick Facts | | | | | | | | |
| | | A Shares | | B Shares1 | | C Shares | | I Shares1 |
Fund Symbols | | NSCAX | | NSCBX | | NSCCX | | NSCRX |
NAV | | $14.14 | | $13.74 | | $13.76 | | $14.21 |
Inception Date | | 12/09/04 | | 12/09/04 | | 12/09/04 | | 12/09/04 |
Returns quoted represent past performance which is no guarantee of future results. Investment returns and principal value will fluctuate so that when shares are redeemed, they may be worth more or less than their original cost. Current performance may be higher or lower than the performance shown. Returns without sales charges would be lower if the sales charge were included. Returns do not reflect the deduction of taxes that a shareholder would pay on Fund distributions or the redemption of shares. For the most recent month-end performance visit www.nuveen.com or call (800) 257-8787.
Returns reflect differences in sales charges and expenses, which are primarily differences in distribution and service fees. Fund returns assume reinvestment of dividends and capital gains. Class A Shares have a 5.75% maximum sales charge. Class A Share purchases of $1 million or more are sold at net asset value without an up-front sales charge but may be subject to a contingent deferred sales charge (CDSC), also known as a backend sales charge, if redeemed within twelve months of purchase. Class B Shares have a CDSC that begins at 5% for redemptions during the first year and declines periodically until after six years when the charge becomes 0%. Class B Shares automatically convert to Class A Shares eight years after purchase. Class C Shares have a 1% CDSC for redemptions within less than one year, which is not reflected in the one-year total return. Class I Shares have no sales charge and may be purchased under limited circumstances or by specified classes of investors. Returns may reflect an expense limitation by the Fund’s investment adviser.
| | | | |
| Average Annual Total Returns as of 6/30/09 |
| | |
| A Shares | | NAV | | Offer |
1-Year | | -39.29% | | -42.78% |
Since Inception | | -6.31% | | -7.52% |
| | |
| B Shares | | w/o CDSC | | w/CDSC |
1-Year | | -39.71% | | -42.12% |
Since Inception | | -7.00% | | -7.40% |
| | |
| C Shares | | NAV | | |
1-Year | | -39.70% | | |
Since Inception | | -6.98% | | |
| | |
| I Shares | | NAV | | |
1-Year | | -39.12% | | |
Since Inception | | -6.06% | | |
| | | | |
| Top Five Common Stock Holdings2 |
Standard Microsystems Corporation | | 3.8% |
Avocent Corporation | | 3.7% |
Acergy S.A., ADR | | 3.6% |
Griffon Corporation | | 3.4% |
St Mary Land and Exploration Company | | 3.4% |
Portfolio Allocation2
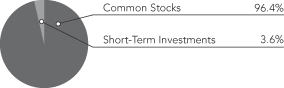
| | |
| Portfolio Statistics |
| Net Assets ($000) | | $73,776 |
| Number of Common Stocks | | 44 |
| | | | | | |
| Expense Ratios | | | | | | |
| Share Class | | Gross
Expense
Ratios | | Net
Expense
Ratios | | As of
Date |
| Class A | | 1.47% | | 1.47% | | 6/30/08 |
| Class B | | 2.22% | | 2.22% | | 6/30/08 |
| Class C | | 2.22% | | 2.22% | | 6/30/08 |
| Class I | | 1.22% | | 1.22% | | 6/30/08 |
The expense ratios shown factor in Total Annual Fund Operating Expenses including management fees and other fees and expenses.
| 1 | Effective May 1, 2008, Class B Shares will only be issued upon exchange of Class B Shares from another Nuveen Fund or for purposes of dividend reinvestment. Effective December 31, 2008, the reinvestment privilege for Class B is no longer available. Effective May 1, 2008, Class R Shares were renamed Class I Shares. See the Fund’s prospectus for more information. |
| 2 | As a percentage of total investments as of June 30, 2009. Holdings are subject to change. |
Fund Spotlight as of 6/30/09 Nuveen NWQ Small-Cap Value Fund
| | |
| Industries1 | | |
Insurance | | 18.0% |
Oil, Gas & Consumable Fuels | | 10.4% |
Machinery | | 10.1% |
Communications Equipment | | 6.9% |
Semiconductors & Equipment | | 6.9% |
Commercial Banks | | 5.4% |
Building Products | | 4.9% |
Electrical Equipment | | 4.2% |
Energy Equipment & Services | | 3.6% |
Paper & Forest Products | | 3.3% |
Pharmaceuticals | | 3.0% |
Personal Products | | 2.9% |
Containers & Packaging | | 2.8% |
Short-Term Investments | | 3.6% |
Other | | 14.0% |
| 1 | As a percentage of total investments as of June 30, 2009. Holdings are subject to change. |
Expense Example
As a shareholder of the Fund, you incur two types of costs: (1) transaction costs, including front and back end sales charges (loads) or redemption fees, where applicable; and (2) ongoing costs, including management fees; distribution and service (12b-1) fees, where applicable; and other Fund expenses. This Example is intended to help you understand your ongoing costs (in dollars) of investing in the Fund and to compare these costs with the ongoing costs of investing in other mutual funds.
The Example below is based on an investment of $1,000 invested at the beginning of the period and held for the period.
The information under “Actual Performance,” together with the amount you invested, allows you to estimate actual expenses incurred over the reporting period. Simply divide your account value by $1,000 (for example, an $8,600 account value divided by $1,000 = 8.60) and multiply the result by the cost shown for your share class, in the row entitled “Expenses Incurred During Period” to estimate the expenses incurred on your account during this period.
The information under “Hypothetical Performance,” provides information about hypothetical account values and hypothetical expenses based on the Fund’s actual expense ratio and an assumed rate of return of 5% per year before expenses, which is not the Fund’s actual return. The hypothetical account values and expenses may not be used to estimate the actual ending account balance or expense you incurred for the period. You may use this information to compare the ongoing costs of investing in the Fund and other Funds. To do so, compare this 5% hypothetical example with the 5% hypothetical examples that appear in the shareholder reports of the other funds.
Please note that the expenses shown in the table are meant to highlight your ongoing costs only and do not reflect any transactional costs, such as front and back end sales charges (loads) or redemption fees, where applicable. Therefore, the hypothetical information is useful in comparing ongoing costs only, and will not help you determine the relative total costs of owning different funds or share classes. In addition, if these transactional costs were included, your costs would have been higher.
| | | | | | | | | | | | | | | | | | | | | | | | | | |
| | | | | | | | | | | | | Hypothetical Performance |
| | | Actual Performance | | | | (5% return before expenses) |
| | | A Shares | | B Shares | | C Shares | | I Shares | | | | A Shares | | B Shares | | C Shares | | I Shares |
| Beginning Account Value (1/01/09) | | $ | 1,000.00 | | $ | 1,000.00 | | $ | 1,000.00 | | $ | 1,000.00 | | | | $ | 1,000.00 | | $ | 1,000.00 | | $ | 1,000.00 | | $ | 1,000.00 |
| Ending Account Value (6/30/09) | | $ | 1,031.40 | | $ | 1,027.70 | | $ | 1,027.60 | | $ | 1,033.50 | | | | $ | 1,016.71 | | $ | 1,013.04 | | $ | 1,013.04 | | $ | 1,018.05 |
| Expenses Incurred During Period | | $ | 8.21 | | $ | 11.92 | | $ | 11.91 | | $ | 6.86 | | | | $ | 8.15 | | $ | 11.83 | | $ | 11.83 | | $ | 6.80 |
For each class of the Fund, expenses are equal to the Fund’s annualized net expense ratio of 1.63%, 2.37%, 2.37% and 1.36% for Classes A, B, C and I, respectively, multiplied by the average account value over the period, multiplied by 181/365 (to reflect the one-half year period).
Fund Spotlight as of 6/30/09 Nuveen Tradewinds Value Opportunities Fund
| | | | | | | | | | |
| Quick Facts | | | | | | | | | | |
| | | A Shares | | B Shares1 | | C Shares | | R3 Shares | | I Shares1 |
Fund Symbols | | NVOAX | | NVOBX | | NVOCX | | NTVTX | | NVORX |
NAV | | $24.17 | | $23.78 | | $23.77 | | $24.23 | | $24.19 |
Latest Capital Gain Distribution2 | | $0.5135 | | $0.5135 | | $0.5135 | | $0.5135 | | $0.5135 |
Latest Ordinary Income Distribution3 | | $0.5840 | | $0.5372 | | $0.5372 | | $0.5372 | | $0.6509 |
Inception Date | | 12/09/04 | | 12/09/04 | | 12/09/04 | | 8/04/08 | | 12/09/04 |
Returns quoted represent past performance which is no guarantee of future results. Investment returns and principal value will fluctuate so that when shares are redeemed, they may be worth more or less than their original cost. Current performance may be higher or lower than the performance shown. Returns without sales charges would be lower if the sales charge were included. Returns do not reflect the deduction of taxes that a shareholder would pay on Fund distributions or the redemption of shares. For the most recent month-end performance visit www.nuveen.com or call (800) 257-8787.
Class A, B, C and I Share returns are actual. The returns for Class R3 Shares are actual for the period since class inception; returns prior to class inception are Class I Share returns adjusted for differences in sales charges and expenses, which are primarily differences in distribution and service fees. Fund returns assume reinvestment of dividends and capital gains. Class A Shares have a 5.75% maximum sales charge. Class A Share purchases of $1 million or more are sold at net asset value without an up-front sales charge but may be subject to a contingent deferred sales charge (CDSC), also known as a backend sales charge, if redeemed within twelve months of purchase. Class B Shares have a CDSC that begins at 5% for redemptions during the first year and declines periodically until after six years when the charge becomes 0%. Class B Shares automatically convert to Class A Shares eight years after purchase. Class C Shares have a 1% CDSC for redemptions within less than one year, which is not reflected in the one-year total return. Class I Shares have no sales charge and may be purchased under limited circumstances or by specified classes of investors. Class R3 Shares have no sales charge and are available to only certain retirement plan clients of financial intermediaries. Returns may reflect an expense limitation by the Fund’s investment adviser.
| | | | |
| Average Annual Total Returns as of 6/30/09 |
| | |
| A Shares | | NAV | | Offer |
1-Year | | -13.47% | | -18.46% |
Since Inception | | 7.87% | | 6.48% |
| | |
| B Shares | | w/o CDSC | | w/CDSC |
1-Year | | -14.10% | | -17.35% |
Since Inception | | 7.06% | | 6.71% |
| | |
| C Shares | | NAV | | |
1-Year | | -14.14% | | |
Since Inception | | 7.05% | | |
| | |
| R3 Shares | | NAV | | |
1-Year | | -13.67% | | |
Since Inception | | 7.59% | | |
| | |
| I Shares | | NAV | | |
1-Year | | -13.29% | | |
Since Inception | | 8.13% | | |
| | |
| Top Five Common Stock Holdings4 | | |
Lihir Gold Limited, Sponsored ADR | | 3.8% |
Newmont Mining Corporation | | 3.6% |
Kinross Gold Corporation | | 3.4% |
Barrick Gold Corporation | | 3.1% |
Tyson Foods, Inc., Class A | | 2.9% |
Portfolio Allocation4
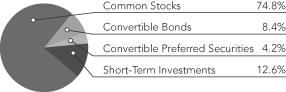
| | |
| Portfolio Statistics |
| Net Assets ($000) | | $1,063,231 |
| Number of Common Stocks | | 63 |
| | | | | | |
| Expense Ratios | | | | | | |
| Share Class | | Gross
Expense
Ratios | | Net
Expense
Ratios | | As of
Date |
| Class A | | 1.42% | | 1.41% | | 6/30/08 |
| Class B | | 2.17% | | 2.16% | | 6/30/08 |
| Class C | | 2.17% | | 2.16% | | 6/30/08 |
| Class R3 | | 1.67% | | 1.67% | | 10/31/08 |
| Class I | | 1.17% | | 1.17% | | 6/30/08 |
The expense ratios shown factor in Total Annual Fund Operating Expenses including management fees and other fees and expenses. The Gross and Net Expense Ratios for Class R3 are estimated based on the actual expenses for the Fund during the most recent fiscal year. The Net Expense Ratios reflect a custodian fee credit from the custodian bank whereby certain fees and expenses are reduced by credits earned on the Fund’s cash on deposit with the bank. There is no guarantee that the Fund will earn such credits in the future. Absent the credit, the Net Expense Ratios would be higher and total returns would be less. These expense ratios may vary from the expense ratios shown elsewhere in this report.
| 1 | Effective May 1, 2008, Class B Shares will only be issued upon exchange of Class B Shares from another Nuveen Fund or for purposes of dividend reinvestment. Effective December 31, 2008, the reinvestment privilege for Class B is no longer available. Effective May 1, 2008, Class R Shares were renamed Class I Shares. See the Fund’s prospectus for more information. |
| 3 | Ordinary income distribution consists of short-term capital gains paid on December 16, 2008, and ordinary income paid on December 31, 2008, if any. |
| 4 | As a percentage of total investments as of June 30, 2009. Holdings are subject to change. |
Fund Spotlight as of 6/31/09 Nuveen Tradewinds Value Opportunities Fund
| | |
| Country Allocation1 | | |
United States | | 56.3% |
Canada | | 15.6% |
Australia | | 4.5% |
Japan | | 2.1% |
South Africa | | 2.0% |
South Korea | | 1.9% |
Brazil | | 1.5% |
India | | 1.4% |
Switzerland | | 0.8% |
Argentina | | 0.8% |
Turkey | | 0.5% |
Short-Term Investments | | 12.6% |
| | |
| Industries1 | | |
Metals & Mining | | 20.7% |
Oil, Gas & Consumable Fuels | | 11.1% |
Food Products | | 5.4% |
Health Care Providers & Services | | 4.8% |
Machinery | | 3.4% |
Communications Equipment | | 3.4% |
Diversified Telecommunication Services | | 2.7% |
Electronic Equipment & Instruments | | 2.6% |
Electric Utilities | | 2.6% |
Wireless Telecommunication Services | | 2.5% |
Auto Components | | 2.2% |
Software | | 2.1% |
Media | | 2.0% |
Pharmaceuticals | | 2.0% |
Internet Software & Services | | 1.9% |
Food & Staples Retailing | | 1.9% |
Multi-Utilities | | 1.8% |
Short-Term Investments | | 12.6% |
Other | | 14.3% |
| 1 | As a percentage of total investments as of June 30, 2009. Holdings are subject to change. |
Expense Example
As a shareholder of the Fund, you incur two types of costs: (1) transaction costs, including front and back end sales charges (loads) or redemption fees, where applicable; and (2) ongoing costs, including management fees; distribution and service (12b-1) fees, where applicable; and other Fund expenses. This Example is intended to help you understand your ongoing costs (in dollars) of investing in the Fund and to compare these costs with the ongoing costs of investing in other mutual funds.
The Example below is based on an investment of $1,000 invested at the beginning of the period and held for the period.
The information under “Actual Performance,” together with the amount you invested, allows you to estimate actual expenses incurred over the reporting period. Simply divide your account value by $1,000 (for example, an $8,600 account value divided by $1,000 = 8.60) and multiply the result by the cost shown for your share class, in the row entitled “Expenses Incurred During Period” to estimate the expenses incurred on your account during this period.
The information under “Hypothetical Performance,” provides information about hypothetical account values and hypothetical expenses based on the Fund’s actual expense ratio and an assumed rate of return of 5% per year before expenses, which is not the Fund’s actual return. The hypothetical account values and expenses may not be used to estimate the actual ending account balance or expense you incurred for the period. You may use this information to compare the ongoing costs of investing in the Fund and other Funds. To do so, compare this 5% hypothetical example with the 5% hypothetical examples that appear in the shareholder reports of the other funds.
Please note that the expenses shown in the table are meant to highlight your ongoing costs only and do not reflect any transactional costs, such as front and back end sales charges (loads) or redemption fees, where applicable. Therefore, the hypothetical information is useful in comparing ongoing costs only, and will not help you determine the relative total costs of owning different funds or share classes. In addition, if these transactional costs were included, your costs would have been higher.
| | | | | | | | | | | | | | | | | | | | | | | | | | | | | | | | |
| | | | | | | | | | | | | | | Hypothetical Performance |
| | | Actual Performance | | | | (5% return before expenses) |
| | | A Shares | | B Shares | | C Shares | | R3 Shares | | I Shares | | | | A Shares | | B Shares | | C Shares | | R3 Shares | | I Shares |
| Beginning Account Value (1/01/09) | | $ | 1,000.00 | | $ | 1,000.00 | | $ | 1,000.00 | | $ | 1,000.00 | | $ | 1,000.00 | | | | $ | 1,000.00 | | $ | 1,000.00 | | $ | 1,000.00 | | $ | 1,000.00 | | $ | 1,000.00 |
| Ending Account Value (6/30/09) | | $ | 1,227.50 | | $ | 1,222.60 | | $ | 1,222.10 | | $ | 1,226.20 | | $ | 1,228.50 | | | | $ | 1,017.26 | | $ | 1,013.59 | | $ | 1,013.59 | | $ | 1,016.12 | | $ | 1,018.60 |
| Expenses Incurred During Period | | $ | 8.39 | | $ | 12.45 | | $ | 12.45 | | $ | 9.67 | | $ | 6.90 | | | | $ | 7.60 | | $ | 11.28 | | $ | 11.28 | | $ | 8.75 | | $ | 6.26 |
For each class of the Fund, expenses are equal to the Fund’s annualized net expense ratio of 1.50%, 2.25%, 2.25%, 1.75% and 1.25% for Classes A, B, C, R3 and I, respectively, multiplied by the average account value over the period, multiplied by 181/365 (to reflect the one-half year period).
Report of
Independent Registered Public Accounting Firm
To the Board of Trustees and Shareholders of
Nuveen Investment Trust:
In our opinion, the accompanying statements of assets and liabilities, including the portfolios of investments, and the related statements of operations, of changes in net assets and the financial highlights present fairly, in all material respects, the financial position of Nuveen Multi-Manager Large-Cap Value Fund, Nuveen NWQ Multi-Cap Value Fund, Nuveen NWQ Large-Cap Value Fund, Nuveen NWQ Small/Mid-Cap Value Fund, Nuveen NWQ Small-Cap Value Fund, and Nuveen Tradewinds Value Opportunities Fund (each a series of the Nuveen Investment Trust, hereafter referred to as the “Funds”) at June 30, 2009, the results of their operations for the year then ended, the changes in their net assets for each of the two years in the period then ended and the financial highlights for each of the five years in the period then ended in conformity with accounting principles generally accepted in the United States of America. These financial statements and financial highlights (hereafter referred to as “financial statements”) are the responsibility of the Funds’ management; our responsibility is to express an opinion on these financial statements based on our audits. We conducted our audits of these financial statements in accordance with the standards of the Public Company Accounting Oversight Board (United States). Those standards require that we plan and perform the audit to obtain reasonable assurance about whether the financial statements are free of material misstatement. An audit includes examining, on a test basis, evidence supporting the amounts and disclosures in the financial statements, assessing the accounting principles used and significant estimates made by management, and evaluating the overall financial statement presentation. We believe that our audits, which included confirmation of securities at June 30, 2009 by correspondence with the custodian and brokers, provide a reasonable basis for our opinion.
PRICEWATERHOUSECOOPERS LLP
Chicago, IL
August 24, 2009
Portfolio of Investments
Nuveen Multi-Manager Large-Cap Value Fund
June 30, 2009
| | | | | | | | | | | |
| Shares | | Description (1) | | | | | | | | Value |
| | | | | | | | | | | |
| | COMMON STOCKS – 97.2% | | | | | | | | | |
| | | | | |
| | Aerospace & Defense – 2.8% | | | | | | | | | |
| | | | | |
| 500 | | Alliant Techsystems Inc., (2) | | | | | | | | $ | 41,180 |
| | | | | |
| 100 | | BE Aerospace Inc., (2) | | | | | | | | | 1,436 |
| | | | | |
| 8,400 | | General Dynamics Corporation | | | | | | | | | 465,276 |
| | | | | |
| 83,950 | | Honeywell International Inc. | | | | | | | | | 2,636,030 |
| | | | | |
| 800 | | ITT Industries, Inc. | | | | | | | | | 35,600 |
| | | | | |
| 500 | | L-3 Communications Holdings, Inc. | | | | | | | | | 34,690 |
| | | | | |
| 30,750 | | Lockheed Martin Corporation | | | | | | | | | 2,479,988 |
| | | | | |
| 4,700 | | Northrop Grumman Corporation | | | | | | | | | 214,696 |
| | | | | |
| 29,410 | | Raytheon Company | | | | | | | | | 1,306,686 |
| | | | | |
| 2,500 | | Spirit AeroSystems Holdings Inc., (2) | | | | | | | | | 34,350 |
| | | | | |
| 7,700 | | United Technologies Corporation | | | | | | | | | 400,092 |
| | Total Aerospace & Defense | | | | | | | | | 7,650,024 |
| | Air Freight & Logistics – 0.1% | | | | | | | | | |
| | | | | |
| 5,100 | | FedEx Corporation | | | | | | | | | 283,662 |
| | | | | |
| 200 | | UTI Worldwide, Inc. | | | | | | | | | 2,280 |
| | Total Air Freight & Logistics | | | | | | | | | 285,942 |
| | Airlines – 0.1% | | | | | | | | | |
| | | | | |
| 200 | | Copa Holdings SA | | | | | | | | | 8,164 |
| | | | | |
| 23,200 | | Delta Air Lines, Inc., (2) | | | | | | | | | 134,328 |
| | | | | |
| 4,300 | | Southwest Airlines Co. | | | | | | | | | 28,939 |
| | Total Airlines | | | | | | | | | 171,431 |
| | Auto Components – 1.0% | | | | | | | | | |
| | | | | |
| 41,250 | | Autoliv Inc., (2) | | | | | | | | | 1,186,763 |
| | | | | |
| 100 | | BorgWarner Inc. | | | | | | | | | 3,415 |
| | | | | |
| 300 | | Federal Mogul Corporation, Class A Shares, (2) | | | | | | | | | 2,835 |
| | | | | |
| 2,900 | | Goodyear Tire & Rubber Company, (2) | | | | | | | | | 32,654 |
| | | | | |
| 66,250 | | Johnson Controls, Inc. | | | | | | | | | 1,438,950 |
| | | | | |
| 400 | | TRW Automotive Holdings Corporation, (2) | | | | | | | | | 4,520 |
| | Total Auto Components | | | | | | | | | 2,669,137 |
| | Automobiles – 0.2% | | | | | | | | | |
| | | | | |
| 91,400 | | Ford Motor Company, (2) | | | | | | | | | 554,798 |
| | | | | |
| 700 | | Harley-Davidson, Inc. | | | | | | | | | 11,347 |
| | | | | |
| 200 | | Thor Industries, Inc. | | | | | | | | | 3,674 |
| | Total Automobiles | | | | | | | | | 569,819 |
| | Beverages – 3.1% | | | | | | | | | |
| | | | | |
| 400 | | Brown-Forman Corporation | | | | | | | | | 17,192 |
| | | | | |
| 46,300 | | Coca-Cola Company | | | | | | | | | 2,221,937 |
| | | | | |
| 8,100 | | Coca-Cola Enterprises Inc. | | | | | | | | | 134,865 |
| | | | | |
| 1,800 | | Constellation Brands, Inc., Class A, (2) | | | | | | | | | 22,824 |
| | | | | |
| 37,530 | | Dr. Pepper Snapple Group, (2) | | | | | | | | | 795,261 |
| | | | | |
| 49,920 | | Molson Coors Brewing Company, Class B | | | | | | | | | 2,113,114 |
| | | | | |
| 21,300 | | Pepsi Bottling Group, Inc. | | | | | | | | | 720,792 |
| | | | | |
| 1,500 | | PepsiAmericas Inc. | | | | | | | | | 40,215 |
| | | | | |
| 41,400 | | PepsiCo, Inc. | | | | | | | | | 2,275,344 |
| | Total Beverages | | | | | | | | | 8,341,544 |
| | | | | | | | | | | |
| Shares | | Description (1) | | | | | | | | Value |
| | | | | | | | | | | |
| | Biotechnology – 1.1% | | | | | | | | | |
| | | | | |
| 57,020 | | Amgen Inc., (2) | | | | | | | | $ | 3,018,639 |
| | Building Products – 0.0% | | | | | | | | | |
| | | | | |
| 600 | | Armstrong World Industries Inc., (2) | | | | | | | | | 9,894 |
| | | | | |
| 3,000 | | Masco Corporation | | | | | | | | | 28,740 |
| | | | | |
| 500 | | Owens Corning, (2) | | | | | | | | | 6,390 |
| | Total Building Products | | | | | | | | | 45,024 |
| | Capital Markets – 3.6% | | | | | | | | | |
| | | | | |
| 3,000 | | Allied Capital Corporation | | | | | | | | | 10,440 |
| | | | | |
| 3,100 | | Ameriprise Financial, Inc. | | | | | | | | | 75,237 |
| | | | | |
| 160,954 | | Bank of New York Company, Inc. | | | | | | | | | 4,717,562 |
| | | | | |
| 1,300 | | E*Trade Group Inc., (2) | | | | | | | | | 1,664 |
| | | | | |
| 800 | | Franklin Resources, Inc. | | | | | | | | | 57,608 |
| | | | | |
| 5,300 | | Goldman Sachs Group, Inc. | | | | | | | | | 781,432 |
| | | | | |
| 47,170 | | Invesco LTD | | | | | | | | | 840,569 |
| | | | | |
| 100 | | Investment Technology Group, (2) | | | | | | | | | 2,039 |
| | | | | |
| 100 | | Janus Capital Group Inc. | | | | | | | | | 1,140 |
| | | | | |
| 800 | | Jefferies Group, Inc., (2) | | | | | | | | | 17,064 |
| | | | | |
| 56,460 | | Legg Mason, Inc. | | | | | | | | | 1,376,495 |
| | | | | |
| 57,180 | | Morgan Stanley | | | | | | | | | 1,630,202 |
| | | | | |
| 300 | | Northern Trust Corporation | | | | | | | | | 16,104 |
| | | | | |
| 1,800 | | Raymond James Financial Inc. | | | | | | | | | 30,978 |
| | | | | |
| 4,000 | | State Street Corporation | | | | | | | | | 188,800 |
| | Total Capital Markets | | | | | | | | | 9,747,334 |
| | Chemicals – 1.6% | | | | | | | | | |
| | | | | |
| 1,100 | | Cabot Corporation | | | | | | | | | 13,838 |
| | | | | |
| 600 | | Celanese Corporation, Series A | | | | | | | | | 14,250 |
| | | | | |
| 3,400 | | Chemtura Corporation | | | | | | | | | 816 |
| | | | | |
| 40,000 | | Dow Chemical Company | | | | | | | | | 645,600 |
| | | | | |
| 101,950 | | E.I. Du Pont de Nemours and Company | | | | | | | | | 2,611,959 |
| | | | | |
| 2,100 | | Eastman Chemical Company | | | | | | | | | 79,590 |
| | | | | |
| 900 | | FMC Corporation | | | | | | | | | 42,570 |
| | | | | |
| 1,200 | | Huntsman Corporation | | | | | | | | | 6,036 |
| | | | | |
| 200 | | Interpid Potash Inc., (2) | | | | | | | | | 5,616 |
| | | | | |
| 1,300 | | Lubrizol Corporation | | | | | | | | | 61,503 |
| | | | | |
| 100 | | Nalco Holding Company | | | | | | | | | 1,684 |
| | | | | |
| 2,900 | | PPG Industries, Inc. | | | | | | | | | 127,310 |
| | | | | |
| 1,500 | | RPM International, Inc. | | | | | | | | | 21,060 |
| | | | | |
| 19,310 | | Scotts Miracle Gro Company | | | | | | | | | 676,816 |
| | | | | |
| 600 | | Sigma-Aldrich Corporation | | | | | | | | | 29,736 |
| | | | | |
| 100 | | Valhi Inc. | | | | | | | | | 743 |
| | | | | |
| 2,200 | | Valspar Corporation | | | | | | | | | 49,566 |
| | Total Chemicals | | | | | | | | | 4,388,693 |
| | Commercial & Professional Services – 0.4% | | | | | | | | | |
| | | | | |
| 71,590 | | Corrections Corporation of America, (2) | | | | | | | | | 1,216,314 |
Portfolio of Investments
Nuveen Multi-Manager Large-Cap Value Fund (continued)
June 30, 2009
| | | | | | | | | | | |
| Shares | | Description (1) | | | | | | | | Value |
| | | | | | | | | | | |
| | Commercial Banks – 4.0% | | | | | | | | | |
| | | | | |
| 3,700 | | Associated Banc-Corp. | | | | | | | | $ | 46,250 |
| | | | | |
| 2,000 | | BancorpSouth Inc. | | | | | | | | | 41,060 |
| | | | | |
| 1,300 | | Bank of Hawaii Corporation | | | | | | | | | 46,579 |
| | | | | |
| 141,350 | | BB&T Corporation | | | | | | | | | 3,106,873 |
| | | | | |
| 300 | | BOK Financial Corporation | | | | | | | | | 11,301 |
| | | | | |
| 8,400 | | Capitalsource Inc. | | | | | | | | | 40,992 |
| | | | | |
| 700 | | City National Corporation | | | | | | | | | 25,781 |
| | | | | |
| 2,700 | | Comerica Incorporated | | | | | | | | | 57,105 |
| | | | | |
| 1,400 | | Commerce Bancshares Inc. | | | | | | | | | 44,562 |
| | | | | |
| 1,500 | | Cullen/Frost Bankers, Inc. | | | | | | | | | 69,180 |
| | | | | |
| 100 | | First Citizens Bancshs Inc. | | | | | | | | | 13,365 |
| | | | | |
| 2,641 | | First Horizon National Corporation, (2) | | | | | | | | | 31,692 |
| | | | | |
| 3,100 | | Fulton Financial Corporation | | | | | | | | | 16,151 |
| | | | | |
| 7,900 | | Huntington BancShares Inc. | | | | | | | | | 33,022 |
| | | | | |
| 1,700 | | KeyCorp. | | | | | | | | | 8,908 |
| | | | | |
| 1,400 | | M&T Bank Corporation | | | | | | | | | 71,302 |
| | | | | |
| 1,400 | | Marshall and Ilsley Corporation | | | | | | | | | 6,720 |
| | | | | |
| 9,600 | | PNC Financial Services Group, Inc. | | | | | | | | | 372,576 |
| | | | | |
| 6,300 | | Popular, Inc. | | | | | | | | | 13,860 |
| | | | | |
| 8,900 | | Regions Financial Corporation | | | | | | | | | 35,956 |
| | | | | |
| 5,200 | | SunTrust Banks, Inc. | | | | | | | | | 85,540 |
| | | | | |
| 2,200 | | Synovus Financial Corp. | | | | | | | | | 6,578 |
| | | | | |
| 3,400 | | TCF Financial Corporation | | | | | | | | | 45,458 |
| | | | | |
| 40,900 | | U.S. Bancorp | | | | | | | | | 732,928 |
| | | | | |
| 2,625 | | Valley National Bancorp. | | | | | | | | | 30,713 |
| | | | | |
| 244,030 | | Wells Fargo & Company | | | | | | | | | 5,920,167 |
| | | | | |
| 1,300 | | Whitney Holding Corporation | | | | | | | | | 11,908 |
| | | | | |
| 200 | | Wilmington Trust Corporation | | | | | | | | | 2,732 |
| | Total Commercial Banks | | | | | | | | | 10,929,259 |
| | Commercial Services & Supplies – 0.5% | | | | | | | | | |
| | | | | |
| 2,300 | | Avery Dennison Corporation | | | | | | | | | 59,064 |
| | | | | |
| 2,400 | | Cintas Corporation | | | | | | | | | 54,816 |
| | | | | |
| 300 | | Pitney Bowes Inc. | | | | | | | | | 6,579 |
| | | | | |
| 8,900 | | R.R. Donnelley & Sons Company | | | | | | | | | 103,418 |
| | | | | |
| 31,570 | | Republic Services, Inc. | | | | | | | | | 770,624 |
| | | | | |
| 1,300 | | Steelcase Inc. | | | | | | | | | 7,566 |
| | | | | |
| 9,200 | | Waste Management, Inc. | | | | | | | | | 259,072 |
| | Total Commercial Services & Supplies | | | | | | | | | 1,261,139 |
| | Communications Equipment – 0.8% | | | | | | | | | |
| | | | | |
| 4,100 | | Brocade Communications Systems Inc., (2) | | | | | | | | | 32,062 |
| | | | | |
| 111,450 | | Cisco Systems, Inc., (2) | | | | | | | | | 2,077,428 |
| | | | | |
| 400 | | Echostar Holding Corporation, Class A, (2) | | | | | | | | | 6,376 |
| | | | | |
| 4,800 | | Motorola, Inc. | | | | | | | | | 31,824 |
| | | | | |
| 5,100 | | Tellabs Inc., (2) | | | | | | | | | 29,223 |
| | Total Communications Equipment | | | | | | | | | 2,176,913 |
| | | | | | | | | | | |
| Shares | | Description (1) | | | | | | | | Value |
| | | | | | | | | | | |
| | Computers & Peripherals – 1.5% | | | | | | | | | |
| | | | | |
| 300 | | Diebold Inc. | | | | | | | | $ | 7,908 |
| | | | | |
| 6,400 | | EMC Corporation, (2) | | | | | | | | | 83,840 |
| | | | | |
| 97,000 | | Hewlett-Packard Company | | | | | | | | | 3,749,050 |
| | | | | |
| 2,400 | | Lexmark International, Inc., Class A, (2) | | | | | | | | | 38,040 |
| | | | | |
| 200 | | NCR Corporation, (2) | | | | | | | | | 2,366 |
| | | | | |
| 1,900 | | QLogic Corporation, (2) | | | | | | | | | 24,092 |
| | | | | |
| 6,800 | | Seagate Technology | | | | | | | | | 71,128 |
| | | | | |
| 1,400 | | Sun Microsystems Inc., (2) | | | | | | | | | 12,908 |
| | | | | |
| 1,300 | | Teradata Corporation, (2) | | | | | | | | | 30,459 |
| | Total Computers & Peripherals | | | | | | | | | 4,019,791 |
| | Construction & Engineering – 0.3% | | | | | | | | | |
| | | | | |
| 200 | | AECOM Technology Corporation, (2) | | | | | | | | | 6,400 |
| | | | | |
| 300 | | KBR Inc. | | | | | | | | | 5,532 |
| | | | | |
| 32,180 | | Quanta Services Incorporated, (2) | | | | | | | | | 744,323 |
| | | | | |
| 1,500 | | URS Corporation, (2) | | | | | | | | | 74,280 |
| | Total Construction & Engineering | | | | | | | | | 830,535 |
| | Construction Materials – 0.0% | | | | | | | | | |
| | | | | |
| 1,500 | | Vulcan Materials Company | | | | | | | | | 64,650 |
| | Consumer Finance – 0.5% | | | | | | | | | |
| | | | | |
| 2,100 | | American Express Company | | | | | | | | | 48,804 |
| | | | | |
| 55,300 | | Capital One Financial Corporation | | | | | | | | | 1,209,964 |
| | | | | |
| 18,500 | | Discover Financial Services | | | | | | | | | 189,995 |
| | | | | |
| 100 | | Student Loan Corporation | | | | | | | | | 3,720 |
| | Total Consumer Finance | | | | | | | | | 1,452,483 |
| | Containers & Packaging – 0.4% | | | | | | | | | |
| | | | | |
| 1,100 | | AptarGroup Inc. | | | | | | | | | 37,147 |
| | | | | |
| 1,600 | | Ball Corporation | | | | | | | | | 72,256 |
| | | | | |
| 2,400 | | Bemis Company, Inc. | | | | | | | | | 60,480 |
| | | | | |
| 1,700 | | Owens-Illinois, Inc., (2) | | | | | | | | | 47,617 |
| | | | | |
| 1,700 | | Packaging Corp. of America | | | | | | | | | 27,540 |
| | | | | |
| 34,930 | | Pactiv Corporation, (2) | | | | | | | | | 757,981 |
| | | | | |
| 2,500 | | Sealed Air Corporation | | | | | | | | | 46,125 |
| | | | | |
| 2,400 | | Sonoco Products Company | | | | | | | | | 57,480 |
| | | | | |
| 4,000 | | Temple-Inland Inc. | | | | | | | | | 52,480 |
| | Total Containers & Packaging | | | | | | | | | 1,159,106 |
| | Distributors – 0.0% | | | | | | | | | |
| | | | | |
| 3,500 | | Genuine Parts Company | | | | | | | | | 117,460 |
| | Diversified Consumer Services – 0.0% | | | | | | | | | |
| | | | | |
| 2,200 | | Career Education Corporation, (2) | | | | | | | | | 54,758 |
| | | | | |
| 4,500 | | Service Corporation International | | | | | | | | | 24,660 |
| | | | | |
| 100 | | Weight Watcher’s International Inc. | | | | | | | | | 2,577 |
| | Total Diversified Consumer Services | | | | | | | | | 81,995 |
| | Diversified Financial Services – 4.9% | | | | | | | | | |
| | | | | |
| 90,000 | | Bank of America Corporation | | | | | | | | | 1,188,000 |
| | | | | |
| 24,300 | | Citigroup Inc. | | | | | | | | | 72,171 |
Portfolio of Investments
Nuveen Multi-Manager Large-Cap Value Fund (continued)
June 30, 2009
| | | | | | | | | | | |
| Shares | | Description (1) | | | | | | | | Value |
| | | | | | | | | | | |
| | Diversified Financial Services (continued) | | | | | | | | | |
| | | | | |
| 100 | | CME Group, Inc. | | | | | | | | $ | 31,111 |
| | | | | |
| 304,470 | | JPMorgan Chase & Co. | | | | | | | | | 10,385,467 |
| | | | | |
| 3,200 | | Leucadia National Corporation, (2) | | | | | | | | | 67,488 |
| | | | | |
| 1,700 | | Moody’s Corporation | | | | | | | | | 44,795 |
| | | | | |
| 800 | | Nasdaq Stock Market, Inc., (2) | | | | | | | | | 17,048 |
| | | | | |
| 54,770 | | New York Stock Exchange Euronext | | | | | | | | | 1,492,483 |
| | Total Diversified Financial Services | | | | | | | | | 13,298,563 |
| | Diversified REIT – 0.1% | | | | | | | | | |
| | | | | |
| 2,600 | | Liberty Property Trust | | | | | | | | | 59,904 |
| | | | | |
| 2,931 | | Vornado Realty Trust | | | | | | | | | 131,983 |
| | Total Diversified REIT | | | | | | | | | 191,887 |
| | Diversified Telecommunication Services – 3.3% | | | | | | | | | |
| | | | | |
| 136,800 | | AT&T Inc. | | | | | | | | | 3,398,112 |
| | | | | |
| 58,950 | | BCE INC. | | | | | | | | | 1,217,907 |
| | | | | |
| 4,000 | | CenturyTel, Inc. | | | | | | | | | 122,800 |
| | | | | |
| 44,710 | | Embarq Corporation | | | | | | | | | 1,880,503 |
| | | | | |
| 9,200 | | Frontier Communications Corporation | | | | | | | | | 65,688 |
| | | | | |
| 33,000 | | Qwest Communications International Inc. | | | | | | | | | 136,950 |
| | | | | |
| 73,300 | | Verizon Communications Inc. | | | | | | | | | 2,252,509 |
| | | | | |
| 9,800 | | Windstream Corporation | | | | | | | | | 81,928 |
| | Total Diversified Telecommunication Services | | | | | | | | | 9,156,397 |
| | Electric Utilities – 3.0% | | | | | | | | | |
| | | | | |
| 13,100 | | American Electric Power Company, Inc. | | | | | | | | | 378,459 |
| | | | | |
| 2,800 | | DPL Inc. | | | | | | | | | 64,876 |
| | | | | |
| 31,900 | | Duke Energy Corporation | | | | | | | | | 465,421 |
| | | | | |
| 20,450 | | Edison International | | | | | | | | | 643,357 |
| | | | | |
| 6,950 | | Entergy Corporation | | | | | | | | | 538,764 |
| | | | | |
| 31,490 | | Exelon Corporation | | | | | | | | | 1,612,603 |
| | | | | |
| 8,200 | | FirstEnergy Corp. | | | | | | | | | 317,750 |
| | | | | |
| 44,400 | | FPL Group, Inc. | | | | | | | | | 2,524,584 |
| | | | | |
| 3,300 | | Great Plains Energy Incorporated | | | | | | | | | 51,315 |
| | | | | |
| 2,700 | | Hawaiian Electric Industries | | | | | | | | | 51,462 |
| | | | | |
| 4,600 | | Northeast Utilities | | | | | | | | | 102,626 |
| | | | | |
| 4,900 | | NV Energy Inc. | | | | | | | | | 52,871 |
| | | | | |
| 6,300 | | Pepco Holdings, Inc. | | | | | | | | | 84,672 |
| | | | | |
| 3,400 | | Pinnacle West Capital Corporation | | | | | | | | | 102,510 |
| | | | | |
| 7,800 | | Progress Energy, Inc. | | | | | | | | | 295,074 |
| | | | | |
| 28,660 | | Southern Company | | | | | | | | | 893,046 |
| | Total Electric Utilities | | | | | | | | | 8,179,390 |
| | Electrical Equipment – 0.0% | | | | | | | | | |
| | | | | |
| 900 | | Cooper Industries, Ltd., Class A | | | | | | | | | 27,945 |
| | | | | |
| 900 | | Hubbell Incorporated, Class B | | | | | | | | | 28,854 |
| | | | | |
| 1,700 | | Thomas & Betts Corporation, (2) | | | | | | | | | 49,062 |
| | Total Electrical Equipment | | | | | | | | | 105,861 |
| | | | | | | | | | | |
| Shares | | Description (1) | | | | | | | | Value |
| | | | | | | | | | | |
| | Electronic Components – 0.0% | | | | | | | | | |
| | | | | |
| 900 | | AVX Group | | | | | | | | $ | 8,937 |
| | | | | |
| 1,100 | | Vishay Intertechnology Inc., (2) | | | | | | | | | 7,469 |
| | Total Electronic Components | | | | | | | | | 16,406 |
| | Electronic Equipment & Instruments – 0.2% | | | | | | | | | |
| | | | | |
| 2,700 | | Arrow Electronics, Inc., (2) | | | | | | | | | 57,348 |
| | | | | |
| 900 | | Avnet Inc., (2) | | | | | | | | | 18,927 |
| | | | | |
| 5,200 | | Ingram Micro, Inc., (2) | | | | | | | | | 91,000 |
| | | | | |
| 800 | | Jabil Circuit Inc. | | | | | | | | | 5,936 |
| | | | | |
| 900 | | Molex Inc. | | | | | | | | | 13,995 |
| | | | | |
| 900 | | Tech Data Corporation, (2) | | | | | | | | | 29,439 |
| | | | | |
| 16,900 | | Tyco Electronics, Limited | | | | | | | | | 314,171 |
| | Total Electronic Equipment & Instruments | | | | | | | | | 530,816 |
| | Energy Equipment & Services – 2.0% | | | | | | | | | |
| | | | | |
| 78,800 | | Baker Hughes Incorporated | | | | | | | | | 2,871,472 |
| | | | | |
| 6,300 | | BJ Services Company | | | | | | | | | 85,869 |
| | | | | |
| 300 | | ENSCO International Incorporated | | | | | | | | | 10,461 |
| | | | | |
| 800 | | Exterran Holdings, Inc., (2) | | | | | | | | | 12,832 |
| | | | | |
| 46,240 | | Halliburton Company | | | | | | | | | 957,168 |
| | | | | |
| 1,600 | | Helix Energy Solutions Group, (2) | | | | | | | | | 17,392 |
| | | | | |
| 2,600 | | Helmerich & Payne Inc. | | | | | | | | | 80,262 |
| | | | | |
| 2,400 | | Hercules Offshore Inc., (2) | | | | | | | | | 9,528 |
| | | | | |
| 1,100 | | Key Energy Services Inc., (2) | | | | | | | | | 6,336 |
| | | | | |
| 9,700 | | Nabors Industries Inc., (2) | | | | | | | | | 151,126 |
| | | | | |
| 600 | | Oil States International Inc., (2) | | | | | | | | | 14,526 |
| | | | | |
| 2,000 | | Patterson-UTI Energy, Inc. | | | | | | | | | 25,720 |
| | | | | |
| 39,420 | | Pride International Inc., (2) | | | | | | | | | 987,865 |
| | | | | |
| 2,400 | | Rowan Companies Inc. | | | | | | | | | 46,368 |
| | | | | |
| 600 | | SeaCor Smit Inc., (2) | | | | | | | | | 45,144 |
| | | | | |
| 1,400 | | Tidewater Inc. | | | | | | | | | 60,018 |
| | | | | |
| 400 | | Unit Corporation, (2) | | | | | | | | | 11,028 |
| | Total Energy Equipment & Services | | | | | | | | | 5,393,115 |
| | Food & Staples Retailing – 2.4% | | | | | | | | | |
| | | | | |
| 1,500 | | BJ’s Wholesale Club, (2) | | | | | | | | | 48,345 |
| | | | | |
| 107,250 | | CVS Caremark Corporation | | | | | | | | | 3,418,058 |
| | | | | |
| 8,300 | | Kroger Co. | | | | | | | | | 183,015 |
| | | | | |
| 15,000 | | Rite Aid Corporation, (2) | | | | | | | | | 22,650 |
| | | | | |
| 9,700 | | Safeway Inc. | | | | | | | | | 197,589 |
| | | | | |
| 7,300 | | SUPERVALU INC. | | | | | | | | | 94,535 |
| | | | | |
| 1,100 | | Walgreen Co. | | | | | | | | | 32,340 |
| | | | | |
| 52,720 | | Wal-Mart Stores, Inc. | | | | | | | | | 2,553,757 |
| | Total Food & Staples Retailing | | | | | | | | | 6,550,289 |
| | Food Products – 1.2% | | | | | | | | | |
| | | | | |
| 13,900 | | Archer-Daniels-Midland Company | | | | | | | | | 372,103 |
| | | | | |
| 3,000 | | Bunge Limited | | | | | | | | | 180,750 |
| | | | | |
| 2,300 | | Campbell Soup Company | | | | | | | | | 67,666 |
Portfolio of Investments
Nuveen Multi-Manager Large-Cap Value Fund (continued)
June 30, 2009
| | | | | | | | | | | |
| Shares | | Description (1) | | | | | | | | Value |
| | | | | | | | | | | |
| | Food Products (continued) | | | | | | | | | |
| | | | | |
| 11,900 | | ConAgra Foods, Inc. | | | | | | | | $ | 226,814 |
| | | | | |
| 1,800 | | Corn Products International, Inc. | | | | | | | | | 48,222 |
| | | | | |
| 500 | | Dean Foods Company, (2) | | | | | | | | | 9,595 |
| | | | | |
| 5,300 | | Del Monte Foods Company | | | | | | | | | 49,714 |
| | | | | |
| 15,420 | | General Mills, Inc. | | | | | | | | | 863,828 |
| | | | | |
| 2,700 | | H.J. Heinz Company | | | | | | | | | 96,390 |
| | | | | |
| 1,000 | | Hershey Foods Corporation | | | | | | | | | 36,000 |
| | | | | |
| 1,000 | | Hormel Foods Corporation | | | | | | | | | 34,540 |
| | | | | |
| 1,900 | | JM Smucker Company | | | | | | | | | 92,454 |
| | | | | |
| 1,800 | | Kellogg Company | | | | | | | | | 83,826 |
| | | | | |
| 32,100 | | Kraft Foods Inc. | | | | | | | | | 813,414 |
| | | | | |
| 1,200 | | McCormick & Company, Incorporated | | | | | | | | | 39,036 |
| | | | | |
| 11,000 | | Sara Lee Corporation | | | | | | | | | 107,360 |
| | | | | |
| 2,800 | | Tyson Foods, Inc., Class A | | | | | | | | | 35,308 |
| | Total Food Products | | | | | | | | | 3,157,020 |
| | Gas Utilities – 0.2% | | | | | | | | | |
| | | | | |
| 2,600 | | AGL Resources Inc. | | | | | | | | | 82,680 |
| | | | | |
| 2,800 | | Atmos Energy Corporation | | | | | | | | | 70,112 |
| | | | | |
| 1,200 | | Energen Corporation | | | | | | | | | 47,880 |
| | | | | |
| 1,900 | | National Fuel Gas Company | | | | | | | | | 68,552 |
| | | | | |
| 2,700 | | ONEOK, Inc. | | | | | | | | | 79,623 |
| | | | | |
| 2,000 | | Questar Corporation | | | | | | | | | 62,120 |
| | | | | |
| 3,400 | | UGI Corporation | | | | | | | | | 86,666 |
| | Total Gas Utilities | | | | | | | | | 497,633 |
| | Health Care Equipment & Supplies – 1.3% | | | | | | | | | |
| | | | | |
| 100 | | Beckman Coulter, Inc. | | | | | | | | | 5,714 |
| | | | | |
| 6,900 | | Boston Scientific Corporation, (2) | | | | | | | | | 69,966 |
| | | | | |
| 600 | | Cooper Companies, Inc. | | | | | | | | | 14,838 |
| | | | | |
| 90,360 | | Covidien PLC | | | | | | | | | 3,383,078 |
| | | | | |
| 800 | | Hill Rom Holdings Inc. | | | | | | | | | 12,976 |
| | | | | |
| 1,200 | | Hospira Inc., (2) | | | | | | | | | 46,224 |
| | | | | |
| 600 | | Inverness Medical Innovation, (2) | | | | | | | | | 21,348 |
| | | | | |
| 1,300 | | Teleflex Inc. | | | | | | | | | 58,279 |
| | | | | |
| 1,000 | | Zimmer Holdings, Inc., (2) | | | | | | | | | 42,600 |
| | Total Health Care Equipment & Supplies | | | | | | | | | 3,655,023 |
| | Health Care Providers & Services – 1.1% | | | | | | | | | |
| | | | | |
| 2,900 | | Aetna Inc. | | | | | | | | | 72,645 |
| | | | | |
| 2,800 | | AmerisourceBergen Corporation | | | | | | | | | 49,672 |
| | | | | |
| 1,400 | | Cardinal Health, Inc. | | | | | | | | | 42,770 |
| | | | | |
| 3,400 | | CIGNA Corporation | | | | | | | | | 81,906 |
| | | | | |
| 600 | | Community Health Systems Inc., (2) | | | | | | | | | 15,150 |
| | | | | |
| 3,100 | | Coventry Health Care, Inc., (2) | | | | | | | | | 58,001 |
| | | | | |
| 400 | | Davita Inc., (2) | | | | | | | | | 19,784 |
| | | | | |
| 2,200 | | Health Management Associates Inc., (2) | | | | | | | | | 10,868 |
| | | | | |
| 800 | | Health Net Inc., (2) | | | | | | | | | 12,440 |
| | | | | | | | | | | |
| Shares | | Description (1) | | | | | | | | Value |
| | | | | | | | | | | |
| | Health Care Providers & Services (continued) | | | | | | | | | |
| | | | | |
| 100 | | Henry Schein Inc., (2) | | | | | | | | $ | 4,795 |
| | | | | |
| 1,400 | | Humana Inc., (2) | | | | | | | | | 45,164 |
| | | | | |
| 1,700 | | Lifepoint Hospitals Inc., (2) | | | | | | | | | 44,625 |
| | | | | |
| 200 | | Lincare Holdings, (2) | | | | | | | | | 4,704 |
| | | | | |
| 1,200 | | McKesson HBOC Inc. | | | | | | | | | 52,800 |
| | | | | |
| 100 | | Medax Inc., (2) | | | | | | | | | 4,213 |
| | | | | |
| 1,500 | | Omnicare, Inc. | | | | | | | | | 38,640 |
| | | | | |
| 27,810 | | Quest Diagnostics Incorporated | | | | | | | | | 1,569,318 |
| | | | | |
| 10,000 | | UnitedHealth Group Incorporated | | | | | | | | | 249,800 |
| | | | | |
| 1,000 | | Universal Health Services, Inc., Class B | | | | | | | | | 48,850 |
| | | | | |
| 9,600 | | Wellpoint Inc., (2) | | | | | | | | | 488,544 |
| | Total Health Care Providers & Services | | | | | | | | | 2,914,689 |
| | Health Care Technology – 0.0% | | | | | | | | | |
| | | | | |
| 4,100 | | Health Corporation, (2) | | | | | | | | | 53,710 |
| | | | | |
| 1,900 | | IMS Health Incorporated | | | | | | | | | 24,130 |
| | Total Health Care Technology | | | | | | | | | 77,840 |
| | Hotels, Restaurants & Leisure – 0.9% | | | | | | | | | |
| | | | | |
| 100 | | Boyd Gaming Corporation, (2) | | | | | | | | | 850 |
| | | | | |
| 8,900 | | Carnival Corporation | | | | | | | | | 229,353 |
| | | | | |
| 400 | | Choice Hotels International, Inc. | | | | | | | | | 10,644 |
| | | | | |
| 300 | | Interval Leisure Group Inc., (2) | | | | | | | | | 2,796 |
| | | | | |
| 500 | | Intl Speedway Corporation | | | | | | | | | 12,805 |
| | | | | |
| 25,070 | | McDonald’s Corporation | | | | | | | | | 1,441,274 |
| | | | | |
| 700 | | MGM Mirage Inc., (2) | | | | | | | | | 4,473 |
| | | | | |
| 60,740 | | Royal Caribbean Cruises Limited | | | | | | | | | 822,420 |
| | | | | |
| 5,600 | | Wyndham Worldwide Corporation | | | | | | | | | 67,872 |
| | Total Hotels, Restaurants & Leisure | | | | | | | | | 2,592,487 |
| | Household Durables – 0.2% | | | | | | | | | |
| | | | | |
| 1,600 | | Black & Decker Corporation | | | | | | | | | 45,856 |
| | | | | |
| 700 | | Centex Corporation | | | | | | | | | 5,922 |
| | | | | |
| 1,400 | | D.R. Horton, Inc. | | | | | | | | | 13,104 |
| | | | | |
| 3,300 | | Fortune Brands Inc. | | | | | | | | | 114,642 |
| | | | | |
| 100 | | Harman International Industries Inc. | | | | | | | | | 1,880 |
| | | | | |
| 1,000 | | Jarden Corporation, (2) | | | | | | | | | 18,750 |
| | | | | |
| 500 | | KB Home | | | | | | | | | 6,840 |
| | | | | |
| 2,500 | | Leggett and Platt Inc. | | | | | | | | | 38,075 |
| | | | | |
| 1,400 | | Lennar Corporation, Class A | | | | | | | | | 13,566 |
| | | | | |
| 400 | | MDC Holdings Inc. | | | | | | | | | 12,044 |
| | | | | |
| 900 | | Mohawk Industries Inc., (2) | | | | | | | | | 32,112 |
| | | | | |
| 2,400 | | Newell Rubbermaid Inc. | | | | | | | | | 24,984 |
| | | | | |
| 1,200 | | Pulte Corporation, (2) | | | | | | | | | 10,596 |
| | | | | |
| 1,200 | | Snap-on Incorporated | | | | | | | | | 34,488 |
| | | | | |
| 1,800 | | Stanley Works | | | | | | | | | 60,912 |
| | | | | |
| 1,000 | | Toll Brothers Inc., (2) | | | | | | | | | 16,970 |
| | | | | |
| 2,800 | | Whirlpool Corporation | | | | | | | | | 119,168 |
| | Total Household Durables | | | | | | | | | 569,909 |
Portfolio of Investments
Nuveen Multi-Manager Large-Cap Value Fund (continued)
June 30, 2009
| | | | | | | | | | | |
| Shares | | Description (1) | | | | | | | | Value |
| | | | | | | | | | | |
| | Household Products – 0.8% | | | | | | | | | |
| | | | | |
| 1,500 | | Clorox Company | | | | | | | | $ | 83,745 |
| | | | | |
| 5,100 | | Kimberly-Clark Corporation | | | | | | | | | 267,393 |
| | | | | |
| 35,600 | | Procter & Gamble Company | | | | | | | | | 1,819,160 |
| | Total Household Products | | | | | | | | | 2,170,298 |
| | Independent Power Producers & Energy Traders – 0.1% | | | | | | | | | |
| | | | | |
| 300 | | Constellation Energy Group | | | | | | | | | 7,974 |
| | | | | |
| 8,800 | | Dynegy Inc., (2) | | | | | | | | | 19,976 |
| | | | | |
| 2,700 | | Mirant Corporation, (2) | | | | | | | | | 42,498 |
| | | | | |
| 5,400 | | NRG Energy Inc., (2) | | | | | | | | | 140,184 |
| | Total Independent Power Producers & Energy Traders | | | | | | | | | 210,632 |
| | Industrial Conglomerates – 1.0% | | | | | | | | | |
| | | | | |
| 700 | | Carlisle Companies Inc. | | | | | | | | | 16,828 |
| | | | | |
| 220,500 | | General Electric Company | | | | | | | | | 2,584,260 |
| | | | | |
| 6,200 | | Tyco International Ltd. | | | | | | | | | 161,076 |
| | Total Industrial Conglomerates | | | | | | | | | 2,762,164 |
| | Industrial REIT – 0.1% | | | | | | | | | |
| | | | | |
| 700 | | AMB Property Corp. | | | | | | | | | 13,167 |
| | | | | |
| 15,700 | | ProLogis | | | | | | | | | 126,542 |
| | Total Industrial REIT | | | | | | | | | 139,709 |
| | Insurance – 5.0% | | | | | | | | | |
| | | | | |
| 74,660 | | Ace Limited | | | | | | | | | 3,302,212 |
| | | | | |
| 102 | | Alleghany Corporation, Term Loan, (2) | | | | | | | | | 27,642 |
| | | | | |
| 1,700 | | Allied World Assurance Holdings | | | | | | | | | 69,411 |
| | | | | |
| 5,700 | | Allstate Corporation | | | | | | | | | 139,080 |
| | | | | |
| 2,100 | | American Financial Group Inc. | | | | | | | | | 45,318 |
| | | | | |
| 200 | | American National Insurance Company | | | | | | | | | 15,116 |
| | | | | |
| 32,150 | | Aon Corporation | | | | | | | | | 1,217,521 |
| | | | | |
| 1,800 | | Arch Capital Group Limited, (2) | | | | | | | | | 105,444 |
| | | | | |
| 1,800 | | Arthur J. Gallagher & Co. | | | | | | | | | 38,412 |
| | | | | |
| 44,406 | | Assurant Inc. | | | | | | | | | 1,069,741 |
| | | | | |
| 2,900 | | Axis Capital Holdings Limited | | | | | | | | | 75,922 |
| | | | | |
| 1,900 | | Brown & Brown Inc. | | | | | | | | | 37,867 |
| | | | | |
| 10,500 | | Chubb Corporation | | | | | | | | | 418,740 |
| | | | | |
| 4,200 | | Cincinnati Financial Corporation | | | | | | | | | 93,870 |
| | | | | |
| 200 | | CNA Financial Corporation | | | | | | | | | 3,094 |
| | | | | |
| 1,400 | | Endurance Specialty Holdings, Limited | | | | | | | | | 41,020 |
| | | | | |
| 500 | | Erie Indemnity Company | | | | | | | | | 17,880 |
| | | | | |
| 1,000 | | Everest Reinsurance Group Ltd | | | | | | | | | 71,570 |
| | | | | |
| 4,200 | | Fidelity National Title Group Inc., Class A | | | | | | | | | 56,826 |
| | | | | |
| 28,094 | | First American Corporation | | | | | | | | | 727,916 |
| | | | | |
| 1,100 | | Hanover Insurance Group Inc. | | | | | | | | | 41,921 |
| | | | | |
| 3,500 | | HCC Insurance Holdings Inc. | | | | | | | | | 84,035 |
| | | | | |
| 7,600 | | Lincoln National Corporation | | | | | | | | | 130,796 |
| | | | | |
| 8,600 | | Loews Corporation | | | | | | | | | 235,640 |
| | | | | |
| 100 | | Markel Corporation, (2) | | | | | | | | | 28,170 |
| | | | | | | | | | | |
| Shares | | Description (1) | | | | | | | | Value |
| | | | | | | | | | | |
| | Insurance (continued) | | | | | | | | | |
| | | | | |
| 7,400 | | Marsh & McLennan Companies, Inc. | | | | | | | | $ | 148,962 |
| | | | | |
| 1,300 | | MBIA Inc., (2) | | | | | | | | | 5,629 |
| | | | | |
| 500 | | Mercury General Corporation | | | | | | | | | 16,715 |
| | | | | |
| 9,300 | | MetLife, Inc. | | | | | | | | | 279,093 |
| | | | | |
| 4,600 | | Old Republic International Corporation | | | | | | | | | 45,310 |
| | | | | |
| 1,000 | | OneBeacon Insurance Group Limited, Class A | | | | | | | | | 11,690 |
| | | | | |
| 1,100 | | PartnerRe Limited | | | | | | | | | 71,445 |
| | | | | |
| 68,930 | | Principal Financial Group, Inc. | | | | | | | | | 1,298,641 |
| | | | | |
| 62,490 | | Progressive Corporation, (2) | | | | | | | | | 944,224 |
| | | | | |
| 400 | | Protective Life Corporation | | | | | | | | | 4,576 |
| | | | | |
| 4,200 | | Prudential Financial, Inc. | | | | | | | | | 156,324 |
| | | | | |
| 1,000 | | Reinsurance Group of America Inc. | | | | | | | | | 34,910 |
| | | | | |
| 1,000 | | RenaisasnceRE Holdings, Limited | | | | | | | | | 46,540 |
| | | | | |
| 800 | | StanCorp Financial Group Inc. | | | | | | | | | 22,944 |
| | | | | |
| 1,500 | | Torchmark Corporation | | | | | | | | | 55,560 |
| | | | | |
| 200 | | Transatlantic Holdings Inc. | | | | | | | | | 8,666 |
| | | | | |
| 53,470 | | Travelers Companies, Inc. | | | | | | | | | 2,194,409 |
| | | | | |
| 600 | | Unitrin, Inc. | | | | | | | | | 7,212 |
| | | | | |
| 6,900 | | Unum Group | | | | | | | | | 109,434 |
| | | | | |
| 100 | | White Mountain Insurance Group | | | | | | | | | 22,891 |
| | | | | |
| 3,300 | | WR Berkley Corporation | | | | | | | | | 70,851 |
| | | | | |
| 3,300 | | XL Capital Ltd, Class A | | | | | | | | | 37,818 |
| | Total Insurance | | | | | | | | | 13,689,008 |
| | Internet & Catalog Retail – 0.0% | | | | | | | | | |
| | | | | |
| 2,600 | | Expedia, Inc., (2) | | | | | | | | | 39,286 |
| | | | | |
| 300 | | Hosting Site Network, Inc., (2) | | | | | | | | | 3,171 |
| | | | | |
| 6,600 | | Liberty Media Holding Corporation Interactive, Class A, (2) | | | | | | | | | 33,066 |
| | Total Internet & Catalog Retail | | | | | | | | | 75,523 |
| | Internet Software & Services – 0.0% | | | | | | | | | |
| | | | | |
| 2,700 | | IAC/InterActiveCorp., (2) | | | | | | | | | 43,335 |
| | IT Services – 1.4% | | | | | | | | | |
| | | | | |
| 18,180 | | Affiliated Computer Services, Inc., (2) | | | | | | | | | 807,556 |
| | | | | |
| 2,200 | | Amdocs Limited, (2) | | | | | | | | | 47,190 |
| | | | | |
| 6,600 | | Computer Sciences Corporation, (2) | | | | | | | | | 292,380 |
| | | | | |
| 800 | | Convergys Corporation, (2) | | | | | | | | | 7,424 |
| | | | | |
| 100 | | DST Systems Inc., (2) | | | | | | | | | 3,695 |
| | | | | |
| 2,500 | | Fidelity National Information Services | | | | | | | | | 49,900 |
| | | | | |
| 2,000 | | Lender Processing Services Inc. | | | | | | | | | 55,540 |
| | | | | |
| 2,800 | | SAIC, Inc., (2) | | | | | | | | | 51,940 |
| | | | | |
| 1,100 | | Unisys Corporation, (2) | | | | | | | | | 1,661 |
| | | | | |
| 38,600 | | Visa Inc. | | | | | | | | | 2,403,236 |
| | Total IT Services | | | | | | | | | 3,720,522 |
| | Leisure Equipment & Products – 0.4% | | | | | | | | | |
| | | | | |
| 9,200 | | Eastman Kodak Company | | | | | | | | | 27,232 |
| | | | | |
| 39,960 | | Hasbro, Inc. | | | | | | | | | 968,630 |
| | | | | |
| 8,700 | | Mattel, Inc. | | | | | | | | | 139,635 |
| | Total Leisure Equipment & Products | | | | | | | | | 1,135,497 |
Portfolio of Investments
Nuveen Multi-Manager Large-Cap Value Fund (continued)
June 30, 2009
| | | | | | | | | | | |
| Shares | | Description (1) | | | | | | | | Value |
| | | | | | | | | | | |
| | Life Sciences Tools & Services – 0.1% | | | | | | | | | |
| | | | | |
| 400 | | Charles River Laboratories International, Inc., (2) | | | | | | | | $ | 13,500 |
| | | | | |
| 600 | | Life Technologies Corporation, (2) | | | | | | | | | 25,032 |
| | | | | |
| 1,000 | | Perkinelmer Inc. | | | | | | | | | 17,400 |
| | | | | |
| 3,100 | | Thermo Fisher Scientific, Inc., (2) | | | | | | | | | 126,387 |
| | Total Life Sciences Tools & Services | | | | | | | | | 182,319 |
| | Machinery – 1.5% | | | | | | | | | |
| | | | | |
| 500 | | AGCO Corporation, (2) | | | | | | | | | 14,535 |
| | | | | |
| 30,800 | | Caterpillar Inc. | | | | | | | | | 1,017,632 |
| | | | | |
| 800 | | Crane Company | | | | | | | | | 17,848 |
| | | | | |
| 30,650 | | Cummins Inc. | | | | | | | | | 1,079,187 |
| | | | | |
| 900 | | Danaher Corporation | | | | | | | | | 55,566 |
| | | | | |
| 500 | | Dover Corporation | | | | | | | | | 16,545 |
| | | | | |
| 2,500 | | Eaton Corporation | | | | | | | | | 111,525 |
| | | | | |
| 16,050 | | Flowserve Corporation | | | | | | | | | 1,120,451 |
| | | | | |
| 1,300 | | Gardner Denver, Inc., (2) | | | | | | | | | 32,721 |
| | | | | |
| 200 | | IDEX Corporation | | | | | | | | | 4,914 |
| | | | | |
| 8,100 | | Illinois Tool Works, Inc. | | | | | | | | | 302,454 |
| | | | | |
| 10,800 | | Ingersoll Rand Company Limited, Class A | | | | | | | | | 225,720 |
| | | | | |
| 1,200 | | Kennametal Inc. | | | | | | | | | 23,016 |
| | | | | |
| 300 | | Lincoln Electric Holdings Inc. | | | | | | | | | 10,812 |
| | | | | |
| 2,300 | | Pentair, Inc. | | | | | | | | | 58,926 |
| | | | | |
| 5,400 | | Terex Corporation, (2) | | | | | | | | | 65,178 |
| | | | | |
| 1,800 | | Timken Company | | | | | | | | | 30,744 |
| | | | | |
| 2,800 | | Trinity Industries Inc. | | | | | | | | | 38,136 |
| | Total Machinery | | | | | | | | | 4,225,910 |
| | Marine – 0.0% | | | | | | | | | |
| | | | | |
| 1,100 | | Alexander and Bald, Inc., (2) | | | | | | | | | 25,784 |
| | Media – 3.0% | | | | | | | | | |
| | | | | |
| 400 | | Ascent Media Corporation, (2) | | | | | | | | | 10,632 |
| | | | | |
| 37,760 | | Cablevision Systems Corporation | | | | | | | | | 732,922 |
| | | | | |
| 37,300 | | CBS Corporation, Class B | | | | | | | | | 258,116 |
| | | | | |
| 200 | | Clear Channel Outdoor Holdings Inc., Class A, (2) | | | | | | | | | 1,060 |
| | | | | |
| 90,250 | | Comcast Corporation, Class A | | | | | | | | | 1,307,723 |
| | | | | |
| 1,900 | | Discovery Communications Inc., Class C Shares, (2) | | | | | | | | | 39,007 |
| | | | | |
| 5,500 | | Gannett Company Inc. | | | | | | | | | 19,635 |
| | | | | |
| 1,300 | | Interpublic Group Companies, Inc., (2) | | | | | | | | | 6,565 |
| | | | | |
| 3,900 | | Liberty Global Inc, A Shares, (2) | | | | | | | | | 61,971 |
| | | | | |
| 900 | | Liberty Media Holding Corporation, Capital Tracking Stock, Class A, (2) | | | | | | | | | 12,204 |
| | | | | |
| 2,600 | | McGraw-Hill Companies, Inc. | | | | | | | | | 78,286 |
| | | | | |
| 500 | | Meredith Corporation | | | | | | | | | 12,775 |
| | | | | |
| 40,200 | | News Corporation, Class A | | | | | | | | | 366,222 |
| | | | | |
| 18,900 | | Omnicom Group, Inc. | | | | | | | | | 596,862 |
| | | | | |
| 1,100 | | Regal Entertainment Group, Class A | | | | | | | | | 14,619 |
| | | | | |
| 600 | | Scripps Networks Interactive, Class A Shares | | | | | | | | | 16,698 |
| | | | | |
| 8,931 | | Time Warner Cable, Class A, (2) | | | | | | | | | 282,845 |
| | | | | | | | | | | |
| Shares | | Description (1) | | | | | | | | Value |
| | | | | | | | | | | |
| | Media (continued) | | | | | | | | | |
| | | | | |
| 31,600 | | Time Warner Inc. | | | | | | | | $ | 796,004 |
| | | | | |
| 124,050 | | Viacom Inc., Class B, (2) | | | | | | | | | 2,815,935 |
| | | | | |
| 14,600 | | Virgin Media, Inc. | | | | | | | | | 136,510 |
| | | | | |
| 29,700 | | Walt Disney Company | | | | | | | | | 692,901 |
| | | | | |
| 100 | | Warner Music Group Corporation, (2) | | | | | | | | | 585 |
| | Total Media | | | | | | | | | 8,260,077 |
| | Metals & Mining – 2.1% | | | | | | | | | |
| | | | | |
| 2,900 | | Alcoa Inc. | | | | | | | | | 29,957 |
| | | | | |
| 1,000 | | Carpenter Technology Inc. | | | | | | | | | 20,810 |
| | | | | |
| 2,000 | | Commercial Metals Company | | | | | | | | | 32,060 |
| | | | | |
| 45,123 | | Freeport-McMoRan Copper & Gold, Inc. | | | | | | | | | 2,261,114 |
| | | | | |
| 52,050 | | Newmont Mining Corporation | | | | | | | | | 2,127,284 |
| | | | | |
| 5,800 | | Nucor Corporation | | | | | | | | | 257,694 |
| | | | | |
| 1,500 | | Reliance Steel & Aluminum Company | | | | | | | | | 57,585 |
| | | | | |
| 400 | | Schnitzer Steel Industries, Inc. | | | | | | | | | 21,144 |
| | | | | |
| 71,174 | | Steel Dynamics Inc. | | | | | | | | | 1,048,393 |
| | | | | |
| 1,100 | | Titanium Metals Corporation | | | | | | | | | 10,109 |
| | | | | |
| 400 | | United States Steel Corporation | | | | | | | | | 14,296 |
| | Total Metals & Mining | | | | | | | | | 5,880,446 |
| | Mortgage REIT – 0.5% | | | | | | | | | |
| | | | | |
| 98,210 | | Annaly Capital Management Inc. | | | | | | | | | 1,486,899 |
| | | | | |
| 1,700 | | iStar Financial Inc. | | | | | | | | | 4,828 |
| | Total Mortgage REIT | | | | | | | | | 1,491,727 |
| | Multiline Retail – 0.7% | | | | | | | | | |
| | | | | |
| 33,420 | | Family Dollar Stores, Inc. | | | | | | | | | 945,786 |
| | | | | |
| 65,150 | | Federated Department Stores, Inc. | | | | | | | | | 766,164 |
| | | | | |
| 5,800 | | J.C. Penney Company, Inc. | | | | | | | | | 166,518 |
| | | | | |
| 1,400 | | Kohl’s Corporation, (2) | | | | | | | | | 59,850 |
| | | | | |
| 500 | | Sears Holding Corporation, (2) | | | | | | | | | 33,260 |
| | | | | |
| 900 | | Target Corporation | | | | | | | | | 35,523 |
| | Total Multiline Retail | | | | | | | | | 2,007,101 |
| | Multi-Utilities – 1.1% | | | | | | | | | |
| | | | | |
| 3,700 | | Alliant Energy Corporation | | | | | | | | | 96,681 |
| | | | | |
| 7,500 | | Ameren Corporation | | | | | | | | | 186,675 |
| | | | | |
| 4,300 | | CenterPoint Energy, Inc. | | | | | | | | | 47,644 |
| | | | | |
| 4,200 | | CMS Energy Corporation | | | | | | | | | 50,736 |
| | | | | |
| 8,400 | | Consolidated Edison, Inc. | | | | | | | | | 314,328 |
| | | | | |
| 14,700 | | Dominion Resources, Inc. | | | | | | | | | 491,274 |
| | | | | |
| 5,900 | | DTE Energy Company | | | | | | | | | 188,800 |
| | | | | |
| 1,800 | | Integrys Energy Group, Inc. | | | | | | | | | 53,982 |
| | | | | |
| 4,800 | | MDU Resources Group Inc. | | | | | | | | | 91,056 |
| | | | | |
| 6,800 | | NiSource Inc. | | | | | | | | | 79,288 |
| | | | | |
| 2,700 | | NSTAR | | | | | | | | | 86,697 |
| | | | | |
| 2,600 | | OGE Energy Corp. | | | | | | | | | 73,632 |
| | | | | |
| 9,200 | | PG&E Corporation | | | | | | | | | 353,648 |
Portfolio of Investments
Nuveen Multi-Manager Large-Cap Value Fund (continued)
June 30, 2009
| | | | | | | | | | | |
| Shares | | Description (1) | | | | | | | | Value |
| | | | | | | | | | | |
| | Multi-Utilities (continued) | | | | | | | | | |
| | | | | |
| 3,300 | | Scana Corporation | | | | | | | | $ | 107,151 |
| | | | | |
| 6,100 | | Sempra Energy | | | | | | | | | 302,743 |
| | | | | |
| 6,300 | | TECO Energy, Inc. | | | | | | | | | 75,159 |
| | | | | |
| 2,500 | | Vectren Corporation | | | | | | | | | 58,575 |
| | | | | |
| 2,600 | | Wisconsin Energy Corporation | | | | | | | | | 105,846 |
| | | | | |
| 12,100 | | Xcel Energy, Inc. | | | | | | | | | 222,761 |
| | Total Multi-Utilities | | | | | | | | | 2,986,676 |
| | Office Electronics – 0.1% | | | | | | | | | |
| | | | | |
| 19,300 | | Xerox Corporation | | | | | | | | | 125,064 |
| | | | | |
| 100 | | Zebra Technologies Corporation, Class A, (2) | | | | | | | | | 2,366 |
| | Total Office Electronics | | | | | | | | | 127,430 |
| | Office REIT – 0.1% | | | | | | | | | |
| | | | | |
| 600 | | Alexandria Real Estate Equities Inc. | | | | | | | | | 21,474 |
| | | | | |
| 800 | | Boston Properties, Inc. | | | | | | | | | 38,160 |
| | | | | |
| 8,000 | | Brandywine Realty Trust | | | | | | | | | 59,600 |
| | | | | |
| 400 | | Digital Realty Trust Inc. | | | | | | | | | 14,340 |
| | | | | |
| 1,200 | | Douglas Emmett Inc. | | | | | | | | | 10,788 |
| | | | | |
| 7,100 | | Duke Realty Corporation | | | | | | | | | 62,267 |
| | | | | |
| 11,800 | | HRPT Properties Trust | | | | | | | | | 47,908 |
| | | | | |
| 400 | | Kilroy Realty Corporation | | | | | | | | | 8,216 |
| | | | | |
| 1,500 | | Mack-Cali Realty Corporation | | | | | | | | | 34,200 |
| | | | | |
| 4,200 | | SL Green Realty Corporation | | | | | | | | | 96,348 |
| | Total Office REIT | | | | | | | | | 393,301 |
| | Oil, Gas & Consumable Fuels – 14.1% | | | | | | | | | |
| | | | | |
| 11,500 | | Anadarko Petroleum Corporation | | | | | | | | | 521,985 |
| | | | | |
| 9,500 | | Apache Corporation | | | | | | | | | 685,425 |
| | | | | |
| 15,300 | | BP PLC, Sponsored ADR | | | | | | | | | 729,504 |
| | | | | |
| 400 | | Cabot Oil & Gas Corporation | | | | | | | | | 12,256 |
| | | | | |
| 83,580 | | Chesapeake Energy Corporation | | | | | | | | | 1,657,391 |
| | | | | |
| 117,270 | | Chevron Corporation | | | | | | | | | 7,769,137 |
| | | | | |
| 42,310 | | Cimarex Energy Company | | | | | | | | | 1,199,065 |
| | | | | |
| 33,900 | | ConocoPhillips | | | | | | | | | 1,425,834 |
| | | | | |
| 26,300 | | Continental Resources Inc., (2) | | | | | | | | | 729,825 |
| | | | | |
| 14,000 | | Devon Energy Corporation | | | | | | | | | 763,000 |
| | | | | |
| 18,500 | | El Paso Corporation | | | | | | | | | 170,755 |
| | | | | |
| 1,000 | | Encore Acquisition Company, (2) | | | | | | | | | 30,850 |
| | | | | |
| 15,610 | | EOG Resources, Inc. | | | | | | | | | 1,060,231 |
| | | | | |
| 90,200 | | Exxon Mobil Corporation, Sponsored ADR | | | | | | | | | 6,305,881 |
| | | | | |
| 4,700 | | Forest Oil Corporation, (2) | | | | | | | | | 70,124 |
| | | | | |
| 34,600 | | Hess Corporation | | | | | | | | | 1,859,750 |
| | | | | |
| 94,800 | | Marathon Oil Corporation | | | | | | | | | 2,856,324 |
| | | | | |
| 1,000 | | Mariner Energy Inc., (2) | | | | | | | | | 11,750 |
| | | | | |
| 12,790 | | Murphy Oil Corporation | | | | | | | | | 694,753 |
| | | | | |
| 3,900 | | Newfield Exploration Company, (2) | | | | | | | | | 127,413 |
| | | | | |
| 3,700 | | Noble Energy, Inc. | | | | | | | | | 218,189 |
| | | | | | | | | | | |
| Shares | | Description (1) | | | | | | | | Value |
| | | | | | | | | | | |
| | Oil, Gas & Consumable Fuels (continued) | | | | | | | | | |
| | | | | |
| 86,890 | | Occidental Petroleum Corporation | | | | | | | | $ | 5,718,230 |
| | | | | |
| 1,300 | | Overseas Shipholding Group Inc. | | | | | | | | | 44,252 |
| | | | | |
| 200 | | Petrohawk Energy Corporation, (2) | | | | | | | | | 4,460 |
| | | | | |
| 3,300 | | Pioneer Natural Resources Company | | | | | | | | | 84,150 |
| | | | | |
| 600 | | Plains Exploration & Production Company, (2) | | | | | | | | | 16,416 |
| | | | | |
| 2,400 | | Southern Union Company | | | | | | | | | 44,136 |
| | | | | |
| 16,400 | | Spectra Energy Corporation | | | | | | | | | 277,488 |
| | | | | |
| 800 | | St Mary Land and Exploration Company | | | | | | | | | 16,696 |
| | | | | |
| 1,600 | | Sunoco, Inc. | | | | | | | | | 37,120 |
| | | | | |
| 1,400 | | Teekay Shipping Corporation | | | | | | | | | 29,442 |
| | | | | |
| 1,100 | | Tesoro Corporation | | | | | | | | | 14,003 |
| | | | | |
| 43,650 | | Total SA, Sponsored ADR | | | | | | | | | 2,367,140 |
| | | | | |
| 46,620 | | Valero Energy Corporation | | | | | | | | | 787,412 |
| | | | | |
| 9,300 | | XTO Energy, Inc. | | | | | | | | | 354,702 |
| | Total Oil, Gas & Consumable Fuels | | | | | | | | | 38,695,089 |
| | Paper & Forest Products – 0.1% | | | | | | | | | |
| | | | | |
| 3,025 | | Domtar Corporation, (2) | | | | | | | | | 50,155 |
| | | | | |
| 14,200 | | International Paper Company | | | | | | | | | 214,846 |
| | | | | |
| 3,300 | | MeadWestvaco Corporation | | | | | | | | | 54,153 |
| | | | | |
| 1,200 | | Weyerhaeuser Company | | | | | | | | | 36,516 |
| | Total Paper & Forest Products | | | | | | | | | 355,670 |
| | Personal Products – 0.3% | | | | | | | | | |
| | | | | |
| 2,100 | | Alberto Culver Company | | | | | | | | | 53,403 |
| | | | | |
| 31,800 | | Avon Products, Inc. | | | | | | | | | 819,804 |
| | | | | |
| 600 | | NBTY Inc., (2) | | | | | | | | | 16,872 |
| | Total Personal Products | | | | | | | | | 890,079 |
| | Pharmaceuticals – 9.2% | | | | | | | | | |
| | | | | |
| 95,820 | | Bristol-Myers Squibb Company | | | | | | | | | 1,946,104 |
| | | | | |
| 43,760 | | Eli Lilly and Company | | | | | | | | | 1,515,846 |
| | | | | |
| 300 | | Endo Pharmaceuticals Holdings Inc., (2) | | | | | | | | | 5,376 |
| | | | | |
| 5,000 | | Forest Laboratories, Inc., (2) | | | | | | | | | 125,550 |
| | | | | |
| 73,670 | | Johnson & Johnson | | | | | | | | | 4,184,456 |
| | | | | |
| 8,700 | | King Pharmaceuticals Inc., (2) | | | | | | | | | 83,781 |
| | | | | |
| 27,500 | | Merck & Co. Inc. | | | | | | | | | 768,900 |
| | | | | |
| 3,200 | | Mylan Laboratories Inc., (2) | | | | | | | | | 41,760 |
| | | | | |
| 54,850 | | Novartis AG | | | | | | | | | 2,237,332 |
| | | | | |
| 317,650 | | Pfizer Inc. | | | | | | | | | 4,764,750 |
| | | | | |
| 127,800 | | Schering-Plough Corporation | | | | | | | | | 3,210,336 |
| | | | | |
| 56,870 | | Watson Pharmaceuticals Inc., (2) | | | | | | | | | 1,915,950 |
| | | | | |
| 97,600 | | Wyeth | | | | | | | | | 4,430,064 |
| | Total Pharmaceuticals | | | | | | | | | 25,230,205 |
| | Professional Services – 0.0% | | | | | | | | | |
| | | | | |
| 200 | | Dun and Bradstreet Inc. | | | | | | | | | 16,242 |
| | | | | |
| 900 | | Equifax Inc. | | | | | | | | | 23,490 |
| | | | | |
| 1,400 | | Manpower Inc. | | | | | | | | | 59,276 |
| | Total Professional Services | | | | | | | | | 99,008 |
Portfolio of Investments
Nuveen Multi-Manager Large-Cap Value Fund (continued)
June 30, 2009
| | | | | | | | | | | |
| Shares | | Description (1) | | | | | | | | Value |
| | | | | | | | | | | |
| | Real Estate Management & Development – 0.0% | | | | | | | | | |
| | | | | |
| 500 | | CB Richard Ellis Group, Inc., Class A, (2) | | | | | | | | $ | 4,680 |
| | | | | |
| 400 | | Jones Lang LaSalle Inc. | | | | | | | | | 13,092 |
| | Total Real Estate Management & Development | | | | | | | | | 17,772 |
| | Residential REIT – 0.2% | | | | | | | | | |
| | | | | |
| 5,100 | | Apartment Investment & Management Company, Class A | | | | | | | | | 45,135 |
| | | | | |
| 2,000 | | AvalonBay Communities, Inc. | | | | | | | | | 111,880 |
| | | | | |
| 1,200 | | BRE Properties, Inc. | | | | | | | | | 28,512 |
| | | | | |
| 500 | | Camden Property Trust | | | | | | | | | 13,800 |
| | | | | |
| 5,600 | | Equity Residential | | | | | | | | | 124,488 |
| | | | | |
| 300 | | Essex Property Trust Inc. | | | | | | | | | 18,669 |
| | | | | |
| 8,100 | | UDR Inc. | | | | | | | | | 83,673 |
| | Total Residential REIT | | | | | | | | | 426,157 |
| | Retail REIT – 0.1% | | | | | | | | | |
| | | | | |
| 2,964 | | CBL & Associates Properties Inc. | | | | | | | | | 15,976 |
| | | | | |
| 11,971 | | Developers Diversified Realty Corporation | | | | | | | | | 58,418 |
| | | | | |
| 600 | | Federal Realty Investment Trust | | | | | | | | | 30,912 |
| | | | | |
| 22,000 | | General Growth Properties Inc. | | | | | | | | | 40,260 |
| | | | | |
| 7,300 | | Kimco Realty Corporation | | | | | | | | | 73,365 |
| | | | | |
| 1,300 | | Regency Centers Corporation | | | | | | | | | 45,383 |
| | | | | |
| 3,200 | | Weingarten Realty Investors Trust | | | | | | | | | 46,432 |
| | Total Retail REIT | | | | | | | | | 310,746 |
| | Road & Rail – 2.2% | | | | | | | | | |
| | | | | |
| 5,300 | | Avis Budget Group Inc., (2) | | | | | | | | | 29,945 |
| | | | | |
| 13,700 | | Burlington Northern Santa Fe Corporation | | | | | | | | | 1,007,498 |
| | | | | |
| 300 | | Con-Way, Inc. | | | | | | | | | 10,593 |
| | | | | |
| 83,250 | | CSX Corporation | | | | | | | | | 2,882,948 |
| | | | | |
| 1,600 | | Hertz Global Holdings, Inc., (2) | | | | | | | | | 12,784 |
| | | | | |
| 400 | | Kansas City Southern Industries, (2) | | | | | | | | | 6,444 |
| | | | | |
| 48,520 | | Norfolk Southern Corporation | | | | | | | | | 1,827,748 |
| | | | | |
| 700 | | Ryder System, Inc. | | | | | | | | | 19,544 |
| | | | | |
| 6,970 | | Union Pacific Corporation | | | | | | | | | 362,858 |
| | Total Road & Rail | | | | | | | | | 6,160,362 |
| | Semiconductors & Equipment – 2.5% | | | | | | | | | |
| | | | | |
| 1,700 | | Advanced Micro Devices, Inc., (2) | | | | | | | | | 6,579 |
| | | | | |
| 18,300 | | ASM Lithography Holding NV | | | | | | | | | 396,195 |
| | | | | |
| 5,800 | | Atmel Corporation, (2) | | | | | | | | | 21,634 |
| | | | | |
| 600 | | Cree, Inc., (2) | | | | | | | | | 17,634 |
| | | | | |
| 1,000 | | Integrated Device Technology, Inc., (2) | | | | | | | | | 6,040 |
| | | | | |
| 236,620 | | Intel Corporation | | | | | | | | | 3,916,061 |
| | | | | |
| 600 | | International Rectifier Corporation, (2) | | | | | | | | | 8,886 |
| | | | | |
| 700 | | Intersil Holding Corporation, Class A | | | | | | | | | 8,799 |
| | | | | |
| 100 | | Lam Research Corporation, (2) | | | | | | | | | 2,600 |
| | | | | |
| 1,500 | | LSI Logic Corporation, (2) | | | | | | | | | 6,840 |
| | | | | |
| 6,800 | | Micron Technology, Inc., (2) | | | | | | | | | 34,408 |
| | | | | |
| 600 | | Novellus Systems, Inc., (2) | | | | | | | | | 10,020 |
| | | | | |
| 110,550 | | Texas Instruments Incorporated | | | | | | | | | 2,354,715 |
| | Total Semiconductors & Equipment | | | | | | | | | 6,790,411 |
| | | | | | | | | | | |
| Shares | | Description (1) | | | | | | | | Value |
| | | | | | | | | | | |
| | Software – 1.8% | | | | | | | | | |
| | | | | |
| 78,020 | | CA Inc. | | | | | | | | $ | 1,359,889 |
| | | | | |
| 800 | | Cadence Design Systems, Inc., (2) | | | | | | | | | 4,720 |
| | | | | |
| 2,700 | | Compuware Corporation, (2) | | | | | | | | | 18,522 |
| | | | | |
| 100 | | McAfee Inc., (2) | | | | | | | | | 4,219 |
| | | | | |
| 92,450 | | Microsoft Corporation | | | | | | | | | 2,197,537 |
| | | | | |
| 200 | | Novell Inc., (2) | | | | | | | | | 906 |
| | | | | |
| 77,550 | | Symantec Corporation, (2) | | | | | | | | | 1,206,678 |
| | | | | |
| 2,200 | | Synopsys Inc., (2) | | | | | | | | | 42,922 |
| | Total Software | | | | | | | | | 4,835,393 |
| | Specialized REIT – 0.5% | | | | | | | | | |
| | | | | |
| 5,500 | | Health Care Property Investors Inc. | | | | | | | | | 116,545 |
| | | | | |
| 2,400 | | Health Care REIT, Inc. | | | | | | | | | 81,840 |
| | | | | |
| 4,000 | | Hospitality Properties Trust | | | | | | | | | 47,560 |
| | | | | |
| 21,700 | | Host Hotels & Resorts Inc. | | | | | | | | | 182,063 |
| | | | | |
| 3,000 | | Nationwide Health Properties, Inc. | | | | | | | | | 77,220 |
| | | | | |
| 1,200 | | Plum Creek Timber Company | | | | | | | | | 35,736 |
| | | | | |
| 1,900 | | Public Storage, Inc. | | | | | | | | | 124,412 |
| | | | | |
| 19,340 | | Rayonier Inc. | | | | | | | | | 703,009 |
| | | | | |
| 1,400 | | Ventas Inc. | | | | | | | | | 41,804 |
| | Total Specialized REIT | | | | | | | | | 1,410,189 |
| | Specialty Retail – 2.8% | | | | | | | | | |
| | | | | |
| 900 | | American Eagle Outfitters, Inc. | | | | | | | | | 12,753 |
| | | | | |
| 300 | | Ann Taylor Stores Corporation, (2) | | | | | | | | | 2,394 |
| | | | | |
| 1,400 | | AutoNation Inc., (2) | | | | | | | | | 24,290 |
| | | | | |
| 800 | | Barnes & Noble Inc. | | | | | | | | | 16,504 |
| | | | | |
| 700 | | Bed Bath and Beyond Inc., (2) | | | | | | | | | 21,525 |
| | | | | |
| 4,200 | | Foot Locker, Inc. | | | | | | | | | 43,974 |
| | | | | |
| 4,400 | | Gap, Inc. | | | | | | | | | 72,160 |
| | | | | |
| 96,890 | | Home Depot, Inc. | | | | | | | | | 2,289,511 |
| | | | | |
| 2,800 | | Limited Brands, Inc. | | | | | | | | | 33,516 |
| | | | | |
| 263,520 | | Lowe’s Companies, Inc. | | | | | | | | | 5,114,923 |
| | | | | |
| 800 | | Office Depot, Inc., (2) | | | | | | | | | 3,648 |
| | | | | |
| 1,200 | | O’Reilly Automotive Inc., (2) | | | | | | | | | 45,696 |
| | | | | |
| 700 | | Penske Auto Group, Inc. | | | | | | | | | 11,648 |
| | | | | |
| 2,700 | | RadioShack Corporation | | | | | | | | | 37,692 |
| | | | | |
| 800 | | Signet Jewelers Limited | | | | | | | | | 16,656 |
| | | | | |
| 1,400 | | Staples, Inc. | | | | | | | | | 28,238 |
| | | | | |
| 1,300 | | Williams-Sonoma Inc. | | | | | | | | | 15,431 |
| | Total Specialty Retail | | | | | | | | | 7,790,559 |
| | Textiles, Apparel & Luxury Goods – 0.0% | | | | | | | | | |
| | | | | |
| 200 | | Jones Apparel Group, Inc. | | | | | | | | | 2,146 |
| | | | | |
| 1,300 | | Liz Claiborne, Inc. | | | | | | | | | 3,744 |
| | | | | |
| 100 | | Phillips-Van Heusen Corporation | | | | | | | | | 2,869 |
| | | | | |
| 1,800 | | VF Corporation | | | | | | | | | 99,630 |
| | Total Textiles, Apparel & Luxury Goods | | | | | | | | | 108,389 |
Portfolio of Investments
Nuveen Multi-Manager Large-Cap Value Fund (continued)
June 30, 2009
| | | | | | | | | | | |
| Shares | | Description (1) | | | | | | | | Value |
| | | | | | | | | | | |
| | Thrifts & Mortgage Finance – 0.7% | | | | | | | | | |
| | | | | |
| 900 | | Astoria Financial Corporation | | | | | | | | $ | 7,722 |
| | | | | |
| 300 | | Capitol Federal Financial | | | | | | | | | 11,499 |
| | | | | |
| 3,200 | | Federal Home Loan Mortgage Corporation, (2) | | | | | | | | | 1,984 |
| | | | | |
| 69,900 | | Federal National Mortgage Association | | | | | | | | | 40,542 |
| | | | | |
| 91,310 | | Hudson City Bancorp, Inc. | | | | | | | | | 1,213,510 |
| | | | | |
| 400 | | MGIC Investment Corporation | | | | | | | | | 1,760 |
| | | | | |
| 6,400 | | New York Community Bancorp, Inc. | | | | | | | | | 68,416 |
| | | | | |
| 38,980 | | People’s United Financial, Inc. | | | | | | | | | 586,259 |
| | | | | |
| 1,600 | | TFS Financial Corporation | | | | | | | | | 16,992 |
| | | | | |
| 200 | | Tree.com Inc., (2) | | | | | | | | | 1,920 |
| | | | | |
| 600 | | Washington Federal Inc. | | | | | | | | | 7,800 |
| | Total Thrifts & Mortgage Finance | | | | | | | | | 1,958,404 |
| | Tobacco – 1.1% | | | | | | | | | |
| | | | | |
| 16,700 | | Altria Group, Inc. | | | | | | | | | 273,713 |
| | | | | |
| 1,500 | | Lorillard Inc. | | | | | | | | | 101,655 |
| | | | | |
| 58,360 | | Philip Morris International | | | | | | | | | 2,545,663 |
| | | | | |
| 4,300 | | Reynolds American Inc. | | | | | | | | | 166,066 |
| | Total Tobacco | | | | | | | | | 3,087,097 |
| | Trading Companies & Distributors – 0.0% | | | | | | | | | |
| | | | | |
| 1,300 | | GATX Corporation | | | | | | | | | 33,436 |
| | | | | |
| 300 | | WESCO International Inc., (2) | | | | | | | | | 7,512 |
| | Total Trading Companies & Distributors | | | | | | | | | 40,948 |
| | Water Utilities – 0.0% | | | | | | | | | |
| | | | | |
| 2,000 | | American Water Works Company | | | | | | | | | 38,220 |
| | | | | |
| 1,900 | | Aqua America Inc. | | | | | | | | | 34,010 |
| | Total Water Utilities | | | | | | | | | 72,230 |
| | Wireless Telecommunication Services – 0.8% | | | | | | | | | |
| | | | | |
| 400 | | Leap Wireless International, Inc., (2) | | | | | | | | | 13,172 |
| | | | | |
| 99,600 | | Sprint Nextel Corporation, (2) | | | | | | | | | 479,076 |
| | | | | |
| 1,200 | | Telephone and Data Systems Inc. | | | | | | | | | 33,960 |
| | | | | |
| 200 | | United States Cellular Corporation, (2) | | | | | | | | | 7,690 |
| | | | | |
| 86,600 | | Vodafone Group PLC, Sponsored ADR | | | | | | | | | 1,687,834 |
| | Total Wireless Telecommunication Services | | | | | | | | | 2,221,732 |
| | Total Common Stocks (cost $293,325,006) | | | | | | | | | 267,112,456 |
| | | | | |
| Shares | | Description (1) | | | | | | | | Value |
| | INVESTMENT COMPANIES – 1.4% | | | | | | | | | |
| | | | | |
| 80,000 | | i-Shares Russell 1000 Value Index Fund | | | | | | | | $ | 3,808,000 |
| | Total Investment Companies (cost $3,759,600) | | | | | | | | | 3,808,000 |
| | | | | | | | | | | | |
Principal
Amount (000) | | Description (1) | | Coupon | | | | Maturity | | Value |
| | | SHORT-TERM INVESTMENTS – 2.0% | | | | | | | | | |
| | | | | |
| $ | 5,429 | | Repurchase Agreement with Fixed Income Clearing Corporation, dated 6/30/09, repurchase price $5,429,273, collateralized by $5,520,000 U.S. Treasury Notes, 1.375%, due 2/15/12, value $5,540,700 | | 0.000% | | | | 7/01/09 | | $ | 5,429,273 |
| | | Total Short-Term Investments (cost $5,429,273) | | | | | | | | | 5,429,273 |
| | | Total Investments (cost $302,513,879) – 100.6% | | | | | | | | | 276,349,729 |
| | | Other Assets Less Liabilities – (0.6)% | | | | | | | | | (1,602,293) |
| | | Net Assets – 100% | | | | | | | | $ | 274,747,436 |
| | (1) | | All percentages shown in the Portfolio of Investments are based on net assets. |
| | (2) | | Non-income producing; issuer has not declared a dividend within the past twelve months. |
| | ADR | | American Depositary Receipt. |
See accompanying notes to financial statements.
Portfolio of Investments
Nuveen NWQ Multi-Cap Value Fund
June 30, 2009
| | | | | | | | | | | |
| Shares | | Description (1) | | | | | | | | Value |
| | | | | | | | | | | |
| | COMMON STOCKS – 97.7% | | | | | | | | | |
| | | | | |
| | Aerospace & Defense – 5.3% | | | | | | | | | |
| | | | | |
| 110,000 | | Lockheed Martin Corporation | | | | | | | | $ | 8,871,500 |
| | | | | |
| 280,000 | | Raytheon Company | | | | | | | | | 12,440,400 |
| | Total Aerospace & Defense | | | | | | | | | 21,311,900 |
| | Biotechnology – 3.5% | | | | | | | | | |
| | | | | |
| 267,200 | | Amgen Inc., (2) | | | | | | | | | 14,145,568 |
| | Chemicals – 1.1% | | | | | | | | | |
| | | | | |
| 58,700 | | CF Industries Holdings, Inc. | | | | | | | | | 4,352,018 |
| | Commercial Services & Supplies – 3.2% | | | | | | | | | |
| | | | | |
| 592,900 | | Pitney Bowes Inc. | | | | | | | | | 13,002,297 |
| | Communications Equipment – 4.6% | | | | | | | | | |
| | | | | |
| 2,750,000 | | Motorola, Inc. | | | | | | | | | 18,232,500 |
| | Containers & Packaging – 2.0% | | | | | | | | | |
| | | | | |
| 500,000 | | Packaging Corp. of America | | | | | | | | | 8,100,000 |
| | Diversified Financial Services – 3.5% | | | | | | | | | |
| | | | | |
| 405,000 | | JPMorgan Chase & Co. | | | | | | | | | 13,814,550 |
| | Electronic Equipment & Instruments – 1.3% | | | | | | | | | |
| | | | | |
| 246,600 | | Agilent Technologies, Inc., (2) | | | | | | | | | 5,008,446 |
| | Health Care Providers & Services – 1.1% | | | | | | | | | |
| | | | | |
| 180,800 | | Aetna Inc. | | | | | | | | | 4,529,040 |
| | Independent Power Producers & Energy Traders – 2.6% | | | | | | | | | |
| | | | | |
| 403,200 | | NRG Energy Inc., (2) | | | | | | | | | 10,467,072 |
| | Insurance – 15.1% | | | | | | | | | |
| | | | | |
| 275,000 | | Aon Corporation | | | | | | | | | 10,414,250 |
| | | | | |
| 1,413,700 | | Genworth Financial Inc., Class A | | | | | | | | | 9,881,763 |
| | | | | |
| 330,000 | | Hartford Financial Services Group, Inc. | | | | | | | | | 3,917,100 |
| | | | | |
| 439,400 | | Loews Corporation | | | | | | | | | 12,039,560 |
| | | | | |
| 500,000 | | Reinsurance Group of America Inc. | | | | | | | | | 17,455,000 |
| | | | | |
| 153,800 | | Transatlantic Holdings Inc. | | | | | | | | | 6,664,154 |
| | Total Insurance | | | | | | | | | 60,371,827 |
| | Machinery – 3.8% | | | | | | | | | |
| | | | | |
| 295,800 | | Ingersoll Rand Company Limited, Class A | | | | | | | | | 6,182,220 |
| | | | | |
| 530,000 | | Timken Company | | | | | | | | | 9,052,400 |
| | Total Machinery | | | | | | | | | 15,234,620 |
| | Media – 8.6% | | | | | | | | | |
| | | | | |
| 683,050 | | CBS Corporation, Class B | | | | | | | | | 4,726,706 |
| | | | | |
| 1,430,000 | | Interpublic Group Companies, Inc., (2) | | | | | | | | | 7,221,500 |
| | | | | |
| 993,497 | | Viacom Inc., Class B, (2) | | | | | | | | | 22,552,382 |
| | Total Media | | | | | | | | | 34,500,588 |
| | Metals & Mining – 8.8% | | | | | | | | | |
| | | | | |
| 405,729 | | AngloGold Ashanti Limited, Sponsored ADR | | | | | | | | | 14,861,853 |
| | | | | |
| 455,600 | | Barrick Gold Corporation | | | | | | | | | 15,285,380 |
| | | | | |
| 140,000 | | United States Steel Corporation | | | | | | | | | 5,003,600 |
| | Total Metals & Mining | | | | | | | | | 35,150,833 |
| | | | | | | | | | | | |
| Shares | | Description (1) | | | | | | | | Value |
| | | | | | | | | | | | |
| | | Mortgage REIT – 2.4% | | | | | | | | | |
| | | | | |
| | 641,400 | | Redwood Trust Inc. | | | | | | | | $ | 9,467,064 |
| | | Oil, Gas & Consumable Fuels – 13.5% | | | | | | | | | |
| | | | | |
| | 205,000 | | Apache Corporation | | | | | | | | | 14,790,750 |
| | | | | |
| | 88,200 | | EOG Resources, Inc. | | | | | | | | | 5,990,544 |
| | | | | |
| | 100,000 | | Hess Corporation | | | | | | | | | 5,375,000 |
| | | | | |
| | 310,000 | | Noble Energy, Inc. | | | | | | | | | 18,280,700 |
| | | | | |
| | 486,500 | | Talisman Energy Inc. | | | | | | | | | 6,952,085 |
| | | | | |
| | 988,800 | | Warren Resources Inc., (2) | | | | | | | | | 2,422,560 |
| | | Total Oil, Gas & Consumable Fuels | | | | | | | | | 53,811,639 |
| | | Pharmaceuticals – 6.2% | | | | | | | | | |
| | | | | |
| | 425,000 | | Sanofi-Aventis, ADR | | | | | | | | | 12,533,250 |
| | | | | |
| | 701,300 | | Sepracor Inc., (2) | | | | | | | | | 12,146,516 |
| | | Total Pharmaceuticals | | | | | | | | | 24,679,766 |
| | | Semiconductors & Equipment – 0.4% | | | | | | | | | |
| | | | | |
| | 1,201,953 | | Mattson Technology, Inc., (2) | | | | | | | | | 1,418,305 |
| | | Software – 6.6% | | | | | | | | | |
| | | | | |
| | 1,511,677 | | CA Inc. | | | | | | | | | 26,348,529 |
| | | Tobacco – 4.1% | | | | | | | | | |
| | | | | |
| | 84,632 | | Lorillard Inc. | | | | | | | | | 5,735,511 |
| | | | | |
| | 239,500 | | Philip Morris International | | | | | | | | | 10,446,990 |
| | | Total Tobacco | | | | | | | | | 16,182,501 |
| | | Total Common Stocks (cost $514,504,407) | | | | | | | | | 390,129,063 |
| | | | | |
Principal
Amount (000) | | Description (1) | | Coupon | | | | Maturity | | Value |
| | | SHORT-TERM INVESTMENTS – 1.6% | | | | | | | | | |
| | | | | |
| $ | 6,263 | | Repurchase Agreement with Fixed Income Clearing Corporation, dated 6/30/09, repurchase price $6,263,374, collateralized by $6,175,000 U.S. Treasury Notes, 2.750%, due 7/31/10, value $6,391,125 | | 0.000% | | | | 7/01/09 | | $ | 6,263,374 |
| | | Total Short-Term Investments (cost $6,263,374) | | | | | | | | | 6,263,374 |
| | | Total Investments (cost $520,767,781) – 99.3% | | | | | | | | | 396,392,437 |
| | | Other Assets Less Liabilities – 0.7% | | | | | | | | | 2,641,183 |
| | | Net Assets – 100% | | | | | | | | $ | 399,033,620 |
| | (1) | | All percentages shown in the Portfolio of Investments are based on net assets. |
| | (2) | | Non-income producing; issuer has not declared a dividend within the past twelve months. |
| | ADR | | American Depositary Receipt. |
See accompanying notes to financial statements.
Portfolio of Investments
Nuveen NWQ Large-Cap Value Fund
June 30, 2009
| | | | | | | | | | | |
| Shares | | Description (1) | | | | | | | | Value |
| | | | | | | | | | | |
| | COMMON STOCKS – 90.0% | | | | | | | | | |
| | | | | |
| | Aerospace & Defense – 4.5% | | | | | | | | | |
| | | | | |
| 11,000 | | Lockheed Martin Corporation | | | | | | | | $ | 887,150 |
| | | | | |
| 42,000 | | Raytheon Company | | | | | | | | | 1,866,060 |
| | Total Aerospace & Defense | | | | | | | | | 2,753,210 |
| | Biotechnology – 3.5% | | | | | | | | | |
| | | | | |
| 40,900 | | Amgen Inc., (2) | | | | | | | | | 2,165,246 |
| | Chemicals – 1.1% | | | | | | | | | |
| | | | | |
| 15,300 | | Mosaic Company | | | | | | | | | 677,790 |
| | Commercial Banks – 2.0% | | | | | | | | | |
| | | | | |
| 51,900 | | Wells Fargo & Company | | | | | | | | | 1,259,094 |
| | Commercial Services & Supplies – 3.6% | | | | | | | | | |
| | | | | |
| 100,000 | | Pitney Bowes Inc. | | | | | | | | | 2,193,000 |
| | Communications Equipment – 3.6% | | | | | | | | | |
| | | | | |
| 332,100 | | Motorola, Inc. | | | | | | | | | 2,201,823 |
| | Diversified Financial Services – 3.0% | | | | | | | | | |
| | | | | |
| 53,200 | | JPMorgan Chase & Co. | | | | | | | | | 1,814,652 |
| | Diversified Telecommunication Services – 1.4% | | | | | | | | | |
| | | | | |
| 35,000 | | AT&T Inc. | | | | | | | | | 869,400 |
| | Electronic Equipment & Instruments – 1.6% | | | | | | | | | |
| | | | | |
| 49,300 | | Agilent Technologies, Inc., (2) | | | | | | | | | 1,001,283 |
| | Energy Equipment & Services – 1.4% | | | | | | | | | |
| | | | | |
| 40,400 | | Halliburton Company | | | | | | | | | 836,280 |
| | Food Products – 1.1% | | | | | | | | | |
| | | | | |
| 25,476 | | Kraft Foods Inc. | | | | | | | | | 645,562 |
| | Health Care Providers & Services – 1.7% | | | | | | | | | |
| | | | | |
| 40,950 | | Aetna Inc. | | | | | | | | | 1,025,798 |
| | Household Products – 1.6% | | | | | | | | | |
| | | | | |
| 19,000 | | Kimberly-Clark Corporation | | | | | | | | | 996,170 |
| | Independent Power Producers & Energy Traders – 1.5% | | | | | | | | | |
| | | | | |
| 34,400 | | NRG Energy Inc., (2) | | | | | | | | | 893,024 |
| | Insurance – 13.5% | | | | | | | | | |
| | | | | |
| 40,000 | | Aon Corporation | | | | | | | | | 1,514,800 |
| | | | | |
| 146,800 | | Genworth Financial Inc., Class A | | | | | | | | | 1,026,132 |
| | | | | |
| 65,000 | | Hartford Financial Services Group, Inc. | | | | | | | | | 771,550 |
| | | | | |
| 72,741 | | Loews Corporation | | | | | | | | | 1,993,103 |
| | | | | |
| 51,700 | | MetLife, Inc. | | | | | | | | | 1,551,517 |
| | | | | |
| 35,000 | | Travelers Companies, Inc. | | | | | | | | | 1,436,400 |
| | Total Insurance | | | | | | | | | 8,293,502 |
| | Machinery – 1.2% | | | | | | | | | |
| | | | | |
| 35,000 | | Ingersoll Rand Company Limited, Class A | | | | | | | | | 731,500 |
| | Media – 6.0% | | | | | | | | | |
| | | | | |
| 45,000 | | CBS Corporation, Class B | | | | | | | | | 311,400 |
| | | | | |
| 65,000 | | Comcast Corporation, Special Class A | | | | | | | | | 916,500 |
| | | | | |
| 107,900 | | Viacom Inc., Class B, (2) | | | | | | | | | 2,449,330 |
| | Total Media | | | | | | | | | 3,677,230 |
| | | | | | | | | | | | |
| Shares | | Description (1) | | | | | | | | Value |
| | | | | | | | | | | | |
| | | Metals & Mining – 8.1% | | | | | | | | | |
| | | | | |
| | 61,901 | | AngloGold Ashanti Limited, Sponsored ADR | | | | | | | | $ | 2,267,434 |
| | | | | |
| | 64,800 | | Barrick Gold Corporation | | | | | | | | | 2,174,040 |
| | | | | |
| | 14,200 | | United States Steel Corporation | | | | | | | | | 507,508 |
| | | Total Metals & Mining | | | | | | | | | 4,948,982 |
| | | Oil, Gas & Consumable Fuels – 12.3% | | | | | | | | | |
| | | | | |
| | 33,600 | | Apache Corporation | | | | | | | | | 2,424,240 |
| | | | | |
| | 10,000 | | EOG Resources, Inc. | | | | | | | | | 679,200 |
| | | | | |
| | 19,200 | | Hess Corporation | | | | | | | | | 1,032,000 |
| | | | | |
| | 40,000 | | Noble Energy, Inc. | | | | | | | | | 2,358,800 |
| | | | | |
| | 72,600 | | Talisman Energy Inc. | | | | | | | | | 1,037,454 |
| | | Total Oil, Gas & Consumable Fuels | | | | | | | | | 7,531,694 |
| | | Pharmaceuticals – 4.2% | | | | | | | | | |
| | | | | |
| | 45,700 | | Merck & Co. Inc. | | | | | | | | | 1,277,772 |
| | | | | |
| | 45,000 | | Sanofi-Aventis, ADR | | | | | | | | | 1,327,050 |
| | | Total Pharmaceuticals | | | | | | | | | 2,604,822 |
| | | Road & Rail – 1.7% | | | | | | | | | |
| | | | | |
| | 20,000 | | Union Pacific Corporation | | | | | | | | | 1,041,200 |
| | | Software – 8.3% | | | | | | | | | |
| | | | | |
| | 225,400 | | CA Inc. | | | | | | | | | 3,928,722 |
| | | | | |
| | 50,000 | | Microsoft Corporation | | | | | | | | | 1,188,500 |
| | | Total Software | | | | | | | | | 5,117,222 |
| | | Tobacco – 3.1% | | | | | | | | | |
| | | | | |
| | 8,661 | | Lorillard Inc. | | | | | | | | | 586,955 |
| | | | | |
| | 30,000 | | Philip Morris International | | | | | | | | | 1,308,600 |
| | | Total Tobacco | | | | | | | | | 1,895,555 |
| | | Total Common Stocks (cost $60,424,143) | | | | | | | | | 55,174,039 |
| | | | | |
Principal
Amount (000) | | Description (1) | | Coupon | | Maturity | | | | Value |
| | | SHORT-TERM INVESTMENTS – 9.7% | | | | | | | | | |
| | | | | |
| $ | 5,945 | | Repurchase Agreement with State Street Bank, dated 6/30/09, repurchase price $5,944,996, collateralized by $6,070,000 U.S. Treasury Bills, 0.000%, due 8/20/09, value $6,068,786 | | 0.000% | | 7/01/09 | | | | $ | 5,944,996 |
| | | Total Short-Term Investments (cost $5,944,996) | | | | | | | | | 5,944,996 |
| | | Total Investments (cost $66,369,139) – 99.7% | | | | | | | | | 61,119,035 |
| | | Other Assets Less Liabilities – 0.3% | | | | | | | | | 196,106 |
| | | Net Assets – 100% | | | | | | | | $ | 61,315,141 |
| | (1) | | All percentages shown in the Portfolio of Investments are based on net assets. |
| | (2) | | Non-income producing; issuer has not declared a dividend within the past twelve months. |
| | ADR | | American Depositary Receipt. |
See accompanying notes to financial statements.
Portfolio of Investments
Nuveen NWQ Small/Mid-Cap Value Fund
June 30, 2009
| | | | | | | | | | | |
| Shares | | Description (1) | | | | | | | | Value |
| | | | | | | | | | | |
| | COMMON STOCKS – 97.0% | | | | | | | | | |
| | | | | |
| | Building Products – 5.5% | | | | | | | | | |
| | | | | |
| 13,100 | | Gibraltar Industries Inc. | | | | | | | | $ | 89,997 |
| | | | | |
| 27,750 | | Griffon Corporation, (2) | | | | | | | | | 230,880 |
| | Total Building Products | | | | | | | | | 320,877 |
| | Chemicals – 1.3% | | | | | | | | | |
| | | | | |
| 2,600 | | Interpid Potash Inc., (2) | | | | | | | | | 73,008 |
| | Communications Equipment – 6.2% | | | | | | | | | |
| | | | | |
| 14,350 | | Avocent Corporation, (2) | | | | | | | | | 200,326 |
| | | | | |
| 20,500 | | Brocade Communications Systems Inc., (2) | | | | | | | | | 160,310 |
| | Total Communications Equipment | | | | | | | | | 360,636 |
| | Containers & Packaging – 2.8% | | | | | | | | | |
| | | | | |
| 5,700 | | Packaging Corp. of America | | | | | | | | | 92,340 |
| | | | | |
| 5,550 | | Temple-Inland Inc. | | | | | | | | | 72,816 |
| | Total Containers & Packaging | | | | | | | | | 165,156 |
| | Electrical Equipment – 2.3% | | | | | | | | | |
| | | | | |
| 2,800 | | Belden Inc. | | | | | | | | | 46,760 |
| | | | | |
| 2,300 | | General Cable Corporation, (2) | | | | | | | | | 86,434 |
| | Total Electrical Equipment | | | | | | | | | 133,194 |
| | Electronic Equipment & Instruments – 9.1% | | | | | | | | | |
| | | | | |
| 8,800 | | Arrow Electronics, Inc., (2) | | | | | | | | | 186,912 |
| | | | | |
| 9,100 | | Avnet Inc., (2) | | | | | | | | | 191,373 |
| | | | | |
| 7,350 | | Coherent Inc., (2) | | | | | | | | | 151,998 |
| | Total Electronic Equipment & Instruments | | | | | | | | | 530,283 |
| | Energy Equipment & Services – 4.4% | | | | | | | | | |
| | | | | |
| 20,900 | | Acergy S.A., ADR | | | | | | | | | 205,656 |
| | | | | |
| 3,500 | | BJ Services Company | | | | | | | | | 47,705 |
| | Total Energy Equipment & Services | | | | | | | | | 253,361 |
| | Food & Staples Retailing – 2.7% | | | | | | | | | |
| | | | | |
| 6,000 | | Casey’s General Stores, Inc. | | | | | | | | | 154,140 |
| | Health Care Providers & Services – 1.5% | | | | | | | | | |
| | | | | |
| 3,450 | | Omnicare, Inc. | | | | | | | | | 88,872 |
| | Independent Power Producers & Energy Traders – 2.2% | | | | | | | | | |
| | | | | |
| 5,000 | | NRG Energy Inc., (2) | | | | | | | | | 129,800 |
| | Insurance – 19.1% | | | | | | | | | |
| | | | | |
| 1,450 | | Allied World Assurance Holdings | | | | | | | | | 59,204 |
| | | | | |
| 7,400 | | Assurant Inc. | | | | | | | | | 178,266 |
| | | | | |
| 5,550 | | Hanover Insurance Group Inc. | | | | | | | | | 211,511 |
| | | | | |
| 2,300 | | HCC Insurance Holdings Inc. | | | | | | | | | 55,223 |
| | | | | |
| 6,600 | | Reinsurance Group of America Inc. | | | | | | | | | 230,406 |
| | | | | |
| 5,300 | | StanCorp Financial Group Inc. | | | | | | | | | 152,004 |
| | | | | |
| 6,800 | | Tower Group Inc. | | | | | | | | | 168,504 |
| | | | | |
| 2,250 | | Willis Group Holdings Limited | | | | | | | | | 57,893 |
| | Total Insurance | | | | | | | | | 1,113,011 |
| | Machinery – 8.1% | | | | | | | | | |
| | | | | |
| 5,900 | | CIRCOR International Inc. | | | | | | | | | 139,299 |
| | | | | |
| 5,750 | | Gardner Denver, Inc., (2) | | | | | | | | | 144,728 |
| | | | | | | | | | | | |
| Shares | | Description (1) | | | | | | | | Value |
| | | | | | | | | | | | |
| | | Machinery (continued) | | | | | | | | | |
| | | | | |
| | 2,500 | | Lincoln Electric Holdings Inc. | | | | | | | | $ | 90,100 |
| | | | | |
| | 1,250 | | Middleby Corporation, (2) | | | | | | | | | 54,900 |
| | | | | |
| | 2,550 | | Timken Company | | | | | | | | | 43,554 |
| | | Total Machinery | | | | | | | | | 472,581 |
| | | Metals & Mining – 5.8% | | | | | | | | | |
| | | | | |
| | 2,800 | | Carpenter Technology Inc. | | | | | | | | | 58,268 |
| | | | | |
| | 3,650 | | Reliance Steel & Aluminum Company | | | | | | | | | 140,124 |
| | | | | |
| | 15,900 | | Yamana Gold Inc. | | | | | | | | | 140,556 |
| | | Total Metals & Mining | | | | | | | | | 338,948 |
| | | Oil, Gas & Consumable Fuels – 9.6% | | | | | | | | | |
| | | | | |
| | 4,500 | | Bill Barrett Corporation, (2) | | | | | | | | | 123,570 |
| | | | | |
| | 2,050 | | Continental Resources Inc., (2) | | | | | | | | | 56,888 |
| | | | | |
| | 10,200 | | Denbury Resources Inc., (2) | | | | | | | | | 150,246 |
| | | | | |
| | 15,600 | | Petroquest Energy Inc., (2) | | | | | | | | | 57,564 |
| | | | | |
| | 8,200 | | St Mary Land and Exploration Company | | | | | | | | | 171,134 |
| | | Total Oil, Gas & Consumable Fuels | | | | | | | | | 559,402 |
| | | Paper & Forest Products – 2.1% | | | | | | | | | |
| | | | | |
| | 18,400 | | Wausau Paper Corp. | | | | | | | | | 123,648 |
| | | Personal Products – 4.8% | | | | | | | | | |
| | | | | |
| | 32,200 | | Elizabeth Arden, Inc., (2) | | | | | | | | | 281,103 |
| | | Pharmaceuticals – 4.7% | | | | | | | | | |
| | | | | |
| | 3,350 | | Perrigo Company | | | | | | | | | 93,063 |
| | | | | |
| | 10,200 | | Sepracor Inc., (2) | | | | | | | | | 176,664 |
| | | Total Pharmaceuticals | | | | | | | | | 269,727 |
| | | Thrifts & Mortgage Finance – 2.8% | | | | | | | | | |
| | | | | |
| | 11,000 | | People’s United Financial, Inc. | | | | | | | | | 165,440 |
| | | Trading Companies & Distributors – 2.0% | | | | | | | | | |
| | | | | |
| | 4,550 | | WESCO International Inc., (2) | | | | | | | | | 113,932 |
| | | Total Common Stocks (cost $5,817,683) | | | | | | | | | 5,647,119 |
| | | | | |
Principal
Amount (000) | | Description (1) | | Coupon | | | | Maturity | | Value |
| | | SHORT-TERM INVESTMENTS – 2.0% | | | | | | | | | |
| | | | | |
| $ | 115 | | Repurchase Agreement with State Street Bank, dated 6/30/09, repurchase price $114,898, collateralized by $120,000 U.S. Treasury Bills, 0.000%, due 12/24/09, value $119,796 | | 0.000% | | | | 7/01/09 | | $ | 114,898 |
| | | Total Short-Term Investments (cost $114,898) | | | | | | | | | 114,898 |
| | | Total Investments (cost $5,932,581) – 99.0% | | | | | | | | | 5,762,017 |
| | | Other Assets Less Liabilities – 1.0% | | | | | | | | | 56,075 |
| | | Net Assets – 100% | | | | | | | | $ | 5,818,092 |
| | (1) | | All percentages shown in the Portfolio of Investments are based on net assets. |
| | (2) | | Non-income producing; issuer has not declared a dividend within the past twelve months. |
| | ADR | | American Depositary Receipt. |
See accompanying notes to financial statements.
Portfolio of Investments
Nuveen NWQ Small-Cap Value Fund
June 30, 2009
| | | | | | | | | | | |
| Shares | | Description (1) | | | | | | | | Value |
| | | | | | | | | | | |
| | COMMON STOCKS – 96.9% | | | | | | | | | |
| | | | | |
| | Auto Components – 0.6% | | | | | | | | | |
| | | | | |
| 23,050 | | WABCO Holdings Inc. | | | | | | | | $ | 407,985 |
| | Building Products – 4.9% | | | | | | | | | |
| | | | | |
| 163,730 | | Gibraltar Industries Inc. | | | | | | | | | 1,124,825 |
| | | | | |
| 304,050 | | Griffon Corporation, (2) | | | | | | | | | 2,529,696 |
| | Total Building Products | | | | | | | | | 3,654,521 |
| | Commercial Banks – 5.4% | | | | | | | | | |
| | | | | |
| 115,250 | | PacWest Bancorp. | | | | | | | | | 1,516,690 |
| | | | | |
| 107,550 | | Texas Capital BancShares, Inc., (2) | | | | | | | | | 1,663,799 |
| | | | | |
| 121,300 | | Western Alliance Bancorporation, (2) | | | | | | | | | 829,692 |
| | Total Commercial Banks | | | | | | | | | 4,010,181 |
| | Communications Equipment – 6.9% | | | | | | | | | |
| | | | | |
| 196,850 | | Avocent Corporation, (2) | | | | | | | | | 2,748,026 |
| | | | | |
| 304,550 | | Brocade Communications Systems Inc., (2) | | | | | | | | | 2,381,581 |
| | Total Communications Equipment | | | | | | | | | 5,129,607 |
| | Containers & Packaging – 2.8% | | | | | | | | | |
| | | | | |
| 69,900 | | Packaging Corp. of America | | | | | | | | | 1,132,380 |
| | | | | |
| 70,950 | | Temple-Inland Inc. | | | | | | | | | 930,864 |
| | Total Containers & Packaging | | | | | | | | | 2,063,244 |
| | Electrical Equipment – 4.2% | | | | | | | | | |
| | | | | |
| 97,400 | | Belden Inc. | | | | | | | | | 1,626,580 |
| | | | | |
| 39,550 | | General Cable Corporation, (2) | | | | | | | | | 1,486,289 |
| | Total Electrical Equipment | | | | | | | | | 3,112,869 |
| | Electronic Equipment & Instruments – 1.3% | | | | | | | | | |
| | | | | |
| 234,800 | | Keithley Instruments, Inc. | | | | | | | | | 939,200 |
| | Energy Equipment & Services – 3.6% | | | | | | | | | |
| | | | | |
| 268,300 | | Acergy S.A., ADR | | | | | | | | | 2,640,072 |
| | Food & Staples Retailing – 2.7% | | | | | | | | | |
| | | | | |
| 77,300 | | Casey’s General Stores, Inc. | | | | | | | | | 1,985,837 |
| | Health Care Providers & Services – 0.8% | | | | | | | | | |
| | | | | |
| 78,800 | | Skilled Healthcare Group Inc., (2) | | | | | | | | | 591,000 |
| | Hotels, Restaurants & Leisure – 2.0% | | | | | | | | | |
| | | | | |
| 51,000 | | Bob Evans Farms | | | | | | | | | 1,465,740 |
| | Household Durables – 2.4% | | | | | | | | | |
| | | | | |
| 153,500 | | Hooker Furniture Corporation | | | | | | | | | 1,762,180 |
| | Insurance – 18.0% | | | | | | | | | |
| | | | | |
| 109,250 | | Aspen Insurance Holdings Limited | | | | | | | | | 2,440,645 |
| | | | | |
| 97,600 | | Assurant Inc. | | | | | | | | | 2,351,184 |
| | | | | |
| 45,850 | | Hanover Insurance Group Inc. | | | | | | | | | 1,747,344 |
| | | | | |
| 193,850 | | PMA Capital Corporation, Class A, (2) | | | | | | | | | 882,018 |
| | | | | |
| 42,400 | | Reinsurance Group of America Inc. | | | | | | | | | 1,480,184 |
| | | | | |
| 76,200 | | StanCorp Financial Group Inc. | | | | | | | | | 2,185,416 |
| | | | | |
| 89,650 | | Tower Group Inc. | | | | | | | | | 2,221,527 |
| | Total Insurance | | | | | | | | | 13,308,318 |
| | | | | | | | | | | | |
| Shares | | Description (1) | | | | | | | | Value |
| | | | | | | | | | | | |
| | | Machinery – 10.2% | | | | | | | | | |
| | | | | |
| | 142,400 | | Albany International Corporation, Class A | | | | | | | | $ | 1,620,512 |
| | | | | |
| | 79,650 | | CIRCOR International Inc. | | | | | | | | | 1,880,537 |
| | | | | |
| | 28,609 | | Kadant Inc., (2) | | | | | | | | | 322,996 |
| | | | | |
| | 28,700 | | Lincoln Electric Holdings Inc. | | | | | | | | | 1,034,348 |
| | | | | |
| | 16,100 | | Middleby Corporation, (2) | | | | | | | | | 707,112 |
| | | | | |
| | 94,750 | | RBC Bearings Inc., (2) | | | | | | | | | 1,937,638 |
| | | Total Machinery | | | | | | | | | 7,503,143 |
| | | Metals & Mining – 1.9% | | | | | | | | | |
| | | | | |
| | 134,200 | | Thompson Creek Metals Company Inc., (2) | | | | | | | | | 1,371,524 |
| | | Oil, Gas & Consumable Fuels – 10.4% | | | | | | | | | |
| | | | | |
| | 300,450 | | Approach Resources Inc., (2) | | | | | | | | | 2,073,105 |
| | | | | |
| | 81,850 | | Bill Barrett Corporation, (2) | | | | | | | | | 2,247,601 |
| | | | | |
| | 237,500 | | Petroquest Energy Inc., (2) | | | | | | | | | 876,375 |
| | | | | |
| | 120,500 | | St Mary Land and Exploration Company | | | | | | | | | 2,514,835 |
| | | Total Oil, Gas & Consumable Fuels | | | | | | | | | 7,711,916 |
| | | Paper & Forest Products – 3.4% | | | | | | | | | |
| | | | | |
| | 162,403 | | Buckeye Technologies Inc., (2) | | | | | | | | | 729,189 |
| | | | | |
| | 260,704 | | Wausau Paper Corp. | | | | | | | | | 1,751,931 |
| | | Total Paper & Forest Products | | | | | | | | | 2,481,120 |
| | | Personal Products – 2.9% | | | | | | | | | |
| | | | | |
| | 248,300 | | Elizabeth Arden, Inc., (2) | | | | | | | | | 2,167,659 |
| | | Pharmaceuticals – 3.0% | | | | | | | | | |
| | | | | |
| | 129,300 | | Sepracor Inc., (2) | | | | | | | | | 2,239,476 |
| | | Road & Rail – 1.9% | | | | | | | | | |
| | | | | |
| | 65,855 | | Marten Transport, Ltd., (2) | | | | | | | | | 1,367,150 |
| | | Semiconductors & Equipment – 6.9% | | | | | | | | | |
| | | | | |
| | 210,000 | | Actel Corporation, (2) | | | | | | | | | 2,253,300 |
| | | | | |
| | 138,700 | | Standard Microsystems Corporation, (2) | | | | | | | | | 2,836,412 |
| | | Total Semiconductors & Equipment | | | | | | | | | 5,089,712 |
| | | Specialty Retail – 0.7% | | | | | | | | | |
| | | | | |
| | 325,591 | | Golfsmith International Holdings Inc., (2) | | | | | | | | | 488,387 |
| | | Total Common Stocks (cost $89,869,073) | | | | | | | | | 71,490,841 |
| | | | | |
Principal
Amount (000) | | Description (1) | | | | Coupon | | Maturity | | Value |
| | | SHORT-TERM INVESTMENTS – 3.6% | | | | | | | | | |
| | | | | |
| $ | 2,640 | | Repurchase Agreement with Fixed Income Clearing Corporation, dated 6/30/09, repurchase price $2,640,321, collateralized by $2,605,000 U.S. Treasury Notes, 2.750%, due 7/31/10, value $2,696,175 | | | | 0.000% | | 7/01/09 | | $ | 2,640,321 |
| | | Total Short-Term Investments (cost $2,640,321) | | | | | | | | | 2,640,321 |
| | | Total Investments (cost $92,509,394) – 100.5% | | | | | | | | | 74,131,162 |
| | | Other Assets Less Liabilities – (0.5)% | | | | | | | | | (355,471) |
| | | Net Assets – 100% | | | | | | | | $ | 73,775,691 |
| | (1) | | All percentages shown in the Portfolio of Investments are based on net assets. |
| | (2) | | Non-income producing; issuer has not declared a dividend within the past twelve months. |
| | ADR | | American Depositary Receipt. |
See accompanying notes to financial statements.
Portfolio of Investments
Nuveen Tradewinds Value Opportunities Fund
June 30, 2009
| | | | | | | | | | | |
| Shares | | Description (1) | | | | | | | | Value |
| | | | | | | | | | | |
| | COMMON STOCKS – 74.0% | | | | | | | | | |
| | | | | |
| | Auto Components – 2.2% | | | | | | | | | |
| | | | | |
| 544,572 | | Magna International Inc., Class A | | | | | | | | $ | 23,002,721 |
| | Biotechnology – 0.7% | | | | | | | | | |
| | | | | |
| 138,866 | | Amgen Inc., (2) | | | | | | | | | 7,351,566 |
| | Capital Markets – 0.8% | | | | | | | | | |
| | | | | |
| 711,806 | | UBS AG, (2) | | | | | | | | | 8,691,151 |
| | Chemicals – 0.4% | | | | | | | | | |
| | | | | |
| 86,911 | | The Mosaic Company | | | | | | | | | 3,850,157 |
| | Commercial Banks – 1.6% | | | | | | | | | |
| | | | | |
| 226,228 | | ICICI Bank Limited, ADR | | | | | | | | | 6,673,726 |
| | | | | |
| 1,873,200 | | Sumitomo Trust & Banking Company, ADR | | | | | | | | | 9,965,424 |
| | Total Commercial Banks | | | | | | | | | 16,639,150 |
| | Commercial Services & Supplies – 1.1% | | | | | | | | | |
| | | | | |
| 471,572 | | Republic Services, Inc. | | | | | | | | | 11,511,073 |
| | Construction & Engineering – 1.0% | | | | | | | | | |
| | | | | |
| 382,534 | | Shaw Group Inc., (2) | | | | | | | | | 10,485,257 |
| | Diversified Telecommunication Services – 2.6% | | | | | | | | | |
| | | | | |
| 311,600 | | KT Corporation, Sponsored ADR | | | | | | | | | 4,474,576 |
| | | | | |
| 911,500 | | Telus Corporation | | | | | | | | | 23,516,700 |
| | Total Diversified Telecommunication Services | | | | | | | | | 27,991,276 |
| | Electric Utilities – 2.5% | | | | | | | | | |
| | | | | |
| 850,243 | | Centrais Electricas Brasileiras S.A., ADR Pref., (2) | | | | | | | | | 11,104,174 |
| | | | | |
| 1,378,004 | | Korea Electric Power Corporation, Sponsored ADR, (2) | | | | | | | | | 15,847,046 |
| | Total Electric Utilities | | | | | | | | | 26,951,220 |
| | Electronic Equipment & Instruments – 2.6% | | | | | | | | | |
| | | | | |
| 867,700 | | Ingram Micro, Inc., (2) | | | | | | | | | 15,184,750 |
| | | | | |
| 366,500 | | Tech Data Corporation, (2) | | | | | | | | | 11,988,215 |
| | Total Electronic Equipment & Instruments | | | | | | | | | 27,172,965 |
| | Energy Equipment & Services – 1.3% | | | | | | | | | |
| | | | | |
| 1,018,154 | | BJ Services Company | | | | | | | | | 13,877,439 |
| | Food & Staples Retailing – 1.8% | | | | | | | | | |
| | | | | |
| 1,030,388 | | Whole Foods Market, Inc. | | | | | | | | | 19,556,764 |
| | Food Products – 5.4% | | | | | | | | | |
| | | | | |
| 770,000 | | Cresud S.A., ADR | | | | | | | | | 7,261,100 |
| | | | | |
| 1,427,327 | | Smithfield Foods, Inc., (2) | | | | | | | | | 19,939,758 |
| | | | | |
| 2,378,700 | | Tyson Foods, Inc., Class A | | | | | | | | | 29,995,407 |
| | Total Food Products | | | | | | | | | 57,196,265 |
| | Health Care Equipment & Supplies – 0.9% | | | | | | | | | |
| | | | | |
| 237,733 | | Zimmer Holdings, Inc., (2) | | | | | | | | | 10,127,426 |
| | Health Care Providers & Services – 3.2% | | | | | | | | | |
| | | | | |
| 1,398,818 | | Health Net Inc., (2) | | | | | | | | | 21,751,620 |
| | | | | |
| 379,795 | | Humana Inc., (2) | | | | | | | | | 12,252,187 |
| | Total Health Care Providers & Services | | | | | | | �� | | 34,003,807 |
| | Household Durables – 0.5% | | | | | | | | | |
| | | | | |
| 481,600 | | Sekisui House, Ltd., Sponsored ADR | | | | | | | | | 4,844,896 |
| | | | | | | | | | | |
| Shares | | Description (1) | | | | | | | | Value |
| | | | | | | | | | | |
| | Household Products – 0.7% | | | | | | | | | |
| | | | | |
| 33,800 | | KAO Corporation, Sponsored ADR | | | | | | | | $ | 7,374,099 |
| | Insurance – 0.7% | | | | | | | | | |
| | | | | |
| 481,135 | | CNA Financial Corporation | | | | | | | | | 7,443,158 |
| | Internet Software & Services – 1.9% | | | | | | | | | |
| | | | | |
| 1,189,307 | | eBay Inc., (2) | | | | | | | | | 20,372,829 |
| | Machinery – 2.5% | | | | | | | | | |
| | | | | |
| 513,914 | | AGCO Corporation, (2) | | | | | | | | | 14,939,480 |
| | | | | |
| 338,138 | | Alamo Group Inc. | | | | | | | | | 3,415,194 |
| | | | | |
| 968,882 | | Tata Motors Limited, ADR | | | | | | | | | 8,254,875 |
| | Total Machinery | | | | | | | | | 26,609,549 |
| | Media – 2.0% | | | | | | | | | |
| | | | | |
| 459,000 | | Scholastic Corporation | | | | | | | | | 9,083,610 |
| | | | | |
| 543,000 | | Viacom Inc., Class B, (2) | | | | | | | | | 12,326,100 |
| | Total Media | | | | | | | | | 21,409,710 |
| | Metals & Mining – 19.0% | | | | | | | | | |
| | | | | |
| 1,638,720 | | Alumina Limited, Sponsored ADR | | | | | | | | | 7,538,112 |
| | | | | |
| 976,225 | | Barrick Gold Corporation | | | | | | | | | 32,752,349 |
| | | | | |
| 659,000 | | Crystallex International Corporation, (2) | | | | | | | | | 144,980 |
| | | | | |
| 1,497,753 | | Geovic Mining Corporation, (2) | | | | | | | | | 765,352 |
| | | | | |
| 1,474,000 | | Geovic Mining Corporation, (2) | | | | | | | | | 760,349 |
| | | | | |
| 1,703,316 | | Gold Fields Limited Sponsored ADR | | | | | | | | | 20,524,958 |
| | | | | |
| 96,481 | | Gold Reserve Inc., Class A, (2) | | | | | | | | | 50,170 |
| | | | | |
| 967,524 | | IAMGOLD Corporation | | | | | | | | | 9,791,343 |
| | | | | |
| 942,046 | | Ivanhoe Mines Ltd., (2) | | | | | | | | | 5,275,458 |
| | | | | |
| 1,959,914 | | Kinross Gold Corporation | | | | | | | | | 35,572,439 |
| | | | | |
| 1,708,914 | | Lihir Gold Limited, Sponsored ADR, (2) | | | | | | | | | 39,680,983 |
| | | | | |
| 924,700 | | Newmont Mining Corporation | | | | | | | | | 37,792,489 |
| | | | | |
| 1,692,056 | | NovaGold Resources Inc., (2) | | | | | | | | | 7,242,000 |
| | | | | |
| 232,530 | | Silver Standard Resources, Inc., (2) | | | | | | | | | 4,359,938 |
| | Total Metals & Mining | | | | | | | | | 202,250,920 |
| | Multi-Utilities – 1.8% | | | | | | | | | |
| | | | | |
| 450,410 | | Ameren Corporation | | | | | | | | | 11,210,705 |
| | | | | |
| 758,600 | | PNM Resources Inc. | | | | | | | | | 8,124,606 |
| | Total Multi-Utilities | | | | | | | | | 19,335,311 |
| | Oil, Gas & Consumable Fuels – 10.1% | | | | | | | | | |
| | | | | |
| 1,628,784 | | Arch Coal Inc. | | | | | | | | | 25,034,410 |
| | | | | |
| 764,052 | | Cameco Corporation | | | | | | | | | 19,559,731 |
| | | | | |
| 157,757 | | Chevron Corporation | | | | | | | | | 10,451,401 |
| | | | | |
| 336,954 | | ConocoPhillips | | | | | | | | | 14,172,285 |
| | | | | |
| 174,500 | | CONSOL Energy Inc. | | | | | | | | | 5,926,020 |
| | | | | |
| 347,109 | | Peabody Energy Corporation | | | | | | | | | 10,468,807 |
| | | | | |
| 233,598 | | Petrobras Energia Participaciones S.A., ADR | | | | | | | | | 1,387,572 |
| | | | | |
| 391,837 | | Pioneer Natural Resources Company | | | | | | | | | 9,991,844 |
| | | | | |
| 674,983 | | Tesoro Petroleum Corporation | | | | | | | | | 8,592,534 |
| | | | | |
| 720,000 | | Warren Resources Inc., (2) | | | | | | | | | 1,764,000 |
| | Total Oil, Gas & Consumable Fuels | | | | | | | | | 107,348,604 |
Portfolio of Investments
Nuveen Tradewinds Value Opportunities Fund (continued)
June 30, 2009
| | | | | | | | | | | | |
| Shares | | Description (1) | | | | | | | | Value |
| | | | | | | | | | | | |
| | | Paper & Forest Products – 0.8% | | | | | | | | | |
| | | | | |
| | 509,264 | | Domtar Corporation, (2) | | | | | | | | $ | 8,443,597 |
| | | Pharmaceuticals – 2.0% | | | | | | | | | |
| | | | | |
| | 1,425,898 | | Pfizer Inc. | | | | | | | | | 21,388,470 |
| | | Road & Rail – 0.9% | | | | | | | | | |
| | | | | |
| | 188,900 | | Union Pacific Corporation | | | | | | | | | 9,834,134 |
| | | Software – 2.1% | | | | | | | | | |
| | | | | |
| | 926,500 | | Microsoft Corporation | | | | | | | | | 22,022,905 |
| | | Wireless Telecommunication Services – 0.9% | | | | | | | | | |
| | | | | |
| | 261,200 | | TIM Participacoes S.A., ADR, (2) | | | | | | | | | 4,552,716 |
| | | | | |
| | 361,300 | | Turkcell Iletisim Hizmetleri A.S., ADR | | | | | | | | | 5,007,616 |
| | | Total Wireless Telecommunication Services | | | | | | | | | 9,560,332 |
| | | Total Common Stocks (cost $811,795,841) | | | | | | | | | 786,646,751 |
| | | | | |
| Shares | | Description (1) | | Coupon | | | | Ratings (3) | | Value |
| | | CONVERTIBLE PREFERRED SECURITIES – 4.1% | | | | | | | | | |
| | | | | |
| | | Communications Equipment – 3.3% | | | | | | | | | |
| | | | | |
| | 57,771 | | Lucent Technologies Capital Trust I | | 7.750% | | | | B3 | | $ | 35,240,310 |
| | | Road & Rail – 0.8% | | | | | | | | | |
| | | | | |
| | 12,362 | | Kansas City Southern Industries Inc., (2) | | 5.125% | | | | CCC | | | 9,086,070 |
| | | Total Convertible Preferred Securities (cost $49,574,682) | | | | | | | | | 44,326,380 |
| | | | | |
Principal
Amount (000) | | Description (1) | | Coupon | | Maturity | | Ratings (3) | | Value |
| | | CONVERTIBLE BONDS – 8.3% | | | | | | | | | |
| | | | | |
| | | Airlines – 1.2% | | | | | | | | | |
| | | | | |
| $ | 10,338 | | JetBlue Airways Corporation | | 3.750% | | 3/15/35 | | CCC | | $ | 9,950,325 |
| | | | | |
| | 2,900 | | JetBlue Airways Corporation | | 6.750% | | 10/15/39 | | CCC | | | 3,070,375 |
| | 13,238 | | Total Airlines | | | | | | | | | 13,020,700 |
| | | Building Products – 0.6% | | | | | | | | | |
| | | | | |
| | 6,661 | | Griffon Corporation | | 4.000% | | 7/18/23 | | N/A | | | 6,344,603 |
| | | Health Care Providers & Services – 1.5% | | | | | | | | | |
| | | | | |
| | 22,949 | | Omnicare, Inc. | | 3.250% | | 12/15/35 | | B+ | | | 16,006,928 |
| | | Machinery – 0.8% | | | | | | | | | |
| | | | | |
| | 16,434 | | Trinity Industries Inc. | | 3.875% | | 6/01/36 | | Ba2 | | | 9,038,700 |
| | | Metals & Mining – 1.5% | | | | | | | | | |
| | | | | |
| | 16,320 | | Coeur d’Alene Mines Corporation | | 1.250% | | 1/15/24 | | CCC– | | | 14,320,800 |
| | | | | |
| | 3,018 | | Gold Reserve, Inc. | | 5.500% | | 6/15/22 | | N/A | | | 1,539,180 |
| | 19,338 | | Total Metals & Mining | | | | | | | | | 15,859,980 |
| | | Oil, Gas & Consumable Fuels – 0.9% | | | | | | | | | |
| | | | | |
| | 15,035 | | USEC Inc. | | 3.000% | | 10/01/14 | | CCC | | | 9,772,750 |
| | | Semiconductors & Equipment – 0.2% | | | | | | | | | |
| | | | | |
| | 4,842 | | LTX-Credence Corporation, (4) | | 3.500% | | 5/15/11 | | N/A | | | 1,612,885 |
| | | | | |
| | 3,600 | | Qimonda Finance LLC, (5) | | 6.750% | | 3/22/13 | | N/A | | | 108,000 |
| | 8,442 | | Total Semiconductors & Equipment | | | | | | | | | 1,720,885 |
| | | Wireless Telecommunication Services – 1.6% | | | | | | | | | |
| | | | | |
| | 21,498 | | NII Holdings Inc. | | 3.125% | | 6/15/12 | | N/A | | | 16,634,076 |
| $ | 123,595 | | Total Convertible Bonds (cost $88,942,408) | | | | | | | | | 88,398,622 |
| | | | | | | | | | | | |
Principal
Amount (000) | | Description (1) | | | | Coupon | | Maturity | | Value |
| | | | | | | | | | | | |
| | | SHORT-TERM INVESTMENTS – 12.5% | | | | | | | | | |
| | | | | |
| $ | 132,512 | | Repurchase Agreement with Fixed Income Clearing Corporation, dated 6/30/09, repurchase price $132,512,182, collateralized by $124,245,000 U.S. Treasury Notes, 4.125%, due 8/31/12, value $135,166,136 | | | | 0.000% | | 7/01/09 | | $ | 132,512,182 |
| | | Total Short-Term Investments (cost $132,512,182) | | | | | | | | | 132,512,182 |
| | | Total Investments (cost $1,082,825,113) – 98.9% | | | | | | | | | 1,051,883,935 |
| | | Other Assets Less Liabilities – 1.1% | | | | | | | | | 11,346,788 |
| | | Net Assets – 100% | | | | | | | | $ | 1,063,230,723 |
| | (1) | | All percentages shown in the Portfolio of Investments are based on net assets. |
| | (2) | | Non-income producing; issuer has not declared a dividend within the past twelve months. |
| | (3) | | Ratings (not covered by the report of independent registered public accounting firm): Using the higher of Standard & Poor’s Group (“Standard & Poor’s”) or Moody’s Investor Service, Inc. (“Moody’s”) rating. Ratings below BBB by Standard & Poor’s or Baa by Moody’s are considered to be below investment grade. |
| | (4) | | Investment valued at fair value using methods determined in good faith by, or at the discretion of, the Board of Trustees. |
| | (5) | | The Fund’s Adviser has concluded this issue is not likely to meet its future interest payment obligations and has directed the Fund’s custodian to cease accruing additional income on the Fund’s records. Subsequent to the reporting period, the Fund’s Adviser directed the Fund’s custodian to “write-off” any remaining recorded balances on the Fund’s records. |
| | N/A | | Not applicable/not available. |
| | ADR | | American Depositary Receipt. |
See accompanying notes to financial statements.
Statement of Assets and Liabilities
June 30, 2009
| | | | | | | | | | | | | | | | | | | | | | | | |
| | | Multi-Manager
Large-Cap Value | | | Multi-Cap
Value | | | Large-Cap
Value | | | Small/Mid- Cap Value | | | Small-Cap
Value | | | Value
Opportunities | |
Assets | | | | | | | | | | | | | | | | | | | | | | | | |
Investments, at value (cost $297,084,606, $514,504,407, $60,424,143, $5,817,683, $89,869,073 and $950,312,931, respectively) | | $ | 270,920,456 | | | $ | 390,129,063 | | | $ | 55,174,039 | | | $ | 5,647,119 | | | $ | 71,490,841 | | | $ | 919,371,753 | |
Short-term investments (at cost, which approximates value) | | | 5,429,273 | | | | 6,263,374 | | | | 5,944,996 | | | | 114,898 | | | | 2,640,321 | | | | 132,512,182 | |
Cash | | | 133,790 | | | | — | | | | — | | | | — | | | | — | | | | — | |
Receivables: | | | | | | | | | | | | | | | | | | | | | | | | |
Dividends | | | 439,791 | | | | 455,329 | | | | 62,795 | | | | 2,660 | | | | 40,192 | | | | 736,308 | |
Interest | | | — | | | | — | | | | — | | | | — | | | | — | | | | 770,135 | |
Investments sold | | | 1,126,698 | | | | 2,607,943 | | | | — | | | | 225,241 | | | | 622,095 | | | | — | |
Reclaims | | | 46,837 | | | | 60,968 | | | | 5,308 | | | | — | | | | — | | | | — | |
Shares sold | | | 156,479 | | | | 1,143,741 | | | | 1,183,141 | | | | 40,024 | | | | 168,858 | | | | 13,428,072 | |
Other assets | | | 95,410 | | | | 28,005 | | | | 22 | | | | 121 | | | | 202 | | | | 12,499 | |
Total assets | | | 278,348,734 | | | | 400,688,423 | | | | 62,370,301 | | | | 6,030,063 | | | | 74,962,509 | | | | 1,066,830,949 | |
Liabilities | | | | | | | | | | | | | | | | | | | | | | | | |
Payables: | | | | | | | | | | | | | | | | | | | | | | | | |
Investments purchased | | | 2,818,132 | | | | — | | | | 790,649 | | | | 151,795 | | | | 564,014 | | | | 388,650 | |
Shares redeemed | | | 301,223 | | | | 710,071 | | | | 172,982 | | | | 17,076 | | | | 452,459 | | | | 1,576,565 | |
Accrued expenses: | | | | | | | | | | | | | | | | | | | | | | | | |
Management fees | | | 163,076 | | | | 277,320 | | | | 27,389 | | | | 2,734 | | | | 89,548 | | | | 966,004 | |
12b-1 distribution and service fees | | | 65,645 | | | | 96,418 | | | | 3,380 | | | | 837 | | | | 4,812 | | | | 161,781 | |
Other | | | 253,222 | | | | 570,994 | | | | 60,760 | | | | 39,529 | | | | 75,985 | | | | 507,226 | |
Total liabilities | | | 3,601,298 | | | | 1,654,803 | | | | 1,055,160 | | | | 211,971 | | | | 1,186,818 | | | | 3,600,226 | |
Net assets | | $ | 274,747,436 | | | $ | 399,033,620 | | | $ | 61,315,141 | | | $ | 5,818,092 | | | $ | 73,775,691 | | | $ | 1,063,230,723 | |
Class A Shares | | | | | | | | | | | | | | | | | | | | | | | | |
Net assets | | $ | 239,209,531 | | | $ | 76,785,015 | | | $ | 6,074,962 | | | $ | 1,382,286 | | | $ | 7,733,404 | | | $ | 378,845,345 | |
Shares outstanding | | | 16,812,096 | | | | 6,284,198 | | | | 477,780 | | | | 125,143 | | | | 547,046 | | | | 15,675,750 | |
Net asset value per share | | $ | 14.23 | | | $ | 12.22 | | | $ | 12.71 | | | $ | 11.05 | | | $ | 14.14 | | | $ | 24.17 | |
Offering price per share (net asset value per share plus maximum sales charge of 5.75% of offering price) | | $ | 15.10 | | | $ | 12.97 | | | $ | 13.49 | | | $ | 11.72 | | | $ | 15.00 | | | $ | 25.64 | |
Class B Shares | | | | | | | | | | | | | | | | | | | | | | | | |
Net assets | | $ | 3,033,231 | | | $ | 16,599,163 | | | $ | 405,383 | | | $ | 33,879 | | | $ | 173,157 | | | $ | 5,080,085 | |
Shares outstanding | | | 219,225 | | | | 1,402,015 | | | | 32,181 | | | | 3,131 | | | | 12,603 | | | | 213,661 | |
Net asset value and offering price per share | | $ | 13.84 | | | $ | 11.84 | | | $ | 12.60 | | | $ | 10.82 | | | $ | 13.74 | | | $ | 23.78 | |
Class C Shares | | | | | | | | | | | | | | | | | | | | | | | | |
Net assets | | $ | 15,803,263 | | | $ | 78,225,355 | | | $ | 2,216,754 | | | $ | 610,304 | | | $ | 3,446,288 | | | $ | 98,742,391 | |
Shares outstanding | | | 1,144,773 | | | | 6,607,231 | | | | 175,951 | | | | 56,350 | | | | 250,435 | | | | 4,153,225 | |
Net asset value and offering price per share | | $ | 13.80 | | | $ | 11.84 | | | $ | 12.60 | | | $ | 10.83 | | | $ | 13.76 | | | $ | 23.77 | |
Class R3 Shares | | | | | | | | | | | | | | | | | | | | | | | | |
Net assets | | $ | 97,354 | | | $ | 103,648 | | | | N/A | | | | N/A | | | | N/A | | | $ | 414,264 | |
Shares outstanding | | | 6,803 | | | | 8,523 | | | | N/A | | | | N/A | | | | N/A | | | | 17,099 | |
Net asset value and offering price per share | | $ | 14.31 | | | $ | 12.16 | | | | N/A | | | | N/A | | | | N/A | | | $ | 24.23 | |
Class I Shares | | | | | | | | | | | | | | | | | | | | | | | | |
Net assets | | $ | 16,604,057 | | | $ | 227,320,439 | | | $ | 52,618,042 | | | $ | 3,791,623 | | | $ | 62,422,842 | | | $ | 580,148,638 | |
Shares outstanding | | | 1,162,422 | | | | 18,606,803 | | | | 4,137,576 | | | | 346,030 | | | | 4,393,753 | | | | 23,980,115 | |
Net asset value and offering price per share | | $ | 14.28 | | | $ | 12.22 | | | $ | 12.72 | | | $ | 10.96 | | | $ | 14.21 | | | $ | 24.19 | |
Net Assets Consist of: | | | | | | | | | | | | | | | | | | | | | | | | |
Capital paid-in | | $ | 398,127,353 | | | $ | 788,536,067 | | | $ | 70,877,713 | | | $ | 41,829,332 | | | $ | 165,662,732 | | | $ | 1,186,478,237 | |
Undistributed (Over-distribution of) net investment income | | | 5,609,527 | | | | 1,013,587 | | | | 164,141 | | | | — | | | | 197,909 | | | | (728,391 | ) |
Accumulated net realized gain (loss) from investments and foreign currency | | | (102,824,430 | ) | | | (266,138,284 | ) | | | (4,476,448 | ) | | | (35,840,676 | ) | | | (73,706,718 | ) | | | (91,566,271 | ) |
Net unrealized appreciation (depreciation) of investments and foreign currency | | | (26,165,014 | ) | | | (124,377,750 | ) | | | (5,250,265 | ) | | | (170,564 | ) | | | (18,378,232 | ) | | | (30,952,852 | ) |
Net assets | | $ | 274,747,436 | | | $ | 399,033,620 | | | $ | 61,315,141 | | | $ | 5,818,092 | | | $ | 73,775,691 | | | $ | 1,063,230,723 | |
N/A Large-Cap Value, Small/Mid-Cap Value and Small-Cap Value are not authorized to issue Class R3 Shares.
See accompanying notes to financial statements.
Statement of Operations
Year Ended June 30, 2009
| | | | | | | | | | | | |
| | | Multi-Manager
Large-Cap Value | | | Multi-Cap Value | | | Large-Cap Value | |
Investment Income | | | | | | | | | | | | |
Dividends (net of foreign tax withheld of $8,942, $61,167 and $6,628, respectively) | | $ | 9,256,133 | | | $ | 8,417,194 | | | $ | 593,228 | |
Interest (net of foreign tax withheld of $0, $0 and $0, respectively) | | | 35,427 | | | | 32,818 | | | | 12,403 | |
Total investment income | | | 9,291,560 | | | | 8,450,012 | | | | 605,631 | |
Expenses | | | | | | | | | | | | |
Management fees | | | 2,296,853 | | | | 3,855,667 | | | | 246,635 | |
12b-1 service fees – Class A | | | 680,628 | | | | 321,014 | | | | 10,619 | |
12b-1 distribution and service fees – Class B | | | 51,805 | | | | 207,029 | | | | 5,690 | |
12b-1 distribution and service fees – Class C | | | 176,173 | | | | 1,036,118 | | | | 21,563 | |
12b-1 distribution and service fees – Class R3 | | | 477 | | | | 463 | | | | — | |
Shareholders’ servicing agent fees and expenses | | | 522,690 | | | | 1,364,012 | | | | 33,004 | |
Custodian’s fees and expenses | | | 66,236 | | | | 84,751 | | | | 9,418 | |
Trustees’ fees and expenses | | | 7,099 | | | | 9,864 | | | | 941 | |
Professional fees | | | 74,047 | | | | 97,412 | | | | 10,113 | |
Shareholders’ reports – printing and mailing expenses | | | 78,004 | | | | 374,699 | | | | 5,391 | |
Federal and state registration fees | | | 110,022 | | | | 121,163 | | | | 87,470 | |
Other expenses | | | 21,419 | | | | 33,140 | | | | 2,914 | |
Total expenses before custodian fee credit and expense reimbursement | | | 4,085,453 | | | | 7,505,332 | | | | 433,758 | |
Custodian fee credit | | | (213 | ) | | | (344 | ) | | | (14 | ) |
Expense reimbursement | | | (396,361 | ) | | | — | | | | (76,602 | ) |
Net expenses | | | 3,688,879 | | | | 7,504,988 | | | | 357,142 | |
Net investment income (loss) | | | 5,602,681 | | | | 945,024 | | | | 248,489 | |
Realized and Unrealized Gain (Loss) | | | | | | | | | | | | |
Net realized gain (loss) from investments and foreign currency | | | (99,556,386 | ) | | | (222,172,003 | ) | | | (3,940,065 | ) |
Change in net unrealized appreciation (depreciation) of investments and foreign currency | | | (34,549,238 | ) | | | (33,669,985 | ) | | | (1,787,154 | ) |
Net realized and unrealized gain (loss) | | | (134,105,624 | ) | | | (255,841,988 | ) | | | (5,727,219 | ) |
Net increase (decrease) in net assets from operations | | $ | (128,502,943 | ) | | $ | (254,896,964 | ) | | $ | (5,478,730 | ) |
See accompanying notes to financial statements.
Statement of Operations (continued)
Year Ended June 30, 2009
| | | | | | | | | | | | |
| | | Small/Mid
Cap Value | | | Small-Cap Value | | | Value Opportunities | |
Investment Income | | | | | | | | | | | | |
Dividends (net of foreign tax withheld of $78, $4,638 and $448,382, respectively) | | $ | 162,985 | | | $ | 1,525,003 | | | $ | 11,303,096 | |
Interest (net of foreign tax withheld of $0, $0 and $1,368, respectively) | | | 5,248 | | | | 42,993 | | | | 6,133,793 | |
Total investment income | | | 168,233 | | | | 1,567,996 | | | | 17,436,889 | |
Expenses | | | | | | | | | | | | |
Management fees | | | 135,747 | | | | 1,009,373 | | | | 7,079,029 | |
12b-1 service fees – Class A | | | 3,075 | | | | 66,092 | | | | 741,609 | |
12b-1 distribution and service fees – Class B | | | 388 | | | | 2,284 | | | | 49,963 | |
12b-1 distribution and service fees – Class C | | | 7,774 | | | | 50,934 | | | | 885,800 | |
12b-1 distribution and service fees – Class R3 | | | — | | | | — | | | | 1,071 | |
Shareholders’ servicing agent fees and expenses | | | 12,544 | | | | 73,354 | | | | 1,053,780 | |
Custodian’s fees and expenses | | | 7,660 | | | | 22,255 | | | | 114,757 | |
Trustees’ fees and expenses | | | 432 | | | | 2,673 | | | | 21,946 | |
Professional fees | | | 5,511 | | | | 26,393 | | | | 151,664 | |
Shareholders’ reports – printing and mailing expenses | | | — | | | | 53,578 | | | | 324,909 | |
Federal and state registration fees | | | 73,287 | | | | 55,089 | | | | 182,007 | |
Other expenses | | | 2,176 | | | | 8,066 | | | | 38,550 | |
Total expenses before custodian fee credit and expense reimbursement | | | 248,594 | | | | 1,370,091 | | | | 10,645,085 | |
Custodian fee credit | | | (13 | ) | | | (4 | ) | | | (642 | ) |
Expense reimbursement | | | (64,796 | ) | | | — | | | | (33,088 | ) |
Net expenses | | | 183,785 | | | | 1,370,087 | | | | 10,611,355 | |
Net investment income (loss) | | | (15,552 | ) | | | 197,909 | | | | 6,825,534 | |
Realized and Unrealized Gain (Loss) | | | | | | | | | | | | |
Net realized gain (loss) from investments and foreign currency | | | (22,774,366 | ) | | | (71,043,262 | ) | | | (92,304,086 | ) |
Change in net unrealized appreciation (depreciation) of investments and foreign currency | | | 6,483,688 | | | | 2,948,702 | | | | (10,891,435 | ) |
Net realized and unrealized gain (loss) | | | (16,290,678 | ) | | | (68,094,560 | ) | | | (103,195,521 | ) |
Net increase (decrease) in net assets from operations | | $ | (16,306,230 | ) | | $ | (67,896,651 | ) | | $ | (96,369,987 | ) |
See accompanying notes to financial statements.
Statement of Changes in Net Assets
| | | | | | | | | | | | | | | | |
| | | Multi-Manager Large-Cap Value | | | Multi-Cap Value | |
| | | Year Ended
6/30/09 | | | Year Ended
6/30/08 | | | Year Ended
6/30/09 | | | Year Ended
6/30/08 | |
Operations | | | | | | | | | | | | | | | | |
Net investment income (loss) | | $ | 5,602,681 | | | $ | 6,001,294 | | | $ | 945,024 | | | $ | 84,274 | |
Net realized gain (loss) from: | | | | | | | | | | | | | | | | |
Investments and foreign currency | | | (99,556,386 | ) | | | 46,928,398 | | | | (222,172,003 | ) | | | (46,695,377 | ) |
Redemptions in-kind | | | — | | | | — | | | | — | | | | — | |
Change in net unrealized appreciation (depreciation) of
investments and foreign currency | | | (34,549,238 | ) | | | (109,626,987 | ) | | | (33,669,985 | ) | | | (293,616,756 | ) |
Net increase (decrease) in net assets from operations | | | (128,502,943 | ) | | | (56,697,295 | ) | | | (254,896,964 | ) | | | (340,227,859 | ) |
Distributions to Shareholders | | | | | | | | | | | | | | | | |
Net investment income: | | | | | | | | | | | | | | | | |
Class A | | | (3,290,647 | ) | | | (5,435,774 | ) | | | — | | | | (319,967 | ) |
Class B | | | (10,009 | ) | | | (43,212 | ) | | | — | | | | — | |
Class C | | | (32,922 | ) | | | (93,919 | ) | | | — | | | | — | |
Class R3 | | | (948 | ) | | | N/A | | | | — | | | | N/A | |
Class I (1) | | | (268,967 | ) | | | (424,963 | ) | | | — | | | | (485,483 | ) |
From accumulated net realized gains: | | | | | | | | | | | | | | | | |
Class A | | | (25,379,143 | ) | | | (69,843,284 | ) | | | — | | | | (17,840,823 | ) |
Class B | | | (509,457 | ) | | | (2,094,917 | ) | | | — | | | | (2,285,419 | ) |
Class C | | | (1,646,216 | ) | | | (4,505,945 | ) | | | — | | | | (12,664,308 | ) |
Class R3 | | | (10,722 | ) | | | N/A | | | | — | | | | N/A | |
Class I (1) | | | (1,582,389 | ) | | | (4,268,174 | ) | | | — | | | | (15,616,418 | ) |
Tax return of capital: | | | | | | | | | | | | | | | | |
Class A | | | — | | | | — | | | | — | | | | (1,415,298 | ) |
Class B | | | — | | | | — | | | | — | | | | — | |
Class C | | | — | | | | — | | | | — | | | | — | |
Class R3 | | | — | | | | N/A | | | | — | | | | N/A | |
Class I (1) | | | — | | | | — | | | | — | | | | (2,147,421 | ) |
Decrease in net assets from distributions to shareholders | | | (32,731,420 | ) | | | (86,710,188 | ) | | | — | | | | (52,775,137 | ) |
Fund Share Transactions | | | | | | | | | | | | | | | | |
Proceeds from sale of shares | | | 25,703,284 | | | | 34,460,397 | | | | 192,693,604 | | | | 342,932,823 | |
Proceeds from shares issued to shareholders due to reinvestment of distributions | | | 24,773,422 | | | | 63,939,667 | | | | — | | | | 47,921,628 | |
| | | 50,476,706 | | | | 98,400,064 | | | | 192,693,604 | | | | 390,854,451 | |
Cost of shares redeemed | | | (61,316,966 | ) | | | (81,247,290 | ) | | | (332,925,017 | ) | | | (704,297,666 | ) |
Cost of redemptions in-kind | | | — | | | | — | | | | — | | | | — | |
Net increase (decrease) in net assets from Fund share transactions | | | (10,840,260 | ) | | | 17,152,774 | | | | (140,231,413 | ) | | | (313,443,215 | ) |
Capital contribution from Adviser | | | — | | | | — | | | | — | | | | — | |
Net increase (decrease) in net assets | | | (172,074,623 | ) | | | (126,254,709 | ) | | | (395,128,377 | ) | | | (706,446,211 | ) |
Net assets at the beginning of year | | | 446,822,059 | | | | 573,076,768 | | | | 794,161,997 | | | | 1,500,608,208 | |
Net assets at the end of year | | $ | 274,747,436 | | | $ | 446,822,059 | | | $ | 399,033,620 | | | $ | 794,161,997 | |
Undistributed (Over-distribution of) net investment income at the end of year | | $ | 5,609,527 | | | $ | 3,610,339 | | | $ | 1,013,587 | | | $ | (38,774 | ) |
| (1) | Effective May 1, 2008, Class R Shares were renamed Class I Shares. |
| N/A | Multi-Manager Large-Cap Value and Multi-Cap Value did not offer Class R3 Shares prior to August 4, 2008. |
See accompanying notes to financial statements.
Statement of Changes in Net Assets (continued)
| | | | | | | | | | | | | | | | |
| | | Large-Cap Value | | | Small/Mid-Cap Value | |
| | | Year Ended
6/30/09 | | | Year Ended
6/30/08 | | | Year Ended
6/30/09 | | | Year Ended
6/30/08 | |
Operations | | | | | | | | | | | | | | | | |
Net investment income (loss) | | $ | 248,489 | | | $ | 148,959 | | | $ | (15,552 | ) | | $ | (232,344 | ) |
Net realized gain (loss) from: | | | | | | | | | | | | | | | | |
Investments and foreign currency | | | (3,940,065 | ) | | | (537,756 | ) | | | (22,774,366 | ) | | | (12,863,794 | ) |
Redemptions in-kind | | | — | | | | — | | | | — | | | | (12,286,275 | ) |
Change in net unrealized appreciation (depreciation) of
investments and foreign currency | | | (1,787,154 | ) | | | (3,537,399 | ) | | | 6,483,688 | | | | (1,437,205 | ) |
Net increase (decrease) in net assets from operations | | | (5,478,730 | ) | | | (3,926,196 | ) | | | (16,306,230 | ) | | | (26,819,618 | ) |
Distributions to Shareholders | | | | | | | | | | | | | | | | |
Net investment income: | | | | | | | | | | | | | | | | |
Class A | | | (22,861 | ) | | | (20,911 | ) | | | — | | | | (413 | ) |
Class B | | | — | | | | — | | | | — | | | | — | |
Class C | | | — | | | | — | | | | — | | | | — | |
Class R3 | | | N/A | | | | N/A | | | | N/A | | | | N/A | |
Class I (1) | | | (141,733 | ) | | | (72,607 | ) | | | — | | | | (487,049 | ) |
From accumulated net realized gains: | | | | | | | | | | | | | | | | |
Class A | | | — | | | | (694 | ) | | | — | | | | — | |
Class B | | | — | | | | (81 | ) | | | — | | | | — | |
Class C | | | — | | | | (342 | ) | | | — | | | | — | |
Class R3 | | | N/A | | | | N/A | | | | N/A | | | | N/A | |
Class I (1) | | | — | | | | (1,364 | ) | | | — | | | | — | |
Tax return of capital: | | | | | | | | | | | | | | | | |
Class A | | | — | | | | — | | | | — | | | | — | |
Class B | | | — | | | | — | | | | — | | | | — | |
Class C | | | — | | | | — | | | | — | | | | — | |
Class R3 | | | N/A | | | | N/A | | | | N/A | | | | N/A | |
Class I (1) | | | — | | | | — | | | | — | | | | — | |
Decrease in net assets from distributions to shareholders | | | (164,594 | ) | | | (95,999 | ) | | | — | | | | (487,462 | ) |
Fund Share Transactions | | | | | | | | | | | | | | | | |
Proceeds from sale of shares | | | 59,453,469 | | | | 23,857,076 | | | | 7,428,866 | | | | 49,652,728 | |
Proceeds from shares issued to shareholders due to reinvestment of distributions | | | 128,769 | | | | 81,088 | | | | — | | | | 485,206 | |
| | | 59,582,238 | | | | 23,938,164 | | | | 7,428,866 | | | | 50,137,934 | |
Cost of shares redeemed | | | (16,741,242 | ) | | | (8,067,479 | ) | | | (28,728,824 | ) | | | (39,369,459 | ) |
Cost of redemptions in-kind | | | — | | | | — | | | | — | | | | (159,386,190 | ) |
Net increase (decrease) in net assets from Fund share transactions | | | 42,840,996 | | | | 15,870,685 | | | | (21,299,958 | ) | | | (148,617,715 | ) |
Capital contribution from Adviser | | | — | | | | — | | | | 125,970 | | | | — | |
Net increase (decrease) in net assets | | | 37,197,672 | | | | 11,848,490 | | | | (37,480,218 | ) | | | (175,924,795 | ) |
Net assets at the beginning of year | | | 24,117,469 | | | | 12,268,979 | | | | 43,298,310 | | | | 219,223,105 | |
Net assets at the end of year | | $ | 61,315,141 | | | $ | 24,117,469 | | | $ | 5,818,092 | | | $ | 43,298,310 | |
Undistributed (Over-distribution of) net investment income at the end of year | | $ | 164,141 | | | $ | 80,201 | | | $ | — | | | $ | — | |
| | | | | | | | | | | | | | | | |
| | | Small-Cap Value | | | Value Opportunities | |
| | | Year Ended
6/30/09 | | | Year Ended
6/30/08 | | | Year Ended
6/30/09 | | | Year Ended
6/30/08 | |
Operations | | | | | | | | | | | | | | | | |
Net investment income (loss) | | $ | 197,909 | | | $ | (135,726 | ) | | $ | 6,825,534 | | | $ | 3,506,893 | |
Net realized gain (loss) from: | | | | | | | | | | | | | | | | |
Investments and foreign currency | | | (71,043,262 | ) | | | (2,486,235 | ) | | | (92,304,086 | ) | | | 48,625,454 | |
Redemptions in-kind | | | — | | | | — | | | | — | | | | — | |
Change in net unrealized appreciation (depreciation) of
investments and foreign currency | | | 2,948,702 | | | | (43,296,876 | ) | | | (10,891,435 | ) | | | (70,243,353 | ) |
Net increase (decrease) in net assets from operations | | | (67,896,651 | ) | | | (45,918,837 | ) | | | (96,369,987 | ) | | | (18,111,006 | ) |
Distributions to Shareholders | | | | | | | | | | | | | | | | |
Net investment income: | | | | | | | | | | | | | | | | |
Class A | | | — | | | | (48,704 | ) | | | (611,878 | ) | | | (5,368,016 | ) |
Class B | | | — | | | | — | | | | — | | | | (67,198 | ) |
Class C | | | — | | | | — | | | | — | | | | (1,191,878 | ) |
Class R3 | | | N/A | | | | N/A | | | | — | | | | N/A | |
Class I (1) | | | — | | | | (373,600 | ) | | | (1,649,711 | ) | | | (3,787,679 | ) |
From accumulated net realized gains: | | | | | | | | | | | | | | | | |
Class A | | | — | | | | (1,644,070 | ) | | | (12,960,049 | ) | | | (12,301,149 | ) |
Class B | | | — | | | | (17,075 | ) | | | (230,149 | ) | | | (267,415 | ) |
Class C | | | — | | | | (357,868 | ) | | | (3,976,760 | ) | | | (4,745,567 | ) |
Class R3 | | | N/A | | | | N/A | | | | (5,448 | ) | | | N/A | |
Class I (1) | | | — | | | | (3,093,051 | ) | | | (14,167,425 | ) | | | (7,857,520 | ) |
Tax return of capital: | | | | | | | | | | | | | | | | |
Class A | | | — | | | | (6,531 | ) | | | — | | | | — | |
Class B | | | — | | | | — | | | | — | | | | — | |
Class C | | | — | | | | — | | | | — | | | | — | |
Class R3 | | | N/A | | | | N/A | | | | — | | | | N/A | |
Class I (1) | | | — | | | | (50,092 | ) | | | — | | | | — | |
Decrease in net assets from distributions to shareholders | | | — | | | | (5,590,991 | ) | | | (33,601,420 | ) | | | (35,586,422 | ) |
Fund Share Transactions | | | | | | | | | | | | | | | | |
Proceeds from sale of shares | | | 36,286,766 | | | | 46,853,684 | | | | 761,448,921 | | | | 453,732,611 | |
Proceeds from shares issued to shareholders due to reinvestment of distributions | | | — | | | | 4,509,429 | | | | 22,479,299 | | | | 27,921,650 | |
| | | 36,286,766 | | | | 51,363,113 | | | | 783,928,220 | | | | 481,654,261 | |
Cost of shares redeemed | | | (66,999,103 | ) | | | (56,058,090 | ) | | | (360,747,458 | ) | | | (173,862,467 | ) |
Cost of redemptions in-kind | | | — | | | | — | | | | — | | | | — | |
Net increase (decrease) in net assets from Fund share transactions | | | (30,712,337 | ) | | | (4,694,977 | ) | | | 423,180,762 | | | | 307,791,794 | |
Capital contribution from Adviser | | | — | | | | — | | | | — | | | | — | |
Net increase (decrease) in net assets | | | (98,608,988 | ) | | | (56,204,805 | ) | | | 293,209,355 | | | | 254,094,366 | |
Net assets at the beginning of year | | | 172,384,679 | | | | 228,589,484 | | | | 770,021,368 | | | | 515,927,002 | |
Net assets at the end of year | | $ | 73,775,691 | | | $ | 172,384,679 | | | $ | 1,063,230,723 | | | $ | 770,021,368 | |
Undistributed (Over-distribution of) net investment income at the end of year | | $ | 197,909 | | | $ | — | | | $ | (728,391 | ) | | $ | (4,918,826 | ) |
| (1) | Effective May 1, 2008, Class R Shares were renamed Class I Shares. |
| N/A | Large-Cap Value, Small/Mid-Cap Value and Small-Cap Value are not authorized to issue Class R3 Shares. Value Opportunities did not offer Class R3 Shares prior to August 4, 2008. |
See accompanying notes to financial statements.
Notes to Financial Statements
1. General Information and Significant Accounting Policies
The Nuveen Investment Trust (the “Trust”) is an open-end management investment company registered under the Investment Company Act of 1940, as amended. The Trust is comprised of the Nuveen Multi-Manager Large-Cap Value Fund (“Multi-Manager Large-Cap Value”), Nuveen NWQ Multi-Cap Value Fund (“Multi-Cap Value”), Nuveen NWQ Large-Cap Value Fund (“Large-Cap Value”), Nuveen NWQ Small/Mid-Cap Value Fund (“Small/Mid-Cap Value”), Nuveen NWQ Small-Cap Value Fund (“Small-Cap Value”) and Nuveen Tradewinds Value Opportunities Fund (“Value Opportunities”) (collectively, the “Funds”), among others. The Trust was organized as a Massachusetts business trust in 1996.
Multi-Manager Large-Cap Value’s primary investment objective is to provide long-term capital appreciation. Under normal circumstances, the Fund invests at least 80% of its net assets in equity securities of companies with market capitalizations comparable to companies in the Russell 1000 Value Index. The Fund may also invest up to 25% of its net assets in U.S. dollar-denominated non-U.S. equity securities.
Multi-Cap Value’s primary investment objective is to provide long-term capital appreciation. Under normal circumstances, the Fund invests at least 80% of its net assets in equity securities of companies with large, medium and small capitalizations. The Fund primarily invests in U.S. equity securities, but it may invest up to 35% of its net assets in non-U.S. equity securities, including up to 10% of its net assets in equity securities of companies located in emerging markets.
Large-Cap Value’s primary investment objective is to provide long-term capital appreciation. Under normal circumstances, the Fund invests at least 80% of its net assets in equity securities of companies with market capitalizations at the time of investment comparable to companies in the Russell 1000 Index. The Fund primarily invests in U.S. equity securities, but it may invest up to 35% of its net assets in non-U.S. equity securities, including up to 10% of its net assets in equity securities of companies located in emerging markets.
Small/Mid-Cap Value’s primary investment objective is to provide long-term capital appreciation. Under normal circumstances, the Fund invests at least 80% of its net assets in equity securities of companies with market capitalizations at the time of investment comparable to companies in the Russell 2500 Index. The Fund primarily invests in U.S. equity securities, but it may invest up to 35% of its net assets in non-U.S. equity securities, including up to 10% of its net assets in equity securities of companies located in emerging markets.
Small-Cap Value’s primary investment objective is to provide long-term capital appreciation. Under normal circumstances, the Fund invests at least 80% of its net assets in equity securities of companies with market capitalizations at the time of investment comparable to companies in the Russell 2000 Index or the Standard & Poor’s SmallCap 600 Index. The Fund primarily invests in U.S. equity securities, but it may invest up to 35% of its net assets in non-U.S. equity securities, including up to 10% of its net assets in equity securities of companies located in emerging markets.
Value Opportunities’ primary investment objective is to provide long-term capital appreciation. Under normal circumstances, the Fund invests primarily in equity securities of companies with varying market capitalizations, which may include small-, mid- and large-capitalization companies. The Fund primarily invests in U.S. equity securities, but it may invest up to 35% of its net assets in non-U.S. equity securities, including up to 10% of its net assets in equity securities of companies located in emerging markets.
Effective May 1, 2008, Class B Shares will only be issued upon exchange of Class B Shares from another Nuveen Investments, Inc. (“Nuveen”) fund or for purposes of dividend reinvestment. The reinstatement privilege for Class B Shares is no longer available as of December 31, 2008.
On August 4, 2008, Multi-Manager Large-Cap Value, Multi-Cap Value and Value Opportunities began offering Class R3 Shares to certain retirement plans.
The following is a summary of significant accounting policies followed by the Funds in the preparation of their financial statements in accordance with accounting principles generally accepted in the United States.
Investment Valuation
Exchange-listed securities are generally valued at the last sales price on the securities exchange on which such securities are primarily traded. Securities traded on a securities exchange for which there are no transactions on a given day or securities not listed on a securities exchange are valued at the mean of the closing bid and asked prices. Securities traded on NASDAQ are valued at the NASDAQ Official Closing Price. If significant market events occur between the time of the determination of the closing price of a foreign security on an exchange and the time that the Funds’ NAV is determined, or if under the Funds’ procedures, the closing price of a foreign security is not deemed to be reliable, and there could be a material effect on the Funds’ NAV, the security would be valued at fair value as determined in accordance with procedures established in good faith by the Board of Trustees. The prices of fixed-income securities are generally provided by an independent pricing service approved by the Funds’ Board of Trustees. When price quotes are not readily available, the pricing service or, in the absence of a pricing service for a particular investment, the Board of Trustees of the Funds, or its designee, may establish fair value using a wide variety of market data including yields or prices of investments of comparable quality, type of issue, coupon, maturity and rating, market quotes or indications of value from securities dealers, evaluations of anticipated cash flows or collateral, general market conditions and other information and analysis, including the obligor’s credit characteristics considered relevant. Short-term investments are valued at amortized cost, which approximates value.
Investment Transactions
Investment transactions are recorded on a trade date basis. Realized gains and losses from transactions are determined on the specific identification method. Investments purchased on a when-issued/delayed delivery basis may have extended settlement periods. Any investments so purchased are subject to market fluctuation during this period. The Funds have instructed the custodian to segregate assets with a current value at least equal to the amount of the when-issued/delayed delivery purchase commitments. At June 30, 2009, there were no such outstanding purchase commitments in any of the Funds.
Investment Income
Dividend income is recorded on the ex-dividend date or, for foreign securities, when information is available. Interest income, which includes the amortization of premiums and accretion of discounts for financial reporting purposes, is recorded on an accrual basis. Interest income also includes paydown gains and losses, if any.
Income Taxes
Each Fund is a separate taxpayer for federal income tax purposes. Each Fund intends to distribute substantially all of its net investment income and net capital gains to shareholders and to otherwise comply with the requirements of Subchapter M of the Internal Revenue Code applicable to regulated investment companies. Therefore, no federal income tax provision is required.
For all open tax years and all major taxing jurisdictions, management of the Funds has concluded that there are no significant uncertain tax positions that would require recognition in the financial statements. Open tax years are those that are open for examination by taxing authorities (i.e., generally the last four tax year ends and the interim tax period since then). Furthermore, management of the Funds is also not aware of any tax positions for which it is reasonably possible that the total amounts of unrecognized tax benefits will significantly change in the next twelve months.
Dividends and Distributions to Shareholders
Dividends from net investment income and net realized capital gains from investment transactions, if any, are declared and distributed to shareholders at least annually. Furthermore, capital gains are distributed only to the extent they exceed available capital loss carryforwards.
Distributions to shareholders are recorded on the ex-dividend date. The amount and timing of distributions are determined in accordance with federal income tax regulations, which may differ from accounting principles generally accepted in the United States.
Flexible Sales Charge Program
Class A Shares are generally sold with an up-front sales charge and incur a .25% annual 12b-1 service fee. Class A Share purchases of $1 million or more are sold at net asset value without an up-front sales charge but may be subject to a contingent deferred sales charge (“CDSC”) if redeemed within twelve months of purchase. Class B Shares are sold without an up-front sales charge but incur a .75% annual 12b-1 distribution fee and a .25% annual 12b-1 service fee. Class B Shares are subject to a CDSC of up to 5% depending upon the length of time the shares are held by the investor (CDSC is reduced to 0% at the end of six years). Class B Shares convert to Class A Shares eight years after purchase. Class C Shares are sold without an up-front sales charge but incur a .75% annual 12b-1 distribution fee and a .25% annual 12b-1 service fee. Class C Shares are subject to a CDSC of 1% if redeemed within one year of purchase. Class R3 Shares are sold without an up-front sales charge but incur a .50% annual 12b-1 distribution and service fee. Class I Shares are not subject to any sales charge or 12b-1 distribution or service fees.
Foreign Currency Transactions
Each Fund is authorized to engage in foreign currency exchange transactions, including foreign currency forwards, futures, options and swap contracts. To the extent that the Funds invest in securities and/or contracts that are denominated in a currency other than U.S. dollars, the Funds will be subject to currency risk, which is the risk that an increase in the U.S. dollar relative to the foreign currency will reduce returns or portfolio value. Generally, when the U.S. dollar rises in value against a foreign currency, the Funds’ investments denominated in that currency will lose value because its currency is worth fewer U.S. dollars; the opposite effect occurs if the U.S. dollar falls in relative value. Investments and other assets and liabilities denominated in foreign currencies are converted into U.S. dollars on a spot (i.e. cash) basis at the spot rate prevailing in the foreign currency exchange market at the time of valuation. Purchases and sales of investments and income denominated in foreign currencies are translated into U.S. dollars on the respective dates of such transactions.
The books and records of the Funds are maintained in U.S. dollars. Foreign currencies, investments and other assets and liabilities are translated into U.S. dollars at 4:00 p.m. Eastern time. Investments and income and expenses are translated on the respective dates of such transactions. Net realized foreign currency gains and losses resulting from changes in exchange rates include foreign currency gains and losses between trade date and settlement date of the transactions, foreign currency transactions, and the difference between the amounts of interest and dividends recorded on the books of a Fund and the amounts actually received.
The realized and unrealized gains or losses resulting from changes in foreign exchange rates are included in “Net realized gain (loss) from investments and foreign currency” and “Change in net unrealized appreciation (depreciation) of investments and foreign currency” on the Statement of Operations.
Market and Counterparty Credit Risk
In the normal course of business each Fund may invest in financial instruments and enter into financial transactions where risk of potential loss exists due to changes in the market (market risk) or failure of the other party to the transaction to perform
Notes to Financial Statements (continued)
(counterparty credit risk). The potential loss could exceed the value of the financial assets recorded on the financial statements. Financial assets, which potentially expose each Fund to counterparty credit risk, consist principally of cash due from counterparties on forward, option and swap transactions. The extent of each Fund’s exposure to counterparty credit risk in respect to these financial assets approximates their carrying value as recorded on the Statement of Assets and Liabilities. Futures contracts expose a Fund to minimal counterparty credit risk as they are exchange traded and the exchange’s clearing house, which is counterparty to all exchange traded futures, guarantees the futures contracts against default.
Each Fund helps manage counterparty credit risk by entering into agreements only with counterparties Nuveen Asset Management (“the Adviser”), a wholly-owned subsidiary of Nuveen, believes have the financial resources to honor their obligations and by having the Adviser monitor the financial stability of the counterparties. Additionally, counterparties may be required to pledge collateral daily (based on the daily valuation of the financial asset) on behalf of each Fund with a value approximately equal to the amount of any unrealized gain above a pre-determined threshold. Reciprocally, when each Fund has an unrealized loss, the Funds have instructed the custodian to pledge assets of the Funds as collateral with a value approximately equal to the amount of the unrealized loss above a pre-determined threshold. Collateral pledges are monitored and subsequently adjusted if and when the valuations fluctuate, either up or down, by at least the predetermined threshold amount.
Redemptions In-Kind
In certain circumstances, a Fund may distribute portfolio securities rather than cash as payment for redemption of Fund shares (redemptions in-kind). For financial reporting purposes, the Fund recognizes a gain on the redemptions in-kind to the extent the value of the distributed securities on the date of redemption exceeds the cost of those securities; the Fund recognizes a loss if cost exceeds value. Gains and losses realized on the redemptions in-kind are not recognized for tax purposes, and are reclassified from undistributed realized gain or loss to paid-in capital. During the fiscal year ended June 30, 2008, Small/Mid-Cap Value realized $12,286,275 of net loss on redemptions in-kind. There were no redemptions in-kind for any of the Funds during the fiscal year ended June 30, 2009.
Derivative Financial Instruments
Each Fund is authorized to invest in derivative financial instruments or other transactions for the purpose of hedging the portfolio’s exposure to common stock risk, high yield credit risk, foreign currency exchange risk and the risk of increases in interest rates. Although each Fund is authorized to invest in such financial instruments, and may do so in the future, they did not invest in any such instruments during the fiscal year ended June 30, 2009.
Repurchase Agreements
In connection with transactions in repurchase agreements, it is each Fund’s policy that its custodian take possession of the underlying collateral securities, the fair value of which exceeds the principal amount of the repurchase transaction, including accrued interest, at all times. If the seller defaults, and the fair value of the collateral declines, realization of the collateral may be delayed or limited.
Expense Allocation
Expenses of the Funds that are not directly attributable to a specific class of shares are prorated among the classes based on the relative net assets of each class. Expenses directly attributable to a class of shares, which presently only include 12b-1 distribution and service fees, are recorded to the specific class.
Custodian Fee Credit
Each Fund has an arrangement with the custodian bank whereby certain custodian fees and expenses are reduced by net credits earned on each Fund’s cash on deposit with the bank. Such deposit arrangements are an alternative to overnight investments. Credits for cash balances may be offset by charges for any days on which a Fund overdraws its account at the custodian bank.
Indemnifications
Under the Trust’s organizational documents, its Officers and Trustees are indemnified against certain liabilities arising out of the performance of their duties to the Trust. In addition, in the normal course of business, the Trust enters into contracts that provide general indemnifications to other parties. The Trust’s maximum exposure under these arrangements is unknown as this would involve future claims that may be made against the Trust that have not yet occurred. However, the Trust has not had prior claims or losses pursuant to these contracts and expects the risk of loss to be remote.
Use of Estimates
The preparation of financial statements in conformity with accounting principles generally accepted in the United States requires management to make estimates and assumptions that affect the reported amounts of assets and liabilities at the date of the financial statements and the reported amounts of increases and decreases in net assets from operations during the reporting period. Actual results may differ from those estimates.
2. Fair Value Measurements
During the current fiscal period, the Funds adopted the provisions of Statement of Financial Accounting Standards No. 157 (SFAS No. 157) “Fair Value Measurements.” SFAS No. 157 defines fair value, establishes a framework for measuring fair value in generally accepted accounting principles and expands disclosure about fair value measurements. In determining the value of each Fund’s investments various inputs are used. These inputs are summarized in the three broad levels listed below:
| | |
| Level 1 – | | Quoted prices in active markets for identical securities. |
| Level 2 – | | Other significant observable inputs (including quoted prices for similar securities, interest rates, prepayment speeds, credit risk, etc.). |
| Level 3 – | | Significant unobservable inputs (including management’s assumptions in determining the fair value of investments). |
The inputs or methodology used for valuing securities are not an indication of the risk associated with investing in those securities.
The following is a summary of each Fund’s fair value measurements as of June 30, 2009:
| | | | | | | | | | | | |
| Multi-Manager Large-Cap Value | | Level 1 | | Level 2 | | Level 3 | | Total |
Investments: | | | | | | | | | | | | |
Common Stocks | | $ | 267,112,456 | | $ | — | | $ | — | | $ | 267,112,456 |
Investment Companies | | | 3,808,000 | | | — | | | — | | | 3,808,000 |
Short-Term Investments | | | 5,429,273 | | | — | | | — | | | 5,429,273 |
Total | | $ | 276,349,729 | | $ | — | | $ | — | | $ | 276,349,729 |
| | | | |
| Multi-Cap Value | | Level 1 | | Level 2 | | Level 3 | | Total |
Investments: | | | | | | | | | | | | |
Common Stocks | | $ | 390,129,063 | | $ | — | | $ | — | | $ | 390,129,063 |
Short-Term Investments | | | 6,263,374 | | | — | | | — | | | 6,263,374 |
Total | | $ | 396,392,437 | | $ | — | | $ | — | | $ | 396,392,437 |
| | | | |
| Large-Cap Value | | Level 1 | | Level 2 | | Level 3 | | Total |
Investments: | | | | | | | | | | | | |
Common Stocks | | $ | 55,174,039 | | $ | — | | $ | — | | $ | 55,174,039 |
Short-Term Investments | | | 5,944,996 | | | — | | | — | | | 5,944,996 |
Total | | $ | 61,119,035 | | $ | — | | $ | — | | $ | 61,119,035 |
| | | | |
| Small/Mid-Cap Value | | Level 1 | | Level 2 | | Level 3 | | Total |
Investments: | | | | | | | | | | | | |
Common Stocks | | $ | 5,647,119 | | $ | — | | $ | — | | $ | 5,647,119 |
Short-Term Investments | | | 114,898 | | | — | | | — | | | 114,898 |
Total | | $ | 5,762,017 | | $ | — | | $ | — | | $ | 5,762,017 |
| | | | |
| Small-Cap Value | | Level 1 | | Level 2 | | Level 3 | | Total |
Investments: | | | | | | | | | | | | |
Common Stocks | | $ | 71,490,841 | | $ | — | | $ | — | | $ | 71,490,841 |
Short-Term Investments | | | 2,640,321 | | | — | | | — | | | 2,640,321 |
Total | | $ | 74,131,162 | | $ | — | | $ | — | | $ | 74,131,162 |
| | | | |
| Value Opportunities | | Level 1 | | Level 2 | | Level 3 | | Total |
Investments: | | | | | | | | | | | | |
Common Stocks | | $ | 764,462,332 | | $ | 22,184,419 | | $ | — | | $ | 786,646,751 |
Preferred Securities* | | | — | | | 44,326,380 | | | | | | 44,326,380 |
Convertible Bonds | | | — | | | 86,785,737 | | | 1,612,885 | | | 88,398,622 |
Short-Term Investments | | | 132,512,182 | | | — | | | — | | | 132,512,182 |
Total | | $ | 896,974,514 | | $ | 153,296,536 | | $ | 1,612,885 | | $ | 1,051,883,935 |
| * | Preferred Securities may include Convertible Preferred Securities, $25 Par (or similar) Preferred Securities and Capital Preferred Securities. |
The following is a reconciliation of Value Opportunities’ Level 3 investments held at the beginning and end of the measurement period:
| | | |
| | | Value Opportunities
Level 3
Investments |
Balance at beginning of year | | $ | — |
Gains (losses): | | | |
Net realized gains (losses) | | | 521 |
Net change in unrealized appreciation (depreciation) | | | 1,111,138 |
Net purchases at cost (sales at proceeds) | | | 501,226 |
Net discounts (premiums) | | | — |
Net transfers in to (out of) at end of period fair value | | | — |
Balance at end of year | | $ | 1,612,885 |
Value Opportunities, “Change in net unrealized appreciation (depreciation) of investments and foreign currency” presented on the Statement of Operations includes $1,111,138 of net unrealized appreciation (depreciation) related to securities classified as Level 3 at year end.
Notes to Financial Statements (continued)
3. Derivative Instruments and Hedging Activities
During the current fiscal period, the Funds adopted the provisions of Statement of Financial Accounting Standards No. 161 (SFAS No. 161) “Disclosures about Derivative Instruments and Hedging Activities.” This standard is intended to enhance financial statement disclosures for derivative instruments and hedging activities and enable investors to better understand: a) how and why a fund uses derivative instruments; b) how derivative instruments are accounted for; and c) how derivative instruments affect a fund’s financial position, results of operations and cash flows, if any. The Funds record derivative instruments at fair value with changes in fair value recognized on the Statement of Operations. Even though the Funds’ investments in derivatives may represent economic hedges, they are considered to be non-hedge transactions for SFAS No. 161 disclosure purposes. The Funds did not invest in derivative instruments during the fiscal year ended June 30, 2009.
4. Fund Shares
Transactions in Fund shares were as follows:
| | | | | | | | | | | | | | |
| | | Multi-Manager Large-Cap Value | |
| | | Year Ended
6/30/09 | | | Year Ended
6/30/08 | |
| | | Shares | | | Amount | | | Shares | | | Amount | |
Shares sold: | | | | | | | | | | | | | | |
Class A | | 1,038,170 | | | $ | 15,636,485 | | | 810,194 | | | $ | 20,952,783 | |
Class A – automatic conversion of Class B Shares | | 68,221 | | | | 1,019,928 | | | 95,820 | | | | 2,611,838 | |
Class B | | 8,883 | | | | 145,467 | | | 49,593 | | | | 1,283,529 | |
Class C | | 233,580 | | | | 3,405,310 | | | 174,454 | | | | 4,304,545 | |
Class R3 | | 6,803 | | | | 150,000 | | | N/A | | | | N/A | |
Class I | | 368,345 | | | | 5,346,094 | | | 205,183 | | | | 5,307,702 | |
Shares issued to shareholders due to reinvestment of distributions: | | | | | | | | | | | | | | |
Class A | | 1,515,317 | | | | 21,678,068 | | | 2,239,141 | | | | 55,693,165 | |
Class B | | 24,991 | | | | 346,027 | | | 57,503 | | | | 1,382,961 | |
Class C | | 69,563 | | | | 961,070 | | | 102,686 | | | | 2,465,511 | |
Class R3 | | — | | | | — | | | N/A | | | | N/A | |
Class I | | 124,387 | | | | 1,788,257 | | | 175,694 | | | | 4,398,030 | |
| | | 3,458,260 | | | | 50,476,706 | | | 3,910,268 | | | | 98,400,064 | |
Shares redeemed: | | | | | | | | | | | | | | |
Class A | | (3,087,008 | ) | | | (47,678,912 | ) | | (2,223,180 | ) | | | (57,260,628 | ) |
Class B | | (150,585 | ) | | | (2,293,048 | ) | | (233,385 | ) | | | (6,098,504 | ) |
Class B – automatic conversion to Class A Shares | | (70,093 | ) | | | (1,019,928 | ) | | (98,311 | ) | | | (2,611,838 | ) |
Class C | | (302,468 | ) | | | (4,498,048 | ) | | (199,454 | ) | | | (5,027,951 | ) |
Class R3 | | — | | | | — | | | N/A | | | | N/A | |
Class I | | (376,550 | ) | | | (5,827,030 | ) | | (390,974 | ) | | | (10,248,369 | ) |
| | | (3,986,704 | ) | | | (61,316,966 | ) | | (3,145,304 | ) | | | (81,247,290 | ) |
Net increase (decrease) | | (528,444 | ) | | $ | (10,840,260 | ) | | 764,964 | | | $ | 17,152,774 | |
N/A – Multi-Manager Large-Cap Value did not issue Class R3 Shares prior to August 4, 2008.
| | | | | | | | | | | | | | |
| | | Multi-Cap Value | |
| | | Year Ended
6/30/09 | | | Year Ended
6/30/08 | |
| | | Shares | | | Amount | | | Shares | | | Amount | |
Shares sold: | | | | | | | | | | | | | | |
Class A | | 1,490,296 | | | $ | 20,013,543 | | | 4,894,727 | | | $ | 108,742,080 | |
Class A – automatic conversion of Class B Shares | | 12,748 | | | | 176,020 | | | 10,889 | | | | 231,835 | |
Class B | | 6,519 | | | | 81,686 | | | 106,450 | | | | 2,458,209 | |
Class C | | 301,887 | | | | 3,735,694 | | | 1,027,450 | | | | 22,871,607 | |
Class R3 | | 8,523 | | | | 150,000 | | | N/A | | | | N/A | |
Class I | | 13,576,526 | | | | 168,536,661 | | | 9,281,624 | | | | 208,629,092 | |
Shares issued to shareholders due to reinvestment of distributions: | | | | | | | | | | | | | | |
Class A | | — | | | | — | | | 802,400 | | | | 17,258,413 | |
Class B | | — | | | | — | | | 96,493 | | | | 2,021,539 | |
Class C | | — | | | | — | | | 510,247 | | | | 10,689,686 | |
Class R3 | | — | | | | — | | | N/A | | | | N/A | |
Class I | | — | | | | — | | | 834,562 | | | | 17,951,990 | |
| | | 15,396,499 | | | | 192,693,604 | | | 17,564,842 | | | | 390,854,451 | |
Shares redeemed: | | | | | | | | | | | | | | |
Class A | | (11,063,212 | ) | | | (153,131,622 | ) | | (14,115,576 | ) | | | (314,563,687 | ) |
Class B | | (581,198 | ) | | | (6,970,880 | ) | | (1,129,737 | ) | | | (24,400,345 | ) |
Class B – automatic conversion to Class A Shares | | (13,117 | ) | | | (176,020 | ) | | (11,126 | ) | | | (231,835 | ) |
Class C | | (4,161,457 | ) | | | (51,502,643 | ) | | (8,271,239 | ) | | | (179,247,807 | ) |
Class R3 | | — | | | | — | | | N/A | | | | N/A | |
Class I | | (9,831,921 | ) | | | (121,143,852 | ) | | (8,682,317 | ) | | | (185,853,992 | ) |
| | | (25,650,905 | ) | | | (332,925,017 | ) | | (32,209,995 | ) | | | (704,297,666 | ) |
Net increase (decrease) | | (10,254,406 | ) | | $ | (140,231,413 | ) | | (14,645,153 | ) | | $ | (313,443,215 | ) |
| |
| | | Large-Cap Value | |
| | | Year Ended
6/30/09 | | | Year Ended
6/30/08 | |
| | | Shares | | | Amount | | | Shares | | | Amount | |
Shares sold: | | | | | | | | | | | | | | |
Class A | | 437,267 | | | $ | 5,473,447 | | | 278,929 | | | $ | 5,572,566 | |
Class B | | 10,688 | | | | 124,561 | | | 49,539 | | | | 955,457 | |
Class C | | 132,478 | | | | 1,618,650 | | | 176,731 | | | | 3,519,118 | |
Class I | | 4,145,758 | | | | 52,236,811 | | | 731,693 | | | | 13,809,935 | |
Shares issued to shareholders due to reinvestment of distributions: | | | | | | | | | | | | | | |
Class A | | 1,543 | | | | 18,534 | | | 605 | | | | 12,060 | |
Class B | | — | | | | — | | | 3 | | | | 49 | |
Class C | | — | | | | — | | | 13 | | | | 255 | |
Class I | | 9,186 | | | | 110,235 | | | 3,448 | | | | 68,724 | |
| | | 4,736,920 | | | | 59,582,238 | | | 1,240,961 | | | | 23,938,164 | |
Shares redeemed: | | | | | | | | | | | | | | |
Class A | | (252,852 | ) | | | (3,125,125 | ) | | (97,992 | ) | | | (1,840,816 | ) |
Class B | | (26,815 | ) | | | (332,584 | ) | | (14,434 | ) | | | (268,025 | ) |
Class C | | (100,256 | ) | | | (1,201,071 | ) | | (85,459 | ) | | | (1,590,105 | ) |
Class I | | (919,292 | ) | | | (12,082,462 | ) | | (230,897 | ) | | | (4,368,533 | ) |
| | | (1,299,215 | ) | | | (16,741,242 | ) | | (428,782 | ) | | | (8,067,479 | ) |
Net increase (decrease) | | 3,437,705 | | | $ | 42,840,996 | | | 812,179 | | | $ | 15,870,685 | |
N/A – Multi-Cap Value did not issue Class R3 Shares prior to August 4, 2008.
Notes to Financial Statements (continued)
| | | | | | | | | | | | | | |
| | | Small/Mid-Cap Value | |
| | | Year Ended
6/30/09 | | | Year Ended
6/30/08 | |
| | | Shares | | | Amount | | | Shares | | | Amount | |
Shares sold: | | | | | | | | | | | | | | |
Class A | | 110,634 | | | $ | 1,210,334 | | | 255,380 | | | $ | 4,773,951 | |
Class B | | 3,754 | | | | 49,057 | | | 1,570 | | | | 28,161 | |
Class C | | 27,757 | | | | 290,402 | | | 57,368 | | | | 1,067,460 | |
Class I | | 454,978 | | | | 5,879,073 | | | 2,422,448 | | | | 43,783,156 | |
Shares issued to shareholders due to reinvestment of distributions: | | | | | | | | | | | | | | |
Class A | | — | | | | — | | | 16 | | | | 307 | |
Class B | | — | | | | — | | | — | | | | — | |
Class C | | — | | | | — | | | — | | | | — | |
Class I | | — | | | | — | | | 25,441 | | | | 484,899 | |
| | | 597,123 | | | | 7,428,866 | | | 2,762,223 | | | | 50,137,934 | |
Shares redeemed: | | | | | | | | | | | | | | |
Class A | | (195,442 | ) | | | (2,681,788 | ) | | (96,825 | ) | | | (1,753,199 | ) |
Class B | | (2,772 | ) | | | (29,711 | ) | | (12,500 | ) | | | (241,750 | ) |
Class C | | (36,006 | ) | | | (374,276 | ) | | (38,545 | ) | | | (697,943 | ) |
Class I | | (2,362,882 | ) | | | (25,643,049 | ) | | (1,922,973 | ) | | | (36,676,567 | ) |
Class I – redemptions in-Kind | | — | | | | — | | | (8,401,687 | ) | | | (159,386,190 | ) |
| | | (2,597,102 | ) | | | (28,728,824 | ) | | (10,472,530 | ) | | | (198,755,649 | ) |
Net increase (decrease) | | (1,999,979 | ) | | $ | (21,299,958 | ) | | (7,710,307 | ) | | $ | (148,617,715 | ) |
| |
| | | Small-Cap Value | |
| | | Year Ended
6/30/09 | | | Year Ended
6/30/08 | |
| | | Shares | | | Amount | | | Shares | | | Amount | |
Shares sold: | | | | | | | | | | | | | | |
Class A | | 357,969 | | | $ | 5,864,631 | | | 577,225 | | | $ | 15,246,182 | |
Class A – automatic conversion of Class B Shares | | 57 | | | | 1,086 | | | 351 | | | | 9,483 | |
Class B | | 1,265 | | | | 15,145 | | | 552 | | | | 13,672 | |
Class C | | 27,028 | | | | 376,243 | | | 18,299 | | | | 460,704 | |
Class I | | 2,201,187 | | | | 30,029,661 | | | 1,226,386 | | | | 31,123,643 | |
Shares issued to shareholders due to reinvestment of distributions: | | | | | | | | | | | | | | |
Class A | | — | | | | — | | | 57,204 | | | | 1,420,922 | |
Class B | | — | | | | — | | | 383 | | | | 9,334 | |
Class C | | — | | | | — | | | 6,980 | | | | 170,236 | |
Class I | | — | | | | — | | | 116,381 | | | | 2,908,937 | |
| | | 2,587,506 | | | | 36,286,766 | | | 2,003,761 | | | | 51,363,113 | |
Shares redeemed: | | | | | | | | | | | | | | |
Class A | | (2,140,849 | ) | | | (29,729,040 | ) | | (897,290 | ) | | | (23,632,590 | ) |
Class B | | (5,021 | ) | | | (68,967 | ) | | (12,223 | ) | | | (302,597 | ) |
Class B – automatic conversion to Class A Shares | | (58 | ) | | | (1,086 | ) | | (356 | ) | | | (9,483 | ) |
Class C | | (200,743 | ) | | | (2,971,696 | ) | | (182,726 | ) | | | (4,593,365 | ) |
Class I | | (2,437,905 | ) | | | (34,228,314 | ) | | (1,098,297 | ) | | | (27,520,055 | ) |
| | | (4,784,576 | ) | | | (66,999,103 | ) | | (2,190,892 | ) | | | (56,058,090 | ) |
Net increase (decrease) | | (2,197,070 | ) | | $ | (30,712,337 | ) | | (187,131 | ) | | $ | (4,694,977 | ) |
| | | | | | | | | | | | | | |
| |
| | | Value Opportunities | |
| | | Year Ended
6/30/09 | | | Year Ended
6/30/08 | |
| | | Shares | | | Amount | | | Shares | | | Amount | |
Shares sold: | | | | | | | | | | | | | | |
Class A | | 10,158,154 | | | $ | 228,277,031 | | | 7,943,088 | | | $ | 242,248,967 | |
Class A – automatic conversion of Class B Shares | | 1,166 | | | | 28,045 | | | 1,176 | | | | 35,598 | |
Class B | | 25,804 | | | | 609,022 | | | 70,171 | | | | 2,120,260 | |
Class C | | 1,546,790 | | | | 34,769,188 | | | 1,258,098 | | | | 38,073,818 | |
Class R3 | | 24,474 | | | | 558,032 | | | N/A | | | | N/A | |
Class I | | 22,348,087 | | | | 497,207,603 | | | 5,631,896 | | | | 171,253,968 | |
Shares issued to shareholders due to reinvestment of distributions: | | | | | | | | | | | | | | |
Class A | | 580,049 | | | | 10,690,843 | | | 435,293 | | | | 13,267,584 | |
Class B | | 10,220 | | | | 185,195 | | | 8,806 | | | | 264,607 | |
Class C | | 156,448 | | | | 2,834,837 | | | 140,306 | | | | 4,216,004 | |
Class R3 | | — | | | | — | | | N/A | | | | N/A | |
Class I | | 473,586 | | | | 8,768,424 | | | 332,868 | | | | 10,173,455 | |
| | | 35,324,778 | | | | 783,928,220 | | | 15,821,702 | | | | 481,654,261 | |
Shares redeemed: | | | | | | | | | | | | | | |
Class A | | (7,498,998 | ) | | | (158,924,417 | ) | | (3,605,597 | ) | | | (109,855,588 | ) |
Class B | | (53,866 | ) | | | (1,118,016 | ) | | (16,825 | ) | | | (513,442 | ) |
Class B – automatic conversion to Class A Shares | | (1,181 | ) | | | (28,045 | ) | | (1,186 | ) | | | (35,598 | ) |
Class C | | (1,525,799 | ) | | | (31,579,562 | ) | | (541,715 | ) | | | (16,374,312 | ) |
Class R3 | | (7,375 | ) | | | (161,002 | ) | | N/A | | | | N/A | |
Class I | | (8,237,208 | ) | | | (168,936,416 | ) | | (1,526,242 | ) | | | (47,083,527 | ) |
| | | (17,324,427 | ) | | | (360,747,458 | ) | | (5,691,565 | ) | | | (173,862,467 | ) |
Net increase (decrease) | | 18,000,351 | | | $ | 423,180,762 | | | 10,130,137 | | | $ | 307,791,794 | |
N/A – Value Opportunities did not issue Class R3 Shares prior to August 4, 2008.
5. Investment Transactions
Purchases and sales (including maturities but excluding short-term investments) during the fiscal year ended June 30, 2009, were as follows:
| | | | | | | | | | | | | | | | | | |
| | | Multi-Manager
Large-Cap
Value | | Multi-Cap
Value | | Large-Cap
Value | | Small/Mid-Cap
Value | | Small-Cap
Value | | Value
Opportunities |
Purchases | | $ | 268,572,108 | | $ | 152,693,182 | | $ | 43,259,069 | | $ | 29,667,200 | | $ | 70,994,134 | | $ | 729,459,861 |
Sales and maturities | | | 296,858,992 | | | 290,149,919 | | | 4,438,326 | | | 47,557,708 | | | 93,089,277 | | | 409,766,223 |
6. Income Tax Information
The following information is presented on an income tax basis. Differences between amounts for financial statement and federal income tax purposes are primarily due to timing differences in recognizing certain gains and losses on investment transactions. To the extent that differences arise that are permanent in nature, such amounts are reclassified within the capital accounts on the Statement of Assets and Liabilities presented in the annual report, based on their federal tax basis treatment; temporary differences do not require reclassification. Temporary and permanent differences do not impact the net asset values of the Funds.
At June 30, 2009, the cost of investments was as follows:
| | | | | | | | | | | | | | | | | | |
| | | Multi-Manager
Large-Cap
Value | | Multi-Cap
Value | | Large-Cap
Value | | Small/Mid-Cap
Value | | Small-Cap
Value | | Value
Opportunities |
Cost of investments | | $ | 315,869,409 | | $ | 521,091,850 | | $ | 66,732,515 | | $ | 6,317,985 | | $ | 94,858,256 | | $ | 1,091,404,756 |
Gross unrealized appreciation and gross unrealized depreciation of investments at June 30, 2009, were as follows:
| | | | | | | | | | | | | | | | | | | | | | | | |
| | | Multi-Manager
Large-Cap
Value | | | Multi-Cap
Value | | | Large-Cap
Value | | | Small/Mid-Cap
Value | | | Small-Cap
Value | | | Value
Opportunities | |
Gross unrealized: | | | | | | | | | | | | | | | | | | | | | | | | |
Appreciation | | $ | 18,804,543 | | | $ | 46,572,106 | | | $ | 1,434,206 | | | $ | 364,807 | | | $ | 6,193,833 | | | $ | 74,797,121 | |
Depreciation | | | (58,324,223 | ) | | | (171,271,519 | ) | | | (7,047,686 | ) | | | (920,775 | ) | | | (26,920,927 | ) | | | (114,317,942 | ) |
Net unrealized appreciation (depreciation) of investments | | $ | (39,519,680 | ) | | $ | (124,699,413 | ) | | $ | (5,613,480 | ) | | $ | (555,968 | ) | | $ | (20,727,094 | ) | | $ | (39,520,821 | ) |
Notes to Financial Statements (continued)
The tax components of undistributed net ordinary income and net long-term capital gains at June 30, 2009, the Funds’ tax year end, were as follows:
| | | | | | | | | | | | | | | | | | |
| | | Multi-Manager
Large-Cap
Value | | Multi-Cap
Value | | Large-Cap
Value | | Small/Mid-Cap
Value | | Small-Cap
Value | | Value
Opportunities |
Undistributed net ordinary income* | | $ | 5,609,527 | | $ | 1,040,478 | | $ | 164,141 | | $ | — | | $ | 197,909 | | $ | — |
Undistributed net long-term capital gains | | | — | | | — | | | — | | | — | | | — | | | — |
| * | Net ordinary income consists of net taxable income derived from dividends, interest, and net short-term capital gains, if any. |
The tax character of distributions paid during the Funds’ tax years ended June 30, 2009 and June 30, 2008, was designated for purposes of the dividends paid deduction as follows:
| | | | | | | | | | | | | | | | | | |
| 2009 | | Multi-Manager
Large-Cap
Value | | Multi-Cap
Value | | Large-Cap
Value | | Small/Mid-Cap
Value | | Small-Cap
Value | | Value
Opportunities |
Distributions from net ordinary income* | | $ | 3,603,493 | | $ | — | | $ | 164,594 | | $ | — | | $ | — | | $ | 18,284,961 |
Distributions from net long-term capital gains** | | | 29,127,927 | | | — | | | — | | | — | | | — | | | 15,316,459 |
Tax return of capital | | | — | | | — | | | — | | | — | | | — | | | — |
| * | Net ordinary income consists of net taxable income derived from dividends, interest, and net short-term capital gains, if any. |
| ** | The Funds designated as a long-term capital gain dividend, pursuant to the Internal Revenue Code Section 852(b)(3), the amount necessary to reduce earnings and profits of the Funds related to net capital gain to zero for the tax year ended June 30, 2009. |
| | | | | | | | | | | | | | | | | | |
| 2008 | | Multi-Manager Large-Cap
Value | | Multi-Cap
Value | | Large-Cap
Value | | Small/Mid-Cap
Value | | Small-Cap
Value | | Value
Opportunities |
Distributions from net ordinary income* | | $ | 24,466,004 | | $ | 17,918,255 | | $ | 95,999 | | $ | 488,463 | | $ | 4,860,282 | | $ | 17,424,118 |
Distributions from net long-term capital gains | | | 62,244,184 | | | 31,305,510 | | | — | | | — | | | 674,086 | | | 18,162,304 |
Tax return of capital | | | — | | | 3,562,719 | | | — | | | — | | | 56,623 | | | — |
| * | Net ordinary income consists of net taxable income derived from dividends, interest, and net short-term capital gains, if any. |
At June 30, 2009, the Funds’ tax year end, the Funds had unused capital loss carryforwards available for federal tax purposes to be applied against future capital gains, if any. If not applied, the carryforwards will expire as follows:
| | | | | | | | | | | | | | | | | | |
| | | Multi-Manager
Large-Cap
Value | | Multi-Cap
Value | | Large-Cap
Value | | Small/Mid-Cap
Value | | Small-Cap
Value | | Value
Opportunities |
Expiration: | | | | | | | | | | | | | | | | | | |
June 30, 2016 | | $ | — | | $ | 16,839,859 | | $ | — | | $ | 13,065,462 | | $ | 2,490,066 | | $ | — |
June 30, 2017 | | | 24,629,447 | | | 174,357,114 | | | 3,880,395 | | | 21,132,667 | | | 16,942,331 | | | 11,117,092 |
Total | | $ | 24,629,447 | | $ | 191,196,973 | | $ | 3,880,395 | | $ | 34,198,129 | | $ | 19,432,397 | | $ | 11,117,092 |
Small/Mid-Cap Value’s capital loss carryforward is subject to an annual limitation under the Internal Revenue Code and related regulations.
The Funds have elected to defer net realized losses from investments incurred from November 1, 2008 through June 30, 2009, the Funds’ tax year end, (“post-October losses”) in accordance with federal income tax regulations. Post-October losses are treated as having arisen on the first day of the following fiscal year:
| | | | | | | | | | | | | | | | | | |
| | | Multi-Manager
Large-Cap
Value | | Multi-Cap
Value | | Large-Cap
Value | | Small/Mid-Cap
Value | | Small-Cap
Value | | Value
Opportunities |
Post-October capital losses | | $ | 64,839,455 | | $ | 74,617,242 | | $ | 232,685 | | $ | 1,257,145 | | $ | 51,925,456 | | $ | 72,586,120 |
7. Management Fees and Other Transactions with Affiliates
Each Fund’s management fee is separated into two components – a complex-level component, based on the aggregate amount of all fund assets managed by the Adviser, and a specific fund-level component, based only on the amount of assets within each individual Fund. This pricing structure enables Nuveen fund shareholders to benefit from growth in the assets within each individual fund as well as from growth in the amount of complex-wide assets managed by the Adviser.
The annual fund-level fee, payable monthly, for each Fund is based upon the average daily net assets of each Fund as follows:
| | | | | | | | | | | | | | | | | | |
| Average Daily Net Assets (1) | | Multi-Manager
Large-Cap
Value
Fund-Level
Fee Rate | | | Multi-Cap
Value
Fund-Level
Fee Rate | | | Large-Cap
Value
Fund-Level
Fee Rate | | | Small/Mid-Cap
Value
Fund-Level
Fee Rate | | | Small-Cap
Value
Fund-Level
Fee Rate | | | Value
Opportunities
Fund-Level
Fee Rate | |
For the first $125 million | | .5500 | % | | .6500 | % | | .6500 | % | | .7500 | % | | .8000 | % | | .8000 | % |
For the next $125 million | | .5375 | | | .6375 | | | .6375 | | | .7375 | | | .7875 | | | .7875 | |
For the next $250 million | | .5250 | | | .6250 | | | .6250 | | | .7250 | | | .7750 | | | .7750 | |
For the next $500 million | | .5125 | | | .6125 | | | .6125 | | | .7125 | | | .7625 | | | .7625 | |
For the next $1 billion | | .5000 | | | .6000 | | | .6000 | | | .7000 | | | .7500 | | | .7500 | |
For net assets over $2 billion | | .4750 | | | .5750 | | | .5750 | | | .6750 | | | .7250 | | | .7250 | |
The annual complex-level fee, payable monthly, which is additive to the fund-level fee, for all Nuveen sponsored funds in the U.S., is based on the aggregate amount of total fund assets managed as stated in the following table. As of June 30, 2009, the complex-level fee rate was .1970%.
The complex-level fee schedule is as follows:
| | | |
| Complex-Level Net Asset Breakpoint Level (1) | | Effective Rate at Breakpoint Level | |
$55 billion | | .2000 | % |
$56 billion | | .1996 | |
$57 billion | | .1989 | |
$60 billion | | .1961 | |
$63 billion | | .1931 | |
$66 billion | | .1900 | |
$71 billion | | .1851 | |
$76 billion | | .1806 | |
$80 billion | | .1773 | |
$91 billion | | .1691 | |
$125 billion | | .1599 | |
$200 billion | | .1505 | |
$250 billion | | .1469 | |
$300 billion | | .1445 | |
| (1) | The complex-level fee component of the management fee for the funds is calculated based upon the aggregate daily managed net assets of all Nuveen funds, with such daily managed net assets defined separately for each fund in its management agreement, but excluding assets attributable to investments in other Nuveen funds. For the complex-level and fund-level fee components, daily managed net assets include assets managed by the Adviser that are attributable to financial leverage. For these purposes, financial leverage includes the funds’ use of preferred stock and borrowings and investments in the residual interest certificates (also called inverse floating rate securities) in tender option bond (TOB) trusts, including the portion of assets held by the TOB trust that has been effectively financed by the trust’s issuance of floating rate securities, subject to an agreement by the Adviser to limit the amount of such assets for determining managed net assets in certain circumstances. |
The management fee compensates the Adviser for overall investment advisory and administrative services and general office facilities. The Adviser has entered into Sub-Advisory Agreements with Nuveen HydePark Group LLC (“HydePark”), Symphony Asset Management LLC (“Symphony”), Institutional Capital LLC (“ICAP”), NWQ Investment Management Company, LLC (“NWQ”) and Tradewinds Global Investors, LLC (“Tradewinds”), (collectively “Sub-Advisers”). HydePark, ICAP and Symphony manage Multi-Manager Large-Cap Value’s investment portfolio. NWQ manages Multi-Cap Value’s, Large-Cap Value’s, Small/Mid-Cap Value’s and Small Cap Value’s investment portfolios. Tradewinds manages Value Opportunities’ investment portfolio. HydePark, NWQ, Symphony and Tradewinds are each subsidiaries of Nuveen. The Sub-Advisers are compensated for their services to the Funds from the management fee paid to the Adviser.
The Adviser has agreed to waive fees and reimburse expenses of the following Funds so that total annual fund operating expenses (excluding 12b-1 distribution and service fees, interest expenses, taxes, fees incurred in acquiring and disposing of portfolio securities and extraordinary expenses) do not exceed the average daily net assets of any class of shares in the amounts and for the time periods stated in the following table.
| | | | | | | | |
| | | Current
Expense Cap | | | Current Expense Cap
Expiration Date | | Permanent
Expense Cap | |
Multi-Manager Large-Cap Value | | 0.95 | % | | October 31, 2010 | | 1.20 | % |
NWQ Large-Cap Value | | 1.10 | | | October 31, 2010 | | 1.35 | |
NWQ Small/Mid-Cap Value | | 1.20 | | | October 31, 2010 | | 1.45 | |
NWQ Small-Cap Value | | 1.25 | | | July 31, 2010 | | 1.50 | |
Tradewinds Value Opportunities | | 1.25 | | | October 31, 2009 | | 1.50 | |
The Adviser may voluntarily reimburse expenses from time to time in any of the Funds. Voluntary reimbursements may be terminated at any time at the Adviser's discretion.
Notes to Financial Statements (continued)
The Trust pays no compensation directly to those of its Trustees who are affiliated with the Adviser or to its Officers, all of whom receive remuneration for their services to the Trust from the Adviser or its affiliates. The Board of Trustees has adopted a deferred compensation plan for independent Trustees that enables Trustees to elect to defer receipt of all or a portion of the annual compensation they are entitled to receive from certain Nuveen advised funds. Under the plan, deferred amounts are treated as though equal dollar amounts had been invested in shares of select Nuveen advised funds.
During the fiscal year ended June 30, 2009, Nuveen Investments, LLC (the “Distributor”), a wholly owned subsidiary of Nuveen, collected sales charges on purchases of Class A Shares, the majority of which were paid out as concessions to financial intermediaries as follows:
| | | | | | | | | | | | | | | | | | |
| | | Multi-Manager
Large-Cap
Value | | Multi-Cap
Value | | Large-Cap
Value | | Small/Mid-Cap
Value | | Small-Cap
Value | | Value
Opportunities |
Sales charges collected (Unaudited) | | $ | 31,355 | | $ | 48,541 | | $ | 7,177 | | $ | 5,645 | | $ | 6,855 | | $ | 548,612 |
Paid to financial intermediaries (Unaudited) | | | 27,494 | | | 43,088 | | | 6,326 | | | 4,926 | | | 6,080 | | | 491,100 |
The Distributor also received 12b-1 service fees on Class A Shares, substantially all of which were paid to compensate financial intermediaries for providing services to shareholders relating to their investments.
During the fiscal year ended June 30, 2009, the Distributor compensated financial intermediaries directly with commission advances at the time of purchase as follows:
| | | | | | | | | | | | | | | | | | |
| | | Multi-Manager
Large-Cap
Value | | Multi-Cap
Value | | Large-Cap
Value | | Small/Mid-Cap
Value | | Small-Cap
Value | | Value
Opportunities |
Commission advances (Unaudited) | | $ | 11,497 | | $ | 32,841 | | $ | 7,296 | | $ | 847 | | $ | 3,368 | | $ | 362,922 |
To compensate for commissions advanced to financial intermediaries, all 12b-1 service fees collected on Class B Shares during the first year following a purchase, all 12b-1 distribution fees collected on Class B Shares, and all 12b-1 service and distribution fees collected on Class C Shares during the first year following a purchase are retained by the Distributor. During the fiscal year ended June 30, 2009, the Distributor retained such 12b-1 fees as follows:
| | | | | | | | | | | | | | | | | | |
| | | Multi-Manager
Large-Cap
Value | | Multi-Cap
Value | | Large-Cap
Value | | Small/Mid-Cap
Value | | Small-Cap
Value | | Value
Opportunities |
12b-1 fees retained (Unaudited) | | $ | 65,622 | | $ | 305,489 | | $ | 24,713 | | $ | 3,671 | | $ | 6,605 | | $ | 362,088 |
The remaining 12b-1 fees charged to the Funds were paid to compensate financial intermediaries for providing services to shareholders relating to their investments.
The Distributor also collected and retained CDSC on share redemptions during the fiscal year ended June 30, 2009, as follows:
| | | | | | | | | | | | | | | | | | |
| | | Multi-Manager
Large-Cap
Value | | Multi-Cap
Value | | Large-Cap
Value | | Small/Mid-Cap Value | | Small-Cap
Value | | Value
Opportunities |
CDSC retained (Unaudited) | | $ | 13,435 | | $ | 186,845 | | $ | 810 | | $ | 558 | | $ | 3,484 | | $ | 106,634 |
7. Subsequent Events
In May 2009, the Financial Accounting Standards Board issued Statement of Financial Accounting Standards No. 165 (SFAS No. 165) “Subsequent Events.” SFAS No. 165 requires an entity to recognize in the financial statements the effects of all subsequent events that provide additional evidence about conditions that existed at the date of the balance sheet. SFAS No. 165 is intended to establish general standards of accounting and for disclosure of events that occur after the balance sheet date but before financial statements are issued or are available to be issued. SFAS No. 165 requires the disclosure of the date through which an entity has evaluated subsequent events and the basis for that date — that is, whether that date represents the date the financial statements were issued or were available to be issued. SFAS No. 165 is effective for interim and annual periods ending after June 15, 2009. The Funds have performed an evaluation of subsequent events through August 24, 2009, which is the date the financial statements were issued.
Financial Highlights
Financial Highlights
| | | | | | | | | | | | | | | | | | | | | | | | | | | | | |
| Selected data for a share outstanding throughout each period: | | | |
| | | | | | |
| Class (Commencement Date) | | | | | | | | | | | | | | | | | |
| | | | | Investment Operations | | | Less Distributions | | | |
| | | | | |
MULTI-MANAGER LARGE-CAP VALUE | | | | | | | | | | | | | | | |
| | | | | | | | |
Year Ended
June 30, | | Beginning
Net
Asset
Value | | Net
Invest-
ment
Income
(Loss)(a) | | Net
Realized/
Unrealized
Gain
(Loss) | | | Total | | | Net
Invest-
ment
Income | | | Capital
Gains | | | Total | | | Ending
Net
Asset
Value |
Class A (8/96) | | | | | | | | | | | | | | | | | | | | | | | | | | |
2009 | | $ | 22.53 | | $ | .29 | | $ | (6.82 | ) | | $ | (6.53 | ) | | $ | (.19 | ) | | $ | (1.58 | ) | | $ | (1.77 | ) | | $ | 14.23 |
2008 | | | 30.05 | | | .32 | | | (3.15 | ) | | | (2.83 | ) | | | (.30 | ) | | | (4.39 | ) | | | (4.69 | ) | | | 22.53 |
2007 | | | 27.23 | | | .35 | | | 5.33 | | | | 5.68 | | | | (.26 | ) | | | (2.60 | ) | | | (2.86 | ) | | | 30.05 |
2006 | | | 25.58 | | | .22 | | | 3.26 | | | | 3.48 | | | | (.23 | ) | | | (1.60 | ) | | | (1.83 | ) | | | 27.23 |
2005 | | | 23.41 | | | .32 | | | 2.13 | | | | 2.45 | | | | (.28 | ) | | | — | | | | (.28 | ) | | | 25.58 |
Class B (8/96) | | | | | | | | | | | | | | | | | | | | | | | | | | |
2009 | | | 21.90 | | | .18 | | | (6.63 | ) | | | (6.45 | ) | | | (.03 | ) | | | (1.58 | ) | | | (1.61 | ) | | | 13.84 |
2008 | | | 29.32 | | | .11 | | | (3.06 | ) | | | (2.95 | ) | | | (.08 | ) | | | (4.39 | ) | | | (4.47 | ) | | | 21.90 |
2007 | | | 26.64 | | | .12 | | | 5.21 | | | | 5.33 | | | | (.05 | ) | | | (2.60 | ) | | | (2.65 | ) | | | 29.32 |
2006 | | | 25.06 | | | .02 | | | 3.20 | | | | 3.22 | | | | (.04 | ) | | | (1.60 | ) | | | (1.64 | ) | | | 26.64 |
2005 | | | 22.95 | | | .14 | | | 2.08 | | | | 2.22 | | | | (.11 | ) | | | — | | | | (.11 | ) | | | 25.06 |
Class C (8/96) | | | | | | | | | | | | | | | | | | | | | | | | | | |
2009 | | | 21.86 | | | .17 | | | (6.62 | ) | | | (6.45 | ) | | | (.03 | ) | | | (1.58 | ) | | | (1.61 | ) | | | 13.80 |
2008 | | | 29.27 | | | .12 | | | (3.06 | ) | | | (2.94 | ) | | | (.08 | ) | | | (4.39 | ) | | | (4.47 | ) | | | 21.86 |
2007 | | | 26.60 | | | .13 | | | 5.19 | | | | 5.32 | | | | (.05 | ) | | | (2.60 | ) | | | (2.65 | ) | | | 29.27 |
2006 | | | 25.02 | | | .02 | | | 3.20 | | | | 3.22 | | | | (.04 | ) | | | (1.60 | ) | | | (1.64 | ) | | | 26.60 |
2005 | | | 22.92 | | | .14 | | | 2.07 | | | | 2.21 | | | | (.11 | ) | | | — | | | | (.11 | ) | | | 25.02 |
Class R3 (8/08) | | | | | | | | | | | | | | | | | | | | | | | | | | |
2009(f) | | | 22.05 | | | .23 | | | (6.25 | ) | | | (6.02 | ) | | | (.14 | ) | | | (1.58 | ) | | | (1.72 | ) | | | 14.31 |
Class I (8/96)(e) | | | | | | | | | | | | | | | | | | | | | | | | | | |
2009 | | | 22.64 | | | .33 | | | (6.87 | ) | | | (6.54 | ) | | | (.24 | ) | | | (1.58 | ) | | | (1.82 | ) | | | 14.28 |
2008 | | | 30.18 | | | .39 | | | (3.17 | ) | | | (2.78 | ) | | | (.37 | ) | | | (4.39 | ) | | | (4.76 | ) | | | 22.64 |
2007 | | | 27.33 | | | .43 | | | 5.35 | | | | 5.78 | | | | (.33 | ) | | | (2.60 | ) | | | (2.93 | ) | | | 30.18 |
2006 | | | 25.67 | | | .29 | | | 3.27 | | | | 3.56 | | | | (.30 | ) | | | (1.60 | ) | | | (1.90 | ) | | | 27.33 |
2005 | | | 23.49 | | | .38 | | | 2.14 | | | | 2.52 | | | | (.34 | ) | | | — | | | | (.34 | ) | | | 25.67 |
| | | | | | | | | | | | | | | | | | | | | | | | | |
| | | | | | | | |
| | | | | | | | | | | | | | | | | | | | | | | | | |
| | | | Ratios/Supplemental Data | |
| | | | | | Ratios to Average
Net Assets
Before Credit/
Reimbursement | | | Ratios to Average
Net Assets After
Reimbursement(c) | | | Ratios to Average
Net Assets
After Credit/
Reimbursement(d) | | | | |
Total
Return(b) | | | Ending
Net
Assets
(000) | | Expenses | | | Net
Invest-
ment
Income
(Loss) | | | Expenses | | | Net
Invest-
ment
Income
(Loss) | | | Expenses | | | Net
Invest-
ment
Income
(Loss) | | | Portfolio
Turnover
Rate | |
| | | | | | | | | | | | | | | | | | | | | | | | | |
| (28.95 | )% | | $ | 239,210 | | 1.27 | % | | 1.71 | % | | 1.14 | % | | 1.83 | % | | 1.14 | % | | 1.83 | % | | 85 | % |
| (10.74 | ) | | | 389,240 | | 1.24 | | | 1.20 | | | 1.24 | | | 1.20 | | | 1.24 | | | 1.20 | | | 131 | |
| 21.71 | | | | 491,489 | | 1.25 | | | 1.22 | | | 1.25 | | | 1.22 | | | 1.25 | | | 1.22 | | | 75 | |
| 13.97 | | | | 440,403 | | 1.28 | | | .83 | | | 1.28 | | | .83 | | | 1.28 | | | .83 | | | 81 | |
| 10.51 | | | | 416,407 | | 1.31 | | | 1.31 | | | 1.31 | | | 1.31 | | | 1.31 | | | 1.31 | | | 81 | |
| | | | | | | | | | | | | | | | | | | | | | | | | |
| (29.46 | ) | | | 3,033 | | 2.01 | | | .97 | | | 1.87 | | | 1.10 | | | 1.87 | | | 1.10 | | | 85 | |
| (11.39 | ) | | | 8,891 | | 1.99 | | | .43 | | | 1.99 | | | .43 | | | 1.99 | | | .43 | | | 131 | |
| 20.77 | | | | 18,491 | | 2.00 | | | .44 | | | 2.00 | | | .44 | | | 2.00 | | | .44 | | | 75 | |
| 13.13 | | | | 26,995 | | 2.03 | | | .08 | | | 2.03 | | | .08 | | | 2.03 | | | .08 | | | 81 | |
| 9.66 | | | | 45,224 | | 2.06 | | | .57 | | | 2.06 | | | .57 | | | 2.06 | | | .57 | | | 81 | |
| | | | | | | | | | | | | | | | | | | | | | | | | |
| (29.52 | ) | | | 15,803 | | 2.02 | | | .96 | | | 1.89 | | | 1.08 | | | 1.89 | | | 1.08 | | | 85 | |
| (11.41 | ) | | | 25,007 | | 1.99 | | | .45 | | | 1.99 | | | .45 | | | 1.99 | | | .45 | | | 131 | |
| 20.80 | | | | 31,219 | | 2.00 | | | .47 | | | 2.00 | | | .47 | | | 2.00 | | | .47 | | | 75 | |
| 13.15 | | | | 28,692 | | 2.03 | | | .08 | | | 2.03 | | | .08 | | | 2.03 | | | .08 | | | 81 | |
| 9.63 | | | | 30,691 | | 2.06 | | | .57 | | | 2.06 | | | .57 | | | 2.06 | | | .57 | | | 81 | |
| | | | | | | | | | | | | | | | | | | | | | | | | |
| (27.29 | ) | | | 97 | | 1.53 | * | | 1.55 | * | | 1.45 | * | | 1.63 | * | | 1.45 | * | | 1.63 | * | | 85 | |
| | | | | | | | | | | | | | | | | | | | | | | | | |
| (28.83 | ) | | | 16,604 | | 1.02 | | | 1.95 | | | .89 | | | 2.08 | | | .89 | | | 2.08 | | | 85 | |
| (10.52 | ) | | | 23,684 | | .99 | | | 1.45 | | | .99 | | | 1.45 | | | .99 | | | 1.45 | | | 131 | |
| 22.03 | | | | 31,878 | | 1.00 | | | 1.48 | | | 1.00 | | | 1.48 | | | 1.00 | | | 1.48 | | | 75 | |
| 14.24 | | | | 25,720 | | 1.03 | | | 1.08 | | | 1.03 | | | 1.08 | | | 1.03 | | | 1.08 | | | 81 | |
| 10.77 | | | | 22,350 | | 1.06 | | | 1.56 | | | 1.06 | | | 1.56 | | | 1.06 | | | 1.56 | | | 81 | |
| (a) | Per share Net Investment Income (Loss) is calculated using the average daily shares method. |
| (b) | Total return is the combination of changes in net asset value without any sales charge, reinvested dividend income at net asset value and reinvested capital gains distributions at net asset value, if any. Total returns are not annualized. |
| (c) | After expense reimbursement from the Adviser, where applicable. |
| (d) | After custodian fee credit and expense reimbursement, where applicable. |
| (e) | Effective May 1, 2008, Class R Shares were renamed Class I Shares. |
| (f) | For the period August 4, 2008 (commencement of operations) through June 30, 2009. |
See accompanying notes to financial statements.
Financial Highlights (continued)
| | | | | | | | | | | | | | | | | | | | | | | | | | | | | | | | | | |
| Selected data for a share outstanding throughout each period: | | | | | | | | | | | | | | | |
| | | | | | | |
| Class (Commencement Date) | | | | | | | | | | | | | | | | | | | | | |
| | | | | Investment Operations | | | Less Distributions | | | |
| | | | | | | | |
| MULTI-CAP VALUE | | | | | | | | | | | | | | | | | | | | | | | |
Year Ended
June 30, | | Beginning
Net
Asset
Value | | Net
Invest-
ment
Income
(Loss)(a) | | | Net
Realized/
Unrealized
Gain
(Loss) | | | Total | | | Net
Invest-
ment
Income | | | Capital
Gains | | | Tax
Return
of
Capital | | | Total | | | Ending
Net
Asset
Value |
Class A (12/02) | | | | | | | | | | | | | | | | | | | | | | | | | | | | | | | | | | |
2009 | | $ | 18.54 | | $ | .04 | | | $ | (6.36 | ) | | $ | (6.32 | ) | | $ | — | | | $ | — | | | $ | — | | | $ | — | | | $ | 12.22 |
2008 | | | 26.15 | | | .04 | | | | (6.62 | ) | | | (6.58 | ) | | | (.02 | ) | | | (.94 | ) | | | (.07 | ) | | | (1.03 | ) | | | 18.54 |
2007 | | | 23.81 | | | .18 | | | | 3.43 | | | | 3.61 | | | | (.13 | ) | | | (1.14 | ) | | | — | | | | (1.27 | ) | | | 26.15 |
2006 | | | 20.60 | | | .15 | | | | 3.42 | | | | 3.57 | | | | (.06 | ) | | | (.30 | ) | | | — | | | | (.36 | ) | | | 23.81 |
2005 | | | 18.56 | | | .11 | | | | 2.15 | | | | 2.26 | | | | (.05 | ) | | | (.17 | ) | | | — | | | | (.22 | ) | | | 20.60 |
Class B (12/02) | | | | | | | | | | | | | | | | | | | | | | | | | | | | | | | | | | |
2009 | | | 18.10 | | | (.06 | ) | | | (6.20 | ) | | | (6.26 | ) | | | — | | | | — | | | | — | | | | — | | | | 11.84 |
2008 | | | 25.64 | | | (.13 | ) | | | (6.47 | ) | | | (6.60 | ) | | | — | | | | (.94 | ) | | | — | | | | (.94 | ) | | | 18.10 |
2007 | | | 23.42 | | | (.01 | ) | | | 3.37 | | | | 3.36 | | | | — | | | | (1.14 | ) | | | — | | | | (1.14 | ) | | | 25.64 |
2006 | | | 20.37 | | | (.02 | ) | | | 3.37 | | | | 3.35 | | | | — | | | | (.30 | ) | | | — | | | | (.30 | ) | | | 23.42 |
2005 | | | 18.45 | | | (.04 | ) | | | 2.13 | | | | 2.09 | | | | — | | | | (.17 | ) | | | — | | | | (.17 | ) | | | 20.37 |
Class C (12/02) | | | | | | | | | | | | | | | | | | | | | | | | | | | | | | | | | | |
2009 | | | 18.10 | | | (.06 | ) | | | (6.20 | ) | | | (6.26 | ) | | | — | | | | — | | | | — | | | | — | | | | 11.84 |
2008 | | | 25.64 | | | (.13 | ) | | | (6.47 | ) | | | (6.60 | ) | | | — | | | | (.94 | ) | | | — | | | | (.94 | ) | | | 18.10 |
2007 | | | 23.42 | | | (.01 | ) | | | 3.37 | | | | 3.36 | | | | — | | | | (1.14 | ) | | | — | | | | (1.14 | ) | | | 25.64 |
2006 | | | 20.37 | | | (.02 | ) | | | 3.37 | | | | 3.35 | | | | — | | | | (.30 | ) | | | — | | | | (.30 | ) | | | 23.42 |
2005 | | | 18.45 | | | (.04 | ) | | | 2.13 | | | | 2.09 | | | | — | | | | (.17 | ) | | | — | | | | (.17 | ) | | | 20.37 |
Class R3 (8/08) | | | | | | | | | | | | | | | | | | | | | | | | | | | | | | | | | | |
2009(f) | | | 17.60 | | | .01 | | | | (5.45 | ) | | | (5.44 | ) | | | — | | | | — | | | | — | | | | — | | | | 12.16 |
Class I (11/97)(e) | | | | | | | | | | | | | | | | | | | | | | | | | | | | | | | | | | |
2009 | | | 18.50 | | | .07 | | | | (6.35 | ) | | | (6.28 | ) | | | — | | | | — | | | | — | | | | — | | | | 12.22 |
2008 | | | 26.09 | | | .09 | | | | (6.59 | ) | | | (6.50 | ) | | | (.02 | ) | | | (.94 | ) | | | (.13 | ) | | | (1.09 | ) | | | 18.50 |
2007 | | | 23.76 | | | .24 | | | | 3.42 | | | | 3.66 | | | | (.19 | ) | | | (1.14 | ) | | | — | | | | (1.33 | ) | | | 26.09 |
2006 | | | 20.55 | | | .20 | | | | 3.42 | | | | 3.62 | | | | (.11 | ) | | | (.30 | ) | | | — | | | | (.41 | ) | | | 23.76 |
2005 | | | 18.52 | | | .15 | | | | 2.15 | | | | 2.30 | | | | (.10 | ) | | | (.17 | ) | | | — | | | | (.27 | ) | | | 20.55 |
| | | | | | | | | | | | | | | | | | | | | | | | | |
| | | | | | | | | | | | | | | | | | | | | | | | | |
| |
| | | | Ratios/Supplemental Data | |
| | | | | | Ratios to Average
Net Assets
Before Credit/
Reimbursement | | | Ratios to Average
Net Assets After
Reimbursement(c) | | | Ratios to Average
Net Assets
After Credit/
Reimbursement(d) | | | | |
Total
Return(b) | | | Ending
Net
Assets
(000) | | Expenses | | | Net
Invest-
ment
Income
(Loss) | | | Expenses | | | Net
Invest-
ment
Income
(Loss) | | | Expenses | | | Net
Invest-
ment
Income
(Loss) | | | Portfolio
Turnover
Rate | |
| | | | | | | | | | | | | | | | | | | | | | | | | |
| (34.12 | )% | | $ | 76,785 | | 1.50 | % | | .27 | % | | 1.50 | % | | .27 | % | | 1.50 | % | | .27 | % | | 32 | % |
| (25.65 | ) | | | 293,777 | | 1.33 | | | .17 | | | 1.33 | | | .17 | | | 1.33 | | | .17 | | | 25 | |
| 15.51 | | | | 634,123 | | 1.24 | | | .71 | | | 1.24 | | | .71 | | | 1.24 | | | .71 | | | 19 | |
| 17.45 | | | | 409,788 | | 1.33 | | | .65 | | | 1.33 | | | .65 | | | 1.33 | | | .65 | | | 9 | |
| 12.20 | | | | 179,548 | | 1.36 | | | .54 | | | 1.36 | | | .54 | | | 1.36 | | | .54 | | | 14 | |
| | | | | | | | | | | | | | | | | | | | | | | | | |
| (34.62 | ) | | | 16,599 | | 2.28 | | | (.46 | ) | | 2.28 | | | (.46 | ) | | 2.28 | | | (.46 | ) | | 32 | |
| (26.20 | ) | | | 36,024 | | 2.08 | | | (.59 | ) | | 2.08 | | | (.59 | ) | | 2.08 | | | (.59 | ) | | 25 | |
| 14.65 | | | | 75,067 | | 2.00 | | | (.04 | ) | | 2.00 | | | (.04 | ) | | 2.00 | | | (.04 | ) | | 19 | |
| 16.57 | | | | 58,423 | | 2.08 | | | (.10 | ) | | 2.08 | | | (.10 | ) | | 2.08 | | | (.10 | ) | | 9 | |
| 11.35 | | | | 33,216 | | 2.10 | | | (.20 | ) | | 2.10 | | | (.20 | ) | | 2.10 | | | (.20 | ) | | 14 | |
| | | | | | | | | | | | | | | | | | | | | | | | | |
| (34.62 | ) | | | 78,225 | | 2.27 | | | (.46 | ) | | 2.27 | | | (.46 | ) | | 2.27 | | | (.46 | ) | | 32 | |
| (26.20 | ) | | | 189,475 | | 2.08 | | | (.58 | ) | | 2.08 | | | (.58 | ) | | 2.08 | | | (.58 | ) | | 25 | |
| 14.64 | | | | 441,048 | | 1.99 | | | (.04 | ) | | 1.99 | | | (.04 | ) | | 1.99 | | | (.04 | ) | | 19 | |
| 16.57 | | | | 308,339 | | 2.08 | | | (.10 | ) | | 2.08 | | | (.10 | ) | | 2.08 | | | (.10 | ) | | 9 | |
| 11.35 | | | | 128,758 | | 2.11 | | | (.21 | ) | | 2.11 | | | (.21 | ) | | 2.10 | | | (.21 | ) | | 14 | |
| | | | | | | | | | | | | | | | | | | | | | | | | |
| (30.91 | ) | | | 104 | | 1.81 | * | | .12 | * | | 1.81 | * | | .12 | * | | 1.81 | * | | .12 | * | | 32 | |
| | | | | | | | | | | | | | | | | | | | | | | | | |
| (33.95 | ) | | | 227,320 | | 1.29 | | | .55 | | | 1.29 | | | .55 | | | 1.29 | | | .55 | | | 32 | |
| (25.47 | ) | | | 274,886 | | 1.09 | | | .39 | | | 1.09 | | | .39 | | | 1.09 | | | .39 | | | 25 | |
| 15.77 | | | | 350,370 | | .99 | | | .96 | | | .99 | | | .96 | | | .99 | | | .96 | | | 19 | |
| 17.77 | | | | 212,033 | | 1.09 | | | .90 | | | 1.09 | | | .90 | | | 1.09 | | | .90 | | | 9 | |
| 12.43 | | | | 82,413 | | 1.10 | | | .78 | | | 1.10 | | | .78 | | | 1.10 | | | .78 | | | 14 | |
| (a) | Per share Net Investment Income (Loss) is calculated using the average daily shares method. |
| (b) | Total return is the combination of changes in net asset value without any sales charge, reinvested dividend income at net asset value and reinvested capital gains distributions at net asset value, if any. Total returns are not annualized. |
| (c) | After expense reimbursement from the Adviser, where applicable. |
| (d) | After custodian fee credit and expense reimbursement, where applicable. |
| (e) | Effective May 1, 2008, Class R Shares were renamed Class I Shares. |
| (f) | For the period August 4, 2008 (commencement of operations) through June 30, 2009. |
See accompanying notes to financial statements.
Financial Highlights (continued)
| | | | | | | | | | | | | | | | | | | | | | | | | | | | | | |
| Selected data for a share outstanding throughout each period: | | | | | | | | | | | | | | | |
| | | | | | |
| Class (Commencement Date) | | | | | | | | | | | | | | | | | | |
| | | | | Investment Operations | | | Less Distributions | | | |
| | | | | | | |
| LARGE-CAP VALUE | | | | | | | | | | | | | | | | | | | | |
Year Ended
June 30, | | Beginning
Net
Asset
Value | | Net
Invest-
ment
Income (Loss)(a) | | | Net
Realized/
Unrealized
Gain (Loss) | | | Total | | | Net
Invest-
ment
Income | | | Capital
Gains | | | Total | | | Ending
Net
Asset
Value |
Class A (12/06) | | | | | | | | | | | | | | | | | | | | | | | | | | | |
2009 | | $ | 17.41 | | $ | .10 | | | $ | (4.73 | ) | | $ | (4.63 | ) | | $ | (.07 | ) | | $ | — | | | $ | (.07 | ) | | $ | 12.71 |
2008 | | | 21.38 | | | .15 | | | | (4.04 | ) | | | (3.89 | ) | | | (.08 | ) | | | — | ** | | | (.08 | ) | | | 17.41 |
2007(e) | | | 20.00 | | | .12 | | | | 1.26 | | | | 1.38 | | | | — | | | | — | | | | — | | | | 21.38 |
Class B (12/06) | | | | | | | | | | | | | | | | | | | | | | | | | | | |
2009 | | | 17.28 | | | — | ** | | | (4.68 | ) | | | (4.68 | ) | | | — | | | | — | | | | — | | | | 12.60 |
2008 | | | 21.30 | | | — | ** | | | (4.02 | ) | | | (4.02 | ) | | | — | | | | — | ** | | | — | ** | | | 17.28 |
2007(e) | | | 20.00 | | | — | ** | | | 1.30 | | | | 1.30 | | | | — | | | | — | | | | — | | | | 21.30 |
Class C (12/06) | | | | | | | | | | | | | | | | | | | | | | | | | | | |
2009 | | | 17.28 | | | — | ** | | | (4.68 | ) | | | (4.68 | ) | | | — | | | | — | | | | — | | | | 12.60 |
2008 | | | 21.30 | | | — | ** | | | (4.02 | ) | | | (4.02 | ) | | | — | | | | — | ** | | | — | ** | | | 17.28 |
2007(e) | | | 20.00 | | | .02 | | | | 1.28 | | | | 1.30 | | | | — | | | | — | | | | — | | | | 21.30 |
Class I (12/06)(f) | | | | | | | | | | | | | | | | | | | | | | | | | | | |
2009 | | | 17.43 | | | .12 | | | | (4.72 | ) | | | (4.60 | ) | | | (.11 | ) | | | — | | | | (.11 | ) | | | 12.72 |
2008 | | | 21.41 | | | .20 | | | | (4.05 | ) | | | (3.85 | ) | | | (.13 | ) | | | — | ** | | | (.13 | ) | | | 17.43 |
2007(e) | | | 20.00 | | | .15 | | | | 1.26 | | | | 1.41 | | | | — | | | | — | | | | — | | | | 21.41 |
| | | | | | | | | | | | | | | | | | | | | | | | | |
| | | | | | | | |
| | | | | | | | | | | | | | | | | | | | | | | | | |
| | | | Ratios/Supplemental Data | |
| | | | | | Ratios to Average
Net Assets
Before Credit/
Reimbursement | | | Ratios to Average
Net Assets After
Reimbursement(c) | | | Ratios to Average
Net Assets
After Credit/
Reimbursement(d) | | | | |
Total
Return(b) | | | Ending
Net
Assets
(000) | | Expenses | | | Net
Invest-
ment
Income
(Loss) | | | Expenses | | | Net
Invest-
ment
Income
(Loss) | | | Expenses | | | Net
Invest-
ment
Income
(Loss) | | | Portfolio
Turnover
Rate | |
| | | | | | | | | | | | | | | | | | | | | | | | | |
| (26.57 | )% | | $ | 6,075 | | 1.61 | % | | .49 | % | | 1.35 | % | | .76 | % | | 1.35 | % | | .76 | % | | 16 | % |
| (18.24 | ) | | | 5,080 | | 1.66 | | | .45 | | | 1.33 | | | .77 | | | 1.33 | | | .78 | | | 13 | |
| 6.90 | | | | 2,358 | | 3.12 | * | | (.84 | )* | | 1.33 | * | | .95 | * | | 1.26 | * | | 1.02 | * | | — | |
| | | | | | | | | | | | | | | | | | | | | | | | | |
| (27.13 | ) | | | 405 | | 2.35 | | | (.22 | ) | | 2.10 | | | .03 | | | 2.10 | | | .03 | | | 16 | |
| (18.82 | ) | | | 835 | | 2.43 | | | (.34 | ) | | 2.08 | | | — | *** | | 2.08 | | | .01 | | | 13 | |
| 6.50 | | | | 281 | | 4.68 | * | | (2.66 | )* | | 2.08 | * | | (.06 | )* | | 2.01 | * | | .01 | * | | — | |
| | | | | | | | | | | | | | | | | | | | | | | | | |
| (27.13 | ) | | | 2,217 | | 2.37 | | | (.25 | ) | | 2.10 | | | .02 | | | 2.10 | | | .02 | | | 16 | |
| (18.82 | ) | | | 2,484 | | 2.42 | | | (.33 | ) | | 2.08 | | | — | *** | | 2.08 | | | — | *** | | 13 | |
| 6.50 | | | | 1,117 | | 3.83 | * | | (1.62 | )* | | 2.08 | * | | .13 | * | | 2.01 | * | | .20 | * | | — | |
| | | | | | | | | | | | | | | | | | | | | | | | | |
| (26.35 | ) | | | 52,618 | | 1.36 | | | .71 | | | 1.10 | | | .97 | | | 1.10 | | | .97 | | | 16 | |
| (18.05 | ) | | | 15,719 | | 1.40 | | | .71 | | | 1.08 | | | 1.02 | | | 1.08 | | | 1.02 | | | 13 | |
| 7.05 | | | | 8,513 | | 2.65 | * | | (.32 | )* | | 1.08 | * | | 1.25 | * | | 1.01 | * | | 1.32 | * | | — | |
| ** | Rounds to less than $.01 per share. |
| *** | Rounds to less than .01%. |
| (a) | Per share Net Investment Income (Loss) is calculated using the average daily shares method. |
| (b) | Total return is the combination of changes in net asset value without any sales charge, reinvested dividend income at net asset value and reinvested capital gains distributions at net asset value, if any. Total returns are not annualized. |
| (c) | After expense reimbursement from the Adviser, where applicable. |
| (d) | After custodian fee credit and expense reimbursement, where applicable. |
| (e) | For the period December 15, 2006 (commencement of operations) through June 30, 2007. |
| (f) | Effective May 1, 2008, Class R Shares were renamed Class I Shares. |
See accompanying notes to financial statements.
Financial Highlights (continued)
| | | | | | | | | | | | | | | | | | | | | | | | | | | | | |
| Selected data for a share outstanding throughout each period: | | | | | | | | | | | | | | |
| | | | | | |
| Class (Commencement Date) | | | | | | | | | | | | | | | | | |
| | | | | Investment Operations | | | Less Distributions | | | |
| | | | | | | |
| SMALL/MID-CAP VALUE | | | | | | | | | | | | | | | | | | | |
Year Ended
June 30, | | Beginning
Net
Asset
Value | | Net
Invest-
ment
Income
(Loss)(a) | | | Net
Realized/
Unrealized
Gain (Loss) | | | Total | | | Net
Invest-
ment
Income | | | Capital
Gains | | Total | | | Ending
Net
Asset
Value |
Class A (12/06) | | | | | | | | | | | | | | | | | | | | | | | | | | |
2009 | | $ | 17.12 | | $ | — | ** | | $ | (6.07 | ) | | $ | (6.07 | ) | | $ | — | | | $ | — | | $ | — | | | $ | 11.05 |
2008 | | | 21.37 | | | (.09 | ) | | | (4.16 | ) | | | (4.25 | ) | | | — | ** | | | — | | | — | ** | | | 17.12 |
2007(e) | | | 20.00 | | | .15 | | | | 1.22 | | | | 1.37 | | | | — | | | | — | | | — | | | | 21.37 |
Class B (12/06) | | | | | | | | | | | | | | | | | | | | | | | | | | |
2009 | | | 16.90 | | | (.06 | ) | | | (6.02 | ) | | | (6.08 | ) | | | — | | | | — | | | — | | | | 10.82 |
2008 | | | 21.29 | | | (.22 | ) | | | (4.17 | ) | | | (4.39 | ) | | | — | | | | — | | | — | | | | 16.90 |
2007(e) | | | 20.00 | | | .02 | | | | 1.27 | | | | 1.29 | | | | — | | | | — | | | — | | | | 21.29 |
Class C (12/06) | | | | | | | | | | | | | | | | | | | | | | | | | | |
2009 | | | 16.92 | | | (.07 | ) | | | (6.02 | ) | | | (6.09 | ) | | | — | | | | — | | | — | | | | 10.83 |
2008 | | | 21.28 | | | (.22 | ) | | | (4.14 | ) | | | (4.36 | ) | | | — | | | | — | | | — | | | | 16.92 |
2007(e) | | | 20.00 | | | .05 | | | | 1.23 | | | | 1.28 | | | | — | | | | — | | | — | | | | 21.28 |
Class I (12/06)(f) | | | | | | | | | | | | | | | | | | | | | | | | | | |
2009 | | | 17.11 | | | (.01 | ) | | | (6.14 | ) | | | (6.15 | ) | | | — | | | | — | | | — | | | | 10.96 |
2008 | | | 21.41 | | | (.04 | ) | | | (4.21 | ) | | | (4.25 | ) | | | (.05 | ) | | | — | | | (.05 | ) | | | 17.11 |
2007(e) | | | 20.00 | | | .49 | | | | .92 | | | | 1.41 | | | | — | | | | — | | | — | | | | 21.41 |
| | | | | | | | | | | | | | | | | | | | | | | | | |
| | | | | | | | | | | | | | | | | | | | | | | | | |
| |
| | | | Ratios/Supplemental Data | |
| | | | | | Ratios to Average
Net Assets
Before Credit/
Reimbursement | | | Ratios to Average
Net Assets After
Reimbursement(c) | | | Ratios to Average
Net Assets
After Credit/
Reimbursement(d) | | | | |
Total
Return(b) | | | Ending
Net
Assets
(000) | | Expenses | | | Net
Invest-
ment
Income
(Loss) | | | Expenses | | | Net
Invest-
ment
Income
(Loss) | | | Expenses | | | Net
Invest-
ment
Income
(Loss) | | | Portfolio
Turnover
Rate | |
| | | | | | | | | | | | | | | | | | | | | | | | | |
| (35.34 | )% | | $ | 1,382 | | 3.03 | % | | (1.60 | )% | | 1.45 | % | | (.02 | )% | | 1.45 | % | | (.02 | )% | | 204 | % |
| (20.02 | )*** | | | 3,595 | | 1.65 | | | (.70 | ) | | 1.43 | | | (.49 | ) | | 1.43 | | | (.48 | ) | | 84 | |
| 6.85 | | | | 1,098 | | 2.54 | * | | .23 | * | | 1.43 | * | | 1.34 | * | | 1.41 | * | | 1.36 | * | | 1 | |
| | | | | | | | | | | | | | | | | | | | | | | | | |
| (35.98 | ) | | | 34 | | 4.25 | | | (2.59 | ) | | 2.20 | | | (.54 | ) | | 2.20 | | | (.54 | ) | | 204 | |
| (20.62 | )*** | | | 36 | | 2.12 | | | (1.17 | ) | | 2.12 | | | (1.17 | ) | | 2.11 | | | (1.16 | ) | | 84 | |
| 6.45 | | | | 279 | | 4.09 | * | | (1.70 | )* | | 2.19 | * | | .20 | * | | 2.17 | * | | .22 | * | | 1 | |
| | | | | | | | | | | | | | | | | | | | | | | | | |
| (35.88 | ) | | | 610 | | 4.11 | | | (2.50 | ) | | 2.20 | | | (.59 | ) | | 2.20 | | | (.59 | ) | | 204 | |
| (20.63 | )*** | | | 1,093 | | 2.39 | | | (1.40 | ) | | 2.18 | | | (1.20 | ) | | 2.18 | | | (1.19 | ) | | 84 | |
| 6.40 | | | | 974 | | 3.22 | * | | (.65 | )* | | 2.18 | * | | .39 | * | | 2.16 | * | | .41 | * | | 1 | |
| | | | | | | | | | | | | | | | | | | | | | | | | |
| (35.98 | ) | | | 3,792 | | 1.44 | | | (.33 | ) | | 1.20 | | | (.08 | ) | | 1.20 | | | (.08 | ) | | 204 | |
| (19.82 | )*** | | | 38,574 | | 1.16 | | | (.20 | ) | | 1.16 | | | (.20 | ) | | 1.15 | | | (.19 | ) | | 84 | |
| 7.05 | | | | 216,872 | | 1.49 | * | | 3.93 | * | | 1.16 | * | | 4.25 | * | | 1.15 | * | | 4.27 | * | | 1 | |
| ** | Rounds to less than $.01 per share. |
| *** | During the fiscal year ended June 30, 2008, the Adviser reimbursed the Fund $89,561 for a cash balance maintained in the Fund. This reimbursement resulted in an increase of .23%, .28%, .19% and .14% to classes A, B, C and I, respectively. |
| (a) | Per share Net Investment Income (Loss) is calculated using the average daily shares method. |
| (b) | Total return is the combination of changes in net asset value without any sales charge, reinvested dividend income at net asset value and reinvested capital gains distributions at net asset value, if any. Total returns are not annualized. |
| (c) | After expense reimbursement from the Adviser, where applicable. |
| (d) | After custodian fee credit and expense reimbursement, where applicable. |
| (e) | For the period December 15, 2006 (commencement of operations) through June 30, 2007. |
| (f) | Effective May 1, 2008, Class R Shares were renamed Class I Shares. |
See accompanying notes to financial statements.
Financial Highlights (continued)
| | | | | | | | | | | | | | | | | | | | | | | | | | | | | | | | | | |
| Selected data for a share outstanding throughout each period: | | | | | | | | | | | | | | | |
| | | | | | | |
| Class (Commencement Date) | | | | | | | | | | | | | | | | | | | | | |
| | | | | Investment Operations | | | Less Distributions | | | |
| | | | | | | | |
| SMALL-CAP VALUE | | | | | | | | | | | | | | | | | | | | | | | |
Year Ended
June 30, | | Beginning
Net
Asset
Value | | Net
Invest-
ment
Income
(Loss)(a) | | | Net
Realized/
Unrealized
Gain
(Loss) | | | Total | | | Net
Invest-
ment
Income | | | Capital
Gains | | | Tax
Return
of
Capital | | | Total | | | Ending
Net
Asset
Value |
Class A (12/04) | | | | | | | | | | | | | | | | | | | | | | | | | | | | | | | |
2009 | | $ | 23.29 | | $ | .02 | | | $ | (9.17 | ) | | $ | (9.15 | ) | | $ | — | | | $ | — | | | $ | — | | | $ | — | | | $ | 14.14 |
2008 | | | 30.12 | | | (.04 | ) | | | (6.08 | ) | | | (6.12 | ) | | | (.02 | ) | | | (.69 | ) | | | — | ** | | | (.71 | ) | | | 23.29 |
2007 | | | 26.10 | | | .13 | | | | 4.05 | | | | 4.18 | | | | (.04 | ) | | | (.12 | ) | | | — | | | | (.16 | ) | | | 30.12 |
2006 | | | 20.84 | | | .13 | | | | 5.48 | | | | 5.61 | | | | (.08 | ) | | | (.27 | ) | | | — | | | | (.35 | ) | | | 26.10 |
2005(e) | | | 20.00 | | | .05 | | | | .79 | | | | .84 | | | | — | | | | — | | | | — | | | | — | | | | 20.84 |
Class B (12/04) | | | | | | | | | | | | | | | | | | | | | | | | | | | | | | | |
2009 | | | 22.80 | | | (.11 | ) | | | (8.95 | ) | | | (9.06 | ) | | | — | | | | — | | | | — | | | | — | | | | 13.74 |
2008 | | | 29.69 | | | (.23 | ) | | | (5.97 | ) | | | (6.20 | ) | | | — | | | | (.69 | ) | | | — | | | | (.69 | ) | | | 22.80 |
2007 | | | 25.89 | | | (.08 | ) | | | 4.00 | | | | 3.92 | | | | — | | | | (.12 | ) | | | — | | | | (.12 | ) | | | 29.69 |
2006 | | | 20.76 | | | (.07 | ) | | | 5.47 | | | | 5.40 | | | | — | | | | (.27 | ) | | | — | | | | (.27 | ) | | | 25.89 |
2005(e) | | | 20.00 | | | (.03 | ) | | | .79 | | | | .76 | | | | — | | | | — | | | | — | | | | — | | | | 20.76 |
Class C (12/04) | | | | | | | | | | | | | | | | | | | | | | | | | | | | | | | |
2009 | | | 22.83 | | | (.11 | ) | | | (8.96 | ) | | | (9.07 | ) | | | — | | | | — | | | | — | | | | — | | | | 13.76 |
2008 | | | 29.73 | | | (.23 | ) | | | (5.98 | ) | | | (6.21 | ) | | | — | | | | (.69 | ) | | | — | | | | (.69 | ) | | | 22.83 |
2007 | | | 25.91 | | | (.08 | ) | | | 4.02 | | | | 3.94 | | | | — | | | | (.12 | ) | | | — | | | | (.12 | ) | | | 29.73 |
2006 | | | 20.76 | | | (.07 | ) | | | 5.49 | | | | 5.42 | | | | — | | | | (.27 | ) | | | — | | | | (.27 | ) | | | 25.91 |
2005(e) | | | 20.00 | | | (.03 | ) | | | .79 | | | | .76 | | | | — | | | | — | | | | — | | | | — | | | | 20.76 |
Class I (12/04)(f) | | | | | | | | | | | | | | | | | | | | | | | | | | | | | | | |
2009 | | | 23.34 | | | .05 | | | | (9.18 | ) | | | (9.13 | ) | | | — | | | | — | | | | — | | | | — | | | | 14.21 |
2008 | | | 30.18 | | | .02 | | | | (6.08 | ) | | | (6.06 | ) | | | (.08 | ) | | | (.69 | ) | | | (.01 | ) | | | (.78 | ) | | | 23.34 |
2007 | | | 26.15 | | | .23 | | | | 4.03 | | | | 4.26 | | | | (.11 | ) | | | (.12 | ) | | | — | | | | (.23 | ) | | | 30.18 |
2006 | | | 20.87 | | | .16 | | | | 5.52 | | | | 5.68 | | | | (.13 | ) | | | (.27 | ) | | | — | | | | (.40 | ) | | | 26.15 |
2005(e) | | | 20.00 | | | .08 | | | | .79 | | | | .87 | | | | — | | | | — | | | | — | | | | — | | | | 20.87 |
| | | | | | | | | | | | | | | | | | | | | | | | | |
| | | | | | | | | | | | | | | | | | | | | | | | | |
| |
| | | | Ratios/Supplemental Data | |
| | | | | |
| | | | | | Ratios to Average
Net Assets
Before Credit/
Reimbursement | | | Ratios to Average
Net Assets After
Reimbursement(c) | | | Ratios to Average
Net Assets
After Credit/
Reimbursement(d) | | | | |
Total
Return(b) | | | Ending
Net
Assets
(000) | | Expenses | | | Net
Invest-
ment
Income
(Loss) | | | Expenses | | | Net
Invest-
ment
Income
(Loss) | | | Expenses | | | Net
Invest-
ment
Income
(Loss) | | | Portfolio
Turnover
Rate | |
| | | | | | | | | | | | | | | | | | | | | | | | | |
| (39.29 | )% | | $ | 7,733 | | 1.46 | % | | .13 | % | | 1.46 | % | | .13 | % | | 1.46 | % | | .13 | % | | 71 | % |
| (20.41 | ) | | | 54,264 | | 1.47 | | | (0.16 | ) | | 1.47 | | | (0.16 | ) | | 1.47 | | | (.16 | ) | | 48 | |
| 16.09 | | | | 78,081 | | 1.50 | | | .44 | | | 1.49 | | | .46 | | | 1.49 | | | .46 | | | 24 | |
| 27.08 | *** | | | 33,907 | | 1.95 | | | (.02 | ) | | 1.42 | | | .51 | | | 1.40 | | | .53 | | | 26 | |
| 4.20 | | | | 3 | | 2.85 | * | | (.96 | )* | | 1.49 | * | | .40 | * | | 1.42 | * | | .47 | * | | 22 | |
| | | | | | | | | | | | | | | | | | | | | | | | | |
| (39.71 | ) | | | 173 | | 2.23 | | | (.69 | ) | | 2.23 | | | (.69 | ) | | 2.23 | | | (.69 | ) | | 71 | |
| (21.02 | ) | | | 374 | | 2.22 | | | (.89 | ) | | 2.22 | | | (.89 | ) | | 2.22 | | | (.89 | ) | | 48 | |
| 15.15 | | | | 833 | | 2.25 | | | (.31 | ) | | 2.24 | | | (.30 | ) | | 2.24 | | | (.30 | ) | | 24 | |
| 26.17 | *** | | | 370 | | 2.75 | | | (.91 | ) | | 2.16 | | | (.33 | ) | | 2.14 | | | (.31 | ) | | 26 | |
| 3.80 | | | | 3 | | 3.60 | * | | (1.70 | )* | | 2.24 | * | | (.35 | )* | | 2.17 | * | | (.28 | )* | | 22 | |
| | | | | | | | | | | | | | | | | | | | | | | | | |
| (39.70 | ) | | | 3,446 | | 2.23 | | | (.70 | ) | | 2.23 | | | (.70 | ) | | 2.23 | | | (.70 | ) | | 71 | |
| (21.03 | ) | | | 9,682 | | 2.22 | | | (.91 | ) | | 2.22 | | | (.91 | ) | | 2.22 | | | (.91 | ) | | 48 | |
| 15.26 | | | | 17,290 | | 2.25 | | | (.31 | ) | | 2.24 | | | (.30 | ) | | 2.24 | | | (.30 | ) | | 24 | |
| 26.22 | *** | | | 7,244 | | 2.73 | | | (.86 | ) | | 2.17 | | | (.30 | ) | | 2.15 | | | (.28 | ) | | 26 | |
| 3.80 | | | | 3 | | 3.60 | * | | (1.70 | )* | | 2.24 | * | | (.35 | )* | | 2.17 | * | | (.28 | )* | | 22 | |
| | | | | | | | | | | | | | | | | | | | | | | | | |
| (39.12 | ) | | | 62,423 | | 1.24 | | | .29 | | | 1.24 | | | .29 | | | 1.24 | | | .29 | | | 71 | |
| (20.22 | ) | | | 108,064 | | 1.22 | | | .08 | | | 1.22 | | | .08 | | | 1.22 | | | .08 | | | 48 | |
| 16.41 | | | | 132,385 | | 1.22 | | | .81 | | | 1.22 | | | .81 | | | 1.22 | | | .81 | | | 24 | |
| 27.41 | *** | | | 13,137 | | 1.73 | | | .07 | | | 1.17 | | | .63 | | | 1.15 | | | .65 | | | 26 | |
| 4.35 | | | | 2,079 | | 2.61 | * | | (.72 | )* | | 1.25 | * | | .64 | * | | 1.17 | * | | .72 | * | | 22 | |
| ** | Rounds to less than $.01 per share. |
| *** | During the fiscal year ended June 30, 2006, NWQ reimbursed Small-Cap Value $9,060 for a cash balance maintained in the Fund. This reimbursement did not have an impact on the Fund’s Class A total return, but resulted in an increase of .05% in each of the total returns for Classes B, C and I. |
| (a) | Per share Net Investment Income (Loss) is calculated using the average daily shares method. |
| (b) | Total return is the combination of changes in net asset value without any sales charge, reinvested dividend income at net asset value and reinvested capital gains distributions at net asset value, if any. Total returns are not annualized. |
| (c) | After expense reimbursement from the Adviser, where applicable. |
| (d) | After custodian fee credit and expense reimbursement, where applicable. |
| (e) | For the period December 9, 2004 (commencement of operations) through June 30, 2005. |
| (f) | Effective May 1, 2008, Class R Shares were renamed Class I Shares. |
See accompanying notes to financial statements.
Financial Highlights (continued)
| | | | | | | | | | | | | | | | | | | | | | | | | | | | | | |
| Selected data for a share outstanding throughout each period: | | | | | | | | | | | | |
| | | | | | | |
| Class (Inception Date) | | | | | | | | | | | | | | | | | | | | |
| | | | | Investment Operations
| | | Less Distributions | | | |
| | | | | |
| VALUE OPPORTUNITIES | | | | | | | | | | | | | | | |
Year Ended
June 30, | | Beginning
Net
Asset
Value | | Net
Invest-
ment
Income
(Loss)(a) | | | Net
Realized/
Unrealized
Gain (Loss) | | | Total | | | Net
Invest-
ment
Income | | | Capital
Gains | | | Total | | | Ending
Net
Asset
Value |
Class A (12/04) | | | | | | | | | | | | | | | | | | | | | | | | | | | |
2009 | | $ | 29.60 | | $ | .20 | | | $ | (4.53 | ) | | $ | (4.33 | ) | | $ | (.05 | ) | | $ | (1.05 | ) | | $ | (1.10 | ) | | $ | 24.17 |
2008 | | | 32.48 | | | .20 | | | | (1.03 | ) | | | (.83 | ) | | | (.59 | ) | | | (1.46 | ) | | | (2.05 | ) | | | 29.60 |
2007 | | | 26.90 | | | .30 | | | | 5.83 | | | | 6.13 | | | | (.29 | ) | | | (.26 | ) | | | (.55 | ) | | | 32.48 |
2006 | | | 21.07 | | | .28 | | | | 5.88 | | | | 6.16 | | | | (.07 | ) | | | (.26 | ) | | | (.33 | ) | | | 26.90 |
2005(e) | | | 20.00 | | | .08 | | | | .99 | | | | 1.07 | | | | — | | | | — | | | | — | | | | 21.07 |
Class B (12/04) | | | | | | | | | | | | | | | | | | | | | | | | | | | |
2009 | | | 29.29 | | | .03 | | | | (4.49 | ) | | | (4.46 | ) | | | — | | | | (1.05 | ) | | | (1.05 | ) | | | 23.78 |
2008 | | | 32.15 | | | (.03 | ) | | | (1.02 | ) | | | (1.05 | ) | | | (.35 | ) | | | (1.46 | ) | | | (1.81 | ) | | | 29.29 |
2007 | | | 26.66 | | | .07 | | | | 5.76 | | | | 5.83 | | | | (.08 | ) | | | (.26 | ) | | | (.34 | ) | | | 32.15 |
2006 | | | 20.98 | | | .09 | | | | 5.85 | | | | 5.94 | | | | — | | | | (.26 | ) | | | (.26 | ) | | | 26.66 |
2005(e) | | | 20.00 | | | — | | | | .98 | | | | .98 | | | | — | | | | — | | | | — | | | | 20.98 |
Class C (12/04) | | | | | | | | | | | | | | | | | | | | | | | | | | | |
2009 | | | 29.29 | | | .03 | | | | (4.50 | ) | | | (4.47 | ) | | | — | | | | (1.05 | ) | | | (1.05 | ) | | | 23.77 |
2008 | | | 32.16 | | | (.03 | ) | | | (1.03 | ) | | | (1.06 | ) | | | (.35 | ) | | | (1.46 | ) | | | (1.81 | ) | | | 29.29 |
2007 | | | 26.66 | | | .07 | | | | 5.77 | | | | 5.84 | | | | (.08 | ) | | | (.26 | ) | | | (.34 | ) | | | 32.16 |
2006 | | | 20.98 | | | .08 | | | | 5.86 | | | | 5.94 | | | | — | | | | (.26 | ) | | | (.26 | ) | | | 26.66 |
2005(e) | | | 20.00 | | | — | | | | .98 | | | | .98 | | | | — | | | | — | | | | — | | | | 20.98 |
Class R3 (8/08) | | | | | | | | | | | | | | | | | | | | | | | | | | | |
2009(g) | | | 28.93 | | | .15 | | | | (3.80 | ) | | | (3.65 | ) | | | — | | | | (1.05 | ) | | | (1.05 | ) | | | 24.23 |
Class I (12/04)(f) | | | | | | | | | | | | | | | | | | | | | | | | | | | |
2009 | | | 29.66 | | | .26 | | | | (4.57 | ) | | | (4.31 | ) | | | (.11 | ) | | | (1.05 | ) | | | (1.16 | ) | | | 24.19 |
2008 | | | 32.54 | | | .28 | | | | (1.03 | ) | | | (.75 | ) | | | (.67 | ) | | | (1.46 | ) | | | (2.13 | ) | | | 29.66 |
2007 | | | 26.95 | | | .39 | | | | 5.82 | | | | 6.21 | | | | (.36 | ) | | | (.26 | ) | | | (.62 | ) | | | 32.54 |
2006 | | | 21.09 | | | .31 | | | | 5.93 | | | | 6.24 | | | | (.12 | ) | | | (.26 | ) | | | (.38 | ) | | | 26.95 |
2005(e) | | | 20.00 | | | .11 | | | | .98 | | | | 1.09 | | | | — | | | | — | | | | — | | | | 21.09 |
| | | | | | | | | | | | | | | | | | | | | | | | | |
| | | | | | | | |
| | | | | | | | | | | | | | | | | | | | | | | | | |
| | | | Ratios/Supplemental Data | |
| | | | | | Ratios to Average
Net Assets
Before Credit/
Reimbursement | | | Ratios to Average
Net Assets After
Reimbursement(c) | | | Ratios to Average
Net Assets
After Credit/
Reimbursement(d) | | | | |
Total
Return(b) | | | Ending
Net
Assets
(000) | | Expenses | | | Net
Invest-
ment
Income
(Loss) | | | Expenses | | | Net
Invest-
ment
Income
(Loss) | | | Expenses | | | Net
Invest-
ment
Income
(Loss) | | | Portfolio
Turnover
Rate | |
| | | | | | | | | | | | | | | | | | | | | | | | | |
| (13.47 | )% | | $ | 378,845 | | 1.48 | % | | .89 | % | | 1.48 | % | | .89 | % | | 1.48 | % | | .89 | % | | 61 | % |
| (2.65 | ) | | | 368,093 | | 1.42 | | | .63 | | | 1.42 | | | .63 | | | 1.41 | | | .64 | | | 48 | |
| 22.98 | | | | 248,827 | | 1.39 | | | .99 | | | 1.39 | | | .99 | | | 1.39 | | | .99 | | | 23 | |
| 29.45 | | | | 73,389 | | 1.63 | | | .94 | | | 1.49 | | | 1.09 | | | 1.48 | | | 1.09 | | | 29 | |
| 5.35 | | | | 3 | | 3.12 | * | | (1.10 | )* | | 1.51 | * | | .52 | * | | 1.30 | * | | .73 | * | | 45 | |
| | | | | | | | | | | | | | | | | | | | | | | | | |
| (14.10 | ) | | | 5,080 | | 2.22 | | | .14 | | | 2.22 | | | .14 | | | 2.22 | | | .14 | | | 61 | |
| (3.39 | ) | | | 6,816 | | 2.17 | | | (.11 | ) | | 2.17 | | | (.11 | ) | | 2.16 | | | (.10 | ) | | 48 | |
| 22.04 | | | | 5,521 | | 2.14 | | | .24 | | | 2.14 | | | .24 | | | 2.14 | | | .24 | | | 23 | |
| 28.49 | | | | 1,041 | | 2.40 | | | .16 | | | 2.24 | | | .33 | | | 2.23 | | | .34 | | | 29 | |
| 4.90 | | | | 3 | | 3.87 | * | | (1.85 | )* | | 2.26 | * | | (.23 | )* | | 2.05 | * | | (.02 | )* | | 45 | |
| | | | | | | | | | | | | | | | | | | | | | | | | |
| (14.14 | ) | | | 98,742 | | 2.22 | | | .14 | | | 2.22 | | | .14 | | | 2.22 | | | .14 | | | 61 | |
| (3.39 | ) | | | 116,463 | | 2.17 | | | (.10 | ) | | 2.17 | | | (.10 | ) | | 2.16 | | | (.10 | ) | | 48 | |
| 22.04 | | | | 100,295 | | 2.14 | | | .24 | | | 2.14 | | | .24 | | | 2.14 | | | .24 | | | 23 | |
| 28.49 | | | | 22,102 | | 2.40 | | | .15 | | | 2.24 | | | .31 | | | 2.23 | | | .32 | | �� | 29 | |
| 4.90 | | | | 3 | | 3.87 | * | | (1.85 | )* | | 2.26 | * | | (.23 | )* | | 2.05 | * | | (.02 | )* | | 45 | |
| | | | | | | | | | | | | | | | | | | | | | | | | |
| (11.47 | ) | | | 414 | | 1.76 | * | | .73 | * | | 1.75 | * | | .75 | * | | 1.75 | * | | .75 | * | | 61 | |
| | | | | | | | | | | | | | | | | | | | | | | | | |
| (13.29 | ) | | | 580,149 | | 1.24 | | | 1.19 | | | 1.23 | | | 1.20 | | | 1.23 | | | 1.20 | | | 61 | |
| (2.39 | ) | | | 278,649 | | 1.17 | | | .89 | | | 1.17 | | | .89 | | | 1.17 | | | .89 | | | 48 | |
| 23.30 | | | | 161,284 | | 1.14 | | | 1.28 | | | 1.14 | | | 1.28 | | | 1.14 | | | 1.28 | | | 23 | |
| 29.80 | | | | 37,393 | | 1.48 | | | .98 | | | 1.24 | | | 1.22 | | | 1.23 | | | 1.23 | | | 29 | |
| 5.45 | | | | 2,102 | | 2.86 | * | | (.84 | )* | | 1.24 | * | | .77 | * | | 1.05 | * | | .97 | * | | 45 | |
| (a) | Per share Net Investment Income (Loss) is calculated using the average daily shares method. |
| (b) | Total return is the combination of changes in net asset value without any sales charge, reinvested dividend income at net asset value and reinvested capital gains distributions at net asset value, if any. Total returns are not annualized. |
| (c) | After expense reimbursement from the Adviser, where applicable. |
| (d) | After custodian fee credit and expense reimbursement, where applicable. |
| (e) | For the period December 9, 2004 (commencement of operations) through June 30, 2005. |
| (f) | Effective May 1, 2008, Class R Shares were renamed Class I Shares. |
| (g) | For the period August 4, 2008 (commencement of operations) through June 30, 2009. |
See accompanying notes to financial statements.
Annual Investment Management Agreement Approval Process
The Investment Company Act of 1940, as amended (the “1940 Act”), provides, in substance, that each investment advisory agreement between a fund and its investment adviser (including sub-advisers) will continue in effect from year to year only if its continuance is approved at least annually by the fund’s board members, including by a vote of a majority of the board members who are not parties to the advisory agreement or “interested persons” of any parties (the “Independent Board Members”), cast in person at a meeting called for the purpose of considering such approval. In connection with such approvals, the fund’s board members must request and evaluate, and the investment adviser is required to furnish, such information as may be reasonably necessary to evaluate the terms of the advisory agreement. Accordingly, at a meeting held on May 27-29, 2009 (the “May Meeting”), the Boards of Trustees (each, a “Board” and each Trustee, a “Board Member”) of the Funds, including a majority of the Independent Board Members, considered and approved the continuation of the advisory and sub-advisory agreements for the Funds for an additional one-year period. These agreements include (a) the investment advisory agreements between Nuveen Asset Management (“NAM”) and each of the Funds; (b) the sub-advisory agreements between NAM and NWQ Investment Management Company, LLC (“NWQ”) on behalf of each of the following Funds: Nuveen NWQ Multi-Cap Value Fund, Nuveen NWQ Large-Cap Value Fund, Nuveen NWQ Small/Mid-Cap Value Fund and Nuveen NWQ Small-Cap Value Fund; (c) the sub-advisory agreement between NAM and Tradewinds Global Investors, LLC (“Tradewinds”) on behalf of the Nuveen Tradewinds Value Opportunities Fund; and (d) the sub-advisory agreements between NAM and Institutional Capital LLC (“ICAP”), Nuveen HydePark Group, LLC (“HydePark”) and Symphony Asset Management LLC (“Symphony”), respectively, on behalf of the Nuveen Multi-Manager Large-Cap Value Fund. NWQ, Tradewinds, ICAP, HydePark and Symphony are each a “Sub-Adviser.” In preparation for their considerations at the May Meeting, the Board also held a separate meeting on April 21-22, 2009 (the “April Meeting”). Accordingly, the factors considered and determinations made regarding the renewals by the Independent Board Members include those made at the April Meeting.
In addition, in evaluating the applicable advisory agreements (each an “Investment Management Agreement”) and sub-advisory agreements (each a “Sub-advisory Agreement,” and each Investment Management Agreement and Sub-advisory Agreement, an “Advisory Agreement”), the Independent Board Members reviewed a broad range of information relating to the Funds, NAM and each Sub-Adviser (NAM and the Sub-Advisers are each a “Fund Adviser”), including absolute performance, fee and expense information for the Funds as well as comparative performance, fee and expense information for a comparable peer group of funds, the performance information of recognized and/or customized benchmarks (as applicable) of the Funds, the profitability of Nuveen for its advisory activities (which includes its wholly owned subsidiaries other than Winslow Capital Management, Inc. (“Winslow Capital”), which was recently acquired in December 2008), and other information regarding the organization, personnel, and services provided by the respective Fund Adviser. The Independent Board Members also met quarterly as well as at other times as the need arose during the year and took into account the information provided at such meetings and the knowledge gained therefrom. Prior to approving the renewal of the Advisory Agreements, the Independent Board Members reviewed the foregoing information with their independent legal counsel and with management, reviewed materials from independent legal counsel describing applicable law and their duties in reviewing advisory contracts, and met with independent legal counsel in private sessions without management present. The Independent Board Members considered the legal advice provided by independent legal counsel and relied upon their knowledge of the Fund Adviser, its services and the Funds resulting from their meetings and other interactions throughout the year and their own business judgment in determining the factors to be considered in evaluating the Advisory Agreements. Each Board Member may have accorded different weight to the various factors in reaching his or her conclusions with respect to a Fund’s Advisory Agreements. The Independent Board Members did not identify any single factor as all-important or controlling. The Independent Board Members’ considerations were instead based on a comprehensive consideration of all the information presented. The principal factors considered by the Board and its conclusions are described below.
A. Nature, Extent and Quality of Services
In considering renewal of the Advisory Agreements, the Independent Board Members considered the nature, extent and quality of the Fund Adviser’s services, including advisory services and administrative services. The Independent Board Members reviewed materials outlining, among other things, the Fund Adviser’s organization and business; the types of services that the Fund Adviser or its affiliates provide and are expected to provide to the Funds; the performance record of the applicable Fund (as described in further detail below); and any initiatives Nuveen had taken for the applicable fund product line.
In reviewing the services provided and the initiatives undertaken during the past year, the Independent Board Members recognized the severe market turmoil experienced in the capital markets during recent periods, including sustained periods of high volatility, credit disruption and government intervention. The Independent Board Members considered the Fund Adviser’s efforts, expertise and other actions taken to address matters as they arose that impacted the Funds. The Independent Board Members recognized the role of the Investment Services group which, among other things, monitors the various positions throughout the Nuveen fund complex to identify and address any systematic risks. In addition, the Capital Markets Committee of NAM provides a multi-departmental venue for developing new policies to mitigate any risks. The Independent Board Members further recognized NAM’s continuous review of the Nuveen funds’ investment strategies and mandates in seeking to continue to refine and improve the investment process for the funds, particularly in light of market conditions. In this regard, the Independent Board Members noted the changes recommended by NAM to various investment mandates for the Nuveen funds in seeking to take advantage of market opportunities and to improve the tools available for managing liquidity and market exposure; the establishment of a team responsible for coordinating the handling of large trades in or out of the Nuveen funds; and the ongoing monitoring of investment management processes.
As part of their review, the Independent Board Members also evaluated the background, experience and track record of the Fund Adviser’s investment personnel. In this regard, the Independent Board Members considered any changes in the personnel, and the
impact on the level of services provided to the Funds, if any. The Independent Board Members also reviewed information regarding portfolio manager compensation arrangements to evaluate the Fund Adviser’s ability to attract and retain high quality investment personnel, preserve stability, and reward performance but not provide an incentive for taking undue risks.
In addition to advisory services, the Independent Board Members considered the quality of administrative services provided by NAM and its affiliates including product management, fund administration, oversight of service providers, shareholder services, administration of Board relations, regulatory and portfolio compliance and legal support. Given the importance of compliance, the Independent Board Members considered NAM’s compliance program, including the report of the chief compliance officer regarding the Funds’ compliance policies and procedures.
The Independent Board Members also considered NAM’s oversight of the performance, business activities and compliance of the Sub-Advisers. In that regard, the Independent Board Members reviewed an evaluation of each Sub-Adviser from NAM. The evaluation also included information relating to the respective Sub-Adviser’s organization, operations, personnel, assets under management, investment philosophy, strategies and techniques in managing the applicable Fund(s), developments affecting each Sub-Adviser, and an analysis of each Sub-Adviser. As described in further detail below, the Board considered the performance of each Fund sub-advised by the respective Sub-Adviser (or, with respect to the Nuveen Multi-Manager Large-Cap Value Fund, the portion of the investment portfolio for which the Sub-Adviser is responsible). The Board also recognized that the Sub-advisory Agreements were essentially agreements for portfolio management services only and the Sub-Advisers were not expected to supply other significant administrative services to the respective Funds. As part of their oversight, the Independent Board Members also continued their program of seeking to visit each sub-adviser to the Nuveen funds at least once over a multiple year rotation, meeting with key investment and business personnel. In this regard, the Independent Board Members met with Tradewinds in February 2008 and 2009 and with NWQ in February 2009. The Independent Board Members noted that NAM recommended the renewal of the applicable Sub-advisory Agreements and considered the basis for such recommendations and any qualifications in connection therewith.
Based on their review, the Independent Board Members found that, overall, the nature, extent and quality of services provided (and expected to be provided) to the Funds under the respective Investment Management Agreement or respective Sub-advisory Agreement, as applicable, were satisfactory.
B. The Investment Performance of the Funds and Fund Advisers
The Board considered the investment performance of each Fund, including the Fund’s historic performance as well as its performance compared to funds with similar investment objectives (the “Performance Peer Group”) based on data provided by an independent provider of mutual fund data as well as recognized and/or customized benchmarks. The Independent Board Members reviewed performance information including, among other things, total return information compared with the Fund’s Performance Peer Group and recognized and/or customized benchmarks for the quarter-, one-, three- and five-year periods (as applicable) ending December 31, 2008 and for the same periods (as applicable) ending March 31, 2009. The Independent Board Members also reviewed performance information of the Nuveen funds managed by each of NWQ, Tradewinds, HydePark and Symphony, respectively, in the aggregate ranked by peer group and the performance of such funds, in the aggregate, relative to their benchmark. With respect to the Nuveen Multi-Manager Large-Cap Value Fund, the Independent Board Members also reviewed, among other things, the returns of the portion of the portfolio managed by each particular Sub-Adviser for the year 2008. This information supplemented the Fund performance information provided to the Board at each of its quarterly meetings.
In comparing a fund’s performance with that of its Performance Peer Group, the Independent Board Members took into account that the closest Performance Peer Group in certain instances may not adequately reflect the respective fund’s investment objectives and strategies thereby hindering a meaningful comparison of the fund’s performance with that of the Performance Peer Group. The Independent Board Members further considered the performance of the Funds in the context of the volatile market conditions during the past year, and their impact on various asset classes and the portfolio management of the Funds.
Based on their review and factoring in the severity of market turmoil in 2008, the Independent Board Members determined that each Fund’s investment performance over time had been satisfactory, except as noted. With respect to the Nuveen NWQ Multi-Cap Value Fund and the Nuveen NWQ Small-Cap Value Fund, based on their review and factoring in the severity of market turmoil in 2008, the Independent Board Members were satisfied with the steps taken to address performance issues during extraordinary times.
C. Fees, Expenses and Profitability
1. Fees and Expenses
The Board evaluated the management fees and expenses of each Fund reviewing, among other things, such Fund’s gross management fees, net management fees and total expense ratios (before and after expense reimbursements and/or waivers) in absolute terms as well as compared to the fee and expenses of a comparable universe of unaffiliated funds based on data provided by an independent fund data provider (the “Peer Universe”) and in certain cases, to a more focused subset of funds in the Peer Universe (the “Peer Group”).
The Independent Board Members further reviewed data regarding the construction of the applicable Peer Universe and Peer Group. In reviewing the comparisons of fee and expense information, the Independent Board Members took into account that in certain instances various factors such as the asset level of a fund relative to peers, the size and particular composition of the Peer Universe or Peer Group, the investment objectives of the peers, expense anomalies, changes in the funds comprising the Peer
Annual Investment Management Agreement Approval Process (continued)
Universe or Peer Group from year to year, levels of reimbursement and the timing of information used may impact the comparative data, thereby limiting the ability to make a meaningful comparison. In reviewing the fee schedule for a Fund, the Independent Board Members also considered the fund-level and complex-wide breakpoint schedules (described in further detail below) and any fee waivers and reimbursements provided by Nuveen.
Based on their review of the fee and expense information provided, the Independent Board Members determined that each Fund’s management fees and net total expense ratio were reasonable in light of the nature, extent and quality of services provided to the Fund.
2. Comparisons with the Fees of Other Clients
The Independent Board Members further reviewed information regarding the nature of services and fee rates offered by NAM to other clients. Such clients include separately managed accounts (both retail and institutional accounts) and funds that are not offered by Nuveen but are sub-advised by one of Nuveen’s investment management teams. In evaluating the comparisons of fees, the Independent Board Members noted that the fee rates charged to the Funds and other clients vary, among other things, because of the different services involved and the additional regulatory and compliance requirements associated with registered investment companies, such as the Funds. Accordingly, the Independent Board Members considered the differences in the product types, including, but not limited to, the services provided, the structure and operations, product distribution and costs thereof, portfolio investment policies, investor profiles, account sizes and regulatory requirements. The Independent Board Members noted, in particular, that the range of services provided to the Funds (as discussed above) is much more extensive than that provided to separately managed accounts. Given the inherent differences in the products, particularly the extensive services provided to the Funds, the Independent Board Members believe such facts justify the different levels of fees.
In considering the fees of the Sub-Advisers, the Independent Board Members also considered the pricing schedule or fees that each Sub-Adviser charges for similar investment management services for other fund sponsors or clients (such as retail and/or institutional managed accounts) as applicable. With respect to Symphony, the Independent Board Members also reviewed the fees it assesses for equity and taxable fixed-income hedge funds and hedge accounts it manages, which include a performance fee.
3. Profitability of Fund Advisers
In conjunction with its review of fees, the Independent Board Members also considered the profitability of Nuveen for its advisory activities (which incorporated Nuveen’s wholly-owned affiliated sub-advisers other than Winslow Capital) and its financial condition. The Independent Board Members reviewed the revenues and expenses of Nuveen’s advisory activities for the last two years, the allocation methodology used in preparing the profitability data and an analysis of the key drivers behind the changes in revenues and expenses that impacted profitability in 2008. In addition, the Independent Board Members reviewed information regarding the financial results of Nuveen for 2008 based on its Form 8-K filed on March 31, 2009. The Independent Board Members noted this information supplemented the profitability information requested and received during the year to help keep them apprised of developments affecting profitability (such as changes in fee waivers and expense reimbursement commitments). In this regard, the Independent Board Members noted that they had also appointed an Independent Board Member as a point person to review and keep them apprised of changes to the profitability analysis and/or methodologies during the year. The Independent Board Members also considered Nuveen’s revenues for advisory activities, expenses, and profit margin compared to that of various unaffiliated management firms with similar amounts of assets under management and relatively comparable asset composition prepared by Nuveen.
In reviewing profitability, the Independent Board Members recognized the subjective nature of determining profitability which may be affected by numerous factors including the allocation of expenses. Further, the Independent Board Members recognized the difficulties in making comparisons as the profitability of other advisers generally is not publicly available and the profitability information that is available for certain advisers or management firms may not be representative of the industry and may be affected by, among other things, the adviser’s particular business mix, capital costs, types of funds managed and expense allocations. Notwithstanding the foregoing, the Independent Board Members reviewed Nuveen’s methodology and assumptions for allocating expenses across product lines to determine profitability. In reviewing profitability, the Independent Board Members recognized Nuveen’s investment in its fund business. Based on their review, the Independent Board Members concluded that Nuveen’s level of profitability for its advisory activities was reasonable in light of the services provided.
In addition, with respect to ICAP, the Independent Board Members also considered such Sub-Adviser’s revenues, expenses and profitability margins (pre- and post-tax). Based on their review, the Independent Board Members were satisfied that such Sub-Adviser’s level of profitability was reasonable in light of the services provided.
In evaluating the reasonableness of the compensation, the Independent Board Members also considered other amounts paid to a Fund Adviser by the Funds as well as any indirect benefits (such as soft dollar arrangements, if any) the Fund Adviser and its affiliates receive, or are expected to receive, that are directly attributable to the management of the Funds, if any. See Section E below for additional information on indirect benefits the Fund Adviser may receive as a result of its relationship with the Funds. Based on their review of the overall fee arrangements of each Fund, the Independent Board Members determined that the advisory fees and expenses of the respective Fund were reasonable.
D. Economies of Scale and Whether Fee Levels Reflect These Economies of Scale
With respect to economies of scale, the Independent Board Members have recognized the potential benefits resulting from the costs of a fund being spread over a larger asset base, although economies of scale are difficult to measure and predict with precision, particularly on a fund-by-fund basis. One method to help ensure the shareholders share in these benefits is to include breakpoints in the advisory fee schedule. Generally, management fees for funds in the Nuveen complex are comprised of a fund-level component and a complex-level component, subject to certain exceptions. Accordingly, the Independent Board Members reviewed and considered the applicable fund-level breakpoints in the advisory fee schedules that reduce advisory fees as asset levels increase. While economies of scale result when costs can be spread over a larger asset base, the Independent Board Members also recognized that the asset levels generally declined in 2008 due to, among other things, the market downturn. Accordingly, for funds with a reduction in assets under management, advisory fee levels may have increased as breakpoints in the fee schedule were no longer surpassed.
In addition to fund-level advisory fee breakpoints, the Board also considered the Funds’ complex-wide fee arrangement. Pursuant to the complex-wide fee arrangement, the fees of the funds in the Nuveen complex generally are reduced as the assets in the fund complex reach certain levels. The complex-wide fee arrangement seeks to provide the benefits of economies of scale to fund shareholders when total fund complex assets increase, even if assets of a particular fund are unchanged or have decreased. The approach reflects the notion that some of Nuveen’s costs are attributable to services provided to all its funds in the complex and therefore all funds benefit if these costs are spread over a larger asset base. Generally, the complex-wide pricing reduces Nuveen’s revenue because total complex fund assets have consistently grown in prior years. As noted, however, total fund assets declined in 2008 resulting in a smaller downward adjustment of revenues due to complex-wide pricing compared to the prior year.
Based on their review, the Independent Board Members concluded that the breakpoint schedules and complex-wide fee arrangement (as applicable) were acceptable and reflect economies of scale to be shared with shareholders when assets under management increase.
E. Indirect Benefits
In evaluating fees, the Independent Board Members received and considered information regarding potential “fall out” or ancillary benefits the respective Fund Adviser or its affiliates may receive as a result of its relationship with each Fund. In this regard, the Independent Board Members considered, among other things, any sales charges, distribution fees and shareholder services fees received and retained by the Funds’ principal underwriter, an affiliate of NAM, which includes fees received pursuant to any 12b-1 plan. The Independent Board Members, therefore, considered the 12b-1 fees retained by Nuveen during the last calendar year.
In addition to the above, the Independent Board Members considered whether the Fund Adviser received any benefits from soft dollar arrangements whereby a portion of the commissions paid by a Fund for brokerage may be used to acquire research that may be useful to the Fund Adviser in managing the assets of the Funds and other clients. With respect to NAM, the Independent Board Members noted that NAM does not currently have any soft dollar arrangements; however, to the extent certain bona fide agency transactions that occur on markets that traditionally trade on a principal basis and riskless principal transactions are considered as generating “commissions,” NAM intends to comply with the applicable safe harbor provisions. With respect to HydePark, ICAP, NWQ and Tradewinds, the Independent Board Members considered that such Sub-Advisers may benefit from their soft dollar arrangements pursuant to which the respective Sub-Adviser receives research from brokers that execute the applicable Fund’s portfolio transactions. For these Sub-Advisers, the Independent Board Members further noted that such Sub-Advisers’ profitability may be lower if they were required to pay for this research with hard dollars. With respect to Symphony, the Board also considered that Symphony currently does not enter into soft dollar arrangements; however, it has adopted a soft dollar policy in the event it does so in the future.
Based on their review, the Independent Board Members concluded that any indirect benefits received by a Fund Adviser as a result of its relationship with the Funds were reasonable and within acceptable parameters.
F. Other Considerations
The Independent Board Members did not identify any single factor discussed previously as all-important or controlling. The Board Members, including the Independent Board Members, unanimously concluded that the terms of the Investment Management Agreements and Sub-advisory Agreements are fair and reasonable, that the respective Fund Adviser’s fees are reasonable in light of the services provided to each Fund and that the Investment Management Agreements and the Sub-advisory Agreements be renewed.
Trustees and Officers
The management of the Fund, including general supervision of the duties performed for the Fund by the Adviser, is the responsibility of the Board of Trustees of the Fund. The number of trustees of the Fund is currently set at nine. None of the trustees who are not “interested” persons of the Fund (referred to herein as “independent trustees”) has ever been a director or employee of, or consultant to, Nuveen or its affiliates. The names and business addresses of the trustees and officers of the Fund, their principal occupations and other affiliations during the past five years, the number of portfolios each oversees and other directorships they hold are set forth below.
The Fund’s Statement of Additional Information (“SAI”) includes more information about the trustees. To request a free copy, call Nuveen Investments at (800) 257-8787 or visit the Funds’ website at www.nuveen.com.
| | | | | | | | |
Name, Birthdate and Address | | Position(s) Held with the Fund | | Year First Elected or Appointed (1) | | Principal Occupation(s) Including other Directorships During Past 5 Years | | Number of Portfolios in Fund Complex Overseen by Trustee |
| | |
| Independent Trustees: | | | | |
Robert P. Bremner 8/22/40 333 W. Wacker Drive Chicago, IL 60606 | | Chairman of the Board and Trustee | | 1997 | | Private Investor and Management Consultant; Treasurer and Director, Humanities Council of Washington D.C. | | 199 |
Jack B. Evans 10/22/48 333 W. Wacker Drive Chicago, IL 60606 | | Trustee | | 1999 | | President, The Hall-Perrine Foundation, a private philanthropic corporation (since 1996); Director and Vice Chairman, United Fire Group, a publicly held company; Member of the Board of Regents for the State of Iowa University System; Director, Gazette Companies; Life Trustee of Coe College; Director, Iowa College Foundation; Member of the Advisory Council of the Department of Finance in the Tippie College of Business, University of lowa; formerly, Director, Alliant Energy; formerly, Director, Federal Reserve Bank of Chicago; formerly, President and Chief Operating Officer, SCI Financial Group, Inc., a regional financial services firm. | | 199 |
William C. Hunter 3/6/48 333 W. Wacker Drive Chicago, IL 60606 | | Trustee | | 2004 | | Dean, Tippie College of Business, University of Iowa (since 2006); Director (since 2004) of Xerox Corporation; Director (since 2005), Beta Gamma Sigma International Honor Society; formerly, Dean and Distinguished Professor of Finance, School of Business at the University of Connecticut (2003-2006); previously, Senior Vice President and Director of Research at the Federal Reserve Bank of Chicago (1995-2003); Director, SS&C Technologies, Inc. (May 2005-October 2005); formerly, Director (1997-2007), Credit Research Center at George Washington University. | | 199 |
David J. Kundert 10/28/42 333 W. Wacker Drive Chicago, IL 60606 | | Trustee | | 2005 | | Director, Northwestern Mutual Wealth Management Company; retired (since 2004) as Chairman, JPMorgan Fleming Asset Management, President and CEO, Banc One Investment Advisors Corporation, and President, One Group Mutual Funds; prior thereto, Executive Vice President, Banc One Corporation and Chairman and CEO, Banc One Investment Management Group; Member, Board of Regents, Luther College; member of the Wisconsin Bar Association; member of Board of Directors, Friends of Boerner Botanical Gardens; member of Investment Committee, Greater Milwaukee Foundation. | | 199 |
William J. Schneider 9/24/44 333 W. Wacker Drive Chicago, IL 60606 | | Trustee | | 1997 | | Chairman of Miller-Valentine Partners Ltd., a real estate investment company; formerly, Senior Partner and Chief Operating Officer (retired, 2004) of Miller-Valentine Group; Member, Dayton Philharmonic Orchestra Association; formerly, Member, Business Advisory Council, Cleveland Federal Reserve Bank; formerly, Director, Dayton Development Coalition. | | 199 |
Judith M. Stockdale 12/29/47 333 W. Wacker Drive Chicago, IL 60606 | | Trustee | | 1997 | | Executive Director, Gaylord and Dorothy Donnelley Foundation (since 1994); prior thereto, Executive Director, Great Lakes Protection Fund (from 1990 to 1994). | | 199 |
Carole E. Stone 6/28/47 333 W. Wacker Drive Chicago, IL 60606 | | Trustee | | 2007 | | Director, Chicago Board Options Exchange (since 2006); Director, C2 Options Exchange, Incorporated (since 2009); Commissioner, New York State Commission on Public Authority Reform (since 2005); formerly, Chair, New York Racing Association Oversight Board (2005-2007). | | 199 |
| | | | | | | | |
Name, Birthdate and Address | | Position(s) Held with the Fund | | Year First Elected or Appointed (1) | | Principal Occupation(s) Including other Directorships During Past 5 Years | | Number of Portfolios in Fund Complex Overseen by Trustee |
Terence J. Toth 9/29/59 333 W. Wacker Drive Chicago, IL 60606 | | Trustee | | 2008 | | Director, Legal & General Investment Management America, Inc. (since 2008); Managing Partner, Musso Capital Management (since 2008); CEO and President, Northern Trust Investments (2004-2007); Executive Vice President, Quantitative Management & Securities Lending (2000-2004); prior thereto, various positions with Northern Trust Company (since 1994); Member: Goodman Theatre Board (since 2004); Chicago Fellowship Board (since 2005), University of Illinois Leadership Council Board (since 2007) and Catalyst Schools of Chicago Board (since 2008); formerly, Member: Northern Trust Mutual Funds Board (2005-2007), Northern Trust Investments Board (2004-2007), Northern Trust Japan Board (2004-2007), Northern Trust Securities Inc. Board (2003-2007) and Northern Trust Hong Kong Board (1997-2004). | | 199 |
| | |
| Interested Trustee: | | | | |
John P. Amboian (2) 6/14/61 333 W. Wacker Drive Chicago, IL 60606 | | Trustee | | 2008 | | Chief Executive Officer (since July 2007) and Director (since 1999) of Nuveen Investments, Inc.; Chief Executive Officer (since 2007) of Nuveen Asset Management, Nuveen Investments Advisors, Inc. formerly, President (1999-2004) of Nuveen Advisory Corp. and Nuveen Institutional Advisory Corp. (3) | | 199 |
Name, Birthdate and Address | | Position(s) Held with the Fund | | Year First Elected or Appointed (4) | | Principal Occupation(s) During Past 5 Years | | Number of Portfolios in Fund Complex Overseen by Officer |
| | |
| Officers of the Fund: | | | | |
Gifford R. Zimmerman 9/9/56 333 W. Wacker Drive Chicago, IL 60606 | | Chief Administrative Officer | | 1988 | | Managing Director (since 2002), Assistant Secretary and Associate General Counsel of Nuveen Investments, LLC; Managing Director (since 2002), Associate General Counsel and Assistant Secretary, of Nuveen Asset Management (since 2002) and of Symphony Asset Management LLC (since 2003); Vice President and Assistant Secretary of NWQ Investment Management Company, LLC. (since 2002), Nuveen Investments Advisers Inc. (since 2002), Tradewinds Global Investors, LLC, and Santa Barbara Asset Management, LLC (since 2006), Nuveen HydePark Group LLC and Nuveen Investment Solutions, Inc. (since 2007); Managing Director (since 2004) and Assistant Secretary (since 1994) of Nuveen Investments, Inc.; formerly, Managing Director (2002-2004), General Counsel (1998-2004) and Assistant Secretary of Nuveen Advisory Corp. and Nuveen Institutional Advisory Corp. (3); Chartered Financial Analyst. | | 199 |
Mark J.P. Anson 6/10/59 333 W. Wacker Drive Chicago, IL 60606 | | Vice President | | 2009 | | President and Executive Director of Nuveen Investments, Inc. (since 2007); President of Nuveen Investments Institutional Services Group LLC (since 2007); previously, Chief Executive Officer of the British Telecom Pension Scheme (2006-2007) and Chief Investment Officer of Calpers (1999-2006); PhD, Chartered Financial Analyst, Chartered Alternative Investment Analyst, Certified Public Accountant, Certified Management Accountant and Certified Internal Auditor. | | 199 |
Nizida Arriaga 6/1/1968 333 W. Wacker Drive Chicago, IL 60606 | | Vice President | | 2009 | | Vice President (since 2007) of Nuveen Investments, LLC; previously, Portfolio Manager, Allstate Investments, LLC (1996-2006); Chartered Financial Analyst. | | 199 |
Trustees and Officers (continued)
| | | | | | | | |
Name, Birthdate and Address | | Position(s) Held with the Fund | | Year First Elected or Appointed (4) | | Principal Occupation(s) During Past 5 Years | | Number of Portfolios in Fund Complex Overseen by Officer |
Michael T. Atkinson 2/3/66 333 W. Wacker Drive Chicago, IL 60606 | | Vice President and Assistant Secretary | | 2000 | | Vice President (since 2002) of Nuveen Investments, LLC; Vice President of Nuveen Asset Management (since 2005). | | 199 |
Margo L. Cook 4/11/64 333 W. Wacker Drive Chicago, IL 60606 | | Vice President | | 2009 | | Executive Vice President (since Oct 2008) of Nuveen Investments, Inc.; previously, Head of Institutional Asset Management (2007-2008) of Bear Stearns Asset Management; Head of Institutional Asset Mgt (1986-2007) of Bank of NY Mellon; Chartered Financial Analyst. | | 199 |
Alan A. Brown 8/1/62 333 W. Wacker Drive Chicago, IL 60606 | | Vice President | | 2007 | | Executive Vice President, Mutual Funds, Nuveen Investments, LLC, (since 2005), previously, Managing Director and Chief Marketing Officer (2001-2005). | | 74 |
Name, Birthdate and Address | | Position(s) Held with the Fund | | Year First Elected or Appointed (4) | | Principal Occupation(s) Including other Directorships During Past 5 Years | | Number of Portfolios in Fund Complex Overseen by Officer |
Lorna C. Ferguson 10/24/45 333 W. Wacker Drive Chicago, IL 60606 | | Vice President | | 1998 | | Managing Director (since 2004) of Nuveen Investments, LLC; Managing Director (since 2005) of Nuveen Asset Management; Managing Director (2004-2005) of Nuveen Advisory Corp. and Nuveen Institutional Advisory Corp. (3). | | 199 |
Stephen D. Foy 5/31/54 333 W. Wacker Drive Chicago, IL 60606 | | Vice President and Controller | | 1998 | | Vice President (since 1993) and Funds Controller (since 1998) of Nuveen Investments, LLC; Vice President (since 2005) of Nuveen Asset Management; Certified Public Accountant. | | 199 |
William T. Huffman 5/7/1969 333 W. Wacker Drive Chicago, IL 60606 | | Vice President | | 2009 | | Chief Operating Officer, Municipal Fixed Income (since 2008) of Nuveen Asset Management; previously, Chairman, President and Chief Executive Officer (2002 – 2007) of Northern Trust Global Advisors, Inc. and Chief Executive Officer (2007) of Northern Trust Global Investments Limited; CPA. | | 199 |
Walter M. Kelly 2/24/70 333 W. Wacker Drive Chicago, IL 60606 | | Chief Compliance Officer and Vice President | | 2003 | | Senior Vice President (since 2008), Vice President (2006- 2008) formerly, Assistant Vice President and Assistant General Counsel (2003-2006) of Nuveen Investments, LLC; Vice President (since 2006) and Assistant Secretary (since 2003) of Nuveen Asset Management. | | 199 |
David J. Lamb 3/22/63 333 W. Wacker Drive Chicago, IL 60606 | | Vice President | | 2000 | | Senior Vice President (since 2009), formerly, Vice President (2000-2009) of Nuveen Investments, LLC; Vice President (since 2005) of Nuveen Asset Management, Certified Public Accountant. | | 199 |
Tina M. Lazar 8/27/61 333 W. Wacker Drive Chicago, IL 60606 | | Vice President | | 2002 | | Senior Vice President (since 2009), formerly, Vice President of Nuveen Investments, LLC (1999-2009); Vice President of Nuveen Asset Management (since 2005). | | 199 |
Larry W. Martin 7/27/51 333 W. Wacker Drive Chicago, IL 60606 | | Vice President and Assistant Secretary | | 1988 | | Vice President, Assistant Secretary and Assistant General Counsel of Nuveen Investments, LLC; Vice President (since 2005) and Assistant Secretary of Nuveen Investments, Inc.; Vice President and Assistant Secretary of Nuveen Investments Advisers Inc. (since 2002), NWQ Investment Management Company, LLC (since 2002), Symphony Asset Management LLC (since 2003), Tradewinds Global Investors, LLC, Santa Barbara Asset Management, LLC (since 2006) and of Nuveen HydePark Group, LLC and Nuveen Investment Solutions, Inc. (since 2007); formerly, Vice President and Assistant Secretary of Nuveen Advisory Corp. and Nuveen Institutional Advisory Corp. (3) | | 199 |
| | | | | | | | |
Name, Birthdate and Address | | Position(s) Held with the Fund | | Year First Elected or Appointed (4) | | Principal Occupation(s) Including other Directorships During Past 5 Years | | Number of Portfolios in Fund Complex Overseen by Officer |
Kevin J. McCarthy 3/26/66 333 W. Wacker Drive Chicago, IL 60606 | | Vice President and Secretary | | 2007 | | Managing Director (since 2008), formerly, Vice President (2007-2008), Nuveen Investments, LLC; Managing Director (since 2008), formerly, Vice President and Assistant Secretary, Nuveen Asset Management and Nuveen Investments Holdings, Inc.; Vice President (since 2007) and Assistant Secretary, Nuveen Investment Advisers Inc., Nuveen Investment Institutional Services Group LLC, NWQ Investment Management Company, LLC, Tradewinds Global Investors LLC, NWQ Holdings, LLC, Symphony Asset Management LLC, Santa Barbara Asset Management LLC, Nuveen HydePark Group, LLC and Nuveen Investment Solutions, Inc. (since 2007); prior thereto, Partner, Bell, Boyd & Lloyd LLP (1997-2007). | | 199 |
John V. Miller 4/10/67 333 W. Wacker Drive Chicago, IL 60606 | | Vice President | | 2007 | | Managing Director (since 2007), formerly, Vice President (2002-2007) of Nuveen Asset Management and Nuveen Investments, LLC; Chartered Financial Analyst. | | 199 |
Gregory Mino 1/4/1971 333 W. Wacker Drive Chicago, IL 60606 | | Vice President | | 2009 | | Vice President of Nuveen Investments, LLC (since 2008); previously, Director (2004-2007) and Executive Director (2007-2008) of UBS Global Asset Management; previously, Vice President (2000-2003) and Director (2003-2004) of Merrill Lynch Investment Managers; Chartered Financial Analyst. | | 199 |
Christopher M. Rohrbacher 8/1/71 333 W. Wacker Drive Chicago, IL 60606 | | Vice President and Assistant Secretary | | 2008 | | Vice President, Nuveen Investments, LLC (since 2008); Vice President and Assistant Secretary, Nuveen Asset Management (since 2008); prior thereto, Associate, Skadden, Arps, Slate Meagher & Flom LLP (2002-2008) | | 199 |
James F. Ruane 7/3/62 333 W. Wacker Drive Chicago, IL 60606 | | Vice President and Assistant Secretary | | 2007 | | Vice President, Nuveen Investments (since 2007); prior thereto, Partner, Deloitte & Touche USA LLP (2005-2007), formerly, senior tax manager (2002-2005); Certified Public Accountant. | | 199 |
John S. White 5/12/67 333 W. Wacker Drive Chicago, IL 60606 | | Vice President | | 2007 | | Senior Vice President (since 2009), formerly, Vice President (2006-2009) of Nuveen Investments, LLC, formerly, Assistant Vice President (since 2002); Lieutenant Colonel (since 2007), United States Marine Corps Reserve, formerly, Major (since 2001). | | 74 |
Mark L. Winget 12/21/68 333 W. Wacker Drive Chicago, IL 60606 | | Vice President and Assistant Secretary | | 2008 | | Vice President, Nuveen Investments, LLC (since 2008); Vice President and Assistant Secretary, Nuveen Asset Management (since 2008); prior thereto, Counsel, VedderPrice P.C. (1997-2007). | | 199 |
| (1) | Trustees serve an indefinite term until his/her successor is elected or appointed. The year first elected or appointed represents the year in which the trustee was first elected or appointed to any fund in the Nuveen Fund Complex. |
| (2) | Mr. Amboian is an interested trustee because of his position with Nuveen Investments, Inc. and certain of its subsidiaries, which are affiliates of the Nuveen Funds. |
| (3) | Nuveen Advisory Corp. and Nuveen Institutional Advisory Corp. were reorganized into Nuveen Asset Management, effective January 1, 2005. |
| (4) | Officers serve one year terms through July of each year. The year first elected or appointed represents the year in which the officer was first elected or appointed to any fund in the Nuveen Fund Complex. |
Glossary of Terms Used in this Report
Average Annual Total Return: This is a commonly used method to express an investment’s performance over a particular, usually multi-year time period. It expresses the return that would have been necessary each year to equal the investment’s actual cumulative performance (including change in NAV or offer price and reinvested dividends and capital gains distributions, if any) over the time period being considered.
Net Asset Value (NAV): A Fund’s NAV is the dollar value of one share in the Fund. It is calculated by subtracting the liabilities of the Fund from its total assets and then dividing the remainder by the number of shares outstanding. Fund NAVs are calculated at the end of each business day.
Fund Information
Fund Manager
Nuveen Asset Management
333 West Wacker Drive
Chicago, IL 60606
Sub-Advisers
Institutional Capital LLC
225 West Wacker Drive
Chicago, IL 60606
Nuveen Hyde Park Group, LLC
111 West Jackson Blvd.
Suite 1411
Chicago, IL 60604
NWQ Investment Management Company, LLC
2049 Century Park East
Los Angeles, CA 90067
Symphony Asset Management, LLC
555 California Street
Rene Suite 2975
San Francisco, CA 94104
Tradewinds Global Investors, LLC
2049 Century Park East
Los Angeles, CA 90067
Legal Counsel
Chapman and Cutler LLP
Chicago, IL
Independent Registered Public Accounting Firm
PricewaterhouseCoopers LLP
Chicago, IL
Custodian
State Street Bank & Trust Company
Boston, MA
Transfer Agent and Shareholder Services
Boston Financial
Data Services
Nuveen Investor Services
P.O. Box 8530
Boston, MA 02266-8530
(800) 257-8787
Distribution Information: Multi-Manager Large-Cap Value, Large-Cap Value and Value Opportunities hereby designate 100%, 100% and 12.57%, respectively, of dividends paid from net ordinary income as dividends qualifying for the 70% dividends received deduction for corporations and 100%, 100% and 31.57%, respectively, as qualified dividend income for individuals under Section 1 (h)(11) of the Internal Revenue Code. The actual qualified dividend income distributions will be reported to shareholders on Form 1099-DIV which will be sent to shareholders shortly after calendar year end.
Quarterly Portfolio of Investments and Proxy Voting Information: You may obtain (i) each Fund’s quarterly portfolio of investments, (ii) information regarding how the Funds voted proxies relating to portfolio securities held during the most recent twelve-month period ended June 30, 2009, and (iii) a description of the policies and procedures that the Funds used to determine how to vote proxies relating to portfolio securities without charge, upon request, by calling Nuveen Investments at (800) 257-8787 or on Nuveen’s website at www.nuveen.com.
You may also obtain this and other Fund information directly from the Securities and Exchange Commission (“SEC”). The SEC may charge a copying fee for this information. Visit the SEC on-line at http://www.sec.gov or in person at the SEC’s Public Reference Room in Washington, D.C. Call the SEC at (202) 942-8090 for room hours and operation. You may also request fund information by sending an e-mail request to publicinfo@sec.gov or by writing to the SEC’s Public Reference Section at 100 F Street NE, Washington, D.C. 20549.
The Financial Industry Regulatory Authority (FINRA) provides a Public Disclosure Program which supplies certain information regarding the disciplinary history of FINRA members and their associated persons in response to either telephone inquiries at (800) 289-9999 or written inquiries at www.finra.org. Financial Industry Regulatory Authority also provides an investor brochure that includes information describing the Public Disclosure Program.
Nuveen Investments:
Serving Investors For Generations
Since 1898, financial advisors and their clients have relied on Nuveen Investments to provide dependable investment solutions. Over this time, Nuveen Investments has adhered to the belief that the best approach to investing is to apply conservative risk-management principles to help minimize volatility.
Building on this tradition, we today offer a range of high quality equity and fixed-income solutions that can be integral parts of a well-diversified core portfolio. Our clients have come to appreciate this diversity, as well as our continued adherence to proven, long-term investing principles.
We offer many different investing solutions
for our clients’ different needs.
Nuveen Investments is a global investment management firm that seeks to help secure the long-term goals of institutions and high net worth investors as well as the consultants and financial advisors who serve them. Nuveen Investments markets its growing range of specialized investment solutions under the high-quality brands of HydePark, NWQ, Nuveen, Santa Barbara, Symphony, Tradewinds and Winslow Capital. In total, the Company managed $128 billion of assets on June 30, 2009.
Find out how we can help you reach your financial goals.
An investor should carefully consider the Fund’s objectives, risks, charges and expenses before investing. For a prospectus containing this and other information about the Fund, please contact your financial advisor or Nuveen Investments at (800) 257-8787. Read the prospectus carefully before you invest or send money.
Learn more about Nuveen Funds at www.nuveen.com/mf
| | |
Distributed by Nuveen Investments, LLC 333 West Wacker Drive Chicago, IL 60606 www.nuveen.com | | |
MAN-NWQ-0609P

Mutual Funds
Nuveen Equity Funds
For investors seeking long-term capital appreciation.
Annual Report
June 30, 2009
| | | | | | | | | | | | |
| Nuveen Enhanced Core Equity Fund | | | | Nuveen Enhanced Mid-Cap Fund | | | | | | | | |
LIFE IS COMPLEX.
Nuveen makes things e-simple.
It only takes a minute to sign up for e-Reports. Once enrolled, you’ll receive an e-mail as soon as your Nuveen Investments Fund information is ready. No more waiting for delivery by regular mail. Just click on the link within the e-mail to see the report and save it on your computer if you wish.
Free e-Reports right to your e-mail!
www.investordelivery.com
If you receive your Nuveen Fund dividends and statements from your financial advisor or brokerage account.
OR
www.nuveen.com/accountaccess
If you receive your Nuveen Fund dividends and statements directly from Nuveen.
| | | | | | |
| Must be preceded by or accompanied by a prospectus. | | NOT FDIC INSURED | | MAY LOSE VALUE | | NO BANK GUARANTEE |
Chairman’s
Letter to Shareholders

Dear Shareholder,
The problems in the U.S. financial system and the slowdown in global economic activity continue to create a very difficult environment for the U.S. economy. The administration, the Federal Reserve System and Congress have initiated a variety of programs directed at restoring liquidity to the financial markets, providing financial support for critical financial institutions and stimulating economic activity. There are encouraging signs that these initiatives are beginning to have a constructive impact. It is not possible to predict whether the actions taken to date will be sufficient to restore more normal conditions in the financial markets or enable the economy to stabilize and set a course toward recovery. However, the speed and scope of the government’s actions are very encouraging and more importantly, reflect a commitment to act decisively to meet the economic challenges we face.
The performance information in the attached report reflects the impact of many forces at work in the equity and fixed-income markets. The comments by the portfolio managers describe the strategies being used to pursue your Fund’s long-term investment goals. Parts of the financial markets continue to experience serious dislocations and thorough research and strong investment disciplines have never been more important in identifying risks and opportunities. I hope you will read this information carefully.
Your Board is particularly sensitive to our shareholders’ concerns in these uncertain times. We believe that frequent and thorough communication is essential in this regard and encourage you to visit the Nuveen website: www.nuveen.com, for recent developments in all Nuveen funds. We also encourage you to communicate with your financial consultant for answers to your questions and to seek advice on your long-term investment strategy in the current market environment.
On behalf of myself and the other members of your Fund’s Board, we look forward to continuing to earn your trust in the months and years ahead.
Sincerely,

Robert P. Bremner
Chairman of the Nuveen Fund Board
August 24, 2009
Portfolio Managers’ Comments
Certain statements in this report are forward-looking statements. Discussions of specific investments are for illustration only and are not intended as recommendations of individual investments. The forward-looking statements and other views expressed herein are those of the portfolio managers as of the date of this report. Actual future results or occurrences may differ significantly from those anticipated in any forward-looking statements and the views expressed herein are subject to change at any time, due to numerous market and other factors. The Funds disclaim any obligation to update publicly or revise any forward-looking statements or views expressed herein.
The Nuveen Enhanced Core Equity Fund and the Nuveen Enhanced Mid-Cap Fund feature management by Nuveen HydePark Group, LLC, an affiliate of Nuveen Investments, Inc. Both Funds are co-managed by David Tierney, PhD, Senior Managing Director and Chief Investment Officer of HydePark, John Gambla, CFA, and Rob Guttschow, CFA. We recently spoke with David, John and Rob about the general economic conditions, key investment strategies and performance of the Funds for the twelve-month period ending June 30, 2009.
What were the general economic conditions during the reporting period?
This twelve month period was among the most volatile in the history of the capital markets. Equity markets across the globe fell as the United States economy pushed further into recession. After IndyMac’s bankruptcy filing on August 1, 2008, the U.S. Government engaged in one of the most dramatic market interventions in years and placed the Federal National Mortgage Association (Fannie Mae) and the Federal Home Loan Mortgage Corporation (Freddie Mac) into receivership. In September, Lehman Brothers, a major Wall Street broker/dealer, filed for bankruptcy protection. AIG, one of the largest insurers globally, effectively was nationalized by the U.S. government, and Wachovia, Washington Mutual, Silver State Bank, and Ameri Bank all were seized by U.S. regulators and/or merged into stronger banks. Merrill Lynch, concerned about its own solvency, quickly negotiated a deal to be acquired by Bank of America. Goldman Sachs and Morgan Stanley converted to commercial banks, possibly signaling the end of the 100-year old independent broker / dealer model. The following months included major financial write-downs across the U.S. economy, the uncovering of the largest Ponzi scheme in history, continual declines in real U.S. Gross Domestic Product, and significant spikes in market volatility.
While the U.S. economy moved further into recession, the international capital markets experienced their own severe downturn. Economic policy responses by the U.S. Federal Reserve were followed, in part, by its counterparts at the Bank of England, the European Central Bank, and the Chinese Government.
Although the S&P 500 and the MSCI EAFE indices were down 37% and 43%, respectively, in 2008, signs of global economic stability began to emerge toward the end of the first quarter in 2009. By the end of June, the 2009 year-to-date returns of these two equity indices were 3% and 8%, respectively. In addition, emerging markets, which fell 53% in 2008, rebounded 36% during the first half of 2009.
The headlines created by the failure of such large banking institutions and Congress’s first failed attempt at bailout legislation resulted in a massive drop in consumer confidence.
This drop in confidence resulted in a drop in spending, as personal consumption contracted at a -3.5% rate in the third quarter and a -3.1% in the fourth quarter.
As a result, volatility in the equity markets continued throughout most of this twelve-month period. However, the second quarter of 2009 saw substantial improvements. The U.S. government has continued to implement various financial bailout/stimulus plans. The major banks have appeared to raise the necessary capital for them to survive in the current downturn, with several of them even appearing to thrive. Equity markets, as measured by the S&P 500 Index, have rocketed up from the lows experienced in March. Ten-year bond yields have come off their multi-decade lows as well.
How did the Funds perform during the twelve-month period ended June 30, 2009?
The table on page six provides performance information for both Funds (Class A Shares at net asset value) for the one-year and since inception periods ended June 30, 2009. The table also compares each Fund’s performance to a general market index. A more detailed discussion of each Fund’s relative performance is provided later in this report.
What strategies were used to manage the Funds during the reporting period?
The proprietary risk-controlled HydePark wealth creation model was used to manage the Funds during this twelve-month period and since the inception of the Funds. This model utilizes both fundamental and momentum-related criteria to create a portfolio designed to maximize the reward-to-risk ratio.
Our investment process is a combination of traditional fundamental security valuation and quantitative risk-control techniques. The philosophy that underlies our value-added process is that a stock’s price must follow the wealth creation fundamentals of the company. A stock’s weight in the portfolio is directly related to its wealth creation fundamentals. Our process has five “wealth creation” factors. Four are fundamentally oriented; two are traditional measures of revenues versus excess of expenses (specifically, earnings and cash flow), and two are traditional measures of the uses for those monies (book value and dividends). The fifth factor is a proprietary measure of stock price momentum. Importantly, the process also considers a stock’s liquidity. Due to the quantitative, model-driven process, top-down macroeconomic “themes” do not influence the model or how we select stocks for the Funds.
The model evaluates all the securities contained in the benchmark portfolio (S&P 500 Index for the Nuveen Enhanced Core Equity Fund and Russell Midcap Index for the
Nuveen Enhanced Mid-Cap Fund) for possible inclusion in the respective portfolios. The process will not consider a stock for possible inclusion if it is not contained in the respective benchmark portfolios. This process produces what HydePark believes are well-diversified, efficient portfolios that attempt to perform within a specific, narrow tracking range (the degree of difference) versus the stated benchmarks. Both portfolios typically contain a large number of holdings with each relative weighting reflecting the five-dimensional view of that stock’s wealth creation characteristics. The portfolios are monitored daily with rebalances occurring quarterly.
How did these strategies influence performance?
Nuveen Enhanced Core Equity Fund
Class A Shares (at net asset value) for the Nuveen Enhanced Core Equity Fund underperformed the Lipper and S&P 500 indexes during the reporting period.
We believe the quantitative, risk-controlled process described above should, under normal circumstances, cause the Fund to track its benchmark portfolio closely, with value-added potential coming from the Fund’s relative overweights / underweights of each stock versus the index. We attempt to express an overweight / underweight opinion on every stock in the benchmark based on our analysis of its five wealth creation factors.
The sum of the Fund’s individual security overweights / underweights versus the index is, by definition, equal to zero; however, the HydePark process does not constrain the portfolio to be industry or sector neutral relative to the benchmark. As a result, the Fund sometimes will overweight a sector because the stocks in that sector had what we judged to be attractive wealth creation fundamentals versus the benchmark. Performance for the portfolio can then be viewed in two parts: return attributable to the Fund’s sector weightings and return attributable to the performance of individual stocks within each sector.
On average, during the reporting period, the Fund was overweighted in energy, telecommunication services and utility stocks, with the largest single overweight in energy, where the Fund was, on average, 3.0% overweight versus the index. The largest single underweight was, on average, in information technology, where the Fund was 3.6% underweight versus the index. Overall, sector weightings were a negative to the Funds relative performance versus the index.
Performance attributable to the individual stock holdings within each sector was a positive for the Fund during the reporting period, with the stock picks within the financial sector having the largest positive impact. The holdings within the utility sector were also a
positive for the Fund. Holdings within the energy and information technology sectors resulted in negative relative performance for the Fund.
Nuveen Enhanced Mid-Cap Fund
Class A Shares (at net asset value) for the Nuveen Enhanced Mid-Cap Fund underperformed both the Lipper and Russell MidCap indexes during the reporting period.
Similar to the Nuveen Enhanced Core Equity Fund, we employ a quantitative, risk-controlled process for this Fund that weighted every stock in the portfolio according to our five wealth creation fundamentals. We believe the resultant portfolio should, under normal circumstances, track its benchmark portfolios closely, with value-added potential coming from our relative overweights / underweights of each stock versus the index. We attempt to express an overweight/underweight opinion on every stock in the benchmark based on our analysis of its five wealth creation factors.
The sum of the Fund’s individual security overweights / underweights versus the index is, by definition, equal to zero; however, the HydePark process is not constrained to be industry or sector neutral. As a result, the Fund sometimes is overweight stocks within a sector because all the individual stocks in that sector had what we judged to be attractive wealth creation fundamentals versus the benchmark in aggregate. Performance for the portfolio can then be viewed in two parts: return attributable to the Fund’s sector weightings and return attributable to the performance of individual stocks within each sector.
On average, during this reporting period, the Fund was comparatively overweighted in the energy, materials, financials and utilities sectors, with the largest overweight in financials where the Fund was, on average, 4.2% overweight versus the Russell index. The largest single sector underweight was, on average, in health care, where the Fund was 4.5% underweight versus the Russell index. Overall, sector weightings were a drag on the Fund’s relative performance versus the index.
Performance attributable to the individual stock weightings within each sector was a net negative for the Fund during this period. Stock selection was positive in the financial, information technology, telecommunications and utilities sectors. Selection was a negative within the energy, consumer discretionary, industrials, and health care sectors.
| 1 | The Lipper Large-Cap Core Funds Index is a managed index that represents the average annualized returns of the 30 largest funds in the Lipper Large-Cap Core Funds category. The since inception returns represent returns for the period 12/31/07-6/30/09 as returns for that time period are available only on a calendar month basis. The returns assume reinvestment of dividends, but do not reflect any applicable sales charges. You cannot invest directly in an index. |
| 2 | The S&P 500 Index is an unmanaged index generally considered representative of the U.S. stock market. The index returns assume reinvestment of dividends, but do not reflect any applicable sales charges. You cannot invest directly in an index. |
| 3 | The Lipper Mid-Cap Core Funds Index is a managed index that represents the average annualized returns of the 30 largest funds in the Lipper Mid-Cap Core Funds category. The since inception returns represent returns for the period 12/31/07-6/30/09 as returns for that time period are available only on a calendar month basis. The returns assume reinvestment of dividends, but do not reflect any applicable sales charges. You cannot invest directly in an index. |
| 4 | The Russell Midcap Index includes the smallest 800 securities in the Russell 1000 Index. The index returns assume reinvestment of dividends and do not reflect any applicable sales charges. You cannot invest directly in an index. |
Class A Shares – Average Annual Total Returns
As of 6/30/09
| | | | |
| | | 1-Year | | Since inception (12/3/2007) |
Nuveen Enhanced Core Equity Fund | | | | |
A Shares at NAV | | -27.18% | | -24.97% |
A Shares at Offer | | -31.35% | | -27.74% |
Lipper Large-Cap Core Funds Index1 | | -25.69% | | -23.00% |
S&P 500 Index2 | | -26.21% | | -23.98% |
Nuveen Enhanced Mid-Cap Fund | | | | |
A Shares at NAV | | -36.27% | | -28.15% |
A Shares at Offer | | -39.92% | | -30.80% |
Lipper Mid-Cap Core Funds Index3 | | -27.20% | | -22.00% |
Russell Midcap Index4 | | -30.36% | | -24.39% |
Returns quoted represent past performance which is no guarantee of future results. Investment returns and principal value will fluctuate so that when shares are redeemed, they may be worth more or less than their original cost. Returns less than one year are cumulative. Current performance may be higher or lower than the performance shown. Class A Shares have a 5.75% maximum sales charge. Returns at NAV would be lower if sales charges were included. Returns do not reflect the deduction of taxes that a shareholder would pay on Fund distributions or the redemption of shares. For the most recent month-end performance, visit www.nuveen.com or call (800) 257-8787.
Please see each Fund’s Spotlight Page later in this report for more complete performance data and expense ratios.
Nuveen Enhanced Core Equity Fund
Growth of an Assumed $10,000 Investment
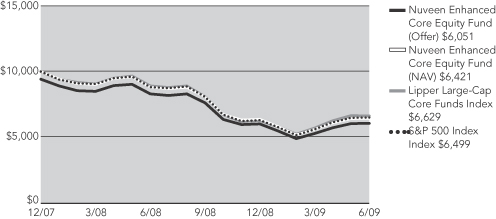
Nuveen Enhanced Mid-Cap Fund
Growth of an Assumed $10,000 Investment
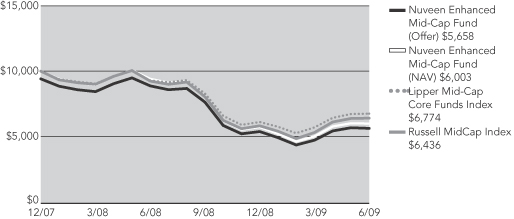
The graphs do not reflect the deduction of taxes that a shareholder may pay on Fund distributions or the redemption of shares.
The index comparisons show the change in value of a $10,000 investment in the Class A Shares of the Nuveen Funds compared with the corresponding indexes. The Lipper Large-Cap Core Funds Index is a managed index that represents the average annualized returns of the 30 largest funds in the Lipper Large-Cap Core Funds category. The S&P 500 Index is an unmanaged index generally considered to be representative of the U.S. stock market. The Lipper Mid-Cap Core Funds Index is a managed index that represents the average annualized returns of the 30 largest funds in the Lipper Mid-Cap Core Funds category. The Russell MidCap Index measures the performance of the mid-cap segment of the U.S. equity universe. The Russell MidCap Index is a subset of the Russell 1000 Index. It includes approximately 800 of the smallest securities based on a combination of their market cap and current index membership. The index returns assume reinvestment of dividends and do not reflect any initial or ongoing expenses. You cannot invest directly in an index. The Nuveen Funds’ returns include reinvestment of all dividends and distributions, and the Funds’ returns at the offer price depicted in the charts reflect the initial maximum sales charge applicable to Class A Shares (5.75%) and all ongoing Fund expenses. The performance data quoted represents past performance, which is not indicative of future results. Current performance may be lower or higher than the performance shown.
Fund Spotlight as of 6/30/09 Nuveen Enhanced Core Equity Fund
| | | | | | |
| Quick Facts | | | | | | |
| | | A Shares | | C Shares | | I Shares1 |
Fund Symbols | | NEEAX | | NEECX | | NEERX |
NAV | | $12.43 | | $12.41 | | $12.43 |
Latest Ordinary Income Distribution2 | | $0.2644 | | $0.1392 | | $0.3063 |
Inception Date | | 12/03/07 | | 12/03/07 | | 12/03/07 |
Returns quoted represent past performance which is no guarantee of future results. Investment returns and principal value will fluctuate so that when shares are redeemed, they may be worth more or less than their original cost. Current performance may be higher or lower than the performance shown. Returns without sales charges would be lower if the sales charge were included. Returns do not reflect the deduction of taxes that a shareholder would pay on Fund distributions or the redemption of shares. For the most recent month-end performance visit www.nuveen.com or call (800) 257-8787.
Returns reflect differences in sales charges and expenses, which are primarily differences in distribution and service fees. Fund returns assume reinvestment of dividends and capital gains. Class A Shares have a 5.75% maximum sales charge. Class A Share purchases of $1 million or more are sold at net asset value without an up-front sales charge but may be subject to a contingent deferred sales charge (CDSC), also known as a backend sales charge, if redeemed within twelve months of purchase. Class C Shares have a 1% CDSC for redemptions within less than one year, which is not reflected in the one-year total return. Class I Shares have no sales charge and may be purchased under limited circumstances or by specified classes of investors. Returns may reflect an expense limitation by the Fund’s investment adviser.
| | | | |
| Average Annual Total Returns as of 6/30/09 |
| | |
| A Shares | | NAV | | Offer |
1-Year | | -27.18% | | -31.35% |
Since Inception | | -24.97% | | -27.74% |
| | |
| C Shares | | NAV | | |
1-Year | | -27.78% | | |
Since Inception | | -25.56% | | |
| | |
| I Shares | | NAV | | |
1-Year | | -27.02% | | |
Since Inception | | -24.80% | | |
| | |
|
| Top Five Common Stock Holdings3 |
Exxon Mobil Corporation | | 4.4% |
AT&T Inc. | | 2.3% |
Johnson & Johnson | | 2.1% |
Procter & Gamble Company | | 2.1% |
Microsoft Corporation | | 2.0% |
Portfolio Allocation3

| | |
| Portfolio Statistics |
| Net Assets ($000) | | $10,182 |
| Number of Common Stocks | | 490 |
| | | | | | |
| Expense Ratios | | | | | | |
| Share Class | | Gross
Expense
Ratios | | Net
Expense
Ratios | | As of
Date |
| Class A | | 1.25% | | 0.73% | | 10/31/09 |
| Class C | | 2.00% | | 1.48% | | 10/31/09 |
| Class I | | 0.74% | | 0.48% | | 10/31/09 |
The expense ratios shown factor in Total Annual Fund Operating Expenses including management fees and other fees and expenses. The Net Expense Ratios reflect a contractual commitment by the Fund’s investment adviser to waive fees and reimburse expenses through October 31, 2010. The Net Expense Ratios also reflect a custodian fee credit whereby certain fees and expenses are reduced by credits earned on the Fund’s cash on deposit with the bank. There is no guarantee that the Fund will earn such credits in the future. Absent the waiver, reimbursement and custodian fee credit, the Net Expense Ratios would be higher and total returns would be less.
| 1 | Effective May 1, 2008, Class R Shares were renamed Class I Shares. See the Fund’s prospectus for more information. |
| 3 | As a percentage of total investments as of June 30, 2009. Holdings are subject to change. |
Fund Spotlight as of 6/30/09 Nuveen Enhanced Core Equity Fund
| | |
| Industries1 | | |
Oil, Gas & Consumable Fuels | | 11.1% |
Pharmaceuticals | | 8.4% |
Computers & Peripherals | | 4.9% |
Diversified Telecommunication Services | | 3.9% |
Software | | 3.8% |
Food & Staples Retailing | | 3.2% |
Diversified Financial Services | | 3.2% |
Household Products | | 2.9% |
Aerospace & Defense | | 2.7% |
Capital Markets | | 2.7% |
Commercial Banks | | 2.6% |
Media | | 2.6% |
Electric Utilities | | 2.6% |
Beverages | | 2.6% |
Communications Equipment | | 2.5% |
Industrial Conglomerates | | 2.5% |
Specialty Retail | | 2.3% |
Semiconductors & Equipment | | 2.2% |
Insurance | | 2.1% |
Tobacco | | 2.1% |
Health Care Providers & Services | | 2.1% |
Food Products | | 1.9% |
Biotechnology | | 1.9% |
Health Care Equipment & Supplies | | 1.9% |
Multi-Utilities | | 1.7% |
Other | | 19.6% |
| 1 | As a percentage of total investments as of June 30, 2009. Holdings are subject to change. |
Expense Example
As a shareholder of the Fund, you incur two types of costs: (1) transaction costs, including front and back end sales charges (loads) or redemption fees, where applicable; and (2) ongoing costs, including management fees; distribution and service (12b-1) fees, where applicable; and other Fund expenses. This Example is intended to help you understand your ongoing costs (in dollars) of investing in the Fund and to compare these costs with the ongoing costs of investing in other mutual funds.
The Example below is based on an investment of $1,000 invested at the beginning of the period and held for the period.
The information under “Actual Performance,” together with the amount you invested, allows you to estimate actual expenses incurred over the reporting period. Simply divide your account value by $1,000 (for example, an $8,600 account value divided by $1,000 = 8.60) and multiply the result by the cost shown for your share class, in the row entitled “Expenses Incurred During Period” to estimate the expenses incurred on your account during this period.
The information under “Hypothetical Performance,” provides information about hypothetical account values and hypothetical expenses based on the Fund’s actual expense ratio and an assumed rate of return of 5% per year before expenses, which is not the Fund’s actual return. The hypothetical account values and expenses may not be used to estimate the actual ending account balance or expense you incurred for the period. You may use this information to compare the ongoing costs of investing in the Fund and other Funds. To do so, compare this 5% hypothetical example with the 5% hypothetical examples that appear in the shareholder reports of the other funds.
Please note that the expenses shown in the table are meant to highlight your ongoing costs only and do not reflect any transactional costs, such as front and back end sales charges (loads) or redemption fees, where applicable. Therefore, the hypothetical information is useful in comparing ongoing costs only, and will not help you determine the relative total costs of owning different funds or share classes. In addition, if these transactional costs were included, your costs would have been higher.
| | | | | | | | | | | | | | | | | | | | |
| | | | | | | | | | | Hypothetical Performance |
| | | Actual Performance | | | | (5% return before expenses) |
| | | A Shares | | C Shares | | I Shares | | | | A Shares | | C Shares | | I Shares |
| Beginning Account Value (1/01/09) | | $ | 1,000.00 | | $ | 1,000.00 | | $ | 1,000.00 | | | | $ | 1,000.00 | | $ | 1,000.00 | | $ | 1,000.00 |
| Ending Account Value (6/30/09) | | $ | 1,005.70 | | $ | 1,008.00 | | $ | 1,006.50 | | | | $ | 1,021.08 | | $ | 1,017.36 | | $ | 1,022.32 |
| Expenses Incurred During Period | | $ | 3.72 | | $ | 7.45 | | $ | 2.48 | | | | $ | 3.75 | | $ | 7.48 | | $ | 2.50 |
For each class of the Fund, expenses are equal to the Fund’s annualized net expense ratio of .75%, 1.50% and .50% for Classes A, C and I, respectively, multiplied by the average account value over the period, multiplied by 181/365 (to reflect the one-half year period).
Fund Spotlight as of 6/30/09 Nuveen Enhanced Mid-Cap Fund
| | | | | | |
| Quick Facts | | | | | | |
| | | A Shares | | C Shares | | I Shares1 |
Fund Symbols | | NDPAX | | NDPCX | | NDPRX |
NAV | | $11.65 | | $11.66 | | $11.65 |
Latest Ordinary Income Distribution2 | | $0.1904 | | $0.0654 | | $0.2323 |
Inception Date | | 12/03/07 | | 12/03/07 | | 12/03/07 |
Returns quoted represent past performance which is no guarantee of future results. Investment returns and principal value will fluctuate so that when shares are redeemed, they may be worth more or less than their original cost. Current performance may be higher or lower than the performance shown. Returns without sales charges would be lower if the sales charge were included. Returns do not reflect the deduction of taxes that a shareholder would pay on Fund distributions or the redemption of shares. For the most recent month-end performance visit www.nuveen.com or call (800) 257-8787.
Returns reflect differences in sales charges and expenses, which are primarily differences in distribution and service fees. Fund returns assume reinvestment of dividends and capital gains. Class A Shares have a 5.75% maximum sales charge. Class A Share purchases of $1 million or more are sold at net asset value without an up-front sales charge but may be subject to a contingent deferred sales charge (CDSC), also known as a backend sales charge, if redeemed within twelve months of purchase. Class C Shares have a 1% CDSC for redemptions within less than one year, which is not reflected in the one-year total return. Class I Shares have no sales charge and may be purchased under limited circumstances or by specified classes of investors. Returns may reflect an expense limitation by the Fund’s investment adviser.
| | | | |
| Average Annual Total Returns as of 6/30/09 |
| | |
| A Shares | | NAV | | Offer |
1-Year | | -36.27% | | -39.92% |
Since Inception | | -28.15% | | -30.80% |
| | |
| C Shares | | NAV | | |
1-Year | | -36.70% | | |
Since Inception | | -28.66% | | |
| | |
| I Shares | | NAV | | |
1-Year | | -36.09% | | |
Since Inception | | -27.96% | | |
| | |
| |
| Top Five Common Stock Holdings4 | | |
YUM! Brands, Inc. | | 1.0% |
Lincoln National Corporation | | 0.8% |
Noble Energy, Inc. | | 0.8% |
Kohl’s Corporation | | 0.8% |
H.J. Heinz Company | | 0.8% |
Portfolio Allocation3
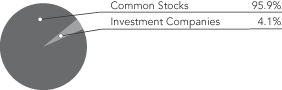
| | |
| Portfolio Statistics |
| Net Assets ($000) | | $1,907 |
| Number of Common Stocks | | 490 |
| | | | | | |
| Expense Ratios | | | | | | |
| Share Class | | Gross
Expense
Ratios | | Net
Expense
Ratios | | As of
Date |
| Class A | | 3.81% | | 0.76% | | 10/31/09 |
| Class C | | 4.56% | | 1.51% | | 10/31/09 |
| Class I | | 3.52% | | 0.51% | | 10/31/09 |
The expense ratios shown factor in Total Annual Fund Operating Expenses including management fees and other fees and expenses. The Net Expense Ratios reflect a contractual commitment by the Fund’s investment adviser to waive fees and reimburse expenses through October 31, 2010. The Net Expense Ratios also reflect a custodian fee credit whereby certain fees and expenses are reduced by credits earned on the Fund’s cash on deposit with the bank. There is no guarantee that the Fund will earn such credits in the future. Absent the waiver, reimbursement and custodian fee credit, the Net Expense Ratios would be higher and total returns would be less.
| 1 | Effective May 1, 2008, Class R Shares were renamed Class I Shares. See the Fund’s prospectus for more information. |
| 3 | As a percentage of total investments as of June 30, 2009. Holdings are subject to change. |
| 4 | As a percentage of total common stocks as of June 30, 2009. Holdings are subject to change. |
Fund Spotlight as of 6/30/09 Nuveen Enhanced Mid-Cap Fund
| | |
| Industries1 | | |
Multi-Utilities | | 5.3% |
Oil, Gas & Consumable Fuels | | 5.2% |
Insurance | | 5.1% |
Specialty Retail | | 4.6% |
Energy Equipment & Services | | 4.5% |
Food Products | | 3.8% |
Machinery | | 3.8% |
Electric Utilities | | 3.7% |
Specialized REIT | | 3.1% |
Multiline Retail | | 3.1% |
Semiconductors & Equipment | | 3.0% |
Media | | 2.8% |
Chemicals | | 2.5% |
Hotels, Restaurants & Leisure | | 2.5% |
Health Care Providers & Services | | 2.4% |
Aerospace & Defense | | 1.9% |
Capital Markets | | 1.8% |
Commercial Banks | | 1.8% |
IT Services | | 1.8% |
Residential REIT | | 1.7% |
Diversified Telecommunication Services | | 1.5% |
Beverages | | 1.5% |
Household Durables | | 1.5% |
Independent Power Producers & Energy Traders | | 1.4% |
Gas Utilities | | 1.3% |
Containers & Packaging | | 1.2% |
Electrical Equipment | | 1.2% |
Metals & Mining | | 1.1% |
Computers & Peripherals | | 1.1% |
Thrifts & Mortgage Finance | | 1.0% |
Automobile | | 1.0% |
Professional Services | | 1.0% |
Food & Staples Retailing | | 1.0% |
Other | | 19.8% |
| 1 | As a percentage of total common stocks as of June 30, 2009. Holdings are subject to change. |
Expense Example
As a shareholder of the Fund, you incur two types of costs: (1) transaction costs, including front and back end sales charges (loads) or redemption fees, where applicable; and (2) ongoing costs, including management fees; distribution and service (12b-1) fees, where applicable; and other Fund expenses. This Example is intended to help you understand your ongoing costs (in dollars) of investing in the Fund and to compare these costs with the ongoing costs of investing in other mutual funds.
The Example below is based on an investment of $1,000 invested at the beginning of the period and held for the period.
The information under “Actual Performance,” together with the amount you invested, allows you to estimate actual expenses incurred over the reporting period. Simply divide your account value by $1,000 (for example, an $8,600 account value divided by $1,000 = 8.60) and multiply the result by the cost shown for your share class, in the row entitled “Expenses Incurred During Period” to estimate the expenses incurred on your account during this period.
The information under “Hypothetical Performance,” provides information about hypothetical account values and hypothetical expenses based on the Fund’s actual expense ratio and an assumed rate of return of 5% per year before expenses, which is not the Fund’s actual return. The hypothetical account values and expenses may not be used to estimate the actual ending account balance or expense you incurred for the period. You may use this information to compare the ongoing costs of investing in the Fund and other Funds. To do so, compare this 5% hypothetical example with the 5% hypothetical examples that appear in the shareholder reports of the other funds.
Please note that the expenses shown in the table are meant to highlight your ongoing costs only and do not reflect any transactional costs, such as front and back end sales charges (loads) or redemption fees, where applicable. Therefore, the hypothetical information is useful in comparing ongoing costs only, and will not help you determine the relative total costs of owning different funds or share classes. In addition, if these transactional costs were included, your costs would have been higher.
| | | | | | | | | | | | | | | | | | | | |
| | | | | | | Hypothetical Performance |
| | | Actual Performance | | | | (5% return before expenses) |
| | | A Shares | | C Shares | | I Shares | | | | A Shares | | C Shares | | I Shares |
| Beginning Account Value (1/01/09) | | $ | 1,000.00 | | $ | 1,000.00 | | $ | 1,000.00 | | | | $ | 1,000.00 | | $ | 1,000.00 | | $ | 1,000.00 |
| Ending Account Value (6/30/09) | | $ | 1,046.70 | | $ | 1,043.90 | | $ | 1,048.60 | | | | $ | 1,020.83 | | $ | 1,017.11 | | $ | 1,022.07 |
| Expenses Incurred During Period | | $ | 4.05 | | $ | 7.83 | | $ | 2.79 | | | | $ | 4.00 | | $ | 7.73 | | $ | 2.75 |
For each class of the Fund, expenses are equal to the Fund’s annualized net expense ratio of .80%, 1.55% and .55% for Classes A, C and I, respectively, multiplied by the average account value over the period, multiplied by 181/365 (to reflect the one-half year period).
Report of
Independent Registered Public Accounting Firm
To the Board of Trustees and Shareholders of
Nuveen Investment Trust:
In our opinion, the accompanying statements of assets and liabilities, including the portfolios of investments, and the related statements of operations, of changes in net assets and the financial highlights present fairly, in all material respects, the financial position of Nuveen Enhanced Core Equity Fund and Nuveen Enhanced Mid-Cap Fund (each a series of the Nuveen Investment Trust, hereafter referred to as the “Funds”) at June 30, 2009, the results of their operations for the year then ended, the changes in their net assets and the financial highlights for the year ended June 30, 2009 and the period December 3, 2007 (commencement of operations) through June 30, 2009, in conformity with accounting principles generally accepted in the United States of America. These financial statements and financial highlights (hereafter referred to as “financial statements”) are the responsibility of the Funds’ management; our responsibility is to express an opinion on these financial statements based on our audits. We conducted our audits of these financial statements in accordance with the standards of the Public Company Accounting Oversight Board (United States). Those standards require that we plan and perform the audit to obtain reasonable assurance about whether the financial statements are free of material misstatement. An audit includes examining, on a test basis, evidence supporting the amounts and disclosures in the financial statements, assessing the accounting principles used and significant estimates made by management, and evaluating the overall financial statement presentation. We believe that our audits, which included confirmation of securities at June 30, 2009 by correspondence with the custodian and brokers, provide a reasonable basis for our opinion.
PRICEWATERHOUSECOOPERS LLP
Chicago, IL
August 24, 2009
Portfolio of Investments
Nuveen Enhanced Core Equity Fund
June 30, 2009
| | | | | | | | | | | |
| Shares | | Description (1) | | | | | | | | Value |
| | | | | | | | | | | |
| | COMMON STOCKS – 99.6% | | | | | | | | | |
| | | | | |
| | Aerospace & Defense – 2.7% | | | | | | | | | |
| | | | | |
| 800 | | Boeing Company | | | | | | | | $ | 34,000 |
| | | | | |
| 400 | | General Dynamics Corporation | | | | | | | | | 22,156 |
| | | | | |
| 200 | | Goodrich Corporation | | | | | | | | | 9,994 |
| | | | | |
| 900 | | Honeywell International Inc. | | | | | | | | | 28,260 |
| | | | | |
| 200 | | ITT Industries, Inc. | | | | | | | | | 8,900 |
| | | | | |
| 200 | | L-3 Communications Holdings, Inc. | | | | | | | | | 13,876 |
| | | | | |
| 400 | | Lockheed Martin Corporation | | | | | | | | | 32,260 |
| | | | | |
| 400 | | Northrop Grumman Corporation | | | | | | | | | 18,272 |
| | | | | |
| 200 | | Precision Castparts Corporation | | | | | | | | | 14,606 |
| | | | | |
| 500 | | Raytheon Company | | | | | | | | | 22,215 |
| | | | | |
| 200 | | Rockwell Collins, Inc. | | | | | | | | | 8,346 |
| | | | | |
| 1,200 | | United Technologies Corporation | | | | | | | | | 62,352 |
| | Total Aerospace & Defense | | | | | | | | | 275,237 |
| | Air Freight & Logistics – 0.9% | | | | | | | | | |
| | | | | |
| 200 | | C.H. Robinson Worldwide, Inc. | | | | | | | | | 10,430 |
| | | | | |
| 200 | | Expeditors International of Washington Inc. | | | | | | | | | 6,668 |
| | | | | |
| 300 | | FedEx Corporation | | | | | | | | | 16,686 |
| | | | | |
| 1,200 | | United Parcel Service, Inc., Class B | | | | | | | | | 59,988 |
| | Total Air Freight & Logistics | | | | | | | | | 93,772 |
| | Airlines – 0.0% | | | | | | | | | |
| | | | | |
| 600 | | Southwest Airlines Co. | | | | | | | | | 4,038 |
| | Auto Components – 0.1% | | | | | | | | | |
| | | | | |
| 100 | | Goodyear Tire & Rubber Company, (2) | | | | | | | | | 1,126 |
| | | | | |
| 600 | | Johnson Controls, Inc. | | | | | | | | | 13,032 |
| | Total Auto Components | | | | | | | | | 14,158 |
| | Automobiles – 0.3% | | | | | | | | | |
| | | | | |
| 4,200 | | Ford Motor Company, (2) | | | | | | | | | 25,494 |
| | | | | |
| 200 | | Harley-Davidson, Inc. | | | | | | | | | 3,242 |
| | Total Automobiles | | | | | | | | | 28,736 |
| | Beverages – 2.5% | | | | | | | | | |
| | | | | |
| 100 | | Brown-Forman Corporation | | | | | | | | | 4,298 |
| | | | | |
| 2,500 | | Coca-Cola Company | | | | | | | | | 119,975 |
| | | | | |
| 400 | | Coca-Cola Enterprises Inc. | | | | | | | | | 6,660 |
| | | | | |
| 100 | | Constellation Brands, Inc., Class A, (2) | | | | | | | | | 1,268 |
| | | | | |
| 300 | | Dr. Pepper Snapple Group, (2) | | | | | | | | | 6,357 |
| | | | | |
| 200 | | Molson Coors Brewing Company, Class B | | | | | | | | | 8,466 |
| | | | | |
| 200 | | Pepsi Bottling Group, Inc. | | | | | | | | | 6,768 |
| | | | | |
| 1,900 | | PepsiCo, Inc. | | | | | | | | | 104,424 |
| | Total Beverages | | | | | | | | | 258,216 |
| | Biotechnology – 1.9% | | | | | | | | | |
| | | | | |
| 1,600 | | Amgen Inc., (2) | | | | | | | | | 84,704 |
| | | | | |
| 400 | | Biogen Idec Inc., (2) | | | | | | | | | 18,060 |
| | | | | |
| 400 | | Celgene Corporation, (2) | | | | | | | | | 19,136 |
| | | | | |
| 100 | | Cephalon, Inc., (2) | | | | | | | | | 5,665 |
Portfolio of Investments
Nuveen Enhanced Core Equity Fund (continued)
June 30, 2009
| | | | | | | | | | | |
| Shares | | Description (1) | | | | | | | | Value |
| | | | | | | | | | | |
| | Biotechnology (continued) | | | | | | | | | |
| | | | | |
| 300 | | Genzyme Corporation, (2) | | | | | | | | $ | 16,701 |
| | | | | |
| 1,000 | | Gilead Sciences, Inc., (2) | | | | | | | | | 46,840 |
| | Total Biotechnology | | | | | | | | | 191,106 |
| | Building Products – 0.0% | | | | | | | | | |
| | | | | |
| 400 | | Masco Corporation | | | | | | | | | 3,832 |
| | Capital Markets – 2.7% | | | | | | | | | |
| | | | | |
| 300 | | Ameriprise Financial, Inc. | | | | | | | | | 7,281 |
| | | | | |
| 1,100 | | Bank of New York Company, Inc. | | | | | | | | | 32,241 |
| | | | | |
| 1,100 | | Charles Schwab Corporation | | | | | | | | | 19,294 |
| | | | | |
| 400 | | E*Trade Group Inc., (2) | | | | | | | | | 512 |
| | | | | |
| 100 | | Federated Investors Inc. | | | | | | | | | 2,409 |
| | | | | |
| 200 | | Franklin Resources, Inc. | | | | | | | | | 14,402 |
| | | | | |
| 600 | | Goldman Sachs Group, Inc. | | | | | | | | | 88,464 |
| | | | | |
| 400 | | Invesco LTD | | | | | | | | | 7,128 |
| | | | | |
| 100 | | Janus Capital Group Inc. | | | | | | | | | 1,140 |
| | | | | |
| 100 | | Legg Mason, Inc. | | | | | | | | | 2,438 |
| | | | | |
| 1,400 | | Morgan Stanley | | | | | | | | | 39,914 |
| | | | | |
| 300 | | Northern Trust Corporation | | | | | | | | | 16,104 |
| | | | | |
| 600 | | State Street Corporation | | | | | | | | | 28,320 |
| | | | | |
| 300 | | T. Rowe Price Group Inc. | | | | | | | | | 12,501 |
| | Total Capital Markets | | | | | | | | | 272,148 |
| | Chemicals – 1.6% | | | | | | | | | |
| | | | | |
| 200 | | Air Products & Chemicals Inc. | | | | | | | | | 12,918 |
| | | | | |
| 50 | | CF Industries Holdings, Inc. | | | | | | | | | 3,707 |
| | | | | |
| 1,100 | | Dow Chemical Company | | | | | | | | | 17,754 |
| | | | | |
| 1,200 | | E.I. Du Pont de Nemours and Company | | | | | | | | | 30,744 |
| | | | | |
| 100 | | Eastman Chemical Company | | | | | | | | | 3,790 |
| | | | | |
| 200 | | Ecolab Inc. | | | | | | | | | 7,798 |
| | | | | |
| 100 | | International Flavors & Fragrances Inc. | | | | | | | | | 3,272 |
| | | | | |
| 500 | | Monsanto Company | | | | | | | | | 37,170 |
| | | | | |
| 200 | | PPG Industries, Inc. | | | | | | | | | 8,780 |
| | | | | |
| 400 | | Praxair, Inc. | | | | | | | | | 28,428 |
| | | | | |
| 200 | | Sigma-Aldrich Corporation | | | | | | | | | 9,912 |
| | Total Chemicals | | | | | | | | | 164,273 |
| | Commercial Banks – 2.6% | | | | | | | | | |
| | | | | |
| 1,200 | | BB&T Corporation | | | | | | | | | 26,376 |
| | | | | |
| 200 | | Comerica Incorporated | | | | | | | | | 4,230 |
| | | | | |
| 300 | | Fifth Third Bancorp. | | | | | | | | | 2,130 |
| | | | | |
| 300 | | First Horizon National Corporation, (2) | | | | | | | | | 3,604 |
| | | | | |
| 300 | | Huntington BancShares Inc. | | | | | | | | | 1,254 |
| | | | | |
| 300 | | KeyCorp. | | | | | | | | | 1,572 |
| | | | | |
| 100 | | M&T Bank Corporation | | | | | | | | | 5,093 |
| | | | | |
| 200 | | Marshall and Ilsley Corporation | | | | | | | | | 960 |
| | | | | |
| 600 | | PNC Financial Services Group, Inc. | | | | | | | | | 23,286 |
| | | | | |
| 1,300 | | Regions Financial Corporation | | | | | | | | | 5,252 |
| | | | | | | | | | | |
| Shares | | Description (1) | | | | | | | | Value |
| | | | | | | | | | | |
| | Commercial Banks (continued) | | | | | | | | | |
| | | | | |
| 200 | | SunTrust Banks, Inc. | | | | | | | | $ | 3,290 |
| | | | | |
| 2,200 | | U.S. Bancorp | | | | | | | | | 39,424 |
| | | | | |
| 6,100 | | Wells Fargo & Company | | | | | | | | | 147,986 |
| | | | | |
| 100 | | Zions Bancorporation | | | | | | | | | 1,156 |
| | Total Commercial Banks | | | | | | | | | 265,613 |
| | Commercial Services & Supplies – 0.6% | | | | | | | | | |
| | | | | |
| 100 | | Avery Dennison Corporation | | | | | | | | | 2,568 |
| | | | | |
| 200 | | Cintas Corporation | | | | | | | | | 4,568 |
| | | | | |
| 200 | | Iron Mountain Inc., (2) | | | | | | | | | 5,750 |
| | | | | |
| 300 | | Pitney Bowes Inc. | | | | | | | | | 6,579 |
| | | | | |
| 300 | | R.R. Donnelley & Sons Company | | | | | | | | | 3,486 |
| | | | | |
| 400 | | Republic Services, Inc. | | | | | | | | | 9,764 |
| | | | | |
| 100 | | Stericycle Inc., (2) | | | | | | | | | 5,153 |
| | | | | |
| 700 | | Waste Management, Inc. | | | | | | | | | 19,712 |
| | Total Commercial Services & Supplies | | | | | | | | | 57,580 |
| | Communications Equipment – 2.5% | | | | | | | | | |
| | | | | |
| 6,900 | | Cisco Systems, Inc., (2) | | | | | | | | | 128,616 |
| | | | | |
| 200 | | Harris Corporation | | | | | | | | | 5,672 |
| | | | | |
| 100 | | JDS Uniphase Corporation, (2) | | | | | | | | | 572 |
| | | | | |
| 700 | | Juniper Networks Inc., (2) | | | | | | | | | 16,520 |
| | | | | |
| 2,200 | | Motorola, Inc. | | | | | | | | | 14,586 |
| | | | | |
| 1,800 | | QUALCOMM, Inc. | | | | | | | | | 81,360 |
| | | | | |
| 600 | | Tellabs Inc., (2) | | | | | | | | | 3,438 |
| | Total Communications Equipment | | | | | | | | | 250,764 |
| | Computers & Peripherals – 4.9% | | | | | | | | | |
| | | | | |
| 900 | | Apple, Inc., (2) | | | | | | | | | 128,187 |
| | | | | |
| 1,500 | | Dell Inc., (2) | | | | | | | | | 20,595 |
| | | | | |
| 2,200 | | EMC Corporation, (2) | | | | | | | | | 28,820 |
| | | | | |
| 2,600 | | Hewlett-Packard Company | | | | | | | | | 100,490 |
| | | | | |
| 1,800 | | International Business Machines Corporation (IBM) | | | | | | | | | 187,956 |
| | | | | |
| 100 | | Lexmark International, Inc., Class A, (2) | | | | | | | | | 1,585 |
| | | | | |
| 400 | | Network Appliance Inc., (2) | | | | | | | | | 7,888 |
| | | | | |
| 200 | | QLogic Corporation, (2) | | | | | | | | | 2,536 |
| | | | | |
| 200 | | SanDisk Corporation, (2) | | | | | | | | | 2,938 |
| | | | | |
| 800 | | Sun Microsystems Inc., (2) | | | | | | | | | 7,376 |
| | | | | |
| 200 | | Teradata Corporation, (2) | | | | | | | | | 4,686 |
| | | | | |
| 300 | | Western Digital Corporation, (2) | | | | | | | | | 7,950 |
| | Total Computers & Peripherals | | | | | | | | | 501,007 |
| | Construction & Engineering – 0.2% | | | | | | | | | |
| | | | | |
| 200 | | Fluor Corporation | | | | | | | | | 10,258 |
| | | | | |
| 100 | | Jacobs Engineering Group, Inc., (2) | | | | | | | | | 4,209 |
| | | | | |
| 200 | | Quanta Services Incorporated, (2) | | | | | | | | | 4,626 |
| | Total Construction & Engineering | | | | | | | | | 19,093 |
| | Construction Materials – 0.0% | | | | | | | | | |
| | | | | |
| 100 | | Vulcan Materials Company | | | | | | | | | 4,310 |
Portfolio of Investments
Nuveen Enhanced Core Equity Fund (continued)
June 30, 2009
| | | | | | | | | | | |
| Shares | | Description (1) | | | | | | | | Value |
| | | | | | | | | | | |
| | Consumer Finance – 0.5% | | | | | | | | | |
| | | | | |
| 1,400 | | American Express Company | | | | | | | | $ | 32,536 |
| | | | | |
| 500 | | Capital One Financial Corporation | | | | | | | | | 10,940 |
| | | | | |
| 600 | | Discover Financial Services | | | | | | | | | 6,162 |
| | | | | |
| 100 | | SLM Corporation, (2) | | | | | | | | | 1,027 |
| | Total Consumer Finance | | | | | | | | | 50,665 |
| | Containers & Packaging – 0.2% | | | | | | | | | |
| | | | | |
| 100 | | Ball Corporation | | | | | | | | | 4,516 |
| | | | | |
| 200 | | Bemis Company, Inc. | | | | | | | | | 5,040 |
| | | | | |
| 100 | | Owens-Illinois, Inc., (2) | | | | | | | | | 2,801 |
| | | | | |
| 200 | | Pactiv Corporation, (2) | | | | | | | | | 4,340 |
| | | | | |
| 300 | | Sealed Air Corporation | | | | | | | | | 5,535 |
| | Total Containers & Packaging | | | | | | | | | 22,232 |
| | Distributors – 0.1% | | | | | | | | | |
| | | | | |
| 200 | | Genuine Parts Company | | | | | | | | | 6,712 |
| | Diversified Consumer Services – 0.3% | | | | | | | | | |
| | | | | |
| 200 | | Apollo Group, Inc., (2) | | | | | | | | | 14,224 |
| | | | | |
| 100 | | Devry, Inc. | | | | | | | | | 5,004 |
| | | | | |
| 400 | | H & R Block Inc. | | | | | | | | | 6,892 |
| | Total Diversified Consumer Services | | | | | | | | | 26,120 |
| | Diversified Financial Services – 3.2% | | | | | | | | | |
| | | | | |
| 6,800 | | Bank of America Corporation | | | | | | | | | 89,760 |
| | | | | |
| 500 | | CIT Group Inc. | | | | | | | | | 1,075 |
| | | | | |
| 3,700 | | Citigroup Inc. | | | | | | | | | 10,989 |
| | | | | |
| 100 | | CME Group, Inc. | | | | | | | | | 31,111 |
| | | | | |
| 100 | | Intercontinental Exchange Inc., (2) | | | | | | | | | 11,424 |
| | | | | |
| 4,700 | | JPMorgan Chase & Co. | | | | | | | | | 160,317 |
| | | | | |
| 100 | | Leucadia National Corporation, (2) | | | | | | | | | 2,109 |
| | | | | |
| 200 | | Moody’s Corporation | | | | | | | | | 5,270 |
| | | | | |
| 200 | | Nasdaq Stock Market, Inc., (2) | | | | | | | | | 4,262 |
| | | | | |
| 200 | | New York Stock Exchange Euronext | | | | | | | | | 5,450 |
| | Total Diversified Financial Services | | | | | | | | | 321,767 |
| | Diversified Telecommunication Services – 3.9% | | | | | | | | | |
| | | | | |
| 9,200 | | AT&T Inc. | | | | | | | | | 228,528 |
| | | | | |
| 200 | | CenturyTel, Inc. | | | | | | | | | 6,140 |
| | | | | |
| 600 | | Frontier Communications Corporation | | | | | | | | | 4,284 |
| | | | | |
| 3,300 | | Qwest Communications International Inc. | | | | | | | | | 13,695 |
| | | | | |
| 4,600 | | Verizon Communications Inc. | | | | | | | | | 141,358 |
| | | | | |
| 700 | | Windstream Corporation | | | | | | | | | 5,852 |
| | Total Diversified Telecommunication Services | | | | | | | | | 399,857 |
| | Electric Utilities – 2.6% | | | | | | | | | |
| | | | | |
| 200 | | Allegheny Energy, Inc. | | | | | | | | | 5,130 |
| | | | | |
| 700 | | American Electric Power Company, Inc. | | | | | | | | | 20,223 |
| | | | | |
| 2,100 | | Duke Energy Corporation | | | | | | | | | 30,639 |
| | | | | |
| 400 | | Edison International | | | | | | | | | 12,584 |
| | | | | |
| 200 | | Entergy Corporation | | | | | | | | | 15,504 |
| | | | | | | | | | | |
| Shares | | Description (1) | | | | | | | | Value |
| | | | | | | | | | | |
| | Electric Utilities (continued) | | | | | | | | | |
| | | | | |
| 800 | | Exelon Corporation | | | | | | | | $ | 40,968 |
| | | | | |
| 400 | | FirstEnergy Corp. | | | | | | | | | 15,500 |
| | | | | |
| 600 | | FPL Group, Inc. | | | | | | | | | 34,116 |
| | | | | |
| 300 | | Northeast Utilities | | | | | | | | | 6,693 |
| | | | | |
| 300 | | Pepco Holdings, Inc. | | | | | | | | | 4,032 |
| | | | | |
| 200 | | Pinnacle West Capital Corporation | | | | | | | | | 6,030 |
| | | | | |
| 500 | | PPL Corporation | | | | | | | | | 16,480 |
| | | | | |
| 500 | | Progress Energy, Inc. | | | | | | | | | 18,915 |
| | | | | |
| 1,100 | | Southern Company | | | | | | | | | 34,276 |
| | Total Electric Utilities | | | | | | | | | 261,090 |
| | Electrical Equipment – 0.4% | | | | | | | | | |
| | | | | |
| 200 | | Cooper Industries, Ltd., Class A | | | | | | | | | 6,210 |
| | | | | |
| 900 | | Emerson Electric Company | | | | | | | | | 29,160 |
| | | | | |
| 200 | | Rockwell Automation, Inc. | | | | | | | | | 6,424 |
| | Total Electrical Equipment | | | | | | | | | 41,794 |
| | Electronic Equipment & Instruments – 0.5% | | | | | | | | | |
| | | | | |
| 300 | | Agilent Technologies, Inc., (2) | | | | | | | | | 6,093 |
| | | | | |
| 200 | | Amphenol Corporation, Class A | | | | | | | | | 6,328 |
| | | | | |
| 1,700 | | Corning Incorporated | | | | | | | | | 27,302 |
| | | | | |
| 100 | | FLIR Systems Inc., (2) | | | | | | | | | 2,256 |
| | | | | |
| 300 | | Jabil Circuit Inc. | | | | | | | | | 2,226 |
| | | | | |
| 100 | | Molex Inc. | | | | | | | | | 1,555 |
| | | | | |
| 400 | | Tyco Electronics, Limited | | | | | | | | | 7,436 |
| | Total Electronic Equipment & Instruments | | | | | | | | | 53,196 |
| | Energy Equipment & Services – 1.7% | | | | | | | | | |
| | | | | |
| 300 | | Baker Hughes Incorporated | | | | | | | | | 10,932 |
| | | | | |
| 400 | | BJ Services Company | | | | | | | | | 5,452 |
| | | | | |
| 300 | | Cooper Cameron Corporation, (2) | | | | | | | | | 8,490 |
| | | | | |
| 100 | | Diamond Offshore Drilling, Inc. | | | | | | | | | 8,305 |
| | | | | |
| 200 | | ENSCO International Incorporated | | | | | | | | | 6,974 |
| | | | | |
| 200 | | FMC Technologies Inc., (2) | | | | | | | | | 7,516 |
| | | | | |
| 900 | | Halliburton Company | | | | | | | | | 18,630 |
| | | | | |
| 400 | | Nabors Industries Inc., (2) | | | | | | | | | 6,232 |
| | | | | |
| 500 | | National-Oilwell Varco Inc., (2) | | | | | | | | | 16,330 |
| | | | | |
| 200 | | Rowan Companies Inc. | | | | | | | | | 3,864 |
| | | | | |
| 1,300 | | Schlumberger Limited | | | | | | | | | 70,343 |
| | | | | |
| 200 | | Smith International, Inc. | | | | | | | | | 5,150 |
| | Total Energy Equipment & Services | | | | | | | | | 168,218 |
| | Food & Staples Retailing – 3.2% | | | | | | | | | |
| | | | | |
| 500 | | Costco Wholesale Corporation | | | | | | | | | 22,850 |
| | | | | |
| 1,700 | | CVS Caremark Corporation | | | | | | | | | 54,179 |
| | | | | |
| 900 | | Kroger Co. | | | | | | | | | 19,845 |
| | | | | |
| 500 | | Safeway Inc. | | | | | | | | | 10,185 |
| | | | | |
| 300 | | SUPERVALU INC. | | | | | | | | | 3,885 |
| | | | | |
| 800 | | Sysco Corporation | | | | | | | | | 17,984 |
Portfolio of Investments
Nuveen Enhanced Core Equity Fund (continued)
June 30, 2009
| | | | | | | | | | | |
| Shares | | Description (1) | | | | | | | | Value |
| | | | | | | | | | | |
| | Food & Staples Retailing (continued) | | | | | | | | | |
| | | | | |
| 1,200 | | Walgreen Co. | | | | | | | | $ | 35,280 |
| | | | | |
| 3,200 | | Wal-Mart Stores, Inc. | | | | | | | | | 155,008 |
| | | | | |
| 200 | | Whole Foods Market, Inc. | | | | | | | | | 3,796 |
| | Total Food & Staples Retailing | | | | | | | | | 323,012 |
| | Food Products – 1.9% | | | | | | | | | |
| | | | | |
| 900 | | Archer-Daniels-Midland Company | | | | | | | | | 24,093 |
| | | | | |
| 300 | | Campbell Soup Company | | | | | | | | | 8,826 |
| | | | | |
| 700 | | ConAgra Foods, Inc. | | | | | | | | | 13,342 |
| | | | | |
| 300 | | Dean Foods Company, (2) | | | | | | | | | 5,757 |
| | | | | |
| 400 | | General Mills, Inc. | | | | | | | | | 22,408 |
| | | | | |
| 400 | | H.J. Heinz Company | | | | | | | | | 14,280 |
| | | | | |
| 200 | | Hershey Foods Corporation | | | | | | | | | 7,200 |
| | | | | |
| 100 | | Hormel Foods Corporation | | | | | | | | | 3,454 |
| | | | | |
| 100 | | JM Smucker Company | | | | | | | | | 4,866 |
| | | | | |
| 300 | | Kellogg Company | | | | | | | | | 13,971 |
| | | | | |
| 2,200 | | Kraft Foods Inc. | | | | | | | | | 55,748 |
| | | | | |
| 200 | | McCormick & Company, Incorporated | | | | | | | | | 6,506 |
| | | | | |
| 900 | | Sara Lee Corporation | | | | | | | | | 8,784 |
| | | | | |
| 400 | | Tyson Foods, Inc., Class A | | | | | | | | | 5,044 |
| | Total Food Products | | | | | | | | | 194,279 |
| | Gas Utilities – 0.1% | | | | | | | | | |
| | | | | |
| 100 | | EQT Corporation | | | | | | | | | 3,491 |
| | | | | |
| 100 | | Nicor Inc. | | | | | | | | | 3,462 |
| | | | | |
| 200 | | Questar Corporation | | | | | | | | | 6,212 |
| | Total Gas Utilities | | | | | | | | | 13,165 |
| | Health Care Equipment & Supplies – 1.9% | | | | | | | | | |
| | | | | |
| 800 | | Baxter International Inc. | | | | | | | | | 42,368 |
| | | | | |
| 300 | | Becton, Dickinson and Company | | | | | | | | | 21,393 |
| | | | | |
| 1,700 | | Boston Scientific Corporation, (2) | | | | | | | | | 17,238 |
| | | | | |
| 100 | | C. R. Bard, Inc. | | | | | | | | | 7,445 |
| | | | | |
| 200 | | DENTSPLY International Inc. | | | | | | | | | 6,104 |
| | | | | |
| 200 | | Hospira Inc., (2) | | | | | | | | | 7,704 |
| | | | | |
| 1,300 | | Medtronic, Inc. | | | | | | | | | 45,357 |
| | | | | |
| 400 | | Saint Jude Medical Inc., (2) | | | | | | | | | 16,440 |
| | | | | |
| 200 | | Stryker Corporation | | | | | | | | | 7,948 |
| | | | | |
| 100 | | Varian Medical Systems, Inc., (2) | | | | | | | | | 3,514 |
| | | | | |
| 300 | | Zimmer Holdings, Inc., (2) | | | | | | | | | 12,780 |
| | Total Health Care Equipment & Supplies | | | | | | | | | 188,291 |
| | Health Care Providers & Services – 2.1% | | | | | | | | | |
| | | | | |
| 500 | | Aetna Inc. | | | | | | | | | 12,525 |
| | | | | |
| 400 | | AmerisourceBergen Corporation | | | | | | | | | 7,096 |
| | | | | |
| 500 | | Cardinal Health, Inc. | | | | | | | | | 15,275 |
| | | | | |
| 200 | | CIGNA Corporation | | | | | | | | | 4,818 |
| | | | | |
| 100 | | Coventry Health Care, Inc., (2) | | | | | | | | | 1,871 |
| | | | | |
| 100 | | Davita Inc., (2) | | | | | | | | | 4,946 |
| | | | | | | | | | | |
| Shares | | Description (1) | | | | | | | | Value |
| | | | | | | | | | | |
| | Health Care Providers & Services (continued) | | | | | | | | | |
| | | | | |
| 300 | | Express Scripts, Inc., (2) | | | | | | | | $ | 20,625 |
| | | | | |
| 200 | | Humana Inc., (2) | | | | | | | | | 6,452 |
| | | | | |
| 100 | | Laboratory Corporation of America Holdings, (2) | | | | | | | | | 6,779 |
| | | | | |
| 300 | | McKesson HBOC Inc. | | | | | | | | | 13,200 |
| | | | | |
| 600 | | Medco Health Solutions, Inc., (2) | | | | | | | | | 27,366 |
| | | | | |
| 100 | | Patterson Companies, Inc., (2) | | | | | | | | | 2,170 |
| | | | | |
| 200 | | Quest Diagnostics Incorporated | | | | | | | | | 11,286 |
| | | | | |
| 500 | | Tenet Healthcare Corporation, (2) | | | | | | | | | 1,410 |
| | | | | |
| 1,600 | | UnitedHealth Group Incorporated | | | | | | | | | 39,968 |
| | | | | |
| 700 | | Wellpoint Inc., (2) | | | | | | | | | 35,623 |
| | Total Health Care Providers & Services | | | | | | | | | 211,410 |
| | Health Care Technology – 0.0% | | | | | | | | | |
| | | | | |
| 200 | | IMS Health Incorporated | | | | | | | | | 2,540 |
| | Hotels, Restaurants & Leisure – 1.7% | | | | | | | | | |
| | | | | |
| 600 | | Carnival Corporation | | | | | | | | | 15,462 |
| | | | | |
| 200 | | Darden Restaurants, Inc. | | | | | | | | | 6,596 |
| | | | | |
| 300 | | International Game Technology | | | | | | | | | 4,770 |
| | | | | |
| 301 | | Marriott International, Inc., Class A | | | | | | | | | 6,645 |
| | | | | |
| 1,700 | | McDonald’s Corporation | | | | | | | | | 97,733 |
| | | | | |
| 900 | | Starbucks Corporation, (2) | | | | | | | | | 12,501 |
| | | | | |
| 200 | | Starwood Hotels & Resorts Worldwide, Inc. | | | | | | | | | 4,440 |
| | | | | |
| 200 | | Wyndham Worldwide Corporation | | | | | | | | | 2,424 |
| | | | | |
| 600 | | YUM! Brands, Inc. | | | | | | | | | 20,004 |
| | Total Hotels, Restaurants & Leisure | | | | | | | | | 170,575 |
| | Household Durables – 0.3% | | | | | | | | | |
| | | | | |
| 100 | | Black & Decker Corporation | | | | | | | | | 2,866 |
| | | | | |
| 100 | | Centex Corporation | | | | | | | | | 846 |
| | | | | |
| 300 | | D.R. Horton, Inc. | | | | | | | | | 2,808 |
| | | | | |
| 200 | | Fortune Brands Inc. | | | | | | | | | 6,948 |
| | | | | |
| 100 | | KB Home | | | | | | | | | 1,368 |
| | | | | |
| 200 | | Leggett and Platt Inc. | | | | | | | | | 3,046 |
| | | | | |
| 200 | | Lennar Corporation, Class A | | | | | | | | | 1,938 |
| | | | | |
| 300 | | Newell Rubbermaid Inc. | | | | | | | | | 3,123 |
| | | | | |
| 200 | | Pulte Corporation, (2) | | | | | | | | | 1,766 |
| | | | | |
| 100 | | Snap-on Incorporated | | | | | | | | | 2,874 |
| | | | | |
| 100 | | Stanley Works | | | | | | | | | 3,384 |
| | | | | |
| 100 | | Whirlpool Corporation | | | | | | | | | 4,256 |
| | Total Household Durables | | | | | | | | | 35,223 |
| | Household Products – 2.9% | | | | | | | | | |
| | | | | |
| 200 | | Clorox Company | | | | | | | | | 11,166 |
| | | | | |
| 600 | | Colgate-Palmolive Company | | | | | | | | | 42,444 |
| | | | | |
| 600 | | Kimberly-Clark Corporation | | | | | | | | | 31,458 |
| | | | | |
| 4,100 | | Procter & Gamble Company | | | | | | | | | 209,510 |
| | Total Household Products | | | | | | | | | 294,578 |
Portfolio of Investments
Nuveen Enhanced Core Equity Fund (continued)
June 30, 2009
| | | | | | | | | | | |
| Shares | | Description (1) | | | | | | | | Value |
| | | | | | | | | | | |
| | Independent Power Producers & Energy Traders – 0.1% | | | | | | | | | |
| | | | | |
| 900 | | AES Corporation, (2) | | | | | | | | $ | 10,449 |
| | | | | |
| 100 | | Constellation Energy Group | | | | | | | | | 2,658 |
| | | | | |
| 500 | | Dynegy Inc., (2) | | | | | | | | | 1,135 |
| | Total Independent Power Producers & Energy Traders | | | | | | | | | 14,242 |
| | Industrial Conglomerates – 2.4% | | | | | | | | | |
| | | | | |
| 900 | | 3M Co. | | | | | | | | | 54,090 |
| | | | | |
| 16,300 | | General Electric Company | | | | | | | | | 191,036 |
| | | | | |
| 300 | | Textron Inc. | | | | | | | | | 2,898 |
| | Total Industrial Conglomerates | | | | | | | | | 248,024 |
| | Insurance – 2.1% | | | | | | | | | |
| | | | | |
| 600 | | AFLAC Incorporated | | | | | | | | | 18,654 |
| | | | | |
| 500 | | Allstate Corporation | | | | | | | | | 12,200 |
| | | | | |
| 1,700 | | American International Group, Inc., (2) | | | | | | | | | 1,972 |
| | | | | |
| 400 | | Aon Corporation | | | | | | | | | 15,148 |
| | | | | |
| 100 | | Assurant Inc. | | | | | | | | | 2,409 |
| | | | | |
| 500 | | Chubb Corporation | | | | | | | | | 19,940 |
| | | | | |
| 300 | | Cincinnati Financial Corporation | | | | | | | | | 6,705 |
| | | | | |
| 200 | | Genworth Financial Inc., Class A | | | | | | | | | 1,398 |
| | | | | |
| 200 | | Hartford Financial Services Group, Inc. | | | | | | | | | 2,374 |
| | | | | |
| 100 | | Lincoln National Corporation | | | | | | | | | 1,721 |
| | | | | |
| 400 | | Loews Corporation | | | | | | | | | 10,960 |
| | | | | |
| 500 | | Marsh & McLennan Companies, Inc. | | | | | | | | | 10,065 |
| | | | | |
| 400 | | MBIA Inc., (2) | | | | | | | | | 1,732 |
| | | | | |
| 900 | | MetLife, Inc. | | | | | | | | | 27,009 |
| | | | | |
| 300 | | Principal Financial Group, Inc. | | | | | | | | | 5,652 |
| | | | | |
| 800 | | Progressive Corporation, (2) | | | | | | | | | 12,088 |
| | | | | |
| 400 | | Prudential Financial, Inc. | | | | | | | | | 14,888 |
| | | | | |
| 100 | | Torchmark Corporation | | | | | | | | | 3,704 |
| | | | | |
| 900 | | Travelers Companies, Inc. | | | | | | | | | 36,936 |
| | | | | |
| 500 | | Unum Group | | | | | | | | | 7,930 |
| | | | | |
| 200 | | XL Capital Ltd, Class A | | | | | | | | | 2,292 |
| | Total Insurance | | | | | | | | | 215,777 |
| | Internet & Catalog Retail – 0.4% | | | | | | | | | |
| | | | | |
| 400 | | Amazon.com, Inc., (2) | | | | | | | | | 33,464 |
| | | | | |
| 300 | | Expedia, Inc., (2) | | | | | | | | | 4,533 |
| | Total Internet & Catalog Retail | | | | | | | | | 37,997 |
| | Internet Software & Services – 1.3% | | | | | | | | | |
| | | | | |
| 200 | | Akamai Technologies, Inc., (2) | | | | | | | | | 3,836 |
| | | | | |
| 1,300 | | eBay Inc., (2) | | | | | | | | | 22,269 |
| | | | | |
| 200 | | Google Inc., Class A, (2) | | | | | | | | | 84,318 |
| | | | | |
| 200 | | VeriSign, Inc., (2) | | | | | | | | | 3,696 |
| | | | | |
| 1,400 | | Yahoo! Inc., (2) | | | | | | | | | 21,924 |
| | Total Internet Software & Services | | | | | | | | | 136,043 |
| | | | | | | | | | | |
| Shares | | Description (1) | | | | | | | | Value |
| | | | | | | | | | | |
| | IT Services – 1.2% | | | | | | | | | |
| | | | | |
| 100 | | Affiliated Computer Services Inc., (2) | | | | | | | | $ | 4,442 |
| | | | | |
| 800 | | Automatic Data Processing, Inc. | | | | | | | | | 28,352 |
| | | | | |
| 400 | | Cognizant Technology Solutions Corporation, Class A, (2) | | | | | | | | | 10,680 |
| | | | | |
| 300 | | Computer Sciences Corporation, (2) | | | | | | | | | 13,290 |
| | | | | |
| 100 | | Convergys Corporation, (2) | | | | | | | | | 928 |
| | | | | |
| 200 | | Fidelity National Information Services | | | | | | | | | 3,992 |
| | | | | |
| 200 | | Fiserv, Inc., (2) | | | | | | | | | 9,140 |
| | | | | |
| 100 | | MasterCard, Inc. | | | | | | | | | 16,731 |
| | | | | |
| 500 | | Paychex, Inc. | | | | | | | | | 12,600 |
| | | | | |
| 200 | | Total System Services Inc. | | | | | | | | | 2,678 |
| | | | | |
| 900 | | Western Union Company | | | | | | | | | 14,760 |
| | Total IT Services | | | | | | | | | 117,593 |
| | Leisure Equipment & Products – 0.1% | | | | | | | | | |
| | | | | |
| 300 | | Eastman Kodak Company | | | | | | | | | 888 |
| | | | | |
| 200 | | Hasbro, Inc. | | | | | | | | | 4,848 |
| | | | | |
| 500 | | Mattel, Inc. | | | | | | | | | 8,025 |
| | Total Leisure Equipment & Products | | | | | | | | | 13,761 |
| | Life Sciences Tools & Services – 0.4% | | | | | | | | | |
| | | | | |
| 200 | | Life Technologies Corporation, (2) | | | | | | | | | 8,344 |
| | | | | |
| 100 | | Millipore Corporation, (2) | | | | | | | | | 7,021 |
| | | | | |
| 100 | | Perkinelmer Inc. | | | | | | | | | 1,740 |
| | | | | |
| 500 | | Thermo Fisher Scientific, Inc., (2) | | | | | | | | | 20,385 |
| | | | | |
| 100 | | Waters Corporation, (2) | | | | | | | | | 5,147 |
| | Total Life Sciences Tools & Services | | | | | | | | | 42,637 |
| | Machinery – 1.3% | | | | | | | | | |
| | | | | |
| 700 | | Caterpillar Inc. | | | | | | | | | 23,128 |
| | | | | |
| 200 | | Cummins Inc. | | | | | | | | | 7,042 |
| | | | | |
| 300 | | Danaher Corporation | | | | | | | | | 18,522 |
| | | | | |
| 500 | | Deere & Company | | | | | | | | | 19,975 |
| | | | | |
| 200 | | Dover Corporation | | | | | | | | | 6,618 |
| | | | | |
| 200 | | Eaton Corporation | | | | | | | | | 8,922 |
| | | | | |
| 100 | | Flowserve Corporation | | | | | | | | | 6,981 |
| | | | | |
| 400 | | Illinois Tool Works Inc. | | | | | | | | | 14,936 |
| | | | | |
| 100 | | Manitowoc Company Inc. | | | | | | | | | 526 |
| | | | | |
| 400 | | PACCAR Inc. | | | | | | | | | 13,004 |
| | | | | |
| 100 | | Pall Corporation | | | | | | | | | 2,656 |
| | | | | |
| 200 | | Parker Hannifin Corporation | | | | | | | | | 8,592 |
| | Total Machinery | | | | | | | | | 130,902 |
| | Media – 2.6% | | | | | | | | | |
| | | | | |
| 700 | | CBS Corporation, Class B | | | | | | | | | 4,844 |
| | | | | |
| 3,700 | | Comcast Corporation, Class A | | | | | | | | | 53,613 |
| | | | | |
| 700 | | DIRECTV Group, Inc., (2) | | | | | | | | | 17,297 |
| | | | | |
| 200 | | Gannett Company Inc. | | | | | | | | | 714 |
| | | | | |
| 500 | | Interpublic Group Companies, Inc., (2) | | | | | | | | | 2,525 |
| | | | | |
| 400 | | McGraw-Hill Companies, Inc. | | | | | | | | | 12,044 |
Portfolio of Investments
Nuveen Enhanced Core Equity Fund (continued)
June 30, 2009
| | | | | | | | | | | |
| Shares | | Description (1) | | | | | | | | Value |
| | | | | | | | | | | |
| | Media (continued) | | | | | | | | | |
| | | | | |
| 100 | | Meredith Corporation | | | | | | | | $ | 2,555 |
| | | | | |
| 2,600 | | News Corporation, Class A | | | | | | | | | 23,686 |
| | | | | |
| 300 | | Omnicom Group Inc. | | | | | | | | | 9,474 |
| | | | | |
| 100 | | Scripps Networks Interactive, Class A Shares | | | | | | | | | 2,783 |
| | | | | |
| 600 | | Time Warner Cable, Class A, (2) | | | | | | | | | 19,002 |
| | | | | |
| 1,600 | | Time Warner Inc. | | | | | | | | | 40,304 |
| | | | | |
| 800 | | Viacom Inc., Class B, (2) | | | | | | | | | 18,160 |
| | | | | |
| 2,400 | | Walt Disney Company | | | | | | | | | 55,992 |
| | Total Media | | | | | | | | | 262,993 |
| | Metals & Mining – 0.8% | | | | | | | | | |
| | | | | |
| 500 | | Alcoa Inc. | | | | | | | | | 5,165 |
| | | | | |
| 100 | | Allegheny Technologies, Inc. | | | | | | | | | 3,493 |
| | | | | |
| 400 | | Freeport-McMoRan Copper & Gold, Inc. | | | | | | | | | 20,044 |
| | | | | |
| 700 | | Newmont Mining Corporation | | | | | | | | | 28,609 |
| | | | | |
| 400 | | Nucor Corporation | | | | | | | | | 17,772 |
| | | | | |
| 100 | | Titanium Metals Corporation | | | | | | | | | 919 |
| | | | | |
| 200 | | United States Steel Corporation | | | | | | | | | 7,148 |
| | Total Metals & Mining | | | | | | | | | 83,150 |
| | Multiline Retail – 0.9% | | | | | | | | | |
| | | | | |
| 100 | | Big Lots, Inc., (2) | | | | | | | | | 2,103 |
| | | | | |
| 200 | | Family Dollar Stores, Inc. | | | | | | | | | 5,660 |
| | | | | |
| 500 | | Federated Department Stores, Inc. | | | | | | | | | 5,880 |
| | | | | |
| 300 | | J.C. Penney Company, Inc. | | | | | | | | | 8,613 |
| | | | | |
| 500 | | Kohl’s Corporation, (2) | | | | | | | | | 21,375 |
| | | | | |
| 200 | | Nordstrom, Inc. | | | | | | | | | 3,978 |
| | | | | |
| 100 | | Sears Holding Corporation, (2) | | | | | | | | | 6,652 |
| | | | | |
| 1,000 | | Target Corporation | | | | | | | | | 39,470 |
| | Total Multiline Retail | | | | | | | | | 93,731 |
| | Multi-Utilities – 1.7% | | | | | | | | | |
| | | | | |
| 300 | | Ameren Corporation | | | | | | | | | 7,467 |
| | | | | |
| 500 | | CenterPoint Energy, Inc. | | | | | | | | | 5,540 |
| | | | | |
| 300 | | CMS Energy Corporation | | | | | | | | | 3,624 |
| | | | | |
| 500 | | Consolidated Edison, Inc. | | | | | | | | | 18,710 |
| | | | | |
| 800 | | Dominion Resources, Inc. | | | | | | | | | 26,736 |
| | | | | |
| 300 | | DTE Energy Company | | | | | | | | | 9,600 |
| | | | | |
| 100 | | Integrys Energy Group, Inc. | | | | | | | | | 2,999 |
| | | | | |
| 400 | | NiSource Inc. | | | | | | | | | 4,664 |
| | | | | |
| 600 | | PG&E Corporation | | | | | | | | | 23,064 |
| | | | | |
| 700 | | Public Service Enterprise Group Incorporated | | | | | | | | | 22,841 |
| | | | | |
| 200 | | Scana Corporation | | | | | | | | | 6,494 |
| | | | | |
| 300 | | Sempra Energy | | | | | | | | | 14,889 |
| | | | | |
| 300 | | TECO Energy, Inc. | | | | | | | | | 3,579 |
| | | | | |
| 200 | | Wisconsin Energy Corporation | | | | | | | | | 8,142 |
| | | | | |
| 700 | | Xcel Energy, Inc. | | | | | | | | | 12,887 |
| | Total Multi-Utilities | | | | | | | | | 171,236 |
| | | | | | | | | | | |
| Shares | | Description (1) | | | | | | | | Value |
| | | | | | | | | | | |
| | Office Electronics – 0.1% | | | | | | | | | |
| | | | | |
| 900 | | Xerox Corporation | | | | | | | | $ | 5,832 |
| | Oil, Gas & Consumable Fuels – 11.0% | | | | | | | | | |
| | | | | |
| 700 | | Anadarko Petroleum Corporation | | | | | | | | | 31,773 |
| | | | | |
| 400 | | Apache Corporation | | | | | | | | | 28,860 |
| | | | | |
| 100 | | Cabot Oil & Gas Corporation | | | | | | | | | 3,064 |
| | | | | |
| 600 | | Chesapeake Energy Corporation | | | | | | | | | 11,898 |
| | | | | |
| 2,800 | | Chevron Corporation | | | | | | | | | 185,500 |
| | | | | |
| 1,800 | | ConocoPhillips | | | | | | | | | 75,708 |
| | | | | |
| 200 | | CONSOL Energy Inc. | | | | | | | | | 6,792 |
| | | | | |
| 300 | | Denbury Resources Inc., (2) | | | | | | | | | 4,419 |
| | | | | |
| 500 | | Devon Energy Corporation | | | | | | | | | 27,250 |
| | | | | |
| 600 | | El Paso Corporation | | | | | | | | | 5,538 |
| | | | | |
| 300 | | EOG Resources, Inc. | | | | | | | | | 20,376 |
| | | | | |
| 6,400 | | Exxon Mobil Corporation | | | | | | | | | 447,424 |
| | | | | |
| 400 | | Hess Corporation | | | | | | | | | 21,500 |
| | | | | |
| 1,100 | | Marathon Oil Corporation | | | | | | | | | 33,143 |
| | | | | |
| 300 | | Murphy Oil Corporation | | | | | | | | | 16,296 |
| | | | | |
| 200 | | Noble Energy, Inc. | | | | | | | | | 11,794 |
| | | | | |
| 1,100 | | Occidental Petroleum Corporation | | | | | | | | | 72,391 |
| | | | | |
| 300 | | Peabody Energy Corporation | | | | | | | | | 9,048 |
| | | | | |
| 100 | | Pioneer Natural Resources Company | | | | | | | | | 2,550 |
| | | | | |
| 200 | | Range Resources Corporation | | | | | | | | | 8,282 |
| | | | | |
| 500 | | Southwestern Energy Company, (2) | | | | | | | | | 19,425 |
| | | | | |
| 900 | | Spectra Energy Corporation | | | | | | | | | 15,228 |
| | | | | |
| 200 | | Sunoco, Inc. | | | | | | | | | 4,640 |
| | | | | |
| 300 | | Tesoro Corporation | | | | | | | | | 3,819 |
| | | | | |
| 700 | | Valero Energy Corporation | | | | | | | | | 11,823 |
| | | | | |
| 700 | | Williams Companies, Inc. | | | | | | | | | 10,927 |
| | | | | |
| 800 | | XTO Energy, Inc. | | | | | | | | | 30,512 |
| | Total Oil, Gas & Consumable Fuels | | | | | | | | | 1,119,980 |
| | Paper & Forest Products – 0.2% | | | | | | | | | |
| | | | | |
| 500 | | International Paper Company | | | | | | | | | 7,565 |
| | | | | |
| 200 | | MeadWestvaco Corporation | | | | | | | | | 3,282 |
| | | | | |
| 300 | | Weyerhaeuser Company | | | | | | | | | 9,129 |
| | Total Paper & Forest Products | | | | | | | | | 19,976 |
| | Personal Products – 0.2% | | | | | | | | | |
| | | | | |
| 500 | | Avon Products, Inc. | | | | | | | | | 12,890 |
| | | | | |
| 100 | | Estee Lauder Companies Inc., Class A | | | | | | | | | 3,267 |
| | Total Personal Products | | | | | | | | | 16,157 |
| | Pharmaceuticals – 8.4% | | | | | | | | | |
| | | | | |
| 2,000 | | Abbott Laboratories | | | | | | | | | 94,080 |
| | | | | |
| 300 | | Allergan, Inc. | | | | | | | | | 14,274 |
| | | | | |
| 3,100 | | Bristol-Myers Squibb Company | | | | | | | | | 62,961 |
| | | | | |
| 1,300 | | Eli Lilly and Company | | | | | | | | | 45,032 |
| | | | | |
| 300 | | Forest Laboratories, Inc., (2) | | | | | | | | | 7,533 |
Portfolio of Investments
Nuveen Enhanced Core Equity Fund (continued)
June 30, 2009
| | | | | | | | | | | |
| Shares | | Description (1) | | | | | | | | Value |
| | | | | | | | | | | |
| | Pharmaceuticals (continued) | | | | | | | | | |
| | | | | |
| 3,800 | | Johnson & Johnson | | | | | | | | $ | 215,840 |
| | | | | |
| 300 | | King Pharmaceuticals Inc., (2) | | | | | | | | | 2,889 |
| | | | | |
| 3,300 | | Merck & Co. Inc. | | | | | | | | | 92,268 |
| | | | | |
| 400 | | Mylan Laboratories Inc., (2) | | | | | | | | | 5,220 |
| | | | | |
| 10,200 | | Pfizer Inc. | | | | | | | | | 153,000 |
| | | | | |
| 2,400 | | Schering-Plough Corporation | | | | | | | | | 60,288 |
| | | | | |
| 200 | | Watson Pharmaceuticals Inc., (2) | | | | | | | | | 6,738 |
| | | | | |
| 2,000 | | Wyeth | | | | | | | | | 90,780 |
| | Total Pharmaceuticals | | | | | | | | | 850,903 |
| | Professional Services – 0.2% | | | | | | | | | |
| | | | | |
| 100 | | Dun and Bradstreet Inc. | | | | | | | | | 8,121 |
| | | | | |
| 200 | | Equifax Inc. | | | | | | | | | 5,220 |
| | | | | |
| 100 | | Monster Worldwide Inc., (2) | | | | | | | | | 1,181 |
| | | | | |
| 200 | | Robert Half International Inc. | | | | | | | | | 4,724 |
| | Total Professional Services | | | | | | | | | 19,246 |
| | Real Estate – 1.0% | | | | | | | | | |
| | | | | |
| 200 | | Apartment Investment & Management Company, Class A | | | | | | | | | 1,770 |
| | | | | |
| 100 | | AvalonBay Communities, Inc. | | | | | | | | | 5,594 |
| | | | | |
| 100 | | Boston Properties, Inc. | | | | | | | | | 4,770 |
| | | | | |
| 400 | | Equity Residential | | | | | | | | | 8,892 |
| | | | | |
| 500 | | Health Care Property Investors Inc. | | | | | | | | | 10,595 |
| | | | | |
| 200 | | Health Care REIT, Inc. | | | | | | | | | 6,820 |
| | | | | |
| 900 | | Host Hotels & Resorts Inc. | | | | | | | | | 7,551 |
| | | | | |
| 300 | | Kimco Realty Corporation | | | | | | | | | 3,015 |
| | | | | |
| 300 | | Plum Creek Timber Company | | | | | | | | | 8,934 |
| | | | | |
| 500 | | ProLogis | | | | | | | | | 4,030 |
| | | | | |
| 200 | | Public Storage, Inc. | | | | | | | | | 13,096 |
| | | | | |
| 304 | | Simon Property Group, Inc. | | | | | | | | | 15,635 |
| | | | | |
| 200 | | Ventas Inc. | | | | | | | | | 5,972 |
| | | | | |
| 200 | | Vornado Realty Trust | | | | | | | | | 9,006 |
| | Total Real Estate | | | | | | | | | 105,680 |
| | Road & Rail – 0.8% | | | | | | | | | |
| | | | | |
| 300 | | Burlington Northern Santa Fe Corporation | | | | | | | | | 22,062 |
| | | | | |
| 400 | | CSX Corporation | | | | | | | | | 13,852 |
| | | | | |
| 400 | | Norfolk Southern Corporation | | | | | | | | | 15,068 |
| | | | | |
| 600 | | Union Pacific Corporation | | | | | | | | | 31,236 |
| | Total Road & Rail | | | | | | | | | 82,218 |
| | Semiconductors & Equipment – 2.1% | | | | | | | | | |
| | | | | |
| 700 | | Advanced Micro Devices, Inc., (2) | | | | | | | | | 2,709 |
| | | | | |
| 400 | | Altera Corporation | | | | | | | | | 6,512 |
| | | | | |
| 400 | | Analog Devices, Inc. | | | | | | | | | 9,912 |
| | | | | |
| 1,200 | | Applied Materials, Inc. | | | | | | | | | 13,164 |
| | | | | |
| 500 | | Broadcom Corporation, Class A, (2) | | | | | | | | | 12,395 |
| | | | | |
| 6,300 | | Intel Corporation | | | | | | | | | 104,265 |
| | | | | |
| 200 | | KLA-Tencor Corporation | | | | | | | | | 5,050 |
| | | | | | | | | | | |
| Shares | | Description (1) | | | | | | | | Value |
| | | | | | | | | | | |
| | Semiconductors & Equipment (continued) | | | | | | | | | |
| | | | | |
| 300 | | Linear Technology Corporation | | | | | | | | $ | 7,005 |
| | | | | |
| 600 | | LSI Logic Corporation, (2) | | | | | | | | | 2,736 |
| | | | | |
| 100 | | MEMC Electronic Materials, (2) | | | | | | | | | 1,781 |
| | | | | |
| 300 | | Microchip Technology Incorporated | | | | | | | | | 6,765 |
| | | | | |
| 900 | | Micron Technology, Inc., (2) | | | | | | | | | 4,554 |
| | | | | |
| 300 | | National Semiconductor Corporation | | | | | | | | | 3,765 |
| | | | | |
| 100 | | Novellus Systems, Inc., (2) | | | | | | | | | 1,670 |
| | | | | |
| 300 | | NVIDIA Corporation, (2) | | | | | | | | | 3,387 |
| | | | | |
| 100 | | Teradyne Inc., (2) | | | | | | | | | 686 |
| | | | | |
| 1,100 | | Texas Instruments Incorporated | | | | | | | | | 23,430 |
| | | | | |
| 400 | | Xilinx, Inc. | | | | | | | | | 8,184 |
| | Total Semiconductors & Equipment | | | | | | | | | 217,970 |
| | Software – 3.8% | | | | | | | | | |
| | | | | |
| 600 | | Adobe Systems Incorporated, (2) | | | | | | | | | 16,980 |
| | | | | |
| 200 | | Autodesk, Inc., (2) | | | | | | | | | 3,796 |
| | | | | |
| 200 | | BMC Software, Inc., (2) | | | | | | | | | 6,758 |
| | | | | |
| 500 | | CA Inc. | | | | | | | | | 8,715 |
| | | | | |
| 200 | | Citrix Systems, (2) | | | | | | | | | 6,378 |
| | | | | |
| 400 | | Compuware Corporation, (2) | | | | | | | | | 2,744 |
| | | | | |
| 200 | | Electronic Arts Inc. (EA), (2) | | | | | | | | | 4,344 |
| | | | | |
| 400 | | Intuit, Inc., (2) | | | | | | | | | 11,264 |
| | | | | |
| 200 | | McAfee Inc., (2) | | | | | | | | | 8,438 |
| | | | | |
| 8,400 | | Microsoft Corporation | | | | | | | | | 199,668 |
| | | | | |
| 300 | | Novell Inc., (2) | | | | | | | | | 1,359 |
| | | | | |
| 4,700 | | Oracle Corporation | | | | | | | | | 100,674 |
| | | | | |
| 100 | | Salesforce.com, Inc., (2) | | | | | | | | | 3,817 |
| | | | | |
| 900 | | Symantec Corporation, (2) | | | | | | | | | 14,004 |
| | Total Software | | | | | | | | | 388,939 |
| | Specialty Retail – 2.3% | | | | | | | | | |
| | | | | |
| 100 | | Abercrombie & Fitch Co., Class A | | | | | | | | | 2,539 |
| | | | | |
| 200 | | AutoNation Inc., (2) | | | | | | | | | 3,470 |
| | | | | |
| 100 | | AutoZone, Inc., (2) | | | | | | | | | 15,111 |
| | | | | |
| 400 | | Bed Bath and Beyond Inc., (2) | | | | | | | | | 12,300 |
| | | | | |
| 500 | | Best Buy Co., Inc. | | | | | | | | | 16,745 |
| | | | | |
| 200 | | GameStop Corporation, (2) | | | | | | | | | 4,402 |
| | | | | |
| 800 | | Gap, Inc. | | | | | | | | | 13,120 |
| | | | | |
| 2,500 | | Home Depot, Inc. | | | | | | | | | 59,075 |
| | | | | |
| 400 | | Limited Brands, Inc. | | | | | | | | | 4,788 |
| | | | | |
| 2,100 | | Lowe’s Companies, Inc. | | | | | | | | | 40,761 |
| | | | | |
| 200 | | Office Depot, Inc., (2) | | | | | | | | | 912 |
| | | | | |
| 200 | | O’Reilly Automotive Inc., (2) | | | | | | | | | 7,616 |
| | | | | |
| 200 | | RadioShack Corporation | | | | | | | | | 2,792 |
| | | | | |
| 100 | | Sherwin-Williams Company | | | | | | | | | 5,375 |
| | | | | |
| 1,000 | | Staples, Inc. | | | | | | | | | 20,170 |
| | | | | |
| 200 | | Tiffany & Co. | | | | | | | | | 5,072 |
| | | | | |
| 600 | | TJX Companies, Inc. | | | | | | | | | 18,876 |
| | Total Specialty Retail | | | | | | | | | 233,124 |
Portfolio of Investments
Nuveen Enhanced Core Equity Fund (continued)
June 30, 2009
| | | | | | | | | | | |
| Shares | | Description (1) | | | | | | | | Value |
| | | | | | | | | | | |
| | Textiles, Apparel & Luxury Goods – 0.5% | | | | | | | | | |
| | | | | |
| 400 | | Coach, Inc. | | | | | | | | $ | 10,752 |
| | | | | |
| 500 | | Nike, Inc., Class B | | | | | | | | | 25,890 |
| | | | | |
| 100 | | Polo Ralph Lauren Corporation | | | | | | | | | 5,354 |
| | | | | |
| 100 | | VF Corporation | | | | | | | | | 5,535 |
| | Total Textiles, Apparel & Luxury Goods | | | | | | | | | 47,531 |
| | Thrifts & Mortgage Finance – 0.2% | | | | | | | | | |
| | | | | |
| 800 | | Hudson City Bancorp, Inc. | | | | | | | | | 10,632 |
| | | | | |
| 500 | | People’s United Financial, Inc. | | | | | | | | | 7,520 |
| | Total Thrifts & Mortgage Finance | | | | | | | | | 18,152 |
| | Tobacco – 2.1% | | | | | | | | | |
| | | | | |
| 3,400 | | Altria Group, Inc. | | | | | | | | | 55,726 |
| | | | | |
| 300 | | Lorillard Inc. | | | | | | | | | 20,331 |
| | | | | |
| 2,900 | | Philip Morris International | | | | | | | | | 126,498 |
| | | | | |
| 300 | | Reynolds American Inc. | | | | | | | | | 11,586 |
| | Total Tobacco | | | | | | | | | 214,141 |
| | Trading Companies & Distributors – 0.1% | | | | | | | | | |
| | | | | |
| 100 | | Fastenal Company | | | | | | | | | 3,317 |
| | | | | |
| 100 | | W.W. Grainger, Inc. | | | | | | | | | 8,188 |
| | Total Trading Companies & Distributors | | | | | | | | | 11,505 |
| | Wireless Telecommunication Services – 0.3% | | | | | | | | | |
| | | | | |
| 400 | | American Tower Corporation, (2) | | | | | | | | | 12,612 |
| | | | | |
| 3,700 | | Sprint Nextel Corporation, (2) | | | | | | | | | 17,797 |
| | Total Wireless Telecommunication Services | | | | | | | | | 30,409 |
| | Total Investments (cost $11,529,232) – 99.6% | | | | | | | | | 10,138,456 |
| | Other Assets Less Liabilities – 0.4% | | | | | | | | | 43,154 |
| | Net Assets – 100% | | | | | | | | $ | 10,181,610 |
| | (1) | | All percentages shown in the Portfolio of Investments are based on net assets. |
| | (2) | | Non-income producing; issuer has not declared a dividend within the past twelve months. |
See accompanying notes to financial statements.
Portfolio of Investments
Nuveen Enhanced Mid-Cap Fund
June 30, 2009
| | | | | | | | | | | |
| Shares | | Description (1) | | | | | | | | Value |
| | | | | | | | | | | |
| | COMMON STOCKS – 97.2% | | | | | | | | | |
| | | | | |
| | Aerospace & Defense – 1.9% | | | | | | | | | |
| | | | | |
| 170 | | Goodrich Corporation | | | | | | | | $ | 8,495 |
| | | | | |
| 220 | | ITT Industries, Inc. | | | | | | | | | 9,790 |
| | | | | |
| 140 | | L-3 Communications Holdings, Inc. | | | | | | | | | 9,713 |
| | | | | |
| 180 | | Rockwell Collins, Inc. | | | | | | | | | 7,511 |
| | | | | |
| 10 | | Spirit AeroSystems Holdings Inc., (2) | | | | | | | | | 137 |
| | Total Aerospace & Defense | | | | | | | | | 35,646 |
| | Air Freight & Logistics – 0.1% | | | | | | | | | |
| | | | | |
| 100 | | UTI Worldwide, Inc. | | | | | | | | | 1,140 |
| | Airlines – 0.4% | | | | | | | | | |
| | | | | |
| 40 | | Copa Holdings SA | | | | | | | | | 1,633 |
| | | | | |
| 1,030 | | Delta Air Lines, Inc., (2) | | | | | | | | | 5,964 |
| | Total Airlines | | | | | | | | | 7,597 |
| | Auto Components – 0.6% | | | | | | | | | |
| | | | | |
| 90 | | Autoliv Inc., (2) | | | | | | | | | 2,589 |
| | | | | |
| 110 | | BorgWarner Inc. | | | | | | | | | 3,756 |
| | | | | |
| 10 | | Federal Mogul Corporation, Class A Shares, (2) | | | | | | | | | 95 |
| | | | | |
| 30 | | Gentex Corporation | | | | | | | | | 348 |
| | | | | |
| 350 | | Goodyear Tire & Rubber Company, (2) | | | | | | | | | 3,941 |
| | | | | |
| 20 | | WABCO Holdings Inc. | | | | | | | | | 354 |
| | Total Auto Components | | | | | | | | | 11,083 |
| | Automobiles – 1.0% | | | | | | | | | |
| | | | | |
| 2,090 | | Ford Motor Company, (2) | | | | | | | | | 12,686 |
| | | | | |
| 400 | | Harley-Davidson, Inc. | | | | | | | | | 6,484 |
| | Total Automobiles | | | | | | | | | 19,170 |
| | Beverages – 1.5% | | | | | | | | | |
| | | | | |
| 100 | | Brown-Forman Corporation | | | | | | | | | 4,298 |
| | | | | |
| 330 | | Coca-Cola Enterprises Inc. | | | | | | | | | 5,494 |
| | | | | |
| 20 | | Constellation Brands, Inc., Class A, (2) | | | | | | | | | 254 |
| | | | | |
| 100 | | Dr. Pepper Snapple Group, (2) | | | | | | | | | 2,119 |
| | | | | |
| 180 | | Molson Coors Brewing Company, Class B | | | | | | | | | 7,619 |
| | | | | |
| 180 | | Pepsi Bottling Group, Inc. | | | | | | | | | 6,091 |
| | | | | |
| 70 | | PepsiAmericas Inc. | | | | | | | | | 1,877 |
| | Total Beverages | | | | | | | | | 27,752 |
| | Biotechnology – 0.4% | | | | | | | | | |
| | | | | |
| 140 | | Cephalon, Inc., (2) | | | | | | | | | 7,931 |
| | | | | |
| 10 | | Vertex Pharmaceuticals Inc., (2) | | | | | | | | | 356 |
| | Total Biotechnology | | | | | | | | | 8,287 |
| | Building Products – 0.1% | | | | | | | | | |
| | | | | |
| 40 | | Armstrong World Industries Inc., (2) | | | | | | | | | 660 |
| | | | | |
| 60 | | Lennox International Inc. | | | | | | | | | 1,927 |
| | Total Building Products | | | | | | | | | 2,587 |
| | Capital Markets – 1.8% | | | | | | | | | |
| | | | | |
| 290 | | Ameriprise Financial, Inc. | | | | | | | | | 7,038 |
| | | | | |
| 10 | | GLG Partners Inc. | | | | | | | | | 41 |
Portfolio of Investments
Nuveen Enhanced Mid-Cap Fund (continued)
June 30, 2009
| | | | | | | | | | | |
| Shares | | Description (1) | | | | | | | | Value |
| | | | | | | | | | | |
| | Capital Markets (continued) | | | | | | | | | |
| | | | | |
| 410 | | Invesco LTD | | | | | | | | $ | 7,306 |
| | | | | |
| 220 | | Janus Capital Group Inc. | | | | | | | | | 2,508 |
| | | | | |
| 260 | | Northern Trust Corporation | | | | | | | | | 13,957 |
| | | | | |
| 150 | | Raymond James Financial Inc. | | | | | | | | | 2,581 |
| | | | | |
| 10 | | Waddell & Reed Financial, Inc., Class A | | | | | | | | | 264 |
| | Total Capital Markets | | | | | | | | | 33,695 |
| | Chemicals – 2.5% | | | | | | | | | |
| | | | | |
| 100 | | Airgas, Inc. | | | | | | | | | 4,053 |
| | | | | |
| 20 | | Albemarle Corporation | | | | | | | | | 511 |
| | | | | |
| 20 | | Cabot Corporation | | | | | | | | | 252 |
| | | | | |
| 140 | | Celanese Corporation, Series A | | | | | | | | | 3,325 |
| | | | | |
| 140 | | CF Industries Holdings, Inc. | | | | | | | | | 10,380 |
| | | | | |
| 80 | | Chemtura Corporation | | | | | | | | | 19 |
| | | | | |
| 90 | | Eastman Chemical Company | | | | | | | | | 3,411 |
| | | | | |
| 20 | | Ecolab Inc. | | | | | | | | | 780 |
| | | | | |
| 80 | | FMC Corporation | | | | | | | | | 3,784 |
| | | | | |
| 80 | | International Flavors & Fragrances Inc. | | | | | | | | | 2,618 |
| | | | | |
| 60 | | Lubrizol Corporation | | | | | | | | | 2,839 |
| | | | | |
| 170 | | PPG Industries, Inc. | | | | | | | | | 7,463 |
| | | | | |
| 30 | | RPM International, Inc. | | | | | | | | | 421 |
| | | | | |
| 220 | | Terra Industries, Inc. | | | | | | | | | 5,328 |
| | | | | |
| 90 | | Valspar Corporation | | | | | | | | | 2,028 |
| | Total Chemicals | | | | | | | | | 47,212 |
| | Commercial & Professional Services – 0.1% | | | | | | | | | |
| | | | | |
| 60 | | Brinks Company | | | | | | | | | 1,742 |
| | Commercial Banks – 1.7% | | | | | | | | | |
| | | | | |
| 140 | | Associated Banc-Corp. | | | | | | | | | 1,750 |
| | | | | |
| 90 | | BancorpSouth Inc. | | | | | | | | | 1,848 |
| | | | | |
| 80 | | Bank of Hawaii Corporation | | | | | | | | | 2,866 |
| | | | | |
| 10 | | BOK Financial Corporation | | | | | | | | | 377 |
| | | | | |
| 80 | | City National Corporation | | | | | | | | | 2,946 |
| | | | | |
| 260 | | Comerica Incorporated | | | | | | | | | 5,499 |
| | | | | |
| 60 | | Commerce Bancshares Inc. | | | | | | | | | 1,910 |
| | | | | |
| 80 | | Cullen/Frost Bankers, Inc. | | | | | | | | | 3,690 |
| | | | | |
| 60 | | Fulton Financial Corporation | | | | | | | | | 313 |
| | | | | |
| 130 | | M&T Bank Corporation | | | | | | | | | 6,621 |
| | | | | |
| 120 | | Popular, Inc. | | | | | | | | | 264 |
| | | | | |
| 220 | | TCF Financial Corporation | | | | | | | | | 2,941 |
| | | | | |
| 147 | | Valley National Bancorp. | | | | | | | | | 1,720 |
| | | | | |
| 60 | | Whitney Holding Corporation | | | | | | | | | 550 |
| | Total Commercial Banks | | | | | | | | | 33,295 |
| | Commercial Services & Supplies – 1.0% | | | | | | | | | |
| | | | | |
| 120 | | Avery Dennison Corporation | | | | | | | | | 3,082 |
| | | | | |
| 150 | | Cintas Corporation | | | | | | | | | 3,426 |
| | | | | |
| 10 | | Copart Inc., (2) | | | | | | | | | 347 |
| | | | | | | | | | | |
| Shares | | Description (1) | | | | | | | | Value |
| | | | | | | | | | | |
| | Commercial Services & Supplies (continued) | | | | | | | | | |
| | | | | |
| 20 | | Covanta Holding Corporation, (2) | | | | | | | | $ | 339 |
| | | | | |
| 30 | | Iron Mountain Inc., (2) | | | | | | | | | 863 |
| | | | | |
| 200 | | Pitney Bowes Inc. | | | | | | | | | 4,386 |
| | | | | |
| 300 | | R.R. Donnelley & Sons Company | | | | | | | | | 3,486 |
| | | | | |
| 60 | | Republic Services, Inc. | | | | | | | | | 1,465 |
| | | | | |
| 50 | | Steelcase Inc. | | | | | | | | | 291 |
| | | | | |
| 10 | | Stericycle Inc., (2) | | | | | | | | | 515 |
| | Total Commercial Services & Supplies | | | | | | | | | 18,200 |
| | Communication Equipment – 0.4% | | | | | | | | | |
| | | | | |
| 30 | | Echostar Holding Corproation, Class A, (2) | | | | | | | | | 478 |
| | | | | |
| 240 | | Harris Corporation | | | | | | | | | 6,806 |
| | | | | |
| 59 | | Harris Stratex Networks, Inc., (2) | | | | | | | | | 382 |
| | | | | |
| 60 | | Tellabs Inc., (2) | | | | | | | | | 344 |
| | Total Communication Equipment | | | | | | | | | 8,010 |
| | Computers & Peripherals – 1.0% | | | | | | | | | |
| | | | | |
| 60 | | Diebold Inc. | | | | | | | | | 1,582 |
| | | | | |
| 160 | | Lexmark International, Inc., Class A, (2) | | | | | | | | | 2,536 |
| | | | | |
| 650 | | Seagate Technology | | | | | | | | | 6,799 |
| | | | | |
| 30 | | Teradata Corporation, (2) | | | | | | | | | 703 |
| | | | | |
| 300 | | Western Digital Corporation, (2) | | | | | | | | | 7,950 |
| | Total Computers & Peripherals | | | | | | | | | 19,570 |
| | Construction & Engineering – 0.5% | | | | | | | | | |
| | | | | |
| 120 | | AECOM Technology Corporation, (2) | | | | | | | | | 3,840 |
| | | | | |
| 100 | | URS Corporation, (2) | | | | | | | | | 4,952 |
| | Total Construction & Engineering | | | | | | | | | 8,792 |
| | Construction Materials – 0.3% | | | | | | | | | |
| | | | | |
| 140 | | Vulcan Materials Company | | | | | | | | | 6,034 |
| | Consumer Finance – 0.4% | | | | | | | | | |
| | | | | |
| 30 | | Americredit Corp., (2) | | | | | | | | | 407 |
| | | | | |
| 650 | | Discover Financial Services | | | | | | | | | 6,675 |
| | Total Consumer Finance | | | | | | | | | 7,082 |
| | Containers & Packaging – 1.2% | | | | | | | | | |
| | | | | |
| 60 | | AptarGroup Inc. | | | | | | | | | 2,026 |
| | | | | |
| 130 | | Ball Corporation | | | | | | | | | 5,871 |
| | | | | |
| 110 | | Bemis Company, Inc. | | | | | | | | | 2,772 |
| | | | | |
| 190 | | Crown Holdings Inc., (2) | | | | | | | | | 4,587 |
| | | | | |
| 10 | | Greif Inc. | | | | | | | | | 442 |
| | | | | |
| 10 | | Packaging Corp. of America | | | | | | | | | 162 |
| | | | | |
| 150 | | Sealed Air Corporation | | | | | | | | | 2,767 |
| | | | | |
| 90 | | Sonoco Products Company | | | | | | | | | 2,155 |
| | | | | |
| 150 | | Temple-Inland Inc. | | | | | | | | | 1,968 |
| | Total Containers & Packaging | | | | | | | | | 22,750 |
| | Distributors – 0.4% | | | | | | | | | |
| | | | | |
| 200 | | Genuine Parts Company | | | | | | | | | 6,712 |
| | | | | |
| 60 | | LKQ Corporation, (2) | | | | | | | | | 987 |
| | Total Distributors | | | | | | | | | 7,699 |
Portfolio of Investments
Nuveen Enhanced Mid-Cap Fund (continued)
June 30, 2009
| | | | | | | | | | | |
| Shares | | Description (1) | | | | | | | | Value |
| | | | | | | | | | | |
| | Diversified Consumer Services – 0.9% | | | | | | | | | |
| | | | | |
| 70 | | Career Education Corporation, (2) | | | | | | | | $ | 1,742 |
| | | | | |
| 370 | | H & R Block Inc. | | | | | | | | | 6,375 |
| | | | | |
| 60 | | Hillenbrand Inc. | | | | | | | | | 998 |
| | | | | |
| 120 | | Service Corporation International | | | | | | | | | 658 |
| | | | | |
| 30 | | Strayer Education Inc. | | | | | | | | | 6,543 |
| | Total Diversified Consumer Services | | | | | | | | | 16,316 |
| | Diversified REIT – 0.3% | | | | | | | | | |
| | | | | |
| 190 | | Liberty Property Trust | | | | | | | | | 4,378 |
| | | | | |
| 40 | | Vornado Realty Trust | | | | | | | | | 1,801 |
| | Total Diversified REIT | | | | | | | | | 6,179 |
| | Diversified Telecommunication Services – 1.5% | | | | | | | | | |
| | | | | |
| 170 | | CenturyTel, Inc. | | | | | | | | | 5,219 |
| | | | | |
| 20 | | CLearwire Corporation, (2) | | | | | | | | | 111 |
| | | | | |
| 160 | | Embarq Corporation | | | | | | | | | 6,730 |
| | | | | |
| 350 | | Frontier Communications Corporation | | | | | | | | | 2,499 |
| | | | | |
| 1,150 | | Level 3 Communications Inc., (2) | | | | | | | | | 1,737 |
| | | | | |
| 2,060 | | Qwest Communications International Inc. | | | | | | | | | 8,549 |
| | | | | |
| 450 | | Windstream Corporation | | | | | | | | | 3,762 |
| | Total Diversified Telecommunication Services | | | | | | | | | 28,607 |
| | Electric Utilities – 3.6% | | | | | | | | | |
| | | | | |
| 440 | | American Electric Power Company, Inc. | | | | | | | | | 12,712 |
| | | | | |
| 110 | | DPL Inc. | | | | | | | | | 2,549 |
| | | | | |
| 350 | | Edison International | | | | | | | | | 11,011 |
| | | | | |
| 200 | | Great Plains Energy Incorporated | | | | | | | | | 3,110 |
| | | | | |
| 110 | | Hawaiian Electric Industries | | | | | | | | | 2,097 |
| | | | | |
| 180 | | Northeast Utilities | | | | | | | | | 4,016 |
| | | | | |
| 260 | | NV Energy Inc. | | | | | | | | | 2,805 |
| | | | | |
| 330 | | Pepco Holdings, Inc. | | | | | | | | | 4,435 |
| | | | | |
| 150 | | Pinnacle West Capital Corporation | | | | | | | | | 4,522 |
| | | | | |
| 360 | | PPL Corporation | | | | | | | | | 11,866 |
| | | | | |
| 260 | | Progress Energy, Inc. | | | | | | | | | 9,836 |
| | Total Electric Utilities | | | | | | | | | 68,959 |
| | Electrical Equipment – 1.1% | | | | | | | | | |
| | | | | |
| 30 | | Ametek Inc. | | | | | | | | | 1,037 |
| | | | | |
| 190 | | Cooper Industries, Ltd., Class A | | | | | | | | | 5,899 |
| | | | | |
| 50 | | Hubbell Incorporated, Class B | | | | | | | | | 1,603 |
| | | | | |
| 200 | | Rockwell Automation, Inc. | | | | | | | | | 6,424 |
| | | | | |
| 80 | | Roper Industries Inc. | | | | | | | | | 3,625 |
| | | | | |
| 100 | | Thomas & Betts Corporation, (2) | | | | | | | | | 2,886 |
| | Total Electrical Equipment | | | | | | | | | 21,474 |
| | Electronic Components – 0.1% | | | | | | | | | |
| | | | | |
| 40 | | Amphenol Corporation, Class A | | | | | | | | | 1,266 |
| | | | | |
| 50 | | AVX Group | | | | | | | | | 497 |
| | | | | |
| 70 | | Vishay Intertechnology Inc., (2) | | | | | | | | | 475 |
| | Total Electronic Components | | | | | | | | | 2,238 |
| | | | | | | | | | | |
| Shares | | Description (1) | | | | | | | | Value |
| | | | | | | | | | | |
| | Electronic Equipment & Instruments – 0.5% | | | | | | | | | |
| | | | | |
| 50 | | Agilent Technologies, Inc., (2) | | | | | | | | $ | 1,016 |
| | | | | |
| 130 | | Arrow Electronics, Inc., (2) | | | | | | | | | 2,761 |
| | | | | |
| 20 | | Avnet Inc., (2) | | | | | | | | | 421 |
| | | | | |
| 160 | | Ingram Micro, Inc., (2) | | | | | | | | | 2,800 |
| | | | | |
| 10 | | Jabil Circuit Inc. | | | | | | | | | 74 |
| | | | | |
| 10 | | Molex Inc. | | | | | | | | | 156 |
| | | | | |
| 20 | | National Instruments Corporation | | | | | | | | | 451 |
| | | | | |
| 10 | | Tech Data Corporation, (2) | | | | | | | | | 327 |
| | | | | |
| 30 | | Trimble Navigation Limited, (2) | | | | | | | | | 589 |
| | Total Electronic Equipment & Instruments | | | | | | | | | 8,595 |
| | Energy Equipment & Services – 4.4% | | | | | | | | | |
| | | | | |
| 500 | | BJ Services Company | | | | | | | | | 6,815 |
| | | | | |
| 110 | | Diamond Offshore Drilling, Inc. | | | | | | | | | 9,135 |
| | | | | |
| 20 | | Dresser Rand Group, Inc., (2) | | | | | | | | | 522 |
| | | | | |
| 310 | | ENSCO International Incorporated | | | | | | | | | 10,810 |
| | | | | |
| 10 | | Exterran Holdings, Inc., (2) | | | | | | | | | 160 |
| | | | | |
| 20 | | Global Industries, Limited, (2) | | | | | | | | | 113 |
| | | | | |
| 180 | | Helmerich & Payne Inc. | | | | | | | | | 5,557 |
| | | | | |
| 40 | | Key Energy Services Inc., (2) | | | | | | | | | 230 |
| | | | | |
| 520 | | Nabors Industries Inc., (2) | | | | | | | | | 8,102 |
| | | | | |
| 500 | | Noble Corporation | | | | | | | | | 15,125 |
| | | | | |
| 420 | | Patterson-UTI Energy, Inc. | | | | | | | | | 5,401 |
| | | | | |
| 290 | | Pride International Inc., (2) | | | | | | | | | 7,267 |
| | | | | |
| 340 | | Rowan Companies Inc. | | | | | | | | | 6,569 |
| | | | | |
| 30 | | SeaCor Smit Inc., (2) | | | | | | | | | 2,257 |
| | | | | |
| 90 | | Tidewater Inc. | | | | | | | | | 3,858 |
| | | | | |
| 40 | | Unit Corporation, (2) | | | | | | | | | 1,103 |
| | Total Energy Equipment & Services | | | | | | | | | 83,024 |
| | Food & Staples Retailing – 1.0% | | | | | | | | | |
| | | | | |
| 110 | | BJ’s Wholesale Club, (2) | | | | | | | | | 3,545 |
| | | | | |
| 340 | | Rite Aid Corporation, (2) | | | | | | | | | 513 |
| | | | | |
| 460 | | Safeway Inc. | | | | | | | | | 9,370 |
| | | | | |
| 390 | | SUPERVALU INC. | | | | | | | | | 5,050 |
| | Total Food & Staples Retailing | | | | | | | | | 18,478 |
| | Food Products – 3.7% | | | | | | | | | |
| | | | | |
| 140 | | Bunge Limited | | | | | | | | | 8,435 |
| | | | | |
| 270 | | Campbell Soup Company | | | | | | | | | 7,943 |
| | | | | |
| 440 | | ConAgra Foods, Inc. | | | | | | | | | 8,386 |
| | | | | |
| 90 | | Corn Products International, Inc. | | | | | | | | | 2,411 |
| | | | | |
| 170 | | Del Monte Foods Company | | | | | | | | | 1,595 |
| | | | | |
| 410 | | H.J. Heinz Company | | | | | | | | | 14,637 |
| | | | | |
| 180 | | Hershey Foods Corporation | | | | | | | | | 6,480 |
| | | | | |
| 70 | | Hormel Foods Corporation | | | | | | | | | 2,418 |
| | | | | |
| 160 | | JM Smucker Company | | | | | | | | | 7,786 |
| | | | | |
| 120 | | McCormick & Company, Incorporated | | | | | | | | | 3,904 |
| | | | | |
| 750 | | Sara Lee Corporation | | | | | | | | | 7,320 |
| | Total Food Products | | | | | | | | | 71,315 |
Portfolio of Investments
Nuveen Enhanced Mid-Cap Fund (continued)
June 30, 2009
| | | | | | | | | | | |
| Shares | | Description (1) | | | | | | | | Value |
| | | | | | | | | | | |
| | Gas Utilities – 1.2% | | | | | | | | | |
| | | | | |
| 70 | | AGL Resources Inc. | | | | | | | | $ | 2,226 |
| | | | | |
| 80 | | Atmos Energy Corporation | | | | | | | | | 2,003 |
| | | | | |
| 80 | | Energen Corporation | | | | | | | | | 3,192 |
| | | | | |
| 80 | | National Fuel Gas Company | | | | | | | | | 2,886 |
| | | | | |
| 130 | | ONEOK, Inc. | | | | | | | | | 3,834 |
| | | | | |
| 210 | | Questar Corporation | | | | | | | | | 6,523 |
| | | | | |
| 120 | | UGI Corporation | | | | | | | | | 3,059 |
| | Total Gas Utilities | | | | | | | | | 23,723 |
| | Health Care Equipment & Supplies – 0.9% | | | | | | | | | |
| | | | | |
| 10 | | Beckman Coulter, Inc. | | | | | | | | | 571 |
| | | | | |
| 30 | | C. R. Bard, Inc. | | | | | | | | | 2,233 |
| | | | | |
| 60 | | Cooper Companies, Inc. | | | | | | | | | 1,484 |
| | | | | |
| 60 | | Edwards Lifesciences Corporation, (2) | | | | | | | | | 4,082 |
| | | | | |
| 50 | | Hospira Inc., (2) | | | | | | | | | 1,926 |
| | | | | |
| 10 | | Idexx Labs Inc., (2) | | | | | | | | | 462 |
| | | | | |
| 30 | | ResMed Inc., (2) | | | | | | | | | 1,222 |
| | | | | |
| 50 | | Saint Jude Medical Inc., (2) | | | | | | | | | 2,055 |
| | | | | |
| 50 | | Teleflex Inc. | | | | | | | | | 2,241 |
| | Total Health Care Equipment & Supplies | | | | | | | | | 16,276 |
| | Health Care Providers & Services – 2.3% | | | | | | | | | |
| | | | | |
| 20 | | AmerisourceBergen Corporation | | | | | | | | | 355 |
| | | | | |
| 220 | | CIGNA Corporation | | | | | | | | | 5,300 |
| | | | | |
| 220 | | Coventry Health Care, Inc., (2) | | | | | | | | | 4,116 |
| | | | | |
| 140 | | Davita Inc., (2) | | | | | | | | | 6,924 |
| | | | | |
| 50 | | Express Scripts, Inc., (2) | | | | | | | | | 3,437 |
| | | | | |
| 110 | | Health Management Associates Inc., (2) | | | | | | | | | 543 |
| | | | | |
| 20 | | Henry Schein Inc., (2) | | | | | | | | | 959 |
| | | | | |
| 20 | | Laboratory Corporation of America Holdings, (2) | | | | | | | | | 1,356 |
| | | | | |
| 80 | | Lifepoint Hospitals Inc., (2) | | | | | | | | | 2,100 |
| | | | | |
| 20 | | Medax Inc., (2) | | | | | | | | | 843 |
| | | | | |
| 150 | | Omnicare, Inc. | | | | | | | | | 3,864 |
| | | | | |
| 180 | | Quest Diagnostics Incorporated | | | | | | | | | 10,157 |
| | | | | |
| 190 | | Tenet Healthcare Corporation, (2) | | | | | | | | | 536 |
| | | | | |
| 70 | | Universal Health Services, Inc., Class B | | | | | | | | | 3,419 |
| | | | | |
| 20 | | VCA Antech, Inc., (2) | | | | | | | | | 534 |
| | Total Health Care Providers & Services | | | | | | | | | 44,443 |
| | Health Care Technology – 0.1% | | | | | | | | | |
| | | | | |
| 130 | | Health Corporation, (2) | | | | | | | | | 1,703 |
| | | | | |
| 40 | | IMS Health Incorporated | | | | | | | | | 508 |
| | Total Health Care Technology | | | | | | | | | 2,211 |
| | Hotels, Restaurants & Leisure – 2.4% | | | | | | | | | |
| | | | | |
| 120 | | Burger King Holdings Inc. | | | | | | | | | 2,072 |
| | | | | |
| 50 | | Choice Hotels International, Inc. | | | | | | | | | 1,331 |
| | | | | |
| 230 | | Darden Restaurants, Inc. | | | | | | | | | 7,585 |
| | | | | |
| 10 | | International Game Technology | | | | | | | | | 159 |
| | | | | | | | | | | |
| Shares | | Description (1) | | | | | | | | Value |
| | | | | | | | | | | |
| | Hotels, Restaurants & Leisure (continued) | | | | | | | | | |
| | | | | |
| 10 | | Interval Leisure Group Inc., (2) | | | | | | | | $ | 93 |
| | | | | |
| 10 | | Intl Speedway Corporation | | | | | | | | | 256 |
| | | | | |
| 660 | | MGM Mirage Inc., (2) | | | | | | | | | 4,217 |
| | | | | |
| 10 | | Orient Express Hotels Limited | | | | | | | | | 85 |
| | | | | |
| 50 | | Panera Bread Company, (2) | | | | | | | | | 2,493 |
| | | | | |
| 10 | | Penn National Gaming, Inc., (2) | | | | | | | | | 291 |
| | | | | |
| 270 | | Royal Caribbean Cruises Limited | | | | | | | | | 3,656 |
| | | | | |
| 90 | | Tim Hortons Inc. | | | | | | | | | 2,209 |
| | | | | |
| 270 | | Wyndham Worldwide Corporation | | | | | | | | | 3,272 |
| | | | | |
| 540 | | YUM! Brands, Inc. | | | | | | | | | 18,004 |
| | Total Hotels, Restaurants & Leisure | | | | | | | | | 45,723 |
| | Household Durables – 1.4% | | | | | | | | | |
| | | | | |
| 100 | | Black & Decker Corporation | | | | | | | | | 2,866 |
| | | | | |
| 200 | | Fortune Brands Inc. | | | | | | | | | 6,948 |
| | | | | |
| 130 | | Garmin Limited | | | | | | | | | 3,097 |
| | | | | |
| 100 | | Mohawk Industries Inc., (2) | | | | | | | | | 3,568 |
| | | | | |
| 100 | | Stanley Works | | | | | | | | | 3,384 |
| | | | | |
| 170 | | Whirlpool Corporation | | | | | | | | | 7,235 |
| | Total Household Durables | | | | | | | | | 27,098 |
| | Household Products – 0.7% | | | | | | | | | |
| | | | | |
| 70 | | Church & Dwight Company Inc. | | | | | | | | | 3,802 |
| | | | | |
| 180 | | Clorox Company | | | | | �� | | | | 10,049 |
| | Total Household Products | | | | | | | | | 13,851 |
| | Independent Power Producers & Energy Traders – 1.3% | | | | | | | | | |
| | | | | |
| 810 | | AES Corporation, (2) | | | | | | | | | 9,404 |
| | | | | |
| 140 | | Calpine Corporation, (2) | | | | | | | | | 1,561 |
| | | | | |
| 40 | | Constellation Energy Group | | | | | | | | | 1,063 |
| | | | | |
| 770 | | Dynegy Inc., (2) | | | | | | | | | 1,748 |
| | | | | |
| 280 | | Mirant Corporation, (2) | | | | | | | | | 4,407 |
| | | | | |
| 290 | | NRG Energy Inc., (2) | | | | | | | | | 7,528 |
| | Total Independent Power Producers & Energy Traders | | | | | | | | | 25,711 |
| | Industrial Conglomerates – 0.4% | | | | | | | | | |
| | | | | |
| 30 | | Carlisle Companies Inc. | | | | | | | | | 721 |
| | | | | |
| 700 | | Textron Inc. | | | | | | | | | 6,762 |
| | Total Industrial Conglomerates | | | | | | | | | 7,483 |
| | Industrial REIT – 0.4% | | | | | | | | | |
| | | | | |
| 940 | | ProLogis | | | | | | | | | 7,576 |
| | Insurance – 5.0% | | | | | | | | | |
| | | | | |
| 50 | | Allied World Assurance Holdings | | | | | | | | | 2,041 |
| | | | | |
| 100 | | American Financial Group Inc. | | | | | | | | | 2,158 |
| | | | | |
| 10 | | American National Insurance Company | | | | | | | | | 756 |
| | | | | |
| 360 | | Aon Corporation | | | | | | | | | 13,633 |
| | | | | |
| 70 | | Arch Capital Group Limited, (2) | | | | | | | | | 4,101 |
| | | | | |
| 140 | | Arthur J. Gallagher & Co. | | | | | | | | | 2,988 |
| | | | | |
| 180 | | Axis Capital Holdings Limited | | | | | | | | | 4,712 |
Portfolio of Investments
Nuveen Enhanced Mid-Cap Fund (continued)
June 30, 2009
| | | | | | | | | | | |
| Shares | | Description (1) | | | | | | | | Value |
| | | | | | | | | | | |
| | Insurance (continued) | | | | | | | | | |
| | | | | |
| 110 | | Brown & Brown Inc. | | | | | | | | $ | 2,192 |
| | | | | |
| 160 | | Cincinnati Financial Corporation | | | | | | | | | 3,576 |
| | | | | |
| 80 | | Conseco Inc., (2) | | | | | | | | | 190 |
| | | | | |
| 70 | | Endurance Specialty Holdings, Limited | | | | | | | | | 2,051 |
| | | | | |
| 20 | | Erie Indemnity Company | | | | | | | | | 715 |
| | | | | |
| 310 | | Fidelity National Title Group Inc., Class A | | | | | | | | | 4,194 |
| | | | | |
| 80 | | Hanover Insurance Group Inc. | | | | | | | | | 3,049 |
| | | | | |
| 110 | | HCC Insurance Holdings Inc. | | | | | | | | | 2,641 |
| | | | | |
| 880 | | Lincoln National Corporation | | | | | | | | | 15,145 |
| | | | | |
| 20 | | Marsh & McLennan Companies, Inc. | | | | | | | | | 403 |
| | | | | |
| 210 | | Old Republic International Corporation | | | | | | | | | 2,068 |
| | | | | |
| 20 | | OneBeacon Insurance Group Limited, Class A | | | | | | | | | 234 |
| | | | | |
| 80 | | PartnerRe Limited | | | | | | | | | 5,196 |
| | | | | |
| 190 | | Progressive Corporation, (2) | | | | | | | | | 2,871 |
| | | | | |
| 80 | | Reinsurance Group of America Inc. | | | | | | | | | 2,793 |
| | | | | |
| 70 | | RenaisasnceRE Holdings, Limited | | | | | | | | | 3,258 |
| | | | | |
| 10 | | Transatlantic Holdings Inc. | | | | | | | | | 433 |
| | | | | |
| 10 | | Unitrin, Inc. | | | | | | | | | 120 |
| | | | | |
| 440 | | Unum Group | | | | | | | | | 6,978 |
| | | | | |
| 10 | | White Mountain Insurance Group | | | | | | | | | 2,289 |
| | | | | |
| 200 | | WR Berkley Corporation | | | | | | | | | 4,294 |
| | Total Insurance | | | | | | | | | 95,079 |
| | Internet & Catalog Retail – 0.1% | | | | | | | | | |
| | | | | |
| 20 | | Hosting Site Network, Inc., (2) | | | | | | | | | 211 |
| | | | | |
| 370 | | Liberty Media Holding Corporation Interactive, Class A, (2) | | | | | | | | | 1,854 |
| | | | | |
| 20 | | Ticketmaster Online-Citysearch, Inc., (2) | | | | | | | | | 128 |
| | Total Internet & Catalog Retail | | | | | | | | | 2,193 |
| | Internet Software & Services – 0.4% | | | | | | | | | |
| | | | | |
| 160 | | IAC/InterActiveCorp., (2) | | | | | | | | | 2,568 |
| | | | | |
| 90 | | Sohu.com Inc., (2) | | | | | | | | | 5,655 |
| | | | | |
| 10 | | WebMD Health Corporation, Class A, (2) | | | | | | | | | 299 |
| | Total Internet Software & Services | | | | | | | | | 8,522 |
| | IT Services – 1.7% | | | | | | | | | |
| | | | | |
| 110 | | Affiliated Computer Services, Inc., (2) | | | | | | | | | 4,886 |
| | | | | |
| 80 | | Amdocs Limited, (2) | | | | | | | | | 1,716 |
| | | | | |
| 150 | | Broadridge Financial Solutions, Inc. | | | | | | | | | 2,487 |
| | | | | |
| 160 | | Computer Sciences Corporation, (2) | | | | | | | | | 7,088 |
| | | | | |
| 40 | | Convergys Corporation, (2) | | | | | | | | | 371 |
| | | | | |
| 220 | | Fidelity National Information Services | | | | | | | | | 4,391 |
| | | | | |
| 20 | | Fiserv, Inc., (2) | | | | | | | | | 914 |
| | | | | |
| 30 | | Genpact Limited, (2) | | | | | | | | | 353 |
| | | | | |
| 80 | | Global Payments Inc. | | | | | | | | | 2,997 |
| | | | | |
| 10 | | Hewitt Associates Inc., Class A, (2) | | | | | | | | | 298 |
| | | | | |
| 90 | | Lender Processing Services Inc. | | | | | | | | | 2,499 |
| | | | | |
| 30 | | Metavante Technologies Inc., (2) | | | | | | | | | 776 |
| | | | | | | | | | | |
| Shares | | Description (1) | | | | | | | | Value |
| | | | | | | | | | | |
| | IT Services (continued) | | | | | | | | | |
| | | | | |
| 20 | | NeuStar, Inc., (2) | | | | | | | | $ | 443 |
| | | | | |
| 160 | | SAIC, Inc., (2) | | | | | | | | | 2,968 |
| | | | | |
| 40 | | Total System Services Inc. | | | | | | | | | 536 |
| | | | | |
| 260 | | Unisys Corporation, (2) | | | | | | | | | 393 |
| | Total IT Services | | | | | | | | | 33,116 |
| | Leisure Equipment & Products – 0.7% | | | | | | | | | |
| | | | | |
| 390 | | Eastman Kodak Company | | | | | | | | | 1,154 |
| | | | | |
| 210 | | Hasbro, Inc. | | | | | | | | | 5,090 |
| | | | | |
| 450 | | Mattel, Inc. | | | | | | | | | 7,222 |
| | Total Leisure Equipment & Products | | | | | | | | | 13,466 |
| | Life Sciences Tools & Services – 0.1% | | | | | | | | | |
| | | | | |
| 10 | | Techne Corporation | | | | | | | | | 638 |
| | | | | |
| 10 | | Waters Corporation, (2) | | | | | | | | | 515 |
| | Total Life Sciences Tools & Services | | | | | | | | | 1,153 |
| | Machinery – 3.7% | | | | | | | | | |
| | | | | |
| 10 | | Crane Company | | | | | | | | | 223 |
| | | | | |
| 290 | | Cummins Inc. | | | | | | | | | 10,211 |
| | | | | |
| 30 | | Donaldson Company, Inc. | | | | | | | | | 1,039 |
| | | | | |
| 220 | | Dover Corporation | | | | | | | | | 7,280 |
| | | | | |
| 220 | | Eaton Corporation | | | | | | | | | 9,814 |
| | | | | |
| 10 | | Gardner Denver, Inc., (2) | | | | | | | | | 252 |
| | | | | |
| 20 | | Graco Inc. | | | | | | | | | 440 |
| | | | | |
| 80 | | Harsco Corporation | | | | | | | | | 2,264 |
| | | | | |
| 80 | | IDEX Corporation | | | | | | | | | 1,966 |
| | | | | |
| 510 | | Ingersoll Rand Company Limited, Class A | | | | | | | | | 10,659 |
| | | | | |
| 10 | | John Bean Technologies Corporation | | | | | | | | | 125 |
| | | | | |
| 90 | | Kennametal Inc. | | | | | | | | | 1,726 |
| | | | | |
| 10 | | Lincoln Electric Holdings Inc. | | | | | | | | | 360 |
| | | | | |
| 70 | | Pall Corporation | | | | | | | | | 1,859 |
| | | | | |
| 200 | | Parker Hannifin Corporation | | | | | | | | | 8,592 |
| | | | | |
| 100 | | Pentair, Inc. | | | | | | | | | 2,562 |
| | | | | |
| 80 | | SPX Corporation | | | | | | | | | 3,918 |
| | | | | |
| 290 | | Terex Corporation, (2) | | | | | | | | | 3,500 |
| | | | | |
| 100 | | Timken Company | | | | | | | | | 1,708 |
| | | | | |
| 130 | | Trinity Industries Inc. | | | | | | | | | 1,771 |
| | Total Machinery | | | | | | | | | 70,269 |
| | Marine – 0.0% | | | | | | | | | |
| | | | | |
| 40 | | Alexander and Bald, Inc., (2) | | | | | | | | | 938 |
| | Media – 2.7% | | | | | | | | | |
| | | | | |
| 10 | | Ascent Media Corporation, (2) | | | | | | | | | 266 |
| | | | | |
| 270 | | Cablevision Systems Corporation | | | | | | | | | 5,241 |
| | | | | |
| 1,230 | | CBS Corporation, Class B | | | | | | | | | 8,512 |
| | | | | |
| 10 | | Clear Channel Outdoor Holdings Inc., Class A, (2) | | | | | | | | | 53 |
| | | | | |
| 10 | | CTC Media, Inc., (2) | | | | | | | | | 118 |
| | | | | |
| 40 | | Discovery Communications Inc., Class C Shares, (2) | | | | | | | | | 821 |
| | | | | |
| 10 | | Dreamworks Animation SKG Inc., (2) | | | | | | | | | 276 |
Portfolio of Investments
Nuveen Enhanced Mid-Cap Fund (continued)
June 30, 2009
| | | | | | | | | | | |
| Shares | | Description (1) | | | | | | | | Value |
| | | | | | | | | | | |
| | Media (continued) | | | | | | | | | |
| | | | | |
| 10 | | E.W. Scripps Company, Class A | | | | | | | | $ | 21 |
| | | | | |
| 350 | | Echostar Communications Corporation, Variable Prepaid Forward, (2) | | | | | | | | | 5,673 |
| | | | | |
| 580 | | Interpublic Group Companies, Inc., (2) | | | | | | | | | 2,929 |
| | | | | |
| 40 | | John Wiley and Sons Inc., Class A | | | | | | | | | 1,330 |
| | | | | |
| 290 | | Liberty Global Inc, A Shares, (2) | | | | | | | | | 4,608 |
| | | | | |
| 210 | | Liberty Media Corporation, Entertainment Tracking Shares, Class A, (2) | | | | | | | | | 5,617 |
| | | | | |
| 30 | | Liberty Media Holding Corporation, Capital Tracking Stock, Class A, (2) | | | | | | | | | 407 |
| | | | | |
| 380 | | McGraw-Hill Companies, Inc. | | | | | | | | | 11,442 |
| | | | | |
| 40 | | New York Times, Class A | | | | | | | | | 220 |
| | | | | |
| 20 | | Scripps Networks Interactive, Class A Shares | | | | | | | | | 557 |
| | | | | |
| 160 | | Sirius XM Radio Inc., (2) | | | | | | | | | 69 |
| | | | | |
| 360 | | Virgin Media, Inc. | | | | | | | | | 3,366 |
| | | | | |
| 20 | | Warner Music Group Corporation, (2) | | | | | | | | | 117 |
| | Total Media | | | | | | | | | 51,643 |
| | Metals & Mining – 1.0% | | | | | | | | | |
| | | | | |
| 170 | | Allegheny Technologies, Inc. | | | | | | | | | 5,938 |
| | | | | |
| 280 | | Cliffs Natural Resources Inc. | | | | | | | | | 6,852 |
| | | | | |
| 120 | | Reliance Steel & Aluminum Company | | | | | | | | | 4,607 |
| | | | | |
| 50 | | Schnitzer Steel Industries, Inc. | | | | | | | | | 2,643 |
| | Total Metals & Mining | | | | | | | | | 20,040 |
| | Mortgage REIT – 0.7% | | | | | | | | | |
| | | | | |
| 910 | | Annaly Capital Management Inc. | | | | | | | | | 13,777 |
| | | | | |
| 10 | | iStar Financial Inc. | | | | | | | | | 28 |
| | Total Mortgage REIT | | | | | | | | | 13,805 |
| | Multiline Retail – 3.0% | | | | | | | | | |
| | | | | |
| 130 | | Big Lots, Inc., (2) | | | | | | | | | 2,734 |
| | | | | |
| 160 | | Dollar Tree Stores Inc., (2) | | | | | | | | | 6,736 |
| | | | | |
| 200 | | Family Dollar Stores, Inc. | | | | | | | | | 5,660 |
| | | | | |
| 830 | | Federated Department Stores, Inc. | | | | | | | | | 9,761 |
| | | | | |
| 370 | | J.C. Penney Company, Inc. | | | | | | | | | 10,623 |
| | | | | |
| 350 | | Kohl’s Corporation, (2) | | | | | | | | | 14,962 |
| | | | | |
| 300 | | Nordstrom, Inc. | | | | | | | | | 5,967 |
| | | | | |
| 20 | | Saks Inc., (2) | | | | | | | | | 89 |
| | Total Multiline Retail | | | | | | | | | 56,532 |
| | Multi-Utilities – 5.2% | | | | | | | | | |
| | | | | |
| 130 | | Alliant Energy Corporation | | | | | | | | | 3,397 |
| | | | | |
| 250 | | Ameren Corporation | | | | | | | | | 6,222 |
| | | | | |
| 510 | | CenterPoint Energy, Inc. | | | | | | | | | 5,651 |
| | | | | |
| 310 | | CMS Energy Corporation | | | | | | | | | 3,745 |
| | | | | |
| 260 | | Consolidated Edison, Inc. | | | | | | | | | 9,729 |
| | | | | |
| 170 | | DTE Energy Company | | | | | | | | | 5,440 |
| | | | | |
| 110 | | Integrys Energy Group, Inc. | | | | | | | | | 3,299 |
| | | | | |
| 180 | | MDU Resources Group Inc. | | | | | | | | | 3,415 |
| | | | | |
| 380 | | NiSource Inc. | | | | | | | | | 4,431 |
| | | | | |
| 120 | | NSTAR | | | | | | | | | 3,853 |
| | | | | | | | | | | |
| Shares | | Description (1) | | | | | | | | Value |
| | | | | | | | | | | |
| | Multi-Utilities (continued) | | | | | | | | | |
| | | | | |
| 80 | | OGE Energy Corp. | | | | | | | | $ | 2,266 |
| | | | | |
| 380 | | PG&E Corporation | | | | | | | | | 14,607 |
| | | | | |
| 120 | | Scana Corporation | | | | | | | | | 3,896 |
| | | | | |
| 230 | | Sempra Energy | | | | | | | | | 11,415 |
| | | | | |
| 230 | | TECO Energy, Inc. | | | | | | | | | 2,743 |
| | | | | |
| 80 | | Vectren Corporation | | | | | | | | | 1,874 |
| | | | | |
| 130 | | Wisconsin Energy Corporation | | | | | | | | | 5,292 |
| | | | | |
| 400 | | Xcel Energy, Inc. | | | | | | | | | 7,364 |
| | Total Multi-Utilities | | | | | | | | | 98,639 |
| | Office Electronics – 0.4% | | | | | | | | | |
| | | | | |
| 1,000 | | Xerox Corporation | | | | | | | | | 6,480 |
| | | | | |
| 20 | | Zebra Technologies Corporation, Class A, (2) | | | | | | | | | 473 |
| | Total Office Electronics | | | | | | | | | 6,953 |
| | Office REIT – 0.8% | | | | | | | | | |
| | | | | |
| 280 | | Brandywine Realty Trust | | | | | | | | | 2,086 |
| | | | | |
| 410 | | Duke Realty Corporation | | | | | | | | | 3,596 |
| | | | | |
| 380 | | HRPT Properties Trust | | | | | | | | | 1,543 |
| | | | | |
| 120 | | Mack-Cali Realty Corporation | | | | | | | | | 2,736 |
| | | | | |
| 260 | | SL Green Realty Corporation | | | | | | | | | 5,964 |
| | Total Office REIT | | | | | | | | | 15,925 |
| | Oil, Gas & Consumable Fuels – 5.0% | | | | | | | | | |
| | | | | |
| 200 | | Cimarex Energy Company | | | | | | | | | 5,668 |
| | | | | |
| 10 | | CNX Gas Corporation, (2) | | | | | | | | | 263 |
| | | | | |
| 1,130 | | El Paso Corporation | | | | | | | | | 10,430 |
| | | | | |
| 250 | | Forest Oil Corporation, (2) | | | | | | | | | 3,730 |
| | | | | |
| 90 | | Frontline Limited | | | | | | | | | 2,192 |
| | | | | |
| 100 | | Mariner Energy Inc., (2) | | | | | | | | | 1,175 |
| | | | | |
| 220 | | Murphy Oil Corporation | | | | | | | | | 11,950 |
| | | | | |
| 200 | | Newfield Exploration Company, (2) | | | | | | | | | 6,534 |
| | | | | |
| 200 | | Noble Energy, Inc. | | | | | | | | | 11,794 |
| | | | | |
| 70 | | Overseas Shipholding Group Inc. | | | | | | | | | 2,383 |
| | | | | |
| 210 | | Petrohawk Energy Corporation, (2) | | | | | | | | | 4,683 |
| | | | | |
| 240 | | Pioneer Natural Resources Company | | | | | | | | | 6,120 |
| | | | | |
| 230 | | Plains Exploration & Production Company, (2) | | | | | | | | | 6,293 |
| | | | | |
| 120 | | Southern Union Company | | | | | | | | | 2,207 |
| | | | | |
| 600 | | Spectra Energy Corporation | | | | | | | | | 10,152 |
| | | | | |
| 330 | | Sunoco, Inc. | | | | | | | | | 7,656 |
| | | | | |
| 90 | | Teekay Shipping Corporation | | | | | | | | | 1,893 |
| | | | | |
| 110 | | W&T Offshore Inc. | | | | | | | | | 1,071 |
| | Total Oil, Gas & Consumable Fuels | | | | | | | | | 96,194 |
| | Paper & Forest Products – 0.8% | | | | | | | | | |
| | | | | |
| 36 | | Domtar Corporation, (2) | | | | | | | | | 597 |
| | | | | |
| 690 | | International Paper Company | | | | | | | | | 10,440 |
| | | | | |
| 170 | | MeadWestvaco Corporation | | | | | | | | | 2,790 |
| | | | | |
| 30 | | Weyerhaeuser Company | | | | | | | | | 913 |
| | Total Paper & Forest Products | | | | | | | | | 14,740 |
Portfolio of Investments
Nuveen Enhanced Mid-Cap Fund (continued)
June 30, 2009
| | | | | | | | | | | |
| Shares | | Description (1) | | | | | | | | Value |
| | | | | | | | | | | |
| | Personal Products – 0.2% | | | | | | | | | |
| | | | | |
| 90 | | Alberto Culver Company | | | | | | | | $ | 2,289 |
| | | | | |
| 30 | | Avon Products, Inc. | | | | | | | | | 773 |
| | | | | |
| 20 | | Bare Escentuals, Inc., (2) | | | | | | | | | 177 |
| | | | | |
| 20 | | Herbalife, Limited | | | | | | | | | 631 |
| | Total Personal Products | | | | | | | | | 3,870 |
| | Pharmaceuticals – 0.9% | | | | | | | | | |
| | | | | |
| 70 | | Allergan, Inc. | | | | | | | | | 3,331 |
| | | | | |
| 40 | | Endo Pharmaceuticals Holdings Inc., (2) | | | | | | | | | 717 |
| | | | | |
| 100 | | Forest Laboratories, Inc., (2) | | | | | | | | | 2,511 |
| | | | | |
| 350 | | King Pharmaceuticals Inc., (2) | | | | | | | | | 3,370 |
| | | | | |
| 190 | | Sepracor Inc., (2) | | | | | | | | | 3,291 |
| | | | | |
| 20 | | Warner Chilcott Limited, (2) | | | | | | | | | 263 |
| | | | | |
| 130 | | Watson Pharmaceuticals Inc., (2) | | | | | | | | | 4,380 |
| | Total Pharmaceuticals | | | | | | | | | 17,863 |
| | Professional Services – 1.0% | | | | | | | | | |
| | | | | |
| 60 | | Dun and Bradstreet Inc. | | | | | | | | | 4,873 |
| | | | | |
| 150 | | Equifax Inc. | | | | | | | | | 3,915 |
| | | | | |
| 20 | | IHS Inc., (2) | | | | | | | | | 997 |
| | | | | |
| 100 | | Manpower Inc. | | | | | | | | | 4,234 |
| | | | | |
| 190 | | Robert Half International Inc. | | | | | | | | | 4,488 |
| | Total Professional Services | | | | | | | | | 18,507 |
| | Residential REIT – 1.7% | | | | | | | | | |
| | | | | |
| 310 | | Apartment Investment & Management Company, Class A | | | | | | | | | 2,744 |
| | | | | |
| 200 | | AvalonBay Communities, Inc. | | | | | | | | | 11,188 |
| | | | | |
| 110 | | Camden Property Trust | | | | | | | | | 3,036 |
| | | | | |
| 530 | | Equity Residential | | | | | | | | | 11,782 |
| | | | | |
| 330 | | UDR Inc. | | | | | | | | | 3,409 |
| | Total Residential REIT | | | | | | | | | 32,159 |
| | Retail REIT – 0.9% | | | | | | | | | |
| | | | | |
| 3 | | CBL & Associates Properties Inc. | | | | | | | | | 16 |
| | | | | |
| 710 | | Developers Diversified Realty Corporation | | | | | | | | | 3,465 |
| | | | | |
| 390 | | General Growth Properties Inc. | | | | | | | | | 714 |
| | | | | |
| 270 | | Kimco Realty Corporation | | | | | | | | | 2,713 |
| | | | | |
| 410 | | Macerich Company | | | | | | | | | 7,220 |
| | | | | |
| 200 | | Weingarten Realty Investors Trust | | | | | | | | | 2,902 |
| | Total Retail REIT | | | | | | | | | 17,030 |
| | Road & Rail – 0.4% | | | | | | | | | |
| | | | | |
| 50 | | Avis Budget Group Inc., (2) | | | | | | | | | 283 |
| | | | | |
| 120 | | Hertz Global Holdings, Inc., (2) | | | | | | | | | 959 |
| | | | | |
| 190 | | J.B. Hunt Transports Serives Inc. | | | | | | | | | 5,801 |
| | Total Road & Rail | | | | | | | | | 7,043 |
| | Semiconductors & Equipment – 2.9% | | | | | | | | | |
| | | | | |
| 540 | | Altera Corporation | | | | | | | | | 8,791 |
| | | | | |
| 520 | | Analog Devices, Inc. | | | | | | | | | 12,886 |
| | | | | |
| 510 | | Atmel Corporation, (2) | | | | | | | | | 1,902 |
| | | | | | | | | | | |
| Shares | | Description (1) | | | | | | | | Value |
| | | | | | | | | | | |
| | Semiconductors & Equipment (continued) | | | | | | | | | |
| | | | | |
| 20 | | Cree, Inc., (2) | | | | | | | | $ | 588 |
| | | | | |
| 160 | | Cypress Semiconductor Corporation, (2) | | | | | | | | | 1,472 |
| | | | | |
| 20 | | Fairchild Semiconductor International Inc., Class A, (2) | | | | | | | | | 140 |
| | | | | |
| 20 | | International Rectifier Corporation, (2) | | | | | | | | | 296 |
| | | | | |
| 480 | | Linear Technology Corporation | | | | | | | | | 11,208 |
| | | | | |
| 50 | | LSI Logic Corporation, (2) | | | | | | | | | 228 |
| | | | | |
| 540 | | National Semiconductor Corporation | | | | | | | | | 6,777 |
| | | | | |
| 530 | | Xilinx, Inc. | | | | | | | | | 10,844 |
| | Total Semiconductors & Equipment | | | | | | | | | 55,132 |
| | Software – 0.8% | | | | | | | | | |
| | | | | |
| 20 | | Ansys Inc., (2) | | | | | | | | | 623 |
| | | | | |
| 570 | | CA Inc. | | | | | | | | | 9,935 |
| | | | | |
| 50 | | Cadence Design Systems, Inc., (2) | | | | | | | | | 295 |
| | | | | |
| 60 | | Compuware Corporation, (2) | | | | | | | | | 412 |
| | | | | |
| 40 | | FactSet Research Systems Inc. | | | | | | | | | 1,995 |
| | | | | |
| 40 | | Intuit, Inc., (2) | | | | | | | | | 1,126 |
| | | | | |
| 60 | | Novell Inc., (2) | | | | | | | | | 272 |
| | | | | |
| 20 | | Nuance Communications, Inc., (2) | | | | | | | | | 242 |
| | | | | |
| 20 | | Red Hat, Inc., (2) | | | | | | | | | 403 |
| | | | | |
| 30 | | Synopsys Inc., (2) | | | | | | | | | 585 |
| | Total Software | | | | | | | | | 15,888 |
| | Specialized REIT – 3.0% | | | | | | | | | |
| | | | | |
| 600 | | Health Care Property Investors Inc. | | | | | | | | | 12,714 |
| | | | | |
| 250 | | Health Care REIT, Inc. | | | | | | | | | 8,525 |
| | | | | |
| 180 | | Hospitality Properties Trust | | | | | | | | | 2,140 |
| | | | | |
| 1,190 | | Host Hotels & Resorts Inc. | | | | | | | | | 9,984 |
| | | | | |
| 180 | | Nationwide Health Properties, Inc. | | | | | | | | | 4,633 |
| | | | | |
| 220 | | Public Storage, Inc. | | | | | | | | | 14,406 |
| | | | | |
| 120 | | Rayonier Inc. | | | | | | | | | 4,362 |
| | Total Specialized REIT | | | | | | | | | 56,764 |
| | Specialty Retail – 4.5% | | | | | | | | | |
| | | | | |
| 220 | | Abercrombie & Fitch Co., Class A | | | | | | | | | 5,586 |
| | | | | |
| 150 | | Advance Auto Parts, Inc. | | | | | | | | | 6,223 |
| | | | | |
| 280 | | American Eagle Outfitters, Inc. | | | | | | | | | 3,968 |
| | | | | |
| 70 | | AutoZone, Inc., (2) | | | | | | | | | 10,578 |
| | | | | |
| 60 | | Barnes & Noble Inc. | | | | | | | | | 1,238 |
| | | | | |
| 30 | | CarMax, Inc., (2) | | | | | | | | | 441 |
| | | | | |
| 150 | | Foot Locker, Inc. | | | | | | | | | 1,571 |
| | | | | |
| 610 | | Gap, Inc. | | | | | | | | | 10,004 |
| | | | | |
| 410 | | Limited Brands, Inc. | | | | | | | | | 4,908 |
| | | | | |
| 50 | | Penske Auto Group, Inc. | | | | | | | | | 832 |
| | | | | |
| 140 | | PetSmart Inc. | | | | | | | | | 3,004 |
| | | | | |
| 260 | | RadioShack Corporation | | | | | | | | | 3,630 |
| | | | | |
| 160 | | Ross Stores, Inc. | | | | | | | | | 6,176 |
| | | | | |
| 130 | | Sherwin-Williams Company | | | | | | | | | 6,987 |
| | | | | |
| 20 | | Signet Jewelers Limited | | | | | | | | | 416 |
Portfolio of Investments
Nuveen Enhanced Mid-Cap Fund (continued)
June 30, 2009
| | | | | | | | | | | |
| Shares | | Description (1) | | | | | | | | Value |
| | | | | | | | | | | |
| | Specialty Retail (continued) | | | | | | | | | |
| | | | | |
| 210 | | Tiffany & Co. | | | | | | | | $ | 5,326 |
| | | | | |
| 450 | | TJX Companies, Inc. | | | | | | | | | 14,157 |
| | Total Specialty Retail | | | | | | | | | 85,045 |
| | Textiles, Apparel & Luxury Goods – 0.7% | | | | | | | | | |
| | | | | |
| 120 | | Polo Ralph Lauren Corporation | | | | | | | | | 6,425 |
| | | | | |
| 120 | | VF Corporation | | | | | | | | | 6,642 |
| | Total Textiles, Apparel & Luxury Goods | | | | | | | | | 13,067 |
| | Thrifts & Mortgage Finance – 1.0% | | | | | | | | | |
| | | | | |
| 20 | | Capitol Federal Financial | | | | | | | | | 767 |
| | | | | |
| 760 | | Hudson City Bancorp, Inc. | | | | | | | | | 10,100 |
| | | | | |
| 460 | | People’s United Financial, Inc. | | | | | | | | | 6,918 |
| | | | | |
| 110 | | TFS Financial Corporation | | | | | | | | | 1,168 |
| | | | | |
| 10 | | Tree.com Inc., (2) | | | | | | | | | 96 |
| | | | | |
| 10 | | Washington Federal Inc. | | | | | | | | | 130 |
| | Total Thrifts & Mortgage Finance | | | | | | | | | 19,179 |
| | Tobacco – 0.7% | | | | | | | | | |
| | | | | |
| 210 | | Lorillard Inc. | | | | | | | | | 14,232 |
| | Trading Companies & Distributors – 0.7% | | | | | | | | | |
| | | | | |
| 70 | | GATX Corporation | | | | | | | | | 1,800 |
| | | | | |
| 60 | | MSC Industrial Direct Inc., Class A | | | | | | | | | 2,129 |
| | | | | |
| 10 | | United Rentals Inc., (2) | | | | | | | | | 65 |
| | | | | |
| 120 | | W.W. Grainger, Inc. | | | | | | | | | 9,826 |
| | Total Trading Companies & Distributors | | | | | | | | | 13,820 |
| | Water Utilities – 0.2% | | | | | | | | | |
| | | | | |
| 60 | | American water Works Company | | | | | | | | | 1,147 |
| | | | | |
| 130 | | Aqua America Inc. | | | | | | | | | 2,327 |
| | Total Water Utilities | | | | | | | | | 3,474 |
| | Wireless Telecommunication Services – 0.8% | | | | | | | | | |
| | | | | |
| 120 | | American Tower Corporation, (2) | | | | | | | | | 3,784 |
| | | | | |
| 80 | | Crown Castle International Corporation, (2) | | | | | | | | | 1,922 |
| | | | | |
| 20 | | Metropcs Communications Inc., (2) | | | | | | | | | 266 |
| | | | | |
| 250 | | NII Holdings Inc., Class B, (2) | | | | | | | | | 4,767 |
| | | | | |
| 100 | | Telephone and Data Systems Inc. | | | | | | | | | 2,830 |
| | | | | |
| 20 | | United States Cellular Corporation, (2) | | | | | | | | | 769 |
| | Total Wireless Telecommunication Services | | | | | | | | | 14,338 |
| | Total Common Stocks (cost $2,139,147) | | | | | | | | | 1,853,241 |
| | | | | |
| Shares | | Description (1) | | | | | | | | Value |
| | INVESTMENT COMPANIES – 4.1% | | | | | | | | | |
| | | | | |
| 1,200 | | iShares Russell MidCap Index Fund | | | | | | | | $ | 78,648 |
| | Total Investment Companies (cost $66,918) | | | | | | | | | 78,648 |
| | Total Investments (cost $2,206,065) – 101.3% | | | | | | | | | 1,931,889 |
| | Other Assets Less Liabilities – (1.3)% | | | | | | | | | (24,751) |
| | Net Assets – 100% | | | | | | | | $ | 1,907,138 |
| | (1) | | All percentages shown in the Portfolio of Investments are based on net assets. |
| | (2) | | Non-income producing; issuer has not declared a dividend within the past twelve months. |
See accompanying notes to financial statements.
Statement of Assets and Liabilities
June 30, 2009
| | | | | | | | |
| | | Enhanced Core Equity | | | Enhanced
Mid-Cap | |
Assets | | | | | | | | |
Investments, at value (cost $11,529,232 and $2,206,065, respectively) | | $ | 10,138,456 | | | $ | 1,931,889 | |
Cash | | | 48,072 | | | | — | |
Receivables: | | | | | | | | |
Dividends | | | 25,545 | | | | 3,763 | |
From Adviser | | | 23,891 | | | | 25,513 | |
Other assets | | | 27 | | | | 2 | |
Total assets | | | 10,235,991 | | | | 1,961,167 | |
Liabilities | | | | | | | | |
Cash overdraft | | | — | | | | 157 | |
Accrued expenses: | | | | | | | | |
12b-1 distribution and service fees | | | 351 | | | | 479 | |
Other | | | 54,030 | | | | 53,393 | |
Total liabilities | | | 54,381 | | | | 54,029 | |
Net assets | | $ | 10,181,610 | | | $ | 1,907,138 | |
Class A Shares | | | | | | | | |
Net assets | | $ | 230,726 | | | $ | 443,436 | |
Shares outstanding | | | 18,566 | | | | 38,050 | |
Net asset value per share | | $ | 12.43 | | | $ | 11.65 | |
Offering price per share (net asset value per share plus
maximum sales charge of 5.75% of offering price) | | $ | 13.19 | | | $ | 12.36 | |
Class C Shares | | | | | | | | |
Net assets | | $ | 358,112 | | | $ | 440,785 | |
Shares outstanding | | | 28,854 | | | | 37,815 | |
Net asset value and offering price per share | | $ | 12.41 | | | $ | 11.66 | |
Class I Shares | | | | | | | | |
Net assets | | $ | 9,592,772 | | | $ | 1,022,917 | |
Shares outstanding | | | 771,724 | | | | 87,786 | |
Net asset value and offering price per share | | $ | 12.43 | | | $ | 11.65 | |
Net Assets Consist of: | | | | | | | | |
Capital paid-in | | $ | 15,638,913 | | | $ | 3,251,292 | |
Undistributed (Over-distribution of) net investment income | | | 313,847 | | | | 20,745 | |
Accumulated net realized gain (loss) from investments and derivative transactions | | | (4,380,374 | ) | | | (1,090,723 | ) |
Net unrealized appreciation (depreciation) of investments | | | (1,390,776 | ) | | | (274,176 | ) |
Net assets | | $ | 10,181,610 | | | $ | 1,907,138 | |
See accompanying notes to financial statements.
Statement of Operations
Year Ended June 30, 2009
| | | | | | | | |
| | | Enhanced
Core Equity | | | Enhanced
Mid-Cap | |
Investment Income | | | | | | | | |
Dividends (net of foreign tax withheld of $9 and $3, respectively) | | $ | 674,928 | | | $ | 50,671 | |
Interest | | | 713 | | | | — | |
Total investment income | | | 675,641 | | | | 50,671 | |
Expenses | | | | | | | | |
Management fees | | | 116,375 | | | | 11,295 | |
12b-1 service fees – Class A | | | 513 | | | | 1,198 | |
12b-1 distribution and service fees – Class C | | | 2,846 | | | | 4,739 | |
Shareholders’ servicing agent fees and expenses | | | 944 | | | | 725 | |
Custodian’s fees and expenses | | | 30,508 | | | | 41,825 | |
Trustees’ fees and expenses | | | 730 | | | | 72 | |
Professional fees | | | 32,725 | | | | 10,268 | |
Shareholders’ reports – printing and mailing expenses | | | 47,237 | | | | 37,732 | |
Federal and state registration fees | | | 57,298 | | | | 54,965 | |
Other expenses | | | 2,350 | | | | 1,490 | |
Total expenses before custodian fee credit and expense reimbursement | | | 291,526 | | | | 164,309 | |
Custodian fee credit | | | (75 | ) | | | (222 | ) |
Expense reimbursement | | | (171,609 | ) | | | (147,053 | ) |
Net expenses | | | 119,842 | | | | 17,034 | |
Net investment income | | | 555,799 | | | | 33,637 | |
Realized and Unrealized Gain (Loss) | | | | | | | | |
Net realized gain (loss) from: | | | | | | | | |
Investments | | | (5,726,772 | ) | | | (963,769 | ) |
Redemptions in-kind | | | (5,326,612 | ) | | | — | |
Change in net unrealized appreciation (depreciation) of investments | | | 2,063,669 | | | | (154,445 | ) |
Net realized and unrealized gain (loss) | | | (8,989,715 | ) | | | (1,118,214 | ) |
Net increase (decrease) in net assets from operations | | $ | (8,433,916 | ) | | $ | (1,084,577 | ) |
See accompanying notes to financial statements.
Statement of Changes in Net Assets
| | | | | | | | | | | | | | | | |
| | | Enhanced Core Equity | | | Enhanced Mid-Cap | |
| | | Year Ended
6/30/09 | | | For the Period
December 3, 2007
(Commencement of
Operations)
through June 30, 2008 | | | Year Ended
6/30/09 | | | For the Period
December 3, 2007
(Commencement of
Operations)
through June 30, 2008 | |
Operations | | | | | | | | | | | | | | | | |
Net investment income | | $ | 555,799 | | | $ | 368,217 | | | $ | 33,637 | | | $ | 19,719 | |
Net realized gain (loss) from: | | | | | | | | | | | | | | | | |
Investments | | | (5,726,772 | ) | | | (1,201,717 | ) | | | (963,769 | ) | | | (127,205 | ) |
Futures contracts | | | — | | | | 16,498 | | | | — | | | | — | |
Redemptions in-kind | | | (5,326,612 | ) | | | — | | | | — | | | | — | |
Change in net unrealized appreciation (depreciation) of investments | | | 2,063,669 | | | | (3,454,445 | ) | | | (154,445 | ) | | | (119,731 | ) |
Net increase (decrease) in net assets from operations | | | (8,433,916 | ) | | | (4,271,447 | ) | | | (1,084,577 | ) | | | (227,217 | ) |
Distributions to Shareholders | | | | | | | | | | | | | | | | |
From net investment income: | | | | | | | | | | | | | | | | |
Class A | | | (4,627 | ) | | | (378 | ) | | | (7,243 | ) | | | (1,699 | ) |
Class B | | | — | | | | (221 | ) | | | — | | | | (1,222 | ) |
Class C | | | (4,554 | ) | | | (221 | ) | | | (2,473 | ) | | | (1,222 | ) |
Class I (1) | | | (541,428 | ) | | | (60,142 | ) | | | (20,296 | ) | | | (2,469 | ) |
Decrease in net assets from distribution to shareholders | | | (550,609 | ) | | | (60,962 | ) | | | (30,012 | ) | | | (6,612 | ) |
Fund Share Transactions | | | | | | | | | | | | | | | | |
Proceeds from sale of shares | | | 394,408 | | | | 35,600,000 | | | | 76,843 | | | | 3,250,000 | |
Proceeds from shares issued to shareholders due
to reinvestment of distributions | | | 318,368 | | | | 35,251 | | | | 3,025 | | | | 612 | |
| | | 712,776 | | | | 35,635,251 | | | | 79,868 | | | | 3,250,612 | |
Cost of shares redeemed | | | (69,427 | ) | | | — | | | | (74,924 | ) | | | — | |
Cost of redemptions in-kind | | | (12,780,056 | ) | | | — | | | | — | | | | — | |
Net increase (decrease) in net assets from Fund share transactions | | | (12,136,707 | ) | | | 35,635,251 | | | | 4,944 | | | | 3,250,612 | |
Net increase (decrease) in net assets | | | (21,121,232 | ) | | | 31,302,842 | | | | (1,109,645 | ) | | | 3,016,783 | |
Net assets at the beginning of period | | | 31,302,842 | | | | — | | | | 3,016,783 | | | | — | |
Net assets at the end of period | | $ | 10,181,610 | | | $ | 31,302,842 | | | $ | 1,907,138 | | | $ | 3,016,783 | |
Undistributed (Over-distribution of) net investment income at the end of period | | $ | 313,847 | | | $ | 308,596 | | | $ | 20,745 | | | $ | 17,126 | |
(1) Effective May 1, 2008, Class R Shares were renamed Class I Shares.
See accompanying notes to financial statements.
Notes to Financial Statements
1. General Information and Significant Accounting Policies
The Nuveen Investment Trust (the “Trust”) is an open-end management investment company registered under the Investment Company Act of 1940, as amended. The Trust is comprised of Nuveen Enhanced Core Equity Fund (“Enhanced Core Equity”) and Nuveen Enhanced Mid-Cap Fund (“Enhanced Mid-Cap”) (collectively, the “Funds”), among others. The Trust was organized as a Massachusetts business trust in 1996.
Enhanced Core Equity ordinarily invests, under normal market conditions, in equity securities of companies within the S&P 500 Index in an attempt to provide long-term capital appreciation.
Enhanced Mid-Cap ordinarily invests, under normal market conditions, in equity securities of companies within the Russell Midcap Index in an attempt to provide long-term capital appreciation. The Fund may also invest in non-U.S. equity securities that are included in the Russell Midcap Index.
Effective March 31, 2008, Class B Shares are no longer available for the Funds. As of March 31, 2008, all outstanding Class B Shares for each Fund were owned by Nuveen Investments, Inc. (“Nuveen”) and transferred to Class I Shares on May 2, 2008.
The following is a summary of significant accounting policies followed by the Funds in the preparation of their financial statements in accordance with accounting principles generally accepted in the United States.
Investment Valuation
Exchange-listed securities are generally valued at the last sales price on the securities exchange on which such securities are primarily traded. Securities traded on a securities exchange for which there are no transactions on a given day or securities not listed on a securities exchange are valued at the mean of the closing bid and asked prices. Securities traded on NASDAQ are valued at the NASDAQ Official Closing Price. Futures contracts are valued using the closing settlement price, or, in the absence of such a price, at the mean of the bid and asked prices. When market price quotes are not readily available, the pricing service or, in the absence of a pricing service for a particular investment or derivative instrument, the Board of Trustees of the Funds, or its designee, may establish fair value using a wide variety of market data including yields or prices of investments of comparable quality, type of issue, market quotes or indications of value from security dealers, evaluations of anticipated cash flows or collateral, general market conditions and other information and analysis, including the obligor’s credit characteristics considered relevant. Short-term investments are valued at amortized cost, which approximates value.
Investment Transactions
Investment transactions are recorded on a trade date basis. Realized gains and losses from investment transactions are determined on the specific identification method.
Investment Income
Dividend income is recorded on the ex-dividend date or, for foreign securities, when information is available. Interest income is recorded on an accrual basis.
Dividends and Distributions to Shareholders
Dividends from net investment income and net realized capital gains from investment transactions, if any, are declared and distributed to shareholders at least annually. Furthermore, capital gains are distributed only to the extent they exceed available capital loss carryforwards.
Distributions to shareholders are recorded on the ex-dividend date. The amount and timing of distributions are determined in accordance with federal income tax regulations, which may differ from accounting principles generally accepted in the United States.
Income Taxes
Each Fund is a separate taxpayer for federal income tax purposes. Each Fund intends to distribute substantially all of its net investment income and net capital gains to shareholders and to otherwise comply with the requirements of Subchapter M of the Internal Revenue Code applicable to regulated investment companies. Therefore, no federal income tax provision is required.
For all open tax years and all major taxing jurisdictions, management of the Funds has concluded that there are no significant uncertain tax positions that would require recognition in the financial statements. Open tax years are those that are open for examination by taxing authorities (i.e., generally the last four tax year ends and the interim tax period since then). Furthermore, management of the Funds is also not aware of any tax positions for which it is reasonably possible that the total amounts of unrecognized tax benefits will significantly change in the next twelve months.
Flexible Sales Charge Program
Class A Shares are generally sold with an up-front sales charge and incur a .25% annual 12b-1 service fee. Class A Share purchases of $1 million or more are sold at net asset value without an up-front sales charge but may be subject to a contingent deferred sales charge (“CDSC”) if redeemed within twelve months of purchase. Class C Shares are sold without an up-front sales charge but incur a .75% annual 12b-1 distribution fee and a .25% annual 12b-1 service fee. Class C Shares are subject to a CDSC of 1% if redeemed within one year of purchase. Class I Shares are not subject to any sales charge or 12b-1 distribution or service fees.
Futures Contracts
Each Fund is authorized to invest in futures contracts in order to gain exposure to, or hedge against changes in equity markets. Upon entering into a futures contract, the Fund is required to deposit with the broker an amount of cash or liquid securities equal to a specified percentage of the contract amount. This is known as the “initial margin.” Cash held by the broker to cover initial margin requirements on open futures contracts, if any, is recognized as “Deposits with brokers for open futures contracts” on the Statement
of Assets and Liabilities. Subsequent payments (“variation margin”) are made or received by the Fund each day, depending on the daily fluctuation of the value of the contract. Variation margin is recognized as a receivable or payable for “Variation margin on futures contracts” on the Statement of Assets and Liabilities, when applicable.
During the period the futures contract is open, changes in the value of the contract are recorded as an unrealized gain or loss by “marking-to-market” on a daily basis to reflect the changes in market value of the contract and is recognized as “Change in unrealized appreciation (depreciation) of futures on the Statement of Operations. When the contract is closed or expired, a Fund records a realized gain or loss equal to the difference between the value of the contract on the closing date and value of the contract when originally entered into and is recognized as “Realized gain (loss) from futures” on the Statement of Operations.
The Funds did not invest in any futures contracts outstanding during the fiscal year ended June 30, 2009.
| | | | |
| | | Enhanced
Core Equity | | Enhanced
Mid-Cap |
Average number of futures contracts outstanding | | — | | — |
Risks of investments in futures contracts include the possible adverse movement of the securities or indices underlying the contracts, the possibility that there may not be a liquid secondary market for the contracts and/or that a change in the value of the contract may not correlate with a change in the value of the underlying securities or indices.
Market and Counterparty Credit Risk
In the normal course of business each Fund may invest in financial instruments and enter into financial transactions where risk of potential loss exists due to changes in the market (market risk) or failure of the other party to the transaction to perform (counterparty credit risk). The potential loss could exceed the value of the financial assets recorded on the financial statements. Financial assets, which potentially expose each Fund to counterparty credit risk, consist principally of cash due from counterparties on forward, option and swap transactions. The extent of each Fund’s exposure to counterparty credit risk in respect to these financial assets approximates their carrying value as recorded on the Statement of Assets and Liabilities. Futures contracts expose a Fund to minimal counterparty credit risk as they are exchange traded and the exchange’s clearinghouse, which is counterparty to all exchange traded futures, guarantees the futures contracts against default.
Each Fund helps manage counterparty credit risk by entering into agreements only with counterparties Nuveen Asset Management (the “Adviser”), a wholly owned subsidiary of Nuveen, believes have the financial resources to honor their obligations and by having the Adviser monitor the financial stability of the counterparties. Additionally, counterparties may be required to pledge collateral daily (based on the daily valuation of the financial asset) on behalf of each Fund with a value approximately equal to the amount of any unrealized gain above a pre-determined threshold. Reciprocally, when each Fund has an unrealized loss, the Funds have instructed the custodian to pledge assets of the Funds as collateral with a value approximately equal to the amount of the unrealized loss above a pre-determined threshold. Collateral pledges are monitored and subsequently adjusted if and when the valuations fluctuate, either up or down, by at least the predetermined threshold amount.
Redemptions In-Kind
In certain circumstances, a Fund may distribute portfolio securities rather than cash as payment for redemption of Fund shares (redemptions in-kind ). For financial reporting purposes, the Fund recognizes a gain on the redemptions in-kind to the extent the value of the distributed securities on the date of redemption exceeds the cost of those securities; the Fund recognizes a loss if cost exceeds value. Gains and losses realized on the redemptions in-kind are not recognized for tax purposes, and are reclassified from undistributed realized gain or loss to paid-in capital. During the fiscal year ended June 30, 2009, Enhanced Core Equity realized $5,326,612 of net loss on redemptions in-kind. There were no redemptions in-kind for Enhanced Mid-Cap during the fiscal year ended June 30, 2009.
Expense Allocation
Expenses of the Funds that are not directly attributable to a specific class of shares are prorated among the classes based on the relative net assets of each class. Expenses directly attributable to a class of shares, which presently only include 12b-1 distribution and service fees, are recorded to the specific class.
Custodian Fee Credit
Each Fund has an arrangement with the custodian bank whereby certain custodian fees and expenses are reduced by net credits earned on each Fund’s cash on deposit with the bank. Such deposit arrangements are an alternative to overnight investments. Credits for cash balances may be offset by changes for any days on which a Fund overdraws its account at the custodian bank.
Indemnifications
Under the Trust’s organizational documents, its Officers and Trustees are indemnified against certain liabilities arising out of the performance of their duties to the Trust. In addition, in the normal course of business, the Trust enters into contracts that provide general indemnifications to other parties. The Trust’s maximum exposure under these arrangements is unknown as this would involve future claims that may be made against the Trust that have not yet occurred. However, the Trust has not had prior claims or losses pursuant to these contracts and expects the risk of loss to be remote.
Use of Estimates
The preparation of financial statements in conformity with accounting principles generally accepted in the United States requires management to make estimates and assumptions that affect the reported amounts of assets and liabilities at the date of the financial statements and the reported amounts of increases and decreases in net assets from operations during the reporting period. Actual results may differ from those estimates.
Notes to Financial Statements (continued)
2. Fair Value Measurements
During the current fiscal period, the Funds adopted the provisions of Statement of Financial Accounting Standards No. 157 (SFAS No. 157) “Fair Value Measurements.” SFAS No. 157 defines fair value, establishes a framework for measuring fair value in generally accepted accounting principles and expands disclosure about fair value measurements. In determining the value of each Fund’s investments various inputs are used. These inputs are summarized in the three broad levels listed below:
| | |
| Level 1 – | | Quoted prices in active markets for identical securities. |
| Level 2 – | | Other significant observable inputs (including quoted prices for similar securities, interest rates, prepayment speeds, credit risk, etc.). |
| Level 3 – | | Significant unobservable inputs (including management’s assumptions in determining the fair value of investments). |
The inputs or methodology used for valuing securities are not an indication of the risk associated with investing in those securities.
The following is a summary of each Fund’s fair value measurements as of June 30, 2009:
| | | | | | | | | | | | |
| Enhanced Core Equity | | Level 1 | | Level 2 | | Level 3 | | Total |
Investments: | | | | | | | | | | | | |
Common Stocks | | $ | 10,138,456 | | $ | — | | $ | — | | $ | 10,138,456 |
| | | | |
| Enhanced Mid-Cap | | Level 1 | | Level 2 | | Level 3 | | Total |
Investments: | | | | | | | | | | | | |
Common Stocks | | $ | 1,853,241 | | $ | — | | $ | — | | $ | 1,853,241 |
Investment Companies | | | 78,648 | | | — | | | — | | | 78,648 |
Total | | $ | 1,931,889 | | $ | — | | $ | — | | $ | 1,931,889 |
3. Derivative Instruments and Hedging Activities
During the current fiscal period, the Funds adopted the provisions of Statement of Financial Accounting Standards No. 161 (SFAS No. 161) “Disclosures about Derivative Instruments and Hedging Activities.” This standard is intended to enhance financial statement disclosures for derivative instruments and hedging activities and enable investors to better understand: a) how and why a fund uses derivative instruments; b) how derivative instruments are accounted for; and c) how derivative instruments affect a fund’s financial position, results of operations and cash flows, if any. The Funds record derivative instruments at fair value with changes in fair value recognized on the Statement of Operations. Even though the Funds’ investments in derivatives may represent economic hedges, they are considered to be non-hedge transactions for SFAS No. 161 disclosure purposes. The Funds did not invest in any derivative instruments during the fiscal year ended June 30, 2009.
4. Fund Shares
Transactions in Fund shares were as follows:
| | | | | | | | | | | | |
| | | Enhanced Core Equity |
| | | Year Ended
6/30/09 | | | For the Period 12/03/07
(commencement of
operations) through
6/30/08 |
| | | Shares | | | Amount | | | Shares | | Amount |
Shares sold: | | | | | | | | | | | | |
Class A | | 6,044 | | | $ | 79,142 | | | 12,500 | | $ | 250,000 |
Class C | | 22,849 | | | | 280,616 | | | 12,500 | | | 250,000 |
Class I* | | 3,059 | | | | 34,650 | | | 1,765,869 | | | 35,100,000 |
Shares issued to shareholders due to reinvestment of distributions: | | | | | | | | | | | | |
Class A | | 22 | | | | 270 | | | — | | | — |
Class C | | 226 | | | | 2,765 | | | — | | | — |
Class I* | | 25,889 | | | | 315,333 | | | 1,771 | | | 35,251 |
| | | 58,089 | | | | 712,776 | | | 1,792,640 | | | 35,635,251 |
Shares redeemed: | | | | | | | | | | | | |
Class A | | — | | | | — | | | — | | | — |
Class C | | (6,721 | ) | | | (69,427 | ) | | — | | | — |
Class I* | | — | | | | — | | | — | | | — |
Class I – redemptions in-kind | | (1,024,864 | ) | | | (12,780,056 | ) | | — | | | — |
| | | (1,031,585 | ) | | | (12,849,483 | ) | | — | | | — |
Net increase (decrease) | | (973,496 | ) | | $ | (12,136,707 | ) | | 1,792,640 | | $ | 35,635,251 |
| | | | | | | | | | | | |
| |
| | | Enhanced Mid-Cap |
| | | Year Ended
6/30/09 | | | For the Period 12/03/07
(commencement of
operations) through
6/30/08 |
| | | Shares | | | Amount | | | Shares | | Amount |
Shares sold: | | | | | | | | | | | | |
Class A | | 541 | | | $ | 9,552 | | | 37,500 | | $ | 750,000 |
Class C | | 313 | | | | 3,346 | | | 37,500 | | | 750,000 |
Class I* | | 6,452 | | | | 63,945 | | | 87,253 | | | 1,750,000 |
Shares issued to shareholders due to reinvestment of distributions: | | | | | | | | | | | | |
Class A | | 9 | | | | 103 | | | — | | | — |
Class C | | 2 | | | | 21 | | | — | | | — |
Class I* | | 268 | | | | 2,901 | | | 31 | | | 612 |
| | | 7,585 | | | | 79,868 | | | 162,284 | | | 3,250,612 |
Shares redeemed: | | | | | | | | | | | | |
Class A | | — | | | | — | | | — | | | — |
Class C | | — | | | | — | | | — | | | — |
Class I* | | (6,218 | ) | | | (74,924 | ) | | — | | | — |
| | | (6,218 | ) | | | (74,924 | ) | | — | | | — |
Net increase (decrease) | | 1,367 | | | $ | 4,944 | | | 162,284 | | $ | 3,250,612 |
| * | Effective March 31, 2008, Class B Shares were no longer available to the Funds and transferred to Class I Shares on May 2, 2008. |
5. Investment Transactions
Purchases and sales (excluding short-term investments) during the fiscal year end June 30, 2009, were as follows:
| | | | | | |
| | | Enhanced
Core Equity | | Enhanced
Mid-Cap |
Purchases | | $ | 8,209,833 | | $ | 1,659,196 |
Sales | | | 7,776,357 | | | 1,599,048 |
6. Income Tax Information
The following information is presented on an income tax basis. Differences between amounts for financial statement and federal income tax purposes are primarily due to timing differences in recognizing certain gains and losses on investment transactions. To the extent that differences arise that are permanent in nature, such amounts are reclassified within the capital accounts on the Statement of Assets and Liabilities presented in the annual report, based on their federal tax basis treatment; temporary differences do not require reclassification. Temporary and permanent differences do not impact the net asset values of the Funds.
At June 30, 2009, the cost of investments was as follows:
| | | | | | |
| | | Enhanced
Core Equity | | Enhanced
Mid-Cap |
Cost of investments | | $ | 11,561,704 | | $ | 2,206,065 |
Gross unrealized appreciation and gross unrealized depreciation of investments at June 30, 2009, were as follows:
| | | | | | | | |
| | | Enhanced
Core Equity | | | Enhanced
Mid-Cap | |
Gross unrealized: | | | | | | | | |
Appreciation | | $ | 360,942 | | | $ | 98,245 | |
Depreciation | | | (1,784,190 | ) | | | (372,421 | ) |
Net unrealized appreciation (depreciation) of investments | | $ | (1,423,248 | ) | | $ | (274,176 | ) |
The tax components of undistributed net ordinary income and net long-term capital gains at June 30, 2009, the Funds’ tax year end, were as follows:
| | | | | | |
| | | Enhanced
Core Equity | | Enhanced
Mid-Cap |
Undistributed net ordinary income* | | $ | 334,676 | | $ | 20,742 |
Undistributed net long-term capital gains | | | — | | | — |
| * | Net ordinary income consists of net taxable income derived from dividends, interest, and net short-term capital gains, if any. |
Notes to Financial Statements (continued)
The tax character of distributions paid during the Funds’ last tax years ended June 30, 2009 and June 30, 2008, was designated for purposes of the dividends paid deduction as follows:
| | | | | | |
| 2009 | | Enhanced
Core Equity | | Enhanced
Mid-Cap |
Distributions from net ordinary income* | | $ | 550,609 | | $ | 30,012 |
Distributions from net long-term capital gains | | | — | | | — |
| | | | | | |
| For the period December 3, 2007 (commencement of operations) through June 30, 2008 | | Enhanced
Core Equity | | Enhanced
Mid-Cap |
Distributions from net ordinary income* | | $ | 60,962 | | $ | 6,613 |
| * | Net ordinary income consists of net taxable income derived from dividends, interest and net short-term capital gains, if any. |
At June 30, 2009, the Funds’ tax year end, Enhanced Mid-Cap had an unused capital loss carryforwards available for federal income tax purposes to be applied against future capital gains, if any. If not applied, the carryforward will expire as follows:
| | | |
| | | Enhanced
Mid-Cap |
Expiration: | | | |
June 30, 2017 | | $ | 289,649 |
The Funds have elected to defer net realized losses from investments incurred from November 1, 2008 through June 30, 2009, the Funds’ tax year end, (“post-October losses”) in accordance with federal income tax regulations. Post-October capital losses are treated as having arisen on the first day of the following fiscal year:
| | | | | | |
| | | Enhanced
Core Equity | | Enhanced
Mid-Cap |
Post-October capital losses | | $ | 4,368,733 | | $ | 801,069 |
Enhanced Core Equity’s Post-October capital loss at June 30, 2009, is subject to an annual limitation under the Internal Revenue Code and related regulations.
7. Management Fees and Other Transactions with Affiliates
Each Fund’s management fee is separated into two components – a complex-level component, based on the aggregate amount of all fund assets managed by the Adviser, and a specific fund-level component, based only on the amount of assets within each individual Fund. This pricing structure enables Nuveen fund shareholders to benefit from growth in the assets within each individual fund as well as from growth in the amount of complex-wide assets managed by the Adviser.
The annual fund-level fee, payable monthly, for each Fund is based upon the average daily net assets of each Fund as follows:
| | | | | | |
| Average Daily Net Assets (1) | | Enhanced
Core Equity
Fund-Level
Fee Rate | | | Enhanced
Mid-Cap
Fund-Level
Fee Rate | |
For the first $125 million | | .3000 | % | | .3500 | % |
For the next $125 million | | .2875 | | | .3375 | |
For the next $250 million | | .2750 | | | .3250 | |
For the next $500 million | | .2625 | | | .3125 | |
For the next $1 billion | | .2500 | | | .3000 | |
For net assets over $2 billion | | .2250 | | | .2750 | |
The annual complex-level fee, payable monthly, which is additive to the fund-level fee, for all Nuveen sponsored funds in the U.S., is based on the aggregate amount of total fund net assets managed as stated in the following table. As of June 30, 2009, the complex-level fee rate was .1970%.
The complex-level fee schedule is as follows:
| | | |
| Complex-Level Net Asset Breakpoint Level (1) | | Effective Rate at Breakpoint Level | |
$55 billion | | .2000 | % |
$56 billion | | .1996 | |
$57 billion | | .1989 | |
$60 billion | | .1961 | |
$63 billion | | .1931 | |
$66 billion | | .1900 | |
$71 billion | | .1851 | |
$76 billion | | .1806 | |
$80 billion | | .1773 | |
$91 billion | | .1691 | |
$125 billion | | .1599 | |
$200 billion | | .1505 | |
$250 billion | | .1469 | |
$300 billion | | .1445 | |
| (1) | The complex-level fee component of the management fee for the funds is calculated based upon the aggregate daily managed net assets of all Nuveen funds, with such daily managed net assets defined separately for each fund in its management agreement, but excluding assets attributable to investments in other Nuveen funds. For the complex-level and fund-level fee components, daily managed net assets include assets managed by the Adviser that are attributable to financial leverage. For those purposes, financial leverage includes the funds’ use of preferred stock and borrowings and investments in the residual interest certificates (also called inverse floating rate securities) in tender option bond (TOB) trusts, including the portion of assets held by the TOB trust that has been effectively financed by the trust’s issuance of floating rate securities, subject to an agreement by the Adviser to limit the amount of such assets for determining managed net assets in certain circumstances. |
The management fee compensates the Adviser for overall investment advisory and administrative services and general office facilities. The Adviser has entered into a Sub-Advisory Agreement with Nuveen HydePark Group, LLC (“HydePark”), a subsidiary of Nuveen, under which HydePark manages the investment portfolios of the Funds. HydePark is compensated for its services to the Funds from the management fee paid to the Adviser.
The Adviser has agreed to waive fees and reimburse expenses of Enhanced Core Equity and Enhanced Mid-Cap through October 31, 2010, so that total annual Fund operating expenses (excluding 12b-1 distribution and service fees, interest expenses, taxes, fees incurred in acquiring and disposing of portfolio securities and extraordinary expenses) do not exceed .50% and .55% of the average daily net assets of any class of Fund shares of Enhanced Core Equity and Enhanced Mid-Cap, respectively, and from exceeding 1.00% and 1.05%, respectively after October 31, 2010. The Adviser may also voluntarily reimburse additional expenses from time to time in either of the Funds. Voluntary reimbursements may be terminated at any time at the Adviser’s discretion.
The Trust pays no compensation directly to those of its Trustees who are affiliated with the Adviser or to its Officers, all of whom receive remuneration for their services to the Trust from the Adviser or its affiliates. The Board of Trustees has adopted a deferred compensation plan for independent Trustees that enables Trustees to elect to defer receipt of all or a portion of the annual compensation they are entitled to receive from certain Nuveen advised funds. Under the plan, deferred amounts are treated as though equal dollar amounts had been invested in shares of select Nuveen advised funds.
During the fiscal year ended June 30, 2009, Nuveen Investments, LLC (the “Distributor”), a wholly owned subsidiary of Nuveen, compensated financial intermediaries directly with commission advances at the time of purchase as follows:
| | | | | | |
| | | Enhanced
Core Equity | | Enhanced
Mid-Cap |
Commission advances (Unaudited) | | $ | 48 | | $ | — |
To compensate for commissions advanced to financial intermediaries, all 12b-1 service and distribution fees collected on Class C Shares during the first year following a purchase are retained by the Distributor. During the fiscal year ended June 30, 2009, the Distributor retained such 12b-1 fees as follows:
| | | | | | |
| | | Enhanced
Core Equity | | Enhanced
Mid-Cap |
12b-1 fees retained (Unaudited) | | $ | 4,739 | | $ | 1,175 |
The remaining 12b-1 fees charged to the Funds were paid to compensate financial intermediaries for providing services to shareholders relating to their investments.
At June 30, 2009, Nuveen owned 12,500, 12,500 and 24,954 shares of Class A, C and I, respectively, of Enhanced Core Equity and 37,500, 37,500 and 74,883 shares of Class A, C and I, respectively, of Enhanced Mid-Cap.
8. Subsequent Events
In May 2009, the Financial Accounting Standards Board issued Statement of Financial Accounting Standards No. 165 (SFAS No. 165) “Subsequent Events.” SFAS No. 165 requires an entity to recognize in the financial statements the effects of all subsequent events that provide additional evidence about conditions that existed at the date of the balance sheet. SFAS No. 165 is intended to establish general standards of accounting and for disclosure of events that occur after the balance sheet date but before financial statements are issued or are available to be issued. SFAS No. 165 requires the disclosure of the date through which an entity has evaluated subsequent events and the basis for that date — that is, whether that date represents the date the financial statements were issued or were available to be issued. SFAS No. 165 is effective for interim and annual periods ending after June 15, 2009. The Funds have performed an evaluation of subsequent events through August 24, 2009, which is the date the financial statements were issued.
Financial Highlights
| | | | | | | | | | | | | | | | | | | | | | | | | | | | | | | |
| Selected data for a share outstanding throughout each period: | |
| | | | | | | |
| Class (Commencement Date) | | | | | | | | | | | | | | | | | | | |
| | | | | Investment Operations | | | Less Distributions | | | | | | |
| | | | | |
| ENHANCED CORE EQUITY | | | | | | | | | | | | | | |
Year Ended June 30, | | Beginning
Net Asset
Value | | Net Invest- ment
Income(a) | | Net Realized/ Unrealized Gain
(Loss) | | | Total | | | Net Invest- ment
Income | | | Capital
Gains | | Total | | | Ending
Net
Asset
Value | | Total
Return(b) | |
Class A (12/07) | | | | | | | | | | | | | | | | | | | | | | | | | | | | |
2009 | | $ | 17.44 | | $ | .27 | | $ | (5.02 | ) | | $ | (4.75 | ) | | $ | (.26 | ) | | $ | — | | $ | (.26 | ) | | $ | 12.43 | | (27.18 | )% |
2008(e) | | | 20.00 | | | .19 | | | (2.72 | ) | | | (2.53 | ) | | | (.03 | ) | | | — | | | (.03 | ) | | | 17.44 | | (12.67 | ) |
Class C (12/07) | | | | | | | | | | | | | | | | | | | | | | | | | | | | |
2009 | | | 17.38 | | | .18 | | | (5.01 | ) | | | (4.83 | ) | | | (.14 | ) | | | — | | | (.14 | ) | | | 12.41 | | (27.78 | ) |
2008(e) | | | 20.00 | | | .11 | | | (2.71 | ) | | | (2.60 | ) | | | (.02 | ) | | | — | | | (.02 | ) | | | 17.38 | | (13.02 | ) |
Class I (12/07) | | | | | | | | | | | | | | | | | | | | | | | | | | | | |
2009 | | | 17.46 | | | .32 | | | (5.04 | ) | | | (4.72 | ) | | | (.31 | ) | | | — | | | (.31 | ) | | | 12.43 | | (27.02 | ) |
2008(e) | | | 20.00 | | | .22 | | | (2.73 | ) | | | (2.51 | ) | | | (.03 | ) | | | — | | | (.03 | ) | | | 17.46 | | (12.55 | ) |
| | | | | | | | | | | | | | | | | | | | | | |
| | | | | | | |
| | | | | | | | | | | | | | | | | | | | | | |
| Ratios/Supplemental Data | |
| | | Ratios to Average
Net Assets
Before Credit/
Reimbursement | | | Ratios to Average
Net Assets After
Reimbursement(c) | | | Ratios to Average
Net Assets
After Credit/
Reimbursement(d) | | | | |
| | | | | | | |
Ending
Net
Assets
(000) | | Expenses | | | Net
Invest- ment
Income | | | Expenses | | | Net
Invest- ment
Income | | | Expenses | | | Net
Invest- ment
Income | | | Portfolio
Turnover
Rate | |
| | | | | | | | | | | | | | | | | | | | | | |
| $ | 231 | | 1.52 | % | | 1.36 | % | | .75 | % | | 2.13 | % | | .75 | % | | 2.13 | % | | 33 | % |
| | 218 | | 1.25 | * | | 1.26 | * | | .74 | * | | 1.77 | * | | .73 | * | | 1.77 | * | | 21 | |
| | | | | | | | | | | | | | | | | | | | | | |
| | 358 | | 2.31 | | | .63 | | | 1.50 | | | 1.44 | | | 1.50 | | | 1.44 | | | 33 | |
| | 217 | | 2.00 | * | | .51 | * | | 1.49 | * | | 1.02 | * | | 1.48 | * | | 1.02 | * | | 21 | |
| | | | | | | | | | | | | | | | | | | | | | |
| | 9,593 | | 1.23 | | | 1.65 | | | .50 | | | 2.38 | | | .50 | | | 2.38 | | | 33 | |
| | 30,868 | | .74 | * | | 1.75 | * | | .49 | * | | 2.01 | * | | .48 | * | | 2.01 | * | | 21 | |
| (a) | Per share Net Investment Income is calculated using the average daily shares method. |
| (b) | Total return is the combination of changes in net asset value without any sales charge, reinvested dividend income at net asset value and reinvested capital gains distributions at net asset value, if any. Total returns are not annualized. |
| (c) | After expense reimbursement from the Adviser, where applicable. |
| (d) | After custodian fee credit and expense reimbursement, where applicable. |
| (e) | For the period December 3, 2007 (commencement of operations) through June 30, 2008. |
See accompanying notes to financial statements.
Financial Highlights (continued)
| | | | | | | | | | | | | | | | | | | | | | | | | | | | | | | |
| Selected data for a share outstanding throughout each period: | |
Class (Commencement Date) | | | | | | | | | | | | | | | | | | | |
| | | | | Investment Operations | | | Less Distributions | | | | | | |
| | | | | | |
| ENHANCED MID-CAP | | | | | | | | | | | | | | | | | |
Year Ended June 30, | | Beginning
Net Asset
Value | | Net Invest- ment
Income(a) | | Net Realized/ Unrealized Gain
(Loss) | | | Total | | | Net Invest- ment
Income | | | Capital
Gains | | Total | | | Ending
Net
Asset
Value | | Total
Return(b) | |
Class A (12/07) | | | | | | | | | | | | | | | | | | | | | | | | | | | | |
2009 | | $ | 18.59 | | $ | .21 | | $ | (6.96 | ) | | $ | (6.75 | ) | | $ | (.19 | ) | | $ | — | | $ | (.19 | ) | | $ | 11.65 | | (36.27 | )% |
2008(e) | | | 20.00 | | | .15 | | | (1.51 | ) | | | (1.36 | ) | | | (.05 | ) | | | — | | | (.05 | ) | | | 18.59 | | (6.79 | ) |
Class C (12/07) | | | | | | | | | | | | | | | | | | | | | | | | | | | | |
2009 | | | 18.53 | | | .11 | | | (6.91 | ) | | | (6.80 | ) | | | (.07 | ) | | | — | | | (.07 | ) | | | 11.66 | | (36.70 | ) |
2008(e) | | | 20.00 | | | .06 | | | (1.50 | ) | | | (1.44 | ) | | | (.03 | ) | | | — | | | (.03 | ) | | | 18.53 | | (7.20 | ) |
Class I (12/07) | | | | | | | | | | | | | | | | | | | | | | | | | | | | |
2009 | | | 18.62 | | | .24 | | | (6.98 | ) | | | (6.74 | ) | | | (.23 | ) | | | — | | | (.23 | ) | | | 11.65 | | (36.09 | ) |
2008(e) | | | 20.00 | | | .15 | | | (1.48 | ) | | | (1.33 | ) | | | (.05 | ) | | | — | | | (.05 | ) | | | 18.62 | | (6.67 | ) |
| | | | | | | | | | | | | | | | | | | | | | |
| | | | | | | | | | | | | | | | | | | | | | |
| Ratios/Supplemental Data | |
| | | Ratios to Average Net Assets
Before Credit/
Reimbursement | | | Ratios to Average
Net Assets After
Reimbursement(c) | | | Ratios to Average Net Assets
After Credit/
Reimbursement(d) | | | | |
| | | | | | | |
Ending
Net
Assets
(000) | | Expenses | | | Net
Invest- ment
Income
(Loss) | | | Expenses | | | Net
Invest- ment
Income
(Loss) | | | Expenses | | | Net
Invest- ment
Income
(Loss) | | | Portfolio
Turnover
Rate | |
| | | | | | | | | | | | | | | | | | | | | | |
| $ | 443 | | 7.84 | % | | (5.39 | )% | | .80 | % | | 1.65 | % | | .79 | % | | 1.67 | % | | 76 | % |
| | 697 | | 3.81 | * | | (1.70 | )* | | .78 | * | | 1.33 | * | | .76 | * | | 1.34 | * | | 89 | |
| | | | | | | | | | | | | | | | | | | | | | |
| | 441 | | 8.61 | | | (6.16 | ) | | 1.55 | | | .90 | | | 1.54 | | | .91 | | | 76 | |
| | 695 | | 4.56 | * | | (2.45 | )* | | 1.53 | * | | .58 | * | | 1.51 | * | | .59 | * | | 89 | |
| | | | | | | | | | | | | | | | | | | | | | |
| | 1,023 | | 7.68 | | | (5.24 | ) | | .55 | | | 1.90 | | | .53 | | | 1.91 | | | 76 | |
| | 1,625 | | 3.52 | * | | (1.43 | )* | | .53 | * | | 1.55 | * | | .51 | * | | 1.57 | * | | 89 | |
| (a) | Per share Net Investment Income is calculated using the average daily shares method. |
| (b) | Total return is the combination of changes in net asset value without any sales charge, reinvested dividend income at net asset value and reinvested capital gains distributions at net asset value, if any. Total returns are not annualized. |
| (c) | After expense reimbursement from the Adviser, where applicable. |
| (d) | After custodian fee credit and expense reimbursement, where applicable. |
| (e) | For the period December 3, 2007 (commencement of operations) through June 30, 2008. |
See accompanying notes to financial statements.
Annual Investment Management Agreement Approval Process
The Investment Company Act of 1940, as amended (the “1940 Act”), provides, in substance, that each investment advisory agreement between a fund and its investment adviser (including sub-advisers) will continue in effect from year to year only if its continuance is approved at least annually by the fund’s board members, including by a vote of a majority of the board members who are not parties to the advisory agreement or “interested persons” of any parties (the “Independent Board Members”), cast in person at a meeting called for the purpose of considering such approval. In connection with such approvals, the fund’s board members must request and evaluate, and the investment adviser is required to furnish, such information as may be reasonably necessary to evaluate the terms of the advisory agreement. Accordingly, at a meeting held on May 27-29, 2009 (the “May Meeting”), the Boards of Trustees (each, a “Board” and each Trustee, a “Board Member”) of the Funds, including a majority of the Independent Board Members, considered and approved the continuation of the advisory and sub-advisory agreements for the Funds for an additional one-year period. These agreements include the investment advisory agreements between Nuveen Asset Management (“NAM”) and each Fund and the sub-advisory agreements between NAM and Nuveen HydePark Group, LLC (the “Sub-Adviser”). In preparation for their considerations at the May Meeting, the Board also held a separate meeting on April 21-22, 2009 (the “April Meeting”). Accordingly, the factors considered and determinations made regarding the renewals by the Independent Board Members include those made at the April Meeting.
In addition, in evaluating the applicable advisory agreements (each an “Investment Management Agreement”) and sub-advisory agreements (each a “Sub-advisory Agreement,” and each Investment Management Agreement and Sub-advisory Agreement, an “Advisory Agreement”), the Independent Board Members reviewed a broad range of information relating to the Funds, NAM and the Sub-Adviser (NAM and the Sub-Adviser are each a “Fund Adviser”), including absolute performance, fee and expense information for the Funds as well as comparative performance, fee and expense information for a comparable peer group of funds, the performance information of recognized and/or customized benchmarks (as applicable) of the Funds, the profitability of Nuveen for its advisory activities (which includes its wholly owned subsidiaries other than Winslow Capital Management, Inc. (“Winslow Capital”), which was recently acquired in December 2008), and other information regarding the organization, personnel, and services provided by the respective Fund Adviser. The Independent Board Members also met quarterly as well as at other times as the need arose during the year and took into account the information provided at such meetings and the knowledge gained therefrom. Prior to approving the renewal of the Advisory Agreements, the Independent Board Members reviewed the foregoing information with their independent legal counsel and with management, reviewed materials from independent legal counsel describing applicable law and their duties in reviewing advisory contracts, and met with independent legal counsel in private sessions without management present. The Independent Board Members considered the legal advice provided by independent legal counsel and relied upon their knowledge of the Fund Adviser, its services and the Funds resulting from their meetings and other interactions throughout the year and their own business judgment in determining the factors to be considered in evaluating the Advisory Agreements. Each Board Member may have accorded different weight to the various factors in reaching his or her conclusions with respect to a Fund’s Advisory Agreements. The Independent Board Members did not identify any single factor as all-important or controlling. The Independent Board Members’ considerations were instead based on a comprehensive consideration of all the information presented. The principal factors considered by the Board and its conclusions are described below.
A. Nature, Extent and Quality of Services
In considering renewal of the Advisory Agreements, the Independent Board Members considered the nature, extent and quality of the Fund Adviser’s services, including advisory services and administrative services. The Independent Board Members reviewed materials outlining, among other things, the Fund Adviser’s organization and business; the types of services that the Fund Adviser or its affiliates provide and are expected to provide to the Funds; the performance record of the applicable Fund (as described in further detail below); and any initiatives Nuveen had taken for the applicable fund product line.
In reviewing the services provided and the initiatives undertaken during the past year, the Independent Board Members recognized the severe market turmoil experienced in the capital markets during recent periods, including sustained periods of high volatility, credit disruption and government intervention. The Independent Board Members considered the Fund Adviser’s efforts, expertise and other actions taken to address matters as they arose that impacted the Funds. The Independent Board Members recognized the role of the Investment Services group which, among other things, monitors the various positions throughout the Nuveen fund complex to identify and address any systematic risks. In addition, the Capital Markets Committee of NAM provides a multi-departmental venue for developing new policies to mitigate any risks. The Independent Board Members further recognized NAM’s continuous review of the Nuveen funds’ investment strategies and mandates in seeking to continue to refine and improve the investment process for the funds, particularly in light of market conditions. In this regard, the Independent Board Members noted the changes recommended by NAM to various investment mandates for the Nuveen funds in seeking to take advantage of market opportunities and to improve the tools available for managing liquidity and market exposure; the establishment of a team responsible for coordinating the handling of large trades in or out of the Nuveen funds; and the ongoing monitoring of investment management processes.
As part of their review, the Independent Board Members also evaluated the background, experience and track record of the Fund Adviser’s investment personnel. In this regard, the Independent Board Members considered any changes in the personnel, and the impact on the level of services provided to the Funds, if any. The Independent Board Members also reviewed information regarding portfolio manager compensation arrangements to evaluate the Fund Adviser’s ability to attract and retain high quality investment personnel, preserve stability, and reward performance but not provide an incentive for taking undue risks.
In addition to advisory services, the Independent Board Members considered the quality of administrative services provided by NAM and its affiliates including product management, fund administration, oversight of service providers, shareholder services, administration of Board relations, regulatory and portfolio compliance and legal support. Given the importance of compliance, the Independent Board Members considered NAM’s compliance program, including the report of the chief compliance officer regarding the Funds’ compliance policies and procedures.
The Independent Board Members also considered NAM’s oversight of the performance, business activities and compliance of the Sub-Adviser. In that regard, the Independent Board Members reviewed an evaluation of the Sub-Adviser from NAM. The evaluation also included information relating to the Sub-Adviser’s organization, operations, personnel, assets under management, investment philosophy, strategies and techniques in managing the Funds, developments affecting the Sub-Adviser, and an analysis of the Sub-Adviser. As described in further detail below, the Board considered the performance of the Funds. The Board also recognized that the Sub-advisory Agreements were essentially agreements for portfolio management services only and the Sub-Adviser was not expected to supply other significant administrative services to the Funds. As part of their oversight, the Independent Board Members also continued their program of seeking to visit each sub-adviser to the Nuveen funds at least once over a multiple year rotation, meeting with key investment and business personnel. The Independent Board Members noted that NAM recommended the renewal of the applicable Sub-advisory Agreements and considered the basis for such recommendations and any qualifications in connection therewith.
Based on their review, the Independent Board Members found that, overall, the nature, extent and quality of services provided (and expected to be provided) to the Funds under the respective Investment Management Agreement or Sub-advisory Agreement, as applicable, were satisfactory.
B. The Investment Performance of the Funds and Fund Advisers
The Board considered the investment performance of each Fund, including the Fund’s historic performance as well as its performance compared to funds with similar investment objectives (the “Performance Peer Group”) based on data provided by an independent provider of mutual fund data as well as recognized and/or customized benchmarks. The Independent Board Members reviewed performance information including, among other things, total return information compared with the Fund’s Performance Peer Group and recognized and/or customized benchmarks for the quarter-, one-, three- and five-year periods (as applicable) ending December 31, 2008 and for the same periods (as applicable) ending March 31, 2009. The Independent Board Members also reviewed performance information of the Nuveen funds managed by the Sub-Adviser in the aggregate ranked by peer group and the performance of such funds, in the aggregate, relative to their benchmark. This information supplemented the Fund performance information provided to the Board at each of its quarterly meetings.
In comparing a fund’s performance with that of its Performance Peer Group, the Independent Board Members took into account that the closest Performance Peer Group in certain instances may not adequately reflect the respective fund’s investment objectives and strategies thereby hindering a meaningful comparison of the fund’s performance with that of the Performance Peer Group. The Independent Board Members further considered the performance of the Funds in the context of the volatile market conditions during the past year, and their impact on various asset classes and the portfolio management of the Funds.
Based on their review and factoring in the severity of market turmoil in 2008, the Independent Board Members determined that each Fund’s investment performance over time had been satisfactory.
C. Fees, Expenses and Profitability
1. Fees and Expenses
The Board evaluated the management fees and expenses of each Fund reviewing, among other things, such Fund’s gross management fees, net management fees and total expense ratios (before and after expense reimbursements and/or waivers) in absolute terms as well as compared to the fee and expenses of a comparable universe of unaffiliated funds based on data provided by an independent fund data provider (the “Peer Universe”) and in certain cases, to a more focused subset of funds in the Peer Universe (the “Peer Group”).
The Independent Board Members further reviewed data regarding the construction of the applicable Peer Universe and Peer Group. In reviewing the comparisons of fee and expense information, the Independent Board Members took into account that in certain instances various factors such as the asset level of a fund relative to peers, the size and particular composition of the Peer Universe or Peer Group, the investment objectives of the peers, expense anomalies, changes in the funds comprising the Peer Universe or Peer Group from year to year, levels of reimbursement and the timing of information used may impact the comparative data, thereby limiting the ability to make a meaningful comparison. In reviewing the fee schedule for a Fund, the Independent Board Members also considered the fund-level and complex-wide breakpoint schedules (described in further detail below) and any fee waivers and reimbursements provided by Nuveen.
Based on their review of the fee and expense information provided, the Independent Board Members determined that each Fund’s management fees and net total expense ratio were reasonable in light of the nature, extent and quality of services provided to the Fund.
Annual Investment Management Agreement Approval Process (continued)
2. Comparisons with the Fees of Other Clients
The Independent Board Members further reviewed information regarding the nature of services and fee rates offered by NAM to other clients. Such clients include separately managed accounts (both retail and institutional accounts) and funds that are not offered by Nuveen but are sub-advised by one of Nuveen’s investment management teams. In evaluating the comparisons of fees, the Independent Board Members noted that the fee rates charged to the Funds and other clients vary, among other things, because of the different services involved and the additional regulatory and compliance requirements associated with registered investment companies, such as the Funds. Accordingly, the Independent Board Members considered the differences in the product types, including, but not limited to, the services provided, the structure and operations, product distribution and costs thereof, portfolio investment policies, investor profiles, account sizes and regulatory requirements. The Independent Board Members noted, in particular, that the range of services provided to the Funds (as discussed above) is much more extensive than that provided to separately managed accounts. Given the inherent differences in the products, particularly the extensive services provided to the Funds, the Independent Board Members believe such facts justify the different levels of fees.
In considering the fees of the Sub-Adviser, the Independent Board Members also considered the pricing schedule or fees that the Sub-Adviser charges for similar investment management services for other fund sponsors or clients (such as retail and/or institutional managed accounts) as applicable.
3. Profitability of Fund Advisers
In conjunction with its review of fees, the Independent Board Members also considered the profitability of Nuveen for its advisory activities (which incorporated Nuveen’s wholly-owned affiliated sub-advisers other than Winslow Capital) and its financial condition. The Independent Board Members reviewed the revenues and expenses of Nuveen’s advisory activities for the last two years, the allocation methodology used in preparing the profitability data and an analysis of the key drivers behind the changes in revenues and expenses that impacted profitability in 2008. In addition, the Independent Board Members reviewed information regarding the financial results of Nuveen for 2008 based on its Form 8-K filed on March 31, 2009. The Independent Board Members noted this information supplemented the profitability information requested and received during the year to help keep them apprised of developments affecting profitability (such as changes in fee waivers and expense reimbursement commitments). In this regard, the Independent Board Members noted that they had also appointed an Independent Board Member as a point person to review and keep them apprised of changes to the profitability analysis and/or methodologies during the year. The Independent Board Members also considered Nuveen’s revenues for advisory activities, expenses, and profit margin compared to that of various unaffiliated management firms with similar amounts of assets under management and relatively comparable asset composition prepared by Nuveen.
In reviewing profitability, the Independent Board Members recognized the subjective nature of determining profitability which may be affected by numerous factors including the allocation of expenses. Further, the Independent Board Members recognized the difficulties in making comparisons as the profitability of other advisers generally is not publicly available and the profitability information that is available for certain advisers or management firms may not be representative of the industry and may be affected by, among other things, the adviser’s particular business mix, capital costs, types of funds managed and expense allocations. Notwithstanding the foregoing, the Independent Board Members reviewed Nuveen’s methodology and assumptions for allocating expenses across product lines to determine profitability. In reviewing profitability, the Independent Board Members recognized Nuveen’s investment in its fund business. Based on their review, the Independent Board Members concluded that Nuveen’s level of profitability for its advisory activities was reasonable in light of the services provided.
In evaluating the reasonableness of the compensation, the Independent Board Members also considered other amounts paid to a Fund Adviser by the Funds as well as any indirect benefits (such as soft dollar arrangements, if any) the Fund Adviser and its affiliates receive, or are expected to receive, that are directly attributable to the management of the Funds, if any. See Section E below for additional information on indirect benefits the Fund Adviser may receive as a result of its relationship with the Funds. Based on their review of the overall fee arrangements of each Fund, the Independent Board Members determined that the advisory fees and expenses of the respective Fund were reasonable.
D. Economies of Scale and Whether Fee Levels Reflect These Economies of Scale
With respect to economies of scale, the Independent Board Members have recognized the potential benefits resulting from the costs of a fund being spread over a larger asset base, although economies of scale are difficult to measure and predict with precision, particularly on a fund-by-fund basis. One method to help ensure the shareholders share in these benefits is to include breakpoints in the advisory fee schedule. Generally, management fees for funds in the Nuveen complex are comprised of a fund-level component and a complex-level component, subject to certain exceptions. Accordingly, the Independent Board Members reviewed and considered the applicable fund-level breakpoints in the advisory fee schedules that reduce advisory fees as asset levels increase. While economies of scale result when costs can be spread over a larger asset base, the Independent Board Members also recognized that the asset levels generally declined in 2008 due to, among other things, the market downturn. Accordingly, for funds with a reduction in assets under management, advisory fee levels may have increased as breakpoints in the fee schedule were no longer surpassed.
In addition to fund-level advisory fee breakpoints, the Board also considered the Funds’ complex-wide fee arrangement. Pursuant to the complex-wide fee arrangement, the fees of the funds in the Nuveen complex generally are reduced as the assets in the fund complex reach certain levels. The complex-wide fee arrangement seeks to provide the benefits of economies of scale to fund
shareholders when total fund complex assets increase, even if assets of a particular fund are unchanged or have decreased. The approach reflects the notion that some of Nuveen’s costs are attributable to services provided to all its funds in the complex and therefore all funds benefit if these costs are spread over a larger asset base. Generally, the complex-wide pricing reduces Nuveen’s revenue because total complex fund assets have consistently grown in prior years. As noted, however, total fund assets declined in 2008 resulting in a smaller downward adjustment of revenues due to complex-wide pricing compared to the prior year.
Based on their review, the Independent Board Members concluded that the breakpoint schedules and complex-wide fee arrangement (as applicable) were acceptable and reflect economies of scale to be shared with shareholders when assets under management increase.
E. Indirect Benefits
In evaluating fees, the Independent Board Members received and considered information regarding potential “fall out” or ancillary benefits the respective Fund Adviser or its affiliates may receive as a result of its relationship with each Fund. In this regard, the Independent Board Members considered, among other things, any sales charges, distribution fees and shareholder services fees received and retained by the Funds’ principal underwriter, an affiliate of NAM, which includes fees received pursuant to any 12b-1 plan. The Independent Board Members, therefore, considered the 12b-1 fees retained by Nuveen during the last calendar year.
In addition to the above, the Independent Board Members considered whether the Fund Adviser received any benefits from soft dollar arrangements whereby a portion of the commissions paid by a Fund for brokerage may be used to acquire research that may be useful to the Fund Adviser in managing the assets of the Funds and other clients. With respect to NAM, the Independent Board Members noted that NAM does not currently have any soft dollar arrangements; however, to the extent certain bona fide agency transactions that occur on markets that traditionally trade on a principal basis and riskless principal transactions are considered as generating “commissions,” NAM intends to comply with the applicable safe harbor provisions. With respect to the Sub-Adviser, the Independent Board Members considered that the Sub-Adviser may benefit from its soft dollar arrangements pursuant to which it receives research from brokers that execute the applicable Fund’s portfolio transactions. The Independent Board Members further noted that the Sub-Adviser’s profitability may be lower if it were required to pay for this research with hard dollars.
Based on their review, the Independent Board Members concluded that any indirect benefits received by a Fund Adviser as a result of its relationship with the Funds were reasonable and within acceptable parameters.
F. Other Considerations
The Independent Board Members did not identify any single factor discussed previously as all-important or controlling. The Board Members, including the Independent Board Members, unanimously concluded that the terms of the Investment Management Agreements and Sub-advisory Agreements are fair and reasonable, that the respective Fund Adviser’s fees are reasonable in light of the services provided to each Fund and that the Investment Management Agreements and the Sub-advisory Agreements be renewed.
Notes
Notes
Trustees and Officers
The management of the Fund, including general supervision of the duties performed for the Fund by the Adviser, is the responsibility of the Board of Trustees of the Fund. The number of trustees of the Fund is currently set at nine. None of the trustees who are not “interested” persons of the Fund (referred to herein as “independent trustees”) has ever been a director or employee of, or consultant to, Nuveen or its affiliates. The names and business addresses of the trustees and officers of the Fund, their principal occupations and other affiliations during the past five years, the number of portfolios each oversees and other directorships they hold are set forth below.
The Fund’s Statement of Additional Information (“SAI”) includes more information about the trustees. To request a free copy, call Nuveen Investments at (800) 257-8787 or visit the Funds’ website at www.nuveen.com.
| | | | | | | | |
Name, Birthdate and Address | | Position(s) Held with the Fund | | Year First Elected or Appointed (1) | | Principal Occupation(s) Including other Directorships During Past 5 Years | | Number of Portfolios in Fund Complex Overseen by Trustee |
| | |
| Independent Trustees: | | | | |
Robert P. Bremner 8/22/40 333 W. Wacker Drive Chicago, IL 60606 | | Chairman of the Board and Trustee | | 1997 | | Private Investor and Management Consultant; Treasurer and Director, Humanities Council of Washington D.C. | | 199 |
Jack B. Evans 10/22/48 333 W. Wacker Drive Chicago, IL 60606 | | Trustee | | 1999 | | President, The Hall-Perrine Foundation, a private philanthropic corporation (since 1996); Director and Vice Chairman, United Fire Group, a publicly held company; Member of the Board of Regents for the State of Iowa University System; Director, Gazette Companies; Life Trustee of Coe College; Director, Iowa College Foundation; Member of the Advisory Council of the Department of Finance in the Tippie College of Business, University of lowa; formerly, Director, Alliant Energy; formerly, Director, Federal Reserve Bank of Chicago; formerly, President and Chief Operating Officer, SCI Financial Group, Inc., a regional financial services firm. | | 199 |
William C. Hunter 3/6/48 333 W. Wacker Drive Chicago, IL 60606 | | Trustee | | 2004 | | Dean, Tippie College of Business, University of Iowa (since 2006); Director (since 2004) of Xerox Corporation; Director (since 2005), Beta Gamma Sigma International Honor Society; formerly, Dean and Distinguished Professor of Finance, School of Business at the University of Connecticut (2003-2006); previously, Senior Vice President and Director of Research at the Federal Reserve Bank of Chicago (1995-2003); Director, SS&C Technologies, Inc. (May 2005-October 2005); formerly, Director (1997-2007), Credit Research Center at George Washington University. | | 199 |
David J. Kundert 10/28/42 333 W. Wacker Drive Chicago, IL 60606 | | Trustee | | 2005 | | Director, Northwestern Mutual Wealth Management Company; retired (since 2004) as Chairman, JPMorgan Fleming Asset Management, President and CEO, Banc One Investment Advisors Corporation, and President, One Group Mutual Funds; prior thereto, Executive Vice President, Banc One Corporation and Chairman and CEO, Banc One Investment Management Group; Member, Board of Regents, Luther College; member of the Wisconsin Bar Association; member of Board of Directors, Friends of Boerner Botanical Gardens; member of Investment Committee, Greater Milwaukee Foundation. | | 199 |
William J. Schneider 9/24/44 333 W. Wacker Drive Chicago, IL 60606 | | Trustee | | 1997 | | Chairman of Miller-Valentine Partners Ltd., a real estate investment company; formerly, Senior Partner and Chief Operating Officer (retired, 2004) of Miller-Valentine Group; Member, Dayton Philharmonic Orchestra Association; formerly, Member, Business Advisory Council, Cleveland Federal Reserve Bank; formerly, Director, Dayton Development Coalition. | | 199 |
Judith M. Stockdale 12/29/47 333 W. Wacker Drive Chicago, IL 60606 | | Trustee | | 1997 | | Executive Director, Gaylord and Dorothy Donnelley Foundation (since 1994); prior thereto, Executive Director, Great Lakes Protection Fund (from 1990 to 1994). | | 199 |
Carole E. Stone 6/28/47 333 W. Wacker Drive Chicago, IL 60606 | | Trustee | | 2007 | | Director, Chicago Board Options Exchange (since 2006); Director, C2 Options Exchange, Incorporated (since 2009); Commissioner, New York State Commission on Public Authority Reform (since 2005); formerly, Chair, New York Racing Association Oversight Board (2005-2007). | | 199 |
| | | | | | | | |
Name, Birthdate and Address | | Position(s) Held with the Fund | | Year First Elected or Appointed (1) | | Principal Occupation(s) Including other Directorships During Past 5 Years | | Number of Portfolios in Fund Complex Overseen by Trustee |
Terence J. Toth 9/29/59 333 W. Wacker Drive Chicago, IL 60606 | | Trustee | | 2008 | | Director, Legal & General Investment Management America, Inc. (since 2008); Managing Partner, Musso Capital Management (since 2008); CEO and President, Northern Trust Investments (2004-2007); Executive Vice President, Quantitative Management & Securities Lending (2000-2004); prior thereto, various positions with Northern Trust Company (since 1994); Member: Goodman Theatre Board (since 2004); Chicago Fellowship Board (since 2005), University of Illinois Leadership Council Board (since 2007) and Catalyst Schools of Chicago Board (since 2008); formerly, Member: Northern Trust Mutual Funds Board (2005-2007), Northern Trust Investments Board (2004-2007), Northern Trust Japan Board (2004-2007), Northern Trust Securities Inc. Board (2003-2007) and Northern Trust Hong Kong Board (1997-2004). | | 199 |
| | |
| Interested Trustee: | | | | |
John P. Amboian (2) 6/14/61 333 W. Wacker Drive Chicago, IL 60606 | | Trustee | | 2008 | | Chief Executive Officer (since July 2007) and Director (since 1999) of Nuveen Investments, Inc.; Chief Executive Officer (since 2007) of Nuveen Asset Management, Nuveen Investments Advisors, Inc. formerly, President (1999-2004) of Nuveen Advisory Corp. and Nuveen Institutional Advisory Corp. (3) | | 199 |
Name, Birthdate and Address | | Position(s) Held with the Fund | | Year First Elected or Appointed (4) | | Principal Occupation(s) During Past 5 Years | | Number of Portfolios in Fund Complex Overseen by Officer |
| | |
| Officers of the Fund: | | | | |
Gifford R. Zimmerman 9/9/56 333 W. Wacker Drive Chicago, IL 60606 | | Chief Administrative Officer | | 1988 | | Managing Director (since 2002), Assistant Secretary and Associate General Counsel of Nuveen Investments, LLC; Managing Director (since 2002), Associate General Counsel and Assistant Secretary, of Nuveen Asset Management (since 2002) and of Symphony Asset Management LLC (since 2003); Vice President and Assistant Secretary of NWQ Investment Management Company, LLC. (since 2002), Nuveen Investments Advisers Inc. (since 2002), Tradewinds Global Investors, LLC, and Santa Barbara Asset Management, LLC (since 2006), Nuveen HydePark Group LLC and Nuveen Investment Solutions, Inc. (since 2007); Managing Director (since 2004) and Assistant Secretary (since 1994) of Nuveen Investments, Inc.; formerly, Managing Director (2002-2004), General Counsel (1998-2004) and Assistant Secretary of Nuveen Advisory Corp. and Nuveen Institutional Advisory Corp. (3); Chartered Financial Analyst. | | 199 |
Mark J.P. Anson 6/10/59 333 W. Wacker Drive Chicago, IL 60606 | | Vice President | | 2009 | | President and Executive Director of Nuveen Investments, Inc. (since 2007); President of Nuveen Investments Institutional Services Group LLC (since 2007); previously, Chief Executive Officer of the British Telecom Pension Scheme (2006-2007) and Chief Investment Officer of Calpers (1999-2006); PhD, Chartered Financial Analyst, Chartered Alternative Investment Analyst, Certified Public Accountant, Certified Management Accountant and Certified Internal Auditor. | | 199 |
Nizida Arriaga 6/1/1968 333 W. Wacker Drive Chicago, IL 60606 | | Vice President | | 2009 | | Vice President (since 2007) of Nuveen Investments, LLC; previously, Portfolio Manager, Allstate Investments, LLC (1996-2006); Chartered Financial Analyst. | | 199 |
Trustees and Officers (continued)
| | | | | | | | |
Name, Birthdate and Address | | Position(s) Held with the Fund | | Year First Elected or Appointed (4) | | Principal Occupation(s) During Past 5 Years | | Number of Portfolios in Fund Complex Overseen by Officer |
Michael T. Atkinson 2/3/66 333 W. Wacker Drive Chicago, IL 60606 | | Vice President and Assistant Secretary | | 2000 | | Vice President (since 2002) of Nuveen Investments, LLC; Vice President of Nuveen Asset Management (since 2005). | | 199 |
Margo L. Cook 4/11/64 333 W. Wacker Drive Chicago, IL 60606 | | Vice President | | 2009 | | Executive Vice President (since Oct 2008) of Nuveen Investments, Inc.; previously, Head of Institutional Asset Management (2007-2008) of Bear Stearns Asset Management; Head of Institutional Asset Mgt (1986-2007) of Bank of NY Mellon; Chartered Financial Analyst. | | 199 |
Alan A. Brown 8/1/62 333 W. Wacker Drive Chicago, IL 60606 | | Vice President | | 2007 | | Executive Vice President, Mutual Funds, Nuveen Investments, LLC, (since 2005), previously, Managing Director and Chief Marketing Officer (2001-2005). | | 74 |
Name, Birthdate and Address | | Position(s) Held with the Fund | | Year First Elected or Appointed (4) | | Principal Occupation(s) Including other Directorships During Past 5 Years | | Number of Portfolios in Fund Complex Overseen by Officer |
Lorna C. Ferguson 10/24/45 333 W. Wacker Drive Chicago, IL 60606 | | Vice President | | 1998 | | Managing Director (since 2004) of Nuveen Investments, LLC; Managing Director (since 2005) of Nuveen Asset Management; Managing Director (2004-2005) of Nuveen Advisory Corp. and Nuveen Institutional Advisory Corp. (3). | | 199 |
Stephen D. Foy 5/31/54 333 W. Wacker Drive Chicago, IL 60606 | | Vice President and Controller | | 1998 | | Vice President (since 1993) and Funds Controller (since 1998) of Nuveen Investments, LLC; Vice President (since 2005) of Nuveen Asset Management; Certified Public Accountant. | | 199 |
William T. Huffman 5/7/1969 333 W. Wacker Drive Chicago, IL 60606 | | Vice President | | 2009 | | Chief Operating Officer, Municipal Fixed Income (since 2008) of Nuveen Asset Management; previously, Chairman, President and Chief Executive Officer (2002 – 2007) of Northern Trust Global Advisors, Inc. and Chief Executive Officer (2007) of Northern Trust Global Investments Limited; CPA. | | 199 |
Walter M. Kelly 2/24/70 333 W. Wacker Drive Chicago, IL 60606 | | Chief Compliance Officer and Vice President | | 2003 | | Senior Vice President (since 2008), Vice President (2006- 2008) formerly, Assistant Vice President and Assistant General Counsel (2003-2006) of Nuveen Investments, LLC; Vice President (since 2006) and Assistant Secretary (since 2003) of Nuveen Asset Management. | | 199 |
David J. Lamb 3/22/63 333 W. Wacker Drive Chicago, IL 60606 | | Vice President | | 2000 | | Senior Vice President (since 2009), formerly, Vice President (2000-2009) of Nuveen Investments, LLC; Vice President (since 2005) of Nuveen Asset Management, Certified Public Accountant. | | 199 |
Tina M. Lazar 8/27/61 333 W. Wacker Drive Chicago, IL 60606 | | Vice President | | 2002 | | Senior Vice President (since 2009), formerly, Vice President of Nuveen Investments, LLC (1999-2009); Vice President of Nuveen Asset Management (since 2005). | | 199 |
Larry W. Martin 7/27/51 333 W. Wacker Drive Chicago, IL 60606 | | Vice President and Assistant Secretary | | 1988 | | Vice President, Assistant Secretary and Assistant General Counsel of Nuveen Investments, LLC; Vice President (since 2005) and Assistant Secretary of Nuveen Investments, Inc.; Vice President and Assistant Secretary of Nuveen Investments Advisers Inc. (since 2002), NWQ Investment Management Company, LLC (since 2002), Symphony Asset Management LLC (since 2003), Tradewinds Global Investors, LLC, Santa Barbara Asset Management, LLC (since 2006) and of Nuveen HydePark Group, LLC and Nuveen Investment Solutions, Inc. (since 2007); formerly, Vice President and Assistant Secretary of Nuveen Advisory Corp. and Nuveen Institutional Advisory Corp. (3) | | 199 |
| | | | | | | | |
Name, Birthdate and Address | | Position(s) Held with the Fund | | Year First Elected or Appointed (4) | | Principal Occupation(s) Including other Directorships During Past 5 Years | | Number of Portfolios in Fund Complex Overseen by Officer |
Kevin J. McCarthy 3/26/66 333 W. Wacker Drive Chicago, IL 60606 | | Vice President and Secretary | | 2007 | | Managing Director (since 2008), formerly, Vice President (2007-2008), Nuveen Investments, LLC; Managing Director (since 2008), formerly, Vice President and Assistant Secretary, Nuveen Asset Management and Nuveen Investments Holdings, Inc.; Vice President (since 2007) and Assistant Secretary, Nuveen Investment Advisers Inc., Nuveen Investment Institutional Services Group LLC, NWQ Investment Management Company, LLC, Tradewinds Global Investors LLC, NWQ Holdings, LLC, Symphony Asset Management LLC, Santa Barbara Asset Management LLC, Nuveen HydePark Group, LLC and Nuveen Investment Solutions, Inc. (since 2007); prior thereto, Partner, Bell, Boyd & Lloyd LLP (1997-2007). | | 199 |
John V. Miller 4/10/67 333 W. Wacker Drive Chicago, IL 60606 | | Vice President | | 2007 | | Managing Director (since 2007), formerly, Vice President (2002-2007) of Nuveen Asset Management and Nuveen Investments, LLC; Chartered Financial Analyst. | | 199 |
Gregory Mino 1/4/1971 333 W. Wacker Drive Chicago, IL 60606 | | Vice President | | 2009 | | Vice President of Nuveen Investments, LLC (since 2008); previously, Director (2004-2007) and Executive Director (2007-2008) of UBS Global Asset Management; previously, Vice President (2000-2003) and Director (2003-2004) of Merrill Lynch Investment Managers; Chartered Financial Analyst. | | 199 |
Christopher M. Rohrbacher 8/1/71 333 W. Wacker Drive Chicago, IL 60606 | | Vice President and Assistant Secretary | | 2008 | | Vice President, Nuveen Investments, LLC (since 2008); Vice President and Assistant Secretary, Nuveen Asset Management (since 2008); prior thereto, Associate, Skadden, Arps, Slate Meagher & Flom LLP (2002-2008) | | 199 |
James F. Ruane 7/3/62 333 W. Wacker Drive Chicago, IL 60606 | | Vice President and Assistant Secretary | | 2007 | | Vice President, Nuveen Investments (since 2007); prior thereto, Partner, Deloitte & Touche USA LLP (2005-2007), formerly, senior tax manager (2002-2005); Certified Public Accountant. | | 199 |
John S. White 5/12/67 333 W. Wacker Drive Chicago, IL 60606 | | Vice President | | 2007 | | Senior Vice President (since 2009), formerly, Vice President (2006-2009) of Nuveen Investments, LLC, formerly, Assistant Vice President (since 2002); Lieutenant Colonel (since 2007), United States Marine Corps Reserve, formerly, Major (since 2001). | | 74 |
Mark L. Winget 12/21/68 333 W. Wacker Drive Chicago, IL 60606 | | Vice President and Assistant Secretary | | 2008 | | Vice President, Nuveen Investments, LLC (since 2008); Vice President and Assistant Secretary, Nuveen Asset Management (since 2008); prior thereto, Counsel, VedderPrice P.C. (1997-2007). | | 199 |
| (1) | Trustees serve an indefinite term until his/her successor is elected or appointed. The year first elected or appointed represents the year in which the trustee was first elected or appointed to any fund in the Nuveen Fund Complex. |
| (2) | Mr. Amboian is an interested trustee because of his position with Nuveen Investments, Inc. and certain of its subsidiaries, which are affiliates of the Nuveen Funds. |
| (3) | Nuveen Advisory Corp. and Nuveen Institutional Advisory Corp. were reorganized into Nuveen Asset Management, effective January 1, 2005. |
| (4) | Officers serve one year terms through July of each year. The year first elected or appointed represents the year in which the officer was first elected or appointed to any fund in the Nuveen Fund Complex. |
Glossary of Terms Used in this Report
Average Annual Total Return: This is a commonly used method to express an investment’s performance over a particular, usually multi-year time period. It expresses the return that would have been necessary each year to equal the investment’s actual cumulative performance (including change in NAV or offer price and reinvested dividends and capital gains distributions, if any) over the time period being considered.
Net Asset Value (NAV): A Fund’s NAV is the dollar value of one share in the Fund. It is calculated by subtracting the liabilities of the Fund from its total assets and then dividing the remainder by the number of shares outstanding. Fund NAVs are calculated at the end of each business day.
Fund Information
Fund Manager
Nuveen Asset Management
333 West Wacker Drive
Chicago, IL 60606
Sub-Advisers
Nuveen HydePark Group, LLC
111 West Jackson Blvd.
Suite 1411
Chicago, IL 60604
Legal Counsel
Chapman and Cutler LLP
Chicago, IL
Independent Registered Public Accounting Firm
PricewaterhouseCoopers LLP
Chicago, IL
Custodian
State Street Bank & Trust Company
Boston, MA
Transfer Agent and Shareholder Services
Boston Financial
Data Services
Nuveen Investor Services
P.O. Box 8530
Boston, MA 02266-8530
(800) 257-8787
Distribution Information: Enhanced Core Equity and Enhanced Mid-Cap hereby designate 100% and 100%, respectively, of dividends paid from net ordinary income as dividends qualifying for the 70% dividends received deduction for corporations and 100% and 100%, respectively, as qualified dividend income for individuals under Section 1 (h)(11) of the Internal Revenue Code. The actual qualified dividend income distributions will be reported to shareholders on Form 1099-DIV which will be sent to shareholders shortly after calendar year end.
Quarterly Portfolio of Investments and Proxy Voting Information: You may obtain (i) each Fund’s quarterly portfolio of investments, (ii) information regarding how the Funds voted proxies relating to portfolio securities held during the most recent twelve-month period ended June 30, 2009, and (iii) a description of the policies and procedures that the Funds used to determine how to vote proxies relating to portfolio securities without charge, upon request, by calling Nuveen Investments at (800) 257-8787 or on Nuveen’s website at www.nuveen.com.
You may also obtain this and other Fund information directly from the Securities and Exchange Commission (“SEC”). The SEC may charge a copying fee for this information. Visit the SEC on-line at http://www.sec.gov or in person at the SEC’s Public Reference Room in Washington, D.C. Call the SEC at (202) 942-8090 for room hours and operation. You may also request Fund information by sending an e-mail request to publicinfo@sec.gov or by writing to the SEC’s Public Reference Section at 100 F Street NE, Washington, D.C. 20549.
The Financial Industry Regulatory Authority (FINRA) provides a Public Disclosure Program which supplies certain information regarding the disciplinary history of FINRA members and their associated persons in response to either telephone inquiries at (800) 289-9999 or written inquiries at www.finra.org. Financial Industry Regulatory Authority also provides an investor brochure that includes information describing the Public Disclosure Program.
Nuveen Investments:
Serving Investors For Generations
Since 1898, financial advisors and their clients have relied on Nuveen Investments to provide dependable investment solutions. Over this time, Nuveen Investments has adhered to the belief that the best approach to investing is to apply conservative risk-management principles to help minimize volatility.
Building on this tradition, we today offer a range of high quality equity and fixed-income solutions that can be integral parts of a well-diversified core portfolio. Our clients have come to appreciate this diversity, as well as our continued adherence to proven, long-term investing principles.
We offer many different investing solutions
for our clients’ different needs.
Nuveen Investments is a global investment management firm that seeks to help secure the long-term goals of institutions and high net worth investors as well as the consultants and financial advisors who serve them. Nuveen Investments markets its growing range of specialized investment solutions under the high-quality brands of HydePark, NWQ, Nuveen, Santa Barbara, Symphony, Tradewinds and Winslow Capital. In total, the Company managed $128 billion of assets on June 30, 2009.
Find out how we can help you reach your financial goals.
An investor should carefully consider the Fund’s objectives, risks, charges and expenses before investing. For a prospectus containing this and other information about the Fund, please contact your financial advisor or Nuveen Investments at (800) 257-8787. Read the prospectus carefully before you invest or send money.
Learn more about Nuveen Funds at www.nuveen.com/mf
| | |
Distributed by Nuveen Investments, LLC 333 West Wacker Drive Chicago, IL 60606 www.nuveen.com | | |
MAN-ENHCM-0609P

Mutual Funds
Nuveen Equity Funds
Designed to provide capital appreciation and to enhance the risk/return profile of the domestic equity portion of the Nuveen Asset Allocation Funds.
Annual Report
June 30, 2009
|
| Nuveen U.S. Equity Completeness Fund |
LIFE IS COMPLEX.
Nuveen makes things e-simple.
It only takes a minute to sign up for e-Reports. Once enrolled, you’ll receive an e-mail as soon as your Nuveen Investments Fund information is ready. No more waiting for delivery by regular mail. Just click on the link within the e-mail to see the report and save it on your computer if you wish.
Free e-Reports right to your e-mail!
www.investordelivery.com
If you receive your Nuveen Fund dividends and statements from your financial advisor or brokerage account.
OR
www.nuveen.com/accountaccess
If you receive your Nuveen Fund dividends and statements directly from Nuveen.
| | | | | | |
| Must be preceded by or accompanied by a prospectus. | | NOT FDIC INSURED | | MAY LOSE VALUE | | NO BANK GUARANTEE |
Chairman’s
Letter to Shareholders

Dear Shareholder,
The problems in the U.S. financial system and the slowdown in global economic activity continue to create a very difficult environment for the U.S. economy. The administration, the Federal Reserve System and Congress have initiated a variety of programs directed at restoring liquidity to the financial markets, providing financial support for critical financial institutions and stimulating economic activity. There are encouraging signs that these initiatives are beginning to have a constructive impact. It is not possible to predict whether the actions taken to date will be sufficient to restore more normal conditions in the financial markets or enable the economy to stabilize and set a course toward recovery. However, the speed and scope of the government’s actions are very encouraging and more importantly, reflect a commitment to act decisively to meet the economic challenges we face.
The performance information in the attached report reflects the impact of many forces at work in the equity and fixed-income markets. The comments by the portfolio managers describe the strategies being used to pursue your Fund’s long-term investment goals. Parts of the financial markets continue to experience serious dislocations and thorough research and strong investment disciplines have never been more important in identifying risks and opportunities. I hope you will read this information carefully.
Your Board is particularly sensitive to our shareholders’ concerns in these uncertain times. We believe that frequent and thorough communication is essential in this regard and encourage you to visit the Nuveen website: www.nuveen.com, for recent developments in all Nuveen funds. We also encourage you to communicate with your financial consultant for answers to your questions and to seek advice on your long-term investment strategy in the current market environment.
On behalf of myself and the other members of your Fund’s Board, we look forward to continuing to earn your trust in the months and years ahead.
Sincerely,

Robert P. Bremner
Chairman of the Nuveen Fund Board
August 24, 2009
Portfolio Managers’ Comments
Certain statements in this report are forward-looking statements. Discussions of specific investments are for illustration only and are not intended as recommendations of individual investments. The forward-looking statements and other views expressed herein are those of the portfolio managers as of the date of this report. Actual future results or occurrences may differ significantly from those anticipated in any forward-looking statements and the views expressed herein are subject to change at any time, due to numerous market and other factors. The Fund disclaims any obligation to update publicly or revise any forward-looking statements or views expressed herein.
The Nuveen U.S. Equity Completeness Fund features management by Nuveen HydePark Group, LLC, an affiliate of Nuveen Investments, Inc. The Fund is co-managed by David Tierney, PhD, Senior Managing Director and Chief Investment Officer of HydePark, John Gambla, CFA, and Rob Guttschow, CFA. We recently spoke with David, John and Rob about the general market conditions, key investment strategies and performance of the Fund for the twelve-month period ended June 30, 2009.
What were the general economic conditions during the reporting period?
This twelve month period was among the most volatile in the history of the capital markets. Equity markets across the globe fell as the United States economy pushed further into recession. After IndyMac’s bankruptcy filing on August 1, 2008, the U.S. Government engaged in one of the most dramatic market interventions in years and placed the Federal National Mortgage Association (Fannie Mae) and the Federal Home Loan Mortgage Corporation (Freddie Mac) into receivership. In September, Lehman Brothers, a major Wall Street broker/dealer, filed for bankruptcy protection. AIG, one of the largest insurers globally, effectively was nationalized by the US government, and Wachovia, Washington Mutual, Silver State Bank, and Ameri Bank all were seized by U.S. regulators and/or merged into stronger banks. Merrill Lynch, concerned about its own solvency, quickly negotiated a deal to be acquired by Bank of America. Goldman Sachs and Morgan Stanley converted to commercial banks signaling the end of the 100-year old independent broker/dealer model. The following months included major financial write-downs across the U.S. economy, the uncovering of the largest Ponzi scheme in history, continual declines in real U.S. Gross Domestic Product, and significant spikes in market volatility.
While the U.S. economy moved further into recession, the international capital markets experienced their own severe downturn. Economic policy responses by the U.S. Federal Reserve were followed, in part, by its counterparts at the Bank of England, the European Central Bank, and the Chinese Government.
Although the S&P 500 and the MSCI EAFE indices were down 37% and 43%, respectively, in 2008, signs of global economic stability began to emerge toward the end of the first quarter in 2009. By the end of June, the 2009 year-to-date returns of these two equity indices were 3% and 8%, respectively. In addition, emerging markets, which fell 53% in 2008, rebounded 36% during the first half of 2009.
The headlines created by the failure of such large banking institutions and Congress’s first failed attempt at bailout legislation resulted in a massive drop in consumer confidence. This drop in confidence resulted in a drop in spending, as personal consumption contracted at a -3.5% rate in the third quarter and a -3.1% in the fourth quarter.
As a result, volatility in the equity markets continued throughout most of this twelve-month period. However, the second quarter of 2009 saw substantial improvements. The U.S. government has continued to implement various financial bailout/stimulus plans. The major banks have appeared to raise the necessary capital for them to survive in the current downturn, with several of them even appearing to thrive. Equity markets, as measured by the S&P 500 Index, have significantly increased from the lows experienced in March. Ten-year bond yields have come off their multi-decade lows as well.
How did the Fund perform during the past twelve-months ended June 30, 2009?
The table on page five provides performance information for the Fund for the twelve-month period ended June 30, 2009. The table also compares the Fund’s performance to a general market index. A more detailed discussion of the Fund’s relative performance is provided later in this report.
What is the Fund’s investment strategy?
The Nuveen U.S. Equity Completeness Fund is designed to serve as an investment for the Nuveen Asset Allocation Funds’ portfolios, helping them to offset or correct the style risk that may exist between those Funds’ U.S. equity benchmark and the benchmarks of the Funds’ underlying equity managers. The Nuveen U.S. Equity Completeness Fund itself does not attempt to track or outperform a particular index.
The proprietary risk-controlled HydePark wealth creation model was used to manage the U.S. Equity Completeness Fund since its inception. This model utilizes both fundamental and momentum-related criteria to create a portfolio designed to maximize the reward-to-risk ratio.
Our investment process is a combination of traditional fundamental security valuation and quantitative risk-control techniques. The philosophy that underlies our value-added process is that a stock’s price must follow the wealth creation fundamentals of the company. A stock’s weight in the portfolio is directly related to its wealth creation fundamentals. Our process has five “wealth creation” factors. Four are fundamentally oriented; two are traditional measures of revenues in excess of expenses (specifically earnings and cash flow), and two are traditional measures of the uses for those excess monies (book value and dividends). The fifth factor is a proprietary measure of stock price momentum. Importantly, the process also considers a stock’s liquidity. Due to the quantitative, model-driven process, top-down macroeconomic “themes” do not influence the model or how HydePark selects stocks for the Fund.
The model evaluates all the securities contained in the benchmark portfolio (Russell 3000 Index) for possible inclusion in the portfolio. The process will not consider a stock for possible inclusion if it is not contained in the benchmark portfolio.
The portfolio typically contains a large number of holdings with each relative weighting reflecting a five-dimensional view of that stock’s wealth creation characteristics. The portfolio is monitored daily with rebalances occurring quarterly.
How did this strategy influence performance?
The Nuveen U.S. Equity Completeness Fund underperformed the Russell 3000 Index during the reporting period.
We believe the quantitative, risk-controlled process described above should, under normal circumstances, cause the Fund to track its benchmark portfolio closely, with value-added potential coming from our relative overweights/underweights of each stock versus the index. We attempt to express an overweight/underweight opinion on every stock in the benchmark based on our analysis of its five wealth creation factors.
The sum of the Fund’s individual security overweights/underweights versus the index as maintained equal to zero, but was not constrained to be industry or sector neutral. As a result, the Fund sometimes was overweight in stocks within a sector because all the individual stocks in that sector had what we judged to be attractive wealth creation fundamentals versus the benchmark in aggregate. Performance for the portfolio can then be viewed in two parts: return attributable to the Fund’s sector weightings and return attributable to the performance of individual stocks within each sector.
On average, during the twelve month period, the Fund was overweighted in energy, materials, consumer discretionary, financials, telecommunication, and utility stocks and underweighted in health care, consumer staples, and information technology stocks. The largest single sector overweight was in financials where the Fund was, on average, 3.1% overweighted versus the index. The largest single underweight was, on average, information technology stocks where the Fund was 4.8% underweighted versus the index. Overall, sector weightings were a drag on the Funds relative performance versus the index.
Performance attributable to the individual stock weightings within each sector was a mild negative for the Fund during this reporting period with overweights in financials being the biggest positive contributor and underweights in health care being the biggest negative contributors.
| 1 | The Russell 3000 Index measures the performance of the 3,000 largest U.S. companies based on total market capitalization, which represents approximately 98% of the investable U.S. equity market. The index returns assume reinvestment of dividends and do not reflect any applicable sales charges. You cannot invest directly in an index. |
Class I Shares – Average Annual Total Returns
As of 6/30/09
| | | | |
| | | 1-Year | | Since
Inception (7/01/2008) |
Nuveen U.S. Equity Completeness Fund | | | | |
I Shares | | -28.96% | | -28.96% |
Russell 3000 Index1 | | -26.56% | | -26.56% |
Returns quoted represent past performance which is no guarantee of future results. Investment returns and principal value will fluctuate so that when shares are redeemed, they may be worth more or less than their original cost. Current performance may be higher or lower than the performance shown. Class I Shares have no sales charge. Returns do not reflect the deduction of taxes that a shareholder would pay on Fund distributions or the redemption of shares. For the most recent month-end performance, visit www.nuveen.com or call (800) 257-8787.
Please see the Fund’s Spotlight Page later in this report for more complete performance data and expense ratios.
Nuveen U.S. Equity Completeness Fund
Growth of an Assumed $10,000 Investment
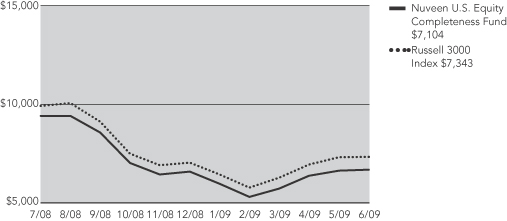
The graph does not reflect the deduction of taxes that a shareholder may pay on Fund distributions or the redemption of shares.
The index comparison shows the change in value of a $10,000 investment in the Nuveen U.S. Equity Completeness Fund compared with the Russell 3000 Index. The Russell 3000 Index measures the performance of the 3,000 largest U.S. companies based on total market capitalization, which represents approximately 98% of the investable U.S. equity market. The index returns assume reinvestment of dividends and do not reflect any applicable sales charges. You cannot invest directly in an index. The Nuveen U.S. Equity Completeness Fund’s total return includes reinvestment of all dividends and distributions. The performance data quoted represents past performance, which is not indicative of future results. Current performance may be lower or higher than the performance shown.
Fund Spotlight as of 6/30/09Nuveen U.S. Equity Completeness Fund
| | |
| Quick Facts | | |
| | | |
NAV | | $14.14 |
Latest Ordinary Income Distribution1 | | $0.0659 |
Inception Date | | 7/01/08 |
Returns quoted represent past performance which is no guarantee of future results. Investment returns and principal value will fluctuate so that when shares are redeemed, they may be worth more or less than their original cost. Current performance may be higher or lower than the performance shown. Returns do not reflect the deduction of taxes that a shareholder would pay on Fund distributions or the redemption of shares.
Fund returns assume reinvestment of dividends and capital gains. Shares have no sales charge and may only be purchased by the Nuveen Allocation Funds. Returns may reflect an expense limitation by the Fund’s investment adviser.
| | |
| Average Annual Total Returns as of 6/30/09 |
| |
| | | NAV |
1-Year | | -28.96% |
Since Inception | | -28.96% |
| | |
| |
| Top Five Common Stock Holdings2 | | |
Exxon Mobil Corporation | | 5.1% |
AT&T Inc. | | 1.8% |
General Electric Company | | 1.7% |
Pfizer Inc. | | 1.6% |
Chevron Corporation | | 1.5% |
Portfolio Allocation2
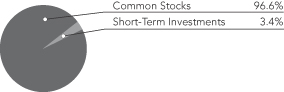
| | |
| Portfolio Statistics |
| Net Assets ($000) | | $4,742 |
| Number of Common Stocks | | 1,510 |
| | | | | | |
| Expense Ratios | | | | | | |
| | | Gross
Expense
Ratio | | Net
Expense
Ratio | | As of
Date |
| | | 0.79% | | 0.79% | | 7/01/08 |
The expense ratios shown factor in Total Annual Fund Operating Expenses including management fees and other fees and expenses, and are based on an estimated $9.4 million average net asset size for the Fund’s first fiscal year.
These expense ratios may vary from the expense ratios shown elsewhere in this report.
| 2 | As a percentage of total investments as of June 30, 2009. Holdings are subject to change. |
Fund Spotlight as of 6/30/09 Nuveen U.S. Equity Completeness Fund
| | |
| Industries1 | | |
Oil, Gas & Consumable Fuels | | 10.0% |
Pharmaceuticals | | 5.8% |
Diversified Telecommunication Services | | 4.1% |
Commercial Banks | | 3.7% |
Software | | 3.6% |
Insurance | | 2.9% |
Electric Utilities | | 2.8% |
Computers & Peripherals | | 2.8% |
Media | | 2.7% |
Specialty Retail | | 2.7% |
Real Estate | | 2.5% |
Biotechnology | | 2.5% |
Health Care Equipment & Supplies | | 2.3% |
Health Care Providers & Services | | 2.3% |
Semiconductors & Equipment | | 2.2% |
Capital Markets | | 2.1% |
Aerospace & Defense | | 2.1% |
Food & Staples Retailing | | 2.1% |
Industrial Conglomerates | | 2.1% |
Communications Equipment | | 2.0% |
Food Products | | 2.0% |
Multi-Utilities | | 1.9% |
Hotels, Restaurants & Leisure | | 1.8% |
Machinery | | 1.7% |
Household Products | | 1.7% |
Beverages | | 1.7% |
Chemicals | | 1.6% |
Diversified Financial Services | | 1.6% |
Short-Term Investments | | 3.4% |
Other | | 19.3% |
| 1 | As a percentage of total investments as of June 30, 2009. Holdings are subject to change. |
Expense Example
As a shareholder of the Fund, you incur two types of costs: (1) transaction costs, including front and back end sales charges (loads) or redemption fees, where applicable; and (2) ongoing costs, including management fees; distribution and service (12b-1) fees, where applicable; and other Fund expenses. This Example is intended to help you understand your ongoing costs (in dollars) of investing in the Fund and to compare these costs with the ongoing costs of investing in other mutual funds.
The Example below is based on an investment of $1,000 invested at the beginning of the period and held for the period.
The information under “Actual Performance,” together with the amount you invested, allows you to estimate actual expenses incurred over the reporting period. Simply divide your account value by $1,000 (for example, an $8,600 account value divided by $1,000 = 8.60) and multiply the result by the cost shown for your share class, in the row entitled “Expenses Incurred During Period” to estimate the expenses incurred on your account during this period.
The information under “Hypothetical Performance,” provides information about hypothetical account values and hypothetical expenses based on the Fund’s actual expense ratio and an assumed rate of return of 5% per year before expenses, which is not the Fund’s actual return. The hypothetical account values and expenses may not be used to estimate the actual ending account balance or expense you incurred for the period. You may use this information to compare the ongoing costs of investing in the Fund and other Funds. To do so, compare this 5% hypothetical example with the 5% hypothetical examples that appear in the shareholder reports of the other funds.
| | | | | | | | |
| | | Actual Performance | | | | Hypothetical Performance
(5% return before expenses) |
| Beginning Account Value (1/01/09) | | $ | 1,000.00 | | | | $ | 1,000.00 |
| Ending Account Value (6/30/09) | | $ | 1,015.80 | | | | $ | 1,020.83 |
| Expenses Incurred During Period | | $ | 3.99 | | | | $ | 4.00 |
Expenses are equal to the Fund’s annualized net expense ratio of .80% multiplied by the average account value over the period, multiplied by 181/365 (to reflect the one-half year period).
Report of
Independent Registered Public Accounting Firm
To the Board of Trustees and Shareholders of
Nuveen Investment Trust:
In our opinion, the accompanying statement of assets and liabilities, including the portfolio of investments, and the related statements of operations, of changes in net assets and the financial highlights present fairly, in all material respects, the financial position of Nuveen U.S. Equity Completeness Fund (a series of the Nuveen Investment Trust, hereafter referred to as the “Fund”) at June 30, 2009, the results of its operations, the changes in its net assets and the financial highlights for the period July 1, 2008 (commencement of operations) through June 30, 2009, in conformity with accounting principles generally accepted in the United States of America. These financial statements and financial highlights (hereafter referred to as “financial statements”) are the responsibility of the Fund’s management; our responsibility is to express an opinion on these financial statements based on our audit. We conducted our audit of these financial statements in accordance with the standards of the Public Company Accounting Oversight Board (United States). Those standards require that we plan and perform the audit to obtain reasonable assurance about whether the financial statements are free of material misstatement. An audit includes examining, on a test basis, evidence supporting the amounts and disclosures in the financial statements, assessing the accounting principles used and significant estimates made by management, and evaluating the overall financial statement presentation. We believe that our audit, which included confirmation of securities at June 30, 2009 by correspondence with the custodian and brokers, provides a reasonable basis for our opinion.
PRICEWATERHOUSECOOPERS LLP
Chicago, IL
August 24, 2009
Portfolio of Investments
Nuveen U.S. Equity Completeness Fund
June 30, 2009
| | | | | | | | | | | |
| Shares | | Description (1) | | | | | | | | Value |
| | | | | | | | | | | |
| | COMMON STOCKS – 96.7% | | | | | | | | | |
| | | | | |
| | Aerospace & Defense – 2.1% | | | | | | | | | |
| | | | | |
| 20 | | AAR Corporation, (2) | | | | | | | | $ | 321 |
| | | | | |
| 40 | | Alliant Techsystems Inc., (2) | | | | | | | | | 3,294 |
| | | | | |
| 10 | | Applied Signal Technology, Inc. | | | | | | | | | 255 |
| | | | | |
| 100 | | Argon ST, Inc., (2) | | | | | | | | | 2,057 |
| | | | | |
| 10 | | BE Aerospace Inc., (2) | | | | | | | | | 144 |
| | | | | |
| 190 | | Boeing Company | | | | | | | | | 8,075 |
| | | | | |
| 60 | | Ceradyne Inc., (2) | | | | | | | | | 1,060 |
| | | | | |
| 70 | | Curtiss Wright Corporation | | | | | | | | | 2,081 |
| | | | | |
| 10 | | Ducommon Inc. | | | | | | | | | 188 |
| | | | | |
| 40 | | GenCorp Inc., (2) | | | | | | | | | 76 |
| | | | | |
| 140 | | General Dynamics Corporation | | | | | | | | | 7,755 |
| | | | | |
| 90 | | Herley Industries, Inc., (2) | | | | | | | | | 987 |
| | | | | |
| 120 | | Hexcel Corporation, (2) | | | | | | | | | 1,144 |
| | | | | |
| 350 | | Honeywell International Inc. | | | | | | | | | 10,990 |
| | | | | |
| 140 | | ITT Industries, Inc. | | | | | | | | | 6,230 |
| | | | | |
| 30 | | L-3 Communications Holdings, Inc. | | | | | | | | | 2,081 |
| | | | | |
| 90 | | Lockheed Martin Corporation | | | | | | | | | 7,259 |
| | | | | |
| 10 | | Moog Inc., Class A Shares, (2) | | | | | | | | | 258 |
| | | | | |
| 200 | | Northrop Grumman Corporation | | | | | | | | | 9,136 |
| | | | | |
| 30 | | Precision Castparts Corporation | | | | | | | | | 2,191 |
| | | | | |
| 150 | | Raytheon Company | | | | | | | | | 6,665 |
| | | | | |
| 260 | | Spirit AeroSystems Holdings Inc., (2) | | | | | | | | | 3,572 |
| | | | | |
| 90 | | Stanley, Inc., (2) | | | | | | | | | 2,959 |
| | | | | |
| 30 | | Teledyne Technologies Inc., (2) | | | | | | | | | 983 |
| | | | | |
| 10 | | TransDigm Group Inc., (2) | | | | | | | | | 362 |
| | | | | |
| 80 | | Triumph Group Inc. | | | | | | | | | 3,200 |
| | | | | |
| 300 | | United Technologies Corporation | | | | | | | | | 15,588 |
| | Total Aerospace & Defense | | | | | | | | | 98,911 |
| | Air Freight & Logistics – 0.6% | | | | | | | | | |
| | | | | |
| 10 | | Atlas Air Worldwide Holdings Inc., (2) | | | | | | | | | 232 |
| | | | | |
| 90 | | C.H. Robinson Worldwide, Inc. | | | | | | | | | 4,694 |
| | | | | |
| 50 | | Dynamex, Inc., (2) | | | | | | | | | 770 |
| | | | | |
| 30 | | Expeditors International of Washington, Inc. | | | | | | | | | 1,000 |
| | | | | |
| 120 | | FedEx Corporation | | | | | | | | | 6,674 |
| | | | | |
| 10 | | Forward Air Corporation | | | | | | | | | 213 |
| | | | | |
| 120 | | Hub Group, Inc., (2) | | | | | | | | | 2,477 |
| | | | | |
| 200 | | United Parcel Service, Inc., Class B | | | | | | | | | 9,998 |
| | | | | |
| 120 | | UTI Worldwide, Inc. | | | | | | | | | 1,368 |
| | Total Air Freight & Logistics | | | | | | | | | 27,426 |
| | Airlines – 0.2% | | | | | | | | | |
| | | | | |
| 80 | | Alaska Air Group, Inc., (2) | | | | | | | | | 1,461 |
| | | | | |
| 30 | | Allegiant Travel Company, (2) | | | | | | | | | 1,189 |
| | | | | |
| 70 | | Delta Air Lines, Inc., (2) | | | | | | | | | 405 |
| | | | | |
| 260 | | Republic Airways Holdings, Inc., (2) | | | | | | | | | 1,698 |
| | | | | | | | | | | |
| Shares | | Description (1) | | | | | | | | Value |
| | | | | | | | | | | |
| | Airlines (continued) | | | | | | | | | |
| | | | | |
| 520 | | Southwest Airlines Co. | | | | | | | | $ | 3,500 |
| | | | | |
| 20 | | UAL Corporation, (2) | | | | | | | | | 64 |
| | | | | |
| 360 | | US Airways Group Inc., (2) | | | | | | | | | 875 |
| | Total Airlines | | | | | | | | | 9,192 |
| | Auto Components – 0.3% | | | | | | | | | |
| | | | | |
| 90 | | Autoliv Inc., (2) | | | | | | | | | 2,589 |
| | | | | |
| 120 | | Cooper Tire & Rubber | | | | | | | | | 1,190 |
| | | | | |
| 20 | | Dorman Products, Inc., (2) | | | | | | | | | 277 |
| | | | | |
| 80 | | Drew Industries Inc., (2) | | | | | | | | | 974 |
| | | | | |
| 10 | | Exide Technologies, (2) | | | | | | | | | 37 |
| | | | | |
| 10 | | Gentex Corporation | | | | | | | | | 116 |
| | | | | |
| 160 | | Johnson Controls, Inc. | | | | | | | | | 3,475 |
| | | | | |
| 40 | | Modine Manufacturing Company | | | | | | | | | 192 |
| | | | | |
| 110 | | Superior Industries International Inc. | | | | | | | | | 1,551 |
| | | | | |
| 270 | | TRW Automotive Holdings Corporation, (2) | | | | | | | | | 3,051 |
| | Total Auto Components | | | | | | | | | 13,452 |
| | Automobiles – 0.2% | | | | | | | | | |
| | | | | |
| 1,160 | | Ford Motor Company, (2) | | | | | | | | | 7,041 |
| | | | | |
| 70 | | Harley-Davidson, Inc. | | | | | | | | | 1,135 |
| | | | | |
| 20 | | Thor Industries, Inc. | | | | | | | | | 367 |
| | | | | |
| 90 | | Winnebago Industries Inc. | | | | | | | | | 669 |
| | Total Automobiles | | | | | | | | | 9,212 |
| | Beverages – 1.7% | | | | | | | | | |
| | | | | |
| 40 | | Boston Beer Company, (2) | | | | | | | | | 1,184 |
| | | | | |
| 30 | | Central European Distribution Corporation, (2) | | | | | | | | | 797 |
| | | | | |
| 10 | | Coca Cola Bottling Company Consolidated | | | | | | | | | 551 |
| | | | | |
| 620 | | Coca-Cola Company | | | | | | | | | 29,754 |
| | | | | |
| 540 | | Coca-Cola Enterprises Inc. | | | | | | | | | 8,991 |
| | | | | |
| 40 | | Constellation Brands, Inc., Class A, (2) | | | | | | | | | 507 |
| | | | | |
| 320 | | Dr. Pepper Snapple Group, (2) | | | | | | | | | 6,781 |
| | | | | |
| 40 | | Hansen Natural Corporation, (2) | | | | | | | | | 1,233 |
| | | | | |
| 30 | | Molson Coors Brewing Company, Class B | | | | | | | | | 1,270 |
| | | | | |
| 50 | | National Beverage Corporation, (2) | | | | | | | | | 533 |
| | | | | |
| 130 | | Pepsi Bottling Group, Inc. | | | | | | | | | 4,399 |
| | | | | |
| 440 | | PepsiCo, Inc. | | | | | | | | | 24,182 |
| | Total Beverages | | | | | | | | | 80,182 |
| | Biotechnology – 2.5% | | | | | | | | | |
| | | | | |
| 40 | | Acorda Therapeutics, Inc., (2) | | | | | | | | | 1,128 |
| | | | | |
| 100 | | Alexion Pharmaceuticals Inc., (2) | | | | | | | | | 4,112 |
| | | | | |
| 210 | | Alkermes Inc., (2) | | | | | | | | | 2,272 |
| | | | | |
| 30 | | Alnylam Pharmaceuticals, Inc., (2) | | | | | | | | | 668 |
| | | | | |
| 570 | | Amgen Inc., (2) | | | | | | | | | 30,176 |
| | | | | |
| 80 | | Amylin Pharmaceuticals Inc., (2) | | | | | | | | | 1,080 |
| | | | | |
| 30 | | Arena Pharmaceuticals, Inc., (2) | | | | | | | | | 150 |
| | | | | |
| 80 | | Biogen Idec Inc., (2) | | | | | | | | | 3,612 |
Portfolio of Investments
Nuveen U.S. Equity Completeness Fund (continued)
June 30, 2009
| | | | | | | | | | | |
| Shares | | Description (1) | | | | | | | | Value |
| | | | | | | | | | | |
| | Biotechnology (continued) | | | | | | | | | |
| | | | | |
| 60 | | Celera Corporation, (2) | | | | | | | | $ | 458 |
| | | | | |
| 60 | | Celgene Corporation, (2) | | | | | | | | | 2,870 |
| | | | | |
| 80 | | Celldex Therapeutics, Inc., (2) | | | | | | | | | 626 |
| | | | | |
| 10 | | Cephalon, Inc., (2) | | | | | | | | | 567 |
| | | | | |
| 60 | | Cepheid, Inc., (2) | | | | | | | | | 565 |
| | | | | |
| 120 | | Cubist Pharmaceuticals Inc., (2) | | | | | | | | | 2,200 |
| | | | | |
| 420 | | Dendreon Corporation, (2) | | | | | | | | | 10,437 |
| | | | | |
| 110 | | Emergent BioSolutions, Inc., (2) | | | | | | | | | 1,576 |
| | | | | |
| 40 | | Enzon Inc., (2) | | | | | | | | | 315 |
| | | | | |
| 190 | | Facet Biotech Corporation, (2) | | | | | | | | | 1,765 |
| | | | | |
| 60 | | Genzyme Corporation, (2) | | | | | | | | | 3,340 |
| | | | | |
| 350 | | Gilead Sciences, Inc., (2) | | | | | | | | | 16,394 |
| | | | | |
| 100 | | GTX, Inc., (2) | | | | | | | | | 923 |
| | | | | |
| 50 | | Intermune, Inc., (2) | | | | | | | | | 760 |
| | | | | |
| 190 | | ISIS Pharmaceuticals, Inc., (2) | | | | | | | | | 3,135 |
| | | | | |
| 70 | | Martek Biosciences Corporation, (2) | | | | | | | | | 1,481 |
| | | | | |
| 140 | | Medarex Inc., (2) | | | | | | | | | 1,169 |
| | | | | |
| 10 | | Medivation, Inc., (2) | | | | | | | | | 224 |
| | | | | |
| 90 | | Metabolix, Inc., (2) | | | | | | | | | 740 |
| | | | | |
| 80 | | Momenta Pharmaceuticals, Inc., (2) | | | | | | | | | 962 |
| | | | | |
| 170 | | Myriad Genentics Inc., (2) | | | | | | | | | 6,061 |
| | | | | |
| 42 | | Myriad Pharmaceuticals Inc., (2) | | | | | | | | | 195 |
| | | | | |
| 70 | | Onyx Pharmaceuticals Inc., (2) | | | | | | | | | 1,978 |
| | | | | |
| 100 | | OSI Pharmaceuticals, Inc., (2) | | | | | | | | | 2,823 |
| | | | | |
| 30 | | Osiris Therapeutics, Inc., (2) | | | | | | | | | 403 |
| | | | | |
| 260 | | PDL Biopahrma Inc. | | | | | | | | | 2,054 |
| | | | | |
| 60 | | Regeneron Pharmaceuticals, Inc., (2) | | | | | | | | | 1,075 |
| | | | | |
| 30 | | Rigel Pharmaceuticals, Inc., (2) | | | | | | | | | 364 |
| | | | | |
| 90 | | Seattle Genetics, Inc., (2) | | | | | | | | | 875 |
| | | | | |
| 110 | | Theravance Inc., (2) | | | | | | | | | 1,610 |
| | | | | |
| 20 | | United Therapeutics Corporation, (2) | | | | | | | | | 1,667 |
| | | | | |
| 90 | | Vertex Pharmaceuticals Inc., (2) | | | | | | | | | 3,208 |
| | | | | |
| 100 | | ZymoGenetics, Inc., (2) | | | | | | | | | 460 |
| | Total Biotechnology | | | | | | | | | 116,478 |
| | Building Products – 0.2% | | | | | | | | | |
| | | | | |
| 80 | | Aaon, Inc. | | | | | | | | | 1,594 |
| | | | | |
| 10 | | Apogee Enterprises, Inc. | | | | | | | | | 123 |
| | | | | |
| 90 | | Lennox International Inc. | | | | | | | | | 2,890 |
| | | | | |
| 80 | | Masco Corporation | | | | | | | | | 766 |
| | | | | |
| 30 | | Owens Corning, (2) | | | | | | | | | 383 |
| | | | | |
| 110 | | Simpson Manufacturing Company Inc. | | | | | | | | | 2,378 |
| | | | | |
| 140 | | USG Corporation, (2) | | | | | | | | | 1,410 |
| | Total Building Products | | | | | | | | | 9,544 |
| | Capital Markets – 2.1% | | | | | | | | | |
| | | | | |
| 80 | | American Capital Limited | | | | | | | | | 257 |
| | | | | | | | | | | |
| Shares | | Description (1) | | | | | | | | Value |
| | | | | | | | | | | |
| | Capital Markets (continued) | | | | | | | | | |
| | | | | |
| 60 | | Ameriprise Financial, Inc. | | | | | | | | $ | 1,456 |
| | | | | |
| 310 | | Bank of New York Company, Inc. | | | | | | | | | 9,086 |
| | | | | |
| 10 | | BlackRock Inc. | | | | | | | | | 1,754 |
| | | | | |
| 30 | | Calamos Asset Management, Inc. Class A | | | | | | | | | 423 |
| | | | | |
| 520 | | Charles Schwab Corporation | | | | | | | | | 9,121 |
| | | | | |
| 80 | | Cohen & Steers Inc. | | | | | | | | | 1,196 |
| | | | | |
| 10 | | Duff & Phelps Corporation, Class A | | | | | | | | | 178 |
| | | | | |
| 180 | | Eaton Vance Corporation | | | | | | | | | 4,815 |
| | | | | |
| 150 | | Federated Investors Inc. | | | | | | | | | 3,614 |
| | | | | |
| 50 | | Franklin Resources, Inc. | | | | | | | | | 3,601 |
| | | | | |
| 40 | | GFI Group, Inc. | | | | | | | | | 270 |
| | | | | |
| 110 | | Goldman Sachs Group, Inc. | | | | | | | | | 16,218 |
| | | | | |
| 30 | | Greenhill & Co Inc. | | | | | | | | | 2,166 |
| | | | | |
| 230 | | Hercules Technology Growth Capital, Inc. | | | | | | | | | 1,923 |
| | | | | |
| 190 | | Invesco LTD | | | | | | | | | 3,386 |
| | | | | |
| 50 | | Janus Capital Group Inc. | | | | | | | | | 570 |
| | | | | |
| 100 | | Knight Trading Group Inc., (2) | | | | | | | | | 1,705 |
| | | | | |
| 90 | | Lazard Limited | | | | | | | | | 2,423 |
| | | | | |
| 180 | | Legg Mason, Inc. | | | | | | | | | 4,388 |
| | | | | |
| 260 | | Morgan Stanley | | | | | | | | | 7,413 |
| | | | | |
| 60 | | Northern Trust Corporation | | | | | | | | | 3,221 |
| | | | | |
| 60 | | OptionsXpress Holdings Inc. | | | | | | | | | 932 |
| | | | | |
| 20 | | Piper Jaffray Companies, (2) | | | | | | | | | 873 |
| | | | | |
| 140 | | RiskMetrics Group, Inc., (2) | | | | | | | | | 2,472 |
| | | | | |
| 20 | | SEI Investments Company | | | | | | | | | 361 |
| | | | | |
| 100 | | State Street Corporation | | | | | | | | | 4,720 |
| | | | | |
| 40 | | Stifel Financial Corporation, (2) | | | | | | | | | 1,924 |
| | | | | |
| 70 | | T. Rowe Price Group Inc. | | | | | | | | | 2,917 |
| | | | | |
| 323 | | TD Ameritrade Holding Corporation, (2) | | | | | | | | | 5,665 |
| | | | | |
| 30 | | TradeStation Group, Inc., (2) | | | | | | | | | 254 |
| | | | | |
| 30 | | Waddell & Reed Financial, Inc., Class A | | | | | | | | | 791 |
| | Total Capital Markets | | | | | | | | | 100,093 |
| | Chemicals – 1.6% | | | | | | | | | |
| | | | | |
| 110 | | Air Products & Chemicals Inc. | | | | | | | | | 7,105 |
| | | | | |
| 20 | | Airgas, Inc. | | | | | | | | | 811 |
| | | | | |
| 10 | | Albemarle Corporation | | | | | | | | | 256 |
| | | | | |
| 100 | | American Vanguard Corp. | | | | | | | | | 1,130 |
| | | | | |
| 20 | | Cabot Corporation | | | | | | | | | 252 |
| | | | | |
| 130 | | Calgon Carbon Corporation, (2) | | | | | | | | | 1,806 |
| | | | | |
| 30 | | Celanese Corporation, Series A | | | | | | | | | 713 |
| | | | | |
| 10 | | CF Industries Holdings, Inc. | | | | | | | | | 741 |
| | | | | |
| 10 | | Cytec Industries, Inc. | | | | | | | | | 186 |
| | | | | |
| 350 | | Dow Chemical Company | | | | | | | | | 5,649 |
| | | | | |
| 460 | | E.I. Du Pont de Nemours and Company | | | | | | | | | 11,785 |
| | | | | |
| 30 | | Eastman Chemical Company | | | | | | | | | 1,137 |
Portfolio of Investments
Nuveen U.S. Equity Completeness Fund (continued)
June 30, 2009
| | | | | | | | | | | |
| Shares | | Description (1) | | | | | | | | Value |
| | | | | | | | | | | |
| | Chemicals (continued) | | | | | | | | | |
| | | | | |
| 70 | | Ecolab Inc. | | | | | | | | $ | 2,729 |
| | | | | |
| 20 | | FMC Corporation | | | | | | | | | 946 |
| | | | | |
| 30 | | Gen Tek Inc., (2) | | | | | | | | | 670 |
| | | | | |
| 80 | | H.B. Fuller Company | | | | | | | | | 1,502 |
| | | | | |
| 390 | | Huntsman Corporation | | | | | | | | | 1,962 |
| | | | | |
| 90 | | Innophos Holdings, Inc. | | | | | | | | | 1,520 |
| | | | | |
| 40 | | Innospec, Inc. | | | | | | | | | 430 |
| | | | | |
| 10 | | Koppers Holdings Inc. | | | | | | | | | 264 |
| | | | | |
| 20 | | Landec Corporation, (2) | | | | | | | | | 136 |
| | | | | |
| 30 | | Lubrizol Corporation | | | | | | | | | 1,419 |
| | | | | |
| 110 | | Monsanto Company | | | | | | | | | 8,177 |
| | | | | |
| 10 | | Mosaic Company | | | | | | | | | 443 |
| | | | | |
| 50 | | NewMarket Corporation | | | | | | | | | 3,367 |
| | | | | |
| 90 | | Olin Corporation | | | | | | | | | 1,070 |
| | | | | |
| 30 | | PolyOne Corporation, (2) | | | | | | | | | 81 |
| | | | | |
| 90 | | PPG Industries, Inc. | | | | | | | | | 3,951 |
| | | | | |
| 80 | | Praxair, Inc. | | | | | | | | | 5,686 |
| | | | | |
| 40 | | Quaker Chemical Corporation | | | | | | | | | 532 |
| | | | | |
| 10 | | Rockwood Holdings Inc., (2) | | | | | | | | | 146 |
| | | | | |
| 140 | | RPM International, Inc. | | | | | | | | | 1,966 |
| | | | | |
| 30 | | Scotts Miracle Gro Company | | | | | | | | | 1,052 |
| | | | | |
| 130 | | Sensient Technologies Corporation | | | | | | | | | 2,934 |
| | | | | |
| 40 | | Sigma-Aldrich Corporation | | | | | | | | | 1,982 |
| | | | | |
| 310 | | Solutia Inc., (2) | | | | | | | | | 1,786 |
| | | | | |
| 20 | | Stepan Company | | | | | | | | | 883 |
| | | | | |
| 20 | | Valspar Corporation | | | | | | | | | 451 |
| | | | | |
| 30 | | Zoltek Companies, Inc., (2) | | | | | | | | | 292 |
| | Total Chemicals | | | | | | | | | 77,948 |
| | Commercial Banks – 3.7% | | | | | | | | | |
| | | | | |
| 10 | | Arrow Financial Corporation | | | | | | | | | 270 |
| | | | | |
| 40 | | Associated Banc-Corp. | | | | | | | | | 500 |
| | | | | |
| 100 | | BancorpSouth Inc. | | | | | | | | | 2,053 |
| | | | | |
| 10 | | Bank of the Ozarks, Inc. | | | | | | | | | 216 |
| | | | | |
| 520 | | BB&T Corporation | | | | | | | | | 11,430 |
| | | | | |
| 230 | | Boston Private Financial Holdings Inc. | | | | | | | | | 1,030 |
| | | | | |
| 10 | | Bryn Mawr Bank | | | | | | | | | 189 |
| | | | | |
| 50 | | Capital City Bank | | | | | | | | | 843 |
| | | | | |
| 70 | | Cardinal Financial Corporation | | | | | | | | | 548 |
| | | | | |
| 180 | | Cathay General Bancorp. | | | | | | | | | 1,712 |
| | | | | |
| 30 | | Chemical Financial Corporation | | | | | | | | | 597 |
| | | | | |
| 90 | | Citizens Republic Bancorp., (2) | | | | | | | | | 64 |
| | | | | |
| 40 | | City Holding Company | | | | | | | | | 1,214 |
| | | | | |
| 200 | | Colonial BancGroup Inc. | | | | | | | | | 124 |
| | | | | |
| 130 | | Comerica Incorporated | | | | | | | | | 2,750 |
| | | | | |
| 10 | | Commerce Bancshares Inc. | | | | | | | | | 318 |
| | | | | | | | | | | |
| Shares | | Description (1) | | | | | | | | Value |
| | | | | | | | | | | |
| | Commercial Banks (continued) | | | | | | | | | |
| | | | | |
| 170 | | Community Bank System Inc. | | | | | | | | $ | 2,475 |
| | | | | |
| 30 | | Community Trust Bancorp, Inc. | | | | | | | | | 803 |
| | | | | |
| 50 | | Cullen/Frost Bankers, Inc. | | | | | | | | | 2,306 |
| | | | | |
| 80 | | CVB Financial | | | | | | | | | 478 |
| | | | | |
| 40 | | East West Bancorp Inc. | | | | | | | | | 260 |
| | | | | |
| 50 | | Enterprise Financial Services Corporation | | | | | | | | | 455 |
| | | | | |
| 200 | | F.N.B. Corporation PA | | | | | | | | | 1,238 |
| | | | | |
| 20 | | Farmers Capital Bank Corporation | | | | | | | | | 503 |
| | | | | |
| 170 | | Fifth Third Bancorp. | | | | | | | | | 1,207 |
| | | | | |
| 40 | | First Bancorp Maine | | | | | | | | | 779 |
| | | | | |
| 70 | | First Bancorp of North Carolina, Inc. | | | | | | | | | 1,098 |
| | | | | |
| 390 | | First Bancorp of Puerto Rico | | | | | | | | | 1,541 |
| | | | | |
| 230 | | First Commonwealth Financial Corporation | | | | | | | | | 1,458 |
| | | | | |
| 40 | | First Financial Bancorp. | | | | | | | | | 301 |
| | | | | |
| 30 | | First Financial Bankshares, Inc. | | | | | | | | | 1,511 |
| | | | | |
| 60 | | First Financial Corporation | | | | | | | | | 1,895 |
| | | | | |
| 223 | | First Horizon National Corporation, (2) | | | | | | | | | 2,682 |
| | | | | |
| 20 | | First Merchants Corporation | | | | | | | | | 161 |
| | | | | |
| 30 | | First Midwest Bancorp, Inc. | | | | | | | | | 219 |
| | | | | |
| 211 | | FirstMerit Corporation | | | | | | | | | 3,583 |
| | | | | |
| 40 | | Frontier Financial Corporation | | | | | | | | | 48 |
| | | | | |
| 160 | | Fulton Financial Corporation | | | | | | | | | 834 |
| | | | | |
| 20 | | Glacier Bancorp, Inc. | | | | | | | | | 295 |
| | | | | |
| 20 | | Greene County Bankshares, Inc. | | | | | | | | | 90 |
| | | | | |
| 50 | | Hancock Holding Company | | | | | | | | | 1,625 |
| | | | | |
| 80 | | Harleysville National Corporation | | | | | | | | | 376 |
| | | | | |
| 70 | | Home Bancshares, Inc. | | | | | | | | | 1,333 |
| | | | | |
| 20 | | Huntington BancShares Inc. | | | | | | | | | 84 |
| | | | | |
| 50 | | IberiaBank Corporation | | | | | | | | | 1,971 |
| | | | | |
| 20 | | Independent Bank Corporation | | | | | | | | | 394 |
| | | | | |
| 150 | | International Bancshares Corporation | | | | | | | | | 1,547 |
| | | | | |
| 100 | | Investors Bancorp, Inc., (2) | | | | | | | | | 916 |
| | | | | |
| 170 | | KeyCorp. | | | | | | | | | 891 |
| | | | | |
| 40 | | M&T Bank Corporation | | | | | | | | | 2,037 |
| | | | | |
| 100 | | Mainsource Financial Group | | | | | | | | | 742 |
| | | | | |
| 20 | | Marshall and Ilsley Corporation | | | | | | | | | 96 |
| | | | | |
| 130 | | MB Financial, Inc. | | | | | | | | | 1,325 |
| | | | | |
| 320 | | National Penn Bancshares, Inc. | | | | | | | | | 1,475 |
| | | | | |
| 100 | | NBT Bancorp, Inc. | | | | | | | | | 2,171 |
| | | | | |
| 30 | | Northfield Bancorp Inc. | | | | | | | | | 349 |
| | | | | |
| 220 | | Old National Bancorp. | | | | | | | | | 2,160 |
| | | | | |
| 270 | | Pacific Capital Bancorp. | | | | | | | | | 578 |
| | | | | |
| 50 | | Pacwest Bancorp. | | | | | | | | | 658 |
| | | | | |
| 30 | | Park National Corporation | | | | | | | | | 1,694 |
| | | | | |
| 40 | | Peoples Bancorp, Inc. | | | | | | | | | 682 |
Portfolio of Investments
Nuveen U.S. Equity Completeness Fund (continued)
June 30, 2009
| | | | | | | | | | | |
| Shares | | Description (1) | | | | | | | | Value |
| | | | | | | | | | | |
| | Commercial Banks (continued) | | | | | | | | | |
| | | | | |
| 40 | | Pinnacle Financial Partners, Inc., (2) | | | | | | | | $ | 533 |
| | | | | |
| 170 | | PNC Financial Services Group, Inc. | | | | | | | | | 6,598 |
| | | | | |
| 50 | | Popular, Inc. | | | | | | | | | 110 |
| | | | | |
| 30 | | Privatebancorp, Inc. | | | | | | | | | 667 |
| | | | | |
| 100 | | Prosperity Bancshares, Inc. | | | | | | | | | 2,983 |
| | | | | |
| 500 | | Regions Financial Corporation | | | | | | | | | 2,020 |
| | | | | |
| 130 | | S&T Bancorp, Inc. | | | | | | | | | 1,581 |
| | | | | |
| 70 | | Sandy Spring Bancorp, Inc. | | | | | | | | | 1,029 |
| | | | | |
| 30 | | Shore Bancshares, Inc. | | | | | | | | | 538 |
| | | | | |
| 60 | | Signature Bank, (2) | | | | | | | | | 1,627 |
| | | | | |
| 10 | | Simmons First National Corporation | | | | | | | | | 267 |
| | | | | |
| 10 | | Southside Bancshares, Inc. | | | | | | | | | 229 |
| | | | | |
| 90 | | Sterling Bancshares Inc. | | | | | | | | | 570 |
| | | | | |
| 340 | | Sterling Financial Corporation | | | | | | | | | 989 |
| | | | | |
| 230 | | SunTrust Banks, Inc. | | | | | | | | | 3,784 |
| | | | | |
| 260 | | Susquehanna Bancshares Inc. | | | | | | | | | 1,271 |
| | | | | |
| 40 | | SVB Financial Group, (2) | | | | | | | | | 1,089 |
| | | | | |
| 30 | | Synovus Financial Corp. | | | | | | | | | 90 |
| | | | | |
| 120 | | TCF Financial Corporation | | | | | | | | | 1,604 |
| | | | | |
| 80 | | Texas Capital BancShares, Inc., (2) | | | | | | | | | 1,238 |
| | | | | |
| 40 | | The South Financial Group Inc. | | | | | | | | | 48 |
| | | | | |
| 20 | | Towne Bank | | | | | | | | | 280 |
| | | | | |
| 80 | | Trustmark Corporation | | | | | | | | | 1,546 |
| | | | | |
| 660 | | U.S. Bancorp | | | | | | | | | 11,827 |
| | | | | |
| 80 | | UMB Financial Corporation | | | | | | | | | 3,041 |
| | | | | |
| 70 | | Umpqua Holdings Corporation | | | | | | | | | 543 |
| | | | | |
| 70 | | United Bankshares, Inc. | | | | | | | | | 1,368 |
| | | | | |
| 121 | | United Community Banks, Inc., (2) | | | | | | | | | 724 |
| | | | | |
| 10 | | Univest Corporation of Pennsylvania | | | | | | | | | 203 |
| | | | | |
| 30 | | Valley National Bancorp. | | | | | | | | | 351 |
| | | | | |
| 10 | | Washington Trust Bancorp, Inc. | | | | | | | | | 178 |
| | | | | |
| 290 | | Webster Financial Corporation | | | | | | | | | 2,335 |
| | | | | |
| 1,820 | | Wells Fargo & Company | | | | | | | | | 44,153 |
| | | | | |
| 50 | | WesBanco, Inc. | | | | | | | | | 727 |
| | | | | |
| 50 | | Westamerica Bancorp. | | | | | | | | | 2,481 |
| | | | | |
| 70 | | Whitney Holding Corporation | | | | | | | | | 641 |
| | | | | |
| 30 | | Wilmington Trust Corporation | | | | | | | | | 410 |
| | | | | |
| 50 | | Wintrust Financial Corporation | | | | | | | | | 804 |
| | | | | |
| 100 | | Yadkin Valley Financial Corporation | | | | | | | | | 691 |
| | Total Commercial Banks | | | | | | | | | 174,350 |
| | Commercial Services & Supplies – 1.0% | | | | | | | | | |
| | | | | |
| 80 | | ABM Industries Inc. | | | | | | | | | 1,446 |
| | | | | |
| 70 | | American Ecology Corporation | | | | | | | | | 1,254 |
| | | | | |
| 30 | | Cenveo Inc., (2) | | | | | | | | | 127 |
| | | | | |
| 90 | | Cintas Corporation | | | | | | | | | 2,056 |
| | | | | | | | | | | |
| Shares | | Description (1) | | | | | | | | Value |
| | | | | | | | | | | |
| | Commercial Services & Supplies (continued) | | | | | | | | | |
| | | | | |
| 10 | | Corrections Corporation of America, (2) | | | | | | | | $ | 170 |
| | | | | |
| 30 | | Covanta Holding Corporation, (2) | | | | | | | | | 509 |
| | | | | |
| 50 | | Ennis Inc. | | | | | | | | | 623 |
| | | | | |
| 70 | | Geo Group Inc., (2) | | | | | | | | | 1,301 |
| | | | | |
| 100 | | GeoEye, Inc., (2) | | | | | | | | | 2,356 |
| | | | | |
| 110 | | Healthcare Services Group, Inc. | | | | | | | | | 1,967 |
| | | | | |
| 10 | | Iron Mountain Inc., (2) | | | | | | | | | 288 |
| | | | | |
| 190 | | Knoll Inc. | | | | | | | | | 1,440 |
| | | | | |
| 10 | | Miller (Herman) Inc. | | | | | | | | | 153 |
| | | | | |
| 110 | | Mine Safety Appliances Company | | | | | | | | | 2,651 |
| | | | | |
| 10 | | Mobile Mini, Inc., (2) | | | | | | | | | 147 |
| | | | | |
| 60 | | R.R. Donnelley & Sons Company | | | | | | | | | 697 |
| | | | | |
| 100 | | Republic Services, Inc. | | | | | | | | | 2,441 |
| | | | | |
| 60 | | Rollins Inc. | | | | | | | | | 1,039 |
| | | | | |
| 100 | | Standard Parking Corporation, (2) | | | | | | | | | 1,629 |
| | | | | |
| 220 | | Steelcase Inc. | | | | | | | | | 1,280 |
| | | | | |
| 160 | | Sykes Enterprises Inc., (2) | | | | | | | | | 2,894 |
| | | | | |
| 60 | | Team, Inc., (2) | | | | | | | | | 940 |
| | | | | |
| 90 | | Tetra Tech, Inc., (2) | | | | | | | | | 2,579 |
| | | | | |
| 20 | | Viad Corporation | | | | | | | | | 344 |
| | | | | |
| 190 | | Waste Connections Inc., (2) | | | | | | | | | 4,923 |
| | | | | |
| 370 | | Waste Management, Inc. | | | | | | | | | 10,419 |
| | | | | |
| 80 | | Waste Services, Inc., (2) | | | | | | | | | 414 |
| | Total Commercial Services & Supplies | | | | | | | | | 46,087 |
| | Communications Equipment – 2.0% | | | | | | | | | |
| | | | | |
| 560 | | 3COM Corporation, (2) | | | | | | | | | 2,638 |
| | | | | |
| 170 | | ADC Telecommunications Inc., (2) | | | | | | | | | 1,353 |
| | | | | |
| 160 | | ADTRAN, Inc. | | | | | | | | | 3,435 |
| | | | | |
| 220 | | Airvana Inc., (2) | | | | | | | | | 1,401 |
| | | | | |
| 30 | | Arris Group Inc., (2) | | | | | | | | | 365 |
| | | | | |
| 40 | | Avocent Corporation, (2) | | | | | | | | | 558 |
| | | | | |
| 30 | | BigBand Networks, Inc., (2) | | | | | | | | | 155 |
| | | | | |
| 30 | | Blue Coat Systems Inc., (2) | | | | | | | | | 496 |
| | | | | |
| 1,590 | | Cisco Systems, Inc., (2) | | | | | | | | | 29,638 |
| | | | | |
| 20 | | Cogo Group Inc., (2) | | | | | | | | | 119 |
| | | | | |
| 130 | | CommScope Inc., (2) | | | | | | | | | 3,414 |
| | | | | |
| 160 | | Comtech Telecom Corporation, (2) | | | | | | | | | 5,101 |
| | | | | |
| 90 | | DG FastChannel, (2) | | | | | | | | | 1,647 |
| | | | | |
| 10 | | Echostar Holding Corporation, Class A, (2) | | | | | | | | | 159 |
| | | | | |
| 10 | | Emulex Corporation, (2) | | | | | | | | | 98 |
| | | | | |
| 100 | | F5 Networks, Inc., (2) | | | | | | | | | 3,459 |
| | | | | |
| 160 | | Globecom Systems, Inc., (2) | | | | | | | | | 1,150 |
| | | | | |
| 10 | | Harris Corporation | | | | | | | | | 284 |
| | | | | |
| 10 | | Hughes Communications, Inc., (2) | | | | | | | | | 228 |
| | | | | |
| 310 | | Infinera Corporation, (2) | | | | | | | | | 2,830 |
Portfolio of Investments
Nuveen U.S. Equity Completeness Fund (continued)
June 30, 2009
| | | | | | | | | | | |
| Shares | | Description (1) | | | | | | | | Value |
| | | | | | | | | | | |
| | Communications Equipment (continued) | | | | | | | | | |
| | | | | |
| 70 | | Interdigital Inc., (2) | | | | | | | | $ | 1,711 |
| | | | | |
| 250 | | IXIA, (2) | | | | | | | | | 1,685 |
| | | | | |
| 120 | | Juniper Networks Inc., (2) | | | | | | | | | 2,832 |
| | | | | |
| 420 | | Motorola, Inc. | | | | | | | | | 2,785 |
| | | | | |
| 40 | | Netgear, Inc., (2) | | | | | | | | | 576 |
| | | | | |
| 240 | | Palm Inc., (2) | | | | | | | | | 3,977 |
| | | | | |
| 10 | | Plantronics Inc. | | | | | | | | | 189 |
| | | | | |
| 160 | | Polycom Inc., (2) | | | | | | | | | 3,243 |
| | | | | |
| 310 | | QUALCOMM Inc. | | | | | | | | | 14,012 |
| | | | | |
| 70 | | Riverbed Technology, Inc., (2) | | | | | | | | | 1,623 |
| | | | | |
| 240 | | ShoreTel, Inc., (2) | | | | | | | | | 1,920 |
| | | | | |
| 10 | | Starent Networks Corporation, (2) | | | | | | | | | 244 |
| | | | | |
| 30 | | Symmetricom Inc., (2) | | | | | | | | | 173 |
| | | | | |
| 30 | | Tekelec, (2) | | | | | | | | | 505 |
| | | | | |
| 10 | | ViaSat, Inc., (2) | | | | | | | | | 256 |
| | Total Communications Equipment | | | | | | | | | 94,259 |
| | Computers & Peripherals – 2.8% | | | | | | | | | |
| | | | | |
| 150 | | Apple, Inc., (2) | | | | | | | | | 21,365 |
| | | | | |
| 90 | | Avid Technology Inc., (2) | | | | | | | | | 1,207 |
| | | | | |
| 620 | | Dell Inc., (2) | | | | | | | | | 8,513 |
| | | | | |
| 30 | | Electronics For Imaging, (2) | | | | | | | | | 320 |
| | | | | |
| 690 | | EMC Corporation, (2) | | | | | | | | | 9,039 |
| | | | | |
| 620 | | Hewlett-Packard Company | | | | | | | | | 23,963 |
| | | | | |
| 140 | | Immersion Corporation, (2) | | | | | | | | | 692 |
| | | | | |
| 180 | | Intermec Inc, (2) | | | | | | | | | 2,322 |
| | | | | |
| 350 | | International Business Machines Corporation (IBM) | | | | | | | | | 36,547 |
| | | | | |
| 230 | | Network Appliance Inc., (2) | | | | | | | | | 4,536 |
| | | | | |
| 330 | | QLogic Corporation, (2) | | | | | | | | | 4,184 |
| | | | | |
| 80 | | Rimage Corporation, (2) | | | | | | | | | 1,329 |
| | | | | |
| 40 | | SanDisk Corporation, (2) | | | | | | | | | 588 |
| | | | | |
| 490 | | Seagate Technology | | | | | | | | | 5,125 |
| | | | | |
| 40 | | Silicon Graphics International Corporation, (2) | | | | | | | | | 182 |
| | | | | |
| 60 | | Stratasys, Inc., (2) | | | | | | | | | 659 |
| | | | | |
| 320 | | Sun Microsystems Inc., (2) | | | | | | | | | 2,950 |
| | | | | |
| 90 | | Synaptics, Inc., (2) | | | | | | | | | 3,479 |
| | | | | |
| 260 | | Western Digital Corporation, (2) | | | | | | | | | 6,890 |
| | Total Computers & Peripherals | | | | | | | | | 133,890 |
| | Construction & Engineering – 0.4% | | | | | | | | | |
| | | | | |
| 10 | | AECOM Technology Corporation, (2) | | | | | | | | | 320 |
| | | | | |
| 100 | | Emcor Group Inc., (2) | | | | | | | | | 2,012 |
| | | | | |
| 40 | | Fluor Corporation | | | | | | | | | 2,052 |
| | | | | |
| 100 | | Granite Construction Inc. | | | | | | | | | 3,328 |
| | | | | |
| 10 | | Layne Christensen Company, (2) | | | | | | | | | 205 |
| | | | | |
| 80 | | MasTec Inc., (2) | | | | | | | | | 938 |
| | | | | |
| 30 | | Michael Baker Corporation, (2) | | | | | | | | | 1,271 |
| | | | | | | | | | | |
| Shares | | Description (1) | | | | | | | | Value |
| | | | | | | | | | | |
| | Construction & Engineering (continued) | | | | | | | | | |
| | | | | |
| 10 | | Pike Electric Corporation, (2) | | | | | | | | $ | 121 |
| | | | | |
| 30 | | Shaw Group Inc., (2) | | | | | | | | | 822 |
| | | | | |
| 10 | | Sterling Construction Company, Inc., (2) | | | | | | | | | 153 |
| | | | | |
| 120 | | Tutor Perini Corporation, (2) | | | | | | | | | 2,083 |
| | | | | |
| 150 | | URS Corporation, (2) | | | | | | | | | 7,428 |
| | Total Construction & Engineering | | | | | | | | | 20,733 |
| | Construction Materials – 0.1% | | | | | | | | | |
| | | | | |
| 160 | | Headwater Inc., (2) | | | | | | | | | 538 |
| | | | | |
| 10 | | Martin Marietta Materials | | | | | | | | | 789 |
| | | | | |
| 20 | | Texas Industries Inc. | | | | | | | | | 627 |
| | | | | |
| 50 | | Vulcan Materials Company | | | | | | | | | 2,155 |
| | Total Construction Materials | | | | | | | | | 4,109 |
| | Consumer Finance – 0.3% | | | | | | | | | |
| | | | | |
| 40 | | Advance America Cash Advance Centers Inc | | | | | | | | | 177 |
| | | | | |
| 310 | | American Express Company | | | | | | | | | 7,204 |
| | | | | |
| 170 | | Capital One Financial Corporation | | | | | | | | | 3,720 |
| | | | | |
| 90 | | Credit Acceptance Corporation, (2) | | | | | | | | | 1,967 |
| | | | | |
| 70 | | Discover Financial Services | | | | | | | | | 719 |
| | | | | |
| 70 | | EZCORP, Inc., (2) | | | | | | | | | 755 |
| | | | | |
| 30 | | First Cash Financial Services, Inc., (2) | | | | | | | | | 526 |
| | | | | |
| 30 | | Nelnet Inc., (2) | | | | | | | | | 408 |
| | | | | |
| 10 | | World Acceptance Corporation, (2) | | | | | | | | | 199 |
| | Total Consumer Finance | | | | | | | | | 15,675 |
| | Containers & Packaging – 0.4% | | | | | | | | | |
| | | | | |
| 30 | | AEP Industries, Inc., (2) | | | | | | | | | 792 |
| | | | | |
| 40 | | AptarGroup Inc. | | | | | | | | | 1,351 |
| | | | | |
| 40 | | Ball Corporation | | | | | | | | | 1,806 |
| | | | | |
| 90 | | Bemis Company, Inc. | | | | | | | | | 2,268 |
| | | | | |
| 20 | | Crown Holdings Inc., (2) | | | | | | | | | 483 |
| | | | | |
| 60 | | Owens-Illinois, Inc., (2) | | | | | | | | | 1,681 |
| | | | | |
| 170 | | Packaging Corp. of America | | | | | | | | | 2,754 |
| | | | | |
| 210 | | Pactiv Corporation, (2) | | | | | | | | | 4,557 |
| | | | | |
| 140 | | Sealed Air Corporation | | | | | | | | | 2,583 |
| | | | | |
| 120 | | Sonoco Products Company | | | | | | | | | 2,874 |
| | Total Containers & Packaging | | | | | | | | | 21,149 |
| | Distributors – 0.2% | | | | | | | | | |
| | | | | |
| 60 | | Core-Mark Holding Company, Inc., (2) | | | | | | | | | 1,564 |
| | | | | |
| 200 | | Genuine Parts Company | | | | | | | | | 6,712 |
| | Total Distributors | | | | | | | | | 8,276 |
| | Diversified Consumer Services – 0.3% | | | | | | | | | |
| | | | | |
| 20 | | American Public Education Inc., (2) | | | | | | | | | 792 |
| | | | | |
| 60 | | Apollo Group, Inc., (2) | | | | | | | | | 4,267 |
| | | | | |
| 20 | | Capella Education Company, (2) | | | | | | | | | 1,199 |
| | | | | |
| 130 | | Corinthian Colleges Inc., (2) | | | | | | | | | 2,201 |
| | | | | |
| 40 | | Grand Canyon Education Inc., (2) | | | | | | | | | 671 |
Portfolio of Investments
Nuveen U.S. Equity Completeness Fund (continued)
June 30, 2009
| | | | | | | | | | | |
| Shares | | Description (1) | | | | | | | | Value |
| | | | | | | | | | | |
| | Diversified Consumer Services (continued) | | | | | | | | | |
| | | | | |
| 60 | | H & R Block Inc. | | | | | | | | $ | 1,034 |
| | | | | |
| 30 | | ITT Educational Services, Inc., (2) | | | | | | | | | 3,020 |
| | | | | |
| 150 | | Jackson Hewitt Tax Services Inc. | | | | | | | | | 939 |
| | | | | |
| 20 | | K12, Inc., (2) | | | | | | | | | 431 |
| | | | | |
| 10 | | Regis Corporation | | | | | | | | | 174 |
| | | | | |
| 110 | | Sothebys Holdings Inc. | | | | | | | | | 1,552 |
| | | | | |
| 10 | | Universal Technical Institute Inc., (2) | | | | | | | | | 149 |
| | Total Diversified Consumer Services | | | | | | | | | 16,429 |
| | Diversified Financial Services – 1.6% | | | | | | | | | |
| | | | | |
| 1,250 | | Bank of America Corporation | | | | | | | | | 16,500 |
| | | | | |
| 1,040 | | Citigroup Inc. | | | | | | | | | 3,089 |
| | | | | |
| 10 | | CME Group, Inc. | | | | | | | | | 3,111 |
| | | | | |
| 110 | | Financial Federal Corporation | | | | | | | | | 2,261 |
| | | | | |
| 40 | | Interactive Brokers Group, Inc., (2) | | | | | | | | | 621 |
| | | | | |
| 10 | | Intercontinental Exchange, Inc., (2) | | | | | | | | | 1,142 |
| | | | | |
| 960 | | JPMorgan Chase & Co. | | | | | | | | | 32,746 |
| | | | | |
| 20 | | Leucadia National Corporation, (2) | | | | | | | | | 422 |
| | | | | |
| 150 | | Marketaxess, (2) | | | | | | | | | 1,430 |
| | | | | |
| 80 | | Moody’s Corporation | | | | | | | | | 2,108 |
| | | | | |
| 100 | | MSCI Inc., Class A Shares, (2) | | | | | | | | | 2,444 |
| | | | | |
| 30 | | Nasdaq Stock Market, Inc., (2) | | | | | | | | | 639 |
| | | | | |
| 40 | | New York Stock Exchange Euronext | | | | | | | | | 1,090 |
| | | | | |
| 260 | | PHH Corporation, (2) | | | | | | | | | 4,727 |
| | | | | |
| 50 | | Portfolio Recovery Associates, Inc., (2) | | | | | | | | | 1,937 |
| | Total Diversified Financial Services | | | | | | | | | 74,267 |
| | Diversified Telecommunication Services – 4.1% | | | | | | | | | |
| | | | | |
| 20 | | Alaska Communications Systems Group Inc. | | | | | | | | | 146 |
| | | | | |
| 3,510 | | AT&T Inc. | | | | | | | | | 87,188 |
| | | | | |
| 60 | | Atlantic Tele-Network, Inc. | | | | | | | | | 2,357 |
| | | | | |
| 30 | | Cbeyond Inc., (2) | | | | | | | | | 431 |
| | | | | |
| 210 | | CenturyTel, Inc. | | | | | | | | | 6,447 |
| | | | | |
| 100 | | CLearwire Corporation, (2) | | | | | | | | | 553 |
| | | | | |
| 200 | | Consolidated Communications Holdings, Inc. | | | | | | | | | 2,342 |
| | | | | |
| 60 | | Embarq Corporation | | | | | | | | | 2,524 |
| | | | | |
| 780 | | Frontier Communications Corporation | | | | | | | | | 5,569 |
| | | | | |
| 240 | | General Communication, Inc., (2) | | | | | | | | | 1,663 |
| | | | | |
| 100 | | Global Crossing Limited, (2) | | | | | | | | | 918 |
| | | | | |
| 100 | | Iowa Telecommunications Services, Inc. | | | | | | | | | 1,251 |
| | | | | |
| 90 | | NTELOS Holdings Corporation | | | | | | | | | 1,658 |
| | | | | |
| 90 | | Premiere Global Services, Inc., (2) | | | | | | | | | 976 |
| | | | | |
| 3,260 | | Qwest Communications International Inc. | | | | | | | | | 13,529 |
| | | | | |
| 70 | | TW Telecom Inc., (2) | | | | | | | | | 719 |
| | | | | |
| 1,910 | | Verizon Communications Inc. | | | | | | | | | 58,694 |
| | | | | |
| 930 | | Windstream Corporation | | | | | | | | | 7,775 |
| | Total Diversified Telecommunication Services | | | | | | | | | 194,740 |
| | | | | | | | | | | |
| Shares | | Description (1) | | | | | | | | Value |
| | | | | | | | | | | |
| | Electric Utilities – 2.8% | | | | | | | | | |
| | | | | |
| 20 | | Allegheny Energy, Inc. | | | | | | | | $ | 513 |
| | | | | |
| 310 | | American Electric Power Company, Inc. | | | | | | | | | 8,956 |
| | | | | |
| 90 | | Cleco Corporation | | | | | | | | | 2,018 |
| | | | | |
| 190 | | DPL Inc. | | | | | | | | | 4,402 |
| | | | | |
| 780 | | Duke Energy Corporation | | | | | | | | | 11,380 |
| | | | | |
| 140 | | Edison International | | | | | | | | | 4,404 |
| | | | | |
| 160 | | El Paso Electric Company, (2) | | | | | | | | | 2,234 |
| | | | | |
| 60 | | Entergy Corporation | | | | | | | | | 4,651 |
| | | | | |
| 350 | | Exelon Corporation | | | | | | | | | 17,924 |
| | | | | |
| 330 | | FirstEnergy Corp. | | | | | | | | | 12,788 |
| | | | | |
| 280 | | FPL Group, Inc. | | | | | | | | | 15,921 |
| | | | | |
| 30 | | Great Plains Energy Incorporated | | | | | | | | | 467 |
| | | | | |
| 80 | | IDACORP, INC | | | | | | | | | 2,091 |
| | | | | |
| 90 | | ITC Holdings Corporation | | | | | | | | | 4,082 |
| | | | | |
| 110 | | Northeast Utilities | | | | | | | | | 2,454 |
| | | | | |
| 140 | | Pepco Holdings, Inc. | | | | | | | | | 1,882 |
| | | | | |
| 70 | | Pinnacle West Capital Corporation | | | | | | | | | 2,111 |
| | | | | |
| 100 | | Portland General Electric Company | | | | | | | | | 1,948 |
| | | | | |
| 250 | | PPL Corporation | | | | | | | | | 8,240 |
| | | | | |
| 180 | | Progress Energy, Inc. | | | | | | | | | 6,809 |
| | | | | |
| 450 | | Southern Company | | | | | | | | | 14,022 |
| | | | | |
| 40 | | UIL Holdings Corporation | | | | | | | | | 898 |
| | | | | |
| 40 | | Unisource Energy Corporation | | | | | | | | | 1,062 |
| | | | | |
| 160 | | Westar Energy Inc. | | | | | | | | | 3,003 |
| | Total Electric Utilities | | | | | | | | | 134,260 |
| | Electrical Equipment – 0.8% | | | | | | | | | |
| | | | | |
| 50 | | Acuity Brands Inc. | | | | | | | | | 1,403 |
| | | | | |
| 90 | | Ametek Inc. | | | | | | | | | 3,112 |
| | | | | |
| 40 | | AZZ Inc., (2) | | | | | | | | | 1,376 |
| | | | | |
| 150 | | Baldor Electric Company | | | | | | | | | 3,569 |
| | | | | |
| 10 | | Belden Inc. | | | | | | | | | 167 |
| | | | | |
| 40 | | Brady Corporation | | | | | | | | | 1,005 |
| | | | | |
| 360 | | Emerson Electric Company | | | | | | | | | 11,664 |
| | | | | |
| 40 | | Encore Wire Corporation | | | | | | | | | 854 |
| | | | | |
| 10 | | Energy Conversion Devices Inc., (2) | | | | | | | | | 142 |
| | | | | |
| 10 | | EnerSys, (2) | | | | | | | | | 182 |
| | | | | |
| 10 | | First Solar Inc., (2) | | | | | | | | | 1,621 |
| | | | | |
| 50 | | Franklin Electric Company, Inc. | | | | | | | | | 1,296 |
| | | | | |
| 40 | | General Cable Corporation, (2) | | | | | | | | | 1,503 |
| | | | | |
| 220 | | GrafTech International Ltd., (2) | | | | | | | | | 2,488 |
| | | | | |
| 250 | | GT Solar International Inc., (2) | | | | | | | | | 1,330 |
| | | | | |
| 30 | | II VI Inc., (2) | | | | | | | | | 665 |
| | | | | |
| 10 | | Regal-Beloit Corporation | | | | | | | | | 397 |
| | | | | |
| 100 | | Thomas & Betts Corporation, (2) | | | | | | | | | 2,886 |
Portfolio of Investments
Nuveen U.S. Equity Completeness Fund (continued)
June 30, 2009
| | | | | | | | | | | |
| Shares | | Description (1) | | | | | | | | Value |
| | | | | | | | | | | |
| | Electrical Equipment (continued) | | | | | | | | | |
| | | | | |
| 60 | | Woodward Governor Company | | | | | | | | $ | 1,188 |
| | Total Electrical Equipment | | | | | | | | | 36,848 |
| | Electronic Equipment & Instruments – 1.0% | | | | | | | | | |
| | | | | |
| 30 | | Agilent Technologies, Inc., (2) | | | | | | | | | 609 |
| | | | | |
| 100 | | Agilysys Inc. | | | | | | | | | 468 |
| | | | | |
| 100 | | Amphenol Corporation, Class A | | | | | | | | | 3,164 |
| | | | | |
| 130 | | Anixter International Inc., (2) | | | | | | | | | 4,887 |
| | | | | |
| 240 | | Avnet Inc., (2) | | | | | | | | | 5,047 |
| | | | | |
| 20 | | Benchmark Electronics Inc., (2) | | | | | | | | | 288 |
| | | | | |
| 170 | | China Security and Surveillance Techology Inc., (2) | | | | | | | | | 1,282 |
| | | | | |
| 70 | | Comverge, Inc., (2) | | | | | | | | | 847 |
| | | | | |
| 500 | | Corning Incorporated | | | | | | | | | 8,030 |
| | | | | |
| 220 | | CTS Corporation | | | | | | | | | 1,441 |
| | | | | |
| 30 | | Daktronics Inc. | | | | | | | | | 231 |
| | | | | |
| 10 | | Dolby Laboratories, Inc., (2) | | | | | | | | | 373 |
| | | | | |
| 130 | | Electro Rent Corporation | | | | | | | | | 1,234 |
| | | | | |
| 10 | | FARO Technologies, Inc., (2) | | | | | | | | | 155 |
| | | | | |
| 10 | | FLIR Systems Inc., (2) | | | | | | | | | 226 |
| | | | | |
| 580 | | Jabil Circuit Inc. | | | | | | | | | 4,304 |
| | | | | |
| 220 | | L-1 Identity Solutions Inc., (2) | | | | | | | | | 1,703 |
| | | | | |
| 30 | | Methode Electronics, Inc. | | | | | | | | | 211 |
| | | | | |
| 60 | �� | MTS Systems Corporation | | | | | | | | | 1,239 |
| | | | | |
| 10 | | OSI Systems Inc., (2) | | | | | | | | | 209 |
| | | | | |
| 90 | | Plexus Corporation, (2) | | | | | | | | | 1,841 |
| | | | | |
| 110 | | Radisys Corporation, (2) | | | | | | | | | 991 |
| | | | | |
| 10 | | Rogers Corporation, (2) | | | | | | | | | 202 |
| | | | | |
| 30 | | ScanSource, Inc., (2) | | | | | | | | | 736 |
| | | | | |
| 10 | | SYNNEX Corporation, (2) | | | | | | | | | 250 |
| | | | | |
| 60 | | Tech Data Corporation, (2) | | | | | | | | | 1,963 |
| | | | | |
| 160 | | Technitrol, Inc. | | | | | | | | | 1,035 |
| | | | | |
| 190 | | TTM Technologies, Inc., (2) | | | | | | | | | 1,512 |
| | | | | |
| 240 | | Tyco Electronics, Limited | | | | | | | | | 4,462 |
| | Total Electronic Equipment & Instruments | | | | | | | | | 48,940 |
| | Energy Equipment & Services – 1.2% | | | | | | | | | |
| | | | | |
| 150 | | Baker Hughes Incorporated | | | | | | | | | 5,466 |
| | | | | |
| 10 | | Bristow Group Inc., (2) | | | | | | | | | 296 |
| | | | | |
| 60 | | Bronco Drilling Company, Inc., (2) | | | | | | | | | 257 |
| | | | | |
| 30 | | Complete Production Services, (2) | | | | | | | | | 191 |
| | | | | |
| 30 | | Cooper Cameron Corporation, (2) | | | | | | | | | 849 |
| | | | | |
| 60 | | Dril Quip Inc., (2) | | | | | | | | | 2,286 |
| | | | | |
| 130 | | ENGlobal Corporation, (2) | | | | | | | | | 640 |
| | | | | |
| 20 | | ENSCO International Incorporated | | | | | | | | | 697 |
| | | | | |
| 60 | | Exterran Holdings, Inc., (2) | | | | | | | | | 962 |
| | | | | |
| 30 | | Global Industries, Limited, (2) | | | | | | | | | 170 |
| | | | | |
| 50 | | Gulfmark Offshore Inc., (2) | | | | | | | | | 1,380 |
| | | | | | | | | | | |
| Shares | | Description (1) | | | | | | | | Value |
| | | | | | | | | | | |
| | Energy Equipment & Services (continued) | | | | | | | | | |
| | | | | |
| 290 | | Halliburton Company | | | | | | | | $ | 6,003 |
| | | | | |
| 40 | | Helix Energy Solutions Group, (2) | | | | | | | | | 435 |
| | | | | |
| 20 | | Hercules Offshore Inc., (2) | | | | | | | | | 79 |
| | | | | |
| 10 | | Lufkin Industries Inc. | | | | | | | | | 421 |
| | | | | |
| 20 | | Matrix Service Company, (2) | | | | | | | | | 230 |
| | | | | |
| 30 | | Natco Group, (2) | | | | | | | | | 988 |
| | | | | |
| 200 | | National-Oilwell Varco Inc., (2) | | | | | | | | | 6,532 |
| | | | | |
| 10 | | Natural Gas Services Group, (2) | | | | | | | | | 133 |
| | | | | |
| 30 | | Noble Corporation | | | | | | | | | 908 |
| | | | | |
| 50 | | Oceaneering International Inc., (2) | | | | | | | | | 2,260 |
| | | | | |
| 60 | | Oil States International Inc., (2) | | | | | | | | | 1,453 |
| | | | | |
| 30 | | PHI Inc Non-Voting, (2) | | | | | | | | | 514 |
| | | | | |
| 50 | | Pride International Inc., (2) | | | | | | | | | 1,253 |
| | | | | |
| 220 | | Schlumberger Limited | | | | | | | | | 11,904 |
| | | | | |
| 30 | | SeaCor Smit Inc., (2) | | | | | | | | | 2,257 |
| | | | | |
| 80 | | Smith International, Inc. | | | | | | | | | 2,060 |
| | | | | |
| 30 | | Superior Energy Services, Inc., (2) | | | | | | | | | 518 |
| | | | | |
| 70 | | Superior Well Services, Inc., (2) | | | | | | | | | 417 |
| | | | | |
| 40 | | Tidewater Inc. | | | | | | | | | 1,715 |
| | | | | |
| 10 | | Transocean Inc., (2) | | | | | | | | | 743 |
| | | | | |
| 40 | | Weatherford International Ltd, (2) | | | | | | | | | 782 |
| | | | | |
| 10 | | Willbros Group Inc., (2) | | | | | | | | | 125 |
| | Total Energy Equipment & Services | | | | | | | | | 54,924 |
| | Food & Staples Retailing – 2.1% | | | | | | | | | |
| | | | | |
| 30 | | Andersons, Inc. | | | | | | | | | 898 |
| | | | | |
| 10 | | Arden Group, Inc. | | | | | | | | | 1,251 |
| | | | | |
| 160 | | Costco Wholesale Corporation | | | | | | | | | 7,312 |
| | | | | |
| 610 | | CVS Caremark Corporation | | | | | | | | | 19,441 |
| | | | | |
| 20 | | Great Atlantic & Pacific Tea Company Inc., (2) | | | | | | | | | 85 |
| | | | | |
| 520 | | Kroger Co. | | | | | | | | | 11,466 |
| | | | | |
| 50 | | PriceSmart, Inc. | | | | | | | | | 838 |
| | | | | |
| 210 | | Safeway Inc. | | | | | | | | | 4,278 |
| | | | | |
| 170 | | Sysco Corporation | | | | | | | | | 3,822 |
| | | | | |
| 50 | | United Natural Foods Inc., (2) | | | | | | | | | 1,313 |
| | | | | |
| 10 | | Village Super Market, Inc. | | | | | | | | | 298 |
| | | | | |
| 270 | | Walgreen Co. | | | | | | | | | 7,938 |
| | | | | |
| 780 | | Wal-Mart Stores, Inc. | | | | | | | | | 37,783 |
| | | | | |
| 60 | | Weis Markets Inc. | | | | | | | | | 2,011 |
| | Total Food & Staples Retailing | | | | | | | | | 98,734 |
| | Food Products – 2.0% | | | | | | | | | |
| | | | | |
| 20 | | Alico Inc. | | | | | | | | | 600 |
| | | | | |
| 240 | | Archer-Daniels-Midland Company | | | | | | | | | 6,425 |
| | | | | |
| 40 | | Bunge Limited | | | | | | | | | 2,410 |
| | | | | |
| 20 | | Calavo Growers, Inc. | | | | | | | | | 397 |
| | | | | |
| 150 | | Campbell Soup Company | | | | | | | | | 4,413 |
Portfolio of Investments
Nuveen U.S. Equity Completeness Fund (continued)
June 30, 2009
| | | | | | | | | | | |
| Shares | | Description (1) | | | | | | | | Value |
| | | | | | | | | | | |
| | Food Products (continued) | | | | | | | | | |
| | | | | |
| 490 | | ConAgra Foods, Inc. | | | | | | | | $ | 9,339 |
| | | | | |
| 70 | | Darling International Inc., (2) | | | | | | | | | 462 |
| | | | | |
| 20 | | Del Monte Foods Company | | | | | | | | | 188 |
| | | | | |
| 20 | | Diamond Foods Inc. | | | | | | | | | 558 |
| | | | | |
| 30 | | Farmer Brothers Company | | | | | | | | | 686 |
| | | | | |
| 100 | | Flowers Foods Inc. | | | | | | | | | 2,184 |
| | | | | |
| 80 | | Fresh Del Monte Produce Inc., (2) | | | | | | | | | 1,301 |
| | | | | |
| 220 | | General Mills, Inc. | | | | | | | | | 12,324 |
| | | | | |
| 220 | | H.J. Heinz Company | | | | | | | | | 7,854 |
| | | | | |
| 10 | | Hain Celestial Group Inc., (2) | | | | | | | | | 156 |
| | | | | |
| 70 | | Hershey Foods Corporation | | | | | | | | | 2,520 |
| | | | | |
| 30 | | J&K Snack Foods Corporation | | | | | | | | | 1,077 |
| | | | | |
| 50 | | JM Smucker Company | | | | | | | | | 2,433 |
| | | | | |
| 90 | | Kellogg Company | | | | | | | | | 4,191 |
| | | | | |
| 630 | | Kraft Foods Inc. | | | | | | | | | 15,964 |
| | | | | |
| 30 | | Lancaster Colony Corporation | | | | | | | | | 1,322 |
| | | | | |
| 60 | | Lance, Inc. | | | | | | | | | 1,388 |
| | | | | |
| 60 | | Ralcorp Holdings Inc., (2) | | | | | | | | | 3,655 |
| | | | | |
| 30 | | Sanderson Farms Inc. | | | | | | | | | 1,350 |
| | | | | |
| 690 | | Sara Lee Corporation | | | | | | | | | 6,734 |
| | | | | |
| 60 | | Smithfield Foods, Inc., (2) | | | | | | | | | 838 |
| | | | | |
| 30 | | Tootsie Roll Industries Inc. | | | | | | | | | 681 |
| | | | | |
| 170 | | Zhongpin Inc., (2) | | | | | | | | | 1,761 |
| | Total Food Products | | | | | | | | | 93,211 |
| | Gas Utilities – 0.4% | | | | | | | | | |
| | | | | |
| 30 | | Atmos Energy Corporation | | | | | | | | | 751 |
| | | | | |
| 20 | | Energen Corporation | | | | | | | | | 798 |
| | | | | |
| 10 | | EQT Corporation | | | | | | | | | 349 |
| | | | | |
| 50 | | New Jersey Resources Corporation | | | | | | | | | 1,852 |
| | | | | |
| 70 | | Nicor Inc. | | | | | | | | | 2,423 |
| | | | | |
| 60 | | ONEOK, Inc. | | | | | | | | | 1,769 |
| | | | | |
| 100 | | Piedmont Natural Gas Company | | | | | | | | | 2,411 |
| | | | | |
| 60 | | Questar Corporation | | | | | | | | | 1,864 |
| | | | | |
| 90 | | South Jersey Industries Inc. | | | | | | | | | 3,140 |
| | | | | |
| 70 | | WGL Holdings Inc. | | | | | | | | | 2,241 |
| | Total Gas Utilities | | | | | | | | | 17,598 |
| | Health Care Equipment & Supplies – 2.3% | | | | | | | | | |
| | | | | |
| 10 | | Abaxis, Inc., (2) | | | | | | | | | 205 |
| | | | | |
| 120 | | Abiomed, Inc., (2) | | | | | | | | | 1,058 |
| | | | | |
| 150 | | Accuray, Inc., (2) | | | | | | | | | 1,001 |
| | | | | |
| 110 | | Align Technology, Inc., (2) | | | | | | | | | 1,166 |
| | | | | |
| 80 | | American Medical Systems Holdings, Inc., (2) | | | | | | | | | 1,264 |
| | | | | |
| 10 | | AngioDynamics, Inc., (2) | | | | | | | | | 133 |
| | | | | |
| 210 | | Baxter International, Inc. | | | | | | | | | 11,122 |
| | | | | |
| 10 | | Beckman Coulter, Inc. | | | | | | | | | 571 |
| | | | | | | | | | | |
| Shares | | Description (1) | | | | | | | | Value |
| | | | | | | | | | | |
| | Health Care Equipment & Supplies (continued) | | | | | | | | | |
| | | | | |
| 80 | | Becton, Dickinson and Company | | | | | | | | $ | 5,705 |
| | | | | |
| 480 | | Boston Scientific Corporation, (2) | | | | | | | | | 4,867 |
| | | | | |
| 20 | | C. R. Bard, Inc. | | | | | | | | | 1,489 |
| | | | | |
| 40 | | Conceptus Inc., (2) | | | | | | | | | 676 |
| | | | | |
| 170 | | Covidien PLC | | | | | | | | | 6,365 |
| | | | | |
| 30 | | CryoLife Inc., (2) | | | | | | | | | 166 |
| | | | | |
| 40 | | Cyberonics, (2) | | | | | | | | | 665 |
| | | | | |
| 30 | | Cynosure, Inc., (2) | | | | | | | | | 230 |
| | | | | |
| 50 | | DENTSPLY International Inc. | | | | | | | | | 1,526 |
| | | | | |
| 240 | | DexCom, Inc., (2) | | | | | | | | | 1,486 |
| | | | | |
| 40 | | Edwards Lifesciences Corporation, (2) | | | | | | | | | 2,721 |
| | | | | |
| 70 | | ev3, Inc., (2) | | | | | | | | | 750 |
| | | | | |
| 40 | | Exactech, Inc., (2) | | | | | | | | | 580 |
| | | | | |
| 30 | | Gen-Probe, Inc., (2) | | | | | | | | | 1,289 |
| | | | | |
| 130 | | Greatbatch, Inc., (2) | | | | | | | | | 2,939 |
| | | | | |
| 30 | | Haemonetics Corporation, (2) | | | | | | | | | 1,710 |
| | | | | |
| 70 | | Hologic Inc., (2) | | | | | | | | | 996 |
| | | | | |
| 140 | | Hospira Inc., (2) | | | | | | | | | 5,393 |
| | | | | |
| 10 | | ICU Medical, Inc., (2) | | | | | | | | | 412 |
| | | | | |
| 30 | | Idexx Labs Inc., (2) | | | | | | | | | 1,386 |
| | | | | |
| 90 | | Immucor, Inc., (2) | | | | | | | | | 1,238 |
| | | | | |
| 60 | | Insulet Corporation, (2) | | | | | | | | | 462 |
| | | | | |
| 20 | | Integra Lifesciences Holdings Corporation, (2) | | | | | | | | | 530 |
| | | | | |
| 110 | | Invacare Corporation | | | | | | | | | 1,942 |
| | | | | |
| 20 | | Inverness Medical Innovation, (2) | | | | | | | | | 712 |
| | | | | |
| 10 | | IRIS International, Inc., (2) | | | | | | | | | 118 |
| | | | | |
| 30 | | Kinetic Concepts Inc., (2) | | | | | | | | | 818 |
| | | | | |
| 80 | | Masimo Corporation, (2) | | | | | | | | | 1,929 |
| | | | | |
| 60 | | Medical Action Industries, Inc., (2) | | | | | | | | | 687 |
| | | | | |
| 260 | | Medtronic, Inc. | | | | | | | | | 9,071 |
| | | | | |
| 40 | | Meridian Bioscience, Inc. | | | | | | | | | 903 |
| | | | | |
| 50 | | Merit Medical Systems, Inc., (2) | | | | | | | | | 815 |
| | | | | |
| 70 | | Micrus Endovascular Corporation, (2) | | | | | | | | | 633 |
| | | | | |
| 90 | | Neogen Corporation, (2) | | | | | | | | | 2,608 |
| | | | | |
| 50 | | NuVasive, Inc., (2) | | | | | | | | | 2,230 |
| | | | | |
| 100 | | OraSure Technologies, Inc., (2) | | | | | | | | | 247 |
| | | | | |
| 30 | | Quidel Corporation, (2) | | | | | | | | | 437 |
| | | | | |
| 10 | | ResMed Inc., (2) | | | | | | | | | 407 |
| | | | | |
| 60 | | Saint Jude Medical Inc., (2) | | | | | | | | | 2,466 |
| | | | | |
| 30 | | Somanetics Corporation, (2) | | | | | | | | | 495 |
| | | | | |
| 80 | | SonoSite, Inc., (2) | | | | | | | | | 1,605 |
| | | | | |
| 130 | | Steris Corporation | | | | | | | | | 3,390 |
| | | | | |
| 120 | | Stryker Corporation | | | | | | | | | 4,769 |
| | | | | |
| 20 | | Surmodics Inc., (2) | | | | | | | | | 453 |
| | | | | |
| 10 | | Synovis Life Technologies, Inc., (2) | | | | | | | | | 208 |
Portfolio of Investments
Nuveen U.S. Equity Completeness Fund (continued)
June 30, 2009
| | | | | | | | | | | |
| Shares | | Description (1) | | | | | | | | Value |
| | | | | | | | | | | |
| | Health Care Equipment & Supplies (continued) | | | | | | | | | |
| | | | | |
| 10 | | Teleflex Inc. | | | | | | | | $ | 448 |
| | | | | |
| 120 | | Thoratec Corporation, (2) | | | | | | | | | 3,214 |
| | | | | |
| 30 | | Varian Medical Systems, Inc., (2) | | | | | | | | | 1,054 |
| | | | | |
| 180 | | Volcano Corporation, (2) | | | | | | | | | 2,516 |
| | | | | |
| 10 | | West Pharmaceutical Services Inc. | | | | | | | | | 349 |
| | | | | |
| 30 | | Wright Medical Group, Inc., (2) | | | | | | | | | 488 |
| | | | | |
| 120 | | Zimmer Holdings, Inc., (2) | | | | | | | | | 5,112 |
| | | | | |
| 20 | | Zoll Medical Corporation, (2) | | | | | | | | | 387 |
| | Total Health Care Equipment & Supplies | | | | | | | | | 110,612 |
| | Health Care Providers & Services – 2.3% | | | | | | | | | |
| | | | | |
| 100 | | Aetna Inc. | | | | | | | | | 2,505 |
| | | | | |
| 10 | | Air Methods Corporation, (2) | | | | | | | | | 274 |
| | | | | |
| 30 | | Almost Family, Inc., (2) | | | | | | | | | 783 |
| | | | | |
| 40 | | Amedisys, Inc., (2) | | | | | | | | | 1,321 |
| | | | | |
| 90 | | AmericGroup Corporation, (2) | | | | | | | | | 2,417 |
| | | | | |
| 80 | | AmerisourceBergen Corporation | | | | | | | | | 1,419 |
| | | | | |
| 40 | | AmSurg Corporation, (2) | | | | | | | | | 858 |
| | | | | |
| 10 | | Assisted Living Concepts Inc., (2) | | | | | | | | | 146 |
| | | | | |
| 30 | | Bio-Reference Laboratories, Inc., (2) | | | | | | | | | 948 |
| | | | | |
| 70 | | Brookdale Senior Living Inc. | | | | | | | | | 682 |
| | | | | |
| 90 | | Cardinal Health, Inc. | | | | | | | | | 2,750 |
| | | | | |
| 20 | | CardioNet Inc., (2) | | | | | | | | | 326 |
| | | | | |
| 70 | | Catalyst Health Soltuions Inc., (2) | | | | | | | | | 1,746 |
| | | | | |
| 60 | | Centene Corporation, (2) | | | | | | | | | 1,199 |
| | | | | |
| 30 | | Chemed Corporation | | | | | | | | | 1,184 |
| | | | | |
| 60 | | CIGNA Corporation | | | | | | | | | 1,445 |
| | | | | |
| 30 | | Community Health Systems Inc., (2) | | | | | | | | | 758 |
| | | | | |
| 20 | | Corvel Corporation, (2) | | | | | | | | | 455 |
| | | | | |
| 50 | | Coventry Health Care, Inc., (2) | | | | | | | | | 936 |
| | | | | |
| 20 | | Cross Country Healthcare, Inc., (2) | | | | | | | | | 137 |
| | | | | |
| 20 | | Emergency Medical Services Corporation, (2) | | | | | | | | | 736 |
| | | | | |
| 60 | | Emeritus Corporation, (2) | | | | | | | | | 793 |
| | | | | |
| 50 | | Express Scripts, Inc., (2) | | | | | | | | | 3,438 |
| | | | | |
| 50 | | Gentiva Health Services, Inc., (2) | | | | | | | | | 823 |
| | | | | |
| 120 | | Hanger Orthopedic Group Inc., (2) | | | | | | | | | 1,631 |
| | | | | |
| 520 | | Health Management Associates Inc., (2) | | | | | | | | | 2,569 |
| | | | | |
| 90 | | Health Net Inc., (2) | | | | | | | | | 1,400 |
| | | | | |
| 80 | | HealthSouth Corporation, (2) | | | | | | | | | 1,155 |
| | | | | |
| 120 | | HealthSpring, Inc., (2) | | | | | | | | | 1,303 |
| | | | | |
| 20 | | Healthways Inc., (2) | | | | | | | | | 269 |
| | | | | |
| 20 | | Henry Schein Inc., (2) | | | | | | | | | 959 |
| | | | | |
| 40 | | HMS Holdings Corporation, (2) | | | | | | | | | 1,629 |
| | | | | |
| 10 | | Humana Inc., (2) | | | | | | | | | 323 |
| | | | | |
| 20 | | Inventiv Health, Inc., (2) | | | | | | | | | 271 |
| | | | | |
| 10 | | IPC The Hospitalist Company, Inc., (2) | | | | | | | | | 267 |
| | | | | | | | | | | |
| Shares | | Description (1) | | | | | | | | Value |
| | | | | | | | | | | |
| | Health Care Providers & Services (continued) | | | | | | | | | |
| | | | | |
| 50 | | Laboratory Corporation of America Holdings, (2) | | | | | | | | $ | 3,390 |
| | | | | |
| 40 | | Landauer Inc. | | | | | | | | | 2,454 |
| | | | | |
| 70 | | LHC Group, Inc., (2) | | | | | | | | | 1,555 |
| | | | | |
| 40 | | Magellan Health Services, Inc., (2) | | | | | | | | | 1,313 |
| | | | | |
| 80 | | McKesson HBOC Inc. | | | | | | | | | 3,520 |
| | | | | |
| 20 | | Medax Inc., (2) | | | | | | | | | 843 |
| | | | | |
| 40 | | MedCath Corporation, (2) | | | | | | | | | 470 |
| | | | | |
| 130 | | Medco Health Solutions, Inc., (2) | | | | | | | | | 5,929 |
| | | | | |
| 30 | | Molina Healthcare Inc., (2) | | | | | | | | | 718 |
| | | | | |
| 80 | | MWI Veterinary Supply, Inc., (2) | | | | | | | | | 2,789 |
| | | | | |
| 100 | | Omnicare, Inc. | | | | | | | | | 2,576 |
| | | | | |
| 70 | | Owens and Minor Inc. | | | | | | | | | 3,067 |
| | | | | |
| 100 | | Patterson Companies, Inc., (2) | | | | | | | | | 2,170 |
| | | | | |
| 30 | | Pharmerica Corporation, (2) | | | | | | | | | 589 |
| | | | | |
| 90 | | PSS World Medical Inc., (2) | | | | | | | | | 1,666 |
| | | | | |
| 200 | | Psychiatric Solutions, Inc., (2) | | | | | | | | | 4,548 |
| | | | | |
| 60 | | Quest Diagnostics Incorporated | | | | | | | | | 3,386 |
| | | | | |
| 220 | | Sun Healthcare Group, Inc., (2) | | | | | | | | | 1,857 |
| | | | | |
| 150 | | Sunrise Assisted Living Inc., (2) | | | | | | | | | 248 |
| | | | | |
| 330 | | UnitedHealth Group Incorporated | | | | | | | | | 8,243 |
| | | | | |
| 10 | | Universal Health Services, Inc., Class B | | | | | | | | | 489 |
| | | | | |
| 40 | | US Physical Therapy, Inc., (2) | | | | | | | | | 590 |
| | | | | |
| 310 | | Wellpoint Inc., (2) | | | | | | | | | 15,776 |
| | Total Health Care Providers & Services | | | | | | | | | 108,041 |
| | Health Care Technology – 0.4% | | | | | | | | | |
| | | | | |
| 350 | | Allscripts Healthcare Solutions Inc., (2) | | | | | | | | | 5,551 |
| | | | | |
| 50 | | AthenaHealth Inc., (2) | | | | | | | | | 1,851 |
| | | | | |
| 50 | | Cerner Corporation, (2) | | | | | | | | | 3,115 |
| | | | | |
| 10 | | Computer Programs and Systems, Inc. | | | | | | | | | 383 |
| | | | | |
| 80 | | Eclipsys Corporation, (2) | | | | | | | | | 1,422 |
| | | | | |
| 80 | | IMS Health Incorporated | | | | | | | | | 1,016 |
| | | | | |
| 120 | | MedAssets Inc., (2) | | | | | | | | | 2,334 |
| | | | | |
| 150 | | Omnicell, Inc., (2) | | | | | | | | | 1,613 |
| | | | | |
| 60 | | Phase Forward, Inc., (2) | | | | | | | | | 907 |
| | | | | |
| 30 | | Quality Systems Inc. | | | | | | | | | 1,709 |
| | Total Health Care Technology | | | | | | | | | 19,901 |
| | Hotels, Restaurants & Leisure – 1.8% | | | | | | | | | |
| | | | | |
| 90 | | Ameristar Casinos, Inc. | | | | | | | | | 1,713 |
| | | | | |
| 80 | | Bally Technologies, Inc., (2) | | | | | | | | | 2,394 |
| | | | | |
| 140 | | BJ’s Restaurants, Inc., (2) | | | | | | | | | 2,362 |
| | | | | |
| 30 | | Boyd Gaming Corporation, (2) | | | | | | | | | 255 |
| | | | | |
| 240 | | Brinker International Inc. | | | | | | | | | 4,087 |
| | | | | |
| 30 | | Buffalo Wild Wings, Inc., (2) | | | | | | | | | 976 |
| | | | | |
| 120 | | California Pizza Kitchen, Inc., (2) | | | | | | | | | 1,595 |
| | | | | |
| 280 | | Carnival Corporation | | | | | | | | | 7,216 |
Portfolio of Investments
Nuveen U.S. Equity Completeness Fund (continued)
June 30, 2009
| | | | | | | | | | | |
| Shares | | Description (1) | | | | | | | | Value |
| | | | | | | | | | | |
| | Hotels, Restaurants & Leisure (continued) | | | | | | | | | |
| | | | | |
| 90 | | CBRL Group Inc. | | | | | | | | $ | 2,511 |
| | | | | |
| 100 | | Cheesecake Factory Inc., (2) | | | | | | | | | 1,730 |
| | | | | |
| 30 | | Chipotle Mexican Grill, (2) | | | | | | | | | 2,400 |
| | | | | |
| 90 | | Choice Hotels International, Inc. | | | | | | | | | 2,395 |
| | | | | |
| 180 | | CKE Restaurants | | | | | | | | | 1,526 |
| | | | | |
| 170 | | Darden Restaurants, Inc. | | | | | | | | | 5,607 |
| | | | | |
| 20 | | Dominos Pizza Inc., (2) | | | | | | | | | 150 |
| | | | | |
| 10 | | Einstein Noah Restaurant Group, (2) | | | | | | | | | 87 |
| | | | | |
| 30 | | International Game Technology | | | | | | | | | 477 |
| | | | | |
| 490 | | Krispy Kreme Doughnuts Inc., (2) | | | | | | | | | 1,470 |
| | | | | |
| 10 | | Life Time Fitness Inc., (2) | | | | | | | | | 200 |
| | | | | |
| 130 | | Marcus Corporation | | | | | | | | | 1,368 |
| | | | | |
| 120 | | Marriott International, Inc., Class A | | | | | | | | | 2,658 |
| | | | | |
| 320 | | McDonald’s Corporation | | | | | | | | | 18,397 |
| | | | | |
| 10 | | MGM Mirage Inc., (2) | | | | | | | | | 64 |
| | | | | |
| 100 | | Monarch Casino & Resort, Inc., (2) | | | | | | | | | 730 |
| | | | | |
| 30 | | P.F. Changs China Bistro, Inc., (2) | | | | | | | | | 962 |
| | | | | |
| 30 | | Papa John’s International, Inc., (2) | | | | | | | | | 744 |
| | | | | |
| 10 | | Peets Coffee and Tea Inc., (2) | | | | | | | | | 252 |
| | | | | |
| 90 | | Penn National Gaming, Inc., (2) | | | | | | | | | 2,620 |
| | | | | |
| 40 | | Pinnacle Entertainment Inc., (2) | | | | | | | | | 372 |
| | | | | |
| 10 | | Red Robin Gourmet Burgers, Inc., (2) | | | | | | | | | 188 |
| | | | | |
| 350 | | Royal Caribbean Cruises Limited | | | | | | | | | 4,739 |
| | | | | |
| 360 | | Ruby Tuesday, Inc., (2) | | | | | | | | | 2,398 |
| | | | | |
| 30 | | Scientific Games Corporation, (2) | | | | | | | | | 473 |
| | | | | |
| 10 | | Speedway Motorsports Inc. | | | | | | | | | 138 |
| | | | | |
| 190 | | Starbucks Corporation, (2) | | | | | | | | | 2,639 |
| | | | | |
| 10 | | Starwood Hotels & Resorts Worldwide, Inc. | | | | | | | | | 222 |
| | | | | |
| 110 | | Tim Hortons Inc. | | | | | | | | | 2,699 |
| | | | | |
| 50 | | WMS Industries Inc., (2) | | | | | | | | | 1,576 |
| | | | | |
| 120 | | YUM! Brands, Inc. | | | | | | | | | 4,001 |
| | Total Hotels, Restaurants & Leisure | | | | | | | | | 86,391 |
| | Household Durables – 0.6% | | | | | | | | | |
| | | | | |
| 20 | | Beazer Homes USA, Inc., (2) | | | | | | | | | 37 |
| | | | | |
| 30 | | Cavco Industries, Inc., (2) | | | | | | | | | 760 |
| | | | | |
| 30 | | Centex Corporation | | | | | | | | | 254 |
| | | | | |
| 20 | | CSS Industries Inc. | | | | | | | | | 408 |
| | | | | |
| 170 | | D.R. Horton, Inc. | | | | | | | | | 1,591 |
| | | | | |
| 100 | | Fortune Brands Inc. | | | | | | | | | 3,474 |
| | | | | |
| 170 | | Hovnanian Enterprises Inc., (2) | | | | | | | | | 401 |
| | | | | |
| 40 | | KB Home | | | | | | | | | 547 |
| | | | | |
| 200 | | Leggett and Platt Inc. | | | | | | | | | 3,046 |
| | | | | |
| 200 | | Lennar Corporation, Class A | | | | | | | | | 1,938 |
| | | | | |
| 50 | | M/I Homes, Inc. | | | | | | | | | 490 |
| | | | | |
| 10 | | MDC Holdings Inc. | | | | | | | | | 301 |
| | | | | | | | | | | |
| Shares | | Description (1) | | | | | | | | Value |
| | | | | | | | | | | |
| | Household Durables (continued) | | | | | | | | | |
| | | | | |
| 100 | | Meritage Corporation, (2) | | | | | | | | $ | 1,886 |
| | | | | |
| 20 | | National Presto Industries Inc. | | | | | | | | | 1,522 |
| | | | | |
| 70 | | Newell Rubbermaid Inc. | | | | | | | | | 729 |
| | | | | |
| 10 | | Ryland Group Inc. | | | | | | | | | 168 |
| | | | | |
| 10 | | Skyline Corporation | | | | | | | | | 218 |
| | | | | |
| 430 | | Tempur Pedic International Inc. | | | | | | | | | 5,620 |
| | | | | |
| 120 | | Toll Brothers Inc., (2) | | | | | | | | | 2,036 |
| | | | | |
| 150 | | Tupperware Corporation | | | | | | | | | 3,903 |
| | Total Household Durables | | | | | | | | | 29,329 |
| | Household Products – 1.7% | | | | | | | | | |
| | | | | |
| 10 | | Church & Dwight Company Inc. | | | | | | | | | 543 |
| | | | | |
| 100 | | Clorox Company | | | | | | | | | 5,583 |
| | | | | |
| 120 | | Colgate-Palmolive Company | | | | | | | | | 8,489 |
| | | | | |
| 10 | | Energizer Holdings Inc., (2) | | | | | | | | | 522 |
| | | | | |
| 280 | | Kimberly-Clark Corporation | | | | | | | | | 14,680 |
| | | | | |
| 1,000 | | Procter & Gamble Company | | | | | | | | | 51,100 |
| | Total Household Products | | | | | | | | | 80,917 |
| | Independent Power Producers & Energy Traders – 0.2% | | | | | | | | | |
| | | | | |
| 90 | | AES Corporation, (2) | | | | | | | | | 1,045 |
| | | | | |
| 10 | | Calpine Corporation, (2) | | | | | | | | | 112 |
| | | | | |
| 100 | | Constellation Energy Group | | | | | | | | | 2,658 |
| | | | | |
| 350 | | Mirant Corporation, (2) | | | | | | | | | 5,509 |
| | | | | |
| 30 | | NRG Energy Inc., (2) | | | | | | | | | 779 |
| | Total Independent Power Producers & Energy Traders | | | | | | | | | 10,103 |
| | Industrial Conglomerates – 2.1% | | | | | | | | | |
| | | | | |
| 210 | | 3M Co. | | | | | | | | | 12,621 |
| | | | | |
| 6,960 | | General Electric Company | | | | | | | | | 81,571 |
| | | | | |
| 70 | | Otter Tail Power Corporation | | | | | | | | | 1,529 |
| | | | | |
| 50 | | Standex International Corporation | | | | | | | | | 580 |
| | | | | |
| 50 | | Tyco International Ltd. | | | | | | | | | 1,299 |
| | Total Industrial Conglomerates | | | | | | | | | 97,600 |
| | Insurance – 2.9% | | | | | | | | | |
| | | | | |
| 10 | | Ace Limited | | | | | | | | | 442 |
| | | | | |
| 130 | | AFLAC Incorporated | | | | | | | | | 4,042 |
| | | | | |
| 10 | | Alleghany Corporation, Term Loan, (2) | | | | | | | | | 2,710 |
| | | | | |
| 190 | | Allstate Corporation | | | | | | | | | 4,636 |
| | | | | |
| 250 | | American Equity Investment Life Holding Company | | | | | | | | | 1,395 |
| | | | | |
| 70 | | American Safety Insurance Holdings, (2) | | | | | | | | | 953 |
| | | | | |
| 10 | | Amerisafe, Inc., (2) | | | | | | | | | 156 |
| | | | | |
| 20 | | Amtrust Financial Services, Inc. | | | | | | | | | 228 |
| | | | | |
| 160 | | Aon Corporation | | | | | | | | | 6,059 |
| | | | | |
| 20 | | Arch Capital Group Limited, (2) | | | | | | | | | 1,172 |
| | | | | |
| 40 | | Argo Group International Holdings Inc., (2) | | | | | | | | | 1,129 |
| | | | | |
| 70 | | Arthur J. Gallagher & Co. | | | | | | | | | 1,494 |
| | | | | |
| 100 | | Aspen Insurance Holdings Limited | | | | | | | | | 2,234 |
Portfolio of Investments
Nuveen U.S. Equity Completeness Fund (continued)
June 30, 2009
| | | | | | | | | | | |
| Shares | | Description (1) | | | | | | | | Value |
| | | | | | | | | | | |
| | Insurance (continued) | | | | | | | | | |
| | | | | |
| 40 | | Assurant Inc. | | | | | | | | $ | 964 |
| | | | | |
| 70 | | Axis Capital Holdings Limited | | | | | | | | | 1,833 |
| | | | | |
| 50 | | Baldwin & Lyons, Class B | | | | | | | | | 985 |
| | | | | |
| 20 | | Brown & Brown Inc. | | | | | | | | | 399 |
| | | | | |
| 190 | | Chubb Corporation | | | | | | | | | 7,577 |
| | | | | |
| 110 | | Cincinnati Financial Corporation | | | | | | | | | 2,459 |
| | | | | |
| 20 | | CNA Financial Corporation | | | | | | | | | 309 |
| | | | | |
| 40 | | Delphi Financial Group, Inc. | | | | | | | | | 777 |
| | | | | |
| 70 | | eHealth, Inc., (2) | | | | | | | | | 1,236 |
| | | | | |
| 10 | | EMC Insurance Group Inc. | | | | | | | | | 208 |
| | | | | |
| 60 | | Endurance Specialty Holdings, Limited | | | | | | | | | 1,758 |
| | | | | |
| 20 | | Enstar Group, Limited, (2) | | | | | | | | | 1,177 |
| | | | | |
| 50 | | Erie Indemnity Company | | | | | | | | | 1,788 |
| | | | | |
| 30 | | Everest Reinsurance Group Ltd | | | | | | | | | 2,147 |
| | | | | |
| 160 | | Fidelity National Title Group Inc., Class A | | | | | | | | | 2,165 |
| | | | | |
| 50 | | First American Corporation | | | | | | | | | 1,296 |
| | | | | |
| 120 | | First Mercury Financial Corporation | | | | | | | | | 1,652 |
| | | | | |
| 30 | | Hartford Financial Services Group, Inc. | | | | | | | | | 356 |
| | | | | |
| 60 | | HCC Insurance Holdings Inc. | | | | | | | | | 1,441 |
| | | | | |
| 40 | | Hilltop Holdings Inc., (2) | | | | | | | | | 475 |
| | | | | |
| 10 | | Horace Mann Educators Corporation | | | | | | | | | 100 |
| | | | | |
| 60 | | IPC Holdings Limited | | | | | | | | | 1,640 |
| | | | | |
| 10 | | Kansas City Life Insurance Company | | | | | | | | | 269 |
| | | | | |
| 60 | | Lincoln National Corporation | | | | | | | | | 1,033 |
| | | | | |
| 110 | | Loews Corporation | | | | | | | | | 3,014 |
| | | | | |
| 10 | | Markel Corporation, (2) | | | | | | | | | 2,817 |
| | | | | |
| 280 | | Marsh & McLennan Companies, Inc. | | | | | | | | | 5,636 |
| | | | | |
| 50 | | Max Capital Group Limited | | | | | | | | | 923 |
| | | | | |
| 170 | | Meadowbrook Insurance Group, Inc. | | | | | | | | | 1,110 |
| | | | | |
| 190 | | MetLife, Inc. | | | | | | | | | 5,702 |
| | | | | |
| 70 | | Montpelier Re Holdings Limited | | | | | | | | | 930 |
| | | | | |
| 10 | | Navigators Group, Inc., (2) | | | | | | | | | 444 |
| | | | | |
| 410 | | Old Republic International Corporation | | | | | | | | | 4,039 |
| | | | | |
| 40 | | PartnerRe Limited | | | | | | | | | 2,598 |
| | | | | |
| 60 | | Platinum Underwriters Holdings Limited | | | | | | | | | 1,715 |
| | | | | |
| 140 | | PMA Capital Corporation, Class A, (2) | | | | | | | | | 637 |
| | | | | |
| 60 | | Principal Financial Group, Inc. | | | | | | | | | 1,130 |
| | | | | |
| 40 | | ProAssurance Corporation, (2) | | | | | | | | | 1,848 |
| | | | | |
| 320 | | Progressive Corporation, (2) | | | | | | | | | 4,835 |
| | | | | |
| 10 | | Protective Life Corporation | | | | | | | | | 114 |
| | | | | |
| 60 | | Prudential Financial, Inc. | | | | | | | | | 2,233 |
| | | | | |
| 40 | | RenaisasnceRE Holdings, Limited | | | | | | | | | 1,862 |
| | | | | |
| 70 | | RLI Corporation | | | | | | | | | 3,136 |
| | | | | |
| 90 | | Selective Insurance Group Inc. | | | | | | | | | 1,149 |
| | | | | |
| 10 | | Stewart Information Services Corporation | | | | | | | | | 143 |
| | | | | | | | | | | |
| Shares | | Description (1) | | | | | | | | Value |
| | | | | | | | | | | |
| | Insurance (continued) | | | | | | | | | |
| | | | | |
| 10 | | Torchmark Corporation | | | | | | | | $ | 370 |
| | | | | |
| 60 | | Tower Group Inc. | | | | | | | | | 1,487 |
| | | | | |
| 360 | | Travelers Companies, Inc. | | | | | | | | | 14,774 |
| | | | | |
| 50 | | Unitrin, Inc. | | | | | | | | | 601 |
| | | | | |
| 410 | | Unum Group | | | | | | | | | 6,503 |
| | | | | |
| 70 | | Valdius Holdings Limited | | | | | | | | | 1,539 |
| | | | | |
| 70 | | WR Berkley Corporation | | | | | | | | | 1,503 |
| | | | | |
| 300 | | XL Capital Ltd, Class A | | | | | | | | | 3,438 |
| | | | | |
| 60 | | Zenith National Insurance Corp. | | | | | | | | | 1,304 |
| | Total Insurance | | | | | | | | | 138,228 |
| | Internet & Catalog Retail – 0.4% | | | | | | | | | |
| | | | | |
| 70 | | 1-800-Flowers, (2) | | | | | | | | | 134 |
| | | | | |
| 150 | | Amazon.com, Inc., (2) | | | | | | | | | 12,549 |
| | | | | |
| 30 | | Blue Nile Inc., (2) | | | | | | | | | 1,290 |
| | | | | |
| 30 | | Expedia, Inc., (2) | | | | | | | | | 453 |
| | | | | |
| 60 | | Liberty Media Holding Corporation Interactive, Class A, (2) | | | | | | | | | 301 |
| | | | | |
| 60 | | NetFlix.com Inc., (2) | | | | | | | | | 2,480 |
| | | | | |
| 50 | | Nutri System Inc. | | | | | | | | | 725 |
| | | | | |
| 120 | | Overstock.com, Inc., (2) | | | | | | | | | 1,435 |
| | Total Internet & Catalog Retail | | | | | | | | | 19,367 |
| | Internet Software & Services – 1.2% | | | | | | | | | |
| | | | | |
| 20 | | Akamai Technologies, Inc., (2) | | | | | | | | | 384 |
| | | | | |
| 10 | | Bankrate Inc., (2) | | | | | | | | | 252 |
| | | | | |
| 40 | | ComScore Inc., (2) | | | | | | | | | 533 |
| | | | | |
| 40 | | DealerTrack Holdings, Inc., (2) | | | | | | | | | 680 |
| | | | | |
| 60 | | Digital River, Inc., (2) | | | | | | | | | 2,179 |
| | | | | |
| 170 | | Earthlink, Inc., (2) | | | | | | | | | 1,260 |
| | | | | |
| 310 | | eBay Inc., (2) | | | | | | | | | 5,310 |
| | | | | |
| 40 | | Google Inc., Class A, (2) | | | | | | | | | 16,864 |
| | | | | |
| 260 | | Internap Network Services Corporation, (2) | | | | | | | | | 907 |
| | | | | |
| 30 | | Internet Brands, Inc., (2) | | | | | | | | | 210 |
| | | | | |
| 90 | | j2 Global Communications, Inc., (2) | | | | | | | | | 2,030 |
| | | | | |
| 160 | | Mercadolibre, Inc., (2) | | | | | | | | | 4,301 |
| | | | | |
| 60 | | ModusLink Global Solutions Inc., (2) | | | | | | | | | 412 |
| | | | | |
| 280 | | NIC, Incorporated, (2) | | | | | | | | | 1,896 |
| | | | | |
| 100 | | Omniture, Inc., (2) | | | | | | | | | 1,256 |
| | | | | |
| 290 | | Perficient, Inc., (2) | | | | | | | | | 2,027 |
| | | | | |
| 240 | | Savvis Inc., (2) | | | | | | | | | 2,750 |
| | | | | |
| 80 | | Sohu.com Inc., (2) | | | | | | | | | 5,026 |
| | | | | |
| 80 | | The Knot, Inc., (2) | | | | | | | | | 630 |
| | | | | |
| 80 | | ValueClick, Inc., (2) | | | | | | | | | 842 |
| | | | | |
| 10 | | VeriSign, Inc., (2) | | | | | | | | | 185 |
| | | | | |
| 110 | | VistaPrint, Limited, (2) | | | | | | | | | 4,692 |
| | | | | |
| 240 | | Yahoo! Inc., (2) | | | | | | | | | 3,758 |
| | Total Internet Software & Services | | | | | | | | | 58,384 |
Portfolio of Investments
Nuveen U.S. Equity Completeness Fund (continued)
June 30, 2009
| | | | | | | | | | | |
| Shares | | Description (1) | | | | | | | | Value |
| | | | | | | | | | | |
| | IT Services – 1.5% | | | | | | | | | |
| | | | | |
| 140 | | Accenture Limited | | | | | | | | $ | 4,684 |
| | | | | |
| 120 | | Acxiom Corporation | | | | | | | | | 1,060 |
| | | | | |
| 50 | | Affiliated Computer Services, Inc., (2) | | | | | | | | | 2,221 |
| | | | | |
| 10 | | Alliance Data Systems Corporation, (2) | | | | | | | | | 412 |
| | | | | |
| 170 | | Automatic Data Processing, Inc. | | | | | | | | | 6,025 |
| | | | | |
| 10 | | Broadridge Financial Solutions, Inc. | | | | | | | | | 166 |
| | | | | |
| 50 | | CACI International Inc., (2) | | | | | | | | | 2,136 |
| | | | | |
| 240 | | Ciber, Inc., (2) | | | | | | | | | 744 |
| | | | | |
| 60 | | Cognizant Technology Solutions Corporation, Class A, (2) | | | | | | | | | 1,602 |
| | | | | |
| 80 | | Computer Sciences Corporation, (2) | | | | | | | | | 3,544 |
| | | | | |
| 20 | | Convergys Corporation, (2) | | | | | | | | | 186 |
| | | | | |
| 60 | | CSG Systems International Inc., (2) | | | | | | | | | 794 |
| | | | | |
| 30 | | Cybersource Corporation, (2) | | | | | | | | | 459 |
| | | | | |
| 10 | | DST Systems Inc., (2) | | | | | | | | | 370 |
| | | | | |
| 70 | | Fidelity National Information Services | | | | | | | | | 1,397 |
| | | | | |
| 90 | | Fiserv, Inc., (2) | | | | | | | | | 4,113 |
| | | | | |
| 50 | | Forrester Research, Inc., (2) | | | | | | | | | 1,228 |
| | | | | |
| 240 | | Gartner Inc., (2) | | | | | | | | | 3,662 |
| | | | | |
| 50 | | Heartland Payment Systems Inc. | | | | | | | | | 479 |
| | | | | |
| 10 | | Lender Processing Services Inc. | | | | | | | | | 278 |
| | | | | |
| 30 | | ManTech International Corporation, Class A, (2) | | | | | | | | | 1,291 |
| | | | | |
| 20 | | MasterCard, Inc. | | | | | | | | | 3,346 |
| | | | | |
| 50 | | Maximus Inc. | | | | | | | | | 2,063 |
| | | | | |
| 30 | | Online Resources Corporation, (2) | | | | | | | | | 187 |
| | | | | |
| 90 | | Paychex, Inc. | | | | | | | | | 2,268 |
| | | | | |
| 240 | | Perot Systems Corporation, (2) | | | | | | | | | 3,439 |
| | | | | |
| 90 | | SAIC, Inc., (2) | | | | | | | | | 1,670 |
| | | | | |
| 290 | | Sapient Corporation, (2) | | | | | | | | | 1,824 |
| | | | | |
| 120 | | SRA International, Inc., (2) | | | | | | | | | 2,107 |
| | | | | |
| 10 | | Syntel Inc. | | | | | | | | | 314 |
| | | | | |
| 120 | | TeleTech Holdings, Inc., (2) | | | | | | | | | 1,818 |
| | | | | |
| 50 | | TNS Inc., (2) | | | | | | | | | 938 |
| | | | | |
| 50 | | VeriFone Holdings Inc., (2) | | | | | | | | | 376 |
| | | | | |
| 120 | | Visa Inc. | | | | | | | | | 7,471 |
| | | | | |
| 360 | | Western Union Company | | | | | | | | | 5,904 |
| | Total IT Services | | | | | | | | | 70,576 |
| | Leisure Equipment & Products – 0.2% | | | | | | | | | |
| | | | | |
| 270 | | Brunswick Corporation | | | | | | | | | 1,166 |
| | | | | |
| 1,370 | | Eastman Kodak Company | | | | | | | | | 4,055 |
| | | | | |
| 40 | | Hasbro, Inc. | | | | | | | | | 970 |
| | | | | |
| 30 | | JAKKS Pacific Inc., (2) | | | | | | | | | 385 |
| | | | | |
| 150 | | Mattel, Inc. | | | | | | | | | 2,408 |
| | | | | |
| 40 | | RC2 Corporation, (2) | | | | | | | | | 529 |
| | Total Leisure Equipment & Products | | | | | | | | | 9,513 |
| | | | | | | | | | | |
| Shares | | Description (1) | | | | | | | | Value |
| | | | | | | | | | | |
| | Life Sciences Tools & Services – 0.6% | | | | | | | | | |
| | | | | |
| 20 | | AMAG Pharmaceuticals Inc., (2) | | | | | | | | $ | 1,093 |
| | | | | |
| 30 | | Bio-Rad Laboratories Inc., (2) | | | | | | | | | 2,264 |
| | | | | |
| 30 | | Cambrex Corporation, (2) | | | | | | | | | 124 |
| | | | | |
| 30 | | Clinical Data, Inc., (2) | | | | | | | | | 331 |
| | | | | |
| 30 | | Dionex Corporation, (2) | | | | | | | | | 1,831 |
| | | | | |
| 20 | | Enzo Biochem Inc., (2) | | | | | | | | | 89 |
| | | | | |
| 130 | | Exelixis, Inc., (2) | | | | | | | | | 633 |
| | | | | |
| 100 | | Illumina Inc., (2) | | | | | | | | | 3,894 |
| | | | | |
| 60 | | Life Technologies Corporation, (2) | | | | | | | | | 2,503 |
| | | | | |
| 80 | | Luminex Corporation, (2) | | | | | | | | | 1,483 |
| | | | | |
| 20 | | Millipore Corporation, (2) | | | | | | | | | 1,404 |
| | | | | |
| 250 | | Thermo Fisher Scientific, Inc., (2) | | | | | | | | | 10,193 |
| | | | | |
| 50 | | Varian Inc., (2) | | | | | | | | | 1,972 |
| | | | | |
| 10 | | Waters Corporation, (2) | | | | | | | | | 515 |
| | Total Life Sciences Tools & Services | | | | | | | | | 28,329 |
| | Machinery – 1.7% | | | | | | | | | |
| | | | | |
| 110 | | American Railcar Industries | | | | | | | | | 909 |
| | | | | |
| 50 | | Astecx Industries Inc., (2) | | | | | | | | | 1,485 |
| | | | | |
| 30 | | Badger Meter Inc. | | | | | | | | | 1,230 |
| | | | | |
| 60 | | Barnes Group Inc. | | | | | | | | | 713 |
| | | | | |
| 30 | | Blount International Inc., (2) | | | | | | | | | 258 |
| | | | | |
| 10 | | Bucyrus International, Inc. | | | | | | | | | 286 |
| | | | | |
| 220 | | Caterpillar Inc. | | | | | | | | | 7,269 |
| | | | | |
| 150 | | China Fire & Security Group Inc., (2) | | | | | | | | | 1,826 |
| | | | | |
| 50 | | CLARCOR, Inc. | | | | | | | | | 1,460 |
| | | | | |
| 20 | | Columbus McKinnon Corporation NY, (2) | | | | | | | | | 253 |
| | | | | |
| 40 | | Crane Company | | | | | | | | | 892 |
| | | | | |
| 80 | | Cummins Inc. | | | | | | | | | 2,817 |
| | | | | |
| 60 | | Danaher Corporation | | | | | | | | | 3,704 |
| | | | | |
| 110 | | Deere & Company | | | | | | | | | 4,395 |
| | | | | |
| 10 | | Donaldson Company, Inc. | | | | | | | | | 346 |
| | | | | |
| 10 | | Dover Corporation | | | | | | | | | 331 |
| | | | | |
| 50 | | Dynamic Material Corporation | | | | | | | | | 964 |
| | | | | |
| 70 | | Eaton Corporation | | | | | | | | | 3,123 |
| | | | | |
| 50 | | EnPro Industries Inc., (2) | | | | | | | | | 901 |
| | | | | |
| 60 | | ESCO Technologies Inc., (2) | | | | | | | | | 2,688 |
| | | | | |
| 40 | | Federal Signal Corporation | | | | | | | | | 306 |
| | | | | |
| 50 | | Gorman-Rupp Company | | | | | | | | | 1,009 |
| | | | | |
| 40 | | Graham Corporation | | | | | | | | | 532 |
| | | | | |
| 90 | | Harsco Corporation | | | | | | | | | 2,547 |
| | | | | |
| 180 | | Illinois Tool Works, Inc. | | | | | | | | | 6,721 |
| | | | | |
| 90 | | Ingersoll Rand Company Limited, Class A | | | | | | | | | 1,881 |
| | | | | |
| 10 | | Joy Global Inc. | | | | | | | | | 357 |
| | | | | |
| 180 | | Kennametal Inc. | | | | | | | | | 3,452 |
| | | | | |
| 10 | | Key Technology, Inc., (2) | | | | | | | | | 99 |
Portfolio of Investments
Nuveen U.S. Equity Completeness Fund (continued)
June 30, 2009
| | | | | | | | | | | |
| Shares | | Description (1) | | | | | | | | Value |
| | | | | | | | | | | |
| | Machinery (continued) | | | | | | | | | |
| | | | | |
| 60 | | LB Foster Company, (2) | | | | | | | | $ | 1,804 |
| | | | | |
| 30 | | Lincoln Electric Holdings Inc. | | | | | | | | | 1,081 |
| | | | | |
| 110 | | Met-Pro Corp. | | | | | | | | | 1,190 |
| | | | | |
| 60 | | Mueller Industries Inc. | | | | | | | | | 1,248 |
| | | | | |
| 130 | | Nordson Corporation | | | | | | | | | 5,026 |
| | | | | |
| 130 | | PACCAR Inc. | | | | | | | | | 4,226 |
| | | | | |
| 50 | | Parker Hannifin Corporation | | | | | | | | | 2,148 |
| | | | | |
| 90 | | Sun Hydraulics Corporation | | | | | | | | | 1,455 |
| | | | | |
| 60 | | Tecumseh Products Company, Class A, (2) | | | | | | | | | 583 |
| | | | | |
| 70 | | Tennant Company | | | | | | | | | 1,287 |
| | | | | |
| 20 | | Terex Corporation, (2) | | | | | | | | | 241 |
| | | | | |
| 50 | | Timken Company | | | | | | | | | 854 |
| | | | | |
| 200 | | Trinity Industries Inc. | | | | | | | | | 2,724 |
| | | | | |
| 60 | | Wabtec Corporation | | | | | | | | | 1,930 |
| | | | | |
| 120 | | Watts Water Technologies, Inc. | | | | | | | | | 2,585 |
| | Total Machinery | | | | | | | | | 81,136 |
| | Marine – 0.0% | | | | | | | | | |
| | | | | |
| 10 | | American Commercial Lines Inc., (2) | | | | | | | | | 155 |
| | | | | |
| 160 | | Eagle Bulk Shipping Inc. | | | | | | | | | 750 |
| | | | | |
| 10 | | Kirby Corporation, (2) | | | | | | | | | 318 |
| | | | | |
| 90 | | TBS International Limited, Class A Shares, (2) | | | | | | | | | 703 |
| | Total Marine | | | | | | | | | 1,926 |
| | Media – 2.7% | | | | | | | | | |
| | | | | |
| 60 | | Arbitron Inc. | | | | | | | | | 953 |
| | | | | |
| 360 | | Cablevision Systems Corporation | | | | | | | | | 6,988 |
| | | | | |
| 1,090 | | CBS Corporation, Class B | | | | | | | | | 7,543 |
| | | | | |
| 1,210 | | Comcast Corporation, Class A | | | | | | | | | 17,533 |
| | | | | |
| 230 | | DIRECTV Group, Inc., (2) | | | | | | | | | 5,683 |
| | | | | |
| 20 | | Dreamworks Animation SKG Inc., (2) | | | | | | | | | 552 |
| | | | | |
| 30 | | Echostar Communications Corporation, Variable Prepaid Forward, (2) | | | | | | | | | 486 |
| | | | | |
| 50 | | Gannett Company Inc. | | | | | | | | | 179 |
| | | | | |
| 10 | | Lamar Advertising Company, (2) | | | | | | | | | 153 |
| | | | | |
| 50 | | Liberty Global Inc, A Shares, (2) | | | | | �� | | | | 795 |
| | | | | |
| 210 | | Liberty Media Corporation, Entertainment Tracking Shares, Class A, (2) | | | | | | | | | 5,618 |
| | | | | |
| 170 | | Live Nation Inc., (2) | | | | | | | | | 826 |
| | | | | |
| 80 | | Marvel Entertainment Inc., (2) | | | | | | | | | 2,847 |
| | | | | |
| 110 | | McGraw-Hill Companies, Inc. | | | | | | | | | 3,312 |
| | | | | |
| 280 | | MediaCom Communications Corporation, (2) | | | | | | | | | 1,431 |
| | | | | |
| 70 | | National CineMedia, Inc. | | | | | | | | | 963 |
| | | | | |
| 100 | | New York Times, Class A | | | | | | | | | 551 |
| | | | | |
| 810 | | News Corporation, Class A | | | | | | | | | 7,379 |
| | | | | |
| 80 | | Omnicom Group, Inc. | | | | | | | | | 2,526 |
| | | | | |
| 20 | | Scripps Networks Interactive, Class A Shares | | | | | | | | | 557 |
| | | | | |
| 40 | | Sinclair Broadcast Group, Series A | | | | | | | | | 78 |
| | | | | |
| 180 | | Time Warner Cable, Class A, (2) | | | | | | | | | 5,701 |
| | | | | | | | | | | |
| Shares | | Description (1) | | | | | | | | Value |
| | | | | | | | | | | |
| | Media (continued) | | | | | | | | | |
| | | | | |
| 1,040 | | Time Warner Inc. | | | | | | | | $ | 26,198 |
| | | | | |
| 230 | | Viacom Inc., Class B, (2) | | | | | | | | | 5,221 |
| | | | | |
| 60 | | Virgin Media, Inc. | | | | | | | | | 561 |
| | | | | |
| 790 | | Walt Disney Company | | | | | | | | | 18,431 |
| | | | | |
| 10 | | Washington Post Company | | | | | | | | | 3,522 |
| | | | | |
| 30 | | World Wrestling Entertainment Inc. | | | | | | | | | 377 |
| | Total Media | | | | | | | | | 126,964 |
| | Metals & Mining – 0.8% | | | | | | | | | |
| | | | | |
| 810 | | Alcoa Inc. | | | | | | | | | 8,367 |
| | | | | |
| 20 | | Allegheny Technologies, Inc. | | | | | | | | | 699 |
| | | | | |
| 20 | | AMCOL International Corp. | | | | | | | | | 432 |
| | | | | |
| 60 | | Brush Engineered Material, (2) | | | | | | | | | 1,005 |
| | | | | |
| 20 | | Cliffs Natural Resources Inc. | | | | | | | | | 489 |
| | | | | |
| 40 | | Compass Minerals International, Inc. | | | | | | | | | 2,196 |
| | | | | |
| 170 | | Freeport-McMoRan Copper & Gold, Inc. | | | | | | | | | 8,519 |
| | | | | |
| 140 | | Horsehead Holding Corp., (2) | | | | | | | | | 1,043 |
| | | | | |
| 160 | | Newmont Mining Corporation | | | | | | | | | 6,539 |
| | | | | |
| 160 | | Nucor Corporation | | | | | | | | | 7,109 |
| | | | | |
| 10 | | Reliance Steel & Aluminum Company | | | | | | | | | 384 |
| | | | | |
| 30 | | Schnitzer Steel Industries, Inc. | | | | | | | | | 1,586 |
| | | | | |
| 30 | | Southern Copper Corporation | | | | | | | | | 613 |
| | | | | |
| 30 | | Steel Dynamics Inc. | | | | | | | | | 442 |
| | Total Metals & Mining | | | | | | | | | 39,423 |
| | Multiline Retail – 0.7% | | | | | | | | | |
| | | | | |
| 160 | | 99 Cents Only Stores, (2) | | | | | | | | | 2,173 |
| | | | | |
| 30 | | Dollar Tree Stores Inc., (2) | | | | | | | | | 1,263 |
| | | | | |
| 100 | | Family Dollar Stores, Inc. | | | | | | | | | 2,830 |
| | | | | |
| 230 | | Federated Department Stores, Inc. | | | | | | | | | 2,705 |
| | | | | |
| 170 | | J.C. Penney Company, Inc. | | | | | | | | | 4,881 |
| | | | | |
| 130 | | Kohl’s Corporation, (2) | | | | | | | | | 5,558 |
| | | | | |
| 50 | | Nordstrom, Inc. | | | | | | | | | 995 |
| | | | | |
| 240 | | Saks Inc., (2) | | | | | | | | | 1,063 |
| | | | | |
| 20 | | Sears Holding Corporation, (2) | | | | | | | | | 1,330 |
| | | | | |
| 230 | | Target Corporation | | | | | | | | | 9,078 |
| | Total Multiline Retail | | | | | | | | | 31,876 |
| | Multi-Utilities – 1.9% | | | | | | | | | |
| | | | | |
| 80 | | Alliant Energy Corporation | | | | | | | | | 2,090 |
| | | | | |
| 130 | | Ameren Corporation | | | | | | | | | 3,236 |
| | | | | |
| 60 | | Avista Corporation | | | | | | | | | 1,069 |
| | | | | |
| 10 | | Black Hills Corporation | | | | | | | | | 230 |
| | | | | |
| 210 | | CenterPoint Energy, Inc. | | | | | | | | | 2,327 |
| | | | | |
| 200 | | CMS Energy Corporation | | | | | | | | | 2,416 |
| | | | | |
| 340 | | Consolidated Edison, Inc. | | | | | | | | | 12,723 |
| | | | | |
| 310 | | Dominion Resources, Inc. | | | | | | | | | 10,360 |
| | | | | |
| 120 | | DTE Energy Company | | | | | | | | | 3,840 |
Portfolio of Investments
Nuveen U.S. Equity Completeness Fund (continued)
June 30, 2009
| | | | | | | | | | | |
| Shares | | Description (1) | | | | | | | | Value |
| | | | | | | | | | | |
| | Multi-Utilities (continued) | | | | | | | | | |
| | | | | |
| 180 | | Integrys Energy Group, Inc. | | | | | | | | $ | 5,398 |
| | | | | |
| 80 | | MDU Resources Group Inc. | | | | | | | | | 1,518 |
| | | | | |
| 300 | | NiSource Inc. | | | | | | | | | 3,498 |
| | | | | |
| 40 | | Northwestern Corporation | | | | | | | | | 910 |
| | | | | |
| 70 | | NSTAR | | | | | | | | | 2,248 |
| | | | | |
| 50 | | OGE Energy Corp. | | | | | | | | | 1,416 |
| | | | | |
| 220 | | PG&E Corporation | | | | | | | | | 8,457 |
| | | | | |
| 120 | | PNM Resources Inc. | | | | | | | | | 1,285 |
| | | | | |
| 150 | | Public Service Enterprise Group Incorporated | | | | | | | | | 4,895 |
| | | | | |
| 80 | | Scana Corporation | | | | | | | | | 2,598 |
| | | | | |
| 140 | | Sempra Energy | | | | | | | | | 6,948 |
| | | | | |
| 30 | | TECO Energy, Inc. | | | | | | | | | 358 |
| | | | | |
| 150 | | Vectren Corporation | | | | | | | | | 3,515 |
| | | | | |
| 60 | | Wisconsin Energy Corporation | | | | | | | | | 2,443 |
| | | | | |
| 290 | | Xcel Energy, Inc. | | | | | | | | | 5,339 |
| | Total Multi-Utilities | | | | | | | | | 89,117 |
| | Office Electronics – 0.2% | | | | | | | | | |
| | | | | |
| 990 | | Xerox Corporation | | | | | | | | | 6,415 |
| | | | | |
| 110 | | Zebra Technologies Corporation, Class A, (2) | | | | | | | | | 2,603 |
| | Total Office Electronics | | | | | | | | | 9,018 |
| | Oil, Gas & Consumable Fuels – 10.0% | | | | | | | | | |
| | | | | |
| 130 | | Alpha Natural Resources Inc., (2) | | | | | | | | | 3,415 |
| | | | | |
| 230 | | Anadarko Petroleum Corporation | | | | | | | | | 10,440 |
| | | | | |
| 120 | | Apache Corporation | | | | | | | | | 8,658 |
| | | | | |
| 60 | | Arena Resources Inc., (2) | | | | | | | | | 1,911 |
| | | | | |
| 30 | | ATP Oil & Gas Corporation, (2) | | | | | | | | | 209 |
| | | | | |
| 30 | | Berry Petroleum Company | | | | | | | | | 558 |
| | | | | |
| 30 | | Bill Barrett Corporation, (2) | | | | | | | | | 824 |
| | | | | |
| 10 | | BPZ Resources, Inc., (2) | | | | | | | | | 49 |
| | | | | |
| 30 | | Cabot Oil & Gas Corporation | | | | | | | | | 919 |
| | | | | |
| 10 | | Carrizo Oil & Gas, Inc., (2) | | | | | | | | | 172 |
| | | | | |
| 120 | | Cheniere Energy Inc., (2) | | | | | | | | | 353 |
| | | | | |
| 260 | | Chesapeake Energy Corporation | | | | | | | | | 5,156 |
| | | | | |
| 1,040 | | Chevron Corporation | | | | | | | | | 68,900 |
| | | | | |
| 30 | | Cimarex Energy Company | | | | | | | | | 850 |
| | | | | |
| 20 | | Clayton Williams Energy, (2) | | | | | | | | | 377 |
| | | | | |
| 10 | | CNX Gas Corporation, (2) | | | | | | | | | 263 |
| | | | | |
| 60 | | Comstock Resources Inc., (2) | | | | | | | | | 1,983 |
| | | | | |
| 80 | | Concho Resources Inc., (2) | | | | | | | | | 2,295 |
| | | | | |
| 730 | | ConocoPhillips | | | | | | | | | 30,704 |
| | | | | |
| 10 | | Contango Oil & Gas Company, (2) | | | | | | | | | 425 |
| | | | | |
| 30 | | Continental Resources Inc., (2) | | | | | | | | | 833 |
| | | | | |
| 10 | | Denbury Resources Inc., (2) | | | | | | | | | 147 |
| | | | | |
| 200 | | Devon Energy Corporation | | | | | | | | | 10,900 |
| | | | | |
| 60 | | DHT Maritime Inc. | | | | | | | | | 313 |
| | | | | | | | | | | |
| Shares | | Description (1) | | | | | | | | Value |
| | | | | | | | | | | |
| | Oil, Gas & Consumable Fuels (continued) | | | | | | | | | |
| | | | | |
| 140 | | El Paso Corporation | | | | | | | | $ | 1,292 |
| | | | | |
| 70 | | EOG Resources, Inc. | | | | | | | | | 4,754 |
| | | | | |
| 100 | | Exco Resources Inc., (2) | | | | | | | | | 1,292 |
| | | | | |
| 3,490 | | Exxon Mobil Corporation | | | | | | | | | 243,986 |
| | | | | |
| 20 | | Forest Oil Corporation, (2) | | | | | | | | | 298 |
| | | | | |
| 10 | | Foundation Coal Holding Corporation | | | | | | | | | 281 |
| | | | | |
| 10 | | Frontline Limited | | | | | | | | | 244 |
| | | | | |
| 10 | | Goodrich Petroleum Corporation, (2) | | | | | | | | | 246 |
| | | | | |
| 70 | | Hess Corporation | | | | | | | | | 3,763 |
| | | | | |
| 100 | | Knightsbridge Tankers Limited | | | | | | | | | 1,364 |
| | | | | |
| 400 | | Marathon Oil Corporation | | | | | | | | | 12,052 |
| | | | | |
| 50 | | Murphy Oil Corporation | | | | | | | | | 2,716 |
| | | | | |
| 40 | | Newfield Exploration Company, (2) | | | | | | | | | 1,307 |
| | | | | |
| 70 | | Noble Energy, Inc. | | | | | | | | | 4,128 |
| | | | | |
| 10 | | Nordic American Tanker Shipping Ltd | | | | | | | | | 318 |
| | | | | |
| 220 | | Occidental Petroleum Corporation | | | | | | | | | 14,478 |
| | | | | |
| 10 | | Panhandle Oil and Gas Inc. | | | | | | | | | 196 |
| | | | | |
| 150 | | Patriot Coal Corporation, (2) | | | | | | | | | 957 |
| | | | | |
| 60 | | Peabody Energy Corporation | | | | | | | | | 1,810 |
| | | | | |
| 10 | | Penn Virginia Corporation | | | | | | | | | 164 |
| | | | | |
| 80 | | Petrohawk Energy Corporation, (2) | | | | | | | | | 1,784 |
| | | | | |
| 20 | | Petroquest Energy Inc., (2) | | | | | | | | | 74 |
| | | | | |
| 10 | | Range Resources Corporation | | | | | | | | | 414 |
| | | | | |
| 10 | | Southern Union Company | | | | | | | | | 184 |
| | | | | |
| 60 | | Southwestern Energy Company, (2) | | | | | | | | | 2,331 |
| | | | | |
| 340 | | Spectra Energy Corporation | | | | | | | | | 5,753 |
| | | | | |
| 230 | | Valero Energy Corporation | | | | | | | | | 3,885 |
| | | | | |
| 60 | | Venoco Inc., (2) | | | | | | | | | 460 |
| | | | | |
| 20 | | Whiting Petroleum Corporation, (2) | | | | | | | | | 703 |
| | | | | |
| 230 | | Williams Companies, Inc. | | | | | | | | | 3,590 |
| | | | | |
| 10 | | World Fuel Services Corporation | | | | | | | | | 412 |
| | | | | |
| 180 | | XTO Energy, Inc. | | | | | | | | | 6,865 |
| | Total Oil, Gas & Consumable Fuels | | | | | | | | | 472,755 |
| | Paper & Forest Products – 0.3% | | | | | | | | | |
| | | | | |
| 20 | | Buckeye Technologies Inc., (2) | | | | | | | | | 90 |
| | | | | |
| 10 | | Deltic Timber Corporation | | | | | | | | | 355 |
| | | | | |
| 260 | | International Paper Company | | | | | | | | | 3,934 |
| | | | | |
| 350 | | Louisiana-Pacific Corporation, (2) | | | | | | | | | 1,197 |
| | | | | |
| 60 | | MeadWestvaco Corporation | | | | | | | | | 985 |
| | | | | |
| 30 | | Neenah Paper, Inc. | | | | | | | | | 264 |
| | | | | |
| 60 | | Schweitzer-Mauduit International Inc. | | | | | | | | | 1,633 |
| | | | | |
| 170 | | Wausau Paper Corp. | | | | | | | | | 1,142 |
| | | | | |
| 110 | | Weyerhaeuser Company | | | | | | | | | 3,347 |
| | Total Paper & Forest Products | | | | | | | | | 12,947 |
Portfolio of Investments
Nuveen U.S. Equity Completeness Fund (continued)
June 30, 2009
| | | | | | | | | | | |
| Shares | | Description (1) | | | | | | | | Value |
| | | | | | | | | | | |
| | Personal Products – 0.2% | | | | | | | | | |
| | | | | |
| 280 | | Avon Products, Inc. | | | | | | | | $ | 7,218 |
| | | | | |
| 20 | | China Sky One Medical Inc., (2) | | | | | | | | | 270 |
| | | | | |
| 20 | | Estee Lauder Companies Inc., Class A | | | | | | | | | 653 |
| | Total Personal Products | | | | | | | | | 8,141 |
| | Pharmaceuticals – 5.8% | | | | | | | | | |
| | | | | |
| 410 | | Abbott Laboratories | | | | | | | | | 19,286 |
| | | | | |
| 50 | | Allergan, Inc. | | | | | | | | | 2,379 |
| | | | | |
| 30 | | Auxilium Pharmaceuticals, Inc., (2) | | | | | | | | | 941 |
| | | | | |
| 740 | | Bristol-Myers Squibb Company | | | | | | | | | 15,029 |
| | | | | |
| 400 | | Eli Lilly and Company | | | | | | | | | 13,856 |
| | | | | |
| 310 | | Forest Laboratories, Inc., (2) | | | | | | | | | 7,784 |
| | | | | |
| 250 | | Inspire Pharmaceuticals, Inc., (2) | | | | | | | | | 1,390 |
| | | | | |
| 1,060 | | Johnson & Johnson | | | | | | | | | 60,208 |
| | | | | |
| 160 | | KV Pharmaceutical Company., Class A, (2) | | | | | | | | | 514 |
| | | | | |
| 40 | | Medicines Company, (2) | | | | | | | | | 336 |
| | | | | |
| 1,030 | | Merck & Co. Inc. | | | | | | | | | 28,799 |
| | | | | |
| 610 | | Mylan Laboratories Inc., (2) | | | | | | | | | 7,961 |
| | | | | |
| 110 | | Par Pharmaceuticals Inc., (2) | | | | | | | | | 1,667 |
| | | | | |
| 130 | | Perrigo Company | | | | | | | | | 3,611 |
| | | | | |
| 4,920 | | Pfizer Inc. | | | | | | | | | 73,800 |
| | | | | |
| 120 | | Pozen Inc., (2) | | | | | | | | | 922 |
| | | | | |
| 20 | | Salix Pharmaceuticals Limited, (2) | | | | | | | | | 197 |
| | | | | |
| 400 | | Schering-Plough Corporation | | | | | | | | | 10,048 |
| | | | | |
| 10 | | Valeant Pharmaceuticals International, (2) | | | | | | | | | 257 |
| | | | | |
| 40 | | ViroPharma, Inc., (2) | | | | | | | | | 237 |
| | | | | |
| 30 | | Watson Pharmaceuticals Inc., (2) | | | | | | | | | 1,011 |
| | | | | |
| 580 | | Wyeth | | | | | | | | | 26,326 |
| | | | | |
| 30 | | Xenoport, Inc., (2) | | | | | | | | | 695 |
| | Total Pharmaceuticals | | | | | | | | | 277,254 |
| | Professional Services – 0.5% | | | | | | | | | |
| | | | | |
| 40 | | Administaff, Inc. | | | | | | | | | 931 |
| | | | | |
| 20 | | CoStar Group, Inc., (2) | | | | | | | | | 797 |
| | | | | |
| 30 | | Dun and Bradstreet Inc. | | | | | | | | | 2,436 |
| | | | | |
| 50 | | FTI Consulting Inc., (2) | | | | | | | | | 2,536 |
| | | | | |
| 110 | | Hill International, Inc., (2) | | | | | | | | | 473 |
| | | | | |
| 40 | | Huron Consulting Group, Inc., (2) | | | | | | | | | 1,849 |
| | | | | |
| 40 | | IHS Inc., (2) | | | | | | | | | 1,995 |
| | | | | |
| 60 | | Kelly Services, Inc. | | | | | | | | | 657 |
| | | | | |
| 80 | | Korn Ferry International, (2) | | | | | | | | | 851 |
| | | | | |
| 20 | | Manpower Inc. | | | | | | | | | 847 |
| | | | | |
| 160 | | Monster Worldwide Inc., (2) | | | | | | | | | 1,890 |
| | | | | |
| 230 | | MPS Group Inc., (2) | | | | | | | | | 1,757 |
| | | | | |
| 80 | | Navigant Consulting Inc., (2) | | | | | | | | | 1,034 |
| | | | | |
| 200 | | Odyssey Marine Exploration Inc., (2) | | | | | | | | | 320 |
| | | | | |
| 120 | | Resources Connection, Inc., (2) | | | | | | | | | 2,060 |
| | | | | | | | | | | |
| Shares | | Description (1) | | | | | | | | Value |
| | | | | | | | | | | |
| | Professional Services (continued) | | | | | | | | | |
| | | | | |
| 50 | | Robert Half International Inc. | | | | | | | | $ | 1,181 |
| | | | | |
| 190 | | Spherion Corporation, (2) | | | | | | | | | 783 |
| | | | | |
| 80 | | Watson Wyatt Worldwide, Inc. | | | | | | | | | 3,002 |
| | Total Professional Services | | | | | | | | | 25,399 |
| | Real Estate – 2.5% | | | | | | | | | |
| | | | | |
| 50 | | Acadia Realty Trust | | | | | | | | | 653 |
| | | | | |
| 30 | | Agree Realty Corporation | | | | | | | | | 550 |
| | | | | |
| 70 | | Alexandria Real Estate Equities Inc. | | | | | | | | | 2,505 |
| | | | | |
| 40 | | AMB Property Corp. | | | | | | | | | 752 |
| | | | | |
| 40 | | American Campus Communities Inc. | | | | | | | | | 887 |
| | | | | |
| 590 | | Annaly Capital Management Inc. | | | | | | | | | 8,933 |
| | | | | |
| 160 | | Anworth Mortgage Asset Corporation | | | | | | | | | 1,154 |
| | | | | |
| 40 | | AvalonBay Communities, Inc. | | | | | | | | | 2,238 |
| | | | | |
| 130 | | BioMed Realty Trust Inc. | | | | | | | | | 1,330 |
| | | | | |
| 30 | | Boston Properties, Inc. | | | | | | | | | 1,431 |
| | | | | |
| 240 | | Capstead Mortgage Corporation | | | | | | | | | 3,050 |
| | | | | |
| 90 | | Corporate Office Properties | | | | | | | | | 2,640 |
| | | | | |
| 200 | | DCT Industrial Trust Inc. | | | | | | | | | 816 |
| | | | | |
| 120 | | DiamondRock Hospitality Company | | | | | | | | | 751 |
| | | | | |
| 60 | | Digital Realty Trust Inc. | | | | | | | | | 2,151 |
| | | | | |
| 140 | | Duke Realty Corporation | | | | | | | | | 1,228 |
| | | | | |
| 60 | | EastGroup Properties Inc. | | | | | | | | | 1,981 |
| | | | | |
| 60 | | Entertainment Properties Trust | | | | | | | | | 1,236 |
| | | | | |
| 40 | | Equity Lifestyles Properties Inc. | | | | | | | | | 1,487 |
| | | | | |
| 130 | | Equity One Inc. | | | | | | | | | 1,724 |
| | | | | |
| 130 | | Equity Residential | | | | | | | | | 2,890 |
| | | | | |
| 110 | | Extra Space Storage Inc. | | | | | | | | | 919 |
| | | | | |
| 20 | | Federal Realty Investment Trust | | | | | | | | | 1,030 |
| | | | | |
| 60 | | Franklin Street Properties Corporation | | | | | | | | | 795 |
| | | | | |
| 60 | | Getty Realty Corporation | | | | | | | | | 1,132 |
| | | | | |
| 110 | | Hatteras Financial Corp. | | | | | | | | | 3,145 |
| | | | | |
| 120 | | Health Care Property Investors Inc. | | | | | | | | | 2,543 |
| | | | | |
| 40 | | Health Care REIT, Inc. | | | | | | | | | 1,364 |
| | | | | |
| 170 | | Healthcare Realty Trust, Inc. | | | | | | | | | 2,861 |
| | | | | |
| 150 | | Highwoods Properties, Inc. | | | | | | | | | 3,356 |
| | | | | |
| 50 | | Home Properties New York, Inc. | | | | | | | | | 1,705 |
| | | | | |
| 570 | | Host Hotels & Resorts Inc. | | | | | | | | | 4,782 |
| | | | | |
| 110 | | Inland Real Estate Corporation | | | | | | | | | 770 |
| | | | | |
| 50 | | Investors Real Estate Trust | | | | | | | | | 445 |
| | | | | |
| 170 | | Kimco Realty Corporation | | | | | | | | | 1,709 |
| | | | | |
| 440 | | Lexington Corporate Properties Trust | | | | | | | | | 1,496 |
| | | | | |
| 60 | | Liberty Property Trust | | | | | | | | | 1,382 |
| | | | | |
| 1 | | Macerich Company | | | | | | | | | 18 |
| | | | | |
| 40 | | Mack-Cali Realty Corporation | | | | | | | | | 912 |
| | | | | |
| 680 | | MFA Mortgage Investments, Inc. | | | | | | | | | 4,706 |
Portfolio of Investments
Nuveen U.S. Equity Completeness Fund (continued)
June 30, 2009
| | | | | | | | | | | |
| Shares | | Description (1) | | | | | | | | Value |
| | | | | | | | | | | |
| | Real Estate (continued) | | | | | | | | | |
| | | | | |
| 30 | | Mid-America Apartment Communities | | | | | | | | $ | 1,101 |
| | | | | |
| 80 | | Mission West Properties Inc. | | | | | | | | | 546 |
| | | | | |
| 30 | | National Health Investors Inc. | | | | | | | | | 801 |
| | | | | |
| 110 | | National Retail Properties, Inc. | | | | | | | | | 1,909 |
| | | | | |
| 50 | | Nationwide Health Properties, Inc. | | | | | | | | | 1,287 |
| | | | | |
| 110 | | Omega Healthcare Investors Inc. | | | | | | | | | 1,707 |
| | | | | |
| 50 | | Plum Creek Timber Company | | | | | | | | | 1,489 |
| | | | | |
| 40 | | Post Properties, Inc. | | | | | | | | | 538 |
| | | | | |
| 60 | | Potlatch Corporation | | | | | | | | | 1,457 |
| | | | | |
| 260 | | ProLogis | | | | | | | | | 2,096 |
| | | | | |
| 30 | | PS Business Parks Inc. | | | | | | | | | 1,453 |
| | | | | |
| 50 | | Public Storage, Inc. | | | | | | | | | 3,274 |
| | | | | |
| 70 | | Rayonier Inc. | | | | | | | | | 2,545 |
| | | | | |
| 130 | | Realty Income Corporation | | | | | | | | | 2,850 |
| | | | | |
| 80 | | Redwood Trust Inc. | | | | | | | | | 1,181 |
| | | | | |
| 30 | | Regency Centers Corporation | | | | | | | | | 1,047 |
| | | | | |
| 160 | | Senior Housing Properties Trust | | | | | | | | | 2,611 |
| | | | | |
| 100 | | Simon Property Group, Inc. | | | | | | | | | 5,143 |
| | | | | |
| 30 | | Sovran Self Storage Inc. | | | | | | | | | 738 |
| | | | | |
| 360 | | Sunstone Hotel Investors Inc. | | | | | | | | | 1,926 |
| | | | | |
| 40 | | Tanger Factory Outlet Centers | | | | | | | | | 1,297 |
| | | | | |
| 320 | | UDR Inc. | | | | | | | | | 3,306 |
| | | | | |
| 60 | | Vornado Realty Trust | | | | | | | | | 2,702 |
| | | | | |
| 60 | | Washington Real Estate Investment Trust | | | | | | | | | 1,342 |
| | Total Real Estate | | | | | | | | | 119,803 |
| | Real Estate Management & Development – 0.1% | | | | | | | | | |
| | | | | |
| 210 | | CB Richard Ellis Group, Inc., Class A, (2) | | | | | | | | | 1,966 |
| | | | | |
| 10 | | Forestar Real Estate Group Inc., (2) | | | | | | | | | 119 |
| | | | | |
| 90 | | St Joe Company, (2) | | | | | | | | | 2,384 |
| | Total Real Estate Management & Development | | | | | | | | | 4,469 |
| | Road & Rail – 0.7% | | | | | | | | | |
| | | | | |
| 40 | | AMERCO, (2) | | | | | | | | | 1,486 |
| | | | | |
| 20 | | Arkansas Best Corporation | | | | | | | | | 527 |
| | | | | |
| 90 | | Burlington Northern Santa Fe Corporation | | | | | | | | | 6,619 |
| | | | | |
| 20 | | Con-Way, Inc. | | | | | | | | | 706 |
| | | | | |
| 130 | | CSX Corporation | | | | | | | | | 4,502 |
| | | | | |
| 20 | | Heartland Express, Inc. | | | | | | | | | 294 |
| | | | | |
| 10 | | J.B. Hunt Transports Serives Inc. | | | | | | | | | 305 |
| | | | | |
| 20 | | Marten Transport, Ltd., (2) | | | | | | | | | 415 |
| | | | | |
| 170 | | Norfolk Southern Corporation | | | | | | | | | 6,404 |
| | | | | |
| 10 | | Old Dominion Frght Line, (2) | | | | | | | | | 336 |
| | | | | |
| 150 | | Union Pacific Corporation | | | | | | | | | 7,809 |
| | | | | |
| 120 | | Werner Enterprises, Inc. | | | | | | | | | 2,174 |
| | | | | |
| 270 | | YRC Worldwide Inc., (2) | | | | | | | | | 467 |
| | Total Road & Rail | | | | | | | | | 32,044 |
| | | | | | | | | | | |
| Shares | | Description (1) | | | | | | | | Value |
| | | | | | | | | | | |
| | Semiconductors & Equipment – 2.2% | | | | | | | | | |
| | | | | |
| 50 | | Advanced Analogic, (2) | | | | | | | | $ | 230 |
| | | | | |
| 120 | | Advanced Energy Industriess Inc., (2) | | | | | | | | | 1,079 |
| | | | | |
| 70 | | Advanced Micro Devices, Inc., (2) | | | | | | | | | 271 |
| | | | | |
| 170 | | Altera Corporation | | | | | | | | | 2,768 |
| | | | | |
| 160 | | Anadigics Inc., (2) | | | | | | | | | 670 |
| | | | | |
| 180 | | Analog Devices, Inc. | | | | | | | | | 4,460 |
| | | | | |
| 250 | | Applied Materials, Inc. | | | | | | | | | 2,743 |
| | | | | |
| 70 | | Atheros Communications, Inc., (2) | | | | | | | | | 1,347 |
| | | | | |
| 450 | | Atmel Corporation, (2) | | | | | | | | | 1,679 |
| | | | | |
| 50 | | ATMI Inc., (2) | | | | | | | | | 777 |
| | | | | |
| 110 | | Broadcom Corporation, Class A, (2) | | | | | | | | | 2,727 |
| | | | | |
| 30 | | Brooks Automation Inc., (2) | | | | | | | | | 134 |
| | | | | |
| 30 | | Cabot Microelectronics Corporation, (2) | | | | | | | | | 849 |
| | | | | |
| 30 | | Cavium Networks, Inc., (2) | | | | | | | | | 504 |
| | | | | |
| 100 | | Cohu Inc. | | | | | | | | | 898 |
| | | | | |
| 163 | | CSR PLC, (2) | | | | | | | | | 942 |
| | | | | |
| 70 | | Cymer, Inc., (2) | | | | | | | | | 2,081 |
| | | | | |
| 60 | | Diodes Inc., (2) | | | | | | | | | 938 |
| | | | | |
| 20 | | DSP Group Inc., (2) | | | | | | | | | 135 |
| | | | | |
| 200 | | Fairchild Semiconductor International Inc., Class A, (2) | | | | | | | | | 1,398 |
| | | | | |
| 20 | | FEI Company, (2) | | | | | | | | | 458 |
| | | | | |
| 60 | | FormFactor Inc., (2) | | | | | | | | | 1,034 |
| | | | | |
| 30 | | Hittite Microwave Corporation, (2) | | | | | | | | | 1,043 |
| | | | | |
| 1,740 | | Intel Corporation | | | | | | | | | 28,797 |
| | | | | |
| 40 | | International Rectifier Corporation, (2) | | | | | | | | | 592 |
| | | | | |
| 20 | | Intersil Holding Corporation, Class A | | | | | | | | | 251 |
| | | | | |
| 10 | | KLA-Tencor Corporation | | | | | | | | | 253 |
| | | | | |
| 20 | | Lam Research Corporation, (2) | | | | | | | | | 520 |
| | | | | |
| 30 | | Marvell Technology Group Ltd., (2) | | | | | | | | | 349 |
| | | | | |
| 130 | | MEMC Electronic Materials, (2) | | | | | | | | | 2,315 |
| | | | | |
| 450 | | Micron Technology, Inc., (2) | | | | | | | | | 2,277 |
| | | | | |
| 110 | | Microsemi Corporation, (2) | | | | | | | | | 1,518 |
| | | | | |
| 340 | | Microtune, Inc., (2) | | | | | | | | | 796 |
| | | | | |
| 50 | | MKS Instruments Inc., (2) | | | | | | | | | 660 |
| | | | | |
| 20 | | Monolithic Power Systems, Inc., (2) | | | | | | | | | 448 |
| | | | | |
| 330 | | National Semiconductor Corporation | | | | | | | | | 4,142 |
| | | | | |
| 20 | | Netlogic Microsystems Inc., (2) | | | | | | | | | 729 |
| | | | | |
| 10 | | NVE Corporation, (2) | | | | | | | | | 486 |
| | | | | |
| 100 | | NVIDIA Corporation, (2) | | | | | | | | | 1,129 |
| | | | | |
| 30 | | Pericom Semiconductor Corporation, (2) | | | | | | | | | 253 |
| | | | | |
| 390 | | PMC-Sierra, Inc., (2) | | | | | | | | | 3,104 |
| | | | | |
| 70 | | Power Integrations Inc. | | | | | | | | | 1,665 |
| | | | | |
| 180 | | RF Micro Devices, Inc., (2) | | | | | | | | | 677 |
| | | | | |
| 200 | | Rudolph Technologies, (2) | | | | | | | | | 1,104 |
| | | | | |
| 80 | | Semtech Corporation, (2) | | | | | | | | | 1,273 |
Portfolio of Investments
Nuveen U.S. Equity Completeness Fund (continued)
June 30, 2009
| | | | | | | | | | | |
| Shares | | Description (1) | | | | | | | | Value |
| | | | | | | | | | | |
| | Semiconductors & Equipment (continued) | | | | | | | | | |
| | | | | |
| 20 | | Silicon Laboratories Inc., (2) | | | | | | | | $ | 759 |
| | | | | |
| 270 | | Skyworks Solutions Inc., (2) | | | | | | | | | 2,641 |
| | | | | |
| 50 | | Supertex Inc., (2) | | | | | | | | | 1,256 |
| | | | | |
| 40 | | Teradyne Inc., (2) | | | | | | | | | 274 |
| | | | | |
| 30 | | Tessera Technologies Inc., (2) | | | | | | | | | 759 |
| | | | | |
| 560 | | Texas Instruments Incorporated | | | | | | | | | 11,928 |
| | | | | |
| 220 | | Xilinx, Inc. | | | | | | | | | 4,501 |
| | Total Semiconductors & Equipment | | | | | | | | | 104,621 |
| | Software – 3.6% | | | | | | | | | |
| | | | | |
| 50 | | ACI Worldwide, Inc., (2) | | | | | | | | | 698 |
| | | | | |
| 110 | | Activision Blizzard Inc., (2) | | | | | | | | | 1,389 |
| | | | | |
| 310 | | Adobe Systems Incorporated, (2) | | | | | | | | | 8,773 |
| | | | | |
| 30 | | Advent Software Inc., (2) | | | | | | | | | 984 |
| | | | | |
| 150 | | American Software, Inc. | | | | | | | | | 864 |
| | | | | |
| 160 | | ArcSight Inc., (2) | | | | | | | | | 2,843 |
| | | | | |
| 150 | | Ariba Inc., (2) | | | | | | | | | 1,476 |
| | | | | |
| 80 | | Asiainfo Holdings, Inc., (2) | | | | | | | | | 1,377 |
| | | | | |
| 90 | | Autodesk, Inc., (2) | | | | | | | | | 1,708 |
| | | | | |
| 50 | | Blackbaud, Inc. | | | | | | | | | 778 |
| | | | | |
| 50 | | Blackboard, Inc., (2) | | | | | | | | | 1,443 |
| | | | | |
| 50 | | BMC Software, Inc., (2) | | | | | | | | | 1,690 |
| | | | | |
| 20 | | Bottomline Technologies, Inc., (2) | | | | | | | | | 180 |
| | | | | |
| 140 | | CA Inc. | | | | | | | | | 2,440 |
| | | | | |
| 10 | | Citrix Systems, (2) | | | | | | | | | 319 |
| | | | | |
| 60 | | CommVault Systems, Inc., (2) | | | | | | | | | 995 |
| | | | | |
| 50 | | Concur Technologies, Inc., (2) | | | | | | | | | 1,554 |
| | | | | |
| 170 | | DemandTec Inc., (2) | | | | | | | | | 1,496 |
| | | | | |
| 80 | | Double-Take Software, (2) | | | | | | | | | 692 |
| | | | | |
| 20 | | Electronic Arts Inc. (EA), (2) | | | | | | | | | 434 |
| | | | | |
| 240 | | Epicor Software Corporation, (2) | | | | | | | | | 1,272 |
| | | | | |
| 50 | | EPIQ Systems, Inc., (2) | | | | | | | | | 768 |
| | | | | |
| 90 | | Fair Isaac Corporation | | | | | | | | | 1,391 |
| | | | | |
| 170 | | Henry Jack and Associates Inc. | | | | | | | | | 3,528 |
| | | | | |
| 310 | | Informatica Corporation, (2) | | | | | | | | | 5,329 |
| | | | | |
| 190 | | Intuit, Inc., (2) | | | | | | | | | 5,350 |
| | | | | |
| 40 | | Kenexa Corporation, (2) | | | | | | | | | 463 |
| | | | | |
| 170 | | Lawson Software, Inc., (2) | | | | | | | | | 949 |
| | | | | |
| 140 | | Macrovision Corporation, (2) | | | | | | | | | 3,053 |
| | | | | |
| 30 | | Manhattan Associates Inc., (2) | | | | | | | | | 547 |
| | | | | |
| 100 | | Micros Systems, Inc., (2) | | | | | | | | | 2,532 |
| | | | | |
| 2,030 | | Microsoft Corporation | | | | | | | | | 48,253 |
| | | | | |
| 180 | | Net 1 Ueps Technologies, Inc., (2) | | | | | | | | | 2,446 |
| | | | | |
| 190 | | NetScout Systems, Inc., (2) | | | | | | | | | 1,782 |
| | | | | |
| 130 | | NetSuite Inc., (2) | | | | | | | | | 1,535 |
| | | | | |
| 70 | | Novell Inc., (2) | | | | | | | | | 317 |
| | | | | | | | | | | |
| Shares | | Description (1) | | | | | | | | Value |
| | | | | | | | | | | |
| | Software (continued) | | | | | | | | | |
| | | | | |
| 10 | | Nuance Communications, Inc., (2) | | | | | | | | $ | 121 |
| | | | | |
| 970 | | Oracle Corporation | | | | | | | | | 20,777 |
| | | | | |
| 270 | | Parametric Technology Corporation, (2) | | | | | | | | | 3,156 |
| | | | | |
| 50 | | Pegasystems, Inc. | | | | | | | | | 1,319 |
| | | | | |
| 70 | | Phoenix Technologies Limited, (2) | | | | | | | | | 190 |
| | | | | |
| 50 | | Progress Software Corporation, (2) | | | | | | | | | 1,059 |
| | | | | |
| 50 | | Quest Software Inc., (2) | | | | | | | | | 697 |
| | | | | |
| 140 | | Red Hat, Inc., (2) | | | | | | | | | 2,818 |
| | | | | |
| 70 | | Solera Holdings Inc., (2) | | | | | | | | | 1,778 |
| | | | | |
| 120 | | Sourcefire Inc., (2) | | | | | | | | | 1,487 |
| | | | | |
| 20 | | SPSS Inc., (2) | | | | | | | | | 667 |
| | | | | |
| 140 | | Sybase, Inc., (2) | | | | | | | | | 4,388 |
| | | | | |
| 410 | | Symantec Corporation, (2) | | | | | | | | | 6,380 |
| | | | | |
| 150 | | Synopsys Inc., (2) | | | | | | | | | 2,927 |
| | | | | |
| 130 | | Take-Two Interactive Software, Inc., (2) | | | | | | | | | 1,231 |
| | | | | |
| 50 | | Taleo Corporation, (2) | | | | | | | | | 914 |
| | | | | |
| 410 | | Tibco Software Inc., (2) | | | | | | | | | 2,940 |
| | | | | |
| 50 | | TiVo, Inc., (2) | | | | | | | | | 524 |
| | | | | |
| 120 | | Tyler Technologies Inc., (2) | | | | | | | | | 1,874 |
| | | | | |
| 50 | | Ultimate Software Group, Inc., (2) | | | | | | | | | 1,212 |
| | | | | |
| 200 | | Vasco Data Security International, Inc., (2) | | | | | | | | | 1,462 |
| | | | | |
| 60 | | Websense Inc., (2) | | | | | | | | | 1,070 |
| | | | | |
| 80 | | Wind River Systems Inc., (2) | | | | | | | | | 917 |
| | Total Software | | | | | | | | | 171,556 |
| | Specialty Retail – 2.7% | | | | | | | | | |
| | | | | |
| 100 | | Aaron Rents Inc., (2) | | | | | | | | | 2,982 |
| | | | | |
| 10 | | Advance Auto Parts, Inc. | | | | | | | | | 415 |
| | | | | |
| 130 | | Aeropostale, Inc., (2) | | | | | | | | | 4,455 |
| | | | | |
| 30 | | American Eagle Outfitters, Inc. | | | | | | | | | 425 |
| | | | | |
| 10 | | Ann Taylor Stores Corporation, (2) | | | | | | | | | 80 |
| | | | | |
| 50 | | Barnes & Noble Inc. | | | | | | | | | 1,032 |
| | | | | |
| 20 | | bebe stores, inc. | | | | | | | | | 138 |
| | | | | |
| 90 | | Bed Bath and Beyond Inc., (2) | | | | | | | | | 2,768 |
| | | | | |
| 130 | | Best Buy Co., Inc. | | | | | | | | | 4,354 |
| | | | | |
| 60 | | Big 5 Sporting Goods Corporation | | | | | | | | | 664 |
| | | | | |
| 260 | | Borders Group, Inc., (2) | | | | | | | | | 957 |
| | | | | |
| 120 | | Brown Shoe Inc. | | | | | | | | | 869 |
| | | | | |
| 40 | | Buckle Inc. | | | | | | | | | 1,271 |
| | | | | |
| 140 | | Cabela’s Incorporated, (2) | | | | | | | | | 1,722 |
| | | | | |
| 30 | | Cato Corporation | | | | | | | | | 523 |
| | | | | |
| 100 | | Charming Shoppes Inc., (2) | | | | | | | | | 372 |
| | | | | |
| 220 | | Chico’s FAS, Inc., (2) | | | | | | | | | 2,141 |
| | | | | |
| 20 | | Childrens Place Retail Stores Inc., (2) | | | | | | | | | 529 |
| | | | | |
| 80 | | Colective Brands Inc., (2) | | | | | | | | | 1,166 |
| | | | | |
| 40 | | Dick’s Sporting Goods Inc., (2) | | | | | | | | | 688 |
Portfolio of Investments
Nuveen U.S. Equity Completeness Fund (continued)
June 30, 2009
| | | | | | | | | | | |
| Shares | | Description (1) | | | | | | | | Value |
| | | | | | | | | | | |
| | Specialty Retail (continued) | | | | | | | | | |
| | | | | |
| 50 | | Dress Barn, Inc., (2) | | | | | | | | $ | 715 |
| | | | | |
| 10 | | DSW Inc., (2) | | | | | | | | | 99 |
| | | | | |
| 410 | | Foot Locker, Inc. | | | | | | | | | 4,293 |
| | | | | |
| 190 | | GameStop Corporation, (2) | | | | | | | | | 4,182 |
| | | | | |
| 180 | | Gap, Inc. | | | | | | | | | 2,952 |
| | | | | |
| 60 | | Group 1 Automotive Inc. | | | | | | | | | 1,561 |
| | | | | |
| 90 | | Guess Inc. | | | | | | | | | 2,320 |
| | | | | |
| 20 | | Gymboree Corporation, (2) | | | | | | | | | 710 |
| | | | | |
| 120 | | Haverty Furniture Companies Inc. | | | | | | | | | 1,098 |
| | | | | |
| 110 | | Hibbett Sporting Goods, Inc., (2) | | | | | | | | | 1,980 |
| | | | | |
| 1,060 | | Home Depot, Inc. | | | | | | | | | 25,048 |
| | | | | |
| 20 | | Hot Topic, Inc., (2) | | | | | | | | | 146 |
| | | | | |
| 30 | | J. Crew Group Inc., (2) | | | | | | | | | 811 |
| | | | | |
| 60 | | Jo Ann Stores, Inc., (2) | | | | | | | | | 1,240 |
| | | | | |
| 30 | | Joseph A Bank Clothiers, Inc., (2) | | | | | | | | | 1,034 |
| | | | | |
| 80 | | Limited Brands, Inc. | | | | | | | | | 958 |
| | | | | |
| 880 | | Lowe’s Companies, Inc. | | | | | | | | | 17,081 |
| | | | | |
| 200 | | Mens Wearhouse Inc. | | | | | | | | | 3,836 |
| | | | | |
| 20 | | Midas Inc., (2) | | | | | | | | | 210 |
| | | | | |
| 10 | | Monro Muffler Brake, Inc. | | | | | | | | | 257 |
| | | | | |
| 40 | | Office Depot, Inc., (2) | | | | | | | | | 182 |
| | | | | |
| 60 | | O’Reilly Automotive Inc., (2) | | | | | | | | | 2,285 |
| | | | | |
| 120 | | Penske Auto Group, Inc. | | | | | | | | | 1,997 |
| | | | | |
| 10 | | PetSmart Inc. | | | | | | | | | 215 |
| | | | | |
| 70 | | RadioShack Corporation | | | | | | | | | 977 |
| | | | | |
| 210 | | Rent-A-Center Inc., (2) | | | | | | | | | 3,744 |
| | | | | |
| 100 | | Ross Stores, Inc. | | | | | | | | | 3,860 |
| | | | | |
| 70 | | Signet Jewelers Limited | | | | | | | | | 1,457 |
| | | | | |
| 10 | | Stage Stores Inc. | | | | | | | | | 111 |
| | | | | |
| 200 | | Staples, Inc. | | | | | | | | | 4,034 |
| | | | | |
| 120 | | TJX Companies, Inc. | | | | | | | | | 3,774 |
| | | | | |
| 100 | | Tractor Supply Company, (2) | | | | | | | | | 4,131 |
| | | | | |
| 140 | | Ulta Salon, Cosmetics & Fragrance, Inc., (2) | | | | | | | | | 1,556 |
| | | | | |
| 10 | | Urban Outfitters, Inc., (2) | | | | | | | | | 208 |
| | | | | |
| 20 | | Zumiez, Inc., (2) | | | | | | | | | 159 |
| | Total Specialty Retail | | | | | | | | | 126,772 |
| | Textiles, Apparel & Luxury Goods – 0.6% | | | | | | | | | |
| | | | | |
| 100 | | Coach, Inc. | | | | | | | | | 2,687 |
| | | | | |
| 10 | | FGX International Limited, (2) | | | | | | | | | 113 |
| | | | | |
| 150 | | Fossil Inc., (2) | | | | | | | | | 3,611 |
| | | | | |
| 90 | | G III Apparel Group, Limited, (2) | | | | | | | | | 1,033 |
| | | | | |
| 10 | | Hanesbrands Inc., (2) | | | | | | | | | 149 |
| | | | | |
| 190 | | Jones Apparel Group, Inc. | | | | | | | | | 2,038 |
| | | | | |
| 20 | | K Swiss, Inc. | | | | | | | | | 169 |
| | | | | |
| 150 | | Liz Claiborne, Inc. | | | | | | | | | 431 |
| | | | | | | | | | | |
| Shares | | Description (1) | | | | | | | | Value |
| | | | | | | | | | | |
| | Textiles, Apparel & Luxury Goods (continued) | | | | | | | | | |
| | | | | |
| 80 | | Nike, Inc., Class B | | | | | | | | $ | 4,141 |
| | | | | |
| 20 | | Oxford Industries Inc. | | | | | | | | | 232 |
| | | | | |
| 70 | | Phillips-Van Heusen Corporation | | | | | | | | | 2,007 |
| | | | | |
| 150 | | Skechers USA Inc., (2) | | | | | | | | | 1,465 |
| | | | | |
| 60 | | Steven Madden Limited, (2) | | | | | | | | | 1,526 |
| | | | | |
| 120 | | Under Armour, Inc., (2) | | | | | | | | | 2,685 |
| | | | | |
| 40 | | VF Corporation | | | | | | | | | 2,213 |
| | | | | |
| 110 | | Volcom, Inc., (2) | | | | | | | | | 1,374 |
| | | | | |
| 50 | | Warnaco Group, Inc., (2) | | | | | | | | | 1,619 |
| | | | | |
| 60 | | Weyco Group, Inc. | | | | | | | | | 1,384 |
| | Total Textiles, Apparel & Luxury Goods | | | | | | | | | 28,877 |
| | Thrifts & Mortgage Finance – 0.5% | | | | | | | | | |
| | | | | |
| 70 | | Astoria Financial Corporation | | | | | | | | | 600 |
| | | | | |
| 50 | | Beneficial Mutual Bancorp Inc., (2) | | | | | | | | | 479 |
| | | | | |
| 50 | | Berkshire Hills Bancorp, Inc. | | | | | | | | | 1,038 |
| | | | | |
| 80 | | Clifton Savings Bancorp, Inc. | | | | | | | | | 860 |
| | | | | |
| 10 | | Dime Community Bancshares, Inc. | | | | | | | | | 90 |
| | | | | |
| 380 | | First Niagara Financial Group Inc. | | | | | | | | | 4,339 |
| | | | | |
| 310 | | Hudson City Bancorp, Inc. | | | | | | | | | 4,119 |
| | | | | |
| 10 | | Kearny Financial Corporation | | | | | | | | | 113 |
| | | | | |
| 440 | | New York Community Bancorp, Inc. | | | | | | | | | 4,703 |
| | | | | |
| 20 | | NewAlliance BancShares Inv | | | | | | | | | 229 |
| | | | | |
| 10 | | Northwest Bancorp, Inc. | | | | | | | | | 188 |
| | | | | |
| 10 | | OceanFirst Financial Corporation | | | | | | | | | 119 |
| | | | | |
| 170 | | People’s United Financial, Inc. | | | | | | | | | 2,556 |
| | | | | |
| 50 | | TFS Financial Corporation | | | | | | | | | 530 |
| | | | | |
| 180 | | TrustCo Bank Corporation NY | | | | | | | | | 1,063 |
| | | | | |
| 60 | | Viewpoint Financial Group | | | | | | | | | 913 |
| | | | | |
| 90 | | Washington Federal Inc. | | | | | | | | | 1,169 |
| | Total Thrifts & Mortgage Finance | | | | | | | | | 23,108 |
| | Tobacco – 1.1% | | | | | | | | | |
| | | | | |
| 180 | | Alliance One International, Inc., (2) | | | | | | | | | 683 |
| | | | | |
| 900 | | Altria Group, Inc. | | | | | | | | | 14,750 |
| | | | | |
| 140 | | Lorillard Inc. | | | | | | | | | 9,487 |
| | | | | |
| 550 | | Philip Morris International | | | | | | | | | 23,990 |
| | | | | |
| 110 | | Reynolds American Inc. | | | | | | | | | 4,247 |
| | Total Tobacco | | | | | | | | | 53,157 |
| | Trading Companies & Distributors – 0.3% | | | | | | | | | |
| | | | | |
| 300 | | Aircastle LTD | | | | | | | | | 2,204 |
| | | | | |
| 20 | | Beacon Roofing Supply Company, (2) | | | | | | | | | 288 |
| | | | | |
| 20 | | DXP Enterprises, Inc., (2) | | | | | | | | | 228 |
| | | | | |
| 50 | | Fastenal Company | | | | | | | | | 1,658 |
| | | | | |
| 20 | | H&E Equipment Services, Inc., (2) | | | | | | | | | 186 |
| | | | | |
| 380 | | RSC Holdings, Inc., (2) | | | | | | | | | 2,553 |
| | | | | |
| 90 | | TAL International Group Inc. | | | | | | | | | 980 |
Portfolio of Investments
Nuveen U.S. Equity Completeness Fund (continued)
June 30, 2009
| | | | | | | | | | | | |
| Shares | | Description (1) | | | | | | | | Value |
| | | | | | | | | | | | |
| | | Trading Companies & Distributors (continued) | | | | | | | | | |
| | | | | |
| | 90 | | Titan Machinery, Inc., (2) | | | | | | | | $ | 1,141 |
| | | | | |
| | 40 | | W.W. Grainger, Inc. | | | | | | | | | 3,274 |
| | | | | |
| | 10 | | Watsco Inc. | | | | | | | | | 488 |
| | | | | |
| | 130 | | WESCO International Inc., (2) | | | | | | | | | 3,254 |
| | | Total Trading Companies & Distributors | | | | | | | | | 16,254 |
| | | Water Utilities – 0.2% | | | | | | | | | |
| | | | | |
| | 50 | | American States Water Co | | | | | | | | | 1,731 |
| | | | | |
| | 190 | | Aqua America Inc. | | | | | | | | | 3,400 |
| | | | | |
| | 70 | | California Water Service Group | | | | | | | | | 2,578 |
| | | | | |
| | 20 | | SJW Corporation | | | | | | | | | 453 |
| | | | | |
| | 110 | | Southwest Water Company | | | | | | | | | 606 |
| | | Total Water Utilities | | | | | | | | | 8,768 |
| | | Wireless Telecommunication Services – 0.5% | | | | | | | | | |
| | | | | |
| | 100 | | American Tower Corporation, (2) | | | | | | | | | 3,152 |
| | | | | |
| | 80 | | Crown Castle International Corporation, (2) | | | | | | | | | 1,921 |
| | | | | |
| | 60 | | iPCS Inc., (2) | | | | | | | | | 897 |
| | | | | |
| | 220 | | Metropcs Communications Inc., (2) | | | | | | | | | 2,927 |
| | | | | |
| | 220 | | NII Holdings Inc., Class B, (2) | | | | | | | | | 4,194 |
| | | | | |
| | 80 | | Shenandoah Telecommunications Company | | | | | | | | | 1,622 |
| | | | | |
| | 1,290 | | Sprint Nextel Corporation, (2) | | | | | | | | | 6,204 |
| | | | | |
| | 220 | | Syniverse Holdings Inc., (2) | | | | | | | | | 3,526 |
| | | Total Wireless Telecommunication Services | | | | | | | | | 24,443 |
| | | Total Common Stocks (cost $5,368,522) | | | | | | | | | 4,588,036 |
| | | | | |
Principal
Amount (000) | | Description (1) | | | | Coupon | | Maturity | | Value |
| | | SHORT-TERM INVESTMENTS – 3.4% | | | | | | | | | |
| | | | | |
| $ | 160 | | Repurchase Agreement with State Street Bank, dated 6/30/09, repurchase price $160,383, collateralized by $165,000 U.S. Treasury Bills, 0.000%, due 12/24/09, value $164,720 | | | | 0.000% | | 7/01/09 | | $ | 160,383 |
| | | Total Short-Term Investments (cost $160,383) | | | | | | | | | 160,383 |
| | | Total Investments (cost $5,528,905) – 100.1% | | | | | | | | | 4,748,419 |
| | | Other Assets Less Liabilities – (0.1)% | | | | | | | | | (6,689) |
| | | Net Assets – 100% | | | | | | | | $ | 4,741,730 |
| | (1) | | All percentages shown in the Portfolio of Investments are based on net assets. |
| | (2) | | Non-income producing; issuer has not declared a dividend within the past twelve months. |
See accompanying notes to financial statements.
Statement of Assets and Liabilities
June 30, 2009
| | | | |
Assets | | | | |
Investments, at value (cost $5,528,905) | | $ | 4,748,419 | |
Receivables: | | | | |
Dividends | | | 7,017 | |
From Adviser | | | 13,799 | |
Investments sold | | | 1,290 | |
Total assets | | | 4,770,525 | |
Liabilities | | | | |
Accrued other expenses | | | 28,795 | |
Total liabilities | | | 28,795 | |
Net assets | | $ | 4,741,730 | |
Shares outstanding | | | 335,274 | |
Net asset value per share | | $ | 14.14 | |
Net Assets Consist of: | | | | |
Capital paid-in | | $ | 6,928,508 | |
Undistributed (Over-distribution of) net investment income | | | 60,886 | |
Accumulated net realized gain (loss) from investments | | | (1,467,178 | ) |
Net unrealized appreciation (depreciation) of investments | | | (780,486 | ) |
Net assets | | $ | 4,741,730 | |
See accompanying notes to financial statements.
Statement of Operations
Year Ended June 30, 2009
| | | | |
Investment Income | | $ | 121,134 | |
Expenses | | | | |
Management fees | | | 23,539 | |
Shareholders’ servicing agent fees and expenses | | | 1,645 | |
Custodian’s fees and expenses | | | 68,955 | |
Trustees’ fees and expenses | | | 146 | |
Professional fees | | | 28,628 | |
Shareholders’ reports – printing and mailing expenses | | | 21,847 | |
Federal and state registration fees | | | 430 | |
Other expenses | | | 243 | |
Total expenses before custodian fee credit and expense reimbursement | | | 145,433 | |
Custodian fee credit | | | (118 | ) |
Expense reimbursement | | | (111,220 | ) |
Net expenses | | | 34,095 | |
Net investment income | | | 87,039 | |
Realized and Unrealized Gain (Loss) | | | | |
Net realized gain (loss) from investments | | | (1,468,814 | ) |
Net unrealized appreciation (depreciation) of investments | | | (780,486 | ) |
Net realized and unrealized gain (loss) | | | (2,249,300 | ) |
Net increase (decrease) in net assets from operations | | $ | (2,162,261 | ) |
See accompanying notes to financial statements.
Statement of Changes in Net Assets
Year Ended June 30, 2009
| | | | |
Operations | | | | |
Net investment income | | $ | 87,039 | |
Net realized gain (loss) from investments | | | (1,468,814 | ) |
Net unrealized appreciation (depreciation) of investments | | | (780,486 | ) |
Net increase (decrease) in net assets from operations | | | (2,162,261 | ) |
Distributions to Shareholders | | | | |
From net investment income | | | (24,986 | ) |
Decrease in net assets from distributions to shareholders | | | (24,986 | ) |
Fund Share Transactions | | | | |
Proceeds from sale of shares | | | 7,623,977 | |
Cost of shares redeemed | | | (695,000 | ) |
Net increase (decrease) in net assets from Fund share transactions | | | 6,928,977 | |
Net increase (decrease) in net assets | | | 4,741,730 | |
Net assets at the beginning of year | | | — | |
Net assets at the end of year | | $ | 4,741,730 | |
Undistributed (Over-distribution of) net investment income at the end of year | | $ | 60,886 | |
See accompanying notes to financial statements.
Notes to Financial Statements
1. General Information and Significant Accounting Policies
The Nuveen Investment Trust (the “Trust”) is an open-end management investment company registered under the Investment Company Act of 1940, as amended. The Trust is comprised of Nuveen U.S. Equity Completeness Fund, (“the Fund”), among others. The Trust was organized as a Massachusetts business trust in 1996.
The Fund’s only investors are expected to be the Nuveen Conservative Allocation Fund, Nuveen Moderate Allocation Fund and Nuveen Growth Allocation Fund (collectively, the “Allocation Funds”), which are advised by Nuveen Asset Management (the “Adviser”), a wholly-owned subsidiary of Nuveen Investments, Inc. (“Nuveen”), and sub-advised by Richards & Tierney, Inc. also a subsidiary of Nuveen.
The Fund ordinarily invests at least 80% of its net assets in U.S. equity securities in an attempt to provide capital appreciation and to enhance the risk/return profile of the U.S. equity portion of the Allocation Funds.
The following is a summary of significant accounting policies followed by the Fund in the preparation of its financial statements in accordance with accounting principles generally accepted in the United States.
Investment Valuation
Exchange-listed securities are generally valued at the last sales price on the securities exchange on which such securities are primarily traded. Securities traded on a securities exchange for which there are no transactions on a given day or securities not listed on a securities exchange are valued at the mean of the closing bid and asked prices. Securities traded on NASDAQ are valued at the NASDAQ Official Closing Price. When market price quotes are not readily available, the pricing service or, in the absence of a pricing service for a particular investment, the Board of Trustees of the Fund, or its designee, may establish fair value using a wide variety of market data including yields or prices of investments of comparable quality, type of issue, market quotes or indications of value from security dealers, evaluations of anticipated cash flows or collateral, general market conditions and other information and analysis, including the obligor’s credit characteristics considered relevant. Short-term investments are valued at amortized cost, which approximates value.
Investment Transactions
Investment transactions are recorded on a trade date basis. Realized gains and losses from investment transactions are determined on the specific identification method.
Investment Income
Dividend income is recorded on the ex-dividend date or, for foreign securities, when information is available. Interest income is recorded on an accrual basis.
Dividends and Distributions to Shareholders
Dividends from net investment income and net realized capital gains from investment transactions, if any, are declared and distributed to shareholders at least annually. Furthermore, capital gains are distributed only to the extent they exceed available capital loss carryforwards.
Distributions to shareholders are recorded on the ex-dividend date. The amount and timing of distributions are determined in accordance with federal income tax regulations, which may differ from accounting principles generally accepted in the United States.
Income Taxes
The Fund intends to distribute substantially all of its net investment income and net capital gains to shareholders and to otherwise comply with the requirements of Subchapter M of the Internal Revenue Code applicable to regulated investment companies. Therefore, no federal income tax provision is required.
For all open tax years and all major taxing jurisdictions, management of the Fund has concluded that there are no significant uncertain tax positions that would require recognition in the financial statements. Open tax years are those that are open for examination by taxing authorities (i.e., generally the last four tax year ends and the interim tax period since then). Furthermore, management of the Fund is also not aware of any tax positions for which it is reasonably possible that the total amounts of unrecognized tax benefits will significantly change in the next twelve months.
Sales Charge Program
The Fund’s shares are not subject to any sales charge or 12b-1 distribution or service fees.
Derivative Financial Instruments
The Fund is authorized to invest in certain derivative financial instruments, including forwards, futures, options and swap contracts. Although the Fund is authorized to invest in such financial instruments, and may do so in the future, it did not make any such investments during the fiscal year ended June 30, 2009.
Repurchase Agreements
In connection with transactions in repurchase agreements, it is the Fund’s policy that its custodian take possession of the underlying collateral securities, the fair value of which exceeds the principal amount of the repurchase transaction, including accrued interest, at all times. If the seller defaults, and the fair value of the collateral declines, realization of the collateral may be delayed or limited.
Custodian Fee Credit
The Fund has an arrangement with the custodian bank whereby certain custodian fees and expenses are reduced by net credits earned on the Fund’s cash on deposit with the bank. Such deposit arrangements are an alternative to overnight investments. Credits for cash balances may be offset by charges for any days on which the Fund overdraws its account at the custodian bank.
Indemnifications
Under the Trust’s organizational documents, its Officers and Trustees are indemnified against certain liabilities arising out of the performance of their duties to the Trust. In addition, in the normal course of business, the Trust enters into contracts that provide general indemnifications to other parties. The Trust’s maximum exposure under these arrangements is unknown as this would involve future claims that may be made against the Trust that have not yet occurred. However, the Trust has not had prior claims or losses pursuant to these contracts and expects the risk of loss to be remote.
Use of Estimates
The preparation of financial statements in conformity with accounting principles generally accepted in the United States requires management to make estimates and assumptions that affect the reported amounts of assets and liabilities at the date of the financial statements and the reported amounts of increases and decreases in net assets from operations during the reporting period. Actual results may differ from those estimates.
2. Fair Value Measurements
During the current fiscal period, the Fund adopted the provisions of Statement of Financial Accounting Standards No. 157 (SFAS No. 157) “Fair Value Measurements.” SFAS No. 157 defines fair value, establishes a framework for measuring fair value in generally accepted accounting principles and expands disclosure about fair value measurements. In determining the value of the Fund’s investments various inputs are used. These inputs are summarized in the three broad levels listed below:
| | |
| Level 1 – | | Quoted prices in active markets for identical securities. |
| Level 2 – | | Other significant observable inputs (including quoted prices for similar securities, interest rates, prepayment speeds, credit risk, etc.). |
| Level 3 – | | Significant unobservable inputs (including management’s assumptions in determining the fair value of investments). |
The inputs or methodology used for valuing securities are not an indication of the risk associated with investing in those securities. The following is a summary of the Fund’s fair value measurements as of June 30, 2009:
| | | | | | | | | | | | |
| | | Level 1 | | Level 2 | | Level 3 | | Total |
Investments: | | | | | | | | | | | | |
Common stocks | | $ | 4,587,094 | | $ | 942 | | $ | — | | $ | 4,588,036 |
Short-Term investments | | | 160,383 | | | — | | | — | | | 160,383 |
Total | | $ | 4,747,477 | | $ | 942 | | $ | — | | $ | 4,748,419 |
3. Derivative Instruments and Hedging Activities
During the current fiscal period, the Fund adopted the provisions of Statement of Financial Accounting Standards No. 161 (SFAS No. 161) “Disclosures about Derivative Instruments and Hedging Activities.” This standard is intended to enhance financial statement disclosures for derivative instruments and hedging activities and enable investors to better understand: a) how and why a fund uses derivative instruments; b) how derivative instruments are accounted for; and c) how derivative instruments affect a fund’s financial position, results of operations and cash flows, if any. The Fund records derivative instruments at fair value with changes in fair value recognized on the Statement of Operations. Even though the Fund’s investments in derivatives may represent economic hedges, they are considered to be non-hedge transactions for SFAS No. 161 disclosure purposes. The Fund did not invest in derivative instruments during fiscal year ended June 30, 2009.
4. Fund Shares
Transactions in Fund shares were as follows:
| | | | | | | |
| | | For the Year
ended 6/30/09 | |
| | | Shares | | | Amount | |
Shares sold | | 384,419 | | | $ | 7,623,977 | |
Shares redeemed | | (49,145 | ) | | | (695,000 | ) |
Net increase (decrease) | | 335,274 | | | $ | 6,928,977 | |
Notes to Financial Statements (continued)
5. Investment Transactions
Purchases and sales (excluding short-term investments) during the fiscal year ended June 30, 2009, aggregated $9,718,005 and $2,830,109, respectively.
6. Income Tax Information
The following information is presented on an income tax basis. Differences between amounts for financial statement and federal income tax purposes are primarily due to timing differences in recognizing certain gains and losses on investment transactions. To the extent that differences arise that are permanent in nature, such amounts are reclassified within the capital accounts on the Statement of Assets and Liabilities presented in the annual report, based on their federal tax basis treatment; temporary differences do not require reclassification. Temporary and permanent differences do not impact the net asset values of the Fund.
At June 30, 2009, the cost of investments was $5,529,473.
Gross unrealized appreciation and gross unrealized depreciation of investments at June 30, 2009, were as follows:
| | | | |
| | | | |
Gross unrealized: | | | | |
Appreciation | | $ | 148,488 | |
Depreciation | | | (929,542 | ) |
Net unrealized appreciation (depreciation) of investments | | $ | (781,054 | ) |
The tax components of undistributed net ordinary income and net long-term capital gains at June 30, 2009, the Fund’s tax year end, were as follows:
| | | |
| | | |
Undistributed net ordinary income* | | $ | 61,028 |
Undistributed net long-term capital gains | | | 244 |
| * | Net ordinary income consists of net taxable income derived from dividends, interest, and net short-term capital gains, if any. |
The tax character of distributions paid during the Fund’s tax year ended June 30, 2009, was designated for purposes of the dividends paid deduction as follows:
| | | |
| | | |
Distributions from net ordinary income* | | $ | 24,986 |
Distributions from net long-term capital gains | | | — |
| * | Net ordinary income consists of net taxable income derived from dividends, interest and net short-term capital gains, if any. |
The Fund elected to defer net realized losses from investments incurred from November 1, 2008 through June 30, 2009, the Fund’s tax year end, (“post-October losses”) in accordance with federal income tax regulations. Post-October capital losses of $1,466,853 are treated as having arisen on the first day of the following fiscal year.
7. Management Fees and Other Transactions with Affiliates
The Fund’s management fee is separated into two components – a complex-level component, based on the aggregate amount of all fund assets managed by the Adviser, and a specific fund-level component, based only on the amount of assets within the Fund. This pricing structure enables Nuveen fund shareholders to benefit from growth in the assets within each individual fund as well as from growth in the amount of complex-wide assets managed by the Adviser.
The annual fund-level fee for the Fund, payable monthly, is .35%.
The annual complex-level fee, payable monthly, which is additive to the fund-level fee, for all Nuveen sponsored funds in the U.S., is based on the aggregate amount of total fund net assets managed as stated in the following table. As of June 30, 2009, the complex-level fee rate was .1970%.
The complex-level fee schedule is as follows:
| | | |
| Complex-Level Net Asset Breakpoint Level (1) | | Effective Rate at Breakpoint Level | |
$55 billion | | .2000 | % |
$56 billion | | .1996 | |
$57 billion | | .1989 | |
$60 billion | | .1961 | |
$63 billion | | .1931 | |
$66 billion | | .1900 | |
$71 billion | | .1851 | |
$76 billion | | .1806 | |
$80 billion | | .1773 | |
$91 billion | | .1691 | |
$125 billion | | .1599 | |
$200 billion | | .1505 | |
$250 billion | | .1469 | |
$300 billion | | .1445 | |
| (1) | The complex-level fee component of the management fee for the funds is calculated based upon the aggregate daily managed net assets of all Nuveen funds, with such daily managed net assets defined separately for each fund in its management agreement, but excluding assets attributable to investments in other Nuveen funds. For the complex-level and fund-level fee components, daily managed net assets include assets managed by the Adviser that are attributable to financial leverage. For those purposes, financial leverage includes the funds’ use of preferred stock and borrowings and investments in the residual interest certificates (also called inverse floating rate securities) in tender option bond (TOB) trusts, including the portion of assets held by the TOB trust that has been effectively financed by the trust’s issuance of floating rate securities, subject to an agreement by the Adviser to limit the amount of such assets for determining managed net assets in certain circumstances. |
The management fee compensates the Adviser for overall investment advisory and administrative services and general office facilities. The Adviser has entered into a Sub-Advisory Agreement with Nuveen HydePark Group, LLC (“HydePark”), a subsidiary of Nuveen, under which HydePark manages the investment portfolio of the Fund. HydePark is compensated for its services to the Fund from the management fee paid to the Adviser.
The Adviser has committed to waive fees and reimburse expenses of the Fund through October 31, 2011, so that total annual Fund operating expenses (excluding interest expenses, taxes, fees incurred in acquiring and disposing of portfolio securities and extraordinary expenses) do not exceed .80% (1.05% after October 31, 2011) of the average daily net assets of the Fund. The Adviser may also voluntarily reimburse additional expenses from time to time. Voluntary reimbursements may be terminated at any time at the Adviser’s discretion.
The Trust pays no compensation directly to those of its Trustees who are affiliated with the Adviser or to its Officers, all of whom receive remuneration for their services to the Trust from the Adviser or its affiliates. The Board of Trustees has adopted a deferred compensation plan for independent Trustees that enables Trustees to elect to defer receipt of all or a portion of the annual compensation they are entitled to receive from certain Nuveen advised funds. Under the plan, deferred amounts are treated as though equal dollar amounts had been invested in shares of select Nuveen advised funds.
At June 30, 2009, Nuveen owned 1,250 shares of the Fund.
8. Subsequent Events
In May 2009, the Financial Accounting Standards Board issued Statement of Financial Accounting Standards No. 165 (SFAS No. 165) “Subsequent Events.” SFAS No. 165 requires an entity to recognize in the financial statements the effects of all subsequent events that provide additional evidence about conditions that existed at the date of the balance sheet. SFAS No. 165 is intended to establish general standards of accounting and for disclosure of events that occur after the balance sheet date but before financial statements are issued or are available to be issued. SFAS No. 165 requires the disclosure of the date through which an entity has evaluated subsequent events and the basis for that date — that is, whether that date represents the date the financial statements were issued or were available to be issued. SFAS No. 165 is effective for interim and annual periods ending after June 15, 2009. The Fund has performed an evaluation of subsequent events through August 24, 2009, which is the date the financial statements were issued.
Financial Highlights
| | | | | | | | | | | | | | | | | | | | | | | | | | | | | | | |
| Selected data for a share outstanding throughout each period: | |
| | | | |
| | | | | Investment Operations | | | Less Distributions | | | | |
| | | | | | | | | | | | | | | | | | | | | | | | |
Year Ended
June 30, | | Beginning
Net
Asset
Value | | Net
Invest-
ment
Income(a) | | Net
Realized/
Unrealized
Gain
(Loss) | | | Total | | | Net
Invest-
ment
Income | | | Capital
Gains | | Total | | | Ending
Net
Asset
Value | | Total
Return(b) | |
2009 | | $ | 20.00 | | $ | .28 | | $ | (6.07 | ) | | $ | (5.79 | ) | | $ | (.07 | ) | | $ | — | | $ | (.07 | ) | | $ | 14.14 | | (28.96 | )% |
| | | | | | | | | | | | | | | | | | | | | | |
|
Ratios/Supplemental Data | |
| | | Ratios to Average
Net Assets
Before Credit/
Reimbursement | | | Ratios to Average
Net Assets After
Reimbursement(c) | | | Ratios to Average
Net Assets
After Credit/
Reimbursement(d) | | | | |
Ending
Net
Assets
(000) | | Expenses | | | Net
Invest-
ment
Income
(Loss) | | | Expenses | | | Net
Invest-
ment
Income
(Loss) | | | Expenses | | | Net
Invest-
ment
Income
(Loss) | | | Portfolio
Turnover
Rate | |
| $ | 4,742 | | 3.38 | % | | (.57 | )% | | .80 | % | | 2.02 | % | | .79 | % | | 2.03 | % | | 69 | % |
| (a) | Per share Net Investment Income is calculated using the average daily shares method. |
| (b) | Total return is the combination of changes in net asset value, reinvested dividend income at net asset value and reinvested capital gains distributions at net asset value, if any. Total return is not annualized. |
| (c) | After expense reimbursement from the Adviser. |
| (d) | After custodian fee credit and expense reimbursement. |
See accompanying notes to financial statements.
Annual Investment Management Agreement Approval Process
The Investment Company Act of 1940, as amended (the “1940 Act”), provides, in substance, that each investment advisory agreement between a fund and its investment adviser (including sub-advisers) will continue in effect from year to year only if its continuance is approved at least annually by the fund’s board members, including by a vote of a majority of the board members who are not parties to the advisory agreement or “interested persons” of any parties (the “Independent Board Members”), cast in person at a meeting called for the purpose of considering such approval. In connection with such approvals, the fund’s board members must request and evaluate, and the investment adviser is required to furnish, such information as may be reasonably necessary to evaluate the terms of the advisory agreement. Accordingly, at a meeting held on May 27-29, 2009 (the “May Meeting”), the Board of Trustees (the “Board,” and each Trustee, a “Board Member”) of the Fund, including a majority of the Independent Board Members, considered and approved the continuation of the advisory and sub-advisory agreements for the Fund for an additional one-year period. These agreements include the investment advisory agreement between Nuveen Asset Management (“NAM”) and the Fund and the sub-advisory agreement between NAM and Nuveen HydePark Group, LLC (the “Sub-Adviser”). In preparation for their considerations at the May Meeting, the Board also held a separate meeting on April 21-22, 2009 (the “April Meeting”). Accordingly, the factors considered and determinations made regarding the renewals by the Independent Board Members include those made at the April Meeting.
In addition, in evaluating the advisory agreement (the “Investment Management Agreement”) and the sub-advisory agreement (the “Sub-advisory Agreement,” and the Investment Management Agreement and Sub-advisory Agreement are each an “Advisory Agreement”), the Independent Board Members reviewed a broad range of information relating to the Fund, NAM and the Sub-Adviser (NAM and the Sub-Adviser are each a “Fund Adviser”), including, fee and expense information for the Fund, certain performance information as described below, the profitability of Nuveen for its advisory activities (which includes its wholly owned subsidiaries other than Winslow Capital Management, Inc. (“Winslow Capital”), which was recently acquired in December 2008), and other information regarding the organization, personnel, and services provided by the respective Fund Adviser. The Independent Board Members also met quarterly as well as at other times as the need arose during the year and took into account the information provided at such meetings and the knowledge gained therefrom. Prior to approving the renewal of the Advisory Agreements, the Independent Board Members reviewed the foregoing information with their independent legal counsel and with management, reviewed materials from independent legal counsel describing applicable law and their duties in reviewing advisory contracts, and met with independent legal counsel in private sessions without management present. The Independent Board Members considered the legal advice provided by independent legal counsel and relied upon their knowledge of the Fund Adviser, its services and the Fund resulting from their meetings and other interactions throughout the year and their own business judgment in determining the factors to be considered in evaluating the Advisory Agreements. Each Board Member may have accorded different weight to the various factors in reaching his or her conclusions with respect to the Fund’s Advisory Agreements. The Independent Board Members did not identify any single factor as all-important or controlling. The Independent Board Members’ considerations were instead based on a comprehensive consideration of all the information presented. The principal factors considered by the Board and its conclusions are described below.
A. Nature, Extent and Quality of Services
In considering renewal of the Advisory Agreements, the Independent Board Members considered the nature, extent and quality of the Fund Adviser’s services, including advisory services and administrative services. The Independent Board Members reviewed materials outlining, among other things, the Fund Adviser’s organization and business; the types of services that the Fund Adviser or its affiliates provide and are expected to provide to the Fund; and any initiatives Nuveen had taken for the applicable fund product line.
In reviewing the services provided and the initiatives undertaken during the past year, the Independent Board Members recognized the severe market turmoil experienced in the capital markets during recent periods, including sustained periods of high volatility, credit disruption and government intervention. The Independent Board Members considered the Fund Adviser’s efforts, expertise and other actions taken to address matters as they arose that impacted the Fund. The Independent Board Members recognized the role of the Investment Services group which, among other things, monitors the various positions throughout the Nuveen fund complex to identify and address any systematic risks. In addition, the Capital Markets Committee of NAM provides a multi-departmental venue for developing new policies to mitigate any risks. The Independent Board Members further recognized NAM’s continuous review of the Nuveen funds’ investment strategies and mandates in seeking to continue to refine and improve the investment process for the funds, particularly in light of market conditions. In this regard, the Independent Board Members noted the changes recommended by NAM to various investment mandates for the Nuveen funds in seeking to take advantage of market opportunities and to improve the tools available for managing liquidity and market exposure; the establishment of a team responsible for coordinating the handling of large trades in or out of the Nuveen funds; and the ongoing monitoring of investment management processes.
As part of their review, the Independent Board Members also evaluated the background, experience and track record of the Fund Adviser’s investment personnel. In this regard, the Independent Board Members considered any changes in the personnel, and the impact on the level of services provided to the Fund, if any. The Independent Board Members also reviewed information regarding portfolio manager compensation arrangements to evaluate the Fund Adviser’s ability to attract and retain high quality investment personnel, preserve stability, and reward performance but not provide an incentive for taking undue risks.
In addition to advisory services, the Independent Board Members considered the quality of administrative services provided by NAM and its affiliates including product management, fund administration, oversight of service providers, shareholder services, administration of Board relations, regulatory and portfolio compliance and legal support. Given the importance of compliance, the Independent Board Members considered NAM’s compliance program, including the report of the chief compliance officer regarding the Fund’s compliance policies and procedures.
The Independent Board Members also considered NAM’s oversight of the performance, business activities and compliance of the Sub-Adviser. In that regard, the Independent Board Members reviewed an evaluation of the Sub-Adviser from NAM. The evaluation also included information relating to the Sub-Adviser’s organization, operations, personnel, assets under management, investment philosophy, strategies and techniques in managing the Fund, developments affecting the Sub-Adviser, and an analysis of the Sub-Adviser. As described in further detail below, the Board considered certain performance information. The Board also recognized that the Sub-advisory Agreement was essentially an agreement for portfolio management services only and the Sub-Adviser was not expected to supply other significant administrative services to the Fund. As part of their oversight, the Independent Board Members also continued their program of seeking to visit each sub-adviser to the Nuveen funds at least once over a multiple year rotation, meeting with key investment and business personnel. The Independent Board Members noted that NAM recommended the renewal of the Sub-advisory Agreement and considered the basis for such recommendations and any qualifications in connection therewith.
Based on their review, the Independent Board Members found that, overall, the nature, extent and quality of services provided (and expected to be provided) to the Fund under the Investment Management Agreement or Sub-advisory Agreement, as applicable, were satisfactory.
B. Investment Performance
In considering performance, the Board noted that the Fund was recently launched and therefore its performance history was too short to be meaningful. Further, the Board recognized the unique structure of this Fund, the shares of which are intended to be offered only to other Nuveen funds (the “Investing Funds”). In this regard, the Board also reviewed the historic performance of the Investing Funds as well as compared to funds with similar investment objectives (the “Performance Peer Group”). The Independent Board Members reviewed performance information of the Investing Funds including, among other things, total return information compared with the Investing Fund’s Performance Peer Group and recognized and/or customized benchmarks for the quarter-, one-, three- and five-year periods (as applicable) ending December 31, 2008 and for the same periods (as applicable) ending March 31, 2009.
C. Fees, Expenses and Profitability
1. Fees and Expenses
The Independent Board Members reviewed the Fund’s gross management fee and net expense ratio (including fee waivers and reimbursements). In this regard, as noted above, the Independent Board Members recognized that the shares of the Fund are only intended to be offered to other Nuveen funds. Given the Fund’s unique structure, the Independent Board Members recognized that a comparable universe of unaffiliated funds (i.e., a “Peer Universe”) or a more focused subset of funds thereof (i.e., a “Peer Group”) was not available. The Independent Board Members further considered that the other Nuveen funds investing in the Fund will also be advised by NAM and sub-advised by an affiliated person of NAM. Accordingly, in evaluating the fees and expenses, the Independent Board Members also took into consideration the advisory fees paid to NAM and the affiliated sub-adviser by the Nuveen funds acquiring the Fund.
Based on their review of the fee and expense information provided, the Independent Board Members determined that the Fund’s management fees and net total expense ratio were reasonable in light of the nature, extent and quality of services provided to the Fund.
2. Comparisons with the Fees of Other Clients
The Independent Board Members further reviewed information regarding the nature of services and fee rates offered by NAM to other clients. Such clients include separately managed accounts (both retail and institutional accounts) and funds that are not offered by Nuveen but are sub-advised by one of Nuveen’s investment management teams. In evaluating the comparisons of fees, the Independent Board Members noted that the fee rates charged to the Fund and other clients vary, among other things, because of the different services involved and the additional regulatory and compliance requirements associated with registered investment companies, such as the Fund. Accordingly, the Independent Board Members considered the differences in the product types, including, but not limited to, the services provided, the structure and operations, product distribution and costs thereof, portfolio investment policies, investor profiles, account sizes and regulatory requirements. The Independent Board Members noted, in particular, that the range of services provided to the Fund (as discussed above) is much more extensive than that provided to separately managed accounts. Given the inherent differences in the products, particularly the extensive services provided to the Fund, the Independent Board Members believe such facts justify the different levels of fees.
In considering the fees of the Sub-Adviser, the Independent Board Members also considered the pricing schedule or fees that the Sub-Adviser charges for similar investment management services for other fund sponsors or clients (such as retail and/or institutional managed accounts) as applicable.
3. Profitability of Fund Advisers
In conjunction with its review of fees, the Independent Board Members also considered the profitability of Nuveen for its advisory activities (which incorporated Nuveen’s wholly-owned affiliated sub-advisers other than Winslow Capital) and its financial condition. The Independent Board Members reviewed the revenues and expenses of Nuveen’s advisory activities for the last two years, the allocation methodology used in preparing the profitability data and an analysis of the key drivers behind the changes in revenues and expenses that impacted profitability in 2008. In addition, the Independent Board Members reviewed information regarding the financial results of Nuveen for 2008 based on its Form 8-K filed on March 31, 2009. The Independent Board Members noted this
Annual Investment Management Agreement Approval Process (continued)
information supplemented the profitability information requested and received during the year to help keep them apprised of developments affecting profitability (such as changes in fee waivers and expense reimbursement commitments). In this regard, the Independent Board Members noted that they had also appointed an Independent Board Member as a point person to review and keep them apprised of changes to the profitability analysis and/or methodologies during the year. The Independent Board Members also considered Nuveen’s revenues for advisory activities, expenses, and profit margin compared to that of various unaffiliated management firms with similar amounts of assets under management and relatively comparable asset composition prepared by Nuveen.
In reviewing profitability, the Independent Board Members recognized the subjective nature of determining profitability which may be affected by numerous factors including the allocation of expenses. Further, the Independent Board Members recognized the difficulties in making comparisons as the profitability of other advisers generally is not publicly available and the profitability information that is available for certain advisers or management firms may not be representative of the industry and may be affected by, among other things, the adviser’s particular business mix, capital costs, types of funds managed and expense allocations. Notwithstanding the foregoing, the Independent Board Members reviewed Nuveen’s methodology and assumptions for allocating expenses across product lines to determine profitability. In reviewing profitability, the Independent Board Members recognized Nuveen’s investment in its fund business. Based on their review, the Independent Board Members concluded that Nuveen’s level of profitability for its advisory activities was reasonable in light of the services provided.
In evaluating the reasonableness of the compensation, the Independent Board Members also considered other amounts paid to a Fund Adviser by the Fund as well as any indirect benefits (such as soft dollar arrangements, if any) the Fund Adviser and its affiliates receive, or are expected to receive, that are directly attributable to the management of the Fund, if any. See Section E below for additional information on indirect benefits the Fund Adviser may receive as a result of its relationship with the Fund. Based on their review of the overall fee arrangements of the Fund, the Independent Board Members determined that the advisory fees and expenses of the Fund were reasonable.
D. Economies of Scale and Whether Fee Levels Reflect These Economies of Scale
With respect to economies of scale, the Independent Board Members have recognized the potential benefits resulting from the costs of a fund being spread over a larger asset base, although economies of scale are difficult to measure and predict with precision, particularly on a fund-by-fund basis. One method to help ensure the shareholders share in these benefits is to include breakpoints in the advisory fee schedule. Generally, management fees for funds in the Nuveen complex, including the Fund, are comprised of a fund-level component and a complex-level component. The Independent Board Members recognized, however, that the Fund does not have fund-level breakpoints given its unique structure.
The Board also considered the Fund’s complex-wide fee arrangement. Pursuant to the complex-wide fee arrangement, the fees of the funds in the Nuveen complex generally are reduced as the assets in the fund complex reach certain levels. The complex-wide fee arrangement seeks to provide the benefits of economies of scale to fund shareholders when total fund complex assets increase, even if assets of a particular fund are unchanged or have decreased. The approach reflects the notion that some of Nuveen’s costs are attributable to services provided to all its funds in the complex and therefore all funds benefit if these costs are spread over a larger asset base. Generally, the complex-wide pricing reduces Nuveen’s revenue because total complex fund assets have consistently grown in prior years. However, due to, among other things, the recent market downturn, total fund assets declined in 2008 resulting in a smaller downward adjustment of revenues due to complex-wide pricing compared to the prior year.
Based on their review, the Independent Board Members concluded that the complex-wide fee arrangement was acceptable and reflects economies of scale to be shared with shareholders when assets under management increase and that the absence of fund-level breakpoints was acceptable.
E. Indirect Benefits
In evaluating fees, the Independent Board Members received and considered information regarding potential “fall out” or ancillary benefits the respective Fund Adviser or its affiliates may receive as a result of its relationship with the Fund. In this regard, the Independent Board Members considered whether the Fund Adviser received any benefits from soft dollar arrangements whereby a portion of the commissions paid by the Fund for brokerage may be used to acquire research that may be useful to the Fund Adviser in managing the assets of the Fund and other clients. With respect to NAM, the Independent Board Members noted that NAM does not currently have any soft dollar arrangements; however, to the extent certain bona fide agency transactions that occur on markets that traditionally trade on a principal basis and riskless principal transactions are considered as generating “commissions,” NAM intends to comply with the applicable safe harbor provisions. With respect to the Sub-Adviser, the Independent Board Members considered that the Sub-Adviser may benefit from its soft dollar arrangements pursuant to which it receives research from brokers that execute the Fund’s portfolio transactions. The Independent Board Members further noted that the Sub-Adviser’s profitability may be lower if it were required to pay for this research with hard dollars.
Based on their review, the Independent Board Members concluded that any indirect benefits received by a Fund Adviser as a result of its relationship with the Fund were reasonable and within acceptable parameters.
F. Other Considerations
The Independent Board Members did not identify any single factor discussed previously as all-important or controlling. The Board Members, including the Independent Board Members, unanimously concluded that the terms of the Investment Management Agreement and Sub-advisory Agreement are fair and reasonable, that the respective Fund Adviser’s fees are reasonable in light of the services provided to the Fund and that the Investment Management Agreement and the Sub-advisory Agreement be renewed.
Trustees and Officers
The management of the Fund, including general supervision of the duties performed for the Fund by the Adviser, is the responsibility of the Board of Trustees of the Fund. The number of trustees of the Fund is currently set at nine. None of the trustees who are not “interested” persons of the Fund (referred to herein as “independent trustees”) has ever been a director or employee of, or consultant to, Nuveen or its affiliates. The names and business addresses of the trustees and officers of the Fund, their principal occupations and other affiliations during the past five years, the number of portfolios each oversees and other directorships they hold are set forth below.
The Fund’s Statement of Additional Information (“SAI”) includes more information about the trustees. To request a free copy, call Nuveen Investments at (800) 257-8787 or visit the Funds’ website at www.nuveen.com.
| | | | | | | | |
Name, Birthdate and Address | | Position(s) Held with the Fund | | Year First Elected or Appointed (1) | | Principal Occupation(s) Including other Directorships During Past 5 Years | | Number of Portfolios in Fund Complex Overseen by Trustee |
| | |
| Independent Trustees: | | | | |
Robert P. Bremner 8/22/40 333 W. Wacker Drive Chicago, IL 60606 | | Chairman of the Board and Trustee | | 1997 | | Private Investor and Management Consultant; Treasurer and Director, Humanities Council of Washington D.C. | | 199 |
Jack B. Evans 10/22/48 333 W. Wacker Drive Chicago, IL 60606 | | Trustee | | 1999 | | President, The Hall-Perrine Foundation, a private philanthropic corporation (since 1996); Director and Vice Chairman, United Fire Group, a publicly held company; Member of the Board of Regents for the State of Iowa University System; Director, Gazette Companies; Life Trustee of Coe College; Director, Iowa College Foundation; Member of the Advisory Council of the Department of Finance in the Tippie College of Business, University of lowa; formerly, Director, Alliant Energy; formerly, Director, Federal Reserve Bank of Chicago; formerly, President and Chief Operating Officer, SCI Financial Group, Inc., a regional financial services firm. | | 199 |
William C. Hunter 3/6/48 333 W. Wacker Drive Chicago, IL 60606 | | Trustee | | 2004 | | Dean, Tippie College of Business, University of Iowa (since 2006); Director (since 2004) of Xerox Corporation; Director (since 2005), Beta Gamma Sigma International Honor Society; formerly, Dean and Distinguished Professor of Finance, School of Business at the University of Connecticut (2003-2006); previously, Senior Vice President and Director of Research at the Federal Reserve Bank of Chicago (1995-2003); Director, SS&C Technologies, Inc. (May 2005-October 2005); formerly, Director (1997-2007), Credit Research Center at George Washington University. | | 199 |
David J. Kundert 10/28/42 333 W. Wacker Drive Chicago, IL 60606 | | Trustee | | 2005 | | Director, Northwestern Mutual Wealth Management Company; retired (since 2004) as Chairman, JPMorgan Fleming Asset Management, President and CEO, Banc One Investment Advisors Corporation, and President, One Group Mutual Funds; prior thereto, Executive Vice President, Banc One Corporation and Chairman and CEO, Banc One Investment Management Group; Member, Board of Regents, Luther College; member of the Wisconsin Bar Association; member of Board of Directors, Friends of Boerner Botanical Gardens; member of Investment Committee, Greater Milwaukee Foundation. | | 199 |
William J. Schneider 9/24/44 333 W. Wacker Drive Chicago, IL 60606 | | Trustee | | 1997 | | Chairman of Miller-Valentine Partners Ltd., a real estate investment company; formerly, Senior Partner and Chief Operating Officer (retired, 2004) of Miller-Valentine Group; Member, Dayton Philharmonic Orchestra Association; formerly, Member, Business Advisory Council, Cleveland Federal Reserve Bank; formerly, Director, Dayton Development Coalition. | | 199 |
Judith M. Stockdale 12/29/47 333 W. Wacker Drive Chicago, IL 60606 | | Trustee | | 1997 | | Executive Director, Gaylord and Dorothy Donnelley Foundation (since 1994); prior thereto, Executive Director, Great Lakes Protection Fund (from 1990 to 1994). | | 199 |
Carole E. Stone 6/28/47 333 W. Wacker Drive Chicago, IL 60606 | | Trustee | | 2007 | | Director, Chicago Board Options Exchange (since 2006); Director, C2 Options Exchange, Incorporated (since 2009); Commissioner, New York State Commission on Public Authority Reform (since 2005); formerly, Chair, New York Racing Association Oversight Board (2005-2007). | | 199 |
| | | | | | | | |
Name, Birthdate and Address | | Position(s) Held with the Fund | | Year First Elected or Appointed (1) | | Principal Occupation(s) Including other Directorships During Past 5 Years | | Number of Portfolios in Fund Complex Overseen by Trustee |
Terence J. Toth 9/29/59 333 W. Wacker Drive Chicago, IL 60606 | | Trustee | | 2008 | | Director, Legal & General Investment Management America, Inc. (since 2008); Managing Partner, Musso Capital Management (since 2008); CEO and President, Northern Trust Investments (2004-2007); Executive Vice President, Quantitative Management & Securities Lending (2000-2004); prior thereto, various positions with Northern Trust Company (since 1994); Member: Goodman Theatre Board (since 2004); Chicago Fellowship Board (since 2005), University of Illinois Leadership Council Board (since 2007) and Catalyst Schools of Chicago Board (since 2008); formerly, Member: Northern Trust Mutual Funds Board (2005-2007), Northern Trust Investments Board (2004-2007), Northern Trust Japan Board (2004-2007), Northern Trust Securities Inc. Board (2003-2007) and Northern Trust Hong Kong Board (1997-2004). | | 199 |
| | |
| Interested Trustee: | | | | |
John P. Amboian (2) 6/14/61 333 W. Wacker Drive Chicago, IL 60606 | | Trustee | | 2008 | | Chief Executive Officer (since July 2007) and Director (since 1999) of Nuveen Investments, Inc.; Chief Executive Officer (since 2007) of Nuveen Asset Management, Nuveen Investments Advisors, Inc. formerly, President (1999-2004) of Nuveen Advisory Corp. and Nuveen Institutional Advisory Corp. (3) | | 199 |
Name, Birthdate and Address | | Position(s) Held with the Fund | | Year First Elected or Appointed (4) | | Principal Occupation(s) During Past 5 Years | | Number of Portfolios in Fund Complex Overseen by Officer |
| | |
| Officers of the Fund: | | | | |
Gifford R. Zimmerman 9/9/56 333 W. Wacker Drive Chicago, IL 60606 | | Chief Administrative Officer | | 1988 | | Managing Director (since 2002), Assistant Secretary and Associate General Counsel of Nuveen Investments, LLC; Managing Director (since 2002), Associate General Counsel and Assistant Secretary, of Nuveen Asset Management (since 2002) and of Symphony Asset Management LLC (since 2003); Vice President and Assistant Secretary of NWQ Investment Management Company, LLC. (since 2002), Nuveen Investments Advisers Inc. (since 2002), Tradewinds Global Investors, LLC, and Santa Barbara Asset Management, LLC (since 2006), Nuveen HydePark Group LLC and Nuveen Investment Solutions, Inc. (since 2007); Managing Director (since 2004) and Assistant Secretary (since 1994) of Nuveen Investments, Inc.; formerly, Managing Director (2002-2004), General Counsel (1998-2004) and Assistant Secretary of Nuveen Advisory Corp. and Nuveen Institutional Advisory Corp. (3); Chartered Financial Analyst. | | 199 |
Mark J.P. Anson 6/10/59 333 W. Wacker Drive Chicago, IL 60606 | | Vice President | | 2009 | | President and Executive Director of Nuveen Investments, Inc. (since 2007); President of Nuveen Investments Institutional Services Group LLC (since 2007); previously, Chief Executive Officer of the British Telecom Pension Scheme (2006-2007) and Chief Investment Officer of Calpers (1999-2006); PhD, Chartered Financial Analyst, Chartered Alternative Investment Analyst, Certified Public Accountant, Certified Management Accountant and Certified Internal Auditor. | | 199 |
Nizida Arriaga 6/1/1968 333 W. Wacker Drive Chicago, IL 60606 | | Vice President | | 2009 | | Vice President (since 2007) of Nuveen Investments, LLC; previously, Portfolio Manager, Allstate Investments, LLC (1996-2006); Chartered Financial Analyst. | | 199 |
Trustees and Officers (continued)
| | | | | | | | |
Name, Birthdate and Address | | Position(s) Held with the Fund | | Year First Elected or Appointed (4) | | Principal Occupation(s) During Past 5 Years | | Number of Portfolios in Fund Complex Overseen by Officer |
Michael T. Atkinson 2/3/66 333 W. Wacker Drive Chicago, IL 60606 | | Vice President and Assistant Secretary | | 2000 | | Vice President (since 2002) of Nuveen Investments, LLC; Vice President of Nuveen Asset Management (since 2005). | | 199 |
Margo L. Cook 4/11/64 333 W. Wacker Drive Chicago, IL 60606 | | Vice President | | 2009 | | Executive Vice President (since Oct 2008) of Nuveen Investments, Inc.; previously, Head of Institutional Asset Management (2007-2008) of Bear Stearns Asset Management; Head of Institutional Asset Mgt (1986-2007) of Bank of NY Mellon; Chartered Financial Analyst. | | 199 |
Alan A. Brown 8/1/62 333 W. Wacker Drive Chicago, IL 60606 | | Vice President | | 2007 | | Executive Vice President, Mutual Funds, Nuveen Investments, LLC, (since 2005), previously, Managing Director and Chief Marketing Officer (2001-2005). | | 74 |
Name, Birthdate and Address | | Position(s) Held with the Fund | | Year First Elected or Appointed (4) | | Principal Occupation(s) Including other Directorships During Past 5 Years | | Number of Portfolios in Fund Complex Overseen by Officer |
Lorna C. Ferguson 10/24/45 333 W. Wacker Drive Chicago, IL 60606 | | Vice President | | 1998 | | Managing Director (since 2004) of Nuveen Investments, LLC; Managing Director (since 2005) of Nuveen Asset Management; Managing Director (2004-2005) of Nuveen Advisory Corp. and Nuveen Institutional Advisory Corp. (3). | | 199 |
Stephen D. Foy 5/31/54 333 W. Wacker Drive Chicago, IL 60606 | | Vice President and Controller | | 1998 | | Vice President (since 1993) and Funds Controller (since 1998) of Nuveen Investments, LLC; Vice President (since 2005) of Nuveen Asset Management; Certified Public Accountant. | | 199 |
William T. Huffman 5/7/1969 333 W. Wacker Drive Chicago, IL 60606 | | Vice President | | 2009 | | Chief Operating Officer, Municipal Fixed Income (since 2008) of Nuveen Asset Management; previously, Chairman, President and Chief Executive Officer (2002 – 2007) of Northern Trust Global Advisors, Inc. and Chief Executive Officer (2007) of Northern Trust Global Investments Limited; CPA. | | 199 |
Walter M. Kelly 2/24/70 333 W. Wacker Drive Chicago, IL 60606 | | Chief Compliance Officer and Vice President | | 2003 | | Senior Vice President (since 2008), Vice President (2006- 2008) formerly, Assistant Vice President and Assistant General Counsel (2003-2006) of Nuveen Investments, LLC; Vice President (since 2006) and Assistant Secretary (since 2003) of Nuveen Asset Management. | | 199 |
David J. Lamb 3/22/63 333 W. Wacker Drive Chicago, IL 60606 | | Vice President | | 2000 | | Senior Vice President (since 2009), formerly, Vice President (2000-2009) of Nuveen Investments, LLC; Vice President (since 2005) of Nuveen Asset Management, Certified Public Accountant. | | 199 |
Tina M. Lazar 8/27/61 333 W. Wacker Drive Chicago, IL 60606 | | Vice President | | 2002 | | Senior Vice President (since 2009), formerly, Vice President of Nuveen Investments, LLC (1999-2009); Vice President of Nuveen Asset Management (since 2005). | | 199 |
Larry W. Martin 7/27/51 333 W. Wacker Drive Chicago, IL 60606 | | Vice President and Assistant Secretary | | 1988 | | Vice President, Assistant Secretary and Assistant General Counsel of Nuveen Investments, LLC; Vice President (since 2005) and Assistant Secretary of Nuveen Investments, Inc.; Vice President and Assistant Secretary of Nuveen Investments Advisers Inc. (since 2002), NWQ Investment Management Company, LLC (since 2002), Symphony Asset Management LLC (since 2003), Tradewinds Global Investors, LLC, Santa Barbara Asset Management, LLC (since 2006) and of Nuveen HydePark Group, LLC and Nuveen Investment Solutions, Inc. (since 2007); formerly, Vice President and Assistant Secretary of Nuveen Advisory Corp. and Nuveen Institutional Advisory Corp. (3) | | 199 |
| | | | | | | | |
Name, Birthdate and Address | | Position(s) Held with the Fund | | Year First Elected or Appointed (4) | | Principal Occupation(s) Including other Directorships During Past 5 Years | | Number of Portfolios in Fund Complex Overseen by Officer |
Kevin J. McCarthy 3/26/66 333 W. Wacker Drive Chicago, IL 60606 | | Vice President and Secretary | | 2007 | | Managing Director (since 2008), formerly, Vice President (2007-2008), Nuveen Investments, LLC; Managing Director (since 2008), formerly, Vice President and Assistant Secretary, Nuveen Asset Management and Nuveen Investments Holdings, Inc.; Vice President (since 2007) and Assistant Secretary, Nuveen Investment Advisers Inc., Nuveen Investment Institutional Services Group LLC, NWQ Investment Management Company, LLC, Tradewinds Global Investors LLC, NWQ Holdings, LLC, Symphony Asset Management LLC, Santa Barbara Asset Management LLC, Nuveen HydePark Group, LLC and Nuveen Investment Solutions, Inc. (since 2007); prior thereto, Partner, Bell, Boyd & Lloyd LLP (1997-2007). | | 199 |
John V. Miller 4/10/67 333 W. Wacker Drive Chicago, IL 60606 | | Vice President | | 2007 | | Managing Director (since 2007), formerly, Vice President (2002-2007) of Nuveen Asset Management and Nuveen Investments, LLC; Chartered Financial Analyst. | | 199 |
Gregory Mino 1/4/1971 333 W. Wacker Drive Chicago, IL 60606 | | Vice President | | 2009 | | Vice President of Nuveen Investments, LLC (since 2008); previously, Director (2004-2007) and Executive Director (2007-2008) of UBS Global Asset Management; previously, Vice President (2000-2003) and Director (2003-2004) of Merrill Lynch Investment Managers; Chartered Financial Analyst. | | 199 |
Christopher M. Rohrbacher 8/1/71 333 W. Wacker Drive Chicago, IL 60606 | | Vice President and Assistant Secretary | | 2008 | | Vice President, Nuveen Investments, LLC (since 2008); Vice President and Assistant Secretary, Nuveen Asset Management (since 2008); prior thereto, Associate, Skadden, Arps, Slate Meagher & Flom LLP (2002-2008) | | 199 |
James F. Ruane 7/3/62 333 W. Wacker Drive Chicago, IL 60606 | | Vice President and Assistant Secretary | | 2007 | | Vice President, Nuveen Investments (since 2007); prior thereto, Partner, Deloitte & Touche USA LLP (2005-2007), formerly, senior tax manager (2002-2005); Certified Public Accountant. | | 199 |
John S. White 5/12/67 333 W. Wacker Drive Chicago, IL 60606 | | Vice President | | 2007 | | Senior Vice President (since 2009), formerly, Vice President (2006-2009) of Nuveen Investments, LLC, formerly, Assistant Vice President (since 2002); Lieutenant Colonel (since 2007), United States Marine Corps Reserve, formerly, Major (since 2001). | | 74 |
Mark L. Winget 12/21/68 333 W. Wacker Drive Chicago, IL 60606 | | Vice President and Assistant Secretary | | 2008 | | Vice President, Nuveen Investments, LLC (since 2008); Vice President and Assistant Secretary, Nuveen Asset Management (since 2008); prior thereto, Counsel, VedderPrice P.C. (1997-2007). | | 199 |
| (1) | Trustees serve an indefinite term until his/her successor is elected or appointed. The year first elected or appointed represents the year in which the trustee was first elected or appointed to any fund in the Nuveen Fund Complex. |
| (2) | Mr. Amboian is an interested trustee because of his position with Nuveen Investments, Inc. and certain of its subsidiaries, which are affiliates of the Nuveen Funds. |
| (3) | Nuveen Advisory Corp. and Nuveen Institutional Advisory Corp. were reorganized into Nuveen Asset Management, effective January 1, 2005. |
| (4) | Officers serve one year terms through July of each year. The year first elected or appointed represents the year in which the officer was first elected or appointed to any fund in the Nuveen Fund Complex. |
Glossary of Terms Used in this Report
Average Annual Total Return: This is a commonly used method to express an investment’s performance over a particular, usually multi-year time period. It expresses the return that would have been necessary each year to equal the investment’s actual cumulative performance (including change in NAV or offer price and reinvested dividends and capital gains distributions, if any) over the time period being considered.
Net Asset Value (NAV): A Fund’s NAV is the dollar value of one share in the Fund. It is calculated by subtracting the liabilities of the Fund from its total assets and then dividing the remainder by the number of shares outstanding. Fund NAVs are calculated at the end of each business day.
Fund Information
Fund Manager
Nuveen Asset Management
333 West Wacker Drive
Chicago, IL 60606
Sub-Advisers
Nuveen HydePark Group, LLC
111 West Jackson Blvd.
Suite 1411
Chicago, IL 60604
Legal Counsel
Chapman and Cutler LLP
Chicago, IL
Independent Registered
Public Accounting Firm
PricewaterhouseCoopers LLP
Chicago, IL
Custodian
State Street Bank & Trust Company
Boston, MA
Transfer Agent and Shareholder Services
Boston Financial
Data Services
Nuveen Investor Services
P.O. Box 8530
Boston, MA 02266-8530
(800) 257-8787
Distribution Information
Nuveen U.S. Equity Completeness Fund hereby designates 100% of dividends paid from net ordinary income as dividends qualifying for the 70% dividends received deduction for corporations and 100% qualified dividend income for individuals under Section 1 (h)(11) of the Internal Revenue Code. The actual qualified dividend income distributions will be reported to shareholders on Form 1099-DIV which will be sent to shareholders shortly after calendar year end.
Quarterly Portfolio of Investments and Proxy Voting Information: You may obtain (i) each Fund’s quarterly portfolio of investments, (ii) information regarding how the Funds voted proxies relating to portfolio securities held during the most recent twelve-month period ended June 30, 2009, and (iii) a description of the policies and procedures that the Funds used to determine how to vote proxies relating to portfolio securities without charge, upon request, by calling Nuveen Investments at (800) 257-8787 or on Nuveen’s website at www.nuveen.com.
You may also obtain this and other Fund information directly from the Securities and Exchange Commission (“SEC”). The SEC may charge a copying fee for this information. Visit the SEC on-line at http://www.sec.gov or in person at the SEC’s Public Reference Room in Washington, D.C. Call the SEC at (202) 942-8090 for room hours and operation. You may also request Fund information by sending an e-mail request to publicinfo@sec.gov or by writing to the SEC’s Public Reference Section at 100 F Street NE, Washington, D.C. 20549.
The Financial Industry Regulatory Authority (FINRA) provides a Public Disclosure Program which supplies certain information regarding the disciplinary history of FINRA members and their associated persons in response to either telephone inquiries at (800) 289-9999 or written inquiries at www.finra.org. Financial Industry Regulatory Authority also provides an investor brochure that includes information describing the Public Disclosure Program.
Nuveen Investments:
Serving Investors For Generations
Since 1898, financial advisors and their clients have relied on Nuveen Investments to provide dependable investment solutions. Over this time, Nuveen Investments has adhered to the belief that the best approach to investing is to apply conservative risk-management principles to help minimize volatility.
Building on this tradition, we today offer a range of high quality equity and fixed-income solutions that can be integral parts of a well-diversified core portfolio. Our clients have come to appreciate this diversity, as well as our continued adherence to proven, long-term investing principles.
We offer many different investing solutions
for our clients’ different needs.
Nuveen Investments is a global investment management firm that seeks to help secure the long-term goals of institutions and high net worth investors as well as the consultants and financial advisors who serve them. Nuveen Investments markets its growing range of specialized investment solutions under the high-quality brands of HydePark, NWQ, Nuveen, Santa Barbara, Symphony, Tradewinds and Winslow Capital. In total, the Company managed $128 billion of assets on June 30, 2009.
Find out how we can help you reach your financial goals.
An investor should carefully consider the Fund’s objectives, risks, charges and expenses before investing. For a prospectus containing this and other information about the Fund, please contact your financial advisor or Nuveen Investments at (800) 257-8787. Read the prospectus carefully before you invest or send money.
Learn more about Nuveen Funds at www.nuveen.com/mf
| | |
Distributed by Nuveen Investments, LLC 333 West Wacker Drive Chicago, IL 60606 www.nuveen.com | | |
MAN-COMP-0609P

Mutual Funds
Nuveen Equity Funds
For investors seeking long-term capital appreciation.
Annual Report
June 30, 2009
|
| Nuveen Enhanced Core Equity Plus Fund |
LIFE IS COMPLEX.
Nuveen makes things e-simple.
It only takes a minute to sign up for e-Reports. Once enrolled, you’ll receive an e-mail as soon as your Nuveen Investments Fund information is ready. No more waiting for delivery by regular mail. Just click on the link within the e-mail to see the report and save it on your computer if you wish.
Free e-Reports right to your e-mail!
www.investordelivery.com
If you receive your Nuveen Fund dividends and statements from your financial advisor or brokerage account.
OR
www.nuveen.com/accountaccess
If you receive your Nuveen Fund dividends and statements directly from Nuveen.
| | | | | | |
| Must be preceded by or accompanied by a prospectus. | | NOT FDIC INSURED | | MAY LOSE VALUE | | NO BANK GUARANTEE |
Chairman’s
Letter to Shareholders

Dear Shareholder,
The problems in the U.S. financial system and the slowdown in global economic activity continue to create a very difficult environment for the U.S. economy. The administration, the Federal Reserve System and Congress have initiated a variety of programs directed at restoring liquidity to the financial markets, providing financial support for critical financial institutions and stimulating economic activity. There are encouraging signs that these initiatives are beginning to have a constructive impact. It is not possible to predict whether the actions taken to date will be sufficient to restore more normal conditions in the financial markets or enable the economy to stabilize and set a course toward recovery. However, the speed and scope of the government’s actions are very encouraging and more importantly, reflect a commitment to act decisively to meet the economic challenges we face.
The performance information in the attached report reflects the impact of many forces at work in the equity and fixed-income markets. The comments by the portfolio managers describe the strategies being used to pursue your Fund’s long-term investment goals. Parts of the financial markets continue to experience serious dislocations and thorough research and strong investment disciplines have never been more important in identifying risks and opportunities. I hope you will read this information carefully.
Your Board is particularly sensitive to our shareholders’ concerns in these uncertain times. We believe that frequent and thorough communication is essential in this regard and encourage you to visit the Nuveen website: www.nuveen.com, for recent developments in all Nuveen funds. We also encourage you to communicate with your financial consultant for answers to your questions and to seek advice on your long-term investment strategy in the current market environment.
On behalf of myself and the other members of your Fund’s Board, we look forward to continuing to earn your trust in the months and years ahead.
Sincerely,

Robert P. Bremner
Chairman of the Nuveen Fund Board
August 24, 2009
Portfolio Managers’ Comments
Certain statements in this report are forward-looking statements. Discussions of specific investments are for illustration only and are not intended as recommendations of individual investments. The forward-looking statements and other views expressed herein are those of the portfolio managers as of the date of this report. Actual future results or occurrences may differ significantly from those anticipated in any forward-looking statements and the views expressed herein are subject to change at any time, due to numerous market and other factors. The Fund disclaims any obligation to update publicly or revise any forward-looking statements or views expressed herein.
The Nuveen Enhanced Core Equity Plus Fund features management by Nuveen HydePark Group, LLC, (HydePark), an affiliate of Nuveen Investments, Inc. The Fund is co-managed by David Tierney, PhD, Senior Managing Director and Chief Investment Officer of HydePark, John Gambla, CFA, and Rob Guttschow, CFA. We recently spoke with David, John and Rob about the general market environment, key investment strategies and performance of the Fund for the period from the Fund’s inception on December 29, 2008, through June 30, 2009.
What were the general economic conditions during the reporting period?
Economic conditions during this initial reporting period were extremely difficult. We entered the period in the midst of a serious economic contraction created in part by the downturn in housing prices across the U.S. The leveraged nature of home purchases combined with the wide dissemination of that mortgage debt across the financial sector resulted in large losses at many financial institutions. During the last six months of 2008, those losses almost brought the entire U.S. financial system to a grinding halt.
As a result, volatility in the equity markets continued throughout most of this reporting period. However, the second quarter of 2009 saw substantial improvements. The U.S. government continued to implement various financial bailout/stimulus plans. The major banks appeared to have raised the necessary capital for them to survive in the current downturn, with several of them even appearing to thrive. Equity markets, as measured by the S&P 500 Index, have rocketed up from the lows experienced in March. Ten-year bond yields have come off their multi-decade lows as well.
How did the Fund perform during the period since inception through June 30, 2009?
The table on page four provides performance information for the Fund (Class A Shares at net asset value) for the period since its inception on December 29, 2008, through June 30, 2009. The table also compares the Fund’s performance to the appropriate benchmark.
The Nuveen Enhanced Core Equity Plus Fund may invest in long positions of equity securities equaling up to 150% of the value of its assets, and may hold short positions in equities representing up to 50% of its assets. The proprietary risk-controlled HydePark wealth creation model was used to manage the Fund since its inception. This model utilizes both fundamental and momentum-related criteria to create a portfolio designed to maximize the reward-to-risk ratio.
Our investment process is a combination of traditional fundamental security valuation and quantitative risk-control techniques. The philosophy that underlies our value-added
process is that a stock’s price must follow the wealth creation fundamentals of the company. A stock’s weight in the portfolio is directly related to its wealth creation fundamentals. Our process has five “wealth creation” factors. Four are fundamentally oriented; two are traditional measures of revenues in excess of expenses (specifically, earnings and cash flow), and two are traditional measures of the uses for those excess monies (book value and dividends). The fifth factor is a proprietary measure of stock price momentum. Importantly, the process also considers a stock’s liquidity. Due to the quantitative, model-driven process, top-down macroeconomic “themes” do not influence the model nor how we select stocks for the Fund.
The model evaluates all the securities contained in the benchmark portfolio (S&P 500 Index) for possible inclusion in the portfolio. The process will not consider a stock for possible inclusion if it is not contained in the respective benchmark portfolio.
This process is intended to produce a well-diversified, efficient portfolio that performs within a specific, narrow tracking range (the degree of difference) versus the stated benchmark. The portfolio typically contains a large number of holdings with each relative weighting reflecting the five-dimensional view of that stock’s wealth creation characteristics: earnings, cash flow, book value, dividends and momentum. The portfolio is monitored daily with major rebalances occurring quarterly.
How did this strategy influence performance?
The Fund began investment operations on December 29, 2008. During the period from the Fund’s inception through June 30, 2009, it underperformed the S&P 500 Index.
We believe the quantitative, risk-controlled process described above should, under normal circumstances, cause the Fund to track its benchmark portfolio closely, with value-added potential coming from the relative overweights/underweights of each stock versus the index. We attempt to express an overweight/underweight opinion on every stock in the benchmark based on our analysis of its five wealth creation factors.
The sum of the Fund’s individual security overweights/underweights versus the index is, by definition, equal to zero, however, the HydePark process does not constrain the portfolio to be industry or sector neutral relative to the benchmark. As a result, the Fund will sometimes overweight a sector because, in aggregate, stocks in that sector had what we judged to be attractive wealth creation fundamentals versus the benchmark. Performance for the portfolio can then be viewed in two parts: return attributable to the Fund’s sector weightings and return attributable to the performance of individual stocks within each sector.
| 1 | The Lipper Extended U.S. Large-Cap Core Funds Index is a managed index that represents the average annualized returns of all funds in the Lipper Extended U.S. Large-Cap Core Funds category. The returns assume reinvestment of dividends, but do not reflect any applicable sales charges. Index performance is for the period 12/31/08-6/30/09 as returns are available only on a calendar month basis. You cannot invest directly in an index. |
| 2 | The S&P 500 Index is an unmanaged index generally considered representative of the U.S. stock market. The index returns assume reinvestment of dividends, but do not reflect any applicable sales charges. Index performance is for the period 12/31/08-6/30/09 as returns are available only on a calendar month basis. You cannot invest directly in an index. |
On average, during the reporting period, the Fund was relatively overweighted in energy, consumer staples, telecommunication, and utility stocks, with the largest overweight in energy. The Fund was underweight in materials, industrials, health care, financials, and information technology. Overall, sector weightings had a negative impact on the Fund’s performance versus the index.
Performance attributable to the individual stock holdings within each sector also was a negative for the Fund during the reporting period. The largest negative impacts came from the holdings within the financial, consumer discretionary, and health care sectors.
Class A Shares – Cumulative Total Returns
As of 6/30/09
| | |
| | | Since
inception
(12/29/2008) |
Nuveen Enhanced Core Equity Plus Fund | | |
A Shares at NAV | | -1.25% |
A Shares at Offer | | -6.93% |
Lipper Extended U.S. Large-Cap Core Funds Index1 | | 6.97% |
S&P 500 Index2 | | 7.20% |
Returns quoted represent past performance which is no guarantee of future results. Investment returns and principal value will fluctuate so that when shares are redeemed, they may be worth more or less than their original cost. Returns less than one year are cumulative. Current performance may be higher or lower than the performance shown. Class A Shares have a 5.75% maximum sales charge. Returns at NAV would be lower if sales charges were included. Returns do not reflect the deduction of taxes that a shareholder would pay on Fund distributions or the redemption of shares. For the most recent month-end performance, visit www.nuveen.com or call (800) 257-8787.
Please see the Fund’s Spotlight Page later in this report for more complete performance data and expense ratios.
Nuveen Enhanced Core Equity Plus Fund
Growth of an Assumed $10,000 Investment
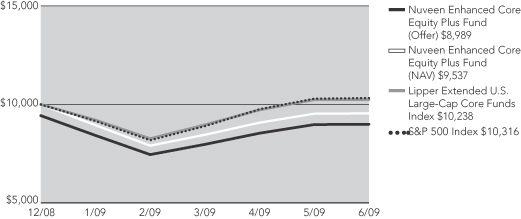
The graph does not reflect the deduction of taxes that a shareholder may pay on Fund distributions or the redemption of shares.
The index comparisons show the change in value of a $10,000 investment in the Class A Shares of the Nuveen Enhanced Core Equity Plus Fund compared with the corresponding indexes. The Lipper Extended U.S. Large-Cap Core Funds Index is a managed index that represents the average annualized returns of all the funds in the Lipper Extended U.S. Large-Cap Core Funds category. The S&P 500 Index is an unmanaged index generally considered to be representative of the U.S. stock market. The index returns assume reinvestment of dividends and do not reflect any initial or ongoing expenses. You cannot invest directly in an index. The Nuveen Enhanced Core Equity Plus Fund returns include reinvestment of all dividends and distributions, and the Fund’s returns at the offer price depicted in the chart reflects the initial maximum sales charge applicable to Class A Shares (5.75%) and all ongoing Fund expenses. The performance data quoted represents past performance, which is not indicative of future results. Current performance may be lower or higher than the performance shown.
Fund Spotlight as of 6/30/09 Nuveen Enhanced Core Equity Plus Fund
| | | | | | | | |
| Quick Facts | | | | | | | | |
| | | A Shares | | C Shares | | R3 Shares | | I Shares |
NAV | | $19.75 | | $19.67 | | $19.72 | | $19.77 |
Inception Date | | 12/29/08 | | 12/29/08 | | 12/29/08 | | 12/29/08 |
Returns quoted represent past performance which is no guarantee of future results. Investment returns and principal value will fluctuate so that when shares are redeemed, they may be worth more or less than their original cost. Current performance may be higher or lower than the performance shown. Returns without sales charges would be lower if the sales charge were included. Returns do not reflect the deduction of taxes that a shareholder would pay on Fund distributions or the redemption of shares. For the most recent month-end performance visit www.nuveen.com or call (800) 257-8787.
Returns reflect differences in sales charges and expenses, which are primarily differences in distribution and service fees. Fund returns assume reinvestment of dividends and capital gains. Class A Shares have a 5.75% maximum sales charge. Class A Share purchases of $1 million or more are sold at net asset value without an up-front sales charge but may be subject to a contingent deferred sales charge (CDSC), also known as a back end sales charge, if redeemed within twelve months of purchase. Class C Shares have a 1% CDSC for redemptions within less than one year, which is not reflected in the one-year total return. Class R3 shares have no sales charge and are available to only certain retirement plans. Class I Shares have no sales charge and may be purchased under limited circumstances or by specified classes of investors. Returns may reflect an expense limitation by the Fund’s investment adviser.
| | | | |
| Cumulative Total Returns as of 6/30/09 |
| | |
| A Shares | | NAV | | Offer |
Since Inception | | -1.25% | | -6.93% |
| | |
| C Shares | | NAV | | w/CDSC |
Since Inception | | -1.65% | | -2.63% |
| | |
| R3 Shares | | NAV | | |
Since Inception | | -1.40% | | |
| | |
| I Shares | | NAV | | |
Since Inception | | -1.15% | | |
| | |
|
| Top Five Common Stock Holdings3 |
Exxon Mobil Corporation | | 5.8% |
AT&T Inc. | | 2.9% |
Chevron Corporation | | 2.5% |
Johnson & Johnson | | 2.5% |
General Electric Company | | 2.2% |
Fund Allocation 1
| | | | |
| Common Stocks | | 103.0% | | |
| Common Stocks Sold Short | | (3.6)% | | |
| Other2 | | 0.6% | | |
| | |
| Portfolio Statistics |
| Net Assets ($000) | | $3,458 |
| Number of Common Stocks3 | | 398 |
| | | | | | |
| Expense Ratios | | | | | | |
| Share Class | | Gross
Expense
Ratios | | Net
Expense
Ratios | | As of
Date |
| Class A | | 1.72% | | 1.59% | | 12/29/08 |
| Class C | | 2.47% | | 2.34% | | 12/29/08 |
| Class R3 | | 1.97% | | 1.84% | | 12/29/08 |
| Class I | | 1.47% | | 1.34% | | 12/29/08 |
The expense ratios shown factor in Total Annual Fund Operating Expenses including management fees and other fees and expenses, and are based on an estimated $50 million average net asset size for the Fund’s first fiscal year. The Net Expense Ratios reflect a contractual commitment by the Fund’s investment adviser to waive fees and reimburse expenses through November 30, 2011. Absent the waiver and reimbursement, the Net Expense Ratios would be higher and total returns would be less.
These expense ratios may vary from the expense ratios elsewhere in this report.
| 1 | As a percentage of total net assets as of June 30, 2009. Holdings are subject to change. |
| 2 | Other assets less liabilities. |
| 3 | Excluding common stocks sold short. |
Fund Spotlight as of 6/30/09 Nuveen Enhanced Core Equity Plus Fund
| | |
| Industries1 | | |
Oil, Gas & Consumable Fuels | | 15.8% |
Pharmaceuticals | | 9.0% |
Diversified Telecommunication Services | | 5.9% |
Media | | 4.3% |
Computers & Peripherals | | 3.9% |
Electric Utilities | | 3.8% |
Food & Staples Retailing | | 3.2% |
Industrial Conglomerates | | 3.1% |
Household Products | | 2.8% |
Multi-Utilities | | 2.8% |
Software | | 2.7% |
Diversified Financial Services | | 2.7% |
Tobacco | | 2.6% |
Aerospace & Defense | | 2.4% |
Food Products | | 2.3% |
Insurance | | 2.0% |
Specialty Retail | | 2.0% |
Commercial Banks | | 2.0% |
Hotels, Restaurants & Leisure | | 1.7% |
Chemicals | | 1.6% |
Machinery | | 1.6% |
Semiconductors & Equipment | | 1.6% |
Beverages | | 1.6% |
Other | | 18.6% |
| 1 | As a percentage of total investments (excluding common stocks sold short) as of June 30, 2009. Holdings are subject to change. |
Expense Example
As a shareholder of the Fund, you incur two types of costs: (1) transaction costs, including front and back end sales charges (loads) or redemption fees, where applicable; and (2) ongoing costs, including management fees; distribution and service (12b-1) fees, where applicable; and other Fund expenses. This Example is intended to help you understand your ongoing costs (in dollars) of investing in the Fund and to compare these costs with the ongoing costs of investing in other mutual funds.
The Example below is based on an investment of $1,000 invested at the beginning of the period and held for the period.
The information under “Actual Performance,” together with the amount you invested, allows you to estimate actual expenses incurred over the reporting period. Simply divide your account value by $1,000 (for example, an $8,600 account value divided by $1,000 = 8.60) and multiply the result by the cost shown for your share class, in the row entitled “Expenses Incurred During Period” to estimate the expenses incurred on your account during this period.
The information under “Hypothetical Performance,” provides information about hypothetical account values and hypothetical expenses based on the Fund’s actual expense ratio and an assumed rate of return of 5% per year before expenses, which is not the Fund’s actual return. The hypothetical account values and expenses may not be used to estimate the actual ending account balance or expense you incurred for the period. You may use this information to compare the ongoing costs of investing in the Fund and other Funds. To do so, compare this 5% hypothetical example with the 5% hypothetical examples that appear in the shareholder reports of the other funds.
Please note that the expenses shown in the table are meant to highlight your ongoing costs only and do not reflect any transactional costs, such as front and back end sales charges (loads) or redemption fees, where applicable. Therefore, the hypothetical information is useful in comparing ongoing costs only, and will not help you determine the relative total costs of owning different funds or share classes. In addition, if these transactional costs were included, your costs would have been higher.
| | | | | | | | | | | | | | | | | | | | | | | | | | |
| | | | | | | | | | | | | Hypothetical Performance |
| | | Actual Performance | | | | (5% return before expenses) |
| | | A Shares | | C Shares | | R3 Shares | | I Shares | | | | A Shares | | C Shares | | R3 Shares | | I Shares |
| Beginning Account Value (1/01/09) | | $ | 1,000.00 | | $ | 1,000.00 | | $ | 1,000.00 | | $ | 1,000.00 | | | | $ | 1,000.00 | | $ | 1,000.00 | | $ | 1,000.00 | | $ | 1,000.00 |
| Ending Account Value (6/30/09) | | $ | 953.60 | | $ | 949.80 | | $ | 952.20 | | $ | 954.60 | | | | $ | 1,017.85 | | $ | 1,014.03 | | $ | 1,016.51 | | $ | 1,018.99 |
| Expenses Incurred During Period | | $ | 6.88 | | $ | 10.49 | | $ | 8.08 | | $ | 5.67 | | | | $ | 7.10 | | $ | 10.84 | | $ | 8.35 | | $ | 5.86 |
For each class of the Fund, expenses are equal to the Fund’s annualized net expense ratio of 1.42%, 2.17%, 1.67% and 1.17% for Classes A, C, R3 and I, respectively, multiplied by the average account value over the period, multiplied by 181/365 (to reflect the one-half year period).
Report of
Independent Registered Public Accounting Firm
To the Board of Trustees and Shareholders of
Nuveen Investment Trust:
In our opinion, the accompanying statement of assets and liabilities, including the portfolio of investments, and the related statements of operations, of changes in net assets and the financial highlights present fairly, in all material respects, the financial position of Nuveen Enhanced Core Equity Plus Fund (a series of the Nuveen Investment Trust, hereafter referred to as the “Fund”) at June 30, 2009, the results of its operations, the changes in its net assets and the financial highlights for the period December 29, 2008 (commencement of operations) through June 30, 2009, in conformity with accounting principles generally accepted in the United States of America. These financial statements and financial highlights (hereafter referred to as “financial statements”) are the responsibility of the Fund’s management; our responsibility is to express an opinion on these financial statements based on our audit. We conducted our audit of these financial statements in accordance with the standards of the Public Company Accounting Oversight Board (United States). Those standards require that we plan and perform the audit to obtain reasonable assurance about whether the financial statements are free of material misstatement. An audit includes examining, on a test basis, evidence supporting the amounts and disclosures in the financial statements, assessing the accounting principles used and significant estimates made by management, and evaluating the overall financial statement presentation. We believe that our audit, which included confirmation of securities at June 30, 2009 by correspondence with the custodian and brokers, provides a reasonable basis for our opinion.
PRICEWATERHOUSECOOPERS LLP
Chicago, IL
August 31, 2009
Portfolio of Investments
Nuveen Enhanced Core Equity Plus Fund
June 30, 2009
| | | | | | | | | | | |
| Shares | | Description (1) | | | | | | | | Value |
| | | | | | | | | | | |
| | COMMON STOCKS – 103.0% | | | | | | | | | |
| | | | | |
| | Aerospace & Defense – 2.4% | | | | | | | | | |
| | | | | |
| 110 | | Boeing Company, (3) | | | | | | | | $ | 4,675 |
| | | | | |
| 170 | | General Dynamics Corporation | | | | | | | | | 9,416 |
| | | | | |
| 70 | | Goodrich Corporation, (3) | | | | | | | | | 3,498 |
| | | | | |
| 260 | | Honeywell International Inc., (3) | | | | | | | | | 8,164 |
| | | | | |
| 80 | | ITT Industries, Inc., (3) | | | | | | | | | 3,560 |
| | | | | |
| 50 | | L-3 Communications Holdings, Inc., (3) | | | | | | | | | 3,469 |
| | | | | |
| 150 | | Lockheed Martin Corporation, (3) | | | | | | | | | 12,098 |
| | | | | |
| 150 | | Northrop Grumman Corporation, (3) | | | | | | | | | 6,852 |
| | | | | |
| 20 | | Precision Castparts Corporation, (3) | | | | | | | | | 1,461 |
| | | | | |
| 170 | | Raytheon Company, (3) | | | | | | | | | 7,553 |
| | | | | |
| 60 | | Rockwell Collins, Inc., (3) | | | | | | | | | 2,504 |
| | | | | |
| 410 | | United Technologies Corporation, (3) | | | | | | | | | 21,304 |
| | Total Aerospace & Defense | | | | | | | | | 84,554 |
| | Air Freight & Logistics – 0.2% | | | | | | | | | |
| | | | | |
| 30 | | C.H. Robinson Worldwide, Inc., (3) | | | | | | | | | 1,565 |
| | | | | |
| 120 | | FedEx Corporation, (3) | | | | | | | | | 6,674 |
| | Total Air Freight & Logistics | | | | | | | | | 8,239 |
| | Auto Components – 0.1% | | | | | | | | | |
| | | | | |
| 210 | | Goodyear Tire & Rubber Company, (2), (3) | | | | | | | | | 2,365 |
| | Automobiles – 0.6% | | | | | | | | | |
| | | | | |
| 2,940 | | Ford Motor Company, (2), (3) | | | | | | | | | 17,846 |
| | | | | |
| 160 | | Harley-Davidson, Inc. | | | | | | | | | 2,594 |
| | Total Automobiles | | | | | | | | | 20,440 |
| | Beverages – 1.6% | | | | | | | | | |
| | | | | |
| 40 | | Brown-Forman Corporation, (3) | | | | | | | | | 1,719 |
| | | | | |
| 440 | | Coca-Cola Company, (3) | | | | | | | | | 21,116 |
| | | | | |
| 260 | | Coca-Cola Enterprises Inc., (3) | | | | | | | | | 4,329 |
| | | | | |
| 20 | | Constellation Brands, Inc., Class A, (2), (3) | | | | | | | | | 254 |
| | | | | |
| 50 | | Dr. Pepper Snapple Group, (2) | | | | | | | | | 1,060 |
| | | | | |
| 70 | | Molson Coors Brewing Company, Class B, (3) | | | | | | | | | 2,963 |
| | | | | |
| 80 | | Pepsi Bottling Group, Inc., (3) | | | | | | | | | 2,707 |
| | | | | |
| 390 | | PepsiCo, Inc., (3) | | | | | | | | | 21,434 |
| | Total Beverages | | | | | | | | | 55,582 |
| | Biotechnology – 1.6% | | | | | | | | | |
| | | | | |
| 720 | | Amgen Inc., (2), (3) | | | | | | | | | 38,117 |
| | | | | |
| 70 | | Biogen Idec Inc., (2), (3) | | | | | | | | | 3,161 |
| | | | | |
| 40 | | Cephalon, Inc., (2), (3) | | | | | | | | | 2,266 |
| | | | | |
| 20 | | Genzyme Corporation, (2) | | | | | | | | | 1,113 |
| | | | | |
| 220 | | Gilead Sciences, Inc., (2), (3) | | | | | | | | | 10,305 |
| | Total Biotechnology | | | | | | | | | 54,962 |
| | Building Products – 0.0% | | | | | | | | | |
| | | | | |
| 20 | | Masco Corporation, (3) | | | | | | | | | 192 |
| | Capital Markets – 0.7% | | | | | | | | | |
| | | | | |
| 80 | | Ameriprise Financial, Inc., (3) | | | | | | | | | 1,942 |
| | | | | |
| 150 | | Bank of New York Company, Inc. | | | | | | | | | 4,397 |
Portfolio of Investments
Nuveen Enhanced Core Equity Plus Fund (continued)
June 30, 2009
| | | | | | | | | | | |
| Shares | | Description (1) | | | | | | | | Value |
| | | | | | | | | | | |
| | Capital Markets (continued) | | | | | | | | | |
| | | | | |
| 120 | | Charles Schwab Corporation | | | | | | | | $ | 2,105 |
| | | | | |
| 20 | | Federated Investors Inc., (3) | | | | | | | | | 482 |
| | | | | |
| 10 | | Franklin Resources, Inc., (3) | | | | | | | | | 720 |
| | | | | |
| 100 | | Invesco LTD, (3) | | | | | | | | | 1,782 |
| | | | | |
| 10 | | Janus Capital Group Inc., (3) | | | | | | | | | 114 |
| | | | | |
| 250 | | Morgan Stanley, (3) | | | | | | | | | 7,128 |
| | | | | |
| 110 | | Northern Trust Corporation | | | | | | | | | 5,905 |
| | Total Capital Markets | | | | | | | | | 24,575 |
| | Chemicals – 1.7% | | | | | | | | | |
| | | | | |
| 40 | | Air Products & Chemicals Inc. | | | | | | | | | 2,584 |
| | | | | |
| 20 | | CF Industries Holdings, Inc. | | | | | | | | | 1,483 |
| | | | | |
| 1,730 | | Dow Chemical Company, (3) | | | | | | | | | 27,922 |
| | | | | |
| 430 | | E.I. Du Pont de Nemours and Company, (3) | | | | | | | | | 11,017 |
| | | | | |
| 60 | | Eastman Chemical Company | | | | | | | | | 2,274 |
| | | | | |
| 20 | | Ecolab Inc., (3) | | | | | | | | | 780 |
| | | | | |
| 30 | | International Flavors & Fragrances Inc., (3) | | | | | | | | | 982 |
| | | | | |
| 90 | | PPG Industries, Inc. | | | | | | | | | 3,951 |
| | | | | |
| 80 | | Praxair, Inc., (3) | | | | | | | | | 5,686 |
| | | | | |
| 20 | | Sigma-Aldrich Corporation, (3) | | | | | | | | | 991 |
| | Total Chemicals | | | | | | | | | 57,670 |
| | Commercial Banks – 2.0% | | | | | | | | | |
| | | | | |
| 570 | | BB&T Corporation, (3) | | | | | | | | | 12,529 |
| | | | | |
| 70 | | Comerica Incorporated, (3) | | | | | | | | | 1,481 |
| | | | | |
| 30 | | First Horizon National Corporation, (2), (3) | | | | | | | | | 366 |
| | | | | |
| 80 | | Huntington BancShares Inc., (3) | | | | | | | | | 334 |
| | | | | |
| 40 | | M&T Bank Corporation, (3) | | | | | | | | | 2,037 |
| | | | | |
| 240 | | PNC Financial Services Group, Inc., (3) | | | | | | | | | 9,314 |
| | | | | |
| 120 | | Regions Financial Corporation, (3) | | | | | | | | | 485 |
| | | | | |
| 1,020 | | U.S. Bancorp, (3) | | | | | | | | | 18,278 |
| | | | | |
| 1,070 | | Wells Fargo & Company, (3) | | | | | | | | | 25,958 |
| | Total Commercial Banks | | | | | | | | | 70,782 |
| | Commercial Services & Supplies – 0.7% | | | | | | | | | |
| | | | | |
| 60 | | Avery Dennison Corporation, (3) | | | | | | | | | 1,541 |
| | | | | |
| 70 | | Cintas Corporation, (3) | | | | | | | | | 1,599 |
| | | | | |
| 80 | | Pitney Bowes Inc., (3) | | | | | | | | | 1,754 |
| | | | | |
| 330 | | R.R. Donnelley & Sons Company, (3) | | | | | | | | | 3,835 |
| | | | | |
| 130 | | Republic Services, Inc., (3) | | | | | | | | | 3,173 |
| | | | | |
| 10 | | Stericycle Inc., (2), (3) | | | | | | | | | 515 |
| | | | | |
| 420 | | Waste Management, Inc., (3) | | | | | | | | | 11,827 |
| | Total Commercial Services & Supplies | | | | | | | | | 24,244 |
| | Communications Equipment – 0.8% | | | | | | | | | |
| | | | | |
| 770 | | Cisco Systems, Inc., (2) | | | | | | | | | 14,353 |
| | | | | |
| 90 | | Harris Corporation | | | | | | | | | 2,552 |
| | | | | |
| 22 | | Harris Stratex Networks, Inc., (2) | | | | | | | | | 143 |
| | | | | |
| 220 | | QUALCOMM, Inc., (3) | | | | | | | | | 9,944 |
| | | | | |
| 60 | | Tellabs Inc., (2) | | | | | | | | | 344 |
| | Total Communications Equipment | | | | | | | | | 27,336 |
| | | | | | | | | | | |
| Shares | | Description (1) | | | | | | | | Value |
| | | | | | | | | | | |
| | Computers & Peripherals – 4.0% | | | | | | | | | |
| | | | | |
| 120 | | Apple, Inc., (2) | | | | | | | | $ | 17,092 |
| | | | | |
| 270 | | Dell Inc., (2) | | | | | | | | | 3,707 |
| | | | | |
| 450 | | EMC Corporation, (2), (3) | | | | | | | | | 5,895 |
| | | | | |
| 850 | | Hewlett-Packard Company, (3) | | | | | | | | | 32,853 |
| | | | | |
| 730 | | International Business Machines Corporation (IBM), (3) | | | | | | | | | 76,227 |
| | | | | |
| 70 | | Lexmark International, Inc., Class A, (2), (3) | | | | | | | | | 1,110 |
| | | | | |
| 30 | | QLogic Corporation, (2) | | | | | | | | | 380 |
| | | | | |
| 40 | | Teradata Corporation, (2), (3) | | | | | | | | | 937 |
| | Total Computers & Peripherals | | | | | | | | | 138,201 |
| | Construction & Engineering – 0.0% | | | | | | | | | |
| | | | | |
| 30 | | Fluor Corporation, (3) | | | | | | | | | 1,539 |
| | Construction Materials – 0.0% | | | | | | | | | |
| | | | | |
| 40 | | Vulcan Materials Company, (3) | | | | | | | | | 1,724 |
| | Consumer Finance – 0.3% | | | | | | | | | |
| | | | | |
| 150 | | Capital One Financial Corporation, (3) | | | | | | | | | 3,282 |
| | | | | |
| 650 | | Discover Financial Services, (3) | | | | | | | | | 6,676 |
| | Total Consumer Finance | | | | | | | | | 9,958 |
| | Containers & Packaging – 0.2% | | | | | | | | | |
| | | | | |
| 60 | | Ball Corporation, (3) | | | | | | | | | 2,710 |
| | | | | |
| 70 | | Bemis Company, Inc., (3) | | | | | | | | | 1,764 |
| | | | | |
| 60 | | Pactiv Corporation, (2), (3) | | | | | | | | | 1,302 |
| | | | | |
| 60 | | Sealed Air Corporation, (3) | | | | | | | | | 1,107 |
| | Total Containers & Packaging | | | | | | | | | 6,883 |
| | Distributors – 0.1% | | | | | | | | | |
| | | | | |
| 100 | | Genuine Parts Company, (3) | | | | | | | | | 3,356 |
| | Diversified Consumer Services – 0.1% | | | | | | | | | |
| | | | | |
| 30 | | Apollo Group, Inc., (2), (3) | | | | | | | | | 2,134 |
| | | | | |
| 150 | | H & R Block Inc., (3) | | | | | | | | | 2,585 |
| | Total Diversified Consumer Services | | | | | | | | | 4,719 |
| | Diversified Financial Services – 2.8% | | | | | | | | | |
| | | | | |
| 2,890 | | Bank of America Corporation | | | | | | | | | 38,148 |
| | | | | |
| 1,630 | | JPMorgan Chase & Co., (3) | | | | | | | | | 55,599 |
| | | | | |
| 30 | | Leucadia National Corporation, (2), (3) | | | | | | | | | 633 |
| | | | | |
| 10 | | Nasdaq Stock Market, Inc., (2), (3) | | | | | �� | | | | 213 |
| | | | | |
| 20 | | New York Stock Exchange Euronext, (3) | | | | | | | | | 545 |
| | Total Diversified Financial Services | | | | | | | | | 95,138 |
| | Diversified Telecommunication Services – 6.1% | | | | | | | | | |
| | | | | |
| 4,110 | | AT&T Inc. | | | | | | | | | 102,089 |
| | | | | |
| 160 | | CenturyTel, Inc., (3) | | | | | | | | | 4,912 |
| | | | | |
| 200 | | Embarq Corporation, (3) | | | | | | | | | 8,412 |
| | | | | |
| 370 | | Frontier Communications Corporation, (3) | | | | | | | | | 2,642 |
| | | | | |
| 2,700 | | Qwest Communications International Inc., (3) | | | | | | | | | 11,205 |
| | | | | |
| 2,490 | | Verizon Communications Inc., (3) | | | | | | | | | 76,518 |
| | | | | |
| 740 | | Windstream Corporation | | | | | | | | | 6,186 |
| | Total Diversified Telecommunication Services | | | | | | | | | 211,964 |
Portfolio of Investments
Nuveen Enhanced Core Equity Plus Fund (continued)
June 30, 2009
| | | | | | | | | | | |
| Shares | | Description (1) | | | | | | | | Value |
| | | | | | | | | | | |
| | Electric Utilities – 3.9% | | | | | | | | | |
| | | | | |
| 50 | | Allegheny Energy, Inc., (3) | | | | | | | | $ | 1,283 |
| | | | | |
| 490 | | American Electric Power Company, Inc., (3) | | | | | | | | | 14,156 |
| | | | | |
| 1,170 | | Duke Energy Corporation, (3) | | | | | | | | | 17,070 |
| | | | | |
| 230 | | Edison International, (3) | | | | | | | | | 7,236 |
| | | | | |
| 120 | | Entergy Corporation | | | | | | | | | 9,302 |
| | | | | |
| 310 | | Exelon Corporation, (3) | | | | | | | | | 15,875 |
| | | | | |
| 250 | | FirstEnergy Corp. | | | | | | | | | 9,688 |
| | | | | |
| 270 | | FPL Group, Inc. | | | | | | | | | 15,352 |
| | | | | |
| 230 | | Pepco Holdings, Inc., (3) | | | | | | | | | 3,091 |
| | | | | |
| 120 | | Pinnacle West Capital Corporation | | | | | | | | | 3,618 |
| | | | | |
| 200 | | PPL Corporation | | | | | | | | | 6,592 |
| | | | | |
| 290 | | Progress Energy, Inc., (3) | | | | | | | | | 10,971 |
| | | | | |
| 640 | | Southern Company | | | | | | | | | 19,942 |
| | Total Electric Utilities | | | | | | | | | 134,176 |
| | Electrical Equipment – 0.4% | | | | | | | | | |
| | | | | |
| 90 | | Cooper Industries, Ltd., Class A, (3) | | | | | | | | | 2,795 |
| | | | | |
| 250 | | Emerson Electric Company, (3) | | | | | | | | | 8,100 |
| | | | | |
| 60 | | Rockwell Automation, Inc., (3) | | | | | | | | | 1,927 |
| | Total Electrical Equipment | | | | | | | | | 12,822 |
| | Electronic Equipment & Instruments – 1.1% | | | | | | | | | |
| | | | | |
| 30 | | Agilent Technologies, Inc., (2), (3) | | | | | | | | | 609 |
| | | | | |
| 30 | | Amphenol Corporation, Class A, (3) | | | | | | | | | 949 |
| | | | | |
| 1,500 | | Corning Incorporated, (3) | | | | | | | | | 24,090 |
| | | | | |
| 10 | | Molex Inc., (3) | | | | | | | | | 156 |
| | | | | |
| 580 | | Tyco Electronics, Limited, (3) | | | | | | | | | 10,782 |
| | Total Electronic Equipment & Instruments | | | | | | | | | 36,586 |
| | Energy Equipment & Services – 1.0% | | | | | | | | | |
| | | | | |
| 130 | | Baker Hughes Incorporated, (3) | | | | | | | | | 4,737 |
| | | | | |
| 150 | | BJ Services Company, (3) | | | | | | | | | 2,045 |
| | | | | |
| 20 | | Cooper Cameron Corporation, (2), (3) | | | | | | | | | 566 |
| | | | | |
| 20 | | Diamond Offshore Drilling, Inc., (3) | | | | | | | | | 1,661 |
| | | | | |
| 120 | | ENSCO International Incorporated | | | | | | | | | 4,184 |
| | | | | |
| 20 | | Halliburton Company | | | | | | | | | 414 |
| | | | | |
| 410 | | Nabors Industries Inc., (2), (3) | | | | | | | | | 6,388 |
| | | | | |
| 140 | | National-Oilwell Varco Inc., (2) | | | | | | | | | 4,572 |
| | | | | |
| 200 | | Noble Corporation | | | | | | | | | 6,050 |
| | | | | |
| 110 | | Rowan Companies Inc., (3) | | | | | | | | | 2,125 |
| | | | | |
| 50 | | Schlumberger Limited, (3) | | | | | | | | | 2,706 |
| | Total Energy Equipment & Services | | | | | | | | | 35,448 |
| | Food & Staples Retailing – 3.3% | | | | | | | | | |
| | | | | |
| 80 | | Costco Wholesale Corporation | | | | | | | | | 3,656 |
| | | | | |
| 390 | | CVS Caremark Corporation | | | | | | | | | 12,429 |
| | | | | |
| 470 | | Kroger Co. | | | | | | | | | 10,364 |
| | | | | |
| 290 | | Safeway Inc., (3) | | | | | | | | | 5,907 |
| | | | | |
| 300 | | SUPERVALU INC. | | | | | | | | | 3,885 |
| | | | | |
| 310 | | Sysco Corporation, (3) | | | | | | | | | 6,969 |
| | | | | | | | | | | |
| Shares | | Description (1) | | | | | | | | Value |
| | | | | | | | | | | |
| | Food & Staples Retailing (continued) | | | | | | | | | |
| | | | | |
| 320 | | Walgreen Co., (3) | | | | | | | | $ | 9,408 |
| | | | | |
| 1,260 | | Wal-Mart Stores, Inc., (3) | | | | | | | | | 61,034 |
| | Total Food & Staples Retailing | | | | | | | | | 113,652 |
| | Food Products – 2.4% | | | | | | | | | |
| | | | | |
| 390 | | Archer-Daniels-Midland Company | | | | | | | | | 10,440 |
| | | | | |
| 130 | | Campbell Soup Company, (3) | | | | | | | | | 3,825 |
| | | | | |
| 320 | | ConAgra Foods, Inc., (3) | | | | | | | | | 6,099 |
| | | | | |
| 100 | | Dean Foods Company, (2), (3) | | | | | | | | | 1,919 |
| | | | | |
| 220 | | General Mills, Inc. | | | | | | | | | 12,324 |
| | | | | |
| 170 | | H.J. Heinz Company | | | | | | | | | 6,069 |
| | | | | |
| 70 | | Hershey Foods Corporation, (3) | | | | | | | | | 2,520 |
| | | | | |
| 30 | | Hormel Foods Corporation | | | | | | | | | 1,036 |
| | | | | |
| 70 | | JM Smucker Company, (3) | | | | | | | | | 3,406 |
| | | | | |
| 110 | | Kellogg Company, (3) | | | | | | | | | 5,123 |
| | | | | |
| 960 | | Kraft Foods Inc. | | | | | | | | | 24,326 |
| | | | | |
| 70 | | McCormick & Company, Incorporated | | | | | | | | | 2,277 |
| | | | | |
| 350 | | Sara Lee Corporation | | | | | | | | | 3,416 |
| | | | | |
| 60 | | Tyson Foods, Inc., Class A, (3) | | | | | | | | | 757 |
| | Total Food Products | | | | | | | | | 83,537 |
| | Gas Utilities – 0.1% | | | | | | | | | |
| | | | | |
| 40 | | Nicor Inc., (3) | | | | | | | | | 1,385 |
| | | | | |
| 80 | | Questar Corporation | | | | | | | | | 2,485 |
| | Total Gas Utilities | | | | | | | | | 3,870 |
| | Health Care Equipment & Supplies – 0.8% | | | | | | | | | |
| | | | | |
| 220 | | Baxter International, Inc. | | | | | | | | | 11,651 |
| | | | | |
| 60 | | Becton, Dickinson and Company, (3) | | | | | | | | | 4,279 |
| | | | | |
| 20 | | C. R. Bard, Inc., (3) | | | | | | | | | 1,489 |
| | | | | |
| 190 | | Covidien PLC | | | | | | | | | 7,114 |
| | | | | |
| 10 | | DENTSPLY International Inc., (3) | | | | | | | | | 305 |
| | | | | |
| 10 | | Hospira Inc., (2) | | | | | | | | | 385 |
| | | | | |
| 70 | | Medtronic, Inc. | | | | | | | | | 2,442 |
| | | | | |
| 20 | | Saint Jude Medical Inc., (2), (3) | | | | | | | | | 822 |
| | Total Health Care Equipment & Supplies | | | | | | | | | 28,487 |
| | Health Care Providers & Services – 1.5% | | | | | | | | | |
| | | | | |
| 120 | | Aetna Inc., (3) | | | | | | | | | 3,006 |
| | | | | |
| 80 | | AmerisourceBergen Corporation, (3) | | | | | | | | | 1,419 |
| | | | | |
| 110 | | Cardinal Health, Inc., (3) | | | | | | | | | 3,361 |
| | | | | |
| 40 | | CIGNA Corporation | | | | | | | | | 964 |
| | | | | |
| 60 | | Coventry Health Care, Inc., (2), (3) | | | | | | | | | 1,123 |
| | | | | |
| 60 | | Davita Inc., (2), (3) | | | | | | | | | 2,968 |
| | | | | |
| 50 | | Express Scripts, Inc., (2) | | | | | | | | | 3,438 |
| | | | | |
| 50 | | Humana Inc., (2), (3) | | | | | | | | | 1,613 |
| | | | | |
| 30 | | Laboratory Corporation of America Holdings, (2), (3) | | | | | | | | | 2,034 |
| | | | | |
| 100 | | McKesson HBOC Inc. | | | | | | | | | 4,400 |
| | | | | |
| 160 | | Medco Health Solutions, Inc., (2), (3) | | | | | | | | | 7,298 |
| | | | | |
| 70 | | Quest Diagnostics Incorporated, (3) | | | | | | | | | 3,950 |
Portfolio of Investments
Nuveen Enhanced Core Equity Plus Fund (continued)
June 30, 2009
| | | | | | | | | | | |
| Shares | | Description (1) | | | | | | | | Value |
| | | | | | | | | | | |
| | Health Care Providers & Services (continued) | | | | | | | | | |
| | | | | |
| 160 | | UnitedHealth Group Incorporated | | | | | | | | $ | 3,997 |
| | | | | |
| 250 | | Wellpoint Inc., (2) | | | | | | | | | 12,723 |
| | Total Health Care Providers & Services | | | | | | | | | 52,294 |
| | Health Care Technology – 0.0% | | | | | | | | | |
| | | | | |
| 30 | | IMS Health Incorporated | | | | | | | | | 381 |
| | Hotels, Restaurants & Leisure – 1.8% | | | | | | | | | |
| | | | | |
| 360 | | Carnival Corporation | | | | | | | | | 9,277 |
| | | | | |
| 90 | | Darden Restaurants, Inc., (3) | | | | | | | | | 2,968 |
| | | | | |
| 710 | | McDonald’s Corporation, (3) | | | | | | | | | 40,818 |
| | | | | |
| 50 | | Starwood Hotels & Resorts Worldwide, Inc., (3) | | | | | | | | | 1,110 |
| | | | | |
| 50 | | Wyndham Worldwide Corporation, (3) | | | | | | | | | 606 |
| | | | | |
| 180 | | YUM! Brands, Inc., (3) | | | | | | | | | 6,001 |
| | Total Hotels, Restaurants & Leisure | | | | | | | | | 60,780 |
| | Household Durables – 0.4% | | | | | | | | | |
| | | | | |
| 40 | | Black & Decker Corporation, (3) | | | | | | | | | 1,146 |
| | | | | |
| 100 | | Fortune Brands Inc., (3) | | | | | | | | | 3,474 |
| | | | | |
| 80 | | Leggett and Platt Inc., (3) | | | | | | | | | 1,218 |
| | | | | |
| 30 | | Pulte Corporation, (2), (3) | | | | | | | | | 265 |
| | | | | |
| 20 | | Snap-on Incorporated, (3) | | | | | | | | | 575 |
| | | | | |
| 50 | | Stanley Works | | | | | | | | | 1,692 |
| | | | | |
| 100 | | Whirlpool Corporation, (3) | | | | | | | | | 4,256 |
| | Total Household Durables | | | | | | | | | 12,626 |
| | Household Products – 2.9% | | | | | | | | | |
| | | | | |
| 60 | | Clorox Company, (3) | | | | | | | | | 3,350 |
| | | | | |
| 140 | | Colgate-Palmolive Company, (3) | | | | | | | | | 9,904 |
| | | | | |
| 240 | | Kimberly-Clark Corporation | | | | | | | | | 12,583 |
| | | | | |
| 1,470 | | Procter & Gamble Company, (3) | | | | | | | | | 75,117 |
| | Total Household Products | | | | | | | | | 100,954 |
| | Independent Power Producers & Energy Traders – 0.4% | | | | | | | | | |
| | | | | |
| 1,180 | | AES Corporation, (2), (3) | | | | | | | | | 13,700 |
| | | | | |
| 40 | | Constellation Energy Group, (3) | | | | | | | | | 1,063 |
| | | | | |
| 180 | | Dynegy Inc., (2), (3) | | | | | | | | | 409 |
| | Total Independent Power Producers & Energy Traders | | | | | | | | | 15,172 |
| | Industrial Conglomerates – 3.2% | | | | | | | | | |
| | | | | |
| 260 | | 3M Co. | | | | | | | | | 15,626 |
| | | | | |
| 6,730 | | General Electric Company, (3) | | | | | | | | | 78,873 |
| | | | | |
| 500 | | Textron Inc., (3) | | | | | | | | | 4,830 |
| | | | | |
| 380 | | Tyco International Ltd. | | | | | | | | | 9,872 |
| | Total Industrial Conglomerates | | | | | | | | | 109,201 |
| | Insurance – 2.1% | | | | | | | | | |
| | | | | |
| 20 | | Allstate Corporation, (3) | | | | | | | | | 488 |
| | | | | |
| 260 | | Aon Corporation, (3) | | | | | | | | | 9,846 |
| | | | | |
| 300 | | Chubb Corporation, (3) | | | | | | | | | 11,964 |
| | | | | |
| 140 | | Cincinnati Financial Corporation, (3) | | | | | | | | | 3,129 |
| | | | | |
| 220 | | Lincoln National Corporation, (3) | | | | | | | | | 3,786 |
| | | | | |
| 270 | | Loews Corporation | | | | | | | | | 7,398 |
| | | | | |
| 160 | | Marsh & McLennan Companies, Inc., (3) | | | | | | | | | 3,221 |
| | | | | | | | | | | |
| Shares | | Description (1) | | | | | | | | Value |
| | | | | | | | | | | |
| | Insurance (continued) | | | | | | | | | |
| | | | | |
| 250 | | MetLife, Inc. | | | | | | | | $ | 7,503 |
| | | | | |
| 20 | | Torchmark Corporation, (3) | | | | | | | | | 741 |
| | | | | |
| 520 | | Travelers Companies, Inc., (3) | | | | | | | | | 21,341 |
| | | | | |
| 130 | | Unum Group | | | | | | | | | 2,062 |
| | | | | |
| 120 | | XL Capital Ltd, Class A, (3) | | | | | | | | | 1,375 |
| | Total Insurance | | | | | | | | | 72,854 |
| | Internet & Catalog Retail – 0.1% | | | | | | | | | |
| | | | | |
| 50 | | Amazon.com, Inc., (2), (3) | | | | | | | | | 4,183 |
| | | | | |
| 10 | | Expedia, Inc., (2), (3) | | | | | | | | | 151 |
| | Total Internet & Catalog Retail | | | | | | | | | 4,334 |
| | Internet Software & Services – 0.6% | | | | | | | | | |
| | | | | |
| 20 | | eBay Inc., (2), (3) | | | | | | | | | 343 |
| | | | | |
| 50 | | Google Inc., Class A, (2) | | | | | | | | | 21,080 |
| | Total Internet Software & Services | | | | | | | | | 21,423 |
| | IT Services – 1.0% | | | | | | | | | |
| | | | | |
| 80 | | Affiliated Computer Services, Inc., (2), (3) | | | | | | | | | 3,554 |
| | | | | |
| 250 | | Automatic Data Processing, Inc. | | | | | | | | | 8,860 |
| | | | | |
| 20 | | Cognizant Technology Solutions Corporation, Class A, (2) | | | | | | | | | 534 |
| | | | | |
| 250 | | Computer Sciences Corporation, (2), (3) | | | | | | | | | 11,075 |
| | | | | |
| 110 | | Fidelity National Information Services, (3) | | | | | | | | | 2,196 |
| | | | | |
| 50 | | Fiserv, Inc., (2), (3) | | | | | | | | | 2,285 |
| | | | | |
| 10 | | MasterCard, Inc., (3) | | | | | | | | | 1,673 |
| | | | | |
| 100 | | Paychex, Inc., (3) | | | | | | | | | 2,520 |
| | | | | |
| 50 | | Total System Services Inc. | | | | | | | | | 670 |
| | Total IT Services | | | | | | | | | 33,367 |
| | Leisure Equipment & Products – 0.2% | | | | | | | | | |
| | | | | |
| 340 | | Eastman Kodak Company, (3) | | | | | | | | | 1,006 |
| | | | | |
| 90 | | Hasbro, Inc., (3) | | | | | | | | | 2,182 |
| | | | | |
| 240 | | Mattel, Inc. | | | | | | | | | 3,852 |
| | Total Leisure Equipment & Products | | | | | | | | | 7,040 |
| | Life Sciences Tools & Services – 0.2% | | | | | | | | | |
| | | | | |
| 30 | | Life Technologies Corporation, (2) | | | | | | | | | 1,252 |
| | | | | |
| 10 | | Millipore Corporation, (2), (3) | | | | | | | | | 702 |
| | | | | |
| 20 | | Perkinelmer Inc., (3) | | | | | | | | | 348 |
| | | | | |
| 90 | | Thermo Fisher Scientific, Inc., (2), (3) | | | | | | | | | 3,669 |
| | | | | |
| 10 | | Waters Corporation, (2) | | | | | | | | | 515 |
| | Total Life Sciences Tools & Services | | | | | | | | | 6,486 |
| | Machinery – 1.7% | | | | | | | | | |
| | | | | |
| 410 | | Caterpillar Inc., (3) | | | | | | | | | 13,546 |
| | | | | |
| 110 | | Cummins Inc. | | | | | | | | | 3,873 |
| | | | | |
| 50 | | Danaher Corporation | | | | | | | | | 3,087 |
| | | | | |
| 70 | | Deere & Company, (3) | | | | | | | | | 2,797 |
| | | | | |
| 120 | | Dover Corporation, (3) | | | | | | | | | 3,971 |
| | | | | |
| 120 | | Eaton Corporation, (3) | | | | | | | | | 5,353 |
| | | | | |
| 10 | | Flowserve Corporation, (3) | | | | | | | | | 698 |
| | | | | |
| 170 | | Illinois Tool Works, Inc., (3) | | | | | | | | | 6,348 |
Portfolio of Investments
Nuveen Enhanced Core Equity Plus Fund (continued)
June 30, 2009
| | | | | | | | | | | |
| Shares | | Description (1) | | | | | | | | Value |
| | | | | | | | | | | |
| | Machinery (continued) | | | | | | | | | |
| | | | | |
| 340 | | Ingersoll Rand Company Limited, Class A, (3) | | | | | | | | $ | 7,106 |
| | | | | |
| 170 | | PACCAR Inc., (3) | | | | | | | | | 5,527 |
| | | | | |
| 30 | | Pall Corporation | | | | | | | | | 797 |
| | | | | |
| 100 | | Parker Hannifin Corporation, (3) | | | | | | | | | 4,296 |
| | Total Machinery | | | | | | | | | 57,399 |
| | Media – 4.4% | | | | | | | | | |
| | | | | |
| 1,570 | | CBS Corporation, Class B, (3) | | | | | | | | | 10,864 |
| | | | | |
| 1,690 | | Comcast Corporation, Class A | | | | | | | | | 24,488 |
| | | | | |
| 240 | | DIRECTV Group, Inc., (2) | | | | | | | | | 5,930 |
| | | | | |
| 220 | | Interpublic Group Companies, Inc., (2), (3) | | | | | | | | | 1,111 |
| | | | | |
| 110 | | McGraw-Hill Companies, Inc. | | | | | | | | | 3,312 |
| | | | | |
| 1,990 | | News Corporation, Class A | | | | | | | | | 18,129 |
| | | | | |
| 130 | | Omnicom Group, Inc., (3) | | | | | | | | | 4,105 |
| | | | | |
| 1,900 | | Time Warner Inc., (3) | | | | | | | | | 47,861 |
| | | | | |
| 820 | | Viacom Inc., Class B, (2), (3) | | | | | | | | | 18,614 |
| | | | | |
| 730 | | Walt Disney Company, (3) | | | | | | | | | 17,031 |
| | Total Media | | | | | | | | | 151,445 |
| | Metals & Mining – 0.7% | | | | | | | | | |
| | | | | |
| 310 | | Alcoa Inc., (3) | | | | | | | | | 3,202 |
| | | | | |
| 40 | | Allegheny Technologies, Inc., (3) | | | | | | | | | 1,397 |
| | | | | |
| 60 | | Newmont Mining Corporation | | | | | | | | | 2,452 |
| | | | | |
| 210 | | Nucor Corporation, (3) | | | | | | | | | 9,330 |
| | | | | |
| 170 | | United States Steel Corporation, (3) | | | | | | | | | 6,076 |
| | Total Metals & Mining | | | | | | | | | 22,457 |
| | Multiline Retail – 1.0% | | | | | | | | | |
| | | | | |
| 50 | | Big Lots, Inc., (2), (3) | | | | | | | | | 1,052 |
| | | | | |
| 60 | | Family Dollar Stores, Inc. | | | | | | | | | 1,698 |
| | | | | |
| 660 | | Federated Department Stores, Inc., (3) | | | | | | | | | 7,762 |
| | | | | |
| 160 | | J.C. Penney Company, Inc., (3) | | | | | | | | | 4,594 |
| | | | | |
| 150 | | Kohl’s Corporation, (2), (3) | | | | | | | | | 6,413 |
| | | | | |
| 50 | | Nordstrom, Inc., (3) | | | | | | | | | 995 |
| | | | | |
| 10 | | Sears Holding Corporation, (2) | | | | | | | | | 665 |
| | | | | |
| 270 | | Target Corporation | | | | | | | | | 10,657 |
| | Total Multiline Retail | | | | | | | | | 33,836 |
| | Multi-Utilities – 2.9% | | | | | | | | | |
| | | | | |
| 270 | | Ameren Corporation, (3) | | | | | | | | | 6,720 |
| | | | | |
| 430 | | CenterPoint Energy, Inc., (3) | | | | | | | | | 4,764 |
| | | | | |
| 130 | | CMS Energy Corporation, (3) | | | | | | | | | 1,570 |
| | | | | |
| 290 | | Consolidated Edison, Inc., (3) | | | | | | | | | 10,852 |
| | | | | |
| 480 | | Dominion Resources, Inc., (3) | | | | | | | | | 16,042 |
| | | | | |
| 220 | | DTE Energy Company, (3) | | | | | | | | | 7,040 |
| | | | | |
| 60 | | Integrys Energy Group, Inc., (3) | | | | | | | | | 1,799 |
| | | | | |
| 260 | | NiSource Inc., (3) | | | | | | | | | 3,032 |
| | | | | |
| 370 | | PG&E Corporation, (3) | | | | | | | | | 14,223 |
| | | | | |
| 200 | | Public Service Enterprise Group Incorporated, (3) | | | | | | | | | 6,526 |
| | | | | |
| 110 | | Scana Corporation, (3) | | | | | | | | | 3,572 |
| | | | | | | | | | | |
| Shares | | Description (1) | | | | | | | | Value |
| | | | | | | | | | | |
| | Multi-Utilities (continued) | | | | | | | | | |
| | | | | |
| 180 | | Sempra Energy, (3) | | | | | | | | $ | 8,933 |
| | | | | |
| 190 | | TECO Energy, Inc., (3) | | | | | | | | | 2,267 |
| | | | | |
| 90 | | Wisconsin Energy Corporation, (3) | | | | | | | | | 3,664 |
| | | | | |
| 450 | | Xcel Energy, Inc., (3) | | | | | | | | | 8,285 |
| | Total Multi-Utilities | | | | | | | | | 99,289 |
| | Office Electronics – 0.1% | | | | | | | | | |
| | | | | |
| 410 | | Xerox Corporation, (3) | | | | | | | | | 2,657 |
| | Oil, Gas & Consumable Fuels – 16.3% | | | | | | | | | |
| | | | | |
| 390 | | Anadarko Petroleum Corporation, (3) | | | | | | | | | 17,702 |
| | | | | |
| 310 | | Apache Corporation | | | | | | | | | 22,367 |
| | | | | |
| 390 | | Chesapeake Energy Corporation, (3) | | | | | | | | | 7,734 |
| | | | | |
| 1,370 | | Chevron Corporation, (3) | | | | | | | | | 90,760 |
| | | | | |
| 1,050 | | ConocoPhillips | | | | | | | | | 44,163 |
| | | | | |
| 500 | | Devon Energy Corporation, (3) | | | | | | | | | 27,250 |
| | | | | |
| 800 | | El Paso Corporation, (3) | | | | | | | | | 7,384 |
| | | | | |
| 110 | | EOG Resources, Inc., (3) | | | | | | | | | 7,471 |
| | | | | |
| 2,960 | | Exxon Mobil Corporation | | | | | | | | | 206,929 |
| | | | | |
| 180 | | Hess Corporation | | | | | | | | | 9,675 |
| | | | | |
| 730 | | Marathon Oil Corporation | | | | | | | | | 21,995 |
| | | | | |
| 170 | | Murphy Oil Corporation, (3) | | | | | | | | | 9,234 |
| | | | | |
| 120 | | Noble Energy, Inc., (3) | | | | | | | | | 7,076 |
| | | | | |
| 660 | | Occidental Petroleum Corporation, (3) | | | | | | | | | 43,435 |
| | | | | |
| 10 | | Peabody Energy Corporation, (3) | | | | | | | | | 302 |
| | | | | |
| 110 | | Pioneer Natural Resources Company, (3) | | | | | | | | | 2,805 |
| | | | | |
| 110 | | Southwestern Energy Company, (2) | | | | | | | | | 4,274 |
| | | | | |
| 520 | | Spectra Energy Corporation, (3) | | | | | | | | | 8,798 |
| | | | | |
| 120 | | Sunoco, Inc., (3) | | | | | | | | | 2,784 |
| | | | | |
| 10 | | Tesoro Corporation, (3) | | | | | | | | | 127 |
| | | | | |
| 180 | | Valero Energy Corporation, (3) | | | | | | | | | 3,040 |
| | | | | |
| 450 | | Williams Companies, Inc. | | | | | | | | | 7,025 |
| | | | | |
| 280 | | XTO Energy, Inc., (3) | | | | | | | | | 10,679 |
| | Total Oil, Gas & Consumable Fuels | | | | | | | | | 563,009 |
| | Paper & Forest Products – 0.3% | | | | | | | | | |
| | | | | |
| 540 | | International Paper Company | | | | | | | | | 8,170 |
| | | | | |
| 120 | | MeadWestvaco Corporation | | | | | | | | | 1,969 |
| | Total Paper & Forest Products | | | | | | | | | 10,139 |
| | Personal Products – 0.0% | | | | | | | | | |
| | | | | |
| 20 | | Avon Products, Inc. | | | | | | | | | 516 |
| | | | | |
| 20 | | Estee Lauder Companies Inc., Class A, (3) | | | | | | | | | 653 |
| | Total Personal Products | | | | | | | | | 1,169 |
| | Pharmaceuticals – 9.2% | | | | | | | | | |
| | | | | |
| 750 | | Abbott Laboratories | | | | | | | | | 35,280 |
| | | | | |
| 1,380 | | Bristol-Myers Squibb Company, (3) | | | | | | | | | 28,028 |
| | | | | |
| 200 | | Eli Lilly and Company, (3) | | | | | | | | | 6,928 |
| | | | | |
| 90 | | Forest Laboratories, Inc., (2), (3) | | | | | | | | | 2,260 |
| | | | | |
| 1,570 | | Johnson & Johnson | | | | | | | | | 89,173 |
| | | | | |
| 230 | | King Pharmaceuticals Inc., (2), (3) | | | | | | | | | 2,215 |
Portfolio of Investments
Nuveen Enhanced Core Equity Plus Fund (continued)
June 30, 2009
| | | | | | | | | | | |
| Shares | | Description (1) | | | | | | | | Value |
| | | | | | | | | | | |
| | Pharmaceuticals (continued) | | | | | | | | | |
| | | | | |
| 1,020 | | Merck & Co. Inc. | | | | | | | | $ | 28,519 |
| | | | | |
| 100 | | Mylan Laboratories Inc., (2), (3) | | | | | | | | | 1,305 |
| | | | | |
| 5,220 | | Pfizer Inc., (3) | | | | | | | | | 78,300 |
| | | | | |
| 200 | | Schering-Plough Corporation | | | | | | | | | 5,024 |
| | | | | |
| 90 | | Watson Pharmaceuticals Inc., (2), (3) | | | | | | | | | 3,032 |
| | | | | |
| 860 | | Wyeth | | | | | | | | | 39,035 |
| | Total Pharmaceuticals | | | | | | | | | 319,099 |
| | Professional Services – 0.1% | | | | | | | | | |
| | | | | |
| 20 | | Dun and Bradstreet Inc. | | | | | | | | | 1,624 |
| | | | | |
| 40 | | Equifax Inc. | | | | | | | | | 1,044 |
| | | | | |
| 50 | | Robert Half International Inc., (3) | | | | | | | | | 1,181 |
| | Total Professional Services | | | | | | | | | 3,849 |
| | Real Estate – 1.2% | | | | | | | | | |
| | | | | |
| 250 | | Apartment Investment & Management Company, Class A, (3) | | | | | | | | | 2,213 |
| | | | | |
| 60 | | AvalonBay Communities, Inc., (3) | | | | | | | | | 3,356 |
| | | | | |
| 440 | | Developers Diversified Realty Corporation, (3) | | | | | | | | | 2,147 |
| | | | | |
| 140 | | Equity Residential | | | | | | | | | 3,112 |
| | | | | |
| 190 | | Health Care Property Investors Inc., (3) | | | | | | | | | 4,026 |
| | | | | |
| 90 | | Health Care REIT, Inc., (3) | | | | | | | | | 3,069 |
| | | | | |
| 880 | | Host Hotels & Resorts Inc., (3) | | | | | | | | | 7,383 |
| | | | | |
| 190 | | Kimco Realty Corporation, (3) | | | | | | | | | 1,910 |
| | | | | |
| 40 | | Plum Creek Timber Company | | | | | | | | | 1,191 |
| | | | | |
| 480 | | ProLogis, (3) | | | | | | | | | 3,869 |
| | | | | |
| 50 | | Public Storage, Inc., (3) | | | | | | | | | 3,274 |
| | | | | |
| 30 | | Simon Property Group, Inc., (3) | | | | | | | | | 1,543 |
| | | | | |
| 50 | | Ventas Inc. | | | | | | | | | 1,493 |
| | | | | |
| 70 | | Vornado Realty Trust | | | | | | | | | 3,152 |
| | Total Real Estate | | | | | | | | | 41,738 |
| | Road & Rail – 1.1% | | | | | | | | | |
| | | | | |
| 140 | | Burlington Northern Santa Fe Corporation, (3) | | | | | | | | | 10,296 |
| | | | | |
| 200 | | CSX Corporation | | | | | | | | | 6,926 |
| | | | | |
| 240 | | Norfolk Southern Corporation, (3) | | | | | | | | | 9,041 |
| | | | | |
| 10 | | Ryder System, Inc. | | | | | | | | | 279 |
| | | | | |
| 240 | | Union Pacific Corporation | | | | | | | | | 12,494 |
| | Total Road & Rail | | | | | | | | | 39,036 |
| | Semiconductors & Equipment – 1.6% | | | | | | | | | |
| | | | | |
| 100 | | Altera Corporation, (3) | | | | | | | | | 1,628 |
| | | | | |
| 170 | | Analog Devices, Inc. | | | | | | | | | 4,213 |
| | | | | |
| 40 | | Broadcom Corporation, Class A, (2) | | | | | | | | | 992 |
| | | | | |
| 2,170 | | Intel Corporation, (3) | | | | | | | | | 35,914 |
| | | | | |
| 90 | | Linear Technology Corporation, (3) | | | | | | | | | 2,102 |
| | | | | |
| 50 | | LSI Logic Corporation, (2), (3) | | | | | | | | | 228 |
| | | | | |
| 70 | | Microchip Technology Incorporated, (3) | | | | | | | | | 1,579 |
| | | | | |
| 100 | | Micron Technology, Inc., (2), (3) | | | | | | | | | 506 |
| | | | | |
| 90 | | National Semiconductor Corporation, (3) | | | | | | | | | 1,130 |
| | | | | |
| 10 | | Novellus Systems, Inc., (2) | | | | | | | | | 167 |
| | | | | | | | | | | |
| Shares | | Description (1) | | | | | | | | Value |
| | | | | | | | | | | |
| | Semiconductors & Equipment (continued) | | | | | | | | | |
| | | | | |
| 270 | | Texas Instruments Incorporated, (3) | | | | | | | | $ | 5,751 |
| | | | | |
| 110 | | Xilinx, Inc., (3) | | | | | | | | | 2,251 |
| | Total Semiconductors & Equipment | | | | | | | | | 56,461 |
| | Software – 2.8% | | | | | | | | | |
| | | | | |
| 60 | | BMC Software, Inc., (2) | | | | | | | | | 2,027 |
| | | | | |
| 140 | | CA Inc., (3) | | | | | | | | | 2,440 |
| | | | | |
| 130 | | Compuware Corporation, (2), (3) | | | | | | | | | 892 |
| | | | | |
| 100 | | Intuit, Inc., (2) | | | | | | | | | 2,816 |
| | | | | |
| 20 | | McAfee Inc., (2), (3) | | | | | | | | | 844 |
| | | | | |
| 2,320 | | Microsoft Corporation | | | | | | | | | 55,146 |
| | | | | |
| 1,250 | | Oracle Corporation, (3) | | | | | | | | | 26,775 |
| | | | | |
| 280 | | Symantec Corporation, (2) | | | | | | | | | 4,357 |
| | Total Software | | | | | | | | | 95,297 |
| | Specialty Retail – 2.1% | | | | | | | | | |
| | | | | |
| 30 | | Abercrombie & Fitch Co., Class A, (3) | | | | | | | | | 762 |
| | | | | |
| 10 | | AutoNation Inc., (2), (3) | | | | | | | | | 174 |
| | | | | |
| 20 | | AutoZone, Inc., (2), (3) | | | | | | | | | 3,022 |
| | | | | |
| 90 | | Bed Bath and Beyond Inc., (2), (3) | | | | | | | | | 2,768 |
| | | | | |
| 120 | | Best Buy Co., Inc., (3) | | | | | | | | | 4,019 |
| | | | | |
| 30 | | GameStop Corporation, (2) | | | | | | | | | 660 |
| | | | | |
| 190 | | Gap, Inc., (3) | | | | | | | | | 3,116 |
| | | | | |
| 1,040 | | Home Depot, Inc., (3) | | | | | | | | | 24,575 |
| | | | | |
| 270 | | Limited Brands, Inc., (3) | | | | | | | | | 3,232 |
| | | | | |
| 720 | | Lowe’s Companies, Inc. | | | | | | | | | 13,975 |
| | | | | |
| 50 | | RadioShack Corporation, (3) | | | | | | | | | 698 |
| | | | | |
| 60 | | Sherwin-Williams Company, (3) | | | | | | | | | 3,225 |
| | | | | |
| 240 | | Staples, Inc., (3) | | | | | | | | | 4,841 |
| | | | | |
| 40 | | Tiffany & Co., (3) | | | | | | | | | 1,014 |
| | | | | |
| 170 | | TJX Companies, Inc. | | | | | | | | | 5,348 |
| | Total Specialty Retail | | | | | | | | | 71,429 |
| | Textiles, Apparel & Luxury Goods – 0.3% | | | | | | | | | |
| | | | | |
| 60 | | Coach, Inc., (3) | | | | | | | | | 1,613 |
| | | | | |
| 120 | | Nike, Inc., Class B | | | | | | | | | 6,214 |
| | | | | |
| 20 | | Polo Ralph Lauren Corporation, (3) | | | | | | | | | 1,071 |
| | | | | |
| 50 | | VF Corporation | | | | | | | | | 2,768 |
| | Total Textiles, Apparel & Luxury Goods | | | | | | | | | 11,666 |
| | Thrifts & Mortgage Finance – 0.2% | | | | | | | | | |
| | | | | |
| 290 | | Hudson City Bancorp, Inc. | | | | | | | | | 3,854 |
| | | | | |
| 230 | | People’s United Financial, Inc., (3) | | | | | | | | | 3,459 |
| | Total Thrifts & Mortgage Finance | | | | | | | | | 7,313 |
| | Tobacco – 2.7% | | | | | | | | | |
| | | | | |
| 2,190 | | Altria Group, Inc., (3) | | | | | | | | | 35,894 |
| | | | | |
| 90 | | Lorillard Inc., (3) | | | | | | | | | 6,099 |
| | | | | |
| 1,070 | | Philip Morris International | | | | | | | | | 46,673 |
| | | | | |
| 140 | | Reynolds American Inc., (3) | | | | | | | | | 5,407 |
| | Total Tobacco | | | | | | | | | 94,073 |
Portfolio of Investments
Nuveen Enhanced Core Equity Plus Fund (continued)
June 30, 2009
| | | | | | | | | | | |
| Shares | | Description (1) | | | | | | | | Value |
| | | | | | | | | | | |
| | Trading Companies & Distributors – 0.1% | | | | | | | | | |
| | | | | |
| 20 | | Fastenal Company, (3) | | | | | | | | $ | 663 |
| | | | | |
| 40 | | W.W. Grainger, Inc., (3) | | | | | | | | | 3,275 |
| | Total Trading Companies & Distributors | | | | | | | | | 3,938 |
| | Wireless Telecommunication Services – 0.8% | | | | | | | | | |
| | | | | |
| 5,670 | | Sprint Nextel Corporation, (2), (3) | | | | | | | | | 27,270 |
| | Total Common Stocks (cost $3,534,205) | | | | | | | | | 3,562,482 |
| | | | | |
| Shares | | Description (1) | | | | | | | | Value |
| | Common Stocks Sold Short – (3.6)% | | | | | | | | | |
| | | | | |
| | Air Freight & Logistics – (0.2)% | | | | | | | | | |
| | | | | |
| (10) | | Expeditors International of Washington, Inc. | | | | | | | | $ | (333) |
| | | | | |
| (140) | | United Parcel Service, Inc., Class B | | | | | | | | | (6,999) |
| | Total Air Freight & Logistics | | | | | | | | | (7,332) |
| | Airlines – (0.0)% | | | | | | | | | |
| | | | | |
| (40) | | Southwest Airlines Co. | | | | | | | | | (269) |
| | Auto Components – (0.0)% | | | | | | | | | |
| | | | | |
| (40) | | Johnson Controls, Inc. | | | | | | | | | (869) |
| | Biotechnology – (0.1)% | | | | | | | | | |
| | | | | |
| (50) | | Celgene Corporation, (2) | | | | | | | | | (2,392) |
| | Capital Markets – (0.1)% | | | | | | | | | |
| | | | | |
| (190) | | E*Trade Group Inc., (2) | | | | | | | | | (243) |
| | | | | |
| (40) | | Legg Mason, Inc. | | | | | | | | | (975) |
| | | | | |
| (30) | | State Street Corporation | | | | | | | | | (1,416) |
| | | | | |
| (30) | | T. Rowe Price Group Inc. | | | | | | | | | (1,250) |
| | Total Capital Markets | | | | | | | | | (3,884) |
| | Chemicals – (0.0)% | | | | | | | | | |
| | | | | |
| (10) | | Monsanto Company | | | | | | | | | (743) |
| | Commercial Banks – (0.1)% | | | | | | | | | |
| | | | | |
| (250) | | Fifth Third Bancorp. | | | | | | | | | (1,775) |
| | | | | |
| (170) | | KeyCorp. | | | | | | | | | (891) |
| | | | | |
| (70) | | Marshall and Ilsley Corporation | | | | | | | | | (336) |
| | | | | |
| (70) | | Zions Bancorporation | | | | | | | | | (809) |
| | Total Commercial Banks | | | | | | | | | (3,811) |
| | Commercial Services & Supplies – (0.0)% | | | | | | | | | |
| | | | | |
| (20) | | Iron Mountain Inc., (2) | | | | | | | | | (575) |
| | Communications Equipment – (0.3)% | | | | | | | | | |
| | | | | |
| (50) | | Ciena Corporation, (2) | | | | | | | | | (518) |
| | | | | |
| (140) | | JDS Uniphase Corporation, (2) | | | | | | | | | (801) |
| | | | | |
| (60) | | Juniper Networks Inc., (2) | | | | | | | | | (1,416) |
| | | | | |
| (800) | | Motorola, Inc. | | | | | | | | | (5,304) |
| | Total Communications Equipment | | | | | | | | | (8,039) |
| | Computers & Peripherals – (0.1)% | | | | | | | | | |
| | | | | |
| (10) | | Network Appliance Inc., (2) | | | | | | | | | (197) |
| | | | | |
| (100) | | SanDisk Corporation, (2) | | | | | | | | | (1,469) |
| | | | | |
| (170) | | Sun Microsystems Inc., (2) | | | | | | | | | (1,567) |
| | Total Computers & Peripherals | | | | | | | | | (3,233) |
| | | | | | | | | | | |
| Shares | | Description (1) | | | | | | | | Value |
| | | | | | | | | | | |
| | Construction & Engineering – (0.0)% | | | | | | | | | |
| | | | | |
| (20) | | Jacobs Engineering Group, Inc., (2) | | | | | | | | $ | (842) |
| | Consumer Finance – (0.4)% | | | | | | | | | |
| | | | | |
| (300) | | American Express Company | | | | | | | | | (6,972) |
| | | | | |
| (500) | | SLM Corporation, (2) | | | | | | | | | (5,135) |
| | Total Consumer Finance | | | | | | | | | (12,107) |
| | Containers & Packaging – (0.0)% | | | | | | | | | |
| | | | | |
| (10) | | Owens-Illinois, Inc., (2) | | | | | | | | | (280) |
| | Diversified Financial Services – (0.2)% | | | | | | | | | |
| | | | | |
| (190) | | CIT Group Inc. | | | | | | | | | (409) |
| | | | | |
| (10) | | CME Group, Inc. | | | | | | | | | (3,111) |
| | | | | |
| (20) | | Intercontinental Exchange, Inc., (2) | | | | | | | | | (2,285) |
| | | | | |
| (10) | | Moody’s Corporation | | | | | | | | | (264) |
| | Total Diversified Financial Services | | | | | | | | | (6,069) |
| | Health Care Equipment & Supplies – (0.2)% | | | | | | | | | |
| | | | | |
| (180) | | Boston Scientific Corporation, (2) | | | | | | | | | (1,825) |
| | | | | |
| (30) | | Intuitive Surgical, Inc., (2) | | | | | | | | | (4,910) |
| | | | | |
| (10) | | Stryker Corporation | | | | | | | | | (397) |
| | | | | |
| (10) | | Varian Medical Systems, Inc., (2) | | | | | | | | | (351) |
| | Total Health Care Equipment & Supplies | | | | | | | | | (7,483) |
| | Health Care Providers & Services – (0.0)% | | | | | | | | | |
| | | | | |
| (300) | | Tenet Healthcare Corporation, (2) | | | | | | | | | (846) |
| | Hotels, Restaurants & Leisure – (0.1)% | | | | | | | | | |
| | | | | |
| (110) | | International Game Technology | | | | | | | | | (1,749) |
| | | | | |
| (10) | | Marriott International, Inc., Class A | | | | | | | | | (222) |
| | | | | |
| (180) | | Starbucks Corporation, (2) | | | | | | | | | (2,500) |
| | Total Hotels, Restaurants & Leisure | | | | | | | | | (4,471) |
| | Household Durables – (0.1)% | | | | | | | | | |
| | | | | |
| (50) | | Centex Corporation | | | | | | | | | (423) |
| | | | | |
| (30) | | D.R. Horton, Inc. | | | | | | | | | (281) |
| | | | | |
| (20) | | Harman International Industries Inc. | | | | | | | | | (376) |
| | | | | |
| (20) | | KB Home | | | | | | | | | (274) |
| | Total Household Durables | | | | | | | | | (1,354) |
| | Insurance – (0.4)% | | | | | | | | | |
| | | | | |
| (90) | | AFLAC Incorporated | | | | | | | | | (2,798) |
| | | | | |
| (10) | | Assurant Inc. | | | | | | | | | (241) |
| | | | | |
| (200) | | Genworth Financial Inc., Class A | | | | | | | | | (1,398) |
| | | | | |
| (180) | | Hartford Financial Services Group, Inc. | | | | | | | | | (2,137) |
| | | | | |
| (20) | | MBIA Inc., (2) | | | | | | | | | (87) |
| | | | | |
| (180) | | Principal Financial Group, Inc. | | | | | | | | | (3,391) |
| | | | | |
| (50) | | Progressive Corporation, (2) | | | | | | | | | (756) |
| | | | | |
| (20) | | Prudential Financial, Inc. | | | | | | | | | (744) |
| | Total Insurance | | | | | | | | | (11,552) |
| | Internet Software & Services – (0.4)% | | | | | | | | | |
| | | | | |
| (50) | | Akamai Technologies, Inc., (2) | | | | | | | | | (959) |
| | | | | |
| (90) | | VeriSign, Inc., (2) | | | | | | | | | (1,663) |
| | | | | |
| (690) | | Yahoo! Inc., (2) | | | | | | | | | (10,805) |
| | Total Internet Software & Services | | | | | | | | | (13,427) |
Portfolio of Investments
Nuveen Enhanced Core Equity Plus Fund (continued)
June 30, 2009
| | | | | | | | | | | |
| Shares | | Description (1) | | | | | | | | Value |
| | | | | | | | | | | |
| | IT Services – (0.0)% | | | | | | | | | |
| | | | | |
| (30) | | Convergys Corporation, (2) | | | | | | | | $ | (278) |
| | | | | |
| (10) | | Western Union Company | | | | | | | | | (164) |
| | Total IT Services | | | | | | | | | (442) |
| | Machinery – (0.0)% | | | | | | | | | |
| | | | | |
| (110) | | Manitowoc Company Inc. | | | | | | | | | (579) |
| | Media – (0.0)% | | | | | | | | | |
| | | | | |
| (140) | | Gannett Company Inc. | | | | | | | | | (500) |
| | | | | |
| (10) | | Scripps Networks Interactive, Class A Shares | | | | | | | | | (278) |
| | Total Media | | | | | | | | | (778) |
| | Metals & Mining – (0.1)% | | | | | | | | | |
| | | | | |
| (70) | | AK Steel Holding Corporation | | | | | | | | | (1,343) |
| | | | | |
| (30) | | Freeport-McMoRan Copper & Gold, Inc. | | | | | | | | | (1,503) |
| | Total Metals & Mining | | | | | | | | | (2,846) |
| | Oil, Gas & Consumable Fuels – (0.1)% | | | | | | | | | |
| | | | | |
| (80) | | CONSOL Energy Inc. | | | | | | | | | (2,717) |
| | | | | |
| (70) | | Massey Energy Company | | | | | | | | | (1,368) |
| | | | | |
| (10) | | Range Resources Corporation | | | | | | | | | (414) |
| | Total Oil, Gas & Consumable Fuels | | | | | | | | | (4,499) |
| | Paper & Forest Products – (0.0)% | | | | | | | | | |
| | | | | |
| (20) | | Weyerhaeuser Company | | | | | | | | | (609) |
| | Pharmaceuticals – (0.0)% | | | | | | | | | |
| | | | | |
| (10) | | Allergan, Inc. | | | | | | | | | (476) |
| | Professional Services – (0.0)% | | | | | | | | | |
| | | | | |
| (70) | | Monster Worldwide Inc., (2) | | | | | | | | | (827) |
| | Real Estate – (0.0)% | | | | | | | | | |
| | | | | |
| (10) | | Boston Properties, Inc. | | | | | | | | | (477) |
| | Real Estate Management & Development – (0.0)% | | | | | | | | | |
| | | | | |
| (110) | | CB Richard Ellis Group, Inc., Class A, (2) | | | | | | | | | (1,030) |
| | Semiconductors & Equipment – (0.2)% | | | | | | | | | |
| | | | | |
| (200) | | Advanced Micro Devices, Inc., (2) | | | | | | | | | (774) |
| | | | | |
| (70) | | Applied Materials, Inc. | | | | | | | | | (768) |
| | | | | |
| (40) | | KLA-Tencor Corporation | | | | | | | | | (1,010) |
| | | | | |
| (150) | | MEMC Electronic Materials, (2) | | | | | | | | | (2,672) |
| | | | | |
| (160) | | NVIDIA Corporation, (2) | | | | | | | | | (1,806) |
| | | | | |
| (100) | | Teradyne Inc., (2) | | | | | | | | | (686) |
| | Total Semiconductors & Equipment | | | | | | | | | (7,716) |
| | Software – (0.4)% | | | | | | | | | |
| | | | | |
| (20) | | Adobe Systems Incorporated, (2) | | | | | | | | | (566) |
| | | | | |
| (20) | | Autodesk, Inc., (2) | | | | | | | | | (380) |
| | | | | |
| (10) | | Citrix Systems, (2) | | | | | | | | | (319) |
| | | | | |
| (400) | | Electronic Arts Inc. (EA), (2) | | | | | | | | | (8,688) |
| | | | | |
| (150) | | Novell Inc., (2) | | | | | | | | | (680) |
| | | | | |
| (60) | | Salesforce.com, Inc., (2) | | | | | | | | | (2,290) |
| | Total Software | | | | | | | | | (12,923) |
| | Specialty Retail – (0.0)% | | | | | | | | | |
| | | | | |
| (70) | | Office Depot, Inc., (2) | | | | | | | | | (319) |
| | | | | | | | | | | |
| Shares | | Description (1) | | | | | | | | Value |
| | | | | | | | | | | |
| | Wireless Telecommunication Services – (0.1)% | | | | | | | | | |
| | | | | |
| (50) | | American Tower Corporation, (2) | | | | | | | | $ | (1,574) |
| | Total Common Stocks Sold Short (proceeds $103,204) | | | | | | | | | (124,673) |
| | Other Assets Less Liabilities – 0.6% | | | | | | | | | 19,875 |
| | Net Assets – 100% | | | | | | | | $ | 3,457,684 |
| | (1) | | All percentages shown in the Portfolio of Investments are based on net assets. |
| | (2) | | Non-income producing; issuer has not declared a dividend within the past twelve months. |
| | (3) | | Investment, or portion of investment, segregated as collateral for securities lending. |
See accompanying notes to financial statements.
Statement of Assets and Liabilities
June 30, 2009
| | | | |
Assets | | | | |
Investments, at value (cost $3,534,205) | | $ | 3,562,482 | |
Cash (1) | |
| 1,293,434
|
|
Receivables: | | | | |
Dividends | | | 6,273 | |
From Adviser | | | 50,358 | |
Total assets | | | 4,912,547 | |
Liabilities | | | | |
Cash overdraft | | | 14,396 | |
Securities sold short, at value (proceeds $103,204) | | | 124,673 | |
Payable for collateral due to broker | |
| 1,293,434
|
|
Accrued expenses: | | | | |
12b-1 distribution and service fees | | | 358 | |
Other | | | 22,002 | |
Total liabilities | | | 1,454,863 | |
Net assets | | $ | 3,457,684 | |
Class A Shares | | | | |
Net assets | | $ | 246,822 | |
Shares outstanding | | | 12,500 | |
Net asset value per share | | $ | 19.75 | |
Offering price per share (net asset value per share plus
maximum sales charge of 5.75% of offering price) | | $ | 20.95 | |
Class C Shares | | | | |
Net assets | | $ | 245,891 | |
Shares outstanding | | | 12,500 | |
Net asset value and offering price per share | | $ | 19.67 | |
Class R3 Shares | | | | |
Net assets | | $ | 246,510 | |
Shares outstanding | | | 12,500 | |
Net asset value and offering price per share | | $ | 19.72 | |
Class I Shares | | | | |
Net assets | | $
| 2,718,461
|
|
Shares outstanding | | | 137,500 | |
Net asset value and offering price per share | | $ | 19.77 | |
Net Assets Consist of: | | | | |
Capital paid-in | | $ | 3,498,909 | |
Undistributed (Over-distribution of) net investment income | | | 38,483 | |
Accumulated net realized gain (loss) from investments | | | (86,516 | ) |
Net unrealized appreciation (depreciation) of investments and securities sold short | | | 6,808 | |
Net assets | | $ | 3,457,684 | |
(1) Represents collateral held for securities lending transactions. See Footnote 1 – Enhanced Custody Program for further information.
See accompanying notes to financial statements.
Statement of Operations
For the Period December 29, 2008 (commencement of operations) through June 30, 2009
| | | | |
Dividend and Interest Income | | $ | 58,752 | |
Expenses | | | | |
Management fees | | | 14,007 | |
12b-1 service fees – Class A | | | 294 | |
12b-1 distribution and service fees – Class C | | | 1,175 | |
12b-1 distribution and service fees – Class R3 | | | 589 | |
Dividend expense on securities sold short | | | 677 | |
Shareholders’ servicing agent fees and expenses | | | 7,689 | |
Custodian’s fees and expenses | | | 15,070 | |
Enhanced custody expense | | | 476 | |
Trustees’ fees and expenses | | | 46 | |
Professional fees | | | 45,376 | |
Shareholders’ reports – printing and mailing expenses | | | 12,585 | |
Federal and state registration fees | | | 195 | |
Other expenses | | | 300 | |
Total expenses before expense reimbursement | | | 98,479 | |
Expense reimbursement | | | (77,131 | ) |
Net expenses | | | 21,348 | |
Net investment income | | | 37,404 | |
Realized and Unrealized Gain (Loss) | | | | |
Net realized gain (loss) from investments and securities sold short | | | (86,528 | ) |
Net unrealized appreciation (depreciation) of investments and securities sold short | | | 6,808 | |
Net realized and unrealized gain (loss) | | | (79,720 | ) |
Net increase (decrease) in net assets from operations | | $ | (42,316 | ) |
See accompanying notes to financial statements.
Statement of Changes in Net Assets
For the Period December 29, 2008 (commencement of operations) through June 30, 2009
| | | | |
Operations | | | | |
Net investment income | | $ | 37,404 | |
Net realized gain (loss) from investments and securities sold short | | | (86,528 | ) |
Net unrealized appreciation (depreciation) of investments and securities sold short | | | 6,808 | |
Net increase (decrease) in net assets from operations | | | (42,316 | ) |
Fund Share Transactions | | | | |
Proceeds from sale of shares | | | 3,500,000 | |
Net increase (decrease) in net assets from Fund share transactions | | | 3,500,000 | |
Net increase (decrease) in net assets | | | 3,457,684 | |
Net assets at the beginning of period | | | — | |
Net assets at the end of period | | $ | 3,457,684 | |
Undistributed (Over-distribution of) net investment income at the end of period | | $ | 38,483 | |
See accompanying notes to financial statements.
Notes to Financial Statements
1. General Information and Significant Accounting Policies
The Nuveen Investment Trust (the “Trust”) is an open-end management investment company registered under the Investment Company Act of 1940, as amended. The Trust is comprised of Nuveen Enhanced Core Equity Plus Fund (the “Fund”), among others. The Trust was organized as a Massachusetts business trust in 1996. The Fund commenced operations on December 29, 2008.
The Fund invests primarily in equity securities of companies within the S&P 500 Index in an attempt to provide long-term capital appreciation. The Fund seeks to achieve additional return by taking short positions in stocks that are expected to underperform and using the proceeds from these short positions to take additional long positions in stocks that are expected to outperform.
The Fund intends to target a net “long” market exposure of approximately 100%. The Fund’s long positions will range from between 90% and 150% of the value of the Fund’s net assets. The Fund’s short positions will range between 0% and 50% of the value of the Fund’s net assets.
The following is a summary of significant accounting policies followed by the Fund in the preparation of its financial statements in accordance with accounting principles generally accepted in the United States.
Investment Valuation
Exchange-listed securities are generally valued at the last sales price on the security exchange on which such securities are primarily traded. Securities traded on a securities exchange for which there are no transactions on a given day or securities not listed on a securities exchange are valued at the mean of the closing bid and asked prices. Securities traded on NASDAQ are valued at the NASDAQ Official Closing Price. When market price quotes are not readily available, the pricing service or, in the absence of a pricing service for a particular investment, the Board of Trustees of the Fund, or its designee, may establish fair value using a wide variety of market data including prices of investments of comparable quality, type of issue, market quotes or indications of value from security dealers, evaluations of anticipated cash flows or collateral, general market conditions and other information and analysis, including the obligor’s credit characteristics considered relevant. Short-term investments are valued at amortized cost, which approximates value.
Investment Transactions
Investment transactions are recorded on a trade date basis. Realized gains and losses from investment transactions are determined on the specific identification method.
Investment Income
Dividend income on securities purchased and dividend expense on securities sold short are recorded on the ex-dividend date. Interest income is recorded on an accrual basis.
Income Taxes
The Fund intends to distribute substantially all of its net investment income and net capital gains to shareholders and to otherwise comply with the requirements of Subchapter M of the Internal Revenue Code applicable to regulated investment companies. Therefore, no federal income tax provision is required.
For all open tax years and all major taxing jurisdictions, management of the Fund has concluded that there are no significant uncertain tax positions that would require recognition in the financial statements. Open tax years are those that are open for examination by taxing authorities (i.e., generally the last four tax year ends and the interim tax period since then). Furthermore, management of the Fund is also not aware of any tax positions for which it is reasonably possible that the total amounts of unrecognized tax benefits will significantly change in the next twelve months.
Dividends and Distributions to Shareholders
Dividends from net investment income and net realized capital gains from investment transactions, if any, are declared and distributed to shareholders at least annually. Furthermore, capital gains are distributed only to the extent they exceed available capital loss carryforwards.
Distributions to shareholders are recorded on the ex-dividend date. The amount and timing of distributions are determined in accordance with federal income tax regulations, which may differ from accounting principles generally accepted in the United States.
Flexible Sales Charge Program
Class A Shares are generally sold with an up-front sales charge and incur a .25% annual 12b-1 service fee. Class A Share purchases of $1 million or more are sold at net asset value without an up-front sales charge but may be subject to a contingent deferred sales charge (“CDSC”) if redeemed within twelve months of purchase. Class C Shares are sold without an up-front sales charge but incur a .75% annual 12b-1 distribution fee and a .25% annual 12b-1 service fee. Class C Shares are subject to a CDSC of 1% if redeemed within one year of purchase. Class R3 Shares are sold without an up-front sales charge but incur a .50% annual 12b-1 distribution and service fee. Class I Shares are not subject to any sales charge or 12b-1 distribution or service fees.
Derivative Financial Instruments
The Fund is authorized to invest in certain derivative financial instruments, including forwards, futures, options and swap contracts. Although the Fund is authorized to invest in such financial instruments, and may do so in the future, it did not make any such investments during the period December 29, 2008 (commencement of operations) through June 30, 2009.
Notes to Financial Statements (continued)
Enhanced Custody Program
The Fund pursues a “long/short” investment strategy, pursuant to which it sells “short” up to 50% of the value of its initial “long” portfolio and purchases additional “long” investments with some or all of the proceeds of the short sale transactions. Financing of the short sale transactions is provided in part through lending securities in the Fund’s portfolio of investments. The administration and monitoring of the collateral requirements for both the short selling and securities lending activities is performed by the Fund’s custodian through its enhanced custody program.
Short Sale Transactions – When the Fund sells a security “short,” it borrows the security from a third party and pledges cash as collateral to secure its obligation to return the security to the lender either upon closing out the “short” position or upon demand from the lender. The cash used to collateralize the borrowing is provided from lending securities in the Fund’s portfolio or from borrowing from the Fund’s custodian. Proceeds from selling short are used to finance the purchase of additional securities for the Fund’s long portfolio. The amount of collateral required to be pledged to borrow a security is determined by reference to the market value of the security borrowed. The Fund is obligated to pay the lender from whom the securities were borrowed dividends declared on the stock by the issuer and recognizes such amounts as “Dividend expense on securities sold short” on the Statement of Operations. Short sales are valued daily, and the corresponding unrealized gains or losses are included with “Net unrealized appreciation (depreciation) of investments and securities sold short” on the Statement of Operations. Liabilities for securities sold short are reported at market value in the accompanying financial statements. Short sale transactions result in off-balance sheet risk because the ultimate obligation may exceed the related amounts shown on the Statement of Assets and Liabilities. The Fund has segregated sufficient assets equal to at least the market value of the short sale obligation to preclude the obligation from being deemed a senior security of the Fund. The Fund will incur a loss if the price of the security increases between the date of the short sale and the date on which the Fund replaces the borrowed security. The Fund’s loss on a short sale is potentially unlimited because there is no upward limit on the price a borrowed security could attain. The Fund will realize a gain if the price of the security declines between those dates.
Securities Lending Transactions – In the ordinary course of business, up to 100% of the Fund’s portfolio is available to be loaned to brokers, dealers and other financial institutions. The Fund may not loan securities in excess of 33 1/3% of its total assets, including the value of the cash collateral received in connection with such loans. Loans are secured by cash collateral received from the borrower equal at all times to at least 100% of the market value of the loaned securities. The Fund uses the cash collateral obtained from such loans primarily to collateralize the Fund’s borrowing of securities sold short. Any amount held in excess of that required to collateralize securities borrowed in short sale transactions may be invested in liquid, high-grade, short-term instruments to enhance the earnings of the Fund. Such amounts are recognized as “Payable for collateral due to broker” on the Statement of Assets and Liabilities.
For its participation in the enhanced custody program, the Fund pays the custodian a fee based on the market value of the Fund’s outstanding short positions, and is recognized as “Enhanced custody expense” on the Statement of Operations.
Repurchase Agreements
In connection with transactions in repurchase agreements, it is the Fund’s policy that its custodian take possession of the underlying collateral securities, the fair value of which exceeds the principal amount of the repurchase transaction, including accrued interest, at all times. If the seller defaults, and the fair value of the collateral declines, realization of the collateral may be delayed or limited.
Expense Allocation
Expenses of the Fund that are not directly attributable to a specific class of shares are prorated among the classes based on the relative net assets of each class. Expenses directly attributable to a class of shares, which presently only include 12b-1 distribution and service fees, are recorded to the specific class.
Custodian Fee Credit
The Fund has an arrangement with the custodian bank whereby certain custodian fees and expenses are reduced by net credits earned on the Fund’s cash on deposit with the bank. Such deposit arrangements are an alternative to overnight investments. Credits for cash balances may be offset by changes for any days on which the Fund overdraws its account at the custodian bank.
Indemnifications
Under the Trust’s organizational documents, its Officers and Trustees are indemnified against certain liabilities arising out of the performance of their duties to the Trust. In addition, in the normal course of business, the Trust enters into contracts that provide general indemnifications to other parties. The Trust’s maximum exposure under these arrangements is unknown as this would involve future claims that may be made against the Trust that have not yet occurred. However, the Trust has not had prior claims or losses pursuant to these contracts and expects the risk of loss to be remote.
Use of Estimates
The preparation of financial statements in conformity with accounting principles generally accepted in the United States requires management to make estimates and assumptions that affect the reported amounts of assets and liabilities at the date of the financial statements and the reported amounts of increases and decreases in net assets from operations during the reporting period. Actual results may differ from those estimates.
2. Fair Value Measurements
In determining the value of the Fund’s investments various inputs are used. These inputs are summarized in the three broad levels listed below:
| | |
| Level 1 – | | Quoted prices in active markets for identical securities. |
| Level 2 – | | Other significant observable inputs (including quoted prices for similar securities, interest rates, prepayment speeds, credit risk, etc.). |
| Level 3 – | | Significant unobservable inputs (including management’s assumptions in determining the fair value of investments). |
The inputs or methodology used for valuing securities are not an indication of the risk associated with investing in those securities.
The following is a summary of the Fund’s fair value measurements as of June 30, 2009:
| | | | | | | | | | | | | | |
| | | Level 1 | | | Level 2 | | Level 3 | | Total | |
Investments: | | | | | | | | | | | | | | |
Common Stocks | | $ | 3,562,482 | | | $ | — | | $ | — | | $ | 3,562,482 | |
Common stocks sold short | | | (124,673 | ) | | | — | | | — | | | (124,673 | ) |
Total | | $ | 3,437,809 | | | $ | — | | $ | — | | $ | 3,437,809 | |
3. Derivative Instruments and Hedging Activities
During the current fiscal period, the Fund adopted the provisions of Statement of Financial Accounting Standards No. 161 (SFAS No. 161) “Disclosures about Derivative Instruments and Hedging Activities.” This standard is intended to enhance financial statement disclosures for derivative instruments and hedging activities and enable investors to better understand: a) how and why a fund uses derivative instruments; b) how derivative instruments are accounted for; and c) how derivative instruments affect a fund’s financial position, results of operations and cash flows, if any. The Fund records derivative instruments at fair value with changes in fair value recognized on the Statement of Operations. Even though the Fund’s investments in derivatives may represent economic hedges, they are considered to be non-hedge transactions for SFAS No. 161 disclosure purposes. The Fund did not invest in derivative instruments during the period December 29, 2008 (commencement of operations) through June 30, 2009.
4. Fund Shares
Transactions in Fund shares were as follows:
| | | | | |
| | | For the Period 12/29/08
(commencement of operations)
through 6/30/09 |
| | | Shares | | Amount |
Shares sold: | | | | | |
Class A | | 12,500 | | $ | 250,000 |
Class C | | 12,500 | | | 250,000 |
Class R3 | | 12,500 | | | 250,000 |
Class I | | 137,500 | | | 2,750,000 |
Net increase (decrease) | | 175,000 | | $ | 3,500,000 |
5. Investment Transactions
Purchases and sales (including proceeds from securities sold short but excluding short-term investments) for the period December 29, 2008 (commencement of operations) through June 30, 2009, aggregated $4,535,324 and $1,017,928, respectively.
6. Income Tax Information
The following information is presented on an income tax basis. Differences between amounts for financial statement and federal income tax purposes are primarily due to timing differences in recognizing certain gains and losses on investment transactions. To the extent that differences arise that are permanent in nature, such amounts are reclassified within the capital accounts on the Statement of Assets and Liabilities presented in the annual report, based on their federal tax basis treatment; temporary differences do not require reclassification. Temporary and permanent differences do not impact the net asset value of the Fund.
At June 30, 2009, the cost of investments (excluding proceeds received on securities sold short) was $3,534,205.
Notes to Financial Statements (continued)
Gross unrealized appreciation and gross unrealized depreciation of investments (excluding proceeds received or securities sold short) at June 30, 2009, were as follows:
| | | | |
Gross unrealized: | | | | |
Appreciation | | $ | 228,182 | |
Depreciation | | | (199,905 | ) |
Net unrealized appreciation (depreciation) of investments | | $ | 28,277 | |
The tax components of undistributed net ordinary income and net long-term capital gains at June 30, 2009, the Fund’s tax year end, were as follows:
| | | |
Undistributed net ordinary income* | | $ | 38,483 |
Undistributed net long-term capital gains | | | — |
| * | Net ordinary income consists of net taxable income derived from dividends, interest, and net short-term capital gains, if any. |
The tax character of distributions paid during the Fund’s tax year ended June 30, 2009, was designated for purposes of the dividends paid deduction as follows:
| | | |
| For the period December 29, 2008 (commencement of operations) through June 30, 2009 | | |
Distributions from net ordinary income* | | $ | — |
Distributions from net long-term capital gains | | | — |
| * | Net ordinary income consists of net taxable income derived from dividends, interest and net short-term capital gains, if any. |
The Fund elected to defer net realized losses from investments incurred from December 29, 2008 (commencement of operations) through June 30, 2009, the Fund’s tax year end, (“post-October losses”) in accordance with federal income tax regulations. Post-October capital losses of $86,516 were treated as having arisen on the first day of the following fiscal year.
7. Management Fees and Other Transactions with Affiliates
The Fund’s management fee is separated into two components – a complex-level component, based on the aggregate amount of all fund assets managed by Nuveen Asset Management (the “Adviser”), a wholly owned subsidiary of Nuveen Investments, Inc. (“Nuveen”), and a specific fund-level component, based only on the amount of assets within the Fund. This pricing structure enables Nuveen fund shareholders to benefit from growth in the assets within each individual fund as well as from growth in the amount of complex-wide assets managed by the Adviser.
The annual fund-level fee, payable monthly, for the Fund is based upon the average daily net assets of the Fund as follows:
| | | |
| Average Daily Net Assets (1) | | Fund-Level
Fee Rate | |
For the first $125 million | | .6500 | % |
For the next $125 million | | .6325 | |
For the next $250 million | | .6250 | |
For the next $500 million | | .6125 | |
For the next $1 billion | | .6000 | |
For net assets over $2 billion | | .5850 | |
The annual complex-level fee, payable monthly, which is additive to the fund-level fee, for all Nuveen sponsored funds in the U.S., is based on the aggregate amount of total fund net assets managed as stated in the following table. As of June 30, 2009, the complex-level fee rate was .1970%.
The complex-level fee schedule is as follows:
| | | |
| Complex-Level Net Asset Breakpoint Level (1) | | Effective Rate at Breakpoint Level | |
$55 billion | | .2000 | % |
$56 billion | | .1996 | |
$57 billion | | .1989 | |
$60 billion | | .1961 | |
$63 billion | | .1931 | |
$66 billion | | .1900 | |
$71 billion | | .1851 | |
$76 billion | | .1806 | |
$80 billion | | .1773 | |
$91 billion | | .1691 | |
$125 billion | | .1599 | |
$200 billion | | .1505 | |
$250 billion | | .1469 | |
$300 billion | | .1445 | |
| (1) | The complex-level fee component of the management fee for the funds is calculated based upon the aggregate daily managed net assets of all Nuveen funds, with such daily managed net assets defined separately for each fund in its management agreement, but excluding assets attributable to investments in other Nuveen funds. For the complex-level and fund-level fee components, daily managed net assets include assets managed by the Adviser that are attributable to financial leverage. For these purposes, financial leverage includes the fund’s use of preferred stock and borrowings and investments in the residual interest certificates (also called inverse floating rate securities) in tender option bond (TOB) trusts, including the portion of assets held by the TOB trust that has been effectively financed by the trust’s issuance of floating rate securities, subject to an agreement by the Adviser to limit the amount of such assets for determining managed net assets in certain circumstances. |
The management fee compensates the Adviser for overall investment advisory and administrative services and general office facilities. The Adviser has entered into a Sub-Advisory Agreement with Nuveen HydePark Group, LLC (“HydePark”), a subsidiary of Nuveen, under which HydePark manages the investment portfolio of the Fund. HydePark is compensated for its services to the Fund from the management fee paid to the Adviser.
The Adviser has agreed to waive and reimburse expenses through November 30, 2011, so that total annual Fund operating expenses (excluding 12b-1 distribution and service fees, interest expenses, taxes, fees incurred in acquiring and disposing of portfolio securities, dividends on securities sold short, enhanced custody expense and extraordinary expenses) do not exceed 1.10% (1.35% after November 30, 2011) of the average daily net assets of any class of Fund shares. The Adviser may also voluntarily reimburse additional expenses from time to time. Voluntary reimbursements may be terminated at any time at the Adviser’s discretion.
The Trust pays no compensation directly to those of its Trustees who are affiliated with the Adviser or to its Officers, all of whom receive remuneration for their services to the Trust from the Adviser or its affiliates. The Board of Trustees has adopted a deferred compensation plan for independent Trustees that enables Trustees to elect to defer receipt of all or a portion of the annual compensation they are entitled to receive from certain Nuveen advised funds. Under the plan, deferred amounts are treated as though equal dollar amounts had been invested in shares of select Nuveen advised funds.
At June 30, 2009, Nuveen owned all shares of each class of the Fund.
During the period December 29, 2008 (commencement of operations) through June 30, 2009, Nuveen Investments, LLC, a wholly owned subsidiary of Nuveen, retained all 12b-1 fees.
8. Subsequent Events
In May 2009, the Financial Accounting Standards Board issued Statement of Financial Accounting Standards No. 165 (SFAS No. 165) “Subsequent Events.” SFAS No. 165 requires an entity to recognize in the financial statements the effects of all subsequent events that provide additional evidence about conditions that existed at the date of the balance sheet. SFAS No. 165 is intended to establish general standards of accounting and for disclosure of events that occur after the balance sheet date but before financial statements are issued or are available to be issued. SFAS No. 165 requires the disclosure of the date through which an entity has evaluated subsequent events and the basis for that date — that is, whether that date represents the date the financial statements were issued or were available to be issued. SFAS No. 165 is effective for interim and annual periods ending after June 15, 2009. The Fund has performed an evaluation of subsequent events through August 31, 2009, which is the date the Trust’s form N-SAR was filed with the Securities and Exchange Commission (SEC).
Financial Highlights
| | | | | | | | | | | | | | | | | | | | | | | | | | | | | |
| Selected data for a share outstanding throughout each period: | |
| | | | | | | |
| Class (Commencement Date) | | | | | | | | | | | | | | | | | |
| | | | | Investment Operations | | | Less Distributions | | | | | |
| | | | | |
| | | | | | | | | | | | | |
Year Ended June 30, | | Beginning
Net Asset
Value | | Net Invest- ment
Income
(Loss)(a) | | Net Realized/ Unrealized Gain
(Loss) | | | Total | | | Net Invest- ment
Income | | Capital
Gains | | Total | | Ending
Net
Asset
Value | | Total
Return(b) | |
Class A (12/08) | | | | | | | | | | | | | | | | | | | | | | | | | | |
2009(e) | | $ | 20.00 | | $ | .20 | | $ | (.45 | ) | | $ | (.25 | ) | | $ | — | | $ | — | | $ | — | | $ | 19.75 | | (1.25 | )% |
Class C (12/08) | | | | | | | | | | | | | | | | | | | | | | | | | | |
2009(e) | | | 20.00 | | | .13 | | | (.46 | ) | | | (.33 | ) | | | — | | | — | | | — | | | 19.67 | | (1.65 | ) |
Class R3 (12/08) | | | | | | | | | | | | | | | | | | | | | | | | | | |
2009(e) | | | 20.00 | | | .18 | | | (.46 | ) | | | (.28 | ) | | | — | | | — | | | — | | | 19.72 | | (1.40 | ) |
Class I (12/08) | | | | | | | | | | | | | | | | | | | | | | | | | | |
2009(e) | | | 20.00 | | | .23 | | | (.46 | ) | | | (.23 | ) | | | — | | | — | | | — | | | 19.77 | | (1.15 | ) |
| | | | | | | | | | | | | | | | | | | | | | |
| | | | | | | | | | | | | | | | | | | | | | |
| | | | | | | | | | | | | | | | | | | | | | |
|
| Ratios/Supplemental Data | |
| | | Ratios to Average
Net Assets
Before Credit/Reimbursement | | | Ratios to Average
Net Assets
After Reimbursement(c) | | | Ratios to Average
Net Assets
After Credit/
Reimbursement(d) | | | | |
Ending
Net
Assets
(000) | | Expenses(f) | | | Net
Invest- ment
Income
(Loss)(f) | | | Expenses(f) | | | Net
Invest- ment
Income
(Loss)(f) | | | Expenses(f) | | | Net
Invest- ment
Income
(Loss)(f) | | | Portfolio
Turnover
Rate | |
| | | | | | | | | | | | | | | | | | | | | | |
| $ | 247 | | 6.10 | %* | | (2.53 | )%* | | 1.42 | %* | | 2.14 | %* | | 1.42 | %* | | 2.14 | %* | | 31 | % |
| | | | | | | | | | | | | | | | | | | | | | |
| | 246 | | 6.84 | * | | (3.28 | )* | | 2.17 | * | | 1.39 | * | | 2.17 | * | | 1.39 | * | | 31 | |
| | | | | | | | | | | | | | | | | | | | | | |
| | 247 | | 6.35 | * | | (2.78 | )* | | 1.67 | * | | 1.89 | * | | 1.67 | * | | 1.89 | * | | 31 | |
| | | | | | | | | | | | | | | | | | | | | | |
| | 2,718 | | 5.85 | * | | (2.28 | )* | | 1.17 | * | | 2.39 | * | | 1.17 | * | | 2.39 | * | | 31 | |
| (a) | Per share Net Investment Income (Loss) is calculated using the average daily shares method. |
| (b) | Total return is the combination of changes in net asset value without any sales charge, reinvested dividend income at net asset value and reinvested capital gains distributions at net asset value, if any. Total returns are not annualized. |
| (c) | After expense reimbursement from the Adviser, where applicable. |
| (d) | After custodian fee credit and expense reimbursement, where applicable. |
| (e) | For the period December 29, 2008 (commencement of operations) through June 30, 2009. |
| (f) | Each ratio includes the effect of the dividend expense on securities sold short and enhanced custody expense as follows: |
| | | | |
| | | Ratio of Dividend Expense on
Securities Sold Short to
Average Net Assets | | Ratio of Enhanced Custody
Expense to Average Net Assets |
Year Ended June 30: | | | | |
2009(e) | | .04%* | | .03%* |
See accompanying notes to financial statements.
Notes
Notes
Trustees and Officers
The management of the Fund, including general supervision of the duties performed for the Fund by the Adviser, is the responsibility of the Board of Trustees of the Fund. The number of trustees of the Fund is currently set at nine. None of the trustees who are not “interested” persons of the Fund (referred to herein as “independent trustees”) has ever been a director or employee of, or consultant to, Nuveen or its affiliates. The names and business addresses of the trustees and officers of the Fund, their principal occupations and other affiliations during the past five years, the number of portfolios each oversees and other directorships they hold are set forth below.
The Fund’s Statement of Additional Information (“SAI”) includes more information about the trustees. To request a free copy, call Nuveen Investments at (800) 257-8787 or visit the Funds’ website at www.nuveen.com.
| | | | | | | | |
Name, Birthdate and Address | | Position(s) Held with the Fund | | Year First Elected or Appointed (1) | | Principal Occupation(s) Including other Directorships During Past 5 Years | | Number of Portfolios in Fund Complex Overseen by Trustee |
| | |
| Independent Trustees: | | | | |
Robert P. Bremner 8/22/40 333 W. Wacker Drive Chicago, IL 60606 | | Chairman of the Board and Trustee | | 1997 | | Private Investor and Management Consultant; Treasurer and Director, Humanities Council of Washington D.C. | | 199 |
Jack B. Evans 10/22/48 333 W. Wacker Drive Chicago, IL 60606 | | Trustee | | 1999 | | President, The Hall-Perrine Foundation, a private philanthropic corporation (since 1996); Director and Vice Chairman, United Fire Group, a publicly held company; Member of the Board of Regents for the State of Iowa University System; Director, Gazette Companies; Life Trustee of Coe College; Director, Iowa College Foundation; Member of the Advisory Council of the Department of Finance in the Tippie College of Business, University of lowa; formerly, Director, Alliant Energy; formerly, Director, Federal Reserve Bank of Chicago; formerly, President and Chief Operating Officer, SCI Financial Group, Inc., a regional financial services firm. | | 199 |
William C. Hunter 3/6/48 333 W. Wacker Drive Chicago, IL 60606 | | Trustee | | 2004 | | Dean, Tippie College of Business, University of Iowa (since 2006); Director (since 2004) of Xerox Corporation; Director (since 2005), Beta Gamma Sigma International Honor Society; formerly, Dean and Distinguished Professor of Finance, School of Business at the University of Connecticut (2003-2006); previously, Senior Vice President and Director of Research at the Federal Reserve Bank of Chicago (1995-2003); Director, SS&C Technologies, Inc. (May 2005-October 2005); formerly, Director (1997-2007), Credit Research Center at George Washington University. | | 199 |
David J. Kundert 10/28/42 333 W. Wacker Drive Chicago, IL 60606 | | Trustee | | 2005 | | Director, Northwestern Mutual Wealth Management Company; retired (since 2004) as Chairman, JPMorgan Fleming Asset Management, President and CEO, Banc One Investment Advisors Corporation, and President, One Group Mutual Funds; prior thereto, Executive Vice President, Banc One Corporation and Chairman and CEO, Banc One Investment Management Group; Member, Board of Regents, Luther College; member of the Wisconsin Bar Association; member of Board of Directors, Friends of Boerner Botanical Gardens; member of Investment Committee, Greater Milwaukee Foundation. | | 199 |
William J. Schneider 9/24/44 333 W. Wacker Drive Chicago, IL 60606 | | Trustee | | 1997 | | Chairman of Miller-Valentine Partners Ltd., a real estate investment company; formerly, Senior Partner and Chief Operating Officer (retired, 2004) of Miller-Valentine Group; Member, Dayton Philharmonic Orchestra Association; formerly, Member, Business Advisory Council, Cleveland Federal Reserve Bank; formerly, Director, Dayton Development Coalition. | | 199 |
Judith M. Stockdale 12/29/47 333 W. Wacker Drive Chicago, IL 60606 | | Trustee | | 1997 | | Executive Director, Gaylord and Dorothy Donnelley Foundation (since 1994); prior thereto, Executive Director, Great Lakes Protection Fund (from 1990 to 1994). | | 199 |
Carole E. Stone 6/28/47 333 W. Wacker Drive Chicago, IL 60606 | | Trustee | | 2007 | | Director, Chicago Board Options Exchange (since 2006); Director, C2 Options Exchange, Incorporated (since 2009); Commissioner, New York State Commission on Public Authority Reform (since 2005); formerly, Chair, New York Racing Association Oversight Board (2005-2007). | | 199 |
| | | | | | | | |
Name, Birthdate and Address | | Position(s) Held with the Fund | | Year First Elected or Appointed (1) | | Principal Occupation(s) Including other Directorships During Past 5 Years | | Number of Portfolios in Fund Complex Overseen by Trustee |
Terence J. Toth 9/29/59 333 W. Wacker Drive Chicago, IL 60606 | | Trustee | | 2008 | | Director, Legal & General Investment Management America, Inc. (since 2008); Managing Partner, Musso Capital Management (since 2008); CEO and President, Northern Trust Investments (2004-2007); Executive Vice President, Quantitative Management & Securities Lending (2000-2004); prior thereto, various positions with Northern Trust Company (since 1994); Member: Goodman Theatre Board (since 2004); Chicago Fellowship Board (since 2005), University of Illinois Leadership Council Board (since 2007) and Catalyst Schools of Chicago Board (since 2008); formerly, Member: Northern Trust Mutual Funds Board (2005-2007), Northern Trust Investments Board (2004-2007), Northern Trust Japan Board (2004-2007), Northern Trust Securities Inc. Board (2003-2007) and Northern Trust Hong Kong Board (1997-2004). | | 199 |
| | |
| Interested Trustee: | | | | |
John P. Amboian (2) 6/14/61 333 W. Wacker Drive Chicago, IL 60606 | | Trustee | | 2008 | | Chief Executive Officer (since July 2007) and Director (since 1999) of Nuveen Investments, Inc.; Chief Executive Officer (since 2007) of Nuveen Asset Management, Nuveen Investments Advisors, Inc. formerly, President (1999-2004) of Nuveen Advisory Corp. and Nuveen Institutional Advisory Corp. (3) | | 199 |
Name, Birthdate and Address | | Position(s) Held with the Fund | | Year First Elected or Appointed (4) | | Principal Occupation(s) During Past 5 Years | | Number of Portfolios in Fund Complex Overseen by Officer |
| | |
| Officers of the Fund: | | | | |
Gifford R. Zimmerman 9/9/56 333 W. Wacker Drive Chicago, IL 60606 | | Chief Administrative Officer | | 1988 | | Managing Director (since 2002), Assistant Secretary and Associate General Counsel of Nuveen Investments, LLC; Managing Director (since 2002), Associate General Counsel and Assistant Secretary, of Nuveen Asset Management (since 2002) and of Symphony Asset Management LLC (since 2003); Vice President and Assistant Secretary of NWQ Investment Management Company, LLC. (since 2002), Nuveen Investments Advisers Inc. (since 2002), Tradewinds Global Investors, LLC, and Santa Barbara Asset Management, LLC (since 2006), Nuveen HydePark Group LLC and Nuveen Investment Solutions, Inc. (since 2007); Managing Director (since 2004) and Assistant Secretary (since 1994) of Nuveen Investments, Inc.; formerly, Managing Director (2002-2004), General Counsel (1998-2004) and Assistant Secretary of Nuveen Advisory Corp. and Nuveen Institutional Advisory Corp. (3); Chartered Financial Analyst. | | 199 |
Mark J.P. Anson 6/10/59 333 W. Wacker Drive Chicago, IL 60606 | | Vice President | | 2009 | | President and Executive Director of Nuveen Investments, Inc. (since 2007); President of Nuveen Investments Institutional Services Group LLC (since 2007); previously, Chief Executive Officer of the British Telecom Pension Scheme (2006-2007) and Chief Investment Officer of Calpers (1999-2006); PhD, Chartered Financial Analyst, Chartered Alternative Investment Analyst, Certified Public Accountant, Certified Management Accountant and Certified Internal Auditor. | | 199 |
Nizida Arriaga 6/1/1968 333 W. Wacker Drive Chicago, IL 60606 | | Vice President | | 2009 | | Vice President (since 2007) of Nuveen Investments, LLC; previously, Portfolio Manager, Allstate Investments, LLC (1996-2006); Chartered Financial Analyst. | | 199 |
Trustees and Officers (continued)
| | | | | | | | |
Name, Birthdate and Address | | Position(s) Held with the Fund | | Year First Elected or Appointed (4) | | Principal Occupation(s) During Past 5 Years | | Number of Portfolios in Fund Complex Overseen by Officer |
Michael T. Atkinson 2/3/66 333 W. Wacker Drive Chicago, IL 60606 | | Vice President and Assistant Secretary | | 2000 | | Vice President (since 2002) of Nuveen Investments, LLC; Vice President of Nuveen Asset Management (since 2005). | | 199 |
Margo L. Cook 4/11/64 333 W. Wacker Drive Chicago, IL 60606 | | Vice President | | 2009 | | Executive Vice President (since Oct 2008) of Nuveen Investments, Inc.; previously, Head of Institutional Asset Management (2007-2008) of Bear Stearns Asset Management; Head of Institutional Asset Mgt (1986-2007) of Bank of NY Mellon; Chartered Financial Analyst. | | 199 |
Alan A. Brown 8/1/62 333 W. Wacker Drive Chicago, IL 60606 | | Vice President | | 2007 | | Executive Vice President, Mutual Funds, Nuveen Investments, LLC, (since 2005), previously, Managing Director and Chief Marketing Officer (2001-2005). | | 74 |
Name, Birthdate and Address | | Position(s) Held with the Fund | | Year First Elected or Appointed (4) | | Principal Occupation(s) Including other Directorships During Past 5 Years | | Number of Portfolios in Fund Complex Overseen by Officer |
Lorna C. Ferguson 10/24/45 333 W. Wacker Drive Chicago, IL 60606 | | Vice President | | 1998 | | Managing Director (since 2004) of Nuveen Investments, LLC; Managing Director (since 2005) of Nuveen Asset Management; Managing Director (2004-2005) of Nuveen Advisory Corp. and Nuveen Institutional Advisory Corp. (3). | | 199 |
Stephen D. Foy 5/31/54 333 W. Wacker Drive Chicago, IL 60606 | | Vice President and Controller | | 1998 | | Vice President (since 1993) and Funds Controller (since 1998) of Nuveen Investments, LLC; Vice President (since 2005) of Nuveen Asset Management; Certified Public Accountant. | | 199 |
William T. Huffman 5/7/1969 333 W. Wacker Drive Chicago, IL 60606 | | Vice President | | 2009 | | Chief Operating Officer, Municipal Fixed Income (since 2008) of Nuveen Asset Management; previously, Chairman, President and Chief Executive Officer (2002 – 2007) of Northern Trust Global Advisors, Inc. and Chief Executive Officer (2007) of Northern Trust Global Investments Limited; CPA. | | 199 |
Walter M. Kelly 2/24/70 333 W. Wacker Drive Chicago, IL 60606 | | Chief Compliance Officer and Vice President | | 2003 | | Senior Vice President (since 2008), Vice President (2006- 2008) formerly, Assistant Vice President and Assistant General Counsel (2003-2006) of Nuveen Investments, LLC; Vice President (since 2006) and Assistant Secretary (since 2003) of Nuveen Asset Management. | | 199 |
David J. Lamb 3/22/63 333 W. Wacker Drive Chicago, IL 60606 | | Vice President | | 2000 | | Senior Vice President (since 2009), formerly, Vice President (2000-2009) of Nuveen Investments, LLC; Vice President (since 2005) of Nuveen Asset Management, Certified Public Accountant. | | 199 |
Tina M. Lazar 8/27/61 333 W. Wacker Drive Chicago, IL 60606 | | Vice President | | 2002 | | Senior Vice President (since 2009), formerly, Vice President of Nuveen Investments, LLC (1999-2009); Vice President of Nuveen Asset Management (since 2005). | | 199 |
Larry W. Martin 7/27/51 333 W. Wacker Drive Chicago, IL 60606 | | Vice President and Assistant Secretary | | 1988 | | Vice President, Assistant Secretary and Assistant General Counsel of Nuveen Investments, LLC; Vice President (since 2005) and Assistant Secretary of Nuveen Investments, Inc.; Vice President and Assistant Secretary of Nuveen Investments Advisers Inc. (since 2002), NWQ Investment Management Company, LLC (since 2002), Symphony Asset Management LLC (since 2003), Tradewinds Global Investors, LLC, Santa Barbara Asset Management, LLC (since 2006) and of Nuveen HydePark Group, LLC and Nuveen Investment Solutions, Inc. (since 2007); formerly, Vice President and Assistant Secretary of Nuveen Advisory Corp. and Nuveen Institutional Advisory Corp. (3) | | 199 |
| | | | | | | | |
Name, Birthdate and Address | | Position(s) Held with the Fund | | Year First Elected or Appointed (4) | | Principal Occupation(s) Including other Directorships During Past 5 Years | | Number of Portfolios in Fund Complex Overseen by Officer |
Kevin J. McCarthy 3/26/66 333 W. Wacker Drive Chicago, IL 60606 | | Vice President and Secretary | | 2007 | | Managing Director (since 2008), formerly, Vice President (2007-2008), Nuveen Investments, LLC; Managing Director (since 2008), formerly, Vice President and Assistant Secretary, Nuveen Asset Management and Nuveen Investments Holdings, Inc.; Vice President (since 2007) and Assistant Secretary, Nuveen Investment Advisers Inc., Nuveen Investment Institutional Services Group LLC, NWQ Investment Management Company, LLC, Tradewinds Global Investors LLC, NWQ Holdings, LLC, Symphony Asset Management LLC, Santa Barbara Asset Management LLC, Nuveen HydePark Group, LLC and Nuveen Investment Solutions, Inc. (since 2007); prior thereto, Partner, Bell, Boyd & Lloyd LLP (1997-2007). | | 199 |
John V. Miller 4/10/67 333 W. Wacker Drive Chicago, IL 60606 | | Vice President | | 2007 | | Managing Director (since 2007), formerly, Vice President (2002-2007) of Nuveen Asset Management and Nuveen Investments, LLC; Chartered Financial Analyst. | | 199 |
Gregory Mino 1/4/1971 333 W. Wacker Drive Chicago, IL 60606 | | Vice President | | 2009 | | Vice President of Nuveen Investments, LLC (since 2008); previously, Director (2004-2007) and Executive Director (2007-2008) of UBS Global Asset Management; previously, Vice President (2000-2003) and Director (2003-2004) of Merrill Lynch Investment Managers; Chartered Financial Analyst. | | 199 |
Christopher M. Rohrbacher 8/1/71 333 W. Wacker Drive Chicago, IL 60606 | | Vice President and Assistant Secretary | | 2008 | | Vice President, Nuveen Investments, LLC (since 2008); Vice President and Assistant Secretary, Nuveen Asset Management (since 2008); prior thereto, Associate, Skadden, Arps, Slate Meagher & Flom LLP (2002-2008) | | 199 |
James F. Ruane 7/3/62 333 W. Wacker Drive Chicago, IL 60606 | | Vice President and Assistant Secretary | | 2007 | | Vice President, Nuveen Investments (since 2007); prior thereto, Partner, Deloitte & Touche USA LLP (2005-2007), formerly, senior tax manager (2002-2005); Certified Public Accountant. | | 199 |
John S. White 5/12/67 333 W. Wacker Drive Chicago, IL 60606 | | Vice President | | 2007 | | Senior Vice President (since 2009), formerly, Vice President (2006-2009) of Nuveen Investments, LLC, formerly, Assistant Vice President (since 2002); Lieutenant Colonel (since 2007), United States Marine Corps Reserve, formerly, Major (since 2001). | | 74 |
Mark L. Winget 12/21/68 333 W. Wacker Drive Chicago, IL 60606 | | Vice President and Assistant Secretary | | 2008 | | Vice President, Nuveen Investments, LLC (since 2008); Vice President and Assistant Secretary, Nuveen Asset Management (since 2008); prior thereto, Counsel, VedderPrice P.C. (1997-2007). | | 199 |
| (1) | Trustees serve an indefinite term until his/her successor is elected or appointed. The year first elected or appointed represents the year in which the trustee was first elected or appointed to any fund in the Nuveen Fund Complex. |
| (2) | Mr. Amboian is an interested trustee because of his position with Nuveen Investments, Inc. and certain of its subsidiaries, which are affiliates of the Nuveen Funds. |
| (3) | Nuveen Advisory Corp. and Nuveen Institutional Advisory Corp. were reorganized into Nuveen Asset Management, effective January 1, 2005. |
| (4) | Officers serve one year terms through July of each year. The year first elected or appointed represents the year in which the officer was first elected or appointed to any fund in the Nuveen Fund Complex. |
Glossary of Terms Used in this Report
Average Annual Total Return: This is a commonly used method to express an investment’s performance over a particular, usually multi-year time period. It expresses the return that would have been necessary each year to equal the investment’s actual cumulative performance (including change in NAV or offer price and reinvested dividends and capital gains distributions, if any) over the time period being considered.
Net Asset Value (NAV): A Fund’s NAV is the dollar value of one share in the Fund. It is calculated by subtracting the liabilities of the Fund from its total assets and then dividing the remainder by the number of shares outstanding. Fund NAVs are calculated at the end of each business day.
Fund Information
Fund Manager
Nuveen Asset Management
333 West Wacker Drive
Chicago, IL 60606
Sub-Advisers
Nuveen HydePark Group, LLC
111 West Jackson Blvd.
Suite 1411
Chicago, IL 60604
Legal Counsel
Chapman and Cutler LLP
Chicago, IL
Independent Registered Public Accounting Firm
PricewaterhouseCoopers LLP
Chicago, IL
Custodian
State Street Bank & Trust Company
Boston, MA
Transfer Agent and Shareholder Services
Boston Financial
Data Services
Nuveen Investor Services
P.O. Box 8530
Boston, MA 02266-8530
(800) 257-8787
Quarterly Portfolio of Investments and Proxy Voting Information: You may obtain (i) the Fund’s quarterly portfolio of investments, (ii) information regarding how the Fund voted proxies relating to portfolio securities held during the most recent twelve-month period ended June 30, 2009, and (iii) a description of the policies and procedures that the Fund used to determine how to vote proxies relating to portfolio securities without charge, upon request, by calling Nuveen Investments at (800) 257-8787 or on Nuveen’s website at www.nuveen.com.
You may also obtain this and other Fund information directly from the Securities and Exchange Commission (“SEC”). The SEC may charge a copying fee for this information. Visit the SEC on-line at http://www.sec.gov or in person at the SEC’s Public Reference Room in Washington, D.C. Call the SEC at (202) 942-8090 for room hours and operation. You may also request Fund information by sending an e-mail request to publicinfo@sec.gov or by writing to the SEC’s Public Reference Section at 100 F Street NE, Washington, D.C. 20549.
The Financial Industry Regulatory Authority (FINRA) provides a Public Disclosure Program which supplies certain information regarding the disciplinary history of FINRA members and their associated persons in response to either telephone inquiries at (800) 289-9999 or written inquiries at www.finra.org. Financial Industry Regulatory Authority also provides an investor brochure that includes information describing the Public Disclosure Program.
Nuveen Investments:
Serving Investors For Generations
Since 1898, financial advisors and their clients have relied on Nuveen Investments to provide dependable investment solutions. Over this time, Nuveen Investments has adhered to the belief that the best approach to investing is to apply conservative risk-management principles to help minimize volatility.
Building on this tradition, we today offer a range of high quality equity and fixed-income solutions that can be integral parts of a well-diversified core portfolio. Our clients have come to appreciate this diversity, as well as our continued adherence to proven, long-term investing principles.
We offer many different investing solutions
for our clients’ different needs.
Nuveen Investments is a global investment management firm that seeks to help secure the long-term goals of institutions and high net worth investors as well as the consultants and financial advisors who serve them. Nuveen Investments markets its growing range of specialized investment solutions under the high-quality brands of HydePark, NWQ, Nuveen, Santa Barbara, Symphony, Tradewinds and Winslow Capital. In total, the Company managed $128 billion of assets on June 30, 2009.
Find out how we can help you reach your financial goals.
An investor should carefully consider the Fund’s objectives, risks, charges and expenses before investing. For a prospectus containing this and other information about the Fund, please contact your financial advisor or Nuveen Investments at (800) 257-8787. Read the prospectus carefully before you invest or send money.
Learn more about Nuveen Funds at www.nuveen.com/mf
| | |
Distributed by Nuveen Investments, LLC 333 West Wacker Drive Chicago, IL 60606 www.nuveen.com | | |
MAN-EQTYP-0609P
ITEM 2. CODE OF ETHICS.
As of the end of the period covered by this report, the registrant has adopted a code of ethics that applies to the registrant’s principal executive officer, principal financial officer, principal accounting officer or controller, or persons performing similar functions. There were no amendments to or waivers from the code during the period covered by this report. The registrant has posted the code of ethics on its website at www.nuveen.com/mf. (To view the code, click on the Shareholder Resources drop down menu box, click on Fund Governance and then click on Code of Conduct.)
ITEM 3. AUDIT COMMITTEE FINANCIAL EXPERT.
The registrant’s Board of Trustees determined that the registrant has at least one “audit committee financial expert” (as defined in Item 3 of Form N-CSR) serving on its Audit Committee. The registrant’s audit committee financial expert is Jack B. Evans, who is “independent” for purposes of Item 3 of Form N-CSR.
Mr. Evans was formerly President and Chief Operating Office of SCI Financial Group, Inc., a full service registered broker-dealer and registered investment adviser (“SCI”). As part of his role as President and Chief Operating Officer, Mr. Evans actively supervised the Chief Financial Officer (the “CFO”) and actively supervised the CFO’s preparation of financial statements and other filings with various regulatory authorities. In such capacity, Mr. Evans was actively involved in the preparation of SCI’s financial statements and the resolution of issues raised in connection therewith. Mr. Evans has also served on the audit committee of various reporting companies. At such companies, Mr. Evans was involved in the oversight of audits, audit plans, and the preparation of financial statements. Mr. Evans also formerly chaired the audit committee of the Federal Reserve Bank of Chicago.
ITEM 4. PRINCIPAL ACCOUNTANT FEES AND SERVICES.
The following tables show the amount of fees that PricewaterhouseCoopers LLP, the Trust’s auditor, billed to the Trust during the Trust’s last two full fiscal years. The Audit Committee approved in advance all audit services and non-audit services that PricewaterhouseCoopers LLP provided to the Trust, except for those non-audit services that were subject to the pre-approval exception under Rule 2-01 of Regulation S-X (the “pre-approval exception”). The pre-approval exception for services provided directly to the Trust waives the pre-approval requirement for services other than audit, review or attest services if: (A) the aggregate amount of all such services provided constitutes no more than 5% of the total amount of revenues paid by the Trust during the fiscal year in which the services are provided; (B) the Trust did not recognize the services as non-audit services at the time of the engagement; and (C) the services are promptly brought to the Audit Committee’s attention, and the Committee (or its delegate) approves the services before the audit is completed.
The Audit Committee has delegated certain pre-approval responsibilities to its Chairman (or, in his absence, any other member of the Audit Committee).
SERVICES THAT THE TRUST’S AUDITOR BILLED TO THE TRUST
| | | | | | | | | | | | |
Fiscal Year Ended June 30, 2009 | | Audit Fees Billed
to Funds 1 | | Audit-Related Fees
Billed to Funds 2 | | Tax Fees
Billed to Funds 3 | | All Other Fees
Billed to Funds 4 |
Name of Series | | | | | | | | | | | | |
Moderate Allocation Fund 5 | | | 8,744 | | | 0 | | | 2,750 | | | 0 |
Conservative Allocation Fund 6 | | | 9,531 | | | 0 | �� | | 2,750 | | | 0 |
Enhanced Core Equity Fund | | | 7,532 | | | 0 | | | 2,750 | | | 0 |
Enhanced Mid-Cap Fund | | | 5,800 | | | 0 | | | 2,750 | | | 0 |
Multi-Manager Large-Cap Value Fund | | | 28,893 | | | 0 | | | 2,750 | | | 0 |
Growth Allocation Fund 7 | | | 6,366 | | | 0 | | | 2,750 | | | 0 |
NWQ Multi-Cap Value Fund | | | 39,692 | | | 0 | | | 2,750 | | | 0 |
NWQ Small-Cap Value Fund | | | 12,474 | | | 0 | | | 2,750 | | | 0 |
Tradewinds Value Opportunities Fund | | | 64,145 | | | 0 | | | 2,750 | | | 0 |
NWQ Large-Cap Value Fund | | | 7,810 | | | 0 | | | 2,750 | | | 0 |
NWQ Small Mid/Cap Value Fund | | | 6,007 | | | 0 | | | 2,750 | | | 0 |
U.S. Equity Completeness Fund 8 | | | 6,083 | | | 0 | | | 0 | | | 0 |
Enhanced Core Equity Plus Fund 9 | | | 5,943 | | | 0 | | | 0 | | | 0 |
| | | | | | | | | | | | |
Total | | $ | 209,020 | | $ | 0 | | $ | 30,250 | | $ | 0 |
| 1 | | “Audit Fees” are the aggregate fees billed for professional services for the audit of the Fund’s annual financial statements and services provided in connection with statutory and regulatory filings or engagements. |
| 2 | | “Audit Related Fees” are the aggregate fees billed for assurance and related services reasonably related to the performance of the audit or review of financial statements and are not reported under “Audit Fees.” |
| 3 | | “Tax Fees” are the aggregate fees billed for professional services for tax advice, tax compliance, and tax planning. |
| 4 | | “All Other Fees” are the aggregate fees billed for products and services other than “Audit Fees,” “Audit Related Fees,” and “Tax Fees.” |
| 5 | | Prior to August 1, 2008, the Fund was known as Nuveen Balanced Stock and Bond Fund. |
| 6 | | Prior to July 7, 2008, the Fund was known as Nuveen Balanced Municipal and Stock Fund. |
| 7 | | Prior to August 1, 2008, the Fund was known as Nuveen Global Value Fund. |
| 8 | | The Fund commenced operations on July 01, 2008. |
| 9 | | The Fund commenced operations on December 29, 2008. |
| | | | | | | | |
| | | Percentage Approved Pursuant to Pre-approval Exception |
| | | Audit Fees Billed
to Funds | | Audit-Related Fees
Billed to Funds | | Tax Fees
Billed to Funds | | All Other Fees
Billed to Funds |
Name of Series | | | | | | | | |
Moderate Allocation Fund | | 0 | | 0 | | 0 | | 0 |
Conservative Allocation Fund | | 0 | | 0 | | 0 | | 0 |
Enhanced Core Equity Fund | | 0 | | 0 | | 0 | | 0 |
Enhanced Mid-Cap Fund | | 0 | | 0 | | 0 | | 0 |
Multi-Manager Large-Cap Value Fund | | 0 | | 0 | | 0 | | 0 |
Growth Allocation Fund | | 0 | | 0 | | 0 | | 0 |
NWQ Multi-Cap Value Fund | | 0 | | 0 | | 0 | | 0 |
NWQ Small-Cap Value Fund | | 0 | | 0 | | 0 | | 0 |
Tradewinds Value Opportunities Fund | | 0 | | 0 | | 0 | | 0 |
NWQ Large-Cap Value Fund | | 0 | | 0 | | 0 | | 0 |
NWQ Small Mid/Cap Value Fund | | 0 | | 0 | | 0 | | 0 |
U.S. Equity Completeness Fund 1 | | 0 | | 0 | | 0 | | 0 |
Enhanced Core Equity Plus Fund 2 | | 0 | | 0 | | 0 | | 0 |
| 1 | | The Fund commenced operations on July 01, 2008. |
| 2 | | The Fund commenced operations on December 29, 2008. |
| | | | | | | | | | | | |
Fiscal Year Ended June 30, 2008 | | Audit Fees Billed
to Funds 1 | | Audit-Related Fees
Billed to Funds 2 | | Tax Fees
Billed to Funds 3 | | All Other Fees
Billed to Funds 4 |
Name of Series | | | | | | | | | | | | |
Moderate Allocation Fund 5 | | | 8,322 | | | 0 | | | 2,800 | | | 0 |
Conservative Allocation Fund 6 | | | 9,067 | | | 0 | | | 2,800 | | | 0 |
Enhanced Core Equity Fund | | | 7,287 | | | 0 | | | 0 | | | 0 |
Enhanced Mid-Cap Fund | | | 5,911 | | | 0 | | | 0 | | | 0 |
Multi-Manager Large-Cap Value Fund | | | 28,346 | | | 0 | | | 2,800 | | | 0 |
Growth Allocation Fund 7 | | | 6,619 | | | 0 | | | 2,800 | | | 0 |
NWQ Multi-Cap Value Fund | | | 53,591 | | | 0 | | | 2,800 | | | 0 |
NWQ Small-Cap Value Fund | | | 13,569 | | | 0 | | | 2,800 | | | 0 |
Tradewinds Value Opportunities Fund | | | 32,019 | | | 0 | | | 2,800 | | | 0 |
NWQ Large-Cap Value Fund | | | 6,639 | | | 0 | | | 2,800 | | | 0 |
NWQ Small Mid/Cap Value Fund | | | 6,770 | | | 0 | | | 2,800 | | | 0 |
U.S. Equity Completeness Fund 8 | | | N/A | | | N/A | | | N/A | | | N/A |
Enhanced Core Equity Plus Fund 9 | | | N/A | | | N/A | | | N/A | | | N/A |
| | | | | | | | | | | | |
Total | | $ | 178,140 | | $ | 0 | | $ | 25,200 | | $ | 0 |
| 1 | | “Audit Fees” are the aggregate fees billed for professional services for the audit of the Fund’s annual financial statements and services provided in connection with statutory and regulatory filings or engagements. |
| 2 | | “Audit Related Fees” are the aggregate fees billed for assurance and related services reasonably related to the performance of the audit or review of financial statements and are not reported under “Audit Fees.” |
| 3 | | “Tax Fees” are the aggregate fees billed for professional services for tax advice, tax compliance, and tax planning. |
| 4 | | “All Other Fees” are the aggregate fees billed for products and services other than “Audit Fees,” “Audit Related Fees,” and “Tax Fees.” |
| 5 | | Prior to August 1, 2008, the Fund was known as Nuveen Balanced Stock and Bond Fund. |
| 6 | | Prior to July 7, 2008, the Fund was known as Nuveen Balanced Municipal and Stock Fund. |
| 7 | | Prior to August 1, 2008, the Fund was known as Nuveen Global Value Fund. |
| 8 | | The Fund commenced operations on July 01, 2008. |
| 9 | | The Fund commenced operations on December 29, 2008. |
| | | | | | | | |
| | | Percentage Approved Pursuant to Pre-approval Exception |
| | | Audit Fees Billed
to Funds | | Audit-Related Fees
Billed to Funds | | Tax Fees
Billed to Funds | | All Other Fees
Billed to Funds |
Name of Series | | | | | | | | |
Moderate Allocation Fund | | 0 | | 0 | | 0 | | 0 |
Conservative Allocation Fund | | 0 | | 0 | | 0 | | 0 |
Enhanced Core Equity Fund | | 0 | | 0 | | 0 | | 0 |
Enhanced Mid-Cap Fund | | 0 | | 0 | | 0 | | 0 |
Multi-Manager Large-Cap Value Fund | | 0 | | 0 | | 0 | | 0 |
Growth Allocation Fund | | 0 | | 0 | | 0 | | 0 |
NWQ Multi-Cap Value Fund | | 0 | | 0 | | 0 | | 0 |
NWQ Small-Cap Value Fund | | 0 | | 0 | | 0 | | 0 |
Tradewinds Value Opportunities Fund | | 0 | | 0 | | 0 | | 0 |
NWQ Large-Cap Value Fund | | 0 | | 0 | | 0 | | 0 |
NWQ Small Mid/Cap Value Fund | | 0 | | 0 | | 0 | | 0 |
U.S. Equity Completeness Fund 1 | | N/A | | N/A | | N/A | | N/A |
Enhanced Core Equity Plus Fund 2 | | N/A | | N/A | | N/A | | N/A |
| 1 | | The Fund commenced operations on July 01, 2008. |
| 2 | | The Fund commenced operations on December 29, 2008. |
SERVICES THAT THE TRUST’S AUDITOR BILLED TO THE
ADVISER AND AFFILIATED FUND SERVICE PROVIDERS
The following tables show the amount of fees billed by PricewaterhouseCoopers LLP to Nuveen Asset Management (“NAM” or the “Adviser”), and any entity controlling, controlled by or under common control with NAM that provides ongoing services to the Trust (“Affiliated Fund Service Provider”), for engagements directly related to the Trust’s operations and financial reporting, during the Trust’s last two full fiscal years.
| | | | | | | | | | | | |
Fiscal Year Ended June 30, 2009 | | Audit-Related Fees
Billed to Adviser and
Affiliated Fund
Service Providers | | | Tax Fees Billed to
Adviser and
Affiliated Fund
Service Providers | | | All Other Fees
Billed to Adviser
and Affiliated Fund
Service Providers | |
Nuveen Investment Trust | | $ | 0 | | | $ | 0 | | | $ | 0 | |
| |
| | | Percentage Approved Pursuant to Pre-approval Exception | |
| | | Audit-Related Fees
Billed to Adviser and
Affiliated Fund
Service Providers | | | Tax Fees Billed to
Adviser and
Affiliated Fund
Service Providers | | | All Other Fees
Billed to Adviser
and Affiliated Fund
Service Providers | |
| | | 0 | % | | | 0 | % | | | 0 | % |
| | | |
Fiscal Year Ended June 30, 2008 | | Audit-Related Fees
Billed to Adviser and
Affiliated Fund
Service Providers | | | Tax Fees Billed to
Adviser and
Affiliated Fund
Service Providers | | | All Other Fees
Billed to Adviser
and Affiliated Fund
Service Providers | |
Nuveen Investment Trust | | $ | 0 | | | $ | 0 | | | $ | 0 | |
| |
| | | Percentage Approved Pursuant to Pre-approval Exception | |
| | | Audit-Related Fees
Billed to Adviser and
Affiliated Fund
Service Providers | | | Tax Fees Billed to
Adviser and
Affiliated Fund
Service Providers | | | All Other Fees
Billed to Adviser
and Affiliated Fund
Service Providers | |
| | | 0 | % | | | 0 | % | | | 0 | % |
The tables also show the percentage of fees subject to the pre-approval exception. The pre-approval exception for services provided to the Adviser and any Affiliated Fund Service Provider (other than audit, review or attest services) waives the pre-approval requirement if: (A) the aggregate amount of all such services provided constitutes no more than 5% of the total amount of revenues paid to PricewaterhouseCoopers LLP by the Trust, the Adviser and Affiliated Fund Service Providers during the fiscal year in which the services are provided that would have to be pre-approved by the Audit Committee; (B) the Trust did not recognize the services as non-audit services at the time of the engagement; and (C) the services are promptly brought to the Audit Committee’s attention, and the Committee (or its delegate) approves the services before the Trust’s audit is completed.
NON-AUDIT SERVICES
| | | | | | | | | | | | |
Fiscal Year Ended June 30, 2009 | | Total Non-Audit Fees
Billed to Trust | | Total Non-Audit Fees
billed to Adviser and
Affiliated Fund Service
Providers (engagements
related directly to the
operations and financial
reporting of the Trust) | | Total Non-Audit Fees
billed to Adviser and
Affiliated Fund Service
Providers (all other
engagements) | | Total |
Name of Series | | | | | | | | | | | | |
Moderate Allocation Fund 1 | | | 2,750 | | | 0 | | | 0 | | | 2,750 |
Conservative Allocation Fund 2 | | | 2,750 | | | 0 | | | 0 | | | 2,750 |
Enhanced Core Equity Fund | | | 2,750 | | | 0 | | | 0 | | | 2,750 |
Enhanced Mid-Cap Fund | | | 2,750 | | | 0 | | | 0 | | | 2,750 |
Multi-Manager Large-Cap Value Fund | | | 2,750 | | | 0 | | | 0 | | | 2,750 |
Growth Allocation Fund 3,4 | | | 3,823 | | | 0 | | | 0 | | | 3,823 |
NWQ Multi-Cap Value Fund | | | 2,750 | | | 0 | | | 0 | | | 2,750 |
NWQ Small-Cap Value Fund | | | 2,750 | | | 0 | | | 0 | | | 2,750 |
Tradewinds Value Opportunities Fund 4 | | | 5,612 | | | 0 | | | 0 | | | 5,612 |
NWQ Large-Cap Value Fund | | | 2,750 | | | 0 | | | 0 | | | 2,750 |
NWQ Small Mid/Cap Value Fund | | | 2,750 | | | 0 | | | 0 | | | 2,750 |
U.S. Equity Completeness Fund 5 | | | 0 | | | 0 | | | 0 | | | 0 |
Enhanced Core Equity Plus Fund 6 | | | 0 | | | 0 | | | 0 | | | 0 |
| | | | | | | | | | | | |
Total | | $ | 34,185 | | $ | 0 | | $ | 0 | | $ | 34,185 |
“Total Non-Audit Fees Billed to Trust” for both fiscal year ends represent “Tax Fees” billed to Funds in their respective amounts from the previous table.
| 1 | | Prior to August 1, 2008, the Fund was known as Nuveen Balanced Stock and Bond Fund. |
| 2 | | Prior to July 7, 2008, the Fund was known as Nuveen Balanced Municipal and Stock Fund. |
| 3 | | Prior to August 1, 2008, the Fund was known as Nuveen Global Value Fund. |
| 4 | | The “Total Non-Audit Fees Billed to Fund” includes tax fees paid by the Fund to Ernst & Young, LLP. |
| 5 | | The Fund commenced operations on July 01, 2008. |
| 6 | | The Fund commenced operations on December 29, 2008. |
| | | | | | | | | | | | | | |
Fiscal Year Ended June 30, 2008 | | Total Non-Audit Fees
Billed to Trust | | | Total Non-Audit Fees
billed to Adviser and
Affiliated Fund Service
Providers (engagements
related directly to the
operations and financial
reporting of the Trust) | | Total Non-Audit Fees
billed to Adviser and
Affiliated Fund Service
Providers (all other
engagements) | | Total | |
Name of Series | | | | | | | | | | | | | | |
Moderate Allocation Fund 1 | | | 2,800 | | | | 0 | | | 0 | | | 2,800 | |
Conservative Allocation Fund 2 | | | 2,800 | | | | 0 | | | 0 | | | 2,800 | |
Enhanced Core Equity Fund | | | 0 | | | | 0 | | | 0 | | | 0 | |
Enhanced Mid-Cap Fund | | | 0 | | | | 0 | | | 0 | | | 0 | |
Multi-Manager Large-Cap Value Fund | | | 2,800 | | | | 0 | | | 0 | | | 2,800 | |
Growth Allocation Fund 3,4 | | | 5,515 | | | | 0 | | | 0 | | | 5,515 | |
NWQ Multi-Cap Value Fund | | | 2,800 | | | | 0 | | | 0 | | | 2,800 | |
NWQ Small-Cap Value Fund | | | 2,800 | | | | 0 | | | 0 | | | 2,800 | |
Tradewinds Value Opportunities Fund 4 | | | 5,515 | | | | 0 | | | 0 | | | 5,515 | |
NWQ Large-Cap Value Fund | | | 2,800 | | | | 0 | | | 0 | | | 2,800 | |
NWQ Small Mid/Cap Value Fund | | | 2,800 | | | | 0 | | | 0 | | | 2,800 | |
U.S. Equity Completeness Fund 5 | | | N/A | | | | N/A | | | N/A | | | N/A | |
Enhanced Core Equity Plus Fund 6 | | | N/A | | | | N/A | | | N/A | | | N/A | |
| | | | | | | | | | | | | | |
Total | | $ | 30,630 | 7 | | $ | 0 | | $ | 0 | | $ | 30,630 | 7 |
“Total Non-Audit Fees Billed to Trust” for both fiscal year ends represent “Tax Fees” billed to Funds in their respective amounts from the previous table.
| 1 | | Prior to August 1, 2008, the Fund was known as Nuveen Balanced Stock and Bond Fund. |
| 2 | | Prior to July 7, 2008, the Fund was known as Nuveen Balanced Municipal and Stock Fund. |
| 3 | | Prior to August 1, 2008, the Fund was known as Nuveen Global Value Fund. |
| 4 | | The “Total Non-Audit Fees Billed to Fund” includes tax fees paid by the Fund to Ernst & Young, LLP. |
| 5 | | The Fund commenced operations on July 01, 2008. |
| 6 | | The Fund commenced operations on December 29, 2008. |
| 7 | | Total has been revised from the amount reported in the 2008 N-CSR annual filing. |
Audit Committee Pre-Approval Policies and Procedures. Generally, the Audit Committee must approve (i) all non-audit services to be performed for the Trust by the Trust’s independent accountants and (ii) all audit and non-audit services to be performed by the Trust’s independent accountants for the Affiliated Fund Service Providers with respect to the operations and financial reporting of the Trust. Regarding tax and research projects conducted by the independent accountants for the Trust and Affiliated Fund Service Providers (with respect to operations and financial reports of the Trust), such engagements will be (i) pre-approved by the Audit Committee if they are expected to be for amounts greater than $10,000; (ii) reported to the Audit Committee Chairman for his verbal approval prior to engagement if they are expected to be for amounts under $10,000 but greater than $5,000; and (iii) reported to the Audit Committee at the next Audit Committee meeting if they are expected to be for an amount under $5,000.
ITEM 5. AUDIT COMMITTEE OF LISTED REGISTRANTS
Not applicable to this registrant.
ITEM 6. SCHEDULE OF INVESTMENTS
See Portfolio of Investments in Item 1
ITEM 7. DISCLOSURE OF PROXY VOTING POLICIES AND PROCEDURES FOR CLOSED-END
MANAGEMENT INVESTMENT COMPANIES
Not applicable to this registrant.
ITEM 8. PORTFOLIO MANAGERS OF CLOSED-END MANAGEMENT INVESTMENT COMPANIES
Not applicable to this registrant.
ITEM 9. PURCHASES OF EQUITY SECURITIES BY CLOSED-END MANAGEMENT INVESTMENT COMPANY AND AFFILIATED PURCHASERS
Not applicable to this registrant.
ITEM 10. SUBMISSION OF MATTERS TO A VOTE OF SECURITY HOLDERS
There have been no material changes to the procedures by which shareholders may recommend nominees to the registrant’s Board of Trustees implemented after the registrant last provided disclosure in response to this Item.
ITEM 11. CONTROLS AND PROCEDURES.
| | (a) | | The registrant’s principal executive and principal financial officers, or persons performing similar functions, have concluded that the registrant’s disclosure controls and procedures (as defined in Rule 30a-3(c) under the Investment Company Act of 1940, as amended (the “1940 Act”) (17 CFR 270.30a-3(c))) are effective, as of a date within 90 days of the filing date of this report that includes the disclosure required by this paragraph, based on their evaluation of the controls and procedures required by Rule 30a-3(b) under the 1940 Act (17 CFR 270.30a-3(b)) and Rules 13a-15(b) or 15d-15(b) under the Securities Exchange Act of 1934, as amended (the “Exchange Act”) (17 CFR 240.13a-15(b) or 240.15d-15(b)). |
| | (b) | | There were no changes in the registrant’s internal control over financial reporting (as defined in Rule 30a-3(d) under the 1940 Act (17 CFR 270.30a-3(d)) that occurred during the second fiscal quarter of the period covered by this report that has materially affected, or is reasonably likely to materially affect, the registrant’s internal control over financial reporting. |
ITEM 12. EXHIBITS
File the exhibits listed below as part of this Form.
| | |
| (a)(1) | | Any code of ethics, or amendment thereto, that is the subject of the disclosure required by Item 2, to the extent that the registrant intends to satisfy the Item 2 requirements through filing of an exhibit: Not applicable because the code is posted on registrant’s website at www.nuveen.com/mf and there were no amendments during the period covered by this report. (To view the code, click on the Shareholder Resources drop down menu box, click on Fund Governance and then Code of Conduct.) |
| |
| (a)(2) | | A separate certification for each principal executive officer and principal financial officer of the registrant as required by Rule 30a-2(a) under the 1940 Act (17 CFR 270.30a-2(a)) in the exact form set forth below: See EX-99.CERT attached hereto. |
| |
| (a)(3) | | Any written solicitation to purchase securities under Rule 23c-1 under the 1940 Act (17 CFR 270.23c-1) sent or given during the period covered by the report by or on behalf of the registrant to 10 or more persons: Not applicable to this registrant. |
| |
| (b) | | If the report is filed under Section 13(a) or 15(d) of the Exchange Act, provide the certifications required by Rule 30a-2(b) under the 1940 Act (17 CFR 270.30a-2(b)), Rule 13a-14(b) or Rule 15d-14(b) under the Exchange Act (17 CFR 240.13a-14(b) or 240.15d-14(b)), and Section 1350 of Chapter 63 of Title 18 of the United States Code (18 U.S.C. 1350) as an Exhibit. A certification furnished pursuant to this paragraph will not be deemed “filed” for purposes of Section 18 of the Exchange Act (15 U.S.C. 78r), or otherwise subject to the liability of that section. Such certification will not be deemed to be incorporated by reference into any filing under the Securities Act of 1933 or the Exchange Act, except to the extent that the registration specifically incorporates it by reference: See EX-99.906 CERT attached hereto. |
SIGNATURES
Pursuant to the requirements of the Securities Exchange Act of 1934 and the Investment Company Act of 1940, the registrant has duly caused this report to be signed on its behalf by the undersigned, thereunto duly authorized.
(Registrant) Nuveen Investment Trust
| | |
| |
By (Signature and Title) | | /s/ Kevin J. McCarthy |
| | Kevin J. McCarthy |
| | Vice President and Secretary |
Date September 8, 2009
Pursuant to the requirements of the Securities Exchange Act of 1934 and the Investment Company Act of 1940, this report has been signed below by the following persons on behalf of the registrant and in the capacities and on the dates indicated.
| | |
| |
By (Signature and Title) | | /s/ Gifford R. Zimmerman |
| | Gifford R. Zimmerman |
| | Chief Administrative Officer |
| | (principal executive officer) |
Date September 8, 2009
| | |
| |
| By (Signature and Title) | | /s/ Stephen D. Foy |
| | Stephen D. Foy |
| | Vice President and Controller |
| | (principal financial officer) |
Date September 8, 2009