UNITED STATES
SECURITIES AND EXCHANGE COMMISSION
Washington, D.C. 20549
FORM N-CSR
CERTIFIED SHAREHOLDER REPORT OF REGISTERED MANAGEMENT
INVESTMENT COMPANIES
Investment Company Act file number 811-07619
Nuveen Investment Trust
(Exact name of registrant as specified in charter)
Nuveen Investments
333 West Wacker Drive, Chicago, IL 60606
(Address of principal executive offices) (Zip code)
Kevin J. McCarthy
Nuveen Investments
333 West Wacker Drive
Chicago, IL 60606
(Name and address of agent for service)
Registrant’s telephone number, including area code: (312) 917-7700
Date of fiscal year end: June 30
Date of reporting period: June 30, 2011
Form N-CSR is to be used by management investment companies to file reports with the Commission not later than 10 days after the transmission to stockholders of any report that is required to be transmitted to stockholders under Rule 30e-1 under the Investment Company Act of 1940 (17 CFR 270.30e-1). The Commission may use the information provided on Form N-CSR in its regulatory, disclosure review, inspection, and policy making roles.
A registrant is required to disclose the information specified by Form N-CSR, and the Commission will make this information public. A registrant is not required to respond to the collection of information contained in Form N-CSR unless the Form displays a currently valid Office of Management and Budget (“OMB”) control number. Please direct comments concerning the accuracy of the information collection burden estimate and any suggestions for reducing the burden to Secretary, Securities and Exchange Commission, 450 Fifth Street, NW, Washington, DC 20549-0609. The OMB has reviewed this collection of information under the clearance requirements of 44 U.S.C. ss.3507.
ITEM 1. REPORTS TO STOCKHOLDERS.

Mutual Funds
Nuveen Equity Funds
For investors seeking long-term capital appreciation.
Annual Report
June 30, 2011
| Share Class / Ticker Symbol | ||||||||||
| Fund Name | Class A | Class B | Class C | Class R3 | Class I | |||||
Nuveen Multi-Manager Large-Cap Value Fund | NNGAX | NNGBX | NNGCX | NMMTX | NNGRX | |||||
Nuveen NWQ Multi-Cap Value Fund | NQVAX | NQVBX | NQVCX | NMCTX | NQVRX | |||||
Nuveen NWQ Large-Cap Value Fund | NQCAX | NQCBX | NQCCX | NQCQX | NQCRX | |||||
Nuveen NWQ Small/Mid Cap Value Fund | NSMAX | — | NSMCX | NSQRX | NSMRX | |||||
Nuveen NWQ Small-Cap Value Fund | NSCAX | — | NSCCX | NSCOX | NSCRX | |||||
Nuveen Tradewinds Value Opportunities Fund | NVOAX | NVOBX | NVOCX | NTVTX | NVORX | |||||
INVESTMENT ADVISER NAME CHANGE
Effective January 1, 2011, Nuveen Asset Management, the Funds’ investment adviser, changed its name to Nuveen Fund Advisors, Inc. (“Nuveen Fund Advisors”). Concurrently, Nuveen Fund Advisors formed a wholly-owned subsidiary, Nuveen Asset Management, LLC, to house its portfolio management capabilities.
NUVEEN INVESTMENTS COMPLETES STRATEGIC COMBINATION WITH FAF ADVISORS
On December 31, 2010, Nuveen Investments completed the strategic combination between Nuveen Asset Management, the largest investment affiliate of Nuveen Investments, and FAF Advisors. As part of this transaction, U.S. Bancorp — the parent of FAF Advisors — received cash consideration and a 9.5% stake in Nuveen Investments in exchange for the long-term investment business of FAF Advisors, including investment-management responsibilities for the non-money market mutual funds of the First American Funds family.
The approximately $27 billion of mutual fund and institutional assets managed by FAF Advisors, along with the investment professionals managing these assets and other key personnel, have become part of Nuveen Asset Management, LLC. With these additions to Nuveen Asset Management, LLC, this affiliate now manages more than $100 billion of assets across a broad range of strategies from municipal and taxable fixed income to traditional and specialized equity investments.
This combination does not affect the investment objectives or strategies of the Funds in this report. Over time, Nuveen Investments expects that the combination will provide even more ways to meet the needs of investors who work with financial advisors and consultants by enhancing the multi-boutique model of Nuveen Investments, which also includes highly respected investment teams at HydePark, NWQ Investment Management, Santa Barbara Asset Management, Symphony Asset Management, Tradewinds Global Investors and Winslow Capital. Nuveen Investments managed approximately $210 billion of assets as of June 30, 2011.
| Must be preceded by or accompanied by a prospectus. | NOT FDIC INSURED | MAY LOSE VALUE | NO BANK GUARANTEE |
| 4 | ||||
| 5 | ||||
| 19 | ||||
| 32 | ||||
| 35 | ||||
| 37 | ||||
| 38 | ||||
| 67 | ||||
| 68 | ||||
| 70 | ||||
| 74 | ||||
| 86 | ||||
| 102 | ||||
| 110 | ||||
| 111 | ||||
Letter to Shareholders

Dear Shareholders,
The global economy continues to be weighed down by an unusual combination of pressures facing the larger developed economies. Japanese leaders continue to work through the economic aftereffects of the March 2011 earthquake and tsunami. Political leaders in Europe and the U.S. have resolved some of the near term fiscal problems, but the financial markets are not convinced that these leaders are able to address more complex longer term fiscal issues. Despite improved earnings and capital increases, the largest banks in these countries continue to be vulnerable to deteriorating mortgage portfolios and sovereign credit exposure, adding another source of uncertainty to the global financial system.
In the U.S., recent economic statistics indicate that the economic recovery may be losing momentum. Consumption, which represents about 70% of the gross domestic product, faces an array of challenges from seemingly intractable declines in housing values, increased energy costs and limited growth in the job market. The failure of Congress and the administration to agree on the debt ceiling increase on a timely basis and the deep divisions between the political parties over fashioning a balanced program to address growing fiscal imbalances that led to the recent S&P ratings downgrade add considerable uncertainty to the domestic economic picture.
On a more positive note, corporate earnings continue to hold up well and the municipal bond market is recovering from recent weakness as states and municipalities implement various programs to reduce their budgetary deficits. In addition, the Federal Reserve System has made it clear that it stands ready to take additional steps should the economic recovery falter. However, there are concerns that the Fed is approaching the limits of its resources to intervene in the economy.
These perplexing times highlight the importance of professional investment management. Your Nuveen investment team is working hard to develop an appropriate response to increased risk, and they continue to seek out opportunities created by stressful markets using proven investment disciplines designed to help your Fund achieve its investment objectives. On your behalf, we monitor their activities to assure that they maintain their investment disciplines.
As always, I encourage you to contact your financial consultant if you have any questions about your investment in a Nuveen Fund. On behalf of the other members of your Fund Board, we look forward to continuing to earn your trust in the months and years ahead.
Sincerely,

Robert P. Bremner
Chairman of the Board
August 23, 2011
| 4 | Nuveen Investments |
Certain statements in this report are forward-looking statements. Discussions of specific investments are for illustration only and are not intended as recommendations of individual investments. The forward-looking statements and other views expressed herein are those of the portfolio manager as of the date of this report. Actual future results or occurrences may differ significantly from those anticipated in any forward-looking statements and the views expressed herein are subject to change at any time, due to numerous market and other factors. The Funds disclaim any obligation to update publicly or revise any forward-looking statements or views expressed herein.
Ratings shown are the highest rating given by one of the following national rating agencies: S&P, Moody’s or Fitch. Credit ratings are subject to change. AAA, AA, A, and BBB are investment grade ratings; BB, B, CCC/CC/C and D are below-investment grade ratings. Bonds backed by U.S. Government or agency securities are given an implied rating equal to the rating of such securities. Holdings designated NR are not rated by a national rating agency.
The Nuveen Multi-Manager Large-Cap Value Fund is co-managed by Institutional Capital LLC (ICAP), Nuveen HydePark Group (HydePark), LLC, and Symphony Asset Management LLC (Symphony). HydePark and Symphony are affiliates of Nuveen Investments. Jerrold Sensor, CFA, and Thomas Wenzel, CFA, oversee the portion of the Fund’s assets managed by ICAP, while Walter French, Keith Hembre, CFA, and James Colon, CFA, perform a similar function at HydePark. Gunther Stein and Ron Sakamoto oversee the portion of the Fund’s assets managed by Symphony. All these individuals have more than 15 years of investment industry experience.
The Nuveen NWQ Multi-Cap Value Fund, Nuveen NWQ Large-Cap Value Fund, Nuveen NWQ Small/Mid-Cap Value Fund and Nuveen NWQ Small-Cap Value Fund feature equity management by NWQ Investment Management Company, LLC (NWQ), an affiliate of Nuveen Investments. Jon Bosse is the Chief Investment Officer of NWQ and manages the Multi-Cap Value and Large-Cap Value Funds. Phyllis Thomas manages the Nuveen Small/Mid-Cap Value and Small-Cap Value Funds. Both Jon and Phyllis have more than 20 years of investment industry experience.
The Nuveen Tradewinds Value Opportunities Fund features portfolio management by Tradewinds Global Investors, LLC (Tradewinds), an affiliate of Nuveen Investments. Dave Iben, Chief Investment Officer of Tradewinds, is the portfolio manager for the Fund. Dave has more than 25 years of investment industry experience.
In the following discussion, representatives from each management team review general market conditions, their investment strategies and the performance of the Funds for the twelve-month period ended June 30, 2011.
What were the general market conditions and trends over the course of the period?
Economic growth was quite uneven over the twelve-month reporting period. The second half of 2010 began with widespread concerns about financial contagion from several European countries and very slow growth, raising the probability of a double-dip recession in the United States. These fears seemed to be quelled in late 2010 and early 2011 as another round of quantitative easing was introduced by the Federal Reserve and consumer spending rebounded sharply. However, this relief was relatively short lived as renewed weakness in housing and higher food and energy prices put a damper on consumption at about the same time that supply chain disruptions from the Japanese tsunami and earthquake were distorting growth and suppressing job creation in many areas in the U.S. and around the world.
| Nuveen Investments | 5 |
Throughout the period, the Fed continued to hold the benchmark fed funds rate in a target range of zero to 0.25% since cutting it to this record low level in December 2008. At its June 2011 meeting, the central bank downgraded growth estimates for the year while reaffirming that it anticipated keeping the fed funds rate at “exceptionally low levels” for an “extended period.”
From a macro perspective, we ended the fiscal period facing many of the same uncertainties that we did at this same time last year. The Greek bailout had yet to be finalized and fiscal concerns had spread to other European countries such as Ireland, Portugal, Italy and Spain. At the same time, fears about slowing U.S. economic growth bubbled to the surface again, causing consumer spending to pull back. The employment situation seemed to plateau, with the national jobless rate registering 9.2% in June 2011, the fourth monthly increase in a row and just slightly lower than one year earlier. Also, the overall housing market continued to show weakness, weighed down by a backlog of distressed properties on the market and falling prices. For the twelve months ended May 2011 (the most recent data available at the time this report was prepared), property values in the Standard & Poor’s (S&P)/Case-Shiller index of 20 major metropolitan areas had fallen 4.5% from one year earlier. U.S. gross domestic product (GDP), a broad measure of the nation’s economic health, was revised downward to an anemic 0.4% annual growth rate for the first quarter of 2011 and estimated to be 1.3% for the second quarter, according to the Commerce Department.
A critical issue is the capability of the U.S. equity markets to withstand stress in the event of continued weakness in the domestic or foreign economies. That fear certainly was a significant cause of the depressed valuations in the finance sector. We believe higher equity capital ratios and loss reserves in the sector will help mitigate the fear and pressure that “broke” the sector during the market decline of calendar year 2008 (through early 2009). Merger and acquisition activity, including private equity and leverage buyout activity, has remained robust. Balance sheets outside of the finance sector are strong, and many companies are returning more capital to shareholders either through dividends or share repurchases. We expect volatility to continue, but believe the significant rotation away from the finance and cyclical sectors have created some attractive investment opportunities.
From a global market perspective, the last two months of the period saw global equities markets fall into a downward trend. Some of this decline was a result of investors attempting to sort out appropriate price levels for Japanese equities, as the impact of March’s tragic earthquake and tsunami continued to be felt. Sustained Middle Eastern/North African turmoil added to market volatility, with political upheavals in that region making conditions opaque and challenging for investors to confidently assess. U.S. equities also contributed to the global market downturn, with this country’s doggedly high unemployment, still-declining house prices and inflation-battered consumer wallets combining to cause fears that a return to recession may be imminent. The specter of a possible sovereign default by Greece haunted European stocks, as a roiling stream of news regarding austerity plans, bailout funds and violent protests made it difficult to surmise what the future may hold for the Mediterranean state. The aggregate effect of all these headwinds has caused some previous market optimism to be replaced with uncertainty.
| 6 | Nuveen Investments |
How did the Funds perform during the twelve-month period ended June 30, 2011?
The tables in the Fund Performance and Expense Ratios section of this report provide Class A Share total returns for the Funds for the one-year, five-year, ten-year and since inception periods ended June 30, 2011. Each Funds Class A Share total returns are compared with the performance of their corresponding market indexes and peer group averages. A more detailed account of each Fund’s performance is provided later in this report.
What strategies were used to manage the Funds during the reporting period? How did these strategies influence performance?
Nuveen Multi-Manager Large-Cap Value Fund
The Fund’s Class A Shares at net asset value (NAV) slightly underperformed the comparative Lipper category average, S&P 500 Index and the Russell 1000 Value Index over the twelve-months ending June 30, 2011.
The Fund uses three separate sub-advisers to seek large capitalization value stocks with the potential for long-term capital appreciation. ICAP uses a value-oriented investment strategy that attempts to identify stocks offering the best relative value and stable to rising earnings from a universe of large and mid-sized companies. It then selects a portion of those stocks that are identified to have a catalyst for change, and monitors these holdings closely to determine if circumstances change. HydePark’s investment process does not endeavor to pick individual stocks. Rather, the process is implemented through proprietary software that takes a given benchmark, along with specified tracking risk, and produces a portfolio that seeks to maximize value-added performance within the defined risk parameters relative to the benchmark. Symphony seeks to deliver consistent returns though an investment process that combines quantitative screens and fundamental research. The portfolio construction process utilizes a proprietary optimizer designed to potentially generate an optimal risk/reward balance versus the stated benchmark.
For the ICAP portion of the Fund, stock selection in the financials and capital spending sectors lifted relative performance, while our choices in the basic industries and retail sectors did not work as expected. On a sector-allocation basis, the portfolio was helped the most by overweighting the strong-performing energy sector and underweighting the financials group, which did not fare as well. Conversely, underweighting transportation stocks while overweighting the technology sector detracted from relative performance.
Throughout the period, we stuck to our consistent bottom-up stock-selection investment process. That is, we selected investments one-by-one, based on our assessment of their valuations and prospects for price improvement compared with other stocks. We bought or added to positions that appeared to provide good value and offered a potential catalyst for a rising stock price, while we continued to sell or reduce exposure to stocks we believed offered limited upside potential.
We made a number of new purchases in the portfolio when we found what we believed were compelling opportunities or as market conditions changed. Our allocation to the health care sector, for example, increased when we bought new positions in such stocks
| Nuveen Investments | 7 |
as Johnson & Johnson, a maker of pharmaceuticals and other health care products, and health benefits company WellPoint. We also added to our existing holdings in drug maker Pfizer. Meanwhile, in the financials sector, we established positions in investment bank Goldman Sachs, asset manager BlackRock, investment services firm Charles Schwab and insurance company MetLife. We also added to our position in software giant Microsoft.
We eliminated several technology holdings — including computer and peripherals maker Hewlett Packard and network communications company Cisco Systems — whose appreciation prospects we believed had diminished. In the capital spending sector, we sold Cummins, which makes power-generation equipment, and Caterpillar, a manufacturer of construction and mining equipment.
On an individual basis, the top contributors to performance relative to the Russell 1000 Value Index included cable network operator Viacom, mobile-communications technology company Qualcomm and integrated oil and gas producer Marathon Oil.
Viacom benefited from higher affiliate fees from cable operators, a better advertising environment and strong viewer ratings — all of which boosted profits. Qualcomm’s shares rose after the company’s financial outlook improved with increased adoption of smart phones, many of which use Qualcomm’s proprietary technology. Marathon Oil outperformed, as plans to spin-off its refining business into a separate company met with investor approval. Viacom and Marathon remained in the Fund as of the end of the period, while we sold the Fund’s stake in Qualcomm in favor of other stocks that we believed offered greater potential upside.
In contrast, several holdings detracted from relative performance, including gold miner Newmont Mining, Cisco Systems and Goldman Sachs. Newmont lagged along with the expectations for further appreciation in gold prices, while Cisco’s sales and growth outlook disappointed investors. Goldman Sachs’ shares did relatively poorly when the firm’s financial results fell short of analysts’ expectations. We sold the portfolio’s stake in Newmont Mining and Cisco during the period. However, we still owned Goldman Sachs shares as of period end because we still believed they were attractive.
In the portion of the portfolio managed by Hyde Park, the Fund, on average, was overweighted in consumer discretionary, energy, materials, telecom services, and utilities during the period. On average, the Fund was underweighted staples, health care, financials, and information technology. The largest single sector overweight was in consumer discretionary services, where the Fund was, on average, 1.9% overweight versus the index. This position contributed positively to the Fund’s relative performance versus the index. The largest single underweight was, on average, in health care, where the Fund was 2.7% underweight versus the index. Overall, sector weightings were a negative to the Fund’s relative performance versus the index.
Performance attributable to the individual stock holdings within each sector was a negative for the Fund during the reporting period, with the stock picks within the Energy sector having the largest negative impact. The holdings within the information technology and staples sectors were also a negative for the Fund. Holdings within the consumer discretionary and health care sectors resulted in the largest positive relative performance for the Fund.
| 8 | Nuveen Investments |
For the portion of the Fund managed by Symphony, we remained invested in companies with relatively strong fundamentals. Top performers for the period included Watson Pharmaceuticals, a generic drug manufacturer. The company is seeing steady growth and margin improvements as the generic drug pipeline remains attractive and Watson’s push into overseas markets is seeing positive results. Also positively contributing was Humana, a U.S. focused managed health care company. During the period, the company raised its full year outlook, noting a better than expected medical loss ratio and rising revenues due in part to the Medicare Advantage membership program.
Tesero also contributed positively to the Fund’s overall return. The company is engaged in the refining and retail marketing of petroleum products. They operate seven refineries, including the largest refineries in Hawaii and Utah and the second-largest in northern California. Rising spreads, a restructuring plan that was received favorably, and an attractive valuation relative to its peers led Tesoro shares to perform strongly during the quarter.
Several positions detracted from performance, including Freeport McMoran, a copper, gold and molybdenum mining company. After a strong run, shares began to underperform the broader market. Chinese demand for copper and other commodities has been a key driver of metals prices in recent years. As China took steps to temper its high economic growth by raising interest rates, investors sold Freeport’s shares.
Arch Coal, a coal mining corporation, underperformed on the back of a tepid response to the company’s intention to acquire International Coal Group. Investors turned to other opportunities as concerns regarding the implied purchase price, greater financial leverage, and operating/integration risks pressured the shares.
Nuveen NWQ Multi-Cap Value Fund
The Fund’s Class A Shares at net asset value (NAV) slightly outperformed the Russell 3000 Value Index, and slightly underperformed the S&P 500 Index and its Lipper category average for the twelve-month period ended June 30, 2011.
The Fund seeks long-term capital appreciation by investing in equity securities of companies with large, medium and small market capitalizations that are selected on an opportunistic basis. Generally, the Fund’s managers look for undervalued companies where catalysts exist that may help unlock value or improve profitability. Such catalysts can be new management, improving fundamentals, renewed management focus, industry consolidation or company restructuring.
Several portfolio positions appreciated sharply during the year given their initial depressed valuations, individual catalysts, and a perception of stabilization in the economy. In the energy sector, Apache Corp. outperformed as the company was able to augment its growth profile by purchasing three business units from BP Plc. This acquisition provides Apache with an opportunity to exploit some underdeveloped and neglected assets. Noble Energy benefited on optimism for its access to the oil-prone Niobrara shale (principally Colorado), and enthusiasm for its Leviathan project, which is offshore from Israel and considered by some to be one of the largest energy discoveries ever.
| Nuveen Investments | 9 |
Hess Corp. rose given a combination of valuation support, commodity leverage, and 2011 exploration catalysts, including potentially high-impact projects in Brazil, Egypt, Ghana, and the Red Sea. In the advertising space, Interpublic Group of Companies continued its fundamental improvement, driven by better execution, increased cash flow generation, and its lower risk profile since our original investment in February 2008. The company took another positive step in its turnaround during the second quarter of 2011 as Moody’s upgraded its unsecured debt and revolving credit facility two notches to investment grade. This should result in the removal of covenants on cash flow and could lead to the company ramping up its share buyback and/or increasing its dividend payout.
Pfizer Inc. outperformed as the company has been active in addressing ongoing and future challenges by shaking up its management team, stabilizing its core earnings, and beginning the process of divesting several divisions. Pfizer has several near-term pipeline opportunities, including its oral rheumatoid arthritis drug, tofacitinib, that posted positive results during a second Phase 3 study. Trinity Industries Inc. rose sharply as the company remains well-positioned to benefit from the ongoing cyclical recovery in railcar and barge manufacturing. Fundamentals continue to improve as it progresses through the upcycle, including higher margins and an increased order backlog.
While the majority of the Fund’s holdings posted positive returns for the period, Genworth Financial, General Motors, and gold mining stocks were among our investments that declined. Genworth Financial’s U.S. mortgage insurance business struggled given the lingering housing market problems. Despite stability in its life and international mortgage divisions, weakness in its U.S. mortgage insurance operations continue to loom over the company’s efforts to recover from the 2008 financial crisis. General Motors declined since our initial purchase in November 2010 on concerns about potential pricing degradation and product mix given high gasoline prices and production cutbacks due to supply shortages from Japan. The potential overhang of the U.S. government’s ownership stake also weighed on the stock. Our investment thesis for the stock remains intact as the company’s fundamentals have greatly improved since emerging from bankruptcy last year, and we believe the issues and concerns are short-term in nature. Gold mining stocks Anglogold Ashanti, Barrick Gold, and Northgate Minerals underperformed given concerns of continued cost inflation, a more punitive tax environment, and questionable capital allocation decisions (particularly at Barrick Gold). Despite these issues, we feel our gold equities continued to offer an attractive investment opportunity.
We made a number of new investments during the year. As previously noted, in mid-November we invested in General Motors when the U.S. government reduced its ownership stake. The company has massively improved its balance sheet and financial flexibility, and has considerable margin and earnings leverage. We believe there is significant hidden value that has not been fully reflected in its stock price. Northgate Minerals Corp. is an intermediate gold producer that operates mines in Australia and Canada. We believe the market is significantly undervaluing Northgate’s Young-Davidson project, which is fully financed and permitted in a politically safe jurisdiction (Ontario, Canada). When construction is completed in 2012, Young-Davidson could be one of the lowest cost mines in North America. Teva Pharmaceutical Industries Ltd. is a global leader in
| 10 | Nuveen Investments |
the development and marketing of generic pharmaceuticals and is well-positioned to benefit from the upcoming wave of major branded drugs with expiring patent protection. Recent execution issues, which have included FDA quality control violations at two plants, have sent Teva shares down to single-digit earnings multiples and near double-digit free cash flow yields. We also added a position in Salix Pharmaceuticals, Ltd. Salix focuses on the development of drugs for gastrointestinal diseases. Its main product, Xifaxan, is approved by the FDA for the treatment of travelers’ disease and hepatic encephalopathy (toxins in the bloodstream). Salix is seeking to expand the label of Xifaxan for the treatment of irritable bowel syndrome (IBS). Approval by the FDA could result in a significant earnings opportunity. PMC-Sierra, Inc. supplies semiconductor chips for the data storage, enterprise, and network infrastructure markets. The company is well-positioned to take advantage as telecom carriers and companies increase their spending to address the rising need for higher data bandwidth. PMC generates healthy free cash flow, solid operating margins, and has net cash on its balance sheet. MKS Instruments Inc. is a leading supplier of critical subcomponents and systems used by semiconductor equipment manufacturers. Over 30% of the company’s revenues come from non-semiconductor clients, including solar panels, flat panel displays, and medical devices. These non-semiconductor clients provide MKS with additional cash flows when the semiconductor demand cycle is at its trough.
During the period we eliminated several positions, including CBS Corp., based on valuation as the share price discounted significantly improved fundamentals and broadcast ratings. We also had concerns that its Showtime network would be adversely impacted by the emergence of other providers given that the network does not have as strong a lineup of original content offerings as its competitors. Aetna Inc. was sold as we no longer felt comfortable with the uncertainty and lack of visibility surrounding the profitability of its core business given the pending implementation of health care reform. We eliminated Lockheed Martin as concerns of additional cuts to the defense budget made other investment opportunities more compelling, and Valeant Pharmaceutical International was sold following significant appreciation as investors become more comfortable with the company’s business model and the sustainability of its growth prospects. Packaging Corp. of America, Timken Co., Tower Group Inc., and Warren Resources Inc. were eliminated as we felt each company’s share price had reached fair valuation, and the risk/reward for continuing to own the stocks was no longer attractive.
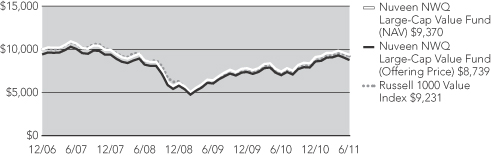
Nuveen NWQ Large-Cap Value Fund
The Fund’s Class A Shares at net asset value (NAV) underperformed the comparative Lipper category average and the Russell 1000 Value Index for the twelve-month period ended June 30, 2011.
The Fund seeks long-term capital appreciation by investing in equity securities of companies principally with market capitalizations above 5 billion that are selected on an opportunistic basis. Generally, the Fund’s managers look for undervalued companies where catalysts exist that may help unlock value or improve profitability. Such catalysts can be new management, improving fundamentals, renewed management focus, industry consolidation or company restructuring.
| Nuveen Investments | 11 |
During this period, the Fund’s energy and petroleum investments were among the top positive contributors to performance. Halliburton Co. benefited from tightness in the pressure pumping market and an upswing in international drilling activity. Noble Energy outperformed primarily due to optimism for the company’s access to its oil-prone Niobrara acreage (principally Colorado), and enthusiasm for its Leviathan project, which is offshore from Israel and according to some one of the largest energy discoveries ever. Apache Corp. augmented its growth profile by purchasing three business units from BP Plc. This acquisition provides Apache with an opportunity to exploit some underdeveloped and neglected assets. Occidental Petroleum announced several transactions during the year that would be accretive to earnings, cash flow, and return on equity, including selling its problematic asset in Argentina and redeploying the proceeds into higher growth opportunities in the U.S. (Bakken Shale and Permian Basin).
Pfizer Inc. outperformed as the company has been active in addressing ongoing and future challenges by shaking up its management team, stabilizing its core earnings, and beginning the process of divesting several divisions. Pfizer has several near-term pipeline opportunities, including its oral rheumatoid arthritis drug, tofacitinib, that posted positive results during a second Phase 3 study. Viacom Inc. appreciated as advertising trends have steadily recovered alongside the global economy. Viacom has tremendous business momentum as its cable networks continue to post solid ratings, particularly at MTV. Strong revenue growth from a robust advertising environment and steadily growing affiliate fees combined with cost controls are driving margin expansion. The company also reactivated its share repurchase program.
Several positions detracted from performance, including Genworth Financial. Its U.S. mortgage insurance business struggled given the lingering housing market problems. Despite stability in its life and international mortgage divisions, weakness in its U.S. mortgage insurance operations continue to loom over the company’s efforts to recover from the 2008 financial crisis. General Motors has declined since our initial purchase in November 2010 on concerns about potential pricing degradation and product mix given high gasoline prices and production cutbacks due to supply shortages from Japan. The potential overhang of the U.S. government’s ownership stake also weighed on the stock. Our investment thesis for the stock remains intact as the company’s fundamentals have greatly improved since emerging from bankruptcy last year, and we believe the most pressing issues and concerns are short-term in nature. Gold mining stocks Anglogold Ashanti and Barrick Gold underperformed given concerns of continued cost inflation, a more punitive tax environment, and questionable capital allocation decision (particularly at Barrick Gold). Despite these issues, we feel our gold equities continued to offer an attractive investment opportunity.
We added several new holdings to the portfolio during the year. As noted, in mid-November we invested in General Motors when the U.S. government reduced its ownership stake. The company has massively improved its balance sheet and financial flexibility, and has considerable margin and earnings leverage. We believe there is significant hidden value that has not been fully reflected in its stock price. We purchased Time Warner when the shares were being pressured by concerns of increased subscriber losses at its HBO networks as viewers move to other providers such as Netflix and Google
| 12 | Nuveen Investments |
TV. We believe the threat of these other providers to Time Warner is exaggerated given the strength of HBO’s original content offerings, which should continue to attract subscribers to the channel. Time Warner offers attractive catalysts for upside potential given the high quality assets, balance sheet strength, high single digit free cash flow yield, and a strong management team (including its well respected CEO, Jeff Bewkes).
We also purchased Interpublic Group of Companies, Inc. (IPG), which provides advertising and marketing services worldwide. The company had been plagued by accounting irregularities, as well as poor cost controls, following a series of acquisitions made over the years. A new management team has fixed the accounting issues and implemented controls and other important business systems for managing and monitoring costs. We initiated a position as the company has continued its fundamental improvement driven by better execution and increased cash flow generation. IPG took another positive step in its turnaround during the second quarter as Moody’s upgraded its unsecured debt and revolving credit facility two notches to investment grade. This should result in removing the covenants on cash flow and could lead to the company ramping up its share buyback and/or increasing its dividend payout.
We invested in Goldman Sachs as we did not believe that new financial regulations would meaningfully affect the company’s future earnings power or its ability to grow its book value. Moreover, the company had settled a lawsuit with the Securities and Exchange Commission regarding the marketing of CDO securities, significantly reducing the company’s litigation exposure, and making the risk/reward profile for owning the stock more attractive, in our opinion. Cisco Systems was purchased as we felt the share price fully discounted lower future operating margins and gave little value to the company’s core franchise or management’s ability to successfully restructure its businesses. We feel that shares of Cisco offered potential upside through stock repurchases, increased dividends, and successful reorganization and product repositioning efforts. We also bought Teva Pharmaceutical Industries Ltd., a global leader in the development and marketing of generic pharmaceuticals. Teva is well-positioned to benefit from the upcoming wave of major branded drugs coming off patent. Recent execution issues, which have included FDA quality control violations at two plants, have sent Teva shares down to single-digit earnings multiples and near double-digit free cash flow yields.
During the period we eliminated CBS Corp. based on valuation as the share price discounted significantly improved fundamentals and broadcast ratings. We also had concerns that its Showtime network would be adversely impacted by the emergence of other providers given that the network does not have as strong a lineup of original content offerings as its competitors. Aetna Inc. was sold as we no longer felt comfortable with the uncertainty and lack of visibility surrounding the profitability of its core business given the pending implementation of health care reform. We eliminated Kroger Co. on concerns regarding the ability of the supermarket group to pass through upcoming food price inflation as consumers simultaneously digest higher gas prices and a sluggish employment outlook. Kimberly-Clark Corp. was sold based on valuation and concerns stemming from the announced restructuring of its pulp and paper operations. We questioned the high cost of the plan, particularly when compared to the limited expected return the restructuring would generate. Following a successful cost cutting initiative, Verizon
| Nuveen Investments | 13 |
Communications no longer possessed an attractive catalyst, which made the stock less compelling compared to other investment opportunities. The Mosaic Co. and Nielson Holdings N.V. also were eliminated as we felt each company’s share price had reached fair valuation, and the risk/reward for continuing to own the stocks was no longer attractive.
Nuveen NWQ Small/Mid-Cap Value Fund
The Fund’s Class A Shares at net asset value (NAV) outperformed the Russell 2500 Index and the Lipper category average for the twelve-month period ended June 30, 2011.
Over this period, the Fund continued to follow its disciplined investment approach, which seeks long-term capital appreciation by investing in equity securities of companies with small- to mid-market capitalizations selected using an analyst-driven, value-oriented process. The portfolio manager looks for undervalued companies where catalysts exist to unlock value or improve profitability. Such catalysts can be new management, improving fundamentals, renewed management focus, industry consolidation or company restructuring.
For the twelve-month reporting period, results were driven by strength in our health care, consumer discretionary and technology holdings. These gains were partially offset by individual investments in the materials and processing sector.
For the reporting period, Valeant Pharmaceuticals International was the top performer. The company continued its strong appreciation as investors become more comfortable with the company’s business model and the sustainability of its growth prospects, particularly its Latin America operations. The company issued new senior debt during the period to shore up its balance sheet, redeem some convertible debt, and repurchase $275 million of common equity. Late in the first quarter 2011, Valeant also made an unsolicited offer to acquire Cephalon Inc., which received a positive response from investors given the potential synergies, earnings accretion, and tax benefits the potential merger would bring. We eliminated the position toward the end of the first quarter of 2011 as the company’s market cap had risen to double where we expected Russell would set the high end of its 2500 Index benchmark in its June 2011 index rebalancing.
Elizabeth Arden, one of our consumer discretionary holdings, also contributed to the Fund’s outperformance. The company’s multi-year European fragrance growth initiative is progressing steadily and its multi-year cost saving initiatives are driving significant margin improvements. We believe the company will continue to take market share in North America and Europe and continue to expand its margins, driving further stock price appreciation.
Our materials and processing holding Globe Specialty Metals appreciated as silicon prices approached multi-year highs. The prospect for legacy contract prices catching up to current merchant (spot) prices are driving earnings estimates for 2011 and 2012 higher. During the period, the company announced that it had entered into agreements to build a silicon metal plant in Iceland. This new, world class plant will be one of the lowest cost silicon plants in the Western world as a result of very low cost hydro electric power contracts and other local incentives. The company has attained almost all the necessary operating and environmental permits and construction is expected to begin in the second half of 2011.
| 14 | Nuveen Investments |
Commodities sold-off late in the period over concerns about slowing global growth and increased populist government policies worldwide, which could result in increased taxes and royalties on mining companies. This negatively impacted the performance of two of our materials and processing holdings, Northgate Minerals Corporation and Thompson Creek Metals Company, Inc. We believe the market is significantly undervaluing Northgate’s Young-Davidson mine project, which is fully financed and permitted in a politically safe jurisdiction (Ontario, Canada). When construction is completed in 2012, Young-Davidson will be one of the lowest cost mines in North America, producing an estimated 200,000 ounces of gold a year at $310 per ounce cash cost with an initial mine life of 15 years. We believe there is also the potential for exploration upside at Young-Davidson. Thompson Creek’s purchase of Terrane Metals last fall has resulted in a more diversified metals business with reserves in molybdenum, copper and gold. As of June 30, 2011, the company’s stock was trading at a large discount to our estimate of net asset value.
As a result of the mid cycle economic slowdown and the perception that housing prices could be declining again, real estate operator Forestar Group Inc. also negatively impacted performance. Most of Forestar’s real estate assets are in Texas, where some real estate markets have stabilized. With a well respected management team and conservative balance sheet, we believe the stock is trading well below asset value, particularly when one considers their significant mineral and water rights. We added to this position during the period.
Nuveen NWQ Small-Cap Value Fund
The Fund’s Class A Shares at net asset value (NAV) outperformed the Russell 2000 Value Index and Lipper category average for the twelve-month period ended June 30, 2011.
Over the reporting period, the Fund continued to follow its disciplined investment approach. The Fund seeks long-term capital appreciation by investing in equity securities of companies with small market capitalizations selected using an analyst-driven, value-oriented process. Portfolio managers look for undervalued companies where catalysts exist to unlock value or improve profitability. Such catalysts can be new management, improving fundamentals, renewed management focus, industry consolidation or company restructuring.
For the twelve-month period, the Fund benefited from its investments in technology, which were among its top contributors, led by Actel. After a strong third quarter as one the portfolio’s top performers, Actel appreciated significantly in the fourth quarter following the announcement that the company had entered into an agreement to be acquired by Microsemi. We eliminated the position just prior to the close of the deal in early November 2010.
Our consumer discretionary holdings also benefited performance, including one of the top performers, Elizabeth Arden. The company’s multi-year European fragrance growth initiative is progressing steadily and its multi-year cost saving initiatives are driving significant margin improvements. We believe the company will continue to take market share in North America and Europe and continue to expand its margins, driving further stock price appreciation.
| Nuveen Investments | 15 |
Carrizo Oil & Gas was also a top contributor for the reporting period. The company executed well as it shifted capital away from natural gas to oil and liquid developments in the Eagle Ford and the Niobrara shale formations. The company acquired Eagle Ford acreage at a very good cost while larger companies continued to pay a premium to get a decent position. The addition of a third rig in July 2011 could further accelerate the net present value of the Eagle Ford acreage.
We did have several detractors from performance, including Skilled Healthcare, which is a holding company with subsidiaries that operate skilled nursing facilities, assisted living facilities, a rehabilitation therapy business, and a hospice business. The company’s nursing home and assisted living facilities are comprised of 10,500 licensed beds and are generally clustered in large urban or suburban markets. We eliminated our position amidst uncertainty over the company’s financial ability to post bond to appeal an unexpectedly significant jury verdict in a class action suit.
Also negatively impacting performance was Orion Marine Group, which is a leading heavy civil marine contractor providing a broad range of turn-key solution marine construction and specialty services on, over, and under the water along the Gulf Coast, the Atlantic seaboard, West Coast, Canada, and the Caribbean Basin. After some contract-related (as opposed to systemic) issues resulted in the stock declining to attractive levels, we initiated our position. We believe this broadly-diversified company has strong growth prospects and that its dredging division has sustainable attractive margins.
The gains in consumer discretionary were partially offset by our investment in Hooker Furniture. Hooker’s stock underperformed as rising oil prices have pressured shipping expenses for the company’s Asia-sourced wood products division. Additionally, the company will be facing higher labor costs in its Chinese manufacturing facility. While cost pressures put a damper on near-term profits, we continue to believe that there will be a cyclical recovery in furniture demand, and Hooker appears well positioned to benefit from increasing margins, cash flow, and earnings going forward.
Nuveen Tradewinds Value Opportunities Fund
The Fund’s Class A Shares at net asset value (NAV) underperformed the Russell 3000 Value Index and Lipper category average for the twelve-month period ending June 30, 2011. It should be noted that the Fund has held, and is expected to continue to hold, securities that are not included in the comparative index shown in this report. Due to the difference between the securities held by the Fund and the composition of the index, we would expect there will be some differences over time between the Fund and the index in performance, composition, or risk profile.
The Fund seeks long-term capital appreciation by investing in equity securities of companies with varying market capitalizations selected using an eclectic, value-oriented process. Tradewinds seeks to provide superior risk-adjusted returns through an analyst-driven, value-oriented approach. Portfolio managers look for undervalued companies where catalysts exist to unlock value or improve profitability. Such catalysts can be new management, improving fundamentals, renewed management focus, industry consolidation or company restructuring.
| 16 | Nuveen Investments |
Much of the Fund’s relative underperformance versus the Russell 3000 Value Index for the period was due to its materials & processing and utilities sector holdings. The Fund’s energy sector holdings, along with its relative underweight in financials — an underperforming sector within the benchmark — enhanced the Fund’s performance during the period. The Fund’s cash balance, which is a residual of our investment process, also detracted from relative performance.
The period’s top absolute contributors to positive performance were from the energy, materials & processing and health care sectors. Petroleum refiner and marketer Tesoro Corporation provided the best return. Rising oil prices have caused a reevaluation of the worth inherent in companies, which drill, produce, refine and distribute this important commodity. Accordingly, the Fund trimmed and sold oil companies on significant price appreciation.
Materials & processing holding Cameco Corporation, the world’s largest uranium producer, was the second best contributor to performance this period, in spite of the ongoing troubling news regarding the stricken Fukushima Daiichi nuclear plant in Japan. Nuclear power still meets important global energy requirements, and we have taken advantage of recent price correction to add to the Fund’s holdings of high quality nuclear energy-related companies.
Health care sector holding Aetna Incorporated was another top performer in absolute terms due to, in our view, more benign prospects for health care reform, and after beating first quarter 2011 earnings estimates. Aetna provides managed health care benefits through group, individual, Medicare and Medicaid programs.
The period’s top absolute performance detractors were from the materials & processing, technology and utilities sectors. Newmont Mining Corporation is one of the world’s largest producers of gold, with operations in the U.S., Australia, Canada, New Zealand, Ghana, Indonesia, Mexico and Peru. The performance of precious metals producers were affected by declines in precious metals prices in January 2011, with the companies participating on the downside, but not participating on the upside as precious metals prices rebounded.
Near the end of the period, tax losses were taken in the Fund in order to reduce any capital gain distribution. Market Vectors® Gold Miners ETF (GDX) was one position purchased as a replacement, and despite its temporary ownership, GDX was among the largest detractors from Fund’s performance for the period. The position was sold at period end and additional losses were harvested.
Technology sector position Cisco Systems Incorporated was another large detractor from performance. The company designs, manufactures and sells Internet Protocol (IP)-based networking and other products related to the communications and information technology industry.
Electricite de France S.A. (EDF) is a French integrated energy company, the leading electricity producer in Europe and the largest nuclear plant operator in the world. The Fund’s holding in EDF suffered, in our opinion, due to three reasons: (1) concerns about the French government setting low tariffs for wholesale and retail electricity; (2) fears of additional capital expenditure due to the Fukushima accident; and (3) EDF having to
| Nuveen Investments | 17 |
purchase peak power at much higher prices as a result of the unusually dry spring weather in France. We believe the stock is among the least expensive nuclear and hydro power producers in the world and took advantage of weakness to increase the position.
Tradewinds is carefully seeking holdings priced below our fundamental assessments. As of late, this search has often led us to stocks generally perceived as defensive companies we view as less exposed to the many downside risks we anticipate. We think there are currently many outstanding businesses with great prospects, so we’re ferreting out mispriced opportunities and buying on weakness.
Effective at the close of business on July 29, 2011, the Nuveen Tradewinds Value Opportunities Fund is closed to new investments, except for investments by the following categories of investors:
| • | Existing shareholders of record as of July 29, 2011; |
| • | Defined contribution retirement plans that purchase shares of the Fund prior to October 31, 2011; |
| • | Full-time and retired employees of Nuveen Investments and its affiliates as well as their immediate family members; |
| • | Officers, trustees, and former trustees of the Nuveen Funds; and |
| • | Benefit plans sponsored by Nuveen Investments or its affiliates. |
RISK CONSIDERATIONS
Mutual fund investing involves risk; principal loss is possible. Equity investments are subject to market risk. Investments in small- and mid-cap companies are subject to greater volatility. Foreign investments involve additional risks, including currency fluctuation, political and economic instability, lack of liquidity and differing legal and accounting standards. These risks are magnified in emerging markets. Investments in small- and mid-cap companies are subject to greater volatility.
| 18 | Nuveen Investments |
Fund Performance and Expense Ratios (Unaudited)
The Fund Performance and Expense Ratios for each Fund are shown on the following twelve pages.
Returns quoted represent past performance, which is no guarantee of future results. Current performance may be higher or lower than the performance shown. Investment returns and principal value will fluctuate so that when shares are redeemed, they may be worth more or less than their original cost. Returns without sales charges would be lower if the sales charge were included. Returns do not reflect the deduction of taxes that a shareholder would pay on Fund distributions or the redemption of Fund shares.
Returns may reflect a contractual agreement between certain Funds and the investment adviser to waive certain fees and expenses; see Notes to Financial Statements, Footnote 7 — Management Fees and Other Transactions with Affiliates for more information. In addition, returns may reflect a voluntary expense limitation by the Funds’ investment adviser that may be modified or discontinued at any time without notice. For the most recent month-end performance visit www.nuveen.com or call (800) 257-8787.
Returns reflect differences in sales charges and expenses, which are primarily differences in distribution and service fees. Fund returns assume reinvestment of dividends and capital gains.
Comparative index and benchmark return information is provided for the Funds’ Class A Shares at net asset value (NAV) only.
The expense ratios shown reflect the Funds’ total operating expenses (before fee waivers or expense reimbursements, if any) as shown in the Funds’ most recent prospectus. The expense ratios include management fees and other fees and expenses.
| Nuveen Investments | 19 |
Fund Performance and Expense Ratios (Unaudited) (continued)
Nuveen Multi-Manager Large-Cap Value Fund
Refer to the first page of this Fund Performance and Expense Ratios section for further explanation of the information included within this page.
Fund Performance
Average Annual Total Returns as of June 30, 2011
| Average Annual | ||||||||||||
| 1-Year | 5-Year | 10-Year | ||||||||||
Class A Shares at NAV | 27.15% | 2.48% | 3.28% | |||||||||
Class A Shares at maximum Offering Price | 19.86% | 1.28% | 2.67% | |||||||||
S&P 500 Index* | 30.69% | 2.94% | 2.72% | |||||||||
Russell 1000 Value Index* | 28.94% | 1.15% | 3.99% | |||||||||
Lipper Large-Cap Value Funds Category Average* | 28.33% | 1.08% | 3.10% | |||||||||
Class B Shares w/o CDSC | 26.23% | 1.71% | 2.66% | |||||||||
Class B Shares w/CDSC | 22.23% | 1.57% | 2.66% | |||||||||
Class C Shares | 26.21% | 1.72% | 2.51% | |||||||||
Class R3 Shares | 26.80% | 2.17% | 3.00% | |||||||||
Class I Shares | 27.46% | 2.74% | 3.54% | |||||||||
Class A, B, C and I Share returns are actual. The returns for Class R3 Shares are actual for the periods since class inception on 8/4/08; returns prior to class inception are Class I Share returns adjusted for differences in sales charges and expense, which are primarily differences in distribution and service fees.
Class A Shares have a maximum 5.75% sales charge (Offering Price). Class A Share purchases of $1 million or more are sold at net asset value without an up-front sales charge but may be subject to a contingent deferred sales charge (CDSC), also known as a back-end sales charge, if redeemed within twelve months of purchase. Class B Shares have a CDSC that begins at 5% for redemptions during the first year and declines periodically until after six years when the charge becomes 0%. Class B Shares automatically convert to Class A Shares eight years after purchase. Class C Shares have a 1% CDSC for redemptions within less than twelve months, which is not reflected in the one-year total return. Class R3 Shares have no sales charge and are available to only certain retirement plan clients of financial intermediaries. Class I Shares have no sales charge and may be purchased under limited circumstances or by specified classes of investors.
Expense Ratios
| Share Class | Gross Expense Ratios | Net Expense Ratios | ||||
Class A | 1.26% | 1.19% | ||||
Class B | 2.01% | 1.94% | ||||
Class C | 2.01% | 1.94% | ||||
Class R3 | 1.50% | 1.44% | ||||
Class I | 1.00% | 0.94% | ||||
The investment adviser has agreed to waive fees and reimburse expenses through October 31, 2011 so that total annual Fund operating expenses (excluding 12b-1 distribution and service fees, interest expenses, taxes, fees incurred in acquiring and disposing of portfolio securities and extraordinary expenses) do not exceed 0.95% of the average daily net assets of any class of Fund shares. The expense limitation expiring October 31, 2011, may be terminated or modified prior to that date only with the approval of the Board of Trustees of the Fund. The expense limitation in effect thereafter may be terminated or modified only with the approval of shareholders of the Fund.
| * | Refer to the Glossary of Terms Used in this Report for definitions. |
| 20 | Nuveen Investments |
Growth of an Assumed $10,000 Investment as of June 30, 2011

The graph does not reflect the deduction of taxes that a shareholder may pay on Fund distributions or the redemption of Fund shares.
| Nuveen Investments | 21 |
Fund Performance and Expense Ratios (Unaudited) (continued)
Nuveen NWQ Multi-Cap Value Fund
Refer to the first page of this Fund Performance and Expense Ratios section for further explanation of the information included within this page.
Fund Performance
Average Annual Total Returns as of June 30, 2011
| Average Annual | ||||||||||||
| 1-Year | 5-Year | 10-Year | ||||||||||
Class A Shares at NAV | 29.74% | -2.37% | 5.64% | |||||||||
Class A Shares at maximum Offering Price | 22.26% | -3.52% | 5.01% | |||||||||
S&P 500 Index* | 30.69% | 2.94% | 2.72% | |||||||||
Russell 3000 Value Index* | 29.13% | 1.23% | 4.25% | |||||||||
Lipper Multi-Cap Core Funds Category Average* | 30.90% | 2.97% | 3.79% | |||||||||
Class B Shares w/o CDSC | 28.71% | -3.10% | 5.00% | |||||||||
Class B Shares w/CDSC | 24.71% | -3.27% | 5.00% | |||||||||
Class C Shares | 28.71% | -3.10% | 4.86% | |||||||||
Class R3 Shares | 29.33% | -2.65% | 5.35% | |||||||||
Class I Shares | 30.05% | -2.12% | 5.92% | |||||||||
Class A, B, C and I Share returns are actual. The returns for Class R3 Shares are actual for the periods since class inception on 8/4/08; returns prior to class inception are Class I Share returns adjusted for differences in sales charges and expense, which are primarily differences in distribution and service fees.
Class A Shares have a maximum 5.75% sales charge (Offering Price). Class A Share purchases of $1 million or more are sold at net asset value without an up-front sales charge but may be subject to a contingent deferred sales charge (CDSC), also known as a back-end sales charge, if redeemed within twelve months of purchase. Class B Shares have a CDSC that begins at 5% for redemptions during the first year and declines periodically until after six years when the charge becomes 0%. Class B Shares automatically convert to Class A Shares eight years after purchase. Class C Shares have a 1% CDSC for redemptions within less than twelve months, which is not reflected in the one-year total return. Class R3 Shares have no sales charge and are available to only certain retirement plan clients of financial intermediaries. Class I Shares have no sales charge and may be purchased under limited circumstances or by specified classes of investors.
Expense Ratios
| Share Class | Expense Ratios | |||
Class A | 1.45% | |||
Class B | 2.19% | |||
Class C | 2.19% | |||
Class R3 | 1.63% | |||
Class I | 1.16% | |||
| * | Refer to the Glossary of Terms Used in this Report for definitions. |
| 22 | Nuveen Investments |
Growth of an Assumed $10,000 Investment as of June 30, 2011

The graph does not reflect the deduction of taxes that a shareholder may pay on Fund distributions or the redemption of Fund shares.
| Nuveen Investments | 23 |
Fund Performance and Expense Ratios (Unaudited) (continued)
Nuveen NWQ Large-Cap Value Fund
Refer to the first page of this Fund Performance and Expense Ratios section for further explanation of the information included within this page.
Fund Performance
Average Annual Total Returns as of June 30, 2011
| Average Annual | ||||||||
| 1-Year | Since Inception* | |||||||
Class A Shares at NAV | 26.22% | -1.38% | ||||||
Class A Shares at maximum Offering Price | 18.95% | -2.66% | ||||||
Russell 1000 Value Index** | 28.94% | -1.34% | ||||||
Lipper Large-Cap Core Funds Category Average** | 28.56% | 0.59% | ||||||
Class B Shares w/o CSDC | 25.28% | -2.12% | ||||||
Class B Shares w/CDSC | 21.28% | -2.56% | ||||||
Class C Shares | 25.26% | -2.11% | ||||||
Class R3 Shares | 25.97% | -1.63% | ||||||
Class I Shares | 26.54% | -1.14% | ||||||
Class A Shares have a maximum 5.75% sales charge (Offering Price). Class A Share purchases of $1 million or more are sold at net asset value without an up-front sales charge but may be subject to a contingent deferred sales charge (CDSC), also known as a back-end sales charge, if redeemed within twelve months of purchase. Class B Shares have a CDSC that begins at 5% for redemptions during the first year and declines periodically until after six years when the charge becomes 0%. Class B Shares automatically convert to Class A Shares eight years after purchase. Class C Shares have a 1% CDSC for redemptions within less than twelve months, which is not reflected in the one-year total return. Class R3 Shares have no sales charge and are available to only certain retirement plan clients of financial intermediaries. Class I Shares have no sales charge and may be purchased under limited circumstances or by specified classes of investors.
Expense Ratios
| Share Class | Expense Ratios | |||
Class A | 1.22% | |||
Class B | 1.97% | |||
Class C | 1.97% | |||
Class R3 | 1.48% | |||
Class I | 0.98% | |||
| * | Since inception returns for Class A, B, C and I Shares and for the index and category average are from 12/15/06; since inception return for Class R3 Shares is from 9/29/09. |
| ** | Refer to the Glossary of Terms Used in this Report for definitions. |
| 24 | Nuveen Investments |
Growth of an Assumed $10,000 Investment as of June 30, 2011
The graph does not reflect the deduction of taxes that a shareholder may pay on Fund distributions or the redemption of Fund shares.
| Nuveen Investments | 25 |
Fund Performance and Expense Ratios (Unaudited) (continued)
Nuveen NWQ Small/Mid-Cap Value Fund
Refer to the first page of this Fund Performance and Expense Ratios section for further explanation of the information included within this page.
Fund Performance
Average Annual Total Returns as of June 30, 2011
| Average Annual | ||||||||
| 1-Year | Since Inception* | |||||||
Class A Shares at NAV | 39.13% | -0.10% | ||||||
Class A Shares at maximum Offering Price | 31.16% | -1.39% | ||||||
Russell 2500 Index** | 34.54% | 1.98% | ||||||
Lipper Small-Cap Core Funds Category Average** | 36.29% | 3.07% | ||||||
Class C Shares | 38.07% | -0.87% | ||||||
Class R3 Shares | 38.69% | 0.60% | ||||||
Class I Shares | 39.40% | -0.11% | ||||||
Class A Shares have a maximum 5.75% sales charge (Offering Price). Class A Share purchases of $1 million or more are sold at net asset value without an up-front sales charge but may be subject to a contingent deferred sales charge (CDSC), also known as a back-end sales charge, if redeemed within twelve months of purchase. Class C Shares have a 1% CDSC for redemptions within less than twelve months, which is not reflected in the one-year total return. Class R3 Shares have no sales charge and are available to only certain retirement plan clients of financial intermediaries. Class I Shares have no sales charge and may be purchased under limited circumstances or by specified classes of investors.
Expense Ratios
| Share Class | Gross Expense Ratios | Net Expense Ratios | ||||||
Class A | 2.17% | 1.34% | ||||||
Class C | 2.96% | 2.09% | ||||||
Class R3 | 2.39% | 1.59% | ||||||
Class I | 1.94% | 1.09% | ||||||
The investment adviser has agreed to waive fees and reimburse expenses through October 31, 2011 so that total annual Fund operating expenses (excluding 12b-1 distribution and service fees, interest expenses, taxes, fees incurred in acquiring and disposing of portfolio securities and extraordinary expenses) do not exceed 1.10% (1.45% after October 31, 2011) of the average daily net assets of any class of Fund shares. The expense limitation expiring October 31, 2011, may be terminated or modified prior to that date only with the approval of the Board of Trustees of the Fund. The expense limitation in effect thereafter may be terminated or modified only with the approval of shareholders of the Fund.
| * | Since inception returns for Class A, C and I Shares and for the index and category average are from 12/15/06; since inception return for Class R3 Shares is from 9/29/09. |
| ** | Refer to the Glossary of Terms Used in this Report for definitions. |
| 26 | Nuveen Investments |
Growth of an Assumed $10,000 Investment as of June 30, 2011
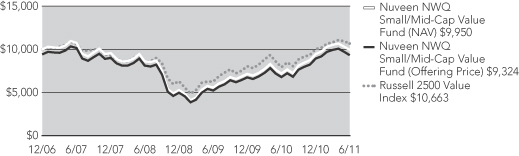
The graph does not reflect the deduction of taxes that a shareholder may pay on Fund distributions or the redemption of Fund shares.
| Nuveen Investments | 27 |
Fund Performance and Expense Ratios (Unaudited) (continued)
Nuveen NWQ Small-Cap Value Fund
Refer to the first page of this Fund Performance and Expense Ratios section for further explanation of the information included within this page.
Fund Performance
Average Annual Total Returns as of June 30, 2011
| Average Annual | ||||||||||||
| 1-Year | 5-Year | Since Inception* | ||||||||||
Class A Shares at NAV | 37.94% | 0.03% | 4.39% | |||||||||
Class A Shares at maximum Offering Price | 29.98% | -1.15% | 3.46% | |||||||||
Russell 2000 Value Index** | 31.35% | 2.24% | 4.52% | |||||||||
Lipper Small-Cap Core Funds Category Average** | 36.29% | 4.01% | 5.96% | |||||||||
Class C Shares | 36.96% | -0.71% | 3.64% | |||||||||
Class R3 Shares | 37.64% | -0.23% | 4.14% | |||||||||
Class I Shares | 38.28% | 0.29% | 4.66% | |||||||||
Class A, C and I Share returns are actual. The returns for Class R3 Shares are actual for the periods since class inception; returns prior to class inception are Class I Share returns adjusted for differences in sales charges and expenses, which are primarily differences in distribution and service fees.
Class A Shares have a maximum 5.75% sales charge (Offering Price). Class A Share purchases of $1 million or more are sold at net asset value without an up-front sales charge but may be subject to a contingent deferred sales charge (CDSC), also known as a back-end sales charge, if redeemed within twelve months of purchase. Class C Shares have a 1% CDSC for redemptions within less than twelve months, which is not reflected in the one-year total return. Class R3 Shares have no sales charge and are available to only certain retirement plan clients of financial intermediaries. Class I Shares have no sales charge and may be purchased under limited circumstances or by specified classes of investors.
Expense Ratios
| Share Class | Expense Ratios | |||
Class A | 1.42% | |||
Class C | 2.16% | |||
Class R3 | 1.63% | |||
Class I | 1.16% | |||
| * | Since inception returns for Class A, C and I Shares and for the index and category average are from 12/9/04; since inception return for Class R3 Shares is from 9/29/09. |
| ** | Refer to the Glossary of Terms Used in this Report for definitions. |
| 28 | Nuveen Investments |
Growth of an Assumed $10,000 Investment as of June 30, 2011

The graph does not reflect the deduction of taxes that a shareholder may pay on Fund distributions or the redemption of Fund shares.
| Nuveen Investments | 29 |
Fund Performance and Expense Ratios (Unaudited) (continued)
Nuveen Tradewinds Value Opportunities Fund
Refer to the first page of this Fund Performance and Expense Ratios section for further explanation of the information included within this page.
Fund Performance
Average Annual Total Returns as of June 30, 2011
| Average Annual | ||||||||||||
| 1-Year | 5-Year | Since Inception* | ||||||||||
Class A Shares at NAV | 25.31% | 9.83% | 12.61% | |||||||||
Class A Shares at maximum Offering Price | 18.09% | 8.54% | 11.60% | |||||||||
Russell 3000 Value Index** | 29.13% | 1.23% | 3.82% | |||||||||
Lipper Multi-Cap Core Funds Category Average** | 30.90% | 2.97% | 4.67% | |||||||||
Class B Shares w/o CDSC | 24.38% | 9.02% | 11.77% | |||||||||
Class B Shares w/ CDSC | 20.38% | 8.87% | 11.77% | |||||||||
Class C Shares | 24.39% | 9.01% | 11.77% | |||||||||
Class R3 Shares | 25.00% | 9.56% | 12.32% | |||||||||
Class I Shares | 25.64% | 10.12% | 12.89% | |||||||||
Class A, B, C and I Share returns are actual. The returns for Class R3 Shares are actual for the periods since class inception; returns prior to class inception are Class I Share returns adjusted for differences in sales charges and expenses, which are primarily differences in distribution and service fees.
Class A Shares have a maximum 5.75% sales charge (Offering Price). Class A Share purchases of $1 million or more are sold at net asset value without an up-front sales charge but may be subject to a contingent deferred sales charge (CDSC), also known as a back-end sales charge, if redeemed within twelve months of purchase. Class B Shares have a CDSC that begins at 5% for redemptions during the first year and declines periodically until after six years when the charge becomes 0%. Class B Shares automatically convert to Class A Shares eight years after purchase. Class C Shares have a 1% CDSC for redemptions within less than twelve months, which is not reflected in the one-year total return. Class R3 Shares have no sales charge and are available to only certain retirement plan clients of financial intermediaries. Class I Shares have no sales charge and may be purchased under limited circumstances or by specified classes of investors.
Expense Ratios
| Share Class | Expense Ratios | |||
Class A | 1.26% | |||
Class B | 2.00% | |||
Class C | 2.02% | |||
Class R3 | 1.54% | |||
Class I | 1.01% | |||
| * | Since inception returns for Class A, B, C and I Shares and for the index and average are from 12/9/04; since inception return for Class R3 Shares is from 8/4/03. |
| ** | Refer to the Glossary of Terms Used in this Report for definitions. |
| 30 | Nuveen Investments |
Growth of an Assumed $10,000 Investment as of June 30, 2011
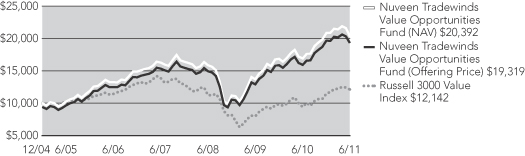
The graph does not reflect the deduction of taxes, that a shareholder may pay on Fund distributions or the redemption of Fund shares.
| Nuveen Investments | 31 |
Holding Summaries (Unaudited) as of June 30, 2011
This data relates to the securities held in each Fund’s portfolio of investments. It should not be construed as a measure of performance for the Fund itself.
Nuveen Multi-Manager Large-Cap Value Fund
Portfolio Allocation1

Nuveen NWQ Multi-Cap Value Fund
Portfolio Allocation1

Portfolio Composition1 | ||||
| Oil, Gas & Consumable Fuels | 12.5% | |||
| Pharmaceuticals | 10.8% | |||
| Insurance | 7.0% | |||
| Commercial Banks | 5.8% | |||
| Media | 5.7% | |||
| Diversified Telecommunication Services | 3.9% | |||
| Capital Markets | 3.7% | |||
| Diversified Financial Services | 3.5% | |||
| Health Care Providers & Services | 3.4% | |||
| Beverages | 3.0% | |||
| Food Products | 2.9% | |||
| Semiconductors & Equipment | 2.3% | |||
| Electric Utilities | 2.1% | |||
| Software | 2.0% | |||
| Aerospace & Defense | 2.0% | |||
| Industrial Conglomerates | 1.7% | |||
| Chemicals | 1.6% | |||
| Machinery | 1.6% | |||
| Specialty Retail | 1.5% | |||
| Health Care Equipment & Supplies | 1.4% | |||
| Auto Components | 1.4% | |||
| Road & Rail | 1.3% | |||
| Wireless Telecommunication Services | 1.3% | |||
| Investment Companies | 1.0% | |||
| IT Services | 1.0% | |||
| Short-Term Investments | 0.8% | |||
| Other | 14.8% | |||
| Portfolio Composition1 | ||||
| Insurance | 15.7% | |||
| Oil, Gas & Consumable Fuels | 12.7% | |||
| Pharmaceuticals | 12.1% | |||
| Metals & Mining | 8.6% | |||
| Media | 7.2% | |||
| Software | 6.7% | |||
| Diversified Financial Services | 5.5% | |||
| Communications Equipment | 5.0% | |||
| Semiconductors & Equipment | 4.7% | |||
| Biotechnology | 3.8% | |||
| Machinery | 3.1% | |||
| Short-Term Investments | 2.5% | |||
| Other | 12.4% | |||
| Top Five Common Stock Holdings1 | ||||
| Pfizer Inc. | 3.3% | |||
| Johnson & Johnson | 2.3% | |||
| Merck & Company Inc. | 2.2% | |||
| Microsoft Corporation | 2.0% | |||
| Wells Fargo & Company | 1.9% | |||
| Top Five Common Stock Holdings1 | ||||
| CA Inc. | 6.7% | |||
| Viacom Inc., Class B | 4.6% | |||
| Pfizer Inc. | 4.5% | |||
| Apache Corporation | 4.0% | |||
| Sanofi-Aventis | 3.9% | |||
| 1 | As a percentage of total investments as of June 30, 2011. Holdings are subject to change. |
| 32 | Nuveen Investments |
This data relates to the securities held in each Fund’s portfolio of investments. It should not be construed as a measure of performance for the Fund itself.
Nuveen NWQ Large-Cap Value Fund
Portfolio Allocation1

Nuveen NWQ Small/Mid-Cap Value Fund
Portfolio Allocation1

| Portfolio Composition1 | ||||
| Insurance | 16.3% | |||
| Oil, Gas & Consumable Fuels | 13.5% | |||
| Pharmaceuticals | 10.7% | |||
| Software | 7.8% | |||
Media | 7.8% | |||
| Metals & Mining | 6.4% | |||
| Communications Equipment | 6.2% | |||
| Diversified Financial Services | 5.4% | |||
| Biotechnology | 3.9% | |||
| Aerospace & Defense | 2.6% | |||
| Capital Markets | 2.4% | |||
| Short-Term Investments | 3.5% | |||
| Other | 13.5% | |||
| Portfolio Composition1 | ||||
| Metals & Mining | 10.0% | |||
Insurance | 8.9% | |||
| Electronic Equipment & Instruments | 8.9% | |||
| Semiconductors & Equipment | 8.7% | |||
| Oil, Gas & Consumable Fuels | 6.7% | |||
| Food Products | 5.6% | |||
| Machinery | 4.9% | |||
| Hotels, Restaurants & Leisure | 4.8% | |||
| Electrical Equipment | 4.5% | |||
| Personal Products | 4.3% | |||
| Real Estate Management & Development | 4.3% | |||
| Commercial Banks | 3.8% | |||
Thrifts & Mortgage Finance | 3.6% | |||
| Communications Equipment | 3.6% | |||
| Building Products | 3.5% | |||
| Other | 13.9% | |||
| Top Five Common Stock Holdings1 | ||||
CA Inc. | 6.0% | |||
Apache Corporation | 4.2% | |||
Pfizer Inc. | 4.1% | |||
Viacom Inc., Class B | 4.1% | |||
AngloGold Ashanti Limited, Sponsored ADR | 4.0% | |||
| Top Five Common Stock Holdings1 | ||||
Bob Evans Farms | 4.8% | |||
Elizabeth Arden, Inc. | 4.3% | |||
Forestar Real Estate Group Inc. | 4.3% | |||
PMC-Sierra, Inc. | 3.7% | |||
SM Energy Company | 3.7% | |||
| 1 | As a percentage of total investments as of June 30, 2011. Holdings are subject to change. |
| Nuveen Investments | 33 |
Holding Summaries (Unaudited) (continued) as of June 30, 2011
This data relates to the securities held in each Fund’s portfolio of investments. It should not be construed as a measure of performance for the Fund itself.
Nuveen NWQ Small-Cap Value Fund
Portfolio Allocation1
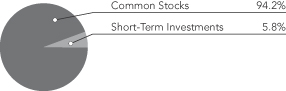
Nuveen Tradewinds Value Opportunities Fund
Portfolio Allocation1

| Portfolio Composition1 | ||||
| Semiconductors & Equipment | 9.6% | |||
| Metals & Mining | 9.0% | |||
| Machinery | 8.0% | |||
| Oil, Gas & Consumable Fuels | 7.5% | |||
| Commercial Banks | 7.0% | |||
| Insurance | 5.2% | |||
Personal Products | 4.8% | |||
Food Products | 4.8% | |||
| Hotels, Restaurants & Leisure | 4.5% | |||
| Real Estate Management & Development | 4.1% | |||
| Building Products | 3.4% | |||
| Communication Equipment | 3.1% | |||
| Road & Rail | 2.9% | |||
| Containers & Packaging | 2.7% | |||
| Electronic Equipment & Instruments | 2.6% | |||
| Short-Term Investments | 5.8% | |||
| Other | 15.0% | |||
| Portfolio Composition1 | ||||
| Metals & Mining | 18.5% | |||
| Oil, Gas & Consumable Fuels | 11.0% | |||
| Electric Utilities | 9.4% | |||
| Pharmaceuticals | 5.9% | |||
| Food & Staples Retailing | 5.2% | |||
| Software | 4.3% | |||
| Insurance | 3.8% | |||
| Communications Equipment | 3.7% | |||
| Health Care Providers & Services | 3.1% | |||
| Diversified Telecommunication Services | 2.7% | |||
| Electronic Equipment & Instruments | 2.6% | |||
| Short-Term Investments | 15.0% | |||
| Other | 14.8% | |||
| Top Five Common Stock Holdings1 | ||||
Standard Microsystems Corporation | 5.0% | |||
Elizabeth Arden, Inc. | 4.8% | |||
Bob Evans Farms | 4.5% | |||
Albany International Corporation, Class A | 4.3% | |||
Forestar Real Estate Group, Inc. | 4.1% | |||
| Top Five Common Stock Holdings1 | ||||
Eli Lilly and Company | 5.0% | |||
Newmont Mining Corporation | 4.8% | |||
Cameco Corporation | 4.3% | |||
Microsoft Corporation | 4.3% | |||
Exelon Corporation | 4.2% | |||
| Country Allocation1 | ||||
| United States | 56.8% | |||
| Canada | 13.4% | |||
| Japan | 3.3% | |||
| Russia | 3.1% | |||
| South Korea | 2.2% | |||
| Australia | 2.0% | |||
| Brazil | 1.3% | |||
| France | 1.2% | |||
| South Africa | 1.1% | |||
| Turkey | 0.9% | |||
| Bermuda | 0.6% | |||
| Norway | 0.6% | |||
| Argentina | 0.4% | |||
| Short-Term Investments | 13.1% | |||
| 1 | As a percentage of total investments as of June 30, 2011. Holdings are subject to change. |
| 34 | Nuveen Investments |
As a shareholder of one or more of the Funds, you incur two types of costs: (1) transaction costs, including up-front and back-end sales charges (loads) or redemption fees, where applicable; and (2) ongoing costs, including management fees; distribution and service (12b-1) fees, where applicable; and other Fund expenses. The Examples below are intended to help you understand your ongoing costs (in dollars) of investing in the Funds and to compare these costs with the ongoing costs of investing in other mutual funds.
The Examples below are based on an investment of $1,000 invested at the beginning of the period and held for the period.
The information under “Actual Performance,” together with the amount you invested, allows you to estimate actual expenses incurred over the reporting period. Simply divide your account value by $1,000 (for example, an $8,600 account value divided by $1,000 = 8.60) and multiply the result by the cost shown for your share class, in the row entitled “Expenses Incurred During Period” to estimate the expenses incurred on your account during this period.
The information under “Hypothetical Performance,” provides information about hypothetical account values and hypothetical expenses based on the respective Fund’s actual expense ratio and an assumed rate of return of 5% per year before expenses, which is not the Fund’s actual return. The hypothetical account values and expenses may not be used to estimate the actual ending account balance or expense you incurred for the period. You may use this information to compare the ongoing costs of investing in the Fund and other Funds. To do so, compare this 5% hypothetical example with the 5% hypothetical examples that appear in the shareholder reports of the other funds.
Please note that the expenses shown in the table are meant to highlight your ongoing costs only and do not reflect any transaction costs. Therefore, the hypothetical information is useful in comparing ongoing costs only, and will not help you determine the relative total costs of owning different funds or share classes. In addition, if these transaction costs were included, your costs would have been higher.
Nuveen Multi-Manager Large-Cap Value Fund
| Hypothetical Performance | ||||||||||||||||||||||||||||||||||||||||||
| Actual Performance | (5% annualized return before expenses) | |||||||||||||||||||||||||||||||||||||||||
| A Shares | B Shares | C Shares | R3 Shares | I Shares | A Shares | B Shares | C Shares | R3 Shares | I Shares | |||||||||||||||||||||||||||||||||
| Beginning Account Value (1/01/11) | $ | 1,000.00 | $ | 1,000.00 | $ | 1,000.00 | $ | 1,000.00 | $ | 1,000.00 | $ | 1,000.00 | $ | 1,000.00 | $ | 1,000.00 | $ | 1,000.00 | $ | 1,000.00 | ||||||||||||||||||||||
| Ending Account Value (6/30/11) | $ | 1,053.60 | $ | 1,049.10 | $ | 1,049.20 | $ | 1,051.70 | $ | 1,055.00 | $ | 1,018.94 | $ | 1,015.22 | $ | 1,015.22 | $ | 1,017.70 | $ | 1,020.18 | ||||||||||||||||||||||
| Expenses Incurred During Period | $ | 6.01 | $ | 9.81 | $ | 9.81 | $ | 7.27 | $ | 4.74 | $ | 5.91 | $ | 9.64 | $ | 9.64 | $ | 7.15 | $ | 4.66 | ||||||||||||||||||||||
For each class of the Fund, expenses are equal to the Fund’s annualized net expense ratio of 1.18%, 1.93%, 1.93%, 1.43% and ..93% for Classes A, B, C, R3 and I, respectively, multiplied by the average account value over the period, multiplied by 181/365 (to reflect the one-half year period).
Nuveen NWQ Multi-Cap Value Fund
| Hypothetical Performance | ||||||||||||||||||||||||||||||||||||||||||
| Actual Performance | (5% annualized return before expenses) | |||||||||||||||||||||||||||||||||||||||||
| A Shares | B Shares | C Shares | R3 Shares | I Shares | A Shares | B Shares | C Shares | R3 Shares | I Shares | |||||||||||||||||||||||||||||||||
| Beginning Account Value (1/01/11) | $ | 1,000.00 | $ | 1,000.00 | $ | 1,000.00 | $ | 1,000.00 | $ | 1,000.00 | $ | 1,000.00 | $ | 1,000.00 | $ | 1,000.00 | $ | 1,000.00 | $ | 1,000.00 | ||||||||||||||||||||||
| Ending Account Value (6/30/11) | $ | 1,043.10 | $ | 1,039.80 | $ | 1,039.80 | $ | 1,041.80 | $ | 1,044.70 | $ | 1,018.00 | $ | 1,014.28 | $ | 1,014.28 | $ | 1,016.76 | $ | 1,019.24 | ||||||||||||||||||||||
| Expenses Incurred During Period | $ | 6.94 | $ | 10.72 | $ | 10.72 | $ | 8.20 | $ | 5.68 | $ | 6.85 | $ | 10.59 | $ | 10.59 | $ | 8.10 | $ | 5.61 | ||||||||||||||||||||||
For each class of the Fund, expenses are equal to the Fund’s annualized net expense ratio of 1.37%, 2.12%, 2.12%, 1.62% and 1.12% for Classes A, B, C, R3 and I, respectively, multiplied by the average account value over the period, multiplied by 181/365 (to reflect the one-half year period).
Nuveen NWQ Large-Cap Value Fund
| Hypothetical Performance | ||||||||||||||||||||||||||||||||||||||||||
| Actual Performance | (5% annualized return before expenses) | |||||||||||||||||||||||||||||||||||||||||
| A Shares | B Shares | C Shares | R3 Shares | I Shares | A Shares | B Shares | C Shares | R3 Shares | I Shares | |||||||||||||||||||||||||||||||||
| Beginning Account Value (1/01/11) | $ | 1,000.00 | $ | 1,000.00 | $ | 1,000.00 | $ | 1,000.00 | $ | 1,000.00 | $ | 1,000.00 | $ | 1,000.00 | $ | 1,000.00 | $ | 1,000.00 | $ | 1,000.00 | ||||||||||||||||||||||
| Ending Account Value (6/30/11) | $ | 1,026.50 | $ | 1,022.50 | $ | 1,023.10 | $ | 1,025.50 | $ | 1,028.20 | $ | 1,018.94 | $ | 1,015.22 | $ | 1,015.22 | $ | 1,017.70 | $ | 1,020.18 | ||||||||||||||||||||||
| Expenses Incurred During Period | $ | 5.93 | $ | 9.68 | $ | 9.63 | $ | 7.18 | $ | 4.68 | $ | 5.91 | $ | 9.64 | $ | 9.64 | $ | 7.15 | $ | 4.66 | ||||||||||||||||||||||
For each class of the Fund, expenses are equal to the Fund’s annualized net expense ratio of 1.18%, 1.93%, 1.93%, 1.43% and ..93% for Classes A, B, C, R3 and I, respectively, multiplied by the average account value over the period, multiplied by 181/365 (to reflect the one-half year period).
| Nuveen Investments | 35 |
Expense Examples (Unaudited) (continued)
Nuveen NWQ Small/Mid-Cap Value Fund
| Hypothetical Performance | ||||||||||||||||||||||||||||||||||
| Actual Performance | (5% annualized return before expenses) | |||||||||||||||||||||||||||||||||
| A Shares | C Shares | R3 Shares | I Shares | A Shares | C Shares | R3 Shares | I Shares | |||||||||||||||||||||||||||
| Beginning Account Value (1/01/11) | $ | 1,000.00 | $ | 1,000.00 | $ | 1,000.00 | $ | 1,000.00 | $ | 1,000.00 | $ | 1,000.00 | $ | 1,000.00 | $ | 1,000.00 | ||||||||||||||||||
| Ending Account Value (6/30/11) | $ | 1,059.00 | $ | 1,054.90 | $ | 1,057.50 | $ | 1,060.40 | $ | 1,018.20 | $ | 1,014.48 | $ | 1,016.96 | $ | 1,019.44 | ||||||||||||||||||
| Expenses Incurred During Period | $ | 6.79 | $ | 10.60 | $ | 8.06 | $ | 5.52 | $ | 6.66 | $ | 10.39 | $ | 7.90 | $ | 5.41 | ||||||||||||||||||
For each class of the Fund, expenses are equal to the Fund’s annualized net expense ratio of 1.33%, 2.08%, 1.58% and 1.08% for Classes A, C, R3 and I, respectively, multiplied by the average account value over the period, multiplied by 181/365 (to reflect the one-half year period).
Nuveen NWQ Small-Cap Value Fund
| Hypothetical Performance | ||||||||||||||||||||||||||||||||||
| Actual Performance | (5% annualized return before expenses) | |||||||||||||||||||||||||||||||||
| A Shares | C Shares | R3 Shares | I Shares | A Shares | C Shares | R3 Shares | I Shares | |||||||||||||||||||||||||||
| Beginning Account Value (1/01/11) | $ | 1,000.00 | $ | 1,000.00 | $ | 1,000.00 | $ | 1,000.00 | $ | 1,000.00 | $ | 1,000.00 | $ | 1,000.00 | $ | 1,000.00 | ||||||||||||||||||
| Ending Account Value (6/30/11) | $ | 1,034.40 | $ | 1,030.70 | $ | 1,033.10 | $ | 1,035.80 | $ | 1,017.55 | $ | 1,013.84 | $ | 1,016.31 | $ | 1,018.79 | ||||||||||||||||||
| Expenses Incurred During Period | $ | 7.36 | $ | 11.13 | $ | 8.62 | $ | 6.11 | $ | 7.30 | $ | 11.03 | $ | 8.55 | $ | 6.06 | ||||||||||||||||||
For each class of the Fund, expenses are equal to the Fund’s annualized net expense ratio of 1.46%, 2.21%, 1.71% and 1.21% for Classes A, B, C, R3 and I, respectively, multiplied by the average account value over the period, multiplied by 181/365 (to reflect the one-half year period).
Nuveen Tradewinds Value Opportunities Fund
| Hypothetical Performance | ||||||||||||||||||||||||||||||||||||||||||
| Actual Performance | (5% annualized return before expenses) | |||||||||||||||||||||||||||||||||||||||||
| A Shares | B Shares | C Shares | R3 Shares | I Shares | A Shares | B Shares | C Shares | R3 Shares | I Shares | |||||||||||||||||||||||||||||||||
| Beginning Account Value (1/01/11) | $ | 1,000.00 | $ | 1,000.00 | $ | 1,000.00 | $ | 1,000.00 | $ | 1,000.00 | $ | 1,000.00 | $ | 1,000.00 | $ | 1,000.00 | $ | 1,000.00 | $ | 1,000.00 | ||||||||||||||||||||||
| Ending Account Value (6/30/11) | $ | 1,014.50 | $ | 1,011.10 | $ | 1,010.80 | $ | 1,013.40 | $ | 1,015.90 | $ | 1,018.89 | $ | 1,015.17 | $ | 1,015.17 | $ | 1,017.65 | $ | 1,020.13 | ||||||||||||||||||||||
| Expenses Incurred During Period | $ | 5.94 | $ | 9.67 | $ | 9.67 | $ | 7.19 | $ | 4.70 | $ | 5.96 | $ | 9.69 | $ | 9.69 | $ | 7.20 | $ | 4.71 | ||||||||||||||||||||||
For each class of the Fund, expenses are equal to the Fund’s annualized net expense ratio of 1.19%, 1.94%, 1.94%, 1.44% and ..94% for Classes A, B, C, R3 and I, respectively, multiplied by the average account value over the period, multiplied by 181/365 (to reflect the one-half year period).
| 36 | Nuveen Investments |
Report of Independent Registered Public Accounting Firm
To the Board of Trustees and Shareholders of
Nuveen Investment Trust:
In our opinion, the accompanying statements of assets and liabilities, including the portfolios of investments, and the related statements of operations, of changes in net assets and the financial highlights present fairly, in all material respects, the financial position of Nuveen Multi-Manager Large-Cap Value Fund, Nuveen NWQ Multi-Cap Value Fund, Nuveen NWQ Large-Cap Value Fund, Nuveen NWQ Small/Mid-Cap Value Fund, Nuveen NWQ Small-Cap Value Fund, and Nuveen Tradewinds Value Opportunities Fund (each a series of the Nuveen Investment Trust, hereafter referred to as the “Funds”) at June 30, 2011, the results of their operations for the year then ended, the changes in their net assets for each of the two years in the period then ended and the financial highlights for each of the periods presented in conformity with accounting principles generally accepted in the United States of America. These financial statements and financial highlights (hereafter referred to as “financial statements”) are the responsibility of the Funds’ management; our responsibility is to express an opinion on these financial statements based on our audits. We conducted our audits of these financial statements in accordance with the standards of the Public Company Accounting Oversight Board (United States). Those standards require that we plan and perform the audit to obtain reasonable assurance about whether the financial statements are free of material misstatement. An audit includes examining, on a test basis, evidence supporting the amounts and disclosures in the financial statements, assessing the accounting principles used and significant estimates made by management, and evaluating the overall financial statement presentation. We believe that our audits, which included confirmation of securities at June 30, 2011 by correspondence with the custodian and brokers, provide a reasonable basis for our opinion.
PRICEWATERHOUSECOOPERS LLP
Chicago, IL
August 26, 2011
| Nuveen Investments | 37 |
Nuveen Multi-Manager Large-Cap Value Fund
June 30, 2011
| Shares | Description (1) | Value | ||||||||||||
COMMON STOCKS – 98.3% | ||||||||||||||
Aerospace & Defense – 2.0% | ||||||||||||||
| 200 | Alliant Techsystems Inc. | $ | 14,266 | |||||||||||
| 100 | BE Aerospace Inc., (2) | 4,081 | ||||||||||||
| 800 | Boeing Company | 59,144 | ||||||||||||
| 3,300 | General Dynamics Corporation | 245,916 | ||||||||||||
| 600 | Goodrich Corporation | 57,300 | ||||||||||||
| 56,650 | Honeywell International Inc. | 3,375,774 | ||||||||||||
| 1,000 | Huntington Ingalls Industries Inc. | 34,500 | ||||||||||||
| 2,300 | ITT Industries, Inc. | 135,539 | ||||||||||||
| 12,940 | L-3 Communications Holdings, Inc. | 1,131,603 | ||||||||||||
| 1,700 | Lockheed Martin Corporation | 137,649 | ||||||||||||
| 5,600 | Northrop Grumman Corporation | 388,360 | ||||||||||||
| 3,200 | Raytheon Company | 159,520 | ||||||||||||
| 400 | Spirit AeroSystems Holdings Inc., (2) | 8,800 | ||||||||||||
| 3,200 | Textron Inc. | 75,552 | ||||||||||||
| 11,130 | United Technologies Corporation | 985,116 | ||||||||||||
Total Aerospace & Defense | 6,813,120 | |||||||||||||
Air Freight & Logistics – 0.0% | ||||||||||||||
| 1,500 | FedEx Corporation | 142,275 | ||||||||||||
| 200 | UTI Worldwide, Inc. | 3,938 | ||||||||||||
Total Air Freight & Logistics | 146,213 | |||||||||||||
Airlines – 0.2% | ||||||||||||||
| 6,400 | AMR Corporation, (2) | 34,560 | ||||||||||||
| 100 | Copa Holdings SA | 6,674 | ||||||||||||
| 12,500 | Delta Air Lines, Inc., (2) | 114,625 | ||||||||||||
| 5,700 | Southwest Airlines Co. | 65,094 | ||||||||||||
| 22,700 | United Continental Holdings Inc. | 513,701 | ||||||||||||
Total Airlines | 734,654 | |||||||||||||
Apparel, Accesories & Luxury Goods – 0.0% | ||||||||||||||
| 400 | Phillips-Van Heusen Corporation | 26,188 | ||||||||||||
| 1,000 | VF Corporation | 108,560 | ||||||||||||
Total Apparel, Accesories & Luxury Goods | 134,748 | |||||||||||||
Auto Components – 1.4% | ||||||||||||||
| 2,500 | Autoliv Inc. | 196,125 | ||||||||||||
| 400 | Federal Mogul Corporation, Class A Shares, (2) | 9,132 | ||||||||||||
| 80,050 | Johnson Controls, Inc. | 3,334,883 | ||||||||||||
| 2,300 | Lear Corporation, (2) | 123,004 | ||||||||||||
| 19,800 | TRW Automotive Holdings Corporation, (2) | 1,168,794 | ||||||||||||
| 300 | Visteon Corporation | 20,523 | ||||||||||||
Total Auto Components | 4,852,461 | |||||||||||||
Automobiles – 0.3% | ||||||||||||||
| 58,200 | Ford Motor Company, (2) | 802,578 | ||||||||||||
| 11,400 | General Motors Company | 346,104 | ||||||||||||
| 300 | Thor Industries, Inc. | 8,652 | ||||||||||||
Total Automobiles | 1,157,334 | |||||||||||||
| 38 | Nuveen Investments |
| Shares | Description (1) | Value | ||||||||||||
Beverages – 3.0% | ||||||||||||||
| 200 | Brown-Forman Corporation | $ | 14,938 | |||||||||||
| 1,200 | Coca-Cola Enterprises Inc. | 35,016 | ||||||||||||
| 69,290 | Coca-Cola Company | 4,662,524 | ||||||||||||
| 4,300 | Constellation Brands, Inc., Class A, (2) | 89,526 | ||||||||||||
| 1,500 | Molson Coors Brewing Company, Class B | 67,110 | ||||||||||||
| 78,400 | PepsiCo, Inc. | 5,521,712 | ||||||||||||
Total Beverages | 10,390,826 | |||||||||||||
Biotechnology – 0.6% | ||||||||||||||
| 31,760 | Amgen Inc., (2) | 1,853,196 | ||||||||||||
| 2,800 | Cephalon, Inc., (2) | 223,720 | ||||||||||||
| 400 | Vertex Pharmaceuticals Inc., (2) | 20,796 | ||||||||||||
Total Biotechnology | 2,097,712 | |||||||||||||
Building Products – 0.0% | ||||||||||||||
| 400 | Armstrong World Industries Inc., (2) | 18,224 | ||||||||||||
| 1,500 | Owens Corning, (2) | 56,025 | ||||||||||||
Total Building Products | 74,249 | |||||||||||||
Capital Markets – 3.7% | ||||||||||||||
| 9,430 | Affiliated Managers Group Inc., (2) | 956,674 | ||||||||||||
| 11,400 | American Capital Limited, (2) | 113,202 | ||||||||||||
| 5,200 | Ameriprise Financial, Inc. | 299,936 | ||||||||||||
| 67,780 | Ares Capital Corporation | 1,089,225 | ||||||||||||
| 14,300 | Bank of New York Company, Inc. | 366,366 | ||||||||||||
| 13,050 | BlackRock Inc. | 2,503,121 | ||||||||||||
| 119,750 | Charles Schwab Corporation | 1,969,888 | ||||||||||||
| 4,000 | E*Trade Group Inc., (2) | 55,200 | ||||||||||||
| 200 | Federated Investors Inc. | 4,768 | ||||||||||||
| 23,350 | Goldman Sachs Group, Inc. | 3,107,652 | ||||||||||||
| 53,390 | Invesco LTD | 1,249,326 | ||||||||||||
| 3,500 | Janus Capital Group Inc. | 33,040 | ||||||||||||
| 700 | Jefferies Group, Inc. | 14,280 | ||||||||||||
| 1,100 | Legg Mason, Inc. | 36,036 | ||||||||||||
| 20,800 | Morgan Stanley | 478,608 | ||||||||||||
| 1,200 | Northern Trust Corporation | 55,152 | ||||||||||||
| 1,400 | Raymond James Financial Inc. | 45,010 | ||||||||||||
| 6,300 | State Street Corporation | 284,067 | ||||||||||||
Total Capital Markets | 12,661,551 | |||||||||||||
Chemicals – 1.6% | ||||||||||||||
| 1,300 | Ashland Inc. | 84,006 | ||||||||||||
| 1,300 | Cabot Corporation | 51,831 | ||||||||||||
| 1,200 | CF Industries Holdings, Inc. | 170,004 | ||||||||||||
| 700 | Cytec Industries, Inc. | 40,033 | ||||||||||||
| 15,500 | Dow Chemical Company | 558,000 | ||||||||||||
| 7,120 | FMC Corporation | 612,462 | ||||||||||||
| 3,800 | Huntsman Corporation | 71,630 | ||||||||||||
| 41,380 | Interpid Potash Inc., (2) | 1,344,850 | ||||||||||||
| Nuveen Investments | 39 |
Portfolio of Investments
Nuveen Multi-Manager Large-Cap Value Fund (continued)
June 30, 2011
| Shares | Description (1) | Value | ||||||||||||
Chemicals (continued) | ||||||||||||||
| 8,700 | LyondellBasell Industries NV, (2) | $ | 335,124 | |||||||||||
| 30,650 | Monsanto Company | 2,223,351 | ||||||||||||
| 300 | Nalco Holding Company | 8,343 | ||||||||||||
| 400 | Rockwood Holdings Inc., (2) | 22,116 | ||||||||||||
| 1,800 | RPM International, Inc. | 41,436 | ||||||||||||
| 100 | Scotts Miracle Gro Company | 5,131 | ||||||||||||
| 1,000 | Valspar Corporation | 36,060 | ||||||||||||
| 500 | Westlake Chemical Corporation | 25,950 | ||||||||||||
| 200 | WR Grace & Company, (2) | 9,126 | ||||||||||||
Total Chemicals | 5,639,453 | |||||||||||||
Commercial & Professional Services – 0.0% | ||||||||||||||
| 500 | Corrections Corporation of America, (2) | 10,825 | ||||||||||||
Commercial Banks – 5.8% | ||||||||||||||
| 87,627 | Associated Banc-Corp. | 1,218,015 | ||||||||||||
| 500 | Bank of Hawaii Corporation | 23,260 | ||||||||||||
| 101,450 | BB&T Corporation | 2,722,918 | ||||||||||||
| 300 | BOK Financial Corporation | 16,431 | ||||||||||||
| 4,400 | Capitalsource Inc. | 28,380 | ||||||||||||
| 2,100 | CIT Group Inc., (2) | 92,946 | ||||||||||||
| 500 | City National Corporation | 27,125 | ||||||||||||
| 1,900 | Comerica Incorporated | 65,683 | ||||||||||||
| 1,100 | Commerce Bancshares Inc. | 47,300 | ||||||||||||
| 400 | Cullen/Frost Bankers, Inc. | 22,740 | ||||||||||||
| 48,720 | East West Bancorp Inc. | 984,631 | ||||||||||||
| 12,200 | Fifth Third Bancorp. | 155,550 | ||||||||||||
| 2,200 | First Horizon National Corporation, (2) | 20,988 | ||||||||||||
| 800 | First Republic Bank of San Francisco | 25,824 | ||||||||||||
| 2,500 | Fulton Financial Corporation | 26,775 | ||||||||||||
| 10,200 | Huntington BancShares Inc. | 66,912 | ||||||||||||
| 223,250 | KeyCorp. | 1,859,673 | ||||||||||||
| 15,360 | M&T Bank Corporation | 1,350,912 | ||||||||||||
| 6,400 | Marshall and Ilsley Corporation | 51,008 | ||||||||||||
| 5,500 | PNC Financial Services Group, Inc. | 327,855 | ||||||||||||
| 6,800 | Popular, Inc., (2) | 18,768 | ||||||||||||
| 14,000 | Regions Financial Corporation | 86,800 | ||||||||||||
| 5,600 | SunTrust Banks, Inc. | 144,480 | ||||||||||||
| 8,700 | Synovus Financial Corp. | 18,096 | ||||||||||||
| 1,400 | TCF Financial Corporation | 19,320 | ||||||||||||
| 94,930 | U.S. Bancorp | 2,421,664 | ||||||||||||
| 2,300 | Valley National Bancorp. | 31,303 | ||||||||||||
| 237,570 | Wells Fargo & Company | 6,666,213 | ||||||||||||
| 61,620 | Zions Bancorporation | 1,479,496 | ||||||||||||
Total Commercial Banks | 20,021,066 | |||||||||||||
Commercial Services & Supplies – 0.6% | ||||||||||||||
| 1,500 | Avery Dennison Corporation | 57,945 | ||||||||||||
| 1,400 | Cintas Corporation | 46,242 | ||||||||||||
| 40 | Nuveen Investments |
| Shares | Description (1) | Value | ||||||||||||
Commercial Services & Supplies (continued) | ||||||||||||||
| 2,100 | Covanta Holding Corporation | $ | 34,629 | |||||||||||
| 500 | KAR Auction Services Inc., (2) | 9,455 | ||||||||||||
| 3,100 | Pitney Bowes Inc. | 71,269 | ||||||||||||
| 4,500 | R.R. Donnelley & Sons Company | 88,245 | ||||||||||||
| 51,980 | Republic Services, Inc. | 1,603,583 | ||||||||||||
| 100 | St Joe Company, (2) | 2,084 | ||||||||||||
| 100 | Waste Connections Inc., (2) | 3,173 | ||||||||||||
| 6,300 | Waste Management, Inc. | 234,801 | ||||||||||||
Total Commercial Services & Supplies | 2,151,426 | |||||||||||||
Communications Equipment – 0.7% | ||||||||||||||
| 4,900 | Brocade Communications Systems Inc., (2) | 31,654 | ||||||||||||
| 41,900 | Cisco Systems, Inc., (2) | 654,059 | ||||||||||||
| 900 | Echostar Holding Corproation, Class A, (2) | 32,787 | ||||||||||||
| 700 | Harris Corporation | 31,542 | ||||||||||||
| 900 | Motorola Mobility Holdings Inc. | 19,836 | ||||||||||||
| 38,850 | Motorola Solutions Inc. | 1,788,654 | ||||||||||||
| 1,000 | Tellabs Inc. | 4,610 | ||||||||||||
Total Communications Equipment | 2,563,142 | |||||||||||||
Computers & Peripherals – 0.6% | ||||||||||||||
| 19,000 | Dell Inc., (2) | 316,730 | ||||||||||||
| 800 | Diebold Inc. | 24,808 | ||||||||||||
| 22,200 | Hewlett-Packard Company | 808,080 | ||||||||||||
| 1,300 | Lexmark International, Inc., Class A, (2) | 38,038 | ||||||||||||
| 500 | NCR Corporation, (2) | 9,445 | ||||||||||||
| 5,800 | SanDisk Corporation, (2) | 240,700 | ||||||||||||
| 32,390 | Seagate Technology, (2) | 523,422 | ||||||||||||
| 3,900 | Western Digital Corporation, (2) | 141,882 | ||||||||||||
Total Computers & Peripherals | 2,103,105 | |||||||||||||
Construction & Engineering – 0.2% | ||||||||||||||
| 600 | AECOM Technology Corporation, (2) | 16,404 | ||||||||||||
| 900 | Chicago Bridge & Iron Company N.V., (2) | 35,010 | ||||||||||||
| 500 | Jacobs Engineering Group, Inc., (2) | 21,625 | ||||||||||||
| 2,700 | KBR Inc. | 101,763 | ||||||||||||
| 100 | Shaw Group Inc., (2) | 3,021 | ||||||||||||
| 1,100 | URS Corporation, (2) | 49,214 | ||||||||||||
Total Construction & Engineering | 227,037 | |||||||||||||
Construction Materials – 0.2% | ||||||||||||||
| 16,500 | Vulcan Materials Company | 635,745 | ||||||||||||
Consumer Finance – 0.7% | ||||||||||||||
| 6,400 | American Express Company | 330,880 | ||||||||||||
| 10,500 | Capital One Financial Corporation | 542,535 | ||||||||||||
| 52,280 | Discover Financial Services | 1,398,490 | ||||||||||||
| 11,300 | SLM Corporation, (2) | 189,953 | ||||||||||||
Total Consumer Finance | 2,461,858 | |||||||||||||
| Nuveen Investments | 41 |
Portfolio of Investments
Nuveen Multi-Manager Large-Cap Value Fund (continued)
June 30, 2011
| Shares | Description (1) | Value | ||||||||||||
Containers & Packaging – 0.4% | ||||||||||||||
| 900 | AptarGroup Inc. | $ | 47,106 | |||||||||||
| 1,100 | Bemis Company, Inc. | 37,158 | ||||||||||||
| 500 | Greif Inc. | 32,515 | ||||||||||||
| 39,850 | Owens-Illinois, Inc., (2) | 1,028,529 | ||||||||||||
| 700 | Packaging Corp. of America | 19,593 | ||||||||||||
| 2,100 | Sealed Air Corporation | 49,959 | ||||||||||||
| 1,100 | Sonoco Products Company | 39,094 | ||||||||||||
| 700 | Temple-Inland Inc. | 20,818 | ||||||||||||
Total Containers & Packaging | 1,274,772 | |||||||||||||
Distributors – 0.0% | ||||||||||||||
| 1,800 | Genuine Parts Company | 97,920 | ||||||||||||
Diversified Consumer Services – 0.0% | ||||||||||||||
| 700 | Career Education Corporation, (2) | 14,805 | ||||||||||||
| 100 | Devry, Inc. | 5,913 | ||||||||||||
| 500 | Education Management Corporation, (2) | 11,970 | ||||||||||||
| 4,500 | H & R Block Inc. | 72,180 | ||||||||||||
| 3,600 | Service Corporation International | 42,048 | ||||||||||||
Total Diversified Consumer Services | 146,916 | |||||||||||||
Diversified Financial Services – 3.5% | ||||||||||||||
| 133,500 | Bank of America Corporation | 1,463,160 | ||||||||||||
| 93,187 | Citigroup Inc. | 3,880,307 | ||||||||||||
| 400 | CME Group, Inc. | 116,636 | ||||||||||||
| 600 | Interactive Brokers Group, Inc., (2) | 9,390 | ||||||||||||
| 156,300 | JP Morgan Chase & Co. | 6,398,922 | ||||||||||||
| 4,700 | Leucadia National Corporation, (2) | 160,270 | ||||||||||||
| 3,700 | Nasdaq Stock Market, Inc., (2) | 93,610 | ||||||||||||
| 2,800 | New York Stock Exchange Euronext | 95,956 | ||||||||||||
Total Diversified Financial Services | 12,218,251 | |||||||||||||
Diversified REIT – 0.2% | ||||||||||||||
| 1,900 | Liberty Property Trust | 61,902 | ||||||||||||
| 2,300 | Vornado Realty Trust | 214,314 | ||||||||||||
Total Diversified REIT | 276,216 | |||||||||||||
Diversified Telecommunication Services – 3.9% | ||||||||||||||
| 117,600 | AT&T Inc. | 3,693,816 | ||||||||||||
| 85,450 | BCE INC. | 3,357,331 | ||||||||||||
| 33,790 | CenturyLink Inc. | 1,366,130 | ||||||||||||
| 24,200 | Frontier Communications Corporation | 195,294 | ||||||||||||
| 38,800 | Level 3 Communications Inc., (2) | 94,672 | ||||||||||||
| 600 | TW Telecom Inc., (2) | 12,318 | ||||||||||||
| 121,070 | Verizon Communications Inc. | 4,507,436 | ||||||||||||
| 6,500 | Windstream Corporation | 84,240 | ||||||||||||
Total Diversified Telecommunication Services | 13,311,237 | |||||||||||||
Electric Utilities – 2.1% | ||||||||||||||
| 9,700 | American Electric Power Company, Inc. | 365,496 | ||||||||||||
| 1,800 | DPL Inc. | 54,288 | ||||||||||||
| 42 | Nuveen Investments |
| Shares | Description (1) | Value | ||||||||||||
Electric Utilities (continued) | ||||||||||||||
| 110,950 | Duke Energy Corporation | $ | 2,089,189 | |||||||||||
| 7,000 | Edison International | 271,250 | ||||||||||||
| 2,600 | Entergy Corporation | 177,528 | ||||||||||||
| 11,400 | Exelon Corporation | 488,376 | ||||||||||||
| 8,300 | FirstEnergy Corp. | 366,445 | ||||||||||||
| 2,700 | Great Plains Energy Incorporated | 55,971 | ||||||||||||
| 1,600 | Hawaiian Electric Industries | 38,496 | ||||||||||||
| 7,000 | NextEra Energy Inc. | 402,220 | ||||||||||||
| 3,600 | Northeast Utilities | 126,612 | ||||||||||||
| 4,900 | NV Energy Inc. | 75,215 | ||||||||||||
| 5,300 | Pepco Holdings, Inc. | 104,039 | ||||||||||||
| 2,600 | Pinnacle West Capital Corporation | 115,908 | ||||||||||||
| 8,700 | PPL Corporation | 242,121 | ||||||||||||
| 5,600 | Progress Energy, Inc. | 268,856 | ||||||||||||
| 43,820 | Southern Company | 1,769,452 | ||||||||||||
| 2,500 | Westar Energy Inc. | 67,275 | ||||||||||||
Total Electric Utilities | 7,078,737 | |||||||||||||
Electrical Equipment – 0.2% | ||||||||||||||
| 700 | Cooper Industries Inc. | 41,769 | ||||||||||||
| 400 | General Cable Corporation, (2) | 17,032 | ||||||||||||
| 1,500 | GrafTech International Ltd., (2) | 30,405 | ||||||||||||
| 900 | Hubbell Incorporated, Class B | 58,455 | ||||||||||||
| 200 | Regal-Beloit Corporation | 13,354 | ||||||||||||
| 600 | Thomas & Betts Corporation, (2) | 32,310 | ||||||||||||
Total Electrical Equipment | 193,325 | |||||||||||||
Electronic Components – 0.2% | ||||||||||||||
| 500 | AVX Group | 7,620 | ||||||||||||
| 25,200 | Corning Incorporated | 457,380 | ||||||||||||
| 7,100 | Vishay Intertechnology Inc., (2) | 106,784 | ||||||||||||
Total Electronic Components | 571,784 | |||||||||||||
Electronic Equipment & Instruments – 0.1% | ||||||||||||||
| 2,900 | Arrow Electronics, Inc., (2) | 120,350 | ||||||||||||
| 2,700 | Avnet Inc., (2) | 86,076 | ||||||||||||
| 1,800 | Ingram Micro, Inc., Class A, (2) | 32,652 | ||||||||||||
| 100 | Itron Inc., (2) | 4,816 | ||||||||||||
| 2,400 | Jabil Circuit Inc. | 48,480 | ||||||||||||
| 2,200 | Molex Inc. | 56,694 | ||||||||||||
| 600 | Tech Data Corporation, (2) | 29,334 | ||||||||||||
Total Electronic Equipment & Instruments | 378,402 | |||||||||||||
Energy Equipment & Services – 0.9% | ||||||||||||||
| 1,000 | Atwood Oceanics Inc., (2) | 44,130 | ||||||||||||
| 7,800 | Baker Hughes Incorporated | 565,968 | ||||||||||||
| 600 | Cooper Cameron Corporation, (2) | 30,174 | ||||||||||||
| 1,000 | Diamond Offshore Drilling, Inc. | 70,410 | ||||||||||||
| 21,990 | Halliburton Company | 1,121,490 | ||||||||||||
| 100 | Helmerich & Payne Inc. | 6,612 | ||||||||||||
| Nuveen Investments | 43 |
Portfolio of Investments
Nuveen Multi-Manager Large-Cap Value Fund (continued)
June 30, 2011
| Shares | Description (1) | Value | ||||||||||||
Energy Equipment & Services (continued) | ||||||||||||||
| 700 | McDermott International Inc., (2) | $ | 13,867 | |||||||||||
| 10,100 | Nabors Industries Inc., (2) | 248,864 | ||||||||||||
| 9,100 | National-Oilwell Varco Inc. | 711,711 | ||||||||||||
| 200 | Oil States International Inc., (2) | 15,982 | ||||||||||||
| 5,300 | Patterson-UTI Energy, Inc. | 167,533 | ||||||||||||
| 2,200 | Rowan Companies Inc., (2) | 85,382 | ||||||||||||
| 600 | SeaCor Smit Inc., (2) | 59,976 | ||||||||||||
| 700 | Tidewater Inc. | 37,667 | ||||||||||||
| 900 | Unit Corporation, (2) | 54,837 | ||||||||||||
Total Energy Equipment & Services | 3,234,603 | |||||||||||||
Food & Staples Retailing – 0.8% | ||||||||||||||
| 500 | BJ’s Wholesale Club, (2) | 25,175 | ||||||||||||
| 56,240 | CVS Caremark Corporation | 2,113,499 | ||||||||||||
| 6,000 | Kroger Co. | 148,800 | ||||||||||||
| 5,300 | Safeway Inc. | 123,861 | ||||||||||||
| 4,800 | SUPERVALU INC. | 45,168 | ||||||||||||
| 700 | Walgreen Co. | 29,722 | ||||||||||||
| 4,800 | Wal-Mart Stores, Inc. | 255,072 | ||||||||||||
Total Food & Staples Retailing | 2,741,297 | |||||||||||||
Food Products – 2.9% | ||||||||||||||
| 84,550 | Archer-Daniels-Midland Company | 2,549,183 | ||||||||||||
| 2,500 | Bunge Limited | 172,375 | ||||||||||||
| 300 | Campbell Soup Company | 10,365 | ||||||||||||
| 2,200 | ConAgra Foods, Inc. | 56,782 | ||||||||||||
| 300 | Corn Products International, Inc. | 16,584 | ||||||||||||
| 5,700 | Dean Foods Company, (2) | 69,939 | ||||||||||||
| 1,100 | General Mills, Inc. | 40,942 | ||||||||||||
| 1,500 | H.J. Heinz Company | 79,920 | ||||||||||||
| 35,520 | Hershey Foods Corporation | 2,019,312 | ||||||||||||
| 1,200 | Hormel Foods Corporation | 35,772 | ||||||||||||
| 2,000 | JM Smucker Company | 152,880 | ||||||||||||
| 100 | Kellogg Company | 5,532 | ||||||||||||
| 62,230 | Kraft Foods Inc. | 2,192,363 | ||||||||||||
| 500 | McCormick & Company, Incorporated | 24,785 | ||||||||||||
| 34,410 | Mead Johnson Nutrition Company, Class A Shares | 2,324,396 | ||||||||||||
| 900 | Ralcorp Holdings Inc., (2) | 77,922 | ||||||||||||
| 2,900 | Sara Lee Corporation | 55,071 | ||||||||||||
| 4,300 | Smithfield Foods, Inc., (2) | 94,041 | ||||||||||||
| 5,100 | Tyson Foods, Inc., Class A | 99,042 | ||||||||||||
Total Food Products | 10,077,206 | |||||||||||||
Gas Utilities – 0.3% | ||||||||||||||
| 1,300 | AGL Resources Inc. | 52,923 | ||||||||||||
| 1,600 | Atmos Energy Corporation | 53,200 | ||||||||||||
| 1,200 | National Fuel Gas Company | 87,360 | ||||||||||||
| 1,900 | ONEOK, Inc. | 140,619 | ||||||||||||
| 39,100 | Questar Corporation | 692,461 | ||||||||||||
| 44 | Nuveen Investments |
| Shares | Description (1) | Value | ||||||||||||
Gas Utilities (continued) | ||||||||||||||
| 2,100 | UGI Corporation | $ | 66,969 | |||||||||||
Total Gas Utilities | 1,093,532 | |||||||||||||
Health Care Equipment & Supplies – 1.4% | ||||||||||||||
| 900 | Alere Inc. | 32,958 | ||||||||||||
| 800 | Baxter International, Inc. | 47,752 | ||||||||||||
| 14,600 | Boston Scientific Corporation, (2) | 100,886 | ||||||||||||
| 43,230 | CareFusion Corporation, (2) | 1,174,559 | ||||||||||||
| 700 | Cooper Companies, Inc. | 55,468 | ||||||||||||
| 59,100 | Covidien PLC | 3,145,893 | ||||||||||||
| 600 | DENTSPLY International Inc. | 22,848 | ||||||||||||
| 100 | Hill Rom Holdings Inc. | 4,604 | ||||||||||||
| 4,400 | Hologic Inc., (2) | 88,748 | ||||||||||||
| 200 | Kinetic Concepts Inc., (2) | 11,526 | ||||||||||||
| 2,200 | Medtronic, Inc. | 84,766 | ||||||||||||
| 500 | Teleflex Inc. | 30,530 | ||||||||||||
| 1,900 | Zimmer Holdings, Inc., (2) | 120,080 | ||||||||||||
Total Health Care Equipment & Supplies | 4,920,618 | |||||||||||||
Health Care Providers & Services – 3.4% | ||||||||||||||
| 41,420 | Aetna Inc. | 1,826,208 | ||||||||||||
| 1,000 | AmericGroup Corporation, (2) | 70,470 | ||||||||||||
| 200 | Brookdale Senior Living Inc., (2) | 4,850 | ||||||||||||
| 2,100 | Cardinal Health, Inc. | 95,382 | ||||||||||||
| 4,600 | CIGNA Corporation | 236,578 | ||||||||||||
| 2,600 | Community Health Systems, Inc., (2) | 66,768 | ||||||||||||
| 3,900 | Coventry Health Care, Inc., (2) | 142,233 | ||||||||||||
| 37,350 | HCA Holdings Inc. | 1,232,550 | ||||||||||||
| 1,100 | Health Net Inc., (2) | 35,299 | ||||||||||||
| 400 | Henry Schein Inc., (2) | 28,636 | ||||||||||||
| 30,760 | Humana Inc., (2) | 2,477,410 | ||||||||||||
| 1,100 | Lifepoint Hospitals Inc., (2) | 42,988 | ||||||||||||
| 15,870 | McKesson HBOC Inc. | 1,327,526 | ||||||||||||
| 1,300 | Omnicare, Inc. | 41,457 | ||||||||||||
| 500 | Patterson Companies, Inc. | 16,445 | ||||||||||||
| 14,100 | Tenet Healthcare Corporation, (2) | 87,984 | ||||||||||||
| 22,400 | UnitedHealth Group Incorporated | 1,155,392 | ||||||||||||
| 900 | VCA Antech, Inc., (2) | 19,080 | ||||||||||||
| 36,200 | Wellpoint Inc., (2) | 2,851,474 | ||||||||||||
Total Health Care Providers & Services | 11,758,730 | |||||||||||||
Health Care Technology – 0.0% | ||||||||||||||
| 300 | Emdeon Inc., Class A, (2) | 3,936 | ||||||||||||
Hotels, Restaurants & Leisure – 0.7% | ||||||||||||||
| 100 | Brinker International Inc. | 2,446 | ||||||||||||
| 2,700 | Carnival Corporation | 101,601 | ||||||||||||
| 200 | Choice Hotels International, Inc. | 6,672 | ||||||||||||
| 400 | Hyatt Hotels Corporation, Class A, (2) | 16,328 | ||||||||||||
| 24,300 | McDonald’s Corporation | 2,048,976 | ||||||||||||
| Nuveen Investments | 45 |
Portfolio of Investments
Nuveen Multi-Manager Large-Cap Value Fund (continued)
June 30, 2011
| Shares | Description (1) | Value | ||||||||||||
Hotels, Restaurants & Leisure (continued) | ||||||||||||||
| 2,900 | MGM Mirage Inc., (2) | $ | 38,309 | |||||||||||
| 1,700 | Penn National Gaming, Inc., (2) | 68,578 | ||||||||||||
| 2,400 | Royal Caribbean Cruises Limited, (2) | 90,336 | ||||||||||||
| 2,400 | Wendy’s International, Inc. | 12,168 | ||||||||||||
| 2,800 | Wyndham Worldwide Corporation | 94,220 | ||||||||||||
Total Hotels, Restaurants & Leisure | 2,479,634 | |||||||||||||
Household Durables – 0.3% | ||||||||||||||
| 400 | D.R. Horton, Inc. | 4,608 | ||||||||||||
| 2,300 | Fortune Brands Inc. | 146,671 | ||||||||||||
| 400 | Garmin Limited | 13,212 | ||||||||||||
| 300 | Harman International Industries Inc., (2) | 13,671 | ||||||||||||
| 900 | Jarden Corporation | 31,059 | ||||||||||||
| 400 | Leggett and Platt Inc. | 9,752 | ||||||||||||
| 900 | Lennar Corporation, Class A | 16,335 | ||||||||||||
| 700 | Mohawk Industries Inc., (2) | 41,993 | ||||||||||||
| 2,000 | Newell Rubbermaid Inc. | 31,560 | ||||||||||||
| 300 | Toll Brothers Inc., (2) | 6,222 | ||||||||||||
| 8,551 | Whirlpool Corporation | 695,367 | ||||||||||||
Total Household Durables | 1,010,450 | |||||||||||||
Household Products – 0.6% | ||||||||||||||
| 600 | Church & Dwight Company Inc. | 24,324 | ||||||||||||
| 1,000 | Clorox Company | 67,440 | ||||||||||||
| 300 | Colgate-Palmolive Company | 26,223 | ||||||||||||
| 1,100 | Energizer Holdings Inc., (2) | 79,596 | ||||||||||||
| 400 | Kimberly-Clark Corporation | 26,624 | ||||||||||||
| 27,500 | Procter & Gamble Company | 1,748,175 | ||||||||||||
Total Household Products | 1,972,382 | |||||||||||||
Independent Power Producers & Energy Traders – 0.1% | ||||||||||||||
| 13,100 | AES Corporation, (2) | 166,894 | ||||||||||||
| 3,100 | Calpine Corporation, (2) | 50,003 | ||||||||||||
| 1,400 | Constellation Energy Group | 53,144 | ||||||||||||
| 3,100 | GenOn Energy Inc. | 11,966 | ||||||||||||
| 3,400 | NRG Energy Inc., (2) | 83,572 | ||||||||||||
Total Independent Power Producers & Energy Traders | 365,579 | |||||||||||||
Industrial Conglomerates – 1.7% | ||||||||||||||
| 700 | 3M Co. | 66,395 | ||||||||||||
| 800 | Carlisle Companies Inc. | 39,384 | ||||||||||||
| 288,950 | General Electric Company | 5,449,597 | ||||||||||||
| 7,100 | Tyco International Ltd. | 350,953 | ||||||||||||
Total Industrial Conglomerates | 5,906,329 | |||||||||||||
Industrial REIT – 0.2% | ||||||||||||||
| 7,800 | Prologis Inc. | 279,552 | ||||||||||||
Insurance – 7.0% | ||||||||||||||
| 44,000 | Ace Limited | 2,896,080 | ||||||||||||
| 5,700 | AFLAC Incorporated | 266,076 | ||||||||||||
| 100 | Alleghany Corporation, Term Loan, (2) | 33,311 | ||||||||||||
| 46 | Nuveen Investments |
| Shares | Description (1) | Value | ||||||||||||
Insurance (continued) | ||||||||||||||
| 900 | Allied World Assurance Holdings | $ | 51,822 | |||||||||||
| 7,900 | Allstate Corporation | 241,187 | ||||||||||||
| 1,500 | American Financial Group Inc. | 53,535 | ||||||||||||
| 7,600 | American International Group, (2) | 222,832 | ||||||||||||
| 100 | American National Insurance Company | 7,750 | ||||||||||||
| 71,710 | Aon Corporation | 3,678,723 | ||||||||||||
| 2,900 | Arch Capital Group Limited, (2) | 92,568 | ||||||||||||
| 1,400 | Arthur J. Gallagher & Co. | 39,956 | ||||||||||||
| 1,000 | Aspen Insurance Holdings Limited | 25,730 | ||||||||||||
| 1,400 | Assurant Inc. | 50,778 | ||||||||||||
| 1,600 | Assured Guaranty Limited | 26,096 | ||||||||||||
| 2,200 | Axis Capital Holdings Limited | 68,112 | ||||||||||||
| 13,600 | Berkshire Hathaway Inc., Class B, (2) | 1,052,504 | ||||||||||||
| 1,700 | Brown & Brown Inc. | 43,622 | ||||||||||||
| 5,200 | Chubb Corporation | 325,572 | ||||||||||||
| 2,500 | Cincinnati Financial Corporation | 72,950 | ||||||||||||
| 400 | CNA Financial Corporation, (2) | 11,620 | ||||||||||||
| 700 | Endurance Specialty Holdings Limited | 28,931 | ||||||||||||
| 900 | Everest Reinsurance Group Ltd | 73,575 | ||||||||||||
| 3,100 | Fidelity National Title Group Inc., Class A | 48,794 | ||||||||||||
| 6,200 | Genworth Financial Inc., Class A, (2) | 63,736 | ||||||||||||
| 600 | Hanover Insurance Group Inc. | 22,626 | ||||||||||||
| 53,310 | Hartford Financial Services Group, Inc. | 1,405,785 | ||||||||||||
| 2,000 | HCC Insurance Holdings Inc. | 63,000 | ||||||||||||
| 40,263 | Lincoln National Corporation | 1,147,093 | ||||||||||||
| 5,000 | Loews Corporation | 210,450 | ||||||||||||
| 100 | Markel Corporation, (2) | 39,681 | ||||||||||||
| 9,400 | Marsh & McLennan Companies, Inc. | 293,186 | ||||||||||||
| 2,300 | MBIA Inc., (2) | 19,987 | ||||||||||||
| 300 | Mercury General Corporation | 11,847 | ||||||||||||
| 89,900 | MetLife, Inc. | 3,943,913 | ||||||||||||
| 3,500 | Old Republic International Corporation | 41,125 | ||||||||||||
| 900 | PartnerRe Limited | 61,965 | ||||||||||||
| 4,900 | Principal Financial Group, Inc. | 149,058 | ||||||||||||
| 7,300 | Progressive Corporation | 156,074 | ||||||||||||
| 1,600 | Protective Life Corporation | 37,008 | ||||||||||||
| 23,630 | Prudential Financial, Inc. | 1,502,632 | ||||||||||||
| 21,680 | Reinsurance Group of America Inc. | 1,319,445 | ||||||||||||
| 900 | RenaisasnceRE Holdings, Limited | 62,955 | ||||||||||||
| 600 | StanCorp Financial Group Inc. | 25,314 | ||||||||||||
| 85,760 | Symetra Financial Corporation | 1,151,757 | ||||||||||||
| 1,700 | Torchmark Corporation | 109,038 | ||||||||||||
| 600 | Transatlantic Holdings Inc. | 29,406 | ||||||||||||
| 7,300 | Travelers Companies, Inc. | 426,174 | ||||||||||||
| 700 | Unitrin, Inc. | 20,769 | ||||||||||||
| Nuveen Investments | 47 |
Portfolio of Investments
Nuveen Multi-Manager Large-Cap Value Fund (continued)
June 30, 2011
| Shares | Description (1) | Value | ||||||||||||
Insurance (continued) | ||||||||||||||
| 5,400 | Unum Group | $ | 137,592 | |||||||||||
| 1,900 | Valdius Holdings Limited | 58,805 | ||||||||||||
| 100 | White Mountain Insurance Group | 42,016 | ||||||||||||
| 1,600 | WR Berkley Corporation | 51,904 | ||||||||||||
| 96,180 | XL Capital Ltd, Class A | 2,114,036 | ||||||||||||
Total Insurance | 24,130,501 | |||||||||||||
Internet & Catalog Retail – 0.2% | ||||||||||||||
| 800 | Expedia, Inc. | 23,192 | ||||||||||||
| 11,600 | Liberty Media Holding Corporation Interactive, Class A, (2) | 194,532 | ||||||||||||
Total Internet & Catalog Retail | 217,724 | |||||||||||||
Internet Software & Services – 0.1% | ||||||||||||||
| 1,200 | AOL Inc., (2) | 23,832 | ||||||||||||
| 7,800 | eBay Inc., (2) | 251,706 | ||||||||||||
| 1,500 | IAC/InterActiveCorp., (2) | 57,255 | ||||||||||||
| 3,300 | Yahoo! Inc., (2) | 49,632 | ||||||||||||
Total Internet Software & Services | 382,425 | |||||||||||||
IT Services – 1.0% | ||||||||||||||
| 8,100 | Accenture Limited | 489,402 | ||||||||||||
| 1,300 | Amdocs Limited, (2) | 39,507 | ||||||||||||
| 19,190 | Automatic Data Processing, Inc. | 1,010,929 | ||||||||||||
| 100 | Booz Allen Hamilton Holding | 1,911 | ||||||||||||
| 100 | Broadridge Financial Solutions, Inc. | 2,407 | ||||||||||||
| 2,100 | Computer Sciences Corporation | 79,716 | ||||||||||||
| 34,280 | CoreLogic Inc. | 572,819 | ||||||||||||
| 600 | DST Systems Inc. | 31,680 | ||||||||||||
| 2,700 | Fidelity National Information Services | 83,133 | ||||||||||||
| 300 | Fiserv, Inc., (2) | 18,789 | ||||||||||||
| 4,700 | International Business Machines Corporation (IBM) | 806,285 | ||||||||||||
| 200 | Paychex, Inc. | 6,144 | ||||||||||||
| 1,000 | SAIC, Inc., (2) | 16,820 | ||||||||||||
| 2,000 | Total System Services Inc. | 37,160 | ||||||||||||
| 1,400 | Visa Inc. | 117,964 | ||||||||||||
Total IT Services | 3,314,666 | |||||||||||||
Leisure Equipment & Products – 0.0% | ||||||||||||||
| 1,700 | Mattel, Inc. | 46,733 | ||||||||||||
Life Sciences Tools & Services – 0.1% | ||||||||||||||
| 300 | Bio-Rad Laboratories Inc., (2) | 35,808 | ||||||||||||
| 1,500 | Perkinelmer Inc. | 40,365 | ||||||||||||
| 1,000 | Qiagen NV | 19,020 | ||||||||||||
| 4,900 | Thermo Fisher Scientific, Inc., (2) | 315,511 | ||||||||||||
Total Life Sciences Tools & Services | 410,704 | |||||||||||||
Machinery – 1.6% | ||||||||||||||
| 2,200 | AGCO Corporation, (2) | 108,592 | ||||||||||||
| 10,530 | Caterpillar Inc. | 1,121,024 | ||||||||||||
| 900 | CNH Global N.V., (2) | 34,785 | ||||||||||||
| 48 | Nuveen Investments |
| Shares | Description (1) | Value | ||||||||||||
Machinery (continued) | ||||||||||||||
| 900 | Crane Company | $ | 44,469 | |||||||||||
| 600 | Dover Corporation | 40,680 | ||||||||||||
| 3,500 | Eaton Corporation | 180,075 | ||||||||||||
| 100 | Flowserve Corporation | 10,989 | ||||||||||||
| 1,300 | Harsco Corporation | 42,380 | ||||||||||||
| 100 | IDEX Corporation | 4,585 | ||||||||||||
| 300 | Illinois Tool Works, Inc. | 16,947 | ||||||||||||
| 800 | Ingersoll Rand Company Limited, Class A | 36,328 | ||||||||||||
| 1,100 | Kennametal Inc. | 46,431 | ||||||||||||
| 400 | Lincoln Electric Holdings Inc. | 14,340 | ||||||||||||
| 1,300 | Navistar International Corporation, (2) | 73,398 | ||||||||||||
| 24,550 | Oshkosh Truck Corporation, (2) | 710,477 | ||||||||||||
| 17,580 | Parker Hannifin Corporation | 1,577,629 | ||||||||||||
| 1,200 | Pentair, Inc. | 48,432 | ||||||||||||
| 700 | Snap-on Incorporated | 43,736 | ||||||||||||
| 500 | SPX Corporation | 41,330 | ||||||||||||
| 2,300 | Stanley Black & Decker Inc. | 165,715 | ||||||||||||
| 1,600 | Terex Corporation, (2) | 45,520 | ||||||||||||
| 22,100 | Timken Company | 1,113,840 | ||||||||||||
| 1,500 | Trinity Industries Inc. | 52,320 | ||||||||||||
Total Machinery | 5,574,022 | |||||||||||||
Marine – 0.0% | ||||||||||||||
| 800 | Alexander and Bald, Inc. | 38,528 | ||||||||||||
| 200 | Kirby Corporation, (2) | 11,334 | ||||||||||||
Total Marine | 49,862 | |||||||||||||
Media – 5.7% | ||||||||||||||
| 13,000 | CBS Corporation, Class B | 370,370 | ||||||||||||
| 1,100 | Clear Channel Outdoor Holdings Inc., Class A, (2) | 13,970 | ||||||||||||
| 143,040 | Comcast Corporation, Class A | 3,624,634 | ||||||||||||
| 300 | Dreamworks Animation SKG Inc., (2) | 6,030 | ||||||||||||
| 2,800 | Echostar Communications Corporation, Variable Prepaid Forward | 85,876 | ||||||||||||
| 3,200 | Gannett Company Inc. | 45,824 | ||||||||||||
| 4,200 | Interpublic Group Companies, Inc., (2) | 52,500 | ||||||||||||
| 500 | Lamar Advertising Company, (2) | 13,685 | ||||||||||||
| 2,500 | Liberty Media Holding Corporation, Capital Tracking Stock, Class A, (2) | 214,375 | ||||||||||||
| 22,180 | Liberty Media Starz, (2) | 1,668,823 | ||||||||||||
| 900 | Madison Square Garden Inc., (2) | 24,777 | ||||||||||||
| 900 | McGraw-Hill Companies, Inc. | 37,719 | ||||||||||||
| 36,600 | News Corporation, Class A | 647,820 | ||||||||||||
| 400 | Regal Entertainment Group, Class A | 4,940 | ||||||||||||
| 2,300 | Thomson Corporation | 86,388 | ||||||||||||
| 141,000 | Time Warner Inc. | 5,128,170 | ||||||||||||
| 109,620 | Viacom Inc., Class B | 5,590,620 | ||||||||||||
| 31,480 | Virgin Media, Inc. | 942,196 | ||||||||||||
| 24,100 | Walt Disney Company | 940,864 | ||||||||||||
| 100 | Washington Post Company | 41,895 | ||||||||||||
Total Media | 19,541,476 | |||||||||||||
| Nuveen Investments | 49 |
Portfolio of Investments
Nuveen Multi-Manager Large-Cap Value Fund (continued)
June 30, 2011
| Shares | Description (1) | Value | ||||||||||||
Metals & Mining – 0.8% | ||||||||||||||
| 100 | AK Steel Holding Corporation | $ | 1,576 | |||||||||||
| 17,100 | Alcoa Inc. | 271,206 | ||||||||||||
| 700 | Commercial Metals Company | 10,045 | ||||||||||||
| 40,406 | Freeport-McMoRan Copper & Gold, Inc. | 2,137,477 | ||||||||||||
| 2,100 | Newmont Mining Corporation | 113,337 | ||||||||||||
| 1,000 | Nucor Corporation | 41,220 | ||||||||||||
| 400 | Reliance Steel & Aluminum Company | 19,860 | ||||||||||||
| 100 | Schnitzer Steel Industries, Inc. | 5,760 | ||||||||||||
| 500 | Steel Dynamics Inc. | 8,125 | ||||||||||||
Total Metals & Mining | 2,608,606 | |||||||||||||
Mortgage REIT – 0.1% | ||||||||||||||
| 3,100 | American Capital Agency Corporation | 90,241 | ||||||||||||
| 19,800 | Annaly Capital Management Inc. | 357,192 | ||||||||||||
| 18,500 | Chimera Investments Corporation | 64,010 | ||||||||||||
Total Mortgage REIT | 511,443 | |||||||||||||
Multiline Retail – 0.7% | ||||||||||||||
| 1,000 | Big Lots, Inc., (2) | 33,150 | ||||||||||||
| 1,300 | Dillard’s, Inc., Class A | 67,782 | ||||||||||||
| 2,200 | J.C. Penney Company, Inc. | 75,988 | ||||||||||||
| 500 | Kohl’s Corporation, (2) | 25,005 | ||||||||||||
| 62,120 | Macy’s, Inc. | 1,816,389 | ||||||||||||
| 8,100 | Target Corporation | 379,971 | ||||||||||||
Total Multiline Retail | 2,398,285 | |||||||||||||
Multi-Utilities – 0.9% | ||||||||||||||
| 2,400 | Alliant Energy Corporation | 97,584 | ||||||||||||
| 5,400 | Ameren Corporation | 155,736 | ||||||||||||
| 10,100 | CenterPoint Energy, Inc. | 195,435 | ||||||||||||
| 6,500 | CMS Energy Corporation | 127,985 | ||||||||||||
| 6,500 | Consolidated Edison, Inc. | 346,060 | ||||||||||||
| 9,100 | Dominion Resources, Inc. | 439,257 | ||||||||||||
| 3,000 | DTE Energy Company | 150,060 | ||||||||||||
| 1,700 | Integrys Energy Group, Inc. | 88,128 | ||||||||||||
| 3,500 | MDU Resources Group Inc. | 78,750 | ||||||||||||
| 7,200 | NiSource Inc. | 145,800 | ||||||||||||
| 1,400 | NSTAR | 64,372 | ||||||||||||
| 2,000 | OGE Energy Corp. | 100,640 | ||||||||||||
| 4,800 | PG&E Corporation | 201,744 | ||||||||||||
| 7,800 | Public Service Enterprise Group Incorporated | 254,592 | ||||||||||||
| 2,000 | Scana Corporation | 78,740 | ||||||||||||
| 4,100 | Sempra Energy | 216,808 | ||||||||||||
| 4,400 | TECO Energy, Inc. | 83,116 | ||||||||||||
| 1,400 | Vectren Corporation | 39,004 | ||||||||||||
| 3,400 | Wisconsin Energy Corporation | 106,590 | ||||||||||||
| 8,700 | Xcel Energy, Inc. | 211,410 | ||||||||||||
Total Multi-Utilities | 3,181,811 | |||||||||||||
| 50 | Nuveen Investments |
| Shares | Description (1) | Value | ||||||||||||
Office Electronics – 0.0% | ||||||||||||||
| 15,600 | Xerox Corporation | $ | 162,396 | |||||||||||
Office REIT – 0.6% | ||||||||||||||
| 800 | Alexandria Real Estate Equities Inc. | 61,936 | ||||||||||||
| 400 | Boston Properties, Inc. | 42,464 | ||||||||||||
| 2,100 | Brandywine Realty Trust | 24,339 | ||||||||||||
| 1,300 | CommonWealth REIT | 33,592 | ||||||||||||
| 200 | Corporate Office Properties | 6,222 | ||||||||||||
| 24,130 | Digital Realty Trust Inc. | 1,490,751 | ||||||||||||
| 1,900 | Douglas Emmett Inc. | 37,791 | ||||||||||||
| 4,400 | Duke Realty Corporation | 61,644 | ||||||||||||
| 1,000 | Mack-Cali Realty Corporation | 32,940 | ||||||||||||
| 2,600 | Piedmont Office Realty Trust | 53,014 | ||||||||||||
| 1,300 | SL Green Realty Corporation | 107,731 | ||||||||||||
Total Office REIT | 1,952,424 | |||||||||||||
Oil, Gas & Consumable Fuels – 12.5% | ||||||||||||||
| 1,700 | Alpha Natural Resources Inc., (2) | 77,248 | ||||||||||||
| 6,900 | Anadarko Petroleum Corporation | 529,644 | ||||||||||||
| 17,860 | Apache Corporation | 2,203,745 | ||||||||||||
| 32,050 | Arch Coal Inc. | 854,453 | ||||||||||||
| 16,600 | Chesapeake Energy Corporation | 492,854 | ||||||||||||
| 63,300 | Chevron Corporation | 6,509,772 | ||||||||||||
| 600 | Cimarex Energy Company | 53,952 | ||||||||||||
| 200 | Cobalt International Energy, Inc., (2) | 2,726 | ||||||||||||
| 85,640 | ConocoPhillips | 6,439,272 | ||||||||||||
| 900 | Denbury Resources Inc., (2) | 18,000 | ||||||||||||
| 28,750 | Devon Energy Corporation | 2,265,788 | ||||||||||||
| 49,870 | El Paso Corporation | 1,007,374 | ||||||||||||
| 1,500 | Energen Corporation | 84,750 | ||||||||||||
| 1,200 | EQT Corporation | 63,024 | ||||||||||||
| 600 | Exco Resources Inc. | 10,590 | ||||||||||||
| 36,600 | Exxon Mobil Corporation | 2,978,508 | ||||||||||||
| 2,600 | Forest Oil Corporation, (2) | 69,446 | ||||||||||||
| 24,990 | Hess Corporation | 1,868,252 | ||||||||||||
| 200 | Kinder Morgan, Inc. | 5,746 | ||||||||||||
| 84,250 | Marathon Oil Corporation | 4,438,290 | ||||||||||||
| 3,400 | Murphy Oil Corporation | 223,244 | ||||||||||||
| 22,120 | Newfield Exploration Company, (2) | 1,504,602 | ||||||||||||
| 2,200 | Noble Energy, Inc. | 197,186 | ||||||||||||
| 50,483 | Occidental Petroleum Corporation | 5,252,251 | ||||||||||||
| 18,440 | Peabody Energy Corporation | 1,086,300 | ||||||||||||
| 800 | Petrohawk Energy Corporation, (2) | 19,736 | ||||||||||||
| 300 | Pioneer Natural Resources Company | 26,871 | ||||||||||||
| 4,300 | Plains Exploration & Production Company, (2) | 163,916 | ||||||||||||
| 31,770 | QEP Resources Inc., (2) | 1,328,939 | ||||||||||||
| 3,100 | Quicksilver Resources Inc., (2) | 45,756 | ||||||||||||
| 17,040 | Range Resources Corporation | 945,720 | ||||||||||||
| Nuveen Investments | 51 |
Portfolio of Investments
Nuveen Multi-Manager Large-Cap Value Fund (continued)
June 30, 2011
| Shares | Description (1) | Value | ||||||||||||
Oil, Gas & Consumable Fuels (continued) | ||||||||||||||
| 200 | SM Energy Company | $ | 14,696 | |||||||||||
| 1,400 | Southern Union Company | 56,210 | ||||||||||||
| 12,100 | Spectra Energy Corporation | 331,661 | ||||||||||||
| 3,100 | Sunoco, Inc. | 129,301 | ||||||||||||
| 1,100 | Teekay Shipping Corporation | 33,968 | ||||||||||||
| 43,540 | Tesoro Corporation | 997,501 | ||||||||||||
| 16,800 | Valero Energy Corporation | 429,576 | ||||||||||||
| 16,300 | Williams Companies, Inc. | 493,075 | ||||||||||||
Total Oil, Gas & Consumable Fuels | 43,253,943 | |||||||||||||
Paper & Forest Products – 0.3% | ||||||||||||||
| 7,900 | Domtar Corporation | 748,288 | ||||||||||||
| 10,100 | International Paper Company | 301,182 | ||||||||||||
| 3,200 | MeadWestvaco Corporation | 106,592 | ||||||||||||
Total Paper & Forest Products | 1,156,062 | |||||||||||||
Pharmaceuticals – 10.8% | ||||||||||||||
| 600 | Abbott Laboratories | 31,572 | ||||||||||||
| 76,811 | Bristol-Myers Squibb Company | 2,224,447 | ||||||||||||
| 16,900 | Eli Lilly and Company | 634,257 | ||||||||||||
| 4,300 | Forest Laboratories, Inc., (2) | 169,162 | ||||||||||||
| 12,600 | Hospira Inc., (2) | 713,916 | ||||||||||||
| 120,460 | Johnson & Johnson | 8,012,998 | ||||||||||||
| 211,289 | Merck & Company Inc. | 7,456,388 | ||||||||||||
| 300 | Mylan Laboratories Inc., (2) | 7,401 | ||||||||||||
| 559,740 | Pfizer Inc. | 11,530,643 | ||||||||||||
| 103,850 | Sanofi-Aventis, ADR | 4,171,655 | ||||||||||||
| 1,500 | Warner Chilcott Limited, (2) | 36,195 | ||||||||||||
| 33,520 | Watson Pharmaceuticals Inc., (2) | 2,303,830 | ||||||||||||
Total Pharmaceuticals | 37,292,464 | |||||||||||||
Professional Services – 0.0% | ||||||||||||||
| 1,500 | Equifax Inc. | 52,080 | ||||||||||||
| 1,200 | Manpower Inc. | 64,380 | ||||||||||||
| 600 | Towers Watson & Company, Class A Shares | 39,426 | ||||||||||||
Total Professional Services | 155,886 | |||||||||||||
Real Estate Management & Development – 0.0% | ||||||||||||||
| 700 | Howard Hughes Corporation | 45,528 | ||||||||||||
| 2,500 | Forest City Enterprises, Inc., (2) | 46,675 | ||||||||||||
| 100 | Jones Lang LaSalle Inc. | 9,430 | ||||||||||||
Total Real Estate Management & Development | 101,633 | |||||||||||||
Residential REIT – 0.4% | ||||||||||||||
| 400 | Apartment Investment & Management Company, Class A | 10,212 | ||||||||||||
| 1,300 | AvalonBay Communities, Inc. | 166,920 | ||||||||||||
| 900 | BRE Properties, Inc. | 44,892 | ||||||||||||
| 11,310 | Camden Property Trust | 719,542 | ||||||||||||
| 4,400 | Equity Residential | 264,000 | ||||||||||||
| 200 | Essex Property Trust Inc. | 27,058 | ||||||||||||
| 2,300 | UDR Inc. | 56,465 | ||||||||||||
Total Residential REIT | 1,289,089 | |||||||||||||
| 52 | Nuveen Investments |
| Shares | Description (1) | Value | ||||||||||||
Retail REIT – 0.2% | ||||||||||||||
| 2,300 | Developers Diversified Realty Corporation | $ | 32,430 | |||||||||||
| 100 | Federal Realty Investment Trust | 8,518 | ||||||||||||
| 10,400 | General Growth Properties Inc. | 173,576 | ||||||||||||
| 7,200 | Kimco Realty Corporation | 134,208 | ||||||||||||
| 1,300 | Macerich Company | 69,550 | ||||||||||||
| 1,600 | Realty Income Corporation | 53,584 | ||||||||||||
| 1,300 | Regency Centers Corporation | 57,161 | ||||||||||||
| 700 | Simon Property Group, Inc. | 81,361 | ||||||||||||
| 1,000 | Taubman Centers Inc. | 59,200 | ||||||||||||
| 2,000 | Weingarten Realty Trust | 50,320 | ||||||||||||
Total Retail REIT | 719,908 | |||||||||||||
Road & Rail – 1.3% | ||||||||||||||
| 400 | Con-Way, Inc. | 15,524 | ||||||||||||
| 91,830 | CSX Corporation | 2,407,783 | ||||||||||||
| 16,290 | Kansas City Southern Industries, (2) | 966,486 | ||||||||||||
| 4,800 | Norfolk Southern Corporation | 359,664 | ||||||||||||
| 1,000 | Ryder System, Inc. | 56,850 | ||||||||||||
| 6,800 | Union Pacific Corporation | 709,920 | ||||||||||||
Total Road & Rail | 4,516,227 | |||||||||||||
Semiconductors & Equipment – 2.3% | ||||||||||||||
| 161,400 | Applied Materials, Inc. | 2,099,814 | ||||||||||||
| 800 | Atmel Corporation, (2) | 11,256 | ||||||||||||
| 5,400 | Fairchild Semiconductor International Inc., Class A, (2) | 90,234 | ||||||||||||
| 95,540 | Intel Corporation | 2,117,166 | ||||||||||||
| 1,300 | International Rectifier Corporation, (2) | 36,361 | ||||||||||||
| 600 | Intersil Holding Corporation, Class A | 7,710 | ||||||||||||
| 1,200 | KLA-Tencor Corporation | 48,576 | ||||||||||||
| 6,400 | LSI Logic Corporation, (2) | 45,568 | ||||||||||||
| 3,000 | Marvell Technology Group Ltd., (2) | 44,295 | ||||||||||||
| 100 | MEMC Electronic Materials, (2) | 853 | ||||||||||||
| 49,900 | Micron Technology, Inc., (2) | 373,252 | ||||||||||||
| 300 | National Semiconductor Corporation | 7,383 | ||||||||||||
| 2,100 | Novellus Systems, Inc., (2) | 75,894 | ||||||||||||
| 3,500 | SunPower Corporation, (2) | 67,655 | ||||||||||||
| 7,000 | Teradyne Inc., (2) | 103,600 | ||||||||||||
| 87,950 | Texas Instruments Incorporated | 2,887,399 | ||||||||||||
Total Semiconductors & Equipment | 8,017,016 | |||||||||||||
Software – 2.0% | ||||||||||||||
| 2,400 | Activision Blizzard Inc. | 28,032 | ||||||||||||
| 2,100 | CA Inc. | 47,964 | ||||||||||||
| 500 | Compuware Corporation, (2) | 4,880 | ||||||||||||
| 261,110 | Microsoft Corporation | 6,788,859 | ||||||||||||
| 1,700 | Synopsys Inc., (2) | 43,707 | ||||||||||||
Total Software | 6,913,442 | |||||||||||||
| Nuveen Investments | 53 |
Portfolio of Investments
Nuveen Multi-Manager Large-Cap Value Fund (continued)
June 30, 2011
| Shares | Description (1) | Value | ||||||||||||
Specialized REIT – 0.6% | ||||||||||||||
| 6,100 | Health Care Property Investors Inc. | $ | 223,809 | |||||||||||
| 2,700 | Health Care REIT, Inc. | 141,561 | ||||||||||||
| 1,900 | Hospitality Properties Trust | 46,075 | ||||||||||||
| 5,600 | Host Hotels & Resorts Inc. | 94,920 | ||||||||||||
| 2,000 | Nationwide Health Properties, Inc. | 82,820 | ||||||||||||
| 600 | Plum Creek Timber Company | 24,324 | ||||||||||||
| 100 | Public Storage, Inc. | 11,401 | ||||||||||||
| 16,520 | Rayonier Inc. | 1,079,582 | ||||||||||||
| 2,300 | Senior Housing Properties Trust | 53,843 | ||||||||||||
| 9,600 | Weyerhaeuser Company | 209,856 | ||||||||||||
Total Specialized REIT | 1,968,191 | |||||||||||||
Specialty Retail – 1.5% | ||||||||||||||
| 400 | Aaron Rents Inc. | 11,304 | ||||||||||||
| 300 | Abercrombie & Fitch Co., Class A | 20,076 | ||||||||||||
| 3,700 | American Eagle Outfitters, Inc. | 47,175 | ||||||||||||
| 400 | AutoNation Inc., (2) | 14,644 | ||||||||||||
| 4,900 | Best Buy Co., Inc. | 153,909 | ||||||||||||
| 1,900 | CarMax, Inc., (2) | 62,833 | ||||||||||||
| 600 | Chico’s FAS, Inc. | 9,138 | ||||||||||||
| 3,500 | Foot Locker, Inc. | 83,160 | ||||||||||||
| 5,000 | GameStop Corporation, (2) | 133,350 | ||||||||||||
| 8,100 | Gap, Inc. | 146,610 | ||||||||||||
| 3,600 | Home Depot, Inc. | 130,392 | ||||||||||||
| 133,250 | Lowe’s Companies, Inc. | 3,106,058 | ||||||||||||
| 2,600 | RadioShack Corporation | 34,606 | ||||||||||||
| 100 | Sally Beauty Holdings Inc. | 1,710 | ||||||||||||
| 1,400 | Signet Jewelers Limited, (2) | 65,534 | ||||||||||||
| 79,400 | Staples, Inc. | 1,254,520 | ||||||||||||
| 600 | Williams-Sonoma Inc. | 21,894 | ||||||||||||
Total Specialty Retail | 5,296,913 | |||||||||||||
Thrifts & Mortgage Finance – 0.1% | ||||||||||||||
| 300 | BankUnited Inc. | 7,962 | ||||||||||||
| 1,100 | Capitol Federal Financial Inc. | 12,936 | ||||||||||||
| 3,400 | First Niagara Financial Group Inc. | 44,880 | ||||||||||||
| 5,700 | Hudson City Bancorp, Inc. | 46,683 | ||||||||||||
| 8,100 | New York Community Bancorp Inc. | 121,419 | ||||||||||||
| 1,900 | People’s United Financial, Inc. | 25,536 | ||||||||||||
| 600 | TFS Financial Corporation | 5,808 | ||||||||||||
| 1,200 | Washington Federal Inc. | 19,716 | ||||||||||||
Total Thrifts & Mortgage Finance | 284,940 | |||||||||||||
Tobacco – 0.7% | ||||||||||||||
| 11,600 | Altria Group, Inc. | 306,356 | ||||||||||||
| 3,300 | Lorillard Inc. | 359,271 | ||||||||||||
| 24,473 | Philip Morris International | 1,634,062 | ||||||||||||
| 5,400 | Reynolds American Inc. | 200,070 | ||||||||||||
Total Tobacco | 2,499,759 | |||||||||||||
| 54 | Nuveen Investments |
| Shares | Description (1) | Value | ||||||||||||||||
Trading Companies & Distributors – 0.0% | ||||||||||||||||||
| 200 | Air Lease Corporation | $ | 4,858 | |||||||||||||||
| 1,100 | GATX Corporation | 40,832 | ||||||||||||||||
| 400 | WESCO International Inc., (2) | 21,636 | ||||||||||||||||
Total Trading Companies & Distributors | 67,326 | |||||||||||||||||
Water Utilities – 0.0% | ||||||||||||||||||
| 4,300 | American Water Works Company | 126,635 | ||||||||||||||||
| 1,900 | Aqua America Inc. | 41,762 | ||||||||||||||||
Total Water Utilities | 168,397 | |||||||||||||||||
Wireless Telecommunication Services – 1.3% | ||||||||||||||||||
| 1,300 | NII Holdings Inc., Class B, (2) | 55,094 | ||||||||||||||||
| 65,500 | Sprint Nextel Corporation, (2) | 353,045 | ||||||||||||||||
| 1,200 | Telephone and Data Systems Inc. | 37,296 | ||||||||||||||||
| 200 | United States Cellular Corporation, (2) | 9,684 | ||||||||||||||||
| 150,150 | Vodafone Group PLC, Sponsored ADR | 4,012,008 | ||||||||||||||||
Total Wireless Telecommunication Services | 4,467,127 | |||||||||||||||||
Total Common Stocks (cost $283,313,393) | 338,919,334 | |||||||||||||||||
| Shares | Description (1) | Value | ||||||||||||||||
INVESTMENT COMPANIES – 1.0% | ||||||||||||||||||
| 50,000 | I-Shares Russell 1000 Value Index Fund | $ | 3,414,000 | |||||||||||||||
Total Investment Companies (cost $3,032,350) | 3,414,000 | |||||||||||||||||
| Principal Amount (000) | Description (1) | Coupon | Maturity | Value | ||||||||||||||
SHORT-TERM INVESTMENTS – 0.8% | ||||||||||||||||||
| $ | 2,793 | Repurchase Agreement with Fixed Income Clearing Corporation, dated 6/30/11, repurchase price $2,792,819, collateralized by $2,790,000 U.S. Treasury Notes, 1.500%, due 12/31/13, value $2,852,775 | 0.010% | 7/01/11 | $ | 2,792,818 | ||||||||||||
Total Short-Term Investments (cost $2,792,818) | 2,792,818 | |||||||||||||||||
Total Investments (cost $289,138,561) – 100.1% | 345,126,152 | |||||||||||||||||
Other Assets Less Liabilities – (0.1)% | (441,433) | |||||||||||||||||
Net Assets – 100% | $ | 344,684,719 | ||||||||||||||||
| For Fund portfolio compliance purposes, the Fund’s industry classifications refer to any one or more of the industry sub-classifications used by one or more widely recognized market indexes or ratings group indexes, and/or as defined by Fund management. This definition may not apply for purposes of this report, which may combine industry sub-classifications into sectors for reporting ease. |
| (1) | All percentages shown in the Portfolio of Investments are based on net assets. |
| (2) | Non-income producing; issuer has not declared a dividend within the past twelve months. |
| ADR | American Depositary Receipt. |
See accompanying notes to financial statements.
| Nuveen Investments | 55 |
Portfolio of Investments
Nuveen NWQ Multi-Cap Value Fund
June 30, 2011
| Shares | Description (1) | Value | ||||||||||||
COMMON STOCKS – 96.1% | ||||||||||||||
Automobiles – 1.7% | ||||||||||||||
| 202,700 | General Motors Company, (2) | $ | 6,153,972 | |||||||||||
Biotechnology – 3.7% | ||||||||||||||
| 234,900 | Amgen Inc., (2) | 13,706,415 | ||||||||||||
Capital Markets – 1.4% | ||||||||||||||
| 1,553,600 | FBR Capital Markets Corporation, (2) | 5,282,240 | ||||||||||||
Commercial Banks – 1.6% | ||||||||||||||
| 430,000 | Privatebancorp, Inc. | 5,934,000 | ||||||||||||
Commercial Services & Supplies – 1.3% | ||||||||||||||
| 211,000 | Pitney Bowes Inc. | 4,850,890 | ||||||||||||
Communications Equipment – 4.9% | ||||||||||||||
| 334,900 | Motorola Mobility Holdings Inc., (2) | 7,381,196 | ||||||||||||
| 231,000 | Motorola Solutions Inc., (2) | 10,635,240 | ||||||||||||
Total Communications Equipment | 18,016,436 | |||||||||||||
Diversified Financial Services – 5.4% | ||||||||||||||
| 306,900 | Citigroup Inc. | 12,779,316 | ||||||||||||
| 170,000 | JP Morgan Chase & Co. | 6,959,800 | ||||||||||||
Total Diversified Financial Services | 19,739,116 | |||||||||||||
Independent Power Producers & Energy Traders – 1.3% | ||||||||||||||
| 187,600 | NRG Energy Inc., (2) | 4,611,208 | ||||||||||||
Insurance – 15.5% | ||||||||||||||
| 187,000 | Aon Corporation | 9,593,100 | ||||||||||||
| 800,000 | Genworth Financial Inc., Class A, (2) | 8,224,000 | ||||||||||||
| 350,000 | Hartford Financial Services Group, Inc. | 9,229,500 | ||||||||||||
| 207,000 | Loews Corporation | 8,712,630 | ||||||||||||
| 158,987 | Reinsurance Group of America Inc. | 9,675,949 | ||||||||||||
| 450,000 | Unum Group | 11,466,000 | ||||||||||||
Total Insurance | 56,901,179 | |||||||||||||
IT Services – 1.7% | ||||||||||||||
| 460,000 | Convergys Corporation, (2) | 6,274,400 | ||||||||||||
Machinery – 3.1% | ||||||||||||||
| 145,000 | Ingersoll Rand Company Limited, Class A | 6,584,450 | ||||||||||||
| 135,000 | Trinity Industries Inc. | 4,708,800 | ||||||||||||
Total Machinery | 11,293,250 | |||||||||||||
Media – 7.1% | ||||||||||||||
| 752,000 | Interpublic Group Companies, Inc. | 9,400,000 | ||||||||||||
| 326,997 | Viacom Inc., Class B | 16,676,847 | ||||||||||||
Total Media | 26,076,847 | |||||||||||||
Metals & Mining – 8.5% | ||||||||||||||
| 311,199 | AngloGold Ashanti Limited, Sponsored ADR | 13,098,366 | ||||||||||||
| 449,000 | Aurizon Mines Ltd, (2) | 2,509,910 | ||||||||||||
| 215,600 | Barrick Gold Corporation | 9,764,524 | ||||||||||||
| 2,247,200 | Northgate Minerals Corporation, (2) | 5,842,720 | ||||||||||||
Total Metals & Mining | 31,215,520 | |||||||||||||
| 56 | Nuveen Investments |
| Shares | Description (1) | Value | ||||||||||||||||
Mortgage REIT – 2.3% | ||||||||||||||||||
| 550,000 | Redwood Trust Inc. | $ | 8,316,000 | |||||||||||||||
Oil, Gas & Consumable Fuels – 12.5% | ||||||||||||||||||
| 118,500 | Apache Corporation | 14,621,715 | ||||||||||||||||
| 399,700 | Denbury Resources Inc., (2) | 7,994,000 | ||||||||||||||||
| 70,000 | Hess Corporation | 5,233,200 | ||||||||||||||||
| 53,000 | Noble Energy, Inc. | 4,750,390 | ||||||||||||||||
| 305,000 | Petrohawk Energy Corporation, (2) | 7,524,350 | ||||||||||||||||
| 280,000 | Talisman Energy Inc. | 5,737,200 | ||||||||||||||||
Total Oil, Gas & Consumable Fuels | 45,860,855 | |||||||||||||||||
Pharmaceuticals – 11.9% | ||||||||||||||||||
| 137,000 | Merck & Company Inc. | 4,834,730 | ||||||||||||||||
| 797,200 | Pfizer Inc. | 16,422,320 | ||||||||||||||||
| 63,900 | Salix Pharmaceuticals Limited, (2) | 2,545,137 | ||||||||||||||||
| 352,000 | Sanofi-Aventis | 14,139,840 | ||||||||||||||||
| 121,000 | Teva Pharmaceutical Industries Limited, Sponsored ADR | 5,834,620 | ||||||||||||||||
Total Pharmaceuticals | 43,776,647 | |||||||||||||||||
Semiconductors & Equipment – 4.6% | ||||||||||||||||||
| 1,200,044 | Mattson Technology, Inc., (2) | 2,280,084 | ||||||||||||||||
| 168,650 | MKS Instruments Inc. | 4,455,733 | ||||||||||||||||
| 1,345,200 | PMC-Sierra, Inc., (2) | 10,183,164 | ||||||||||||||||
Total Semiconductors & Equipment | 16,918,981 | |||||||||||||||||
Software – 6.6% | ||||||||||||||||||
| 1,058,577 | CA Inc. | 24,177,898 | ||||||||||||||||
Tobacco – 1.0% | ||||||||||||||||||
| 55,000 | Philip Morris International | 3,672,350 | ||||||||||||||||
Total Common Stocks (cost $294,474,297) | 352,778,204 | |||||||||||||||||
| Principal Amount (000) | Description (1) | Coupon | Maturity | Value | ||||||||||||||
SHORT-TERM INVESTMENTS – 2.5% | ||||||||||||||||||
| $ | 9,054 | Repurchase Agreement with Fixed Income Clearing Corporation, dated 6/30/11, repurchase price $9,054,460, collateralized by $9,035,000 U.S. Treasury Notes, 1.500%, due 12/31/13, value $9,238,288 | 0.010% | 7/01/11 | $ | 9,054,457 | ||||||||||||
Total Short-Term Investments (cost $9,054,457) | 9,054,457 | |||||||||||||||||
Total Investments (cost $303,528,754) – 98.6% | 361,832,661 | |||||||||||||||||
Other Assets Less Liabilities – 1.4% | 5,181,274 | |||||||||||||||||
Net Assets – 100% | $ | 367,013,935 | ||||||||||||||||
| For Fund portfolio compliance purposes, the Fund’s industry classifications refer to any one or more of the industry sub-classifications used by one or more widely recognized market indexes or ratings group indexes, and/or as defined by Fund management. This definition may not apply for purposes of this report, which may combine industry sub-classifications into sectors for reporting ease. |
| (1) | All percentages shown in the Portfolio of Investments are based on net assets. |
| (2) | Non-income producing; issuer has not declared a dividend within the past twelve months. |
| ADR | American Depositary Receipt. |
See accompanying notes to financial statements.
| Nuveen Investments | 57 |
Portfolio of Investments
Nuveen NWQ Large-Cap Value Fund
June 30, 2011
| Shares | Description (1) | Value | ||||||||||||
COMMON STOCKS – 96.9% | ||||||||||||||
Aerospace & Defense – 2.7% | ||||||||||||||
| 83,570 | Lockheed Martin Corporation | $ | 6,766,663 | |||||||||||
| 96,730 | Raytheon Company | 4,821,991 | ||||||||||||
Total Aerospace & Defense | 11,588,654 | |||||||||||||
Automobiles – 1.9% | ||||||||||||||
| 266,000 | General Motors Company, (2) | 8,075,760 | ||||||||||||
Biotechnology – 4.0% | ||||||||||||||
| 296,020 | Amgen Inc., (2) | 17,272,767 | ||||||||||||
Capital Markets – 2.4% | ||||||||||||||
| 78,600 | Goldman Sachs Group, Inc. | 10,460,874 | ||||||||||||
Commercial Banks – 2.4% | ||||||||||||||
| 368,630 | Wells Fargo & Company | 10,343,758 | ||||||||||||
Commercial Services & Supplies – 1.0% | ||||||||||||||
| 205,830 | Pitney Bowes Inc. | 4,732,032 | ||||||||||||
Communications Equipment – 6.2% | ||||||||||||||
| 369,500 | Cisco Systems, Inc. | 5,767,895 | ||||||||||||
| 444,590 | Motorola Mobility Holdings Inc., (2) | 9,798,764 | ||||||||||||
| 247,648 | Motorola Solutions Inc., (2) | 11,401,714 | ||||||||||||
Total Communications Equipment | 26,968,373 | |||||||||||||
Diversified Financial Services – 5.4% | ||||||||||||||
| 383,120 | Citigroup Inc. | 15,953,117 | ||||||||||||
| 183,970 | JP Morgan Chase & Co. | 7,531,732 | ||||||||||||
Total Diversified Financial Services | 23,484,849 | |||||||||||||
Energy Equipment & Services – 1.0% | ||||||||||||||
| 97,210 | Halliburton Company | 4,957,710 | ||||||||||||
Food & Staples Retailing – 1.6% | ||||||||||||||
| 180,400 | CVS Caremark Corporation | 6,779,432 | ||||||||||||
Independent Power Producers & Energy Traders – 1.1% | ||||||||||||||
| 211,250 | NRG Energy Inc., (2) | 5,192,525 | ||||||||||||
Insurance – 16.4% | ||||||||||||||
| 174,110 | Aon Corporation | 8,931,843 | ||||||||||||
| 937,280 | Genworth Financial Inc., Class A, (2) | 9,635,238 | ||||||||||||
| 406,910 | Hartford Financial Services Group, Inc. | 10,730,217 | ||||||||||||
| 215,400 | Lincoln National Corporation | 6,136,746 | ||||||||||||
| 245,031 | Loews Corporation | 10,313,355 | ||||||||||||
| 322,680 | MetLife, Inc. | 14,155,972 | ||||||||||||
| 449,780 | Unum Group | 11,460,394 | ||||||||||||
Total Insurance | 71,363,765 | |||||||||||||
Machinery – 1.8% | ||||||||||||||
| 169,270 | Ingersoll Rand Company Limited, Class A | 7,686,551 | ||||||||||||
Media – 7.8% | ||||||||||||||
| 499,590 | Interpublic Group Companies, Inc. | 6,244,875 | ||||||||||||
| 274,900 | Time Warner Inc. | 9,998,113 | ||||||||||||
| 348,220 | Viacom Inc., Class B | 17,759,220 | ||||||||||||
Total Media | 34,002,208 | |||||||||||||
| 58 | Nuveen Investments |
| Shares | Description (1) | Value | ||||||||||||||||
Metals & Mining – 6.4% | ||||||||||||||||||
| 414,151 | AngloGold Ashanti Limited, Sponsored ADR | $ | 17,431,616 | |||||||||||||||
| 233,690 | Barrick Gold Corporation | 10,583,820 | ||||||||||||||||
Total Metals & Mining | 28,015,436 | |||||||||||||||||
Oil, Gas & Consumable Fuels – 13.5% | ||||||||||||||||||
| 148,030 | Apache Corporation | 18,265,422 | ||||||||||||||||
| 237,460 | Canadian Natural Resources Limited | 9,940,076 | ||||||||||||||||
| 110,130 | Hess Corporation | 8,233,319 | ||||||||||||||||
| 85,800 | Noble Energy, Inc. | 7,690,254 | ||||||||||||||||
| 62,295 | Occidental Petroleum Corporation | 6,481,172 | ||||||||||||||||
| 406,670 | Talisman Energy Inc. | 8,332,668 | ||||||||||||||||
Total Oil, Gas & Consumable Fuels | 58,942,911 | |||||||||||||||||
Pharmaceuticals – 10.7% | ||||||||||||||||||
| 148,960 | Merck & Company Inc. | 5,256,798 | ||||||||||||||||
| 870,540 | Pfizer Inc. | 17,933,124 | ||||||||||||||||
| 417,930 | Sanofi-Aventis | 16,788,248 | ||||||||||||||||
| 143,200 | Teva Pharmaceutical Industries Limited, Sponsored ADR | 6,905,104 | ||||||||||||||||
Total Pharmaceuticals | 46,883,274 | |||||||||||||||||
Road & Rail – 1.4% | ||||||||||||||||||
| 58,040 | Union Pacific Corporation | 6,059,376 | ||||||||||||||||
Software – 7.9% | ||||||||||||||||||
| 1,155,400 | CA Inc. | 26,389,333 | ||||||||||||||||
| 303,810 | Microsoft Corporation | 7,899,060 | ||||||||||||||||
Total Software | 34,288,393 | |||||||||||||||||
Tobacco – 1.3% | ||||||||||||||||||
| 82,220 | Philip Morris International | 5,489,829 | ||||||||||||||||
Total Common Stocks (cost $375,510,451) | 422,588,477 | |||||||||||||||||
| Principal Amount (000) | Description (1) | Coupon | Maturity | Value | ||||||||||||||
SHORT-TERM INVESTMENTS – 3.5% | ||||||||||||||||||
| $ | 15,439 | Repurchase Agreement with State Street Bank, dated 6/30/11, repurchase price $15,438,505, collateralized by $15,640,000 U.S. Treasury Notes, 1.750%, due 5/31/16, value $15,747,353 | 0.010% | 7/01/11 | $ | 15,438,501 | ||||||||||||
Total Short-Term Investments (cost $15,438,501) | 15,438,501 | |||||||||||||||||
Total Investments (cost $390,948,952) – 100.4% | 438,026,978 | |||||||||||||||||
Other Assets Less Liabilities – (0.4)% | (1,729,197) | |||||||||||||||||
Net Assets – 100% | $ | 436,297,781 | ||||||||||||||||
| For Fund portfolio compliance purposes, the Fund’s industry classifications refer to any one or more of the industry sub-classifications used by one or more widely recognized market indexes or ratings group indexes, and/or as defined by Fund management. This definition may not apply for purposes of this report, which may combine industry sub-classifications into sectors for reporting ease. |
| (1) | All percentages shown in the Portfolio of Investments are based on net assets. |
| (2) | Non-income producing; issuer has not declared a dividend within the past twelve months. |
| ADR | American Depositary Receipt. |
See accompanying notes to financial statements.
| Nuveen Investments | 59 |
Portfolio of Investments
Nuveen NWQ Small/Mid-Cap Value Fund
June 30, 2011
| Shares | Description (1) | Value | ||||||||||||
Aerospace & Defense – 1.9% | ||||||||||||||
| 24,550 | Orbital Sciences Corporation, (2) | $ | 413,668 | |||||||||||
Building Products – 3.4% | ||||||||||||||
| 71,450 | Griffon Corporation, (2) | 720,216 | ||||||||||||
Chemicals – 1.0% | ||||||||||||||
| 6,500 | Interpid Potash Inc., (2) | 211,250 | ||||||||||||
Commercial Banks – 3.7% | ||||||||||||||
| 17,500 | Texas Capital BancShares, Inc., (2) | 452,025 | ||||||||||||
| 46,550 | Western Alliance Bancorporation, (2) | 330,505 | ||||||||||||
Total Commercial Banks | 782,530 | |||||||||||||
Commercial Services & Supplies – 1.3% | ||||||||||||||
| 17,100 | Schawk Inc. | 283,176 | ||||||||||||
Communications Equipment – 3.4% | ||||||||||||||
| 113,850 | Brocade Communications Systems Inc., (2) | 735,471 | ||||||||||||
Containers & Packaging – 3.0% | ||||||||||||||
| 8,150 | Packaging Corp. of America | 228,119 | ||||||||||||
| 13,900 | Temple-Inland Inc. | 413,386 | ||||||||||||
Total Containers & Packaging | 641,505 | |||||||||||||
Electrical Equipment – 4.4% | ||||||||||||||
| 9,400 | Belden Inc. | 327,684 | ||||||||||||
| 30,100 | GrafTech International Ltd., (2) | 610,127 | ||||||||||||
Total Electrical Equipment | 937,811 | |||||||||||||
Electronic Equipment & Instruments – 8.7% | ||||||||||||||
| 16,250 | Arrow Electronics, Inc., (2) | 674,375 | ||||||||||||
| 19,950 | Avnet Inc., (2) | 636,006 | ||||||||||||
| 9,750 | Coherent Inc., (2) | 538,883 | ||||||||||||
Total Electronic Equipment & Instruments | 1,849,264 | |||||||||||||
Food & Staples Retailing – 1.3% | ||||||||||||||
| 6,150 | Casey’s General Stores, Inc. | 270,600 | ||||||||||||
Food Products – 5.5% | ||||||||||||||
| 21,200 | Hormel Foods Corporation | 631,972 | ||||||||||||
| 9,783 | Treehouse Foods Inc., (2) | 534,250 | ||||||||||||
Total Food Products | 1,166,222 | |||||||||||||
Hotels, Restaurants & Leisure – 4.7% | ||||||||||||||
| 28,650 | Bob Evans Farms | 1,001,891 | ||||||||||||
Insurance – 8.7% | ||||||||||||||
| 9,450 | Allied World Assurance Holdings | 544,131 | ||||||||||||
| 7,500 | PartnerRe Limited | 516,375 | ||||||||||||
| 7,750 | Reinsurance Group of America Inc. | 471,665 | ||||||||||||
| 7,750 | Willis Group Holdings PLC | 318,603 | ||||||||||||
Total Insurance | 1,850,774 | |||||||||||||
Machinery – 4.8% | ||||||||||||||
| 12,600 | CIRCOR International Inc. | 539,658 | ||||||||||||
| 1,700 | Harsco Corporation | 55,420 | ||||||||||||
| 2,200 | Middleby Corporation, (2) | 206,888 | ||||||||||||
| 4,350 | Timken Company | 219,240 | ||||||||||||
Total Machinery | 1,021,206 | |||||||||||||
| 60 | Nuveen Investments |
| Shares | Description (1) | Value | ||||||||||||
Metals & Mining – 9.8% | ||||||||||||||
| 59,000 | Aurizon Mines Ltd, (2) | $ | 329,810 | |||||||||||
| 9,500 | Globe Specialty Metals Inc., (2) | 212,990 | ||||||||||||
| 195,650 | Northgate Minerals Corporation, (2) | 508,690 | ||||||||||||
| 7,550 | Royal Gold, Inc. | 442,204 | ||||||||||||
| 58,800 | Thompson Creek Metals Company Inc., (2) | 586,824 | ||||||||||||
Total Metals & Mining | 2,080,518 | |||||||||||||
Oil, Gas & Consumable Fuels – 6.5% | ||||||||||||||
| 31,300 | Denbury Resources Inc., (2) | 626,000 | ||||||||||||
| 10,300 | SM Energy Company | 756,844 | ||||||||||||
Total Oil, Gas & Consumable Fuels | 1,382,844 | |||||||||||||
Paper & Forest Products – 0.9% | ||||||||||||||
| 3,000 | Clearwater Paper Corporation | 204,840 | ||||||||||||
Personal Products – 4.2% | ||||||||||||||
| 30,750 | Elizabeth Arden, Inc., (2) | 892,673 | ||||||||||||
Pharmaceuticals – 0.6% | ||||||||||||||
| 3,600 | Salix Pharmaceuticals Limited, (2) | 143,388 | ||||||||||||
Real Estate Management & Development – 4.1% | ||||||||||||||
| 53,800 | Forestar Real Estate Group Inc., (2) | 883,934 | ||||||||||||
Semiconductors & Equipment – 8.4% | ||||||||||||||
| 13,400 | MKS Instruments Inc. | 354,028 | ||||||||||||
| 100,300 | PMC-Sierra, Inc., (2) | 759,271 | ||||||||||||
| 45,900 | Teradyne Inc., (2) | 679,320 | ||||||||||||
Total Semiconductors & Equipment | 1,792,619 | |||||||||||||
Specialty Retail – 2.0% | ||||||||||||||
| 10,400 | Guess Inc. | 437,424 | ||||||||||||
Thrifts & Mortgage Finance – 3.5% | ||||||||||||||
| 24,850 | Northwest Bancshares Inc. | 312,613 | ||||||||||||
| 31,600 | People’s United Financial, Inc. | 424,704 | ||||||||||||
Total Thrifts & Mortgage Finance | 737,317 | |||||||||||||
Trading Companies & Distributors – 1.3% | ||||||||||||||
| 5,000 | WESCO International Inc., (2) | 270,446 | ||||||||||||
Total Investments (cost $16,970,341) – 97.1% | �� | 20,711,587 | ||||||||||||
Other Assets Less Liabilities – 2.9% | 626,826 | |||||||||||||
Net Assets – 100% | $ | 21,338,413 | ||||||||||||
| For Fund portfolio compliance purposes, the Fund’s industry classifications refer to any one or more of the industry sub-classifications used by one or more widely recognized market indexes or ratings group indexes, and/or as defined by Fund management. This definition may not apply for purposes of this report, which may combine industry sub-classifications into sectors for reporting ease. |
| (1) | All percentages shown in the Portfolio of Investments are based on net assets. |
| (2) | Non-income producing; issuer has not declared a dividend within the past twelve months. |
See accompanying notes to financial statements.
| Nuveen Investments | 61 |
Portfolio of Investments
Nuveen NWQ Small-Cap Value Fund
June 30, 2011
| Shares | Description (1) | Value | ||||||||||||
COMMON STOCKS – 104.0% | ||||||||||||||
Aerospace & Defense – 1.9% | ||||||||||||||
| 110,450 | Orbital Sciences Corporation | $ | 1,861,083 | |||||||||||
Apparel, Accesories & Luxury Goods – 1.6% | ||||||||||||||
| 52,300 | True Religion Apparel, Inc., (2) | 1,520,884 | ||||||||||||
Building Products – 3.8% | ||||||||||||||
| 366,350 | Griffon Corporation, (2) | 3,692,808 | ||||||||||||
Commercial Banks – 7.7% | ||||||||||||||
| 68,850 | Pacwest Bancorp. | 1,416,245 | ||||||||||||
| 131,090 | Privatebancorp, Inc. | 1,809,042 | ||||||||||||
| 90,450 | Texas Capital BancShares, Inc., (2) | 2,336,324 | ||||||||||||
| 274,050 | Western Alliance Bancorporation, (2) | 1,945,755 | ||||||||||||
Total Commercial Banks | 7,507,366 | |||||||||||||
Communication Equipment – 3.4% | ||||||||||||||
| 507,250 | Brocade Communications Systems Inc., (2) | 3,276,835 | ||||||||||||
Construction & Engineering – 2.2% | ||||||||||||||
| 225,750 | Orion Marine Group Inc., (2) | 2,124,308 | ||||||||||||
Containers & Packaging – 3.0% | ||||||||||||||
| 34,900 | Packaging Corp. of America | 976,851 | ||||||||||||
| 65,650 | Temple-Inland Inc. | 1,952,431 | ||||||||||||
Total Containers & Packaging | 2,929,282 | |||||||||||||
Electrical Equipment – 1.5% | ||||||||||||||
| 42,150 | Belden Inc. | 1,469,349 | ||||||||||||
Electronic Equipment & Instruments – 2.8% | ||||||||||||||
| 49,600 | Coherent Inc., (2) | 2,741,392 | ||||||||||||
Food & Staples Retailing – 1.6% | ||||||||||||||
| 34,800 | Casey’s General Stores, Inc. | 1,531,200 | ||||||||||||
Food Products – 5.2% | ||||||||||||||
| 511,275 | Smart Balance Inc., (2) | 2,648,405 | ||||||||||||
| 44,650 | Treehouse Foods Inc., (2) | 2,438,337 | ||||||||||||
Total Food Products | 5,086,742 | |||||||||||||
Hotels, Restaurants & Leisure – 5.0% | ||||||||||||||
| 137,700 | Bob Evans Farms | 4,815,369 | ||||||||||||
Household Durables – 1.7% | ||||||||||||||
| 184,595 | Hooker Furniture Corporation | 1,635,512 | ||||||||||||
Insurance – 5.8% | ||||||||||||||
| 44,150 | Allied World Assurance Holdings | 2,542,157 | ||||||||||||
| 119,450 | Aspen Insurance Holdings Limited | 3,073,449 | ||||||||||||
Total Insurance | 5,615,606 | |||||||||||||
IT Services – 2.0% | ||||||||||||||
| 143,150 | Convergys Corporation, (2) | 1,952,566 | ||||||||||||
Machinery – 8.9% | ||||||||||||||
| 174,600 | Albany International Corporation, Class A | 4,607,694 | ||||||||||||
| 68,250 | CIRCOR International Inc. | 2,923,148 | ||||||||||||
| 11,450 | Middleby Corporation, (2) | 1,076,758 | ||||||||||||
Total Machinery | 8,607,600 | |||||||||||||
Metals & Mining – 10.0% | ||||||||||||||
| 261,600 | Aurizon Mines Ltd, (2) | 1,462,344 | ||||||||||||
| 62 | Nuveen Investments |
| Shares | Description (1) | Value | ||||||||||||||||
Metals & Mining (continued) | ||||||||||||||||||
| 44,550 | Globe Specialty Metals Inc., (2) | $ | 998,811 | |||||||||||||||
| 1,061,950 | Northgate Minerals Corporation, (2) | 2,761,070 | ||||||||||||||||
| 33,350 | Royal Gold, Inc. | 1,953,310 | ||||||||||||||||
| 251,350 | Thompson Creek Metals Company Inc., (2) | 2,508,473 | ||||||||||||||||
Total Metals & Mining | 9,684,008 | |||||||||||||||||
Oil, Gas & Consumable Fuels – 8.3% | ||||||||||||||||||
| 105,600 | Carrizo Oil & Gas, Inc., (2) | 4,408,800 | ||||||||||||||||
| 49,900 | SM Energy Company | 3,666,652 | ||||||||||||||||
Total Oil, Gas & Consumable Fuels | 8,075,452 | |||||||||||||||||
Paper & Forest Products – 1.0% | ||||||||||||||||||
| 36,103 | Buckeye Technologies Inc., (2) | 974,059 | ||||||||||||||||
Personal Products – 5.3% | ||||||||||||||||||
| 175,800 | Elizabeth Arden, Inc., (2) | 5,103,474 | ||||||||||||||||
Real Estate Management & Development – 4.6% | ||||||||||||||||||
| 270,185 | Forestar Real Estate Group Inc., (2) | 4,439,140 | ||||||||||||||||
Road & Rail – 3.2% | ||||||||||||||||||
| 144,900 | Marten Transport, Ltd., (2) | 3,129,839 | ||||||||||||||||
Semiconductors & Equipment – 10.6% | ||||||||||||||||||
| 325,800 | Entegris Inc., (2) | 3,297,096 | ||||||||||||||||
| 63,200 | MKS Instruments Inc. | 1,669,742 | ||||||||||||||||
| 197,400 | Standard Microsystems Corporation, (2) | 5,327,825 | ||||||||||||||||
Total Semiconductors & Equipment | 10,294,663 | |||||||||||||||||
Specialty Retail – 1.2% | ||||||||||||||||||
| 301,191 | Golfsmith International Holdings Inc., (2) | 1,144,525 | ||||||||||||||||
Thrifts & Mortgage Finance – 1.7% | ||||||||||||||||||
| 128,600 | Northwest Bancshares Inc. | 1,617,787 | ||||||||||||||||
Total Common Stocks (cost $80,179,875) | 100,830,849 | |||||||||||||||||
| Principal Amount (000) | Description (1) | Coupon | Maturity | Value | ||||||||||||||
SHORT-TERM INVESTMENTS – 6.4% | ||||||||||||||||||
| $ | 6,249 | Repurchase Agreement with Fixed Income Clearing Corporation, dated 6/30/11, repurchase price $6,248,552, collateralized by $6,235,000 U.S. Treasury Notes, 1.500%, due 12/31/13, value $6,375,288 | 0.010% | 7/01/11 | $ | 6,248,550 | ||||||||||||
Total Short-Term Investments (cost $6,248,550) | 6,248,550 | |||||||||||||||||
Total Investments (cost $86,428,425) – 110.4% | 107,079,399 | |||||||||||||||||
Other Assets Less Liabilities – (10.4)% | (10,101,562) | |||||||||||||||||
Net Assets – 100% | $ | 96,977,837 | ||||||||||||||||
| For Fund portfolio compliance purposes, the Fund’s industry classifications refer to any one or more of the industry sub-classifications used by one or more widely recognized market indexes or ratings group indexes, and/or as defined by Fund management. This definition may not apply for purposes of this report, which may combine industry sub-classifications into sectors for reporting ease. |
| (1) | All percentages shown in the Portfolio of Investments are based on net assets. |
| (2) | Non-income producing; issuer has not declared a dividend within the past twelve months. |
See accompanying notes to financial statements.
| Nuveen Investments | 63 |
Portfolio of Investments
Nuveen Tradewinds Value Opportunities Fund
June 30, 2011
| Shares | Description (1) | Value | ||||||||||||
COMMON STOCKS – 78.4% | ||||||||||||||
Aerospace & Defense – 2.5% | ||||||||||||||
| 253,000 | Alliant Techsystems Inc. | $ | 18,046,490 | |||||||||||
| 856,980 | Lockheed Martin Corporation | 69,389,671 | ||||||||||||
Total Aerospace & Defense | 87,436,161 | |||||||||||||
Airlines – 0.4% | ||||||||||||||
| 857,405 | Skywest Inc. | 12,912,519 | ||||||||||||
Capital Markets – 1.0% | ||||||||||||||
| 7,595,000 | Daiwa Securities Group Inc., ADR, (4) | 33,873,700 | ||||||||||||
Communications Equipment – 1.9% | ||||||||||||||
| 4,297,000 | Cisco Systems, Inc. | 67,076,170 | ||||||||||||
Computers & Peripherals – 0.5% | ||||||||||||||
| 463,000 | Western Digital Corporation, (2) | 16,843,940 | ||||||||||||
Diversified Telecommunication Services – 2.6% | ||||||||||||||
| 1,440,000 | KT Corporation, Sponsored ADR | 27,993,600 | ||||||||||||
| 1,189,200 | Telus Corporation Non-Voting | 62,551,920 | ||||||||||||
Total Diversified Telecommunication Services | 90,545,520 | |||||||||||||
Electric Utilities – 9.2% | ||||||||||||||
| 2,960,000 | Centrais Electricas Brasileiras S.A., PFD B ADR | 50,734,400 | ||||||||||||
| 5,934,600 | Electricite de France S.A., ADR, (4) | 46,586,610 | ||||||||||||
| 3,371,300 | Exelon Corporation | 144,426,492 | ||||||||||||
| 3,085,000 | Korea Electric Power Corporation, Sponsored ADR | 40,937,950 | ||||||||||||
| 7,743,312 | RusHydro, ADR, (2), (4) | 37,555,063 | ||||||||||||
Total Electric Utilities | 320,240,515 | |||||||||||||
Electronic Equipment & Instruments – 2.5% | ||||||||||||||
| 2,960,000 | Ingram Micro, Inc., Class A, (2) | 53,694,400 | ||||||||||||
| 724,400 | Tech Data Corporation, (2) | 35,415,916 | ||||||||||||
Total Electronic Equipment & Instruments | 89,110,316 | |||||||||||||
Food & Staples Retailing – 5.1% | ||||||||||||||
| 2,920,000 | Kroger Co. | 72,416,000 | ||||||||||||
| 1,960,000 | Wal-Mart Stores, Inc. | 104,154,400 | ||||||||||||
Total Food & Staples Retailing | 176,570,400 | |||||||||||||
Food Products – 0.6% | ||||||||||||||
| 731,669 | Cresud S.A., ADR | 11,882,305 | ||||||||||||
| 521,736 | Tyson Foods, Inc., Class A | 10,132,113 | ||||||||||||
Total Food Products | 22,014,418 | |||||||||||||
Health Care Providers & Services – 1.6% | ||||||||||||||
| 1,261,300 | Aetna Inc. | 55,610,717 | ||||||||||||
Insurance – 3.7% | ||||||||||||||
| 472,300 | Axis Capital Holdings Limited | 14,622,408 | ||||||||||||
| 771,128 | CNA Financial Corporation | 22,401,268 | ||||||||||||
| 256,353 | Endurance Specialty Holdings Limited | 10,595,069 | ||||||||||||
| 1,110,800 | Marsh & McLennan Companies, Inc. | 34,645,852 | ||||||||||||
| 2,661,000 | MS&AD Insurance Group Holdiongs Inc., ADR, (4) | 30,974,040 | ||||||||||||
| 1,351,600 | Old Republic International Corporation | 15,881,300 | ||||||||||||
Total Insurance | 129,119,937 | |||||||||||||
| 64 | Nuveen Investments |
| Shares | Description (1) | Value | ||||||||||||
Internet Software & Services – 1.1% | ||||||||||||||
| 1,176,200 | eBay Inc., (2) | $ | 37,955,974 | |||||||||||
Machinery – 1.2% | ||||||||||||||
| 534,900 | AGCO Corporation, (2) | 26,402,664 | ||||||||||||
| 243,000 | Japan Steel Works Limited, ADR, (4) | 16,518,946 | ||||||||||||
Total Machinery | 42,921,610 | |||||||||||||
Metals & Mining – 17.9% | ||||||||||||||
| 408,000 | AngloGold Ashanti Limited, Sponsored ADR | 17,172,720 | ||||||||||||
| 2,810,000 | Barrick Gold Corporation | 127,264,900 | ||||||||||||
| 1,784,500 | Gold Fields Limited, Sponsored ADR | 26,035,855 | ||||||||||||
| 5,326,229 | Kinross Gold Corporation | 84,154,418 | ||||||||||||
| 1,960,000 | Newcrest Mining Limited, Sponsored ADR, (4) | 79,380,000 | ||||||||||||
| 3,035,000 | Newmont Mining Corporation | 163,798,950 | ||||||||||||
| 4,950,000 | NovaGold Resources Inc., (2) | 45,540,000 | ||||||||||||
| 2,597,860 | Polyus Gold Company, ADR, (4) | 81,832,590 | ||||||||||||
Total Metals & Mining | 625,179,433 | |||||||||||||
Multi-Utilities – 2.4% | ||||||||||||||
| 2,933,200 | Ameren Corporation | 84,593,488 | ||||||||||||
Oil, Gas & Consumable Fuels – 9.8% | ||||||||||||||
| 1,210,000 | Arch Coal Inc. | 32,258,600 | ||||||||||||
| 5,588,100 | Cameco Corporation | 147,246,435 | ||||||||||||
| 1,748,000 | Chesapeake Energy Corporation | 51,898,120 | ||||||||||||
| 365,000 | ConocoPhillips | 27,444,350 | ||||||||||||
| 2,369,701 | Nexen Inc. | 53,318,273 | ||||||||||||
| 325,835 | Petrobras Energia S.A., ADR | 6,311,424 | ||||||||||||
| 910,000 | Statoil ASA, ADR | 23,159,500 | ||||||||||||
Total Oil, Gas & Consumable Fuels | 341,636,702 | |||||||||||||
Pharmaceuticals – 5.8% | ||||||||||||||
| 4,540,000 | Eli Lilly and Company | 170,386,200 | ||||||||||||
| 782,100 | Forest Laboratories, Inc., (2) | 30,767,814 | ||||||||||||
Total Pharmaceuticals | 201,154,014 | |||||||||||||
Road & Rail – 1.9% | ||||||||||||||
| 5,168,000 | East Japan Railway Company, ADR, (4) | 49,509,440 | ||||||||||||
| 180,000 | Union Pacific Corporation | 18,792,000 | ||||||||||||
Total Road & Rail | 68,301,440 | |||||||||||||
Software – 4.2% | ||||||||||||||
| 5,620,000 | Microsoft Corporation | 146,120,000 | ||||||||||||
Specialty Retail – 1.0% | ||||||||||||||
| 1,096,100 | Best Buy Co., Inc. | 34,428,501 | ||||||||||||
Wireless Telecommunication Services – 1.5% | ||||||||||||||
| 955,000 | SK Telecom Company Limited, ADR | 17,858,500 | ||||||||||||
| 2,550,000 | Turkcell Iletisim Hizmetleri A.S., ADR | 34,552,500 | ||||||||||||
Total Wireless Telecommunication Services | 52,411,000 | |||||||||||||
Total Common Stocks (cost $2,475,414,205) | 2,736,056,475 | |||||||||||||
| Nuveen Investments | 65 |
Portfolio of Investments
Nuveen Tradewinds Value Opportunities Fund (continued)
June 30, 2011
| Shares | Description (1) | Coupon | Ratings (3) | Value | ||||||||||||||||
CONVERTIBLE PREFERRED SECURITIES – 2.3% | ||||||||||||||||||||
Communications Equipment – 0.9% | ||||||||||||||||||||
| 32,100 | Lucent Technologies Capital Trust I | 7.750% | B3 | $ | 31,498,125 | |||||||||||||||
Health Care Providers & Services – 1.4% | ||||||||||||||||||||
| 1,044,700 | Omnicare Capital Trust II, Series B | 4.000% | B | 50,250,070 | ||||||||||||||||
Total Convertible Preferred Securities (cost $62,425,888) | 81,748,195 | |||||||||||||||||||
| Principal Amount (000) | Description (1) | Coupon | Maturity | Ratings (3) | Value | |||||||||||||||
CONVERTIBLE BONDS – 2.1% | ||||||||||||||||||||
Biotechnology – 0.2% | ||||||||||||||||||||
| $ | 8,489 | Amgen Inc. | 0.375% | 2/01/13 | A+ | $ | 8,520,834 | |||||||||||||
Communications Equipment – 0.8% | ||||||||||||||||||||
| 27,809 | Lucent Technologies Inc., Series B | 2.875% | 6/15/25 | B1 | 27,113,775 | |||||||||||||||
Metals & Mining – 0.1% | ||||||||||||||||||||
| 3,018 | Gold Reserve, Inc., (2) | 5.500% | 6/15/22 | N/A | 2,278,590 | |||||||||||||||
Oil, Gas & Consumable Fuels – 1.0% | ||||||||||||||||||||
| 6,853 | Goodrich Petroleum Corporation | 5.000% | 10/01/29 | CCC+ | 6,690,241 | |||||||||||||||
| 38,017 | USEC Inc., Convertible Bond | 3.000% | 10/01/14 | Caa2 | 27,277,197 | |||||||||||||||
| 44,870 | Total Oil, Gas & Consumable Fuels | 33,967,438 | ||||||||||||||||||
| $ | 84,186 | Total Convertible Bonds (cost $74,081,099) | 71,880,637 | |||||||||||||||||
| Principal Amount (000) | Description (1) | Coupon | Maturity | Value | ||||||||||||||||
SHORT-TERM INVESTMENTS – 14.6% | ||||||||||||||||||||
| $ | 510,362 | Repurchase Agreement with Fixed Income Clearing Corporation, dated 6/30/11, repurchase price $510,362,211, collateralized by: $245,870,000 U.S. Treasury Notes, 1.375%, due 11/15/12, value $249,865,388, $50,000,000 U.S. Treasury Notes, 0.625%, due 1/31/13, value $50,312,500, $19,345,000 U.S. Treasury Notes, 0.500%, due 11/30/12, value $19,393,363 and $200,000,000 U.S. Treasury Notes, 0.625%, due 2/28/13, value $201,000,000 | 0.010% | 7/01/11 | $ | 510,362,069 | ||||||||||||||
Total Short-Term Investments (cost $510,362,069) | 510,362,069 | |||||||||||||||||||
Total Investments (cost $3,122,283,261) – 97.4% | 3,400,047,376 | |||||||||||||||||||
Other Assets Less Liabilities – 2.6% | 90,773,466 | |||||||||||||||||||
Net Assets – 100% | $ | 3,490,820,842 | ||||||||||||||||||
| For Fund portfolio compliance purposes, the Fund’s industry classifications refer to any one or more industry sub-classifications used by one or more widely recognized market indexes or ratings group indexes, and/or as defined by Fund management. This definition may not apply for purposes of this report, which may combine industry sub-classifications into sectors for reporting ease. |
| (1) | All percentages shown in the Portfolio of Investments are based on net assets. |
| (2) | Non-income producing; issuer has not declared a dividend within the past twelve months. |
| (3) | Ratings (not covered by the report of independent registered public accounting firm): Using the highest of Standard & Poor’s Group (“Standard & Poor’s”), Moody’s Investor Service, Inc. (“Moody’s”) or Fitch, Inc. (“Fitch”) rating. Ratings below BBB by Standard & Poor’s, Baa by Moody’s or BBB by Fitch are considered to be below investment grade. Holdings designated N/R are not rated by any of these national rating agencies. |
| (4) | For fair value measurement disclosure purposes, Common Stock categorized as Level 2. See Notes to Financial Statements. Footnote 1 – General Information and Significant Accounting Policies, Investment Valuation for more information. |
| N/A | Not available. |
| ADR | American Depositary Receipt. |
See accompanying notes to financial statements.
| 66 | Nuveen Investments |
Statement of Assets and Liabilities
June 30, 2011
| Multi-Manager Large-Cap Value | Multi-Cap Value | Large-Cap Value | Small/Mid- Cap Value | Small-Cap Value | Value Opportunities | |||||||||||||||||||
Assets | ||||||||||||||||||||||||
Investments, at value (cost $286,345,743, $294,474,297, $375,510,451, $16,970,341, $80,179,875 and $2,611,921,192, respectively) | $ | 342,333,334 | $ | 352,778,204 | $ | 422,588,477 | $ | 20,711,587 | $ | 100,830,849 | $ | 2,889,685,307 | ||||||||||||
Short-term investments (at cost, which approximates value) | 2,792,818 | 9,054,457 | 15,438,501 | — | 6,248,550 | 510,362,069 | ||||||||||||||||||
Cash | 1,229 | 32,457 | 31,877 | — | — | 560,592 | ||||||||||||||||||
Receivables: | ||||||||||||||||||||||||
Dividends | 675,550 | 341,509 | 329,233 | 5,230 | 39,425 | 4,650,036 | ||||||||||||||||||
Interest | — | — | — | — | — | 427,107 | ||||||||||||||||||
Investments sold | 22,759,958 | 7,360,813 | 2,071,168 | 712,283 | 7,904,868 | 72,937,748 | ||||||||||||||||||
Reclaims | 27,767 | — | — | — | — | — | ||||||||||||||||||
Shares sold | 280,345 | 1,210,009 | 3,818,804 | 135,786 | 202,755 | 22,796,560 | ||||||||||||||||||
Other assets | 128,554 | 51,479 | 3,685 | 2,007 | 1,769 | 70,472 | ||||||||||||||||||
Total assets | 368,999,555 | 370,828,928 | 444,281,745 | 21,566,893 | 115,228,216 | 3,501,489,891 | ||||||||||||||||||
Liabilities | ||||||||||||||||||||||||
Cash overdraft | — | — | — | 67,748 | — | — | ||||||||||||||||||
Payables: | ||||||||||||||||||||||||
Investments purchased | 22,844,081 | 2,425,326 | 1,955,191 | 78,558 | 1,336,883 | 560,592 | ||||||||||||||||||
Shares redeemed | 899,400 | 600,724 | 5,540,583 | 11,251 | 16,717,871 | 5,534,174 | ||||||||||||||||||
Accrued expenses: | ||||||||||||||||||||||||
Management fees | 193,805 | 235,439 | 213,802 | 3,301 | 75,887 | 2,112,294 | ||||||||||||||||||
12b-1 distribution and service fees | 75,198 | 82,975 | 12,609 | 2,016 | 5,112 | 617,723 | ||||||||||||||||||
Other | 302,352 | 470,529 | 261,779 | 65,606 | 114,626 | 1,844,266 | ||||||||||||||||||
Total liabilities | 24,314,836 | 3,814,993 | 7,983,964 | 228,480 | 18,250,379 | 10,669,049 | ||||||||||||||||||
Net assets | $ | 344,684,719 | $ | 367,013,935 | $ | 436,297,781 | $ | 21,338,413 | $ | 96,977,837 | $ | 3,490,820,842 | ||||||||||||
Class A Shares | ||||||||||||||||||||||||
Net assets | $ | 295,092,902 | $ | 61,437,672 | $ | 26,142,791 | $ | 5,261,403 | $ | 7,365,238 | $ | 1,291,887,530 | ||||||||||||
Shares outstanding | 14,575,770 | 3,215,130 | 1,408,701 | 264,297 | 292,014 | 36,311,187 | ||||||||||||||||||
Net asset value per share | $ | 20.25 | $ | 19.11 | $ | 18.56 | $ | 19.91 | $ | 25.22 | $ | 35.58 | ||||||||||||
Offering price per share (net asset value per share plus maximum sales charge of 5.75% of offering price) | $ | 21.49 | $ | 20.28 | $ | 19.69 | $ | 21.12 | $ | 26.76 | $ | 37.75 | ||||||||||||
Class B Shares | ||||||||||||||||||||||||
Net assets | $ | 1,759,567 | $ | 15,630,859 | $ | 575,087 | N/A | N/A | $ | 6,862,529 | ||||||||||||||
Shares outstanding | 89,543 | 854,829 | 31,699 | N/A | N/A | 197,813 | ||||||||||||||||||
Net asset value and offering price per share | $ | 19.65 | $ | 18.29 | $ | 18.14 | N/A | N/A | $ | 34.69 | ||||||||||||||
Class C Shares | ||||||||||||||||||||||||
Net assets | $ | 17,517,977 | $ | 71,116,302 | $ | 8,659,765 | $ | 1,201,680 | $ | 4,400,973 | $ | 436,073,946 | ||||||||||||
Shares outstanding | 893,331 | 3,889,039 | 477,209 | 62,518 | 181,876 | 12,572,985 | ||||||||||||||||||
Net asset value and offering price per share | $ | 19.61 | $ | 18.29 | $ | 18.15 | $ | 19.22 | $ | 24.20 | $ | 34.68 | ||||||||||||
Class R3 Shares | ||||||||||||||||||||||||
Net assets | $ | 164,075 | $ | 156,322 | $ | 60,781 | $ | 72,729 | $ | 75,303 | $ | 6,880,190 | ||||||||||||
Shares outstanding | 8,065 | 8,244 | 3,281 | 3,695 | 2,981 | 193,438 | ||||||||||||||||||
Net asset value and offering price per share | $ | 20.34 | $ | 18.96 | $ | 18.53 | $ | 19.68 | $ | 25.26 | $ | 35.57 | ||||||||||||
Class I Shares | ||||||||||||||||||||||||
Net assets | $ | 30,150,198 | $ | 218,672,780 | $ | 400,859,357 | $ | 14,802,601 | $ | 85,136,323 | $ | 1,749,116,647 | ||||||||||||
Shares outstanding | 1,482,553 | 11,409,517 | 21,566,519 | 745,773 | 3,348,563 | 48,966,720 | ||||||||||||||||||
Net asset value and offering price per share | $ | 20.34 | $ | 19.17 | $ | 18.59 | $ | 19.85 | $ | 25.42 | $ | 35.72 | ||||||||||||
Net assets consist of: | ||||||||||||||||||||||||
Capital paid-in | $ | 356,720,676 | $ | 583,458,498 | $ | 385,053,244 | $ | 50,836,114 | $ | 132,545,969 | $ | 2,996,782,334 | ||||||||||||
Undistributed (Over-distribution of) net investment income | 3,641,860 | (53,182 | ) | 968,738 | — | — | 56,608,504 | |||||||||||||||||
Accumulated net realized gain (loss) | (71,665,985 | ) | (274,695,288 | ) | 3,197,643 | (33,238,947 | ) | (56,219,106 | ) | 159,645,869 | ||||||||||||||
Net unrealized appreciation (depreciation) | 55,988,168 | 58,303,907 | 47,078,156 | 3,741,246 | 20,650,974 | 277,784,135 | ||||||||||||||||||
Net assets | $ | 344,684,719 | $ | 367,013,935 | $ | 436,297,781 | $ | 21,338,413 | $ | 96,977,837 | $ | 3,490,820,842 | ||||||||||||
Authorized shares | Unlimited | Unlimited | Unlimited | Unlimited | Unlimited | Unlimited | ||||||||||||||||||
Par value per share | $ | 0.01 | $ | 0.01 | $ | 0.01 | $ | 0.01 | $ | 0.01 | $ | 0.01 | ||||||||||||
| N/A | — Small/Mid-Cap Value and Small-Cap Value do not issue Class B Shares. |
See accompanying notes to financial statements.
| Nuveen Investments | 67 |
Year Ended June 30, 2011
| Multi-Manager Large-Cap Value | Multi-Cap Value | Large-Cap Value | ||||||||||
Investment Income | ||||||||||||
Dividends (net of foreign tax withheld of $63,472, $201,469 and $138,195, respectively) | $ | 7,655,989 | $ | 4,843,383 | $ | 4,844,456 | ||||||
Interest | 845 | 2,054 | 2,157 | |||||||||
Total investment income | 7,656,834 | 4,845,437 | 4,846,613 | |||||||||
Expenses | ||||||||||||
Management fees | 2,409,019 | 2,994,988 | 2,487,545 | |||||||||
12b-1 service fees – Class A | 718,662 | 159,549 | 47,478 | |||||||||
12b-1 distribution and service fees – Class B | 19,686 | 166,490 | 5,479 | |||||||||
12b-1 distribution and service fees – Class C | 172,994 | 746,362 | 66,159 | |||||||||
12b-1 distribution and service fees – Class R3 | 475 | 916 | 286 | |||||||||
Shareholders’ servicing agent fees and expenses | 456,432 | 792,606 | 452,692 | |||||||||
Custodian’s fees and expenses | 109,679 | 61,276 | 57,220 | |||||||||
Trustees’ fees and expenses | 6,822 | 8,966 | 9,031 | |||||||||
Professional fees | 34,362 | 33,541 | 42,811 | |||||||||
Shareholders’ reports – printing and mailing expenses | 163,322 | 206,470 | 113,173 | |||||||||
Federal and state registration fees | 43,999 | 99,346 | 122,039 | |||||||||
Other expenses | 18,252 | 20,528 | 10,237 | |||||||||
Total expenses before custodian fee credit and expense reimbursement | 4,153,704 | 5,291,038 | 3,414,150 | |||||||||
Custodian fee credit | (40 | ) | (7 | ) | (15 | ) | ||||||
Expense reimbursement | (124,710 | ) | — | — | ||||||||
Net expenses | 4,028,954 | 5,291,031 | 3,414,135 | |||||||||
Net investment income (loss) | 3,627,880 | (445,594 | ) | 1,432,478 | ||||||||
Realized and Unrealized Gain (Loss) | ||||||||||||
Net realized gain (loss) from: | ||||||||||||
Investments and foreign currency | 28,249,798 | 21,484,838 | 7,285,480 | |||||||||
Redemptions in-kind | — | — | (2,103,361 | ) | ||||||||
Change in net unrealized appreciation (depreciation) of investments and foreign currency | 46,238,142 | 76,177,341 | 61,059,587 | |||||||||
Net realized and unrealized gain (loss) | 74,487,940 | 97,662,179 | 66,241,706 | |||||||||
Net increase (decrease) in net assets from operations | $ | 78,115,820 | $ | 97,216,585 | $ | 67,674,184 | ||||||
See accompanying notes to financial statements.
| 68 | Nuveen Investments |
| Small/Mid Cap Value | Small-Cap Value | Value Opportunities | ||||||||||
Investment Income | ||||||||||||
Dividends (net of foreign tax withheld of $3,307, $0 and $2,226,387, respectively) | $ | 140,191 | $ | 660,499 | $ | 46,079,644 | ||||||
Interest | 119 | 761 | 4,655,083 | |||||||||
Total investment income | 140,310 | 661,260 | 50,734,727 | |||||||||
Expenses | ||||||||||||
Management fees | 132,488 | 1,036,997 | 20,837,981 | |||||||||
12b-1 service fees – Class A | 10,867 | 19,498 | 2,562,548 | |||||||||
12b-1 distribution and service fees – Class B | — | — | 67,079 | |||||||||
12b-1 distribution and service fees – Class C | 9,088 | 41,736 | 3,191,488 | |||||||||
12b-1 distribution and service fees – Class R3 | 332 | 326 | 18,260 | |||||||||
Shareholders’ servicing agent fees and expenses | 26,275 | 100,796 | 3,199,777 | |||||||||
Custodian’s fees and expenses | 9,822 | 23,897 | 405,138 | |||||||||
Trustees’ fees and expenses | 429 | 2,815 | 63,061 | |||||||||
Professional fees | 38,189 | 38,578 | 71,042 | |||||||||
Shareholders’ reports – printing and mailing expenses | 8,344 | 26,630 | 750,239 | |||||||||
Federal and state registration fees | 59,625 | 75,875 | 450,203 | |||||||||
Other expenses | 557 | 4,581 | 90,362 | |||||||||
Total expenses before custodian fee credit and expense reimbursement | 296,016 | 1,371,729 | 31,707,178 | |||||||||
Custodian fee credit | — | (13 | ) | (2,991 | ) | |||||||
Expense reimbursement | (92,199 | ) | — | — | ||||||||
Net expenses | 203,817 | 1,371,716 | 31,704,187 | |||||||||
Net investment income (loss) | (63,507 | ) | (710,456 | ) | 19,030,540 | |||||||
Realized and Unrealized Gain (Loss) | ||||||||||||
Net realized gain (loss) from: | ||||||||||||
Investments and foreign currency | 1,980,649 | 12,240,975 | 320,911,163 | |||||||||
Redemptions in-kind | — | — | — | |||||||||
Change in net unrealized appreciation (depreciation) of investments and foreign currency | 2,631,331 | 22,021,396 | 172,998,798 | |||||||||
Net realized and unrealized gain (loss) | 4,611,980 | 34,262,371 | 493,909,961 | |||||||||
Net increase (decrease) in net assets from operations | $ | 4,548,473 | $ | 33,551,915 | $ | 512,940,501 | ||||||
See accompanying notes to financial statements.
| Nuveen Investments | 69 |
Statement of Changes in Net Assets
| Multi-Manager Large-Cap Value | Multi-Cap Value | |||||||||||||||
| Year Ended 6/30/11 | Year Ended 6/30/10 | Year Ended 6/30/11 | Year Ended 6/30/10 | |||||||||||||
Operations | ||||||||||||||||
Net investment income (loss) | $ | 3,627,880 | $ | 3,015,988 | $ | (445,594 | ) | $ | (1,610,896 | ) | ||||||
Net realized gain (loss) from: | ||||||||||||||||
Investments and foreign currency | 28,249,798 | 3,750,889 | 21,484,838 | (30,044,317 | ) | |||||||||||
Redemptions in-kind | — | — | — | — | ||||||||||||
Change in net unrealized appreciation (depreciation) of investments and foreign currency | 46,238,142 | 35,915,040 | 76,177,341 | 106,504,316 | ||||||||||||
Net increase (decrease) in net assets from operations | 78,115,820 | 42,681,917 | 97,216,585 | 74,849,103 | ||||||||||||
Distributions to Shareholders | ||||||||||||||||
From net investment income: | ||||||||||||||||
Class A | (3,374,398 | ) | (4,929,821 | ) | — | (125,185 | ) | |||||||||
Class B | (9,369 | ) | (29,067 | ) | — | — | ||||||||||
Class C | (82,745 | ) | (194,187 | ) | — | — | ||||||||||
Class R3 | (495 | ) | (1,813 | ) | — | (40 | ) | |||||||||
Class I | (388,686 | ) | (443,196 | ) | — | (547,790 | ) | |||||||||
From accumulated net realized gains: | ||||||||||||||||
Class A | — | — | — | — | ||||||||||||
Class B | — | — | — | — | ||||||||||||
Class C | — | — | — | — | ||||||||||||
Class R3 | — | — | — | — | ||||||||||||
Class I | — | — | — | — | ||||||||||||
From return of capital: | ||||||||||||||||
Class A | — | — | — | (68,530 | ) | |||||||||||
Class B | — | — | — | — | ||||||||||||
Class C | — | — | — | — | ||||||||||||
Class R3 | — | — | — | (22 | ) | |||||||||||
Class I | — | — | — | (299,879 | ) | |||||||||||
Decrease in net assets from distributions to shareholders | (3,855,693 | ) | (5,598,084 | ) | — | (1,041,446 | ) | |||||||||
Fund Share Transactions | ||||||||||||||||
Proceeds from sale of shares | 31,376,189 | 37,463,350 | 102,534,298 | 165,234,343 | ||||||||||||
Proceeds from shares issued to shareholders due to reinvestment of distributions | 3,040,868 | 4,377,343 | — | 940,552 | ||||||||||||
| 34,417,057 | 41,840,693 | 102,534,298 | 166,174,895 | |||||||||||||
Cost of shares redeemed | (59,347,740 | ) | (58,316,687 | ) | (204,384,238 | ) | (267,368,882 | ) | ||||||||
Cost of redemptions in-kind | — | — | — | — | ||||||||||||
Net increase (decrease) in net assets from Fund share transactions | (24,930,683 | ) | (16,475,994 | ) | (101,849,940 | ) | (101,193,987 | ) | ||||||||
Net increase (decrease) in net assets | 49,329,444 | 20,607,839 | (4,633,355 | ) | (27,386,330 | ) | ||||||||||
Net assets at the beginning of period | 295,355,275 | 274,747,436 | 371,647,290 | 399,033,620 | ||||||||||||
Net assets at the end of period | $ | 344,684,719 | $ | 295,355,275 | $ | 367,013,935 | $ | 371,647,290 | ||||||||
Undistributed (Over-distribution of) net investment income at the end of period | $ | 3,641,860 | | $ | 3,857,753 | $ | (53,182 | ) | $ | (41,594 | ) | |||||
See accompanying notes to financial statements.
| 70 | Nuveen Investments |
| Large-Cap Value | Small/Mid-Cap Value | |||||||||||||||
| Year Ended 6/30/11 | Year Ended 6/30/10 | Year Ended 6/30/11 | Year Ended 6/30/10 | |||||||||||||
Operations | ||||||||||||||||
Net investment income (loss) | $ | 1,432,478 | $ | 740,117 | $ | (63,507 | ) | $ | (49,429 | ) | ||||||
Net realized gain (loss) from: | ||||||||||||||||
Investments and foreign currency | 7,285,480 | 60,957 | 1,980,649 | 621,080 | ||||||||||||
Redemptions in-kind | | (2,103,361 | ) | | — | | | — | | | — | | ||||
Change in net unrealized appreciation (depreciation) of investments and foreign currency | 61,059,587 | (8,731,166 | ) | 2,631,331 | 1,280,479 | |||||||||||
Net increase (decrease) in net assets from operations | 67,674,184 | (7,930,092 | ) | 4,548,473 | 1,852,130 | |||||||||||
Distributions to Shareholders | ||||||||||||||||
From net investment income: | ||||||||||||||||
Class A | (31,669 | ) | — | — | — | |||||||||||
Class B | — | — | — | — | ||||||||||||
Class C | — | — | — | — | ||||||||||||
Class R3 | — | — | — | — | ||||||||||||
Class I | (1,171,295 | ) | (165,020 | ) | — | — | ||||||||||
From accumulated net realized gains: | ||||||||||||||||
Class A | — | — | — | — | ||||||||||||
Class B | — | — | — | — | ||||||||||||
Class C | — | — | — | — | ||||||||||||
Class R3 | — | — | — | — | ||||||||||||
Class I | — | — | — | — | ||||||||||||
From return of capital: | ||||||||||||||||
Class A | — | — | — | — | ||||||||||||
Class B | — | — | — | — | ||||||||||||
Class C | — | — | — | — | ||||||||||||
Class R3 | — | — | — | — | ||||||||||||
Class I | — | — | — | — | ||||||||||||
Decrease in net assets from distributions to shareholders | (1,202,964 | ) | (165,020 | ) | — | — | ||||||||||
Fund Share Transactions | ||||||||||||||||
Proceeds from sale of shares | 243,412,496 | 266,036,468 | 10,589,304 | 8,754,586 | ||||||||||||
Proceeds from shares issued to shareholders due to reinvestment of distributions | 1,143,195 | 150,445 | — | — | ||||||||||||
| 244,555,691 | 266,186,913 | 10,589,304 | 8,754,586 | |||||||||||||
Cost of shares redeemed | (133,179,546 | ) | (46,859,395 | ) | (5,034,171 | ) | (5,190,001 | ) | ||||||||
Cost of redemptions in-kind | | (14,097,131 | ) | | — | | | — | | | — | | ||||
Net increase (decrease) in net assets from Fund share transactions | 97,279,014 | 219,327,518 | 5,555,133 | 3,564,585 | ||||||||||||
Net increase (decrease) in net assets | 163,750,234 | 211,232,406 | 10,103,606 | 5,416,715 | ||||||||||||
Net assets at the beginning of period | 272,547,547 | 61,315,141 | 11,234,807 | 5,818,092 | ||||||||||||
Net assets at the end of period | $ | 436,297,781 | $ | 272,547,547 | $ | 21,338,413 | $ | 11,234,807 | ||||||||
Undistributed (Over-distribution of) net investment income at the end of period | $ | 968,738 | $ | 738,707 | $ | — | $ | — | ||||||||
See accompanying notes to financial statements.
| Nuveen Investments | 71 |
Statement of Changes in Net Assets (continued)
| Small-Cap Value | Value Opportunities | |||||||||||||||
| Year Ended 6/30/11 | Year Ended 6/30/10 | Year Ended 6/30/11 | Year Ended 6/30/10 | |||||||||||||
Operations | ||||||||||||||||
Net investment income (loss) | $ | (710,456 | ) | $ | (259,439 | ) | $ | 19,030,540 | $ | 7,788,136 | ||||||
Net realized gain (loss) from: | ||||||||||||||||
Investments and foreign currency | 12,240,975 | 5,246,292 | 320,911,163 | 110,998,312 | ||||||||||||
Redemptions in-kind | — | — | — | — | ||||||||||||
Change in net unrealized appreciation (depreciation) of | 22,021,396 | 17,007,810 | 172,998,798 | 135,738,189 | ||||||||||||
Net increase (decrease) in net assets from operations | 33,551,915 | 21,994,663 | 512,940,501 | 254,524,637 | ||||||||||||
Distributions to Shareholders | ||||||||||||||||
From net investment income: | ||||||||||||||||
Class A | — | (3,183 | ) | (15,223,937 | ) | — | ||||||||||
Class B | — | — | (52,942 | ) | — | |||||||||||
Class C | — | — | (2,428,403 | ) | — | |||||||||||
Class R3 | — | — | (33,059 | ) | — | |||||||||||
Class I | — | (192,552 | ) | (22,462,376 | ) | — | ||||||||||
From accumulated net realized gains: | ||||||||||||||||
Class A | — | — | (32,302,076 | ) | — | |||||||||||
Class B | — | — | (224,961 | ) | — | |||||||||||
Class C | — | — | (9,988,549 | ) | — | |||||||||||
Class R3 | — | — | (72,577 | ) | — | |||||||||||
Class I | — | — | (41,366,702 | ) | — | |||||||||||
From return of capital: | ||||||||||||||||
Class A | — | — | — | — | ||||||||||||
Class B | — | — | — | — | ||||||||||||
Class C | — | — | — | — | ||||||||||||
Class R3 | — | — | — | — | ||||||||||||
Class I | — | — | — | — | ||||||||||||
Decrease in net assets from distributions to shareholders | — | (195,735 | ) | (124,155,582 | ) | — | ||||||||||
Fund Share Transactions | ||||||||||||||||
Proceeds from sale of shares | 41,569,383 | 27,648,194 | 1,972,518,147 | 1,059,742,767 | ||||||||||||
Proceeds from shares issued to shareholders due to reinvestment of distributions | — | 178,041 | 92,637,725 | — | ||||||||||||
| 41,569,383 | 27,826,235 | 2,065,155,872 | 1,059,742,767 | |||||||||||||
Cost of shares redeemed | (63,521,319 | ) | (38,022,996 | ) | (867,673,014 | ) | (472,945,062 | ) | ||||||||
Net increase (decrease) in net assets from Fund share transactions | (21,951,936 | ) | (10,196,761 | ) | 1,197,482,858 | 586,797,705 | ||||||||||
Net increase (decrease) in net assets | 11,599,979 | 11,602,167 | 1,586,267,777 | 841,322,342 | ||||||||||||
Net assets at the beginning of period | 85,377,858 | 73,775,691 | 1,904,553,065 | 1,063,230,723 | ||||||||||||
Net assets at the end of period | $ | 96,977,837 | $ | 85,377,858 | $ | 3,490,820,842 | $ | 1,904,553,065 | ||||||||
Undistributed (Over-distribution of) net investment income at the end of period | $ | — | $ | — | $ | 56,608,504 | $ | 6,805,973 | ||||||||
See accompanying notes to financial statements.
| 72 | Nuveen Investments |
Financial Highlights
| Nuveen Investments | 73 |
| Selected data for a share outstanding throughout each period: | ||||||||||||||||||||||||||||||||
| Class (Commencement Date) | ||||||||||||||||||||||||||||||||
| Investment Operations | Less Distributions | |||||||||||||||||||||||||||||||
MULTI-MANAGER LARGE-CAP VALUE | ||||||||||||||||||||||||||||||||
| Year Ended June 30, | Beginning Net Asset Value | Net Invest- ment Income (Loss)(a) | Net Realized/ Unrealized Gain (Loss) | Total | Net Invest- ment Income | Capital Gains(b) | Total | Ending Net Asset Value | ||||||||||||||||||||||||
Class A (8/96) |
| |||||||||||||||||||||||||||||||
2011 | $ | 16.11 | $ | .21 | $ | 4.15 | $ | 4.36 | $ | (.22 | ) | $ | — | $ | (.22 | ) | $ | 20.25 | ||||||||||||||
2010 | 14.23 | .16 | 2.02 | 2.18 | (.30 | ) | — | (.30 | ) | 16.11 | ||||||||||||||||||||||
2009 | 22.53 | .29 | (6.82 | ) | (6.53 | ) | (.19 | ) | (1.58 | ) | (1.77 | ) | 14.23 | |||||||||||||||||||
2008 | 30.05 | .32 | (3.15 | ) | (2.83 | ) | (.30 | ) | (4.39 | ) | (4.69 | ) | 22.53 | |||||||||||||||||||
2007 | 27.23 | .35 | 5.33 | 5.68 | (.26 | ) | (2.60 | ) | (2.86 | ) | 30.05 | |||||||||||||||||||||
Class B (8/96) |
| |||||||||||||||||||||||||||||||
2011 | 15.65 | .06 | 4.03 | 4.09 | (.09 | ) | — | (.09 | ) | 19.65 | ||||||||||||||||||||||
2010 | 13.84 | .04 | 1.96 | 2.00 | (.19 | ) | — | (.19 | ) | 15.65 | ||||||||||||||||||||||
2009 | 21.90 | .18 | (6.63 | ) | (6.45 | ) | (.03 | ) | (1.58 | ) | (1.61 | ) | 13.84 | |||||||||||||||||||
2008 | 29.32 | .11 | (3.06 | ) | (2.95 | ) | (.08 | ) | (4.39 | ) | (4.47 | ) | 21.90 | |||||||||||||||||||
2007 | 26.64 | .12 | 5.21 | 5.33 | (.05 | ) | (2.60 | ) | (2.65 | ) | 29.32 | |||||||||||||||||||||
Class C (8/96) |
| |||||||||||||||||||||||||||||||
2011 | 15.61 | .06 | 4.03 | 4.09 | (.09 | ) | — | (.09 | ) | 19.61 | ||||||||||||||||||||||
2010 | 13.80 | .04 | 1.96 | 2.00 | (.19 | ) | — | (.19 | ) | 15.61 | ||||||||||||||||||||||
2009 | 21.86 | .17 | (6.62 | ) | (6.45 | ) | (.03 | ) | (1.58 | ) | (1.61 | ) | 13.80 | |||||||||||||||||||
2008 | 29.27 | .12 | (3.06 | ) | (2.94 | ) | (.08 | ) | (4.39 | ) | (4.47 | ) | 21.86 | |||||||||||||||||||
2007 | 26.60 | .13 | 5.19 | 5.32 | (.05 | ) | (2.60 | ) | (2.65 | ) | 29.27 | |||||||||||||||||||||
Class R3 (8/08) |
| |||||||||||||||||||||||||||||||
2011 | 16.19 | .18 | 4.15 | 4.33 | (.18 | ) | — | (.18 | ) | 20.34 | ||||||||||||||||||||||
2010 | 14.31 | .12 | 2.03 | 2.15 | (.27 | ) | — | (.27 | ) | 16.19 | ||||||||||||||||||||||
2009(f) | 22.05 | .23 | (6.25 | ) | (6.02 | ) | (.14 | ) | (1.58 | ) | (1.72 | ) | 14.31 | |||||||||||||||||||
Class I (8/96)(e) |
| |||||||||||||||||||||||||||||||
2011 | 16.18 | .26 | 4.17 | 4.43 | (.27 | ) | — | (.27 | ) | 20.34 | ||||||||||||||||||||||
2010 | 14.28 | .21 | 2.03 | 2.24 | (.34 | ) | — | (.34 | ) | 16.18 | ||||||||||||||||||||||
2009 | 22.64 | .33 | (6.87 | ) | (6.54 | ) | (.24 | ) | (1.58 | ) | (1.82 | ) | 14.28 | |||||||||||||||||||
2008 | 30.18 | .39 | (3.17 | ) | (2.78 | ) | (.37 | ) | (4.39 | ) | (4.76 | ) | 22.64 | |||||||||||||||||||
2007 | 27.33 | .43 | 5.35 | 5.78 | (.33 | ) | (2.60 | ) | (2.93 | ) | 30.18 | |||||||||||||||||||||
| 74 | Nuveen Investments |
| Ratios/Supplemental Data | ||||||||||||||||||||||||||
| Ratios to Average Net Assets Before Reimbursement | Ratios to Average Net Assets After Reimbursement(d) | |||||||||||||||||||||||||
| Total Return(c) | Ending Net Assets (000) | Expenses | Net Invest- ment Income (Loss) | Expenses | Net Invest- ment Income (Loss) | Portfolio Turnover Rate | ||||||||||||||||||||
| 27.15 | % | $ | 295,093 | 1.22 | % | 1.07 | % | 1.18 | % | 1.11 | % | 78 | % | |||||||||||||
| 15.19 | 254,730 | 1.26 | .91 | 1.19 | .97 | 74 | ||||||||||||||||||||
| (28.95 | ) | 239,210 | 1.27 | 1.71 | 1.20 | 1.83 | 85 | |||||||||||||||||||
| (10.74 | ) | 389,240 | 1.24 | 1.20 | 1.21 | 1.23 | 131 | |||||||||||||||||||
| 21.71 | 491,489 | 1.25 | 1.22 | 1.25 | 1.22 | 75 | ||||||||||||||||||||
| 26.23 | 1,760 | 1.97 | .31 | 1.93 | .34 | 78 | ||||||||||||||||||||
| 14.26 | 2,000 | 2.01 | .16 | 1.94 | .23 | 74 | ||||||||||||||||||||
| (29.46 | ) | 3,033 | 2.01 | .97 | 1.95 | 1.10 | 85 | |||||||||||||||||||
| (11.39 | ) | 8,891 | 1.99 | .43 | 1.96 | .46 | 131 | |||||||||||||||||||
| 20.77 | 18,491 | 2.00 | .44 | 2.00 | .44 | 75 | ||||||||||||||||||||
| 26.21 | 17,518 | 1.97 | .32 | 1.93 | .36 | 78 | ||||||||||||||||||||
| 14.37 | 15,565 | 2.01 | .16 | 1.94 | .22 | 74 | ||||||||||||||||||||
| (29.52 | ) | 15,803 | 2.02 | .96 | 1.95 | 1.08 | 85 | |||||||||||||||||||
| (11.41 | ) | 25,007 | 1.99 | .45 | 1.96 | .48 | 131 | |||||||||||||||||||
| 20.80 | 31,219 | 2.00 | .47 | 2.00 | .47 | 75 | ||||||||||||||||||||
| 26.80 | 164 | 1.49 | .91 | 1.43 | .97 | 78 | ||||||||||||||||||||
| 14.88 | 110 | 1.50 | .66 | 1.44 | .72 | 74 | ||||||||||||||||||||
| (27.29 | ) | 97 | 1.53 | * | 1.55 | * | 1.45 | * | 1.63 | * | 85 | |||||||||||||||
| 27.46 | 30,150 | .97 | 1.32 | .93 | 1.36 | 78 | ||||||||||||||||||||
| 15.53 | 22,950 | 1.00 | 1.16 | .94 | 1.22 | 74 | ||||||||||||||||||||
| (28.83 | ) | 16,604 | 1.02 | 1.95 | .95 | 2.08 | 85 | |||||||||||||||||||
| (10.52 | ) | 23,684 | .99 | 1.45 | .96 | 1.48 | 131 | |||||||||||||||||||
| 22.03 | 31,878 | 1.00 | 1.48 | 1.00 | 1.48 | 75 | ||||||||||||||||||||
| (a) | Per share Net Investment Income (Loss) is calculated using the average daily shares method. |
| (b) | Distributions from Capital Gains include short-term capital gains, if any. |
| (c) | Total return is the combination of changes in net asset value without any sales charge, reinvested dividend income at net asset value and reinvested capital gains distributions at net asset value, if any. Total returns are not annualized. |
| (d) | After expense reimbursement from the Adviser, where applicable. Ratios do not reflect the effect of custodian fee credits earned on the Fund’s net cash on deposit with the custodian bank, where applicable. |
| (e) | Effective May 1, 2008, Class R Shares were renamed Class I Shares. |
| (f) | For the period August 4, 2008 (commencement of operations) through June 30, 2009. |
| * | Annualized. |
See accompanying notes to financial statements.
| Nuveen Investments | 75 |
Financial Highlights (continued)
| Selected data for a share outstanding throughout each period: | ||||||||||||||||||||||||||||||||||||
| Class (Commencement Date) | ||||||||||||||||||||||||||||||||||||
| Investment Operations | Less Distributions | |||||||||||||||||||||||||||||||||||
| MULTI-CAP VALUE | ||||||||||||||||||||||||||||||||||||
| Year Ended June 30, | Beginning Net Asset Value | Net Invest- ment Income (Loss)(a) | Net Realized/ Unrealized Gain (Loss) | Total | Net Invest- ment Income | Capital Gains(b) | Return of Capital | Total | Ending Net Asset Value | |||||||||||||||||||||||||||
Class A (12/02) | ||||||||||||||||||||||||||||||||||||
2011 | $ | 14.73 | $ | (.02 | ) | $ | 4.40 | $ | 4.38 | $ | — | $ | — | $ | — | $ | — | $ | 19.11 | |||||||||||||||||
2010 | 12.22 | (.06 | ) | 2.61 | 2.55 | (.03 | ) | — | (.01 | ) | (.04 | ) | 14.73 | |||||||||||||||||||||||
2009 | 18.54 | .04 | (6.36 | ) | (6.32 | ) | — | — | — | — | 12.22 | |||||||||||||||||||||||||
2008 | 26.15 | .04 | (6.62 | ) | (6.58 | ) | (.02 | ) | (.94 | ) | (.07 | ) | (1.03 | ) | 18.54 | |||||||||||||||||||||
2007 | 23.81 | .18 | 3.43 | 3.61 | (.13 | ) | (1.14 | ) | — | (1.27 | ) | 26.15 | ||||||||||||||||||||||||
Class B (12/02) | ||||||||||||||||||||||||||||||||||||
2011 | 14.21 | (.14 | ) | 4.22 | 4.08 | — | — | — | — | 18.29 | ||||||||||||||||||||||||||
2010 | 11.84 | (.16 | ) | 2.53 | 2.37 | — | — | — | — | 14.21 | ||||||||||||||||||||||||||
2009 | 18.10 | (.06 | ) | (6.20 | ) | (6.26 | ) | — | — | — | — | 11.84 | ||||||||||||||||||||||||
2008 | 25.64 | (.13 | ) | (6.47 | ) | (6.60 | ) | — | (.94 | ) | — | (.94 | ) | 18.10 | ||||||||||||||||||||||
2007 | 23.42 | (.01 | ) | 3.37 | 3.36 | — | (1.14 | ) | — | (1.14 | ) | 25.64 | ||||||||||||||||||||||||
Class C (12/02) | ||||||||||||||||||||||||||||||||||||
2011 | 14.21 | (.14 | ) | 4.22 | 4.08 | — | — | — | — | 18.29 | ||||||||||||||||||||||||||
2010 | 11.84 | (.16 | ) | 2.53 | 2.37 | — | — | — | — | 14.21 | ||||||||||||||||||||||||||
2009 | 18.10 | (.06 | ) | (6.20 | ) | (6.26 | ) | — | — | — | — | 11.84 | ||||||||||||||||||||||||
2008 | 25.64 | (.13 | ) | (6.47 | ) | (6.60 | ) | — | (.94 | ) | — | (.94 | ) | 18.10 | ||||||||||||||||||||||
2007 | 23.42 | (.01 | ) | 3.37 | 3.36 | — | (1.14 | ) | — | (1.14 | ) | 25.64 | ||||||||||||||||||||||||
Class R3 (8/08) | ||||||||||||||||||||||||||||||||||||
2011 | 14.66 | (.06 | ) | 4.36 | 4.30 | — | — | — | — | 18.96 | ||||||||||||||||||||||||||
2010 | 12.16 | (.08 | ) | 2.59 | 2.51 | (.01 | ) | — | — | ** | (.01 | ) | 14.66 | |||||||||||||||||||||||
2009(f) | 17.60 | .01 | (5.45 | ) | (5.44 | ) | — | — | — | — | 12.16 | |||||||||||||||||||||||||
Class I (11/97)(e) | ||||||||||||||||||||||||||||||||||||
2011 | 14.74 | .03 | 4.40 | 4.43 | — | — | — | — | 19.17 | |||||||||||||||||||||||||||
2010 | 12.22 | (.01 | ) | 2.60 | 2.59 | (.05 | ) | — | (.02 | ) | (.07 | ) | 14.74 | |||||||||||||||||||||||
2009 | 18.50 | .07 | (6.35 | ) | (6.28 | ) | — | — | — | — | 12.22 | |||||||||||||||||||||||||
2008 | 26.09 | .09 | (6.59 | ) | (6.50 | ) | (.02 | ) | (.94 | ) | (.13 | ) | (1.09 | ) | 18.50 | |||||||||||||||||||||
2007 | 23.76 | .24 | 3.42 | 3.66 | (.19 | ) | (1.14 | ) | — | (1.33 | ) | 26.09 | ||||||||||||||||||||||||
| 76 | Nuveen Investments |
| Ratios/Supplemental Data | ||||||||||||||||||
| Ratios to Average Net Assets(d) | ||||||||||||||||||
| Total Return(c) | Ending Net Assets (000) | Expenses | Net Invest- ment Income (Loss) | Portfolio Turnover Rate | ||||||||||||||
| 29.74 | % | $ | 61,438 | 1.38 | % | (.10 | )% | 24 | % | |||||||||
| 20.85 | 61,514 | 1.47 | (.38 | ) | 34 | |||||||||||||
| (34.12 | ) | 76,785 | 1.50 | .27 | 32 | |||||||||||||
| (25.65 | ) | 293,777 | 1.33 | .17 | 25 | |||||||||||||
| 15.51 | 634,123 | 1.24 | .71 | 19 | ||||||||||||||
| 28.71 | 15,631 | 2.13 | (.85 | ) | 24 | |||||||||||||
| 20.02 | 16,016 | 2.21 | (1.12 | ) | 34 | |||||||||||||
| (34.62 | ) | 16,599 | 2.28 | (.46 | ) | 32 | ||||||||||||
| (26.20 | ) | 36,024 | 2.08 | (.59 | ) | 25 | ||||||||||||
| 14.65 | 75,067 | 2.00 | (.04 | ) | 19 | |||||||||||||
| 28.71 | 71,116 | 2.13 | (.84 | ) | 24 | |||||||||||||
| 20.02 | 71,209 | 2.21 | (1.13 | ) | 34 | |||||||||||||
| (34.62 | ) | 78,225 | 2.27 | (.46 | ) | 32 | ||||||||||||
| (26.20 | ) | 189,475 | 2.08 | (.58 | ) | 25 | ||||||||||||
| 14.64 | 441,048 | 1.99 | (.04 | ) | 19 | |||||||||||||
| 29.33 | 156 | 1.63 | (.32 | ) | 24 | |||||||||||||
| 20.62 | 202 | 1.65 | (.55 | ) | 34 | |||||||||||||
| (30.91 | ) | 104 | 1.81 | * | .12 | * | 32 | |||||||||||
| 30.05 | 218,673 | 1.13 | .18 | 24 | ||||||||||||||
| 21.18 | 222,707 | 1.18 | (.08 | ) | 34 | |||||||||||||
| (33.95 | ) | 227,320 | 1.29 | .55 | 32 | |||||||||||||
| (25.47 | ) | 274,886 | 1.09 | .39 | 25 | |||||||||||||
| 15.77 | 350,370 | .99 | .96 | 19 | ||||||||||||||
| (a) | Per share Net Investment Income (Loss) is calculated using the average daily shares method. |
| (b) | Distributions from Capital Gains include short-term capital gains, if any. |
| (c) | Total return is the combination of changes in net asset value without any sales charge, reinvested dividend income at net asset value and reinvested capital gains distributions at net asset value, if any. Total returns are not annualized. |
| (d) | Ratios do not reflect the effect of custodian fee credits earned on the Fund’s net cash on deposit with the custodian bank, where applicable. |
| (e) | Effective May 1, 2008, Class R Shares were renamed Class I Shares. |
| (f) | For the period August 4, 2008 (commencement of operations) through June 30, 2009. |
| * | Annualized. |
| ** | Amount rounds to less than $.01 per share. |
See accompanying notes to financial statements.
| Nuveen Investments | 77 |
Financial Highlights (continued)
| Selected data for a share outstanding throughout each period: | ||||||||||||||||||||||||||||||||
| Class (Commencement Date) | ||||||||||||||||||||||||||||||||
| Investment Operations | Less Distributions | |||||||||||||||||||||||||||||||
| LARGE-CAP VALUE | ||||||||||||||||||||||||||||||||
| Year Ended June 30, | Beginning Net Asset Value | Net (Loss)(a) | Net (Loss) | Total | Net Invest- ment Income | Capital Gains(b) | Total | Ending Net Asset Value | ||||||||||||||||||||||||
Class A (12/06) |
| |||||||||||||||||||||||||||||||
| 2011 | $ | 14.73 | $ | .03 | $ | 3.83 | $ | 3.86 | $ | (.03 | ) | $ | — | $ | (.03 | ) | $ | 18.56 | ||||||||||||||
2010 | 12.71 | .03 | 1.99 | 2.02 | — | — | — | 14.73 | ||||||||||||||||||||||||
2009 | 17.41 | .10 | (4.73 | ) | (4.63 | ) | (.07 | ) | — | (.07 | ) | 12.71 | ||||||||||||||||||||
2008 | 21.38 | .15 | (4.04 | ) | (3.89 | ) | (.08 | ) | — | ** | (.08 | ) | 17.41 | |||||||||||||||||||
2007(f) | 20.00 | .12 | 1.26 | 1.38 | — | — | — | 21.38 | ||||||||||||||||||||||||
Class B (12/06) |
| |||||||||||||||||||||||||||||||
| 2011 | 14.48 | (.10 | ) | 3.76 | 3.66 | — | — | — | 18.14 | |||||||||||||||||||||||
2010 | 12.60 | (.09 | ) | 1.97 | 1.88 | — | — | — | 14.48 | |||||||||||||||||||||||
2009 | 17.28 | — | ** | (4.68 | ) | (4.68 | ) | — | — | — | 12.60 | |||||||||||||||||||||
2008 | 21.30 | — | ** | (4.02 | ) | (4.02 | ) | — | — | ** | — | ** | 17.28 | |||||||||||||||||||
2007(f) | 20.00 | — | ** | 1.30 | 1.30 | — | — | — | 21.30 | |||||||||||||||||||||||
Class C (12/06) |
| |||||||||||||||||||||||||||||||
| 2011 | 14.49 | (.09 | ) | 3.75 | 3.66 | — | — | — | 18.15 | |||||||||||||||||||||||
2010 | 12.60 | (.08 | ) | 1.97 | 1.89 | — | — | — | 14.49 | |||||||||||||||||||||||
2009 | 17.28 | — | ** | (4.68 | ) | (4.68 | ) | — | — | — | 12.60 | |||||||||||||||||||||
2008 | 21.30 | — | ** | (4.02 | ) | (4.02 | ) | — | — | ** | — | ** | 17.28 | |||||||||||||||||||
2007(f) | 20.00 | .02 | 1.28 | 1.30 | — | — | — | 21.30 | ||||||||||||||||||||||||
Class R3 (9/09) |
| |||||||||||||||||||||||||||||||
| 2011 | 14.71 | (.01 | ) | 3.83 | 3.82 | — | — | — | 18.53 | |||||||||||||||||||||||
2010(g) | 15.24 | — | ** | (.53 | ) | (.53 | ) | — | — | — | 14.71 | |||||||||||||||||||||
Class I (12/06)(e) |
| |||||||||||||||||||||||||||||||
| 2011 | 14.75 | .08 | 3.83 | 3.91 | (.07 | ) | — | (.07 | ) | 18.59 | ||||||||||||||||||||||
2010 | 12.72 | .08 | 1.97 | 2.05 | (.02 | ) | — | (.02 | ) | 14.75 | ||||||||||||||||||||||
2009 | 17.43 | .12 | (4.72 | ) | (4.60 | ) | (.11 | ) | — | (.11 | ) | 12.72 | ||||||||||||||||||||
2008 | 21.41 | .20 | (4.05 | ) | (3.85 | ) | (.13 | ) | — | ** | (.13 | ) | 17.43 | |||||||||||||||||||
2007(f) | 20.00 | .15 | 1.26 | 1.41 | — | — | — | 21.41 | ||||||||||||||||||||||||
| 78 | Nuveen Investments |
| Ratios/Supplemental Data | ||||||||||||||||||||||||||
| Ratios to Average Net Assets Before Reimbursement | Ratios to Average Net Assets After Reimbursement(d) | |||||||||||||||||||||||||
| Total Return(c) | Ending Net Assets (000) | Expenses | Net Invest- ment Income (Loss) | Expenses | Net Invest- ment Income (Loss) | Portfolio Turnover Rate | ||||||||||||||||||||
| 26.22 | % | $ | 26,143 | 1.20 | % | .19 | % | 1.20 | % | .19 | % | 27 | % | |||||||||||||
| 15.89 | 13,820 | 1.32 | .20 | 1.32 | .20 | 15 | ||||||||||||||||||||
| (26.57 | ) | 6,075 | 1.61 | .49 | 1.35 | .76 | 16 | |||||||||||||||||||
| (18.24 | ) | 5,080 | 1.66 | .45 | 1.33 | .77 | 13 | |||||||||||||||||||
| 6.90 | 2,358 | 3.12 | * | (.84 | )* | 1.33 | * | .95 | * | — | **** | |||||||||||||||
| 25.28 | 575 | 1.95 | (.56 | ) | 1.95 | (.56 | ) | 27 | ||||||||||||||||||
| 14.92 | 456 | 2.07 | (.60 | ) | 2.07 | (.60 | ) | 15 | ||||||||||||||||||
| (27.13 | ) | 405 | 2.35 | (.22 | ) | 2.10 | .03 | 16 | ||||||||||||||||||
| (18.82 | ) | 835 | 2.43 | (.34 | ) | 2.08 | — | *** | 13 | |||||||||||||||||
| 6.50 | 281 | 4.68 | * | (2.66 | )* | 2.08 | * | (.06 | )* | — | **** | |||||||||||||||
| 25.26 | 8,660 | 1.95 | (.55 | ) | 1.95 | (.55 | ) | 27 | ||||||||||||||||||
| 15.00 | 4,665 | 2.07 | (.55 | ) | 2.07 | (.55 | ) | 15 | ||||||||||||||||||
| (27.13 | ) | 2,217 | 2.37 | (.25 | ) | 2.10 | .02 | 16 | ||||||||||||||||||
| (18.82 | ) | 2,484 | 2.42 | (.33 | ) | 2.08 | — | *** | 13 | |||||||||||||||||
| 6.50 | 1,117 | 3.83 | * | (1.62 | )* | 2.08 | * | .13 | * | — | **** | |||||||||||||||
| 25.97 | 61 | 1.45 | (.06 | ) | 1.45 | (.06 | ) | 27 | ||||||||||||||||||
| (3.48 | ) | 48 | 1.58 | * | (.02 | )* | 1.58 | * | (.02 | )* | 15 | |||||||||||||||
| 26.54 | 400,859 | .95 | .45 | .95 | .45 | 27 | ||||||||||||||||||||
| 16.13 | 253,558 | 1.08 | .53 | 1.08 | .53 | 15 | ||||||||||||||||||||
| (26.35 | ) | 52,618 | 1.36 | .71 | 1.10 | .97 | 16 | |||||||||||||||||||
| (18.05 | ) | 15,719 | 1.40 | .71 | 1.08 | 1.02 | 13 | |||||||||||||||||||
| 7.05 | 8,513 | 2.65 | * | (.32 | )* | 1.08 | * | 1.25 | * | — | **** | |||||||||||||||
| (a) | Per share Net Investment Income (Loss) is calculated using the average daily shares method. |
| (b) | Distributions from Capital Gains include short-term capital gains, if any. |
| (c) | Total return is the combination of changes in net asset value without any sales charge, reinvested dividend income at net asset value and reinvested capital gains distributions at net asset value, if any. Total returns are not annualized. |
| (d) | After expense reimbursement from the Adviser, where applicable. Ratios do not reflect the effect of custodian fee credits earned on the Fund’s net cash on deposit with the custodian bank, where applicable. |
| (e) | Effective May 1, 2008, Class R Shares were renamed Class I Shares. |
| (f) | For the period December 15, 2006 (commencement of operations) through June 30, 2007. |
| (g) | For the period September 29, 2009 (commencement of operations) through June 30, 2010. |
| * | Annualized. |
| ** | Rounds to less than $.01 per share. |
| *** | Rounds to less than .01%. |
| **** | Rounds to less than 1%. |
See accompanying notes to financial statements.
| Nuveen Investments | 79 |
Financial Highlights (continued)
| Selected data for a share outstanding throughout each period: | ||||||||||||||||||||||||||||||||
| Class (Commencement Date) | ||||||||||||||||||||||||||||||||
| Investment Operations | Less Distributions | |||||||||||||||||||||||||||||||
| SMALL/MID-CAP VALUE | ||||||||||||||||||||||||||||||||
| Year Ended June 30, | Beginning Net Asset Value | Net Invest- ment Income (Loss)(a) | Net (Loss) | Total | Net Invest- ment Income | Capital Gains(b) | Total | Ending Net Asset Value | ||||||||||||||||||||||||
Class A (12/06) |
| |||||||||||||||||||||||||||||||
2011 | $ | 14.32 | $ | (.09 | ) | $ | 5.68 | $ | 5.59 | $ | — | $ | — | $ | — | $ | 19.91 | |||||||||||||||
2010 | 11.05 | (.09 | ) | 3.36 | 3.27 | — | — | — | 14.32 | |||||||||||||||||||||||
2009 | 17.12 | — | ** | (6.07 | ) | (6.07 | ) | — | — | — | 11.05 | |||||||||||||||||||||
2008 | 21.37 | (.09 | ) | (4.16 | ) | (4.25 | ) | — | ** | — | — | ** | 17.12 | |||||||||||||||||||
2007(f) | 20.00 | .15 | 1.22 | 1.37 | — | — | — | 21.37 | ||||||||||||||||||||||||
Class C (12/06) |
| |||||||||||||||||||||||||||||||
| 2011 | 13.93 | (.22 | ) | 5.51 | 5.29 | — | — | — | 19.22 | |||||||||||||||||||||||
2010 | 10.83 | (.19 | ) | 3.29 | 3.10 | — | — | — | 13.93 | |||||||||||||||||||||||
2009 | 16.92 | (.07 | ) | (6.02 | ) | (6.09 | ) | — | — | — | 10.83 | |||||||||||||||||||||
2008 | 21.28 | (.22 | ) | (4.14 | ) | (4.36 | ) | — | — | — | 16.92 | |||||||||||||||||||||
2007(f) | 20.00 | .05 | 1.23 | 1.28 | — | — | — | 21.28 | ||||||||||||||||||||||||
Class R3 (9/09) |
| |||||||||||||||||||||||||||||||
| 2011 | 14.19 | (.13 | ) | 5.62 | 5.49 | — | — | — | 19.68 | |||||||||||||||||||||||
2010(g) | 13.53 | (.09 | ) | .75 | .66 | — | — | — | 14.19 | |||||||||||||||||||||||
Class I (12/06)(e) |
| |||||||||||||||||||||||||||||||
| 2011 | 14.24 | (.05 | ) | 5.66 | 5.61 | — | — | — | 19.85 | |||||||||||||||||||||||
2010 | 10.96 | (.05 | ) | 3.33 | 3.28 | — | — | — | 14.24 | |||||||||||||||||||||||
2009 | 17.11 | (.01 | ) | (6.14 | ) | (6.15 | ) | — | — | — | 10.96 | |||||||||||||||||||||
2008 | 21.41 | (.04 | ) | (4.21 | ) | (4.25 | ) | (.05 | ) | — | (.05 | ) | 17.11 | |||||||||||||||||||
2007(f) | 20.00 | .49 | .92 | 1.41 | — | — | — | 21.41 | ||||||||||||||||||||||||
| 80 | Nuveen Investments |
| Ratios/Supplemental Data | ||||||||||||||||||||||||||
| Ratios to Average Net Assets Before Reimbursement | Ratios to Average Net Assets After Reimbursement(d) | |||||||||||||||||||||||||
| Total Return(c) | Ending Net Assets (000) | Expenses | Net Invest- ment Income (Loss) | Expenses | Net Invest- ment Income (Loss) | Portfolio Turnover Rate | ||||||||||||||||||||
| 39.13 | % | $ | 5,261 | 1.88 | % | (1.04 | )% | 1.33 | % | (.50 | )% | 46 | % | |||||||||||||
| 29.50 | % | 3,267 | 2.32 | (1.51 | ) | 1.44 | (.63 | ) | 64 | |||||||||||||||||
| (35.34 | ) | 1,382 | 3.03 | (1.60 | ) | 1.45 | (.02 | ) | 204 | |||||||||||||||||
| (20.02 | )*** | 3,595 | 1.65 | (.70 | ) | 1.43 | (.49 | ) | 84 | |||||||||||||||||
| 6.85 | 1,098 | 2.54 | * | .23 | * | 1.43 | * | 1.34 | * | 1 | ||||||||||||||||
| 38.07 | 1,202 | 2.62 | (1.80 | ) | 2.08 | (1.26 | ) | 46 | ||||||||||||||||||
| 28.53 | 636 | 3.11 | (2.29 | ) | 2.19 | (1.37 | ) | 64 | ||||||||||||||||||
| (35.88 | ) | 610 | 4.11 | (2.50 | ) | 2.20 | (.59 | ) | 204 | |||||||||||||||||
| (20.63 | )*** | 1,093 | 2.39 | (1.40 | ) | 2.18 | (1.20 | ) | 84 | |||||||||||||||||
| 6.40 | 974 | 3.22 | * | (.65 | )* | 2.18 | * | .39 | * | 1 | ||||||||||||||||
| 38.69 | 73 | 2.13 | (1.29 | ) | 1.58 | (.74 | ) | 46 | ||||||||||||||||||
| 4.88 | 52 | 2.54 | * | (1.67 | )* | 1.69 | * | (.81 | )* | 64 | ||||||||||||||||
| 39.40 | 14,803 | 1.62 | (.80 | ) | 1.08 | (.26 | ) | 46 | ||||||||||||||||||
| 29.93 | 7,279 | 2.09 | (1.26 | ) | 1.19 | (.36 | ) | 64 | ||||||||||||||||||
| (35.98 | ) | 3,792 | 1.44 | (.33 | ) | 1.20 | (.08 | ) | 204 | |||||||||||||||||
| (19.82 | )*** | 38,574 | 1.16 | (.20 | ) | 1.16 | (.20 | ) | 84 | |||||||||||||||||
| 7.05 | 216,872 | 1.49 | * | 3.93 | * | 1.16 | * | 4.25 | * | 1 | ||||||||||||||||
| (a) | Per share Net Investment Income (Loss) is calculated using the average daily shares method. |
| (b) | Distributions from Capital Gains include short-term capital gains, if any. |
| (c) | Total return is the combination of changes in net asset value without any sales charge, reinvested dividend income at net asset value and reinvested capital gains distributions at net asset value, if any. Total returns are not annualized. |
| (d) | After expense reimbursement from the Adviser, where applicable. Ratios do not reflect the effect of custodian fee credits earned on the Fund’s net cash on deposit with the custodian bank, where applicable. |
| (e) | Effective May 1, 2008, Class R Shares were renamed Class I Shares. |
| (f) | For the period December 15, 2006 (commencement of operations) through June 30, 2007. |
| (g) | For the period September 29, 2009 (commencement of operations) through June 30, 2010. |
| * | Annualized. |
| ** | Rounds to less than $.01 per share. |
| *** | During the year ended June 30, 2008, the Adviser reimbursed the Fund $89,561 for a cash balance maintained in the Fund. This reimbursement resulted in an increase of .23%, .28%, ..19% and .14% to Classes A, B, C and I, respectively. |
See accompanying notes to financial statements.
| Nuveen Investments | 81 |
Financial Highlights (continued)
| Selected data for a share outstanding throughout each period: | ||||||||||||||||||||||||||||||||||||
| Class (Commencement Date) | ||||||||||||||||||||||||||||||||||||
| Investment Operations | Less Distributions | |||||||||||||||||||||||||||||||||||
| SMALL-CAP VALUE | ||||||||||||||||||||||||||||||||||||
| Year Ended June 30, | Beginning Net Asset Value | Net Invest- ment Income (Loss)(a) | Net Realized/ Unrealized Gain (Loss) | Total | Net Invest- ment Income | Capital Gains(b) | Return of Capital | Total | Ending Net Asset Value | |||||||||||||||||||||||||||
Class A (12/04) |
| |||||||||||||||||||||||||||||||||||
2011 | $ | 18.30 | $ | (.18 | ) | $ | 7.10 | $ | 6.92 | $ | — | $ | — | $ | — | $ | — | $ | 25.22 | |||||||||||||||||
2010 | 14.14 | (.10 | ) | 4.27 | 4.17 | (.01 | ) | — | — | (.01 | ) | 18.30 | ||||||||||||||||||||||||
2009 | 23.29 | .02 | (9.17 | ) | (9.15 | ) | — | — | — | — | 14.14 | |||||||||||||||||||||||||
2008 | 30.12 | (.04 | ) | (6.08 | ) | (6.12 | ) | (.02 | ) | (.69 | ) | — | ** | (.71 | ) | 23.29 | ||||||||||||||||||||
2007 | 26.10 | .13 | 4.05 | 4.18 | (.04 | ) | (.12 | ) | — | (.16 | ) | 30.12 | ||||||||||||||||||||||||
Class C (12/04) |
| |||||||||||||||||||||||||||||||||||
2011 | 17.68 | (.35 | ) | 6.87 | 6.52 | — | — | — | — | 24.20 | ||||||||||||||||||||||||||
2010 | 13.76 | (.21 | ) | 4.13 | 3.92 | — | — | — | — | 17.68 | ||||||||||||||||||||||||||
2009 | 22.83 | (.11 | ) | (8.96 | ) | (9.07 | ) | — | — | — | — | 13.76 | ||||||||||||||||||||||||
2008 | 29.73 | (.23 | ) | (5.98 | ) | (6.21 | ) | — | (.69 | ) | — | (.69 | ) | 22.83 | ||||||||||||||||||||||
2007 | 25.91 | (.08 | ) | 4.02 | 3.94 | — | (.12 | ) | — | (.12 | ) | 29.73 | ||||||||||||||||||||||||
Class R3 (9/09) |
| |||||||||||||||||||||||||||||||||||
2011 | 18.37 | (.25 | ) | 7.14 | 6.89 | — | — | — | — | 25.26 | ||||||||||||||||||||||||||
2010(f) | 18.07 | (.08 | ) | .38 | .30 | — | — | — | — | 18.37 | ||||||||||||||||||||||||||
Class I (12/04)(e) |
| |||||||||||||||||||||||||||||||||||
2011 | 18.40 | (.14 | ) | 7.16 | 7.02 | — | — | — | — | 25.42 | ||||||||||||||||||||||||||
2010 | 14.21 | (.04 | ) | 4.28 | 4.24 | (.05 | ) | — | — | (.05 | ) | 18.40 | ||||||||||||||||||||||||
2009 | 23.34 | .05 | (9.18 | ) | (9.13 | ) | — | — | — | — | 14.21 | |||||||||||||||||||||||||
2008 | 30.18 | .02 | (6.08 | ) | (6.06 | ) | (.08 | ) | (.69 | ) | (.01 | ) | (.78 | ) | 23.34 | |||||||||||||||||||||
2007 | 26.15 | .23 | 4.03 | 4.26 | (.11 | ) | (.12 | ) | — | (.23 | ) | 30.18 | ||||||||||||||||||||||||
| 82 | Nuveen Investments |
| Ratios/Supplemental Data | ||||||||||||||||||||||||||
| Ratios to Average Net Assets Before Reimbursement | Ratios to Average Net Assets After Reimbursement(d) | |||||||||||||||||||||||||
| Total Return(c) | Ending Net Assets (000) | Expenses | Net Invest- ment Income (Loss) | Expenses | Net Invest- ment Income (Loss) | Portfolio Turnover Rate | ||||||||||||||||||||
| 37.94 | % | $ | 7,365 | 1.43 | % | (.82 | )% | 1.43 | % | (.82 | )% | 51 | % | |||||||||||||
| 29.41 | 7,009 | 1.47 | (.56 | ) | 1.45 | (.54 | ) | 58 | ||||||||||||||||||
| (39.29 | ) | 7,733 | 1.46 | .13 | 1.46 | .13 | 71 | |||||||||||||||||||
| (20.41 | )�� | 54,264 | 1.47 | (.16 | ) | 1.47 | (.16 | ) | 48 | |||||||||||||||||
| 16.09 | 78,081 | 1.50 | .44 | 1.49 | .46 | 24 | ||||||||||||||||||||
| 36.96 | 4,401 | 2.18 | (1.58 | ) | 2.18 | (1.58 | ) | 51 | ||||||||||||||||||
| 28.42 | 3,494 | 2.21 | (1.23 | ) | 2.19 | (1.21 | ) | 58 | ||||||||||||||||||
| (39.70 | ) | 3,446 | 2.23 | (.70 | ) | 2.23 | (.70 | ) | 71 | |||||||||||||||||
| (21.03 | ) | 9,682 | 2.22 | (.91 | ) | 2.22 | (.91 | ) | 48 | |||||||||||||||||
| 15.26 | 17,290 | 2.25 | (.31 | ) | 2.24 | (.30 | ) | 24 | ||||||||||||||||||
| 37.64 | 75 | 1.68 | (1.08 | ) | 1.68 | (1.08 | ) | 51 | ||||||||||||||||||
| 1.60 | 51 | 1.68 | * | (.57 | )* | 1.68 | * | (.57 | )* | 58 | ||||||||||||||||
| 38.28 | 85,136 | 1.18 | (.58 | ) | 1.18 | (.58 | ) | 51 | ||||||||||||||||||
| 29.74 | 74,824 | 1.21 | (.23 | ) | 1.19 | (.21 | ) | 58 | ||||||||||||||||||
| (39.12 | ) | 62,423 | 1.24 | .29 | 1.24 | .29 | 71 | |||||||||||||||||||
| (20.22 | ) | 108,064 | 1.22 | .08 | 1.22 | .08 | 48 | |||||||||||||||||||
| 16.41 | 132,385 | 1.22 | .81 | 1.22 | .81 | 24 | ||||||||||||||||||||
| (a) | Per share Net Investment Income (Loss) is calculated using the average daily shares method. |
| (b) | Distributions from Capital Gains include short-term capital gains, if any. |
| (c) | Total return is the combination of changes in net asset value without any sales charge, reinvested dividend income at net asset value and reinvested capital gains distributions at net asset value, if any. Total returns are not annualized. |
| (d) | After expense reimbursement from the Adviser, where applicable. Ratios do not reflect the effect of custodian fee credits earned on the Fund’s net cash on deposit with the custodian bank, where applicable. |
| (e) | Effective May 1, 2008, Class R Shares were renamed Class I Shares. |
| (f) | For the period September 29, 2009 (commencement of operations) through June 30, 2010. |
| * | Annualized. |
| ** | Rounds to less than $.01 per share. |
See accompanying notes to financial statements.
| Nuveen Investments | 83 |
Financial Highlights (continued)
| Selected data for a share outstanding throughout each period: | ||||||||||||||||||||||||||||||||
| Class (Inception Date) | ||||||||||||||||||||||||||||||||
| Investment Operations | Less Distributions | |||||||||||||||||||||||||||||||
| VALUE OPPORTUNITIES | ||||||||||||||||||||||||||||||||
| Year Ended June 30, | Beginning Net Asset Value | Net Invest- ment Income (Loss)(a) | Net (Loss) | Total | Net Invest- ment Income | Capital Gains(b) | Total | Ending Net Asset Value | ||||||||||||||||||||||||
Class A (12/04) |
| |||||||||||||||||||||||||||||||
2011 | $ | 29.76 | $ | .23 | $ | 7.26 | $ | 7.49 | $ | (.51 | ) | $ | (1.16 | ) | $ | (1.67 | ) | $ | 35.58 | |||||||||||||
2010 | 24.17 | .13 | 5.46 | 5.59 | — | — | — | 29.76 | ||||||||||||||||||||||||
2009 | 29.60 | .20 | (4.53 | ) | (4.33 | ) | (.05 | ) | (1.05 | ) | (1.10 | ) | 24.17 | |||||||||||||||||||
2008 | 32.48 | .20 | (1.03 | ) | (.83 | ) | (.59 | ) | (1.46 | ) | (2.05 | ) | 29.60 | |||||||||||||||||||
2007 | 26.90 | .30 | 5.83 | 6.13 | (.29 | ) | (.26 | ) | (.55 | ) | 32.48 | |||||||||||||||||||||
Class B (12/04) |
| |||||||||||||||||||||||||||||||
2011 | 29.07 | (.04 | ) | 7.08 | 7.04 | (.26 | ) | (1.16 | ) | (1.42 | ) | 34.69 | ||||||||||||||||||||
2010 | 23.78 | (.09 | ) | 5.38 | 5.29 | — | — | — | 29.07 | |||||||||||||||||||||||
2009 | 29.29 | .03 | (4.49 | ) | (4.46 | ) | — | (1.05 | ) | (1.05 | ) | 23.78 | ||||||||||||||||||||
2008 | 32.15 | (.03 | ) | (1.02 | ) | (1.05 | ) | (.35 | ) | (1.46 | ) | (1.81 | ) | 29.29 | ||||||||||||||||||
2007 | 26.66 | .07 | 5.76 | 5.83 | (.08 | ) | (.26 | ) | (.34 | ) | 32.15 | |||||||||||||||||||||
Class C (12/04) |
| |||||||||||||||||||||||||||||||
2011 | 29.06 | (.03 | ) | 7.07 | 7.04 | (.26 | ) | (1.16 | ) | (1.42 | ) | 34.68 | ||||||||||||||||||||
2010 | 23.77 | (.09 | ) | 5.38 | 5.29 | — | — | — | 29.06 | |||||||||||||||||||||||
2009 | 29.29 | .03 | (4.50 | ) | (4.47 | ) | — | (1.05 | ) | (1.05 | ) | 23.77 | ||||||||||||||||||||
2008 | 32.16 | (.03 | ) | (1.03 | ) | (1.06 | ) | (.35 | ) | (1.46 | ) | (1.81 | ) | 29.29 | ||||||||||||||||||
2007 | 26.66 | .07 | 5.77 | 5.84 | (.08 | ) | (.26 | ) | (.34 | ) | 32.16 | |||||||||||||||||||||
Class R3 (8/08) |
| |||||||||||||||||||||||||||||||
2011 | 29.76 | .17 | 7.23 | 7.40 | (.43 | ) | (1.16 | ) | (1.59 | ) | 35.57 | |||||||||||||||||||||
2010 | 24.23 | .07 | 5.46 | 5.53 | — | — | — | 29.76 | ||||||||||||||||||||||||
2009(f) | 28.93 | .15 | (3.80 | ) | (3.65 | ) | — | (1.05 | ) | (1.05 | ) | 24.23 | ||||||||||||||||||||
Class I (12/04)(e) |
| |||||||||||||||||||||||||||||||
2011 | 29.87 | .31 | 7.29 | 7.60 | (.59 | ) | (1.16 | ) | (1.75 | ) | 35.72 | |||||||||||||||||||||
2010 | 24.19 | .20 | 5.48 | 5.68 | — | — | — | 29.87 | ||||||||||||||||||||||||
2009 | 29.66 | .26 | (4.57 | ) | (4.31 | ) | (.11 | ) | (1.05 | ) | (1.16 | ) | 24.19 | |||||||||||||||||||
2008 | 32.54 | .28 | (1.03 | ) | (.75 | ) | (.67 | ) | (1.46 | ) | (2.13 | ) | 29.66 | |||||||||||||||||||
2007 | 26.95 | .39 | 5.82 | 6.21 | (.36 | ) | (.26 | ) | (.62 | ) | 32.54 | |||||||||||||||||||||
| 84 | Nuveen Investments |
| Ratios/Supplemental Data | ||||||||||||||||||||||||||
| Ratios to Average Net Assets Before Reimbursement | Ratios to Average Net Assets After Reimbursement(d) | |||||||||||||||||||||||||
| Total Return(c) | Ending Net Assets (000) | Expenses | Net Invest- ment Income (Loss) | Expenses | Net Invest- ment Income (Loss) | Portfolio Turnover Rate | ||||||||||||||||||||
| 25.31 | % | $ | 1,291,888 | 1.20 | % | .65 | % | 1.20 | % | .65 | % | 77 | % | |||||||||||||
| 23.13 | 658,037 | 1.43 | .44 | 1.43 | .44 | 48 | ||||||||||||||||||||
| (13.47 | ) | 378,845 | 1.48 | .89 | 1.48 | .89 | 61 | |||||||||||||||||||
| (2.65 | ) | 368,093 | 1.42 | .63 | 1.42 | .63 | 48 | |||||||||||||||||||
| 22.98 | 248,827 | 1.39 | .99 | 1.39 | .99 | 23 | ||||||||||||||||||||
| 24.38 | 6,863 | 1.95 | (.13 | ) | 1.95 | (.13 | ) | 77 | ||||||||||||||||||
| 22.25 | 5,801 | 2.17 | (.32 | ) | 2.17 | (.32 | ) | 48 | ||||||||||||||||||
| (14.10 | ) | 5,080 | 2.22 | .14 | 2.22 | .14 | 61 | |||||||||||||||||||
| (3.39 | ) | 6,816 | 2.17 | (.11 | ) | 2.17 | (.11 | ) | 48 | |||||||||||||||||
| 22.04 | 5,521 | 2.14 | .24 | 2.14 | .24 | 23 | ||||||||||||||||||||
| 24.39 | 436,074 | 1.95 | (.07 | ) | 1.95 | (.07 | ) | 77 | ||||||||||||||||||
| 22.25 | 192,332 | 2.19 | (.31 | ) | 2.19 | (.31 | ) | 48 | ||||||||||||||||||
| (14.14 | ) | 98,742 | 2.22 | .14 | 2.22 | .14 | 61 | |||||||||||||||||||
| (3.39 | ) | 116,463 | 2.17 | (.10 | ) | 2.17 | (.10 | ) | 48 | |||||||||||||||||
| 22.04 | 100,295 | 2.14 | .24 | 2.14 | .24 | 23 | ||||||||||||||||||||
| 25.00 | 6,880 | 1.45 | .49 | 1.45 | .49 | 77 | ||||||||||||||||||||
| 22.82 | 1,444 | 1.71 | .22 | 1.71 | .22 | 48 | ||||||||||||||||||||
| (11.47 | ) | 414 | 1.76 | * | .73 | * | 1.75 | * | .75 | * | 61 | |||||||||||||||
| 25.64 | 1,749,117 | .95 | .91 | .95 | .91 | 77 | ||||||||||||||||||||
| 23.48 | 1,046,939 | 1.18 | .69 | 1.18 | .69 | 48 | ||||||||||||||||||||
| (13.29 | ) | 580,149 | 1.24 | 1.19 | 1.23 | 1.20 | 61 | |||||||||||||||||||
| (2.39 | ) | 278,649 | 1.17 | .89 | 1.17 | .89 | 48 | |||||||||||||||||||
| 23.30 | 161,284 | 1.14 | 1.28 | 1.14 | 1.28 | 23 | ||||||||||||||||||||
| (a) | Per share Net Investment Income (Loss) is calculated using the average daily shares method. |
| (b) | Distributions from Capital Gains include short-term capital gains, if any. |
| (c) | Total return is the combination of changes in net asset value without any sales charge, reinvested dividend income at net asset value and reinvested capital gains distributions at net asset value, if any. Total returns are not annualized. |
| (d) | After expense reimbursement from the Adviser, where applicable. Ratios do not reflect the effect of custodian fee credits earned on the Fund’s net cash on deposit with the custodian bank, where applicable. |
| (e) | Effective May 1, 2008, Class R Shares were renamed Class I Shares. |
| (f) | For the period August 4, 2008 (commencement of operations) through June 30, 2009. |
| * | Annualized. |
See accompanying notes to financial statements.
| Nuveen Investments | 85 |
1. General Information and Significant Accounting Policies
General Information
The Nuveen Investment Trust (the “Trust”) is an open-end management investment company registered under the Investment Company Act of 1940, as amended. The Trust is comprised of the Nuveen Multi-Manager Large-Cap Value Fund (“Multi-Manager Large-Cap Value”), Nuveen NWQ Multi-Cap Value Fund (“Multi-Cap Value”), Nuveen NWQ Large-Cap Value Fund (“Large-Cap Value”), Nuveen NWQ Small/Mid-Cap Value Fund (“Small/Mid-Cap Value”), Nuveen NWQ Small-Cap Value Fund (“Small-Cap Value”) and Nuveen Tradewinds Value Opportunities Fund (“Value Opportunities”) (each a “Fund” and collectively, the “Funds”), among others. The Trust was organized as a Massachusetts business trust in 1996.
Effective January 1, 2011, the Funds’ adviser, Nuveen Asset Management, a wholly-owned subsidiary of Nuveen Investments, Inc. (“Nuveen”), changed its name to Nuveen Fund Advisors, Inc. (the “Adviser”).
Effective April 30, 2011, Nuveen Investments, LLC, a wholly-owned subsidiary of Nuveen, changed its name to Nuveen Securities, LLC (the “Distributor”).
Multi-Manager Large-Cap Value’s investment objective is to provide long-term capital appreciation. Under normal market conditions, the Fund invests at least 80% of its net assets in equity securities of companies with market capitalizations comparable to companies in the Russell 1000® Value Index. The Fund will not be forced to sell a stock because it has exceeded or fallen below the current market capitalization range. The Fund’s investment portfolio is managed by three sub-advisers, Institutional Capital LLC (“ICAP”), Nuveen HypePark Group, LLC (“HydePark”) and Symphony Asset Management LLC (“Symphony”). HydePark and Symphony are subsidiaries of Nuveen. The Adviser maintains a strategic asset allocation of between 25% and 40% of the Fund’s assets with each sub-adviser. The Fund may also invest up to 25% of its net assets in non-U.S. equity securities that are U.S. dollar-denominated.
Multi-Cap Value’s investment objective is to provide long-term capital appreciation. Under normal market conditions, the Fund invests at least 80% of its net assets in equity securities of companies with large, medium and small capitalizations. The Fund’s sub-adviser, NWQ Investment Management Company, LLC (“NWQ”), maintains a long-term investment view and a focus on securities it believes can appreciate over an extended time, regardless of interim fluctuations. NWQ will sell securities or reduce positions if it feels that the company no longer possesses favorable risk/reward characteristics, attractive valuations or catalysts. The Fund invests primarily in U.S. equity securities, but it may invest up to 35% of its net assets in non-U.S. equity securities, including up to 10% of its net assets in equity securities of companies located in emerging market countries.
Large-Cap Value’s, Small/Mid-Cap Value’s and Small-Cap Value’s investment objective is to provide long-term capital appreciation. Under normal market conditions, Large-Cap Value and Small/Mid-Cap Value invest at least 80% of their net assets in equity securities of companies with market capitalizations at the time of investment comparable to companies in the Russell 1000® Index and Russell 2500® Value Index, respectively. Under normal market conditions, Small-Cap Value invests at least 80% of its net assets in equity securities of companies with market capitalizations at the time of investment comparable to companies in either the Russell® 2000 Value Index or the Standard & Poor’s Small Cap 600 Index. The Funds will not be forced to sell a stock because it has exceeded or fallen below the current market capitalization range. The Funds’ sub-adviser, NWQ, seeks to identify under-valued companies with a catalyst to unlock value or improve profitability. NWQ maintains a long-term investment view and a focus on securities it believes can appreciate over an extended time, regardless of interim fluctuations. Each Fund invests primarily in U.S. equity securities, but may invest up to 35% of its net assets in non-U.S. equity securities, including up to 10% of its net assets in equity securities of companies located in emerging market countries.
Value Opportunities’ investment objective is to provide long-term capital appreciation. Under normal market conditions, the Fund invests primarily in equity securities of companies with varying market capitalizations, which may include small-, mid- and large-capitalization companies. The Fund’s sub-adviser, Tradewinds Global Investors, LLC (“Tradewinds”), seeks to identify under-valued companies considering absolute valuation and security pricing in the context of industry and market conditions. Tradewinds’ disciplined, value-oriented investment strategy focuses on rigorous financial statements and valuation analysis, qualitative factors and portfolio downside protection. The Fund invests primarily in U.S. equity securities, but it may invest up to 35% of its net assets in non-U.S. equity securities, including up to 15% of its net assets in equity securities of companies located in emerging market countries.
The Funds’ most recent prospectus provides further description of each Fund’s investment objective, principal strategies, and principal risks.
Significant Accounting Policies
The following is a summary of significant accounting policies followed by the Funds in the preparation of their financial statements in accordance with accounting principles generally accepted in the United States (“U.S. GAAP”).
Investment Valuation
Common stocks and other equity-type securities are valued at the last sales price on the securities exchange on which such securities are primarily traded and are generally classified as Level 1 for fair value measurement purposes. Securities primarily traded on the NASDAQ National Market (“NASDAQ”) are valued, except as indicated below, at the NASDAQ Official Closing Price and are
| 86 | Nuveen Investments |
generally classified as Level 1. However, securities traded on a securities exchange or NASDAQ for which there were no transactions on a given day or securities not listed on a securities exchange or NASDAQ are valued at the quoted bid price. Prices of certain American Depository Receipts (“ADR”) held by the Funds that trade in only limited volume in the United States are valued based on the last traded price, official closing price, or the most recent bid price of the underlying non-U.S.-traded stock, adjusted as appropriate for the underlying-to-ADR conversion ratio and foreign exchange rate, and from time-to-time may also be adjusted further to take into account material events that may take place after the close of the local non-U.S. market but before the close of the New York Stock Exchange. These securities generally represent a transfer from a Level 1 to a Level 2 security. Investments in investment companies are valued at their respective net asset values on valuation date. These investment vehicles are generally classified as Level 1.
Prices of fixed-income securities are provided by a pricing service approved by the Funds’ Board of Trustees. These securities are generally classified as Level 2. When price quotes are not readily available, the pricing service establishes a security’s fair value using methods that may include consideration of the following: yields or prices of investments of comparable quality, type of issue, coupon, maturity and rating, market quotes or indications of value from security dealers, evaluations of anticipated cash flows or collateral, general market conditions and other information and analysis, including the obligor’s credit characteristics considered relevant. In pricing certain securities, particularly less liquid and lower quality securities, the pricing service may consider information about a security, its issuer, or market activity provided by the Adviser. These securities are generally classified as Level 2 or Level 3 depending on the priority of the significant inputs.
Repurchase agreements are valued at contract amount plus accrued interest, which approximates market value. These securities are generally classified as Level 2.
Certain securities may not be able to be priced by the pre-established pricing methods as described above. Such securities may be valued by the Funds’ Board of Trustees or its designee at fair value. These securities generally include, but are not limited to, restricted securities (securities which may not be publicly sold without registration under the Securities Act of 1933, as amended) for which a pricing service is unable to provide a market price; securities whose trading has been formally suspended; debt securities that have gone into default and for which there is no current market quotation; a security whose market price is not available from a pre-established pricing source; a security with respect to which an event has occurred that is likely to materially affect the value of the security after the market has closed but before the calculation of a Fund’s net asset value (as may be the case in non-U.S. markets on which the security is primarily traded) or make it difficult or impossible to obtain a reliable market quotation; and a security whose price, as provided by the pricing service, is not deemed to reflect the security’s fair value. As a general principle, the fair value of a security would appear to be the amount that the owner might reasonably expect to receive for it in a current sale. A variety of factors may be considered in determining the fair value of such securities, which may include consideration of the following: yields or prices of investments of comparable quality, type of issue, coupon, maturity and rating, market quotes or indications of value from security dealers, evaluations of anticipated cash flows or collateral, general market conditions and other information and analysis, including the obligor’s credit characteristics considered relevant. These securities are generally classified as Level 2 or Level 3 depending on the priority of the significant inputs. Regardless of the method employed to value a particular security, all valuations are subject to review by the Funds’ Board of Trustees or its designee.
Refer to Footnote 2 – Fair Value Measurements for further details on the leveling of securities held by the Funds as of the end of the reporting period.
Investment Transactions
Investment transactions are recorded on a trade date basis. Realized gains and losses from investment transactions are determined on the specific identification method, which is the same basis used for federal income tax purposes. Investments purchased on a when-issued/delayed delivery basis may have extended settlement periods. Any investments so purchased are subject to market fluctuation during this period. The Funds have instructed the custodian to segregate assets with a current value at least equal to the amount of the when-issued/delayed delivery purchase commitments. At June 30, 2011, there were no such outstanding purchase commitments in any of the Funds.
Investment Income
Dividend income is recorded on the ex-dividend date or, for foreign securities, when information is available. Interest income, which includes the amortization of premiums and accretion of discounts for financial reporting purposes, is recorded on an accrual basis. Interest income also includes paydown gains and losses, if any.
Professional Fees
Professional fees presented on the Statement of Operations consist of legal fees incurred in the normal course of operations, audit fees, tax consulting fees and, in some cases, workout expenditures. Workout expenditures are incurred in an attempt to protect or enhance an investment, or to pursue other claims or legal actions on behalf of Fund shareholders.
Income Taxes
Each Fund is a separate taxpayer for federal income tax purposes. Each Fund intends to distribute substantially all of its net investment income and net capital gains to shareholders and to otherwise comply with the requirements of Subchapter M of the Internal Revenue Code applicable to regulated investment companies. Therefore, no federal income tax provision is required.
| Nuveen Investments | 87 |
Notes to Financial Statements (continued)
For all open tax years and all major taxing jurisdictions, management of the Funds has concluded that there are no significant uncertain tax positions that would require recognition in the financial statements. Open tax years are those that are open for examination by taxing authorities (i.e., generally the last four tax year ends and the interim tax period since then). Furthermore, management of the Funds is also not aware of any tax positions for which it is reasonably possible that the total amounts of unrecognized tax benefits will significantly change in the next twelve months.
Dividends and Distributions to Shareholders
Dividends from net investment income and net realized capital gains from investment transactions, if any, are declared and distributed to shareholders at least annually. Furthermore, capital gains are distributed only to the extent they exceed available capital loss carryforwards.
Distributions to shareholders are recorded on the ex-dividend date. The amount and timing of distributions are determined in accordance with federal income tax regulations, which may differ from U.S. GAAP.
In-Kind Redemptions
In certain circumstances, a Fund may distribute portfolio securities rather than cash as payment for redemption of Fund shares (in-kind redemption). For financial reporting purposes, the Fund recognizes a gain on the in-kind redemptions to the extent the value of the distributed securities on the date of redemption exceeds the cost of those securities; the Fund recognizes a loss if cost exceeds value. Gains and losses realized on the in-kind redemptions are not recognized for tax purposes, and are reclassified from undistributed realized gain or loss to paid-in capital. During the fiscal year ended June 30, 2011, Large-Cap Value realized $(2,103,361) of net loss on in-kind redemptions.
Flexible Sales Charge Program
Class A Shares are generally sold with an up-front sales charge and incur a .25% annual 12b-1 service fee. Class A Share purchases of $1 million or more are sold at net asset value without an up-front sales charge but may be subject to a contingent deferred sales charge (“CDSC”) if redeemed within twelve months of purchase. Class B Shares were sold without an up-front sales charge but incur a .75% annual 12b-1 distribution fee and a .25% annual 12b-1 service fee. Class B Shares are subject to a CDSC of up to 5% depending upon the length of time the shares are held by the investor (CDSC is reduced to 0% at the end of six years). Class B Shares convert to Class A Shares eight years after purchase. Class C Shares are sold without an up-front sales charge but incur a .75% annual 12b-1 distribution fee and a .25% annual 12b-1 service fee. Class C Shares are subject to a CDSC of 1% if redeemed within twelve months of purchase. Class R3 Shares are sold without an up-front sales charge but incur a .50% annual 12b-1 distribution and service fee. Class I Shares are not subject to any sales charge or 12b-1 distribution or service fees.
Foreign Currency Transactions
Each Fund is authorized to engage in foreign currency exchange transactions, including foreign currency forwards, futures, options and swap contracts. To the extent that the Funds invest in securities and/or contracts that are denominated in a currency other than U.S. dollars, the Funds will be subject to currency risk, which is the risk that an increase in the U.S. dollar relative to the foreign currency will reduce returns or portfolio value. Generally, when the U.S. dollar rises in value against a foreign currency, the Funds’ investments denominated in that currency will lose value because its currency is worth fewer U.S. dollars; the opposite effect occurs if the U.S. dollar falls in relative value. Investments and other assets and liabilities denominated in foreign currencies are converted into U.S. dollars on a spot (i.e. cash) basis at the spot rate prevailing in the foreign currency exchange market at the time of valuation. Purchases and sales of investments and income denominated in foreign currencies are translated into U.S. dollars on the respective dates of such transactions.
The books and records of the Funds are maintained in U.S. dollars. Foreign currencies, investments and other assets and liabilities are translated into U.S. dollars at 4:00 p.m. Eastern time. Investments, income and expenses are translated on the respective dates of such transactions. Net realized foreign currency gains and losses resulting from changes in exchange rates include foreign currency gains and losses between trade date and settlement date of the transactions, foreign currency transactions, and the difference between the amounts of interest and dividends recorded on the books of a Fund and the amounts actually received.
The realized gains and losses resulting from changes in foreign currency exchange rates and changes in foreign exchange rates associated with other assets and liabilities on investments are recognized as a component of “Net realized gain (loss) from investments and foreign currency,” when applicable.
The unrealized gains and losses resulting from changes in foreign currency exchange rates and changes in foreign exchange rates associated with other assets and liabilities on investments are recognized as a component of “Change in net unrealized appreciation (depreciation) of investments and foreign currency,” when applicable.
Market and Counterparty Credit Risk
In the normal course of business each Fund may invest in financial instruments and enter into financial transactions where risk of potential loss exists due to changes in the market (market risk) or failure of the other party to the transaction to perform (counterparty credit risk). The potential loss could exceed the value of the financial assets recorded on the financial statements. Financial assets, which potentially expose each Fund to counterparty credit risk, consist principally of cash due from counterparties on forward, option and swap transactions, when applicable. The extent of each Fund’s exposure to counterparty credit risk in respect to these financial assets approximates their carrying value as recorded on the Statement of Assets and Liabilities. Futures contracts, when
| 88 | Nuveen Investments |
applicable, expose a Fund to minimal counterparty credit risk as they are exchange traded and the exchange’s clearinghouse, which is counterparty to all exchange traded futures, guarantees the futures contracts against default.
Each Fund helps manage counterparty credit risk by entering into agreements only with counterparties the Adviser believes have the financial resources to honor their obligations and by having the Adviser monitor the financial stability of the counterparties. Additionally, counterparties may be required to pledge collateral daily (based on the daily valuation of the financial asset) on behalf of each Fund with a value approximately equal to the amount of any unrealized gain above a pre-determined threshold. Reciprocally, when each Fund has an unrealized loss, the Funds have instructed the custodian to pledge assets of the Funds as collateral with a value approximately equal to the amount of the unrealized loss above a pre-determined threshold. Collateral pledges are monitored and subsequently adjusted if and when the valuations fluctuate, either up or down, by at least the predetermined threshold amount.
Derivative Financial Instruments
Each Fund is authorized to invest in certain derivative instruments, including foreign currency forwards, futures, options and swap contracts. Although the Funds are authorized to invest in such derivative instruments, and may do so in the future, they did not make any such investments during the fiscal year ended June 30, 2011.
Repurchase Agreements
In connection with transactions in repurchase agreements, it is each Fund’s policy that its custodian take possession of the underlying collateral securities, the fair value of which exceeds the principal amount of the repurchase transaction, including accrued interest, at all times. If the counterparty defaults, and the fair value of the collateral declines, realization of the collateral may be delayed or limited.
Multiclass Operations and Allocations
Income and expenses of the Funds that were not directly attributable to a specific class of shares were prorated among the classes based on the relative net assets of each class. Expenses directly attributable to a class of shares, which presently only include 12b-1 distribution and service fees, are recorded to the specific class.
Realized and unrealized capital gains and losses of the Funds are prorated among the classes based on the relative net assets of each class.
Custodian Fee Credit
Each Fund has an arrangement with the custodian bank whereby certain custodian fees and expenses are reduced by net credits earned on each Fund’s cash on deposit with the bank. Such deposit arrangements are an alternative to overnight investments. Credits for cash balances may be offset by charges for any days on which a Fund overdraws its account at the custodian bank.
Indemnifications
Under the Trust’s organizational documents, its officers and trustees are indemnified against certain liabilities arising out of the performance of their duties to the Trust. In addition, in the normal course of business, the Trust enters into contracts that provide general indemnifications to other parties. The Trust’s maximum exposure under these arrangements is unknown as this would involve future claims that may be made against the Trust that have not yet occurred. However, the Trust has not had prior claims or losses pursuant to these contracts and expects the risk of loss to be remote.
Use of Estimates
The preparation of financial statements in conformity with U.S. GAAP requires management to make estimates and assumptions that affect the reported amounts of assets and liabilities at the date of the financial statements and the reported amounts of increases and decreases in net assets from operations during the reporting period. Actual results may differ from those estimates.
2. Fair Value Measurements
Fair value is defined as the price that the Funds would receive upon selling an investment or transferring a liability in an orderly transaction to an independent buyer in the principal or most advantageous market for the investment. A three-tier hierarchy is used to maximize the use of observable market data and minimize the use of unobservable inputs and to establish classification of fair value measurements for disclosure purposes. Observable inputs reflect the assumptions market participants would use in pricing the asset or liability. Observable inputs are based on market data obtained from sources independent of the reporting entity. Unobservable inputs reflect the reporting entity’s own assumptions about the assumptions market participants would use in pricing the asset or liability. Unobservable inputs are based on the best information available in the circumstances. The three-tier hierarchy of inputs is summarized in the three broad levels listed below:
| Level 1 – | Quoted prices in active markets for identical securities. | |
| Level 2 – | Other significant observable inputs (including quoted prices for similar securities, interest rates, prepayment speeds, credit risk, etc.). | |
| Level 3 – | Significant unobservable inputs (including management’s assumptions in determining the fair value of investments). |
| Nuveen Investments | 89 |
Notes to Financial Statements (continued)
The inputs or methodologies used for valuing securities are not an indication of the risk associated with investing in those securities.
The following is a summary of each Fund’s fair value measurements as of June 30, 2011:
| Multi-Manager Large-Cap Value | Level 1 | Level 2 | Level 3 | Total | ||||||||||||
Investments: | ||||||||||||||||
Common Stocks | $ | 338,919,334 | $ | — | $ | — | $ | 338,919,334 | ||||||||
Investment Companies | 3,414,000 | — | — | 3,414,000 | ||||||||||||
Short-Term Investments | — | 2,792,818 | — | 2,792,818 | ||||||||||||
Total | $ | 342,333,334 | $ | 2,792,818 | $ | — | $ | 345,126,152 | ||||||||
| Multi-Cap Value | Level 1 | Level 2 | Level 3 | Total | ||||||||||||
Investments: | ||||||||||||||||
Common Stocks | $ | 352,778,204 | $ | — | $ | — | $ | 352,778,204 | ||||||||
Short-Term Investments | — | 9,054,457 | — | 9,054,457 | ||||||||||||
Total | $ | 352,778,204 | $ | 9,054,457 | $ | — | $ | 361,832,661 | ||||||||
| Large-Cap Value | Level 1 | Level 2 | Level 3 | Total | ||||||||||||
Investments: | ||||||||||||||||
Common Stocks | $ | 422,588,477 | $ | — | $ | — | $ | 422,588,477 | ||||||||
Short-Term Investments | — | 15,438,501 | — | 15,438,501 | ||||||||||||
Total | $ | 422,588,477 | $ | 15,438,501 | $ | — | $ | 438,026,978 | ||||||||
| Small/Mid-Cap Value | Level 1 | Level 2 | Level 3 | Total | ||||||||||||
Investments: | ||||||||||||||||
Common Stocks | $ | 20,711,587 | $ | — | $ | — | $ | 20,711,587 | ||||||||
| Small-Cap Value | Level 1 | Level 2 | Level 3 | Total | ||||||||||||
Investments: | ||||||||||||||||
Common Stocks | $ | 100,830,849 | $ | — | $ | — | $ | 100,830,849 | ||||||||
Short-Term Investments | — | 6,248,550 | — | 6,248,550 | ||||||||||||
Total | $ | 100,830,849 | $ | 6,248,550 | $ | — | $ | 107,079,399 | ||||||||
| Value Opportunities | Level 1 | Level 2 | Level 3 | Total | ||||||||||||
Investments: | ||||||||||||||||
Common Stocks* | $ | 2,359,826,086 | $ | 376,230,389 | $ | — | $ | 2,736,056,475 | ||||||||
Convertible Preferred Securities | 50,250,070 | 31,498,125 | — | 81,748,195 | ||||||||||||
Convertible Bonds | — | 71,880,637 | — | 71,880,637 | ||||||||||||
Short-Term Investments | — | 510,362,069 | — | 510,362,069 | ||||||||||||
Total | $ | 2,410,076,156 | $ | 989,971,220 | $ | — | $ | 3,400,047,376 | ||||||||
| * | Refer to the Fund’s Portfolio of Investments for industry breakdown of Common Stocks classified as Level 2. |
During the fiscal year ended June 30, 2011, the Funds recognized no significant transfers to or from Level 1, Level 2 or Level 3.
3. Derivative Instruments and Hedging Activities
The Funds record derivative instruments at fair value, with changes in fair value recognized on the Statement of Operations, when applicable. Even though the Funds’ investments in derivatives may represent economic hedges, they are not considered to be hedge transactions for financial reporting purposes. The Funds did not invest in derivative instruments during the fiscal year ended June 30, 2011.
| 90 | Nuveen Investments |
4. Fund Shares
Transactions in Fund shares were as follows:
| Multi-Manager Large-Cap Value | ||||||||||||||||
| Year Ended 6/30/11 | Year Ended 6/30/10 | |||||||||||||||
| Shares | Amount | Shares | Amount | |||||||||||||
Shares sold: | ||||||||||||||||
Class A | 1,146,918 | $ | 21,421,203 | 1,676,101 | $ | 28,372,824 | ||||||||||
Class A – automatic conversion of Class B Shares | 6,381 | 125,090 | 13,936 | 235,899 | ||||||||||||
Class B | 4,726 | 87,375 | 1,985 | 33,090 | ||||||||||||
Class C | 78,056 | 1,447,381 | 97,095 | 1,600,643 | ||||||||||||
Class R3 | 5,307 | 108,254 | — | — | ||||||||||||
Class I | 421,332 | 8,186,886 | 420,151 | 7,220,894 | ||||||||||||
Shares issued to shareholders due to reinvestment of distributions: | ||||||||||||||||
Class A | 137,700 | 2,645,224 | 223,062 | 3,843,347 | ||||||||||||
Class B | 350 | 6,555 | 1,268 | 21,300 | ||||||||||||
Class C | 3,150 | 58,810 | 7,793 | 130,619 | ||||||||||||
Class R3 | — | — | — | — | ||||||||||||
Class I | 17,140 | 330,279 | 22,111 | 382,077 | ||||||||||||
| 1,821,060 | 34,417,057 | 2,463,502 | 41,840,693 | |||||||||||||
Shares redeemed: | ||||||||||||||||
Class A | (2,529,784 | ) | (47,871,458 | ) | (2,910,640 | ) | (49,432,426 | ) | ||||||||
Class B | (36,822 | ) | (669,595 | ) | (80,313 | ) | (1,311,698 | ) | ||||||||
Class B – automatic conversion to Class A Shares | (6,544 | ) | (125,090 | ) | (14,332 | ) | (235,899 | ) | ||||||||
Class C | (184,860 | ) | (3,387,231 | ) | (252,676 | ) | (4,153,799 | ) | ||||||||
Class R3 | (4,045 | ) | (75,035 | ) | — | — | ||||||||||
Class I | (374,681 | ) | (7,219,331 | ) | (185,922 | ) | (3,182,865 | ) | ||||||||
| (3,136,736 | ) | (59,347,740 | ) | (3,443,883 | ) | (58,316,687 | ) | |||||||||
Net increase (decrease) | (1,315,676 | ) | $ | (24,930,683 | ) | (980,381 | ) | $ | (16,475,994 | ) | ||||||
| Multi-Cap Value | ||||||||||||||||
| Year Ended 6/30/11 | Year Ended 6/30/10 | |||||||||||||||
| Shares | Amount | Shares | Amount | |||||||||||||
Shares sold: | ||||||||||||||||
Class A | 257,568 | $ | 4,693,322 | 627,873 | $ | 9,323,721 | ||||||||||
Class A – automatic conversion of Class B Shares | 1,662 | 29,720 | 2,673 | 42,121 | ||||||||||||
Class B | 738 | 13,235 | 8,749 | 123,334 | ||||||||||||
Class C | 206,600 | 3,691,066 | 184,090 | 2,656,674 | ||||||||||||
Class R3 | — | — | 5,266 | 80,000 | ||||||||||||
Class I | 5,275,849 | 94,106,955 | 10,184,665 | 153,008,493 | ||||||||||||
Shares issued to shareholders due to reinvestment of distributions: | ||||||||||||||||
Class A | — | — | 11,622 | 178,402 | ||||||||||||
Class B | — | — | — | — | ||||||||||||
Class C | — | — | — | — | ||||||||||||
Class R3 | — | — | — | — | ||||||||||||
Class I | — | — | 49,684 | 762,150 | ||||||||||||
| 5,742,417 | 102,534,298 | 11,074,622 | 166,174,895 | |||||||||||||
Shares redeemed: | ||||||||||||||||
Class A | (1,219,158 | ) | (21,543,518 | ) | (2,751,308 | ) | (41,130,477 | ) | ||||||||
Class B | (271,607 | ) | (4,594,805 | ) | (280,574 | ) | (4,105,538 | ) | ||||||||
Class B – automatic conversion to Class A Shares | (1,726 | ) | (29,720 | ) | (2,766 | ) | (42,121 | ) | ||||||||
Class C | (1,330,310 | ) | (22,630,843 | ) | (1,778,572 | ) | (25,758,309 | ) | ||||||||
Class R3 | (5,545 | ) | (95,540 | ) | — | — | ||||||||||
Class I | (8,977,010 | ) | (155,489,812 | ) | (13,730,474 | ) | (196,332,437 | ) | ||||||||
| (11,805,356 | ) | (204,384,238 | ) | (18,543,694 | ) | (267,368,882 | ) | |||||||||
Net increase (decrease) | (6,062,939 | ) | $ | (101,849,940 | ) | (7,469,072 | ) | $ | (101,193,987 | ) | ||||||
| Nuveen Investments | 91 |
Notes to Financial Statements (continued)
| Large-Cap Value | ||||||||||||||||
| Year Ended 6/30/11 | Year Ended 6/30/10 | |||||||||||||||
| Shares | Amount | Shares | Amount | |||||||||||||
Shares sold: | ||||||||||||||||
Class A | 750,248 | $ | 13,506,650 | 751,282 | $ | 11,492,047 | ||||||||||
Class B | 2,507 | 44,509 | 6,984 | 104,974 | ||||||||||||
Class C | 231,440 | 4,162,335 | 198,629 | 2,979,285 | ||||||||||||
Class R3 | — | — | 3,281 | 50,000 | ||||||||||||
Class I | 12,462,365 | 225,699,002 | 15,731,019 | 251,410,162 | ||||||||||||
Shares issued to shareholders due to reinvestment of distributions: | ||||||||||||||||
Class A | 1,685 | 30,408 | — | — | ||||||||||||
Class B | — | — | — | — | ||||||||||||
Class C | — | — | — | — | ||||||||||||
Class R3 | — | — | — | — | ||||||||||||
Class I | 61,650 | 1,112,787 | 9,607 | 150,445 | ||||||||||||
| 13,509,895 | 244,555,691 | 16,700,802 | 266,186,913 | |||||||||||||
Shares redeemed: | ||||||||||||||||
Class A | (281,473 | ) | (4,910,989 | ) | (290,821 | ) | (4,518,603 | ) | ||||||||
Class B | (2,321 | ) | (41,081 | ) | (7,652 | ) | (117,818 | ) | ||||||||
Class C | (76,312 | ) | (1,320,386 | ) | (52,499 | ) | (789,834 | ) | ||||||||
Class R3 | — | — | — | — | ||||||||||||
Class I | (7,359,209 | ) | (126,907,090 | ) | (2,686,292 | ) | (41,433,140 | ) | ||||||||
Class I – In-kind | (790,197 | ) | (14,097,131 | ) | — | — | ||||||||||
| (8,509,512 | ) | (147,276,677 | ) | (3,037,264 | ) | (46,859,395 | ) | |||||||||
Net increase (decrease) | 5,000,383 | $ | 97,279,014 | 13,663,538 | $ | 219,327,518 | ||||||||||
| Small/Mid-Cap Value | ||||||||||||||||
| Year Ended 6/30/11 | Year Ended 6/30/10 | |||||||||||||||
Shares | Amount | Shares | Amount | |||||||||||||
Shares sold: | ||||||||||||||||
Class A | 125,266 | $ | 2,330,322 | 241,034 | $ | 3,457,571 | ||||||||||
Class B | — | — | — | — | ||||||||||||
Class C | 38,567 | 717,006 | 8,768 | 126,801 | ||||||||||||
Class R3 | — | — | 3,695 | 50,000 | ||||||||||||
Class I | 402,138 | 7,541,976 | 362,144 | 5,120,214 | ||||||||||||
Shares issued to shareholders due to reinvestment of distributions: | ||||||||||||||||
Class A | — | — | — | — | ||||||||||||
Class B | — | — | — | — | ||||||||||||
Class C | — | — | — | — | ||||||||||||
Class R3 | — | — | — | — | ||||||||||||
Class I | — | — | — | — | ||||||||||||
| 565,971 | 10,589,304 | 615,641 | 8,754,586 | |||||||||||||
Shares redeemed: | ||||||||||||||||
Class A | (89,087 | ) | (1,569,528 | ) | (138,059 | ) | (2,080,874 | ) | ||||||||
Class B | — | — | (3,131 | ) | (41,857 | ) | ||||||||||
Class C | (21,715 | ) | (381,001 | ) | (19,452 | ) | (273,599 | ) | ||||||||
Class R3 | — | — | — | — | ||||||||||||
Class I | (167,368 | ) | (3,083,642 | ) | (197,171 | ) | (2,793,671 | ) | ||||||||
| (278,170 | ) | (5,034,171 | ) | (357,813 | ) | (5,190,001 | ) | |||||||||
Net increase (decrease) | 287,801 | $ | 5,555,133 | 257,828 | $ | 3,564,585 | ||||||||||
| 92 | Nuveen Investments |
| Small-Cap Value | ||||||||||||||||
| Year Ended 6/30/11 | Year Ended 6/30/10 | |||||||||||||||
Shares | Amount | Shares | Amount | |||||||||||||
Shares sold: | ||||||||||||||||
Class A | 137,861 | $ | 3,142,610 | 382,855 | $ | 7,506,236 | ||||||||||
Class B | — | — | — | — | ||||||||||||
Class C | 34,660 | 799,980 | 48,848 | 835,965 | ||||||||||||
Class R3 | 214 | 5,400 | 2,767 | 50,000 | ||||||||||||
Class I | 1,616,836 | 37,621,393 | 1,072,278 | 19,255,993 | ||||||||||||
Shares issued to shareholders due to reinvestment of distributions: | ||||||||||||||||
Class A | — | — | 157 | 2,887 | ||||||||||||
Class B | — | — | — | — | ||||||||||||
Class C | — | — | — | — | ||||||||||||
Class R3 | — | — | — | — | ||||||||||||
Class I | — | — | 9,463 | 175,154 | ||||||||||||
| 1,789,571 | 41,569,383 | 1,516,368 | 27,826,235 | |||||||||||||
Shares redeemed: | ||||||||||||||||
Class A | (228,916 | ) | (5,393,959 | ) | (546,989 | ) | (9,955,503 | ) | ||||||||
Class B | — | — | (12,603 | ) | (214,987 | ) | ||||||||||
Class C | (50,367 | ) | (1,124,106 | ) | (101,700 | ) | (1,781,003 | ) | ||||||||
Class R3 | — | — | — | — | ||||||||||||
Class I | (2,335,883 | ) | (57,003,254 | ) | (1,407,884 | ) | (26,071,503 | ) | ||||||||
| (2,615,166 | ) | (63,521,319 | ) | (2,069,176 | ) | (38,022,996 | ) | |||||||||
Net increase (decrease) | (825,595 | ) | $ | (21,951,936 | ) | (552,808 | ) | $ | (10,196,761 | ) | ||||||
| Value Opportunities | ||||||||||||||||
| Year Ended 6/30/11 | Year Ended 6/30/10 | |||||||||||||||
Shares | Amount | Shares | Amount | |||||||||||||
Shares sold: | ||||||||||||||||
Class A | 21,475,323 | $ | 744,550,597 | 14,799,422 | $ | 432,820,362 | ||||||||||
Class A – automatic conversion of Class B Shares | 738 | 24,973 | 268 | 8,362 | ||||||||||||
Class B | 15,614 | 530,405 | 12,924 | 368,325 | ||||||||||||
Class C | 6,952,830 | 235,972,429 | 3,311,121 | 96,049,664 | ||||||||||||
Class R3 | 187,394 | 6,566,510 | 39,711 | 1,215,106 | ||||||||||||
Class I | 28,299,535 | 984,873,233 | 18,071,924 | 529,280,948 | ||||||||||||
Shares issued to shareholders due to reinvestment of distributions: | ||||||||||||||||
Class A | 1,243,318 | 43,508,206 | — | — | ||||||||||||
Class B | 6,776 | 230,906 | — | — | ||||||||||||
Class C | 268,889 | 9,160,217 | — | — | ||||||||||||
Class R3 | 901 | 31,501 | — | — | ||||||||||||
Class I | 1,130,122 | 39,706,895 | — | — | ||||||||||||
| 59,581,440 | 2,065,155,872 | 36,235,370 | 1,059,742,767 | |||||||||||||
Shares redeemed: | ||||||||||||||||
Class A | (8,516,105 | ) | (296,306,385 | ) | (8,367,527 | ) | (241,527,563 | ) | ||||||||
Class B | (23,366 | ) | (786,635 | ) | (26,775 | ) | (769,996 | ) | ||||||||
Class B – automatic conversion to Class A Shares | (748 | ) | (24,973 | ) | (273 | ) | (8,362 | ) | ||||||||
Class C | (1,266,428 | ) | (42,580,995 | ) | (846,652 | ) | (24,411,478 | ) | ||||||||
Class R3 | (43,378 | ) | (1,517,789 | ) | (8,289 | ) | (243,107 | ) | ||||||||
Class I | (15,510,421 | ) | (526,456,237 | ) | (7,004,555 | ) | (205,984,556 | ) | ||||||||
| (25,360,446 | ) | (867,673,014 | ) | (16,254,071 | ) | (472,945,062 | ) | |||||||||
Net increase (decrease) | 34,220,994 | $ | 1,197,482,858 | 19,981,299 | $ | 586,797,705 | ||||||||||
5. Investment Transactions
Purchases and sales (including maturities but excluding short-term investments, where applicable) during the fiscal year ended June 30, 2011, were as follows:
| Multi-Manager Large-Cap Value | Multi-Cap Value | Large-Cap Value | Small/Mid-Cap Value | Small-Cap Value | Value Opportunities | |||||||||||||||||||
Purchases | $ | 258,539,282 | $ | 88,006,300 | $ | 186,379,498 | $ | 12,724,259 | $ | 54,026,276 | $ | 2,551,876,728 | ||||||||||||
Sales and maturities | 279,171,784 | 193,576,396 | 90,608,414 | 7,529,722 | 69,555,605 | 1,772,925,742 | ||||||||||||||||||
| Nuveen Investments | 93 |
Notes to Financial Statements (continued)
6. Income Tax Information
The following information is presented on an income tax basis. Differences between amounts for financial statement and federal income tax purposes are primarily due to timing differences in recognizing certain gains and losses on investment transactions. To the extent that differences arise that are permanent in nature, such amounts are reclassified within the capital accounts as detailed below. Temporary differences do not require reclassification. Temporary and permanent differences do not impact the net asset values of the Funds.
At June 30, 2011, the cost and unrealized appreciation (depreciation) of investments, as determined on a federal income tax basis, were as follows:
| Multi-Manager Large-Cap Value | Multi-Cap Value | Large-Cap Value | Small/Mid-Cap Value | Small-Cap Value | Value Opportunities | |||||||||||||||||||
Cost of investments | $ | 296,635,784 | $ | 308,293,842 | $ | 391,591,825 | $ | 17,034,389 | $ | 89,454,529 | $ | 3,142,396,504 | ||||||||||||
Gross unrealized: | ||||||||||||||||||||||||
Appreciation | $ | 61,173,225 | $ | 76,741,303 | $ | 51,817,587 | $ | 4,270,615 | $ | 27,537,048 | $ | 310,948,688 | ||||||||||||
Depreciation | (12,682,857 | ) | (23,202,484 | ) | (5,382,434 | ) | (593,417 | ) | (9,912,178 | ) | (53,297,816 | ) | ||||||||||||
Net unrealized appreciation (depreciation) of investments | $ | 48,490,368 | $ | 53,538,819 | $ | 46,435,153 | $ | 3,677,198 | $ | 17,624,870 | $ | 257,650,872 | ||||||||||||
Permanent differences, primarily due to federal taxes paid, net operating losses, tax equalization, foreign currency reclassifications, adjustments for investments in passive foreign investment companies, redemption-in-kind and litigation proceeds, resulted in reclassifications among the Funds’ components of net assets at June 30, 2011, the Funds’ tax year-end, as follows:
| Multi-Manager Large-Cap Value | Multi-Cap Value | Large-Cap Value | Small/Mid-Cap Value | Small-Cap Value | Value Opportunities | |||||||||||||||||||
Capital paid-in | $ | — | $ | (433,497 | ) | $ | (2,424,794 | ) | $ | (63,507 | ) | $ | (710,475 | ) | $ | 25,521,840 | ||||||||
Undistributed (Over-distribution of) net investment income | 11,920 | 434,006 | 517 | 63,507 | 710,456 | 70,972,709 | ||||||||||||||||||
Accumulated net realized gain (loss) | (11,920 | ) | (509 | ) | 2,424,277 | — | 19 | (96,494,549 | ) | |||||||||||||||
The tax components of undistributed net ordinary income and net long-term capital gains at June 30, 2011, the Funds’ tax year end, were as follows:
| Multi-Manager Large-Cap Value | Multi-Cap Value | Large-Cap Value | Small/Mid-Cap Value | Small-Cap Value | Value Opportunities | |||||||||||||||||||
Undistributed net ordinary income* | $ | 3,641,860 | $ | — | $ | 1,418,089 | $ | — | $ | — | $ | 122,128,274 | ||||||||||||
Undistributed net long-term capital gains | — | — | 3,391,164 | — | — | 114,312,328 | ||||||||||||||||||
| * | Net ordinary income consists of net taxable income derived from dividends, interest, and net short-term capital gains, if any. |
The tax character of distributions paid during the Funds’ tax years ended June 30, 2011 and June 30, 2010, was designated for purposes of the dividends paid deduction as follows:
| 2011 | Multi-Manager Large-Cap Value | Multi-Cap Value | Large-Cap Value | Small/Mid-Cap Value | Small-Cap Value | Value Opportunities | ||||||||||||||||||
Distributions from net ordinary income* | $ | 3,855,693 | $ | — | $ | 1,202,964 | $ | — | $ | — | $ | 89,346,972 | ||||||||||||
Distributions from net long-term capital gains | — | — | — | — | — | 34,808,611 | ||||||||||||||||||
Return of capital | — | — | — | — | — | — | ||||||||||||||||||
| 2010 | Multi-Manager Large-Cap Value | Multi-Cap Value | Large-Cap Value | Small/Mid-Cap Value | Small-Cap Value | Value Opportunities | ||||||||||||||||||
Distributions from net ordinary income* | $ | 5,598,084 | $ | 673,015 | $ | 165,020 | $ | — | $ | 195,735 | $ | — | ||||||||||||
Distributions from net long-term capital gains | — | — | — | — | — | — | ||||||||||||||||||
Return of capital | — | 368,431 | — | — | — | — | ||||||||||||||||||
| * | Net ordinary income consists of net taxable income derived from dividends, interest, and net short-term capital gains, if any. |
At June 30, 2011, the Funds’ tax year end, the following Funds had unused capital loss carryforwards available for federal tax purposes to be applied against future capital gains, if any. If not applied, the carryforwards will expire as follows:
| Multi-Manager Large-Cap Value | Multi-Cap Value | Small/Mid-Cap Value | Small-Cap Value | |||||||||||||
Expiration: | ||||||||||||||||
June 30, 2016 | $ | — | $ | — | $ | 11,203,437 | $ | — | ||||||||
June 30, 2017 | — | 169,314,405 | 21,132,667 | 6,583,384 | ||||||||||||
June 30, 2018 | 64,168,763 | 100,615,795 | 838,796 | 46,609,617 | ||||||||||||
Total | $ | 64,168,763 | $ | 269,930,200 | $ | 33,174,900 | $ | 53,193,001 | ||||||||
| 94 | Nuveen Investments |
Small/Mid-Cap Value’s capital loss carryforward is subject to an annual limitation under the Internal Revenue Code and related regulations.
During the Funds’ tax year ended June 30, 2011, the following Funds utilized their capital loss carryforwards as follows:
| Multi-Manager Large-Cap Value | Multi-Cap Value | Large-Cap Value | Small/Mid-Cap Value | Small-Cap Value | ||||||||||||||||
Utilized capital loss carryforwards | $ | 26,445,014 | $ | 21,882,568 | $ | 3,754,035 | $ | 1,862,025 | $ | 12,849,013 | ||||||||||
7. Management Fees and Other Transactions with Affiliates
Each Fund’s management fee consists of two components – a fund-level fee, based only on the amount of assets within each individual Fund, and a complex-level fee, based on the aggregate amount of all eligible fund assets managed by the Adviser. This pricing structure enables each Fund’s shareholders to benefit from growth in the assets within their respective Fund as well as from growth in the amount of complex-wide assets managed by the Adviser.
The annual fund-level fee for each Fund, payable monthly, is calculated according to the following schedule:
| Average Daily Net Assets | Multi-Manager Large-Cap Value Fund-Level Fee Rate | Multi-Cap Value Fund-Level Fee Rate | Large-Cap Value Fund-Level Fee Rate | Small/Mid-Cap Value Fund-Level Fee Rate | Small-Cap Value Fund-Level Fee Rate | Value Opportunities Fund-Level Fee Rate | ||||||||||||||||||
For the first $125 million | .5500 | % | .6300 | % | .5500 | % | .6000 | % | .7500 | % | .6300 | % | ||||||||||||
For the next $125 million | .5375 | .6175 | .5375 | .5875 | .7375 | .6175 | ||||||||||||||||||
For the next $250 million | .5250 | .6050 | .5250 | .5750 | .7250 | .6050 | ||||||||||||||||||
For the next $500 million | .5125 | .5925 | .5125 | .5625 | .7125 | .5925 | ||||||||||||||||||
For the next $1 billion | .5000 | .5800 | .5000 | .5500 | .7000 | .5800 | ||||||||||||||||||
For net assets over $2 billion | .4750 | .5550 | .4750 | .5250 | .6750 | .5550 | ||||||||||||||||||
The annual complex-level fee for each Fund, payable monthly, is calculated according to the following schedule:
| Complex-Level Asset Breakpoint Level* | Effective Rate at Breakpoint Level | |||
$55 billion | .2000 | % | ||
$56 billion | .1996 | |||
$57 billion | .1989 | |||
$60 billion | .1961 | |||
$63 billion | .1931 | |||
$66 billion | .1900 | |||
$71 billion | .1851 | |||
$76 billion | .1806 | |||
$80 billion | .1773 | |||
$91 billion | .1691 | |||
$125 billion | .1599 | |||
$200 billion | .1505 | |||
$250 billion | .1469 | |||
$300 billion | .1445 | |||
| * | The complex-level fee is calculated based upon the aggregate daily “eligible assets” of all Nuveen Funds. Eligible assets do not include assets attributable to investments in other Nuveen Funds or assets in excess of $2 billion added to the Nuveen Fund complex in connection with the Adviser’s assumption of the management of the former First American Funds effective January 1, 2011. Eligible assets include closed-end fund assets managed by the Adviser that are attributable to financial leverage. For these purposes, financial leverage includes the closed-end funds’ use of preferred stock and borrowings and certain investments in the residual interest certificates (also called inverse floating rate securities) in tender option bond (TOB) trusts, including the portion of assets held by a TOB trust that has been effectively financed by the trust’s issuance of floating rate securities, subject to an agreement by the Adviser as to certain funds to limit the amount of such assets for determining eligible assets in certain circumstances. As of June 30, 2011, the complex-level fee rate for each of these Funds was .1774%. |
The management fee compensates the Adviser for overall investment advisory and administrative services and general office facilities. The Adviser has entered into sub-advisory agreements with HydePark, Symphony, ICAP, NWQ and Tradewinds (collectively, the “Sub-Advisers”). The Sub-Advisers are compensated for their services to the Funds from the management fees paid to the Adviser.
The Adviser has agreed to waive fees and reimburse expenses (“Expense Cap”) so that total annual fund operating expenses (excluding 12b-1 distribution and service fees, interest expenses, taxes, fees incurred in acquiring and disposing of portfolio securities and extraordinary expenses) do not exceed the average daily net assets of any class of Fund shares in the amounts and for the time periods stated in the following table.
| Nuveen Investments | 95 |
Notes to Financial Statements (continued)
| Fund | Temporary Expense Cap | Temporary Expense Cap Expiration Date | Permanent Expense Cap | |||||||||
Multi-Manager Large-Cap Value | 0.95 | % | October 31, 2011 | 1.20 | % | |||||||
NWQ Large-Cap Value | 1.10 | October 31, 2011 | 1.35 | |||||||||
NWQ Small/Mid-Cap Value | 1.10 | October 31, 2011 | 1.45 | |||||||||
NWQ Small-Cap Value | 1.25 | July 31, 2010 | 1.50 | |||||||||
Tradewinds Value Opportunities | N/A | N/A | 1.50 | |||||||||
The Adviser may voluntarily reimburse expenses from time to time in any of the Funds. Voluntary reimbursements may be terminated at any time at the Adviser's discretion.
The Trust pays no compensation directly to those of its trustees who are affiliated with the Adviser or to its officers, all of whom receive remuneration for their services to the Trust from the Adviser or its affiliates. The Board of Trustees has adopted a deferred compensation plan for independent trustees that enables trustees to elect to defer receipt of all or a portion of the annual compensation they are entitled to receive from certain Nuveen advised funds. Under the plan, deferred amounts are treated as though equal dollar amounts had been invested in shares of select Nuveen advised funds.
During the fiscal year ended June 30, 2011, the Distributor collected sales charges on purchases of Class A Shares, the majority of which were paid out as concessions to financial intermediaries as follows:
| Multi-Manager Large-Cap Value | Multi-Cap Value | Large-Cap Value | Small/Mid-Cap Value | Small-Cap Value | Value Opportunities | |||||||||||||||||||
Sales charges collected (Unaudited) | $ | 34,594 | $ | 28,358 | $ | 69,048 | $ | 15,279 | $ | 6,654 | $ | 3,893,410 | ||||||||||||
Paid to financial intermediaries (Unaudited) | 30,286 | 24,796 | 63,429 | 13,358 | 5,799 | 3,452,382 | ||||||||||||||||||
The Distributor also received 12b-1 service fees on Class A Shares, substantially all of which were paid to compensate financial intermediaries for providing services to shareholders relating to their investments.
During the fiscal year ended June 30, 2011, the Distributor compensated financial intermediaries directly with commission advances at the time of purchase as follows:
| Multi-Manager Large-Cap Value | Multi-Cap Value | Large-Cap Value | Small/Mid-Cap Value | Small-Cap Value | Value Opportunities | |||||||||||||||||||
Commission advances (Unaudited) | $ | 8,956 | $ | 31,388 | $ | 61,697 | $ | 5,251 | $ | 6,470 | $ | 2,598,662 | ||||||||||||
To compensate for commissions advanced to financial intermediaries, all 12b-1 service fees collected on Class B Shares during the first year following a purchase, all 12b-1 distribution fees collected on Class B Shares, and all 12b-1 service and distribution fees collected on Class C Shares during the first year following a purchase are retained by the Distributor. During the fiscal year ended June 30, 2011, the Distributor retained such 12b-1 fees as follows:
| Multi-Manager Large-Cap Value | Multi-Cap Value | Large-Cap Value | Small/Mid-Cap Value | Small-Cap Value | Value Opportunities | |||||||||||||||||||
12b-1 fees retained (Unaudited) | $ | 26,459 | $ | 146,940 | $ | 32,381 | $ | 2,988 | $ | 5,839 | $ | 1,627,904 | ||||||||||||
The remaining 12b-1 fees charged to the Funds were paid to compensate financial intermediaries for providing services to shareholders relating to their investments.
The Distributor also collected and retained CDSC on share redemptions during the fiscal year ended June 30, 2011, as follows:
| Multi-Manager Large-Cap Value | Multi-Cap Value | Large-Cap Value | Small/Mid-Cap Value | Small-Cap Value | Value Opportunities | |||||||||||||||||||
CDSC retained (Unaudited) | $ | 2,226 | $ | 51,892 | $ | 1,442 | $ | 393 | $ | 518 | $ | 86,768 | ||||||||||||
At June 30, 2011, Nuveen owned shares of the Funds as follows:
| Multi-Manager Large-Cap Value | Multi-Cap Value | Large-Cap Value | Small/Mid-Cap Value | Small-Cap Value | Value Opportunities | |||||||||||||||||||
Class A | — | 165 | — | — | — | — | ||||||||||||||||||
Class B | — | — | — | N/A | N/A | — | ||||||||||||||||||
Class C | — | 84 | — | — | — | — | ||||||||||||||||||
Class R3 | 2,757 | 2,978 | 3,281 | 3,695 | 2,767 | 1,432 | ||||||||||||||||||
Class I | — | 84 | — | — | — | — | ||||||||||||||||||
| 96 | Nuveen Investments |
8. New Accounting Pronouncements
Financial Accounting Standards Board (“FASB”) Transfers and Servicing (Topic 860): Reconsideration of Effective Control for Repurchase Agreements.
On April 15, 2011, the FASB issued Accounting Standards Update (“ASU”) No. 2011-03 (“ASU No. 2011-03”). The guidance in the ASU No. 2011-03 is intended to improve the accounting for repurchase and other similar agreements. Specifically, ASU No. 2011-03 modifies the criteria for determining when these agreements would be accounted for as financing transactions (secured borrowings/lending agreements) as opposed to sale (purchase) transactions with commitments to repurchase (resell). The effective date of ASU No. 2011-03 is for interim and annual periods beginning on or after December 15, 2011. At this time, management is evaluating the implications of this guidance and the impact it will have to the financial statement amounts or footnote disclosures, if any.
Fair Value Measurements and Disclosures
On May 12, 2011, the FASB issued ASU No. 2011-04 modifying Topic 820, Fair Value Measurements and Disclosures. At the same time, the International Accounting Standards Board (“IASB”) issued International Financial Reporting Standard (“IFRS”) 13, Fair Value Measurement. The objective of the FASB and IASB is convergence of their guidance on fair value measurements and disclosures. Specifically, ASU No. 2011-04 requires reporting entities to disclose i) the amounts of any transfers between Level 1 and Level 2, and the reasons for the transfers, ii) for Level 3 fair value measurements, a) quantitative information about significant unobservable inputs used, b) a description of the valuation processes used by the reporting entity and c) a narrative description of the sensitivity of the fair value measurement to changes in unobservable inputs if a change in those inputs might result in a significantly higher or lower fair value measurement. The effective date of ASU No. 2011-04 is for interim and annual periods beginning after December 15, 2011. At this time, management is evaluating the implications of this guidance and the impact it will have on the financial statement amounts and footnote disclosures, if any.
9. Subsequent Events
Effective at the close of business on July 29, 2011, Value Opportunities will be closed to new investments, except for investments by the following categories of investors:
| • | Existing shareholders of record as of July 29, 2011; |
| • | Defined contribution retirement plans that purchase shares of the fund prior to October 31, 2011; |
| • | Full-time and retired employees of Nuveen and its affiliates as well as their immediate family members; |
| • | Officers, trustees and former trustees of the Nuveen funds; and |
| • | Benefit plans sponsored by Nuveen or its affiliates. |
Effective July 1, 2011, Multi-Manager Large Cap Value, Large-Cap Value and Small Mid-Cap Value each had their respective Temporary Expense Cap extended to October 31, 2012.
| Nuveen Investments | 97 |
Trustees and Officers (Unaudited)
The management of the Funds, including general supervision of the duties performed for the Funds by the Adviser, is the responsibility of the Board of Trustees of the Funds. The number of trustees of the Funds is currently set at ten. None of the trustees who are not “interested” persons of the Funds (referred to herein as “independent trustees”) has ever been a director or employee of, or consultant to, Nuveen or its affiliates. The names and business addresses of the trustees and officers of the Funds, their principal occupations and other affiliations during the past five years, the number of portfolios each oversees and other directorships they hold are set forth below.
The Funds’ Statement of Additional Information (“SAI”) includes more information about the trustees. To request a free copy, call Nuveen Investments at (800) 257-8787 or visit the Funds’ website at www.nuveen.com.
Name, Birthdate and Address | Position(s) Held with the Funds | Year First Elected or Appointed (1) | Principal Occupation(s) Including other Directorships During Past 5 Years | Number of Portfolios in Fund Complex Overseen by Trustee | ||||
| Independent Trustees: | ||||||||
Robert P. Bremner (2) 8/22/40 333 W. Wacker Drive Chicago, IL 60606 | Chairman of the Board and Trustee | 1996 | Private Investor and Management Consultant; Treasurer and Director, Humanities Council of Washington, D.C.; Board Member, Independent Directors Council affiliated with the Investment Company Institute. | 245 | ||||
Jack B. Evans 10/22/48 333 W. Wacker Drive Chicago, IL 60606 | Trustee | 1999 | President, The Hall-Perrine Foundation, a private philanthropic corporation (since 1996); Director and Chairman, United Fire Group, a publicly held company; member of the Board of Regents for the State of Iowa University System; Director, Source Media Group; Life Trustee of Coe College and the Iowa College Foundation; formerly, Director, Alliant Energy; formerly, Director, Federal Reserve Bank of Chicago; formerly, President and Chief Operating Officer, SCI Financial Group, Inc., a regional financial services firm. | 245 | ||||
William C. Hunter 3/6/48 333 W. Wacker Drive Chicago, IL 60606 | Trustee | 2004 | Dean, Tippie College of Business, University of Iowa (since 2006); Director (since 2004) of Xerox Corporation; Director (since 2005), Beta Gamma Sigma International Honor Society; Director of Wellmark, Inc. (since 2009); formerly, Dean and Distinguished Professor of Finance, School of Business at the University of Connecticut (2003-2006); previously, Senior Vice President and Director of Research at the Federal Reserve Bank of Chicago (1995-2003); formerly, Director (1997-2007), Credit Research Center at Georgetown University. | 245 | ||||
David J. Kundert (2) 10/28/42 333 W. Wacker Drive Chicago, IL 60606 | Trustee | 2005 | Director, Northwestern Mutual Wealth Management Company; retired (since 2004) as Chairman, JPMorgan Fleming Asset Management, President and CEO, Banc One Investment Advisors Corporation, and President, One Group Mutual Funds; prior thereto, Executive Vice President, Banc One Corporation and Chairman and CEO, Banc One Investment Management Group; Member, Board of Regents, Luther College; member of the Wisconsin Bar Association; member of Board of Directors, Friends of Boerner Botanical Gardens; member of Board of Directors and Chair of Investment Committee, Greater Milwaukee Foundation. | 245 | ||||
William J. Schneider (2) 9/24/44 333 W. Wacker Drive Chicago, IL 60606 | Trustee | 1997 | Chairman of Miller-Valentine Partners Ltd., a real estate investment company; formerly, Senior Partner and Chief Operating Officer (retired 2004) of Miller-Valentine Group; member, University of Dayton Business School Advisory Council; member, Mid-America Health System Board; formerly, member and chair, Dayton Philharmonic Orchestra Association; formerly, member, Business Advisory Council, Cleveland Federal Reserve Bank. | 245 | ||||
Judith M. Stockdale 12/29/47 333 W. Wacker Drive Chicago, IL 60606 | Trustee | 1997 | Executive Director, Gaylord and Dorothy Donnelley Foundation (since 1994); prior thereto, Executive Director, Great Lakes Protection Fund (1990-1994). | 245 | ||||
Carole E. Stone (2) 6/28/47 333 W. Wacker Drive Chicago, IL 60606 | Trustee | 2007 | Director, Chicago Board Options Exchange (since 2006); Director, C2 Options Exchange, Incorporated (since 2009); formerly, Commissioner, New York State Commission on Public Authority Reform (2005-2010); formerly, Chair, New York Racing Association Oversight Board (2005-2007). | 245 | ||||
| 98 | Nuveen Investments |
Name, Birthdate and Address | Position(s) Held with the Funds | Year First Elected or Appointed (1) | Principal Occupation(s) During Past Five Years | Number of Portfolios in Fund Complex Overseen by Trustee | ||||
Virginia L. Stringer 8/16/44 333 West Wacker Drive Chicago, IL 60606 | Trustee | 2011 | Board Member, Mutual Fund Directors Forum; Member, Governing Board, Investment Company Institute’s Independent Directors Council; governance consultant and non-profit board member; former Owner and President, Strategic Management Resources, Inc. a management consulting firm; previously, held several executive positions in general management, marketing and human resources at IBM and The Pillsbury Company; Independent Director, First American Fund Complex (1987-2010) and Chair (1997-2010). | 245 | ||||
Terence J. Toth (2) 9/29/59 333 W. Wacker Drive Chicago, IL 60606 | Trustee | 2008 | Director, Legal & General Investment Management America, Inc. (since 2008); Managing Partner, Promus Capital (since 2008); formerly, CEO and President, Northern Trust Global Investments (2004-2007); Executive Vice President, Quantitative Management & Securities Lending (2000-2004); prior thereto, various positions with Northern Trust Company (since 1994); member: Goodman Theatre Board (since 2004), Chicago Fellowship Board (since 2005) and Catalyst Schools of Chicago Board (since 2008); formerly, member: Northern Trust Mutual Funds Board (2005-2007), Northern Trust Global Investments Board (2004-2007), Northern Trust Japan Board (2004-2007), Northern Trust Securities Inc. Board (2003-2007) and Northern Trust Hong Kong Board (1997-2004). | 245 | ||||
| Interested Trustee: | ||||||||
John P. Amboian (3) 6/14/61 333 W. Wacker Drive Chicago, IL 60606 | Trustee | 2008 | Chief Executive Officer and Chairman (since 2007), and Director (since 1999) of Nuveen Investments, Inc., formerly, President (1999-2007); Chief Executive Officer (since 2007) of Nuveen Investments Advisers Inc.; Director (since 1998) formerly, Chief Executive Officer (2007-2010) of Nuveen Fund Advisors, Inc. | 245 | ||||
Name, Birthdate and Address | Position(s) Held with the Funds | Year First Elected or Appointed (4) | Principal Occupation(s) During Past 5 Years | Number of Portfolios in Fund Complex Overseen by Officer | ||||
| Officers of the Funds: | ||||||||
Gifford R. Zimmerman 9/9/56 333 W. Wacker Drive Chicago, IL 60606 | Chief Administrative Officer | 1988 | Managing Director (since 2002), Assistant Secretary and Associate General Counsel of Nuveen Securities, LLC; Managing Director (since 2004) and Assistant Secretary (since 1994) of Nuveen Investments, Inc.; Managing Director (since 2002), Assistant Secretary (since 1997) and Co-General Counsel (since 2011) of Nuveen Fund Advisors, Inc.; Managing Director, Assistant Secretary and Associate General Counsel of Nuveen Asset Management, LLC (since 2011); Managing Director, Associate General Counsel and Assistant Secretary of Symphony Asset Management LLC (since 2003); Vice President and Assistant Secretary of NWQ Investment Management Company, LLC (since 2002), Nuveen Investments Advisers Inc. (since 2002), Tradewinds Global Investors LLC, and Santa Barbara Asset Management, LLC (since 2006), Nuveen HydePark Group LLC and Nuveen Investment Solutions, Inc. (since 2007) and of Winslow Capital Management Inc. (since 2010); Chief Administrative Officer and Chief Compliance Officer (since 2010) of Nuveen Commodities Asset Management, LLC; Chartered Financial Analyst. | 245 | ||||
Margo L. Cook 4/11/64 333 W. Wacker Drive Chicago, IL 60606 | Vice President | 2009 | Executive Vice President (since 2008) of Nuveen Investments, Inc. and of Nuveen Fund Advisors, Inc. (since 2011); previously, Head of Institutional Asset Management (2007-2008) of Bear Stearns Asset Management; Head of Institutional Asset Management (1986-2007) of Bank of NY Mellon; Chartered Financial Analyst. | 245 | ||||
| Nuveen Investments | 99 |
Trustees and Officers (Unaudited) (continued)
Name, Birthdate and Address | Position(s) Held with the Funds | Year First Elected or Appointed (4) | Principal Occupation(s) During Past 5 Years | Number of Portfolios in Fund Complex Overseen by Officer | ||||
Lorna C. Ferguson 10/24/45 333 W. Wacker Drive Chicago, IL 60606 | Vice President | 1998 | Managing Director (since 2005) of Nuveen Fund Advisors, Inc. | 245 | ||||
Stephen D. Foy 5/31/54 333 W. Wacker Drive Chicago, IL 60606 | Vice President and Controller | 1998 | Senior Vice President (since 2010), formerly, Vice President (2005-2010) of Nuveen Securities, LLC and Funds Controller; Vice President of Nuveen; Certified Public Accountant. | 245 | ||||
Scott S. Grace 8/20/70 333 W. Wacker Drive Chicago, IL 60606 | Vice President and Treasurer | 2009 | Managing Director, Corporate Finance & Development, Treasurer (since 2009) of Nuveen Securities, LLC; Managing Director and Treasurer (since 2009) of Nuveen Fund Advisors, Inc., Nuveen Investment Solutions, Inc., Nuveen Investments Advisers, Inc., Nuveen Investments Holdings Inc. and (since (2011) Nuveen Asset Management, LLC; Vice President and Treasurer of NWQ Investment Management Company, LLC, Tradewinds Global Investors, LLC, Symphony Asset Management LLC and Winslow Capital Management, Inc.; Vice President of Santa Barbara Asset Management, LLC; formerly, Treasurer (2006-2009), Senior Vice President (2008-2009), previously, Vice President (2006-2008) of Janus Capital Group, Inc.; formerly, Senior Associate in Morgan Stanley’s Global Financial Services Group (2000-2003); Chartered Accountant Designation. | 245 | ||||
Walter M. Kelly 2/24/70 333 W. Wacker Drive Chicago, IL 60606 | Chief Compliance Officer and Vice President | 2003 | Senior Vice President (since 2008), Vice President (2006-2008) of Nuveen Securities, LLC; Senior Vice President (since 2008) and Assistant Secretary (since 2008) of Nuveen Fund Advisors, Inc. | 245 | ||||
Tina M. Lazar 8/27/61 333 W. Wacker Drive Chicago, IL 60606 | Vice President | 2002 | Senior Vice President (since 2010), formerly, Vice President (2005-2010) of Nuveen Fund Advisors, Inc. | 245 | ||||
Larry W. Martin 7/27/51 333 West Wacker Drive Chicago, IL 60606 | Vice President and Assistant Secretary | 1997 | Senior Vice President (since 2010), formerly, Vice President (1993-2010), Assistant Secretary and Assistant General Counsel of Nuveen Securities, LLC; Senior Vice President (since 2011) of Nuveen Asset Management, LLC: Senior Vice President (since 2010), formerly, Vice President (2005-2010), and Assistant Secretary of Nuveen Investments, Inc.; Senior Vice President (since 2010), formerly Vice President (2005-2010), and Assistant Secretary (since 1997) of Nuveen Fund Advisors, Inc.; Vice President and Assistant Secretary of Nuveen Investments Advisers, Inc. (since 2002), NWQ Investment Management Company, LLC, Symphony Asset Management LLC (since 2003), Tradewinds Global Investors, LLC, Santa Barbara Asset Management, LLC (since 2006), Nuveen HydePark Group, LLC and Nuveen Investment Solutions, Inc. (since 2007), and of Winslow Capital Management, Inc. (since 2010); Vice President and Assistant Secretary of Nuveen Commodities Asset Management, LLC (since 2010). | 245 |
| 100 | Nuveen Investments |
Name, Birthdate and Address | Position(s) Held with the Funds | Year First Elected or Appointed (4) | Principal Occupation(s) Including other Directorships During Past 5 Years | Number of Portfolios in Fund Complex Overseen by Officer | ||||
Kevin J. McCarthy 3/26/66 333 W. Wacker Drive Chicago, IL 60606 | Vice President and Secretary | 2007 | Managing Director (since 2008), formerly, Vice President (2007-2008), Nuveen Securities, LLC; Managing Director (since 2008), Assistant Secretary (since 2007) and Co-General Counsel (since 2011) of Nuveen Fund Advisors, Inc.; Managing Director, Assistant Secretary and Associate General Counsel (since 2011) of Nuveen Asset Management, LLC; Managing Director (since 2008), and Assistant Secretary, Nuveen Investment Holdings, Inc.; Vice President (since 2007) and Assistant Secretary of Nuveen Investments Advisers Inc., NWQ Investment Management Company, LLC, Tradewinds Global Investors LLC, NWQ Holdings, LLC, Symphony Asset Management LLC, Santa Barbara Asset Management, LLC, Nuveen HydePark Group, LLC, Nuveen Investment Solutions, Inc. (since 2007) and of Winslow Capital Management, Inc. (since 2010); Vice President and Secretary (since 2010) of Nuveen Commodities Asset Management, LLC; prior thereto, Partner, Bell, Boyd & Lloyd LLP (1997-2007). | 245 | ||||
Kathleen L. Prudhomme 3/30/53 800 Nicollet Mall Minneapolis, MN 55402 | Vice President and Assistant Secretary | 2011 | Managing Director, Assistant Secretary and Co-General Counsel (since 2011) of Nuveen Fund Advisors, Inc.; Managing Director, Assistant Secretary and Associate General Counsel (since 2011) of Nuveen Asset Management, LLC; Managing Director and Assistant Secretary (since 2011) of Nuveen Securities, LLC; formerly, Deputy General Counsel, FAF Advisors, Inc. (2004-2010). | 245 | ||||
Jeffrey M. Wilson 3/13/56 333 West Wacker Drive Chicago, IL 60606 | Vice President | 2011 | Senior Vice President of Nuveen Investments (since 2011), formerly, Senior Vice President of FAF Advisors, Inc. (2000-2010). | 112 |
| (1) | Trustees serve an indefinite term until his/her successor is elected or appointed. The year first elected or appointed represents the year in which the trustee was first elected or appointed to any fund in the Nuveen Fund Complex. |
| (2) | Also serves as a trustee of the Nuveen Diversified Commodity Fund, an exchange-traded commodity pool managed by Nuveen Commodities Asset Management, LLC, an affiliate of the Adviser. |
| (3) | Mr. Amboian is an interested trustee because of his position with Nuveen Investments, Inc. and certain of its subsidiaries, which are affiliates of the Nuveen Funds. |
| (4) | Officers serve one year terms through August of each year. The year first elected or appointed represents the year in which the officer was first elected or appointed to any fund in the Nuveen Fund Complex. |
| Nuveen Investments | 101 |
Annual Investment Management Agreement Approval Process
(Unaudited)
The Board of Trustees (each, a “Board” and each Trustee, a “Board Member”) of the Funds, including the Board Members who are not parties to the Funds’ advisory or sub-advisory agreements or “interested persons” of any such parties (the “Independent Board Members”), are responsible for approving the advisory agreements (each, an “Investment Management Agreement”) between each Fund and Nuveen Fund Advisors, Inc. (the “Advisor”) and the sub-advisory agreements (each, a “Sub-Advisory Agreement”) between (a) the Advisor and NWQ Investment Management Company, LLC (“NWQ”) on behalf of each of the following Funds: the Nuveen NWQ Multi-Cap Value Fund, the Nuveen NWQ Large-Cap Value Fund, the Nuveen NWQ Small/Mid-Cap Value Fund and the Nuveen NWQ Small-Cap Value Fund; (b) the Advisor and Tradewinds Global Investors, LLC (“Tradewinds”) on behalf of the Nuveen Tradewinds Value Opportunities Fund; and (c) the Advisor and Institutional Capital LLC (“ICAP”), Nuveen HydePark Group, LLC (“HydePark”) and Symphony Asset Management LLC (“Symphony”), respectively, on behalf of the Nuveen Multi-Manager Large-Cap Value Fund, and their periodic continuation. NWQ, Tradewinds, ICAP, HydePark and Symphony are each a “Sub-Advisor” and the Investment Management Agreements and the Sub-Advisory Agreements are referred to collectively as the “Advisory Agreements.” Pursuant to the Investment Company Act of 1940, as amended (the “1940 Act”), the Board is required to consider the continuation of advisory agreements and sub-advisory agreements on an annual basis. Accordingly, at an in-person meeting held on May 23-25, 2011 (the “May Meeting”), the Board, including a majority of the Independent Board Members, considered and approved the continuation of the Advisory Agreements for the Funds for an additional one-year period.
In preparation for their considerations at the May Meeting, the Board requested and received extensive materials prepared in connection with the review of the Advisory Agreements. The materials provided a broad range of information regarding the Funds, the Advisor and the Sub-Advisors (the Advisor and the Sub-Advisors are collectively, the “Fund Advisers” and each, a “Fund Adviser”). As described in more detail below, the information provided included, among other things, a review of Fund performance, including Fund investment performance assessments against peer groups and appropriate benchmarks, a comparison of Fund fees and expenses relative to peers, a description and assessment of shareholder service levels for the Funds, a summary of the performance of certain service providers, a review of product initiatives and shareholder communications and an analysis of the Advisor’s profitability with comparisons to comparable peers in the managed fund business. As part of their annual review, the Board also held a separate meeting on April 19-20, 2011, to review the Funds’ investment performance and consider an analysis provided by the Advisor of each Sub-Advisor which generally evaluated the Sub-Advisor’s investment team, investment mandate, organizational structure and history, investment philosophy and process, performance of the applicable Fund or Funds, and significant changes to the foregoing. As a result of their review of the materials and discussions, the Board presented the Advisor with questions and the Advisor responded.
The materials and information prepared in connection with the annual review of the Advisory Agreements supplement the information provided to the Board during the year. In this regard, throughout the year, the Board, acting directly or through its committees, regularly reviews the performance and various services provided by the Advisor and each Sub-Advisor. The Board meets at least quarterly as well as at other times as the need arises. At its quarterly meetings, the Board reviews reports by the Advisor which include, among other things, Fund performance, a review of the investment teams and compliance reports. The Board also meets with key investment personnel managing the Fund portfolios during the year. In addition, the Board continues its program of seeking to visit each sub-advisor to the Nuveen funds at least once over a multiple year rotation, meeting with key investment and business personnel. In this regard, the Independent Board Members met with Tradewinds, NWQ and Symphony in 2010 and 2011. The Board also met with State Street Bank & Trust Company, the Funds’ accountant and custodian, in 2010. The Board considers factors and information that are relevant to its annual consideration of the renewal of the Advisory Agreements at these meetings held throughout the year. Accordingly, the Board considers the information provided and knowledge gained at these meetings when performing its annual review of the Advisory Agreements. The Independent Board Members are assisted throughout the process by independent legal counsel who provided materials describing applicable law and the duties of directors or trustees in reviewing advisory contracts and met with the Independent Board Members in executive sessions without management present.
The Board considered all factors it believed relevant with respect to each Fund, including among other factors: (a) the nature, extent and quality of the services provided by the Fund Advisers, (b) the investment performance of the Fund and Fund Advisers, (c) the advisory fees and costs of the services to be provided to the Funds and the profitability of the Fund Advisers, (d) the extent of any economies of scale, (e) any benefits derived by the Fund Advisers from the relationship with the Fund and (f) other factors. Each Board Member may have accorded different weight to the various factors in reaching his or her conclusions with respect to a Fund’s Advisory Agreements. The Independent Board Members did not identify any single factor as all important or controlling. The Independent Board Members’ considerations were instead based on a comprehensive consideration of all the information presented. The principal factors considered by the Board and its conclusions are described below.
A. Nature, Extent and Quality of Services
In considering renewal of the Advisory Agreements, the Independent Board Members considered the nature, extent and quality of the Fund Adviser’s services, including advisory services and the resulting Fund performance and administrative services. The Independent Board Members reviewed materials outlining, among other things, the Fund Adviser’s organization and business; the types of services that the Fund Adviser or its affiliates provide to the Funds; the performance record of the applicable Fund (as described in further detail below); and any initiatives Nuveen had taken for the applicable fund product line.
| 102 | Nuveen Investments |
In considering advisory services, the Board recognized that the Advisor provides various oversight, administrative, compliance and other services for the Funds and each Sub-Advisor provides the portfolio investment management services to the Funds. Accordingly, in reviewing the portfolio management services provided to each Fund, the Board reviewed the materials provided by the Nuveen Investment Services Oversight Team analyzing, among other things, each Sub-Advisor’s investment team and changes thereto, organization and history, assets under management, Fund objectives and mandate, the investment team’s philosophy and strategies in managing the Fund, developments affecting the Sub-Advisor or Fund and Fund performance and, in addition, with respect to the Nuveen Multi-Manager Large-Cap Value Fund (the “Multi-Manager Fund”), the performance of the portion of the Fund’s portfolio allocated to the respective Sub-Advisor. The Independent Board Members also reviewed portfolio manager compensation arrangements to evaluate each Fund Adviser’s ability to attract and retain high quality investment personnel, preserve stability, and reward performance but not provide an incentive to take undue risks. In addition, the Board considered the Advisor’s execution of its oversight responsibilities over each Sub-Advisor. Given the importance of compliance, the Independent Board Members also considered Nuveen’s compliance program, including the report of the chief compliance officer regarding the Funds’ compliance policies and procedures.
In addition to advisory services, the Board considered the quality and extent of administrative and other non-investment advisory services the Advisor and its affiliates provide to the Funds, including product management, investment services (such as oversight of investment policies and procedures, risk management, and pricing), fund administration, oversight of service providers, shareholder services, administration of Board relations, regulatory and portfolio compliance and legal support. In reviewing the services provided, the Board also reviewed materials describing various notable initiatives and projects the Advisor performed in connection with the open-end fund product line. These initiatives included operations necessary to effect the acquisition of FAF Advisors, Inc.’s (“FAF”) long-term asset management business by Nuveen and the subsequent integration of FAF and the funds FAF advised into the Nuveen family of funds; reduction of management fees and expense caps on certain open-end equity funds that was effective July 1, 2010; changes in dividend declaration policies; and adding funds to various distribution platforms.
Based on their review, the Independent Board Members found that, overall, the nature, extent and quality of services provided to the respective Funds under each applicable Advisory Agreement were satisfactory.
B. The Investment Performance of the Funds and Fund Advisers
The Board, including the Independent Board Members, reviewed and considered the performance history of each Fund over various time periods. The Board reviewed, among other things, each Fund’s historic investment performance as well as information comparing the Fund’s performance information with that of other funds (the “Performance Peer Group”) based on data provided by an independent provider of mutual fund data and with recognized and/or customized benchmarks.
The Board reviewed reports, including a comprehensive analysis of the Funds’ performance and the applicable investment team or teams. In this regard, the Board reviewed each Fund’s total return information compared to the returns of its Performance Peer Group and recognized and/or customized benchmarks for the quarter, one-, three- and five-year periods ending December 31, 2010 and for the same periods ending March 31, 2011 (or for the periods available for Funds that did not exist for part of the foregoing time frame). With respect to the Multi-Manager Fund, the Independent Board Members also reviewed, among other things, the returns of each sleeve of such Fund relative to the benchmark of such sleeve for the quarter, one- and three-year periods ending December 31, 2010 and for the same periods ending March 31, 2011.
In reviewing performance comparison information, the Independent Board Members recognized that the usefulness of the comparisons of the performance of certain funds with the performance of their respective Performance Peer Group may be limited because the Performance Peer Group may not adequately represent the objectives and strategies of the applicable funds or may be limited in size or number. The Independent Board Members also noted that the investment experience of a particular shareholder in the Nuveen funds will vary depending on when such shareholder invests in the applicable fund, the class held (if multiple classes are offered) and the performance of the fund (or respective class) during that shareholder’s investment period. With respect to any Nuveen funds that underperformed their peers and/or benchmarks from time to time, the Board monitors such funds closely and considers any steps necessary or appropriate to address such issues.
In considering the results of the comparisons, the Independent Board Members observed, among other things, that: the Nuveen NWQ Large-Cap Value Fund (the “Large-Cap Value Fund”), the Nuveen Tradewinds Value Opportunities Fund (the “Value Opportunities Fund”) and the Multi-Manager Fund had demonstrated generally favorable performance in comparison to peers, performing in the first or second quartile over various periods; and the Nuveen NWQ Multi-Cap Value Fund (the “Multi-Cap Value Fund”), the Nuveen NWQ Small-Cap Value Fund (the “Small-Cap Value Fund”) and the Nuveen NWQ Small/Mid-Cap Value Fund (the “Small/Mid-Cap Value Fund”) lagged their peers somewhat in the longer three- to five-year periods (as available) but their performance had improved in the recent one-year period.
Based on their review, the Independent Board Members determined that each Fund’s investment performance had been satisfactory.
| Nuveen Investments | 103 |
Annual Investment Management Agreement Approval Process
(Unaudited) (continued)
C. Fees, Expenses and Profitability
1. Fees and Expenses
The Board evaluated the management fees and expenses of each Fund reviewing, among other things, such Fund’s gross management fees, net management fees and net expense ratios in absolute terms as well as compared to the fee and expenses of a comparable universe of funds based on data provided by an independent fund data provider (the “Peer Universe”) and in certain cases, to a more focused subset of funds in the Peer Universe (the “Peer Group”) and any expense limitations.
The Independent Board Members further reviewed the methodology regarding the construction of the applicable Peer Universe and Peer Group (if any). In reviewing the comparisons of fee and expense information, the Independent Board Members took into account that in certain instances various factors such as: the asset level of a fund relative to peers; the limited size and particular composition of the Peer Universe or Peer Group; the investment objectives of the peers; expense anomalies; changes in the funds comprising the Peer Universe or Peer Group from year to year; levels of reimbursement; and the timing of information used may impact the comparative data thereby limiting the ability to make a meaningful comparison with peers.
In reviewing the fee schedule for a Fund, the Independent Board Members also considered the fund-level and complex-wide breakpoint schedules (described in further detail below) and any fee waivers and reimbursements provided by Nuveen. In reviewing fees and expenses, the Board considered the expenses and fees to be higher if they were over 10 basis points higher, slightly higher if they were 6 to 10 basis points higher, in line if they were within 5 basis points higher than the peer average and below if they were below the peer average of the Peer Group (if available) or Peer Universe if there was no separate Peer Group. Except as noted below, the Independent Board Members observed that the Funds had net management fees and net expense ratios below or in line with their peer averages.
The Independent Board Members recognized that last year the Advisor reduced its management fee for a significant number of Nuveen taxable open-end funds including the Value Opportunities Fund, the Multi-Cap Value Fund, the Large-Cap Value Fund, the Small/Mid-Cap Value Fund (which also had a reduction in its expense cap) and the Small-Cap Value Fund. As the reductions went into effect on July 1, 2010, the Independent Board Members noted that the impact of these reductions was not fully reflected in the expense data for last year. Notwithstanding the foregoing, the Independent Board Members noted that the Multi-Cap Value Fund had a net management fee in line with its peer average but a higher net expense ratio, the Small-Cap Value Fund had a net management fee higher than its peer average and a net expense ratio below its peer average, and the Value Opportunities Fund had a net management fee and net expense ratio higher than its peer average.
Based on their review of the fee and expense information provided, the Independent Board Members determined that each Fund’s management fees were reasonable in light of the nature, extent and quality of services provided to the Fund.
2. Comparisons with the Fees of Other Clients
The Independent Board Members further reviewed information regarding the nature of services and fee rates offered by the Advisor to other clients, including separately managed accounts (both retail and institutional accounts), foreign investment funds offered by Nuveen, and funds that are not offered by Nuveen but are sub-advised by one of Nuveen’s investment management teams. In evaluating the comparisons of fees, the Independent Board Members noted that the fee rates charged to the Funds and other clients vary, among other things, because of the different services involved and the additional regulatory and compliance requirements associated with registered investment companies, such as the Funds. Accordingly, the Independent Board Members considered the differences in the product types, including, but not limited to, the services provided, the structure and operations, product distribution and costs thereof, portfolio investment policies, investor profiles, account sizes and regulatory requirements. The Independent Board Members noted, in particular, that the range of services provided to the Funds (as discussed above) is much more extensive than that provided to separately managed accounts. Given the inherent differences in the products, particularly the extensive services provided to the Funds, the Independent Board Members believe such facts justify the different levels of fees.
In considering the fees of a Sub-Advisor, the Independent Board Members also considered the pricing schedule or fees that the Sub-Advisor charges for similar investment management services for other fund sponsors or clients (such as retail and/or institutional managed accounts) or funds, as applicable. With respect to Symphony, the Independent Board Members also reviewed the fees it assesses for equity and taxable fixed-income hedge funds it manages, which include a performance fee. The Independent Board Members noted that with respect to ICAP, such fees were the result of arm’s-length negotiations.
3. Profitability of Fund Advisers
In conjunction with its review of fees, the Independent Board Members also considered the profitability of Nuveen for its advisory activities (which incorporated Nuveen’s wholly-owned affiliated sub-advisers) and its financial condition. The Independent Board Members reviewed the revenues and expenses of Nuveen’s advisory activities for the last two years, the allocation methodology used in preparing the profitability data and an analysis of the key drivers behind the changes in revenues and expenses that impacted profitability in 2010. The Independent Board Members noted this information supplemented the profitability information requested and received during the year to help keep them apprised of developments affecting profitability (such as changes in fee waivers and expense reimbursement commitments). In this regard, the Independent Board Members noted that they have an
| 104 | Nuveen Investments |
Independent Board Member serve as a point person to review and keep them apprised of changes to the profitability analysis and/or methodologies during the year. The Independent Board Members also considered Nuveen’s revenues for advisory activities, expenses, and profit margin compared to that of various unaffiliated management firms with similar amounts of assets under management and relatively comparable asset composition prepared by Nuveen.
In reviewing profitability, the Independent Board Members recognized the subjective nature of determining profitability which may be affected by numerous factors including the allocation of expenses. Further, the Independent Board Members recognized the difficulties in making comparisons as the profitability of other advisers generally is not publicly available and the profitability information that is available for certain advisers or management firms may not be representative of the industry and may be affected by, among other things, the adviser’s particular business mix, capital costs, types of funds managed and expense allocations. Notwithstanding the foregoing, the Independent Board Members reviewed Nuveen’s methodology and assumptions for allocating expenses across product lines to determine profitability. In reviewing profitability, the Independent Board Members recognized Nuveen’s investment in its fund business. Based on their review, the Independent Board Members concluded that the Advisor’s level of profitability for its advisory activities was reasonable in light of the services provided.
With respect to NWQ, Tradewinds and Symphony, the Independent Board Members reviewed each such Sub-Advisor’s revenues, expenses and pre-tax profitability margins. Similarly, with respect to ICAP, the Independent Board Members also considered such Sub-Advisor’s revenues, expenses and profitability margins (pre- and post-tax). Based on their review, the Independent Board Members were satisfied that the respective Sub-Advisor’s level of profitability was reasonable in light of the services provided.
In evaluating the reasonableness of the compensation, the Independent Board Members also considered other amounts paid to a Fund Adviser by the Funds as well as any indirect benefits (such as soft dollar arrangements, if any) the Fund Adviser and its affiliates receive, or are expected to receive, that are directly attributable to the management of the Funds, if any. See Section E below for additional information on indirect benefits a Fund Adviser may receive as a result of its relationship with the Funds. Based on their review of the overall fee arrangements of each Fund, the Independent Board Members determined that the advisory fees and expenses of the respective Fund were reasonable.
D. Economies of Scale and Whether Fee Levels Reflect These Economies of Scale
With respect to economies of scale, the Independent Board Members have recognized the potential benefits resulting from the costs of a fund being spread over a larger asset base, although economies of scale are difficult to measure and predict with precision, particularly on a fund-by-fund basis. One method to help ensure the shareholders share in these benefits is to include breakpoints in the advisory fee schedule. Generally, management fees for funds in the Nuveen complex are comprised of a fund-level component and a complex-level component, subject to certain exceptions. Accordingly, the Independent Board Members reviewed and considered the applicable fund-level breakpoints in the advisory fee schedules that reduce advisory fees as asset levels increase.
In addition to fund-level advisory fee breakpoints, the Board also considered the Funds’ complex-wide fee arrangement. Pursuant to the complex-wide fee arrangement, the fees of the funds in the Nuveen complex are generally reduced as the assets in the fund complex reach certain levels. The complex-wide fee arrangement seeks to provide the benefits of economies of scale to fund shareholders when total fund complex assets increase, even if assets of a particular fund are unchanged or have decreased. The approach reflects the notion that some of Nuveen’s costs are attributable to services provided to all its funds in the complex and therefore all funds benefit if these costs are spread over a larger asset base. In this regard, the Independent Board Members also noted that a portion of the assets acquired pursuant to the transaction with FAF are included in determining the level of assets for calculating the complex-wide fee, which helps reduce such fee to the benefit of all shareholders.
Based on their review, the Independent Board Members concluded that the breakpoint schedules and complex-wide fee arrangement were acceptable and reflect economies of scale to be shared with shareholders when assets under management increase.
E. Indirect Benefits
In evaluating fees, the Independent Board Members received and considered information regarding potential “fall out” or ancillary benefits the respective Fund Adviser or its affiliates may receive as a result of its relationship with each Fund. In this regard, the Independent Board Members considered, among other things, any sales charges, distribution fees and shareholder services fees received and retained by the Funds’ principal underwriter, an affiliate of the Advisor, which includes fees received pursuant to any 12b-1 plan. The Independent Board Members, therefore, considered the 12b-1 fees retained by Nuveen during the last calendar year.
In addition to the above, the Independent Board Members considered whether the Fund Advisers received any benefits from soft dollar arrangements whereby a portion of the commissions paid by a Fund for brokerage may be used to acquire research that may be useful to the Fund Adviser in managing the assets of the Funds and other clients. With respect to the Advisor, the Independent Board Members recognized that the Advisor has the authority to pay a higher commission in return for brokerage and research services if it determines in good faith that the commission paid is reasonable in relation to the value of the brokerage and research services provided. With respect to HydePark, ICAP, NWQ, and Tradewinds, the Independent Board Members considered that each such Sub-Advisor may benefit from its soft dollar arrangements pursuant to which it receives research from brokers that execute the applicable Fund’s portfolio transactions. For the Advisor and the foregoing Sub-Advisors, the Independent Board Members noted that such Fund Advisers’ profitability may be somewhat lower if they did not receive the research services pursuant to the soft dollar
| Nuveen Investments | 105 |
Annual Investment Management Agreement Approval Process
(Unaudited) (continued)
arrangements and had to acquire such services directly. With respect to Symphony, the Board also considered that Symphony currently does not enter into soft dollar arrangements; however, it has adopted a soft dollar policy in the event it does so in the future.
Based on their review, the Independent Board Members concluded that any indirect benefits received by a Fund Adviser as a result of its relationship with the Funds were reasonable and within acceptable parameters.
F. Other Considerations
The Independent Board Members did not identify any single factor discussed previously as all-important or controlling. The Board Members, including the Independent Board Members, unanimously concluded that the terms of each Advisory Agreement are fair and reasonable, that the respective Fund Adviser’s fees are reasonable in light of the services provided to each Fund and that the Advisory Agreements be renewed.
| 106 | Nuveen Investments |
Notes
| Nuveen Investments | 107 |
Notes
| 108 | Nuveen Investments |
Notes
| Nuveen Investments | 109 |
Glossary of Terms Used in this Report
Average Annual Total Return: This is a commonly used method to express an investment’s performance over a particular, usually multi-year time period. It expresses the return that would have been necessary each year to equal the investment’s actual cumulative performance (including change in NAV or offer price and reinvested dividends and capital gains distributions, if any) over the time period being considered.
Lipper Large-Cap Core Funds Category Average: Represents the average annualized total return for all reporting funds in the Lipper Large-Cap Core Fund category. The Category contained 1,068 funds during the 1-year period ended June 30, 2011. For more information about Lipper category averages, please see your Fund’s web page at www.nuveen.com.
Lipper Large-Cap Value Funds Category Average: Represents the average annualized total return for all reporting funds in the Lipper Large-Cap Value Fund category. The Category contained 520 funds for the 1-year period ended June 30, 2011. For more information about Lipper category averages, please see your Fund’s web page at www.nuveen.com.
Lipper Multi-Cap Core Funds Category Average: Represents the average annualized total return for all reporting funds in the Lipper Multi-Cap Core Fund category. The Category contained 794 funds during the 1-year period ended June 30, 2011. For more information about Lipper category averages, please see your Fund’s web page at www.nuveen.com.
Lipper Small-Cap Core Funds Category Average: Represents the average annualized total return for all reporting funds in the Lipper Small-Cap Core Fund category. The Category contained 728 funds for the 1-year period ended June 30, 2011. For more information about Lipper category averages, please see your Fund’s web page at www.nuveen.com.
Net Asset Value (NAV): A Fund’s NAV is the dollar value of one share in the Fund. It is calculated by subtracting the liabilities of the Fund from its total assets and then dividing the remainder by the number of shares outstanding. Fund NAVs are calculated at the end of each business day.
Russell 1000 Value Index: An index that measures the performance of those Russell 1000 companies with lower price-to-book ratios and lower forecasted growth values. Returns do not include the effects of any sales charges or management fees. It is not possible to invest directly in an index.
Russell 2000 Value Index: An index that measures the performance of those Russell 2000 companies with lower price-to-book ratios and lower forecasted growth values. Returns do not include the effects of any sales charges or management fees. It is not possible to invest directly in an index.
Russell 2500 Index: An index that measures the performance of the 2,500 smallest companies in the Russell 3000 Index, which represents approximately 20% of the total market capitalization of the Russell 3000 Index. Returns do not include the effects of any sales charges or management fees. It is not possible to invest directly in an index.
Russell 3000 Value Index: An index that measures the performance of those Russell 3000 companies with lower price-to-book ratios and higher forecasted growth values. Returns do not include the effects of any sales charges or management fees. It is not possible to invest directly in an index.
S&P 500 Index: An unmanaged index generally considered representative of the U.S. stock market. Index returns do not include the effects of sales charges or management fees. It is not possible to invest directly in an index.
Tax Equalization: The practice of treating a portion of the distribution made to a redeeming shareholder, which represents his proportionate part of undistributed net investment income and capital gain as a distribution for tax purposes. Such amounts are referred to as the equalization debits (or payments) and will be considered a distribution to the shareholder of net investment income and capital gain for calculation of the Fund’s dividends paid deduction.
| 110 | Nuveen Investments |
Fund Manager
Nuveen Fund Advisors, Inc.
333 West Wacker Drive
Chicago, IL 60606
Sub-Advisers
Institutional Capital LLC
225 West Wacker Drive
Chicago, IL 60606
Nuveen HydePark Group, LLC
333 West Wacker Drive,
Chicago, IL 60603
NWQ Investment Management Company, LLC
2049 Century Park East, 16th Floor
Los Angeles, CA 90067
Symphony Asset Management LLC
555 California Street
Rene Suite 2975
San Francisco, CA 94104
Tradewinds Global Investors, LLC
2049 Century Park East, 20th Floor
Los Angeles, CA 90067
Legal Counsel
Chapman and Cutler LLP
Chicago, IL
Independent Registered Public Accounting Firm
PricewaterhouseCoopers LLP
Chicago, IL
Custodian
State Street Bank & Trust Company
Boston, MA
Transfer Agent and Shareholder Services
Boston Financial
Data Services
Nuveen Investor Services
P.O. Box 8530
Boston, MA 02266-8530
(800) 257-8787
Distribution Information: The following Funds hereby designate their percentages of dividends paid from net ordinary income as dividends qualifying for the 70% dividends received deduction (“DRD”) for corporations and their percentages as qualified dividend income (“QDI”) for individuals under Section 1 (h)(11) of the Internal Revenue Code as shown in the accompanying table. The actual qualified dividend income distributions will be reported to shareholders on Form 1099-DIV which will be sent to shareholders shortly after calendar year end.
| Fund | % of DRD | % of QDI | ||||||
Nuveen Multi-Manager Large-Cap Value Fund | 100 | % | 100 | % | ||||
Nuveen NWQ Large-Cap Value Fund | 100 | % | 100 | % | ||||
Nuveen Tradewinds Value Opportunities Fund | 29.1 | % | 37.9 | % | ||||
Long Term Capital Gain Distributions : Nuveen Tradewinds Value Opportunities Fund designated as a long-term capital gain dividend, pursuant to Internal Revenue Code Section 852(b)(3), $25,877,124, or, if greater, the amount necessary to reduce earnings and profits of the Fund related to net capital gain to zero for the tax year ended June 30, 2011.
Quarterly Portfolio of Investments and Proxy Voting Information: You may obtain (i) each Fund’s quarterly portfolio of investments, (ii) information regarding how the Funds voted proxies relating to portfolio securities held during the most recent twelve-month period ended June 30, and (iii) a description of the policies and procedures that the Funds used to determine how to vote proxies relating to portfolio securities without charge, upon request, by calling Nuveen Investments at (800) 257-8787 or on Nuveen’s website at www.nuveen.com.
You may also obtain this and other Fund information directly from the Securities and Exchange Commission (SEC). The SEC may charge a copying fee for this information. Visit the SEC on-line at http://www.sec.gov or in person at the SEC’s Public Reference Room in Washington, D.C. Call the SEC at (202) 942-8090 for room hours and operation. You may also request fund information by sending an e-mail request to publicinfo@sec.gov or by writing to the SEC’s Public Reference Section at 100 F Street NE, Washington, D.C. 20549.
The Financial Industry Regulatory Authority (FINRA) provides a Public Disclosure Program which supplies certain information regarding the disciplinary history of FINRA members and their associated persons in response to either telephone inquiries at (800) 289-9999 or written inquiries at www.finra.org. FINRA also provides an investor brochure that includes information describing the Public Disclosure Program.
| Nuveen Investments | 111 |
Nuveen Investments:
Serving Investors for Generations
Since 1898, financial advisors and their clients have relied on Nuveen Investments to provide dependable investment solutions through continued adherence to proven, long-term investing principles. Today, we offer a range of high quality equity and fixed-income solutions designed to be integral components of a well-diversified core portfolio.
Focused on meeting investor needs.
Nuveen Investments is a global investment management firm that seeks to help secure the long-term goals of institutions and high net worth investors as well as the consultants and financial advisors who serve them. We market our growing range of specialized investment solutions under the high-quality brands of HydePark, NWQ, Nuveen Asset Management, Santa Barbara, Symphony, Tradewinds and Winslow Capital. In total, Nuveen Investments managed approximately $210 billion of assets as of June 30, 2011.
Find out how we can help you.
To learn more about how the products and services of Nuveen Investments may be able to help you meet your financial goals, talk to your financial advisor, or call us at (800) 257-8787. Please read the information provided carefully before you invest. Investors should consider the investment objective and policies, risk considerations, charges and expenses of any investment carefully. Where applicable, be sure to obtain a prospectus, which contains this and other relevant information. To obtain a prospectus, please contact your securities representative or Nuveen Investments, 333 W. Wacker Dr., Chicago, IL 60606. Please read the prospectus carefully before you invest or send money.
Learn more about Nuveen Funds at: www.nuveen.com/mf
Nuveen makes things e-simple.
It only takes a minute to sign up for e-Reports. Once enrolled, you’ll receive an e-mail as soon as your Nuveen Fund information is ready — no more waiting for delivery by regular mail. Just click on the link within the e-mail to see the report and save it on your computer if you wish.
Free e-Reports right to your e-mail!
www.investordelivery.com
If you receive your Nuveen Fund distributions and statements from your financial advisor or brokerage account.
OR
www.nuveen.com/accountaccess
If you receive your Nuveen Fund distributions and statements directly from Nuveen.
Distributed by Nuveen Securities, LLC 333 West Wacker Drive Chicago, IL 60606 www.nuveen.com |
MAN-NWQ-0611D

Mutual Funds
Nuveen Asset Allocation Funds
For investors seeking attractive long-term total returns.
Annual Report
June 30, 2011
| Share Class / Ticker Symbol | ||||||||||
| Fund Name | Class A | Class B | Class C | Class R3 | Class I | |||||
Nuveen Growth Allocation Fund | NGOAX | NGVBX | NGVCX | NGATX | NGVRX | |||||
Nuveen Moderate Allocation Fund | NNSAX | NNSBX | NUVCX | NMATX | NNSRX | |||||
Nuveen Conservative Allocation Fund | NBMSX | NMNBX | NBMCX | NALTX | NMNRX | |||||
INVESTMENT ADVISER NAME CHANGE
Effective January 1, 2011, Nuveen Asset Management, the Funds’ investment adviser, changed its name to Nuveen Fund Advisors, Inc. (“Nuveen Fund Advisors”). Concurrently, Nuveen Fund Advisors formed a wholly-owned subsidiary, Nuveen Asset Management, LLC, to house its portfolio management capabilities.
NUVEEN INVESTMENTS COMPLETES STRATEGIC COMBINATION WITH FAF ADVISORS
On December 31, 2010, Nuveen Investments completed the strategic combination between Nuveen Asset Management, the largest investment affiliate of Nuveen Investments, and FAF Advisors. As part of this transaction, U.S. Bancorp — the parent of FAF Advisors — received cash consideration and a 9.5% stake in Nuveen Investments in exchange for the long-term investment business of FAF Advisors, including investment-management responsibilities for the non-money market mutual funds of the First American Funds family.
The approximately $27 billion of mutual fund and institutional assets managed by FAF Advisors, along with the investment professionals managing these assets and other key personnel, have become part of Nuveen Asset Management, LLC. With these additions to Nuveen Asset Management, LLC, this affiliate now manages more than $100 billion of assets across a broad range of strategies from municipal and taxable fixed income to traditional and specialized equity investments.
This combination does not affect the investment objectives or strategies of the Funds in this report. Over time, Nuveen Investments expects that the combination will provide even more ways to meet the needs of investors who work with financial advisors and consultants by enhancing the multi-boutique model of Nuveen Investments, which also includes highly respected investment teams at HydePark, NWQ Investment Management, Santa Barbara Asset Management, Symphony Asset Management, Tradewinds Global Investors and Winslow Capital. Nuveen Investments managed approximately $210 billion of assets as of June 30, 2011.
| Must be preceded by or accompanied by a prospectus. | NOT FDIC INSURED | MAY LOSE VALUE | NO BANK GUARANTEE |
| 4 | ||||
| 5 | ||||
| 11 | ||||
| 18 | ||||
| 22 | ||||
| | 23 | | ||
| 24 | ||||
| 27 | ||||
| 28 | ||||
| 29 | ||||
| 32 | ||||
| 38 | ||||
| 46 | ||||
| 50 | ||||
| 54 | ||||
| 55 | ||||
Letter to Shareholders

Dear Shareholders,
The global economy continues to be weighed down by an unusual combination of pressures facing the larger developed economies. Japanese leaders continue to work through the economic aftereffects of the March 2011 earthquake and tsunami. Political leaders in Europe and the U.S. have resolved some of the near term fiscal problems, but the financial markets are not convinced that these leaders are able to address more complex longer term fiscal issues. Despite improved earnings and capital increases, the largest banks in these countries continue to be vulnerable to deteriorating mortgage portfolios and sovereign credit exposure, adding another source of uncertainty to the global financial system.
In the U.S., recent economic statistics indicate that the economic recovery may be losing momentum. Consumption, which represents about 70% of the gross domestic product, faces an array of challenges from seemingly intractable declines in housing values, increased energy costs and limited growth in the job market. The failure of Congress and the administration to agree on the debt ceiling increase on a timely basis and the deep divisions between the political parties over fashioning a balanced program to address growing fiscal imbalances that led to the recent S&P ratings downgrade add considerable uncertainty to the domestic economic picture.
On a more positive note, corporate earnings continue to hold up well and the municipal bond market is recovering from recent weakness as states and municipalities implement various programs to reduce their budgetary deficits. In addition, the Federal Reserve System has made it clear that it stands ready to take additional steps should the economic recovery falter. However, there are concerns that the Fed is approaching the limits of its resources to intervene in the economy.
These perplexing times highlight the importance of professional investment management. Your Nuveen investment team is working hard to develop an appropriate response to increased risk, and they continue to seek out opportunities created by stressful markets using proven investment disciplines designed to help your Fund achieve its investment objectives. On your behalf, we monitor their activities to assure that they maintain their investment disciplines.
As always, I encourage you to contact your financial consultant if you have any questions about your investment in a Nuveen Fund. On behalf of the other members of your Fund Board, we look forward to continuing to earn your trust in the months and years ahead.
Sincerely,

Robert P. Bremner
Chairman of the Board
August 23, 2011
| 4 | Nuveen Investments |
Important Notice
On August 2, 2011, the Board of Trustees of Nuveen Investment Trust approved, subject to shareholder approval, the merger of (i) the Conservative Allocation Fund into the Nuveen Strategy Conservative Allocation Fund and (ii) the Moderate Allocation Fund into the Nuveen Strategy Balanced Allocation Fund. The Conservative Allocation Fund and the Moderate Allocation Fund will each hold a special meeting of shareholders for the purpose of voting on the merger in late November or early December 2011. A joint Proxy Statement/Prospectus relating to each proposed merger will be filed with the SEC in the coming weeks and will contain important information relating the merger. Shareholders are urged to read each such joint Proxy Statement/Prospectus carefully. After they are filed, free copies of the Proxy Statement/Prospectuses will be available on the SEC’s web site at www.sec.gov.
Also on August 2, 2011, the Board of Trustees approved the liquidation of the Nuveen Growth Allocation Fund, effective October 7, 2011. Beginning September 7, 2011, the Growth Allocation Fund will stop accepting purchases from new investors and existing shareholders, except that defined contribution retirement plans that hold fund shares as of September 7, 2011, may continue to purchase fund shares until October 3, 2011. Existing shareholders may continue to reinvest dividends and capital gains distributions received from the Fund. The Fund reserves the right to modify the extent to which sales of shares are limited prior to the Fund’s liquidation. After the close of business on October 7, 2011, the Fund will liquidate any remaining shareholder accounts and will send shareholders the proceeds of the liquidation.
Certain statements in this report are forward-looking statements. Discussions of specific investments are for illustration only and are not intended as recommendations of individual investments. The forward-looking statements and other views expressed herein are those of the portfolio managers as of the date of this report. Actual future results or occurrences may differ significantly from those anticipated in any forward-looking statements and the views expressed herein are subject to change at any time, due to numerous market and other factors. The Funds disclaim any obligation to update publicly or revise any forward-looking statements or views expressed herein.
The Funds feature portfolio management by Nuveen Investment Solutions, Inc. (NIS), an affiliate of Nuveen Investments. The Funds are managed by John Simmons, CFA, Managing Director and Portfolio Manager for NIS.
In May 2011, David R. Cline and James Colon, CFA, joined John in managing the Funds.
Here the team discusses general market conditions, key portfolio management strategies and the performance of these three Funds for the twelve-month period ended June 30, 2011.
What were the general market conditions and trends over the course of the period?
Economic growth was quite uneven over the twelve-month reporting period. The second half of 2010 began with widespread concerns about financial contagion from several European countries and very slow growth, raising the probability of a double-dip recession in the United States. These fears seemed to be quelled in late 2010 and early 2011 as another round of quantitative easing was introduced by the Federal Reserve and consumer spending rebounded sharply. However, this relief was relatively short lived as renewed weakness in housing and higher food and energy prices put a damper on consumption at about the same time that supply chain disruptions from the Japanese tsunami and earthquake were distorting growth and suppressing job creation in many areas in the U.S. and around the world.
Throughout the period, the Fed continued to hold the benchmark fed funds rate in a target range of zero to 0.25% since cutting it to this record low level in December 2008. At its June 2011 meeting, the central bank downgraded growth estimates for the year while reaffirming that it anticipated keeping the fed funds rate at “exceptionally low levels” for an “extended period.”
| Nuveen Investments | 5 |
From a macro perspective, we ended the fiscal period facing many of the same uncertainties that we did at this same time last year. The Greek bailout had yet to be finalized and fiscal concerns had spread to other European countries such as Ireland, Portugal, Italy and Spain. At the same time, fears about slowing U.S. economic growth bubbled to the surface again, causing consumer spending to pull back. The employment situation seemed to plateau, with the national jobless rate registering 9.2% in June 2011, the fourth monthly increase in a row and just slightly lower than one year earlier. Also, the overall housing market continued to show weakness, weighed down by a backlog of distressed properties on the market and falling prices. For the twelve months ended May 2011 (the most recent data available at the time this report was prepared), property values in the Standard & Poor’s (S&P)/Case-Shiller index of 20 major metropolitan areas had fallen 4.5% from one year earlier. U.S. gross domestic product (GDP), a broad measure of the nation’s economic health, was revised downward to an anemic 0.4% annual growth rate for the first quarter of 2011 and estimated to be 1.3% for the second quarter, according to the Commerce Department.
The U.S. equity markets generally rose during the twelve-month period, with the major large capitalization indexes producing strong, double-digit gains. By June 30, 2011, the Russell 1000 Value and S&P 500 indexes had appreciated over 90% from their March 2009 lows. While this still left these indexes below their 2007 peak levels, bankruptcies and significant equity dilution for a multitude of corporations make those prior levels much more elevated than they may seem at first glance. However, even though many companies continue to report better-than-expected earnings, very few of the structural imbalances facing the United States or the global economy have been addressed in a meaningful way.
How did the Funds perform during the twelve-month period ended June 30, 2011?
The tables in the Fund Performance and Expense Ratios section of this report provide Class A Share total returns for the Funds for the one-year, five-year, ten-year and since inception periods ended June 30, 2011. Each Fund’s returns are compared with the performance of a peer group, appropriate composite benchmark and general market index.
What strategies were used to manage the Funds during the reporting period?
All of these Funds are managed using the same strategic approach. This involves seeking to: (1) identify a universe of investable asset classes with different risks, returns and relationships, (2) determine an allocation policy among these asset classes that produces the highest expected return consistent with a targeted level of investment risk, (3) utilize liquid, transparent, and value-added investment funds within each asset class, (4) structure these funds to produce value-added performance consistent with the Funds’ active management risk budgets, and (5) monitor, refine and revise all the investment inputs that go into each Fund’s portfolio building process.
| 6 | Nuveen Investments |
How did these strategies influence performance?
Nuveen Growth Allocation Fund
Class A Shares at net asset value for the Fund slightly outperformed the Lipper Mixed-Asset Target Allocation Growth Funds Category Average, but slightly underperformed the Growth Allocation Composite over the twelve-month reporting period. The Fund also underperformed the S&P 500 Index.
The Growth Allocation Fund’s policy allocation as of June 30, 2011, is presented below:
| Asset Class | Asset Class Policy Weight | |||
Domestic Equity | 33% | |||
International Equity | 29% | |||
Global Resources | 3% | |||
U.S. Public Real Estate | 5% | |||
Domestic Fixed Income | 1% | |||
Domestic High Yield | 11% | |||
TIPS | 5% | |||
Convertibles | 3% | |||
Commodities | 2% | |||
Preferreds | 2% | |||
Short Duration & Cash | 6% | |||
| 100% | ||||
As noted above, NIS monitors and manages the risk factors that impact the Fund’s performance, including (1) Investment Policy/Capital Market Risk, (2) Investment Style Risk, (3) Active Management Risk, and (4) Allocation Tactics Risk. The impact of each of these factors is quantified and analyzed as a part of our ongoing feedback and control management process.
Investment policy/capital market risk typically will have the largest performance impact on the Fund. For the twelve-month reporting period, our asset class allocations produced a strong return, primarily because almost all capital market segments performed well across the globe.
Investment style risk involves an allocation policy to investment managers whose styles, in aggregate, differ from the asset class market target. NIS attempts to minimize this risk by investing in the Nuveen U.S. Equity Completeness Fund to gain exposure to the domestic equity asset class and, historically, in various exchange-traded funds to gain exposure to the international equity asset class. The return impact from investment style risk was slightly negative within international equity and negligible to slightly negative elsewhere during the reporting period.
Active management risk consists of the performance differential between an investment manager’s actual performance and the performance of the respective benchmark. NIS seeks to manage this active management risk by structuring teams of managers within asset classes that are believed to have the best chance of outperforming, in aggregate, their asset class target. During the reporting period, the Fund’s investment managers, in aggregate, generated negative incremental returns relative to their benchmarks. Manager performance within the high yield bond asset class again generated the greatest level of outperformance. Slightly negative manager performance was realized in the international equity and global resources asset classes.
| Nuveen Investments | 7 |
Allocation tactic risk involves the deviations of actual allocations versus the policy allocation weights. These deviations are often due to movements in the capital markets as well as to daily cash flows into and out of the Fund. During the reporting period, the performance impact due to allocation tactics has had a small, positive impact on total Fund performance.
Nuveen Moderate Allocation Fund
Class A Shares at net asset value for the Fund slightly underperformed the Lipper Mixed-Asset Target Allocation Moderate Funds Category Average, but outperformed the Moderate Allocation Composite. The Fund also underperformed the S&P 500 Index during the twelve-month reporting period.
The Moderate Allocation Fund’s policy allocation as of June 30, 2011, is presented below:
| Asset Class | Asset Class Policy Weight | |||
Domestic Equity | 24% | |||
International Equity | 19% | |||
Global Resources | 3% | |||
U.S. Public Real Estate | 4% | |||
Domestic Fixed Income | 7% | |||
Domestic High Yield | 15% | |||
TIPS | 12% | |||
Convertibles | 2% | |||
Commodities | 2% | |||
Preferreds | 2% | |||
Short Duration & Cash | 10% | |||
| 100% | ||||
As noted above, NIS monitors and manages the risk factors that impact the Fund’s performance, including (1) Investment Policy/Capital Market Risk, (2) Investment Style Risk, (3) Active Management Risk, and (4) Allocation Tactics Risk. The impact of each of these factors is quantified and analyzed as a part of our ongoing feedback and control management process.
Investment policy/capital market risk will typically have the largest performance impact on the Fund. During the reporting period, our asset class allocations produced a solid return, primarily because almost all capital market segments performed well across the globe.
Investment style risk involves an allocation policy to investment managers whose styles, in aggregate, differ from the asset class market target. NIS attempts to minimize this risk by investing in the Nuveen U.S. Equity Completeness Fund to gain exposure to the domestic equity asset class and, historically, in various exchange-traded funds to gain exposure to the international equity class. The return impact from investment style risk was slightly negative within international equity and negligible to slightly negative elsewhere during the reporting period.
Active management risk consists of the performance differential between an investment manager’s actual performance and the performance of the respective benchmark. NIS seeks to manage active management risk by structuring teams of managers within asset classes that are believed to have the best chance of outperforming, in aggregate, their
| 8 | Nuveen Investments |
asset class target. During the reporting period, the Fund’s investment managers, in aggregate, generated negative incremental returns, relative to their benchmarks. Manager performance within the high yield asset class generated the greatest level of outperformance. Slightly negative manager performance was realized in the global resources and international equity asset classes.
Allocation tactic risk involves the deviations of actual allocations versus the policy allocation weights. These deviations are often due to movements in the capital markets as well as to daily cash flows into and out of the Fund. During the reporting period the performance impact due to allocation tactics has had a small, negative impact on total Fund performance.
Nuveen Conservative Allocation Fund
Class A Shares at net asset value for the Fund outperformed the Conservative Allocation Composite and the Lipper Mixed-Asset Target Allocation Conservative Funds Category Average during the twelve-month reporting period. The Fund underperformed the S&P 500 Index.
The Conservative Allocation Fund’s policy allocation as of June 30, 2011, is presented in the accompanying table:
| Asset Class | Asset Class Policy Weight | |||
Domestic Equity | 14% | |||
International Equity | 10% | |||
Global Resources | 3% | |||
U.S. Public Real Estate | 3% | |||
Domestic Fixed Income | 16% | |||
Domestic High Yield | 9% | |||
TIPS | 14% | |||
Convertibles | 1% | |||
Commodities | 2% | |||
Preferreds | 2% | |||
Short Duration & Cash | 26% | |||
| 100% | ||||
As noted above, NIS monitors and manages the risk factors that impact the Fund’s performance, including (1) Investment Policy/Capital Market Risk, (2) Investment Style Risk, (3) Active Management Risk, and (4) Allocation Tactics Risk. The impact of each of these factors is quantified and analyzed as a part of our ongoing feedback and control management process.
Investment policy/capital market risk will typically have the largest performance impact on the Fund. For the twelve-month reporting period, our asset class allocations produced a solid return, primarily because almost all capital market segments performed well across the globe.
Investment style risk involves an allocation policy to investment managers whose styles, in aggregate, differ from the asset class market target. NIS attempts to minimize this risk by investing in the Nuveen U.S. Equity Completeness Fund to gain exposure to the domestic equity asset class and, historically, in various exchange-traded funds to gain exposure to
| Nuveen Investments | 9 |
the international equity class. The return impact from investment style risk was negative within international equity and negligible to slightly negative elsewhere during the reporting period.
Active management risk consists of the performance differential between an investment manager’s actual performance and the performance of the respective benchmarks. NIS seeks to manage active management risk by structuring teams of managers within asset classes that are believed to have the best chance of outperforming their asset class target. During the period, the Fund’s investment managers, in aggregate, generated slightly negative incremental returns, relative to their benchmarks. Manager performance within high yield was the strongest while a number of asset classes generated slightly negative levels of performance for the reporting period including international equity and global resources.
Allocation tactic risk involves the deviations of actual allocations versus the policy allocation weights. These deviations are often due to movements in the capital markets as well as to cash flows into and out of the Fund. During the reporting period the performance impact due to allocation tactics has had a small, negative impact on total Fund performance.
RISK CONSIDERATIONS
Mutual fund investing involves risk; principal loss is possible. Asset allocation funds invest in various underlying funds (primarily Nuveen Funds). Generally, your cost to invest in asset allocation funds will be higher than the cost to invest in shares of the underlying funds. Asset allocation funds are exposed to the risks of the underlying funds in proportion to each Fund’s allocation. These risks include, but are not limited to, market risk; volatility related to small- and mid-cap stocks; non-diversification risk; foreign securities risk; and credit and interest-rate risk related to debt securities. A Fund’s potential use of derivative instruments involves a high degree of financial risk, including the risk that the loss on a derivative may be greater than the principal amount invested.
| 10 | Nuveen Investments |
Fund Performance and Expense Ratios (Unaudited)
The Fund Performance and Expense Ratios for each Fund are shown on the following six pages.
Returns quoted represent past performance, which is no guarantee of future results. Current performance may be higher or lower than the performance shown. Investment returns and principal value will fluctuate so that when shares are redeemed, they may be worth more or less than their original cost. Returns without sales charges would be lower if the sales charge were included. Returns do not reflect the deduction of taxes that a shareholder would pay on Fund distributions or the redemption of Fund shares.
Returns may reflect a contractual agreement between certain Funds and the investment adviser to waive certain fees and expenses; see Notes to Financial Statements, Footnote 6 — Management Fees and Other Transactions with Affiliates for more information. In addition, returns may reflect a voluntary expense limitation by the Funds’ investment adviser that may be modified or discontinued at any time without notice. For the most recent month-end performance visit www.nuveen.com or call (800) 257-8787.
Returns reflect differences in sales charges and expenses, which are primarily differences in distribution and service fees. Fund returns assume reinvestment of dividends and capital gains.
Comparative index and benchmark return information is provided for the Funds’ Class A Shares at net asset value (NAV) only.
The expense ratios shown reflect the Funds’ total operating expenses (before fee waivers or expense reimbursements, if any) as shown in the Funds’ most recent prospectus. The expense ratios include management fees and other fees and expenses.
| Nuveen Investments | 11 |
Fund Performance and Expense Ratios (Unaudited) (continued)
Nuveen Growth Allocation Fund
Refer to the first page of this Fund Performance and Expense Ratios section for further explanation of the information included within this page.
Fund Performance
Average Annual Total Returns as of June 30, 2011
Average Annual | ||||||||||||
| 1-Year | 5-Year | Since Inception* | ||||||||||
Class A Shares at NAV | 23.45% | 4.15% | 6.18% | |||||||||
Class A Shares at maximum Offering Price | 16.35% | 2.92% | 5.23% | |||||||||
S&P 500 Index** | 30.69% | 2.94% | 3.72% | |||||||||
Growth Allocation Composite** | 23.72% | 3.87% | 4.18% | |||||||||
Lipper Mixed-Asset Target Allocation Growth Funds Category Average** | 23.35% | 3.72% | 4.45% | |||||||||
Class B Shares w/o CDSC | 22.54% | 3.37% | 5.39% | |||||||||
Class B Shares w/CDSC | 18.54% | 3.19% | 5.39% | |||||||||
Class C Shares | 22.58% | 3.37% | 5.40% | |||||||||
Class R3 Shares | 23.15% | 3.89% | 5.92% | |||||||||
Class I Shares | 23.85% | 4.41% | 6.46% | |||||||||
Class A, C and I Share returns are actual. The returns for Class R3 Shares are actual for the periods since class inception; returns prior to class inception are Class I Share returns adjusted for differences in sales charges and expenses, which are primarily differences in distribution and service fees.
Class A Shares have a maximum 5.75% sales charge. Class A Share purchases of $1 million or more are sold at net asset value without an up-front sales charge but may be subject to a contingent deferred sales charge (CDSC), also known as a back-end sales charge, if redeemed within twelve months of purchase. Class C Shares have a 1% CDSC for redemptions within less than twelve months, which is not reflected in the one-year total return. Class R3 Shares have no sales charge and are available to only certain retirement plans. Class I Shares have no sales charge and may be purchased under limited circumstances or by specified classes of investors.
Expense Ratios
| Share Class | Gross Expense Ratios | Net Expense Ratios | ||||
Class A | 2.33% | 1.40% | ||||
Class B | 3.09% | 2.15% | ||||
Class C | 3.09% | 2.15% | ||||
Class R3 | 2.60% | 1.65% | ||||
Class I | 2.10% | 1.15% | ||||
The investment adviser has agreed to waive fees and reimburse expenses through October 31, 2011 so that total annual Fund operating expenses (excluding 12b-1 distribution and service fees, interest expenses, taxes, fees incurred in acquiring and disposing of portfolio securities and extraordinary expenses) do not exceed 0.40% (0.84% after October 31, 2011) of the average daily net assets of any class of Fund shares. The expense limitation expiring October 31, 2011, may be terminated or modified prior to that date only with the approval of the Board of Trustees of the Fund. The expense limitation in effect thereafter may be terminated or modified only with the approval of shareholders of the Fund.
| * | Since inception returns for Class A, B, C and I Shares and for the index, composite and average are from 12/9/04; since inception return for Class R3 Shares is from 8/4/08. |
| ** | Refer to the Glossary of Terms Used in this Report for definitions. |
| 12 | Nuveen Investments |
Growth of an Assumed $10,000 Investment as of June 30, 2011
The graph does not reflect the deduction of taxes that a shareholder may pay on Fund distributions or the redemption of Fund shares.
| Nuveen Investments | 13 |
Fund Performance and Expense Ratios (Unaudited) (continued)
Nuveen Moderate Allocation Fund
Refer to the first page of this Fund Performance and Expense Ratios section for further explanation of the information included within this page.
Fund Performance
Average Annual Total Returns as of June 30, 2011
| Average Annual | ||||||||||||
| 1-Year | 5-Year | 10-Year | ||||||||||
Class A Shares at NAV | 18.77% | 5.27% | 4.56% | |||||||||
Class A Shares at maximum Offering Price | 11.92% | 4.03% | 3.94% | |||||||||
S&P 500 Index* | 30.69% | 2.94% | 2.72% | |||||||||
Moderate Allocation Composite* | 18.53% | 4.65% | 4.18% | |||||||||
Lipper Mixed-Asset Target Allocation Moderate Funds Category Average* | 19.01% | 3.97% | 4.23% | |||||||||
Class B Shares w/o CDSC | 17.82% | 4.47% | 3.93% | |||||||||
Class B Shares w/CDSC | 13.82% | 4.30% | 3.93% | |||||||||
Class C Shares | 17.75% | 4.46% | 3.77% | |||||||||
Class R3 Shares** | 18.17% | 4.94% | 4.27% | |||||||||
Class I Shares | 19.00% | 5.53% | 4.81% | |||||||||
Class A, C and I Share returns are actual. The returns for Class R3 Shares are actual for the periods since class inception; returns prior to class inception are Class I Share returns adjusted for differences in sales charges and expenses, which are primarily differences in distribution and service fees.
Class A Shares have a maximum 5.75% sales charge. Class A Share purchases of $1 million or more are sold at net asset value without an up-front sales charge but may be subject to a contingent deferred sales charge (CDSC), also known as a back-end sales charge, if redeemed within twelve months of purchase. Class C Shares have a 1% CDSC for redemptions within less than twelve months, which is not reflected in the one-year total return. Class R3 Shares have no sales charge and are available to only certain retirement plans. Class I Shares have no sales charge and may be purchased under limited circumstances or by specified classes of investors.
Expense Ratios
| Share Class | Gross Expense Ratios | Net Expense Ratios | ||||||
Class A | 1.53% | 1.24% | ||||||
Class B | 2.28% | 1.99% | ||||||
Class C | 2.28% | 1.99% | ||||||
Class R3 | 1.78% | 1.49% | ||||||
Class I | 1.28% | 0.99% | ||||||
The investment adviser has agreed to waive fees and reimburse expenses through October 31, 2011 so that total annual Fund operating expenses (excluding 12b-1 distribution and service fees, interest expenses, taxes, fees incurred in acquiring and disposing of portfolio securities and extraordinary expenses) do not exceed 0.29% of the average daily net assets of any class of Fund shares. The expense limitation expiring October 31, 2011, may be terminated or modified prior to that date only with the approval of the Board of Trustees of the Fund. The expense limitation in effect thereafter may be terminated or modified only with the approval of shareholders of the Fund.
| * | Refer to the Glossary of Terms Used in this Report for definitions. |
| ** | The inception date for Class R3 Shares is 8/4/08. |
| 14 | Nuveen Investments |
Growth of an Assumed $10,000 Investment as of June 30, 2011

The graph does not reflect the deduction of taxes that a shareholder may pay on Fund distributions or the redemption of Fund shares.
| Nuveen Investments | 15 |
Fund Performance and Expense Ratios (Unaudited) (continued)
Nuveen Conservative Allocation Fund
Refer to the first page of this Fund Performance and Expense Ratios section for further explanation of the information included within this page.
Fund Performance
Average Annual Total Returns as of June 30, 2011
| Average Annual | ||||||||||||
| 1-Year | 5-Year | 10-Year | ||||||||||
Class A Shares at NAV | 14.29% | 4.48% | 3.56% | |||||||||
Class A Shares at maximum Offering Price | 7.70% | 3.25% | 2.95% | |||||||||
S&P 500 Index* | 30.69% | 2.94% | 2.72% | |||||||||
Conservative Allocation Composite* | 13.47% | 5.31% | 4.74% | |||||||||
Lipper Mixed-Asset Target Allocation Conservative Funds Category Average* | 13.06% | 4.41% | 4.19% | |||||||||
Class B Shares w/o CDSC | 13.37% | 3.69% | 2.94% | |||||||||
Class B Shares w/CDSC | 9.37% | 3.52% | 2.94% | |||||||||
Class C Shares | 13.38% | 3.70% | 2.78% | |||||||||
Class R3 Shares** | 13.94% | 4.22% | 3.30% | |||||||||
Class I Shares | 14.49% | 4.73% | 3.82% | |||||||||
Class A, C and I Share returns are actual. The returns for Class R3 Shares are actual for the periods since class inception; returns prior to class inception are Class I Share returns adjusted for differences in sales charges and expenses, which are primarily differences in distribution and service fees.
Class A Shares have a maximum 5.75% sales charge. Class A Share purchases of $1 million or more are sold at net asset value without an up-front sales charge but may be subject to a contingent deferred sales charge (CDSC), also known as a back-end sales charge, if redeemed within twelve months of purchase. Class C Shares have a 1% CDSC for redemptions within less than twelve months, which is not reflected in the one-year total return. Class R3 Shares have no sales charge and are available to only certain retirement plans. Class I Shares have no sales charge and may be purchased under limited circumstances or by specified classes of investors.
Expense Ratios
| Share Class | Gross Expense Ratios | Net Expense Ratios | ||||
Class A | 1.39% | 1.24% | ||||
Class B | 2.15% | 1.99% | ||||
Class C | 2.14% | 1.99% | ||||
Class R3 | 1.64% | 1.49% | ||||
Class I | 1.12% | 0.99% | ||||
The investment adviser has agreed to waive fees and reimburse expenses through October 31, 2011 so that total annual Fund operating expenses (excluding 12b-1 distribution and service fees, interest expenses, taxes, fees incurred in acquiring and disposing of portfolio securities and extraordinary expenses) do not exceed 0.37% of the average daily net assets of any class of Fund shares. The expense limitation expiring October 31, 2011, may be terminated or modified prior to that date only with the approval of the Board of Trustees of the Fund. The expense limitation in effect thereafter may be terminated or modified only with the approval of shareholders of the Fund.
| * | Refer to the Glossary of Terms Used in this Report for definitions. |
| ** | Inception date for Class R3 Shares is 8/4/08. |
| 16 | Nuveen Investments |
Growth of an Assumed $10,000 Investment as of June 30, 2011
The graph does not reflect the deduction of taxes that a shareholder may pay on Fund distributions or the redemption of Fund shares.
| Nuveen Investments | 17 |
Holding Summaries (Unaudited) as of June 30, 2011
This data relates to the securities held in each Fund’s portfolio of investments. It should not be construed as a measure of performance for the Fund itself.
Nuveen Growth Allocation Fund
Portfolio Allocation1
Nuveen Moderate Allocation Fund
Portfolio Allocation1
Nuveen Conservative Allocation Fund
Portfolio Allocation1
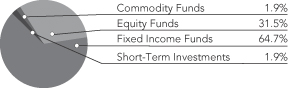
| 18 | Nuveen Investments |
| 1 | As a percentage of total investments as of June 30, 2011. Holdings are subject to change. |
Nuveen Growth Allocation Fund
| Holding | Weighting1 | |||
Credit Suisse Commodity Return Strategy Fund | 1.7% | |||
| Total Non-Affiliated Commodity Funds | 1.7% | |||
Nuveen Multi-Manager Large-Cap Value Fund (Class I) | 4.0% | |||
Nuveen NWQ Large-Cap Value Fund (Class I) | 6.0% | |||
Nuveen Real Estate Securities Fund (Class I) | 5.0% | |||
Nuveen Santa Barbara Growth Fund (Class I) | 1.7% | |||
Nuveen Santa Barbara International Equity Fund (Class I) | 12.3% | |||
Nuveen Symphony Large-Cap Growth Fund (Class I) | 2.4% | |||
Nuveen Tradewinds Emerging Markets Fund (Class I) | 5.1% | |||
Nuveen Tradewinds Global Resources Fund (Class I) | 3.1% | |||
Nuveen Tradewinds International Value Fund (Class I) | 12.2% | |||
Nuveen Tradewinds Value Opportunities Fund (Class I) | 3.3% | |||
Nuveen U.S. Equity Completeness Fund | 10.1% | |||
Nuveen Winslow Large Cap Growth Fund (Class I) | 6.1% | |||
Total Affiliated Equity Funds | 71.3% | |||
Guggenheim Frontier Markets ETF | 0.0% | |||
SPDR Barclays Capital Convertible Securities ETF | 3.0% | |||
SPDR S&P Emerging Middle East and Africa ETF | 0.0% | |||
Total Non-Affiliated Equity Funds | 3.0% | |||
| Total Equity Funds | 74.3% | |||
Nuveen High Yield Bond Fund (Class I) | 5.6% | |||
Nuveen Inflation Protected Securities Fund (Class I) | 5.0% | |||
Nuveen Multi-Strategy Core Bond Fund (Class I) | 1.2% | |||
Nuveen Preferred Securities Fund (Class I) | 2.0% | |||
Nuveen Short Duration Bond Fund (Class I) | 1.6% | |||
Nuveen Short Term Bond Fund (Class I) | 3.0% | |||
Nuveen Symphony Credit Opportunities Fund (Class I) | 5.6% | |||
| Total Affiliated Fixed Income Funds | 24.0% | |||
| Total Investments | 100.0% | |||
| Non-Affiliated Commodity Funds | 1-Year Average Annual Total Returns as of 6/30/11 | |||
Credit Suisse Commodity Return Strategy Fund | 24.47% | |||
| Affiliated Equity Funds | ||||
Nuveen Multi-Manager Large-Cap Value Fund (Class I) | 27.46% | |||
Nuveen NWQ Large-Cap Value Fund (Class I) | 26.54% | |||
Nuveen Real Estate Securities Fund (Class I) | 35.47% | |||
Nuveen Santa Barbara Growth Fund (Class I) | 30.37% | |||
Nuveen Santa Barbara International Equity Fund (Class I) | 34.55% | |||
Nuveen Symphony Large-Cap Growth Fund (Class I) | 35.58% | |||
Nuveen Tradewinds Emerging Markets Fund (Class I) | 19.28% | |||
Nuveen Tradewinds Global Resources Fund (Class I) | 32.28% | |||
Nuveen Tradewinds International Value Fund (Class I) | 18.85% | |||
Nuveen Tradewinds Value Opportunities Fund (Class I) | 25.64% | |||
Nuveen U.S. Equity Completeness Fund | 31.57% | |||
Nuveen Winslow Large Cap Growth Fund (Class I) | 39.67% | |||
| Non-Affiliated Equity Funds | ||||
Guggenheim Frontier Markets ETF | 28.83% | |||
SPDR Barclays Capital Convertible Securities ETF | 20.38% | |||
SPDR S&P Emerging Middle East and Africa ETF | 29.18% | |||
| Affiliated Fixed Income Funds | ||||
Nuveen High Yield Bond Fund (Class I) | 17.96% | |||
Nuveen Inflation Protected Securities Fund (Class I) | 7.62% | |||
Nuveen Multi-Strategy Core Bond Fund (Class I) | 4.95% | |||
Nuveen Preferred Securities Fund (Class I) | 18.90% | |||
Nuveen Short Duration Bond Fund (Class I) | 4.01% | |||
Nuveen Short Term Bond Fund (Class I) | 3.16% | |||
Nuveen Symphony Credit Opportunities Fund (Class I) | 16.00% | |||
| 1 | As a percentage of total investments as of June 30, 2011. Holdings are subject to change. |
| Nuveen Investments | 19 |
Holding Summaries (Unaudited) (continued) as of June 30, 2011
Nuveen Moderate Allocation Fund
| Holding | Weighting1 | |||
Credit Suisse Commodity Return Strategy Fund | 2.1% | |||
| Total Non-Affiliated Commodity Funds | 2.1% | |||
Nuveen Multi-Manager Large-Cap Value Fund (Class I) | 2.9% | |||
Nuveen NWQ Large-Cap Value Fund (Class I) | 4.4% | |||
Nuveen Real Estate Securities Fund (Class I) | 4.0% | |||
Nuveen Santa Barbara Growth Fund (Class I) | 1.2% | |||
Nuveen Santa Barbara International Equity Fund (Class I) | 8.2% | |||
Nuveen Symphony Large-Cap Growth Fund (Class I) | 1.7% | |||
Nuveen Tradewinds Emerging Markets Fund (Class I) | 3.1% | |||
Nuveen Tradewinds Global Resources Fund (Class I) | 3.1% | |||
Nuveen Tradewinds International Value Fund (Class I) | 8.2% | |||
Nuveen Tradewinds Value Opportunities Fund (Class I) | 2.5% | |||
Nuveen U.S. Equity Completeness Fund | 7.3% | |||
Nuveen Winslow Large Cap Growth Fund (Class I) | 4.4% | |||
Total Affiliated Equity Funds | 51.0% | |||
Guggenheim Frontier Markets ETF | 0.0% | |||
SPDR Barclays Capital Convertible Securities ETF | 2.0% | |||
SPDR S&P Emerging Middle East and Africa ETF | 0.0% | |||
Total Non-Affiliated Equity Funds | 2.0% | |||
| Total Equity Funds | 53.0% | |||
Nuveen High Yield Bond Fund (Class I) | 7.6% | |||
Nuveen Inflation Protected Securities Fund (Class I) | 12.0% | |||
Nuveen Multi-Strategy Core Bond Fund (Class I) | 7.0% | |||
Nuveen Preferred Securities Fund (Class I) | 2.0% | |||
Nuveen Short Duration Bond Fund (Class I) | 7.2% | |||
Nuveen Short Term Bond Fund (Class I) | 0.4% | |||
Nuveen Symphony Credit Opportunities Fund (Class I) | 7.6% | |||
| Total Affiliated Fixed Income Funds | 43.8% | |||
| Total Short-Term Investments | 1.1% | |||
| Total Investments | 100.0% | |||
| Non-Affiliated Commodity Funds | 1-Year Average Annual Total Returns as of 6/30/11 | |||
Credit Suisse Commodity Return Strategy Fund | 24.47% | |||
| Affiliated Equity Funds | ||||
Nuveen Multi-Manager Large-Cap Value Fund (Class I) | 27.46% | |||
Nuveen NWQ Large-Cap Value Fund (Class I) | 26.54% | |||
Nuveen Real Estate Securities Fund (Class I) | 35.47% | |||
Nuveen Santa Barbara Growth Fund (Class I) | 30.37% | |||
Nuveen Santa Barbara International Equity Fund (Class I) | 34.55% | |||
Nuveen Symphony Large-Cap Growth Fund (Class I) | 35.58% | |||
Nuveen Tradewinds Emerging Markets Fund (Class I) | 19.28% | |||
Nuveen Tradewinds Global Resources Fund (Class I) | 32.28% | |||
Nuveen Tradewinds International Value Fund (Class I) | 18.85% | |||
Nuveen Tradewinds Value Opportunities Fund (Class I) | 25.64% | |||
Nuveen U.S. Equity Completeness Fund | 31.57% | |||
Nuveen Winslow Large Cap Growth Fund (Class I) | 39.67% | |||
| Non-Affiliated Equity Funds | ||||
Guggenheim Frontier Markets ETF | 28.83% | |||
SPDR Barclays Capital Convertible Securities ETF | 20.38% | |||
SPDR S&P Emerging Middle East and Africa ETF | 29.18% | |||
| Affiliated Fixed Income Funds | ||||
Nuveen High Yield Bond Fund (Class I) | 17.96% | |||
Nuveen Inflation Protected Securities Fund (Class I) | 7.62% | |||
Nuveen Multi-Strategy Core Bond Fund (Class I) | 4.95% | |||
Nuveen Preferred Securities Fund (Class I) | 18.90% | |||
Nuveen Short Duration Bond Fund (Class I) | 4.01% | |||
Nuveen Short Term Bond Fund (Class I) | 3.16% | |||
Nuveen Symphony Credit Opportunities Fund (Class I) | 16.00% | |||
| 1 | As a percentage of total investments as of June 30, 2011. Holdings are subject to change. |
| 20 | Nuveen Investments |
Nuveen Conservative Allocation Fund
| Holding | Weighting1 | |||
Credit Suisse Commodity Return Strategy Fund | 1.9% | |||
| Total Non-Affiliated Commodity Funds | 1.9% | |||
Nuveen Multi-Manager Large-Cap Value Fund (Class I) | 1.7% | |||
Nuveen NWQ Large-Cap Value Fund (Class I) | 2.6% | |||
Nuveen Real Estate Securities Fund (Class I) | 3.0% | |||
Nuveen Santa Barbara Growth Fund (Class I) | 0.7% | |||
Nuveen Santa Barbara International Equity Fund (Class I) | 4.6% | |||
Nuveen Symphony Large-Cap Growth Fund (Class I) | 1.0% | |||
Nuveen Tradewinds Emerging Markets Fund (Class I) | 1.0% | |||
Nuveen Tradewinds Global Resources Fund (Class I) | 3.0% | |||
Nuveen Tradewinds International Value Fund (Class I) | 4.6% | |||
Nuveen Tradewinds Value Opportunities Fund (Class I) | 1.4% | |||
Nuveen U.S. Equity Completeness Fund | 4.3% | |||
Nuveen Winslow Large Cap Growth Fund (Class I) | 2.6% | |||
Total Affiliated Equity Funds | 30.5% | |||
Guggenheim Frontier Markets ETF | 0.0% | |||
SPDR Barclays Capital Convertible Securities ETF | 1.0% | |||
SPDR S&P Emerging Middle East and Africa ETF | 0.0% | |||
Total Non-Affiliated Equity Funds | 1.0% | |||
| Total Equity Funds | 31.5% | |||
Nuveen High Yield Bond Fund (Class I) | 4.5% | |||
Nuveen Inflation Protected Securities Fund (Class I) | 14.0% | |||
Nuveen Multi-Strategy Core Bond Fund (Class I) | 16.1% | |||
Nuveen Preferred Securities Fund (Class I) | 2.0% | |||
Nuveen Short Duration Bond Fund (Class I) | 19.5% | |||
Nuveen Short Term Bond Fund (Class I) | 4.1% | |||
Nuveen Symphony Credit Opportunities Fund (Class I) | 4.5% | |||
| Total Affiliated Fixed Income Funds | 64.7% | |||
| Total Short-Term Investments | 1.9% | |||
| Total Investments | 100.0% | |||
| Non-Affiliated Commodity Funds | 1-Year Average Annual Total Returns as of 6/30/11 | |||
Credit Suisse Commodity Return Strategy Fund | 24.47% | |||
| Affiliated Equity Funds | ||||
Nuveen Multi-Manager Large-Cap Value Fund (Class I) | 27.46% | |||
Nuveen NWQ Large-Cap Value Fund (Class I) | 26.54% | |||
Nuveen Real Estate Securities Fund (Class I) | 35.47% | |||
Nuveen Santa Barbara Growth Fund (Class I) | 30.37% | |||
Nuveen Santa Barbara International Equity Fund (Class I) | 34.55% | |||
Nuveen Symphony Large-Cap Growth Fund (Class I) | 35.58% | |||
Nuveen Tradewinds Emerging Markets Fund (Class I) | 19.28% | |||
Nuveen Tradewinds Global Resources Fund (Class I) | 32.28% | |||
Nuveen Tradewinds International Value Fund (Class I) | 18.85% | |||
Nuveen Tradewinds Value Opportunities Fund (Class I) | 25.64% | |||
Nuveen U.S. Equity Completeness Fund | 31.57% | |||
Nuveen Winslow Large Cap Growth Fund (Class I) | 39.67% | |||
| Non-Affiliated Equity Funds | ||||
Guggenheim Frontier Markets ETF | 28.83% | |||
SPDR Barclays Capital Convertible Securities ETF | 20.38% | |||
SPDR S&P Emerging Middle East and Africa ETF | 29.18% | |||
| Affiliated Fixed Income Funds | ||||
Nuveen High Yield Bond Fund (Class I) | 17.96% | |||
Nuveen Inflation Protected Securities Fund (Class I) | 7.62% | |||
Nuveen Multi-Strategy Core Bond Fund (Class I) | 4.95% | |||
Nuveen Preferred Securities Fund (Class I) | 18.90% | |||
Nuveen Short Duration Bond Fund (Class I) | 4.01% | |||
Nuveen Short Term Bond Fund (Class I) | 3.16% | |||
Nuveen Symphony Credit Opportunities Fund (Class I) | 16.00% | |||
| 1 | As a percentage of total investments as of June 30, 2011. Holdings are subject to change. |
| Nuveen Investments | 21 |
As a shareholder of one or more of the Funds, you incur two types of costs: (1) transaction costs, including up-front and back-end sales charges (loads) or redemption fees, where applicable; and (2) ongoing costs, including management fees; distribution and service (12b-1) fees, where applicable; and other Fund expenses. The Examples below are intended to help you understand your ongoing costs (in dollars) of investing in the Funds and to compare these costs with the ongoing costs of investing in other mutual funds.
The Examples below are based on an investment of $1,000 invested at the beginning of the period and held for the period.
The information under “Actual Performance,” together with the amount you invested, allows you to estimate actual expenses incurred over the reporting period. Simply divide your account value by $1,000 (for example, an $8,600 account value divided by $1,000 = 8.60) and multiply the result by the cost shown for your share class, in the row entitled “Expenses Incurred During Period” to estimate the expenses incurred on your account during this period.
The information under “Hypothetical Performance,” provides information about hypothetical account values and hypothetical expenses based on the respective Fund’s actual expense ratio and an assumed rate of return of 5% per year before expenses, which is not the Fund’s actual return. The hypothetical account values and expenses may not be used to estimate the actual ending account balance or expense you incurred for the period. You may use this information to compare the ongoing costs of investing in the Fund and other Funds. To do so, compare this 5% hypothetical example with the 5% hypothetical examples that appear in the shareholder reports of the other funds.
Please note that the expenses shown in the table are meant to highlight your ongoing costs only and do not reflect any transaction costs. Therefore, the hypothetical information is useful in comparing ongoing costs only, and will not help you determine the relative total costs of owning different funds or share classes. In addition, if these transaction costs were included, your costs would have been higher.
Nuveen Growth Allocation Fund
| Hypothetical Performance | ||||||||||||||||||||||||||||||||||||||||||
| Actual Performance | (5% annualized return before expenses) | |||||||||||||||||||||||||||||||||||||||||
| A Shares | B Shares | C Shares | R3 Shares | I Shares | A Shares | B Shares | C Shares | R3 Shares | I Shares | |||||||||||||||||||||||||||||||||
| Beginning Account Value (1/01/11) | $ | 1,000.00 | $ | 1,000.00 | $ | 1,000.00 | $ | 1,000.00 | $ | 1,000.00 | $ | 1,000.00 | $ | 1,000.00 | $ | 1,000.00 | $ | 1,000.00 | $ | 1,000.00 | ||||||||||||||||||||||
| Ending Account Value (6/30/11) | $ | 1,016.30 | $ | 1,012.60 | $ | 1,012.60 | $ | 1,015.40 | $ | 1,017.60 | $ | 1,021.57 | $ | 1,017.85 | $ | 1,017.85 | $ | 1,020.33 | $ | 1,022.81 | ||||||||||||||||||||||
| Expenses Incurred During Period | $ | 3.25 | $ | 6.99 | $ | 6.99 | $ | 4.50 | $ | 2.00 | $ | 3.26 | $ | 7.00 | $ | 7.00 | $ | 4.51 | $ | 2.01 | ||||||||||||||||||||||
For each class of the Fund, expenses are equal to the Fund’s annualized net expense ratio of .65%, 1.40%, 1.40%, .90% and ..40% for Classes A, B, C, R3 and I, respectively, multiplied by the average account value over the period, multiplied by 181/365 (to reflect the one-half year period).
Nuveen Moderate Allocation Fund
| Hypothetical Performance | ||||||||||||||||||||||||||||||||||||||||||
| Actual Performance | (5% annualized return before expenses) | |||||||||||||||||||||||||||||||||||||||||
| A Shares | B Shares | C Shares | R3 Shares | I Shares | A Shares | B Shares | C Shares | R3 Shares | I Shares | |||||||||||||||||||||||||||||||||
| Beginning Account Value (1/01/11) | $ | 1,000.00 | $ | 1,000.00 | $ | 1,000.00 | $ | 1,000.00 | $ | 1,000.00 | $ | 1,000.00 | $ | 1,000.00 | $ | 1,000.00 | $ | 1,000.00 | $ | 1,000.00 | ||||||||||||||||||||||
| Ending Account Value (6/30/11) | $ | 1,017.40 | $ | 1,013.70 | $ | 1,013.70 | $ | 1,016.20 | $ | 1,019.10 | $ | 1,022.12 | $ | 1,018.40 | $ | 1,018.40 | $ | 1,020.88 | $ | 1,023.36 | ||||||||||||||||||||||
| Expenses Incurred During Period | $ | 2.70 | $ | 6.44 | $ | 6.44 | $ | 3.95 | $ | 1.45 | $ | 2.71 | $ | 6.46 | $ | 6.46 | $ | 3.96 | $ | 1.45 | ||||||||||||||||||||||
For each class of the Fund, expenses are equal to the Fund’s annualized net expense ratio of .54%, 1.29%, 1.29%, .79% and ..29% for Classes A, B, C, R3 and I, respectively, multiplied by the average account value over the period, multiplied by 181/365 (to reflect the one-half year period).
Nuveen Conservative Allocation Fund
| Hypothetical Performance | ||||||||||||||||||||||||||||||||||||||||||
| Actual Performance | (5% annualized return before expenses) | |||||||||||||||||||||||||||||||||||||||||
| A Shares | B Shares | C Shares | R3 Shares | I Shares | A Shares | B Shares | C Shares | R3 Shares | I Shares | |||||||||||||||||||||||||||||||||
| Beginning Account Value (1/01/11) | $ | 1,000.00 | $ | 1,000.00 | $ | 1,000.00 | $ | 1,000.00 | $ | 1,000.00 | $ | 1,000.00 | $ | 1,000.00 | $ | 1,000.00 | $ | 1,000.00 | $ | 1,000.00 | ||||||||||||||||||||||
| Ending Account Value (6/30/11) | $ | 1,018.30 | $ | 1,014.30 | $ | 1,014.30 | $ | 1,017.10 | $ | 1,019.20 | $ | 1,021.72 | $ | 1,018.00 | $ | 1,018.00 | $ | 1,020.48 | $ | 1,022.96 | ||||||||||||||||||||||
| Expenses Incurred During Period | $ | 3.10 | $ | 6.84 | $ | 6.84 | $ | 4.35 | $ | 1.85 | $ | 3.11 | $ | 6.85 | $ | 6.85 | $ | 4.36 | $ | 1.86 | ||||||||||||||||||||||
For each class of the Fund, expenses are equal to the Fund’s annualized net expense ratio of .62%, 1.37%, 1.37%, .87% and ..37% for Classes A, B, C, R3 and I, respectively, multiplied by the average account value over the period, multiplied by 181/365 (to reflect the one-half year period).
| 22 | Nuveen Investments |
Report of Independent Registered Public Accounting Firm
To the Board of Trustees and Shareholders of
Nuveen Investment Trust:
In our opinion, the accompanying statements of assets and liabilities, including the portfolios of investments, and the related statements of operations, of changes in net assets and the financial highlights present fairly, in all material respects, the financial position of Nuveen Growth Allocation Fund, Nuveen Moderate Allocation Fund, and Nuveen Conservative Allocation (each a series of the Nuveen Investment Trust, hereafter referred to as the “Funds”) at June 30, 2011, the results of their operations for the year then ended, the changes in their net assets for each of the two years in the period then ended and the financial highlights for each of the periods presented in conformity with accounting principles generally accepted in the United States of America. These financial statements and financial highlights (hereafter referred to as “financial statements”) are the responsibility of the Funds’ management; our responsibility is to express an opinion on these financial statements based on our audits. We conducted our audits of these financial statements in accordance with the standards of the Public Company Accounting Oversight Board (United States). Those standards require that we plan and perform the audit to obtain reasonable assurance about whether the financial statements are free of material misstatement. An audit includes examining, on a test basis, evidence supporting the amounts and disclosures in the financial statements, assessing the accounting principles used and significant estimates made by management, and evaluating the overall financial statement presentation. We believe that our audits, which included confirmation of securities at June 30, 2011 by correspondence with the custodian and brokers, provide a reasonable basis for our opinion.
As disclosed in Note 1 to the financial statements, the Nuveen Growth Allocation Fund will liquidate after the close of business on October 7, 2011.
PRICEWATERHOUSECOOPERS LLP
Chicago, IL
August 26, 2011
| Nuveen Investments | 23 |
Nuveen Growth Allocation Fund
June 30, 2011
| Shares | Description (1) | Value | ||||||||||||
COMMODITY FUNDS – 1.7% | ||||||||||||||
Non-Affiliated Commodity Funds – 1.7% | ||||||||||||||
| 16,707 | Credit Suisse Commodity Return Strategy Fund | $ | 153,879 | |||||||||||
Total Commodity Funds (cost $149,710) | 153,879 | |||||||||||||
EQUITY FUNDS – 73.6% | ||||||||||||||
Affiliated Equity Funds – 70.6% | ||||||||||||||
| 17,602 | Nuveen Multi-Manager Large Cap Value Fund (Class I) | 358,044 | ||||||||||||
| 28,892 | Nuveen NWQ Large-Cap Value Fund (Class I) | 537,113 | ||||||||||||
| 22,526 | Nuveen Real Estate Securities Fund (Class I) | 447,367 | ||||||||||||
| 7,033 | Nuveen Santa Barbara Growth Fund (Class I) | 149,467 | ||||||||||||
| 35,233 | Nuveen Santa Barbara International Equity Fund (Class I) | 1,091,872 | ||||||||||||
| 8,329 | Nuveen Symphony Large-Cap Growth Fund (Class I) | 209,155 | ||||||||||||
| 11,270 | Nuveen Tradewinds Emerging Markets Fund (Class I) | 451,496 | ||||||||||||
| 10,658 | Nuveen Tradewinds Global Resources Fund (Class I) | 272,966 | ||||||||||||
| 41,905 | Nuveen Tradewinds International Value Fund (Class I) | 1,088,282 | ||||||||||||
| 8,318 | Nuveen Tradewinds Value Opportunities Fund (Class I) | 297,219 | ||||||||||||
| 43,569 | Nuveen U.S. Equity Completeness Fund, (2) | 895,344 | ||||||||||||
| 16,496 | Nuveen Winslow Large Cap Growth Fund (Class I) | 538,436 | ||||||||||||
Total Affiliated Equity Funds (cost $5,965,473) | 6,336,761 | |||||||||||||
Non-Affiliated Equity Funds – 3.0% | ||||||||||||||
| 10 | Guggenheim Frontier Markets ETF | 234 | ||||||||||||
| 6,480 | SPDR Barclays Capital Convertible Securities ETF | 268,790 | ||||||||||||
| 3 | SPDR S&P Emerging Middle East and Africa ETF | 222 | ||||||||||||
Total Non-Affiliated Equity Funds (cost $266,008) | 269,246 | |||||||||||||
Total Equity Funds (cost $6,231,481) | 6,606,007 | |||||||||||||
FIXED INCOME FUNDS – 23.7% | ||||||||||||||
Affiliated Fixed Income Funds – 23.7% | ||||||||||||||
| 27,537 | Nuveen High Yield Bond Fund (Class I) | 495,128 | ||||||||||||
| 40,771 | Nuveen Inflation Protected Securities Fund (Class I) | 446,859 | ||||||||||||
| 5,161 | Nuveen Multi-Strategy Core Bond Fund (Class I) | 105,094 | ||||||||||||
| 10,698 | Nuveen Preferred Securities Fund (Class I) | 180,796 | ||||||||||||
| 7,167 | Nuveen Short Duration Bond Fund (Class I) | 141,134 | ||||||||||||
| 26,216 | Nuveen Short Term Bond Fund (Class I) | 264,000 | ||||||||||||
| 23,537 | Nuveen Symphony Credit Opportunities Fund (Class I) | 494,284 | ||||||||||||
Total Fixed Income Funds (cost $2,014,808) | 2,127,295 | |||||||||||||
Total Investments (cost $8,395,999) – 99.0% | 8,887,181 | |||||||||||||
Other Assets Less Liabilities – 1.0% | 88,416 | |||||||||||||
Net Assets – 100% | $ | 8,975,597 | ||||||||||||
| (1) | All percentages shown in the Portfolio of Investments are based on net assets. |
| (2) | For fair value measurement disclosure purposes, Nuveen U.S. Equity Completeness Fund categorized as Level 2, as it is not publicly available to shareholders and may only be purchased by the Nuveen Conservative Allocation Fund, Nuveen Moderate Allocation Fund and Nuveen Growth Allocation Fund. See Notes to Financial Statements, Footnote 1 – General Information and Significant Accounting Policies, Investment Valuation for more information. |
See accompanying notes to financial statements.
| 24 | Nuveen Investments |
Portfolio of Investments
Nuveen Moderate Allocation Fund
June 30, 2011
| Shares | Description (1) | Value | ||||||||||||||||
COMMODITY FUNDS – 2.1% | ||||||||||||||||||
Non-Affiliated Commodity Funds – 2.1% | ||||||||||||||||||
| 124,691 | Credit Suisse Commodity Return Strategy Fund | $ | 1,148,412 | |||||||||||||||
Total Commodity Funds (cost $1,117,303) | 1,148,412 | |||||||||||||||||
EQUITY FUNDS – 52.3% | ||||||||||||||||||
Affiliated Equity Funds – 50.3% | ||||||||||||||||||
| 78,828 | Nuveen Multi-Manager Large Cap Value Fund (Class I) | 1,603,372 | ||||||||||||||||
| 129,609 | Nuveen NWQ Large-Cap Value Fund (Class I) | 2,409,433 | ||||||||||||||||
| 110,890 | Nuveen Real Estate Securities Fund (Class I) | 2,202,282 | ||||||||||||||||
| 31,500 | Nuveen Santa Barbara Growth Fund (Class I) | 669,391 | ||||||||||||||||
| 144,789 | Nuveen Santa Barbara International Equity Fund (Class I) | 4,487,039 | ||||||||||||||||
| 37,345 | Nuveen Symphony Large-Cap Growth Fund (Class I) | 937,747 | ||||||||||||||||
| 41,649 | Nuveen Tradewinds Emerging Markets Fund (Class I) | 1,668,488 | ||||||||||||||||
| 65,421 | Nuveen Tradewinds Global Resources Fund (Class I) | 1,675,452 | ||||||||||||||||
| 172,448 | Nuveen Tradewinds International Value Fund (Class I) | 4,478,489 | ||||||||||||||||
| 37 | Nuveen Tradewinds Value Opportunities Fund (Class I) | 1,334,572 | ||||||||||||||||
| 195,300 | Nuveen U.S. Equity Completeness Fund, (2) | 4,013,432 | ||||||||||||||||
| 73,908 | Nuveen Winslow Large Cap Growth Fund (Class I) | 2,412,387 | ||||||||||||||||
Total Affiliated Equity Funds (cost $25,104,250) | 27,892,084 | |||||||||||||||||
Non-Affiliated Equity Funds – 2.0% | ||||||||||||||||||
| 60 | Guggenheim Frontier Markets ETF | 1,406 | ||||||||||||||||
| 26,660 | SPDR Barclays Capital Convertible Securities ETF | 1,105,857 | ||||||||||||||||
| 20 | SPDR S&P Emerging Middle East and Africa ETF | 1,482 | ||||||||||||||||
Total Non-Affiliated Equity Funds (cost $1,086,353) | 1,108,745 | |||||||||||||||||
Total Equity Funds (cost $26,190,603) | 29,000,829 | |||||||||||||||||
FIXED INCOME FUNDS – 43.3% | ||||||||||||||||||
Affiliated Fixed Income Funds – 43.3% | ||||||||||||||||||
| 231,027 | Nuveen High Yield Bond Fund (Class I) | 4,153,873 | ||||||||||||||||
| 602,115 | Nuveen Inflation Protected Securities Fund (Class I) | 6,599,186 | ||||||||||||||||
| 189,145 | Nuveen Multi-Strategy Core Bond Fund (Class I) | 3,850,991 | ||||||||||||||||
| 65,486 | Nuveen Preferred Securities Fund (Class I) | 1,106,720 | ||||||||||||||||
| 199,158 | Nuveen Short Duration Bond Fund (Class I) | 3,921,436 | ||||||||||||||||
| 21,350 | Nuveen Short Term Bond Fund (Class I) | 215,000 | ||||||||||||||||
| 197,520 | Nuveen Symphony Credit Opportunities Fund (Class I) | 4,147,935 | ||||||||||||||||
Total Fixed Income Funds (cost $22,423,366) | 23,995,141 | |||||||||||||||||
| Principal Amount (000) | Description (1) | Coupon | Maturity | Value | ||||||||||||||
SHORT-TERM INVESTMENTS – 1.1% | ||||||||||||||||||
| $ | 603 | Repurchase Agreement with Fixed Income Clearing Corporation, dated 6/30/11, repurchase price $602,935, collateralized by $600,000 U.S. Treasury Notes, 1.750%, due 3/31/14, value $619,500 | 0.010% | 7/01/11 | $ | 602,935 | ||||||||||||
Total Short-Term Investments (cost $602,935) | 602,935 | |||||||||||||||||
Total Investments (cost $50,334,207) – 98.8% | 54,747,317 | |||||||||||||||||
Other Assets Less Liabilities – 1.2% | 680,336 | |||||||||||||||||
Net Assets – 100% | $ | 55,427,653 | ||||||||||||||||
| (1) | All percentages shown in the Portfolio of Investments are based on net assets. |
| (2) | For fair value measurement disclosure purposes, Nuveen U.S. Equity Completeness Fund categorized as Level 2, as it is not publicly available to shareholders and may only be purchased by the Nuveen Conservative Allocation Fund, Nuveen Moderate Allocation Fund and Nuveen Growth Allocation Fund. See Notes to Financial Statements, Footnote 1 – General Information and Significant Accounting Policies, Investment Valuation for more information. |
See accompanying notes to financial statements.
| Nuveen Investments | 25 |
Portfolio of Investments
Nuveen Conservative Allocation Fund
June 30, 2011
| Shares | Description (1) | Value | ||||||||||||||||
COMMODITY FUNDS – 1.9% | ||||||||||||||||||
Non-Affiliated Commodity Funds – 1.9% | ||||||||||||||||||
| 107,759 | Credit Suisse Commodity Return Strategy Fund | $ | 992,467 | |||||||||||||||
Total Commodity Funds (cost $965,583) | 992,467 | |||||||||||||||||
EQUITY FUNDS – 31.7% | ||||||||||||||||||
Affiliated Equity Funds – 30.7% | ||||||||||||||||||
| 43,710 | Nuveen Multi-Manager Large Cap Value Fund (Class I) | 889,062 | ||||||||||||||||
| 71,979 | Nuveen NWQ Large-Cap Value Fund (Class I) | 1,338,103 | ||||||||||||||||
| 78,890 | Nuveen Real Estate Securities Fund (Class I) | 1,566,760 | ||||||||||||||||
| 17,529 | Nuveen Santa Barbara Growth Fund (Class I) | 372,504 | ||||||||||||||||
| 77,347 | Nuveen Santa Barbara International Equity Fund (Class I) | 2,397,006 | ||||||||||||||||
| 20,718 | Nuveen Symphony Large-Cap Growth Fund (Class I) | 520,233 | ||||||||||||||||
| 13,385 | Nuveen Tradewinds Emerging Markets Fund (Class I) | 536,243 | ||||||||||||||||
| 61,845 | Nuveen Tradewinds Global Resources Fund (Class I) | 1,583,874 | ||||||||||||||||
| 92,142 | Nuveen Tradewinds International Value Fund (Class I) | 2,392,949 | ||||||||||||||||
| 21 | Nuveen Tradewinds Value Opportunities Fund (Class I) | 740,342 | ||||||||||||||||
| 108,440 | Nuveen U.S. Equity Completeness Fund, (2) | 2,228,459 | ||||||||||||||||
| 40,990 | Nuveen Winslow Large Cap Growth Fund (Class I) | 1,337,915 | ||||||||||||||||
Total Affiliated Equity Funds (cost $14,169,766) | 15,903,450 | |||||||||||||||||
Non-Affiliated Equity Funds – 1.0% | ||||||||||||||||||
| 50 | Guggenheim Frontier Markets ETF | 1,172 | ||||||||||||||||
| 12,780 | SPDR Barclays Capital Convertible Securities ETF | 530,114 | ||||||||||||||||
| 15 | SPDR S&P Emerging Middle East and Africa ETF | 1,111 | ||||||||||||||||
Total Non-Affiliated Equity Funds (cost $517,091) | 532,397 | |||||||||||||||||
Total Equity Funds (cost $14,686,857) | 16,435,847 | |||||||||||||||||
FIXED INCOME FUNDS – 65.2% | ||||||||||||||||||
Affiliated Fixed Income Funds – 65.2% | ||||||||||||||||||
| 131,806 | Nuveen High Yield Bond Fund (Class I) | 2,369,888 | ||||||||||||||||
| 668,776 | Nuveen Inflation Protected Securities Fund (Class I) | 7,329,795 | ||||||||||||||||
| 411,962 | Nuveen Multi-Strategy Core Bond Fund (Class I) | 8,387,565 | ||||||||||||||||
| 62,172 | Nuveen Preferred Securities Fund (Class I) | 1,050,711 | ||||||||||||||||
| 515,828 | Nuveen Short Duration Bond Fund (Class I) | 10,156,661 | ||||||||||||||||
| 213,505 | Nuveen Short Term Bond Fund (Class I) | 2,150,000 | ||||||||||||||||
| 112,683 | Nuveen Symphony Credit Opportunities Fund (Class I) | 2,366,361 | ||||||||||||||||
Total Fixed Income Funds (cost $32,248,087) | 33,810,981 | |||||||||||||||||
| Principal Amount (000) | Description (1) | Coupon | Maturity | Value | ||||||||||||||
SHORT-TERM INVESTMENTS – 1.9% | ||||||||||||||||||
| $ | 1,006 | Repurchase Agreement with Fixed Income Clearing Corporation, dated 6/30/11, repurchase price $1,006,271 collateralized by $995,000 U.S. Treasury Notes, 1.750%, due 3/31/14, value $1,027,338 | 0.010% | 7/01/11 | $ | 1,006,271 | ||||||||||||
Total Short-Term Investments (cost $1,006,271) | 1,006,271 | |||||||||||||||||
Total Investments (cost $48,906,798) – 100.7% | 52,245,566 | |||||||||||||||||
Other Assets Less Liabilities – (0.7)% | (369,313) | |||||||||||||||||
Net Assets – 100% | $ | 51,876,253 | ||||||||||||||||
| (1) | All percentages shown in the Portfolio of Investments are based on net assets. |
| (2) | For fair value measurement disclosure purposes, Nuveen U.S. Equity Completeness Fund categorized as Level 2, as it is not publicly available to shareholders and may only be purchased by the Nuveen Conservative Allocation Fund, Nuveen Moderate Allocation Fund and Nuveen Growth Allocation Fund. See Notes to Financial Statements, Footnote 1 – General Information and Significant Accounting Policies, Investment Valuation for more information. |
See accompanying notes to financial statements.
| 26 | Nuveen Investments |
Statement of Assets and Liabilities
June 30, 2011
| Growth Allocation | Moderate Allocation | Conservative Allocation | ||||||||||
Assets | ||||||||||||
Affiliated investments, at value (cost $7,980,281, $47,527,616 and $46,417,853, respectively) | $ | 8,464,056 | $ | 51,887,225 | $ | 49,714,431 | ||||||
Non-affiliated investments, at value (cost $415,718, $2,806,591 and $2,488,945, respectively) | 423,125 | 2,860,092 | 2,531,135 | |||||||||
Cash | 7,412 | — | — | |||||||||
Receivables: | ||||||||||||
Dividends | 8,951 | 85,532 | 90,141 | |||||||||
From Adviser | 14,388 | 18,376 | 7,720 | |||||||||
Investments sold | 664,000 | 2,621,854 | 4,083,425 | |||||||||
Reclaims | 989 | 6,058 | 5,489 | |||||||||
Shares sold | 1,000 | 48,284 | 18,401 | |||||||||
Other assets | 2,032 | 14,031 | 22,258 | |||||||||
Total assets | 9,585,953 | 57,541,452 | 56,473,000 | |||||||||
Liabilities | ||||||||||||
Payables: | ||||||||||||
Investments purchased | 536,895 | 1,847,000 | 3,765,000 | |||||||||
Shares redeemed | — | 146,226 | 714,812 | |||||||||
Accrued expenses: | ||||||||||||
12b-1 distribution and service fees | 3,939 | 17,742 | 18,250 | |||||||||
Other | 69,522 | 102,831 | 98,685 | |||||||||
Total liabilities | 610,356 | 2,113,799 | 4,596,747 | |||||||||
Net assets | $ | 8,975,597 | $ | 55,427,653 | $ | 51,876,253 | ||||||
Class A Shares | ||||||||||||
Net assets | $ | 2,789,839 | $ | 32,234,383 | $ | 37,420,285 | ||||||
Shares outstanding | 117,745 | 1,314,426 | 1,527,306 | |||||||||
Net asset value per share | $ | 23.69 | $ | 24.52 | $ | 24.50 | ||||||
Offering price per share (net asset value per share plus maximum sales charge of 5.75% of offering price) | $ | 25.14 | $ | 26.02 | $ | 25.99 | ||||||
Class B Shares | ||||||||||||
Net assets | $ | 452,906 | $ | 1,704,416 | $ | 1,062,532 | ||||||
Shares outstanding | 19,446 | 69,596 | 40,464 | |||||||||
Net asset value and offering price per share | $ | 23.29 | $ | 24.49 | $ | 26.26 | ||||||
Class C Shares | ||||||||||||
Net assets | $ | 3,564,396 | $ | 11,617,725 | $ | 11,589,417 | ||||||
Shares outstanding | 152,876 | 474,111 | 441,880 | |||||||||
Net asset value and offering price per share | $ | 23.32 | $ | 24.50 | $ | 26.23 | ||||||
Class R3 Shares | ||||||||||||
Net assets | $ | 55,543 | $ | 538,352 | $ | 50,899 | ||||||
Shares outstanding | 2,337 | 22,012 | 2,135 | |||||||||
Net asset value and offering price per share | $ | 23.77 | $ | 24.46 | $ | 23.84 | ||||||
Class I Shares | ||||||||||||
Net assets | $ | 2,112,913 | $ | 9,332,777 | $ | 1,753,120 | ||||||
Shares outstanding | 88,948 | 380,733 | 73,541 | |||||||||
Net asset value and offering price per share | $ | 23.75 | $ | 24.51 | $ | 23.84 | ||||||
Net assets consist of: | ||||||||||||
Capital paid-in | $ | 9,772,072 | $ | 50,732,110 | $ | 49,620,818 | ||||||
Undistributed (Over-distribution of) net investment income | 82,430 | 944,484 | 1,142,487 | |||||||||
Accumulated net realized gain (loss) | (1,369,998 | ) | (662,051 | ) | (2,225,820 | ) | ||||||
Net unrealized appreciation (depreciation) | 491,093 | 4,413,110 | 3,338,768 | |||||||||
Net assets | $ | 8,975,597 | $ | 55,427,653 | $ | 51,876,253 | ||||||
Authorized shares Par value per share | $ | Unlimited 0.01 |
| $ | Unlimited 0.01 |
| $ | Unlimited 0.01 |
| |||
See accompanying notes to financial statements.
| Nuveen Investments | 27 |
Year Ended June 30, 2011
| Growth Allocation | Moderate Allocation | Conservative Allocation | ||||||||||
Investment Income | ||||||||||||
Dividends from affiliated investments | $ | 140,697 | $ | 1,257,215 | $ | 1,407,998 | ||||||
Dividends from non-affiliated investments and interest | 23,920 | 182,177 | 166,057 | |||||||||
Total investment income | 164,617 | 1,439,392 | 1,574,055 | |||||||||
Expenses | ||||||||||||
Management fees | 13,096 | 84,169 | 76,095 | |||||||||
12b-1 service fees – Class A | 5,166 | 76,711 | 94,518 | |||||||||
12b-1 distribution and service fees – Class B | 4,416 | 21,220 | 11,256 | |||||||||
12b-1 distribution and service fees – Class C | 35,769 | 96,188 | 99,803 | |||||||||
12b-1 distribution and service fees – Class R3 | 513 | 2,156 | 493 | |||||||||
Shareholders’ servicing agent fees and expenses | 13,752 | 61,269 | 44,592 | |||||||||
Custodian’s fees and expenses | 3,939 | 11,789 | 8,142 | |||||||||
Trustees’ fees and expenses | 50 | 322 | 279 | |||||||||
Professional fees | 34,012 | 34,962 | 33,564 | |||||||||
Shareholders’ reports – printing and mailing expenses | 14,964 | 53,873 | 36,816 | |||||||||
Federal and state registration fees | 86,378 | 69,801 | 68,520 | |||||||||
Other expenses | 893 | 1,061 | 1,160 | |||||||||
Total expenses before custodian fee credit and expense reimbursement | 212,948 | 513,521 | 475,238 | |||||||||
Custodian fee credit | (8 | ) | (25 | ) | (18 | ) | ||||||
Expense reimbursement | (132,167 | ) | (154,522 | ) | (81,471 | ) | ||||||
Net expenses | 80,773 | 358,974 | 393,749 | |||||||||
Net investment income (loss) | 83,844 | 1,080,418 | 1,180,306 | |||||||||
Realized and Unrealized Gain (Loss) | ||||||||||||
Net realized gain (loss) from: | ||||||||||||
Affiliated investments | 309,543 | 498,933 | 848,094 | |||||||||
Non-affiliated investments | 728,340 | 3,872,003 | 2,105,996 | |||||||||
Distributions from affiliated investment company shares | 5,963 | 37,906 | 32,017 | |||||||||
Total net realized gain (loss) | 1,043,846 | 4,408,842 | 2,986,107 | |||||||||
Change in net unrealized appreciation (depreciation) of: | ||||||||||||
Affiliated investments | 694,848 | 4,613,828 | 2,756,131 | |||||||||
Non-affiliated investments | (55,782 | ) | (1,257,094 | ) | (537,664 | ) | ||||||
Total change in net unrealized appreciation (depreciation) | 639,066 | 3,356,734 | 2,218,467 | |||||||||
Net realized and unrealized gain (loss) | 1,682,912 | 7,765,576 | 5,204,574 | |||||||||
Net increase (decrease) in net assets from operations | $ | 1,766,756 | $ | 8,845,994 | $ | 6,384,880 | ||||||
See accompanying notes to financial statements.
| 28 | Nuveen Investments |
Statement of Changes in Net Assets
| Growth Allocation | ||||||||
| Year Ended 6/30/11 | Year Ended 6/30/10 | |||||||
Operations | ||||||||
Net investment income (loss) | $ | 83,844 | $ | 170,924 | ||||
Total net realized gain (loss) | 1,043,846 | (226,538 | ) | |||||
Total change in net unrealized appreciation (depreciation) | 639,066 | 1,261,750 | ||||||
Net increase (decrease) in net assets from operations | 1,766,756 | 1,206,136 | ||||||
Distributions to Shareholders | ||||||||
From net investment income: | ||||||||
Class A | (47,099 | ) | (41,424 | ) | ||||
Class B | (7,675 | ) | (6,798 | ) | ||||
Class C | (63,446 | ) | (58,777 | ) | ||||
Class R3 | (1,405 | ) | (2,707 | ) | ||||
Class I | (37,408 | ) | (95,767 | ) | ||||
Decrease in net assets from distributions to shareholders | (157,033 | ) | (205,473 | ) | ||||
Fund Share Transactions | ||||||||
Proceeds from sale of shares | 3,136,854 | 1,875,121 | ||||||
Proceeds from shares issued to shareholders due to reinvestment of | 112,749 | 124,234 | ||||||
| 3,249,603 | 1,999,355 | |||||||
Cost of shares redeemed | (4,224,975 | ) | (3,296,958 | ) | ||||
Net increase (decrease) in net assets from Fund share transactions | (975,372 | ) | (1,297,603 | ) | ||||
Net increase (decrease) in net assets | 634,351 | (296,940 | ) | |||||
Net assets at the beginning of period | 8,341,246 | 8,638,186 | ||||||
Net assets at the end of period | $ | 8,975,597 | $ | 8,341,246 | ||||
Undistributed (Over-distribution of) net investment income at the end | $ | 82,430 | $ | 156,003 | ||||
See accompanying notes to financial statements.
| Nuveen Investments | 29 |
Statement of Changes in Net Assets (continued)
| Moderate Allocation | Conservative Allocation | |||||||||||||||
| Year Ended 6/30/11 | Year Ended 6/30/10 | Year Ended 6/30/11 | Year Ended 6/30/10 | |||||||||||||
Operations | ||||||||||||||||
Net investment income (loss) | $ | 1,080,418 | $ | 1,112,375 | $ | 1,180,306 | $ | 1,388,287 | ||||||||
Total net realized gain (loss) | 4,408,842 | (429,758 | ) | 2,986,107 | (527,879 | ) | ||||||||||
Total change in net unrealized appreciation (depreciation) | 3,356,734 | 4,329,077 | 2,218,467 | 4,704,920 | ||||||||||||
Net increase (decrease) in net assets from operations | 8,845,994 | 5,011,694 | 6,384,880 | 5,565,328 | ||||||||||||
Distributions to Shareholders | ||||||||||||||||
From net investment income: | ||||||||||||||||
Class A | (644,042 | ) | (672,528 | ) | (1,103,768 | ) | (1,297,304 | ) | ||||||||
Class B | (30,584 | ) | (55,689 | ) | (25,810 | ) | (41,526 | ) | ||||||||
Class C | (132,270 | ) | (112,259 | ) | (215,809 | ) | (221,070 | ) | ||||||||
Class R3 | (9,499 | ) | (3,573 | ) | (1,352 | ) | (4,893 | ) | ||||||||
Class I | (335,495 | ) | (307,372 | ) | (54,557 | ) | (19,969 | ) | ||||||||
Decrease in net assets from distributions to shareholders | (1,151,890 | ) | (1,151,421 | ) | (1,401,296 | ) | (1,584,762 | ) | ||||||||
Fund Share Transactions | ||||||||||||||||
Proceeds from sale of shares | 20,662,801 | 15,999,993 | 11,902,802 | 5,011,319 | ||||||||||||
Proceeds from shares issued to shareholders due to reinvestment of distributions | 773,093 | 821,617 | 1,000,328 | 1,184,288 | ||||||||||||
| 21,435,894 | 16,821,610 | 12,903,130 | 6,195,607 | |||||||||||||
Cost of shares redeemed | (19,092,544 | ) | (10,629,089 | ) | (11,435,937 | ) | (8,982,212 | ) | ||||||||
Net increase (decrease) in net assets from Fund share transactions | 2,343,350 | 6,192,521 | 1,467,193 | (2,786,605 | ) | |||||||||||
Net increase (decrease) in net assets | 10,037,454 | 10,052,794 | 6,450,777 | 1,193,961 | ||||||||||||
Net assets at the beginning of period | 45,390,199 | 35,337,405 | 45,425,476 | 44,231,515 | ||||||||||||
Net assets at the end of period | $ | 55,427,653 | $ | 45,390,199 | $ | 51,876,253 | $ | 45,425,476 | ||||||||
Undistributed (Over-distribution of) net investment income at the end of period | $ | 944,484 | $ | 628,884 | $ | 1,142,487 | $ | 1,382,075 | ||||||||
See accompanying notes to financial statements.
| 30 | Nuveen Investments |
Financial Highlights
| Nuveen Investments | 31 |
| Selected data for a share outstanding throughout each period: | ||||||||||||||||||||||||||||||||||||
| Class (Commencement Date) | ||||||||||||||||||||||||||||||||||||
| Investment Operations | Less Distributions | |||||||||||||||||||||||||||||||||||
| GROWTH ALLOCATION | ||||||||||||||||||||||||||||||||||||
| Year Ended June 30, | Beginning Net Asset Value | Net (Loss)(a) | Net (Loss) | Total | Net Invest- ment Income | Capital Gains(b) | Total | Ending Net Asset Value | Total Return(c) | |||||||||||||||||||||||||||
Class A (12/04) |
| |||||||||||||||||||||||||||||||||||
2011 | $ | 19.66 | $ | .29 | $ | 4.31 | $ | 4.60 | $ | (.57 | ) | $ | — | $ | (.57 | ) | $ | 23.69 | 23.45 | % | ||||||||||||||||
2010 | 17.69 | .40 | 2.02 | 2.42 | (.45 | ) | — | (.45 | ) | 19.66 | 13.56 | |||||||||||||||||||||||||
2009 | 23.58 | .49 | (5.18 | ) | (4.69 | ) | (.06 | ) | (1.14 | ) | (1.20 | ) | 17.69 | (19.00 | ) | |||||||||||||||||||||
2008 | 27.79 | .08 | (2.73 | ) | (2.65 | ) | (.22 | ) | (1.34 | ) | (1.56 | ) | 23.58 | (9.84 | ) | |||||||||||||||||||||
2007 | 23.95 | .17 | 4.48 | 4.65 | (.18 | ) | (.63 | ) | (.81 | ) | 27.79 | 19.67 | ||||||||||||||||||||||||
Class B (12/04) |
| |||||||||||||||||||||||||||||||||||
2011 | 19.34 | .14 | 4.21 | 4.35 | (.40 | ) | — | (.40 | ) | 23.29 | 22.54 | |||||||||||||||||||||||||
2010 | 17.42 | .25 | 1.98 | 2.23 | (.31 | ) | — | (.31 | ) | 19.34 | 12.72 | |||||||||||||||||||||||||
2009 | 23.34 | .41 | (5.19 | ) | (4.78 | ) | — | (1.14 | ) | (1.14 | ) | 17.42 | (19.61 | ) | ||||||||||||||||||||||
2008 | 27.51 | (.11 | ) | (2.70 | ) | (2.81 | ) | (.02 | ) | (1.34 | ) | (1.36 | ) | 23.34 | (10.49 | ) | ||||||||||||||||||||
2007 | 23.74 | (.02 | ) | 4.42 | 4.40 | — | (.63 | ) | (.63 | ) | 27.51 | 18.73 | ||||||||||||||||||||||||
Class C (12/04) |
| |||||||||||||||||||||||||||||||||||
2011 | 19.35 | .13 | 4.24 | 4.37 | (.40 | ) | — | (.40 | ) | 23.32 | 22.58 | |||||||||||||||||||||||||
2010 | 17.44 | .25 | 1.97 | 2.22 | (.31 | ) | — | (.31 | ) | 19.35 | 12.65 | |||||||||||||||||||||||||
2009 | 23.35 | .41 | (5.18 | ) | (4.77 | ) | — | (1.14 | ) | (1.14 | ) | 17.44 | (19.56 | ) | ||||||||||||||||||||||
2008 | 27.53 | (.11 | ) | (2.71 | ) | (2.82 | ) | (.02 | ) | (1.34 | ) | (1.36 | ) | 23.35 | (10.52 | ) | ||||||||||||||||||||
2007 | 23.75 | (.02 | ) | 4.43 | 4.41 | — | (.63 | ) | (.63 | ) | 27.53 | 18.76 | ||||||||||||||||||||||||
Class R3 (8/08) |
| |||||||||||||||||||||||||||||||||||
2011 | 19.73 | .19 | 4.37 | 4.56 | (.52 | ) | — | (.52 | ) | 23.77 | 23.15 | |||||||||||||||||||||||||
2010 | 17.76 | .36 | 2.02 | 2.38 | (.41 | ) | — | (.41 | ) | 19.73 | 13.27 | |||||||||||||||||||||||||
2009(g) | 22.66 | .53 | (4.29 | ) | (3.76 | ) | — | ** | (1.14 | ) | (1.14 | ) | 17.76 | (15.68 | ) | |||||||||||||||||||||
Class I (12/04)(f) |
| |||||||||||||||||||||||||||||||||||
2011 | 19.69 | .29 | 4.39 | 4.68 | (.62 | ) | — | (.62 | ) | 23.75 | 23.85 | |||||||||||||||||||||||||
2010 | 17.72 | .48 | 1.99 | 2.47 | (.50 | ) | — | (.50 | ) | 19.69 | 13.78 | |||||||||||||||||||||||||
2009 | 23.63 | .61 | (5.27 | ) | (4.66 | ) | (.11 | ) | (1.14 | ) | (1.25 | ) | 17.72 | (18.77 | ) | |||||||||||||||||||||
2008 | 27.85 | .16 | (2.75 | ) | (2.59 | ) | (.29 | ) | (1.34 | ) | (1.63 | ) | 23.63 | (9.62 | ) | |||||||||||||||||||||
2007 | 24.00 | .24 | 4.48 | 4.72 | (.24 | ) | (.63 | ) | (.87 | ) | 27.85 | 19.95 | ||||||||||||||||||||||||
| 32 | Nuveen Investments |
| Ratios/Supplemental Data | ||||||||||||||||||||||
| Ratios to Average Net Assets Before Reimbursement | Ratios to Average Net Assets After Reimbursement(d) | |||||||||||||||||||||
| Ending Net Assets (000) | Expenses(e) | Net Invest- ment Income (Loss) | Expenses(e) | Net Invest- ment Income (Loss) | Portfolio Turnover Rate | |||||||||||||||||
| $ | 2,790 | 2.30 | % | (.41 | )% | .65 | % | 1.24 | % | 90 | % | |||||||||||
| 1,478 | 1.58 | 1.04 | .65 | 1.97 | 20 | |||||||||||||||||
| 1,922 | 2.52 | 1.01 | .79 | 2.74 | 173 | |||||||||||||||||
| 3,420 | 2.04 | (.07 | ) | 1.69 | .28 | 34 | ||||||||||||||||
| 6,888 | 1.82 | .52 | 1.68 | .66 | 31 | |||||||||||||||||
| 453 | 2.93 | (.92 | ) | 1.40 | .61 | 90 | ||||||||||||||||
| 411 | 2.34 | .32 | 1.40 | 1.26 | 20 | |||||||||||||||||
| 434 | 3.35 | .52 | 1.52 | 2.34 | 173 | |||||||||||||||||
| 647 | 2.79 | (.79 | ) | 2.44 | (.44 | ) | 34 | |||||||||||||||
| 752 | 2.54 | (.19 | ) | 2.44 | (.09 | ) | 31 | |||||||||||||||
| 3,564 | 2.95 | (.95 | ) | 1.40 | .60 | 90 | ||||||||||||||||
| 3,095 | 2.34 | .33 | 1.40 | 1.27 | 20 | |||||||||||||||||
| 3,364 | 3.30 | .53 | 1.53 | 2.30 | 173 | |||||||||||||||||
| 6,035 | 2.80 | (.81 | ) | 2.45 | (.46 | ) | 34 | |||||||||||||||
| 8,771 | 2.53 | (.17 | ) | 2.44 | (.07 | ) | 31 | |||||||||||||||
| 56 | 2.21 | (.47 | ) | .90 | .84 | 90 | ||||||||||||||||
| 133 | 1.85 | .84 | .90 | 1.78 | 20 | |||||||||||||||||
| 118 | 3.01 | * | 1.29 | * | .90 | * | 3.39 | * | 173 | |||||||||||||
| 2,113 | 1.76 | (.05 | ) | .40 | 1.31 | 90 | ||||||||||||||||
| 3,224 | 1.35 | 1.43 | .40 | 2.38 | 20 | |||||||||||||||||
| 2,800 | 2.36 | 1.55 | .52 | 3.39 | 173 | |||||||||||||||||
| 4,396 | 1.76 | .25 | 1.41 | .60 | 34 | |||||||||||||||||
| 4,868 | 1.58 | .78 | 1.43 | .93 | 31 | |||||||||||||||||
| (a) | Per share Net Investment Income (Loss) is calculated using the average daily shares method. |
| (b) | Distributions from Capital Gains include short-term capital gains, if any. |
| (c) | •Total return is the combination of changes in net asset value without any sales charge, reinvested dividend income at net asset value and |
| reinvested capital gains distributions at net asset value, if any. Total returns are not annualized. |
| •Total returns for the year ended June 30, 2008, and prior reflect the performance of the Nuveen Global Value Fund. Total returns for the year |
| ended June 30, 2009, include performance of the Nuveen Global Value Fund for the period July 1, 2008 through July 31, 2008. Returns prior to August 1, 2008, are not indicative of the performance that the Fund would have generated as currently managed. |
| (d) | After expense reimbursement from the Adviser, where applicable. Ratios do not reflect the effect of custodian fee credits earned on the Fund’s net cash on deposit with the custodian bank, where applicable. |
| (e) | The expense ratios subsequent to the year ended June 30, 2008, do not reflect the expenses of the Underlying Funds in which the Fund invests. |
| (f) | Effective May 1, 2008, Class R Shares were renamed Class I Shares. |
| (g) | For the period August 4, 2008 (commencement of operations) through June 30, 2009. |
| * | Annualized. |
| ** | Rounds to less than $.01 per share. |
See accompanying notes to financial statements.
| Nuveen Investments | 33 |
Financial Highlights (continued)
| Selected data for a share outstanding throughout each period: | ||||||||||||||||||||||||||||||||||||
| Class (Commencement Date) | ||||||||||||||||||||||||||||||||||||
| Investment Operations | Less Distributions | |||||||||||||||||||||||||||||||||||
| MODERATE ALLOCATION | ||||||||||||||||||||||||||||||||||||
| Year Ended June 30, | Beginning Net Asset Value | Net Invest- ment Income (Loss)(a) | Net Realized/ Unrealized Gain (Loss) | Total | Net Invest- ment Income | Capital Gains(b) | Total | Ending Net Asset Value | Total Return(c) | |||||||||||||||||||||||||||
Class A (8/96) |
| |||||||||||||||||||||||||||||||||||
2011 | $ | 21.08 | $ | .48 | $ | 3.47 | $ | 3.95 | $ | (.51 | ) | $ | — | $ | (.51 | ) | $ | 24.52 | 18.77 | % | ||||||||||||||||
2010 | 18.90 | .56 | 2.20 | 2.76 | (.58 | ) | — | (.58 | ) | 21.08 | 14.49 | |||||||||||||||||||||||||
2009 | 22.35 | .67 | (3.32 | ) | (2.65 | ) | (.34 | ) | (.46 | ) | (.80 | ) | 18.90 | (11.28 | ) | |||||||||||||||||||||
2008 | 26.73 | .54 | (2.04 | ) | (1.50 | ) | (.56 | ) | (2.32 | ) | (2.88 | ) | 22.35 | (6.31 | ) | |||||||||||||||||||||
2007 | 25.40 | .58 | 2.97 | 3.55 | (.61 | ) | (1.61 | ) | (2.22 | ) | 26.73 | 14.40 | ||||||||||||||||||||||||
Class B (8/96) |
| |||||||||||||||||||||||||||||||||||
2011 | 21.07 | .31 | 3.45 | 3.76 | (.34 | ) | — | (.34 | ) | 24.49 | 17.82 | |||||||||||||||||||||||||
2010 | 18.91 | .39 | 2.20 | 2.59 | (.43 | ) | — | (.43 | ) | 21.07 | 13.64 | |||||||||||||||||||||||||
2009 | 22.35 | .52 | (3.30 | ) | (2.78 | ) | (.20 | ) | (.46 | ) | (.66 | ) | 18.91 | (11.98 | ) | |||||||||||||||||||||
2008 | 26.73 | .35 | (2.04 | ) | (1.69 | ) | (.37 | ) | (2.32 | ) | (2.69 | ) | 22.35 | (7.02 | ) | |||||||||||||||||||||
2007 | 25.40 | .37 | 2.98 | 3.35 | (.41 | ) | (1.61 | ) | (2.02 | ) | 26.73 | 13.55 | ||||||||||||||||||||||||
Class C (8/96) |
| |||||||||||||||||||||||||||||||||||
2011 | 21.10 | .29 | 3.45 | 3.74 | (.34 | ) | — | (.34 | ) | 24.50 | 17.75 | |||||||||||||||||||||||||
2010 | 18.94 | .40 | 2.19 | 2.59 | (.43 | ) | — | (.43 | ) | 21.10 | 13.62 | |||||||||||||||||||||||||
2009 | 22.37 | .53 | (3.30 | ) | (2.77 | ) | (.20 | ) | (.46 | ) | (.66 | ) | 18.94 | (11.93 | ) | |||||||||||||||||||||
2008 | 26.75 | .35 | (2.04 | ) | (1.69 | ) | (.37 | ) | (2.32 | ) | (2.69 | ) | 22.37 | (7.01 | ) | |||||||||||||||||||||
2007 | 25.42 | .38 | 2.97 | 3.35 | (.41 | ) | (1.61 | ) | (2.02 | ) | 26.75 | 13.54 | ||||||||||||||||||||||||
Class R3 (8/08) |
| |||||||||||||||||||||||||||||||||||
2011 | 21.08 | .45 | 3.38 | 3.83 | (.45 | ) | — | (.45 | ) | 24.46 | 18.17 | |||||||||||||||||||||||||
2010 | 18.91 | .51 | 2.19 | 2.70 | (.53 | ) | — | (.53 | ) | 21.08 | 14.19 | |||||||||||||||||||||||||
2009(g) | 22.20 | .59 | (3.12 | ) | (2.53 | ) | (.30 | ) | (.46 | ) | (.76 | ) | 18.91 | (10.87 | ) | |||||||||||||||||||||
Class I (8/96)(f) |
| |||||||||||||||||||||||||||||||||||
2011 | 21.08 | .56 | 3.43 | 3.99 | (.56 | ) | — | (.56 | ) | 24.51 | 19.00 | |||||||||||||||||||||||||
2010 | 18.89 | .63 | 2.18 | 2.81 | (.62 | ) | — | (.62 | ) | 21.08 | 14.80 | |||||||||||||||||||||||||
2009 | 22.35 | .71 | (3.32 | ) | (2.61 | ) | (.39 | ) | (.46 | ) | (.85 | ) | 18.89 | (11.08 | ) | |||||||||||||||||||||
2008 | 26.73 | .60 | (2.04 | ) | (1.44 | ) | (.62 | ) | (2.32 | ) | (2.94 | ) | 22.35 | (6.07 | ) | |||||||||||||||||||||
2007 | 25.40 | .64 | 2.98 | 3.62 | (.68 | ) | (1.61 | ) | (2.29 | ) | 26.73 | 14.68 | ||||||||||||||||||||||||
| 34 | Nuveen Investments |
| Ratios/Supplemental Data | ||||||||||||||||||||||
| Ratios to Average Net Assets Before Reimbursement | Ratios to Average Net Assets After Reimbursement(d) | |||||||||||||||||||||
| Ending Net Assets (000) | Expenses(e) | Net Invest- ment Income (Loss) | Expenses(e) | Net Invest- ment Income (Loss) | Portfolio Turnover Rate | |||||||||||||||||
| $ | 32,234 | .82 | % | 1.74 | % | .54 | % | 2.01 | % | 95 | % | |||||||||||
| 25,190 | .83 | 2.32 | .54 | 2.61 | 13 | |||||||||||||||||
| 21,136 | 1.29 | 2.97 | .62 | 3.64 | 171 | |||||||||||||||||
| 29,612 | 1.32 | 2.04 | 1.23 | 2.12 | 51 | |||||||||||||||||
| 33,519 | 1.26 | 2.17 | 1.24 | 2.19 | 61 | |||||||||||||||||
| 1,704 | 1.56 | 1.04 | 1.29 | 1.32 | 95 | |||||||||||||||||
| 2,421 | 1.58 | 1.53 | 1.29 | 1.82 | 13 | |||||||||||||||||
| 3,054 | 2.02 | 2.18 | 1.38 | 2.81 | 171 | |||||||||||||||||
| 5,535 | 2.07 | 1.29 | 1.98 | 1.38 | 51 | |||||||||||||||||
| 6,376 | 2.02 | 1.40 | 1.99 | 1.42 | 61 | |||||||||||||||||
| 11,618 | 1.57 | .94 | 1.29 | 1.22 | 95 | |||||||||||||||||
| 6,354 | 1.58 | 1.58 | 1.29 | 1.87 | 13 | |||||||||||||||||
| 4,685 | 2.03 | 2.19 | 1.37 | 2.85 | 171 | |||||||||||||||||
| 7,265 | 2.07 | 1.29 | 1.98 | 1.38 | 51 | |||||||||||||||||
| 7,694 | 2.01 | 1.42 | 1.99 | 1.44 | 61 | |||||||||||||||||
| 538 | 1.06 | 1.58 | .79 | 1.85 | 95 | |||||||||||||||||
| 142 | 1.08 | 2.07 | .79 | 2.36 | 13 | |||||||||||||||||
| 128 | 1.57 | * | 2.84 | * | .79 | * | 3.62 | * | 171 | |||||||||||||
| 9,333 | .56 | 2.07 | .29 | 2.34 | 95 | |||||||||||||||||
| 11,283 | .58 | 2.64 | .29 | 2.93 | 13 | |||||||||||||||||
| 6,334 | 1.02 | 3.19 | .36 | 3.84 | 171 | |||||||||||||||||
| 9,662 | 1.07 | 2.29 | .98 | 2.38 | 51 | |||||||||||||||||
| 10,690 | 1.01 | 2.42 | .99 | 2.44 | 61 | |||||||||||||||||
| (a) | Per share Net Investment Income (Loss) is calculated using the average daily shares method. |
| (b) | Distributions from Capital Gains include short-term capital gains, if any. |
| (c) | •Total return is the combination of changes in net asset value without any sales charge, reinvested dividend income at net asset value and |
| reinvested capital gains distributions at net asset value, if any. Total returns are not annualized. |
| •Total returns for the year ended June 30, 2008, and prior reflect the performance of the Nuveen Balanced Stock and Bond Fund. Total returns for |
| the year ended June 30, 2009, include performance of the Nuveen Balanced Stock and Bond Fund for the period July 1, 2008 through July 31, 2008. Returns prior to August 1, 2008, are not indicative of the performance that the Fund would have generated as currently managed. |
| (d) | After expense reimbursement from the Adviser, where applicable. Ratios do not reflect the effect of custodian fee credits earned on the Fund’s net cash on deposit with the custodian bank, where applicable. |
| (e) | The expense ratios subsequent to the year ended June 30, 2008, do not reflect the expenses of the Underlying Funds in which the Fund invests. |
| (f) | Effective May 1, 2008, Class R Shares were renamed Class I Shares. |
| (g) | For the period August 4, 2008 (commencement of operations) through June 30, 2009. |
| * | Annualized. |
See accompanying notes to financial statements.
| Nuveen Investments | 35 |
Financial Highlights (continued)
| Selected data for a share outstanding throughout each period: | ||||||||||||||||||||||||||||||||||||
| Class (Commencement Date) | ||||||||||||||||||||||||||||||||||||
| Investment Operations | Less Distributions | |||||||||||||||||||||||||||||||||||
| CONSERVATIVE ALLOCATION | ||||||||||||||||||||||||||||||||||||
| Year Ended June 30, | Beginning Net Asset Value | Net Invest- ment Income (Loss)(a) | Net Realized/ Unrealized Gain (Loss) | Total | Net Invest- ment Income | Capital Gains(b) | Total | Ending Net Asset Value | Total Return(c) | |||||||||||||||||||||||||||
Class A (8/96) |
| �� | ||||||||||||||||||||||||||||||||||
2011 | $ | 22.07 | $ | .60 | $ | 2.54 | $ | 3.14 | $ | (.71 | ) | $ | — | $ | (.71 | ) | $ | 24.50 | 14.29 | % | ||||||||||||||||
2010 | 20.24 | .69 | 1.93 | 2.62 | (.79 | ) | — | (.79 | ) | 22.07 | 12.93 | |||||||||||||||||||||||||
2009 | 22.84 | .85 | (2.60 | ) | (1.75 | ) | (.37 | ) | (.48 | ) | (.85 | ) | 20.24 | (7.25 | ) | |||||||||||||||||||||
2008 | 25.76 | .64 | (2.17 | ) | (1.53 | ) | (.67 | ) | (.72 | ) | (1.39 | ) | 22.84 | (6.23 | ) | |||||||||||||||||||||
2007 | 23.86 | .67 | 1.91 | 2.58 | (.68 | ) | — | (.68 | ) | 25.76 | 10.90 | |||||||||||||||||||||||||
Class B (8/96) |
| |||||||||||||||||||||||||||||||||||
2011 | 23.67 | .44 | 2.72 | 3.16 | (.57 | ) | — | (.57 | ) | 26.26 | 13.37 | |||||||||||||||||||||||||
2010 | 21.72 | .55 | 2.09 | 2.64 | (.69 | ) | — | (.69 | ) | 23.67 | 12.11 | |||||||||||||||||||||||||
2009 | 24.43 | .77 | (2.80 | ) | (2.03 | ) | (.20 | ) | (.48 | ) | (.68 | ) | 21.72 | (7.97 | ) | |||||||||||||||||||||
2008 | 27.36 | .48 | (2.30 | ) | (1.82 | ) | (.39 | ) | (.72 | ) | (1.11 | ) | 24.43 | (6.90 | ) | |||||||||||||||||||||
2007 | 25.32 | .50 | 2.04 | 2.54 | (.50 | ) | — | (.50 | ) | 27.36 | 10.09 | |||||||||||||||||||||||||
Class C (8/96) |
| |||||||||||||||||||||||||||||||||||
2011 | 23.64 | .43 | 2.73 | 3.16 | (.57 | ) | — | (.57 | ) | 26.23 | 13.38 | |||||||||||||||||||||||||
2010 | 21.69 | .56 | 2.08 | 2.64 | (.69 | ) | — | (.69 | ) | 23.64 | 12.12 | |||||||||||||||||||||||||
2009 | 24.39 | .77 | (2.79 | ) | (2.02 | ) | (.20 | ) | (.48 | ) | (.68 | ) | 21.69 | (7.94 | ) | |||||||||||||||||||||
2008 | 27.32 | .49 | (2.31 | ) | (1.82 | ) | (.39 | ) | (.72 | ) | (1.11 | ) | 24.39 | (6.94 | ) | |||||||||||||||||||||
2007 | 25.29 | .51 | 2.02 | 2.53 | (.50 | ) | — | (.50 | ) | 27.32 | 10.10 | |||||||||||||||||||||||||
Class R3 (8/08) |
| |||||||||||||||||||||||||||||||||||
2011 | 21.49 | .48 | 2.50 | 2.98 | (.63 | ) | — | (.63 | ) | 23.84 | 13.94 | |||||||||||||||||||||||||
2010 | 19.71 | .62 | 1.88 | 2.50 | (.72 | ) | — | (.72 | ) | 21.49 | 12.67 | |||||||||||||||||||||||||
2009(g) | 22.16 | .70 | (2.40 | ) | (1.70 | ) | (.27 | ) | (.48 | ) | (.75 | ) | 19.71 | (7.27 | ) | |||||||||||||||||||||
Class I (8/96)(f) |
| |||||||||||||||||||||||||||||||||||
2011 | 21.48 | .62 | 2.48 | 3.10 | (.74 | ) | — | (.74 | ) | 23.84 | 14.49 | |||||||||||||||||||||||||
2010 | 19.69 | .72 | 1.89 | 2.61 | (.82 | ) | — | (.82 | ) | 21.48 | 13.24 | |||||||||||||||||||||||||
2009 | 22.24 | .88 | (2.53 | ) | (1.65 | ) | (.42 | ) | (.48 | ) | (.90 | ) | 19.69 | (6.98 | ) | |||||||||||||||||||||
2008 | 25.15 | .69 | (2.12 | ) | (1.43 | ) | (.76 | ) | (.72 | ) | (1.48 | ) | 22.24 | (5.99 | ) | |||||||||||||||||||||
2007 | 23.34 | .72 | 1.86 | 2.58 | (.77 | ) | — | (.77 | ) | 25.15 | 11.17 | |||||||||||||||||||||||||
| 36 | Nuveen Investments |
| Ratios/Supplemental Data | ||||||||||||||||||||||
| Ratios to Average Net Assets Before Reimbursement | Ratios to Average Net Assets After Reimbursement(d) | |||||||||||||||||||||
| Ending Net Assets (000) | Expenses(e) | Net Invest- ment Income (Loss) | Expenses(e) | Net Invest- ment Income (Loss) | Portfolio Turnover Rate | |||||||||||||||||
| $ | 37,420 | .78 | % | 2.34 | % | .62 | % | 2.50 | % | 89 | % | |||||||||||
| 34,943 | .77 | 2.94 | .62 | 3.09 | 14 | |||||||||||||||||
| 35,247 | 1.04 | 3.88 | .63 | 4.28 | 166 | |||||||||||||||||
| 52,785 | 1.28 | 2.53 | 1.23 | 2.58 | 37 | |||||||||||||||||
| 61,577 | 1.22 | 2.64 | 1.22 | 2.64 | 37 | |||||||||||||||||
| 1,063 | 1.53 | 1.55 | 1.37 | 1.71 | 89 | |||||||||||||||||
| 1,031 | 1.53 | 2.16 | 1.37 | 2.32 | 14 | |||||||||||||||||
| 1,730 | 1.77 | 3.22 | 1.38 | 3.60 | 166 | |||||||||||||||||
| 3,480 | 2.03 | 1.76 | 1.98 | 1.81 | 37 | |||||||||||||||||
| 5,916 | 1.98 | 1.87 | 1.98 | 1.87 | 37 | |||||||||||||||||
| 11,589 | 1.53 | 1.51 | 1.37 | 1.68 | 89 | |||||||||||||||||
| 8,034 | 1.52 | 2.22 | 1.37 | 2.37 | 14 | |||||||||||||||||
| 6,649 | 1.81 | 3.21 | 1.38 | 3.63 | 166 | |||||||||||||||||
| 8,192 | 2.03 | 1.78 | 1.98 | 1.83 | 37 | |||||||||||||||||
| 9,363 | 1.97 | 1.90 | 1.97 | 1.90 | 37 | |||||||||||||||||
| 51 | 1.02 | 1.91 | .87 | 2.06 | 89 | |||||||||||||||||
| 145 | 1.02 | 2.71 | .87 | 2.86 | 14 | |||||||||||||||||
| 133 | 1.35 | * | 3.59 | * | .87 | * | 4.08 | * | 166 | |||||||||||||
| 1,753 | .53 | 2.49 | .37 | 2.65 | 89 | |||||||||||||||||
| 1,272 | .50 | 3.20 | .37 | 3.32 | 14 | |||||||||||||||||
| 472 | .76 | 4.09 | .39 | 4.46 | 166 | |||||||||||||||||
| 1,361 | 1.03 | 2.78 | .98 | 2.83 | 37 | |||||||||||||||||
| 1,525 | .97 | 2.90 | .97 | 2.90 | 37 | |||||||||||||||||
| (a) | Per share Net Investment Income (Loss) is calculated using the average daily shares method. |
| (b) | Distributions from Capital Gains include short-term capital gains, if any. |
| (c) | •Total return is the combination of changes in net asset value without any sales charge, reinvested dividend income at net asset value and |
| reinvested capital gains distributions at net asset value, if any. Total returns are not annualized. |
| •Total returns for the year ended June 30, 2008, and prior reflect the performance of the Nuveen Balanced Municipal and Stock Fund. Total returns |
| for the year ended June 30, 2009, include performance of the Nuveen Balanced Municipal and Stock Fund for the period July 1, 2008 through July 6, 2008. Returns prior to July 7, 2008, are not indicative of the performance that the Fund would have generated as currently managed. |
| (d) | After expense reimbursement from the Adviser, where applicable. Ratios do not reflect the effect of custodian fee credits earned on the Fund’s net cash on deposit with the custodian bank, where applicable. |
| (e) | The expense ratios subsequent to the year ended June 30, 2008, do not reflect the expenses of the Underlying Funds in which the Fund invests. |
| (f) | Effective May 1, 2008, Class R Shares were renamed Class I Shares. |
| (g) | For the period August 4, 2008 (commencement of operations) through June 30, 2009. |
| * | Annualized. |
See accompanying notes to financial statements.
| Nuveen Investments | 37 |
1. General Information and Significant Accounting Policies
General Information
The Nuveen Investment Trust (the “Trust”) is an open-end investment company registered under the Investment Company Act of 1940, as amended. The Trust is comprised of Nuveen Growth Allocation Fund (“Growth Allocation”), Nuveen Moderate Allocation Fund (“Moderate Allocation”) and Nuveen Conservative Allocation Fund (“Conservative Allocation”) (each a “Fund” and collectively, the “Funds”), among others. The Trust was organized as a Massachusetts business trust in 1996.
Effective January 1, 2011, the Funds’ adviser, Nuveen Asset Management, a wholly-owned subsidiary of Nuveen Investments, Inc. (“Nuveen”), changed its name to Nuveen Fund Advisors, Inc. (the “Adviser”).
Effective April 30, 2011, Nuveen Investments, LLC, a wholly-owned subsidiary of Nuveen, changed its name to Nuveen Securities, LLC (the “Distributor”).
Each Fund is a “fund of funds” that primarily invests in shares of other registered investment companies, including open-end mutual funds and exchange-traded funds (collectively, the “Underlying Funds”). Each Fund’s assets are allocated among broad asset classes through investment in a combination of the Underlying Funds. The Underlying Funds, in turn, invest in a variety of U.S. and non-U.S. equity and fixed income securities. Each Fund has a strategic allocation between equity and fixed income investments that correlates with its risk profile. The Adviser, has selected Nuveen Investment Solutions, Inc. (“NIS”) (formerly, Richards & Tierney, Inc.), also a wholly-owned subsidiary of Nuveen, to serve as sub-adviser to the Funds. NIS adjusts portfolio allocations from time to time consistent with each Fund’s risk profile in its effort to produce performance consistent with its investment objective. Each Fund primarily invests in Underlying Funds within the Nuveen family of funds.
Growth Allocation’s investment objective is to provide attractive long-term total return with a growth risk profile.
Moderate Allocation’s investment objective is to provide attractive long-term total return with a moderate risk profile.
Conservative Allocation’s investment objective is to provide attractive long-term total return with a conservative risk profile.
The Funds’ most recent prospectus provides further description of each Fund’s investment objective, principal investment strategies, and principal risks.
Beginning September 7, 2011, Growth Allocation will stop accepting purchases from new investors and existing shareholders, except that defined contribution retirement plans that hold Fund shares as of September 7, 2011 may continue to purchase Fund shares until October 3, 2011. Existing shareholders may continue to reinvest dividends and capital gains distributions received from the Fund. The Fund reserves the right to modify the extent to which sales of shares are limited prior to the Fund’s liquidation. After the close of business on October 7, 2011, the Fund will liquidate any remaining shareholder accounts and will send shareholders the proceeds of the liquidation.
The Board of Trustees and Nuveen Strategy Funds, Inc. (the “Company”) has approved the reorganization of (a) Conservative Allocation into Nuveen Strategy Conservative Allocation Fund, a series of the Company, and (b) Moderate Allocation into Nuveen Strategy Balanced Allocation Fund, a series of the Company. Each of Conservative Allocation and Moderate Allocation is referred to as an “Acquired Fund” and each of Nuveen Strategy Conservative Allocation Fund and Nuveen Strategy Balanced Allocation Fund is referred to as an “Acquiring Fund.” Each reorganization is subject to approval by the shareholders of the Acquired Fund in that reorganization.
For each reorganization, if the Acquired Fund’s shareholders approve the reorganization, the Acquired Fund will transfer all of its assets and liabilities to the Acquiring Fund in exchange for Acquiring Fund shares of equal value. These Acquiring Fund shares will then be distributed to Acquired Fund shareholders and the Acquired Fund will be terminated. As a result of these transactions, Acquired Fund shareholders will become shareholders of the Acquiring Fund and will cease to be shareholders of the Acquired Fund. Each Acquired Fund shareholder will receive Acquiring Fund shares with a total value equal to the total value of that shareholder’s Acquired Fund shares immediately prior to the closing of the reorganization.
For each reorganization, a special meeting of the Acquired Fund’s shareholders for the purpose of voting on the reorganization is expected to be held in late November or early December 2011. If the required approval is obtained, it is anticipated that the reorganization will be consummated shortly after the special shareholder meeting. Further information regarding the proposed reorganizations will be contained in proxy materials that are expected to be sent to shareholders of each Acquired Fund in October 2011.
Each Acquired Fund will continue sales and redemptions of its shares as described in the prospectus until shortly before its reorganization. However, holders of shares purchased after the record date set for an Acquired Fund’s special meeting of shareholders will not be entitled to vote those shares at the special meeting.
Significant Accounting Policies
The following is a summary of significant accounting policies followed by the Funds in the preparation of their financial statements in accordance with accounting principles generally accepted in the United States (“U.S. GAAP”).
| 38 | Nuveen Investments |
Investment Valuation
The affiliated Underlying Funds in which the Funds invest are valued at their respective net asset values and securities and other assets for which market quotations are available, including non-affiliated Exchange Traded Funds (“ETFs”) in which the Funds invest, are valued at the last sales price on the securities exchange on which such securities are primarily traded and are generally classified as Level 1 for fair value measurement purposes.
Repurchase agreements are valued at contract amount plus accrued interest, which approximates market value. These securities are generally classified as Level 2.
Certain securities may not be able to be priced by the pre-established pricing methods as described above. Such securities may be valued by the Funds’ Board of Trustees or its designee at fair value. These securities generally include, but are not limited to, restricted securities (securities which may not be publicly sold without registration under the Securities Act of 1933, as amended) for which a pricing service is unable to provide a market price; securities whose trading has been formally suspended; debt securities that have gone into default and for which there is no current market quotation; a security whose market price is not available from a pre-established pricing source; a security with respect to which an event has occurred that is likely to materially affect the value of the security after the market has closed but before the calculation of a Fund’s net asset value (as may be the case in non-U.S. markets on which the security is primarily traded) or make it difficult or impossible to obtain a reliable market quotation; and a security whose price, as provided by the pricing service, is not deemed to reflect the security’s fair value. As a general principle, the fair value of a security would appear to be the amount that the owner might reasonably expect to receive for them in a current sale. A variety of factors may be considered in determining the fair value of such securities, which may include consideration of the following: yields or prices of investments of comparable quality, type of issue, coupon, maturity and rating, market quotes or indications of value from security dealers, evaluations of anticipated cash flows or collateral, general market conditions and other information and analysis, including the obligor’s credit characteristics considered relevant. These securities are classified as Level 2 or as Level 3 depending on the priority of the significant inputs. Regardless of the method employed to value a particular security, all valuations are subject to review by the Funds’ Board of Trustees or its designee.
Refer to Footnote 2 – Fair Value Measurements for further details on the leveling of securities held by the Funds as of the end of the reporting period.
Investment Transactions
Investment transactions are recorded on a trade date basis. Realized gains and losses from investment transactions are determined on the specific identification method, which is the same basis used for federal income tax purposes.
Investment Income
Dividend income and realized gain distributions from the Underlying Funds are recorded on the ex-dividend date, or for foreign securities, when information is available. Interest income is recorded on an accrual basis.
Income Taxes
Each Fund is a separate taxpayer for federal income tax purposes. Each Fund intends to distribute substantially all of its net investment income and net capital gains to shareholders and to otherwise comply with the requirements of Subchapter M of the Internal Revenue Code applicable to regulated investment companies. Therefore, no federal income tax provision is required.
For all open tax years and all major taxing jurisdictions, management of the Funds has concluded that there are no significant uncertain tax positions that would require recognition in the financial statements. Open tax years are those that are open for examination by taxing authorities (i.e., generally the last four tax year ends and the interim tax period since then). Furthermore, management of the Funds is also not aware of any tax positions for which it is reasonably possible that the total amounts of unrecognized tax benefits will significantly change in the next twelve months.
Dividends and Distributions to Shareholders
Dividends from net investment income and net realized capital gains from investment transactions, if any, are declared and distributed to shareholders at least annually. Furthermore, capital gains are distributed only to the extent they exceed available capital loss carryforwards.
Distributions to shareholders are recorded on the ex-dividend date. The amount and timing of distributions are determined in accordance with federal income tax regulations, which may differ from U.S. GAAP.
Flexible Sales Charge Program
Class A Shares are generally sold with an up-front sales charge and incur a .25% annual 12b-1 service fee. Class A Share purchases of $1 million or more are sold at net asset value without an up-front sales charge but may be subject to a contingent deferred sales charge (“CDSC”) if redeemed within twelve months of purchase. Class B Shares were sold without an up-front sales charge but incur a .75% annual 12b-1 distribution fee and a .25% annual 12b-1 service fee. Class B Shares are subject to a CDSC of up to 5% depending upon the length of time the shares are held by the investor (CDSC is reduced to 0% at the end of six years). Class B Shares convert to Class A Shares eight years after purchase. Class C Shares are sold without an up-front sales charge but incur a .75% annual 12b-1 distribution fee and a .25% annual 12b-1 service fee. Class C Shares are subject to a CDSC of 1% if redeemed within twelve months of purchase. Class R3 Shares are sold without an up-front sales charge but incur a .50% annual 12b-1 distribution and service fee. Class I Shares are not subject to any sales charge or 12b-1 distribution or service fees.
| Nuveen Investments | 39 |
Notes to Financial Statements (continued)
Repurchase Agreements
In connection with transactions in repurchase agreements, it is each Fund’s policy that its custodian take possession of the underlying collateral securities, the fair value of which exceeds the principal amount of the repurchase transaction, including accrued interest, at all times. If the counterparty defaults, and the fair value of the collateral declines, realization of the collateral may be delayed or limited.
Multiclass Operations and Allocations
Income and expenses of the Funds that are not directly attributable to a specific class of shares are prorated among the classes based on the relative net assets of each class. Expenses directly attributable to a class of shares, which presently only include 12b-1 distribution and service fees, are recorded to the specific class.
Realized and unrealized capital gains and losses of the Funds are prorated among the classes based on the relative net assets of each class.
Custodian Fee Credit
Each Fund has an arrangement with the custodian bank whereby certain custodian fees and expenses are reduced by net credits earned on each Fund’s cash on deposit with the bank. Such deposit arrangements are an alternative to overnight investments. Credits for cash balances may be offset by charges for any days on which a Fund overdraws its account at the custodian bank.
Indemnifications
Under the Trust’s organizational documents, its officers and trustees are indemnified against certain liabilities arising out of the performance of their duties to the Trust. In addition, in the normal course of business, the Trust enters into contracts that provide general indemnifications to other parties. The Trust’s maximum exposure under these arrangements is unknown as this would involve future claims that may be made against the Trust that have not yet occurred. However, the Trust has not had prior claims or losses pursuant to these contracts and expects the risk of loss to be remote.
Use of Estimates
The preparation of financial statements in conformity with U.S. GAAP requires management to make estimates and assumptions that affect the reported amounts of assets and liabilities at the date of the financial statements and the reported amounts of increases and decreases in net assets from operations during the reporting period. Actual results may differ from those estimates.
2. Fair Value Measurements
Fair value is defined as the price that the Funds would receive upon selling an investment or transferring a liability in an orderly transaction to an independent buyer in the principal or most advantageous market for the investment. A three-tier hierarchy is used to maximize the use of observable market data and minimize the use of unobservable inputs and to establish classification of fair value measurements for disclosure purposes. Observable inputs reflect the assumptions market participants would use in pricing the asset or liability. Observable inputs are based on market data obtained from sources independent of the reporting entity. Unobservable inputs reflect the reporting entity’s own assumptions about the assumptions market participants would use in pricing the asset or liability. Unobservable inputs are based on the best information available in the circumstances. The three-tier hierarchy of inputs is summarized in the three broad levels listed below:
| Level 1 – | Quoted prices in active markets for identical securities. | |
| Level 2 – | Other significant observable inputs (including quoted prices for similar securities, interest rates, prepayment speeds, credit risk, etc.). | |
| Level 3 – | Significant unobservable inputs (including management’s assumptions in determining the fair value of investments). |
The inputs or methodologies used for valuing securities are not an indication of the risk associated with investing in those securities.
The following is a summary of each Fund’s fair value measurements as of June 30, 2011:
| Growth Allocation | Level 1 | Level 2 | Level 3 | Total | ||||||||||||
Investments: | ||||||||||||||||
Commodity Funds | $ | 153,879 | $ | — | $ | — | $ | 153,879 | ||||||||
Equity Funds* | 5,710,663 | 895,344 | — | 6,606,007 | ||||||||||||
Fixed Income Funds | 2,127,295 | — | — | 2,127,295 | ||||||||||||
Total | $ | 7,991,837 | $ | 895,344 | $ | — | $ | 8,887,181 | ||||||||
| Moderate Allocation | Level 1 | Level 2 | Level 3 | Total | ||||||||||||
Investments: | ||||||||||||||||
Commodity Funds | $ | 1,148,412 | $ | — | $ | — | $ | 1,148,412 | ||||||||
Equity Funds* | 24,987,397 | 4,013,432 | — | 29,000,829 | ||||||||||||
Fixed Income Funds | 23,995,141 | — | — | 23,995,141 | ||||||||||||
Short-Term Investments | — | 602,935 | — | 602,935 | ||||||||||||
Total | $ | 50,130,950 | $ | 4,616,367 | $ | — | $ | 54,747,317 | ||||||||
| 40 | Nuveen Investments |
| Conservative Allocation | Level 1 | Level 2 | Level 3 | Total | ||||||||||||
Investments: | ||||||||||||||||
Commodity Funds | $ | 992,467 | $ | — | $ | — | $ | 992,467 | ||||||||
Equity Funds* | 14,207,388 | 2,228,459 | — | 16,435,847 | ||||||||||||
Fixed Income Funds | 33,810,981 | — | — | 33,810,981 | ||||||||||||
Short-Term Investments | — | 1,006,271 | — | 1,006,271 | ||||||||||||
Total | $ | 49,010,836 | $ | 3,234,730 | $ | — | $ | 52,245,566 | ||||||||
| * | Refer to the Fund’s Portfolio of Investments for industry breakdown of Equity Funds classified as Level 2. |
During the fiscal year ended June 30, 2011, the Funds recognized no significant transfers to or from Level 1, Level 2 or Level 3.
3. Fund Shares
Transactions in Fund shares were as follows:
| Growth Allocation | ||||||||||||||||
| Year Ended 6/30/11 | Year Ended 6/30/10 | |||||||||||||||
| Shares | Amount | Shares | Amount | |||||||||||||
Shares sold: | ||||||||||||||||
Class A | 59,128 | $ | 1,386,476 | 12,451 | $ | 254,499 | ||||||||||
Class A – automatic conversion of Class B Shares | 528 | 10,434 | 1,414 | 27,920 | ||||||||||||
Class B | 1,509 | 34,999 | 499 | 10,072 | ||||||||||||
Class C | 31,076 | 700,231 | 13,567 | 273,199 | ||||||||||||
Class R3 | 1,136 | 26,702 | 119 | 2,510 | ||||||||||||
Class I | 41,485 | 978,012 | 63,274 | 1,306,921 | ||||||||||||
Shares issued to shareholders due to reinvestment of distributions: | ||||||||||||||||
Class A | 1,441 | 33,484 | 1,616 | 33,497 | ||||||||||||
Class B | 258 | 5,916 | 286 | 5,851 | ||||||||||||
Class C | 1,674 | 38,416 | 1,954 | 40,044 | ||||||||||||
Class R3 | — | — | — | — | ||||||||||||
Class I | 1,501 | 34,933 | 2,161 | 44,842 | ||||||||||||
| 139,736 | 3,249,603 | 97,341 | 1,999,355 | |||||||||||||
Shares redeemed: | ||||||||||||||||
Class A | (18,523 | ) | (423,906 | ) | (48,956 | ) | (992,985 | ) | ||||||||
Class B | (3,056 | ) | (68,400 | ) | (3,013 | ) | (60,608 | ) | ||||||||
Class B – automatic conversion to Class A Shares | (537 | ) | (10,434 | ) | (1,437 | ) | (27,920 | ) | ||||||||
Class C | (39,791 | ) | (892,467 | ) | (48,532 | ) | (990,208 | ) | ||||||||
Class R3 | (5,537 | ) | (128,364 | ) | — | — | ||||||||||
Class I | (117,763 | ) | (2,701,404 | ) | (59,727 | ) | (1,225,237 | ) | ||||||||
| (185,207 | ) | (4,224,975 | ) | (161,665 | ) | (3,296,958 | ) | |||||||||
Net increase (decrease) | (45,471 | ) | $ | (975,372 | ) | (64,324 | ) | $ | (1,297,603 | ) | ||||||
| Nuveen Investments | 41 |
Notes to Financial Statements (continued)
| Moderate Allocation | ||||||||||||||||
| Year Ended 6/30/11 | Year Ended 6/30/10 | |||||||||||||||
| Shares | Amount | Shares | Amount | |||||||||||||
Shares sold: | ||||||||||||||||
Class A | 405,747 | $ | 9,750,433 | 320,824 | $ | 6,838,312 | ||||||||||
Class A – automatic conversion of Class B Shares | 18,023 | 435,503 | 16,654 | 349,383 | ||||||||||||
Class B | 3,194 | 76,653 | 5,172 | 111,052 | ||||||||||||
Class C | 253,153 | 6,023,931 | 102,608 | 2,234,838 | ||||||||||||
Class R3 | 20,005 | 476,687 | — | — | ||||||||||||
Class I | 164,414 | 3,899,594 | 294,986 | 6,466,408 | ||||||||||||
Shares issued to shareholders due to reinvestment of distributions: | ||||||||||||||||
Class A | 21,456 | 515,151 | 24,846 | 539,393 | ||||||||||||
Class B | 951 | 22,900 | 1,900 | 41,374 | ||||||||||||
Class C | 2,445 | 58,884 | 2,149 | 46,866 | ||||||||||||
Class R3 | 2 | 53 | — | — | ||||||||||||
Class I | 7,346 | 176,105 | 8,948 | 193,984 | ||||||||||||
| 896,736 | 21,435,894 | 778,087 | 16,821,610 | |||||||||||||
Shares redeemed: | ||||||||||||||||
Class A | (325,759 | ) | (7,880,813 | ) | (285,652 | ) | (6,155,361 | ) | ||||||||
Class B | (31,431 | ) | (736,904 | ) | (36,986 | ) | (790,891 | ) | ||||||||
Class B – automatic conversion to Class A Shares | (18,018 | ) | (435,503 | ) | (16,668 | ) | (349,383 | ) | ||||||||
Class C | (82,621 | ) | (1,988,780 | ) | (51,008 | ) | (1,094,056 | ) | ||||||||
Class R3 | (4,752 | ) | (113,202 | ) | — | — | ||||||||||
Class I | (326,251 | ) | (7,937,342 | ) | (103,972 | ) | (2,239,398 | ) | ||||||||
| (788,832 | ) | (19,092,544 | ) | (494,286 | ) | (10,629,089 | ) | |||||||||
Net increase (decrease) |
|
107,904 |
|
$ |
2,343,350 |
| 283,801 | $ | 6,192,521 | |||||||
| Conservative Allocation | ||||||||||||||||
| Year Ended 6/30/11 | Year Ended 6/30/10 | |||||||||||||||
| Shares | Amount | Shares | Amount | |||||||||||||
Shares sold: | ||||||||||||||||
Class A | 182,177 | $ | 4,399,756 | 64,709 | $ | 1,429,477 | ||||||||||
Class A – automatic conversion of Class B Shares | 6,494 | 158,839 | 12,695 | 277,918 | ||||||||||||
Class B | 14,281 | 368,623 | 3,707 | 88,335 | ||||||||||||
Class C | 203,911 | 5,297,987 | 77,397 | 1,845,358 | ||||||||||||
Class R3 | 578 | 13,559 | — | — | ||||||||||||
Class I | 71,583 | 1,664,038 | 62,604 | 1,370,231 | ||||||||||||
Shares issued to shareholders due to reinvestment of distributions: | ||||||||||||||||
Class A | 33,309 | 798,086 | 43,904 | 976,421 | ||||||||||||
Class B | 618 | 15,918 | 1,297 | 31,032 | ||||||||||||
Class C | 5,842 | 150,441 | 6,737 | 161,004 | ||||||||||||
Class R3 | — | — | — | — | ||||||||||||
Class I | 1,540 | 35,883 | 734 | 15,831 | ||||||||||||
| 520,333 | 12,903,130 | 273,784 | 6,195,607 | |||||||||||||
Shares redeemed: | ||||||||||||||||
Class A | (277,679 | ) | (6,674,735 | ) | (279,645 | ) | (6,196,925 | ) | ||||||||
Class B | (11,927 | ) | (309,680 | ) | (29,273 | ) | (695,626 | ) | ||||||||
Class B – automatic conversion to Class A Shares | (6,060 | ) | (158,839 | ) | (11,842 | ) | (277,918 | ) | ||||||||
Class C | (107,748 | ) | (2,786,625 | ) | (50,787 | ) | (1,205,324 | ) | ||||||||
Class R3 | (5,212 | ) | (123,190 | ) | — | — | ||||||||||
Class I | (58,791 | ) | (1,382,868 | ) | (28,076 | ) | (606,419 | ) | ||||||||
| (467,417 | ) | (11,435,937 | ) | (399,623 | ) | (8,982,212 | ) | |||||||||
Net increase (decrease) | 52,916 | $ | 1,467,193 | (125,839 | ) | $ | (2,786,605 | ) | ||||||||
| 42 | Nuveen Investments |
4. Investment Transactions
Purchases and sales (excluding short-term investments, when applicable) during the fiscal year ended June 30, 2011, were as follows:
| Growth Allocation | Moderate Allocation | Conservative Allocation | ||||||||||
Purchases: | ||||||||||||
Affiliated investments | $ | 7,340,000 | $ | 49,207,000 | $ | 40,654,000 | ||||||
Non-affiliated investments | 448,118 | 4,592,145 | 5,167,846 | |||||||||
Sales and maturities: | ||||||||||||
Affiliated investments | 5,006,000 | 31,016,000 | 26,626,000 | |||||||||
Non-affiliated investments | 3,727,939 | 20,396,538 | 17,480,973 | |||||||||
5. Income Tax Information
The following information is presented on an income tax basis. Differences between amounts for financial statement and federal income tax purposes are primarily due to timing differences in recognizing certain gains and losses on investment transactions. To the extent that differences arise that are permanent in nature, such amounts are reclassified within the capital accounts as detailed below. Temporary differences do not require reclassification. Temporary and permanent differences do not impact the net asset values of the Funds.
At June 30, 2011, the cost and unrealized appreciation (depreciation) of investments, as determined on a federal income tax basis, were as follows:
| Growth Allocation | Moderate Allocation | Conservative Allocation | ||||||||||
Cost of investments | $ | 8,484,428 | $ | 50,876,161 | $ | 49,085,097 | ||||||
Gross unrealized: | ||||||||||||
Appreciation | $ | 517,362 | $ | 4,510,184 | $ | 3,370,368 | ||||||
Depreciation | (114,609 | ) | (639,028 | ) | (209,899 | ) | ||||||
Net unrealized appreciation (depreciation) of investments | $ | 402,753 | $ | 3,871,156 | $ | 3,160,469 | ||||||
Permanent differences primarily due to reclassification of proceeds from the redemption of an underlying fund, that would be treated for tax purposes as ordinary income or return of capital, reclassification of litigation proceeds and tax reclassification of dividends from investment in regulated investment companies resulted in reclassifications among the Funds’ components of net assets at June 30, 2011, the Funds’ tax year end, as follows:
| Growth Allocation | Moderate Allocation | Conservative Allocation | ||||||||||
Capital paid-in | $ | — | $ | (1,233 | ) | $ | (4 | ) | ||||
Undistributed (Over-distribution of) net investment income | (384 | ) | 387,072 | (18,598 | ) | |||||||
Accumulated net realized gain (loss) | 384 | (385,839 | ) | 18,602 | ||||||||
The tax components of undistributed net ordinary income and net long-term capital gains at June 30, 2011, the Funds’ tax year end, were as follows:
| Growth Allocation | Moderate Allocation | Conservative Allocation | ||||||||||
Undistributed net ordinary income* | $ | 82,430 | $ | 944,484 | $ | 1,142,487 | ||||||
Undistributed net long-term capital gains | — | — | — | |||||||||
| * | Net ordinary income consists of net taxable income derived from dividends, interest and net short-term capital gains, if any. |
The tax character of distributions paid during the Funds’ tax years ended June 30, 2011 and June 30, 2010, was designated for purposes of the dividends paid deduction as follows:
| 2011 | Growth Allocation | Moderate Allocation | Conservative Allocation | |||||||||
Distributions from net ordinary income* | $ | 157,033 | $ | 1,151,890 | $ | 1,401,296 | ||||||
Distributions from net long-term capital gains | — | — | — | |||||||||
2010 | Growth Allocation | Moderate Allocation | Conservative Allocation | |||||||||
Distributions from net ordinary income* | $ | 205,473 | $ | 1,151,421 | $ | 1,584,762 | ||||||
Distributions from net long-term capital gains | — | — | — | |||||||||
| * | Net ordinary income consists of net taxable income derived from dividends, interest and net short-term capital gains, if any. |
| Nuveen Investments | 43 |
Notes to Financial Statements (continued)
At June 30, 2011, the Funds’ tax year end, the Funds had unused capital loss carryforwards available for federal income tax purposes to be applied against future capital gains, if any. If not applied, the carryforwards will expire as follows:
| Growth Allocation | Moderate Allocation | Conservative Allocation | ||||||||||
Expiration: | ||||||||||||
June 30, 2016 | $ | — | $ | — | $ | 718,494 | ||||||
June 30, 2017 | 141,202 | — | 1,329,027 | |||||||||
June 30, 2018 | 1,140,368 | 120,097 | — | |||||||||
Total | $ | 1,281,570 | $ | 120,097 | $ | 2,047,521 | ||||||
During the Fund’s tax year ended June 30, 2011, the Funds utilized capital loss carryforwards as follows:
| Growth Allocation | Moderate Allocation | Conservative Allocation | ||||||||||
Utilized capital loss carryforwards | $ | 852,352 | $ | 3,353,361 | $ | 2,908,499 | ||||||
6. Management Fees and Other Transactions with Affiliates
The management fee for each Fund, payable monthly, is .15% of the average daily net assets of each Fund.
The management fee compensates the Adviser for overall investment advisory and administrative services and general office facilities it provides for the Funds. The Adviser has entered into a sub-advisory agreement with NIS under which NIS manages the investment portfolios of the Funds. NIS is compensated for its sub-advisory services to the Funds from the management fee paid to the Adviser.
The Adviser has agreed to waive fees and reimburse expenses (“Expense Cap”) of the Funds, so that total annual fund operating expenses (excluding 12b-1 distribution and service fees, interest expenses, taxes, fees incurred in acquiring and disposing of portfolio securities, Underlying Fund fees and expenses and extraordinary expenses) do not exceed the percentage of each Fund’s average daily net assets for each share class and for the time periods stated, as set forth in the following table:
| Temporary Expense Cap | Temporary Expense Cap Expiration Date | Permanent Expense Cap | ||||||||||
Growth Allocation | .40 | % | October 31, 2011 | .84 | % | |||||||
Moderate Allocation | .29 | October 31, 2011 | N/A | |||||||||
Conservative Allocation | .37 | October 31, 2011 | N/A | |||||||||
The Adviser may voluntarily reimburse expenses from time to time in any of the Funds. Voluntary reimbursements may be terminated at any time at the Adviser’s discretion.
The Trust pays no compensation directly to those of its trustees who are affiliated with the Adviser or to its officers, all of whom receive remuneration for their services to the Trust from the Adviser or its affiliates. The Board of Trustees has adopted a deferred compensation plan for independent trustees that enables trustees to elect to defer receipt of all or a portion of the annual compensation they are entitled to receive from certain Nuveen-advised funds. Under the plan, deferred amounts are treated as though equal dollar amounts had been invested in shares of select Nuveen-advised funds.
During the fiscal year ended June 30, 2011, the Distributor collected sales charges on purchases of Class A Shares, the majority of which were paid out as concessions to financial intermediaries as follows:
| Growth Allocation | Moderate Allocation | Conservative Allocation | ||||||||||
Sales charges collected (Unaudited) | $ | 27,749 | $ | 125,940 | $ | 32,332 | ||||||
Paid to financial intermediaries (Unaudited) | 24,774 | 110,401 | 28,403 | |||||||||
The Distributor also received 12b-1 service fees on Class A Shares, substantially all of which were paid to compensate financial intermediaries for providing services to shareholders relating to their investments.
During the fiscal year ended June 30, 2011, the Distributor compensated financial intermediaries directly with commission advances at the time of purchase as follows:
| Growth Allocation | Moderate Allocation | Conservative Allocation | ||||||||||
Commission advances (Unaudited) | $ | 8,229 | $ | 26,519 | $ | 10,447 | ||||||
| 44 | Nuveen Investments |
To compensate for commissions advanced to financial intermediaries, all 12b-1 service fees collected on Class B Shares during the first year following a purchase, all 12b-1 distribution fees collected on Class B Shares, and all 12b-1 service and distribution fees collected on Class C Shares during the first year following a purchase are retained by the Distributor. During the fiscal year ended June 30, 2011, the Distributor retained such 12b-1 fees as follows:
| Growth Allocation | Moderate Allocation | Conservative Allocation | ||||||||||
12b-1 fees retained (Unaudited) | $ | 6,869 | $ | 44,565 | $ | 31,343 | ||||||
The remaining 12b-1 fees charged to the Funds were paid to compensate financial intermediaries for providing services to shareholders relating to their investments.
The Distributor also collected and retained CDSC on share redemptions during the fiscal year ended June 30, 2011, as follows:
| Growth Allocation | Moderate Allocation | Conservative Allocation | ||||||||||
CDSC retained (Unaudited) | $ | 1,045 | $ | 5,750 | $ | 3,128 | ||||||
7. New Accounting Pronouncements
Financial Accounting Standards Board (“FASB”) Transfers and Servicing (Topic 860): Reconsideration of Effective Control for Repurchase Agreements
On April 15, 2011, the FASB issued Accounting Standards Update (“ASU”) No. 2011-03 (“ASU No. 2011-03”). The guidance in ASU No. 2011-03 is intended to improve the accounting for repurchase agreements (“repos”) and other similar agreements. Specifically, ASU No. 2011-03 modifies the criteria for determining when these transactions would be accounted for as financings (secured borrowings/lending agreements) as opposed to sales (purchases) with commitments to repurchase (resell). The effective date of ASU No. 2011-03 is for interim and annual periods beginning on or after December 15, 2011. At this time, management is evaluating the implications of this guidance and the impact it will have to the financial statement amounts or footnote disclosures, if any.
Fair Value Measurements and Disclosures
On May 12, 2011, the FASB issued ASU No. 2011-04 (“ASU No. 2011-04”) modifying Topic 820, Fair Value Measurements and Disclosures. At the same time, the International Accounting Standards Board (“IASB”) issued International Financial Reporting Standard (“IFRS”) 13, Fair Value Measurement. The objective of the FASB and IASB is convergence of their guidance on fair value measurements and disclosures. Specifically, the ASU requires reporting entities to disclose i) the amounts of any transfers between Level 1 and Level 2, and the reasons for the transfers, ii) for Level 3 fair value measurements, a) quantitative information about significant unobservable inputs used, b) a description of the valuation processes used by the reporting entity and c) a narrative description of the sensitivity of the fair value measurement to changes in unobservable inputs if a change in those inputs might result in a significantly higher or lower fair value measurement. The effective date of ASU No. 2011-04 is for interim and annual periods beginning after December 15, 2011. At this time, management is evaluating the implications of this guidance and the impact it will have on the financial statement amounts and footnote disclosures, if any.
| Nuveen Investments | 45 |
Trustees and Officers (Unaudited)
The management of the Funds, including general supervision of the duties performed for the Funds by the Adviser, is the responsibility of the Board of Trustees of the Funds. The number of trustees of the Funds is currently set at ten. None of the trustees who are not “interested” persons of the Funds (referred to herein as “independent trustees”) has ever been a director or employee of, or consultant to, Nuveen or its affiliates. The names and business addresses of the trustees and officers of the Funds, their principal occupations and other affiliations during the past five years, the number of portfolios each oversees and other directorships they hold are set forth below.
The Funds’ Statement of Additional Information (“SAI”) includes more information about the trustees. To request a free copy, call Nuveen Investments at (800) 257-8787 or visit the Funds’ website at www.nuveen.com.
Name, Birthdate and Address | Position(s) Held with the Funds | Year First Elected or Appointed (1) | Principal Occupation(s) Including other Directorships During Past 5 Years | Number of Portfolios in Fund Complex Overseen by Trustee | ||||
| Independent Trustees: | ||||||||
Robert P. Bremner (2) 8/22/40 333 W. Wacker Drive Chicago, IL 60606 | Chairman of the Board and Trustee | 1996 | Private Investor and Management Consultant; Treasurer and Director, Humanities Council of Washington, D.C.; Board Member, Independent Directors Council affiliated with the Investment Company Institute. | 245 | ||||
Jack B. Evans 10/22/48 333 W. Wacker Drive Chicago, IL 60606 | Trustee | 1999 | President, The Hall-Perrine Foundation, a private philanthropic corporation (since 1996); Director and Chairman, United Fire Group, a publicly held company; member of the Board of Regents for the State of Iowa University System; Director, Source Media Group; Life Trustee of Coe College and the Iowa College Foundation; formerly, Director, Alliant Energy; formerly, Director, Federal Reserve Bank of Chicago; formerly, President and Chief Operating Officer, SCI Financial Group, Inc., a regional financial services firm. | 245 | ||||
William C. Hunter 3/6/48 333 W. Wacker Drive Chicago, IL 60606 | Trustee | 2004 | Dean, Tippie College of Business, University of Iowa (since 2006); Director (since 2004) of Xerox Corporation; Director (since 2005), Beta Gamma Sigma International Honor Society; Director of Wellmark, Inc. (since 2009); formerly, Dean and Distinguished Professor of Finance, School of Business at the University of Connecticut (2003-2006); previously, Senior Vice President and Director of Research at the Federal Reserve Bank of Chicago (1995-2003); formerly, Director (1997-2007), Credit Research Center at Georgetown University. | 245 | ||||
David J. Kundert (2) 10/28/42 333 W. Wacker Drive Chicago, IL 60606 | Trustee | 2005 | Director, Northwestern Mutual Wealth Management Company; retired (since 2004) as Chairman, JPMorgan Fleming Asset Management, President and CEO, Banc One Investment Advisors Corporation, and President, One Group Mutual Funds; prior thereto, Executive Vice President, Banc One Corporation and Chairman and CEO, Banc One Investment Management Group; Member, Board of Regents, Luther College; member of the Wisconsin Bar Association; member of Board of Directors, Friends of Boerner Botanical Gardens; member of Board of Directors and Chair of Investment Committee, Greater Milwaukee Foundation. | 245 | ||||
William J. Schneider (2) 9/24/44 333 W. Wacker Drive Chicago, IL 60606 | Trustee | 1997 | Chairman of Miller-Valentine Partners Ltd., a real estate investment company; formerly, Senior Partner and Chief Operating Officer (retired 2004) of Miller-Valentine Group; member, University of Dayton Business School Advisory Council; member, Mid-America Health System Board; formerly, member and chair, Dayton Philharmonic Orchestra Association; formerly, member, Business Advisory Council, Cleveland Federal Reserve Bank. | 245 | ||||
Judith M. Stockdale 12/29/47 333 W. Wacker Drive Chicago, IL 60606 | Trustee | 1997 | Executive Director, Gaylord and Dorothy Donnelley Foundation (since 1994); prior thereto, Executive Director, Great Lakes Protection Fund (1990-1994). | 245 | ||||
Carole E. Stone (2) 6/28/47 333 W. Wacker Drive Chicago, IL 60606 | Trustee | 2007 | Director, Chicago Board Options Exchange (since 2006); Director, C2 Options Exchange, Incorporated (since 2009); formerly, Commissioner, New York State Commission on Public Authority Reform (2005-2010); formerly, Chair, New York Racing Association Oversight Board (2005-2007). | 245 | ||||
| 46 | Nuveen Investments |
Name, Birthdate and Address | Position(s) Held with the Funds | Year First Elected or Appointed (1) | Principal Occupation(s) During Past Five Years | Number of Portfolios in Fund Complex Overseen by Trustee | ||||
Virginia L. Stringer 8/16/44 333 West Wacker Drive Chicago, IL 60606 | Trustee | 2011 | Board Member, Mutual Fund Directors Forum; Member, Governing Board, Investment Company Institute’s Independent Directors Council; governance consultant and non-profit board member; former Owner and President, Strategic Management Resources, Inc. a management consulting firm; previously, held several executive positions in general management, marketing and human resources at IBM and The Pillsbury Company; Independent Director, First American Fund Complex (1987-2010) and Chair (1997-2010). | 245 | ||||
Terence J. Toth (2) 9/29/59 333 W. Wacker Drive Chicago, IL 60606 | Trustee | 2008 | Director, Legal & General Investment Management America, Inc. (since 2008); Managing Partner, Promus Capital (since 2008); formerly, CEO and President, Northern Trust Global Investments (2004-2007); Executive Vice President, Quantitative Management & Securities Lending (2000-2004); prior thereto, various positions with Northern Trust Company (since 1994); member: Goodman Theatre Board (since 2004), Chicago Fellowship Board (since 2005) and Catalyst Schools of Chicago Board (since 2008); formerly, member: Northern Trust Mutual Funds Board (2005-2007), Northern Trust Global Investments Board (2004-2007), Northern Trust Japan Board (2004-2007), Northern Trust Securities Inc. Board (2003-2007) and Northern Trust Hong Kong Board (1997-2004). | 245 | ||||
| Interested Trustee: | ||||||||
John P. Amboian (3) 6/14/61 333 W. Wacker Drive Chicago, IL 60606 | Trustee | 2008 | Chief Executive Officer and Chairman (since 2007), and Director (since 1999) of Nuveen Investments, Inc., formerly, President (1999-2007); Chief Executive Officer (since 2007) of Nuveen Investments Advisers Inc.; Director (since 1998) formerly, Chief Executive Officer (2007-2010) of Nuveen Fund Advisors, Inc. | 245 | ||||
Name, Birthdate and Address | Position(s) Held with the Funds | Year First Elected or Appointed (4) | Principal Occupation(s) During Past 5 Years | Number of Portfolios in Fund Complex Overseen by Officer | ||||
| Officers of the Funds: | ||||||||
Gifford R. Zimmerman 9/9/56 333 W. Wacker Drive Chicago, IL 60606 | Chief Administrative Officer | 1988 | Managing Director (since 2002), Assistant Secretary and Associate General Counsel of Nuveen Securities, LLC; Managing Director (since 2004) and Assistant Secretary (since 1994) of Nuveen Investments, Inc.; Managing Director (since 2002), Assistant Secretary (since 1997) and Co-General Counsel (since 2011) of Nuveen Fund Advisors, Inc.; Managing Director, Assistant Secretary and Associate General Counsel of Nuveen Asset Management, LLC (since 2011); Managing Director, Associate General Counsel and Assistant Secretary of Symphony Asset Management LLC (since 2003); Vice President and Assistant Secretary of NWQ Investment Management Company, LLC (since 2002), Nuveen Investments Advisers Inc. (since 2002), Tradewinds Global Investors LLC, and Santa Barbara Asset Management, LLC (since 2006), Nuveen HydePark Group LLC and Nuveen Investment Solutions, Inc. (since 2007) and of Winslow Capital Management Inc. (since 2010); Chief Administrative Officer and Chief Compliance Officer (since 2010) of Nuveen Commodities Asset Management, LLC; Chartered Financial Analyst. | 245 | ||||
Margo L. Cook 4/11/64 333 W. Wacker Drive Chicago, IL 60606 | Vice President | 2009 | Executive Vice President (since 2008) of Nuveen Investments, Inc. and of Nuveen Fund Advisors, Inc. (since 2011); previously, Head of Institutional Asset Management (2007-2008) of Bear Stearns Asset Management; Head of Institutional Asset Management (1986-2007) of Bank of NY Mellon; Chartered Financial Analyst. | 245 | ||||
| Nuveen Investments | 47 |
Trustees and Officers (Unaudited) (continued)
Name, Birthdate and Address | Position(s) Held with the Funds | Year First Elected or Appointed (4) | Principal Occupation(s) During Past 5 Years | Number of Portfolios in Fund Complex Overseen by Officer | ||||
Lorna C. Ferguson 10/24/45 333 W. Wacker Drive Chicago, IL 60606 | Vice President | 1998 | Managing Director (since 2005) of Nuveen Fund Advisors, Inc. | 245 | ||||
Stephen D. Foy 5/31/54 333 W. Wacker Drive Chicago, IL 60606 | Vice President and Controller | 1998 | Senior Vice President (since 2010), formerly, Vice President (2005-2010) of Nuveen Securities, LLC and Funds Controller; Vice President of Nuveen; Certified Public Accountant. | 245 | ||||
Scott S. Grace 8/20/70 333 W. Wacker Drive Chicago, IL 60606 | Vice President and Treasurer | 2009 | Managing Director, Corporate Finance & Development, Treasurer (since 2009) of Nuveen Securities, LLC; Managing Director and Treasurer (since 2009) of Nuveen Fund Advisors, Inc., Nuveen Investment Solutions, Inc., Nuveen Investments Advisers, Inc., Nuveen Investments Holdings Inc. and (since (2011) Nuveen Asset Management, LLC; Vice President and Treasurer of NWQ Investment Management Company, LLC, Tradewinds Global Investors, LLC, Symphony Asset Management LLC and Winslow Capital Management, Inc.; Vice President of Santa Barbara Asset Management, LLC; formerly, Treasurer (2006-2009), Senior Vice President (2008-2009), previously, Vice President (2006-2008) of Janus Capital Group, Inc.; formerly, Senior Associate in Morgan Stanley’s Global Financial Services Group (2000-2003); Chartered Accountant Designation. | 245 | ||||
Walter M. Kelly 2/24/70 333 W. Wacker Drive Chicago, IL 60606 | Chief Compliance Officer and Vice President | 2003 | Senior Vice President (since 2008), Vice President (2006-2008) of Nuveen Securities, LLC; Senior Vice President (since 2008) and Assistant Secretary (since 2008) of Nuveen Fund Advisors, Inc. | 245 | ||||
Tina M. Lazar 8/27/61 333 W. Wacker Drive Chicago, IL 60606 | Vice President | 2002 | Senior Vice President (since 2010), formerly, Vice President (2005-2010) of Nuveen Fund Advisors, Inc. | 245 | ||||
Larry W. Martin 7/27/51 333 West Wacker Drive Chicago, IL 60606 | Vice President and Assistant Secretary | 1997 | Senior Vice President (since 2010), formerly, Vice President (1993-2010), Assistant Secretary and Assistant General Counsel of Nuveen Securities, LLC; Senior Vice President (since 2011) of Nuveen Asset Management, LLC: Senior Vice President (since 2010), formerly, Vice President (2005-2010), and Assistant Secretary of Nuveen Investments, Inc.; Senior Vice President (since 2010), formerly Vice President (2005-2010), and Assistant Secretary (since 1997) of Nuveen Fund Advisors, Inc.; Vice President and Assistant Secretary of Nuveen Investments Advisers, Inc. (since 2002), NWQ Investment Management Company, LLC, Symphony Asset Management LLC (since 2003), Tradewinds Global Investors, LLC, Santa Barbara Asset Management, LLC (since 2006), Nuveen HydePark Group, LLC and Nuveen Investment Solutions, Inc. (since 2007), and of Winslow Capital Management, Inc. (since 2010); Vice President and Assistant Secretary of Nuveen Commodities Asset Management, LLC (since 2010). | 245 |
| 48 | Nuveen Investments |
Name, Birthdate and Address | Position(s) Held with the Funds | Year First Elected or Appointed (4) | Principal Occupation(s) Including other Directorships During Past 5 Years | Number of Portfolios in Fund Complex Overseen by Officer | ||||
Kevin J. McCarthy 3/26/66 333 W. Wacker Drive Chicago, IL 60606 | Vice President and Secretary | 2007 | Managing Director (since 2008), formerly, Vice President (2007-2008), Nuveen Securities, LLC; Managing Director (since 2008), Assistant Secretary (since 2007) and Co-General Counsel (since 2011) of Nuveen Fund Advisors, Inc.; Managing Director, Assistant Secretary and Associate General Counsel (since 2011) of Nuveen Asset Management, LLC; Managing Director (since 2008), and Assistant Secretary, Nuveen Investment Holdings, Inc.; Vice President (since 2007) and Assistant Secretary of Nuveen Investments Advisers Inc., NWQ Investment Management Company, LLC, Tradewinds Global Investors LLC, NWQ Holdings, LLC, Symphony Asset Management LLC, Santa Barbara Asset Management, LLC, Nuveen HydePark Group, LLC, Nuveen Investment Solutions, Inc. (since 2007) and of Winslow Capital Management, Inc. (since 2010); Vice President and Secretary (since 2010) of Nuveen Commodities Asset Management, LLC; prior thereto, Partner, Bell, Boyd & Lloyd LLP (1997-2007). | 245 | ||||
Kathleen L. Prudhomme 3/30/53 800 Nicollet Mall Minneapolis, MN 55402 | Vice President and Assistant Secretary | 2011 | Managing Director, Assistant Secretary and Co-General Counsel (since 2011) of Nuveen Fund Advisors, Inc.; Managing Director, Assistant Secretary and Associate General Counsel (since 2011) of Nuveen Asset Management, LLC; Managing Director and Assistant Secretary (since 2011) of Nuveen Securities, LLC; formerly, Deputy General Counsel, FAF Advisors, Inc. (2004-2010). | 245 | ||||
Jeffrey M. Wilson 3/13/56 333 West Wacker Drive Chicago, IL 60606 | Vice President | 2011 | Senior Vice President of Nuveen Investments (since 2011), formerly, Senior Vice President of FAF Advisors, Inc. (2000-2010). | 112 |
| (1) | Trustees serve an indefinite term until his/her successor is elected or appointed. The year first elected or appointed represents the year in which the trustee was first elected or appointed to any fund in the Nuveen Fund Complex. |
| (2) | Also serves as a trustee of the Nuveen Diversified Commodity Fund, an exchange-traded commodity pool managed by Nuveen Commodities Asset Management, LLC, an affiliate of the Adviser. |
| (3) | Mr. Amboian is an interested trustee because of his position with Nuveen Investments, Inc. and certain of its subsidiaries, which are affiliates of the Nuveen Funds. |
| (4) | Officers serve one year terms through August of each year. The year first elected or appointed represents the year in which the officer was first elected or appointed to any fund in the Nuveen Fund Complex. |
| Nuveen Investments | 49 |
Annual Investment Management Agreement Approval Process
(Unaudited)
The Board of Trustees (each, a “Board” and each Trustee, a “Board Member”) of the Funds, including the Board Members who are not parties to the Funds’ advisory or sub-advisory agreements or “interested persons” of any such parties (the “Independent Board Members”), are responsible for approving the advisory agreements (each, an “Investment Management Agreement”) between each Fund and Nuveen Fund Advisors, Inc. (the “Advisor”) and the sub-advisory agreements (each, a “Sub-Advisory Agreement”) between the Advisor and Nuveen Investment Solutions, Inc. (the “Sub-Advisor”) (the Investment Management Agreements and the Sub-Advisory Agreements are referred to collectively as the “Advisory Agreements”) and their periodic continuation. Pursuant to the Investment Company Act of 1940, as amended (the “1940 Act”), the Board is required to consider the continuation of advisory agreements and sub-advisory agreements on an annual basis. Accordingly, at an in-person meeting held on May 23-25, 2011 (the “May Meeting”), the Board, including a majority of the Independent Board Members, considered and approved the continuation of the Advisory Agreements for the Funds for an additional one-year period.
In preparation for their considerations at the May Meeting, the Board requested and received extensive materials prepared in connection with the review of the Advisory Agreements. The materials provided a broad range of information regarding the Funds, the Advisor and the Sub-Advisor (the Advisor and the Sub-Advisor are collectively, the “Fund Advisers” and each, a “Fund Adviser”). As described in more detail below, the information provided included, among other things, a review of Fund performance, including Fund investment performance assessments against peer groups and appropriate benchmarks, a comparison of Fund fees and expenses relative to peers, a description and assessment of shareholder service levels for the Funds, a summary of the performance of certain service providers, a review of product initiatives and shareholder communications and an analysis of the Advisor’s profitability with comparisons to comparable peers in the managed fund business. As part of their annual review, the Board also held a separate meeting on April 19-20, 2011, to review the Funds’ investment performance and consider an analysis provided by the Advisor of the Sub-Advisor which generally evaluated the Sub-Advisor’s investment team, investment mandate, organizational structure and history, investment philosophy and process, performance of the applicable Fund, and significant changes to the foregoing. As a result of their review of the materials and discussions, the Board presented the Advisor with questions and the Advisor responded.
The materials and information prepared in connection with the annual review of the Advisory Agreements supplement the information provided to the Board during the year. In this regard, throughout the year, the Board, acting directly or through its committees, regularly reviews the performance and various services provided by the Advisor and the Sub-Advisor. The Board meets at least quarterly as well as at other times as the need arises. At its quarterly meetings, the Board reviews reports by the Advisor which include, among other things, Fund performance, a review of the investment teams and compliance reports. The Board also meets with key investment personnel managing the Fund portfolios during the year. In addition, the Board continues its program of seeking to visit each sub-advisor to the Nuveen funds at least once over a multiple year rotation, meeting with key investment and business personnel. The Board also met with State Street Bank & Trust Company, the Funds’ accountant and custodian, in 2010. The Board considers factors and information that are relevant to its annual consideration of the renewal of the Advisory Agreements at these meetings held throughout the year. Accordingly, the Board considers the information provided and knowledge gained at these meetings when performing its annual review of the Advisory Agreements. The Independent Board Members are assisted throughout the process by independent legal counsel who provided materials describing applicable law and the duties of directors or trustees in reviewing advisory contracts and met with the Independent Board Members in executive sessions without management present.
The Board considered all factors it believed relevant with respect to each Fund, including among other factors: (a) the nature, extent and quality of the services provided by the Fund Advisers, (b) the investment performance of the Fund and Fund Advisers, (c) the advisory fees and costs of the services to be provided to the Funds and the profitability of the Fund Advisers, (d) the extent of any economies of scale, (e) any benefits derived by the Fund Advisers from the relationship with the Fund and (f) other factors. Each Board Member may have accorded different weight to the various factors in reaching his or her conclusions with respect to a Fund’s Advisory Agreements. The Independent Board Members did not identify any single factor as all important or controlling. The Independent Board Members’ considerations were instead based on a comprehensive consideration of all the information presented. The principal factors considered by the Board and its conclusions are described below.
A. Nature, Extent and Quality of Services
In considering renewal of the Advisory Agreements, the Independent Board Members considered the nature, extent and quality of the Fund Adviser’s services, including advisory services and the resulting Fund performance and administrative services. The Independent Board Members reviewed materials outlining, among other things, the Fund Adviser’s organization and business; the types of services that the Fund Adviser or its affiliates provide to the Funds; the performance record of the applicable Fund (as described in further detail below); and any initiatives Nuveen had taken for the applicable fund product line.
In considering advisory services, the Board recognized that the Advisor provides various oversight, administrative, compliance and other services for the Funds and the Sub-Advisor provides the portfolio investment management services to the Funds. Accordingly, in reviewing the portfolio management services provided to each Fund, the Board reviewed the materials provided by the Nuveen Investment Services Oversight Team analyzing, among other things, the Sub-Advisor’s investment team and changes thereto, organization and history, assets under management, Fund objectives and mandate, the investment team’s philosophy and strategies in managing the Fund, developments affecting the Sub-Advisor or Fund and Fund performance. The Independent Board Members also reviewed portfolio manager compensation arrangements to evaluate each Fund Adviser’s ability to attract and retain high quality investment personnel, preserve stability, and reward performance but not provide an incentive to take undue risks. In addition, the
| 50 | Nuveen Investments |
Board considered the Advisor’s execution of its oversight responsibilities over the Sub-Advisor. Given the importance of compliance, the Independent Board Members also considered Nuveen’s compliance program, including the report of the chief compliance officer regarding the Funds’ compliance policies and procedures.
In addition to advisory services, the Board considered the quality and extent of administrative and other non-investment advisory services the Advisor and its affiliates provide to the Funds, including product management, investment services (such as oversight of investment policies and procedures, risk management, and pricing), fund administration, oversight of service providers, shareholder services, administration of Board relations, regulatory and portfolio compliance and legal support. In reviewing the services provided, the Board also reviewed materials describing various notable initiatives and projects the Advisor performed in connection with the open-end fund product line. These initiatives included operations necessary to effect the acquisition of FAF Advisors, Inc.’s (“FAF”) long-term asset management business by Nuveen and the subsequent integration of FAF and the funds FAF advised into the Nuveen family of funds; reduction of management fees and expense caps on certain open-end equity funds that was effective July 1, 2010; changes in dividend declaration policies; and adding funds to various distribution platforms.
Based on their review, the Independent Board Members found that, overall, the nature, extent and quality of services provided to the respective Funds under each applicable Advisory Agreement were satisfactory.
B. The Investment Performance of the Funds and Fund Advisers
The Board, including the Independent Board Members, reviewed and considered the performance history of each Fund over various time periods. The Board reviewed, among other things, each Fund’s historic investment performance as well as information comparing the Fund’s performance information with that of other funds (the “Performance Peer Group”) based on data provided by an independent provider of mutual fund data and with recognized and/or customized benchmarks.
The Board reviewed reports, including a comprehensive analysis of the Funds’ performance and the applicable investment team. In this regard, the Board reviewed each Fund’s total return information compared to the returns of its Performance Peer Group and recognized and/or customized benchmarks for the quarter, one-, three- and five-year periods ending December 31, 2010 and for the same periods ending March 31, 2011.
In reviewing performance comparison information, the Independent Board Members recognized that the usefulness of the comparisons of the performance of certain funds with the performance of their respective Performance Peer Group may be limited because the Performance Peer Group may not adequately represent the objectives and strategies of the applicable funds or may be limited in size or number. In addition, the Independent Board Members noted that previous changes to the investment strategies of the Funds limit somewhat the usefulness of reviewing the Funds’ past performance beyond recent periods. The Independent Board Members also noted that the investment experience of a particular shareholder in the Nuveen funds will vary depending on when such shareholder invests in the applicable fund, the class held (if multiple classes are offered) and the performance of the fund (or respective class) during that shareholder’s investment period. With respect to any Nuveen funds that underperformed their peers and/or benchmarks from time to time, the Board monitors such funds closely and considers any steps necessary or appropriate to address such issues.
In considering the results of the comparisons, the Independent Board Members observed, among other things, that the Funds had demonstrated generally favorable performance in comparison to peers, performing in the first or second quartile over various periods.
Based on their review, the Independent Board Members determined that each Fund’s investment performance had been satisfactory.
C. Fees, Expenses and Profitability
1. Fees and Expenses
The Board evaluated the management fees and expenses of each Fund reviewing, among other things, such Fund’s gross management fees, net management fees and net expense ratios in absolute terms as well as compared to the fee and expenses of a comparable universe of funds based on data provided by an independent fund data provider (the “Peer Universe”) and in certain cases, to a more focused subset of funds in the Peer Universe (the “Peer Group”) and any expense limitations.
The Independent Board Members further reviewed the methodology regarding the construction of the applicable Peer Universe and Peer Group (if any). In reviewing the comparisons of fee and expense information, the Independent Board Members took into account that in certain instances various factors such as: the asset level of a fund relative to peers; the limited size and particular composition of the Peer Universe or Peer Group; the investment objectives of the peers; expense anomalies; changes in the funds comprising the Peer Universe or Peer Group from year to year; levels of reimbursement; and the timing of information used may impact the comparative data thereby limiting the ability to make a meaningful comparison with peers, including for each of the Funds.
In reviewing the fee schedule for a Fund, the Independent Board Members also considered the fund-level and complex-wide breakpoint schedules (described in further detail below) and any fee waivers and reimbursements provided by Nuveen. In reviewing fees and expenses, the Board considered the expenses and fees to be higher if they were over 10 basis points higher, slightly higher if they were 6 to 10 basis points higher, in line if they were within 5 basis points higher than the peer average and below if they were below the peer average of the Peer Group (if available) or Peer Universe if there was no separate Peer Group.
| Nuveen Investments | 51 |
Annual Investment Management Agreement Approval Process
(Unaudited) (continued)
The Independent Board Members recognized that the Funds operate as fund-of-funds and the fee and expense arrangement of a fund-of-funds structure differs from that of a traditional fund format. The Independent Board Members noted that, in light of their fund-of-funds structure, the Funds will indirectly pay a portion of the expenses incurred by the underlying funds, including their advisory fees. Accordingly, the Independent Board Members reviewed, among other things, the gross and net management fees, the underlying fund expenses, and total expense ratio (including underlying fund expenses). In this regard, the Independent Board Members noted that the net management fee and total expense ratio of each Fund was below the peer average. In addition, the Independent Board Members considered that many of the underlying funds may be advised by the Advisor and sub-advised by an affiliated person of the Advisor. Accordingly, the Advisor and affiliated sub-advisors may receive advisory fees from the underlying funds in which the Funds invest, and the Funds will indirectly bear their pro rata portion of these fees as well as the other expenses of the underlying funds. In considering the services provided by the Fund Advisers to the Funds and the fee arrangements, the Board determined, however, that the fees were for services in addition to, rather than duplicative of, the services provided under any underlying fund’s advisory contracts.
Based on their review of the fee and expense information provided, the Independent Board Members determined that each Fund’s management fees were reasonable in light of the nature, extent and quality of services provided to the Fund.
2. Comparisons with the Fees of Other Clients
The Independent Board Members further reviewed information regarding the nature of services and fee rates offered by the Advisor to other clients, including separately managed accounts (both retail and institutional accounts), foreign investment funds offered by Nuveen, and funds that are not offered by Nuveen but are sub-advised by one of Nuveen’s investment management teams. In evaluating the comparisons of fees, the Independent Board Members noted that the fee rates charged to the Funds and other clients vary, among other things, because of the different services involved and the additional regulatory and compliance requirements associated with registered investment companies, such as the Funds. Accordingly, the Independent Board Members considered the differences in the product types, including, but not limited to, the services provided, the structure and operations, product distribution and costs thereof, portfolio investment policies, investor profiles, account sizes and regulatory requirements. The Independent Board Members noted, in particular, that the range of services provided to the Funds (as discussed above) is much more extensive than that provided to separately managed accounts. The Independent Board Members also recognized that the Advisor and the Sub-Advisor to the Funds do not currently advise other fund-of-funds and, therefore, meaningful comparisons of fees for similar types of clients were not available. Given the inherent differences in the products, particularly the extensive services provided to the Funds, the Independent Board Members believe such facts justify the different levels of fees.
In considering the fees of the Sub-Advisor, the Independent Board Members also considered the pricing schedule or fees that the Sub-Advisor charges for similar investment management services for other fund sponsors or clients (such as retail and/or institutional managed accounts) as applicable.
3. Profitability of Fund Advisers
In conjunction with its review of fees, the Independent Board Members also considered the profitability of Nuveen for its advisory activities (which incorporated Nuveen’s wholly-owned affiliated sub-advisers) and its financial condition. The Independent Board Members reviewed the revenues and expenses of Nuveen’s advisory activities for the last two years, the allocation methodology used in preparing the profitability data and an analysis of the key drivers behind the changes in revenues and expenses that impacted profitability in 2010. The Independent Board Members noted this information supplemented the profitability information requested and received during the year to help keep them apprised of developments affecting profitability (such as changes in fee waivers and expense reimbursement commitments). In this regard, the Independent Board Members noted that they have an Independent Board Member serve as a point person to review and keep them apprised of changes to the profitability analysis and/or methodologies during the year. The Independent Board Members also considered Nuveen’s revenues for advisory activities, expenses, and profit margin compared to that of various unaffiliated management firms with similar amounts of assets under management and relatively comparable asset composition prepared by Nuveen.
In reviewing profitability, the Independent Board Members recognized the subjective nature of determining profitability which may be affected by numerous factors including the allocation of expenses. Further, the Independent Board Members recognized the difficulties in making comparisons as the profitability of other advisers generally is not publicly available and the profitability information that is available for certain advisers or management firms may not be representative of the industry and may be affected by, among other things, the adviser’s particular business mix, capital costs, types of funds managed and expense allocations. Notwithstanding the foregoing, the Independent Board Members reviewed Nuveen’s methodology and assumptions for allocating expenses across product lines to determine profitability. In reviewing profitability, the Independent Board Members recognized Nuveen’s investment in its fund business. Based on their review, the Independent Board Members concluded that the Advisor’s level of profitability for its advisory activities was reasonable in light of the services provided.
In evaluating the reasonableness of the compensation, the Independent Board Members also considered other amounts paid to a Fund Adviser by the Funds as well as any indirect benefits (such as soft dollar arrangements, if any) the Fund Adviser and its affiliates receive, or are expected to receive, that are directly attributable to the management of the Funds, if any. See Section E below for additional information on indirect benefits a Fund Adviser may receive as a result of its relationship with the Funds. Based
| 52 | Nuveen Investments |
on their review of the overall fee arrangements of each Fund, the Independent Board Members determined that the advisory fees and expenses of the respective Fund were reasonable.
D. Economies of Scale and Whether Fee Levels Reflect These Economies of Scale
With respect to economies of scale, the Independent Board Members have recognized the potential benefits resulting from the costs of a fund being spread over a larger asset base, although economies of scale are difficult to measure and predict with precision, particularly on a fund-by-fund basis. One method to help ensure the shareholders share in these benefits is to include breakpoints in the advisory fee schedule. Generally, management fees for funds in the Nuveen complex are comprised of a fund-level component and a complex-level component, subject to certain exceptions. Accordingly, the Independent Board Members generally review and consider the applicable fund-level breakpoints in the advisory fee schedules for the funds in the Nuveen fund complex that reduce advisory fees as asset levels increase. The Independent Board Members recognized, however, that the Funds do not have fund-level breakpoints given their unique structures.
In addition, pursuant to the complex-wide fee arrangement, the fees of the funds in the Nuveen complex are generally reduced as the assets in the fund complex reach certain levels. The Funds, however, are not assessed a complex-level fee as this is assessed at the Nuveen underlying fund level. The Independent Board Members further recognized that the Funds nevertheless will benefit from reductions in complex-level fees and fund-level fees indirectly as the complex and Nuveen underlying funds reach breakpoint levels and reduce the fees of the Nuveen underlying funds.
Based on their review, the Independent Board Members concluded that the absence of a fund-level breakpoint schedule and of a complex-wide fee arrangement was acceptable.
E. Indirect Benefits
In evaluating fees, the Independent Board Members received and considered information regarding potential “fall out” or ancillary benefits the respective Fund Adviser or its affiliates may receive as a result of its relationship with each Fund. In this regard, the Independent Board Members considered, among other things, any sales charges, distribution fees and shareholder services fees received and retained by the Funds’ principal underwriter, an affiliate of the Advisor, which includes fees received pursuant to any 12b-1 plan. The Independent Board Members, therefore, considered the 12b-1 fees retained by Nuveen during the last calendar year.
In addition to the above, the Independent Board Members considered whether the Fund Advisers received any benefits from soft dollar arrangements whereby a portion of the commissions paid by a Fund for brokerage may be used to acquire research that may be useful to the Fund Adviser in managing the assets of the Funds and other clients. With respect to the Advisor, the Independent Board Members recognized that the Advisor has the authority to pay a higher commission in return for brokerage and research services if it determines in good faith that the commission paid is reasonable in relation to the value of the brokerage and research services provided. With respect to the Sub-Advisor, the Independent Board Members considered that the Sub-Advisor may benefit from its soft dollar arrangements pursuant to which it receives research from brokers that execute the applicable Fund’s portfolio transactions. The Independent Board Members noted that the Fund Advisers’ profitability may be somewhat lower if they did not receive the research services pursuant to the soft dollar arrangements and had to acquire such services directly.
Based on their review, the Independent Board Members concluded that any indirect benefits received by a Fund Adviser as a result of its relationship with the Funds were reasonable and within acceptable parameters.
F. Other Considerations
The Independent Board Members did not identify any single factor discussed previously as all-important or controlling. The Board Members, including the Independent Board Members, unanimously concluded that the terms of each Advisory Agreement are fair and reasonable, that the respective Fund Adviser’s fees are reasonable in light of the services provided to each Fund and that the Advisory Agreements be renewed.
| Nuveen Investments | 53 |
Glossary of Terms Used in this Report
Average Annual Total Return: This is a commonly used method to express an investment’s performance over a particular, usually multi-year time period. It expresses the return that would have been necessary each year to equal the investment’s actual cumulative performance (including change in NAV or offer price and reinvested dividends and capital gains distributions, if any) over the time period being considered.
Net Asset Value (NAV): A Fund’s NAV is the dollar value of one share in the Fund. It is calculated by subtracting the liabilities of the Fund from its total assets and then dividing the remainder by the number of shares outstanding. Fund NAVs are calculated at the end of each business day.
The Conservative Allocation Composite Index: is an index comprised of a 38% weighting in the S&P 500 Index, a 57% weighting in the Barclays Capital U.S. Aggregate Bond Index, and a 5% weighting in Citigroup 3-Month U.S. Treasury Bill Index. The composite returns assume reinvestment of dividends and do not reflect any applicable sales charges. You cannot invest directly in a composite.
The Growth Allocation Composite Index: is an index comprised of a 76% weighting in the S&P 500 Index, a 19% weighting in the Barclays Capital U.S. Aggregate Bond Index, and a 5% weighting in Citigroup 3-Month U.S. Treasury Bill Index. The composite returns assume reinvestment of dividends and do not reflect any applicable sales charges. You cannot invest directly in a composite.
The Lipper Mixed-Asset Target Allocation Conservative Funds Category Average: represents the average annualized total return for all the reporting funds in the Lipper Mixed Asset Target Allocation Conservative Funds category. The Category contained 446 funds during the 1-year period ended June 30, 2011. For more information about Lipper category averages, please see your Fund’s web page at www.nuveen.com.
The Lipper Mixed-Asset Target Allocation Growth Funds Category Average: represents the average annualized total return for all reporting funds in the Lipper Mixed Asset Target Allocation Growth Funds category. The Category contained 551 funds during the 1-year period ended June 30, 2011. For more information about Lipper category averages, please see your Fund’s web page at www.nuveen.com.
The Lipper Mixed-Asset Target Allocation Moderate Funds Category Average: represents the average annualized total return for all reporting funds in the Lipper Mixed Asset Target Allocation Moderate Funds category. The Category contained 482 funds during the 1-year period ended June 30, 2011. For more information about Lipper category averages, please see your Fund’s web page at www.nuveen.com.
The Moderate Allocation Composite Index: is an index comprised of a 57% weighting in the S&P 500 Index, a 38% weighting in the Barclays Capital U.S. Aggregate Bond Index, and a 5% weighting in Citigroup 3-Month U.S. Treasury Bill Index. The composite returns assume reinvestment of dividends and do not reflect any applicable sales charges. You cannot invest directly in a composite.
The S&P 500 Index: is an unmanaged index generally considered representative of the U.S. stock market. The index returns assume reinvestment of dividends, but do not reflect any applicable sales charges. You cannot invest directly in an index.
| 54 | Nuveen Investments |
Fund Manager
Nuveen Fund Advisors, Inc.
333 West Wacker Drive
Chicago, IL 60606
Sub-Adviser
Nuveen Investment Solutions, Inc.
333 West Wacker Drive
Chicago, IL 60606
Legal Counsel
Chapman and Cutler LLP
Chicago, IL
Independent Registered Public Accounting Firm
PricewaterhouseCoopers LLP
Chicago, IL
Custodian
State Street Bank & Trust Company
Boston, MA
Transfer Agent and Shareholder Services
Boston Financial
Data Services
Nuveen Investor Services
P.O. Box 8530
Boston, MA 02266-8530
(800) 257-8787
Distribution Information: The Funds hereby designate their percentages of dividends paid from net ordinary income as dividends qualifying for the 70% dividends received deduction (“DRD”) for corporations and their percentages as qualified dividend income (“QDI”) for individuals under Section 1 (h)(11) of the Internal Revenue Code as shown in the accompanying table. The actual qualified dividend income distributions will be reported to shareholders on Form 1099-DIV which will be sent to shareholders shortly after calendar year end.
| Fund | % of DRD | % of QDI | ||||||
Nuveen Growth Allocation Fund | 0.00% | 41.32% | ||||||
Nuveen Moderate Allocation Fund | 0.00% | 13.03% | ||||||
Nuveen Conservative Allocation Fund | 0.00% | 11.06% | ||||||
Quarterly Portfolio of Investments and Proxy Voting Information: You may obtain (i) each Fund’s quarterly portfolio of investments, (ii) information regarding how the Funds voted proxies relating to portfolio securities held during the most recent twelve-month period ended June 30, and (iii) a description of the policies and procedures that the Funds used to determine how to vote proxies relating to portfolio securities without charge, upon request, by calling Nuveen Investments at (800) 257-8787 or on Nuveen’s website at www.nuveen.com.
You may also obtain this and other Fund information directly from the Securities and Exchange Commission (SEC). The SEC may charge a copying fee for this information. Visit the SEC on-line at http://www.sec.gov or in person at the SEC’s Public Reference Room in Washington, D.C. Call the SEC at (202) 942-8090 for room hours and operation. You may also request Fund information by sending an e-mail request to publicinfo@sec.gov or by writing to the SEC’s Public Reference Section at 100 F Street NE, Washington, D.C. 20549.
The Financial Industry Regulatory Authority (FINRA) provides a Public Disclosure Program which supplies certain information regarding the disciplinary history of FINRA members and their associated persons in response to either telephone inquiries at (800) 289-9999 or written inquiries at www.finra.org. FINRA also provides an investor brochure that includes information describing the Public Disclosure Program.
| Nuveen Investments | 55 |
Nuveen Investments:
Serving Investors for Generations
Since 1898, financial advisors and their clients have relied on Nuveen Investments to provide dependable investment solutions through continued adherence to proven, long-term investing principles. Today, we offer a range of high quality equity and fixed-income solutions designed to be integral components of a well-diversified core portfolio.
Focused on meeting investor needs.
Nuveen Investments is a global investment management firm that seeks to help secure the long-term goals of institutions and high net worth investors as well as the consultants and financial advisors who serve them. We market our growing range of specialized investment solutions under the high-quality brands of HydePark, NWQ, Nuveen Asset Management, Santa Barbara, Symphony, Tradewinds and Winslow Capital. In total, Nuveen Investments managed approximately $210 billion of assets as of June 30, 2011.
Find out how we can help you.
To learn more about how the products and services of Nuveen Investments may be able to help you meet your financial goals, talk to your financial advisor, or call us at (800) 257-8787. Please read the information provided carefully before you invest. Investors should consider the investment objective and policies, risk considerations, charges and expenses of any investment carefully. Where applicable, be sure to obtain a prospectus, which contains this and other relevant information. To obtain a prospectus, please contact your securities representative or Nuveen Investments, 333 W. Wacker Dr., Chicago, IL 60606. Please read the prospectus carefully before you invest or send money.
Learn more about Nuveen Funds at: www.nuveen.com/mf
Nuveen makes things e-simple.
It only takes a minute to sign up for e-Reports. Once enrolled, you’ll receive an e-mail as soon as your Nuveen Fund information is ready — no more waiting for delivery by regular mail. Just click on the link within the e-mail to see the report and save it on your computer if you wish.
Free e-Reports right to your e-mail!
www.investordelivery.com
If you receive your Nuveen Fund distributions and statements from your financial advisor or brokerage account.
OR
www.nuveen.com/accountaccess
If you receive your Nuveen Fund distributions and statements directly from Nuveen.
Distributed by Nuveen Securities, LLC 333 West Wacker Drive Chicago, IL 60606 www.nuveen.com |
MAN-ALL0-0611P

Mutual Funds
Nuveen Equity Funds
Designed to provide capital appreciation and to enhance the risk/return
profile of the domestic equity portion of the Nuveen Asset Allocation Funds.
Annual Report
June 30, 2011
| Fund Name | ||||||||
Nuveen U.S. Equity Completeness Fund | ||||||||
INVESTMENT ADVISER NAME CHANGE
Effective January 1, 2011, Nuveen Asset Management, the Funds’ investment adviser, changed its name to Nuveen Fund Advisors, Inc. (“Nuveen Fund Advisors”). Concurrently, Nuveen Fund Advisors formed a wholly-owned subsidiary, Nuveen Asset Management, LLC, to house its portfolio management capabilities.
NUVEEN INVESTMENTS COMPLETES STRATEGIC COMBINATION WITH FAF ADVISORS
On December 31, 2010, Nuveen Investments completed the strategic combination between Nuveen Asset Management, the largest investment affiliate of Nuveen Investments, and FAF Advisors. As part of this transaction, U.S. Bancorp — the parent of FAF Advisors — received cash consideration and a 9.5% stake in Nuveen Investments in exchange for the long-term investment business of FAF Advisors, including investment-management responsibilities for the non-money market mutual funds of the First American Funds family.
The approximately $27 billion of mutual fund and institutional assets managed by FAF Advisors, along with the investment professionals managing these assets and other key personnel, have become part of Nuveen Asset Management, LLC. With these additions to Nuveen Asset Management, LLC, this affiliate now manages more than $100 billion of assets across a broad range of strategies from municipal and taxable fixed income to traditional and specialized equity investments.
This combination does not affect the investment objectives or strategies of the Funds in this report. Over time, Nuveen Investments expects that the combination will provide even more ways to meet the needs of investors who work with financial advisors and consultants by enhancing the multi-boutique model of Nuveen Investments, which also includes highly respected investment teams at HydePark, NWQ Investment Management, Santa Barbara Asset Management, Symphony Asset Management, Tradewinds Global Investors and Winslow Capital. Nuveen Investments managed approximately $210 billion of assets as of June 30, 2011.
| Must be preceded by or accompanied by a prospectus. | NOT FDIC INSURED | MAY LOSE VALUE | NO BANK GUARANTEE |
Table of Contents
| 4 | ||||
| 5 | ||||
| 8 | ||||
| 10 | ||||
| 11 | ||||
| 13 | ||||
| 49 | ||||
| 50 | ||||
| 51 | ||||
| 52 | ||||
| 54 | ||||
| 63 | ||||
| 70 | ||||
| 71 | ||||
Letter to Shareholders

Dear Shareholders,
The global economy continues to be weighed down by an unusual combination of pressures facing the larger developed economies. Japanese leaders continue to work through the economic aftereffects of the March 2011 earthquake and tsunami. Political leaders in Europe and the U.S. have resolved some of the near term fiscal problems, but the financial markets are not convinced that these leaders are able to address more complex longer term fiscal issues. Despite improved earnings and capital increases, the largest banks in these countries continue to be vulnerable to deteriorating mortgage portfolios and sovereign credit exposure, adding another source of uncertainty to the global financial system.
In the U.S., recent economic statistics indicate that the economic recovery may be losing momentum. Consumption, which represents about 70% of the gross domestic product, faces an array of challenges from seemingly intractable declines in housing values, increased energy costs and limited growth in the job market. The failure of Congress and the administration to agree on the debt ceiling increase on a timely basis and the deep divisions between the political parties over fashioning a balanced program to address growing fiscal imbalances that led to the recent S&P ratings downgrade add considerable uncertainty to the domestic economic picture.
On a more positive note, corporate earnings continue to hold up well and the municipal bond market is recovering from recent weakness as states and municipalities implement various programs to reduce their budgetary deficits. In addition, the Federal Reserve System has made it clear that it stands ready to take additional steps should the economic recovery falter. However, there are concerns that the Fed is approaching the limits of its resources to intervene in the economy.
These perplexing times highlight the importance of professional investment management. Your Nuveen investment team is working hard to develop an appropriate response to increased risk, and they continue to seek out opportunities created by stressful markets using proven investment disciplines designed to help your Fund achieve its investment objectives. On your behalf, we monitor their activities to assure that they maintain their investment disciplines.
As always, I encourage you to contact your financial consultant if you have any questions about your investment in a Nuveen Fund. On behalf of the other members of your Fund Board, we look forward to continuing to earn your trust in the months and years ahead.
Sincerely,

Robert P. Bremner
Chairman of the Board
August 23, 2011
| 4 | Nuveen Investments |
Certain statements in this report are forward-looking statements. Discussions of specific investments are for illustration only and are not intended as recommendations of individual investments. The forward-looking statements and other views expressed herein are those of the portfolio manager as of the date of this report. Actual future results or occurrences may differ significantly from those anticipated in any forward-looking statements and the views expressed herein are subject to change at any time, due to numerous market and other factors. The Fund disclaims any obligation to update publicly or revise any forward-looking statements or views expressed herein.
The Nuveen U.S. Equity Completeness Fund features management by Nuveen HydePark Group, LLC, an affiliate of Nuveen Investments. The Fund is managed by Keith Hembre, CFA, and Managing Director of Nuveen HydePark Group, LLC, and Nuveen Asset Management, LLC, also an affiliate of Nuveen Investments. We recently spoke with Keith about general market conditions, key investment strategies and the performance of the Fund for twelve-month period ended June 30, 2011.
How did the Fund perform during the twelve-months ended June 30, 2011?
The table in the Fund Performance and Expense Ratios section of this report provides total return performance information for the Fund for the one-year and since inception periods ended June 30, 2011. The table also compares the Fund’s performance to a general market index. A more detailed discussion of the Fund’s relative performance is provided later in this report.
What was the general market environment during the twelve-month reporting period?
The U.S. equity markets continued their solid appreciation during the year with the major large capitalization indices producing, double-digit gains for the period. The Russell 1000 Value and S&P 500 Indices have now appreciated over 90% from their March 2009 lows. While it still leaves those indices below their 2007 peak levels, bankruptcies and significant equity dilution for a multitude of corporations make those prior levels much more elevated than they may seem at first glance. Although current economic growth is positive and many companies continue to report better-than-expected earnings, very few of the structural imbalances facing the United States, or the global economy, have been addressed in a meaningful way.
The devastating earthquake/tsunami in Japan and political upheaval throughout the Middle East were dominant socio-political events during the year. Other major events impacting the markets included sovereign debt issuers (notably Greece), and discussions regarding the U. S. debt ceiling and the end of the Federal Reserve’s second quantitative easing initiative. Higher royalties/mineral taxes continue to be discussed globally. The debt of several European countries (Greece, Portugal) has been downgraded to below investment grade. While liquidity continues to be provided to these countries in exchange for agreeing to austerity measures, the ultimate capability to repay debts in full has not been determined.
What is the Fund’s investment strategy?
The Nuveen U.S. Equity Completeness Fund is designed to serve as an investment option for the Nuveen Asset Allocation Funds, helping them to offset the style risk that may exist
| Nuveen Investments | 5 |
between those Funds’ U.S. equity benchmark and the benchmarks of the Funds’ underlying equity managers.
The proprietary, risk-controlled HydePark wealth creation model continued to be used to manage the Fund during this period, as it has since the inception of the Fund. This model utilizes both fundamental and momentum-related criteria to create a portfolio designed to maximize the reward-to-risk ratio of the Fund’s holdings.
This investment process combines traditional, fundamental security valuation and quantitative risk-control techniques. The philosophy that underlies our value-added process is that a stock’s price must follow the wealth creation fundamentals of the company. A stock’s weight in the portfolio is directly related to its wealth creation fundamentals. Our process has five “wealth creation” factors. Four are fundamentally oriented — two are traditional measures of revenues versus excess of expenses (specifically, earnings and cash flow), and two are traditional measures of the uses for those monies (book value and dividends). The fifth factor is a proprietary measure of stock price momentum. Importantly, the process also considers a stock’s liquidity. Due to the quantitative, model-driven process, top-down macroeconomic “themes” do not influence the model or how we select stocks for the Fund.
The model evaluates all the securities contained in the benchmark portfolio (Russell 3000 Index) for possible inclusion in the Fund’s portfolio. The process will not consider a stock for possible inclusion if it is not contained in the Russell 3000 Index.
This process produces what HydePark believes is a well-diversified, efficient portfolio that attempts to perform within a specific, narrow tracking range (the degree of difference) versus the stated benchmark. The Fund’s portfolio typically contains a large number of holdings, with each relative weighting reflecting the five-dimensional view of that stock’s wealth creation characteristics. The portfolio is monitored daily with rebalances occurring quarterly.
How did this strategy influence performance?
Fund’s Class I Shares slightly underperformed the Russell 3000 Index during the reporting period.
The quantitative, risk-controlled process described above should, under normal circumstances, causes the Fund to track its benchmark portfolio closely, with value-added potential coming from our relative overweight or underweight of each stock versus the index. We attempt to express an overweight/underweight opinion on every stock in the benchmark based on our analysis of its five wealth creation factors.
The sum of the Fund’s individual security overweights and underweights versus the index is, by definition, equal to zero. However, the HydePark process does not constrain the portfolio to be industry or sector neutral relative to the benchmark. As a result, the Fund will sometimes overweight a sector because the stocks in that sector had what we judged to be attractive wealth creation fundamentals versus the benchmark. Performance for the portfolio can then be viewed in two parts: return attributable to the Fund’s sector weightings and return attributable to the performance of individual stocks within each sector.
| 6 | Nuveen Investments |
Consistent with its general strategy, the Fund generally emphasized more cyclical and “value” style sectors during the period. Energy, materials, industrials, consumer discretionary, financials, telecom services and utilities were overweighted. These emphases were counterbalanced via underweights to consumer staples, health care and information technology. The consumer discretionary overweight that averaged +2.3% versus the benchmark was the largest single sector overweight; it contributed positively to the Fund’s relative performance versus the Index. The largest single underweight was in health care, where the Fund was, on average, 2.4% underweight versus the Index. Overall, sector weightings were a negative to the Fund’s index-relative performance.
Performance attributable to within-sector stock selections was a positive during the reporting period. Stock selections within the consumer discretionary sector had the largest positive impact; holdings within the health care and energy sectors were also a positive for the Fund. Selections within the financials sector stood out as detracting from the Fund’s return relative to the Index.
Subsequent to the reporting period, the Board of Trustees approved the liquidation of the Fund upon the redemption of all shares held by other funds invested in the Fund.
RISK CONSIDERATIONS
Mutual fund investing involves risk; principal loss is possible. Equity investments are subject to market risk. Investments in small- and mid-cap companies are subject to greater volatility.
| Nuveen Investments | 7 |
Fund Performance and Expense Ratios (Unaudited)
Returns quoted represent past performance, which is no guarantee of future results. Current performance may be higher or lower than the performance shown. Investment returns and principal value will fluctuate so that when shares are redeemed, they may be worth more or less than their original cost. Returns do not reflect the deduction of taxes that a shareholder would pay on Fund distributions or the redemption of Fund shares.
Returns may reflect a contractual agreement between the Fund and the investment adviser to waive certain fees and expenses; see Notes to Financial Statements, Footnote 7 — Management Fees and Other Transactions with Affiliates for more information. In addition, returns may reflect a voluntary expense limitation by the Fund’s investment adviser that may be modified or discontinued at any time without notice. For the most recent month-end performance visit www.nuveen.com or call (800) 257-8787.
Fund returns assume reinvestment of dividends and capital gains. Shares have no sales charge and may only be purchased by the Nuveen Allocation Funds.
The expense ratios below reflect the Fund’s total operating expenses (before fee waivers or expense reimbursements, if any) as shown in the Fund’s most recent prospectus. The expense ratios include management fees and other fees and expenses.
Nuveen U.S. Equity Completeness Fund
Fund Performance
Average Annual Total Returns as of June 30, 2011
| Average Annual | ||||||||
| 1-Year | Since Inception* | |||||||
Class I Shares | 31.57% | 1.91% | ||||||
Russell 3000 Index** | 32.37% | 3.88% | ||||||
Expense Ratios
| Gross Expense Ratio | Net Expense Ratio | |||||
| 3.20% | .79% | |||||
The investment adviser has agreed to waive fees and reimburse expenses through October 31, 2011 so that total annual Fund operating expenses (excluding interest expenses, taxes, fees incurred in acquiring and disposing of portfolio securities and extraordinary expenses) do not exceed 0.80% (1.05% after October 31, 2011) of the average daily net assets. The expense limitation expiring October 31, 2011, may be terminated or modified prior to that date only with the approval of the Board of Trustees of the Fund. The expense limitation in effect thereafter may be terminated or modified only with the approval of shareholders of the Fund.
| * | Since inception returns are from 7/01/08; |
| ** | Refer to the Glossary of Terms Used in this Report for definitions. |
| 8 | Nuveen Investments |
Growth of an Assumed $10,000 Investment as of June 30, 2011
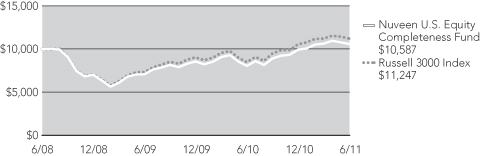
The graph does not reflect the deduction of taxes, such as state and local income taxes or capital gains taxes, that a shareholder may pay on Fund distributions or the redemption of Fund shares.
| Nuveen Investments | 9 |
Holding Summaries (Unaudited) as of June 30, 2011
This data relates to the securities held in the Fund’s portfolio of investments. It should not be construed as a measure of performance for the Fund itself.
Nuveen U.S. Equity Completeness Fund
Portfolio Allocation1

| Portfolio Composition1 | ||||
| Oil, Gas & Consumable Fuels | 10.4% | |||
| Computers & Peripherals | 4.2% | |||
| Semiconductors & Equipment | 3.8% | |||
Media | 3.8% | |||
| Insurance | 3.6% | |||
| Software | 3.3% | |||
| IT Services | 3.1% | |||
| Machinery | 2.8% | |||
| Pharmaceuticals | 2.8% | |||
| Commercial Banks | 2.8% | |||
| Chemicals | 2.7% | |||
| Specialty Retail | 2.5% | |||
| Energy Equipment & Services | 2.5% | |||
| Real Estate | 2.5% | |||
| Health Care Providers & Services | 2.4% | |||
| Hotels, Restaurants & Leisure | 2.3% | |||
| Aerospace & Defense | 2.3% | |||
| Capital Markets | 2.2% | |||
| Communications Equipment | 2.2% | |||
| Diversified Telecommunication Services | 2.0% | |||
| Industrial Conglomerates | 2.0% | |||
| Diversified Financial Services | 2.0% | |||
| Food & Staples Retailing | 1.8% | |||
| Metals & Mining | 1.7% | |||
| Electric Utilities | 1.7% | |||
| Health Care Equipment & Supplies | 1.5% | |||
| Food Products | 1.2% | |||
| Beverages | 1.2% | |||
| Short-Term Investments | 3.3% | |||
| Other | 19.4% | |||
| Top Five Common Stock Holdings2 | ||||
| Exxon Mobil Corporation | 3.4% | |||
| Apple, Inc. | 2.6% | |||
| International Business Machines Corporation (IBM) | 1.5% | |||
| Chevron Corporation | 1.4% | |||
| General Electric Company | 1.1% | |||
| 1 | As a percentage of total investments as of June 30, 2011. Holdings are subject to change. |
| 2 | As a percentage of total common stocks as of June 30, 2011. Holdings are subject to change. |
| 10 | Nuveen Investments |
As a shareholder of the Fund, you incur two types of costs: (1) transaction costs, including up-front and back-end sales charges (loads) or redemption fees, where applicable; and (2) ongoing costs, including management fees; distribution and service (12b-1) fees, where applicable; and other Fund expenses. The Example below is intended to help you understand your ongoing costs (in dollars) of investing in the Fund and to compare these costs with the ongoing costs of investing in other mutual funds.
The Example below is based on an investment of $1,000 invested at the beginning of the period and held for the period.
The information under “Actual Performance,” together with the amount you invested, allows you to estimate actual expenses incurred over the reporting period. Simply divide your account value by $1,000 (for example, an $8,600 account value divided by $1,000 = 8.60) and multiply the result by the cost shown for your share class, in the row entitled “Expenses Incurred During Period” to estimate the expenses incurred on your account during this period.
The information under “Hypothetical Performance,” provides information about hypothetical account values and hypothetical expenses based on the Fund’s actual expense ratio and an assumed rate of return of 5% per year before expenses, which is not the Fund’s actual return. The hypothetical account values and expenses may not be used to estimate the actual ending account balance or expense you incurred for the period. You may use this information to compare the ongoing costs of investing in the Fund and other Funds. To do so, compare this 5% hypothetical example with the 5% hypothetical examples that appear in the shareholder reports of the other funds.
Please note that the expenses shown in the table are meant to highlight your ongoing costs only and do not reflect any transaction costs. Therefore, the hypothetical information is useful in comparing ongoing costs only, and will not help you determine the relative total costs of owning different funds. In addition, if these transaction costs were included, your costs would have been higher.
Nuveen U.S. Equity Completeness Fund
| Hypothetical Performance | ||||||||
Actual Performance | (5% annualized return before expenses) | |||||||
| Beginning Account Value (1/01/11) | $ | 1,000.00 | $ | 1,000.00 | ||||
| Ending Account Value (6/30/11) | $ | 1,064.20 | $ | 1,020.93 | ||||
| Expenses Incurred During Period | $ | 3.99 | $ | 3.91 | ||||
Expenses are equal to the Fund’s annualized net expense ratio of .78% multiplied by the average account value over the period, multiplied by 181/365 (to reflect the one-half year period)
| Nuveen Investments | 11 |
Independent Registered
Public Accounting Firm
To the Board of Trustees and Shareholders of
Nuveen Investment Trust:
In our opinion, the accompanying statement of assets and liabilities, including the portfolio of investments, and the related statements of operations, of changes in net assets and the financial highlights present fairly, in all material respects, the financial position of Nuveen U.S. Equity Completeness Fund (a series of the Nuveen Investment Trust, hereafter referred to as the “Fund”) at June 30, 2011, the results of its operations, the changes in its net assets for each of the two years in the period then ended and the financial highlights for each of the periods presented in conformity with accounting principles generally accepted in the United States of America. These financial statements and financial highlights (hereafter referred to as “financial statements”) are the responsibility of the Fund’s management; our responsibility is to express an opinion on these financial statements based on our audit. We conducted our audit of these financial statements in accordance with the standards of the Public Company Accounting Oversight Board (United States). Those standards require that we plan and perform the audit to obtain reasonable assurance about whether the financial statements are free of material misstatement. An audit includes examining, on a test basis, evidence supporting the amounts and disclosures in the financial statements, assessing the accounting principles used and significant estimates made by management, and evaluating the overall financial statement presentation. We believe that our audit, which included confirmation of securities at June 30, 2011 by correspondence with the custodian and brokers, provides a reasonable basis for our opinion.
PRICEWATERHOUSECOOPERS LLP
Chicago, IL
August 26, 2011
| 12 | Nuveen Investments |
Nuveen U.S. Equity Completeness Fund
June 30, 2011
| Shares | Description (1) | Value | ||||||||||||
COMMON STOCKS – 100.1% | ||||||||||||||
Aerospace & Defense – 2.3% | ||||||||||||||
| 10 | AAR Corporation | $ | 271 | |||||||||||
| 50 | Aerovironment, Inc. | 1,768 | ||||||||||||
| 10 | Alliant Techsystems Inc. | 713 | ||||||||||||
| 210 | Boeing Company | 15,525 | ||||||||||||
| 20 | Ceradyne Inc. | 780 | ||||||||||||
| 80 | Cubic Corporation | 4,079 | ||||||||||||
| 10 | Digitalglobe Inc., (2) | 254 | ||||||||||||
| 40 | Esterline Technologies Corporation, (2) | 3,056 | ||||||||||||
| 80 | General Dynamics Corporation | 5,962 | ||||||||||||
| 30 | GeoEye, Inc., (2) | 1,122 | ||||||||||||
| 10 | Goodrich Corporation | 955 | ||||||||||||
| 50 | Heico Corporation | 2,737 | ||||||||||||
| 120 | Hexcel Corporation, (2) | 2,627 | ||||||||||||
| 480 | Honeywell International Inc. | 28,603 | ||||||||||||
| 20 | ITT Industries, Inc. | 1,179 | ||||||||||||
| 40 | Kratos Defence & Security Solutions Inc. | 486 | ||||||||||||
| 70 | L-3 Communications Holdings, Inc. | 6,122 | ||||||||||||
| 180 | Lockheed Martin Corporation | 14,575 | ||||||||||||
| 50 | Moog Inc., CLass A Shares, (2) | 2,176 | ||||||||||||
| 20 | National Presto Industries Inc. | 2,030 | ||||||||||||
| 110 | Northrop Grumman Corporation | 7,629 | ||||||||||||
| 30 | Precision Castparts Corporation | 4,940 | ||||||||||||
| 90 | Raytheon Company | 4,487 | ||||||||||||
| 80 | Rockwell Collins, Inc. | 4,935 | ||||||||||||
| 20 | Spirit AeroSystems Holdings Inc., (2) | 440 | ||||||||||||
| 70 | Teledyne Technologies Inc., (2) | 3,525 | ||||||||||||
| 260 | Textron Inc. | 6,139 | ||||||||||||
| 470 | United Technologies Corporation | 41,600 | ||||||||||||
Total Aerospace & Defense | 168,715 | |||||||||||||
Air Freight & Logistics – 0.5% | ||||||||||||||
| 40 | Atlas Air Worldwide Holdings Inc. | 2,380 | ||||||||||||
| 40 | C.H. Robinson Worldwide, Inc. | 3,154 | ||||||||||||
| 40 | Expeditors International of Washington, Inc. | 2,048 | ||||||||||||
| 150 | FedEx Corporation | 14,228 | ||||||||||||
| 10 | Hub Group, Inc., (2) | 377 | ||||||||||||
| 200 | United Parcel Service, Inc., Class B | 14,586 | ||||||||||||
Total Air Freight & Logistics | 36,773 | |||||||||||||
Airlines – 0.6% | ||||||||||||||
| 10 | Copa Holdings SA | 667 | ||||||||||||
| 1,290 | Delta Air Lines, Inc., (2) | 11,829 | ||||||||||||
| 270 | JetBlue Airways Corporation | 1,647 | ||||||||||||
| 50 | Republic Airways Holdings, Inc., (2) | 273 | ||||||||||||
| 20 | Skywest Inc. | 301 | ||||||||||||
| 280 | Southwest Airlines Co. | 3,198 | ||||||||||||
| 960 | United Continental Holdings Inc. | 21,725 | ||||||||||||
Total Airlines | 39,640 | |||||||||||||
| Nuveen Investments | 13 |
Portfolio of Investments
Nuveen U.S. Equity Completeness Fund (continued)
June 30, 2011
| Shares | Description (1) | Value | ||||||||||||
Auto Components – 0.8% | ||||||||||||||
| 180 | BorgWarner Inc., (2) | $ | 14,542 | |||||||||||
| 840 | Dana Holding Corporation, (2) | 15,372 | ||||||||||||
| 20 | Dorman Products, Inc. (2) | 792 | ||||||||||||
| 220 | Exide Technologies (2) | 1,681 | ||||||||||||
| 80 | Fuel Systems Solutions, Inc. | 1,996 | ||||||||||||
| 280 | Johnson Controls, Inc. | 11,665 | ||||||||||||
| 390 | Spartan Motors, Inc. | 2,106 | ||||||||||||
| 110 | Tenneco Inc. | 4,848 | ||||||||||||
| 60 | TRW Automotive Holdings Corporation, (2) | 3,542 | ||||||||||||
Total Auto Components | 56,544 | |||||||||||||
Automobiles – 0.6% | ||||||||||||||
| 2,510 | Ford Motor Company, (2) | 34,613 | ||||||||||||
| 110 | Harley-Davidson, Inc. | 4,507 | ||||||||||||
| 250 | Winnebago Industries Inc. | 2,415 | ||||||||||||
Total Automobiles | 41,535 | |||||||||||||
Beverages – 1.2% | ||||||||||||||
| 10 | Boston Beer Company | 896 | ||||||||||||
| 140 | Coca Cola Enterprises Inc. | 4,085 | ||||||||||||
| 750 | Coca-Cola Company | 50,468 | ||||||||||||
| 40 | Dr. Pepper Snapple Group | 1,677 | ||||||||||||
| 120 | Molson Coors Brewing Company, Class B | 5,369 | ||||||||||||
| 360 | PepsiCo, Inc. | 25,355 | ||||||||||||
Total Beverages | 87,850 | |||||||||||||
Biotechnology – 0.9% | ||||||||||||||
| 80 | Alexion Pharmaceuticals Inc., (2) | 3,762 | ||||||||||||
| 70 | Alkermes Inc., (2) | 1,302 | ||||||||||||
| 350 | Allos Therapeutics, Inc., (2) | 749 | ||||||||||||
| 70 | Alnylam Pharmaceuticals, Inc., (2) | 656 | ||||||||||||
| 130 | Amgen Inc., (2) | 7,586 | ||||||||||||
| 230 | Amylin Pharmaceuticals Inc., (2) | 3,073 | ||||||||||||
| 40 | Ardea Biosciences Inc., (2) | 1,018 | ||||||||||||
| 140 | Ariad Pharmaceuticals, Inc. | 1,586 | ||||||||||||
| 90 | ArQule Inc. | 563 | ||||||||||||
| 30 | Biogen Idec Inc., (2) | 3,208 | ||||||||||||
| 90 | BioMarin Pharmaceutical Inc., (2) | 2,449 | ||||||||||||
| 10 | Biomimetic Therapeutics, Inc., (2) | 51 | ||||||||||||
| 10 | Cephalon, Inc., (2) | 799 | ||||||||||||
| 110 | Cepheid, Inc., (2) | 3,810 | ||||||||||||
| 70 | Cubist Pharmaceuticals Inc., (2) | 2,519 | ||||||||||||
| 90 | Emergent BioSolutions, Inc., (2) | 2,030 | ||||||||||||
| 180 | Exelixis, Inc., (2) | 1,613 | ||||||||||||
| 60 | Genomic Health, Inc. | 1,675 | ||||||||||||
| 110 | Gilead Sciences, Inc., (2) | 4,555 | ||||||||||||
| 90 | Halozyme Therapeutics, Inc. | 622 | ||||||||||||
| 120 | Immunogen, Inc., (2) | 1,463 | ||||||||||||
| 14 | Nuveen Investments |
| Shares | Description (1) | Value | ||||||||||||
Biotechnology (continued) | ||||||||||||||
| 80 | Immunomedics, Inc. | $ | 326 | |||||||||||
| 60 | Incyte Pharmaceuticals Inc., (2) | 1,136 | ||||||||||||
| 150 | Intermune, Inc., (2) | 5,378 | ||||||||||||
| 90 | ISIS Pharmaceuticals, Inc., (2) | 824 | ||||||||||||
| 90 | Keryx Biopharmaceuticals, Inc. | 426 | ||||||||||||
| 110 | Micromet, Inc. | 631 | ||||||||||||
| 40 | Myriad Genentics Inc., (2) | 908 | ||||||||||||
| 130 | Novavax, Inc., (2) | 263 | ||||||||||||
| 80 | NPS Pharmaceuticals, Inc. | 756 | ||||||||||||
| 50 | Onyx Pharmaceuticals Inc., (2) | 1,765 | ||||||||||||
| 50 | Rigel Pharmaceuticals, Inc., (2) | 459 | ||||||||||||
| 70 | Seattle Genetics, Inc., (2) | 1,436 | ||||||||||||
| 80 | SIGA Technologies, Inc., (2) | 779 | ||||||||||||
| 10 | Targacept, Inc. | 211 | ||||||||||||
| 140 | Theravance Inc., (2) | 3,109 | ||||||||||||
| 10 | Vertex Pharmaceuticals Inc., (2) | 520 | ||||||||||||
| 130 | ZIOPHARM Oncology, Inc. | 796 | ||||||||||||
Total Biotechnology | 64,812 | |||||||||||||
Building Products – 0.1% | ||||||||||||||
| 90 | Aaon, Inc. | 1,966 | ||||||||||||
| 80 | Apogee Enterprises, Inc. | 1,025 | ||||||||||||
| 50 | Gibraltar Industries Inc., (2) | 566 | ||||||||||||
| 10 | Masco Corporation | 120 | ||||||||||||
| 30 | Simpson Manufacturing Company Inc. | 896 | ||||||||||||
| 10 | Smith AO Corporation | 423 | ||||||||||||
| 90 | USG Corporation, (2) | 1,291 | ||||||||||||
Total Building Products | 6,287 | |||||||||||||
Capital Markets – 2.3% | ||||||||||||||
| 20 | Affiliated Managers Group Inc., (2) | 2,029 | ||||||||||||
| 690 | American Capital Limited, (2) | 6,852 | ||||||||||||
| 240 | Ameriprise Financial, Inc. | 13,843 | ||||||||||||
| 380 | Bank of New York Company, Inc. | 9,736 | ||||||||||||
| 10 | BlackRock Inc. | 1,918 | ||||||||||||
| 130 | Charles Schwab Corporation | 2,139 | ||||||||||||
| 70 | Cohen & Steers Inc. | 2,321 | ||||||||||||
| 30 | Duff & Phelps Corporation, Class A | 385 | ||||||||||||
| 40 | E*Trade Group Inc., (2) | 552 | ||||||||||||
| 10 | Eaton Vance Corporation | 302 | ||||||||||||
| 20 | Epoch Holding Corporation | 357 | ||||||||||||
| 70 | Federated Investors Inc. | 1,669 | ||||||||||||
| 100 | Franklin Resources, Inc. | 13,129 | ||||||||||||
| 200 | GFI Group, Inc. | 918 | ||||||||||||
| 330 | Goldman Sachs Group, Inc. | 43,920 | ||||||||||||
| 200 | Invesco LTD | 4,680 | ||||||||||||
| 10 | Investment Technology Group, (2) | 140 | ||||||||||||
| Nuveen Investments | 15 |
Portfolio of Investments
Nuveen U.S. Equity Completeness Fund (continued)
June 30, 2011
| Shares | Description (1) | Value | ||||||||||||
Capital Markets (continued) | ||||||||||||||
| 70 | Janus Capital Group Inc. | $ | 661 | |||||||||||
| 10 | Jefferies Group, Inc. | 204 | ||||||||||||
| 190 | Knight Trading Group Inc., (2) | 2,094 | ||||||||||||
| 20 | Lazard Limited | 742 | ||||||||||||
| 20 | Legg Mason, Inc. | 655 | ||||||||||||
| 40 | Main Street Capital Corporation | 758 | ||||||||||||
| 1,070 | Morgan Stanley | 24,621 | ||||||||||||
| 220 | NGP Capital Resources Company | 1,804 | ||||||||||||
| 50 | Northern Trust Corporation | 2,298 | ||||||||||||
| 120 | OptionsXpress Holdings Inc., (2) | 2,002 | ||||||||||||
| 130 | Pennantpark Investment Corporation | 1,457 | ||||||||||||
| 30 | Piper Jaffray Companies, (2) | 864 | ||||||||||||
| 40 | Raymond James Financial Inc. | 1,286 | ||||||||||||
| 100 | SEI Investments Company | 2,251 | ||||||||||||
| 150 | State Street Corporation | 6,764 | ||||||||||||
| 70 | Stifel Financial Corporation, (2) | 2,510 | ||||||||||||
| 80 | T. Rowe Price Group Inc. | 4,827 | ||||||||||||
| 50 | Waddell & Reed Financial, Inc., Class A | 1,818 | ||||||||||||
Total Capital Markets | 162,506 | |||||||||||||
Chemicals – 2.8% | ||||||||||||||
| 50 | A Schulman, Inc. | 1,260 | ||||||||||||
| 160 | Air Products & Chemicals Inc. | 15,293 | ||||||||||||
| 20 | Airgas, Inc. | 1,401 | ||||||||||||
| 90 | Albemarle Corporation | 6,228 | ||||||||||||
| 20 | Arch Chemicals Inc. | 689 | ||||||||||||
| 60 | Ashland Inc. | 3,877 | ||||||||||||
| 10 | Balchem Corporation | 438 | ||||||||||||
| 80 | Cabot Corporation | 3,190 | ||||||||||||
| 120 | Celanese Corporation, Series A | 6,397 | ||||||||||||
| 30 | CF Industries Holdings, Inc. | 4,250 | ||||||||||||
| 20 | Cytec Industries, Inc. | 1,144 | ||||||||||||
| 300 | Dow Chemical Company | 10,800 | ||||||||||||
| 630 | E.I. Du Pont de Nemours and Company | 34,052 | ||||||||||||
| 10 | Eastman Chemical Company | 1,021 | ||||||||||||
| 40 | Ecolab Inc. | 2,255 | ||||||||||||
| 200 | Ferro Corporation (2) | 2,688 | ||||||||||||
| 20 | H.B. Fuller Company | 488 | ||||||||||||
| 130 | Huntsman Corporation | 2,451 | ||||||||||||
| 30 | International Flavors & Fragrances Inc. | 1,927 | ||||||||||||
| 10 | Interpid Potash Inc., (2) | 325 | ||||||||||||
| 20 | Koppers Holdings Inc. | 759 | ||||||||||||
| 50 | LSB Industries Inc. | 2,146 | ||||||||||||
| 30 | Lubrizol Corporation | 4,028 | ||||||||||||
| 10 | Minerals Technologies Inc. | 663 | ||||||||||||
| 140 | Monsanto Company | 10,156 | ||||||||||||
| 16 | Nuveen Investments |
| Shares | Description (1) | Value | ||||||||||||
Chemicals (continued) | ||||||||||||||
| 200 | Mosaic Company | $ | 13,546 | |||||||||||
| 20 | NewMarket Corporation | 3,414 | ||||||||||||
| 70 | Olin Corporation | 1,586 | ||||||||||||
| 50 | OM Group Inc. | 2,032 | ||||||||||||
| 130 | OMNOVA Solutions Inc., (2) | 905 | ||||||||||||
| 170 | PolyOne Corporation, (2) | 2,630 | ||||||||||||
| 60 | PPG Industries, Inc. | 5,447 | ||||||||||||
| 110 | Praxair, Inc. | 11,923 | ||||||||||||
| 210 | Rockwood Holdings Inc., (2) | 11,611 | ||||||||||||
| 280 | Senomyx, Inc. | 1,439 | ||||||||||||
| 80 | Sensient Technologies Corporation | 2,966 | ||||||||||||
| 30 | Sherwin-Williams Company | 2,516 | ||||||||||||
| 70 | Sigma-Aldrich Corporation | 5,137 | ||||||||||||
| 220 | Solutia Inc., (2) | 5,027 | ||||||||||||
| 90 | Valspar Corporation | 3,245 | ||||||||||||
| 100 | WR Grace & Company, (2) | 4,563 | ||||||||||||
| 30 | Zep Inc. | 567 | ||||||||||||
| 110 | Zoltek Companies, Inc. | 1,158 | ||||||||||||
Total Chemicals | 197,638 | |||||||||||||
Commercial Banks – 2.9% | ||||||||||||||
| 20 | Ameris Bancorp. | 177 | ||||||||||||
| 50 | Arrow Financial Corporation | 1,224 | ||||||||||||
| 30 | BancFirst Corporation | 1,158 | ||||||||||||
| 40 | Bank of Hawaii Corporation | 1,861 | ||||||||||||
| 30 | Bank of the Ozarks, Inc. | 1,562 | ||||||||||||
| 210 | BB&T Corporation | 5,636 | ||||||||||||
| 50 | BOK Financial Corporation | 2,739 | ||||||||||||
| 160 | Boston Private Financial Holdings Inc. | 1,053 | ||||||||||||
| 160 | Cathay General Bancorp. | 2,622 | ||||||||||||
| 20 | Chemical Financial Corporation | 375 | ||||||||||||
| 40 | CIT Group Inc., (2) | 1,770 | ||||||||||||
| 40 | City Holding Company | 1,321 | ||||||||||||
| 140 | Comerica Incorporated | 4,840 | ||||||||||||
| 80 | Commerce Bancshares Inc. | 3,440 | ||||||||||||
| 20 | Community Bank System Inc. | 496 | ||||||||||||
| 20 | Community Trust Bancorp, Inc. | 554 | ||||||||||||
| 150 | Danvers Bancorp Inc. | 3,266 | ||||||||||||
| 360 | East West Bancorp Inc. | 7,276 | ||||||||||||
| 260 | F.N.B. Corporation PA | 2,691 | ||||||||||||
| 860 | Fifth Third Bancorp. | 10,965 | ||||||||||||
| 300 | First Busey Corporation | 1,587 | ||||||||||||
| 280 | First Commonwealth Financial Corporation | 1,607 | ||||||||||||
| 110 | First Financial Bancorp. | 1,836 | ||||||||||||
| 50 | First Financial Bankshares, Inc. | 1,723 | ||||||||||||
| 310 | First Horizon National Corporation, (2) | 2,957 | ||||||||||||
| 20 | First Midwest Bancorp, Inc. | 246 | ||||||||||||
| Nuveen Investments | 17 |
Portfolio of Investments
Nuveen U.S. Equity Completeness Fund (continued)
June 30, 2011
| Shares | Description (1) | Value | ||||||||||||
Commercial Banks (continued) | ||||||||||||||
| 60 | FirstMerit Corporation | $ | 991 | |||||||||||
| 50 | Great Southern Bancorp. | 948 | ||||||||||||
| 20 | Hancock Holding Company | 620 | ||||||||||||
| 20 | Home Bancshares, Inc. | 473 | ||||||||||||
| 330 | Huntington BancShares Inc. | 2,165 | ||||||||||||
| 50 | IberiaBank Corporation | 2,882 | ||||||||||||
| 20 | Independent Bank Corporation | 525 | ||||||||||||
| 70 | International Bancshares Corporation | 1,171 | ||||||||||||
| 30 | Investors Bancorp, Inc. | 426 | ||||||||||||
| 500 | KeyCorp. | 4,165 | ||||||||||||
| 250 | Lakeland Bancorp, Inc. | 2,495 | ||||||||||||
| 10 | M&T Bank Corporation | 880 | ||||||||||||
| 120 | Marshall and Ilsley Corporation | 956 | ||||||||||||
| 50 | MB Financial, Inc. | 962 | ||||||||||||
| 60 | Nara Bancorp, Inc. | 488 | ||||||||||||
| 160 | National Penn Bancshares, Inc. | 1,269 | ||||||||||||
| 100 | NBT Bancorp, Inc. | 2,213 | ||||||||||||
| 90 | Old National Bancorp. | 972 | ||||||||||||
| 30 | Oriental Financial Group Inc. | 387 | ||||||||||||
| 40 | Pinnacle Financial Partners, Inc., (2) | 622 | ||||||||||||
| 220 | PNC Financial Services Group, Inc. | 13,114 | ||||||||||||
| 90 | Prosperity Bancshares, Inc. | 3,944 | ||||||||||||
| 310 | Regions Financial Corporation | 1,922 | ||||||||||||
| 30 | S&T Bancorp, Inc. | 558 | ||||||||||||
| 20 | Sandy Spring Bancorp, Inc. | 360 | ||||||||||||
| 10 | SCBT Financial Corporation | 287 | ||||||||||||
| 60 | Signature Bank, (2) | 3,432 | ||||||||||||
| 40 | Simmons First National Corporation | 1,026 | ||||||||||||
| 100 | StellarOne Corporation | 1,211 | ||||||||||||
| 10 | Suffolk Bancorp. | 140 | ||||||||||||
| 120 | SunTrust Banks, Inc. | 3,096 | ||||||||||||
| 220 | Susquehanna Bancshs Inc. | 1,760 | ||||||||||||
| 30 | SVB Financial Group, (2) | 1,791 | ||||||||||||
| 90 | TCF Financial Corporation | 1,242 | ||||||||||||
| 50 | Texas Capital BancShares, Inc., (2) | 1,292 | ||||||||||||
| 10 | Tompkins Financial Corporation | 392 | ||||||||||||
| 80 | Trustmark Corporation | 1,873 | ||||||||||||
| 520 | U.S. Bancorp | 13,265 | ||||||||||||
| 40 | UMB Financial Corporation | 1,675 | ||||||||||||
| 130 | Umpqua Holdings Corporation | 1,504 | ||||||||||||
| 110 | Union First Market Bankshares Corporation | 1,340 | ||||||||||||
| 50 | United Bankshares, Inc. | 1,224 | ||||||||||||
| 100 | Washington Trust Bancorp, Inc. | 2,297 | ||||||||||||
| 140 | Webster Financial Corporation | 2,943 | ||||||||||||
| 1,440 | Wells Fargo & Company | 40,406 | ||||||||||||
| 18 | Nuveen Investments |
| Shares | Description (1) | Value | ||||||||||||
Commercial Banks (continued) | ||||||||||||||
| 30 | WesBanco, Inc. | $ | 590 | |||||||||||
| 50 | Westamerica Bancorp. | 2,463 | ||||||||||||
| 150 | Western Alliance Bancorporation, (2) | 1,065 | ||||||||||||
| 40 | Wintrust Financial Corporation | 1,287 | ||||||||||||
| 280 | Zions Bancorporation | 6,723 | ||||||||||||
Total Commercial Banks | 204,814 | |||||||||||||
Commercial Services & Supplies – 0.8% | ||||||||||||||
| 70 | ABM Industries Inc. | 1,634 | ||||||||||||
| 60 | Acco Brands Corporation | 471 | ||||||||||||
| 50 | American Reprographics Co, (2) | 354 | ||||||||||||
| 70 | Avery Dennison Corporation | 2,704 | ||||||||||||
| 80 | Brinks Company | 2,386 | ||||||||||||
| 100 | Cintas Corporation | 3,303 | ||||||||||||
| 10 | Clean Harbors, Inc., (2) | 1,033 | ||||||||||||
| 20 | Copart Inc., (2) | 932 | ||||||||||||
| 10 | Corrections Corporation of America, (2) | 217 | ||||||||||||
| 10 | Covanta Holding Corporation | 165 | ||||||||||||
| 180 | Deluxe Corporation | 4,448 | ||||||||||||
| 130 | EnergySolutions Inc. | 642 | ||||||||||||
| 170 | Geo Group Inc., (2) | 3,915 | ||||||||||||
| 80 | Healthcare Services Group, Inc. | 1,300 | ||||||||||||
| 120 | HNI Corporation | 3,014 | ||||||||||||
| 120 | Iron Mountain Inc. | 4,091 | ||||||||||||
| 100 | Mine Safety Appliances Company | 3,734 | ||||||||||||
| 30 | Mobile Mini, Inc. | 636 | ||||||||||||
| 60 | R.R. Donnelley & Sons Company | 1,177 | ||||||||||||
| 50 | Republic Services, Inc. | 1,543 | ||||||||||||
| 80 | Stericycle Inc., (2) | 7,130 | ||||||||||||
| 70 | Viad Corporation | 1,560 | ||||||||||||
| 310 | Waste Management, Inc. | 11,554 | ||||||||||||
Total Commercial Services & Supplies | 57,943 | |||||||||||||
Communications Equipment – 2.3% | ||||||||||||||
| 180 | Acme Packet, Inc. | 12,623 | ||||||||||||
| 130 | ADTRAN, Inc. | 5,032 | ||||||||||||
| 180 | Aruba Networks, Inc., (2) | 5,319 | ||||||||||||
| 150 | Aviat Networks Inc., (2) | 591 | ||||||||||||
| 20 | Blue Coat Systems Inc., (2) | 437 | ||||||||||||
| 140 | Ciena Corporation, (2) | 2,573 | ||||||||||||
| 840 | Cisco Systems, Inc., (2) | 13,112 | ||||||||||||
| 60 | Comtech Telecom Corporation, (2) | 1,682 | ||||||||||||
| 30 | Digi International, Inc., (2) | 390 | ||||||||||||
| 80 | EMS Tech Inc., (2) | 2,638 | ||||||||||||
| 10 | Emulex Corporation, (2) | 86 | ||||||||||||
| 920 | Extreme Networks Inc., (2) | 2,981 | ||||||||||||
| 120 | F5 Networks, Inc., (2) | 13,230 | ||||||||||||
| Nuveen Investments | 19 |
Portfolio of Investments
Nuveen U.S. Equity Completeness Fund (continued)
June 30, 2011
| Shares | Description (1) | Value | ||||||||||||
Communications Equipment (continued) | ||||||||||||||
| 340 | Finisar Corporation | $ | 6,130 | |||||||||||
| 110 | Harmonic Inc., (2) | 795 | ||||||||||||
| 50 | Harris Corporation | 2,253 | ||||||||||||
| 140 | Interdigital Inc., (2) | 5,719 | ||||||||||||
| 160 | JDS Uniphase Corporation, (2) | 2,666 | ||||||||||||
| 220 | Juniper Networks Inc., (2) | 6,930 | ||||||||||||
| 60 | Motorola Solutions Inc. | 2,762 | ||||||||||||
| 130 | Netgear, Inc., (2) | 5,684 | ||||||||||||
| 10 | Oplink Communications, Inc., (2) | 186 | ||||||||||||
| 60 | Plantronics Inc. | 2,192 | ||||||||||||
| 1,040 | Powerwave Technologies Inc. | 3,068 | ||||||||||||
| 840 | QUALCOMM, Inc. | 47,704 | ||||||||||||
| 350 | Riverbed Technology, Inc., (2) | 13,857 | ||||||||||||
| 50 | Symmetricom Inc., (2) | 292 | ||||||||||||
| 110 | UTStarCom Holdings Corporation | 172 | ||||||||||||
| 10 | ViaSat, Inc., (2) | 433 | ||||||||||||
Total Communications Equipment | 161,537 | |||||||||||||
Computers & Peripherals – 4.3% | ||||||||||||||
| 550 | Apple, Inc., (2) | 184,619 | ||||||||||||
| 110 | Avid Technology Inc. | 2,072 | ||||||||||||
| 370 | Cray, Inc. | 2,368 | ||||||||||||
| 810 | Dell Inc., (2) | 13,503 | ||||||||||||
| 30 | Electronics For Imaging, (2) | 517 | ||||||||||||
| 1,250 | EMC Corporation, (2) | 34,438 | ||||||||||||
| 660 | Hewlett-Packard Company | 24,024 | ||||||||||||
| 160 | Hypercom Corporation | 1,573 | ||||||||||||
| 90 | Intermec Inc, (2) | 994 | ||||||||||||
| 40 | Intevac, Inc. (2) | 408 | ||||||||||||
| 120 | Lexmark International, Inc., Class A, (2) | 3,511 | ||||||||||||
| 310 | Network Appliance Inc., (2) | 16,362 | ||||||||||||
| 10 | Novatel Wireless, (2) | 55 | ||||||||||||
| 30 | Quantum Corporation, (2) | 99 | ||||||||||||
| 440 | SanDisk Corporation, (2) | 18,260 | ||||||||||||
| 100 | Seagate Technology, (2) | 1,616 | ||||||||||||
| 10 | Stratasys, Inc., (2) | 337 | ||||||||||||
| 40 | Synaptics, Inc., (2) | 1,030 | ||||||||||||
| 100 | Western Digital Corporation, (2) | 3,638 | ||||||||||||
| 160 | Xyratex Limited | 1,642 | ||||||||||||
Total Computers & Peripherals | 311,066 | |||||||||||||
Construction & Engineering – 0.2% | ||||||||||||||
| 20 | AECOM Technology Corporation, (2) | 547 | ||||||||||||
| 20 | Chicago Bridge & Iron Company N.V., (2) | 778 | ||||||||||||
| 60 | Emcor Group Inc., (2) | 1,759 | ||||||||||||
| 20 | Fluor Corporation | 1,293 | ||||||||||||
| 80 | Granite Construction Inc. | 1,962 | ||||||||||||
| 20 | Nuveen Investments |
| Shares | Description (1) | Value | ||||||||||||
Construction & Engineering (continued) | ||||||||||||||
| 130 | Great Lakes Dredge & Dock Corporation | $ | 725 | |||||||||||
| 20 | Jacobs Engineering Group, Inc., (2) | 865 | ||||||||||||
| 50 | KBR Inc. | 1,885 | ||||||||||||
| 20 | Orion Marine Group Inc., (2) | 188 | ||||||||||||
| 20 | Quanta Services Incorporated, (2) | 404 | ||||||||||||
| 130 | URS Corporation, (2) | 5,816 | ||||||||||||
Total Construction & Engineering | 16,222 | |||||||||||||
Construction Materials – 0.0% | ||||||||||||||
| 10 | Texas Industries Inc. | 416 | ||||||||||||
| 10 | Vulcan Materials Company | 385 | ||||||||||||
Total Construction Materials | 801 | |||||||||||||
Consumer Finance – 0.7% | ||||||||||||||
| 350 | Advance America Cash Advance Centers Inc | 2,412 | ||||||||||||
| 460 | American Express Company | 23,782 | ||||||||||||
| 260 | Capital One Financial Corporation | 13,434 | ||||||||||||
| 10 | Credit Acceptance Corporation (2) | 845 | ||||||||||||
| 110 | Discover Financial Services | 2,943 | ||||||||||||
| 70 | EZCORP, Inc., (2) | 2,490 | ||||||||||||
| 10 | First Cash Financial Services, Inc., (2) | 420 | ||||||||||||
| 110 | SLM Corporation, (2) | 1,849 | ||||||||||||
| 20 | World Acceptance Corporation | 1,311 | ||||||||||||
Total Consumer Finance | 49,486 | |||||||||||||
Containers & Packaging – 0.3% | ||||||||||||||
| 60 | Ball Corporation | 2,308 | ||||||||||||
| 170 | Crown Holdings Inc., (2) | 6,599 | ||||||||||||
| 70 | Rock-Tenn Company | 4,644 | ||||||||||||
| 100 | Sonoco Products Company | 3,554 | ||||||||||||
| 110 | Temple-Inland Inc. | 3,271 | ||||||||||||
Total Containers & Packaging | 20,376 | |||||||||||||
Distributors – 0.1% | ||||||||||||||
| 20 | Genuine Parts Company | 1,088 | ||||||||||||
| 140 | Pool Corporation | 4,173 | ||||||||||||
| 10 | Weyco Group, Inc. | 246 | ||||||||||||
Total Distributors | 5,507 | |||||||||||||
Diversified Consumer Services – 0.6% | ||||||||||||||
| 20 | American Public Education Inc., (2) | 890 | ||||||||||||
| 60 | Apollo Group, Inc., (2) | 2,621 | ||||||||||||
| 70 | Bridgepoint Education Inc., (2) | 1,750 | ||||||||||||
| 90 | Career Education Corporation, (2) | 1,904 | ||||||||||||
| 170 | Coinstar Inc., (2) | 9,272 | ||||||||||||
| 100 | Corinthian Colleges Inc., (2) | 426 | ||||||||||||
| 310 | H & R Block Inc. | 4,972 | ||||||||||||
| 40 | ITT Educational Services, Inc., (2) | 3,130 | ||||||||||||
| 40 | K12, Inc., (2) | 1,326 | ||||||||||||
| 120 | Lincoln Educational Services Corporation, (2) | 2,058 | ||||||||||||
| Nuveen Investments | 21 |
Portfolio of Investments
Nuveen U.S. Equity Completeness Fund (continued)
June 30, 2011
| Shares | Description (1) | Value | ||||||||||||
Diversified Consumer Services (continued) | ||||||||||||||
| 90 | Matthews International Corporation | $ | 3,614 | |||||||||||
| 40 | Prepaid Legal Svcs inc. | 2,660 | ||||||||||||
| 130 | Regis Corporation | 1,992 | ||||||||||||
| 140 | Sothebys Holdings Inc. | 6,090 | ||||||||||||
Total Diversified Consumer Services | 42,705 | |||||||||||||
Diversified Financial Services – 2.0% | ||||||||||||||
| 4,750 | Bank of America Corporation | 52,060 | ||||||||||||
| 600 | Citigroup Inc. | 24,984 | ||||||||||||
| 20 | CME Group, Inc. | 5,832 | ||||||||||||
| 80 | Compass Diversified Trust | 1,319 | ||||||||||||
| 10 | Intercontinental Exchange, Inc., (2) | 1,247 | ||||||||||||
| 890 | JP Morgan Chase & Co. | 36,437 | ||||||||||||
| 60 | Leucadia National Corporation, (2) | 2,046 | ||||||||||||
| 70 | Moody’s Corporation | 2,685 | ||||||||||||
| 40 | MSCI Inc., Class A Shares, (2) | 1,507 | ||||||||||||
| 290 | Nasdaq Stock Market, Inc., (2) | 7,337 | ||||||||||||
| 190 | New York Stock Exchange Euronext | 6,511 | ||||||||||||
| 150 | PHH Corporation, (2) | 3,078 | ||||||||||||
| 10 | PICO Holdings, Inc. | 290 | ||||||||||||
Total Diversified Financial Services | 145,333 | |||||||||||||
Diversified Telecommunication Services – 2.1% | ||||||||||||||
| 30 | Abovenet Communications, (2) | 2,114 | ||||||||||||
| 80 | Alaska Communications Systems Group Inc. | 710 | ||||||||||||
| 2,510 | AT&T Inc. | 78,839 | ||||||||||||
| 50 | Atlantic Tele-Network, Inc. | 1,918 | ||||||||||||
| 30 | Cbeyond Inc., (2) | 397 | ||||||||||||
| 190 | CenturyLink Inc. | 7,682 | ||||||||||||
| 500 | Cincinnati Bell Inc. | 1,660 | ||||||||||||
| 100 | Cogent Communications Group, Inc., (2) | 1,701 | ||||||||||||
| 160 | Frontier Communications Corporation | 1,291 | ||||||||||||
| 40 | General Communication, Inc., (2) | 483 | ||||||||||||
| 50 | TW Telecom Inc., (2) | 1,027 | ||||||||||||
| 1,300 | Verizon Communications Inc. | 48,399 | ||||||||||||
| 360 | Vonage Holdings Corporation | 1,588 | ||||||||||||
Total Diversified Telecommunication Services | 147,809 | |||||||||||||
Electric Utilities – 1.8% | ||||||||||||||
| 30 | ALLETE Inc | 1,231 | ||||||||||||
| 350 | American Electric Power Company, Inc. | 13,188 | ||||||||||||
| 50 | Central Vermont Public Service Corp. | 1,808 | ||||||||||||
| 80 | Cleco Corporation | 2,788 | ||||||||||||
| 690 | Duke Energy Corporation | 12,993 | ||||||||||||
| 290 | Edison International | 11,238 | ||||||||||||
| 40 | Entergy Corporation | 2,731 | ||||||||||||
| 290 | Exelon Corporation | 12,424 | ||||||||||||
| 180 | FirstEnergy Corp. | 7,947 | ||||||||||||
| 22 | Nuveen Investments |
| Shares | Description (1) | Value | ||||||||||||
Electric Utilities (continued) | ||||||||||||||
| 140 | Hawaiian Electric Industries | $ | 3,368 | |||||||||||
| 110 | IDACORP, INC | 4,345 | ||||||||||||
| 20 | ITC Holdings Corporation | 1,435 | ||||||||||||
| 160 | NextEra Energy Inc. | 9,194 | ||||||||||||
| 230 | Northeast Utilities | 8,089 | ||||||||||||
| 30 | Otter Tail Power Corporation | 633 | ||||||||||||
| 40 | Pepco Holdings, Inc. | 785 | ||||||||||||
| 120 | Pinnacle West Capital Corporation | 5,350 | ||||||||||||
| 140 | PNM Resources Inc. | 2,344 | ||||||||||||
| 140 | Portland General Electric Company | 3,539 | ||||||||||||
| 80 | PPL Corporation | 2,226 | ||||||||||||
| 60 | Progress Energy, Inc. | 2,881 | ||||||||||||
| 270 | Southern Company | 10,903 | ||||||||||||
| 60 | UIL Holdings Corporation | 1,941 | ||||||||||||
| 80 | Unisource Energy Corporation | 2,986 | ||||||||||||
| 20 | Unitil Corp. | 526 | ||||||||||||
Total Electric Utilities | 126,893 | |||||||||||||
Electrical Equipment – 0.9% | ||||||||||||||
| 60 | Acuity Brands Inc. | 3,347 | ||||||||||||
| 60 | Ametek Inc. | 2,694 | ||||||||||||
| 190 | Belden Inc. | 6,623 | ||||||||||||
| 50 | Brady Corporation | 1,603 | ||||||||||||
| 60 | Cooper Industries Inc. | 3,580 | ||||||||||||
| 230 | Emerson Electric Company | 12,938 | ||||||||||||
| 280 | Ener1 Inc., (2) | 308 | ||||||||||||
| 30 | Franklin Electric Company, Inc. | 1,409 | ||||||||||||
| 10 | General Cable Corporation, (2) | 426 | ||||||||||||
| 490 | GrafTech International Ltd., (2) | 9,932 | ||||||||||||
| 110 | Hubbell Incorporated, Class B | 7,145 | ||||||||||||
| 120 | II VI Inc., (2) | 3,072 | ||||||||||||
| 20 | Powell Industries Inc. | 730 | ||||||||||||
| 50 | Rockwell Automation, Inc. | 4,338 | ||||||||||||
| 30 | Roper Industries Inc. | 2,499 | ||||||||||||
| 30 | Vicor Corporation | 485 | ||||||||||||
| 50 | Woodward Governor Company | 1,743 | ||||||||||||
Total Electrical Equipment | 62,872 | |||||||||||||
Electronic Equipment & Instruments – 1.0% | ||||||||||||||
| 50 | Amphenol Corporation, Class A | 2,700 | ||||||||||||
| 50 | Anixter International Inc., (2) | 3,267 | ||||||||||||
| 90 | Avnet Inc., (2) | 2,869 | ||||||||||||
| 60 | AVX Group | 914 | ||||||||||||
| 70 | Benchmark Electronics Inc. | 1,155 | ||||||||||||
| 10 | Checkpoint Systems Inc., (2) | 179 | ||||||||||||
| 20 | Cognex Corporation | 709 | ||||||||||||
| 90 | Coherent Inc., (2) | 4,974 | ||||||||||||
| Nuveen Investments | 23 |
Portfolio of Investments
Nuveen U.S. Equity Completeness Fund (continued)
June 30, 2011
| Shares | Description (1) | Value | ||||||||||||
Electronic Equipment & Instruments (continued) | ||||||||||||||
| 710 | Corning Incorporated | $ | 12,887 | |||||||||||
| 30 | Electro Rent Corporation | 514 | ||||||||||||
| 90 | FLIR Systems Inc., (2) | 3,034 | ||||||||||||
| 100 | IPG Photonics Corporation | 7,271 | ||||||||||||
| 10 | Itron Inc., (2) | 482 | ||||||||||||
| 50 | Maxwell Technologies, Inc. | 810 | ||||||||||||
| 40 | Measurement Specialties, Inc. | 1,428 | ||||||||||||
| 130 | Mercury Computer Systems Inc. | 2,428 | ||||||||||||
| 60 | Multi Fineline Electronix, Inc. | 1,297 | ||||||||||||
| 20 | National Instruments Corporation | 594 | ||||||||||||
| 10 | OSI Systems Inc., (2) | 430 | ||||||||||||
| 20 | Plexus Corporation, (2) | 696 | ||||||||||||
| 400 | Power One Inc, (2) | 3,240 | ||||||||||||
| 490 | Pulse Electronics Corporation | 2,166 | ||||||||||||
| 20 | Radisys Corporation | 146 | ||||||||||||
| 150 | SMART Modular Technologies, Inc. | 1,374 | ||||||||||||
| 70 | SYNNEX Corporation, (2) | 2,219 | ||||||||||||
| 60 | Trimble Navigation Limited, (2) | 2,378 | ||||||||||||
| 320 | TTM Technologies, Inc., (2) | 5,126 | ||||||||||||
| 90 | Universal Display Corporation | 3,158 | ||||||||||||
| 350 | Vishay Intertechnology Inc., (2) | 5,264 | ||||||||||||
Total Electronic Equipment & Instruments | 73,709 | |||||||||||||
Energy Equipment & Services – 2.6% | ||||||||||||||
| 180 | Baker Hughes Incorporated | 13,061 | ||||||||||||
| 70 | Carbo Ceramics Inc. | 11,407 | ||||||||||||
| 140 | Complete Production Services (2) | 4,670 | ||||||||||||
| 70 | Cooper Cameron Corporation, (2) | 3,520 | ||||||||||||
| 60 | Dawson Geophysical Company, (2) | 2,049 | ||||||||||||
| 80 | Diamond Offshore Drilling, Inc. | 5,633 | ||||||||||||
| 30 | Dril Quip Inc., (2) | 2,035 | ||||||||||||
| 90 | FMC Technologies Inc., (2) | 4,031 | ||||||||||||
| 390 | Global Industries, Limited, (2) | 2,137 | ||||||||||||
| 30 | Gulfmark Offshore Inc. | 1,326 | ||||||||||||
| 410 | Halliburton Company | 20,910 | ||||||||||||
| 20 | Helmerich & Payne Inc. | 1,322 | ||||||||||||
| 140 | Hornbeck Offshore Services Inc. | 3,850 | ||||||||||||
| 390 | ION Geophysical Corporation, (2) | 3,689 | ||||||||||||
| 20 | Key Energy Services Inc. | 360 | ||||||||||||
| 110 | Lufkin Industries Inc. | 9,466 | ||||||||||||
| 30 | Nabors Industries Inc., (2) | 739 | ||||||||||||
| 150 | National-Oilwell Varco Inc. | 11,732 | ||||||||||||
| 100 | Oceaneering International Inc., (2) | 4,050 | ||||||||||||
| 20 | OYO Geospace Corporation | 2,000 | ||||||||||||
| 20 | Patterson-UTI Energy, Inc. | 632 | ||||||||||||
| 20 | PHI Inc Non-Voting, (2) | 435 | ||||||||||||
| 24 | Nuveen Investments |
| Shares | Description (1) | Value | ||||||||||||
Energy Equipment & Services (continued) | ||||||||||||||
| 30 | Pioneer Drilling Company, (2) | $ | 457 | |||||||||||
| 200 | Rowan Companies Inc., (2) | 7,762 | ||||||||||||
| 630 | Schlumberger Limited | 54,432 | ||||||||||||
| 10 | SeaCor Smit Inc., (2) | 1,000 | ||||||||||||
| 80 | Tidewater Inc. | 4,305 | ||||||||||||
| 600 | Weatherford International Ltd, (2) | 11,250 | ||||||||||||
| 10 | Willbros Group Inc., (2) | 85 | ||||||||||||
Total Energy Equipment & Services | 188,345 | |||||||||||||
Food & Staples Retailing – 1.8% | ||||||||||||||
| 60 | BJ’s Wholesale Club, (2) | 3,021 | ||||||||||||
| 20 | Casey’s General Stores, Inc. | 880 | ||||||||||||
| 150 | Costco Wholesale Corporation | 12,186 | ||||||||||||
| 380 | CVS Caremark Corporation | 14,280 | ||||||||||||
| 180 | Ingles Markets, Inc. | 2,979 | ||||||||||||
| 120 | Kroger Co. | 2,976 | ||||||||||||
| 40 | Nash Finch Company | 1,432 | ||||||||||||
| 70 | PriceSmart, Inc. | 3,586 | ||||||||||||
| 120 | Ruddick Corporation | 5,225 | ||||||||||||
| 70 | Safeway Inc. | 1,636 | ||||||||||||
| 160 | Spartan Stores, Inc. | 3,125 | ||||||||||||
| 80 | SUPERVALU INC. | 753 | ||||||||||||
| 250 | Sysco Corporation | 7,795 | ||||||||||||
| 60 | United Natural Foods Inc., (2) | 2,560 | ||||||||||||
| 720 | Walgreen Co. | 30,571 | ||||||||||||
| 580 | Wal-Mart Stores, Inc. | 30,821 | ||||||||||||
| 80 | Weis Markets Inc. | 3,258 | ||||||||||||
| 60 | Whole Foods Market, Inc., (2) | 3,807 | ||||||||||||
| 90 | Winn-Dixie Stores Inc. | 761 | ||||||||||||
Total Food & Staples Retailing | 131,652 | |||||||||||||
Food Products – 1.2% | ||||||||||||||
| 260 | Archer-Daniels-Midland Company | 7,839 | ||||||||||||
| 20 | Bunge Limited | 1,379 | ||||||||||||
| 110 | Calavo Growers, Inc. | 2,317 | ||||||||||||
| 70 | Cal-Maine Foods, Inc. | 2,237 | ||||||||||||
| 20 | Campbell Soup Company | 691 | ||||||||||||
| 110 | Chiquita Brands International Inc., (2) | 1,432 | ||||||||||||
| 180 | ConAgra Foods, Inc. | 4,646 | ||||||||||||
| 20 | Corn Products International, Inc. | 1,106 | ||||||||||||
| 150 | Darling International Inc., (2) | 2,655 | ||||||||||||
| 140 | Dean Foods Company, (2) | 1,718 | ||||||||||||
| 30 | Flowers Foods Inc. | 661 | ||||||||||||
| 170 | General Mills, Inc. | 6,327 | ||||||||||||
| 50 | Green Mountain Coffee Inc., (2) | 4,463 | ||||||||||||
| 80 | H.J. Heinz Company | 4,262 | ||||||||||||
| 20 | Hain Celestial Group Inc., (2) | 667 | ||||||||||||
| Nuveen Investments | 25 |
Portfolio of Investments
Nuveen U.S. Equity Completeness Fund (continued)
June 30, 2011
| Shares | Description (1) | Value | ||||||||||||
Food Products (continued) | ||||||||||||||
| 100 | Hershey Foods Corporation | $ | 5,685 | |||||||||||
| 20 | JM Smucker Company | 1,529 | ||||||||||||
| 70 | Kellogg Company | 3,872 | ||||||||||||
| 400 | Kraft Foods Inc. | 14,092 | ||||||||||||
| 20 | Lancaster Colony Corporation | 1,216 | ||||||||||||
| 10 | Limoneira Company | 226 | ||||||||||||
| 20 | Mead Johnson Nutrition Company, Class A Shares | 1,351 | ||||||||||||
| 50 | Ralcorp Holdings Inc., (2) | 4,329 | ||||||||||||
| 310 | Sara Lee Corporation | 5,887 | ||||||||||||
| 50 | Seneca Foods Corporation, (2) | 1,279 | ||||||||||||
| 80 | Smart Balance Inc., (2) | 414 | ||||||||||||
| 50 | Smithfield Foods, Inc., (2) | 1,094 | ||||||||||||
| 10 | Snyders Lance Inc. | 216 | ||||||||||||
| 30 | Treehouse Foods Inc., (2) | 1,638 | ||||||||||||
| 140 | Tyson Foods, Inc., Class A | 2,719 | ||||||||||||
Total Food Products | 87,947 | |||||||||||||
Gas Utilities – 0.3% | ||||||||||||||
| 70 | Chesapeake Utilities Corporation | 2,802 | ||||||||||||
| 120 | Laclede Group Inc. | 4,540 | ||||||||||||
| 10 | New Jersey Resources Corporation | 446 | ||||||||||||
| 30 | Nicor Inc. | 1,642 | ||||||||||||
| 10 | Northwest Natural Gas Company | 451 | ||||||||||||
| 10 | ONEOK, Inc. | 740 | ||||||||||||
| 30 | Piedmont Natural Gas Company | 908 | ||||||||||||
| 350 | Questar Corporation | 6,199 | ||||||||||||
| 30 | Southwest Gas Corporation | 1,158 | ||||||||||||
| 20 | WGL Holdings Inc. | 770 | ||||||||||||
Total Gas Utilities | 19,656 | |||||||||||||
Health Care Equipment & Supplies – 1.6% | ||||||||||||||
| 20 | Abaxis, Inc., (2) | 545 | ||||||||||||
| 60 | Abiomed, Inc., (2) | 972 | ||||||||||||
| 60 | Accuray, Inc., (2) | 481 | ||||||||||||
| 40 | Align Technology, Inc., (2) | 912 | ||||||||||||
| 50 | AngioDynamics, Inc., (2) | 712 | ||||||||||||
| 30 | Arthrocare Corporation | 1,004 | ||||||||||||
| 150 | Baxter International, Inc. | 8,954 | ||||||||||||
| 70 | Becton, Dickinson and Company | 6,032 | ||||||||||||
| 80 | Boston Scientific Corporation, (2) | 553 | ||||||||||||
| 30 | C. R. Bard, Inc. | 3,296 | ||||||||||||
| 20 | Cantel Medical Corporation | 538 | ||||||||||||
| 10 | CareFusion Corporation, (2) | 272 | ||||||||||||
| 10 | Conceptus Inc., (2) | 117 | ||||||||||||
| 160 | Covidien PLC | 8,517 | ||||||||||||
| 60 | Cyberonics, (2) | 1,677 | ||||||||||||
| 60 | Delcath Systems, Inc., (2) | 310 | ||||||||||||
| 26 | Nuveen Investments |
| Shares | Description (1) | Value | ||||||||||||
Health Care Equipment & Supplies (continued) | ||||||||||||||
| 100 | DENTSPLY International Inc. | $ | 3,808 | |||||||||||
| 90 | DexCom, Inc., (2) | 1,304 | ||||||||||||
| 50 | Edwards Lifesciences Corporation, (2) | 4,359 | ||||||||||||
| 20 | Gen-Probe, Inc., (2) | 1,383 | ||||||||||||
| 40 | Greatbatch, Inc. | 1,073 | ||||||||||||
| 20 | Haemonetics Corporation, (2) | 1,287 | ||||||||||||
| 20 | Heartware International Inc., (2) | 1,482 | ||||||||||||
| 10 | Hologic Inc., (2) | 202 | ||||||||||||
| 20 | ICU Medical, Inc., (2) | 874 | ||||||||||||
| 50 | Idexx Labs Inc., (2) | 3,878 | ||||||||||||
| 50 | Immucor, Inc., (2) | 1,021 | ||||||||||||
| 30 | Insulet Corporation, (2) | 665 | ||||||||||||
| 30 | Integra Lifesciences Holdings Corporation, (2) | 1,434 | ||||||||||||
| 50 | Invacare Corporation | 1,660 | ||||||||||||
| 50 | Kinetic Concepts Inc., (2) | 2,882 | ||||||||||||
| 30 | Mako Surgical Corporation, (2) | 892 | ||||||||||||
| 40 | Masimo Corporation | 1,187 | ||||||||||||
| 270 | Medtronic, Inc. | 10,403 | ||||||||||||
| 30 | Meridian Bioscience, Inc. | 723 | ||||||||||||
| 20 | Merit Medical Systems, Inc., (2) | 359 | ||||||||||||
| 40 | Natus Medical, Inc., (2) | 606 | ||||||||||||
| 30 | Neogen Corporation, (2) | 1,356 | ||||||||||||
| 30 | NuVasive, Inc., (2) | 986 | ||||||||||||
| 20 | Nxstage Medical, Inc., (2) | 416 | ||||||||||||
| 40 | Orthofix International NV, (2) | 1,699 | ||||||||||||
| 80 | Palomar Medical Technologies, Inc. | 902 | ||||||||||||
| 170 | Saint Jude Medical Inc., (2) | 8,106 | ||||||||||||
| 10 | SonoSite, Inc., (2) | 352 | ||||||||||||
| 200 | STAAR Surgical Company | 1,060 | ||||||||||||
| 50 | Steris Corporation | 1,749 | ||||||||||||
| 110 | Stryker Corporation | 6,456 | ||||||||||||
| 160 | Syneron Medical Limited | 1,941 | ||||||||||||
| 60 | Synovis Life Technologies, Inc. | 1,045 | ||||||||||||
| 20 | Unilife Corporation | 104 | ||||||||||||
| 30 | Varian Medical Systems, Inc., (2) | 2,101 | ||||||||||||
| 110 | Volcano Corporation, (2) | 3,552 | ||||||||||||
| 40 | West Pharmaceutical Services Inc. | 1,750 | ||||||||||||
| 40 | Wright Medical Group, Inc., (2) | 600 | ||||||||||||
| 20 | Zimmer Holdings, Inc., (2) | 1,264 | ||||||||||||
| 40 | Zoll Medical Corporation, (2) | 2,266 | ||||||||||||
Total Health Care Equipment & Supplies | 114,079 | |||||||||||||
Health Care Providers & Services – 2.4% | ||||||||||||||
| 80 | Aetna Inc. | 3,527 | ||||||||||||
| 30 | Air Methods Corporation, (2) | 2,242 | ||||||||||||
| 50 | Amedisys, Inc., (2) | 1,332 | ||||||||||||
| Nuveen Investments | 27 |
Portfolio of Investments
Nuveen U.S. Equity Completeness Fund (continued)
June 30, 2011
| Shares | Description (1) | Value | ||||||||||||
Health Care Providers & Services (continued) | ||||||||||||||
| 110 | AmericGroup Corporation, (2) | $ | 7,752 | |||||||||||
| 230 | AmerisourceBergen Corporation | 9,522 | ||||||||||||
| 80 | AMN Healthcare Services Inc. | 666 | ||||||||||||
| 10 | Bio-Reference Laboratories, Inc., (2) | 209 | ||||||||||||
| 210 | Capital Senior Living Corporation | 1,951 | ||||||||||||
| 140 | Cardinal Health, Inc. | 6,359 | ||||||||||||
| 30 | Catalyst Health Soltuions Inc., (2) | 1,675 | ||||||||||||
| 70 | Centene Corporation, (2) | 2,487 | ||||||||||||
| 30 | Chemed Corporation | 1,966 | ||||||||||||
| 130 | Chindex International, Inc. | 1,771 | ||||||||||||
| 50 | CIGNA Corporation | 2,572 | ||||||||||||
| 70 | Community Health Systems, Inc., (2) | 1,798 | ||||||||||||
| 10 | Corvel Corporation | 469 | ||||||||||||
| 50 | Coventry Health Care, Inc., (2) | 1,824 | ||||||||||||
| 30 | Cross Country Healthcare, Inc., (2) | 228 | ||||||||||||
| 40 | Davita Inc., (2) | 3,464 | ||||||||||||
| 30 | Ensign Group Inc. | 912 | ||||||||||||
| 50 | Express Scripts, Inc., (2) | 2,699 | ||||||||||||
| 350 | Five Star Quality Care Inc. | 2,034 | ||||||||||||
| 30 | Gentiva Health Services, Inc., (2) | 625 | ||||||||||||
| 40 | Health Management Associates Inc., (2) | 431 | ||||||||||||
| 20 | Health Net Inc., (2) | 642 | ||||||||||||
| 160 | HealthSouth Corporation, (2) | 4,200 | ||||||||||||
| 150 | HealthSpring, Inc., (2) | 6,917 | ||||||||||||
| 30 | Healthways Inc. | 455 | ||||||||||||
| 30 | Henry Schein Inc., (2) | 2,148 | ||||||||||||
| 40 | HMS Holdings Corporation, (2) | 3,075 | ||||||||||||
| 60 | Humana Inc., (2) | 4,832 | ||||||||||||
| 100 | Kindred Healthcare Inc., (2) | 2,147 | ||||||||||||
| 40 | Laboratory Corporation of America Holdings, (2) | 3,872 | ||||||||||||
| 10 | Landauer Inc. | 616 | ||||||||||||
| 10 | LHC Group, Inc. | 231 | ||||||||||||
| 40 | Lincare Holdings | 1,171 | ||||||||||||
| 50 | Magellan Health Services, Inc., (2) | 2,737 | ||||||||||||
| 120 | McKesson HBOC Inc. | 10,038 | ||||||||||||
| 60 | Medax Inc., (2) | 4,331 | ||||||||||||
| 60 | Medco Health Solutions, Inc., (2) | 3,391 | ||||||||||||
| 70 | Molina Healthcare Inc. | 1,898 | ||||||||||||
| 20 | MWI Veterinary Supply, Inc. | 1,615 | ||||||||||||
| 20 | Omnicare, Inc. | 638 | ||||||||||||
| 70 | Owens and Minor Inc. | 2,414 | ||||||||||||
| 40 | Patterson Companies, Inc. | 1,316 | ||||||||||||
| 200 | Providence Service Corporation | 2,530 | ||||||||||||
| 50 | PSS World Medical Inc., (2) | 1,401 | ||||||||||||
| 50 | Quest Diagnostics Incorporated | 2,955 | ||||||||||||
| 28 | Nuveen Investments |
| Shares | Description (1) | Value | ||||||||||||
Health Care Providers & Services (continued) | ||||||||||||||
| 230 | Select Medical Corporation, (2) | $ | 2,040 | |||||||||||
| 80 | Triple-S Management Corporation, Class B Shares | 1,738 | ||||||||||||
| 380 | UnitedHealth Group Incorporated | 19,600 | ||||||||||||
| 120 | Universal Health Services, Inc., Class B | 6,184 | ||||||||||||
| 140 | VCA Antech, Inc., (2) | 2,968 | ||||||||||||
| 180 | Wellcare Health Plans Inc., (2) | 9,254 | ||||||||||||
| 110 | Wellpoint Inc., (2) | 8,665 | ||||||||||||
Total Health Care Providers & Services | 174,534 | |||||||||||||
Health Care Technology – 0.1% | ||||||||||||||
| 50 | Allscripts Healthcare Solutions Inc., (2) | 971 | ||||||||||||
| 20 | AthenaHealth Inc., (2) | 822 | ||||||||||||
| 20 | Cerner Corporation, (2) | 1,222 | ||||||||||||
| 10 | Computer Programs and Systems, Inc. | 635 | ||||||||||||
| 60 | Medidata Solutions, Inc. | 1,432 | ||||||||||||
| 40 | Omnicell, Inc., (2) | 624 | ||||||||||||
| 20 | Quality Systems Inc. | 1,746 | ||||||||||||
Total Health Care Technology | 7,452 | |||||||||||||
Hotels, Restaurants & Leisure – 2.4% | ||||||||||||||
| 10 | Ambassadors Group, Inc. | 88 | ||||||||||||
| 30 | Bally Technologies, Inc., (2) | 1,220 | ||||||||||||
| 10 | BJ’s Restaurants, Inc. | 524 | ||||||||||||
| 20 | Bob Evans Farms | 699 | ||||||||||||
| 40 | Boyd Gaming Corporation | 348 | ||||||||||||
| 170 | Brinker International Inc. | 4,158 | ||||||||||||
| 210 | Carnival Corporation, ADR | 7,902 | ||||||||||||
| 100 | CBRL Group Inc. | 4,931 | ||||||||||||
| 10 | CEC Entertainment Inc., (2) | 401 | ||||||||||||
| 120 | Cheesecake Factory Inc., (2) | 3,764 | ||||||||||||
| 20 | Chipotle Mexican Grill, (2) | 6,164 | ||||||||||||
| 70 | Darden Restaurants, Inc. | 3,483 | ||||||||||||
| 750 | Denny’s Corporation | 2,910 | ||||||||||||
| 50 | Gaylord Entertainment Company (2) | 1,500 | ||||||||||||
| 10 | Jack in the Box Inc., (2) | 228 | ||||||||||||
| 60 | Krispy Kreme Doughnuts Inc., (2) | �� | 571 | |||||||||||
| 690 | Las Vegas Sands, (2) | 29,125 | ||||||||||||
| 80 | Life Time Fitness Inc., (2) | 3,193 | ||||||||||||
| 80 | Marriott International, Inc., Class A | 2,839 | ||||||||||||
| 400 | McDonald’s Corporation | 33,728 | ||||||||||||
| 10 | P.F. Changs China Bistro, Inc. | 402 | ||||||||||||
| 30 | Panera Bread Company, (2) | 3,770 | ||||||||||||
| 10 | Papa John’s International, Inc., (2) | 333 | ||||||||||||
| 20 | Peets Coffee and Tea Inc., (2) | 1,154 | ||||||||||||
| 210 | Penn National Gaming, Inc., (2) | 8,471 | ||||||||||||
| 60 | Red Robin Gourmet Burgers, Inc., (2) | 2,183 | ||||||||||||
| 20 | Sonic Corporation, (2) | 213 | ||||||||||||
| Nuveen Investments | 29 |
Portfolio of Investments
Nuveen U.S. Equity Completeness Fund (continued)
June 30, 2011
| Shares | Description (1) | Value | ||||||||||||
Hotels, Restaurants & Leisure (continued) | ||||||||||||||
| 240 | Starbucks Corporation | $ | 9,478 | |||||||||||
| 70 | Starwood Hotels & Resorts Worldwide, Inc. | 3,923 | ||||||||||||
| 20 | Texas Roadhouse, Inc. | 351 | ||||||||||||
| 30 | Vail Resorts, Inc. | 1,387 | ||||||||||||
| 150 | Wyndham Worldwide Corporation | 5,048 | ||||||||||||
| 40 | Wynn Resorts Ltd | 5,742 | ||||||||||||
| 360 | YUM! Brands, Inc. | 19,886 | ||||||||||||
Total Hotels, Restaurants & Leisure | 170,117 | |||||||||||||
Household Durables – 0.5% | ||||||||||||||
| 450 | Beazer Homes USA, Inc., (2) | 1,526 | ||||||||||||
| 10 | D.R. Horton, Inc. | 115 | ||||||||||||
| 120 | Fortune Brands Inc. | 7,652 | ||||||||||||
| 130 | Garmin Limited | 4,294 | ||||||||||||
| 80 | Helen of Troy Limited, (2) | 2,762 | ||||||||||||
| 530 | Hovnanian Enterprises Inc., (2) | 1,277 | ||||||||||||
| 70 | Irobot Corporation | 2,470 | ||||||||||||
| 10 | Jarden Corporation | 345 | ||||||||||||
| 70 | La Z Boy Inc., (2) | 691 | ||||||||||||
| 50 | Leggett and Platt Inc. | 1,219 | ||||||||||||
| 110 | Meritage Corporation, (2) | 2,482 | ||||||||||||
| 70 | Mohawk Industries Inc., (2) | 4,199 | ||||||||||||
| 90 | Newell Rubbermaid Inc. | 1,420 | ||||||||||||
| 10 | Ryland Group Inc. | 165 | ||||||||||||
| 20 | Toll Brothers Inc., (2) | 415 | ||||||||||||
| 50 | Univeral Electronics Inc., (2) | 1,263 | ||||||||||||
| 60 | Whirlpool Corporation | 4,879 | ||||||||||||
Total Household Durables | 37,174 | |||||||||||||
Household Products – 0.9% | ||||||||||||||
| 70 | Church & Dwight Company Inc. | 2,838 | ||||||||||||
| 80 | Clorox Company | 5,395 | ||||||||||||
| 80 | Colgate-Palmolive Company | 6,993 | ||||||||||||
| 10 | Energizer Holdings Inc., (2) | 724 | ||||||||||||
| 150 | Kimberly-Clark Corporation | 9,984 | ||||||||||||
| 560 | Procter & Gamble Company | 35,599 | ||||||||||||
| 50 | Spectrum Brands Inc. | 1,600 | ||||||||||||
Total Household Products | 63,133 | |||||||||||||
Independent Power Producers & Energy Traders – 0.2% | ||||||||||||||
| 320 | AES Corporation, (2) | 4,077 | ||||||||||||
| 180 | Calpine Corporation, (2) | 2,903 | ||||||||||||
| 110 | Constellation Energy Group | 4,176 | ||||||||||||
| 200 | GenOn Energy Inc. | 772 | ||||||||||||
| 60 | NRG Energy Inc., (2) | 1,475 | ||||||||||||
Total Independent Power Producers & Energy Traders | 13,403 | |||||||||||||
Industrial Conglomerates – 2.1% | ||||||||||||||
| 330 | 3M Co. | 31,301 | ||||||||||||
| 340 | Danaher Corporation | 18,017 | ||||||||||||
| 30 | Nuveen Investments |
| Shares | Description (1) | Value | ||||||||||||
Industrial Conglomerates (continued) | ||||||||||||||
| 4,190 | General Electric Company | $ | 79,023 | |||||||||||
| 380 | Tyco International Ltd. | 18,783 | ||||||||||||
Total Industrial Conglomerates | 147,124 | |||||||||||||
Insurance – 3.8% | ||||||||||||||
| 170 | Ace Limited | 11,189 | ||||||||||||
| 380 | AFLAC Incorporated | 17,738 | ||||||||||||
| 250 | Allstate Corporation | 7,633 | ||||||||||||
| 80 | Alterra Capital Holdings Limited | 1,784 | ||||||||||||
| 40 | American International Group, (2) | 1,173 | ||||||||||||
| 10 | American National Insurance Company | 775 | ||||||||||||
| 30 | Amerisafe, Inc., (2) | 679 | ||||||||||||
| 160 | Amtrust Financial Services, Inc. | 3,645 | ||||||||||||
| 70 | Aon Corporation | 3,591 | ||||||||||||
| 30 | Arch Capital Group Limited, (2) | 958 | ||||||||||||
| 100 | Argo Group International Holdings Inc. | 2,972 | ||||||||||||
| 30 | Assurant Inc. | 1,088 | ||||||||||||
| 30 | Assured Guaranty Limited | 489 | ||||||||||||
| 190 | Axis Capital Holdings Limited | 5,882 | ||||||||||||
| 350 | Berkshire Hathaway Inc., Class B, (2) | 27,087 | ||||||||||||
| 140 | Chubb Corporation | 8,765 | ||||||||||||
| 30 | Cincinnati Financial Corporation | 875 | ||||||||||||
| 710 | CNO Financial Group Inc., (2) | 5,616 | ||||||||||||
| 80 | Delphi Financial Group, Inc. | 2,337 | ||||||||||||
| 100 | eHealth, Inc. | 1,336 | ||||||||||||
| 110 | Employers Holdings, Inc. | 1,845 | ||||||||||||
| 20 | Endurance Specialty Holdings Limited | 827 | ||||||||||||
| 20 | Enstar Group, Limited | 2,090 | ||||||||||||
| 20 | Erie Indemnity Company | 1,414 | ||||||||||||
| 10 | Everest Reinsurance Group Ltd | 818 | ||||||||||||
| 180 | Fidelity National Title Group Inc., Class A | 2,833 | ||||||||||||
| 100 | First American Corporation | 1,565 | ||||||||||||
| 30 | FPIC Insurance Group Inc. | 1,250 | ||||||||||||
| 120 | Genworth Financial Inc., Class A, (2) | 1,234 | ||||||||||||
| 20 | Global Indemnity PLC | 444 | ||||||||||||
| 440 | Hartford Financial Services Group, Inc. | 11,603 | ||||||||||||
| 50 | HCC Insurance Holdings Inc. | 1,575 | ||||||||||||
| 320 | Lincoln National Corporation | 9,117 | ||||||||||||
| 260 | Loews Corporation | 10,943 | ||||||||||||
| 10 | Markel Corporation, (2) | 3,968 | ||||||||||||
| 180 | Marsh & McLennan Companies, Inc. | 5,614 | ||||||||||||
| 70 | Meadowbrook Insurance Group, Inc. | 694 | ||||||||||||
| 10 | Mercury General Corporation | 395 | ||||||||||||
| 460 | MetLife, Inc. | 20,180 | ||||||||||||
| 180 | Montpelier Re Holdings Limited | 3,240 | ||||||||||||
| 10 | National Western Life Insurance Company | 1,595 | ||||||||||||
| Nuveen Investments | 31 |
Portfolio of Investments
Nuveen U.S. Equity Completeness Fund (continued)
June 30, 2011
| Shares | Description (1) | Value | ||||||||||||
Insurance (continued) | ||||||||||||||
| 20 | Navigators Group, Inc. | $ | 940 | |||||||||||
| 20 | Old Republic International Corporation | 235 | ||||||||||||
| 40 | PartnerRe Limited | 2,754 | ||||||||||||
| 40 | Platinum Underwriters Holdings Limited | 1,330 | ||||||||||||
| 30 | Primerica Inc. | 659 | ||||||||||||
| 320 | Principal Financial Group, Inc. | 9,734 | ||||||||||||
| 30 | ProAssurance Corporation, (2) | 2,100 | ||||||||||||
| 110 | Progressive Corporation | 2,352 | ||||||||||||
| 290 | Prudential Financial, Inc. | 18,441 | ||||||||||||
| 20 | RenaisasnceRE Holdings, Limited | 1,399 | ||||||||||||
| 20 | RLI Corporation | 1,238 | ||||||||||||
| 80 | Seabright Insurance Holdings Inc. | 792 | ||||||||||||
| 120 | Selective Insurance Group Inc. | 1,952 | ||||||||||||
| 80 | StanCorp Financial Group Inc. | 3,375 | ||||||||||||
| 20 | Torchmark Corporation | 1,283 | ||||||||||||
| 70 | Tower Group Inc. | 1,667 | ||||||||||||
| 20 | Transatlantic Holdings Inc. | 980 | ||||||||||||
| 260 | Travelers Companies, Inc. | 15,179 | ||||||||||||
| 120 | Unitrin, Inc. | 3,560 | ||||||||||||
| 130 | Unum Group | 3,312 | ||||||||||||
| 160 | WR Berkley Corporation | 5,190 | ||||||||||||
| 160 | XL Capital Ltd, Class A | 3,517 | ||||||||||||
Total Insurance | 270,845 | |||||||||||||
Internet & Catalog Retail – 0.7% | ||||||||||||||
| 120 | Amazon.com, Inc., (2) | 24,539 | ||||||||||||
| 70 | Expedia, Inc. | 2,029 | ||||||||||||
| 100 | Liberty Media Holding Corporation Interactive, Class A, (2) | 1,677 | ||||||||||||
| 20 | NetFlix.com Inc., (2) | 5,254 | ||||||||||||
| 90 | Overstock.com, Inc., (2) | 1,370 | ||||||||||||
| 20 | Priceline.com Incorporated, (2) | 10,239 | ||||||||||||
| 110 | Shutterfly, Inc., (2) | 6,316 | ||||||||||||
Total Internet & Catalog Retail | 51,424 | |||||||||||||
Internet Software & Services – 1.2% | ||||||||||||||
| 30 | Akamai Technologies, Inc., (2) | 944 | ||||||||||||
| 30 | Constant Contact Inc. | 761 | ||||||||||||
| 20 | Digital River, Inc., (2) | 643 | ||||||||||||
| 330 | Earthlink, Inc. | 2,539 | ||||||||||||
| 330 | eBay Inc., (2) | 10,649 | ||||||||||||
| 70 | Google Inc., Class A, (2) | 35,447 | ||||||||||||
| 110 | IAC/InterActiveCorp., (2) | 4,199 | ||||||||||||
| 50 | j2 Global Communications, Inc., (2) | 1,412 | ||||||||||||
| 30 | Open Solutions Inc. | 2,494 | ||||||||||||
| 50 | Perficient, Inc. | 513 | ||||||||||||
| 20 | QuinStreet, Inc. | 260 | ||||||||||||
| 140 | Rackspace Hosting Inc., (2) | 5,984 | ||||||||||||
| 32 | Nuveen Investments |
| Shares | Description (1) | Value | ||||||||||||
Internet Software & Services (continued) | ||||||||||||||
| 120 | Saba Software, Inc. | $ | 1,084 | |||||||||||
| 80 | Savvis Inc. | 3,162 | ||||||||||||
| 30 | Travelzoo Inc. | 1,939 | ||||||||||||
| 310 | United Online, Inc. | 1,869 | ||||||||||||
| 280 | ValueClick, Inc., (2) | 4,648 | ||||||||||||
| 300 | Yahoo! Inc., (2) | 4,512 | ||||||||||||
Total Internet Software & Services | 83,059 | |||||||||||||
IT Services – 3.2% | ||||||||||||||
| 240 | Accenture Limited | 14,501 | ||||||||||||
| 170 | Acxiom Corporation, (2) | 2,229 | ||||||||||||
| 20 | Alliance Data Systems Corporation, (2) | 1,881 | ||||||||||||
| 100 | Amdocs Limited, (2) | 3,039 | ||||||||||||
| 140 | Automatic Data Processing, Inc. | 7,375 | ||||||||||||
| 50 | CACI International Inc., (2) | 3,154 | ||||||||||||
| 40 | Cardtronics Inc., (2) | 938 | ||||||||||||
| 100 | Cognizant Technology Solutions Corporation, Class A, (2) | 7,334 | ||||||||||||
| 160 | Computer Sciences Corporation | 6,074 | ||||||||||||
| 40 | Convergys Corporation, (2) | 546 | ||||||||||||
| 50 | Euronet Worldwide, Inc., (2) | 771 | ||||||||||||
| 60 | Exlservice Holdings, Inc., (2) | 1,386 | ||||||||||||
| 220 | Fidelity National Information Services | 6,774 | ||||||||||||
| 60 | Fiserv, Inc., (2) | 3,758 | ||||||||||||
| 10 | Global Payments Inc. | 510 | ||||||||||||
| 140 | Henry Jack and Associates Inc. | 4,201 | ||||||||||||
| 160 | IGATE Corporation | 2,611 | ||||||||||||
| 620 | International Business Machines Corporation (IBM) | 106,361 | ||||||||||||
| 80 | Lender Processing Services Inc. | 1,673 | ||||||||||||
| 260 | Lionbridge Technologies, Inc. | 827 | ||||||||||||
| 30 | ManTech International Corporation, Class A, (2) | 1,333 | ||||||||||||
| 20 | MasterCard, Inc. | 6,027 | ||||||||||||
| 30 | Maximus Inc. | 2,482 | ||||||||||||
| 60 | Paychex, Inc. | 1,843 | ||||||||||||
| 50 | SAIC, Inc., (2) | 841 | ||||||||||||
| 100 | Sapient Corporation | 1,503 | ||||||||||||
| 90 | SRA International, Inc., (2) | 2,783 | ||||||||||||
| 50 | Teradata Corporation, (2) | 3,010 | ||||||||||||
| 180 | Unisys Corporation, (2) | 4,626 | ||||||||||||
| 200 | VeriFone Holdings Inc., (2) | 8,870 | ||||||||||||
| 30 | Virtusa Corporation | 569 | ||||||||||||
| 100 | Visa Inc. | 8,426 | ||||||||||||
| 320 | Western Union Company | 6,410 | ||||||||||||
| 60 | Wright Express Corporation, (2) | 3,124 | ||||||||||||
Total IT Services | 227,790 | |||||||||||||
Leisure Equipment & Products – 0.3% | ||||||||||||||
| 140 | Brunswick Corporation | 2,856 | ||||||||||||
| Nuveen Investments | 33 |
Portfolio of Investments
Nuveen U.S. Equity Completeness Fund (continued)
June 30, 2011
| Shares | Description (1) | Value | ||||||||||||
Leisure Equipment & Products (continued) | ||||||||||||||
| 80 | Hasbro, Inc. | $ | 3,514 | |||||||||||
| 10 | LeapFrog Enterprises Inc. | 42 | ||||||||||||
| 140 | Mattel, Inc. | 3,849 | ||||||||||||
| 110 | Polaris Industries Inc. | 12,229 | ||||||||||||
Total Leisure Equipment & Products | 22,490 | |||||||||||||
Life Sciences Tools & Services – 0.4% | ||||||||||||||
| 330 | Affymetrix, Inc., (2) | 2,617 | ||||||||||||
| 70 | Agilent Technologies, Inc., (2) | 3,578 | ||||||||||||
| 30 | Caliper Life Sciences, Inc. | 243 | ||||||||||||
| 50 | eResearch Technology, Inc., (2) | 319 | ||||||||||||
| 50 | Illumina Inc., (2) | 3,758 | ||||||||||||
| 30 | Life Technologies Corporation, (2) | 1,562 | ||||||||||||
| 30 | Mettler-Toledo International Inc., (2) | 5,060 | ||||||||||||
| 50 | Pacific Biosciences of California Inc. | 585 | ||||||||||||
| 10 | Parexel International Corporation | 236 | ||||||||||||
| 80 | Perkinelmer Inc. | 2,153 | ||||||||||||
| 50 | Pharmaceutical Product Development Inc. | 1,342 | ||||||||||||
| 60 | Thermo Fisher Scientific, Inc., (2) | 3,863 | ||||||||||||
| 20 | Waters Corporation, (2) | 1,915 | ||||||||||||
Total Life Sciences Tools & Services | 27,231 | |||||||||||||
Machinery – 2.9% | ||||||||||||||
| 70 | 3D Systems Corporation | 1,380 | ||||||||||||
| 20 | Albany International Corporation, Class A | 528 | ||||||||||||
| 100 | Altra Industrial Motion, Inc. | 2,399 | ||||||||||||
| 10 | Ampco-Pittsburgh Corporation | 235 | ||||||||||||
| 10 | Astecx Industries Inc. | 370 | ||||||||||||
| 10 | Barnes Group Inc. | 248 | ||||||||||||
| 170 | Blount International Inc. | 2,970 | ||||||||||||
| 120 | Briggs & Stratton Corporation | 2,383 | ||||||||||||
| 30 | Bucyrus International, Inc. | 2,750 | ||||||||||||
| 350 | Caterpillar Inc. | 37,261 | ||||||||||||
| 80 | Chart Industries, Inc., (2) | 4,318 | ||||||||||||
| 80 | CLARCOR, Inc. | 3,782 | ||||||||||||
| 70 | Colfax Corporation | 1,736 | ||||||||||||
| 110 | Cummins Inc. | 11,384 | ||||||||||||
| 340 | Deere & Company | 28,033 | ||||||||||||
| 90 | Dover Corporation | 6,102 | ||||||||||||
| 220 | Eaton Corporation | 11,319 | ||||||||||||
| 40 | EnPro Industries Inc., (2) | 1,923 | ||||||||||||
| 50 | ESCO Technologies Inc. | 1,840 | ||||||||||||
| 20 | Flowserve Corporation | 2,198 | ||||||||||||
| 50 | Force Protection, Inc. | 248 | ||||||||||||
| 60 | Gardner Denver, Inc. | 5,043 | ||||||||||||
| 50 | Greenbrier Companies Inc., (2) | 988 | ||||||||||||
| 10 | Harsco Corporation | 326 | ||||||||||||
| 34 | Nuveen Investments |
| Shares | Description (1) | Value | ||||||||||||
Machinery (continued) | ||||||||||||||
| 170 | Illinois Tool Works, Inc. | $ | 9,603 | |||||||||||
| 20 | Ingersoll Rand Company Limited, Class A | 908 | ||||||||||||
| 50 | Joy Global Inc. | 4,762 | ||||||||||||
| 30 | Kadant Inc. | 945 | ||||||||||||
| 30 | Kennametal Inc. | 1,266 | ||||||||||||
| 10 | Meritor Inc. | 160 | ||||||||||||
| 30 | Middleby Corporation, (2) | 2,821 | ||||||||||||
| 30 | Mueller Water Products Inc. | 119 | ||||||||||||
| 30 | Navistar International Corporation, (2) | 1,694 | ||||||||||||
| 120 | Nordson Corporation | 6,582 | ||||||||||||
| 130 | PACCAR Inc. | 6,642 | ||||||||||||
| 40 | Pall Corporation | 2,249 | ||||||||||||
| 150 | Parker Hannifin Corporation | 13,461 | ||||||||||||
| 20 | Peerless Manufacturing Company | 397 | ||||||||||||
| 110 | Pentair, Inc. | 4,440 | ||||||||||||
| 10 | Robbins & Myers, Inc. | 529 | ||||||||||||
| 60 | Stanley Black & Decker Inc. | 4,323 | ||||||||||||
| 10 | Tennant Company | 399 | ||||||||||||
| 50 | Terex Corporation, (2) | 1,423 | ||||||||||||
| 40 | Timken Company | 2,016 | ||||||||||||
| 80 | Titan International Inc. | 1,941 | ||||||||||||
| 20 | TriMas Corporation | 495 | ||||||||||||
| 140 | Trinity Industries Inc. | 4,883 | ||||||||||||
| 520 | Wabash National Corporation | 4,872 | ||||||||||||
| 20 | WABCO Holdings Inc., (2) | 1,381 | ||||||||||||
| 40 | Wabtec Corporation | 2,629 | ||||||||||||
Total Machinery | 210,704 | |||||||||||||
Media – 3.9% | ||||||||||||||
| 100 | Arbitron Inc. | 4,133 | ||||||||||||
| 100 | Belo Corp. | 753 | ||||||||||||
| 490 | Cablevision Systems Corporation | 17,743 | ||||||||||||
| 330 | CBS Corporation, Class B | 9,402 | ||||||||||||
| 2,180 | Comcast Corporation, Class A | 55,241 | ||||||||||||
| 290 | DIRECTV Group, Inc., (2) | �� | 14,738 | |||||||||||
| 80 | Discovery Communications inc., Class A Shares, (2) | 3,277 | ||||||||||||
| 10 | Dreamworks Animation SKG Inc., (2) | 201 | ||||||||||||
| 90 | Entercom Communications Corporation | 781 | ||||||||||||
| 50 | Global Sources, Limited | 460 | ||||||||||||
| 210 | Harte-Hanks Inc. | 1,705 | ||||||||||||
| 330 | Interpublic Group Companies, Inc., (2) | 4,125 | ||||||||||||
| 20 | Knology, Inc., (2) | 297 | ||||||||||||
| 60 | Liberty Global Inc, A Shares, (2) | 2,702 | ||||||||||||
| 70 | Lions Gate Entertainment Corporation, Equity | 463 | ||||||||||||
| 150 | McGraw-Hill Companies, Inc. | 6,287 | ||||||||||||
| 70 | National CineMedia, Inc. | 1,184 | ||||||||||||
| Nuveen Investments | 35 |
Portfolio of Investments
Nuveen U.S. Equity Completeness Fund (continued)
June 30, 2011
| Shares | Description (1) | Value | ||||||||||||
Media (continued) | ||||||||||||||
| 260 | New York Times, Class A, (2) | $ | 2,267 | |||||||||||
| 1,800 | News Corporation, Class A | 31,860 | ||||||||||||
| 170 | Omnicom Group, Inc. | 8,187 | ||||||||||||
| 10 | Regal Entertainment Group, Class A | 124 | ||||||||||||
| 50 | Rentrak Corporation | 887 | ||||||||||||
| 80 | Scripps Networks Interactive, Class A Shares | 3,910 | ||||||||||||
| 40 | Sinclair Broadcast Group, Series A | 439 | ||||||||||||
| 300 | Thomson Corporation | 11,268 | ||||||||||||
| 390 | Time Warner Cable, Class A | 30,436 | ||||||||||||
| 630 | Time Warner Inc. | 22,913 | ||||||||||||
| 140 | Vallassis Communications Inc., (2) | 4,242 | ||||||||||||
| 240 | Viacom Inc., Class B | 12,240 | ||||||||||||
| 60 | Virgin Media, Inc. | 1,796 | ||||||||||||
| 650 | Walt Disney Company | 25,376 | ||||||||||||
Total Media | 279,437 | |||||||||||||
Metals & Mining – 1.8% | ||||||||||||||
| 680 | Alcoa Inc. | 10,785 | ||||||||||||
| 80 | Allegheny Technologies, Inc. | 5,078 | ||||||||||||
| 150 | Allied Nevada Gold Corporation, (2) | 5,306 | ||||||||||||
| 70 | AM Castle & Co, (2) | 1,163 | ||||||||||||
| 20 | AMCOL International Corp. | 763 | ||||||||||||
| 10 | Century Aluminum Company, (2) | 157 | ||||||||||||
| 110 | Cliffs Natural Resources Inc. | 10,170 | ||||||||||||
| 200 | Coeur d’Alene Mines Corporation, (2) | 4,852 | ||||||||||||
| 20 | Compass Minerals International, Inc. | 1,721 | ||||||||||||
| 760 | Freeport-McMoRan Copper & Gold, Inc. | 40,204 | ||||||||||||
| 310 | General Moly, Inc. | 1,383 | ||||||||||||
| 290 | Golden Star Resources Ltd | 638 | ||||||||||||
| 400 | Hecla Mining Company, (2) | 3,076 | ||||||||||||
| 150 | Horsehead Holding Corp., (2) | 1,998 | ||||||||||||
| 60 | Molycorp Inc. | 3,664 | ||||||||||||
| 290 | Newmont Mining Corporation | 15,651 | ||||||||||||
| 120 | Nucor Corporation | 4,946 | ||||||||||||
| 70 | Reliance Steel & Aluminum Company | 3,476 | ||||||||||||
| 80 | Southern Copper Corporation | 2,630 | ||||||||||||
| 30 | Steel Dynamics Inc. | 488 | ||||||||||||
| 110 | Titanium Metals Corporation, (2) | 2,015 | ||||||||||||
| 40 | United States Steel Corporation | 1,842 | ||||||||||||
| 60 | Universal Stainless & Alloy Products, Inc. | 2,806 | ||||||||||||
| 100 | US Gold Corporation, (2) | 603 | ||||||||||||
| 10 | Walter Industries Inc. | 1,158 | ||||||||||||
| 140 | Worthington Industries, Inc. | 3,234 | ||||||||||||
Total Metals & Mining | 129,807 | |||||||||||||
Multiline Retail – 1.0% | ||||||||||||||
| 320 | Dillard’s, Inc., Class A | 16,685 | ||||||||||||
| 36 | Nuveen Investments |
| Shares | Description (1) | Value | ||||||||||||
Multiline Retail (continued) | ||||||||||||||
| 130 | Dollar Tree Stores Inc., (2) | $ | 8,661 | |||||||||||
| 70 | Family Dollar Stores, Inc. | 3,679 | ||||||||||||
| 150 | J.C. Penney Company, Inc. | 5,181 | ||||||||||||
| 110 | Kohl’s Corporation, (2) | 5,501 | ||||||||||||
| 290 | Macy’s, Inc. | 8,480 | ||||||||||||
| 130 | Nordstrom, Inc. | 6,102 | ||||||||||||
| 300 | Saks Inc., (2) | 3,351 | ||||||||||||
| 330 | Target Corporation | 15,480 | ||||||||||||
Total Multiline Retail | 73,120 | |||||||||||||
Multi-Utilities – 1.1% | ||||||||||||||
| 50 | Alliant Energy Corporation | 2,033 | ||||||||||||
| 110 | Ameren Corporation | 3,172 | ||||||||||||
| 20 | Avista Corporation | 514 | ||||||||||||
| 10 | Black Hills Corporation | 301 | ||||||||||||
| 220 | CenterPoint Energy, Inc. | 4,257 | ||||||||||||
| 50 | CH Energy Group Inc. | 2,663 | ||||||||||||
| 350 | CMS Energy Corporation | 6,892 | ||||||||||||
| 50 | Consolidated Edison, Inc. | 2,662 | ||||||||||||
| 180 | Dominion Resources, Inc. | 8,689 | ||||||||||||
| 200 | DTE Energy Company | 10,004 | ||||||||||||
| 10 | Integrys Energy Group, Inc. | 518 | ||||||||||||
| 40 | MDU Resources Group Inc. | 900 | ||||||||||||
| 120 | NiSource Inc. | 2,430 | ||||||||||||
| 20 | NSTAR | 920 | ||||||||||||
| 40 | OGE Energy Corp. | 2,013 | ||||||||||||
| 150 | PG&E Corporation | 6,305 | ||||||||||||
| 180 | Public Service Enterprise Group Incorporated | 5,875 | ||||||||||||
| 20 | Scana Corporation | 787 | ||||||||||||
| 50 | Sempra Energy | 2,644 | ||||||||||||
| 40 | TECO Energy, Inc. | 756 | ||||||||||||
| 10 | Vectren Corporation | 279 | ||||||||||||
| 190 | Wisconsin Energy Corporation | 5,957 | ||||||||||||
| 370 | Xcel Energy, Inc. | 8,991 | ||||||||||||
Total Multi-Utilities | 79,562 | |||||||||||||
Office Electronics – 0.0% | ||||||||||||||
| 210 | Xerox Corporation | 2,186 | ||||||||||||
Oil, Gas & Consumable Fuels – 10.8% | ||||||||||||||
| 280 | Anadarko Petroleum Corporation | 21,493 | ||||||||||||
| 130 | Apache Corporation | 16,041 | ||||||||||||
| 110 | Arch Coal Inc. | 2,933 | ||||||||||||
| 250 | Berry Petroleum Company | 13,283 | ||||||||||||
| 90 | Bill Barrett Corporation, (2) | 4,172 | ||||||||||||
| 500 | Brigham Exploration Company, (2) | 14,965 | ||||||||||||
| 10 | Cabot Oil & Gas Corporation | 663 | ||||||||||||
| 60 | Carrizo Oil & Gas, Inc., (2) | 2,505 | ||||||||||||
| Nuveen Investments | 37 |
Portfolio of Investments
Nuveen U.S. Equity Completeness Fund (continued)
June 30, 2011
| Shares | Description (1) | Value | ||||||||||||
Oil, Gas & Consumable Fuels (continued) | ||||||||||||||
| 650 | Cheniere Energy Inc. | $ | 5,954 | |||||||||||
| 470 | Chesapeake Energy Corporation | 13,954 | ||||||||||||
| 990 | Chevron Corporation | 101,812 | ||||||||||||
| 70 | Cimarex Energy Company | 6,294 | ||||||||||||
| 10 | Cobalt International Energy, Inc., (2) | 136 | ||||||||||||
| 70 | Concho Resources Inc., (2) | 6,430 | ||||||||||||
| 980 | ConocoPhillips | 73,686 | ||||||||||||
| 50 | CONSOL Energy Inc. | 2,424 | ||||||||||||
| 20 | Continental Resources Inc., (2) | 1,298 | ||||||||||||
| 260 | Crosstex Energy, Inc., (2) | 3,094 | ||||||||||||
| 420 | Denbury Resources Inc., (2) | 8,400 | ||||||||||||
| 160 | Devon Energy Corporation | 12,610 | ||||||||||||
| 460 | El Paso Corporation | 9,292 | ||||||||||||
| 100 | Energen Corporation | 5,650 | ||||||||||||
| 130 | Energy Partners Limited | 1,925 | ||||||||||||
| 160 | Energy XXI Limited Bermuda | 5,315 | ||||||||||||
| 80 | EOG Resources, Inc. | 8,364 | ||||||||||||
| 50 | EQT Corporation | 2,626 | ||||||||||||
| 40 | Exco Resources Inc. | 706 | ||||||||||||
| 2,990 | Exxon Mobil Corporation | 243,257 | ||||||||||||
| 150 | Frontline Limited | 2,211 | ||||||||||||
| 50 | GeoResources, Inc. | 1,125 | ||||||||||||
| 140 | Hess Corporation | 10,466 | ||||||||||||
| 960 | Kodiak Oil & Gas Corporation | 5,539 | ||||||||||||
| 450 | Marathon Oil Corporation | 23,706 | ||||||||||||
| 20 | McMoran Exploration Corporation, (2) | 370 | ||||||||||||
| 70 | Murphy Oil Corporation | 4,596 | ||||||||||||
| 30 | Newfield Exploration Company, (2) | 2,041 | ||||||||||||
| 20 | Noble Energy, Inc. | 1,793 | ||||||||||||
| 80 | Nordic American Tanker Shipping Ltd | 1,819 | ||||||||||||
| 150 | Northern Oil and Gas Inc., (2) | 3,323 | ||||||||||||
| 100 | Oasis Petroleum Inc. | 2,968 | ||||||||||||
| 300 | Occidental Petroleum Corporation | 31,212 | ||||||||||||
| 50 | Overseas Shipholding Group Inc. | 1,347 | ||||||||||||
| 50 | Panhandle Oil and Gas Inc. | 1,475 | ||||||||||||
| 10 | Patriot Coal Corporation, (2) | 223 | ||||||||||||
| 50 | Peabody Energy Corporation | 2,946 | ||||||||||||
| 110 | Penn Virginia Corporation | 1,453 | ||||||||||||
| 30 | Pertoleum Development Corporation, (2) | 897 | ||||||||||||
| 50 | Petrohawk Energy Corporation, (2) | 1,234 | ||||||||||||
| 270 | Petroquest Energy Inc., (2) | 1,895 | ||||||||||||
| 20 | Pioneer Natural Resources Company | 1,791 | ||||||||||||
| 10 | Plains Exploration & Production Company, (2) | 381 | ||||||||||||
| 20 | QEP Resources Inc., (2) | 837 | ||||||||||||
| 60 | Quicksilver Resources Inc., (2) | 886 | ||||||||||||
| 38 | Nuveen Investments |
| Shares | Description (1) | Value | ||||||||||||
Oil, Gas & Consumable Fuels (continued) | ||||||||||||||
| 60 | Range Resources Corporation | $ | 3,330 | |||||||||||
| 110 | Rosetta Resources, Inc., (2) | 5,669 | ||||||||||||
| 520 | SandRidge Energy Inc., (2) | 5,543 | ||||||||||||
| 30 | Ship Financial International Limited | 541 | ||||||||||||
| 20 | SM Energy Company | 1,470 | ||||||||||||
| 10 | Southwestern Energy Company, (2) | 429 | ||||||||||||
| 430 | Spectra Energy Corporation | 11,786 | ||||||||||||
| 130 | Stone Energy Corporation, (2) | 3,951 | ||||||||||||
| 110 | Sunoco, Inc. | 4,588 | ||||||||||||
| 60 | Swift Energy Company, (2) | 2,236 | ||||||||||||
| 200 | Teekay Tankers Limited, Class A Shares | 1,880 | ||||||||||||
| 170 | Tesoro Corporation | 3,895 | ||||||||||||
| 50 | TransAtlantic Petroleum Limited | 85 | ||||||||||||
| 30 | Ultra Petroleum Corporation, (2) | 1,374 | ||||||||||||
| 740 | Uranium Energy Corporation | 2,264 | ||||||||||||
| 290 | Vaalco Energy Inc. | 1,746 | ||||||||||||
| 200 | Valero Energy Corporation | 5,114 | ||||||||||||
| 40 | Venoco Inc. | 510 | ||||||||||||
| 680 | Warren Resources Inc., (2) | 2,591 | ||||||||||||
| 200 | Western Refining Inc. | 3,614 | ||||||||||||
| 10 | Whiting Petroleum Corporation, (2) | 569 | ||||||||||||
| 260 | Williams Companies, Inc. | 7,865 | ||||||||||||
| 120 | World Fuel Services Corporation | 4,312 | ||||||||||||
Total Oil, Gas & Consumable Fuels | 771,178 | |||||||||||||
Paper & Forest Products – 0.3% | ||||||||||||||
| 40 | Clearwater Paper Corporation | 2,731 | ||||||||||||
| 20 | Deltic Timber Corporation | 1,074 | ||||||||||||
| 520 | International Paper Company | 15,506 | ||||||||||||
| 110 | Louisiana-Pacific Corporation, (2) | 895 | ||||||||||||
| 40 | MeadWestvaco Corporation | 1,332 | ||||||||||||
| 120 | Neenah Paper, Inc. | 2,554 | ||||||||||||
Total Paper & Forest Products | 24,092 | |||||||||||||
Personal Products – 0.1% | ||||||||||||||
| 120 | Avon Products, Inc. | 3,360 | ||||||||||||
| 40 | Estee Lauder Companies Inc., Class A | 4,208 | ||||||||||||
| 30 | Herbalife, Limited | 1,729 | ||||||||||||
| 20 | Inter Parfums, Inc. | 461 | ||||||||||||
| 30 | USANA Health Sciences, Inc. | 938 | ||||||||||||
Total Personal Products | 10,696 | |||||||||||||
Pharmaceuticals – 2.9% | ||||||||||||||
| 390 | Abbott Laboratories | 20,522 | ||||||||||||
| 240 | Akorn, Inc. | 1,680 | ||||||||||||
| 120 | Allergan, Inc. | 9,990 | ||||||||||||
| 440 | Avanir Pharmaceuticals | 1,478 | ||||||||||||
| 390 | Bristol-Myers Squibb Company | 11,294 | ||||||||||||
| Nuveen Investments | 39 |
Portfolio of Investments
Nuveen U.S. Equity Completeness Fund (continued)
June 30, 2011
| Shares | Description (1) | Value | ||||||||||||
Pharmaceuticals (continued) | ||||||||||||||
| 70 | Cadence Pharmaceuticals, Inc. | $ | 644 | |||||||||||
| 120 | DepoMed, Inc. (2) | 982 | ||||||||||||
| 330 | Durect Corporation | 670 | ||||||||||||
| 660 | Eli Lilly and Company | 24,770 | ||||||||||||
| 140 | Forest Laboratories, Inc., (2) | 5,508 | ||||||||||||
| 720 | Johnson & Johnson | 47,894 | ||||||||||||
| 110 | Medicines Company | 1,816 | ||||||||||||
| 690 | Merck & Company Inc. | 24,350 | ||||||||||||
| 200 | Mylan Laboratories Inc., (2) | 4,934 | ||||||||||||
| 10 | Nektar Therapautics, (2) | 73 | ||||||||||||
| 10 | Obagi Medical Products, Inc. | 94 | ||||||||||||
| 130 | Optimer Pharmaceuticals, Inc., (2) | 1,546 | ||||||||||||
| 40 | Pain Therapeutics, Inc., (2) | 155 | ||||||||||||
| 20 | Par Pharmaceuticals Inc., (2) | 660 | ||||||||||||
| 50 | Perrigo Company | 4,394 | ||||||||||||
| 1,620 | Pfizer Inc. | 33,372 | ||||||||||||
| 370 | Questcor Pharmaceuticals Inc. | 8,917 | ||||||||||||
| 120 | ViroPharma, Inc., (2) | 2,220 | ||||||||||||
| 280 | Vivus, Inc., (2) | 2,279 | ||||||||||||
Total Pharmaceuticals | 210,242 | |||||||||||||
Professional Services – 0.4% | ||||||||||||||
| 80 | Acacia Research, (2) | 2,935 | ||||||||||||
| 80 | Corporate Executive Board Company | 3,492 | ||||||||||||
| 30 | CoStar Group, Inc., (2) | 1,778 | ||||||||||||
| 50 | Dun and Bradstreet Inc. | 3,777 | ||||||||||||
| 40 | Exponent, Inc. | 1,740 | ||||||||||||
| 10 | FTI Consulting Inc., (2) | 379 | ||||||||||||
| 20 | Huron Consulting Group, Inc. | 604 | ||||||||||||
| 20 | IHS Inc., (2) | 1,668 | ||||||||||||
| 70 | Insperity Inc. | 2,073 | ||||||||||||
| 20 | KForce Inc. | 262 | ||||||||||||
| 160 | Korn Ferry International, (2) | 3,518 | ||||||||||||
| 10 | Manpower Inc. | 537 | ||||||||||||
| 160 | On Assignment, Inc. | 1,573 | ||||||||||||
| 50 | Resources Connection, Inc., (2) | 602 | ||||||||||||
| 30 | Robert Half International Inc. | 811 | ||||||||||||
| 90 | SFN Group, (2) | 818 | ||||||||||||
| 20 | The Advisory Board Company, (2) | 1,158 | ||||||||||||
Total Professional Services | 27,725 | |||||||||||||
Real Estate Investment Trust – 2.5% | ||||||||||||||
| 70 | Agree Realty Corporation | 1,563 | ||||||||||||
| 40 | American Campus Communities Inc. | 1,421 | ||||||||||||
| 110 | American Capital Agency Corporation | 3,202 | ||||||||||||
| 240 | Anworth Mortgage Asset Corporation | 1,802 | ||||||||||||
| 40 | Apollo Commercial Real Estate Finance, Inc. | 645 | ||||||||||||
| 40 | Nuveen Investments |
| Shares | Description (1) | Value | ||||||||||||
Real Estate Investment Trust (continued) | ||||||||||||||
| 190 | Ashford Hospitality Trust Inc. | $ | 2,366 | |||||||||||
| 30 | AvalonBay Communities, Inc. | 3,852 | ||||||||||||
| 100 | BioMed Realty Trust Inc. | 1,924 | ||||||||||||
| 360 | Campus Crest Communities Inc. | 4,658 | ||||||||||||
| 380 | CapLease Inc. | 1,866 | ||||||||||||
| 120 | Capstead Mortgage Corporation | 1,608 | ||||||||||||
| 420 | CBL & Associates Properties Inc. | 7,615 | ||||||||||||
| 130 | Cedar Shopping Centers Inc. | 670 | ||||||||||||
| 110 | Colonial Properties Trust | 2,244 | ||||||||||||
| 120 | CommonWealth REIT | 3,101 | ||||||||||||
| 60 | Cypress Sharpridge Investments Inc. | 769 | ||||||||||||
| 620 | DCT Industrial Trust Inc. | 3,243 | ||||||||||||
| 120 | DiamondRock Hospitality Company, (2) | 1,288 | ||||||||||||
| 20 | Digital Realty Trust Inc. | 1,236 | ||||||||||||
| 210 | Duke Realty Corporation | 2,942 | ||||||||||||
| 130 | Dupont Fabros Technology Inc. | 3,276 | ||||||||||||
| 210 | Dynex Capital, Inc. | 2,033 | ||||||||||||
| 90 | EastGroup Properties Inc. | 3,826 | ||||||||||||
| 190 | Education Realty Trust Inc. | 1,628 | ||||||||||||
| 50 | Entertainment Properties Trust | 2,335 | ||||||||||||
| 20 | Equity Lifestyles Properties Inc. | 1,249 | ||||||||||||
| 40 | Equity Residential | 2,400 | ||||||||||||
| 10 | Essex Property Trust Inc. | 1,353 | ||||||||||||
| 100 | Extra Space Storage Inc. | 2,133 | ||||||||||||
| 10 | Federal Realty Investment Trust | 852 | ||||||||||||
| 70 | Franklin Street Properties Corporation | 904 | ||||||||||||
| 110 | Getty Realty Corporation | 2,775 | ||||||||||||
| 150 | Glimcher Realty Trust | 1,425 | ||||||||||||
| 80 | Hatteras Financial Corp. | 2,258 | ||||||||||||
| 20 | Health Care REIT, Inc. | 1,049 | ||||||||||||
| 40 | Healthcare Realty Trust, Inc. | 825 | ||||||||||||
| 160 | Hersha Hospitality Trust | 891 | ||||||||||||
| 50 | Highwoods Properties, Inc. | 1,657 | ||||||||||||
| 30 | Home Properties New York, Inc. | 1,826 | ||||||||||||
| 40 | Invesco Mortgage Capital Inc. | 845 | ||||||||||||
| 220 | iStar Financial Inc. | 1,784 | ||||||||||||
| 50 | Kilroy Realty Corporation | 1,975 | ||||||||||||
| 60 | Kimco Realty Corporation | 1,118 | ||||||||||||
| 320 | Kite Realty Group Trust | 1,594 | ||||||||||||
| 70 | LaSalle Hotel Properties | 1,844 | ||||||||||||
| 160 | Lexington Corporate Properties Trust | 1,461 | ||||||||||||
| 20 | Macerich Company | 1,070 | ||||||||||||
| 90 | Medical Properties Trust Inc. | 1,035 | ||||||||||||
| 400 | MFA Mortgage Investments, Inc. | 3,216 | ||||||||||||
| 20 | Mid-America Apartment Communities | 1,349 | ||||||||||||
| Nuveen Investments | 41 |
Portfolio of Investments
Nuveen U.S. Equity Completeness Fund (continued)
June 30, 2011
| Shares | Description (1) | Value | ||||||||||||
Real Estate Investment Trust (continued) | ||||||||||||||
| 150 | Monmouth Real Estate Investment Corporation | $ | 1,268 | |||||||||||
| 30 | National Health Investors Inc. | 1,333 | ||||||||||||
| 80 | National Retail Properties, Inc. | 1,961 | ||||||||||||
| 220 | Omega Healthcare Investors Inc. | 4,622 | ||||||||||||
| 140 | Penn Real Estate Investment Trust | 2,198 | ||||||||||||
| 20 | Plum Creek Timber Company | 811 | ||||||||||||
| 140 | Post Properties, Inc. | 5,706 | ||||||||||||
| 50 | Potlatch Corporation | 1,764 | ||||||||||||
| 140 | Prologis Inc. | 5,018 | ||||||||||||
| 70 | PS Business Parks Inc. | 3,857 | ||||||||||||
| 40 | Public Storage, Inc. | 4,560 | ||||||||||||
| 120 | Ramco-Gershenson Properties Trust | 1,486 | ||||||||||||
| 80 | Rayonier Inc. | 5,228 | ||||||||||||
| 80 | Redwood Trust Inc. | 1,210 | ||||||||||||
| 280 | Resource Capital Corporation | 1,770 | ||||||||||||
| 150 | Retail Opportunity Investments Corporation | 1,614 | ||||||||||||
| 30 | Sabra Health Care Real Estate Investment Trust Inc. | 501 | ||||||||||||
| 100 | Senior Housing Properties Trust | 2,341 | ||||||||||||
| 70 | Simon Property Group, Inc. | 8,136 | ||||||||||||
| 60 | Sovran Self Storage Inc. | 2,460 | ||||||||||||
| 70 | Starwood Property Trust Inc. | 1,436 | ||||||||||||
| 730 | Strategic Hotels & Resorts Inc. | 5,168 | ||||||||||||
| 40 | Sun Communities Inc. | 1,492 | ||||||||||||
| 50 | Sunstone Hotel Investors Inc., (2) | 464 | ||||||||||||
| 60 | Tanger Factory Outlet Centers | 1,606 | ||||||||||||
| 100 | U-Store-It Trust | 1,052 | ||||||||||||
| 20 | Ventas Inc. | 1,054 | ||||||||||||
| 20 | Vornado Realty Trust | 1,864 | ||||||||||||
| 110 | Washington Real Estate Investment Trust | 3,577 | ||||||||||||
| 290 | Weyerhaeuser Company | 6,339 | ||||||||||||
| 60 | Winthrop Realty Trust, Inc. | 716 | ||||||||||||
Total Real Estate Investment Trust | 182,613 | |||||||||||||
Real Estate Management & Development – 0.2% | ||||||||||||||
| 120 | CB Richard Ellis Group, Inc., Class A, (2) | 3,013 | ||||||||||||
| 50 | Forest City Enterprises, Inc., (2) | 934 | ||||||||||||
| 70 | Howard Hughes Corporation | 4,553 | ||||||||||||
| 20 | Jones Lang LaSalle Inc. | 1,886 | ||||||||||||
| 10 | Tejon Ranch Company, (2) | 341 | ||||||||||||
Total Real Estate Management & Development | 10,727 | |||||||||||||
Road & Rail – 1.0% | ||||||||||||||
| 10 | AMERCO | 962 | ||||||||||||
| 340 | Avis Budget Group Inc., (2) | 5,811 | ||||||||||||
| 10 | Con-Way, Inc. | 388 | ||||||||||||
| 780 | CSX Corporation | 20,452 | ||||||||||||
| 70 | Genesee & Wyoming Inc. | 4,105 | ||||||||||||
| 42 | Nuveen Investments |
| Shares | Description (1) | Value | ||||||||||||
Road & Rail (continued) | ||||||||||||||
| 20 | Marten Transport, Ltd., (2) | $ | 432 | |||||||||||
| 120 | Norfolk Southern Corporation | 8,992 | ||||||||||||
| 130 | Old Dominion Frght Line | 4,849 | ||||||||||||
| 190 | Union Pacific Corporation | 19,836 | ||||||||||||
| 140 | Werner Enterprises, Inc. | 3,507 | ||||||||||||
Total Road & Rail | 69,334 | |||||||||||||
Semiconductors & Equipment – 4.0% | ||||||||||||||
| 40 | Advanced Energy Industriess Inc. | 592 | ||||||||||||
| 60 | Advanced Micro Devices, Inc., (2) | 419 | ||||||||||||
| 180 | Altera Corporation | 8,343 | ||||||||||||
| 180 | Amkor Technology Inc., (2) | 1,111 | ||||||||||||
| 60 | Anadigics Inc. | 193 | ||||||||||||
| 150 | Analog Devices, Inc. | 5,871 | ||||||||||||
| 550 | Applied Materials, Inc. | 7,156 | ||||||||||||
| 10 | Applied Micro Circuits Corporation | 89 | ||||||||||||
| 810 | Atmel Corporation, (2) | 11,397 | ||||||||||||
| 180 | Broadcom Corporation, Class A | 6,055 | ||||||||||||
| 20 | Cabot Microelectronics Corporation, (2) | 929 | ||||||||||||
| 60 | Cavium Networks Inc. | 2,615 | ||||||||||||
| 80 | CEVA, Inc. | 2,437 | ||||||||||||
| 240 | Cirrus Logic Inc., (2) | 3,816 | ||||||||||||
| 20 | Cohu Inc. | 262 | ||||||||||||
| 40 | Cymer, Inc., (2) | 1,980 | ||||||||||||
| 120 | Diodes Inc., (2) | 3,132 | ||||||||||||
| 530 | Entegris Inc. | 5,364 | ||||||||||||
| 360 | Fairchild Semiconductor International Inc., Class A, (2) | 6,016 | ||||||||||||
| 140 | FEI Company, (2) | 5,347 | ||||||||||||
| 20 | First Solar Inc., (2) | 2,645 | ||||||||||||
| 170 | GSI Technology Inc. | 1,224 | ||||||||||||
| 70 | Hittite Microwave Corporation, (2) | 4,334 | ||||||||||||
| 190 | Integrated Device Technology, Inc., (2) | 1,493 | ||||||||||||
| 2,710 | Intel Corporation | 60,054 | ||||||||||||
| 110 | International Rectifier Corporation, (2) | 3,077 | ||||||||||||
| 40 | IXYS Corporation, (2) | 599 | ||||||||||||
| 150 | KLA-Tencor Corporation | 6,072 | ||||||||||||
| 80 | Kopin Corporation | 377 | ||||||||||||
| 80 | Lam Research Corporation, (2) | 3,542 | ||||||||||||
| 200 | Linear Technology Corporation | 6,604 | ||||||||||||
| 30 | LSI Logic Corporation, (2) | 214 | ||||||||||||
| 210 | Marvell Technology Group Ltd., (2) | 3,101 | ||||||||||||
| 160 | Maxim Integrated Products, Inc. | 4,090 | ||||||||||||
| 100 | Microchip Technology Incorporated | 3,791 | ||||||||||||
| 560 | Micron Technology, Inc., (2) | 4,189 | ||||||||||||
| 250 | Microsemi Corporation, (2) | 5,125 | ||||||||||||
| 40 | Mindspeed Technologies, Inc. | 320 | ||||||||||||
| Nuveen Investments | 43 |
Portfolio of Investments
Nuveen U.S. Equity Completeness Fund (continued)
June 30, 2011
| Shares | Description (1) | Value | ||||||||||||
Semiconductors & Equipment (continued) | ||||||||||||||
| 100 | MIPS Technologies, Inc., (2) | $ | 691 | |||||||||||
| 120 | MKS Instruments Inc. | 3,170 | ||||||||||||
| 10 | Monolithic Power Systems, Inc., (2) | 154 | ||||||||||||
| 60 | Nanometrics Inc. | 1,139 | ||||||||||||
| 100 | National Semiconductor Corporation | 2,461 | ||||||||||||
| 80 | Netlogic Microsystems Inc., (2) | 3,234 | ||||||||||||
| 10 | Novellus Systems, Inc., (2) | 361 | ||||||||||||
| 220 | NVIDIA Corporation, (2) | 3,506 | ||||||||||||
| 110 | Omnivision Technologies, Inc. | 3,829 | ||||||||||||
| 790 | ON Semiconductor Corporation, (2) | 8,271 | ||||||||||||
| 550 | Photronics Inc., (2) | 4,659 | ||||||||||||
| 10 | PMC-Sierra, Inc., (2) | 76 | ||||||||||||
| 20 | Power Integrations Inc. | 769 | ||||||||||||
| 910 | RF Micro Devices, Inc., (2) | 5,569 | ||||||||||||
| 10 | Rubicon Technology Inc., (2) | 169 | ||||||||||||
| 90 | Rudolph Technologies, (2) | 964 | ||||||||||||
| 80 | Semtech Corporation, (2) | 2,187 | ||||||||||||
| 30 | Sigma Designs, Inc. | 229 | ||||||||||||
| 410 | Silicon Image, Inc., (2) | 2,649 | ||||||||||||
| 300 | Skyworks Solutions Inc., (2) | 6,894 | ||||||||||||
| 3 | SunPower Corporation, (2) | 58 | ||||||||||||
| 130 | Teradyne Inc., (2) | 1,924 | ||||||||||||
| 20 | Tessera Technologies Inc., (2) | 343 | ||||||||||||
| 550 | Texas Instruments Incorporated | 18,057 | ||||||||||||
| 440 | TriQuint Semiconductor, Inc., (2) | 4,484 | ||||||||||||
| 80 | Ultratech Stepper Inc. | 2,430 | ||||||||||||
| 120 | Varian Semiconductor Equipment Associate, (2) | 7,373 | ||||||||||||
| 140 | Veeco Instruments Inc., (2) | 6,777 | ||||||||||||
| 210 | Xilinx, Inc. | 7,659 | ||||||||||||
Total Semiconductors & Equipment | 284,061 | |||||||||||||
Software – 3.4% | ||||||||||||||
| 200 | Accelrys, Inc. | 1,422 | ||||||||||||
| 110 | ACI Worldwide, Inc., (2) | 3,715 | ||||||||||||
| 40 | Activision Blizzard Inc. | 467 | ||||||||||||
| 160 | Actuate Corporation | 936 | ||||||||||||
| 10 | Adobe Systems Incorporated, (2) | 315 | ||||||||||||
| 40 | Advent Software Inc., (2) | 1,127 | ||||||||||||
| 20 | Ansys Inc., (2) | 1,093 | ||||||||||||
| 180 | Ariba Inc., (2) | 6,205 | ||||||||||||
| 280 | Aspen Technology Inc. | 4,810 | ||||||||||||
| 60 | Autodesk, Inc., (2) | 2,316 | ||||||||||||
| 90 | Blackbaud, Inc. | 2,495 | ||||||||||||
| 60 | BMC Software, Inc., (2) | 3,282 | ||||||||||||
| 170 | CA Inc. | 3,883 | ||||||||||||
| 130 | Citrix Systems, (2) | 10,400 | ||||||||||||
| 44 | Nuveen Investments |
| Shares | Description (1) | Value | ||||||||||||
Software (continued) | ||||||||||||||
| 60 | CommVault Systems, Inc., (2) | $ | 2,667 | |||||||||||
| 60 | Concur Technologies, Inc., (2) | 3,004 | ||||||||||||
| 10 | Deltek Inc. | 75 | ||||||||||||
| 80 | Ebix, Inc., (2) | 1,524 | ||||||||||||
| 10 | Electronic Arts Inc. (EA), (2) | 236 | ||||||||||||
| 70 | FactSet Research Systems Inc. | 7,162 | ||||||||||||
| 40 | Fair Isaac Corporation | 1,208 | ||||||||||||
| 190 | Fortinet Inc. | 5,185 | ||||||||||||
| 110 | Informatica Corporation, (2) | 6,427 | ||||||||||||
| 100 | Intuit, Inc., (2) | 5,186 | ||||||||||||
| 20 | JDA Software Group, (2) | 618 | ||||||||||||
| 60 | Kenexa Corporation | 1,439 | ||||||||||||
| 210 | Lawson Software, Inc., (2) | 2,356 | ||||||||||||
| 350 | Mentor Graphics Corporation | 4,484 | ||||||||||||
| 1,920 | Microsoft Corporation | 49,920 | ||||||||||||
| 30 | Microstrategy Inc., (2) | 4,880 | ||||||||||||
| 160 | Monotype Imaging Holdings Inc. | 2,261 | ||||||||||||
| 110 | NetScout Systems, Inc., (2) | 2,298 | ||||||||||||
| 40 | Nuance Communications, Inc., (2) | 859 | ||||||||||||
| 1,310 | Oracle Corporation | 43,112 | ||||||||||||
| 120 | Parametric Technology Corporation, (2) | 2,752 | ||||||||||||
| 110 | Progress Software Corporation, (2) | 2,654 | ||||||||||||
| 30 | PROS Holdings, Inc., (2) | 525 | ||||||||||||
| 20 | QLIK Technologies Inc. | 681 | ||||||||||||
| 110 | Quest Software Inc., (2) | 2,500 | ||||||||||||
| 10 | Radiant Systems, Inc., (2) | 209 | ||||||||||||
| 10 | RealPage Inc. | 265 | ||||||||||||
| 50 | Red Hat, Inc., (2) | 2,295 | ||||||||||||
| 30 | Renaissance Learning Inc. | 376 | ||||||||||||
| 40 | Rovi Corporation, (2) | 2,294 | ||||||||||||
| 60 | Salesforce.com, Inc., (2) | 8,939 | ||||||||||||
| 10 | Solarwinds, Inc., (2) | 261 | ||||||||||||
| 50 | Solera Holdings Inc. | 2,958 | ||||||||||||
| 140 | SS&C Technologies Holdings Inc. | 2,782 | ||||||||||||
| 110 | SuccessFactors, Inc., (2) | 3,234 | ||||||||||||
| 50 | Symantec Corporation, (2) | 986 | ||||||||||||
| 120 | Synchronoss Technologies, Inc. | 3,808 | ||||||||||||
| 40 | Synopsys Inc., (2) | 1,028 | ||||||||||||
| 220 | Take-Two Interactive Software, Inc., (2) | 3,362 | ||||||||||||
| 30 | Taleo Corporation, (2) | 1,111 | ||||||||||||
| 170 | THQ, Inc., (2) | 615 | ||||||||||||
| 390 | Tibco Software Inc., (2) | 11,318 | ||||||||||||
| 40 | Ultimate Software Group, Inc., (2) | 2,177 | ||||||||||||
Total Software | 244,497 | |||||||||||||
| Nuveen Investments | 45 |
Portfolio of Investments
Nuveen U.S. Equity Completeness Fund (continued)
June 30, 2011
| Shares | Description (1) | Value | ||||||||||||
Specialty Retail – 2.6% | ||||||||||||||
| 30 | Abercrombie & Fitch Co., Class A | $ | 2,008 | |||||||||||
| 60 | Advance Auto Parts, Inc. | 3,509 | ||||||||||||
| 60 | Aeropostale, Inc., (2) | 1,050 | ||||||||||||
| 80 | American Eagle Outfitters, Inc. | 1,020 | ||||||||||||
| 20 | America’s Car-Mart, Inc., (2) | 660 | ||||||||||||
| 130 | Ann Inc. | 3,393 | ||||||||||||
| 180 | Ascena Retail Group Inc. | 6,129 | ||||||||||||
| 20 | AutoZone, Inc., (2) | 5,897 | ||||||||||||
| 80 | Bed Bath and Beyond Inc., (2) | 4,670 | ||||||||||||
| 190 | Best Buy Co., Inc. | 5,968 | ||||||||||||
| 40 | Buckle Inc. | 1,708 | ||||||||||||
| 130 | CarMax, Inc., (2) | 4,299 | ||||||||||||
| 420 | Casual Male Retail Group Inc. | 1,743 | ||||||||||||
| 70 | Cato Corporation | 2,016 | ||||||||||||
| 70 | Chico’s FAS, Inc. | 1,066 | ||||||||||||
| 50 | Childrens Place Retail Stores Inc., (2) | 2,225 | ||||||||||||
| 170 | Colective Brands Inc., (2) | 2,497 | ||||||||||||
| 60 | Destination Maternity Corporation | 1,199 | ||||||||||||
| 90 | Dick’s Sporting Goods Inc., (2) | 3,461 | ||||||||||||
| 10 | DSW Inc., (2) | 506 | ||||||||||||
| 90 | GameStop Corporation, (2) | 2,400 | ||||||||||||
| 180 | Gap, Inc. | 3,258 | ||||||||||||
| 60 | Guess Inc. | 2,524 | ||||||||||||
| 70 | Hhgregg Inc., (2) | 938 | ||||||||||||
| 10 | Hibbett Sporting Goods, Inc., (2) | 407 | ||||||||||||
| 680 | Home Depot, Inc. | 24,630 | ||||||||||||
| 40 | Joseph A Bank Clothiers, Inc., (2) | 2,000 | ||||||||||||
| 60 | Kirkland’s, Inc., (2) | 721 | ||||||||||||
| 220 | Limited Brands, Inc. | 8,459 | ||||||||||||
| 590 | Lowe’s Companies, Inc. | 13,753 | ||||||||||||
| 60 | Mens Wearhouse Inc. | 2,022 | ||||||||||||
| 50 | Monro Muffler Brake, Inc. | 1,865 | ||||||||||||
| 200 | OfficeMax Inc., (2) | 1,570 | ||||||||||||
| 50 | O’Reilly Automotive Inc. | 3,276 | ||||||||||||
| 200 | Pacific Sunwear of California, Inc., (2) | 522 | ||||||||||||
| 50 | PetSmart Inc. | 2,269 | ||||||||||||
| 230 | Pier 1 Imports, Inc. | 2,661 | ||||||||||||
| 120 | RadioShack Corporation | 1,597 | ||||||||||||
| 290 | Rent-A-Center Inc., (2) | 8,862 | ||||||||||||
| 100 | Ross Stores, Inc. | 8,012 | ||||||||||||
| 20 | Shoe Carnival, Inc., (2) | 603 | ||||||||||||
| 10 | Signet Jewelers Limited, (2) | 468 | ||||||||||||
| 310 | Sonic Automotive Inc. | 4,542 | ||||||||||||
| 40 | Stage Stores Inc. | 672 | ||||||||||||
| 220 | Staples, Inc. | 3,476 | ||||||||||||
| 46 | Nuveen Investments |
| Shares | Description (1) | Value | ||||||||||||
Specialty Retail (continued) | ||||||||||||||
| 70 | Stein Mart, Inc. | $ | 675 | |||||||||||
| 50 | Tiffany & Co. | 3,926 | ||||||||||||
| 190 | TJX Companies, Inc. | 9,981 | ||||||||||||
| 50 | Tractor Supply Company | 3,344 | ||||||||||||
| 170 | Ulta Salon, Cosmetics & Fragrance, Inc. | 10,979 | ||||||||||||
| 20 | Urban Outfitters, Inc., (2) | 563 | ||||||||||||
| 160 | Wet Seal Inc. | 715 | ||||||||||||
| 20 | Williams-Sonoma Inc. | 730 | ||||||||||||
| 40 | Zumiez, Inc., (2) | 999 | ||||||||||||
Total Specialty Retail | 188,443 | |||||||||||||
Textiles, Apparel & Luxury Goods – 1.0% | ||||||||||||||
| 40 | Carter’s Inc., (2) | 1,230 | ||||||||||||
| 150 | Coach, Inc. | 9,590 | ||||||||||||
| 160 | Deckers Outdoor Corporation, (2) | 14,102 | ||||||||||||
| 20 | Fossil Inc., (2) | 2,354 | ||||||||||||
| 60 | G III Apparel Group, Limited | 2,069 | ||||||||||||
| 380 | Iconix Brand Group, Inc. | 9,196 | ||||||||||||
| 50 | Jones Apparel Group Inc. | 543 | ||||||||||||
| 50 | K Swiss, Inc., (2) | 532 | ||||||||||||
| 100 | Maidenform Brands Inc., (2) | 2,766 | ||||||||||||
| 120 | Nike, Inc., Class B | 10,798 | ||||||||||||
| 120 | Perry Ellis International, Inc. | 3,030 | ||||||||||||
| 60 | Polo Ralph Lauren Corporation | 7,957 | ||||||||||||
| 70 | Under Armour, Inc., (2) | 5,412 | ||||||||||||
| 10 | VF Corporation | 1,086 | ||||||||||||
| 70 | Warnaco Group, Inc., (2) | 3,658 | ||||||||||||
Total Textiles, Apparel & Luxury Goods | 74,323 | |||||||||||||
Thrifts & Mortgage Finance – 0.3% | ||||||||||||||
| 70 | Bank Mutual Corporation | 257 | ||||||||||||
| 20 | Beneficial Mutual Bancorp Inc., (2) | 164 | ||||||||||||
| 30 | Berkshire Hills Bancorp, Inc. | 672 | ||||||||||||
| 120 | Brookline Bancorp, Inc. | 1,112 | ||||||||||||
| 220 | Flushing Financial Corporation | 2,860 | ||||||||||||
| 380 | Hudson City Bancorp, Inc. | 3,112 | ||||||||||||
| 140 | MGIC Investment Corporation, (2) | 833 | ||||||||||||
| 60 | New York Community Bancorp Inc. | 899 | ||||||||||||
| 30 | Northwest Bancshares Inc. | 377 | ||||||||||||
| 180 | Ocwen Financial Corporation | 2,297 | ||||||||||||
| 30 | People’s United Financial, Inc. | 403 | ||||||||||||
| 220 | Provident Financial Services Inc. | 3,150 | ||||||||||||
| 530 | Radian Group Inc. | 2,242 | ||||||||||||
| 20 | TFS Financial Corporation | 194 | ||||||||||||
| 250 | TrustCo Bank Corporation NY | 1,225 | ||||||||||||
| 50 | ViewPoint Financial Group | 690 | ||||||||||||
| 30 | Washington Federal Inc. | 493 | ||||||||||||
| 180 | Westfield Financial Inc. | 1,462 | ||||||||||||
Total Thrifts & Mortgage Finance | 22,442 | |||||||||||||
| Nuveen Investments | 47 |
Portfolio of Investments
Nuveen U.S. Equity Completeness Fund (continued)
June 30, 2011
| Shares | Description (1) | Value | ||||||||||||||||
Tobacco – 1.1% | ||||||||||||||||||
| 710 | Altria Group, Inc. | $ | 18,751 | |||||||||||||||
| 30 | Lorillard Inc. | 3,266 | ||||||||||||||||
| 690 | Philip Morris International | 46,071 | ||||||||||||||||
| 280 | Reynolds American Inc. | 10,374 | ||||||||||||||||
Total Tobacco | 78,462 | |||||||||||||||||
Trading Companies & Distributors – 0.4% | ||||||||||||||||||
| 40 | Aircastle LTD | 509 | ||||||||||||||||
| 120 | CAI International Inc. | 2,479 | ||||||||||||||||
| 110 | DXP Enterprises, Inc. | 2,789 | ||||||||||||||||
| 70 | Fastenal Company | 2,519 | ||||||||||||||||
| 30 | Houston Wire & Cable Company | 467 | ||||||||||||||||
| 10 | MSC Industrial Direct Inc., Class A | 663 | ||||||||||||||||
| 460 | RSC Holdings, Inc. | 5,502 | ||||||||||||||||
| 90 | Textainer Group Holdings Limited | 2,767 | ||||||||||||||||
| 90 | Titan Machinery, Inc. | 2,590 | ||||||||||||||||
| 50 | W.W. Grainger, Inc. | 7,683 | ||||||||||||||||
| 20 | Watsco Inc. | 1,360 | ||||||||||||||||
| 30 | WESCO International Inc., (2) | 1,623 | ||||||||||||||||
Total Trading Companies & Distributors | 30,951 | |||||||||||||||||
Water Utilities – 0.1% | ||||||||||||||||||
| 340 | American Water Works Company | 10,013 | ||||||||||||||||
| 10 | Aqua America Inc. | 220 | ||||||||||||||||
| 10 | SJW Corporation | 242 | ||||||||||||||||
Total Water Utilities | 10,475 | |||||||||||||||||
Wireless Telecommunication Services – 0.5% | ||||||||||||||||||
| 70 | American Tower Corporation, (2) | 3,663 | ||||||||||||||||
| 190 | Clearwire Corporation, (2) | 718 | ||||||||||||||||
| 10 | Crown Castle International Corporation, (2) | 408 | ||||||||||||||||
| 20 | NII Holdings Inc., Class B, (2) | 848 | ||||||||||||||||
| 20 | Shenandoah Telecommunications Company | 340 | ||||||||||||||||
| 4,300 | Sprint Nextel Corporation, (2) | 23,177 | ||||||||||||||||
| 120 | Telephone and Data Systems Inc. | 3,730 | ||||||||||||||||
Total Wireless Telecommunication Services | 32,884 | |||||||||||||||||
Total Common Stocks (cost $6,041,302) | 7,174,789 | |||||||||||||||||
| Principal Amount (000) | Description (1) | Coupon | Maturity | Value | ||||||||||||||
SHORT-TERM INVESTMENTS – 3.5% | ||||||||||||||||||
| $ | 247 | Repurchase Agreement with State Street Bank, dated 6/30/11, repurchase price $247,472, collateralized by $255,000 U.S. Treasury Notes, 1.000%, due 4/30/12, value $257,116 | 0.010% | 7/01/11 | $ | 247,471 | ||||||||||||
Total Short-Term Investments (cost $247,471) | 247,471 | |||||||||||||||||
Total Investments (cost $6,288,773) – 103.6% | 7,422,260 | |||||||||||||||||
Other Assets Less Liabilities – (3.6)% | (258,418) | |||||||||||||||||
Net Assets – 100% | $ | 7,163,842 | ||||||||||||||||
| For Fund portfolio compliance purposes, the Fund’s industry classifications refer to any one or more of the industry sub-classifications used by one or more widely recognized market indexes or ratings group indexes, and/or as defined by Fund management. This definition may not apply for purposes of this report, which may combine industry sub-classifications into sectors for reporting ease. |
| (1) | All percentages shown in the Portfolio of Investments are based on net assets. |
| (2) | Non-income producing; issuer has not declared a dividend within the past twelve months. |
| ADR | American Depositary Receipt. |
See accompanying notes to financial statements.
| 48 | Nuveen Investments |
Statement of Assets and Liabilities
June 30, 2011
Assets | ||||
Investments, at value (cost $6,288,773) | $ | 7,422,260 | ||
Cash | 105 | |||
Receivables: | ||||
Dividends | 8,105 | |||
From Adviser | 16,919 | |||
Investments sold | 601,563 | |||
Total assets | 8,048,952 | |||
Liabilities | ||||
Payable for shares redeemed | 835,000 | |||
Accrued other expenses | 50,110 | |||
Total liabilities | 885,110 | |||
Net assets | $ | 7,163,842 | ||
Shares outstanding | 348,561 | |||
Net asset value per share | $ | 20.55 | ||
Net assets consist of: | ||||
Capital paid-in | $ | 7,091,661 | ||
Undistributed (Over-distribution of) net investment income | (151 | ) | ||
Accumulated net realized gain (loss) | (1,061,155 | ) | ||
Net unrealized appreciation (depreciation) | 1,133,487 | |||
Net assets | $ | 7,163,842 | ||
Authorized shares Par value per share | $ | Unlimited 0.01 |
|
See accompanying notes to financial statements.
| Nuveen Investments | 49 |
Year Ended June 30, 2011
Investment Income (net of tax withheld of $37) | $ | 142,312 | ||
Expenses | ||||
Management fees | 42,578 | |||
Shareholders’ servicing agent fees and expenses | 155 | |||
Custodian’s fees and expenses | 106,135 | |||
Trustees’ fees and expenses | 204 | |||
Professional fees | 24,239 | |||
Shareholders’ reports – printing and mailing expenses | 31,535 | |||
Federal and state registration fees | 346 | |||
Other expenses | 241 | |||
Total expenses before expense reimbursement | 205,433 | |||
Expense reimbursement | (142,734 | ) | ||
Net expenses | 62,699 | |||
Net investment income (loss) | 79,613 | |||
Realized and Unrealized Gain (Loss) | ||||
Net realized gain (loss) from investments | 308,809 | |||
Change in net unrealized appreciation (depreciation) of investments | 1,547,411 | |||
Net realized and unrealized gain (loss) | 1,856,220 | |||
Net increase (decrease) in net assets from operations | $ | 1,935,833 |
See accompanying notes to financial statements.
| 50 | Nuveen Investments |
Statement of Changes in Net Assets
| Year Ended 6/30/11 | Year Ended 6/30/10 | |||||||
Operations | ||||||||
Net investment income (loss) | $ | 79,613 | $ | 66,745 | ||||
Net realized gain (loss) from investments | 308,809 | 96,952 | ||||||
Change in net unrealized appreciation (depreciation) of investments | 1,547,411 | 366,562 | ||||||
Net increase (decrease) in net assets from operations | 1,935,833 | 530,259 | ||||||
Distributions to Shareholders | ||||||||
From net investment income | (64,991 | ) | (82,988 | ) | ||||
Decrease in net assets from distributions to shareholders | (64,991 | ) | (82,988 | ) | ||||
Fund Share Transactions | ||||||||
Proceeds from sale of shares | 3,732,000 | 1,287,999 | ||||||
Cost of shares redeemed | (4,455,000 | ) | (461,000 | ) | ||||
Net increase (decrease) in net assets from Fund share transactions | (723,000 | ) | 826,999 | |||||
Net increase (decrease) in net assets | 1,147,842 | 1,274,270 | ||||||
Net assets at the beginning of period | 6,016,000 | 4,741,730 | ||||||
Net assets at the end of period | $ | 7,163,842 | $ | 6,016,000 | ||||
Undistributed (Over-distribution of) net investment income at the end of period | $ | (151 | ) | $ | 44,671 | |||
See accompanying notes to financial statements.
| Nuveen Investments | 51 |
| Selected data for a share outstanding throughout each period: | ||||||||||||||||||||||||||||||||||||
| Investment Operations | Less Distributions | |||||||||||||||||||||||||||||||||||
| Year Ended June 30, | Beginning Net Asset Value | Net Invest- ment Income (Loss)(a) | Net (Loss) | Total | Net Invest- ment Income | Capital Gains(b) | Total | Ending Net Asset Value | Total Return(c) | |||||||||||||||||||||||||||
Class I (7/08) | ||||||||||||||||||||||||||||||||||||
2011 | $ | 15.78 | $ | .19 | $ | 4.78 | $ | 4.97 | $ | (.20 | ) | $ | — | $ | (.20 | ) | $ | 20.55 | 31.57 | % | ||||||||||||||||
2010 | 14.14 | .19 | 1.70 | 1.89 | (.25 | ) | — | (.25 | ) | 15.78 | 13.25 | |||||||||||||||||||||||||
2009 | 20.00 | .28 | (6.07 | ) | (5.79 | ) | (.07 | ) | — | (.07 | ) | 14.14 | (28.96 | ) | ||||||||||||||||||||||
| 52 | Nuveen Investments |
| Ratios/Supplemental Data | ||||||||||||||||||||||
| Ratios to Average Net Assets Before Reimbursement | Ratios to Average Net Assets After Reimbursement(d) | |||||||||||||||||||||
| Ending Net Assets (000) | Expenses | Net Invest- ment Income (Loss) | Expenses | Net Invest- ment Income (Loss) | Portfolio Turnover Rate | |||||||||||||||||
| $ | 7,164 | 2.56 | % | (.79 | )% | .78 | % | .99 | % | 204 | % | |||||||||||
| 6,016 | 3.20 | (1.24 | ) | .79 | 1.17 | 105 | ||||||||||||||||
| 4,742 | 3.38 | (.57 | ) | .80 | 2.02 | 69 | ||||||||||||||||
| (a) | Per share Net Investment Income (Loss) is calculated using the average daily shares method. |
| (b) | Distributions from Capital Gains include short-term capital gains, if any. |
| (c) | Total return is the combination of changes in net asset value, reinvested dividend income at net asset value and reinvested capital gains distributions at net asset value, if any. Total returns are not annualized. |
| (d) | After expense reimbursement from the Adviser, where applicable. Ratios do not reflect the effect of custodian fee credits earned on the Fund’s net cash on deposit with the custodian bank, where applicable. |
See accompanying notes to financial statements.
| Nuveen Investments | 53 |
1. General Information and Significant Accounting Policies
General Information
The Nuveen Investment Trust (the “Trust”) is an open-end investment company registered under the Investment Company Act of 1940, as amended. The Trust is comprised of Nuveen U.S. Equity Completeness Fund, (the “Fund”), among others. The Trust was organized as a Massachusetts business trust in 1996.
Effective January 1, 2011, the Fund’s adviser, Nuveen Asset Management, a wholly-owned subsidiary of Nuveen Investments, Inc. (“Nuveen”), changed its name to Nuveen Fund Advisors, Inc. (the “Adviser”).
Effective April 30, 2011, Nuveen Investments, LLC, a wholly-owned subsidiary of Nuveen, changed its name to Nuveen Securities, LLC (the “Distributor”).
The Fund’s investment objective is to provide capital appreciation and to enhance the risk/return profile of the U.S. equity portion of certain “funds of funds” advised by the Adviser.
Under normal market conditions, the Fund will invest primarily in equity securities of U.S. companies. The Fund’s only investors are the Nuveen Conservative Allocation Fund, Nuveen Moderate Allocation Fund and Nuveen Growth Allocation Fund (individually, an “Allocation Fund,” and collectively, the “Allocation Funds”). Each Allocation Fund is a “fund of funds” and invests principally in shares of other registered investment companies, including open-end mutual funds and exchange-traded funds (the “Underlying Funds”). The Fund is managed with the goal of outperforming a customized benchmark that is designed so that, when it is combined with the benchmarks of the U.S. equity-focused Underlying Funds included in the Allocation Funds, it approximates the performance of the Russell 3000 Index. This process seeks to optimize return while targeting a tracking error of 1.50% relative to the customized benchmark.
The Fund’s most recent prospectus provides further description of the Fund’s investment objective, principal investment strategies, and principal risks.
Significant Accounting Policies
The following is a summary of significant accounting policies followed by the Fund in the preparation of its financial statements in accordance with accounting principles generally accepted in the United States (“U.S. GAAP”).
Investment Valuation
Common stocks and other equity-type securities are valued at the last sales price on the securities exchange on which such securities are primarily traded. Securities primarily traded on the NASDAQ National Market (“NASDAQ”) are valued, except as indicated below, at the NASDAQ Official Closing Price. However, securities traded on a securities exchange or NASDAQ for which there were no transactions on a given day or securities not listed on a securities exchange or NASDAQ are valued at the last quoted bid price. These securities are generally classified as Level 1 for fair value measurement purposes. Prices of certain American Depository Receipts (“ADR”) held by the Fund that trade in only limited volume in the United States are valued based on the last traded price, official closing price, or the most recent bid price of the underlying non-U.S.-traded stock, adjusted as appropriate for the underlying-to-ADR conversion ratio and foreign exchange rate, and from time-to-time may also be adjusted further to take into account material events that may take place after the close of the local non-U.S. market but before the close of the New York Stock Exchange. These securities generally represent a transfer from a Level 1 to a Level 2 security.
Repurchase agreements are valued at contract amount plus accrued interest, which approximates market value. These securities are generally classified as Level 2.
Certain securities may not be able to be priced by the pre-established pricing methods as described above. Such securities may be valued by the Fund’s Board of Trustees or its designee at fair value. These securities generally include, but are not limited to, restricted securities (securities which may not be publicly sold without registration under the Securities Act of 1933, as amended) for which a pricing service is unable to provide a market price; securities whose trading has been formally suspended; debt securities that have gone into default and for which there is no current market quotation; a security whose market price is not available from a pre-established pricing source; a security with respect to which an event has occurred that is likely to materially affect the value of the security after the market has closed but before the calculation of the Fund’s net asset value (as may be the case in non-U.S. markets on which the security is primarily traded) or make it difficult or impossible to obtain a reliable market quotation; and a security whose price, as provided by the pricing service, is not deemed to reflect the security’s fair value. As a general principle, the fair value of a security would appear to be the amount that the owner might reasonably expect to receive for them in a current sale. A variety of factors may be considered in determining the fair value of such securities, which may include consideration of the following: yields or prices of investments of comparable quality, type of issue, coupon, maturity and rating, market quotes or indications of value from security dealers, evaluations of anticipated cash flows or collateral, general market conditions and other information and analysis, including the obligor’s credit characteristics considered relevant. These securities are classified as Level 2 or as Level 3 depending on the priority of the significant inputs. Regardless of the method employed to value a particular security, all valuations are subject to review by the Fund’s Board of Trustees or its designee.
| 54 | Nuveen Investments |
Refer to Footnote 2 – Fair Value Measurements for further details on the leveling of securities held by the Fund as of the end of the reporting period.
Investment Transactions
Investment transactions are recorded on a trade date basis. Realized gains and losses from investment transactions are determined on the specific identification method, which is the same basis used for federal income tax purposes.
Investment Income
Dividend income is recorded on the ex-dividend date or, for foreign securities, when information is available. Interest income is recorded on an accrual basis.
Income Taxes
The Fund intends to distribute substantially all of its net investment income and net capital gains to shareholders and to otherwise comply with the requirements of Subchapter M of the Internal Revenue Code applicable to regulated investment companies. Therefore, no federal income tax provision is required.
For all open tax years and all major taxing jurisdictions, management of the Fund has concluded that there are no significant uncertain tax positions that would require recognition in the financial statements. Open tax years are those that are open for examination by taxing authorities (i.e., generally the last four tax year ends and the interim tax period since then). Furthermore, management of the Fund is also not aware of any tax positions for which it is reasonably possible that the total amounts of unrecognized tax benefits will significantly change in the next twelve months.
Dividends and Distributions to Shareholders
Dividends from net investment income and net realized capital gains from investment transactions, if any, are declared and distributed to shareholders at least annually. Furthermore, capital gains are distributed only to the extent they exceed available capital loss carryforwards.
Distributions to shareholders are recorded on the ex-dividend date. The amount and timing of distributions are determined in accordance with federal income tax regulations, which may differ from U.S. GAAP.
Sales Charge Program
The Fund’s shares are not subject to any sales charge or 12b-1 distribution or service fees.
Derivative Instruments
The Fund is authorized to invest in futures, options, swaps and other derivative instruments. Although the Fund is authorized to invest in such derivative instruments, and may do so in the future, it did not make any such investments during the fiscal year ended June 30, 2011.
Repurchase Agreements
In connection with transactions in repurchase agreements, it is the Fund’s policy that its custodian take possession of the underlying collateral securities, the fair value of which exceeds the principal amount of the repurchase transaction, including accrued interest, at all times. If the counterparty defaults, and the fair value of the collateral declines, realization of the collateral may be delayed or limited.
Custodian Fee Credit
The Fund has an arrangement with the custodian bank whereby certain custodian fees and expenses are reduced by net credits earned on the Fund’s cash on deposit with the bank. Such deposit arrangements are an alternative to overnight investments. Credits for cash balances may be offset by charges for any days on which the Fund overdraws its account at the custodian bank.
Indemnifications
Under the Trust’s organizational documents, its officers and trustees are indemnified against certain liabilities arising out of the performance of their duties to the Trust. In addition, in the normal course of business, the Trust enters into contracts that provide general indemnifications to other parties. The Trust’s maximum exposure under these arrangements is unknown as this would involve future claims that may be made against the Trust that have not yet occurred. However, the Trust has not had prior claims or losses pursuant to these contracts and expects the risk of loss to be remote.
Use of Estimates
The preparation of financial statements in conformity with U.S. GAAP requires management to make estimates and assumptions that affect the reported amounts of assets and liabilities at the date of the financial statements and the reported amounts of increases and decreases in net assets from operations during the reporting period. Actual results may differ from those estimates.
2. Fair Value Measurements
Fair value is defined as the price that the Fund would receive upon selling an investment or transferring a liability in an orderly transaction to an independent buyer in the principal or most advantageous market for the investment. A three-tier hierarchy is used to maximize the use of observable market data and minimize the use of unobservable inputs and to establish classification of fair value measurements for disclosure purposes. Observable inputs reflect the assumptions market participants would use in pricing the asset or liability. Observable inputs are based on market data obtained from sources independent of the reporting entity. Unobservable
| Nuveen Investments | 55 |
Notes to Financial Statements (continued)
inputs reflect the reporting entity’s own assumptions about the assumptions market participants would use in pricing the asset or liability. Unobservable inputs are based on the best information available in the circumstances. The three-tier hierarchy of inputs is summarized in the three broad levels listed below:
| Level 1 – | Quoted prices in active markets for identical securities. | |
| Level 2 – | Other significant observable inputs (including quoted prices for similar securities, interest rates, prepayment speeds, credit risk, etc.). | |
| Level 3 – | Significant unobservable inputs (including management’s assumptions in determining the fair value of investments). |
The inputs or methodologies used for valuing securities are not an indication of the risk associated with investing in those securities. The following is a summary of the Fund’s fair value measurements as of June 30, 2011:
| Level 1 | Level 2 | Level 3 | Total | |||||||||||||
Investments: | ||||||||||||||||
Common Stocks | $ | 7,174,789 | $ | — | $ | — | $ | 7,174,789 | ||||||||
Short-Term Investments | — | 247,471 | — | 247,471 | ||||||||||||
Total | $ | 7,174,789 | $ | 247,471 | $ | — | $ | 7,422,260 | ||||||||
During the fiscal year ended June 30, 2011, the Fund recognized no significant transfers to or from Level 1, Level 2 or Level 3.
3. Derivative Instruments and Hedging Activities
The Fund records derivative instruments at fair value, with changes in fair value recognized on the Statement of Operations, when applicable. Even though the Fund’s investments in derivatives may represent economic hedges, they are not considered to be hedge transactions for financial reporting purposes. The Fund did not invest in derivative instruments during the fiscal year ended June 30, 2011.
4. Fund Shares
Transactions in Fund shares were as follows:
| Year Ended 6/30/11 | Year Ended 6/30/10 | |||||||||||||||
| Shares | Amount | Shares | Amount | |||||||||||||
Shares sold | 192,309 | $ | 3,732,000 | 74,400 | $ | 1,287,999 | ||||||||||
Shares redeemed | (225,092 | ) | (4,455,000 | ) | (28,330 | ) | (461,000 | ) | ||||||||
Net increase (decrease) | (32,783 | ) | $ | (723,000 | ) | 46,070 | $ | 826,999 | ||||||||
5. Investment Transactions
Purchases and sales (excluding short-term investments) during the fiscal year ended June 30, 2011, aggregated $15,914,046 and $16,348,239, respectively.
6. Income Tax Information
The following information is presented on an income tax basis. Differences between amounts for financial statement and federal income tax purposes are primarily due to timing differences in recognizing certain gains and losses on investment transactions. To the extent that differences arise that are permanent in nature, such amounts are reclassified within the capital accounts as detailed below. Temporary differences do not require reclassification. Temporary and permanent differences do not impact the net asset value of the Fund.
At June 30, 2011, the cost and unrealized appreciation (depreciation) of investments, as determined on a federal income tax basis, were as follows:
Cost of investments | $ | 6,341,454 | ||
Gross unrealized: | ||||
Appreciation | $ | 1,237,605 | ||
Depreciation | (156,800 | ) | ||
Net unrealized appreciation (depreciation) of investments | $ | 1,080,805 |
| 56 | Nuveen Investments |
Permanent differences, primarily due to reclassification of redemption proceeds from an upper tier fund, which would be treated as a distribution paid by the Fund for tax purposes, investments in passive foreign investment companies and federal taxes paid resulted in reclassifications among the Fund’s components of net assets at June 30, 2011, the Fund’s tax year end, as follows:
Capital paid-in | $ | 59,338 | ||
Undistributed (Over-distribution of) net investment income | (59,444 | ) | ||
Accumulated net realized gain (loss) | 106 |
The tax components of undistributed net ordinary income and net long-term capital gains at June 30, 2011, the Fund’s tax year end, were as follows:
Undistributed net ordinary income* | $ | — | ||
Undistributed net long-term capital gains | — | |||
| * | Net ordinary income consists of net taxable income derived from dividends, interest, and net short-term capital gains, if any. |
The tax character of distributions paid during the Fund’s tax years ended June 30, 2011 and June 30, 2010, was designated for purposes of the dividends paid deduction as follows:
| 2011 | ||||
Distributions from net ordinary income* | $ | 64,991 | ||
Distributions from net long-term capital gains | — | |||
| 2010 | ||||
Distributions from net ordinary income* | $ | 82,988 | ||
Distributions from net long-term capital gains | — | |||
| * | Net ordinary income consists of net taxable income derived from dividends, interest and net short-term capital gains, if any. |
At June 30, 2011, the Fund’s tax year end, the Fund had unused capital loss carryforwards of $1,008,625 available for federal income tax purposes to be applied against future capital gains, if any. If not applied, the carryforwards will expire on June 30, 2018.
7. Management Fees and Other Transactions with Affiliates
The Fund’s management fee consists of two components – a fund-level fee, based only on the amount of assets within the Fund, and a complex-level fee, based on the aggregate amount of all eligible fund assets managed by the Adviser. This pricing structure enables Fund shareholders to benefit from growth in the assets within the Fund as well as from growth in the amount of complex-wide assets managed by the Adviser.
The annual fund-level fee, payable monthly, is .35% of average daily net assets.
The annual complex-level fee, payable monthly, is calculated according to the following schedule:
| Complex-Level Asset Breakpoint Level* | Effective Rate at Breakpoint Level | |||
$55 billion | .2000 | % | ||
$56 billion | .1996 | |||
$57 billion | .1989 | |||
$60 billion | .1961 | |||
$63 billion | .1931 | |||
$66 billion | .1900 | |||
$71 billion | .1851 | |||
$76 billion | .1806 | |||
$80 billion | .1773 | |||
$91 billion | .1691 | |||
$125 billion | .1599 | |||
$200 billion | .1505 | |||
$250 billion | .1469 | |||
$300 billion | .1445 | |||
| * | The complex-level fee is calculated based upon the aggregate daily “eligible assets” of all Nuveen Funds. Eligible assets do not include assets attributable to investments in other Nuveen Funds or assets in excess of $2 billion added to the Nuveen Fund complex in connection with the Adviser’s assumption of the management of the former First American Funds effective January 1, 2011. Eligible assets include closed-end fund assets managed by the Adviser that are attributable to financial leverage. For these purposes, financial leverage includes the closed end funds’ use of preferred stock and borrowings and certain investments in the residual interest certificates (also called inverse floating rate securities) in tender option bond (TOB) trusts, including the portion of assets held by a TOB trust that has been effectively financed by the trust’s issuance of floating rate securities, subject to an agreement by the Adviser to limit the amount of such assets for determining eligible assets in certain circumstances. As of June 30, 2011, the complex-level fee rate for the Fund was .1774%. |
| Nuveen Investments | 57 |
Notes to Financial Statements (continued)
The management fee compensates the Adviser for overall investment advisory and administrative services and general office facilities it provides for the Fund. The Adviser has entered into a sub-advisory agreement with Nuveen HydePark Group, LLC (“HydePark”), a subsidiary of Nuveen, under which HydePark manages the investment portfolio of the Fund. HydePark is compensated for its services to the Fund from the management fee paid to the Adviser.
The Adviser has agreed to waive fees and reimburse expenses of the Fund through October 31, 2011, so that total annual Fund operating expenses (excluding interest expenses, taxes, fees incurred in acquiring and disposing of portfolio securities and extraordinary expenses) do not exceed .80% (1.05% after October 31, 2011) of the average daily net assets of the Fund. The Adviser may voluntarily reimburse additional expenses from time to time. Voluntary reimbursements may be terminated at any time at the Adviser’s discretion.
The Trust pays no compensation directly to those of its trustees who are affiliated with the Adviser or to its officers, all of whom receive remuneration for their services to the Trust from the Adviser or its affiliates. The Board of Trustees has adopted a deferred compensation plan for independent trustees that enables trustees to elect to defer receipt of all or a portion of the annual compensation they are entitled to receive from certain Nuveen-advised funds. Under the plan, deferred amounts are treated as though equal dollar amounts had been invested in shares of select Nuveen-advised funds.
At June 30, 2011, Nuveen owned 1,250 shares of the Fund.
8. New Accounting Pronouncements
Financial Accounting Standards Board (“FASB”) Transfers and Servicing (Topic 860): Reconsideration of Effective Control for Repurchase Agreements
On April 15, 2011, the FASB issued Accounting Standards Update (“ASU”) No. 2011-03 (“ASU No. 2011-03”). The guidance in ASU No. 2011-03 is intended to improve the accounting for repurchase agreements (“repos”) and other similar agreements. Specifically, ASU No. 2011-03 modifies the criteria for determining when these transactions would be accounted for as financings (secured borrowings/lending agreements) as opposed to sales (purchases) with commitments to repurchase (resell). The effective date of ASU No. 2011-03 is for interim and annual periods beginning on or after December 15, 2011. At this time, management is evaluating the implications of this guidance and the impact it will have to the financial statement amounts or footnote disclosures, if any.
Fair Value Measurements and Disclosures
On May 12, 2011, the FASB issued ASU No. 2011-04 (“ASU No. 2011-04”) modifying Topic 820, Fair Value Measurements and Disclosures. At the same time, the International Accounting Standards Board (“IASB”) issued International Financial Reporting Standard (“IFRS”) 13, Fair Value Measurement. The objective of the FASB and IASB is convergence of their guidance on fair value measurements and disclosures. Specifically, the ASU requires reporting entities to disclose i) the amounts of any transfers between Level 1 and Level 2, and the reasons for the transfers, ii) for Level 3 fair value measurements, a) quantitative information about significant unobservable inputs used, b) a description of the valuation processes used by the reporting entity and c) a narrative description of the sensitivity of the fair value measurement to changes in unobservable inputs if a change in those inputs might result in a significantly higher or lower fair value measurement. The effective date of ASU No. 2011-04 is for interim and annual periods beginning after December 15, 2011. At this time, management is evaluating the implications of this guidance and the impact it will have on the financial statement amounts and footnote disclosures, if any.
9. Subsequent Event
Subsequent to the reporting period, the Board of Trustees approved the liquidation of the Fund upon the redemption of all shares held by other funds invested in the Fund.
| 58 | Nuveen Investments |
Trustees and Officers (Unaudited)
The management of the Funds, including general supervision of the duties performed for the Funds by the Adviser, is the responsibility of the Board of Trustees of the Funds. The number of trustees of the Funds is currently set at ten. None of the trustees who are not “interested” persons of the Funds (referred to herein as “independent trustees”) has ever been a director or employee of, or consultant to, Nuveen or its affiliates. The names and business addresses of the trustees and officers of the Funds, their principal occupations and other affiliations during the past five years, the number of portfolios each oversees and other directorships they hold are set forth below.
The Funds’ Statement of Additional Information (“SAI”) includes more information about the trustees. To request a free copy, call Nuveen Investments at (800) 257-8787 or visit the Funds’ website at www.nuveen.com.
Name, Birthdate and Address | Position(s) Held with the Funds | Year First Elected or Appointed (1) | Principal Occupation(s) Including other Directorships During Past 5 Years | Number of Portfolios in Fund Complex Overseen by Trustee | ||||
| Independent Trustees: | ||||||||
Robert P. Bremner (2) 8/22/40 333 W. Wacker Drive Chicago, IL 60606 | Chairman of the Board and Trustee | 1996 | Private Investor and Management Consultant; Treasurer and Director, Humanities Council of Washington, D.C.; Board Member, Independent Directors Council affiliated with the Investment Company Institute. | 245 | ||||
Jack B. Evans 10/22/48 333 W. Wacker Drive Chicago, IL 60606 | Trustee | 1999 | President, The Hall-Perrine Foundation, a private philanthropic corporation (since 1996); Director and Chairman, United Fire Group, a publicly held company; member of the Board of Regents for the State of Iowa University System; Director, Source Media Group; Life Trustee of Coe College and the Iowa College Foundation; formerly, Director, Alliant Energy; formerly, Director, Federal Reserve Bank of Chicago; formerly, President and Chief Operating Officer, SCI Financial Group, Inc., a regional financial services firm. | 245 | ||||
William C. Hunter 3/6/48 333 W. Wacker Drive Chicago, IL 60606 | Trustee | 2004 | Dean, Tippie College of Business, University of Iowa (since 2006); Director (since 2004) of Xerox Corporation; Director (since 2005), Beta Gamma Sigma International Honor Society; Director of Wellmark, Inc. (since 2009); formerly, Dean and Distinguished Professor of Finance, School of Business at the University of Connecticut (2003-2006); previously, Senior Vice President and Director of Research at the Federal Reserve Bank of Chicago (1995-2003); formerly, Director (1997-2007), Credit Research Center at Georgetown University. | 245 | ||||
David J. Kundert (2) 10/28/42 333 W. Wacker Drive Chicago, IL 60606 | Trustee | 2005 | Director, Northwestern Mutual Wealth Management Company; retired (since 2004) as Chairman, JPMorgan Fleming Asset Management, President and CEO, Banc One Investment Advisors Corporation, and President, One Group Mutual Funds; prior thereto, Executive Vice President, Banc One Corporation and Chairman and CEO, Banc One Investment Management Group; Member, Board of Regents, Luther College; member of the Wisconsin Bar Association; member of Board of Directors, Friends of Boerner Botanical Gardens; member of Board of Directors and Chair of Investment Committee, Greater Milwaukee Foundation. | 245 | ||||
William J. Schneider (2) 9/24/44 333 W. Wacker Drive Chicago, IL 60606 | Trustee | 1997 | Chairman of Miller-Valentine Partners Ltd., a real estate investment company; formerly, Senior Partner and Chief Operating Officer (retired 2004) of Miller-Valentine Group; member, University of Dayton Business School Advisory Council; member, Mid-America Health System Board; formerly, member and chair, Dayton Philharmonic Orchestra Association; formerly, member, Business Advisory Council, Cleveland Federal Reserve Bank. | 245 | ||||
Judith M. Stockdale 12/29/47 333 W. Wacker Drive Chicago, IL 60606 | Trustee | 1997 | Executive Director, Gaylord and Dorothy Donnelley Foundation (since 1994); prior thereto, Executive Director, Great Lakes Protection Fund (1990-1994). | 245 | ||||
Carole E. Stone (2) 6/28/47 333 W. Wacker Drive Chicago, IL 60606 | Trustee | 2007 | Director, Chicago Board Options Exchange (since 2006); Director, C2 Options Exchange, Incorporated (since 2009); formerly, Commissioner, New York State Commission on Public Authority Reform (2005-2010); formerly, Chair, New York Racing Association Oversight Board (2005-2007). | 245 | ||||
| Nuveen Investments | 59 |
Trustees and Officers (Unaudited) (continued)
Name, Birthdate and Address | Position(s) Held with the Funds | Year First Elected or Appointed (1) | Principal Occupation(s) During Past Five Years | Number of Portfolios in Fund Complex Overseen by Trustee | ||||
Virginia L. Stringer 8/16/44 333 West Wacker Drive Chicago, IL 60606 | Trustee | 2011 | Board Member, Mutual Fund Directors Forum; Member, Governing Board, Investment Company Institute’s Independent Directors Council; governance consultant and non-profit board member; former Owner and President, Strategic Management Resources, Inc. a management consulting firm; previously, held several executive positions in general management, marketing and human resources at IBM and The Pillsbury Company; Independent Director, First American Fund Complex (1987-2010) and Chair (1997-2010). | 245 | ||||
Terence J. Toth (2) 9/29/59 333 W. Wacker Drive Chicago, IL 60606 | Trustee | 2008 | Director, Legal & General Investment Management America, Inc. (since 2008); Managing Partner, Promus Capital (since 2008); formerly, CEO and President, Northern Trust Global Investments (2004-2007); Executive Vice President, Quantitative Management & Securities Lending (2000-2004); prior thereto, various positions with Northern Trust Company (since 1994); member: Goodman Theatre Board (since 2004), Chicago Fellowship Board (since 2005) and Catalyst Schools of Chicago Board (since 2008); formerly, member: Northern Trust Mutual Funds Board (2005-2007), Northern Trust Global Investments Board (2004-2007), Northern Trust Japan Board (2004-2007), Northern Trust Securities Inc. Board (2003-2007) and Northern Trust Hong Kong Board (1997-2004). | 245 | ||||
| Interested Trustee: | ||||||||
John P. Amboian (3) 6/14/61 333 W. Wacker Drive Chicago, IL 60606 | Trustee | 2008 | Chief Executive Officer and Chairman (since 2007), and Director (since 1999) of Nuveen Investments, Inc., formerly, President (1999-2007); Chief Executive Officer (since 2007) of Nuveen Investments Advisers Inc.; Director (since 1998) formerly, Chief Executive Officer (2007-2010) of Nuveen Fund Advisors, Inc. | 245 | ||||
Name, Birthdate and Address | Position(s) Held with the Funds | Year First Elected or Appointed (4) | Principal Occupation(s) During Past 5 Years | Number of Portfolios in Fund Complex Overseen by Officer | ||||
| Officers of the Funds: | ||||||||
Gifford R. Zimmerman 9/9/56 333 W. Wacker Drive Chicago, IL 60606 | Chief Administrative Officer | 1988 | Managing Director (since 2002), Assistant Secretary and Associate General Counsel of Nuveen Securities, LLC; Managing Director (since 2004) and Assistant Secretary (since 1994) of Nuveen Investments, Inc.; Managing Director (since 2002), Assistant Secretary (since 1997) and Co-General Counsel (since 2011) of Nuveen Fund Advisors, Inc.; Managing Director, Assistant Secretary and Associate General Counsel of Nuveen Asset Management, LLC (since 2011); Managing Director, Associate General Counsel and Assistant Secretary of Symphony Asset Management LLC (since 2003); Vice President and Assistant Secretary of NWQ Investment Management Company, LLC (since 2002), Nuveen Investments Advisers Inc. (since 2002), Tradewinds Global Investors LLC, and Santa Barbara Asset Management, LLC (since 2006), Nuveen HydePark Group LLC and Nuveen Investment Solutions, Inc. (since 2007) and of Winslow Capital Management Inc. (since 2010); Chief Administrative Officer and Chief Compliance Officer (since 2010) of Nuveen Commodities Asset Management, LLC; Chartered Financial Analyst. | 245 | ||||
Margo L. Cook 4/11/64 333 W. Wacker Drive Chicago, IL 60606 | Vice President | 2009 | Executive Vice President (since 2008) of Nuveen Investments, Inc. and of Nuveen Fund Advisors, Inc. (since 2011); previously, Head of Institutional Asset Management (2007-2008) of Bear Stearns Asset Management; Head of Institutional Asset Management (1986-2007) of Bank of NY Mellon; Chartered Financial Analyst. | 245 | ||||
| 60 | Nuveen Investments |
Name, Birthdate and Address | Position(s) Held with the Funds | Year First Elected or Appointed (4) | Principal Occupation(s) During Past 5 Years | Number of Portfolios in Fund Complex Overseen by Officer | ||||
Lorna C. Ferguson 10/24/45 333 W. Wacker Drive Chicago, IL 60606 | Vice President | 1998 | Managing Director (since 2005) of Nuveen Fund Advisors, Inc. | 245 | ||||
Stephen D. Foy 5/31/54 333 W. Wacker Drive Chicago, IL 60606 | Vice President and Controller | 1998 | Senior Vice President (since 2010), formerly, Vice President (2005-2010) of Nuveen Securities, LLC and Funds Controller; Vice President of Nuveen; Certified Public Accountant. | 245 | ||||
Scott S. Grace 8/20/70 333 W. Wacker Drive Chicago, IL 60606 | Vice President and Treasurer | 2009 | Managing Director, Corporate Finance & Development, Treasurer (since 2009) of Nuveen Securities, LLC; Managing Director and Treasurer (since 2009) of Nuveen Fund Advisors, Inc., Nuveen Investment Solutions, Inc., Nuveen Investments Advisers, Inc., Nuveen Investments Holdings Inc. and (since (2011) Nuveen Asset Management, LLC; Vice President and Treasurer of NWQ Investment Management Company, LLC, Tradewinds Global Investors, LLC, Symphony Asset Management LLC and Winslow Capital Management, Inc.; Vice President of Santa Barbara Asset Management, LLC; formerly, Treasurer (2006-2009), Senior Vice President (2008-2009), previously, Vice President (2006-2008) of Janus Capital Group, Inc.; formerly, Senior Associate in Morgan Stanley’s Global Financial Services Group (2000-2003); Chartered Accountant Designation. | 245 | ||||
Walter M. Kelly 2/24/70 333 W. Wacker Drive Chicago, IL 60606 | Chief Compliance Officer and Vice President | 2003 | Senior Vice President (since 2008), Vice President (2006-2008) of Nuveen Securities, LLC; Senior Vice President (since 2008) and Assistant Secretary (since 2008) of Nuveen Fund Advisors, Inc. | 245 | ||||
Tina M. Lazar 8/27/61 333 W. Wacker Drive Chicago, IL 60606 | Vice President | 2002 | Senior Vice President (since 2010), formerly, Vice President (2005-2010) of Nuveen Fund Advisors, Inc. | 245 | ||||
Larry W. Martin 7/27/51 333 West Wacker Drive Chicago, IL 60606 | Vice President and Assistant Secretary | 1997 | Senior Vice President (since 2010), formerly, Vice President (1993-2010), Assistant Secretary and Assistant General Counsel of Nuveen Securities, LLC; Senior Vice President (since 2011) of Nuveen Asset Management, LLC: Senior Vice President (since 2010), formerly, Vice President (2005-2010), and Assistant Secretary of Nuveen Investments, Inc.; Senior Vice President (since 2010), formerly Vice President (2005-2010), and Assistant Secretary (since 1997) of Nuveen Fund Advisors, Inc.; Vice President and Assistant Secretary of Nuveen Investments Advisers, Inc. (since 2002), NWQ Investment Management Company, LLC, Symphony Asset Management LLC (since 2003), Tradewinds Global Investors, LLC, Santa Barbara Asset Management, LLC (since 2006), Nuveen HydePark Group, LLC and Nuveen Investment Solutions, Inc. (since 2007), and of Winslow Capital Management, Inc. (since 2010); Vice President and Assistant Secretary of Nuveen Commodities Asset Management, LLC (since 2010). | 245 |
| Nuveen Investments | 61 |
Trustees and Officers (Unaudited) (continued)
Name, Birthdate and Address | Position(s) Held with the Funds | Year First Elected or Appointed (4) | Principal Occupation(s) Including other Directorships During Past 5 Years | Number of Portfolios in Fund Complex Overseen by Officer | ||||
Kevin J. McCarthy 3/26/66 333 W. Wacker Drive Chicago, IL 60606 | Vice President and Secretary | 2007 | Managing Director (since 2008), formerly, Vice President (2007-2008), Nuveen Securities, LLC; Managing Director (since 2008), Assistant Secretary (since 2007) and Co-General Counsel (since 2011) of Nuveen Fund Advisors, Inc.; Managing Director, Assistant Secretary and Associate General Counsel (since 2011) of Nuveen Asset Management, LLC; Managing Director (since 2008), and Assistant Secretary, Nuveen Investment Holdings, Inc.; Vice President (since 2007) and Assistant Secretary of Nuveen Investments Advisers Inc., NWQ Investment Management Company, LLC, Tradewinds Global Investors LLC, NWQ Holdings, LLC, Symphony Asset Management LLC, Santa Barbara Asset Management, LLC, Nuveen HydePark Group, LLC, Nuveen Investment Solutions, Inc. (since 2007) and of Winslow Capital Management, Inc. (since 2010); Vice President and Secretary (since 2010) of Nuveen Commodities Asset Management, LLC; prior thereto, Partner, Bell, Boyd & Lloyd LLP (1997-2007). | 245 | ||||
Kathleen L. Prudhomme 3/30/53 800 Nicollet Mall Minneapolis, MN 55402 | Vice President and Assistant Secretary | 2011 | Managing Director, Assistant Secretary and Co-General Counsel (since 2011) of Nuveen Fund Advisors, Inc.; Managing Director, Assistant Secretary and Associate General Counsel (since 2011) of Nuveen Asset Management, LLC; Managing Director and Assistant Secretary (since 2011) of Nuveen Securities, LLC; formerly, Deputy General Counsel, FAF Advisors, Inc. (2004-2010). | 245 | ||||
Jeffrey M. Wilson 3/13/56 333 West Wacker Drive Chicago, IL 60606 | Vice President | 2011 | Senior Vice President of Nuveen Investments (since 2011), formerly, Senior Vice President of FAF Advisors, Inc. (2000-2010). | 112 |
| (1) | Trustees serve an indefinite term until his/her successor is elected or appointed. The year first elected or appointed represents the year in which the trustee was first elected or appointed to any fund in the Nuveen Fund Complex. |
| (2) | Also serves as a trustee of the Nuveen Diversified Commodity Fund, an exchange-traded commodity pool managed by Nuveen Commodities Asset Management, LLC, an affiliate of the Adviser. |
| (3) | Mr. Amboian is an interested trustee because of his position with Nuveen Investments, Inc. and certain of its subsidiaries, which are affiliates of the Nuveen Funds. |
| (4) | Officers serve one year terms through August of each year. The year first elected or appointed represents the year in which the officer was first elected or appointed to any fund in the Nuveen Fund Complex. |
| 62 | Nuveen Investments |
Annual Investment Management Agreement Approval Process
(Unaudited)
The Board of Trustees (the “Board,” and each Trustee, a “Board Member”) of the Fund, including the Board Members who are not parties to the Fund’s advisory or sub-advisory agreements or “interested persons” of any such parties (the “Independent Board Members”), are responsible for approving the advisory agreement (the “Investment Management Agreement”) between the Fund and Nuveen Fund Advisors, Inc. (the “Advisor”) and the sub-advisory agreement (the “Sub-Advisory Agreement”) between the Advisor and Nuveen HydePark Group, LLC (the “Sub-Advisor”) (the Investment Management Agreement and the Sub-Advisory Agreement are referred to collectively as the “Advisory Agreements”) and their periodic continuation. Pursuant to the Investment Company Act of 1940, as amended (the “1940 Act”), the Board is required to consider the continuation of advisory agreements and sub-advisory agreements on an annual basis. Accordingly, at an in-person meeting held on May 23-25, 2011 (the “May Meeting”), the Board, including a majority of the Independent Board Members, considered and approved the continuation of the Advisory Agreements for the Fund for an additional one-year period.
In preparation for their considerations at the May Meeting, the Board requested and received extensive materials prepared in connection with the review of the Advisory Agreements. The materials provided a broad range of information regarding the Fund, the Advisor and the Sub-Advisor (the Advisor and the Sub-Advisor are collectively, the “Fund Advisers” and each, a “Fund Adviser”). As described in more detail below, the information provided included, among other things, a review of Fund performance, including Fund investment performance assessments against appropriate benchmarks, a review of Fund fees and expenses, a description and assessment of shareholder service levels for the Fund, a summary of the performance of certain service providers, a review of product initiatives and shareholder communications and an analysis of the Advisor’s profitability with comparisons to comparable peers in the managed fund business. As part of their annual review, the Board also held a separate meeting on April 19-20, 2011, to review the Fund’s investment performance and consider an analysis provided by the Advisor of the Sub-Advisor which generally evaluated the Sub-Advisor’s investment team, investment mandate, organizational structure and history, investment philosophy and process, performance of the Fund, and significant changes to the foregoing. As a result of their review of the materials and discussions, the Board presented the Advisor with questions and the Advisor responded.
The materials and information prepared in connection with the annual review of the Advisory Agreements supplement the information provided to the Board during the year. In this regard, throughout the year, the Board, acting directly or through its committees, regularly reviews the performance and various services provided by the Advisor and the Sub-Advisor. The Board meets at least quarterly as well as at other times as the need arises. At its quarterly meetings, the Board reviews reports by the Advisor which include, among other things, Fund performance, a review of the investment teams and compliance reports. The Board also meets with key investment personnel managing the Fund’s portfolio during the year. In addition, the Board continues its program of seeking to visit each sub-advisor to the Nuveen funds at least once over a multiple year rotation, meeting with key investment and business personnel. The Board also met with State Street Bank & Trust Company, the Fund’s accountant and custodian, in 2010. The Board considers factors and information that are relevant to its annual consideration of the renewal of the Advisory Agreements at these meetings held throughout the year. Accordingly, the Board considers the information provided and knowledge gained at these meetings when performing its annual review of the Advisory Agreements. The Independent Board Members are assisted throughout the process by independent legal counsel who provided materials describing applicable law and the duties of directors or trustees in reviewing advisory contracts and met with the Independent Board Members in executive sessions without management present.
The Board considered all factors it believed relevant with respect to the Fund, including among other factors: (a) the nature, extent and quality of the services provided by the Fund Advisers, (b) the investment performance of the Fund and Fund Advisers, (c) the advisory fees and costs of the services to be provided to the Fund and the profitability of the Fund Advisers, (d) the extent of any economies of scale, (e) any benefits derived by the Fund Advisers from the relationship with the Fund and (f) other factors. Each Board Member may have accorded different weight to the various factors in reaching his or her conclusions with respect to the Fund’s Advisory Agreements. The Independent Board Members did not identify any single factor as all important or controlling. The Independent Board Members’ considerations were instead based on a comprehensive consideration of all the information presented. The principal factors considered by the Board and its conclusions are described below.
A. Nature, Extent and Quality of Services
In considering renewal of the Advisory Agreements, the Independent Board Members considered the nature, extent and quality of the Fund Adviser’s services, including advisory services and the resulting Fund performance and administrative services. The Independent Board Members reviewed materials outlining, among other things, the Fund Adviser’s organization and business; the types of services that the Fund Adviser or its affiliates provide to the Fund; the performance record of the Fund (as described in further detail below); and any initiatives Nuveen had taken for the applicable fund product line.
In considering advisory services, the Board recognized that the Advisor provides various oversight, administrative, compliance and other services for the Fund and the Sub-Advisor provides the portfolio investment management services to the Fund. Accordingly, in reviewing the portfolio management services provided to the Fund, the Board reviewed the materials provided by the Nuveen Investment Services Oversight Team analyzing, among other things, the Sub-Advisor’s investment team and changes thereto, organization and history, assets under management, Fund objectives and mandate, the investment team’s philosophy and strategies in managing the Fund, developments affecting the Sub-Advisor or Fund and Fund performance. The Independent Board Members also reviewed portfolio manager compensation arrangements to evaluate each Fund Adviser’s ability to attract and retain high quality investment personnel, preserve stability, and reward performance but not provide an incentive to take undue risks. In addition, the
| Nuveen Investments | 63 |
Annual Investment Management Agreement Approval Process
(Unaudited) (continued)
Board considered the Advisor’s execution of its oversight responsibilities over the Sub-Advisor. Given the importance of compliance, the Independent Board Members also considered Nuveen’s compliance program, including the report of the chief compliance officer regarding the Fund’s compliance policies and procedures.
In addition to advisory services, the Board considered the quality and extent of administrative and other non-investment advisory services the Advisor and its affiliates provide to the Fund, including product management, investment services (such as oversight of investment policies and procedures, risk management, and pricing), fund administration, oversight of service providers, shareholder services, administration of Board relations, regulatory and portfolio compliance and legal support. In reviewing the services provided, the Board also reviewed materials describing various notable initiatives and projects the Advisor performed in connection with the open-end fund product line. These initiatives included operations necessary to effect the acquisition of FAF Advisors, Inc.’s (“FAF”) long-term asset management business by Nuveen and the subsequent integration of FAF and the funds FAF advised into the Nuveen family of funds; reduction of management fees and expense caps on certain open-end equity funds that was effective July 1, 2010; changes in dividend declaration policies; and adding funds to various distribution platforms.
Based on their review, the Independent Board Members found that, overall, the nature, extent and quality of services provided to the Fund under each Advisory Agreement were satisfactory.
B. The Investment Performance of the Fund and Fund Advisers
The Board, including the Independent Board Members, reviewed and considered the performance history of the Fund over various time periods. In general, the boards of the various Nuveen funds reviewed, among other things, each such fund’s historic investment performance as well as information comparing the fund’s performance information with that of other funds (the “Performance Peer Group”) based on data provided by an independent provider of mutual fund data and with recognized and/or customized benchmarks. In reviewing the performance data for the Fund, the Board noted the unique structure of this Fund, the shares of which are intended to be offered only to other Nuveen funds. Given this unique structure, the Fund does not have a Performance Peer Group.
The Independent Board Members also noted that the investment experience of a particular shareholder in the Nuveen funds will vary depending on when such shareholder invests in the applicable fund, the class held (if multiple classes are offered) and the performance of the fund (or respective class) during that shareholder’s investment period. With respect to any Nuveen funds that underperformed their peers and/or benchmarks from time to time, the Board monitors such funds closely and considers any steps necessary or appropriate to address such issues. In considering the performance of the Fund, the Board reviewed the Fund’s total return information and performance information of the Fund and as compared to a recognized benchmark for the quarter and one-year periods ending December 31, 2010 and March 31, 2011, noting the Fund slightly underperformed the benchmark for the one-year period. The Board noted the short performance history available for the Fund limits some of the ability to meaningfully assess its performance.
Based on their review, the Independent Board Members determined that the Fund’s investment performance had been satisfactory.
C. Fees, Expenses and Profitability
1. Fees and Expenses
The Independent Board Members reviewed the Fund’s gross management fee, net management fee, fee waivers and net expense ratio. In this regard, the Independent Board Members noted the unique structure of the Fund, the shares of which are only intended to be offered to other Nuveen funds. Given the Fund’s unique structure, the Independent Board Members recognized that a comparable universe of funds (i.e., a “Peer Universe”) or a more focused subset of funds thereof (i.e., a “Peer Group”) was not available. The Independent Board Members further considered that the other Nuveen funds investing in the Fund will also be advised by the Advisor and sub-advised by an affiliated person of the Advisor. Accordingly, in evaluating the fees and expenses, the Independent Board Members also recognized the advisory fees paid to the Advisor and the affiliated Sub-Advisor by the Nuveen funds acquiring the Fund.
Based on their review of the fee and expense information provided, the Independent Board Members determined that the Fund’s management fees were reasonable in light of the nature, extent and quality of services provided to the Fund.
2. Comparisons with the Fees of Other Clients
The Independent Board Members further reviewed information regarding the nature of services and fee rates offered by the Advisor to other clients, including separately managed accounts (both retail and institutional accounts), foreign investment funds offered by Nuveen, and funds that are not offered by Nuveen but are sub-advised by one of Nuveen’s investment management teams. In evaluating the comparisons of fees, the Independent Board Members noted that the fee rates charged to the Fund and other clients vary, among other things, because of the different services involved and the additional regulatory and compliance requirements associated with registered investment companies, such as the Fund. Accordingly, the Independent Board Members considered the differences in the product types, including, but not limited to, the services provided, the structure and operations, product distribution and costs thereof, portfolio investment policies, investor profiles, account sizes and regulatory requirements. The Independent Board Members noted, in particular, that the range of services provided to the Fund (as discussed above) is more extensive than that provided to separately managed accounts. The Independent Board Members noted that the Fund is unique to
| 64 | Nuveen Investments |
the Nuveen complex in serving as an underlying fund to other Nuveen funds and there were no comparable unaffiliated investment companies available. Given the inherent differences in the products, particularly the services provided to the Fund, the Independent Board Members believe such facts justify the different levels of fees.
In considering the fees of the Sub-Advisor, the Independent Board Members also considered the pricing schedule or fees that the Sub-Advisor charges for similar investment management services for other funds.
3. Profitability of Fund Advisers
In conjunction with its review of fees, the Independent Board Members also considered the profitability of Nuveen for its advisory activities (which incorporated Nuveen’s wholly-owned affiliated sub-advisers) and its financial condition. The Independent Board Members reviewed the revenues and expenses of Nuveen’s advisory activities for the last two years, the allocation methodology used in preparing the profitability data and an analysis of the key drivers behind the changes in revenues and expenses that impacted profitability in 2010. The Independent Board Members noted this information supplemented the profitability information requested and received during the year to help keep them apprised of developments affecting profitability (such as changes in fee waivers and expense reimbursement commitments). In this regard, the Independent Board Members noted that they have an Independent Board Member serve as a point person to review and keep them apprised of changes to the profitability analysis and/or methodologies during the year. The Independent Board Members also considered Nuveen’s revenues for advisory activities, expenses, and profit margin compared to that of various unaffiliated management firms with similar amounts of assets under management and relatively comparable asset composition prepared by Nuveen.
In reviewing profitability, the Independent Board Members recognized the subjective nature of determining profitability which may be affected by numerous factors including the allocation of expenses. Further, the Independent Board Members recognized the difficulties in making comparisons as the profitability of other advisers generally is not publicly available and the profitability information that is available for certain advisers or management firms may not be representative of the industry and may be affected by, among other things, the adviser’s particular business mix, capital costs, types of funds managed and expense allocations. Notwithstanding the foregoing, the Independent Board Members reviewed Nuveen’s methodology and assumptions for allocating expenses across product lines to determine profitability. In reviewing profitability, the Independent Board Members recognized Nuveen’s investment in its fund business. Based on their review, the Independent Board Members concluded that the Advisor’s level of profitability for its advisory activities was reasonable in light of the services provided.
In evaluating the reasonableness of the compensation, the Independent Board Members also considered other amounts paid to a Fund Adviser by the Fund as well as any indirect benefits (such as soft dollar arrangements, if any) the Fund Adviser and its affiliates receive, or are expected to receive, that are directly attributable to the management of the Fund, if any. See Section E below for additional information on indirect benefits a Fund Adviser may receive as a result of its relationship with the Fund. Based on their review of the overall fee arrangements of the Fund, the Independent Board Members determined that the advisory fees and expenses of the Fund were reasonable.
D. Economies of Scale and Whether Fee Levels Reflect These Economies of Scale
With respect to economies of scale, the Independent Board Members have recognized the potential benefits resulting from the costs of a fund being spread over a larger asset base, although economies of scale are difficult to measure and predict with precision, particularly on a fund-by-fund basis. One method to help ensure the shareholders share in these benefits is to include breakpoints in the advisory fee schedule. Generally, management fees for funds in the Nuveen complex are comprised of a fund-level component and a complex-level component. The Independent Board Members recognized, however, that the Fund does not have fund-level breakpoints given its unique structure.
The Board also considered the Fund’s complex-wide fee arrangement. Pursuant to the complex-wide fee arrangement, the fees of the funds in the Nuveen complex are generally reduced as the assets in the fund complex reach certain levels. The complex-wide fee arrangement seeks to provide the benefits of economies of scale to fund shareholders when total fund complex assets increase, even if assets of a particular fund are unchanged or have decreased. The approach reflects the notion that some of Nuveen’s costs are attributable to services provided to all its funds in the complex and therefore all funds benefit if these costs are spread over a larger asset base. In this regard, the Independent Board Members also noted that a portion of the assets acquired pursuant to the transaction with FAF are included in determining the level of assets for calculating the complex-wide fee, which helps reduce such fee to the benefit of all shareholders.
Based on their review, the Independent Board Members concluded that the complex-wide fee arrangement was acceptable and reflects economies of scale to be shared with shareholders when assets under management increase and that the absence of a fund-level breakpoint schedule was acceptable.
E. Indirect Benefits
In evaluating fees, the Independent Board Members received and considered information regarding potential “fall out” or ancillary benefits the respective Fund Adviser or its affiliates may receive as a result of its relationship with the Fund. The Independent Board Members also considered whether the Fund Advisers received any benefits from soft dollar arrangements whereby a portion of the commissions paid by the Fund for brokerage may be used to acquire research that may be useful to the Fund Adviser in managing the assets of the Fund and other clients. With respect to the Advisor, the Independent Board Members recognized that the Advisor has
| Nuveen Investments | 65 |
Annual Investment Management Agreement Approval Process
(Unaudited) (continued)
the authority to pay a higher commission in return for brokerage and research services if it determines in good faith that the commission paid is reasonable in relation to the value of the brokerage and research services provided. With respect to the Sub-Advisor, the Independent Board Members considered that the Sub-Advisor may benefit from its soft dollar arrangements pursuant to which it receives research from brokers that execute the Fund’s portfolio transactions. The Independent Board Members noted that the Fund Advisers’ profitability may be somewhat lower if they did not receive the research services pursuant to the soft dollar arrangements and had to acquire such services directly.
Based on their review, the Independent Board Members concluded that any indirect benefits received by a Fund Adviser as a result of its relationship with the Fund were reasonable and within acceptable parameters.
F. Other Considerations
The Independent Board Members did not identify any single factor discussed previously as all-important or controlling. The Board Members, including the Independent Board Members, unanimously concluded that the terms of each Advisory Agreement are fair and reasonable, that the respective Fund Adviser’s fees are reasonable in light of the services provided to the Fund and that the Advisory Agreements be renewed.
| 66 | Nuveen Investments |
Notes
| Nuveen Investments | 67 |
Notes
| 68 | Nuveen Investments |
Notes
| Nuveen Investments | 69 |
Glossary of Terms Used in this Report
Average Annual Total Return: This is a commonly used method to express an investment’s performance over a particular, usually multi-year time period. It expresses the return that would have been necessary each year to equal the investment’s actual cumulative performance (including change in NAV or offer price and reinvested dividends and capital gains distributions, if any) over the time period being considered.
Net Asset Value (NAV): A Fund’s NAV is the dollar value of one share in the Fund. It is calculated by subtracting the liabilities of the Fund from its total assets and then dividing the remainder by the number of shares outstanding. Fund NAVs are calculated at the end of each business day.
Russell 3000 Index: is an index that measures the performance of the 3,000 largest U.S. companies based on total market capitalization, which represents approximately 98% of the investable U.S. equity market. The index returns assume reinvestment of dividends and do not reflect any applicable sales charges. You cannot invest directly in an index.
| 70 | Nuveen Investments |
Fund Manager
Nuveen Fund Advisors, Inc.
333 West Wacker Drive
Chicago, IL 60606
Sub-Advisers
Nuveen HydePark Group, LLC
333 West Wacker Drive
Chicago, IL 60606
Legal Counsel
Chapman and Cutler LLP
Chicago, IL
Independent Registered
Public Accounting Firm
PricewaterhouseCoopers LLP
Chicago, IL
Custodian
State Street Bank & Trust Company
Boston, MA
Transfer Agent and Shareholder Services
Boston Financial
Data Services
Nuveen Investor Services
P.O. Box 8530
Boston, MA 02266-8530
(800) 257-8787
Distribution Information: The Fund hereby designates its percentages of dividends paid from net ordinary income as dividends qualifying for the 70% dividends received deduction (“DRD”) for corporations and its percentages as qualified dividend income (“QDI”) for individuals under Section 1 (h)(11) of the Internal Revenue Code as shown in the accompanying table. The actual qualified dividend income distributions will be reported to shareholders on Form 1099-DIV, which will be sent to shareholders shortly after calendar year end.
| % of DRD | % of QDI | |||||||
Nuveen U.S. Equity Completeness Fund | 31.09% | 31.09% | ||||||
Quarterly Portfolio of Investments and Proxy Voting Information: You may obtain (i) the Fund’s quarterly portfolio of investments, (ii) information regarding how the Fund voted proxies relating to portfolio securities held during the most recent twelve-month period ended June 30, and (iii) a description of the policies and procedures that the Fund used to determine how to vote proxies relating to portfolio securities without charge, upon request, by calling Nuveen Investments at (800) 257-8787 or on Nuveen’s website at www.nuveen.com.
You may also obtain this and other Fund information directly from the Securities and Exchange Commission (SEC). The SEC may charge a copying fee for this information. Visit the SEC on-line at http://www.sec.gov or in person at the SEC’s Public Reference Room in Washington, D.C. Call the SEC at (202) 942-8090 for room hours and operation. You may also request Fund information by sending an e-mail request to publicinfo@sec.gov or by writing to the SEC’s Public Reference Section at 100 F Street NE, Washington, D.C. 20549.
The Financial Industry Regulatory Authority (FINRA) provides a Public Disclosure Program which supplies certain information regarding the disciplinary history of FINRA members and their associated persons in response to either telephone inquiries at (800) 289-9999 or written inquiries at www.finra.org. FINRA also provides an investor brochure that includes information describing the Public Disclosure Program.
| Nuveen Investments | 71 |
Nuveen Investments:
Serving Investors for Generations
Since 1898, financial advisors and their clients have relied on Nuveen Investments to provide dependable investment solutions through continued adherence to proven, long-term investing principles. Today, we offer a range of high quality equity and fixed-income solutions designed to be integral components of a well-diversified core portfolio.
Focused on meeting investor needs.
Nuveen Investments is a global investment management firm that seeks to help secure the long-term goals of institutions and high net worth investors as well as the consultants and financial advisors who serve them. We market our growing range of specialized investment solutions under the high-quality brands of HydePark, NWQ, Nuveen Asset Management, Santa Barbara, Symphony, Tradewinds and Winslow Capital. In total, Nuveen Investments managed approximately $210 billion of assets as of June 30, 2011.
Find out how we can help you.
To learn more about how the products and services of Nuveen Investments may be able to help you meet your financial goals, talk to your financial advisor, or call us at (800) 257-8787. Please read the information provided carefully before you invest. Investors should consider the investment objective and policies, risk considerations, charges and expenses of any investment carefully. Where applicable, be sure to obtain a prospectus, which contains this and other relevant information. To obtain a prospectus, please contact your securities representative or Nuveen Investments, 333 W. Wacker Dr., Chicago, IL 60606. Please read the prospectus carefully before you invest or send money.
Learn more about Nuveen Funds at: www.nuveen.com/mf
Nuveen makes things e-simple.
It only takes a minute to sign up for e-Reports. Once enrolled, you’ll receive an e-mail as soon as your Nuveen Fund information is ready — no more waiting for delivery by regular mail. Just click on the link within the e-mail to see the report and save it on your computer if you wish.
Free e-Reports right to your e-mail!
www.investordelivery.com
If you receive your Nuveen Fund distributions and statements from your financial advisor or brokerage account.
OR
www.nuveen.com/accountaccess
If you receive your Nuveen Fund distributions and statements directly from Nuveen.
Distributed by Nuveen Securities, LLC 333 West Wacker Drive Chicago, IL 60606 www.nuveen.com |
MAN-COMP-0611P

Mutual Funds
Nuveen Equity Funds
For investors seeking high current income and long-term capital appreciation.
Annual Report
June 30, 2011
Nuveen NWQ Equity Income Fund |
INVESTMENT ADVISER NAME CHANGE
Effective January 1, 2011, Nuveen Asset Management, the Funds’ investment adviser, changed its name to Nuveen Fund Advisors, Inc. (“Nuveen Fund Advisors”). Concurrently, Nuveen Fund Advisors formed a wholly-owned subsidiary, Nuveen Asset Management, LLC, to house its portfolio management capabilities.
NUVEEN INVESTMENTS COMPLETES STRATEGIC COMBINATION WITH FAF ADVISORS
On December 31, 2010, Nuveen Investments completed the strategic combination between Nuveen Asset Management, the largest investment affiliate of Nuveen Investments, and FAF Advisors. As part of this transaction, U.S. Bancorp — the parent of FAF Advisors — received cash consideration and a 9.5% stake in Nuveen Investments in exchange for the long-term investment business of FAF Advisors, including investment-management responsibilities for the non-money market mutual funds of the First American Funds family.
The approximately $27 billion of mutual fund and institutional assets managed by FAF Advisors, along with the investment professionals managing these assets and other key personnel, have become part of Nuveen Asset Management, LLC. With these additions to Nuveen Asset Management, LLC, this affiliate now manages more than $100 billion of assets across a broad range of strategies from municipal and taxable fixed income to traditional and specialized equity investments.
This combination does not affect the investment objectives or strategies of the Funds in this report. Over time, Nuveen Investments expects that the combination will provide even more ways to meet the needs of investors who work with financial advisors and consultants by enhancing the multi-boutique model of Nuveen Investments, which also includes highly respected investment teams at HydePark, NWQ Investment Management, Santa Barbara Asset Management, Symphony Asset Management, Tradewinds Global Investors and Winslow Capital. Nuveen Investments managed approximately $210 billion of assets as of June 30, 2011.
| Must be preceded by or accompanied by a prospectus. | NOT FDIC INSURED | MAY LOSE VALUE | NO BANK GUARANTEE |
| 4 | ||||
| 5 | ||||
| 10 | ||||
| 12 | ||||
| 13 | ||||
| 14 | ||||
| 15 | ||||
| 18 | ||||
| 19 | ||||
| 20 | ||||
| 22 | ||||
| 24 | ||||
| 30 | ||||
| 34 | ||||
| 38 | ||||
| 39 | ||||
Letter to Shareholders

Dear Shareholders,
The global economy continues to be weighed down by an unusual combination of pressures facing the larger developed economies. Japanese leaders continue to work through the economic aftereffects of the March 2011 earthquake and tsunami. Political leaders in Europe and the U.S. have resolved some of the near term fiscal problems, but the financial markets are not convinced that these leaders are able to address more complex longer term fiscal issues. Despite improved earnings and capital increases, the largest banks in these countries continue to be vulnerable to deteriorating mortgage portfolios and sovereign credit exposure, adding another source of uncertainty to the global financial system.
In the U.S., recent economic statistics indicate that the economic recovery may be losing momentum. Consumption, which represents about 70% of the gross domestic product, faces an array of challenges from seemingly intractable declines in housing values, increased energy costs and limited growth in the job market. The failure of Congress and the administration to agree on the debt ceiling increase on a timely basis and the deep divisions between the political parties over fashioning a balanced program to address growing fiscal imbalances that led to the recent S&P ratings downgrade add considerable uncertainty to the domestic economic picture.
On a more positive note, corporate earnings continue to hold up well and the municipal bond market is recovering from recent weakness as states and municipalities implement various programs to reduce their budgetary deficits. In addition, the Federal Reserve System has made it clear that it stands ready to take additional steps should the economic recovery falter. However, there are concerns that the Fed is approaching the limits of its resources to intervene in the economy.
These perplexing times highlight the importance of professional investment management. Your Nuveen investment team is working hard to develop an appropriate response to increased risk, and they continue to seek out opportunities created by stressful markets using proven investment disciplines designed to help your Fund achieve its investment objectives. On your behalf, we monitor their activities to assure that they maintain their investment disciplines.
As always, I encourage you to contact your financial consultant if you have any questions about your investment in a Nuveen Fund. On behalf of the other members of your Fund Board, we look forward to continuing to earn your trust in the months and years ahead.
Sincerely,

Robert P. Bremner
Chairman of the Board
August 23, 2011
| 4 | Nuveen Investments |
Certain statements in this report are forward-looking statements. Discussions of specific investments are for illustration only and are not intended as recommendations of individual investments. The forward-looking statements and other views expressed herein are those of the portfolio manager as of the date of this report. Actual future results or occurrences may differ significantly from those anticipated in any forward-looking statements and the views expressed herein are subject to change at any time, due to numerous market and other factors. The Fund disclaims any obligation to update publicly or revise any forward-looking statements or views expressed herein.
Ratings shown are the highest rating given by one of the following national rating agencies: S&P, Moody’s or Fitch. Credit ratings are subject to change. AAA, AA, A, and BBB are investment grade ratings; BB, B, CCC/CC/C and D are below-investment grade ratings. Bonds backed by U.S. Government or agency securities are given an implied rating equal to the rating of such securities. Holdings designated NR are not rated by a national rating agency.
The Nuveen NWQ Equity Income Fund features management by NWQ Investment Management Company, LLC, an affiliate of Nuveen Investments. Jon Bosse, Chief Investment Officer of NWQ, leads the Fund’s management team at that firm. He has 29 years of corporate finance and investment management experience. Here Jon talks about overall market conditions, his management strategies and the performance of the Fund for the period ending June 30, 2011.
What were the general market conditions and trends over the course of the period?
Economic growth was quite uneven over the twelve-month reporting period. The second half of 2010 began with widespread concerns about financial contagion from several European countries and very slow growth, raising the probability of a double-dip recession in the United States. These fears seemed to be quelled in late 2010 and early 2011 as another round of quantitative easing was introduced by the Federal Reserve and consumer spending rebounded sharply. However, this relief was relatively short lived as renewed weakness in housing and higher food and energy prices put a damper on consumption at about the same time that supply chain disruptions from the Japanese tsunami and earthquake were distorting growth and suppressing job creation in many areas in the U.S. and around the world.
Throughout the period, the Fed continued to hold the benchmark fed funds rate in a target range of zero to 0.25% since cutting it to this record low level in December 2008. At its June 2011 meeting, the central bank downgraded growth estimates for the year while reaffirming that it anticipated keeping the fed funds rate at “exceptionally low levels” for an “extended period.”
From a macro perspective, we ended the fiscal period facing many of the same uncertainties that we did at this same time last year. The Greek bailout had yet to be finalized and fiscal concerns had spread to other European countries such as Ireland, Portugal, Italy and Spain. At the same time, fears about slowing U.S. economic growth bubbled to the surface again, causing consumer spending to pull back. The employment situation seemed to plateau, with the national jobless rate registering 9.2% in June 2011, the fourth monthly increase in a row and just slightly lower than one year earlier. Also, the overall housing market continued to show weakness, weighed down by a backlog of distressed properties on the market and falling prices. For the twelve months ended May 2011 (the most recent data available at the time this report was prepared), property values in the Standard & Poor’s (S&P)/Case-Shiller index of 20 major metropolitan areas had fallen 4.5% from one year earlier. U.S. gross domestic product (GDP), a broad measure of the nation’s economic health, was revised downward to an anemic 0.4% annual growth rate for the first quarter of 2011 and estimated to be 1.3% for the second quarter, according to the Commerce Department.
| Nuveen Investments | 5 |
The U.S. equity markets generally rose during the twelve-month period, with the major large capitalization indexes producing strong, double-digit gains. By June 30, 2011, the Russell 1000 Value and S&P 500 indexes had appreciated over 90% from their March 2009 lows. While this still left these indexes below their 2007 peak levels, bankruptcies and significant equity dilution for a multitude of corporations make those prior levels much more elevated than they may seem at first glance. However, even though many companies continue to report better-than-expected earnings, very few of the structural imbalances facing the United States or the global economy have been addressed in a meaningful way.
A critical issue is the capability of the U.S. equity markets to withstand stress in the event of a continued weakness in the domestic or foreign economies. That fear certainly was a significant cause of depressed valuations in the finance sector. We believe higher equity capital ratios and loss reserves will help mitigate the fear and pressure that “broke” the sector during the market decline of calendar year 2008 (through early 2009). Merger and acquisition activity, including private equity and leveraged buyout activity, has remained robust. Balance sheets outside of the finance sector are strong, and many companies are returning more capital to shareholders either through dividends or share repurchases. We expect volatility to continue, but believe the significant rotation away from the finance and cyclical sectors have created some attractive investment opportunities.
How did the Fund perform during the twelve-month period ending June 30, 2011?
The table in the Fund Performance and Expense Ratio section of this report provides total returns for the Fund’s Class A Shares for the one-year and since inception periods ended June 30, 2011. The Fund’s returns are compared with the performance of a corresponding market index and peer group average. Despite a strong return for the period, the Fund modestly underperformed the Russell 1000 Value Index and the Lipper Equity Income Funds Category Average.
What is the Fund’s investment strategy?
The Fund is designed to seek high current income and long-term capital appreciation. NWQ attempts to meet this investment objective by investing primarily in dividend-paying equity securities, including common stocks, preferred stocks, warrants to purchase common stocks or preferred stocks, securities convertible into common or preferred stocks (such as convertible bonds and debentures), and other securities with equity characteristics. The Fund does not invest more than 25% of its net assets in non-common stock investments. Although the Fund invests primarily in U.S. equity securities, it may invest up to 25% of its net assets in non-U.S. equity securities. The Fund also has the ability to sell covered call options on individual stocks in an effort to enhance returns while foregoing some upside potential.
How did this strategy influence performance?
Several portfolio positions appreciated sharply during the year, given initial depressed valuations, individual catalysts, and a perception of stabilization in the economy. Pfizer Inc. outperformed as the company has been active in addressing ongoing and future challenges by shaking up its management team, stabilizing its core earnings, and beginning the process of divesting several divisions. Pfizer has several near-term pipeline
| 6 | Nuveen Investments |
opportunities, including its oral rheumatoid arthritis drug, tofacitinib, that posted positive results during a second Phase 3 study.
Viacom Inc. appreciated as advertising trends have steadily recovered alongside the global economy. Viacom has tremendous business momentum as its cable networks continue to post solid ratings, particularly at MTV. Strong revenue growth from a robust advertising environment and steadily growing affiliate fees combined with cost controls are driving margin expansion. The company also reactivated its share repurchase program.
Motorola Solutions Inc. is a leading provider of two-way radio and wireless network products, and appears to be positioned to profit from the digital upgrade in public safety equipment. We believe the company will also benefit significantly if the government allocates additional frequency spectrum to public safety for wireless broadband data usage, an issue that is starting to gain momentum in Washington. We expect the company will address capital allocation (dividends and share repurchase) after completing the sale of its network business to Nokia Siemens.
Several positions negatively impacted performance, including Genworth Financial Inc.’s U.S. mortgage insurance business. It struggled given the lingering housing market problems. Despite stability in its life and international mortgage divisions, weakness in its U.S. mortgage insurance operations continues to loom over the company’s efforts to recover from the 2008 financial crisis. General Motors Company (GM) has declined since the Fund’s initial purchase in November 2010 on concerns about potential pricing degradation and product mix given high gasoline prices and production cutbacks due to supply shortages from Japan. The potential overhang of the U.S. government’s ownership stake also weighed on the stock. However, our investment thesis for the stock remains intact as the company’s fundamentals have greatly improved since emerging from bankruptcy last year, and the issues and concerns are short-term in nature.
Also detracting from performance were gold mining stocks AngloGold Ashanti Limited and Barrick Gold Corporation, which underperformed given concerns of continued cost inflation, a more punitive tax environment, and questionable capital allocation decisions (particularly at Barrick Gold). Despite these issues, we feel our gold equities continued to offer an attractive investment opportunity.
We made a number of new investments during the year. As noted, in mid-November we invested in GM when the U.S. government reduced its ownership stake. The company has massively improved its balance sheet and financial flexibility, and has considerable margin and earnings leverage. We believe there is significant hidden value that has not been fully reflected in GM’s stock price.
Cisco Systems Inc. was purchased as we felt the share price fully discounted lower future operating margins and gave little value to the company’s core franchise or management’s ability to successfully restructure its businesses. We feel that shares of Cisco offered potential upside through stock repurchases, increased dividends, and successful reorganization and product repositioning efforts.
Teva Pharmaceutical Industries Ltd. (Teva) is a global leader in the development and marketing of generic pharmaceuticals and is well-positioned to benefit from the upcoming wave of major branded drugs reaching the expiration of their patent protection. Recent execution issues, which have included FDA quality control violations at two plants, have sent Teva shares down to single-digit earnings multiples and near double-digit free cash flow yields.
| Nuveen Investments | 7 |
Interpublic Group of Companies, Inc. provides advertising and marketing services worldwide. The company had been plagued by accounting irregularities, as well as poor cost controls, following a series of acquisitions made over the years. A new management team has fixed the accounting issues and implemented controls and other important business systems for managing and monitoring costs. We initiated a position as the company continued its fundamental improvement driven by better execution and increased cash flow generation. The company recently took another positive step in its turnaround when Moody’s upgraded its unsecured debt and revolving credit facility two notches to investment grade. This should result in removing the covenants on cash flow and could lead to the company ramping up its share buyback and/or increasing its dividend payout.
We also purchased CVS Caremark Corporation, the retail pharmacy and pharmacy services provider. We believe that the market is giving the company no credit for the synergies created by its purchase of pharmacy benefit manager Caremark Rx two years ago in a deal which created the most vertically integrated pharmacy in the country. Other new investments during the period include Frontier Communications Corporation, GlaxoSmithKline PLC ADR, Hewlett-Packard Company, Ingersoll Rand Plc, JP Morgan Chase, National CineMedia, Nielsen Holdings N.V., Redwood Trust, Time Warner Inc., and Symetra Financial Corporation.
We eliminated several positions, including Kroger Co. on concerns regarding the ability of the supermarket group to pass through upcoming food price inflation as consumers simultaneously digest higher gas prices and a sluggish employment outlook. Kimberly-Clark Corp. was sold based on valuation and concerns stemming from the announced restructuring of its pulp and paper operations. We questioned the high cost of the plan, particularly when compared to the limited expected return the restructuring would generate.
Valeant Pharmaceutical International was sold following significant appreciation as investors become more comfortable with the company’s business model and the sustainability of its growth prospects. Following a successful cost cutting initiative, Verizon Communications no longer possessed an attractive catalyst, which made the stock less compelling compared to other investment opportunities. Bank of America, ENI Spa ADR, Packaging Corp. of America, The Mosaic Company, Travelers Co., Inc., Trinity Industries Inc., and Union Pacific were also eliminated as we felt each company’s share price had reached fair valuation, and the risk/reward opportunity for continuing to own the stocks was no longer attractive.
RISK CONSIDERATIONS
Mutual fund investing involves risk; principal loss is possible. Equity investments are subject to market risk. Foreign investments involve additional risks, including currency fluctuation, political and economic instability, lack of liquidity and differing legal and accounting standards. These risks are magnified in emerging markets. Convertible securities involve risks as the value of the Fund’s convertible securities may decline in response to such factors as rising interest rates and fluctuations in the market price of the common stock underlying the convertible securities. The value of call options sold (written) will be affected by, among other things, changes in the value of the securities or indexes underlying the options and the remaining time to the options’ expiration. By writing call options, the Fund may not participate in any appreciation of its equity portfolio as fully as it would if the Fund did not sell call options.
| 8 | Nuveen Investments |
[THIS PAGE INTENTIONALLY LEFT BLANK]
| Nuveen Investments | 9 |
Fund Performance and Expense Ratios (Unaudited)
Nuveen NWQ Equity Income Fund
Returns quoted represent past performance, which is no guarantee of future results. Current performance may be higher or lower than the performance shown. Investment returns and principal value will fluctuate so that when shares are redeemed, they may be worth more or less than their original cost. Returns without sales charges would be lower if the sales charge were included. Returns do not reflect the deduction of taxes that a shareholder would pay on Fund distributions or the redemption of Fund shares.
Returns may reflect a contractual agreement between the Fund and the investment adviser to waive certain fees and expenses; see Notes to Financial Statements, Footnote 7 — Management Fees and Other Transactions with Affiliates for more information. In addition, returns may reflect a voluntary expense limitation by the Fund’s investment adviser that may be modified or discontinued at any time without notice. For the most recent month-end performance visit www.nuveen.com or call (800) 257-8787.
Returns reflect differences in sales charges and expenses, which are primarily differences in distribution and service fees. Fund returns assume reinvestment of dividends and capital gains.
Comparative index and benchmark return information is provided for the Fund’s Class A Shares at net asset value (NAV) only.
The expense ratios below reflect the Fund’s total operating expenses (before fee waivers or expense reimbursements, if any) as shown in the Fund’s most recent prospectus. The expense ratios include management fees and other fees and expenses.
Average Annual Total Returns as of June 30, 2011
| Average Annual | ||||||||
| 1-Year | Since Inception* | |||||||
Class A Shares at NAV | 25.34% | 13.74% | ||||||
Class A Shares at maximum Offering Price | 18.13% | 10.04% | ||||||
Russell 1000 Value Index** | 28.94% | 14.53% | ||||||
Lipper Equity Income Funds Category Average** | 29.79% | 15.85% | ||||||
Class C Shares | 24.43% | 12.89% | ||||||
Class R3 Shares | 25.09% | 13.46% | ||||||
Class I Shares | 25.64% | 14.01% | ||||||
Class A Shares have a maximum 5.75% sales charge. Class A Share purchases of $1 million or more are sold at net asset value without an up-front sales charge but may be subject to a contingent deferred sales charge (CDSC), also known as a back-end sales charge, if redeemed within one year of purchase. Class C Shares have a 1% CDSC for redemptions within less than one year, which is not reflected in the twelve month total return. Class R3 Shares have no sales charge and are available to only certain retirement plans. Class I Shares have no sales charge and may be purchased under limited circumstances or by specified classes of investors.
| Expense Ratios | ||||||
| Share Class | Gross Expense Ratios | Net Expense Ratios | ||||
| Class A | 3.74% | 1.14% | ||||
| Class C | 4.49% | 1.89% | ||||
| Class R3 | 3.99% | 1.39% | ||||
| Class I | 3.49% | 0.89% | ||||
The investment adviser has agreed to waive fees and reimburse expenses through October 31, 2012 so that total annual Fund operating expenses (excluding 12b-1 distribution and service fees, interest expenses, taxes, fees incurred in acquiring and disposing of portfolio securities and extraordinary expenses) do not exceed .90% (1.15% after October 31, 2012) of the average daily net assets of any class of Fund shares. The expense limitation expiring October 31, 2012, may be terminated or modified prior to that date only with the approval of the Board of Trustees of the Fund. The expense limitation in effect thereafter may be terminated or modified only with the approval of shareholders of the Fund.
| * | Since inception returns are from 9/15/09. |
| ** | Refer to the Glossary of Terms Used in this Report for definitions. |
| 10 | Nuveen Investments |
Growth of an Assumed $10,000 Investment as of June 30, 2011
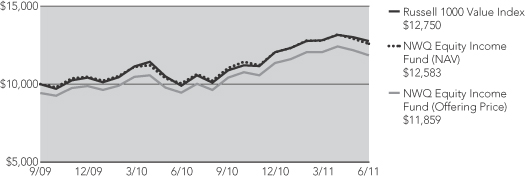
The graph does not reflect the deduction of taxes that a shareholder may pay on Fund distributions or the redemption of Fund shares.
| Nuveen Investments | 11 |
Holding Summaries (Unaudited) as of June 30, 2011
This data relates to the securities held in the Fund’s portfolio of investments. It should not be construed as a measure of performance for the Fund itself.
Portfolio Allocation1
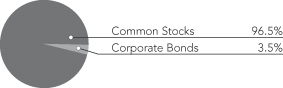
| Portfolio Composition1 | ||||
| Insurance | 18.3% | |||
| Pharmaceuticals | 16.0% | |||
| Media | 9.3% | |||
| Metals & Mining | 7.4% | |||
| Communications Equipment | 6.5% | |||
| Oil, Gas, & Consumable Fuels | 6.5% | |||
| Software | 6.2% | |||
| Diversified Financial Services | 5.4% | |||
| Aerospace & Defense | 3.6% | |||
| Commercial Banks | 2.6% | |||
| Other | 18.2% | |||
| Top Five Common Stock Holdings2 | ||||
Sanofi-Aventis, Sponsored ADR | 5.2% | |||
| Pfizer Inc. | 5.1% | |||
CA Inc. | 4.4% | |||
Citigroup Inc. | 3.6% | |||
Viacom Inc., Class B | 3.6% | |||
| 1 | As a percentage of total investments as of June 30, 2011. Holdings are subject to change. |
| 2 | As a percentage of total common stocks as of June 30, 2011. Holdings are subject to change. |
| 12 | Nuveen Investments |
As a shareholder of the Fund, you incur two types of costs: (1) transaction costs, including up-front and back-end sales charges (loads) or redemption fees, where applicable; and (2) ongoing costs, including management fees; distribution and service (12b-1) fees, where applicable; and other Fund expenses. This Example is intended to help you understand your ongoing costs (in dollars) of investing in the Fund and to compare these costs with the ongoing costs of investing in other mutual funds.
The Example below is based on an investment of $1,000 invested at the beginning of the period and held for the period.
The information under “Actual Performance,” together with the amount you invested, allows you to estimate actual expenses incurred over the reporting period. Simply divide your account value by $1,000 (for example, an $8,600 account value divided by $1,000 = 8.60) and multiply the result by the cost shown for your share class, in the row entitled “Expenses Incurred During Period” to estimate the expenses incurred on your account during this period.
The information under “Hypothetical Performance,” provides information about hypothetical account values and hypothetical expenses based on the Fund’s actual expense ratio and an assumed rate of return of 5% per year before expenses, which is not the Fund’s actual return. The hypothetical account values and expenses may not be used to estimate the actual ending account balance or expense you incurred for the period. You may use this information to compare the ongoing costs of investing in the Fund and other Funds. To do so, compare this 5% hypothetical example with the 5% hypothetical examples that appear in the shareholder reports of the other funds.
Please note that the expenses shown in the table are meant to highlight your ongoing costs only and do not reflect any transaction costs. Therefore, the hypothetical information is useful in comparing ongoing costs only, and will not help you determine the relative total costs of owning different funds or share classes. In addition, if these transaction costs were included, your costs would have been higher.
| Hypothetical Performance | ||||||||||||||||||||||||||||||||||
| Actual Performance | (5% annualized return before expenses) | |||||||||||||||||||||||||||||||||
| A Shares | C Shares | R3 Shares | I Shares | A Shares | C Shares | R3 Shares | I Shares | |||||||||||||||||||||||||||
| Beginning Account Value (1/01/11) | $ | 1,000.00 | $ | 1,000.00 | $ | 1,000.00 | $ | 1,000.00 | $ | 1,000.00 | $ | 1,000.00 | $ | 1,000.00 | $ | 1,000.00 | ||||||||||||||||||
| Ending Account Value (6/30/11) | $ | 1,045.10 | $ | 1,041.30 | $ | 1,043.80 | $ | 1,046.00 | $ | 1,019.19 | $ | 1,015.47 | $ | 1,017.95 | $ | 1,020.43 | ||||||||||||||||||
| Expenses Incurred During Period | $ | 5.73 | $ | 9.52 | $ | 6.99 | $ | 4.46 | $ | 5.66 | $ | 9.39 | $ | 6.90 | $ | 4.41 | ||||||||||||||||||
For each class of the Fund, expenses are equal to the Fund’s annualized net expense ratio of 1.13%, 1.88%, 1.38% and .88% for Classes A, C, R3 and I, respectively, multiplied by the average account value over the period, multiplied by 181/365 (to reflect the one-half year period).
| Nuveen Investments | 13 |
Independent Registered
Public Accounting Firm
To the Board of Trustees and Shareholders of
Nuveen Investment Trust:
In our opinion, the accompanying statement of assets and liabilities, including the portfolio of investments, and the related statements of operations, of changes in net assets and the financial highlights present fairly, in all material respects, the financial position of Nuveen NWQ Equity Income Fund (a series of the Nuveen Investment Trust, hereafter referred to as the “Fund”) at June 30, 2011, the results of its operations for the year then ended, the changes in its net assets and the financial highlights for each of the periods indicated, in conformity with accounting principles generally accepted in the United States of America. These financial statements and financial highlights (hereafter referred to as “financial statements”) are the responsibility of the Fund’s management; our responsibility is to express an opinion on these financial statements based on our audit. We conducted our audit of these financial statements in accordance with the standards of the Public Company Accounting Oversight Board (United States). Those standards require that we plan and perform the audit to obtain reasonable assurance about whether the financial statements are free of material misstatement. An audit includes examining, on a test basis, evidence supporting the amounts and disclosures in the financial statements, assessing the accounting principles used and significant estimates made by management, and evaluating the overall financial statement presentation. We believe that our audit, which included confirmation of securities at June 30, 2011 by correspondence with the custodian and brokers, provides a reasonable basis for our opinion.
PRICEWATERHOUSECOOPERS LLP
Chicago, IL
August 26, 2011
| 14 | Nuveen Investments |
Nuveen NWQ Equity Income Fund
June 30, 2011
| Shares | Description (1) | Value | ||||||||||||
COMMON STOCKS – 96.9% | ||||||||||||||
Aerospace & Defense – 3.7% | ||||||||||||||
| 225 | Lockheed Martin Corporation | $ | 18,218 | |||||||||||
| 500 | Raytheon Company | 24,925 | ||||||||||||
Total Aerospace & Defense | 43,143 | |||||||||||||
Automobiles – 2.2% | ||||||||||||||
| 850 | General Motors Company, (2) | 25,806 | ||||||||||||
Biotechnology – 1.5% | ||||||||||||||
| 300 | Amgen Inc., (2) | 17,505 | ||||||||||||
Commercial Banks – 2.6% | ||||||||||||||
| 1,100 | Wells Fargo & Company | 30,866 | ||||||||||||
Commercial Services & Supplies – 1.9% | ||||||||||||||
| 1,000 | Pitney Bowes Inc. | 22,990 | ||||||||||||
Communications Equipment – 6.5% | ||||||||||||||
| 1,100 | Cisco Systems, Inc. | 17,171 | ||||||||||||
| 1,300 | Motorola Mobility Holdings Inc., (2) | 28,652 | ||||||||||||
| 671 | Motorola Solutions Inc., (2) | 30,893 | ||||||||||||
Total Communications Equipment | 76,716 | |||||||||||||
Computers & Peripherals – 1.5% | ||||||||||||||
| 500 | Hewlett-Packard Company | 18,200 | ||||||||||||
Diversified Financial Services – 5.4% | ||||||||||||||
| 1,000 | Citigroup Inc. | 41,640 | ||||||||||||
| 540 | JP Morgan Chase & Co. | 22,108 | ||||||||||||
Total Diversified Financial Services | 63,748 | |||||||||||||
Diversified Telecommunication Services – 1.8% | ||||||||||||||
| 2,600 | Frontier Communications Corporation | 20,982 | ||||||||||||
Food & Staples Retailing – 1.8% | ||||||||||||||
| 550 | CVS Caremark Corporation | 20,669 | ||||||||||||
Insurance – 14.8% | ||||||||||||||
| 2,600 | Genworth Financial Inc., Class A, (2) | 26,728 | ||||||||||||
| 1,500 | Hartford Financial Services Group, Inc. | 39,555 | ||||||||||||
| 450 | Loews Corporation | 18,941 | ||||||||||||
| 850 | MetLife, Inc. | 37,290 | ||||||||||||
| 1,500 | Symetra Financial Corporation | 20,145 | ||||||||||||
| 1,250 | Unum Group | 31,850 | ||||||||||||
Total Insurance | 174,509 | |||||||||||||
Machinery – 1.5% | ||||||||||||||
| 400 | Ingersoll Rand Company Limited, Class A | 18,164 | ||||||||||||
Media – 9.3% | ||||||||||||||
| 1,600 | Interpublic Group Companies, Inc. | 20,000 | ||||||||||||
| 1,200 | National CineMedia, Inc. | 20,292 | ||||||||||||
| 800 | Time Warner Inc. | 29,096 | ||||||||||||
| 800 | Viacom Inc., Class B | 40,800 | ||||||||||||
Total Media | 110,188 | |||||||||||||
| Nuveen Investments | 15 |
Portfolio of Investments
Nuveen NWQ Equity Income Fund (continued)
June 30, 2011
| Shares | Description (1) | Value | ||||||||||||
Metals & Mining – 7.5% | ||||||||||||||
| 800 | AngloGold Ashanti Limited, Sponsored ADR | $ | 33,672 | |||||||||||
| 700 | Barrick Gold Corporation | 31,703 | ||||||||||||
| 550 | Nucor Corporation | 22,671 | ||||||||||||
Total Metals & Mining | 88,046 | |||||||||||||
Oil, Gas & Consumable Fuels – 6.5% | ||||||||||||||
| 300 | Exxon Mobil Corporation | 24,414 | ||||||||||||
| 225 | Occidental Petroleum Corporation | 23,409 | ||||||||||||
| 500 | Total S.A., Sponsored ADR | 28,920 | ||||||||||||
Total Oil, Gas & Consumable Fuels | 76,743 | |||||||||||||
Pharmaceuticals – 16.1% | ||||||||||||||
| 600 | GlaxoSmithKline PLC, Sponsored ADR | 25,740 | ||||||||||||
| 775 | Merck & Company Inc. | 27,350 | ||||||||||||
| 2,800 | Pfizer Inc. | 57,680 | ||||||||||||
| 1,475 | Sanofi-Aventis, Sponsored ADR | 59,249 | ||||||||||||
| 400 | Teva Pharmaceutical Industries Limited, Sponsored ADR | 19,288 | ||||||||||||
Total Pharmaceuticals | 189,307 | |||||||||||||
Professional Services – 1.1% | ||||||||||||||
| 400 | Nielsen Holdings BV | 12,464 | ||||||||||||
Real Estate Investment Trust – 1.0% | ||||||||||||||
| 800 | Redwood Trust Inc. | 12,096 | ||||||||||||
Software – 6.3% | ||||||||||||||
| 2,175 | CA Inc. | 49,677 | ||||||||||||
| 925 | Microsoft Corporation | 24,050 | ||||||||||||
Total Software | 73,727 | |||||||||||||
Tobacco – 2.0% | ||||||||||||||
| 350 | Philip Morris International | 23,370 | ||||||||||||
Wireless Telecommunication Services – 1.9% | ||||||||||||||
| 850 | Vodafone Group PLC, Sponsored ADR | 22,712 | ||||||||||||
Total Common Stocks (cost $1,059,227) | $ | 1,141,951 | ||||||||||||
| Principal Amount (000) | Description (1) | Coupon | Maturity | Ratings (3) | Value | |||||||||||||||||
CORPORATE BONDS – 3.5% | ||||||||||||||||||||||
Insurance – 3.5% | ||||||||||||||||||||||
| 40 | Genworth Financial Inc. | 5.750% | 6/15/14 | BBB | $ | 41,765 | ||||||||||||||||
Total Corporate Bonds (cost $37,530) | 41,765 | |||||||||||||||||||||
Total Investments (cost $1,096,757) – 100.4% | 1,183,716 | |||||||||||||||||||||
Other Assets Less Liabilities – (0.4)% | (5,302) | |||||||||||||||||||||
Net Assets – 100% | $ | 1,178,414 | ||||||||||||||||||||
| 16 | Nuveen Investments |
| For Fund portfolio compliance purposes, the Fund’s industry classifications refer to any one or more of the industry sub-classifications used by one or more widely recognized market indexes or ratings group indexes, and/or as defined by Fund management. This definition may not apply for purposes of this report, which may combine industry sub-classifications into sectors for reporting ease. |
| (1) | All percentages shown in the Portfolio of Investments are based on net assets. |
| (2) | Non-income producing; issuer has not declared a dividend within the past twelve months. |
| (3) | Ratings (not covered by the report of independent registered public accounting firm): Using the highest of Standard & Poor’s Group (“Standard & Poor’s”), Moody’s Investor Service, Inc. (“Moody’s”) or Fitch, Inc. (“Fitch”) rating. Ratings below BBB by Standard & Poor’s, Baa by Moody’s or BBB by Fitch are considered to be below investment grade. Holdings designated N/R are not rated by any of these national rating agencies. |
| ADR | American Depositary Receipt. |
See accompanying notes to financial statements.
| Nuveen Investments | 17 |
Statement of Assets and Liabilities
June 30, 2011
Assets | ||||
Investments, at value (cost $1,096,757) | $ | 1,183,716 | ||
Cash | 7,810 | |||
Receivables: | ||||
Dividends | 2,670 | |||
From Adviser | 3,975 | |||
Interest | 102 | |||
Investments sold | 7,046 | |||
Reclaims | 48 | |||
Other assets | 2,038 | |||
Total assets | 1,207,405 | |||
Liabilities | ||||
Dividends payable | 5,824 | |||
Accrued expenses: | ||||
12b-1 distribution and service fees | 416 | |||
Professional fees | 11,009 | |||
Shareholders’ reports – printing and mailing expenses | 9,423 | |||
Other | 2,319 | |||
Total liabilities | 28,991 | |||
Net assets | $ | 1,178,414 | ||
Class A Shares | ||||
Net assets | $ | 294,639 | ||
Shares outstanding | 12,500 | |||
Net asset value per share | $ | 23.57 | ||
Offering price per share (net asset value per share plus maximum sales charge of 5.75% of offering price) | $ | 25.01 | ||
Class C Shares | ||||
Net assets | $ | 294,499 | ||
Shares outstanding | 12,500 | |||
Net asset value and offering price per share | $ | 23.56 | ||
Class R3 Shares | ||||
Net assets | $ | 294,591 | ||
Shares outstanding | 12,500 | |||
Net asset value and offering price per share | $ | 23.57 | ||
Class I Shares | ||||
Net assets | $ | 294,685 | ||
Shares outstanding | 12,500 | |||
Net asset value and offering price per share | $ | 23.57 | ||
Net assets consist of: | ||||
Capital paid-in | $ | 998,320 | ||
Undistributed (Over-distribution of) net investment income | 294 | |||
Accumulated net realized gain (loss) | 92,841 | |||
Net unrealized appreciation (depreciation) | 86,959 | |||
Net assets | $ | 1,178,414 | ||
Authorized shares | Unlimited | |||
Par value per share | $ | 0.01 |
See accompanying notes to financial statements.
| 18 | Nuveen Investments |
Year Ended June 30, 2011
Dividend and Interest Income (net of foreign tax withheld of $1,005) | $ | 29,937 | ||
Expenses | ||||
Management fees | 7,729 | |||
12b-1 service fees – Class A | 709 | |||
12b-1 distribution and service fees – Class C | 2,834 | |||
12b-1 distribution and service fees – Class R3 | 1,418 | |||
Shareholders’ servicing agent fees and expenses | 222 | |||
Custodian’s fees and expenses | 6,584 | |||
Trustees’ fees and expenses | 27 | |||
Professional fees | 17,840 | |||
Shareholders’ reports – printing and mailing expenses | 24,718 | |||
Other expenses | 31 | |||
Total expenses before custodian fee credit and expense reimbursement | 62,112 | |||
Custodian fee credit | (42 | ) | ||
Expense reimbursement | (47,165 | ) | ||
Net expenses | 14,905 | |||
Net investment income (loss) | 15,032 | |||
Realized and Unrealized Gain (Loss) | ||||
Net realized gain (loss) from: | ||||
Investments | 78,517 | |||
Call options written | 13,904 | |||
Change in net unrealized appreciation (depreciation) of: | ||||
Investments | 138,525 | |||
Call options written | (205 | ) | ||
Net realized and unrealized gain (loss) | 230,741 | |||
Net increase (decrease) in net assets from operations | $ | 245,773 |
See accompanying notes to financial statements.
| Nuveen Investments | 19 |
Statement of Changes in Net Assets
Year Ended 6/30/11 | For the Period 9/15/09 (commencement of operations) through 6/30/10 | |||||||
Operations | ||||||||
Net investment income (loss) | $ | 15,032 | $ | 13,663 | ||||
Net realized gain (loss) from: | ||||||||
Investments | 78,517 | 18,690 | ||||||
Call options written | 13,904 | 22,704 | ||||||
Change in net unrealized appreciation (depreciation) of: | ||||||||
Investments | 138,525 | (51,566 | ) | |||||
Call options written | (205 | ) | 205 | |||||
Net increase (decrease) in net assets from operations | 245,773 | 3,696 | ||||||
Distributions to Shareholders | ||||||||
From net investment income: | ||||||||
Class A | (4,536 | ) | (3,737 | ) | ||||
Class C | (2,404 | ) | (2,254 | ) | ||||
Class R3 | (3,824 | ) | (3,242 | ) | ||||
Class I | (5,249 | ) | (4,233 | ) | ||||
From accumulated net realized gains: | ||||||||
Class A | (10,394 | ) | — | |||||
Class C | (10,394 | ) | — | |||||
Class R3 | (10,394 | ) | — | |||||
Class I | (10,394 | ) | — | |||||
Decrease in net assets from distributions to shareholders | (57,589 | ) | (13,466 | ) | ||||
Fund Share Transactions | ||||||||
Net proceeds from sale of shares | — | 1,000,000 | ||||||
Net increase (decrease) in net assets from Fund share transactions | — | 1,000,000 | ||||||
Net increase (decrease) in net assets | 188,184 | 990,230 | ||||||
Net assets at the beginning of period | 990,230 | — | ||||||
Net assets at the end of period | $ | 1,178,414 | $ | 990,230 | ||||
Undistributed (Over-distribution of) net investment income at the end of period | $ | 294 | $ | 1,275 | ||||
See accompanying notes to financial statements.
| 20 | Nuveen Investments |
Financial Highlights
| Nuveen Investments | 21 |
| Selected data for a share outstanding throughout the period: | ||||||||||||||||||||||||||||||||||||
| Class (Commencement Date) | ||||||||||||||||||||||||||||||||||||
| Investment Operations | Less Distributions | |||||||||||||||||||||||||||||||||||
| Year Ended June 30, | Beginning Net Asset Value | Net Invest- ment Income (Loss)(a) | Net (Loss) | Total | Net Invest- ment Income | Capital Gains(b) | Total | Ending Net Asset Value | Total Return(c) | |||||||||||||||||||||||||||
Class A (9/09) | ||||||||||||||||||||||||||||||||||||
2011 | $ | 19.81 | $ | .34 | $ | 4.61 | $ | 4.95 | $ | (.36 | ) | $ | (.83 | ) | $ | (1.19 | ) | $ | 23.57 | 25.34 | % | |||||||||||||||
2010(e) | 20.00 | .30 | (.19 | ) | .11 | (.30 | ) | — | (.30 | ) | 19.81 | .48 | ||||||||||||||||||||||||
Class C (9/09) | ||||||||||||||||||||||||||||||||||||
2011 | 19.80 | .17 | 4.61 | 4.78 | (.19 | ) | (.83 | ) | (1.02 | ) | 23.56 | 24.43 | ||||||||||||||||||||||||
2010(e) | 20.00 | .18 | (.20 | ) | (.02 | ) | (.18 | ) | — | (.18 | ) | 19.80 | (.14 | ) | ||||||||||||||||||||||
Class R3 (9/09) | ||||||||||||||||||||||||||||||||||||
2011 | 19.80 | .29 | 4.62 | 4.91 | (.31 | ) | (.83 | ) | (1.14 | ) | 23.57 | 25.09 | ||||||||||||||||||||||||
2010(e) | 20.00 | .26 | (.20 | ) | .06 | (.26 | ) | — | (.26 | ) | 19.80 | .24 | ||||||||||||||||||||||||
Class I (9/09) | ||||||||||||||||||||||||||||||||||||
2011 | 19.81 | .40 | 4.61 | 5.01 | (.42 | ) | (.83 | ) | (1.25 | ) | 23.57 | 25.64 | ||||||||||||||||||||||||
2010(e) | 20.00 | .35 | (.20 | ) | .15 | (.34 | ) | — | (.34 | ) | 19.81 | .67 | ||||||||||||||||||||||||
| 22 | Nuveen Investments |
| Ratios/Supplemental Data | ||||||||||||||||||||||
| Ratios to Average Net Assets Before Reimbursement | Ratios to Average Net Assets After Reimbursement(d) | |||||||||||||||||||||
| Ending Net Assets (000) | Expenses | Net Invest- ment Income (Loss) | Expenses | Net Invest- ment Income (Loss) | Portfolio Turnover Rate | |||||||||||||||||
| $ | 295 | 5.29 | % | (2.65 | )% | 1.13 | % | 1.51 | % | 44 | % | |||||||||||
| 248 | 3.79 | * | (.82 | )* | 1.14 | * | 1.83 | * | 24 | |||||||||||||
| 294 | 6.04 | (3.40 | ) | 1.88 | .76 | 44 | ||||||||||||||||
| 248 | 4.54 | * | (1.57 | )* | 1.89 | * | 1.08 | * | 24 | |||||||||||||
| 295 | 5.54 | (2.90 | ) | 1.38 | 1.26 | 44 | ||||||||||||||||
| 248 | 4.04 | * | (1.07 | )* | 1.39 | * | 1.58 | * | 24 | |||||||||||||
| 295 | 5.04 | (2.40 | ) | .88 | 1.76 | 44 | ||||||||||||||||
| 248 | 3.54 | * | (.57 | )* | .89 | * | 2.08 | * | 24 | |||||||||||||
| (a) | Per share Net Investment Income (Loss) is calculated using the average daily shares method. |
| (b) | Distributions from Capital Gains include short-term capital gains, if any. |
| (c) | Total return is the combination of changes in net asset value without any sales charge, reinvested dividend income at net asset value and reinvested capital gains distributions at net asset value, if any. Total returns are not annualized. |
| (d) | After expense reimbursement from the Adviser, where applicable. Ratios do not reflect the effect of custodian credits earned on the Fund’s net cash on deposit with the custodian bank, where applicable. |
| (e) | For the period September 15, 2009 (commencement of operations) through June 30, 2010. |
| * | Annualized. |
See accompanying notes to financial statements.
| Nuveen Investments | 23 |
1. General Information and Significant Accounting Policies
General Information
The Nuveen Investment Trust (the “Trust”) is an open-end investment company registered under the Investment Company Act of 1940, as amended. The Trust is comprised of Nuveen NWQ Equity Income Fund (the “Fund”), among others. The Trust was organized as a Massachusetts business trust in 1996. The Fund commenced operations on September 15, 2009.
Effective January 1, 2011, the Fund’s adviser, Nuveen Asset Management, a wholly-owned subsidiary of Nuveen Investments, Inc. (“Nuveen”), changed its name to Nuveen Fund Advisors, Inc. (the “Adviser”).
Effective April 30, 2011, Nuveen Investments, LLC, a wholly-owned subsidiary of Nuveen, changed its name to Nuveen Securities, LLC (the “Distributor”).
The Fund’s investment objective is to provide high current income and long-term capital appreciation. Under normal market conditions, the Fund invests at least 80% of its net assets in equity securities. The Fund invests primarily in income producing common stocks, but may also invest in preferred securities, convertible securities and corporate debt securities. The Fund may also write covered call options on securities in which the Fund holds a long position. The Fund may invest up to 20% of its net assets in fixed-income securities, including up to 10% of its net assets in below investment-grade debt securities, commonly referred to as “high yield,” “high risk” or “junk” bonds. The Fund may also invest up to 25% of its net assets in non-U.S. securities, including up to 10% of its net assets in securities of companies located in emerging markets.
The Fund’s most recent prospectus provides further description of the Fund’s investment objective, principal investment strategies and principal risks.
Significant Accounting Policies
The following is a summary of significant accounting policies followed by the Fund in the preparation of its financial statements in accordance with accounting principles generally accepted in the United States (“U.S. GAAP”).
Investment Valuation
Common stocks and other equity-type securities are valued at the last sales price on the securities exchange on which such securities are primarily traded and are generally classified as Level 1 for fair value measurement purposes. Securities primarily traded on the NASDAQ National Market (“NASDAQ”) are valued, except as indicated below, at the NASDAQ Official Closing Price and are generally classified as Level 1. However, securities traded on a securities exchange or NASDAQ for which there were no transactions on a given day or securities not listed on a securities exchange or NASDAQ are valued at the last quoted bid price. Prices of certain American Depository Receipts (“ADR”) held by the Fund that trade in only limited volume in the United States are valued based on the last traded price, official closing price, or the most recent bid price of the underlying non-U.S.-traded stock, adjusted as appropriate for the underlying-to-ADR conversion ratio and foreign exchange rate, and from time-to-time may also be adjusted further to take into account material events that may take place after the close of the local non-U.S. market but before the close of the New York Stock Exchange. These securities generally represent a transfer from Level 1 to Level 2 security. Investments in investment companies are valued at their respective net asset values on the valuation date. These investment vehicles are generally classified as Level 1.
Prices of fixed-income securities are provided by a pricing service approved by the Fund’s Board of Trustees. These securities are generally classified as Level 2. When price quotes are not readily available the pricing service establishes a security’s fair value using methods that may include consideration of the following: yields or prices of investments of comparable quality, type of issue, coupon, maturity and rating, market quotes or indications of value from security dealers, evaluations of anticipated cash flows or collateral, general market conditions and other information and analysis, including the obligor’s credit characteristics considered relevant. In pricing certain securities, particularly less liquid and lower quality securities, the pricing service may consider information about a security, its issuer, or market activity provided by the Adviser. These securities are generally classified as Level 2 or Level 3 depending on the priority of the significant inputs.
Certain securities may not be able to be priced by the pre-established pricing methods as described above. Such securities may be valued by the Fund’s Board of Trustees or its designee at fair value. These securities generally include, but are not limited to, restricted securities (securities which may not be publicly sold without registration under the Securities Act of 1933, as amended) for which a pricing service is unable to provide a market price; securities whose trading has been formally suspended; debt securities that have gone into default and for which there is no current market quotation; a security whose market price is not available from a pre-established pricing source; a security with respect to which an event has occurred that is likely to materially affect the value of the security after the market has closed but before the calculation of the Fund’s net asset value (as may be the case in non-U.S. markets on which the security is primarily traded) or make it difficult or impossible to obtain a reliable market quotation; and a security whose price, as provided by the pricing service, is not deemed to reflect the security’s fair value. As a general principle, the fair value of a security would appear to be the amount that the owner might reasonably expect to receive for them in a current sale. A variety of factors may be considered in determining the fair value of such securities, which may include consideration of the following: yields or prices of investments of comparable quality, type of issue, coupon, maturity and rating, market quotes or indications of value from
| 24 | Nuveen Investments |
security dealers, evaluations of anticipated cash flows or collateral, general market conditions and other information and analysis, including the obligor’s credit characteristics considered relevant. These securities are generally classified as Level 2 or as Level 3 depending on the priority of the significant inputs. Regardless of the method employed to value a particular security, all valuations are subject to review by the Fund’s Board of Trustees or its designee.
Refer to Footnote 2 – Fair Value Measurements for further details on the leveling of securities held by the Fund as of the end of the reporting period.
Investment Transactions
Investment transactions are recorded on a trade date basis. Realized gains and losses from investment transactions are determined on the specific identification method, which is the same basis used for federal income tax purposes. Investments purchased on a when-issued/delayed delivery basis may have extended settlement periods. Any investments so purchased are subject to market fluctuation during this period. The Fund has instructed the custodian to segregate assets with a current value at least equal to the amount of the when-issued/delayed delivery purchase commitments. At June 30, 2011, the Fund had no such outstanding when-issued/delayed delivery purchase commitments.
Investment Income
Dividend income is recorded on the ex-dividend date or, for foreign securities, when information is available. Interest income, which includes the amortization of premiums and accretion of discounts for financial reporting purposes, is recorded on an accrual basis. Interest income also includes paydown gains and losses, if any.
Income Taxes
The Fund intends to distribute substantially all of its net investment income and net capital gains to shareholders and to otherwise comply with the requirements of Subchapter M of the Internal Revenue Code applicable to regulated investment companies. Therefore, no federal income tax provision is required.
For all open tax years and all major taxing jurisdictions, management of the Fund has concluded that there are no significant uncertain tax positions that would require recognition in the financial statements. Open tax years are those that are open for examination by taxing authorities (i.e., generally the last four tax year ends and the interim tax period since then). Furthermore, management of the Fund is also not aware of any tax positions for which it is reasonably possible that the total amounts of unrecognized tax benefits will significantly change in the next twelve months.
Dividends and Distributions to Shareholders
Dividends from net investment income are declared and distributed to shareholders quarterly. Net realized capital gains from investment transactions, if any, are declared and distributed to shareholders at least annually. Furthermore, capital gains are distributed only to the extent they exceed available capital loss carryforwards.
Distributions to shareholders are recorded on the ex-dividend date. The amount and timing of distributions are determined in accordance with federal income tax regulations, which may differ from U.S. GAAP.
Flexible Sales Charge Program
Class A Shares are generally sold with an up-front sales charge and incur a .25% annual 12b-1 service fee. Class A Share purchases of $1 million or more are sold at net asset value without an up-front sales charge but may be subject to a contingent deferred sales charge (“CDSC”) if redeemed within twelve months of purchase. Class C Shares are sold without an up-front sales charge but incur a .75% annual 12b-1 distribution fee and a .25% annual 12b-1 service fee. Class C Shares are subject to a CDSC of 1% if redeemed within one year of purchase. Class R3 Shares are sold without an up-front sales charge but incur a .25% annual 12b-1 distribution fee and a .25% annual 12b-1 service fee. Class I Shares are not subject to any sales charge or 12b-1 distribution or service fees.
Options Transactions
The Fund is subject to equity price risk in the normal course of pursuing its investment objectives and is authorized to write (sell) call options on securities, in an attempt to manage such risk. When the Fund writes a call option, an amount equal to the net premium received (the premium less commission) is recognized as a component of “Call options written, at value” on the Statement of Assets and Liabilities and is subsequently adjusted to reflect the current value of the written option until the option is exercised or expires or the Fund enters into a closing purchase transaction. The changes in the value of options written during the fiscal period are recognized as a component of “Change in net unrealized appreciation (depreciation) of call options written” on the Statement of Operations. When a call option is exercised or expires or the Fund enters into a closing purchase transaction, the difference between the net premium received and any amount paid at expiration or on executing a closing purchase transaction, including commission, is recognized as a component of “Net realized gain (loss) from call options written” on the Statement of Operations. The Fund, as writer of a call option, has no control over whether the underlying instrument may be sold (called) and as a result bears the risk of an unfavorable change in the market value of the instrument underlying the written option. There is also the risk the Fund may not be able to enter into a closing transaction because of an illiquid market.
During the fiscal year ended June 30, 2011, the Fund wrote covered call options on individual stocks to enhance returns while foregoing some upside potential. The average notional amount of call options written during the fiscal year ended June 30, 2011, was ($52,580). The average notional amount is calculated based on the outstanding amount at the beginning of the fiscal year and at the end of each fiscal quarter within the current fiscal year. Refer to Footnote 3 – Derivative Instruments and Hedging Activities and Footnote 5 – Investment Transactions for further details on call options written.
| Nuveen Investments | 25 |
Notes to Financial Statements (continued)
Market and Counterparty Credit Risk
In the normal course of business the Fund may invest in financial instruments and enter into financial transactions where risk of potential loss exists due to changes in the market (market risk) or failure of the other party to the transaction to perform (counterparty credit risk). The potential loss could exceed the value of the financial assets recorded on the financial statements. Financial assets, which potentially expose the Fund to counterparty credit risk, consist principally of cash due from counterparties on forward, option and swap transactions, when applicable. The extent of the Fund’s exposure to counterparty credit risk in respect to these financial assets approximates their carrying value as recorded on the Statement of Assets and Liabilities. Futures contracts, when applicable, expose the Fund to minimal counterparty credit risk as they are exchange traded and the exchange’s clearinghouse, which is counterparty to all exchange traded futures, guarantees the futures contract against default.
The Fund helps manage counterparty credit risk by entering into agreements only with counterparties the Adviser, believes have the financial resources to honor their obligations and by having the Adviser monitor the financial stability of the counterparties. Additionally, counterparties may be required to pledge collateral daily (based on the daily valuation of the financial asset) on behalf of the Fund with a value approximately equal to the amount of any unrealized gain above a pre-determined threshold. Reciprocally, when the Fund has an unrealized loss, the Fund has instructed the custodian to pledge assets of the Fund as collateral with a value approximately equal to the amount of the unrealized loss above a pre-determined threshold. Collateral pledges are monitored and subsequently adjusted if and when the valuations fluctuate, either up or down, by at least the pre-determined threshold amount.
Multiclass Operations and Allocations
Income and expenses of the Fund that are not directly attributable to a specific class of shares are prorated among the classes based on the relative net assets of each class. Expenses directly attributable to a class of shares, which presently only include 12b-1 distribution and service fees, are recorded to the specific class.
Realized and unrealized capital gains and losses of the Fund are prorated among the classes based on the relative net assets of each class.
Custodian Fee Credit
The Fund has an arrangement with the custodian bank whereby certain custodian fees and expenses are reduced by net credits earned on the Fund’s cash on deposit with the bank. Such deposit arrangements are an alternative to overnight investments. Credits for cash balances may be offset by charges for any days on which the Fund overdraws its account at the custodian bank.
Indemnifications
Under the Trust’s organizational documents, its officers and trustees are indemnified against certain liabilities arising out of the performance of their duties to the Trust. In addition, in the normal course of business, the Trust enters into contracts that provide general indemnifications to other parties. The Trust’s maximum exposure under these arrangements is unknown as this would involve future claims that may be made against the Trust that have not yet occurred. However, the Trust has not had prior claims or losses pursuant to these contracts and expects the risk of loss to be remote.
Use of Estimates
The preparation of financial statements in conformity with U.S. GAAP requires management to make estimates and assumptions that affect the reported amounts of assets and liabilities at the date of the financial statements and the reported amounts of increases and decreases in net assets from operations during the reporting period. Actual results may differ from those estimates.
2. Fair Value Measurements
Fair value is defined as the price that the Fund would receive upon selling an investment or transferring a liability in an orderly transaction to an independent buyer in the principal or most advantageous market for the investment. A three-tier hierarchy is used to maximize the use of observable market data and minimize the use of unobservable inputs and to establish classification of fair value measurements for disclosure purposes. Observable inputs reflect the assumptions market participants would use in pricing the asset or liability. Observable inputs are based on market data obtained from sources independent of the reporting entity. Unobservable inputs reflect the reporting entity’s own assumptions about the assumptions market participants would use in pricing the asset or liability. Unobservable inputs are based on the best information available in the circumstances. The three-tier hierarchy of inputs is summarized in the three broad levels listed below:
| Level 1 – | Quoted prices in active markets for identical securities. | |
| Level 2 – | Other significant observable inputs (including quoted prices for similar securities, interest rates, prepayment speeds, credit risk, etc.). | |
| Level 3 – | Significant unobservable inputs (including management’s assumptions in determining the fair value of investments). |
| 26 | Nuveen Investments |
The inputs or methodologies used for valuing securities are not an indication of the risk associated with investing in those securities. The following is a summary of the Fund’s fair value measurements as of June 30, 2011:
| Level 1 | Level 2 | Level 3 | Total | |||||||||||||
Investments: | ||||||||||||||||
Common Stocks | $ | 1,141,951 | $ | — | $ | — | $ | 1,141,951 | ||||||||
Corporate Bonds | — | 41,765 | — | 41,765 | ||||||||||||
Total | $ | 1,141,951 | $ | 41,765 | $ | — | $ | 1,183,716 | ||||||||
During the fiscal year ended June 30, 2011, the Fund recognized no significant transfers to or from Level 1, Level 2 or Level 3.
3. Derivative Instruments and Hedging Activities
The Fund records derivative instruments at fair value, with changes in fair value recognized on the Statement of Operations, when applicable. Even though the Fund’s investments in derivatives may represent economic hedges, they are not considered to be hedge transactions for financial reporting purposes. For additional information on the derivative instruments in which the Fund was invested during and at the end of the reporting period, refer to the Portfolio of Investments, Financial Statements and Footnote 1 – General Information and Significant Accounting Policies.
The following tables present the amount of net realized gain (loss) and change in net unrealized appreciation (depreciation) recognized for the fiscal year ended June 30, 2011, on derivative instruments, as well as the primary risk exposure associated with each.
| Net Realized Gain (Loss) from Call Options Written | ||||
Risk Exposure | ||||
Equity Price | $ | 13,904 | ||
| Change in Net Unrealized Appreciation (Depreciation) of Call Options Written | ||||
Risk Exposure | ||||
Equity Price | $ | (205 | ) | |
4. Fund Shares
Transactions in Fund shares were as follows:
| Year Ended 6/30/11 | For the period 9/15/09 (commencement of operations) through 6/30/10 | |||||||||||||||
| Shares | Amount | Shares | Amount | |||||||||||||
Shares sold: | ||||||||||||||||
Class A | — | $ | — | 12,500 | $ | 250,000 | ||||||||||
Class C | — | — | 12,500 | 250,000 | ||||||||||||
Class R3 | — | — | 12,500 | 250,000 | ||||||||||||
Class I | — | — | 12,500 | 250,000 | ||||||||||||
Net increase (decrease) | — | $ | — | 50,000 | $ | 1,000,000 | ||||||||||
5. Investment Transactions
Purchases and sales (excluding call options written) during the fiscal year ended June 30, 2011, aggregated $498,798 and $531,922, respectively.
Transactions in call options written during the fiscal year ended June 30, 2011, were as follows:
| Number of Contracts | Premiums Received | |||||||
Outstanding, beginning of period | 48 | $ | 4,580 | |||||
Call options written | 126 | 12,655 | ||||||
Call options terminated in closing purchase transactions | (124 | ) | (9,414 | ) | ||||
Call options exercised | (11 | ) | (3,571 | ) | ||||
Call options expired | (39 | ) | (4,250 | ) | ||||
Outstanding, end of period | — | — | ||||||
| Nuveen Investments | 27 |
Notes to Financial Statements (continued)
6. Income Tax Information
The following information is presented on an income tax basis. Differences between amounts for financial statement and federal income tax purposes are primarily due to timing differences in recognizing certain gains and losses on investment transactions. To the extent that differences arise that are permanent in nature, such amounts are reclassified within the capital accounts as detailed below. Temporary differences do not require reclassification. Temporary and permanent differences do not impact the net asset values of the Fund.
At June 30, 2011, the cost and unrealized appreciation (depreciation) of investments (excluding investments in derivatives), as determined on a federal income tax basis, were as follows:
Cost of investments | $ | 1,097,463 | ||
Gross unrealized: | ||||
Appreciation | $ | 121,921 | ||
Depreciation | (35,668 | ) | ||
Net unrealized appreciation (depreciation) of investments | $ | 86,253 |
Permanent differences, primarily due to federal taxes paid and distribution reclass, resulted in reclassifications among the Fund’s components of net assets at June 30, 2011, the Fund’s tax year-end, as follows:
Capital paid-in | $ | (421 | ) | |
Undistributed (Over-distribution of) net investment income | (1 | ) | ||
Accumulated net realized gain (loss) | 422 |
The tax components of undistributed net ordinary income and net long-term capital gains at June 30, 2011, the Fund’s tax year end, were as follows:
Undistributed net ordinary income* | $ | 56,415 | ||
Undistributed net long-term capital gains | 43,250 |
| * | Net ordinary income consists of net taxable income derived from dividends, interest, and net short-term capital gains, if any. |
| Undistributed net ordinary income has not been reduced for the dividend declared June 1, 2011 and paid on July 1, 2011. |
The tax character of distributions paid during the Fund’s tax years ended June 30, 2011 and June 30, 2010, was designated for purposes of the dividends paid deduction as follows:
| 2011 | ||||
Distributions from net ordinary income* | $ | 56,860 | ||
Distributions from net long-term capital gains | — | |||
| For the period September 15, 2009 (commencement of operations) through June 30, 2010 | ||||
Distributions from net ordinary income* | $ | 8,371 | ||
Distributions from net long-term capital gains | — | |||
| * | Net ordinary income consists of net taxable income derived from dividends, interest, and net short-term capital gains, if any. |
7. Management Fees and Other Transactions with Affiliates
The Fund’s management fee consists of two components – a fund-level fee, based only on the amount of assets within the Fund, and a complex-level fee, based on the aggregate amount of all eligible fund assets managed by the Adviser. This pricing structure enables Fund shareholders to benefit from growth in the assets within the Fund as well as from growth in the amount of complex-wide assets managed by the Adviser.
The annual fund-level fee, payable monthly, is calculated according to the following schedule:
| Average Daily Net Assets | Fund-Level Fee Rate | |||
For the first $125 million | 0.5000 | % | ||
For the next $125 million | 0.4875 | |||
For the next $250 million | 0.4750 | |||
For the next $500 million | 0.4625 | |||
For the next $1 billion | 0.4500 | |||
For net assets over $2 billion | 0.4250 | |||
| 28 | Nuveen Investments |
The annual complex-level fee, payable monthly, is calculated according to the following schedule:
| Complex-Level Asset Breakpoint Level* | Effective Rate at Breakpoint Level | |||
$55 billion | .2000 | % | ||
$56 billion | .1996 | |||
$57 billion | .1989 | |||
$60 billion | .1961 | |||
$63 billion | .1931 | |||
$66 billion | .1900 | |||
$71 billion | .1851 | |||
$76 billion | .1806 | |||
$80 billion | .1773 | |||
$91 billion | .1691 | |||
$125 billion | .1599 | |||
$200 billion | .1505 | |||
$250 billion | .1469 | |||
$300 billion | .1445 | |||
| * | The complex-level fee is calculated based upon the aggregate daily “eligible assets” of all Nuveen Funds. Eligible assets do not include assets attributable to investments in other Nuveen Funds or assets in excess of $2 billion added to the Nuveen Fund complex in connection with the Adviser’s assumption of the management of the former First American Funds effective January 1, 2011. Eligible assets include closed-end fund assets managed by the Adviser that are attributable to financial leverage. For these purposes, financial leverage includes the closed-end funds’ use of preferred stock and borrowings and certain investments in the residual interest certificates (also called inverse floating rate securities) in tender option bond (TOB) trusts, including the portion of assets held by a TOB trust that has been effectively financed by the trust’s issuance of floating rate securities, subject to an agreement by the Adviser as to certain funds to limit the amount of such assets for determining eligible assets in certain circumstances. As of June 30, 2011, the complex-level fee rate for the Fund was .1774%. |
The management fee compensates the Adviser for the overall investment advisory and administrative services and general office facilities it provides for the Fund. The Adviser has entered into a sub-advisory agreement with NWQ Investment Management Company, LLC (“NWQ”), a subsidiary of Nuveen, under which NWQ manages the investment portfolio of the Fund. NWQ is compensated for its sub-advisory services to the Fund from the management fee paid to the Adviser.
The Adviser has agreed to waive fees and reimburse expenses through October 31, 2012, so that total annual Fund operating expenses (excluding 12b-1 distribution and service fees, interest expenses, taxes, fees incurred in acquiring and disposing of portfolio securities and extraordinary expenses) do not exceed .90% (1.15% after October 31, 2012) of the average daily net assets of any class of Fund shares. The Adviser may voluntarily reimburse additional expenses from time to time. Voluntary reimbursements may be terminated at any time at the Adviser’s discretion.
The Trust pays no compensation directly to those of its trustees who are affiliated with the Adviser or to its officers, all of whom receive remuneration for their services to the Trust from the Adviser or its affiliates. The Board of Trustees has adopted a deferred compensation plan for independent trustees that enables trustees to elect to defer receipt of all or a portion of the annual compensation they are entitled to receive from certain Nuveen-advised funds. Under the plan, deferred amounts are treated as though equal dollar amounts had been invested in shares of select Nuveen-advised funds.
During the fiscal year ended June 30, 2011, the Distributor retained all 12b-1 fees.
At June 30, 2011, Nuveen owned shares of the Fund as follows:
Class A | 12,500 | |||
Class C | 12,500 | |||
Class R3 | 12,500 | |||
Class I | 12,500 |
8. New Accounting Pronouncements
Fair Value Measurements and Disclosures
On May 12, 2011, the Financial Accounting Standards Board (“FASB”) issued Accounting Standard Update (“ASU”) No. 2011-04 (“ASU No. 2011-040”) modifying Topic 820, Fair Value Measurements and Disclosures. At the same time, the International Accounting Standards Board (“IASB”) issued International Financial Reporting Standard (“IFRS”) 13, Fair Value Measurement. The objective of the FASB and IASB is convergence of their guidance on fair value measurements and disclosures. Specifically, ASU No. 2011-04 requires reporting entities to disclose i) the amounts of any transfers between Level 1 and Level 2, and the reasons for the transfers, ii) for Level 3 fair value measurements, a) quantitative information about significant unobservable inputs used, b) a description of the valuation processes used by the reporting entity and c) a narrative description of the sensitivity of the fair value measurement to changes in unobservable inputs if a change in those inputs might result in a significantly higher or lower fair value measurement. The effective date of ASU No. 2011-04 is for interim and annual periods beginning after December 15, 2011. At this time, management is evaluating the implications of this guidance and the impact it will have on the financial statement amounts and footnote disclosures, if any.
| Nuveen Investments | 29 |
Trustees and Officers (Unaudited)
The management of the Funds, including general supervision of the duties performed for the Funds by the Adviser, is the responsibility of the Board of Trustees of the Funds. The number of trustees of the Funds is currently set at ten. None of the trustees who are not “interested” persons of the Funds (referred to herein as “independent trustees”) has ever been a director or employee of, or consultant to, Nuveen or its affiliates. The names and business addresses of the trustees and officers of the Funds, their principal occupations and other affiliations during the past five years, the number of portfolios each oversees and other directorships they hold are set forth below.
The Funds’ Statement of Additional Information (“SAI”) includes more information about the trustees. To request a free copy, call Nuveen Investments at (800) 257-8787 or visit the Funds’ website at www.nuveen.com.
Name, Birthdate and Address | Position(s) Held with the Funds | Year First Elected or Appointed (1) | Principal Occupation(s) Including other Directorships During Past 5 Years | Number of Portfolios in Fund Complex Overseen by Trustee | ||||
| Independent Trustees: | ||||||||
Robert P. Bremner (2) 8/22/40 333 W. Wacker Drive Chicago, IL 60606 | Chairman of the Board and Trustee | 1996 | Private Investor and Management Consultant; Treasurer and Director, Humanities Council of Washington, D.C.; Board Member, Independent Directors Council affiliated with the Investment Company Institute. | 245 | ||||
Jack B. Evans 10/22/48 333 W. Wacker Drive Chicago, IL 60606 | Trustee | 1999 | President, The Hall-Perrine Foundation, a private philanthropic corporation (since 1996); Director and Chairman, United Fire Group, a publicly held company; member of the Board of Regents for the State of Iowa University System; Director, Source Media Group; Life Trustee of Coe College and the Iowa College Foundation; formerly, Director, Alliant Energy; formerly, Director, Federal Reserve Bank of Chicago; formerly, President and Chief Operating Officer, SCI Financial Group, Inc., a regional financial services firm. | 245 | ||||
William C. Hunter 3/6/48 333 W. Wacker Drive Chicago, IL 60606 | Trustee | 2004 | Dean, Tippie College of Business, University of Iowa (since 2006); Director (since 2004) of Xerox Corporation; Director (since 2005), Beta Gamma Sigma International Honor Society; Director of Wellmark, Inc. (since 2009); formerly, Dean and Distinguished Professor of Finance, School of Business at the University of Connecticut (2003-2006); previously, Senior Vice President and Director of Research at the Federal Reserve Bank of Chicago (1995-2003); formerly, Director (1997-2007), Credit Research Center at Georgetown University. | 245 | ||||
David J. Kundert (2) 10/28/42 333 W. Wacker Drive Chicago, IL 60606 | Trustee | 2005 | Director, Northwestern Mutual Wealth Management Company; retired (since 2004) as Chairman, JPMorgan Fleming Asset Management, President and CEO, Banc One Investment Advisors Corporation, and President, One Group Mutual Funds; prior thereto, Executive Vice President, Banc One Corporation and Chairman and CEO, Banc One Investment Management Group; Member, Board of Regents, Luther College; member of the Wisconsin Bar Association; member of Board of Directors, Friends of Boerner Botanical Gardens; member of Board of Directors and Chair of Investment Committee, Greater Milwaukee Foundation. | 245 | ||||
William J. Schneider (2) 9/24/44 333 W. Wacker Drive Chicago, IL 60606 | Trustee | 1997 | Chairman of Miller-Valentine Partners Ltd., a real estate investment company; formerly, Senior Partner and Chief Operating Officer (retired 2004) of Miller-Valentine Group; member, University of Dayton Business School Advisory Council; member, Mid-America Health System Board; formerly, member and chair, Dayton Philharmonic Orchestra Association; formerly, member, Business Advisory Council, Cleveland Federal Reserve Bank. | 245 | ||||
Judith M. Stockdale 12/29/47 333 W. Wacker Drive Chicago, IL 60606 | Trustee | 1997 | Executive Director, Gaylord and Dorothy Donnelley Foundation (since 1994); prior thereto, Executive Director, Great Lakes Protection Fund (1990-1994). | 245 | ||||
Carole E. Stone (2) 6/28/47 333 W. Wacker Drive Chicago, IL 60606 | Trustee | 2007 | Director, Chicago Board Options Exchange (since 2006); Director, C2 Options Exchange, Incorporated (since 2009); formerly, Commissioner, New York State Commission on Public Authority Reform (2005-2010); formerly, Chair, New York Racing Association Oversight Board (2005-2007). | 245 | ||||
| 30 | Nuveen Investments |
Name, Birthdate and Address | Position(s) Held with the Funds | Year First Elected or Appointed (1) | Principal Occupation(s) During Past Five Years | Number of Portfolios in Fund Complex Overseen by Trustee | ||||
Virginia L. Stringer 8/16/44 333 West Wacker Drive Chicago, IL 60606 | Trustee | 2011 | Board Member, Mutual Fund Directors Forum; Member, Governing Board, Investment Company Institute’s Independent Directors Council; governance consultant and non-profit board member; former Owner and President, Strategic Management Resources, Inc. a management consulting firm; previously, held several executive positions in general management, marketing and human resources at IBM and The Pillsbury Company; Independent Director, First American Fund Complex (1987-2010) and Chair (1997-2010). | 245 | ||||
Terence J. Toth (2) 9/29/59 333 W. Wacker Drive Chicago, IL 60606 | Trustee | 2008 | Director, Legal & General Investment Management America, Inc. (since 2008); Managing Partner, Promus Capital (since 2008); formerly, CEO and President, Northern Trust Global Investments (2004-2007); Executive Vice President, Quantitative Management & Securities Lending (2000-2004); prior thereto, various positions with Northern Trust Company (since 1994); member: Goodman Theatre Board (since 2004), Chicago Fellowship Board (since 2005) and Catalyst Schools of Chicago Board (since 2008); formerly, member: Northern Trust Mutual Funds Board (2005-2007), Northern Trust Global Investments Board (2004-2007), Northern Trust Japan Board (2004-2007), Northern Trust Securities Inc. Board (2003-2007) and Northern Trust Hong Kong Board (1997-2004). | 245 | ||||
| Interested Trustee: | ||||||||
John P. Amboian (3) 6/14/61 333 W. Wacker Drive Chicago, IL 60606 | Trustee | 2008 | Chief Executive Officer and Chairman (since 2007), and Director (since 1999) of Nuveen Investments, Inc., formerly, President (1999-2007); Chief Executive Officer (since 2007) of Nuveen Investments Advisers Inc.; Director (since 1998) formerly, Chief Executive Officer (2007-2010) of Nuveen Fund Advisors, Inc. | 245 | ||||
Name, Birthdate and Address | Position(s) Held with the Funds | Year First Elected or Appointed (4) | Principal Occupation(s) During Past 5 Years | Number of Portfolios in Fund Complex Overseen by Officer | ||||
| Officers of the Funds: | ||||||||
Gifford R. Zimmerman 9/9/56 333 W. Wacker Drive Chicago, IL 60606 | Chief Administrative Officer | 1988 | Managing Director (since 2002), Assistant Secretary and Associate General Counsel of Nuveen Securities, LLC; Managing Director (since 2004) and Assistant Secretary (since 1994) of Nuveen Investments, Inc.; Managing Director (since 2002), Assistant Secretary (since 1997) and Co-General Counsel (since 2011) of Nuveen Fund Advisors, Inc.; Managing Director, Assistant Secretary and Associate General Counsel of Nuveen Asset Management, LLC (since 2011); Managing Director, Associate General Counsel and Assistant Secretary of Symphony Asset Management LLC (since 2003); Vice President and Assistant Secretary of NWQ Investment Management Company, LLC (since 2002), Nuveen Investments Advisers Inc. (since 2002), Tradewinds Global Investors LLC, and Santa Barbara Asset Management, LLC (since 2006), Nuveen HydePark Group LLC and Nuveen Investment Solutions, Inc. (since 2007) and of Winslow Capital Management Inc. (since 2010); Chief Administrative Officer and Chief Compliance Officer (since 2010) of Nuveen Commodities Asset Management, LLC; Chartered Financial Analyst. | 245 | ||||
Margo L. Cook 4/11/64 333 W. Wacker Drive Chicago, IL 60606 | Vice President | 2009 | Executive Vice President (since 2008) of Nuveen Investments, Inc. and of Nuveen Fund Advisors, Inc. (since 2011); previously, Head of Institutional Asset Management (2007-2008) of Bear Stearns Asset Management; Head of Institutional Asset Management (1986-2007) of Bank of NY Mellon; Chartered Financial Analyst. | 245 | ||||
| Nuveen Investments | 31 |
Trustees and Officers (Unaudited) (continued)
Name, Birthdate and Address | Position(s) Held with the Funds | Year First Elected or Appointed (4) | Principal Occupation(s) During Past 5 Years | Number of Portfolios in Fund Complex Overseen by Officer | ||||
Lorna C. Ferguson 10/24/45 333 W. Wacker Drive Chicago, IL 60606 | Vice President | 1998 | Managing Director (since 2005) of Nuveen Fund Advisors, Inc. | 245 | ||||
Stephen D. Foy 5/31/54 333 W. Wacker Drive Chicago, IL 60606 | Vice President and Controller | 1998 | Senior Vice President (since 2010), formerly, Vice President (2005-2010) of Nuveen Securities, LLC and Funds Controller; Vice President of Nuveen; Certified Public Accountant. | 245 | ||||
Scott S. Grace 8/20/70 333 W. Wacker Drive Chicago, IL 60606 | Vice President and Treasurer | 2009 | Managing Director, Corporate Finance & Development, Treasurer (since 2009) of Nuveen Securities, LLC; Managing Director and Treasurer (since 2009) of Nuveen Fund Advisors, Inc., Nuveen Investment Solutions, Inc., Nuveen Investments Advisers, Inc., Nuveen Investments Holdings Inc. and (since (2011) Nuveen Asset Management, LLC; Vice President and Treasurer of NWQ Investment Management Company, LLC, Tradewinds Global Investors, LLC, Symphony Asset Management LLC and Winslow Capital Management, Inc.; Vice President of Santa Barbara Asset Management, LLC; formerly, Treasurer (2006-2009), Senior Vice President (2008-2009), previously, Vice President (2006-2008) of Janus Capital Group, Inc.; formerly, Senior Associate in Morgan Stanley’s Global Financial Services Group (2000-2003); Chartered Accountant Designation. | 245 | ||||
Walter M. Kelly 2/24/70 333 W. Wacker Drive Chicago, IL 60606 | Chief Compliance Officer and Vice President | 2003 | Senior Vice President (since 2008), Vice President (2006-2008) of Nuveen Securities, LLC; Senior Vice President (since 2008) and Assistant Secretary (since 2008) of Nuveen Fund Advisors, Inc. | 245 | ||||
Tina M. Lazar 8/27/61 333 W. Wacker Drive Chicago, IL 60606 | Vice President | 2002 | Senior Vice President (since 2010), formerly, Vice President (2005-2010) of Nuveen Fund Advisors, Inc. | 245 | ||||
Larry W. Martin 7/27/51 333 West Wacker Drive Chicago, IL 60606 | Vice President and Assistant Secretary | 1997 | Senior Vice President (since 2010), formerly, Vice President (1993-2010), Assistant Secretary and Assistant General Counsel of Nuveen Securities, LLC; Senior Vice President (since 2011) of Nuveen Asset Management, LLC: Senior Vice President (since 2010), formerly, Vice President (2005-2010), and Assistant Secretary of Nuveen Investments, Inc.; Senior Vice President (since 2010), formerly Vice President (2005-2010), and Assistant Secretary (since 1997) of Nuveen Fund Advisors, Inc.; Vice President and Assistant Secretary of Nuveen Investments Advisers, Inc. (since 2002), NWQ Investment Management Company, LLC, Symphony Asset Management LLC (since 2003), Tradewinds Global Investors, LLC, Santa Barbara Asset Management, LLC (since 2006), Nuveen HydePark Group, LLC and Nuveen Investment Solutions, Inc. (since 2007), and of Winslow Capital Management, Inc. (since 2010); Vice President and Assistant Secretary of Nuveen Commodities Asset Management, LLC (since 2010). | 245 |
| 32 | Nuveen Investments |
Name, Birthdate and Address | Position(s) Held with the Funds | Year First Elected or Appointed (4) | Principal Occupation(s) Including other Directorships During Past 5 Years | Number of Portfolios in Fund Complex Overseen by Officer | ||||
Kevin J. McCarthy 3/26/66 333 W. Wacker Drive Chicago, IL 60606 | Vice President and Secretary | 2007 | Managing Director (since 2008), formerly, Vice President (2007-2008), Nuveen Securities, LLC; Managing Director (since 2008), Assistant Secretary (since 2007) and Co-General Counsel (since 2011) of Nuveen Fund Advisors, Inc.; Managing Director, Assistant Secretary and Associate General Counsel (since 2011) of Nuveen Asset Management, LLC; Managing Director (since 2008), and Assistant Secretary, Nuveen Investment Holdings, Inc.; Vice President (since 2007) and Assistant Secretary of Nuveen Investments Advisers Inc., NWQ Investment Management Company, LLC, Tradewinds Global Investors LLC, NWQ Holdings, LLC, Symphony Asset Management LLC, Santa Barbara Asset Management, LLC, Nuveen HydePark Group, LLC, Nuveen Investment Solutions, Inc. (since 2007) and of Winslow Capital Management, Inc. (since 2010); Vice President and Secretary (since 2010) of Nuveen Commodities Asset Management, LLC; prior thereto, Partner, Bell, Boyd & Lloyd LLP (1997-2007). | 245 | ||||
Kathleen L. Prudhomme 3/30/53 800 Nicollet Mall Minneapolis, MN 55402 | Vice President and Assistant Secretary | 2011 | Managing Director, Assistant Secretary and Co-General Counsel (since 2011) of Nuveen Fund Advisors, Inc.; Managing Director, Assistant Secretary and Associate General Counsel (since 2011) of Nuveen Asset Management, LLC; Managing Director and Assistant Secretary (since 2011) of Nuveen Securities, LLC; formerly, Deputy General Counsel, FAF Advisors, Inc. (2004-2010). | 245 | ||||
Jeffrey M. Wilson 3/13/56 333 West Wacker Drive Chicago, IL 60606 | Vice President | 2011 | Senior Vice President of Nuveen Investments (since 2011), formerly, Senior Vice President of FAF Advisors, Inc. (2000-2010). | 112 |
| (1) | Trustees serve an indefinite term until his/her successor is elected or appointed. The year first elected or appointed represents the year in which the trustee was first elected or appointed to any fund in the Nuveen Fund Complex. |
| (2) | Also serves as a trustee of the Nuveen Diversified Commodity Fund, an exchange-traded commodity pool managed by Nuveen Commodities Asset Management, LLC, an affiliate of the Adviser. |
| (3) | Mr. Amboian is an interested trustee because of his position with Nuveen Investments, Inc. and certain of its subsidiaries, which are affiliates of the Nuveen Funds. |
| (4) | Officers serve one year terms through August of each year. The year first elected or appointed represents the year in which the officer was first elected or appointed to any fund in the Nuveen Fund Complex. |
| Nuveen Investments | 33 |
Annual Investment Management Agreement Approval Process
(Unaudited)
The Board of Trustees (the “Board,” and each Trustee, a “Board Member”) of the Fund, including the Board Members who are not parties to the Fund’s advisory or sub-advisory agreements or “interested persons” of any such parties (the “Independent Board Members”), are responsible for approving the advisory agreement (the “Investment Management Agreement”) between the Fund and Nuveen Fund Advisors, Inc. (the “Advisor”) and the sub-advisory agreement (the “Sub-Advisory Agreement”) between the Advisor and NWQ Investment Management Company, LLC (the “Sub-Advisor”) (the Investment Management Agreement and the Sub-Advisory Agreement are referred to collectively as the “Advisory Agreements”) and their periodic continuation. Pursuant to the Investment Company Act of 1940, as amended (the “1940 Act”), the Board is required to consider the continuation of advisory agreements and sub-advisory agreements on an annual basis. Accordingly, at an in-person meeting held on May 23-25, 2011 (the “May Meeting”), the Board, including a majority of the Independent Board Members, considered and approved the continuation of the Advisory Agreements for the Fund for an additional one-year period.
In preparation for their considerations at the May Meeting, the Board requested and received extensive materials prepared in connection with the review of the Advisory Agreements. The materials provided a broad range of information regarding the Fund, the Advisor and the Sub-Advisor (the Advisor and the Sub-Advisor are collectively, the “Fund Advisers” and each, a “Fund Adviser”). As described in more detail below, the information provided included, among other things, a review of Fund performance, including Fund investment performance assessments against peer groups and appropriate benchmarks, a comparison of Fund fees and expenses relative to peers, a description and assessment of shareholder service levels for the Fund, a summary of the performance of certain service providers, a review of product initiatives and shareholder communications and an analysis of the Advisor’s profitability with comparisons to comparable peers in the managed fund business. As part of their annual review, the Board also held a separate meeting on April 19-20, 2011, to review the Fund’s investment performance and consider an analysis provided by the Advisor of the Sub-Advisor which generally evaluated the Sub-Advisor’s investment team, investment mandate, organizational structure and history, investment philosophy and process, performance of the Fund, and significant changes to the foregoing. As a result of their review of the materials and discussions, the Board presented the Advisor with questions and the Advisor responded.
The materials and information prepared in connection with the annual review of the Advisory Agreements supplement the information provided to the Board during the year. In this regard, throughout the year, the Board, acting directly or through its committees, regularly reviews the performance and various services provided by the Advisor and the Sub-Advisor. The Board meets at least quarterly as well as at other times as the need arises. At its quarterly meetings, the Board reviews reports by the Advisor which include, among other things, Fund performance, a review of the investment teams and compliance reports. The Board also meets with key investment personnel managing the Fund’s portfolio during the year. In addition, the Board continues its program of seeking to visit each sub-advisor to the Nuveen funds at least once over a multiple year rotation, meeting with key investment and business personnel. In this regard, the Independent Board Members met with the Sub-Advisor in 2010 and 2011. The Board also met with State Street Bank & Trust Company, the Fund’s accountant and custodian, in 2010. The Board considers factors and information that are relevant to its annual consideration of the renewal of the Advisory Agreements at these meetings held throughout the year. Accordingly, the Board considers the information provided and knowledge gained at these meetings when performing its annual review of the Advisory Agreements. The Independent Board Members are assisted throughout the process by independent legal counsel who provided materials describing applicable law and the duties of directors or trustees in reviewing advisory contracts and met with the Independent Board Members in executive sessions without management present.
The Board considered all factors it believed relevant with respect to the Fund, including among other factors: (a) the nature, extent and quality of the services provided by the Fund Advisers, (b) the investment performance of the Fund and Fund Advisers, (c) the advisory fees and costs of the services to be provided to the Fund and the profitability of the Fund Advisers, (d) the extent of any economies of scale, (e) any benefits derived by the Fund Advisers from the relationship with the Fund and (f) other factors. Each Board Member may have accorded different weight to the various factors in reaching his or her conclusions with respect to the Fund’s Advisory Agreements. The Independent Board Members did not identify any single factor as all important or controlling. The Independent Board Members’ considerations were instead based on a comprehensive consideration of all the information presented. The principal factors considered by the Board and its conclusions are described below.
A. Nature, Extent and Quality of Services
In considering renewal of the Advisory Agreements, the Independent Board Members considered the nature, extent and quality of the Fund Adviser’s services, including advisory services and the resulting Fund performance and administrative services. The Independent Board Members reviewed materials outlining, among other things, the Fund Adviser’s organization and business; the types of services that the Fund Adviser or its affiliates provide to the Fund; the performance record of the Fund (as described in further detail below); and any initiatives Nuveen had taken for the applicable fund product line.
In considering advisory services, the Board recognized that the Advisor provides various oversight, administrative, compliance and other services for the Fund and the Sub-Advisor provides the portfolio investment management services to the Fund. Accordingly, in reviewing the portfolio management services provided to the Fund, the Board reviewed the materials provided by the Nuveen Investment Services Oversight Team analyzing, among other things, the Sub-Advisor’s investment team and changes thereto, organization and history, assets under management, Fund objectives and mandate, the investment team’s philosophy and strategies in managing the Fund, developments affecting the Sub-Advisor or Fund and Fund performance. The Independent Board Members also reviewed portfolio manager compensation arrangements to evaluate each Fund Adviser’s ability to attract and retain high quality
| 34 | Nuveen Investments |
investment personnel, preserve stability, and reward performance but not provide an incentive to take undue risks. In addition, the Board considered the Advisor’s execution of its oversight responsibilities over the Sub-Advisor. Given the importance of compliance, the Independent Board Members also considered Nuveen’s compliance program, including the report of the chief compliance officer regarding the Fund’s compliance policies and procedures.
In addition to advisory services, the Board considered the quality and extent of administrative and other non-investment advisory services the Advisor and its affiliates provide to the Fund, including product management, investment services (such as oversight of investment policies and procedures, risk management, and pricing), fund administration, oversight of service providers, shareholder services, administration of Board relations, regulatory and portfolio compliance and legal support. In reviewing the services provided, the Board also reviewed materials describing various notable initiatives and projects the Advisor performed in connection with the open-end fund product line. These initiatives included operations necessary to effect the acquisition of FAF Advisors, Inc.’s (“FAF”) long-term asset management business by Nuveen and the subsequent integration of FAF and the funds FAF advised into the Nuveen family of funds; reduction of management fees and expense caps on certain open-end equity funds that was effective July 1, 2010; changes in dividend declaration policies; and adding funds to various distribution platforms.
Based on their review, the Independent Board Members found that, overall, the nature, extent and quality of services provided to the Fund under each Advisory Agreement were satisfactory.
B. The Investment Performance of the Fund and Fund Advisers
The Board, including the Independent Board Members, reviewed and considered the performance history of the Fund over various time periods. The Board reviewed, among other things, the Fund’s historic investment performance as well as information comparing the Fund’s performance information with that of other funds (the “Performance Peer Group”) based on data provided by an independent provider of mutual fund data and with recognized and/or customized benchmarks.
The Board reviewed reports, including a comprehensive analysis of the Fund’s performance and the applicable investment team. In this regard, the Board reviewed the Fund’s total return information compared to the returns of its Performance Peer Group and recognized and/or customized benchmarks for the quarter and one-year periods ending December 31, 2010 and for the same periods ending March 31, 2011.
In reviewing performance comparison information, the Independent Board Members recognized that the usefulness of the comparisons of the performance of certain funds with the performance of their respective Performance Peer Group may be limited because the Performance Peer Group may not adequately represent the objectives and strategies of the applicable funds or may be limited in size or number. The Independent Board Members also noted that the investment experience of a particular shareholder in the Nuveen funds will vary depending on when such shareholder invests in the applicable fund, the class held (if multiple classes are offered) and the performance of the fund (or respective class) during that shareholder’s investment period. With respect to any Nuveen funds that underperformed their peers and/or benchmarks from time to time, the Board monitors such funds closely and considers any steps necessary or appropriate to address such issues.
In reviewing the performance information, the Independent Board Members noted that the Fund was relatively new with a shorter performance history available, thereby limiting the ability to make a meaningful assessment of performance. Notwithstanding the foregoing, the Independent Board Members determined that the Fund’s investment performance had been satisfactory.
C. Fees, Expenses and Profitability
1. Fees and Expenses
The Board evaluated the management fees and expenses of the Fund reviewing, among other things, the Fund’s gross management fees, net management fees and net expense ratios in absolute terms as well as compared to the fee and expenses of a comparable universe of funds based on data provided by an independent fund data provider (the “Peer Universe”) and in certain cases, to a more focused subset of funds in the Peer Universe (the “Peer Group”) and any expense limitations.
The Independent Board Members further reviewed the methodology regarding the construction of the applicable Peer Universe and Peer Group (if any). In reviewing the comparisons of fee and expense information, the Independent Board Members took into account that in certain instances various factors such as: the asset level of a fund relative to peers; the limited size and particular composition of the Peer Universe or Peer Group; the investment objectives of the peers; expense anomalies; changes in the funds comprising the Peer Universe or Peer Group from year to year; levels of reimbursement; and the timing of information used may impact the comparative data thereby limiting the ability to make a meaningful comparison with peers.
In reviewing the fee schedule for the Fund, the Independent Board Members also considered the fund-level and complex-wide breakpoint schedules (described in further detail below) and any fee waivers and reimbursements provided by Nuveen. In reviewing fees and expenses, the Board considered the expenses and fees to be higher if they were over 10 basis points higher, slightly higher if they were 6 to 10 basis points higher, in line if they were within 5 basis points higher than the peer average and below if they were below the peer average of the Peer Group (if available) or Peer Universe if there was no separate Peer Group. The Independent Board Members observed that the Fund had net management fees and net expense ratios below its peer averages.
| Nuveen Investments | 35 |
Annual Investment Management Agreement Approval Process
(Unaudited) (continued)
Based on their review of the fee and expense information provided, the Independent Board Members determined that the Fund’s management fees were reasonable in light of the nature, extent and quality of services provided to the Fund.
2. Comparisons with the Fees of Other Clients
The Independent Board Members further reviewed information regarding the nature of services and fee rates offered by the Advisor to other clients, including separately managed accounts (both retail and institutional accounts), foreign investment funds offered by Nuveen, and funds that are not offered by Nuveen but are sub-advised by one of Nuveen’s investment management teams. In evaluating the comparisons of fees, the Independent Board Members noted that the fee rates charged to the Fund and other clients vary, among other things, because of the different services involved and the additional regulatory and compliance requirements associated with registered investment companies, such as the Fund. Accordingly, the Independent Board Members considered the differences in the product types, including, but not limited to, the services provided, the structure and operations, product distribution and costs thereof, portfolio investment policies, investor profiles, account sizes and regulatory requirements. The Independent Board Members noted, in particular, that the range of services provided to the Fund (as discussed above) is much more extensive than that provided to separately managed accounts. Given the inherent differences in the products, particularly the extensive services provided to the Fund, the Independent Board Members believe such facts justify the different levels of fees.
In considering the fees of the Sub-Advisor, the Independent Board Members also considered the pricing schedule or fees that the Sub-Advisor charges for similar investment management services for other fund sponsors or clients (such as retail and/or institutional managed accounts) as applicable.
3. Profitability of Fund Advisers
In conjunction with its review of fees, the Independent Board Members also considered the profitability of Nuveen for its advisory activities (which incorporated Nuveen’s wholly-owned affiliated sub-advisers) and its financial condition. The Independent Board Members reviewed the revenues and expenses of Nuveen’s advisory activities for the last two years, the allocation methodology used in preparing the profitability data and an analysis of the key drivers behind the changes in revenues and expenses that impacted profitability in 2010. The Independent Board Members noted this information supplemented the profitability information requested and received during the year to help keep them apprised of developments affecting profitability (such as changes in fee waivers and expense reimbursement commitments). In this regard, the Independent Board Members noted that they have an Independent Board Member serve as a point person to review and keep them apprised of changes to the profitability analysis and/or methodologies during the year. The Independent Board Members also considered Nuveen’s revenues for advisory activities, expenses, and profit margin compared to that of various unaffiliated management firms with similar amounts of assets under management and relatively comparable asset composition prepared by Nuveen.
In reviewing profitability, the Independent Board Members recognized the subjective nature of determining profitability which may be affected by numerous factors including the allocation of expenses. Further, the Independent Board Members recognized the difficulties in making comparisons as the profitability of other advisers generally is not publicly available and the profitability information that is available for certain advisers or management firms may not be representative of the industry and may be affected by, among other things, the adviser’s particular business mix, capital costs, types of funds managed and expense allocations. Notwithstanding the foregoing, the Independent Board Members reviewed Nuveen’s methodology and assumptions for allocating expenses across product lines to determine profitability. In reviewing profitability, the Independent Board Members recognized Nuveen’s investment in its fund business. Based on their review, the Independent Board Members concluded that the Advisor’s level of profitability for its advisory activities was reasonable in light of the services provided.
The Independent Board Members also considered the Sub-Advisor’s revenues, expenses and pre-tax profitability margins. Based on their review, the Independent Board Members were satisfied that the Sub-Advisor’s level of profitability was reasonable in light of the services provided.
In evaluating the reasonableness of the compensation, the Independent Board Members also considered other amounts paid to a Fund Adviser by the Fund as well as any indirect benefits (such as soft dollar arrangements, if any) the Fund Adviser and its affiliates receive, or are expected to receive, that are directly attributable to the management of the Fund, if any. See Section E below for additional information on indirect benefits a Fund Adviser may receive as a result of its relationship with the Fund. Based on their review of the overall fee arrangements of the Fund, the Independent Board Members determined that the advisory fees and expenses of the Fund were reasonable.
D. Economies of Scale and Whether Fee Levels Reflect These Economies of Scale
With respect to economies of scale, the Independent Board Members have recognized the potential benefits resulting from the costs of a fund being spread over a larger asset base, although economies of scale are difficult to measure and predict with precision, particularly on a fund-by-fund basis. One method to help ensure the shareholders share in these benefits is to include breakpoints in the advisory fee schedule. Generally, management fees for funds in the Nuveen complex are comprised of a fund-level component and a complex-level component, subject to certain exceptions. Accordingly, the Independent Board Members reviewed and considered the applicable fund-level breakpoints in the advisory fee schedules that reduce advisory fees as asset levels increase.
| 36 | Nuveen Investments |
In addition to fund-level advisory fee breakpoints, the Board also considered the Fund’s complex-wide fee arrangement. Pursuant to the complex-wide fee arrangement, the fees of the funds in the Nuveen complex are generally reduced as the assets in the fund complex reach certain levels. The complex-wide fee arrangement seeks to provide the benefits of economies of scale to fund shareholders when total fund complex assets increase, even if assets of a particular fund are unchanged or have decreased. The approach reflects the notion that some of Nuveen’s costs are attributable to services provided to all its funds in the complex and therefore all funds benefit if these costs are spread over a larger asset base. In this regard, the Independent Board Members also noted that a portion of the assets acquired pursuant to the transaction with FAF are included in determining the level of assets for calculating the complex-wide fee, which helps reduce such fee to the benefit of all shareholders.
Based on their review, the Independent Board Members concluded that the breakpoint schedules and complex-wide fee arrangement were acceptable and reflect economies of scale to be shared with shareholders when assets under management increase.
E. Indirect Benefits
In evaluating fees, the Independent Board Members received and considered information regarding potential “fall out” or ancillary benefits the respective Fund Adviser or its affiliates may receive as a result of its relationship with the Fund. In this regard, the Independent Board Members considered, among other things, any sales charges, distribution fees and shareholder services fees received and retained by the Fund’s principal underwriter, an affiliate of the Advisor, which includes fees received pursuant to any 12b-1 plan. The Independent Board Members, therefore, considered the 12b-1 fees retained by Nuveen during the last calendar year.
In addition to the above, the Independent Board Members considered whether the Fund Advisers received any benefits from soft dollar arrangements whereby a portion of the commissions paid by the Fund for brokerage may be used to acquire research that may be useful to the Fund Adviser in managing the assets of the Fund and other clients. With respect to the Advisor, the Independent Board Members recognized that the Advisor has the authority to pay a higher commission in return for brokerage and research services if it determines in good faith that the commission paid is reasonable in relation to the value of the brokerage and research services provided. With respect to the Sub-Advisor, the Independent Board Members considered that the Sub-Advisor may benefit from its soft dollar arrangements pursuant to which it receives research from brokers that execute the Fund’s portfolio transactions. The Independent Board Members noted that the Fund Advisers’ profitability may be somewhat lower if they did not receive the research services pursuant to the soft dollar arrangements and had to acquire such services directly.
Based on their review, the Independent Board Members concluded that any indirect benefits received by a Fund Adviser as a result of its relationship with the Fund were reasonable and within acceptable parameters.
F. Other Considerations
The Independent Board Members did not identify any single factor discussed previously as all-important or controlling. The Board Members, including the Independent Board Members, unanimously concluded that the terms of each Advisory Agreement are fair and reasonable, that the respective Fund Adviser’s fees are reasonable in light of the services provided to the Fund and that the Advisory Agreements be renewed.
| Nuveen Investments | 37 |
Glossary of Terms Used in this Report
Average Annual Total Return: This is a commonly used method to express an investment’s performance over a particular, usually multi-year time period. It expresses the return that would have been necessary each year to equal the investment’s actual cumulative performance (including change in NAV or offer price and reinvested dividends and capital gains distributions, if any) over the time period being considered.
Lipper Equity Income Funds Category Average: Represents the average annualized total return for all reporting funds in the Lipper Equity Income Funds Category. The Category contained 227 funds during the 1-year period ended June 30, 2011. For more information about Lipper category averages, please see www.nuveen.com. You cannot invest directly in an average.
Net Asset Value (NAV): A Fund’s NAV is the dollar value of one share in the Fund. It is calculated by subtracting the liabilities of the Fund from its total assets and then dividing the remainder by the number of shares outstanding. Fund NAVs are calculated at the end of each business day.
Russell 1000 Value Index: Is a market-capitalization weighted index of those firms in the Russell 1000 Index with lower price-to-book ratios and lower forecasted growth values. You cannot invest directly in an index.
| 38 | Nuveen Investments |
Fund Manager
Nuveen Fund Advisors, Inc.
333 West Wacker Drive
Chicago, IL 60606
Sub-Adviser
NWQ Investment Management
Company, LLC
2049 Century Park East
Los Angeles, CA 90097
Legal Counsel
Chapman and Cutler LLP
Chicago, IL
Independent Registered
Public Accounting Firm
PricewaterhouseCoopers LLP
Chicago, IL
Custodian
State Street Bank & Trust Company
Boston, MA
Transfer Agent and Shareholder Services
Boston Financial
Data Services
Nuveen Investor Services
P.O. Box 8530
Boston, MA 02266-8530
(800) 257-8787
Distribution Information: The Fund hereby designates its percentages of dividends paid from net ordinary income as dividends qualifying for the 70% dividends received deduction (“DRD”) for corporations and its percentages as qualified dividend income (“QDI”) for individuals under Section 1 (h)(11) of the Internal Revenue Code as shown in the accompanying table. The actual qualified dividend income distributions will be reported to shareholders on Form 1099-DIV which will be sent to shareholders shortly after calendar year end.
| Fund | % of DRD | % of QDI | ||||||
Nuveen NWQ Equity Income Fund | 34.27% | 42.84% | ||||||
Fund’s Quarterly Portfolio of Investments and Proxy Voting Information: You may obtain (i) the Fund’s quarterly portfolio of investments, (ii) information regarding how the Fund voted proxies relating to portfolio securities held during the most recent twelve-month period ended June 30, and (iii) a description of the policies and procedures that the Fund used to determine how to vote proxies relating to portfolio securities without charge, upon request, by calling Nuveen Investments at (800) 257-8787 or on Nuveen’s website at www.nuveen.com.
You may also obtain this and other Fund information directly from the Securities and Exchange Commission (SEC). The SEC may charge a copying fee for this information. Visit the SEC on-line at http://www.sec.gov or in person at the SEC’s Public Reference Room in Washington, D.C. Call the SEC at (202) 942-8090 for room hours and operation. You may also request Fund information by sending an e-mail request to publicinfo@sec.gov or by writing to the SEC’s Public Reference Section at 100 F Street NE, Washington, D.C. 20549.
The Financial Industry Regulatory Authority (FINRA) provides a Public Disclosure Program which supplies certain information regarding the disciplinary history of FINRA members and their associated persons in response to either telephone inquiries at (800) 289-9999 or written inquiries at www.finra.org. FINRA also provides an investor brochure that includes information describing the Public Disclosure Program.
| Nuveen Investments | 39 |
Nuveen Investments:
Serving Investors for Generations
Since 1898, financial advisors and their clients have relied on Nuveen Investments to provide dependable investment solutions through continued adherence to proven, long-term investing principles. Today, we offer a range of high quality equity and fixed-income solutions designed to be integral components of a well-diversified core portfolio.
Focused on meeting investor needs.
Nuveen Investments is a global investment management firm that seeks to help secure the long-term goals of institutions and high net worth investors as well as the consultants and financial advisors who serve them. We market our growing range of specialized investment solutions under the high-quality brands of HydePark, NWQ, Nuveen Asset Management, Santa Barbara, Symphony, Tradewinds and Winslow Capital. In total, Nuveen Investments managed approximately $210 billion of assets as of June 30, 2011.
Find out how we can help you.
To learn more about how the products and services of Nuveen Investments may be able to help you meet your financial goals, talk to your financial advisor, or call us at (800) 257-8787. Please read the information provided carefully before you invest. Investors should consider the investment objective and policies, risk considerations, charges and expenses of any investment carefully. Where applicable, be sure to obtain a prospectus, which contains this and other relevant information. To obtain a prospectus, please contact your securities representative or Nuveen Investments, 333 W. Wacker Dr., Chicago, IL 60606. Please read the prospectus carefully before you invest or send money.
Learn more about Nuveen Funds at: www.nuveen.com/mf
Nuveen makes things e-simple.
It only takes a minute to sign up for e-Reports. Once enrolled, you’ll receive an e-mail as soon as your Nuveen Fund information is ready — no more waiting for delivery by regular mail. Just click on the link within the e-mail to see the report and save it on your computer if you wish.
Free e-Reports right to your e-mail!
www.investordelivery.com
If you receive your Nuveen Fund distributions and statements from your financial advisor or brokerage account.
OR
www.nuveen.com/accountaccess
If you receive your Nuveen Fund distributions and statements directly from Nuveen.
Distributed by Nuveen Securities, LLC 333 West Wacker Drive Chicago, IL 60606 www.nuveen.com |
MAN-NEQI-0611P
ITEM 2. CODE OF ETHICS.
As of the end of the period covered by this report, the registrant has adopted a code of ethics that applies to the registrant’s principal executive officer, principal financial officer, principal accounting officer or controller, or persons performing similar functions. There were no amendments to or waivers from the code during the period covered by this report. The registrant has posted the code of ethics on its website at www.nuveen.com/mf. (To view the code, click on the Shareholder Resources drop down menu box, click on Fund Governance and then click on Code of Conduct.)
ITEM 3. AUDIT COMMITTEE FINANCIAL EXPERT.
The registrant’s Board of Trustees determined that the registrant has at least one “audit committee financial expert” (as defined in Item 3 of Form N-CSR) serving on its Audit Committee. The registrant’s audit committee financial expert is Carole E. Stone, who is “independent” for purposes of Item 3 of Form N-CSR.
Ms. Stone served for five years as Director of the New York State Division of the Budget. As part of her role as Director, Ms. Stone was actively involved in overseeing the development of the State’s operating, local assistance and capital budgets, its financial plan and related documents; overseeing the development of the State’s bond-related disclosure documents and certifying that they fairly presented the State’s financial position; reviewing audits of various State and local agencies and programs; and coordinating the State’s system of internal audit and control. Prior to serving as Director, Ms. Stone worked as a budget analyst/examiner with increasing levels of responsibility over a 30 year period, including approximately five years as Deputy Budget Director. Ms. Stone has also served as Chair of the New York State Racing Association Oversight Board, as Chair of the Public Authorities Control Board, as a Commissioner on the New York State Commission on Public Authority Reform and as a member of the Boards of Directors of several New York State public authorities. These positions have involved overseeing operations and finances of certain entities and assessing the adequacy of project/entity financing and financial reporting. Currently, Ms. Stone is on the Board of Directors of CBOE Holdings, Inc., of the Chicago Board Options Exchange, and of C2 Options Exchange. Ms. Stone’s position on the boards of these entities and as a member of both CBOE Holdings’ Audit Committee and its Finance Committee has involved, among other things, the oversight of audits, audit plans and preparation of financial statements.
ITEM 4. PRINCIPAL ACCOUNTANT FEES AND SERVICES.
The following tables show the amount of fees that PricewaterhouseCoopers LLP, the Trust’s auditor, billed to the Trust during the Trust’s last two full fiscal years. The Audit Committee approved in advance all audit services and non-audit services that PricewaterhouseCoopers LLP provided to the Trust, except for those non-audit services that were subject to the pre-approval exception under Rule 2-01 of Regulation S-X (the “pre-approval exception”). The pre-approval exception for services provided directly to the Trust waives the pre-approval requirement for services other than audit, review or attest services if: (A) the aggregate amount of all such services provided constitutes no more than 5% of the total amount of revenues paid by the Trust during the fiscal year in which the services are provided; (B) the Trust did not recognize the services as non-audit services at the time of the engagement; and (C) the services are promptly brought to the Audit Committee’s attention, and the Committee (or its delegate) approves the services before the audit is completed.
The Audit Committee has delegated certain pre-approval responsibilities to its Chairman (or, in his absence, any other member of the Audit Committee).
SERVICES THAT THE TRUST’S AUDITOR BILLED TO THE TRUST
Fiscal Year Ended June 30, 2011 | Audit Fees Billed to Funds 1 | Audit-Related Fees Billed to Funds 2 | Tax Fees Billed to Funds 3 | All Other Fees Billed to Funds 4 | ||||||||||||
Name of Series | ||||||||||||||||
Moderate Allocation Fund | 11,451 | 0 | 2,850 | 0 | ||||||||||||
Conservative Allocation Fund | 11,392 | 0 | 2,850 | 0 | ||||||||||||
NWQ Equity Income Fund | 11,009 | 0 | 0 | 0 | ||||||||||||
Multi-Manager Large-Cap Value Fund | 13,548 | 0 | 2,850 | 0 | ||||||||||||
Growth Allocation Fund | 11,063 | 0 | 2,850 | 0 | ||||||||||||
NWQ Multi-Cap Value Fund | 13,715 | 0 | 2,850 | 0 | ||||||||||||
NWQ Small-Cap Value Fund | 11,941 | 0 | 2,850 | 0 | ||||||||||||
Tradewinds Value Opportunities Fund | 34,448 | 0 | 2,850 | 0 | ||||||||||||
NWQ Large-Cap Value Fund | 14,010 | 0 | 2,850 | 0 | ||||||||||||
NWQ Small Mid/Cap Value Fund | 11,159 | 0 | 2,850 | 0 | ||||||||||||
U.S. Equity Completeness Fund | 11,073 | 0 | 0 | 0 | ||||||||||||
|
|
|
|
|
|
|
| |||||||||
Total | $ | 154,809 | $ | 0 | $ | 25,650 | $ | 0 | ||||||||
| 1 | “Audit Fees” are the aggregate fees billed for professional services for the audit of the Fund’s annual financial statements and services provided in connection with statutory and regulatory filings or engagements. |
| 2 | “Audit Related Fees” are the aggregate fees billed for assurance and related services reasonably related to the performance of the audit or review of financial statements and are not reported under “Audit Fees”. |
| 3 | “Tax Fees” are the aggregate fees billed for professional services for tax advice, tax compliance, and tax planning. |
| 4 | “All Other Fees” are the aggregate fees billed for products and services other than “Audit Fees”, “Audit Related Fees”, and “Tax Fees”. |
| Percentage Approved Pursuant to Pre-approval Exception | ||||||||||||||||
| Audit Fees Billed to Funds | Audit-Related Fees Billed to Funds | Tax Fees Billed to Funds | All Other Fees Billed to Funds | |||||||||||||
Name of Series | ||||||||||||||||
Moderate Allocation Fund | 0 | % | 0 | % | 0 | % | 0 | % | ||||||||
Conservative Allocation Fund | 0 | % | 0 | % | 0 | % | 0 | % | ||||||||
NWQ Equity Income Fund | 0 | % | 0 | % | 0 | % | 0 | % | ||||||||
Multi-Manager Large-Cap Value Fund | 0 | % | 0 | % | 0 | % | 0 | % | ||||||||
Growth Allocation Fund | 0 | % | 0 | % | 0 | % | 0 | % | ||||||||
NWQ Multi-Cap Value Fund | 0 | % | 0 | % | 0 | % | 0 | % | ||||||||
NWQ Small-Cap Value Fund | 0 | % | 0 | % | 0 | % | 0 | % | ||||||||
Tradewinds Value Opportunities Fund | 0 | % | 0 | % | 0 | % | 0 | % | ||||||||
NWQ Large-Cap Value Fund | 0 | % | 0 | % | 0 | % | 0 | % | ||||||||
NWQ Small Mid/Cap Value Fund | 0 | % | 0 | % | 0 | % | 0 | % | ||||||||
U.S. Equity Completeness Fund | 0 | % | 0 | % | 0 | % | 0 | % | ||||||||
Fiscal Year Ended June 30, 2010 | Audit Fees Billed to Funds 1 | Audit-Related Fees Billed to Funds 2 | Tax Fees Billed to Funds 3 | All Other Fees Billed to Funds 4 | ||||||||||||
Name of Series | ||||||||||||||||
Moderate Allocation Fund | 10,898 | 0 | 2,750 | 0 | ||||||||||||
Conservative Allocation Fund | 10,899 | 0 | 2,750 | 0 | ||||||||||||
NWQ Equity Income Fund 5 | 10,509 | 0 | 0 | 0 | ||||||||||||
Multi-Manager Large-Cap Value Fund | 13,221 | 0 | 2,750 | 0 | ||||||||||||
Growth Allocation Fund | 10,578 | 0 | 2,750 | 0 | ||||||||||||
NWQ Multi-Cap Value Fund | 13,642 | 0 | 2,750 | 0 | ||||||||||||
NWQ Small-Cap Value Fund | 11,261 | 0 | 2,750 | 0 | ||||||||||||
Tradewinds Value Opportunities Fund | 24,403 | 0 | 2,750 | 0 | ||||||||||||
NWQ Large-Cap Value Fund | 11,875 | 0 | 2,750 | 0 | ||||||||||||
NWQ Small Mid/Cap Value Fund | 10,593 | 0 | 2,750 | 0 | ||||||||||||
U.S. Equity Completeness Fund | 10,548 | 0 | 0 | 0 | ||||||||||||
|
|
|
|
|
|
|
| |||||||||
Total | $ | 138,427 | $ | 0 | $ | 24,750 | $ | 0 | ||||||||
| 1 | “Audit Fees” are the aggregate fees billed for professional services for the audit of the Fund’s annual financial statements and services provided in connection with statutory and regulatory filings or engagements. |
| 2 | “Audit Related Fees” are the aggregate fees billed for assurance and related services reasonably related to the performance of the audit or review of financial statements and are not reported under “Audit Fees”. |
| 3 | “Tax Fees” are the aggregate fees billed for professional services for tax advice, tax compliance, and tax planning. |
| 4 | “All Other Fees” are the aggregate fees billed for products and services other than “Audit Fees”, “Audit Related Fees”, and “Tax Fees”. |
| 5 | The Fund commenced operations on September 15, 2009. |
| Percentage Approved Pursuant to Pre-approval Exception | ||||||||||||||||
| Audit Fees Billed to Funds | Audit-Related Fees Billed to Funds | Tax Fees Billed to Funds | All Other Fees Billed to Funds | |||||||||||||
Name of Series | ||||||||||||||||
Moderate Allocation Fund | 0 | % | 0 | % | 0 | % | 0 | % | ||||||||
Conservative Allocation Fund | 0 | % | 0 | % | 0 | % | 0 | % | ||||||||
NWQ Equity Income Fund 1 | 0 | % | 0 | % | 0 | % | 0 | % | ||||||||
Multi-Manager Large-Cap Value Fund | 0 | % | 0 | % | 0 | % | 0 | % | ||||||||
Growth Allocation Fund | 0 | % | 0 | % | 0 | % | 0 | % | ||||||||
NWQ Multi-Cap Value Fund | 0 | % | 0 | %�� | 0 | % | 0 | % | ||||||||
NWQ Small-Cap Value Fund | 0 | % | 0 | % | 0 | % | 0 | % | ||||||||
Tradewinds Value Opportunities Fund | 0 | % | 0 | % | 0 | % | 0 | % | ||||||||
NWQ Large-Cap Value Fund | 0 | % | 0 | % | 0 | % | 0 | % | ||||||||
NWQ Small Mid/Cap Value Fund | 0 | % | 0 | % | 0 | % | 0 | % | ||||||||
U.S. Equity Completeness Fund | 0 | % | 0 | % | 0 | % | 0 | % | ||||||||
| 1 | The Fund commenced operations on September 15, 2009. |
Fiscal Year Ended June 30, 2011 | Audit-Related Fees Billed to Adviser and Affiliated Fund Service Providers | Tax Fees Billed to Adviser and Affiliated Fund Service Providers | All Other Fees Billed to Adviser and Affiliated Fund Service Providers | |||||||||
Nuveen Investment Trust | $ | 0 | $ | 0 | $ | 0 | ||||||
| Percentage Approved Pursuant to Pre-approval Exception | ||||||||||||
| Audit-Related Fees Billed to Adviser and Affiliated Fund Service Providers | Tax Fees Billed to Adviser and Affiliated Fund Service Providers | All Other Fees Billed to Adviser and Affiliated Fund Service Providers | ||||||||||
| 0 | % | 0 | % | 0 | % | |||||||
Fiscal Year Ended June 30, 2010 | Audit-Related Fees Billed to Adviser and Affiliated Fund Service Providers | Tax Fees Billed to Adviser and Affiliated Fund Service Providers | All Other Fees Billed to Adviser and Affiliated Fund Service Providers | |||||||||
Nuveen Investment Trust | $ | 0 | $ | 0 | $ | 0 | ||||||
| Percentage Approved Pursuant to Pre-approval Exception | ||||||||||||
| Audit-Related Fees Billed to Adviser and Affiliated Fund Service Providers | Tax Fees Billed to Adviser and Affiliated Fund Service Providers | All Other Fees Billed to Adviser and Affiliated Fund Service Providers | ||||||||||
| 0 | % | 0 | % | 0 | % | |||||||
Fiscal Year Ended June 30, 2011 | Total Non-Audit Fees Billed to Trust | Total Non-Audit Fees billed to Adviser and Affiliated Fund Service Providers (engagements related directly to the operations and financial reporting of the Trust) | Total Non-Audit Fees billed to Adviser and Affiliated Fund Service Providers (all other engagements) | Total | ||||||||||||
Name of Series | ||||||||||||||||
Moderate Allocation Fund | 2,850 | 0 | 0 | 2,850 | ||||||||||||
Conservative Allocation Fund | 2,850 | 0 | 0 | 2,850 | ||||||||||||
NWQ Equity Income Fund | 0 | 0 | 0 | 0 | ||||||||||||
Multi-Manager Large-Cap Value Fund | 2,850 | 0 | 0 | 2,850 | ||||||||||||
Growth Allocation Fund | 2,850 | 0 | 0 | 2,850 | ||||||||||||
NWQ Multi-Cap Value Fund | 2,850 | 0 | 0 | 2,850 | ||||||||||||
NWQ Small-Cap Value Fund | 2,850 | 0 | 0 | 2,850 | ||||||||||||
Tradewinds Value Opportunities Fund | 2,850 | 0 | 0 | 2,850 | ||||||||||||
NWQ Large-Cap Value Fund | 2,850 | 0 | 0 | 2,850 | ||||||||||||
NWQ Small Mid/Cap Value Fund | 2,850 | 0 | 0 | 2,850 | ||||||||||||
U.S. Equity Completeness Fund | 0 | 0 | 0 | 0 | ||||||||||||
|
|
|
|
|
|
|
| |||||||||
Total | $ | 25,650 | $ | 0 | $ | 0 | $ | 25,650 | ||||||||
“Non-Audit Fees Billed to Trust” represent “Tax Fees” and “All Other Fees” billed to each Fund in their respective amounts from the previous table.
Fiscal Year Ended June 30, 2010 | Total Non-Audit Fees Billed to Trust | Total Non-Audit Fees billed to Adviser and Affiliated Fund Service Providers (engagements related directly to the operations and financial reporting of the Trust) | Total Non-Audit Fees billed to Adviser and Affiliated Fund Service Providers (all other engagements) | Total | ||||||||||||
Name of Series | ||||||||||||||||
Moderate Allocation Fund | 2,750 | 0 | 0 | 2,750 | ||||||||||||
Conservative Allocation Fund | 2,750 | 0 | 0 | 2,750 | ||||||||||||
NWQ Equity Income Fund 1 | 0 | 0 | 0 | 0 | ||||||||||||
Multi-Manager Large-Cap Value Fund | 2,750 | 0 | 0 | 2,750 | ||||||||||||
Growth Allocation Fund | 2,750 | 0 | 0 | 2,750 | ||||||||||||
NWQ Multi-Cap Value Fund | 2,750 | 0 | 0 | 2,750 | ||||||||||||
NWQ Small-Cap Value Fund | 2,750 | 0 | 0 | 2,750 | ||||||||||||
Tradewinds Value Opportunities Fund | 2,750 | 0 | 0 | 2,750 | ||||||||||||
NWQ Large-Cap Value Fund | 2,750 | 0 | 0 | 2,750 | ||||||||||||
NWQ Small Mid/Cap Value Fund | 2,750 | 0 | 0 | 2,750 | ||||||||||||
U.S. Equity Completeness Fund | 0 | 0 | 0 | 0 | ||||||||||||
|
|
|
|
|
|
|
| |||||||||
Total | $ | 24,750 | $ | 0 | $ | 0 | $ | 24,750 | ||||||||
“Non-Audit Fees Billed to Trust” represent “Tax Fees” and “All Other Fees” billed to each Fund in their respective amounts from the previous table.
| 1 | The Fund commenced operations on September 15, 2009. |
Audit Committee Pre-Approval Policies and Procedures. Generally, the Audit Committee must approve (i) all non-audit services to be performed for the Trust by the Trust’s independent accountants and (ii) all audit and non-audit services to be performed by the Trust’s independent accountants for the Affiliated Fund Service Providers with respect to the operations and financial reporting of the Trust. Regarding tax and research projects conducted by the independent accountants for the Trust and Affiliated Fund Service Providers (with respect to operations and financial reports of the Trust), such engagements will be (i) pre-approved by the Audit Committee if they are expected to be for amounts greater than $10,000; (ii) reported to the Audit Committee Chairman for his verbal approval prior to engagement if they are expected to be for amounts under $10,000 but greater than $5,000; and (iii) reported to the Audit Committee at the next Audit Committee meeting if they are expected to be for an amount under $5,000.
ITEM 5. AUDIT COMMITTEE OF LISTED REGISTRANTS
Not applicable to this registrant.
ITEM 6. SCHEDULE OF INVESTMENTS
| a) | See Portfolio of Investments in Item 1. |
| b) | Not applicable. |
ITEM 7. DISCLOSURE OF PROXY VOTING POLICIES AND PROCEDURES FOR CLOSED-END
MANAGEMENT INVESTMENT COMPANIES
Not applicable to this registrant.
ITEM 8. PORTFOLIO MANAGERS OF CLOSED-END MANAGEMENT INVESTMENT COMPANIES
Not applicable to this registrant.
ITEM 9. PURCHASES OF EQUITY SECURITIES BY CLOSED-END MANAGEMENT INVESTMENT COMPANY AND AFFILIATED PURCHASERS
Not applicable to this registrant.
ITEM 10. SUBMISSION OF MATTERS TO A VOTE OF SECURITY HOLDERS
There have been no material changes to the procedures by which shareholders may recommend nominees to the registrant’s Board of Trustees implemented after the registrant last provided disclosure in response to this Item.
ITEM 11. CONTROLS AND PROCEDURES.
| (a) | The registrant’s principal executive and principal financial officers, or persons performing similar functions, have concluded that the registrant’s disclosure controls and procedures (as defined in Rule 30a-3(c) under the Investment Company Act of 1940, as amended (the “1940 Act”) (17 CFR 270.30a-3(c))) are effective, as of a date within 90 days of the filing date of this report that includes the disclosure required by this paragraph, based on their evaluation of the controls and procedures required by Rule 30a-3(b) under the 1940 Act (17 CFR 270.30a-3(b)) and Rules 13a-15(b) or 15d-15(b) under the Securities Exchange Act of 1934, as amended (the “Exchange Act”) (17 CFR 240.13a-15(b) or 240.15d-15(b)). |
| (b) | There were no changes in the registrant’s internal control over financial reporting (as defined in Rule 30a-3(d) under the 1940 Act (17 CFR 270.30a-3(d)) that occurred during the second fiscal quarter of the period covered by this report that has materially affected, or is reasonably likely to materially affect, the registrant’s internal control over financial reporting. |
ITEM 12. EXHIBITS
File the exhibits listed below as part of this Form.
| (a)(1) | Any code of ethics, or amendment thereto, that is the subject of the disclosure required by Item 2, to the extent that the registrant intends to satisfy the Item 2 requirements through filing of an exhibit: Not applicable because the code is posted on registrant’s website at www.nuveen.com/mf and there were no amendments during the period covered by this report. (To view the code, click on the Shareholder Resources drop down menu box, click on Fund Governance and then Code of Conduct.) | |
| (a)(2) | A separate certification for each principal executive officer and principal financial officer of the registrant as required by Rule 30a-2(a) under the 1940 Act (17 CFR 270.30a-2(a)) in the exact form set forth below: See EX-99.CERT attached hereto. | |
| (a)(3) | Any written solicitation to purchase securities under Rule 23c-1 under the 1940 Act (17 CFR 270.23c-1) sent or given during the period covered by the report by or on behalf of the registrant to 10 or more persons: Not applicable to this registrant. | |
| (b) | If the report is filed under Section 13(a) or 15(d) of the Exchange Act, provide the certifications required by Rule 30a-2(b) under the 1940 Act (17 CFR 270.30a-2(b)), Rule 13a-14(b) or Rule 15d-14(b) under the Exchange Act (17 CFR 240.13a-14(b) or 240.15d-14(b)), and Section 1350 of Chapter 63 of Title 18 of the United States Code (18 U.S.C. 1350) as an Exhibit. A certification furnished pursuant to this paragraph will not be deemed “filed” for purposes of Section 18 of the Exchange Act (15 U.S.C. 78r), or otherwise subject to the liability of that section. Such certification will not be deemed to be incorporated by reference into any filing under the Securities Act of 1933 or the Exchange Act, except to the extent that the registration specifically incorporates it by reference: See EX-99.906 CERT attached hereto. | |
SIGNATURES
Pursuant to the requirements of the Securities Exchange Act of 1934 and the Investment Company Act of 1940, the registrant has duly caused this report to be signed on its behalf by the undersigned, thereunto duly authorized.
(Registrant) Nuveen Investment Trust
By (Signature and Title)
| /s/ Kevin J. McCarthy | |
| Kevin J. McCarthy | ||
| Vice President and Secretary | ||
Date September 7, 2011
Pursuant to the requirements of the Securities Exchange Act of 1934 and the Investment Company Act of 1940, this report has been signed below by the following persons on behalf of the registrant and in the capacities and on the dates indicated.
By (Signature and Title)
| /s/ Gifford R. Zimmerman | |
| Gifford R. Zimmerman | ||
| Chief Administrative Officer | ||
| (principal executive officer) | ||
Date September 7, 2011
| By (Signature and Title) | /s/ Stephen D. Foy | |
| Stephen D. Foy | ||
| Vice President and Controller | ||
| (principal financial officer) | ||
Date September 7, 2011