UNITED STATES
SECURITIES AND EXCHANGE COMMISSION
Washington, D.C. 20549
FORM N-CSR
CERTIFIED SHAREHOLDER REPORT OF REGISTERED MANAGEMENT
INVESTMENT COMPANIES
Investment Company Act file number 811-07619
Nuveen Investment Trust
(Exact name of registrant as specified in charter)
Nuveen Investments
333 West Wacker Drive, Chicago, IL 60606
(Address of principal executive offices) (Zip code)
Kevin J. McCarthy
Nuveen Investments
333 West Wacker Drive
Chicago, IL 60606
(Name and address of agent for service)
Registrant’s telephone number, including area code: (312) 917-7700
Date of fiscal year end: June 30
Date of reporting period: June 30, 2008
Form N-CSR is to be used by management investment companies to file reports with the Commission not later than 10 days after the transmission to stockholders of any report that is required to be transmitted to stockholders under Rule 30e-1 under the Investment Company Act of 1940 (17 CFR 270.30e-1). The Commission may use the information provided on Form N-CSR in its regulatory, disclosure review, inspection, and policy making roles.
A registrant is required to disclose the information specified by Form N-CSR, and the Commission will make this information public. A registrant is not required to respond to the collection of information contained in Form N-CSR unless the Form displays a currently valid Office of Management and Budget (“OMB”) control number. Please direct comments concerning the accuracy of the information collection burden estimate and any suggestions for reducing the burden to Secretary, Securities and Exchange Commission, 450 Fifth Street, NW, Washington, DC 20549-0609. The OMB has reviewed this collection of information under the clearance requirements of 44 U.S.C. ss.3507.
ITEM 1. REPORTS TO STOCKHOLDERS.
NUVEEN INVESTMENTS MUTUAL FUNDS
Annual Report June 30, 2008 | For investors seeking long-term growth potential. | |

Nuveen Investments
Value and Balanced Funds
Nuveen Multi-Manager Large-Cap Value Fund
Nuveen Balanced Municipal and Stock Fund
(currently known as Nuveen Conservative Allocation Fund)
Nuveen Balanced Stock and Bond Fund
(currently known as Nuveen Moderate Allocation Fund)


NOW YOU CAN RECEIVE YOUR
NUVEEN INVESTMENTS FUND REPORTS FASTER.
NO MORE WAITING.
SIGN UP TODAY TO RECEIVE NUVEEN INVESTMENTS FUND INFORMATION BY E-MAIL.
It only takes a minute to sign up for E-Reports. Once enrolled, you’ll receive an e-mail as soon as your Nuveen Investments Fund information is ready — no more waiting for delivery by regular mail. Just click on the link within the e-mail to see the report, and save it on your computer if your wish.

IT’S FAST, EASY & FREE:
www.investordelivery.com
if you get your Nuveen Investments Fund dividends and statements from your financial advisor or brokerage account.
(Be sure to have the address sheet that accompanied this report handy. You’ll need it to complete the enrollment process.)
OR
www.nuveen.com/accountaccess
if you get your Nuveen Investments Fund dividends and statements directly from Nuveen Investments.

| Must be preceded by or accompanied by a prospectus. | NOT FDIC INSURED | MAY LOSE VALUE | NO BANK GUARANTEE |
Dear Fellow Shareholders,
I’d like to use my initial letter to you to accomplish several things. First, I want to report that after fourteen years of service on your Fund’s Board, including the last twelve as chairman, Tim Schwertfeger retired from the Board in June. The Board has elected me to replace him as the chairman, the first time this role has been filled by someone who is not an employee of Nuveen Investments. Electing an independent chairman marks a significant milestone in the management of your Fund, and it aligns us with what is now considered a “best practice” in the fund industry. Further, it demonstrates the independence with which your Board has always acted on your behalf.
Following Tim will not be easy. During my eleven previous years on the Nuveen Fund Board, I found that Tim always set a very high standard by combining insightful industry and market knowledge and sound, clear judgment. While the Board will miss his wise counsel, I am certain we will retain the primary commitment Tim shared with all of us – an unceasing dedication to creating and retaining value for Nuveen Fund shareholders. This focus on value over time is a touchstone that I and all the other Board members will continue to use when making decisions on your behalf.
Second, I also want to report that we are very fortunate to be welcoming two new Board members to our team. John Amboian, the current chairman and CEO of Nuveen Investments, has agreed to replace Tim as Nuveen’s representative on the Board. John’s presence will allow the independent Board members to benefit not only from his leadership role at Nuveen but also his broad understanding of the fund industry and Nuveen’s role within it. We also are adding Terry Toth as an independent director. A former CEO of the Northern Trust Company’s asset management group, Terry will bring extensive experience in the fund industry to our deliberations.
Finally, I urge you to take the time to review the Portfolio Managers’ Comments and Fund Spotlight sections of this report. All of us are grateful that you have chosen Nuveen Investments as a partner as you pursue your financial goals, and, on behalf of myself and the other members of your Fund’s Board, let me say we look forward to continuing to earn your trust in the months and years ahead.
Sincerely,

Robert P. Bremner
Chairman of the Board
August 22, 2008

Robert P. Bremner
Chairman of the Board
Annual Report l Page 1
Portfolio Managers’ Comments
The Nuveen Multi-Manager Large-Cap Value, Balanced Municipal and Stock, and Balanced Stock and Bond Funds feature equity management by Institutional Capital LLC (ICAP). The municipal portion of the Balanced Municipal and Stock Fund was managed by Nuveen Asset Management. We recently asked Jerry Senser, chief executive officer and chief investment officer of ICAP, and Tom Spalding of Nuveen Asset Management to discuss the key portfolio management strategies and the performance of these three Funds for the twelve-month reporting period ended June 30, 2008.
On July 31, 2007, the Board of Trustees of the Nuveen Large-Cap Value Fund approved Nuveen HydePark Group, LLC (“HydePark”) and Symphony Asset Management LLC (“Symphony”) as additional sub-advisors for the Fund. On October 12, 2007 shareholders of the Fund approved the additional sub-advisory agreements and they went into effect on November 14, 2007. Effective May 1, 2008, the Fund changed its name from Nuveen Large-Cap Value Fund to Nuveen Multi-Manager Large-Cap Value Fund. In this commentary, both HydePark and Symphony discuss the portfolio management strategies and performance for the periods in which they managed the Nuveen Multi-Manager Large-Cap Value Fund.
Effective July 7, 2008, based upon the determination of the Fund’s Board of Trustees and a shareholder vote, the Nuveen Balanced Municipal and Stock Fund’s sub-adviser and primary investment objective were changed. Richards & Tierney, Inc. was appointed as the Fund’s sub-adviser and the new investment objective is to provide attractive long-term total return with a conservative risk profile. The Fund became a “fund of funds” that invests principally in shares of other registered investment companies, including open-end mutual funds and exchange-traded funds (the Underlying Funds). The Fund will invest principally in Underlying Funds within the Nuveen family of funds. The Fund also changed its name from Nuveen Balanced Municipal and Stock Fund to Nuveen Conservative Allocation Fund.
Effective August 1, 2008, based upon the determination of the Fund’s Board of Trustees and a shareholder vote, the Nuveen Balanced Stock and Bond Fund’s sub-adviser and primary investment objective were changed. Richards & Tierney, Inc. was appointed as the Fund’s sub-adviser and the new investment objective is to provide attractive long-term total return with a moderate risk profile. The Fund became a “fund of funds” that invests principally in shares of other registered investment companies, including open-end mutual funds and exchange-traded funds (the Underlying Funds). The Fund will invest principally in Underlying Funds within the Nuveen family of funds. The Fund also changed its name from Nuveen Balanced Stock and Bond Fund to Nuveen Moderate Allocation Fund.
What type of economic and stock market backdrop did the Funds encounter during the reporting period?
It was an extremely challenging environment. The U.S. economy began the period on the upswing, with gross domestic product (GDP) growth of 4.9 percent in the third quarter of 2007. In the subsequent three months, however, growth tailed off dramatically to just 0.6 percent, followed by a still-sluggish expansion of 1.0 percent in the first quarter of 2008.
A variety of factors were weighing on the economy, with the list topped by steadily rising oil prices hitting a series of record highs. Higher energy costs, along with increasing food prices, resulted in higher consumer inflation. The housing market posed another big challenge. As home values weakened, mortgage defaults rose, and debt securities tied to relatively risky sub-prime loans lost significant value. That led to large losses for a wide variety of investors, most notably, the financial institutions holding these underperforming mortgage-backed securities. To stimulate the economy and boost liquidity in the financial markets, the Federal Reserve Board began cutting interest rates in September 2007. As of June 30, 2008, the federal funds target rate stood at 2.00 percent, down from 5.25 percent at the beginning of the period.
Against this backdrop, the stock market fared relatively poorly overall, although energy stocks benefited from strength in commodity prices. Financial stocks, hit the hardest by sub-prime-related turmoil, lost significant ground.
The first half of the period was particularly eventful for the municipal bond market. The troubles with mortgage securities led to a severe credit crunch. Almost every type of fixed-income security, including municipal bonds, encountered significant
Discussions of specific investments are for illustration only and are not intended as recommendations of individual investments. The views expressed herein represent those of the portfolio managers as of the date of this report and are subject to change at any time, based on market conditions and other factors. The Funds disclaim any obligation to advise shareholders of such changes.
Annual Report Page 2
Class A Shares—
Average Annual Total Returns as of 6/30/08
| 1-Year | 5-Year | 10-Year | ||||
Nuveen Multi-Manager Large-Cap Value Fund | -10.74% -15.86% | 10.04% 8.74% | 4.61% 3.99% | |||
Lipper Large-Cap Value Funds Index1 | -16.53% | 7.81% | 3.44% | |||
Russell 1000 Value Index2 | -18.78% | 8.92% | 4.91% | |||
S&P 500 Index3 | -13.12% | 7.58% | 2.88% | |||
Nuveen Balanced Municipal and Stock Fund | -6.23% -11.62% | 5.27% 4.03% | 2.93% 2.32% | |||
Lipper Mixed-Asset Target Allocation Moderate Funds Index4 | -5.58% | 6.70% | 4.37% | |||
Market Benchmark Index5 | -5.18% | 5.76% | 5.26% | |||
S&P 500 Index3 | -13.12% | 7.58% | 2.88% | |||
Nuveen Balanced Stock and Bond Fund | -6.31% -11.70% | 6.62% 5.36% | 4.52% 3.90% | |||
Lipper Mixed-Asset Target Allocation Growth Funds Index6 | -7.42% | 7.64% | 4.97% | |||
Market Benchmark Index7 | -7.98% | 6.93% | 5.39% | |||
S&P 500 Index3 | -13.12% | 7.58% | 2.88% | |||
Returns quoted represent past performance, which is no guarantee of future results. Returns at NAV would be lower if the sales charge were included. Current performance may be higher or lower than the performance shown. Investment returns and principal value will fluctuate so that when shares are redeemed, they may be worth more or less than their original cost. Class A shares have a 5.75% maximum sales charge. Returns do not reflect the deduction of taxes that a shareholder would pay on Fund distributions or the redemption of shares. For the most recent month-end performance, visit www.nuveen.com or call (800) 257-8787.
Please see each Fund’s Spotlight Page later in this report for more complete performance data and expense ratios.
| 1 | The Lipper Large-Cap Value Funds Index is a managed index that represents the average annualized total return of the 30 largest funds in the Lipper Large-Cap Value Funds category. The returns assume reinvestment of dividends and do not reflect any applicable sales charges. You cannot invest directly in an index. |
| 2 | The Russell 1000 Value Index is a market capitalization-weighted index of those firms in the Russell 1000 Index with lower price-to-book ratios and lower forecasted growth value. The index returns assume reinvestment of dividends and do not reflect any applicable sales charges. You cannot invest directly in an index. |
| 3 | The S&P 500 Index is an unmanaged index generally considered representative of the U.S. stock market. The index returns assume reinvestment of dividends and do not reflect any applicable sales charges. You cannot invest directly in an index. |
| 4 | The Lipper Mixed-Asset Target Allocation Moderate Funds Index is a managed index that represents the average annualized total return of the 10 largest funds in the Lipper Mixed-Asset Target Allocation Moderate Fund category. The returns assume reinvestment of dividends and do not reflect any applicable sales charges. You cannot invest directly in an index. |
| 5 | The Market Benchmark Index is comprised of a 40% weighting in the Russell 1000 Value Index and 60% in the Lehman Brothers 10-Year Municipal Bond Index. The Russell 1000 Value Index is a market capitalization-weighted index of those firms in the Russell 1000 Index with lower price-to-book ratios and lower forecasted growth value. The Lehman Brothers 10-Year Municipal Bond Index is an unmanaged index comprised of a broad range of investment-grade municipal bonds with maturities ranging from 8 to 12 years. The index returns assume reinvestment of dividends and do not reflect any applicable sales charges. You cannot invest directly in an index. |
| 6 | The Lipper Mixed-Asset Target Allocation Growth Funds Index is a managed index that represents the average annualized total returns of the 10 largest funds in the Lipper Mixed-Asset Target Allocation Growth Fund category. The returns assume reinvestment of dividends and do not reflect any applicable sales charges. You cannot invest directly in an index. |
| 7 | The Market Benchmark Index is comprised of a 60% weighting in the Russell 1000 Value Index and 40% in the Lehman Brothers Intermediate Treasury Index. The Russell 1000 Value Index is a market capitalization-weighted index of those firms in the Russell 1000 Index with lower price-to-book ratios and lower forecasted growth value. The Lehman Brothers Intermediate Treasury Index is an unmanaged index comprised of treasury securities with maturities ranging from 1-10 years. The returns assume reinvestment of dividends and do not reflect any applicable sales charges. You cannot invest directly in an index. |
Annual Report Page 3
difficulties. Lower-rated debt performed the worst, as investors remained concerned about taking on additional credit risk. Although market conditions stabilized for a time, volatility returned early in 2008, as hedge funds and other nontraditional municipal bond investors exited the market and several municipal bond insurers saw their credit rating downgraded. Between March and the end of the period, however, conditions in the municipal market slowly improved.
How did the Funds perform during the past twelve months ending June 30, 2008?
The table on page three provides performance information for the three Funds (Class A shares at net asset value) for the one-year period ended June 30, 2008. The table also compares the Funds’ performance to appropriate benchmarks.
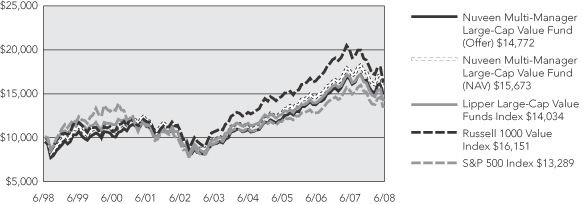
The Nuveen Multi-Manager Large-Cap Value Fund (Class A shares at net asset value) outpaced both the broad stock market, as measured by the S&P 500 Index, and the large-cap value Russell 1000 Value Index. Successful stock selection accounted for the Fund’s outperformance relative to the Russell Index.
During the reporting period, the Nuveen Multi-Manager Large-Cap Value Fund added two additional sub-advisers to the Fund, Symphony and HydePark. Each manager will maintain a strategic asset allocation of between 25% and 40% of the Fund’s net assets. This change is designed to provide greater diversification within the Fund’s portfolio, while offering the potential for improved risk-adjusted returns. In connection with the approval of the two new sub-advisers, Fund management has also agreed to lower the Fund’s management fees and to implement a cap on overall expense.
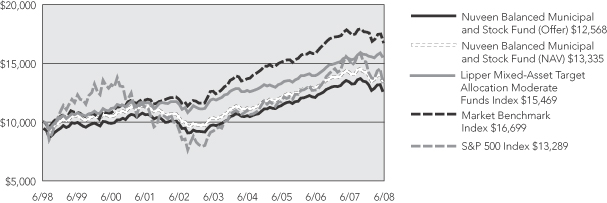
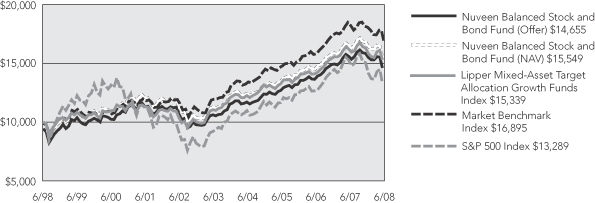
The Nuveen Balanced Municipal and Stock Fund (Class A shares at net asset value) modestly trailed its peer group, the Lipper Mixed-Asset Target Allocation Moderate Funds Index. In addition, the Fund underperformed its blended benchmark, the 40% Russell 1000 Value Index/60% Lehman Brothers 10-Year Municipal Bond Index. The Nuveen Balanced Stock and Bond Fund (Class A shares at net asset value) outperformed its peer group, the Lipper Mixed-Asset Target Allocation Moderate Funds Index, as well as its blended benchmark, the 60% Russell 1000 Value Index/40% Lehman Brothers Intermediate Treasury Index.
What was your strategy in managing the equity portion of the Funds?
ICAP
For the ICAP managed portions of the Nuveen Multi-Manager Large-Cap Value Fund, Nuveen Balanced Municipal and Stock Fund and Nuveen Balanced Stock and Bond Fund, we remained focused on bottom-up stock picking, meaning that we selected investments one-by-one based on our careful analysis. During the period, we focused on financially strong companies displaying catalysts that we believed could generate future share-price appreciation.
We found a variety of investment opportunities in the health care sector during the period. These stocks had favorable demographics, in the form of an aging population as well as a number of potentially profitable new drugs being brought to market. Conversely, we were reducing our exposure to the financial sector, which as a whole has been hampered by a slowing economy and an increased risk of sub-prime-mortgage-related losses. When we did invest in financials, we looked for companies with strong risk controls and relatively low exposure to sub-prime debt.
Relatively late in the period, we shifted some of our energy-sector investments away from companies primarily focused on exploration and production. Instead, we bought more integrated energy companies where we were able to find better value. Given the continued run-up in oil prices, many of our best-performing stocks were in the energy sector. Our top stock contributor was Occidental Petroleum, a mid-sized oil and natural gas exploration company that benefited from its strong cash flows and profitable growth in energy
Annual Report Page 4
production. Those same factors also boosted independent oil and gas producer XTO Energy. Global integrated oil company Hess Oil gained ground as well, rising on increased energy production and growth in oil reserves. Oil-field services company Baker Hughes has been successful in raising prices along with strong demand for its services. Elsewhere in the market, Australian metals and mining company Rio Tinto continued to benefit from sharply rising commodity prices worldwide. We sold our position in this stock in the fourth quarter of 2007 after it reached our target price.
In absolute terms, many of our weakest performers were financial stocks. Diversified financial services firm Citigroup suffered significant sub-prime-related losses. Investment bank Morgan Stanley also reported significant losses and declined sharply during the past year. Sub-prime losses as well as questions about its accounting statements pressured shares of insurance giant American International Group. Consumer credit card business Capital One declined as well, as investors worried about the potential impact of a declining economy on consumer spending. Of final note, conglomerate General Electric also detracted, with weaker-than-expected earnings reported in the first quarter of 2008 hampering the stock’s performance.
Symphony
Symphony began investment operations for the Nuveen Multi-Manager Large-Cap Value Fund near the middle of the reporting period on November 14, 2007. Fundamental to Symphony’s investment philosophy is the concept that both quantitative and qualitative methods have value. Quantitative methods are disciplined, constrained, and unaffected by emotion, whereas qualitative methods exploit the intuition, experience, and insights of skilled analysts and portfolio managers. Specifically, the quantitative screening process serves as the starting point in investment decision-making. It helps to simplify the often very complex portfolio construction process into a manageable problem. The qualitative process provides a systematic way of researching companies from a broad perspective, ensuring the stocks selected for the portfolio are attractive in all important respects. Specifically we continued to be very wary of the ongoing credit crisis and were under the opinion that there was no easy fix to the housing malaise, and continued home price depreciation. In addition we thought that leverage still needed to come out of the system and valuations continued to be moving targets. Therefore, we were very judicious in regards to financial stocks and companies with limited balance sheet flexibility.
Our performance was aided by three major sectors; financials, materials and energy. With regards to financials, being underweight investment banks, finance companies and large cap banks helped performance. The stocks we did own were not as impacted by the credit crisis such as Hudson City Bancorp and Western Union. In materials our stock selection was very strong leading us to select one of our largest holdings Mosaic Company, a fertilizer company which benefited from a generally strong environment for potash and fertilizer. In energy it was a similar story with strong stock selection led by Hess, Occidental Petroleum and Helmerich & Payne, all of which benefited from the sharp rise in oil prices. From a quantitative perspective our exposure to companies with stronger quality of earnings, higher earnings momentum and higher price to book ratios combined with less emphasis on dividend yields positively impacted performance.
Nasdaq was the largest detractor from our performance after the stock dropped sharply in the first six months of 2008. This holding was one of the best performing stocks in the comparative Index during the fourth quarter of 2007. Nasdaq was negatively impacted by the continued deleveraging in the financial community as worries that poor performance by hedge funds and investment banks would negatively impact future volumes and growth rates. We currently no longer hold Nasdaq, as we exited the position after the end of the reporting period.
Annual Report Page 5
HydePark
HydePark began investment operations for the Nuveen Multi-Manager Large-Cap Value Fund near the middle of the reporting period on November 14, 2007. The proprietary risk-controlled HydePark wealth creation model was used to manage the HydePark portion of the Fund during this time period. This model utilizes both fundamental and momentum-related criteria to create a portfolio designed to maximize the reward-to-risk ratio. The HydePark model does not incorporate qualitative data or inputs into the portfolio construction process. Therefore, no top-down or macro-economic “themes” influence how the HydePark model works. The HydePark model evaluates all the securities contained in the benchmark portfolio, the Russell 1000 Value Index, for possible inclusion in the HydePark model portfolio. The resultant HydePark portfolio typically contains a large number of holdings, by design. Each position can reflect a weighting that is over, under, or the same as that security’s weight in the benchmark portfolio. Consequently, the HydePark “favored” or “unfavored” segments of the market are reflected in the relative economic sector weights. From this economic sector-based attribution model, a comparison to the benchmark can be made. Our performance during the period since we began investment operations was hurt by an overweight in financials and performance was bolstered by an overweight to the energy sector and an underweight to the basic industries sector as compared to the benchmark.
How did you manage the municipal portion of the Balanced Municipal and Stock Fund?
In this unusually challenging environment for tax-exempt securities, we were generally favoring premium-coupon bonds of medium credit quality with relatively short effective maturities of 15 years and less. Premium-coupon bonds tend to be more defensive and less vulnerable to a potential increase in interest rates, which we saw as a possibility. As a result, we also kept the portfolio’s duration, meaning its sensitivity to changes in interest rates, relatively short throughout the past year. To fund new purchases, we were mostly using the proceeds of bond calls and redemptions that took place during the period.
How did you manage the Treasury portion of the Balanced Stock and Bond Fund?
The Fund’s fixed-income portfolio, which consists entirely of U.S. Treasury securities of varying maturities, was managed conservatively during the past year. In June 2008, when the yield on the 10-year Treasury note moved above 4 percent, we lengthened the portfolio’s average maturity to take advantage of price weakness in the bond market. However, the portfolio’s interest rate sensitivity generally remained relatively low, in part because we believed that inflation concerns could limit the potential for additional Fed rate decreases.
Dividend Information
The Nuveen Balanced Municipal and Stock Fund seeks to pay dividends at a rate that reflects the past and projected performance of the Fund. To permit the Fund to maintain a more stable dividend, the Fund may pay dividends at a rate that may be more or less than the amount of net investment income actually earned by the Fund during the period. If the Fund has cumulatively earned more than it has paid in dividends, it will hold the excess in reserve as undistributed net investment income (UNII) as part of the Fund’s net asset value. Conversely, if the Fund has cumulatively paid out dividends more than it has earned, the excess will constitute negative UNII, which will likewise be reflected in the Fund’s net asset value. The Fund will, over time, pay all its net investment income as dividends to shareholders. As of June 30, 2008, the Nuveen Balanced Municipal and Stock Fund had a positive UNII balance for both tax and financial statement purposes.
Annual Report Page 6
Nuveen Multi-Manager Large-Cap Value Fund
Growth of an Assumed $10,000 Investment
Nuveen Balanced Municipal and Stock Fund (currently known as Nuveen Conservative Allocation Fund)
Growth of an Assumed $10,000 Investment
The graphs do not reflect the deduction of taxes that a shareholder may pay on Fund distributions or the redemption of shares.
The index comparisons show the change in value of a $10,000 investment in the Class A shares of the Nuveen Funds compared with the corresponding indexes. The Lipper Large-Cap Value Funds Index is a managed index that represents the average annualized total returns of the 30 largest funds in the Lipper Large-Cap Value Funds category. The Russell 1000 Value Index is a market capitalization-weighted index of those firms in the Russell 1000 Index with lower price-to-book ratios and lower forecasted growth value. The S&P 500 Index is an unmanaged index generally considered to be representative of the U.S. stock market. The Lipper Mixed-Asset Target Allocation Moderate Funds Index is a managed index that represents the average annualized total returns of the 10 largest funds in the Lipper Mixed-Asset Target Allocation Moderate Funds category. The Market Benchmark Index is comprised of a 40% weighting in the Russell 1000 Value Index and 60% in the Lehman Brothers 10-Year Municipal Bond Index. The Lehman Brothers 10-Year Municipal Bond Index is an unmanaged index comprised of a broad range of investment-grade municipal bonds with maturities ranging from 8 to 12 years. The index returns assume reinvestment of dividends and do not reflect any initial or ongoing expenses. You cannot invest directly in an index. The Nuveen Funds’ total returns include reinvestment of all dividends and distributions, and the Funds’ total returns at the offer price depicted in the chart reflects the initial maximum sales charge applicable to A shares (5.75%) and all ongoing Fund expenses. The performance data quoted represents past performance, which is not indicative of future results. Current performance may be lower or higher than the performance shown.
Annual Report Page 7
Nuveen Balanced Stock and Bond Fund (currently known as Nuveen Moderate Allocation Fund)
Growth of an Assumed $10,000 Investment
The graph does not reflect the deduction of taxes that a shareholder may pay on Fund distributions or the redemption of shares.
The index comparisons show the change in value of a $10,000 investment in the Class A shares of the Nuveen Fund compared with the corresponding indexes. The Lipper Mixed-Asset Target Allocation Growth Funds Index is a managed index that represents the average annualized total returns of the 10 largest funds in the Lipper Mixed-Asset Target Allocation Growth Funds category. The Market Benchmark Index is comprised of a 60% weighting in the Russell 1000 Value Index and 40% in the Lehman Brothers Intermediate Treasury Index. The Russell 1000 Value Index is a market capitalization-weighted index of those firms in the Russell 1000 Index with lower price-to-book ratios and lower forecasted growth value. The Lehman Brothers Intermediate Treasury Index is an unmanaged index comprised of treasury securities with maturities ranging from 1-10 years. The S&P 500 Index is an unmanaged index generally considered to be representative of the U.S. stock market. The index returns assume reinvestment of dividends and do not reflect any initial or ongoing expenses. You cannot invest directly in an index. The Nuveen Fund’s total returns include reinvestment of all dividends and distributions, and the Fund’s total return at the offer price depicted in the chart reflects the initial maximum sales charge applicable to A shares (5.75%) and all ongoing Fund expenses. The performance data quoted represents past performance, which is not indicative of future results. Current performance may be lower or higher than the performance shown.
Annual Report Page 8
Fund Spotlight as of 6/30/08 Nuveen Multi-Manager Large-Cap Value Fund
| Quick Facts | ||||||||
| A Shares | B Shares1 | C Shares | I Shares1 | |||||
Fund Symbol | NNGAX | NNGBX | NNGCX | NNGRX | ||||
NAV | $22.53 | $21.90 | $21.86 | $22.64 | ||||
Latest Capital Gain Distribution2 | $3.3835 | $3.3835 | $3.3835 | $3.3835 | ||||
Latest Ordinary Income Distribution3 | $1.3036 | $1.0825 | $1.0823 | $1.3783 | ||||
Inception Date | 8/07/96 | 8/07/96 | 8/07/96 | 8/07/96 |
Returns quoted represent past performance which is no guarantee of future performance. Returns without sales charges would be lower if the sales charge were included. Current performance may be higher or lower than the performance shown. Investment returns and principal value will fluctuate so that when shares are redeemed, they may be worth more or less than their original cost. Returns do not reflect the deduction of taxes that a shareholder would pay on Fund distributions or the redemption of shares. For the most recent month-end performance visit www.nuveen.com or call (800) 257-8787.
Fund returns assume reinvestment of dividends and capital gains. Class A shares have a 5.75% maximum sales charge. Class B shares have a contingent deferred sales charge (CDSC), also known as a back-end sales charge, that for redemptions begins at 5% and declines periodically until after 6 years when the charge becomes 0%. Class B shares automatically convert to Class A shares eight years after purchase. Class C shares have a 1% CDSC for redemptions within less than one year, which is not reflected in the one-year total return. Class I shares have no sales charge and may be purchased under limited circumstances or by specified classes of investors. Returns may reflect a voluntary expense limitation by the Fund’s investment adviser which may be modified or discontinued at any time without notice.
| Average Annual Total Returns as of 6/30/08 | ||||
| A Shares | NAV | Offer | ||
1-Year | -10.74% | -15.86% | ||
5-Year | 10.04% | 8.74% | ||
10-Year | 4.61% | 3.99% | ||
| B Shares | w/o CDSC | w/CDSC | ||
1-Year | -11.39% | -14.38% | ||
5-Year | 9.20% | 9.06% | ||
10-Year | 3.99% | 3.99% | ||
| C Shares | NAV | |||
1-Year | -11.41% | |||
5-Year | 9.22% | |||
10-Year | 3.83% | |||
| I Shares | NAV | |||
1-Year | -10.52% | |||
5-Year | 10.31% | |||
10-Year | 4.88% | |||
| Top Five Common Stock Holdings4 | ||
AT&T Inc. | 3.7% | |
Chevron Corporation | 2.9% | |
Exxon Mobil Corporation | 2.7% | |
JPMorgan Chase & Co. | 2.4% | |
General Electric Company | 2.1% | |
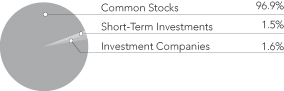
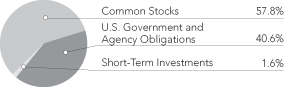
Portfolio Allocation4
| Portfolio Statistics | ||
Net Assets ($000) | $446,822 | |
Number of Stocks | 660 | |
| Expense Ratios | ||||||
| Share Class | Gross Expense Ratios | Net Expense Ratios | As of Date | |||
Class A | 1.15% | 1.15% | 11/14/07 | |||
Class B | 1.90% | 1.90% | 11/14/07 | |||
Class C | 1.90% | 1.90% | 11/14/07 | |||
Class I | 0.90% | 0.90% | 11/14/07 | |||
The expense ratios shown factor in Total Annual Fund Operating Expenses including management fees and other fees and expenses. The Gross Expense Ratios and Net Expense Ratios were restated to reflect current expenses as if such expenses had been in effect during the previous fiscal year, and to better reflect the expected ratios of the Fund for the current fiscal year. These expense ratios may vary from the expense ratios shown elsewhere in this report.
| 1 | Effective May 1, 2008 Class B Shares will only be issued upon exchange of Class B Shares from another Nuveen Fund or for purposes of dividend reinvestment. Effective December 31, 2008 the reinstatement privilege for Class B Shares will no longer be available. Effective May 1, 2008, Class R Shares were renamed Class I Shares. See the Fund’s prospectus for more information. |
| 2 | Paid December 17, 2007. |
| 3 | Ordinary income distribution consists of short-term capital gains paid on December 17, 2007 and ordinary income paid on December 31, 2007. |
| 4 | As a percentage of total investments as of June 30, 2008. Holdings are subject to change. |
Annual Report Page 9
Fund Spotlight as of 6/30/08 Nuveen Multi-Manager Large-Cap Value Fund
| Industries1 | ||
Oil, Gas & Consumable Fuels | 16.2% | |
Capital Markets | 7.2% | |
Pharmaceuticals | 6.2% | |
Insurance | 5.7% | |
Commercial Banks | 5.0% | |
Diversified Telecommunication Services | 4.8% | |
Chemicals | 4.1% | |
Media | 3.8% | |
Electric Utilities | 3.3% | |
Industrial Conglomerates | 3.1% | |
Energy Equipment & Services | 2.8% | |
Food & Staples Retailing | 2.5% | |
Metals & Mining | 2.3% | |
Computers & Peripherals | 2.2% | |
Beverages | 2.1% | |
Road & Rail | 2.0% | |
Household Products | 1.9% | |
Diversified Financial Services | 1.7% | |
Tobacco | 1.6% | |
Multi-Utilities | 1.6% | |
Communications Equipment | 1.5% | |
Consumer Finance | 1.4% | |
Gas Utilities | 1.2% | |
Food Products | 1.1% | |
Other | 14.7% |
| 1 | As a percentage of total common stocks as of June 30, 2008. Holdings are subject to change. |
Expense Example (Unaudited)
As a shareholder of the Fund, you incur two types of costs: (1) transaction costs, including front and back end sales charges (loads) or redemption fees, where applicable; and (2) ongoing costs, including management fees; distribution and service (12b-1) fees, where applicable; and other Fund expenses. This Example is intended to help you understand your ongoing costs (in dollars) of investing in the Fund and to compare these costs with the ongoing costs of investing in other mutual funds.
The Example below is based on an investment of $1,000 invested at the beginning of the period and held for the period.
The information under “Actual Performance,” together with the amount you invested, allows you to estimate actual expenses incurred over the reporting period. Simply divide your account value by $1,000 (for example, an $8,600 account value divided by $1,000 = 8.60) and multiply the result by the cost shown for your share class, in the row entitled “Expenses Incurred During Period” to estimate the expenses incurred on your account during this period.
The information under “Hypothetical Performance,” provides information about hypothetical account values and hypothetical expenses based on the Fund’s actual expense ratio and an assumed rate of return of 5% per year before expenses, which is not the Fund’s actual return. The hypothetical account values and expenses may not be used to estimate the actual ending account balance or expense you incurred for the period. You may use this information to compare the ongoing costs of investing in the Fund and other Funds. To do so, compare this 5% hypothetical example with the 5% hypothetical examples that appear in the shareholder reports of the other funds.
Please note that the expenses shown in the table are meant to highlight your ongoing costs only and do not reflect any transactional costs, such as front and back end sales charges (loads) or redemption fees, where applicable. Therefore, the hypothetical information is useful in comparing ongoing costs only, and will not help you determine the relative total costs of owning different funds or share classes. In addition, if these transactional costs were included, your costs would have been higher.
| Hypothetical Performance | ||||||||||||||||||||||||||
| Actual Performance | (5% return before expenses) | |||||||||||||||||||||||||
| A Shares | B Shares | C Shares | I Shares | A Shares | B Shares | C Shares | I Shares | |||||||||||||||||||
Beginning Account Value (1/01/08) | $ | 1,000.00 | $ | 1,000.00 | $ | 1,000.00 | $ | 1,000.00 | $ | 1,000.00 | $ | 1,000.00 | $ | 1,000.00 | $ | 1,000.00 | ||||||||||
Ending Account Value (6/30/08) | $ | 900.50 | $ | 897.20 | $ | 897.00 | $ | 901.60 | $ | 1,018.75 | $ | 1,015.02 | $ | 1,015.02 | $ | 1,019.99 | ||||||||||
Expenses Incurred During Period | $ | 5.81 | $ | 9.34 | $ | 9.34 | $ | 4.63 | $ | 6.17 | $ | 9.92 | $ | 9.92 | $ | 4.92 | ||||||||||
For each class of the Fund, expenses are equal to the Fund’s annualized expense ratio of 1.23%, 1.98%, 1.98% and 0.98% for Classes A, B, C and I, respectively, multiplied by the average account value over the period, multiplied by 182/366 (to reflect the one-half year period).
Annual Report Page 10
Fund Spotlight as of 6/30/08 Nuveen Balanced Municipal and Stock Fund
(currently known as Nuveen Conservative Allocation Fund)
| Quick Facts | ||||||||
| A Shares | B Shares1 | C Shares | I Shares1 | |||||
Fund Symbols | NBMSX | NMNBX | NBMCX | NMNRX | ||||
NAV | $22.84 | $24.43 | $24.39 | $22.24 | ||||
Latest Dividend2 | $0.0430 | $0.0340 | $0.0340 | $0.0455 | ||||
Latest Capital Gain Distribution3 | $0.6451 | $0.6451 | $0.6451 | $0.6451 | ||||
Latest Ordinary Income Distribution4 | $0.2387 | $0.0711 | $0.0711 | $0.2971 | ||||
Inception Date | 8/07/96 | 8/07/96 | 8/07/96 | 8/07/96 |
Returns quoted represent past performance which is no guarantee of future performance. Returns without sales charges would be lower if the sales charge were included. Current performance may be higher or lower than the performance shown. Investment returns and principal value will fluctuate so that when shares are redeemed, they may be worth more or less than their original cost. Returns do not reflect the deduction of taxes that a shareholder would pay on Fund distributions or the redemption of shares. For the most recent month-end performance visit www.nuveen.com or call (800) 257-8787.
Fund returns assume reinvestment of dividends and capital gains. Class A shares have a 5.75% maximum sales charge. Class B shares have a contingent deferred sales charge (CDSC), also known as a back-end sales charge, that for redemptions begins at 5% and declines periodically until after 6 years when the charge becomes 0%. Class B shares automatically convert to Class A shares eight years after purchase. Class C shares have a 1% CDSC for redemptions within less than one year, which is not reflected in the one-year total return. Class I shares have no sales charge and may be purchased under limited circumstances or by specified classes of investors. Returns may reflect a voluntary expense limitation by the Fund’s investment adviser which may be modified or discontinued at any time without notice.
| Average Annual Total Returns as of 6/30/08 | ||||
| A Shares | NAV | Offer | ||
1-Year | -6.23% | -11.62% | ||
5-Year | 5.27% | 4.03% | ||
10-Year | 2.93% | 2.32% | ||
| B Shares | w/o CDSC | w/CDSC | ||
1-Year | -6.90% | -10.47% | ||
5-Year | 4.49% | 4.33% | ||
10-Year | 2.32% | 2.32% | ||
| C Shares | NAV | |||
1-Year | -6.94% | |||
5-Year | 4.48% | |||
10-Year | 2.16% | |||
| I Shares | NAV | |||
1-Year | -5.99% | |||
5-Year | 5.54% | |||
10-Year | 3.19% | |||
| Bond Credit Quality6,8 | ||||
AAA/U.S. Guaranteed | 23.9% | |||
AA | 46.8% | |||
A | 5.9% | |||
BBB | 20.0% | |||
BB or Lower | 1.4% | |||
N/R | 2.0% | |||
| Expense Ratios | ||||||
| Share Class | Gross Expense Ratios | Net Expense Ratios | As of Date | |||
Class A | 1.22% | 1.19% | 6/30/07 | |||
Class B | 1.98% | 1.95% | 6/30/07 | |||
Class C | 1.97% | 1.94% | 6/30/07 | |||
Class I | 0.97% | 0.94% | 6/30/07 | |||
The expense ratios shown factor in Total Annual Fund Operating Expenses including management fees and other fees and expenses. The Net Expense Ratios reflect a custodian fee credit from the custodian bank whereby certain fees and expenses are reduced by credits earned of the Fund’s cash on deposit with the bank. There is no guarantee that the Fund will earn such credits in the future. Absent the credit, the Net Expense Ratios would be higher and total returns would be less.
| Yields5 | ||||
| A Shares | NAV | Offer | ||
SEC 30-Day Yield | 2.81% | 2.69% | ||
Distribution Rate | 3.90% | 3.74% | ||
| B Shares | NAV | |||
30-Day Yield | 2.10% | |||
Distribution Rate | 2.92% | |||
| C Shares | NAV | |||
30-Day Yield | 2.05% | |||
Distribution Rate | 2.85% | |||
| I Shares | NAV | |||
SEC 30-Day Yield | 3.06% | |||
Distribution Rate | 4.25% | |||
Portfolio Allocation7

| Portfolio Statistics | ||
Net Assets ($000) | $65,819 | |
Number of Common Stocks | 41 | |
Average Duration (Municipal Bonds) | 5.43 | |
| Top Five Common Stock Holdings7 | ||
Wyeth | 1.9% | |
AT&T Inc. | 1.8% | |
E.I. Du Pont de Nemours and Company | 1.6% | |
JPMorgan Chase & Co. | 1.5% | |
Exxon Mobile Corporation | 1.4% |
These Fund Spotlight pages reflect the performance for the Nuveen Balanced Municipal and Stock Fund as of and for the fiscal year ended June 30, 2008.
| 1 | Effective May 1, 2008 Class B Shares will only be issued upon exchange of Class B Shares from another Nuveen Fund or for purposes of dividend reinvestment. Effective December 31, 2008 the reinstatement privilege for Class B Shares will no longer be available. Effective May 1, 2008, Class R Shares were renamed Class I Shares. See the Fund’s prospectus for more information. |
| 2 | Paid July 1, 2008. This is the latest monthly tax-exempt dividend declared during the period ended June 30, 2008. Income is generally exempt from regular federal income taxes. Income may be subject to state and local taxes and to the federal alternative minimum tax. Capital gains, if any, are subject to tax. |
| 3 | Paid December 17, 2007. |
| 4 | Ordinary income distribution consists of short-term capital gains paid December 17, 2007 and ordinary income paid on December 31, 2007, if any. |
| 5 | Distribution Rate Yields may differ from SEC 30-Day Yields due to, among other factors, amortization of post-purchase bond premiums and differences between portfolio earnings and distribution rates. |
| 6 | As a percentage of total municipal bond holdings as of June 30, 2008. Holdings are subject to change. |
| 7 | As a percentage of total investments as of June 30, 2008. Holdings are subject to change. |
| 8 | The percentages shown in the foregoing chart may reflect the ratings on certain bonds insured by AMBAC, FGIC, MBIA, RAAI and XLCA as of June 30, 2008. Please see the Managers’ Commentary for an expanded discussion on the affect on the Fund of changes to the ratings of certain bonds in the portfolio resulting from changes to the ratings of the underlying insurers both during the period and after period end. |
Annual Report Page 11
Fund Spotlight as of 6/30/08 Nuveen Balanced Municipal and Stock Fund
(currently known as Nuveen Conservative Allocation Fund)
| Industries1 Common Stocks: | ||
Oil, Gas & Consumable Fuels | 5.0% | |
Pharmaceuticals | 4.1% | |
Capital Markets | 4.0% | |
Media | 2.8% | |
Industrial Conglomerates | 2.5% | |
Insurance | 1.8% | |
Diversified Telecommunication Services | 1.8% | |
Chemicals | 1.6% | |
Wireless Telecommunication Services | 1.4% | |
Other | 14.4% |
| Industries1 Municipal Bonds: | ||
U.S. Guaranteed | 11.5% | |
Tax Obligation/Limited | 11.2% | |
Health Care | 10.5% | |
Transportation | 5.6% | |
Tax Obligation/General | 5.5% | |
Utilities | 4.4% | |
Education and Civic Organizations | 3.8% | |
Consumer Staples | 3.8% | |
Long-Term Care | 2.9% | |
Water and Sewer | 0.8% | |
Housing/Single Family | 0.6% |
| 1 | As a percentage of total investments as of June 30, 2008. Holdings are subject to change. |
Expense Example (Unaudited)
As a shareholder of the Fund, you incur two types of costs: (1) transaction costs, including front and back end sales charges (loads) or redemption fees, where applicable; and (2) ongoing costs, including management fees; distribution and service (12b-1) fees, where applicable; and other Fund expenses. This Example is intended to help you understand your ongoing costs (in dollars) of investing in the Fund and to compare these costs with the ongoing costs of investing in other mutual funds.
The Example below is based on an investment of $1,000 invested at the beginning of the period and held for the period.
The information under “Actual Performance,” together with the amount you invested, allows you to estimate actual expenses incurred over the reporting period. Simply divide your account value by $1,000 (for example, an $8,600 account value divided by $1,000 = 8.60) and multiply the result by the cost shown for your share class, in the row entitled “Expenses Incurred During Period” to estimate the expenses incurred on your account during this period.
The information under “Hypothetical Performance,” provides information about hypothetical account values and hypothetical expenses based on the Fund’s actual expense ratio and an assumed rate of return of 5% per year before expenses, which is not the Fund’s actual return. The hypothetical account values and expenses may not be used to estimate the actual ending account balance or expense you incurred for the period. You may use this information to compare the ongoing costs of investing in the Fund and other Funds. To do so, compare this 5% hypothetical example with the 5% hypothetical examples that appear in the shareholder reports of the other funds.
Please note that the expenses shown in the table are meant to highlight your ongoing costs only and do not reflect any transactional costs, such as front and back end sales charges (loads) or redemption fees, where applicable. Therefore, the hypothetical information is useful in comparing ongoing costs only, and will not help you determine the relative total costs of owning different funds or share classes. In addition, if these transactional costs were included, your costs would have been higher.
| Hypothetical Performance | ||||||||||||||||||||||||||
| Actual Performance | (5% return before expenses) | |||||||||||||||||||||||||
| A Shares | B Shares | C Shares | I Shares | A Shares | B Shares | C Shares | I Shares | |||||||||||||||||||
Beginning Account Value (1/01/08) | $ | 1,000.00 | $ | 1,000.00 | $ | 1,000.00 | $ | 1,000.00 | $ | 1,000.00 | $ | 1,000.00 | $ | 1,000.00 | $ | 1,000.00 | ||||||||||
Ending Account Value (6/30/08) | $ | 937.10 | $ | 933.90 | $ | 933.80 | $ | 938.10 | $ | 1,019.05 | $ | 1,015.32 | $ | 1,015.32 | $ | 1,020.29 | ||||||||||
Expenses Incurred During Period | $ | 5.64 | $ | 9.23 | $ | 9.23 | $ | 4.43 | $ | 5.87 | $ | 9.62 | $ | 9.62 | $ | 4.62 | ||||||||||
For each class of the Fund, expenses are equal to the Fund’s annualized expense ratio of 1.17%,1.92%, 1.92% and .92% for Classes A, B, C and I, respectively, multiplied by the average account value over the period, multiplied by 182/366 (to reflect the one-half year period).
Annual Report Page 12
Fund Spotlight as of 6/30/08 Nuveen Balanced Stock and Bond Fund
(currently known as Nuveen Moderate Allocation Fund)
| Quick Facts | ||||||||
| A Shares | B Shares1 | C Shares | I Shares1 | |||||
Fund Symbols | NNSAX | NNSBX | NUVCX | NNSRX | ||||
NAV | $22.35 | $22.35 | $22.37 | $22.35 | ||||
Latest Capital Gain Distribution2 | $1.8231 | $1.8231 | $1.8231 | $1.8231 | ||||
Latest Ordinary Income Distribution3 | $0.6407 | $0.5904 | $0.5905 | $0.6574 | ||||
Inception Date | 8/07/96 | 8/07/96 | 8/07/96 | 8/07/96 |
Returns quoted represent past performance which is no guarantee of future performance. Returns without sales charges would be lower if the sales charge were included. Current performance may be higher or lower than the performance shown. Investment returns and principal value will fluctuate so that when shares are redeemed, they may be worth more or less than their original cost. Returns do not reflect the deduction of taxes that a shareholder would pay on Fund distributions or the redemption of shares. For the most recent month-end performance visit www.nuveen.com or call (800) 257-8787.
Fund returns assume reinvestment of dividends and capital gains. Class A shares have a 5.75% maximum sales charge. Class B shares have a contingent deferred sales charge (CDSC), also known as a back-end sales charge, that for redemptions begins at 5% and declines periodically until after 6 years when the charge becomes 0%. Class B shares automatically convert to Class A shares eight years after purchase. Class C shares have a 1% CDSC for redemptions within less than one year, which is not reflected in the one-year total return. Class I shares have no sales charge and may be purchased under limited circumstances or by specified classes of investors. Returns may reflect a voluntary expense limitation by the Fund’s investment adviser which may be modified or discontinued at any time without notice.
| Average Annual Total Returns as of 6/30/08 | ||||
| A Shares | NAV | Offer | ||
1-Year | -6.31% | -11.70% | ||
5-Year | 6.62% | 5.36% | ||
10-Year | 4.52% | 3.90% | ||
| B Shares | w/o CDSC | w/CDSC | ||
1-Year | -7.02% | -10.36% | ||
5-Year | 5.83% | 5.67% | ||
10-Year | 3.88% | 3.88% | ||
| C Shares | NAV | |||
1-Year | -7.01% | |||
5-Year | 5.83% | |||
10-Year | 3.75% | |||
| I Shares | NAV | |||
1-Year | -6.07% | |||
5-Year | 6.88% | |||
10-Year | 4.78% | |||
| Top Five Common Stock Holdings4 | ||
Wyeth | 2.7% | |
AT&T Inc. | 2.7% | |
E.I. Du Pont de Nemours and Company | 2.3% | |
JPMorgan Chase & Co. | 2.2% | |
Exxon Mobile Corporation | 2.1% | |
| Expense Ratios | ||||||
| Share Class | Gross Expense Ratios | Net Expense Ratios | As of Date | |||
Class A | 1.26% | 1.24% | 6/30/07 | |||
Class B | 2.02% | 1.99% | 6/30/07 | |||
Class C | 2.01% | 1.99% | 6/30/07 | |||
Class I | 1.01% | 0.99% | 6/30/07 | |||
The expense ratios shown factor in Total Annual Fund Operating Expenses including management fees and other fees and expenses. The Net Expense Ratios reflect a voluntary commitment by the Fund’s investment adviser to waive fees and reimburse expenses through October 31, 2008. Absent the waiver, the Net Expense Ratios would be higher and the total returns would be less.
| Yields5 | ||||
| A Shares | NAV | Offer | ||
SEC 30-Day Yield | 1.77% | 1.70% | ||
Distribution Rate | 2.46% | 2.36% | ||
| B Shares | NAV | |||
30-Day Yield | 1.00% | |||
Distribution Rate | 1.39% | |||
| C Shares | NAV | |||
30-Day Yield | 1.00% | |||
Distribution Rate | 1.39% | |||
| I Shares | NAV | |||
SEC 30-Day Yield | 2.03% | |||
Distribution Rate | 2.82% | |||
Portfolio Allocation4
| Portfolio Statistics | ||
Net Assets ($000) | $52,075 | |
Number of Common Stocks | 41 | |
Average Duration (Bonds) | 4.70 | |
These Fund Spotlight pages reflect the performance for the Nuveen Balanced Stock and Bond Fund as of and for the fiscal year ended June 30, 2008.
| 1 | Effective May 1, 2008 Class B Shares will only be issued upon exchange of Class B Shares from another Nuveen Fund or for purposes of dividend reinvestment. Effective December 31, 2008 the reinstatement privilege for Class B Shares will no longer be available. Effective May 1, 2008, Class R Shares were renamed Class I Shares. See the Fund’s prospectus for more information. |
| 2 | Paid December 17, 2007. |
| 3 | Ordinary income distribution consists of short-term capital gains paid on December 17, 2007, and ordinary income paid on December 31, 2007. |
| 4 | As a percentage of total investments as of June 30, 2008. Holdings are subject to change. |
| 5 | Distribution Rate Yields may differ from SEC 30-Day Yields due to, among other factors, amortization of post-purchase bond premiums and differences between portfolio earnings and distribution rates. |
Annual Report Page 13
Fund Spotlight as of 6/30/08 Nuveen Balanced Stock and Bond Fund
(currently known as Nuveen Moderate Allocation Fund)
| Industries1 | ||
U.S. Treasury Notes | 23.7% | |
U.S. Treasury Bonds | 16.9% | |
Oil, Gas & Consumable Fuels | 7.3% | |
Pharmaceuticals | 6.0% | |
Capital Markets | 5.8% | |
Media | 4.1% | |
Industrial Conglomerates | 3.7% | |
Insurance | 2.7% | |
Diversified Telecommunication Services | 2.7% | |
Chemicals | 2.3% | |
Wireless Telecommunication Services | 2.0% | |
Computer & Peripherals | 2.0% | |
Commercial Banks | 2.0% | |
Beverages | 1.9% | |
Energy Equipment & Services | 1.8% | |
Short-Term Investments | 1.6% | |
Other | 13.5% |
| 1 | As a percentage of total investments as of June 30, 2008. Holdings are subject to change. |
Expense Example (Unaudited)
As a shareholder of the Fund, you incur two types of costs: (1) transaction costs, including front and back end sales charges (loads) or redemption fees, where applicable; and (2) ongoing costs, including management fees; distribution and service (12b-1) fees, where applicable; and other Fund expenses. This Example is intended to help you understand your ongoing costs (in dollars) of investing in the Fund and to compare these costs with the ongoing costs of investing in other mutual funds.
The Example below is based on an investment of $1,000 invested at the beginning of the period and held for the period.
The information under “Actual Performance,” together with the amount you invested, allows you to estimate actual expenses incurred over the reporting period. Simply divide your account value by $1,000 (for example, an $8,600 account value divided by $1,000 = 8.60) and multiply the result by the cost shown for your share class, in the row entitled “Expenses Incurred During Period” to estimate the expenses incurred on your account during this period.
The information under “Hypothetical Performance,” provides information about hypothetical account values and hypothetical expenses based on the Fund’s actual expense ratio and an assumed rate of return of 5% per year before expenses, which is not the Fund’s actual return. The hypothetical account values and expenses may not be used to estimate the actual ending account balance or expense you incurred for the period. You may use this information to compare the ongoing costs of investing in the Fund and other Funds. To do so, compare this 5% hypothetical example with the 5% hypothetical examples that appear in the shareholder reports of the other funds.
Please note that the expenses shown in the table are meant to highlight your ongoing costs only and do not reflect any transactional costs, such as front and back end sales charges (loads) or redemption fees, where applicable. Therefore, the hypothetical information is useful in comparing ongoing costs only, and will not help you determine the relative total costs of owning different funds or share classes. In addition, if these transactional costs were included, your costs would have been higher.
| Hypothetical Performance | ||||||||||||||||||||||||||
| Actual Performance | (5% return before expenses) | |||||||||||||||||||||||||
| A Shares | B Shares | C Shares | I Shares | A Shares | B Shares | C Shares | I Shares | |||||||||||||||||||
Beginning Account Value (1/01/08) | $ | 1,000.00 | $ | 1,000.00 | $ | 1,000.00 | $ | 1,000.00 | $ | 1,000.00 | $ | 1,000.00 | $ | 1,000.00 | $ | 1,000.00 | ||||||||||
Ending Account Value (6/30/08) | $ | 922.80 | $ | 919.30 | $ | 919.30 | $ | 924.00 | $ | 1,018.70 | $ | 1,014.97 | $ | 1,014.97 | $ | 1,019.94 | ||||||||||
Expenses Incurred During Period | $ | 5.93 | $ | 9.50 | $ | 9.50 | $ | 4.74 | $ | 6.22 | $ | 9.97 | $ | 9.97 | $ | 4.97 | ||||||||||
For each class of the Fund, expenses are equal to the Fund’s annualized expense ratio of 1.24%, 1.99%, 1.99% and 0.99% for Classes A, B, C and I, respectively, multiplied by the average account value over the period, multiplied by 182/366 (to reflect the one-half year period).
Annual Report Page 14
Shareholder
Meeting Report
The special meeting of shareholders for Nuveen Balanced Municipal and Stock Fund (currently known as Nuveen Conservative Allocation Fund) and Nuveen Balanced Stock and Bond Fund (currently known as Nuveen Moderate Allocation Fund) was held in the offices of Nuveen Investments on June 23, 2008.
| Municipal and Stock (1) | Stock and Bond (2) | |||
To approve a new sub-advisory agreement between Nuveen Asset Management (NAM) and Richards & Tierney, Inc.: | ||||
For | 1,510,348 | 1,226,870 | ||
Against | 97,661 | 33,460 | ||
Abstain | 84,113 | 43,484 | ||
Total | 1,692,122 | 1,303,814 | ||
To approve a change to the Funds’ investment objectives: | ||||
For | 1,486,578 | 1,222,851 | ||
Against | 128,253 | 37,148 | ||
Abstain | 77,291 | 43,815 | ||
Total | 1,692,122 | 1,303,814 | ||
To approve a change to the Funds’ diversification policies: | ||||
For | 1,493,278 | 1,219,527 | ||
Against | 127,281 | 44,436 | ||
Abstain | 71,563 | 39,851 | ||
Total | 1,692,122 | 1,303,814 | ||
| To approve the elimination of the following fundamental investment policies: (i) to purchase only quality municipal bonds that are either rated investment grade (AAA/Aaa to BBB/Baa) by at least one independent rating agency at the time of purchase or are non-rated but judged to be investment grade by NAM; and (ii) to not invest more than 20% of the Fund’s municipal investments in non-rated municipal bonds judged to be investment grade by NAM: | ||||
For | 1,479,075 | — | ||
Against | 129,413 | — | ||
Abstain | 83,634 | — | ||
Total | 1,692,122 | — | ||
| (1) | Effective July 7, 2008, the Nuveen Balanced Municipal and Stock Fund changed its name to Nuveen Conservative Allocation Fund. |
| (2) | Effective August 1, 2008, the Nuveen Balanced Stock and Bond Fund changed its name to Nuveen Moderate Allocation Fund. |
15
Portfolio of Investments
Nuveen Multi-Manager Large-Cap Value Fund
June 30, 2008
| Shares | Description (1) | Value | |||
| COMMON STOCKS – 96.6% | |||||
| Aerospace & Defense – 0.7% | |||||
| 500 | Alliant Techsystems Inc., (2) | $ | 50,840 | ||
| 100 | BE Aerospace Inc., (2) | 2,331 | |||
| 1,000 | DRS Technologies Inc. | 78,720 | |||
| 5,700 | General Dynamics Corporation | 479,940 | |||
| 30,250 | Honeywell International Inc. | 1,520,970 | |||
| 300 | L-3 Communications Holdings, Inc. | 27,261 | |||
| 5,200 | Northrop Grumman Corporation | 347,880 | |||
| 5,500 | Raytheon Company | 309,540 | |||
| 3,000 | Spirit AeroSystems Holdings Inc., (2) | 57,540 | |||
| 6,100 | United Technologies Corporation | 376,370 | |||
Total Aerospace & Defense | 3,251,392 | ||||
| Air Freight & Logistics – 0.3% | |||||
| 14,420 | FedEx Corporation | 1,136,152 | |||
| 100 | UTI Worldwide, Inc. | 1,995 | |||
Total Air Freight & Logistics | 1,138,147 | ||||
| Airlines – 0.1% | |||||
| 3,400 | Continental Airlines, inc., (2) | 34,374 | |||
| 300 | Copa Holdings SA | 8,448 | |||
| 12,300 | Delta Air Lines, Inc. | 70,110 | |||
| 700 | Northwest Airlines Corporation, (2) | 4,662 | |||
| 11,400 | Southwest Airlines Co. | 148,656 | |||
Total Airlines | 266,250 | ||||
| Auto Components – 0.1% | |||||
| 2,000 | Autoliv Inc. | 93,240 | |||
| 200 | BorgWarner Inc. | 8,876 | |||
| 600 | Federal Mogul Corporation, Class A Shares | 9,678 | |||
| 4,900 | Goodyear Tire & Rubber Company, (2) | 87,367 | |||
| 8,300 | Johnson Controls, Inc. | 238,044 | |||
| 1,300 | TRW Automotive Holdings Corporation, (2) | 24,011 | |||
Total Auto Components | 461,216 | ||||
| Automobiles – 0.3% | |||||
| 179,200 | Ford Motor Company, (2) | 861,952 | |||
| 49,000 | General Motors Corporation | 563,500 | |||
| 800 | Harley-Davidson, Inc. | 29,008 | |||
| 400 | Thor Industries, Inc. | 8,504 | |||
Total Automobiles | 1,462,964 | ||||
| Beverages – 2.0% | |||||
| 2,500 | Anheuser-Busch Companies, Inc. | 155,300 | |||
| 200 | Brown-Forman Corporation | 15,114 | |||
| 61,880 | Coca-Cola Company | 3,216,518 | |||
| 12,800 | Coca-Cola Enterprises Inc. | 221,440 | |||
| 1,300 | Constellation Brands, Inc., Class A, (2) | 25,818 | |||
16
| Shares | Description (1) | Value | |||
| Beverages (continued) | |||||
| 5,200 | Dr. Pepper Snapple Group | $ | 109,096 | ||
| 15,080 | Molson Coors Brewing Company, Class B | 819,296 | |||
| 4,700 | Pepsi Bottling Group, Inc. | 131,224 | |||
| 1,600 | PepsiAmericas Inc. | 31,648 | |||
| 69,000 | PepsiCo, Inc. | 4,387,710 | |||
Total Beverages | 9,113,164 | ||||
| Biotechnology – 0.1% | |||||
| 9,800 | Amgen Inc., (2) | 462,168 | |||
| 500 | Imclone Systems Inc., (2) | 20,230 | |||
| 1,000 | Invitrogen Corporation, (2) | 39,260 | |||
Total Biotechnology | 521,658 | ||||
| Building Products – 0.5% | |||||
| 500 | Armstrong World Industries Inc., (2) | 14,610 | |||
| 128,500 | Masco Corporation | 2,021,305 | |||
| 1,300 | Owens Corning, (2) | 29,575 | |||
| 200 | USG Corporation, (2) | 5,914 | |||
Total Building Products | 2,071,404 | ||||
| Capital Markets – 6.9% | |||||
| 9,100 | American Capital Strategies Limited | 216,307 | |||
| 7,600 | Ameriprise Financial, Inc. | 309,092 | |||
| 245,164 | Bank of New York Company, Inc. | 9,274,550 | |||
| 100 | BlackRock Inc. | 17,700 | |||
| 500 | Franklin Resources, Inc. | 45,825 | |||
| 26,550 | Goldman Sachs Group, Inc. | 4,643,595 | |||
| 105,520 | Invesco LTD | 2,530,370 | |||
| 100 | Investment Technology Group, (2) | 3,346 | |||
| 600 | Jefferies Group, Inc. | 10,092 | |||
| 309,430 | JPMorgan Chase & Co. | 10,616,543 | |||
| 1,700 | Legg Mason, Inc. | 74,069 | |||
| 14,800 | Lehman Brothers Holdings Inc. | 293,188 | |||
| 26,200 | Merrill Lynch & Co., Inc. | 830,802 | |||
| 49,202 | Morgan Stanley | 1,774,716 | |||
| 2,000 | Raymond James Financial Inc. | 52,780 | |||
| 5,000 | State Street Corporation | 319,950 | |||
Total Capital Markets | 31,012,925 | ||||
| Chemicals – 4.0% | |||||
| 21,760 | Air Products & Chemicals Inc. | 2,151,194 | |||
| 1,700 | Ashland Inc. | 81,940 | |||
| 700 | Cabot Corporation | 17,017 | |||
| 200 | Celanese Corporation, Series A | 9,132 | |||
| 4,800 | Chemtura Corporation | 28,032 | |||
| 1,200 | Cytec Industries, Inc. | 65,472 | |||
| 34,100 | Dow Chemical Company | 1,190,431 | |||
17
Portfolio of Investments
Nuveen Multi-Manager Large-Cap Value Fund (continued)
June 30, 2008
| Shares | Description (1) | Value | |||
| Chemicals (continued) | |||||
| 137,500 | E.I. Du Pont de Nemours and Company | $ | 5,897,375 | ||
| 20,780 | Eastman Chemical Company | 1,430,911 | |||
| 1,000 | FMC Corporation | 77,440 | |||
| 3,100 | Huntsman Corporation | 35,340 | |||
| 1,600 | Lubrizol Corporation | 74,128 | |||
| 44,360 | Mosaic Company, (2) | 6,418,892 | |||
| 100 | Nalco Holding Company | 2,115 | |||
| 3,500 | PPG Industries, Inc. | 200,795 | |||
| 300 | Rohm and Haas Company | 13,932 | |||
| 3,800 | RPM International, Inc. | 78,280 | |||
| 100 | Scotts Miracle Gro Company | 1,757 | |||
| 700 | Sigma-Aldrich Corporation | 37,702 | |||
| 100 | Valhi Inc. | 2,725 | |||
| 2,100 | Valspar Corporation | 39,711 | |||
Total Chemicals | 17,854,321 | ||||
| Commercial Banks – 4.9% | |||||
| 4,700 | Associated Banc-Corp. | 90,663 | |||
| 2,700 | BancorpSouth Inc. | 47,223 | |||
| 170,400 | Bank of America Corporation | 4,067,448 | |||
| 1,300 | Bank of Hawaii Corporation | 62,140 | |||
| 81,700 | BB&T Corporation | 1,860,309 | |||
| 500 | BOK Financial Corporation | 26,725 | |||
| 800 | City National Corporation | 33,656 | |||
| 5,800 | Comerica Incorporated | 148,654 | |||
| 1,400 | Commerce Bancshares Inc. | 55,524 | |||
| 1,700 | Cullen/Frost Bankers, Inc. | 84,745 | |||
| 19,600 | Fifth Third Bancorp. | 199,528 | |||
| 100 | First Citizens Bancshs Inc. | 13,949 | |||
| 3,200 | First Horizon National Corporation | 23,776 | |||
| 5,600 | Fulton Financial Corporation | 56,280 | |||
| 9,400 | Huntington BancShares Inc. | 54,238 | |||
| 17,600 | KeyCorp. | 193,248 | |||
| 1,800 | M&T Bank Corporation | 126,972 | |||
| 93,340 | Marshall and Ilsley Corporation | 1,430,902 | |||
| 23,960 | Northern Trust Corporation | 1,642,937 | |||
| 9,800 | PNC Financial Services Group, Inc. | 559,580 | |||
| 9,800 | Popular, Inc. | 64,582 | |||
| 35,200 | Regions Financial Corporation | 384,032 | |||
| 66,100 | SunTrust Banks, Inc. | 2,394,142 | |||
| 9,200 | Synovus Financial Corp. | 80,316 | |||
| 3,200 | TCF Financial Corporation | 38,496 | |||
| 58,300 | U.S. Bancorp | 1,625,987 | |||
| 1,500 | Unionbancal Corporation | 60,630 | |||
18
| Shares | Description (1) | Value | |||
| Commercial Banks (continued) | |||||
| 2,600 | Valley National Bancorp. | $ | 41,002 | ||
| 104,520 | Wachovia Corporation | 1,623,196 | |||
| 1,400 | Webster Financial Corporation | 26,040 | |||
| 186,000 | Wells Fargo & Company | 4,417,500 | |||
| 2,100 | Whitney Holding Corporation | 38,430 | |||
| 1,700 | Wilmington Trust Corporation | 44,948 | |||
| 2,700 | Zions Bancorporation | 85,023 | |||
Total Commercial Banks | 21,702,821 | ||||
| Commercial Services & Supplies – 0.2% | |||||
| 8,100 | Allied Waste Industries, Inc., (2) | 102,222 | |||
| 1,500 | Avery Dennison Corporation | 65,895 | |||
| 2,400 | Cintas Corporation | 63,624 | |||
| 100 | Corrections Corporation of America, (2) | 2,747 | |||
| 200 | Equifax Inc. | 6,724 | |||
| 1,100 | Manpower Inc. | 64,064 | |||
| 100 | Pitney Bowes Inc. | 3,410 | |||
| 5,100 | R.R. Donnelley & Sons Company | 151,419 | |||
| 100 | Republic Services, Inc. | 2,970 | |||
| 1,900 | Steelcase Inc. | 19,057 | |||
| 9,200 | Waste Management, Inc. | 346,932 | |||
| 100 | Zebra Technologies Corporation, Class A, (2) | 3,264 | |||
Total Commercial Services & Supplies | 832,328 | ||||
| Communication Equipment – 1.5% | |||||
| 700 | ADC Telecommunications Inc., (2) | 10,339 | |||
| 154,250 | Cisco Systems, Inc., (2) | 3,587,855 | |||
| 700 | JDS Uniphase Corporation, (2) | 7,952 | |||
| 4,000 | Motorola, Inc. | 29,360 | |||
| 65,790 | QUALCOMM Inc. | 2,919,102 | |||
Total Communication Equipment | 6,554,608 | ||||
| Computers & Peripherals – 2.2% | |||||
| 4,200 | Brocade Communications Systems Inc., (2) | 34,608 | |||
| 4,700 | EMC Corporation, (2) | 69,043 | |||
| 125,150 | Hewlett-Packard Company | 5,532,882 | |||
| 4,500 | Ingram Micro, Inc., (2) | 79,875 | |||
| 28,550 | International Business Machines Corporation (IBM) | 3,384,032 | |||
| 2,900 | Lexmark International, Inc., Class A, (2) | 96,947 | |||
| 100 | McAfee Inc., (2) | 3,403 | |||
| 300 | NCR Corporation, (2) | 7,560 | |||
| 16,000 | Seagate Technology | 306,080 | |||
| 15,300 | Sun Microsystems Inc., (2) | 166,464 | |||
| 1,100 | Teradata Corporation, (2) | 25,454 | |||
Total Computers & Peripherals | 9,706,348 | ||||
19
Portfolio of Investments
Nuveen Multi-Manager Large-Cap Value Fund (continued)
June 30, 2008
| Shares | Description (1) | Value | |||
| Construction & Engineering – 0.0% | |||||
| 300 | AECOM Technology Corporation | $ | 9,759 | ||
| 300 | KBR Inc. | 10,473 | |||
| 700 | Quanta Services Incorporated, (2) | 23,289 | |||
| 1,500 | URS Corporation, (2) | 62,955 | |||
Total Construction & Engineering | 106,476 | ||||
| Construction Materials – 0.0% | |||||
| 300 | Eagle Materials Inc. | 7,599 | |||
| 700 | Vulcan Materials Company | 41,846 | |||
Total Construction Materials | 49,445 | ||||
| Consumer Finance – 1.4% | |||||
| 4,900 | American Express Company | 184,583 | |||
| 2,300 | Americredit Corp., (2) | 19,826 | |||
| 65,750 | Capital One Financial Corporation | 2,499,158 | |||
| 7,100 | Capitalsource Inc. | 78,668 | |||
| 1,700 | Discover Financial Services | 22,389 | |||
| 100 | Student Loan Corporation | 9,808 | |||
| 40,630 | Visa Inc. | 3,303,625 | |||
Total Consumer Finance | 6,118,057 | ||||
| Containers & Packaging – 0.1% | |||||
| 1,200 | AptarGroup Inc. | 50,340 | |||
| 800 | Ball Corporation | 38,192 | |||
| 2,400 | Bemis Company, Inc. | 53,808 | |||
| 4,300 | Owens-Illinois, Inc., (2) | 179,267 | |||
| 2,800 | Packaging Corp. of America | 60,228 | |||
| 3,500 | Pactiv Corporation, (2) | 74,305 | |||
| 4,800 | Sealed Air Corporation | 91,248 | |||
| 12,400 | Smurfit-Stone Container Corporation, (2) | 50,468 | |||
| 1,800 | Sonoco Products Company | 55,710 | |||
| 1,300 | Temple-Inland Inc. | 14,651 | |||
Total Containers & Packaging | 668,217 | ||||
| Diversified Consumer Services – 0.0% | |||||
| 3,700 | Service Corporation International | 36,482 | |||
| Diversified Financial Services – 1.7% | |||||
| 6,000 | Allied Capital Corporation | 83,340 | |||
| 2,300 | CIT Group Inc. | 15,663 | |||
| 223,600 | Citigroup Inc. | 3,747,536 | |||
| 200 | CME Group, Inc. | 76,638 | |||
| 4,400 | Leucadia National Corporation | 206,536 | |||
| 1,900 | Nasdaq Stock Market, Inc., (2) | 50,445 | |||
| 1,100 | New York Stock Exchange Euronext | 55,726 | |||
| 130,760 | Western Union Company | 3,232,387 | |||
Total Diversified Financial Services | 7,468,271 | ||||
20
| Shares | Description (1) | Value | |||
| Diversified REIT – 0.1% | |||||
| 3,100 | Duke Realty Corporation | $ | 69,595 | ||
| 1,700 | Liberty Property Trust | 56,355 | |||
| 1,700 | Vornado Realty Trust | 149,600 | |||
Total Diversified REIT | 275,550 | ||||
| Diversified Telecommunication Services – 4.6% | |||||
| 488,798 | AT&T Inc. | 16,467,605 | |||
| 1,400 | CenturyTel, Inc. | 49,826 | |||
| 6,400 | Citizens Communications Company | 72,576 | |||
| 4,800 | Embarq Corporation | 226,896 | |||
| 46,200 | Qwest Communications International Inc. | 181,566 | |||
| 63,400 | Sprint Nextel Corporation | 602,300 | |||
| 77,700 | Verizon Communications Inc. | 2,750,580 | |||
| 13,800 | Windstream Corporation | 170,292 | |||
Total Diversified Telecommunication Services | 20,521,641 | ||||
| Electric Utilities – 3.2% | |||||
| 3,200 | Alliant Energy Corporation | 109,632 | |||
| 6,800 | Ameren Corporation | 287,164 | |||
| 14,200 | American Electric Power Company, Inc. | 571,266 | |||
| 10,500 | Consolidated Edison, Inc. | 410,445 | |||
| 20,840 | DPL Inc. | 549,759 | |||
| 5,600 | DTE Energy Company | 237,664 | |||
| 57,600 | Edison International | 2,959,488 | |||
| 600 | Entergy Corporation | 72,288 | |||
| 4,000 | Exelon Corporation | 359,840 | |||
| 8,100 | FirstEnergy Corp. | 666,873 | |||
| 61,970 | FPL Group, Inc. | 4,063,993 | |||
| 2,800 | Great Plains Energy Incorporated | 70,784 | |||
| 2,600 | Hawaiian Electric Industries | 64,298 | |||
| 3,000 | Northeast Utilities | 76,590 | |||
| 2,500 | OGE Energy Corp. | 79,275 | |||
| 7,400 | Pepco Holdings, Inc. | 189,810 | |||
| 9,700 | PG&E Corporation | 384,993 | |||
| 4,100 | Pinnacle West Capital Corporation | 126,157 | |||
| 7,800 | Progress Energy, Inc. | 326,274 | |||
| 44,330 | Reliant Energy Inc., (2) | 942,899 | |||
| 3,300 | Sierra Pacific Resources | 41,943 | |||
| 48,420 | Southern Company | 1,690,826 | |||
| 7,100 | TECO Energy, Inc. | 152,579 | |||
Total Electric Utilities | 14,434,840 | ||||
| Electrical Equipment – 0.1% | |||||
| 700 | Cooper Industries, Ltd., Class A, (2) | 27,650 | |||
| 10,460 | Emerson Electric Company | 517,247 | |||
| 700 | Hubbell Incorporated, Class B | 27,909 | |||
21
Portfolio of Investments
Nuveen Multi-Manager Large-Cap Value Fund (continued)
June 30, 2008
| Shares | Description (1) | Value | |||
| Electrical Equipment (continued) | |||||
| 300 | Lincoln Electric Holdings Inc. | $ | 23,610 | ||
| 1,000 | Thomas & Betts Corporation, (2) | 37,850 | |||
Total Electrical Equipment | 634,266 | ||||
| Electronic Equipment & Instruments – 1.0% | |||||
| 3,200 | Arrow Electronics, Inc., (2) | 98,304 | |||
| 2,000 | Avnet Inc., (2) | 54,560 | |||
| 800 | AVX Group | 9,048 | |||
| 100 | Diebold Inc. | 3,558 | |||
| 1,200 | Jabil Circuit Inc. | 19,692 | |||
| 1,600 | Molex Inc. | 39,056 | |||
| 1,100 | Tech Data Corporation, (2) | 37,279 | |||
| 35,540 | Thermo Fisher Scientific, Inc., (2) | 1,980,644 | |||
| 68,150 | Tyco Electronics, Limited | 2,441,133 | |||
| 2,200 | Vishay Intertechnology Inc., (2) | 19,514 | |||
Total Electronic Equipment & Instruments | 4,702,788 | ||||
| Energy Equipment & Services – 2.7% | |||||
| 20,100 | Anadarko Petroleum Corporation | 1,504,284 | |||
| 46,450 | Baker Hughes Incorporated | 4,056,943 | |||
| 5,600 | BJ Services Company | 178,864 | |||
| 600 | Cabot Oil & Gas Corporation | 40,638 | |||
| 600 | ENSCO International Incorporated | 48,444 | |||
| 2,300 | Exterran Holdings, Inc. | 164,427 | |||
| 1,600 | Global Industries, Limited, (2) | 28,688 | |||
| 2,100 | Helix Energy Solutions Group, (2) | 87,444 | |||
| 15,080 | Helmerich & Payne Inc. | 1,086,062 | |||
| 1,600 | Hercules Offshore Inc. | 60,832 | |||
| 2,200 | Key Energy Services Inc. | 42,724 | |||
| 8,400 | Nabors Industries Limited, (2) | 413,532 | |||
| 24,650 | Noble Corporation | 1,601,264 | |||
| 800 | Oil States International Inc. | 50,752 | |||
| 2,700 | Patterson-UTI Energy, Inc. | 97,308 | |||
| 31,820 | Pride International Inc., (2) | 1,504,768 | |||
| 2,400 | Rowan Companies Inc. | 112,200 | |||
| 500 | SeaCor Smit Inc., (2) | 44,755 | |||
| 1,500 | Tidewater Inc. | 97,545 | |||
| 10,180 | Unit Corporation, (2) | 844,635 | |||
Total Energy Equipment & Services | 12,066,109 | ||||
| Food & Staples Retailing – 2.4% | |||||
| 1,200 | BJ’s Wholesale Club, (2) | 46,440 | |||
| 62,295 | Costco Wholesale Corporation | 4,369,371 | |||
| 79,900 | CVS Caremark Corporation | 3,161,643 | |||
| 78,150 | Kroger Co. | 2,256,191 | |||
| 12,400 | Safeway Inc. | 354,020 | |||
22
| Shares | Description (1) | Value | |||
| Food & Staples Retailing (continued) | |||||
| 6,500 | SUPERVALU INC. | $ | 200,785 | ||
| 5,000 | Wal-Mart Stores, Inc. | 281,000 | |||
Total Food & Staples Retailing | 10,669,450 | ||||
| Food Products – 1.1% | |||||
| 19,300 | Archer-Daniels-Midland Company | 651,375 | |||
| 2,900 | Bunge Limited, (2) | 312,301 | |||
| 1,200 | Campbell Soup Company | 40,152 | |||
| 9,800 | ConAgra Foods, Inc. | 188,944 | |||
| 1,600 | Corn Products International, Inc. | 78,576 | |||
| 44,000 | Dean Foods Company, (2) | 863,280 | |||
| 3,400 | Del Monte Foods Company | 24,140 | |||
| 5,600 | General Mills, Inc. | 340,312 | |||
| 23,530 | H.J. Heinz Company | 1,125,911 | |||
| 100 | Hershey Foods Corporation | 3,278 | |||
| 1,200 | Hormel Foods Corporation | 41,532 | |||
| 1,400 | JM Smucker Company | 56,896 | |||
| 700 | Kellogg Company | 33,614 | |||
| 31,100 | Kraft Foods Inc. | 884,795 | |||
| 900 | McCormick & Company, Incorporated | 32,094 | |||
| 8,900 | Sara Lee Corporation | 109,025 | |||
| 3,200 | Smithfield Foods, Inc., (2) | 63,616 | |||
| 4,800 | Tyson Foods, Inc., Class A | 71,712 | |||
| 400 | Wm. Wrigley Jr. Company | 31,112 | |||
Total Food Products | 4,952,665 | ||||
| Gas Utilities – 1.2% | |||||
| 2,100 | AGL Resources Inc. | 72,618 | |||
| 2,600 | Atmos Energy Corporation | 71,682 | |||
| 25,950 | Energen Corporation | 2,024,879 | |||
| 38,570 | Questar Corporation | 2,740,013 | |||
| 1,800 | Southern Union Company | 48,636 | |||
| 11,200 | Spectra Energy Corporation | 321,888 | |||
| 2,200 | UGI Corporation | 63,162 | |||
Total Gas Utilities | 5,342,878 | ||||
| Health Care Equipment & Supplies – 0.8% | |||||
| 1,300 | AmerisourceBergen Corporation | 51,987 | |||
| 100 | Beckman Coulter, Inc. | 6,753 | |||
| 20,800 | Boston Scientific Corporation, (2) | 255,632 | |||
| 100 | Cooper Companies, Inc. | 3,715 | |||
| 65,470 | Covidien Limited | 3,135,358 | |||
| 800 | Hill Rom Holdings Inc. | 21,584 | |||
| 1,800 | Hospira Inc., (2) | 72,198 | |||
| 500 | Inverness Medical Innovation | 16,585 | |||
| 400 | Lincare Holdings, (2) | 11,360 | |||
23
Portfolio of Investments
Nuveen Multi-Manager Large-Cap Value Fund (continued)
June 30, 2008
| Shares | Description (1) | Value | |||
| Health Care Equipment & Supplies (continued) | |||||
| 100 | Zimmer Holdings, Inc., (2) | $ | 6,805 | ||
Total Health Care Equipment & Supplies | 3,581,977 | ||||
| Health Care Providers & Services – 0.3% | |||||
| 1,600 | Aetna Inc. | 64,848 | |||
| 300 | Brookdale Senior Living Inc. | 6,108 | |||
| 3,200 | CIGNA Corporation | 113,248 | |||
| 1,300 | Community Health Systems Inc., (2) | 42,874 | |||
| 3,400 | Coventry Health Care, Inc., (2) | 103,428 | |||
| 400 | Davita Inc., (2) | 21,252 | |||
| 5,200 | Health Management Associates Inc., (2) | 33,852 | |||
| 2,600 | Humana Inc., (2) | 103,402 | |||
| 1,600 | Lifepoint Hospitals Inc., (2) | 45,280 | |||
| 100 | McKesson HBOC Inc. | 5,591 | |||
| 100 | Pediatrix Medical Group Inc., (2) | 4,923 | |||
| 100 | Quest Diagnostics Incorporated | 4,847 | |||
| 2,200 | Tenet Healthcare Corporation, (2) | 12,232 | |||
| 11,700 | UnitedHealth Group Incorporated | 307,125 | |||
| 700 | Universal Health Services, Inc., Class B | 44,254 | |||
| 10,400 | Wellpoint Inc., (2) | 495,664 | |||
Total Health Care Providers & Services | 1,408,928 | ||||
| Health Care Technology – 0.0% | |||||
| 1,100 | Health Corporation, (2) | 12,452 | |||
| 100 | IMS Health Incorporated | 2,330 | |||
Total Health Care Technology | 14,782 | ||||
| Hotels, Restaurants & Leisure – 0.3% | |||||
| 10,300 | Carnival Corporation | 339,488 | |||
| 200 | Choice Hotels International, Inc. | 5,300 | |||
| 51,347 | Intercontinental Hotels Group PLC, ADR | 684,456 | |||
| 400 | Intl Speedway Corporation | 15,612 | |||
| 1,300 | McDonald’s Corporation | 73,086 | |||
| 800 | MGM Mirage Inc., (2) | 27,112 | |||
| 7,400 | Royal Caribbean Cruises Limited | 166,278 | |||
| 4,600 | Wyndham Worldwide Corporation | 82,386 | |||
Total Hotels, Restaurants & Leisure | 1,393,718 | ||||
| Household Durables – 0.3% | |||||
| 1,900 | Black & Decker Corporation | 109,269 | |||
| 18,600 | D.R. Horton, Inc. | 201,810 | |||
| 2,600 | Fortune Brands Inc. | 162,266 | |||
| 300 | Harman International Industries Inc. | 12,417 | |||
| 600 | KB Home | 10,158 | |||
| 3,800 | Leggett and Platt Inc. | 63,726 | |||
| 500 | MDC Holdings Inc. | 19,530 | |||
| 2,400 | Mohawk Industries Inc., (2) | 153,840 | |||
24
| Shares | Description (1) | Value | |||
| Household Durables (continued) | |||||
| 6,100 | Newell Rubbermaid Inc. | $ | 102,419 | ||
| 100 | NVR Inc., (2) | 50,008 | |||
| 1,400 | Snap-on Incorporated | 72,814 | |||
| 1,900 | Stanley Works | 85,177 | |||
| 600 | Toll Brothers Inc. | 11,238 | |||
| 3,500 | Whirlpool Corporation | 216,055 | |||
Total Household Durables | 1,270,727 | ||||
| Household Products – 1.9% | |||||
| 300 | Clorox Company | 15,660 | |||
| 10,170 | Colgate-Palmolive Company | 702,747 | |||
| 31,550 | Kimberly-Clark Corporation | 1,886,059 | |||
| 94,050 | Procter & Gamble Company | 5,719,181 | |||
Total Household Products | 8,323,647 | ||||
| Independent Power Producers & Energy Traders – 0.0% | |||||
| 100 | Constellation Energy Group | 8,210 | |||
| 1,500 | Mirant Corporation, (2) | 58,725 | |||
| 3,200 | NRG Energy Inc., (2) | 137,280 | |||
Total Independent Power Producers & Energy Traders | 204,215 | ||||
| Industrial Conglomerates – 3.0% | |||||
| 500 | Carlisle Companies Inc. | 14,500 | |||
| 351,385 | General Electric Company | 9,378,466 | |||
| 3,100 | Genuine Parts Company | 123,008 | |||
| 9,975 | Siemens AG, Sponsored ADR | 1,098,547 | |||
| 400 | Teleflex Inc. | 22,236 | |||
| 52,850 | Textron Inc. | 2,533,101 | |||
| 1,400 | Tyco International Ltd. | 56,056 | |||
Total Industrial Conglomerates | 13,225,914 | ||||
| Industrial REIT – 0.1% | |||||
| 1,900 | AMB Property Corp. | 95,722 | |||
| 5,300 | ProLogis | 288,055 | |||
Total Industrial REIT | 383,777 | ||||
| Insurance – 5.5% | |||||
| 76,100 | Ace Limited | 4,192,349 | |||
| 44,440 | AFLAC Incorporated | 2,790,832 | |||
| 200 | Alleghany Corporation, Term Loan | 66,410 | |||
| 38,920 | Allied World Assurance Holdings | 1,542,010 | |||
| 77,250 | Allstate Corporation | 3,521,828 | |||
| 1,900 | American Financial Group Inc. | 50,825 | |||
| 20,700 | American International Group, Inc. | 547,722 | |||
| 300 | American National Insurance Company | 29,406 | |||
| 72,250 | Aon Corporation | 3,319,165 | |||
| 1,500 | Arch Capital Group Limited, (2) | 99,480 | |||
| 2,100 | Arthur J. Gallagher & Co. | 50,610 | |||
25
Portfolio of Investments
Nuveen Multi-Manager Large-Cap Value Fund (continued)
June 30, 2008
| Shares | Description (1) | Value | |||
| Insurance (continued) | |||||
| 15,940 | Assurant Inc. | $ | 1,051,402 | ||
| 3,000 | Axis Capital Holdings Limited | 89,430 | |||
| 1,000 | Brown & Brown Inc. | 17,390 | |||
| 9,700 | Chubb Corporation | 475,397 | |||
| 5,100 | Cincinnati Financial Corporation | 129,540 | |||
| 600 | CNA Financial Corporation | 15,090 | |||
| 3,000 | Conseco Inc., (2) | 29,760 | |||
| 1,500 | Endurance Specialty Holdings, Limited | 46,185 | |||
| 700 | Erie Indemnity Company | 32,305 | |||
| 1,500 | Everest Reinsurance Group Ltd | 119,565 | |||
| 6,300 | Fidelity National Title Group Inc., Class A | 79,380 | |||
| 1,200 | First American Corporation | 31,680 | |||
| 8,600 | Genworth Financial Inc., Class A | 153,166 | |||
| 1,200 | Hanover Insurance Group Inc. | 51,000 | |||
| 5,800 | Hartford Financial Services Group, Inc. | 374,506 | |||
| 2,100 | HCC Insurance Holdings Inc. | 44,394 | |||
| 6,300 | Lincoln National Corporation | 285,516 | |||
| 7,100 | Loews Corporation | 332,990 | |||
| 200 | Markel Corporation, (2) | 73,400 | |||
| 10,800 | Marsh & McLennan Companies, Inc. | 286,740 | |||
| 900 | MBIA Inc. | 3,951 | |||
| 800 | Mercury General Corporation | 37,376 | |||
| 10,300 | MetLife, Inc. | 543,531 | |||
| 1,200 | Nationwide Financial Services, Inc. | 57,612 | |||
| 6,000 | Old Republic International Corporation | 71,040 | |||
| 700 | OneBeacon Insurance Group Limited, Class A | 12,299 | |||
| 1,600 | PartnerRe Limited | 110,608 | |||
| 800 | Philadelphia Consolidated Holding Corporation, (2) | 27,176 | |||
| 4,700 | Principal Financial Group, Inc. | 197,259 | |||
| 12,500 | Progressive Corporation | 234,000 | |||
| 1,600 | Protective Life Corporation | 60,880 | |||
| 6,100 | Prudential Financial, Inc. | 364,414 | |||
| 600 | Reinsurance Group of America Inc. | 26,112 | |||
| 1,600 | RenaisasnceRE Holdings, Limited | 71,472 | |||
| 2,600 | SAFECO Corporation | 174,616 | |||
| 1,300 | StanCorp Financial Group Inc. | 61,048 | |||
| 1,700 | Torchmark Corporation | 99,705 | |||
| 500 | Transatlantic Holdings Inc. | 28,235 | |||
| 16,000 | Travelers Companies, Inc. | 694,400 | |||
| 1,300 | Unitrin, Inc. | 35,841 | |||
| 72,590 | Unum Group | 1,484,466 | |||
| 100 | White Mountain Insurance Group | 42,900 | |||
| 2,300 | WR Berkley Corporation | 55,568 | |||
26
| Shares | Description (1) | Value | |||
| Insurance (continued) | |||||
| 1,900 | XL Capital Ltd, Class A | $ | 39,064 | ||
Total Insurance | 24,463,046 | ||||
| Internet & Catalog Retail – 0.0% | |||||
| 2,200 | Expedia, Inc., (2) | 40,436 | |||
| 1,700 | IAC/InterActiveCorp., (2) | 32,776 | |||
Total Internet & Catalog Retail | 73,212 | ||||
| IT Services – 0.2% | |||||
| 1,400 | Affiliated Computer Services Inc., (2) | 74,886 | |||
| 4,600 | Computer Sciences Corporation, (2) | 215,464 | |||
| 1,500 | Convergys Corporation, (2) | 22,290 | |||
| 300 | DST Systems Inc., (2) | 16,515 | |||
| 18,700 | Electronic Data Systems Corporation | 460,768 | |||
| 1,800 | Fidelity National Information Services | 66,438 | |||
| 2,600 | SAIC, Inc., (2) | 54,106 | |||
Total IT Services | 910,467 | ||||
| Leisure Equipment & Products – 0.5% | |||||
| 7,100 | Eastman Kodak Company | 102,453 | |||
| 59,820 | Hasbro, Inc. | 2,136,770 | |||
| 4,900 | Mattel, Inc. | 83,888 | |||
Total Leisure Equipment & Products | 2,323,111 | ||||
| Life Sciences Tools & Services – 0.0% | |||||
| 500 | Charles River Laboratories International, Inc., (2) | 31,960 | |||
| 1,100 | Perkinelmer Inc. | 30,635 | |||
Total Life Sciences Tools & Services | 62,595 | ||||
| Machinery – 0.8% | |||||
| 22,050 | AGCO Corporation, (2) | 1,155,641 | |||
| 1,000 | Crane Company | 38,530 | |||
| 300 | Danaher Corporation | 23,190 | |||
| 8,900 | Deere & Company | 641,957 | |||
| 400 | Dover Corporation | 19,348 | |||
| 2,100 | Eaton Corporation | 178,437 | |||
| 400 | Flowserve Corporation | 54,680 | |||
| 1,800 | Gardner Denver, Inc., (2) | 102,240 | |||
| 100 | IDEX Corporation | 3,684 | |||
| 8,200 | Illinois Tool Works Inc. | 389,582 | |||
| 3,500 | Ingersoll Rand Company Limited, Class A | 131,005 | |||
| 700 | ITT Industries Inc. | 44,331 | |||
| 1,100 | Kennametal Inc. | 35,805 | |||
| 1,000 | Oshkosh Truck Corporation | 20,690 | |||
| 7,240 | Parker Hannifin Corporation | 516,357 | |||
| 1,600 | Pentair, Inc. | 56,032 | |||
| 1,400 | Terex Corporation, (2) | 71,918 | |||
| 2,100 | Timken Company | 69,174 | |||
27
Portfolio of Investments
Nuveen Multi-Manager Large-Cap Value Fund (continued)
June 30, 2008
| Shares | Description (1) | Value | |||
| Machinery (continued) | |||||
| 2,100 | Trinity Industries Inc. | $ | 72,849 | ||
Total Machinery | 3,625,450 | ||||
| Marine – 0.0% | |||||
| 1,100 | Alexander and Bald, Inc. | 50,105 | |||
| 700 | Overseas Shipholding Group Inc. | 55,664 | |||
Total Marine | 105,769 | ||||
| Media – 3.6% | |||||
| 68,180 | Cablevision Systems Corporation, (2) | 1,540,868 | |||
| 16,700 | CBS Corporation, Class B | 325,483 | |||
| 2,800 | Clear Channel Communications, Inc. | 98,560 | |||
| 100 | Clear Channel Outdoor Holdings Inc., Class A, (2) | 1,783 | |||
| 42,000 | Comcast Corporation, Class A | 796,740 | |||
| 5,600 | Discovery Holding Company, Series A, (2) | 122,976 | |||
| 800 | E.W. Scripps Company, Class A | 33,232 | |||
| 1,500 | Echostar Holding Corporation, Class A, (2) | 46,830 | |||
| 10,400 | Gannett Company Inc. | 225,368 | |||
| 500 | Hearst-Argyle Television Inc. | 9,600 | |||
| 200 | Interpublic Group Companies, Inc., (2) | 1,720 | |||
| 6,900 | Liberty Global Inc, A Shares, (2) | 216,867 | |||
| 4,400 | Liberty Media Holding Corporation Capital, Class A, (2) | 63,360 | |||
| 5,500 | Liberty Media Holding Corporation Interactive, Class A, (2) | 81,180 | |||
| 700 | McGraw-Hill Companies, Inc. | 28,084 | |||
| 300 | Meredith Corporation | 8,487 | |||
| 3,300 | New York Times, Class A | 50,787 | |||
| 204,100 | News Corporation, Class A | 3,069,664 | |||
| 60,400 | Omnicom Group Inc. | 2,710,752 | |||
| 1,600 | Regal Entertainment Group, Class A | 24,448 | |||
| 2,400 | Time Warner Cable, Class A, (2) | 63,552 | |||
| 85,400 | Time Warner Inc. | 1,263,920 | |||
| 119,350 | Viacom Inc., Class B, (2) | 3,644,949 | |||
| 12,600 | Virgin Media, Inc. | 171,486 | |||
| 51,310 | Walt Disney Company | 1,600,872 | |||
| 300 | Warner Music Group Corporation | 2,142 | |||
| 100 | Washington Post Company | 58,690 | |||
Total Media | 16,262,400 | ||||
| Metals & Mining – 2.2% | |||||
| 5,000 | Alcoa Inc. | 178,100 | |||
| 1,000 | Carpenter Technology Inc. | 43,650 | |||
| 400 | Century Aluminum Company, (2) | 26,596 | |||
| 25,050 | Commercial Metals Company | 944,385 | |||
| 45,200 | Freeport-McMoRan Copper & Gold, Inc. | 5,296,988 | |||
| 4,500 | Nucor Corporation | 336,015 | |||
| 1,300 | Reliance Steel & Aluminum Company | 100,217 | |||
28
| Shares | Description (1) | Value | |||
| Metals & Mining (continued) | |||||
| 400 | Schnitzer Steel Industries, Inc. | $ | 45,840 | ||
| 2,800 | Steel Dynamics Inc. | 109,396 | |||
| 700 | Titanium Metals Corporation | 9,793 | |||
| 14,530 | United States Steel Corporation | 2,684,853 | |||
Total Metals & Mining | 9,775,833 | ||||
| Mortgage REIT – 0.3% | |||||
| 77,200 | Annaly Capital Management Inc. | 1,197,372 | |||
| 4,900 | iStar Financial Inc. | 64,729 | |||
Total Mortgage REIT | 1,262,101 | ||||
| Multiline Retail – 0.8% | |||||
| 2,700 | Family Dollar Stores, Inc. | 53,838 | |||
| 18,800 | Federated Department Stores, Inc. | 365,096 | |||
| 6,600 | J.C. Penney Company, Inc. | 239,514 | |||
| 2,300 | Kohl’s Corporation, (2) | 92,092 | |||
| 900 | Saks Inc., (2) | 9,882 | |||
| 2,800 | Sears Holding Corporation, (2) | 206,248 | |||
| 55,050 | Target Corporation | 2,559,275 | |||
Total Multiline Retail | 3,525,945 | ||||
| Multi-Utilities – 1.5% | |||||
| 6,400 | CenterPoint Energy, Inc. | 102,720 | |||
| 3,400 | CMS Energy Corporation | 50,660 | |||
| 12,700 | Dominion Resources, Inc. | 603,123 | |||
| 45,400 | Duke Energy Corporation | 789,052 | |||
| 4,600 | Dynegy Inc., (2) | 39,330 | |||
| 5,100 | Energy East Corporation | 126,072 | |||
| 2,500 | Integrys Energy Group, Inc. | 127,075 | |||
| 95,380 | MDU Resources Group Inc. | 3,324,947 | |||
| 2,500 | National Fuel Gas Company | 148,700 | |||
| 10,300 | NiSource Inc. | 184,576 | |||
| 2,800 | NSTAR | 94,696 | |||
| 1,400 | ONEOK, Inc. | 68,362 | |||
| 4,300 | Puget Energy, Inc. | 103,157 | |||
| 4,000 | Scana Corporation | 148,000 | |||
| 6,500 | Sempra Energy | 366,925 | |||
| 2,200 | Vectren Corporation | 68,662 | |||
| 3,200 | Wisconsin Energy Corporation | 144,704 | |||
| 13,800 | Xcel Energy, Inc. | 276,966 | |||
Total Multi-Utilities | 6,767,727 | ||||
| Office Electronics – 0.1% | |||||
| 16,700 | Xerox Corporation | 226,452 | |||
| Office REIT – 0.1% | |||||
| 700 | Alexandria Real Estate Equities Inc. | 68,138 | |||
| 2,500 | Boston Properties, Inc. | 225,550 | |||
29
Portfolio of Investments
Nuveen Multi-Manager Large-Cap Value Fund (continued)
June 30, 2008
| Shares | Description (1) | Value | |||
| Office REIT (continued) | |||||
| 2,700 | Brandywine Realty Trust | $ | 42,552 | ||
| 400 | Digital Realty Trust Inc. | 16,364 | |||
| 2,700 | Douglas Emmett Inc. | 59,319 | |||
| 8,000 | HRPT Properties Trust | 54,160 | |||
| 700 | Kilroy Realty Corporation | 32,921 | |||
| 1,900 | Mack-Cali Realty Corporation | 64,923 | |||
| 800 | SL Green Realty Corporation | 66,176 | |||
Total Office REIT | 630,103 | ||||
| Oil, Gas & Consumable Fuels – 15.7% | |||||
| 10,500 | Apache Corporation | 1,459,500 | |||
| 29,900 | BP Amoco PLC | 2,080,143 | |||
| 49,390 | Chesapeake Energy Corporation | 3,257,764 | |||
| 131,140 | Chevron Corporation | 12,999,908 | |||
| 3,500 | Cimarex Energy Company | 243,845 | |||
| 50,700 | ConocoPhillips | 4,785,573 | |||
| 13,220 | Continental Resources Inc., (2) | 916,410 | |||
| 35,650 | Devon Energy Corporation | 4,283,704 | |||
| 13,500 | El Paso Corporation | 293,490 | |||
| 1,100 | Encore Acquisition Company | 82,709 | |||
| 9,690 | EOG Resources, Inc. | 1,271,328 | |||
| 134,400 | Exxon Mobil Corporation | 11,844,672 | |||
| 2,400 | Forest Oil Corporation, (2) | 178,800 | |||
| 36,430 | Hess Corporation | 4,597,102 | |||
| 95,250 | Marathon Oil Corporation | 4,940,618 | |||
| 600 | Mariner Energy Inc. | 22,182 | |||
| 26,720 | Murphy Oil Corporation | 2,619,896 | |||
| 2,900 | Newfield Exploration Company, (2) | 189,225 | |||
| 3,100 | Noble Energy, Inc. | 311,736 | |||
| 95,730 | Occidental Petroleum Corporation | 8,602,298 | |||
| 300 | Petrohawk Energy Corporation, (2) | 13,893 | |||
| 1,400 | Pioneer Natural Resources Company | 109,592 | |||
| 200 | Plains Exploration & Production Company, (2) | 14,594 | |||
| 900 | St Mary Land and Exploration Company | 58,176 | |||
| 4,200 | Sunoco, Inc. | 170,898 | |||
| 700 | Teekay Shipping Corporation | 31,626 | |||
| 9,100 | Tesoro Petroleum Corporation | 179,907 | |||
| 32,200 | Valero Energy Corporation | 1,325,996 | |||
| 43,875 | XTO Energy, Inc. | 3,005,876 | |||
Total Oil, Gas & Consumable Fuels | 69,891,461 | ||||
| Paper & Forest Products – 0.2% | |||||
| 11,000 | Domtar Corporation, (2) | 59,950 | |||
| 17,100 | International Paper Company | 398,430 | |||
| 6,500 | MeadWestvaco Corporation | 154,960 | |||
30
| Shares | Description (1) | Value | |||
| Paper & Forest Products (continued) | |||||
| 2,400 | Weyerhaeuser Company | $ | 122,736 | ||
Total Paper & Forest Products | 736,076 | ||||
| Personal Products – 0.4% | |||||
| 1,200 | Alberto Culver Company | 31,524 | |||
| 50,200 | Avon Products, Inc. | 1,808,204 | |||
| 400 | NBTY Inc., (2) | 12,824 | |||
Total Personal Products | 1,852,552 | ||||
| Pharmaceuticals – 6.0% | |||||
| 100 | Barr Laboratories Inc., (2) | 4,508 | |||
| 97,980 | Bristol-Myers Squibb Company | 2,011,529 | |||
| 49,740 | Eli Lilly and Company | 2,295,998 | |||
| 300 | Endo Pharmaceuticals Holdings Inc., (2) | 7,257 | |||
| 1,800 | Forest Laboratories, Inc., (2) | 62,532 | |||
| 103,200 | Johnson & Johnson | 6,639,888 | |||
| 1,700 | King Pharmaceuticals Inc., (2) | 17,799 | |||
| 9,000 | Merck & Co. Inc. | 339,210 | |||
| 2,300 | Mylan Laboratories Inc., (2) | 27,761 | |||
| 228,200 | Pfizer Inc. | 3,986,654 | |||
| 169,400 | Schering-Plough Corporation | 3,335,486 | |||
| 46,710 | Watson Pharmaceuticals Inc., (2) | 1,269,111 | |||
| 139,200 | Wyeth | 6,676,032 | |||
Total Pharmaceuticals | 26,673,765 | ||||
| Real Estate Management & Development – 0.0% | |||||
| 300 | CB Richard Ellis Group, Inc., Class A, (2) | 5,760 | |||
| 400 | Jones Lang LaSalle Inc. | 24,076 | |||
| 100 | St Joe Company, (2) | 3,432 | |||
Total Real Estate Management & Development | 33,268 | ||||
| Residential REIT – 0.3% | |||||
| 700 | Apartment Investment & Management Company, Class A | 23,842 | |||
| 600 | AvalonBay Communities, Inc. | 53,496 | |||
| 900 | BRE Properties, Inc. | 38,952 | |||
| 200 | Camden Property Trust | 8,852 | |||
| 5,600 | Equity Residential | 214,312 | |||
| 8,080 | Essex Property Trust Inc. | 860,520 | |||
| 2,500 | UDR Inc. | 55,950 | |||
Total Residential REIT | 1,255,924 | ||||
| Retail REIT – 0.4% | |||||
| 1,700 | CBL & Associates Properties Inc. | 38,828 | |||
| 1,400 | Developers Diversified Realty Corporation | 48,594 | |||
| 300 | Federal Realty Investment Trust | 20,700 | |||
| 500 | General Growth Properties Inc. | 17,523 | |||
| 3,400 | Kimco Realty Corporation | 117,368 | |||
| 1,000 | Regency Centers Corporation | 59,120 | |||
31
Portfolio of Investments
Nuveen Multi-Manager Large-Cap Value Fund (continued)
June 30, 2008
| Shares | Description (1) | Value | |||
| Retail REIT (continued) | |||||
| 10,900 | Simon Property Group, Inc. | $ | 979,801 | ||
| 14,110 | Taubman Centers Inc. | 686,452 | |||
| 2,200 | Weingarten Realty Investors Trust | 66,704 | |||
Total Retail REIT | 2,035,090 | ||||
| Road & Rail – 2.0% | |||||
| 100 | Avis Budget Group Inc., (2) | 837 | |||
| 28,350 | Burlington Northern Santa Fe Corporation | 2,831,882 | |||
| 800 | Con-Way, Inc. | 37,808 | |||
| 52,020 | CSX Corporation | 3,267,376 | |||
| 4,200 | Hertz Global Holdings, Inc., (2) | 40,320 | |||
| 400 | Kansas City Southern Industries, (2) | 17,596 | |||
| 3,400 | Norfolk Southern Corporation | 213,078 | |||
| 25,560 | Ryder System, Inc. | 1,760,573 | |||
| 7,640 | Union Pacific Corporation | 576,820 | |||
Total Road & Rail | 8,746,290 | ||||
| Semiconductors & Equipment – 0.8% | |||||
| 1,900 | Atmel Corporation, (2) | 6,612 | |||
| 1,100 | Cree, Inc., (2) | 25,091 | |||
| 1,900 | Fairchild Semiconductor International Inc., Class A, (2) | 22,287 | |||
| 1,200 | Integrated Device Technology, Inc., (2) | 11,928 | |||
| 7,100 | Intel Corporation | 152,508 | |||
| 700 | International Rectifier Corporation, (2) | 13,440 | |||
| 600 | Intersil Holding Corporation, Class A | 14,592 | |||
| 800 | Lam Research Corporation, (2) | 28,920 | |||
| 800 | LSI Logic Corporation, (2) | 4,912 | |||
| 37,300 | Micron Technology, Inc., (2) | 223,800 | |||
| 900 | Novellus Systems, Inc., (2) | 19,071 | |||
| 700 | QLogic Corporation, (2) | 10,213 | |||
| 1,000 | Teradyne Inc., (2) | 11,070 | |||
| 101,900 | Texas Instruments Incorporated | 2,869,504 | |||
Total Semiconductors & Equipment | 3,413,948 | ||||
| Software – 0.1% | |||||
| 1,400 | Amdocs Limited, (2) | 41,188 | |||
| 900 | CA Inc. | 20,781 | |||
| 5,400 | Cadence Design Systems, Inc., (2) | 54,540 | |||
| 2,500 | Compuware Corporation, (2) | 23,850 | |||
| 3,200 | Novell Inc., (2) | 18,848 | |||
| 10,700 | Symantec Corporation, (2) | 207,045 | |||
| 1,800 | Synopsys Inc., (2) | 43,038 | |||
Total Software | 409,290 | ||||
| Specialized REIT – 0.9% | |||||
| 5,700 | Health Care Property Investors Inc. | 181,317 | |||
| 2,600 | Health Care REIT, Inc. | 115,700 | |||
32
| Shares | Description (1) | Value | |||
| Specialized REIT (continued) | |||||
| 4,000 | Hospitality Properties Trust | $ | 97,840 | ||
| 154,550 | Host Hotels & Resorts Inc. | 2,109,608 | |||
| 3,300 | Nationwide Health Properties, Inc. | 103,917 | |||
| 1,800 | Plum Creek Timber Company | 76,878 | |||
| 1,600 | Public Storage, Inc. | 129,264 | |||
| 21,560 | Rayonier Inc. | 915,438 | |||
| 2,100 | Ventas Inc. | 89,397 | |||
Total Specialized REIT | 3,819,359 | ||||
| Specialty Retail – 0.7% | |||||
| 2,800 | American Eagle Outfitters, Inc. | 38,164 | |||
| 300 | Ann Taylor Stores Corporation, (2) | 7,188 | |||
| 5,000 | AutoNation Inc., (2) | 50,100 | |||
| 800 | Barnes & Noble Inc. | 19,872 | |||
| 700 | Bed Bath and Beyond Inc., (2) | 19,670 | |||
| 3,000 | Foot Locker, Inc. | 37,350 | |||
| 1,700 | Gap, Inc. | 28,339 | |||
| 82,920 | Home Depot, Inc. | 1,941,986 | |||
| 4,400 | Limited Brands, Inc. | 74,140 | |||
| 28,300 | Lowe’s Companies, Inc. | 587,225 | |||
| 10,200 | Office Depot, Inc., (2) | 111,588 | |||
| 1,600 | OfficeMax Inc. | 22,240 | |||
| 1,500 | O’Reilly Automotive Inc., (2) | 33,525 | |||
| 1,400 | Penske Auto Group, Inc. | 20,636 | |||
| 200 | Phillips-Van Heusen Corporation | 7,324 | |||
| 4,700 | RadioShack Corporation | 57,669 | |||
| 700 | Staples, Inc. | 16,625 | |||
| 1,400 | Williams-Sonoma Inc. | 27,776 | |||
Total Specialty Retail | 3,101,417 | ||||
| Textiles, Apparel & Luxury Goods – 0.0% | |||||
| 2,200 | Jones Apparel Group, Inc. | 30,250 | |||
| 2,100 | Liz Claiborne, Inc. | 29,715 | |||
| 1,300 | VF Corporation | 92,534 | |||
Total Textiles, Apparel & Luxury Goods | 152,499 | ||||
| Thrifts & Mortgage Finance – 0.8% | |||||
| 2,000 | Astoria Financial Corporation | 40,160 | |||
| 400 | Capitol Federal Financial | 15,044 | |||
| 17,500 | Countrywide Financial Corporation | 74,375 | |||
| 4,400 | Federal National Mortgage Association | 85,844 | |||
| 186,740 | Hudson City Bancorp, Inc. | 3,114,823 | |||
| 200 | MGIC Investment Corporation | 1,222 | |||
| 11,100 | New York Community Bancorp, Inc. | 198,024 | |||
| 6,700 | People’s United Financial, Inc. | 104,520 | |||
| 2,000 | TFS Financial Corporation | 23,180 | |||
33
Portfolio of Investments
Nuveen Multi-Manager Large-Cap Value Fund (continued)
June 30, 2008
| Shares | Description (1) | Value | |||
| Thrifts & Mortgage Finance (continued) | |||||
| 2,900 | Washington Federal Inc. | $ | 52,490 | ||
Total Thrifts & Mortgage Finance | 3,709,682 | ||||
| Tobacco – 1.5% | |||||
| 64,260 | Altria Group, Inc. | 1,321,186 | |||
| 71,420 | Philip Morris International, (2) | 3,527,434 | |||
| 3,900 | Reynolds American Inc. | 182,013 | |||
| 33,080 | UST Inc. | 1,806,499 | |||
Total Tobacco | 6,837,132 | ||||
| Trading Companies & Distributors – 0.0% | |||||
| 1,100 | GATX Corporation | 48,763 | |||
| 1,300 | United Rentals Inc., (2) | 25,493 | |||
| 400 | WESCO International Inc., (2) | 16,016 | |||
Total Trading Companies & Distributors | 90,272 | ||||
| Water Utilities – 0.0% | |||||
| 4,100 | American Water Works Company | 90,938 | |||
| 700 | Aqua America Inc. | 11,179 | |||
Total Water Utilities | 102,117 | ||||
| Wireless Telecommunication Services – 1.1% | |||||
| 4,100 | Crown Castle International Corporation, (2) | 158,793 | |||
| 300 | Leap Wireless International, Inc. | 12,951 | |||
| 1,300 | Telephone and Data Systems Inc. | 61,451 | |||
| 400 | United States Cellular Corporation, (2) | 22,620 | |||
| 153,150 | Vodafone Group PLC, Sponsored ADR | 4,511,799 | |||
Total Wireless Telecommunication Services | 4,767,614 | ||||
| Total Common Stocks (cost $422,752,477) | 431,446,333 | ||||
| Shares | Description (1) | Value | |||
| INVESTMENT COMPANIES – 1.5% | |||||
| 100,000 | I-Shares Russell 1000 Value Index Fund | $ | 6,905,000 | ||
| Total Investment Companies (cost $7,214,632) | 6,905,000 | ||||
| Principal Amount (000) | Description (1) | Coupon | Maturity | Value | ||||||
| SHORT-TERM INVESTMENTS – 1.5% | ||||||||||
| $ | 6,662 | Repurchase Agreement with Fixed Income Clearing Corporation, dated 6/30/08, repurchase price $6,661,823, collateralized by $6,490,000 U.S. Treasury Notes, 4.500%, due 5/15/17, value $6,798,275 | 1.350% | 7/01/08 | $ | 6,661,573 | ||||
| Total Short-Term Investments (cost $6,661,573) | 6,661,573 | |||||||||
| Total Investments (cost $436,628,682) – 99.6% | 445,012,906 | |||||||||
| Other Assets Less Liabilities – 0.4% | 1,809,153 | |||||||||
| Net Assets – 100% | $ | 446,822,059 | ||||||||
| (1) | All percentages shown in the Portfolio of Investments are based on net assets. |
| (2) | Non-income producing. |
| ADR | American Depositary Receipt. |
See accompanying notes to financial statements.
34
Portfolio of Investments
Nuveen Balanced Municipal and Stock Fund
(currently known as Nuveen Conservative Allocation Fund)
June 30, 2008
| Shares | Description (1) | Value | |||
| COMMON STOCKS – 38.9% | |||||
| Aerospace & Defense – 0.4% | |||||
| 5,950 | Honeywell International Inc. | $ | 299,166 | ||
| Beverages – 1.3% | |||||
| 13,750 | PepsiCo, Inc. | 874,363 | |||
| Building Products – 0.6% | |||||
| 25,450 | Masco Corporation | 400,329 | |||
| Capital Markets – 3.9% | |||||
| 20,667 | Bank of New York Company, Inc. | 781,833 | |||
| 2,850 | Goldman Sachs Group, Inc. | 498,465 | |||
| 28,600 | JPMorgan Chase & Co. | 981,266 | |||
| 8,605 | Morgan Stanley | 310,382 | |||
Total Capital Markets | 2,571,946 | ||||
| Chemicals – 1.6% | |||||
| 24,000 | E.I. Du Pont de Nemours and Company | 1,029,360 | |||
| Commercial Banks – 1.3% | |||||
| 11,150 | SunTrust Banks, Inc. | 403,853 | |||
| 20,450 | Wells Fargo & Company | 485,688 | |||
Total Commercial Banks | 889,541 | ||||
| Communication Equipment – 1.1% | |||||
| 30,650 | Cisco Systems, Inc., (2) | 712,918 | |||
| Computers & Peripherals – 1.3% | |||||
| 20,050 | Hewlett-Packard Company | 886,410 | |||
| Consumer Finance – 0.6% | |||||
| 11,000 | Capital One Financial Corporation | 418,110 | |||
| Diversified Telecommunication Services – 1.8% | |||||
| 34,262 | AT&T Inc. | 1,154,286 | |||
| Electronic Equipment & Instruments – 0.6% | |||||
| 11,850 | Tyco Electronics, Limited | 424,466 | |||
| Energy Equipment & Services – 1.2% | |||||
| 9,250 | Baker Hughes Incorporated | 807,895 | |||
| Food & Staples Retailing – 0.9% | |||||
| 14,750 | CVS Caremark Corporation | 583,658 | |||
| Health Care Equipment & Supplies – 0.6% | |||||
| 8,050 | Covidien Limited | 385,515 | |||
| Hotels, Restaurants & Leisure – 0.2% | |||||
| 10,182 | Intercontinental Hotels Group PLC, ADR | 135,726 | |||
| Household Products – 1.2% | |||||
| 12,650 | Procter & Gamble Company | 769,247 | |||
| Industrial Conglomerates – 2.4% | |||||
| 32,448 | General Electric Company | 866,037 | |||
| 2,050 | Siemens AG, Sponsored ADR | 225,767 | |||
| 10,550 | Textron Inc. | 505,662 | |||
Total Industrial Conglomerates | 1,597,466 | ||||
35
Portfolio of Investments
Nuveen Balanced Municipal and Stock Fund (continued)
(currently known as Nuveen Conservative Allocation Fund)
June 30, 2008
| Shares | Description (1) | Value | |||
| Insurance – 1.8% | |||||
| 11,000 | Ace Limited | $ | 605,990 | ||
| 12,700 | Allstate Corporation | 578,993 | |||
Total Insurance | 1,184,983 | ||||
| Media – 2.8% | |||||
| 37,550 | News Corporation, Class A | 564,752 | |||
| 12,050 | Omnicom Group Inc. | 540,804 | |||
| 23,100 | Viacom Inc., Class B, (2) | 705,474 | |||
Total Media | 1,811,030 | ||||
| Multiline Retail – 0.8% | |||||
| 10,850 | Target Corporation | 504,417 | |||
| Oil, Gas & Consumable Fuels – 4.9% | |||||
| 6,000 | BP Amoco PLC | 417,420 | |||
| 10,550 | Exxon Mobil Corporation | 929,772 | |||
| 14,250 | Marathon Oil Corporation | 739,148 | |||
| 7,000 | Occidental Petroleum Corporation | 629,020 | |||
| 7,687 | XTO Energy, Inc. | 526,636 | |||
Total Oil, Gas & Consumable Fuels | 3,241,996 | ||||
| Personal Products – 0.6% | |||||
| 10,100 | Avon Products, Inc. | 363,802 | |||
| Pharmaceuticals – 4.1% | |||||
| 12,500 | Johnson & Johnson | 804,250 | |||
| 33,900 | Schering-Plough Corporation | 667,491 | |||
| 25,450 | Wyeth | 1,220,580 | |||
Total Pharmaceuticals | 2,692,321 | ||||
| Semiconductors & Equipment – 0.9% | |||||
| 20,150 | Texas Instruments Incorporated | 567,424 | |||
| Specialized REIT – 0.6% | |||||
| 27,200 | Host Hotels & Resorts Inc. | 371,280 | |||
| Wireless Telecommunication Services – 1.4% | |||||
| 30,700 | Vodafone Group PLC, Sponsored ADR | 904,422 | |||
| Total Common Stocks (cost $25,798,075) | 25,582,077 | ||||
| Principal Amount (000) | Description (1) | Optional Call Provisions (3) | Ratings (4) | Value | ||||||
| MUNICIPAL BONDS – 59.7% | ||||||||||
| Alaska – 1.2% | ||||||||||
| $ | 895 | Northern Tobacco Securitization Corporation, Alaska, Tobacco Settlement Asset-Backed Bonds, Series 2006A, 4.625%, 6/01/23 | 6/14 at 100.00 | Baa3 | $ | 812,554 | ||||
| California – 7.3% | ||||||||||
| 1,000 | Alameda Corridor Transportation Authority, California, Subordinate Lien Revenue Bonds, Series 2004A, 0.000%, 10/01/25 – AMBAC Insured | 10/17 at 100.00 | AA | 828,930 | ||||||
| 500 | Calleguas-Las Virgenes Public Finance Authority, California, Water Revenue Bonds, Calleguas Municipal Water District, Series 2003B, 5.250%, 7/01/19 – MBIA Insured | 7/13 at 100.00 | AA+ | 524,965 | ||||||
36
| Principal Amount (000) | Description (1) | Optional Call Provisions (3) | Ratings (4) | Value | |||||||
| California (continued) | |||||||||||
| $ | 420 | Golden State Tobacco Securitization Corporation, California, Enhanced Tobacco Settlement Asset-Backed Bonds, Series 2007A-1, 4.500%, 6/01/27 | 6/17 at 100.00 | BBB | $ | 375,207 | |||||
| 250 | M-S-R Public Power Agency, California, Revenue Refunding Bonds, San Juan Project, Series 2001I, 5.000%, 7/01/17 – MBIA Insured | 7/11 at 100.00 | AA | 258,580 | |||||||
| 250 | Orange County, California, Refunding Recovery Bonds, Series 1995A, 6.000%, 6/01/10 – MBIA Insured (ETM) | No Opt. Call | AA | (5) | 266,090 | ||||||
| 1,495 | Palmdale Civic Authority, California, Revenue Refinancing Bonds, Civic Center Project, Series 1997A, 5.375%, 7/01/12 – MBIA Insured | 7/08 at 101.00 | AA | 1,513,058 | |||||||
| 800 | San Diego County, California, Certificates of Participation, Burnham Institute, Series 1999, 5.700%, 9/01/11 (Pre-refunded 9/01/09) | 9/09 at 101.00 | N/R | (5) | 833,592 | ||||||
| 250 | San Diego County, California, Certificates of Participation, Burnham Institute, Series 2006, 5.000%, 9/01/34 | 9/15 at 102.00 | Baa3 | 220,020 | |||||||
| 4,965 | Total California | 4,820,442 | |||||||||
| Colorado – 6.5% | |||||||||||
| 750 | Colorado Health Facilities Authority, Revenue Bonds, Longmont United Hospital, Series 2006B, 5.000%, 12/01/23 – RAAI Insured | 12/16 at 100.00 | A | 725,700 | |||||||
| 250 | Colorado Health Facilities Authority, Revenue Bonds, Vail Valley Medical Center, Series 2004, 5.000%, 1/15/17 | 1/15 at 100.00 | BBB+ | 250,270 | |||||||
| 1,000 | Denver City and County, Colorado, Airport Special Facilities Revenue Bonds, Rental Car Projects, Series 1999A, 6.000%, 1/01/13 – MBIA Insured (Alternative Minimum Tax) | 1/09 at 101.00 | AA | 1,016,900 | |||||||
| E-470 Public Highway Authority, Colorado, Toll Revenue Bonds, Series 2004B: | |||||||||||
| 370 | 0.000%, 9/01/28 – MBIA Insured | 9/20 at 63.98 | AA | 113,623 | |||||||
| 2,000 | 0.000%, 3/01/36 – MBIA Insured | 9/2 at 100.00 | AA | 380,300 | |||||||
| 2,000 | Metropolitan Football Stadium District, Colorado, Sales Tax Revenue Bonds, Series 1999A, 0.000%, 1/01/12 – MBIA Insured | No Opt. Call | AA | 1,754,738 | |||||||
| 160 | Northwest Parkway Public Highway Authority, Colorado, Senior Lien Revenue Bonds, Series 2001B, 0.000%, 6/15/27 (Pre-refunded 6/15/11) – AMBAC Insured | 6/11 at 38.04 | AA | (5) | 54,350 | ||||||
| 6,530 | Total Colorado | 4,295,881 | |||||||||
| District of Columbia – 0.6% | |||||||||||
| 255 | District of Columbia, General Obligation Refunding Bonds, Series 1994A-1, 6.500%, 6/01/10 – MBIA Insured | No Opt. Call | AAA | 271,037 | |||||||
| 130 | Washington Convention Center Authority, District of Columbia, Senior Lien Dedicated Tax Revenue Bonds, Series 1998, 5.000%, 10/01/21 (Pre-refunded 10/01/08) – AMBAC Insured | 10/08 at 101.00 | AA | (5) | 132,301 | ||||||
| 385 | Total District of Columbia | 403,338 | |||||||||
| Florida – 1.3% | |||||||||||
| 500 | Escambia County Health Facilities Authority, Florida, Revenue Bonds, Ascension Health Credit Group, Series 2003A, 5.250%, 11/15/11 | No Opt. Call | Aa1 | 526,060 | |||||||
| 350 | Jacksonville Economic Development Commission, Florida, Healthcare Facilities Revenue Bonds, Mayo Clinic, Series 2001A, 5.500%, 11/15/36 | 11/11 at 101.00 | AA | 352,909 | |||||||
| 850 | Total Florida | 878,969 | |||||||||
| Idaho – 0.0% | |||||||||||
| 30 | Idaho Housing and Finance Association, Single Family Mortgage Bonds, Series 1997D, 5.950%, 7/01/09 (Alternative Minimum Tax) | 7/08 at 101.00 | Aa3 | 30,737 | |||||||
| Illinois – 5.9% | |||||||||||
| 745 | Bolingbrook, Will and DuPage Counties, Illinois, Residential Mortgage Revenue Bonds, Series 1979, 7.500%, 8/01/10 – FGIC Insured (ETM) | No Opt. Call | N/R | (5) | 788,687 | ||||||
37
Portfolio of Investments
Nuveen Balanced Municipal and Stock Fund (continued)
(currently known as Nuveen Conservative Allocation Fund)
June 30, 2008
| Principal Amount (000) | Description (1) | Optional Call Provisions (3) | Ratings (4) | Value | |||||||
| Illinois (continued) | |||||||||||
| Chicago Board of Education, Illinois, Unlimited Tax General Obligation Bonds, Dedicated Tax Revenues, Series 1998B-1: | |||||||||||
| $ | 2,205 | 0.000%, 12/01/24 – FGIC Insured | No Opt. Call | AA– | $ | 940,102 | |||||
| 2,205 | 0.000%, 12/01/29 – FGIC Insured | No Opt. Call | Aaa | 699,889 | |||||||
| Illinois Development Finance Authority, Economic Development Revenue Bonds, Latin School of Chicago, Series 1998: | |||||||||||
| 270 | 5.200%, 8/01/11 (Pre-refunded 8/01/08) | 8/08 at 100.00 | Baa2 | (5) | 270,772 | ||||||
| 200 | 5.250%, 8/01/12 (Pre-refunded 8/01/08) | 8/08 at 100.00 | Baa2 | (5) | 200,580 | ||||||
| 580 | 5.300%, 8/01/13 (Pre-refunded 8/01/08) | 8/08 at 100.00 | Baa2 | (5) | 581,705 | ||||||
| 120 | Illinois Health Facilities Authority, Revenue Bonds, Condell Medical Center, Series 2000, 6.000%, 5/15/10 | No Opt. Call | Baa3 | 124,961 | |||||||
| 250 | Illinois Health Facilities Authority, Revenue Bonds, Lake Forest Hospital, Series 2002A, 6.000%, 7/01/17 | 7/12 at 100.00 | A– | 261,503 | |||||||
| 6,575 | Total Illinois | 3,868,199 | |||||||||
| Indiana – 1.6% | |||||||||||
| 300 | Anderson, Indiana, Economic Development Revenue Bonds, Anderson University, Series 2007, 5.000%, 10/01/24 | 4/14 at 100.00 | N/R | 273,018 | |||||||
| 860 | St. Joseph County Hospital Authority, Indiana, Revenue Bonds, Memorial Health System, Series 1998A, 4.625%, 8/15/28 – MBIA Insured | 8/08 at 101.00 | AA | 804,814 | |||||||
| 1,160 | Total Indiana | 1,077,832 | |||||||||
| Iowa – 1.3% | |||||||||||
| 970 | Iowa Finance Authority, Health Facility Revenue Bonds, Care Initiatives Project, Series 2006A, 5.000%, 7/01/19 | 7/16 at 100.00 | BBB– | 870,633 | |||||||
| Louisiana – 0.5% | |||||||||||
| 340 | Louisiana Public Facilities Authority, Revenue Bonds, Baton Rouge General Hospital, Series 2004, 5.250%, 7/01/24 – MBIA Insured | 7/14 at 100.00 | AA | 345,593 | |||||||
| Maine – 0.4% | |||||||||||
| 255 | Winslow, Maine, General Obligation Tax Increment Financing Bonds, Crowe Rope Industries, Series 1997A, 6.000%, 3/01/11 – MBIA Insured (Alternative Minimum Tax) | 9/08 at 101.00 | AA | 258,231 | |||||||
| Massachusetts – 2.1% | |||||||||||
| 885 | Massachusetts Development Finance Agency, Resource Recovery Revenue Bonds, Ogden Haverhill Associates, Series 1998B, 5.200%, 12/01/13 (Alternative Minimum Tax) | 12/08 at 102.00 | BBB | 867,592 | |||||||
| 495 | Massachusetts Turnpike Authority, Western Turnpike Revenue Bonds, Series 1997A, 5.550%, 1/01/17 – MBIA Insured | 7/08 at 100.00 | AA | 499,113 | |||||||
| 1,380 | Total Massachusetts | 1,366,705 | |||||||||
| Michigan – 2.4% | |||||||||||
| 540 | Detroit, Michigan, General Obligation Bonds, Series 2003A, 5.250%, 4/01/19 – XLCA Insured | 4/13 at 100.00 | BBB | 538,110 | |||||||
| 465 | Kent Hospital Finance Authority, Michigan, Revenue Bonds, Spectrum Health, Series 2005B, 5.000%, 7/15/11 | No Opt. Call | AA | 483,209 | |||||||
| 540 | Michigan State Hospital Finance Authority, Hospital Revenue Bonds, Detroit Medical Center Obligated Group, Series 1998A, 5.000%, 8/15/13 | 8/08 at 101.00 | BB– | 532,899 | |||||||
| 1,545 | Total Michigan | 1,554,218 | |||||||||
| Minnesota – 0.8% | |||||||||||
| 500 | Minnesota, General Obligation Bonds, Series 1998, 5.000%, 11/01/17 (Pre-refunded 11/01/08) | 11/08 at 100.00 | AAA | 505,500 | |||||||
| Mississippi – 0.7% | |||||||||||
| 500 | Mississippi Development Bank, Revenue Bonds, Mississippi Municipal Energy Agency, Mississippi Power, Series 2006A, 5.000%, 3/01/21 – XLCA Insured | 3/16 at 100.00 | Baa2 | 480,230 | |||||||
38
| Principal Amount (000) | Description (1) | Optional Call Provisions (3) | Ratings (4) | Value | |||||||
| Missouri – 1.3% | |||||||||||
| $ | 1,000 | Kansas City Municipal Assistance Corporation, Missouri, Leasehold Revenue Bonds, Series 2004B-1, 0.000%, 4/15/27 – AMBAC Insured | No Opt. Call | AA | $ | 367,400 | |||||
| 500 | Missouri Joint Municipal Electric Utility Commission, Plum Point Project, Revenue Bonds, Series 2006, 5.000%, 1/01/21 – MBIA Insured | 1/16 at 100.00 | AA | 497,245 | |||||||
| 1,500 | Total Missouri | 864,645 | |||||||||
| Nevada – 0.8% | |||||||||||
| 480 | Clark County, Nevada, Motor Vehicle Fuel Tax Highway Improvement Revenue Bonds, Series 2003, 5.125%, 7/01/17 – AMBAC Insured | 7/13 at 100.00 | AA | 504,600 | |||||||
| 10 | Nevada Housing Division, Single Family Mortgage Bonds, Mezzanine Series 1997B-1, 6.000%, 4/01/15 (Alternative Minimum Tax) | 10/08 at 101.00 | Aa2 | 10,117 | |||||||
| 490 | Total Nevada | 514,717 | |||||||||
| New Jersey – 1.2% | |||||||||||
| 500 | New Jersey Transportation Trust Fund Authority, Transportation System Bonds, Series 2006A, 5.250%, 12/15/22 – FSA Insured | No Opt. Call | AAA | 539,530 | |||||||
| 225 | Tobacco Settlement Financing Corporation, New Jersey, Tobacco Settlement Asset-Backed Bonds, Series 2002, 5.750%, 6/01/32 (Pre-refunded 6/01/12) | 6/12 at 100.00 | AAA | 239,558 | |||||||
| 725 | Total New Jersey | 779,088 | |||||||||
| New York – 2.0% | |||||||||||
| 500 | Dormitory Authority of the State of New York, FHA-Insured Mortgage Revenue Bonds, Montefiore Hospital, Series 2004, 5.000%, 2/01/19 – FGIC Insured | 2/15 at 100.00 | N/R | 506,300 | |||||||
| 295 | New York City, New York, General Obligation Bonds, Fiscal Series 1998D, 5.500%, 8/01/10 | 8/08 at 100.50 | AA | 298,620 | |||||||
| 500 | New York State Tobacco Settlement Financing Corporation, Tobacco Settlement Asset-Backed and State Contingency Contract-Backed Bonds, Series 2003B-1C, 5.500%, 6/01/16 | 6/11 at 100.00 | AA– | 519,200 | |||||||
| 1,295 | Total New York | 1,324,120 | |||||||||
| North Carolina – 1.0% | |||||||||||
| 580 | North Carolina Municipal Power Agency 1, Catawba Electric Revenue Bonds, Series 1980, 10.500%, 1/01/10 (ETM) | No Opt. Call | AAA | 625,937 | |||||||
| Ohio – 1.9% | |||||||||||
| 250 | Cuyahoga County, Ohio, Revenue Refunding Bonds, Cleveland Clinic Health System, Series 2003A, 5.750%, 1/01/22 | 7/13 at 100.00 | AA– | 262,378 | |||||||
| 1,000 | Lorain County, Ohio, Healthcare Facilities Revenue Refunding Bonds, Kendal at Oberlin, Series 1998A, 5.375%, 2/01/12 | 8/08 at 101.00 | BBB+ | 1,005,490 | |||||||
| 1,250 | Total Ohio | 1,267,868 | |||||||||
| Oklahoma – 0.7% | |||||||||||
| 470 | Edmond Public Works Authority, Oklahoma, Utility System Revenue Refunding Bonds, Series 1999, 5.600%, 7/01/19 (Pre-refunded 7/01/09) – AMBAC Insured | 7/09 at 100.00 | AA | (5) | 487,885 | ||||||
| Oregon – 0.5% | |||||||||||
| 325 | Oregon Housing and Community Services Department, Single Family Mortgage Revenue Bonds, Series 2004H, 5.125%, 1/01/29 (Alternative Minimum Tax) | 1/14 at 100.00 | Aa2 | 327,556 | |||||||
| Pennsylvania – 1.0% | |||||||||||
| 220 | Allentown, Pennsylvania, General Obligation Bonds, Series 2003, 5.500%, 10/01/19 – FGIC Insured | 10/13 at 100.00 | Baa1 | 234,782 | |||||||
| 40 | Allentown, Pennsylvania, General Obligation Bonds, Series 2003, 5.500%, 10/01/19 (Pre-refunded 10/01/13) – FGIC Insured | 10/13 at 100.00 | Baa1 | (5) | 43,977 | ||||||
| 360 | The Hospitals and Higher Education Facilities Authority of Philadelphia, Pennsylvania, Health System Revenue Bonds, Series 1998A, Jefferson Health System, 5.125%, 5/15/21 – MBIA Insured | 5/09 at 100.50 | AA | 363,881 | |||||||
| 620 | Total Pennsylvania | 642,640 | |||||||||
39
Portfolio of Investments
Nuveen Balanced Municipal and Stock Fund (continued)
(currently known as Nuveen Conservative Allocation Fund)
June 30, 2008
| Principal Amount (000) | Description (1) | Optional Call Provisions (3) | Ratings (4) | Value | |||||||
| South Carolina – 4.1% | |||||||||||
| $ | 250 | Dorchester County School District 2, South Carolina, Installment Purchase Revenue Bonds, GROWTH, Series 2004, 5.250%, 12/01/20 | 12/14 at 100.00 | A | $ | 255,368 | |||||
| 1,000 | Greenville County School District, South Carolina, Installment Purchase Revenue Bonds, Series 2002, 5.875%, 12/01/19 (Pre-refunded 12/01/12) | 12/12 at 101.00 | AA– | (5) | 1,110,570 | ||||||
| 500 | Medical University Hospital Authority, South Carolina, FHA-Insured Mortgage Revenue Bonds, Series 2004A, 5.250%, 8/15/20 – MBIA Insured | 8/14 at 100.00 | AA | 519,690 | |||||||
| 750 | Tobacco Settlement Revenue Management Authority, South Carolina, Tobacco Settlement Asset-Backed Bonds, Series 2001B, 6.000%, 5/15/22 | 5/11 at 101.00 | BBB | 791,393 | |||||||
| 2,500 | Total South Carolina | 2,677,021 | |||||||||
| Texas – 5.3% | |||||||||||
| 2,000 | Abilene Higher Education Authority, Inc., Texas, Student Loan Revenue Bonds, Subordinate Series 1998B, 5.050%, 7/01/13 (Alternative Minimum Tax) | 11/08 at 100.00 | Aa3 | 2,004,297 | |||||||
| 500 | Dallas Area Rapid Transit, Texas, Senior Lien Sales Tax Revenue Bonds, Series 2001, 5.000%, 12/01/31 (Pre-refunded 12/01/11) – AMBAC Insured | 12/11 at 100.00 | AAA | 530,435 | |||||||
| 1,550 | Harris County-Houston Sports Authority, Texas, Junior Lien Revenue Bonds, Series 2001H, 0.000%, 11/15/30 – MBIA Insured | No Opt. Call | AA | 404,922 | |||||||
| 630 | Houston, Texas, Hotel Occupancy Tax and Special Revenue Bonds, Convention and Entertainment Project, Series 2001B, 0.000%, 9/01/30 – AMBAC Insured | No Opt. Call | AA | 178,126 | |||||||
| 335 | Live Oak, Texas, General Obligation Bonds, Series 2004, 5.250%, 8/01/20 – MBIA Insured | 8/14 at 100.00 | A2 | 351,780 | |||||||
| 5,015 | Total Texas | 3,469,560 | |||||||||
| Utah – 0.4% | |||||||||||
| 260 | Eagle Mountain, Utah, Gas and Electric Revenue Bonds, Series 2005, 5.000%, 6/01/24 – RAAI Insured | 6/15 at 100.00 | A | 253,035 | |||||||
| Virginia – 1.6% | |||||||||||
| 250 | Fairfax County Industrial Development Authority, Virginia, Healthcare Revenue Refunding Bonds, Inova Health System, Series 1998A, 5.000%, 8/15/25 | 8/08 at 101.00 | AA+ | 250,015 | |||||||
| 830 | Metropolitan District of Columbia Airports Authority, Virginia, Airport System Revenue Bonds, Series 1998B, 5.000%, 10/01/28 – MBIA Insured (Alternative Minimum Tax) | 10/08 at 101.00 | AA | 787,388 | |||||||
| 1,080 | Total Virginia | 1,037,403 | |||||||||
| Washington – 3.6% | |||||||||||
| 1,260 | Central Puget Sound Regional Transit Authority, Washington, Sales Tax and Motor Vehicle Excise Tax Bonds, Series 1999, 4.750%, 2/01/28 – FGIC Insured | 2/09 at 101.00 | AAA | 1,236,323 | |||||||
| 465 | Cowlitz County Public Utilities District 1, Washington, Electric Production Revenue Bonds, Series 2004, 5.000%, 9/01/22 – FGIC Insured | 9/14 at 100.00 | A– | 467,418 | |||||||
| 650 | Washington State Tobacco Settlement Authority, Tobacco Settlement Asset-Backed Revenue Bonds, Series 2002, 6.500%, 6/01/26 | 6/13 at 100.00 | BBB | 658,119 | |||||||
| 2,375 | Total Washington | 2,361,860 | |||||||||
40
| Principal Amount (000) | Description (1) | Optional Call Provisions (3) | Ratings (4) | Value | ||||||
| West Virginia – 0.7% | ||||||||||
| $ | 500 | West Virginia Hospital Finance Authority, Revenue Bonds, United Hospital Center Inc. Project, Series 2006A, 4.500%, 6/01/26 – AMBAC Insured | 6/16 at 100.00 | AA | $ | 467,805 | ||||
| Wisconsin – 1.0% | ||||||||||
| 625 | Badger Tobacco Asset Securitization Corporation, Wisconsin, Tobacco Settlement Asset-Backed Bonds, Series 2002, 6.375%, 6/01/32 | 6/12 at 100.00 | BBB | 627,206 | ||||||
| $ | 46,490 | Total Municipal Bonds (cost $39,679,958) | 39,297,408 | |||||||
| Total Investments (cost $65,478,033) – 98.6% | 64,879,485 | |||||||||
| Other Assets Less Liabilities – 1.4% | 939,018 | |||||||||
| Net Assets – 100% | $ | 65,818,503 | ||||||||
| (1) | All percentages shown in the Portfolio of Investments are based on net assets. |
| (2) | Non-income producing. |
| (3) | Optional Call Provisions (not covered by the report of independent registered public accounting firm): Dates (month and year) and prices of the earliest optional call or redemption. There may be other call provisions at varying prices at later dates. Certain mortgage-backed securities may be subject to periodic principal paydowns. |
| (4) | Ratings (not covered by the report of independent registered public accounting firm): Using the higher of Standard & Poor’s Group (“Standard & Poor’s”) or Moody’s Investor Service, Inc. (“Moody’s”) rating. Ratings below BBB by Standard & Poor’s or Baa by Moody’s are considered to be below investment grade. |
| The Portfolio of Investments may reflect the ratings on certain bonds insured by AMBAC, FGIC, MBIA, RAAI and XLCA as of June 30, 2008. Please see the Portfolio Managers’ Commentary for an expanded discussion of the affect on the Fund of changes to the ratings of certain bonds in the portfolio resulting from changes to the ratings of the underlying insurers both during the period and after period end. |
| (5) | Backed by an escrow or trust containing sufficient U.S. Government or U.S. Government agency securities which ensure the timely payment of principal and interest. Such investments are normally considered to be equivalent to AAA rated securities. |
| N/R | Not rated. |
| (ETM) | Escrowed to maturity. |
| ADR | American Depositary Receipt. |
See accompanying notes to financial statements.
41
Portfolio of Investments
Nuveen Balanced Stock and Bond Fund
(currently known as Nuveen Moderate Allocation Fund)
June 30, 2008
| Shares | Description (1) | Value | |||
| COMMON STOCKS – 57.9% | |||||
| Aerospace & Defense – 0.7% | |||||
| 7,350 | Honeywell International Inc. | $ | 369,558 | ||
| Beverages – 1.9% | |||||
| 15,650 | PepsiCo, Inc. | 995,184 | |||
| Building Products – 0.9% | |||||
| 29,500 | Masco Corporation | 464,035 | |||
| Capital Markets – 5.8% | |||||
| 24,663 | Bank of New York Company, Inc. | 933,001 | |||
| 3,400 | Goldman Sachs Group, Inc. | 594,660 | |||
| 33,900 | JPMorgan Chase & Co. | 1,163,109 | |||
| 9,904 | Morgan Stanley | 357,237 | |||
Total Capital Markets | 3,048,007 | ||||
| Chemicals – 2.3% | |||||
| 28,200 | E.I. Du Pont de Nemours and Company | 1,209,498 | |||
| Commercial Banks – 2.0% | |||||
| 12,950 | SunTrust Banks, Inc. | 469,049 | |||
| 24,550 | Wells Fargo & Company | 583,063 | |||
Total Commercial Banks | 1,052,112 | ||||
| Communications Equipment – 1.6% | |||||
| 36,500 | Cisco Systems, Inc., (2) | 848,990 | |||
| Computers & Peripherals – 2.0% | |||||
| 23,850 | Hewlett-Packard Company | 1,054,409 | |||
| Consumer Finance – 1.0% | |||||
| 13,200 | Capital One Financial Corporation | 501,732 | |||
| Diversified Telecommunication Services – 2.7% | |||||
| 41,045 | AT&T Inc. | 1,382,806 | |||
| Electronic Equipment & Instruments – 1.0% | |||||
| 14,050 | Tyco Electronics, Limited | 503,271 | |||
| Energy Equipment & Services – 1.8% | |||||
| 11,000 | Baker Hughes Incorporated | 960,740 | |||
| Food & Staples Retailing – 1.3% | |||||
| 16,850 | CVS Caremark Corporation | 666,755 | |||
| Health Care Equipment & Supplies – 0.9% | |||||
| 9,500 | Covidien Limited | 454,955 | |||
| Hotels, Restaurants & Leisure – 0.3% | |||||
| 12,169 | Intercontinental Hotels Group PLC, ADR | 162,213 | |||
| Household Products – 1.8% | |||||
| 15,000 | Procter & Gamble Company | 912,150 | |||
| Industrial Conglomerates – 3.7% | |||||
| 40,097 | General Electric Company | 1,070,189 | |||
| 2,250 | Siemens AG, Sponsored ADR | 247,793 | |||
| 12,500 | Textron Inc. | 599,125 | |||
Total Industrial Conglomerates | 1,917,107 | ||||
42
| Shares | Description (1) | Value | |||
| Insurance – 2.7% | |||||
| 13,200 | Ace Limited | $ | 727,188 | ||
| 14,950 | Allstate Corporation | 681,571 | |||
Total Insurance | 1,408,759 | ||||
| Media – 4.1% | |||||
| 44,000 | News Corporation, Class A | 661,760 | |||
| 13,800 | Omnicom Group Inc. | 619,344 | |||
| 27,500 | Viacom Inc., Class B, (2) | 839,850 | |||
Total Media | 2,120,954 | ||||
| Multiline Retail – 1.1% | |||||
| 12,800 | Target Corporation | 595,071 | |||
| Oil, Gas & Consumable Fuels – 7.3% | |||||
| 7,000 | BP Amoco PLC | 486,990 | |||
| 12,350 | Exxon Mobil Corporation | 1,088,406 | |||
| 16,650 | Marathon Oil Corporation | 863,636 | |||
| 8,350 | Occidental Petroleum Corporation | 750,331 | |||
| 9,037 | XTO Energy, Inc. | 619,125 | |||
Total Oil, Gas & Consumable Fuels | 3,808,488 | ||||
| Personal Products – 0.8% | |||||
| 11,800 | Avon Products, Inc. | 425,035 | |||
| Pharmaceuticals – 6.0% | |||||
| 14,800 | Johnson & Johnson | 952,232 | |||
| 39,750 | Schering-Plough Corporation | 782,678 | |||
| 29,200 | Wyeth | 1,400,432 | |||
Total Pharmaceuticals | 3,135,342 | ||||
| Specialized REIT – 0.9% | |||||
| 32,450 | Host Hotels & Resorts Inc. | 442,942 | |||
| Semiconductors & Equipment – 1.3% | |||||
| 24,000 | Texas Instruments Incorporated | 675,839 | |||
| Wireless Telecommunication Services – 2.0% | |||||
| 36,000 | Vodafone Group PLC, Sponsored ADR | 1,060,560 | |||
| Total Common Stocks (cost $30,612,545) | 30,176,512 | ||||
| Principal Amount (000) | Description (1) | Coupon | Maturity | Ratings (3) | Value | |||||||
| U.S. GOVERNMENT AND AGENCY OBLIGATIONS – 40.7% | ||||||||||||
| $ | 2,935 | U.S. Treasury Bonds | 7.250% | 5/15/16 | Aaa | $ | 3,607,070 | |||||
| 2,350 | U.S. Treasury Bonds | 7.250% | 8/15/22 | Aaa | 3,028,562 | |||||||
| 1,880 | U.S. Treasury Bonds | 6.000% | 2/15/26 | Aaa | 2,202,392 | |||||||
| 2,400 | U.S. Treasury Notes | 4.750% | 11/15/08 | Aaa | 2,423,813 | |||||||
| 2,170 | U.S. Treasury Notes | 3.875% | 5/15/09 | Aaa | 2,198,992 | |||||||
| 3,880 | U.S. Treasury Notes | 5.750% | 8/15/10 | Aaa | 4,127,656 | |||||||
| 3,435 | U.S. Treasury Notes | 4.250% | 11/15/13 | Aaa | 3,585,821 | |||||||
| $ | 19,050 | Total U.S. Government and Agency Obligations (cost $19,895,398) | 21,174,306 | |||||||||
43
Portfolio of Investments
Nuveen Balanced Stock and Bond Fund (continued)
(currently known as Nuveen Moderate Allocation Fund)
June 30, 2008
| Principal Amount (000) | Description (1) | Coupon | Maturity | Value | ||||||
| SHORT-TERM INVESTMENTS – 1.6% | ||||||||||
| $ | 830 | Repurchase Agreement with Fixed Income Clearing Corporation, dated 6/30/08, repurchase price $829,880, collateralized by $810,000 U.S. Treasury Notes, 4.500%, due 5/15/17, value $848,475 | 1.350% | 7/01/08 | $ | 829,849 | ||||
| Total Short-Term Investments (cost $829,849) | 829,849 | |||||||||
| Total Investments (cost $51,337,792) – 100.2% | 52,180,667 | |||||||||
| Other Assets Less Liabilities – (0.2)% | (105,671) | |||||||||
| Net Assets – 100% | $ | 52,074,996 | ||||||||
| (1) | All percentages shown in the Portfolio of Investments are based on net assets. |
| (2) | Non-income producing. |
| (3) | Ratings (not covered by the report of independent registered public accounting firm): Using the higher of Standard & Poor’s Group (“Standard & Poor’s”) or Moody’s Investor Service, Inc. (“Moody’s”) rating. Ratings below BBB by Standard & Poor’s or Baa by Moody’s are considered to be below investment grade. |
| ADR | American Depositary Receipt. |
See accompanying notes to financial statements.
44
Statement of Assets and Liabilities
June 30, 2008
| Multi-Manager Large-Cap Value | Municipal and Stock (1) | Stock and Bond (2) | |||||||||
Assets | |||||||||||
Investments, at value (cost $436,628,682, $65,478,033 and $51,337,792, respectively) | $ | 445,012,906 | $ | 64,879,485 | $ | 52,180,667 | |||||
Cash | — | 454,720 | — | ||||||||
Receivables: | |||||||||||
Dividends | 808,960 | 66,655 | 77,710 | ||||||||
Interest | 250 | 577,823 | 261,701 | ||||||||
Investments sold | 36,967,229 | 30,000 | 57,485 | ||||||||
Reclaims | 19,025 | — | — | ||||||||
Shares sold | 130,105 | 40,991 | 76,023 | ||||||||
Other assets | 149,054 | 26,246 | 14,689 | ||||||||
Total assets | 483,087,529 | 66,075,920 | 52,668,275 | ||||||||
Liabilities | |||||||||||
Payables: | |||||||||||
Investments purchased | 34,884,250 | — | 47,855 | ||||||||
Shares redeemed | 563,018 | 118,812 | 379,239 | ||||||||
Accrued expenses: | |||||||||||
Management fees | 277,318 | 16,934 | 21,711 | ||||||||
12b-1 distribution and service fees | 113,028 | 21,038 | 17,243 | ||||||||
Other | 427,856 | 69,262 | 49,539 | ||||||||
Dividends payable | — | 31,371 | 77,692 | ||||||||
Total liabilities | 36,265,470 | 257,417 | 593,279 | ||||||||
Net assets | $ | 446,822,059 | $ | 65,818,503 | $ | 52,074,996 | |||||
Class A Shares | |||||||||||
Net assets | $ | 389,240,328 | $ | 52,785,381 | $ | 29,612,341 | |||||
Shares outstanding | 17,277,396 | 2,310,636 | 1,325,097 | ||||||||
Net asset value per share | $ | 22.53 | $ | 22.84 | $ | 22.35 | |||||
Offering price per share (net asset value per share plus | $ | 23.90 | $ | 24.23 | $ | 23.71 | |||||
Class B Shares | |||||||||||
Net assets | $ | 8,890,987 | $ | 3,480,466 | $ | 5,535,004 | |||||
Shares outstanding | 406,029 | 142,481 | 247,706 | ||||||||
Net asset value and offering price per share | $ | 21.90 | $ | 24.43 | $ | 22.35 | |||||
Class C Shares | |||||||||||
Net assets | $ | 25,006,822 | $ | 8,191,749 | $ | 7,265,327 | |||||
Shares outstanding | 1,144,098 | 335,810 | 324,799 | ||||||||
Net asset value and offering price per share | $ | 21.86 | $ | 24.39 | $ | 22.37 | |||||
Class I Shares (3) | |||||||||||
Net assets | $ | 23,683,922 | $ | 1,360,907 | $ | 9,662,324 | |||||
Shares outstanding | 1,046,240 | 61,180 | 432,395 | ||||||||
Net asset value and offering price per share | $ | 22.64 | $ | 22.24 | $ | 22.35 | |||||
Net Assets Consist of: | |||||||||||
Capital paid-in | $ | 408,863,445 | $ | 65,125,860 | $ | 50,752,091 | |||||
Undistributed (Over-distribution of) net investment income | 3,610,339 | 373,852 | (297,012 | ) | |||||||
Accumulated net realized gain (loss) from investments | 25,964,051 | 917,339 | 777,042 | ||||||||
Net unrealized appreciation (depreciation) of investments | 8,384,224 | (598,548 | ) | 842,875 | |||||||
Net assets | $ | 446,822,059 | $ | 65,818,503 | $ | 52,074,996 | |||||
| (1) | Effective July 7, 2008, the Nuveen Balanced Municipal and Stock Fund changed its name to Nuveen Conservative Allocation Fund. |
| (2) | Effective August 1, 2008, the Nuveen Balanced Stock and Bond Fund changed its name to Nuveen Moderate Allocation Fund. |
| (3) | Effective May 1, 2008, Class R Shares were renamed Class I Shares. |
See accompanying notes to financial statements.
45
Statement of Operations
Year Ended June 30, 2008
| Multi-Manager Large-Cap Value | Municipal and Stock (1) | Stock and Bond (2) | ||||||||||
Investment Income | ||||||||||||
Dividends (net of foreign tax withheld of $86,933, $11,527 and $12,781, respectively) | $ | 12,403,062 | $ | 746,222 | $ | 825,135 | ||||||
Interest | 281,630 | 2,052,426 | 1,092,310 | |||||||||
Total investment income | 12,684,692 | 2,798,648 | 1,917,445 | |||||||||
Expenses | ||||||||||||
Management fees | 3,945,199 | 539,821 | 419,405 | |||||||||
12b-1 service fees – Class A | 1,125,643 | 145,538 | 81,386 | |||||||||
12b-1 distribution and service fees – Class B | 130,420 | 47,883 | 59,626 | |||||||||
12b-1 distribution and service fees – Class C | 285,790 | 90,020 | 79,561 | |||||||||
Shareholders’ servicing agent fees and expenses | 600,743 | 59,809 | 59,749 | |||||||||
Custodian’s fees and expenses | 141,915 | 42,160 | 20,497 | |||||||||
Trustees’ fees and expenses | 12,291 | 1,931 | 1,420 | |||||||||
Professional fees | 88,111 | 19,852 | 16,823 | |||||||||
Shareholders’ reports – printing and mailing expenses | 243,524 | 22,352 | 24,075 | |||||||||
Federal and state registration fees | 92,073 | 67,504 | 66,770 | |||||||||
Other expenses | 22,005 | 4,528 | 3,813 | |||||||||
Total expenses before custodian fee credit and expense reimbursement | 6,687,714 | 1,041,398 | 833,125 | |||||||||
Custodian fee credit | (4,316 | ) | (20,193 | ) | (799 | ) | ||||||
Expense reimbursement | — | (34,628 | ) | (50,589 | ) | |||||||
Net expenses | 6,683,398 | 986,577 | 781,737 | |||||||||
Net investment income | 6,001,294 | 1,812,071 | 1,135,708 | |||||||||
Realized and Unrealized Gain (Loss) | ||||||||||||
Net realized gain (loss) from investments | 46,928,398 | 2,127,878 | 2,148,936 | |||||||||
Change in net unrealized appreciation (depreciation) of investments | (109,626,987 | ) | (8,520,958 | ) | (6,894,384 | ) | ||||||
Net realized and unrealized gain (loss) | (62,698,589 | ) | (6,393,080 | ) | (4,745,448 | ) | ||||||
Net increase (decrease) in net assets from operations | $ | (56,697,295 | ) | $ | (4,581,009 | ) | $ | (3,609,740 | ) | |||
| (1) | Effective July 7, 2008, the Nuveen Balanced Municipal and Stock Fund changed its name to Nuveen Conservative Allocation Fund. |
| (2) | Effective August 1, 2008, the Nuveen Balanced Stock and Bond Fund changed its name to Nuveen Moderate Allocation Fund. |
See accompanying notes to financial statements.
46
Statement of Changes in Net Assets
| Multi-Manager Large-Cap Value | ||||||||
Year Ended | Year Ended 6/30/07 | |||||||
Operations | ||||||||
Net investment income | $ | 6,001,294 | $ | 6,412,687 | ||||
Net realized gain (loss) from investments | 46,928,398 | 76,534,871 | ||||||
Change in net unrealized appreciation (depreciation) of investments | (109,626,987 | ) | 24,730,433 | |||||
Net increase (decrease) in net assets from operations | (56,697,295 | ) | 107,677,991 | |||||
Distributions to Shareholders | ||||||||
From net investment income: | ||||||||
Class A | (5,435,774 | ) | (4,392,794 | ) | ||||
Class B | (43,212 | ) | (42,199 | ) | ||||
Class C | (93,919 | ) | (57,080 | ) | ||||
Class I (1) | (424,963 | ) | (345,055 | ) | ||||
From accumulated net realized gains: | ||||||||
Class A | (69,843,284 | ) | (40,781,978 | ) | ||||
Class B | (2,094,917 | ) | (2,008,149 | ) | ||||
Class C | (4,505,945 | ) | (2,703,325 | ) | ||||
Class I (1) | (4,268,174 | ) | (2,473,004 | ) | ||||
Decrease in net assets from distributions to shareholders | (86,710,188 | ) | (52,803,584 | ) | ||||
Fund Share Transactions | ||||||||
Proceeds from sale of shares | 34,460,397 | 31,514,790 | ||||||
Proceeds from shares issued to shareholders due | 63,939,667 | 38,522,404 | ||||||
| 98,400,064 | 70,037,194 | |||||||
Cost of shares redeemed | (81,247,290 | ) | (73,645,052 | ) | ||||
Net increase (decrease) in net assets from Fund share transactions | 17,152,774 | (3,607,858 | ) | |||||
Net increase (decrease) in net assets | (126,254,709 | ) | 51,266,549 | |||||
Net assets at the beginning of year | 573,076,768 | 521,810,219 | ||||||
Net assets at the end of year | $ | 446,822,059 | $ | 573,076,768 | ||||
Undistributed (Over-distribution of) net investment income | $ | 3,610,339 | $ | 3,643,122 | ||||
| (1) | Effective May 1, 2008, Class R Shares were renamed Class I Shares. |
See accompanying notes to financial statements.
47
Statement of Changes in Net Assets
| Municipal and Stock (1) | Stock and Bond (2) | |||||||||||||||
| Year Ended 6/30/08 | Year Ended 6/30/07 | Year Ended 6/30/08 | Year Ended 6/30/07 | |||||||||||||
Operations | ||||||||||||||||
Net investment income | $ | 1,812,071 | $ | 1,966,431 | $ | 1,135,708 | $ | 1,175,779 | ||||||||
Net realized gain (loss) from investments | 2,127,878 | 4,718,378 | 2,148,936 | 5,193,418 | ||||||||||||
Change in net unrealized appreciation (depreciation) of investments | (8,520,958 | ) | 1,283,251 | (6,894,384 | ) | 1,270,350 | ||||||||||
Net increase (decrease) in net assets from operations | (4,581,009 | ) | 7,968,060 | (3,609,740 | ) | 7,639,547 | ||||||||||
Distributions to Shareholders | ||||||||||||||||
From net investment income: | ||||||||||||||||
Class A | (1,587,051 | ) | (1,623,074 | ) | (735,128 | ) | (764,847 | ) | ||||||||
Class B | (69,672 | ) | (146,444 | ) | (88,440 | ) | (108,071 | ) | ||||||||
Class C | (133,017 | ) | (162,325 | ) | (119,994 | ) | (119,957 | ) | ||||||||
Class I (3) | (46,479 | ) | (44,672 | ) | (267,654 | ) | (264,636 | ) | ||||||||
From accumulated net realized gains: | ||||||||||||||||
Class A | (1,673,617 | ) | — | (2,893,413 | ) | (1,958,406 | ) | |||||||||
Class B | (125,373 | ) | — | (506,849 | ) | (431,620 | ) | |||||||||
Class C | (244,548 | ) | — | (713,526 | ) | (477,052 | ) | |||||||||
Class I (3) | (42,817 | ) | — | (925,907 | ) | (600,140 | ) | |||||||||
Decrease in net assets from distributions to shareholders | (3,922,574 | ) | (1,976,515 | ) | (6,250,911 | ) | (4,724,729 | ) | ||||||||
Fund Share Transactions | ||||||||||||||||
Proceeds from sale of shares | 5,775,698 | 8,065,057 | 9,934,186 | 8,200,987 | ||||||||||||
Proceeds from shares issued to shareholders due | 3,132,749 | 1,445,739 | 4,812,675 | 3,273,179 | ||||||||||||
| 8,908,447 | 9,510,796 | 14,746,861 | 11,474,166 | |||||||||||||
Cost of shares redeemed | (12,966,895 | ) | (15,049,637 | ) | (11,090,975 | ) | (11,358,671 | ) | ||||||||
Net increase (decrease) in net assets from Fund share transactions | (4,058,448 | ) | (5,538,841 | ) | 3,655,886 | 115,495 | ||||||||||
Net increase (decrease) in net assets | (12,562,031 | ) | 452,704 | (6,204,765 | ) | 3,030,313 | ||||||||||
Net assets at the beginning of year | 78,380,534 | 77,927,830 | 58,279,761 | 55,249,448 | ||||||||||||
Net assets at the end of year | $ | 65,818,503 | $ | 78,380,534 | $ | 52,074,996 | $ | 58,279,761 | ||||||||
Undistributed (Over-distribution of) net investment income | $ | 373,852 | $ | 398,038 | $ | (297,012 | ) | $ | (258,929 | ) | ||||||
| (1) | Effective July 7, 2008, the Nuveen Balanced Municipal and Stock Fund changed its name to Nuveen Conservative Allocation Fund. |
| (2) | Effective August 1, 2008, the Nuveen Balanced Stock and Bond Fund changed its name to Nuveen Moderate Allocation Fund. |
| (3) | Effective May 1, 2008, Class R Shares were renamed Class I Shares. |
See accompanying notes to financial statements.
48
Notes to Financial Statements
1. General Information and Significant Accounting Policies
The Nuveen Investment Trust (the “Trust”) is an open-end management investment company registered under the Investment Company Act of 1940, as amended. The Trust is comprised of the Nuveen Multi-Manager Large-Cap Value Fund (“Multi-Manager Large-Cap Value”), (formerly Nuveen Large-Cap Value Fund), Nuveen Balanced Municipal and Stock Fund (“Municipal and Stock”) (currently Nuveen Conservative Allocation Fund) and Nuveen Balanced Stock and Bond Fund (“Stock and Bond”) (currently Nuveen Moderate Allocation Fund) (collectively, the “Funds”), among others. The Trust was organized as a Massachusetts business trust in 1996.
On May 1, 2008, as previously approved by the Board of Trustees, the Fund changed its name from Nuveen Large-Cap Value Fund to Nuveen Multi-Manager Large-Cap Value Fund.
On July 31, 2007, the Board of Trustees of Multi-Manager Large-Cap Value approved Nuveen HydePark Group, LLC (“Nuveen HydePark”) and Symphony Asset Management (“Symphony”) as additional sub-advisors for the Fund. The sub-advisory agreements took effect on November 16, 2007.
Multi-Manager Large-Cap Value invested primarily in a diversified portfolio of large and mid-cap equities of domestic companies in an attempt to provide capital growth. Effective November 14, 2007, the Fund’s primary investment objective is to provide long-term capital appreciation. The Fund intends to pursue its investment objective by investing at least 80% of its net assets in equity securities of companies with market capitalizations comparable to companies in the Russell 1000 Value Index. In addition, the Fund may also invest up to 25% of its net assets in U.S. dollar-denominated non-U.S. equity securities.
Municipal and Stock invested in a mix of equities and tax-exempt securities in an attempt to provide capital growth, capital preservation and current tax-exempt income.
Stock and Bond invested in a mix of equities, taxable bonds and cash equivalents in an attempt to provide capital growth, capital preservation and current income.
On March 31, 2008, the Nuveen Mutual Funds announced the following policy changes applicable to the Funds, effective May 1, 2008:
| • | For Class A Share purchases at net asset value of $1 million or more that are subject to a contingent deferred sales charge (“CDSC”), the period over which the CDSC will apply has been reduced from eighteen months to twelve months for all purchases occurring on or after May 1, 2007. Class A Shares purchased prior to May 1, 2007 that have not been redeemed are no longer be subject to a CDSC; |
| • | Class B Shares will only be issued (i) upon the exchange of Class B Shares from another Nuveen fund, (ii) for purposes of dividend reinvestment, and (iii) through December 31, 2008, for defined contribution plans and investors using automatic investment plans with investments in Class B Shares as of March 31, 2008. The reinstatement privilege for Class B Shares will no longer be available as of December 31, 2008; |
| • | Class R Shares have been renamed Class I Shares and are available for (i) purchases of $1 million or more, (ii) purchases using dividends and capital gains distributions on Class I Shares and (iii) purchase by limited categories of investors. |
The following is a summary of significant accounting policies followed by the Funds in the preparation of their financial statements in accordance with accounting principles generally accepted in the United States.
Investment Valuation
Exchange-listed securities are generally valued at the last sales price on the securities exchange on which such securities are primarily traded. Securities traded on a securities exchange for which there are no transactions on a given day or securities not listed on a securities exchange are valued at the mean of the closing bid and asked prices. Securities traded on Nasdaq are valued at the Nasdaq Official Closing Price. The prices of fixed-income securities are generally provided by an independent pricing service approved by the Funds’ Board of Trustees. When market quotes are not readily available, the pricing service or, in the absence of a pricing service for a particular investment, the Board of Trustees of the Funds, or its designee, may establish fair value using a wide variety of market data including yields or prices of investments of comparable quality, type of issue, coupon, maturity and rating, market quotes or indications of value from securities dealers, evaluations of anticipated cash flows or collateral, general market conditions and other information and analysis, including the obligor’s credit characteristics considered relevant by the pricing service or the Board of Trustees’ designee. If the pricing service is unable to supply a price for a fixed-income security, the Funds may use market quotes provided by major broker/dealers in such investments. If it is determined that the market price for an investment is unavailable or inappropriate, the Board of Trustees of the Funds, or its designee, may establish fair value in accordance with procedures established in good faith by the Board of Trustees. Short-term investments are valued at amortized cost, which approximates market value.
Investment Transactions
Investment transactions are recorded on a trade date basis. Realized gains and losses from investment transactions are determined on the specific identification method. Investments purchased on a when-issued/delayed delivery basis may have extended settlement periods. Any investments so purchased are subject to market fluctuation during this period. The Funds have instructed
49
Notes to Financial Statements (continued)
the custodian to segregate assets with a current value at least equal to the amount of the when-issued/delayed delivery purchase commitments. At June 30, 2008, there were no such outstanding purchase commitments in any of the Funds.
Investment Income
Dividend income is recorded on the ex-dividend date or, for foreign securities, when information is available. Interest income, which includes the amortization of premiums and accretion of discounts for financial reporting purposes, is recorded on an accrual basis. Interest income also includes paydown gains and losses, if any.
Dividends and Distributions to Shareholders
Distributions to shareholders are recorded on the ex-dividend date. The amount and timing of distributions are determined in accordance with federal income tax regulations, which may differ from accounting principles generally accepted in the United States.
Taxable net investment income is declared and distributed to shareholders annually for Multi-Manager Large-Cap Value and Municipal and Stock, and quarterly for Stock and Bond. Tax-exempt net investment income is declared as a dividend monthly for Municipal and Stock. Net realized capital gains from investment transactions, if any, are declared and distributed to shareholders at least annually. Furthermore, capital gains are distributed only to the extent they exceed available capital loss carryforwards.
Income Taxes
Each Fund is a separate taxpayer for federal income tax purposes. Each Fund intends to distribute substantially all of its net investment income and net capital gains to shareholders and to otherwise comply with the requirements of Subchapter M of the Internal Revenue Code applicable to regulated investment companies. Therefore, no federal income tax provision is required. Furthermore, Municipal and Stock intends to satisfy conditions which will enable interest from municipal securities, which is exempt from regular federal and designated state income taxes, to retain such tax-exempt status when distributed to shareholders of the Fund. Net realized capital gains and ordinary income distributions paid by the Funds are subject to federal taxation.
Effective December 31, 2007, the Funds adopted Financial Accounting Standards Board (FASB) Interpretation No. 48 ‘‘Accounting for Uncertainty in Income Taxes’’ (FIN 48). FIN 48 provides guidance for how uncertain tax positions should be recognized, measured, presented and disclosed in the financial statements. FIN 48 requires the affirmative evaluation of tax positions taken or expected to be taken in the course of preparing the Funds’ tax returns to determine whether it is ‘‘more-likely-than-not’’ (i.e., a greater than 50 percent likelihood) of being sustained by the applicable tax authority. Tax positions not deemed to meet the more-likely-than-not threshold may result in a tax expense in the current year.
Implementation of FIN 48 required management of the Funds to analyze all open tax years, as defined by the statute of limitations, for all major jurisdictions, which includes federal and certain states. Open tax years are those that are open for examination by taxing authorities (i.e., generally the last four tax year ends and the interim tax period since then). The Funds have no examinations in progress.
For all open tax years and all major taxing jurisdictions through the end of the reporting period, management of the Funds has reviewed all tax positions taken or expected to be taken in the preparation of the Funds’ tax returns and concluded the adoption of FIN 48 resulted in no impact to the Funds’ net assets or results of operations as of and during the fiscal year ended June 30, 2008.
The Funds are also not aware of any tax positions for which it is reasonably possible that the total amounts of unrecognized tax benefits will significantly change in the next twelve months.
Flexible Sales Charge Program
Each Fund offers Class A, C and I Shares. During the period July 1, 2007 through April 30, 2008, each Fund offered Class B Shares. Class A Shares are generally sold with an up-front sales charge and incur a .25% annual 12b-1 service fee. Class A Share purchases of $1 million or more are sold at net asset value without an up-front sales charge but may be subject to a CDSC if redeemed within twelve months of purchase. Class B Shares are sold without an up-front sales charge but incur a .75% annual 12b-1 distribution fee and a .25% annual 12b-1 service fee. Class B Shares are subject to a CDSC of up to 5% depending upon the length of time the shares are held by the investor (CDSC is reduced to 0% at the end of six years). Class B Shares convert to Class A Shares eight years after purchase. Class C Shares are sold without an up-front sales charge but incur a .75% annual 12b-1 distribution fee and a .25% annual 12b-1 service fee. Class C Shares are subject to a CDSC of 1% if redeemed within one year of purchase. Class I Shares are not subject to any sales charge or 12b-1 distribution or service fees.
Derivative Financial Instruments
The Funds are authorized to invest in certain derivative financial instruments, including futures, forwards, options and swap transactions. Although the Funds are authorized to invest in such financial instruments, and may do so in the future, they did not make any such investments during the fiscal year ended June 30, 2008.
Repurchase Agreements
In connection with transactions in repurchase agreements, it is the Funds’ policy that its custodian take possession of the underlying collateral securities, the fair value of which exceeds the principal amount of the repurchase transaction, including accrued interest, at all times. If the seller defaults, and the fair value of the collateral declines, realization of the collateral may be delayed or limited.
50
Zero Coupon Securities
Municipal and Stock and Stock and Bond are authorized to invest in zero coupon securities. A zero coupon security does not pay a regular interest coupon to its holders during the life of the security. Tax-exempt income to the holder of the security comes from accretion of the difference between the original purchase price of the security at issuance and the par value of the security at maturity and is effectively paid at maturity. Such securities, if any, are included in the Portfolios of Investments with a 0.000% coupon rate in their description. The market prices of zero coupon securities generally are more volatile than the market prices of securities that pay interest periodically.
Expense Allocation
Expenses of the Funds that are not directly attributable to a specific class of shares are prorated among the classes based on the relative net assets of each class. Expenses directly attributable to a class of shares, which presently only include 12b-1 distribution and service fees, are recorded to the specific class.
Custodian Fee Credit
Each Fund has an arrangement with the custodian bank whereby certain custodian fees and expenses are reduced by net credits earned on each Fund’s cash on deposit with the bank. Such deposit arrangements are an alternative to overnight investments. Credits for cash balances may be offset by charges for any days on which a Fund overdraws its account at the custodian bank.
Indemnifications
Under the Trust’s organizational documents, its Officers and Trustees are indemnified against certain liabilities arising out of the performance of their duties to the Trust. In addition, in the normal course of business, the Trust enters into contracts that provide general indemnifications to other parties. The Trust’s maximum exposure under these arrangements is unknown as this would involve future claims that may be made against the Trust that have not yet occurred. However, the Trust has not had prior claims or losses pursuant to these contracts and expects the risk of loss to be remote.
Use of Estimates
The preparation of financial statements in conformity with accounting principles generally accepted in the United States requires management to make estimates and assumptions that affect the reported amounts of assets and liabilities at the date of the financial statements and the reported amounts of increases and decreases in net assets from operations during the reporting period. Actual results may differ from those estimates.
2. Fund Shares
Transactions in Fund shares were as follows:
| Multi-Manager Large-Cap Value | ||||||||||||||
| Year Ended 6/30/08 | Year Ended 6/30/07 | |||||||||||||
| Shares | Amount | Shares | Amount | |||||||||||
Shares sold: | ||||||||||||||
Class A | 810,194 | $ | 20,952,783 | 589,796 | $ | 16,843,317 | ||||||||
Class A – automatic conversion of Class B shares | 95,820 | 2,611,838 | 211,410 | 6,045,121 | ||||||||||
Class B | 49,593 | 1,283,529 | 52,323 | 1,446,438 | ||||||||||
Class C | 174,454 | 4,304,545 | 120,847 | 3,341,766 | ||||||||||
Class I | 205,183 | 5,307,702 | 132,239 | 3,838,148 | ||||||||||
Shares issued to shareholders due to reinvestment | ||||||||||||||
Class A | 2,239,141 | 55,693,165 | 1,181,266 | 33,095,021 | ||||||||||
Class B | 57,503 | 1,382,961 | 45,561 | 1,242,036 | ||||||||||
Class C | 102,686 | 2,465,511 | 52,581 | 1,430,796 | ||||||||||
Class I | 175,694 | 4,398,030 | 97,833 | 2,754,551 | ||||||||||
| 3,910,268 | 98,400,064 | 2,483,856 | 70,037,194 | |||||||||||
Shares redeemed: | ||||||||||||||
Class A | (2,223,180 | ) | (57,260,628 | ) | (1,799,554 | ) | (51,667,507 | ) | ||||||
Class B | (233,385 | ) | (6,098,504 | ) | (264,126 | ) | (7,395,984 | ) | ||||||
Class B – automatic conversion to Class A shares | (98,311 | ) | (2,611,838 | ) | (216,354 | ) | (6,045,121 | ) | ||||||
Class C | (199,454 | ) | (5,027,951 | ) | (185,679 | ) | (5,219,044 | ) | ||||||
Class I | (390,974 | ) | (10,248,369 | ) | (114,704 | ) | (3,317,396 | ) | ||||||
| (3,145,304 | ) | (81,247,290 | ) | (2,580,417 | ) | (73,645,052 | ) | |||||||
Net increase (decrease) | 764,964 | $ | 17,152,774 | (96,561 | ) | $ | (3,607,858 | ) | ||||||
51
Notes to Financial Statements (continued)
| Municipal and Stock | ||||||||||||||
| Year Ended 6/30/08 | Year Ended 6/30/07 | |||||||||||||
| Shares | Amount | Shares | Amount | |||||||||||
Shares sold: | ||||||||||||||
Class A | 144,034 | $ | 3,561,688 | 132,891 | $ | 3,330,489 | ||||||||
Class A – automatic conversion of Class B shares | 30,256 | 744,559 | 125,746 | 3,112,482 | ||||||||||
Class B | 7,118 | 187,254 | 4,823 | 128,147 | ||||||||||
Class C | 44,722 | 1,186,819 | 46,026 | 1,232,209 | ||||||||||
Class I | 4,085 | 95,378 | 10,720 | 261,730 | ||||||||||
Shares issued to shareholders due to reinvestment | ||||||||||||||
Class A | 109,684 | 2,703,707 | 49,523 | 1,240,603 | ||||||||||
Class B | 4,374 | 114,905 | 3,088 | 81,876 | ||||||||||
Class C | 10,003 | 261,976 | 4,061 | 107,905 | ||||||||||
Class I | 2,168 | 52,161 | 627 | 15,355 | ||||||||||
| 356,444 | 8,908,447 | 377,505 | 9,510,796 | |||||||||||
Shares redeemed: | ||||||||||||||
Class A | (363,913 | ) | (8,963,389 | ) | (351,285 | ) | (8,742,712 | ) | ||||||
Class B | (56,867 | ) | (1,503,160 | ) | (95,718 | ) | (2,546,404 | ) | ||||||
Class B – automatic conversion to Class A shares | (28,381 | ) | (744,559 | ) | (118,476 | ) | (3,112,482 | ) | ||||||
Class C | (61,567 | ) | (1,620,340 | ) | (23,453 | ) | (626,412 | ) | ||||||
Class I | (5,712 | ) | (135,447 | ) | (901 | ) | (21,627 | ) | ||||||
| (516,440 | ) | (12,966,895 | ) | (589,833 | ) | (15,049,637 | ) | |||||||
Net increase (decrease) | (159,996 | ) | $ | (4,058,448 | ) | (212,328 | ) | $ | (5,538,841 | ) | ||||
| Stock and Bond | ||||||||||||||
| Year Ended 6/30/08 | Year Ended 6/30/07 | |||||||||||||
| Shares | Amount | Shares | Amount | |||||||||||
Shares sold: | ||||||||||||||
Class A | 177,010 | $ | 4,491,373 | 128,966 | $ | 3,383,402 | ||||||||
Class A – automatic conversion of Class B shares | 19,334 | 487,364 | 55,247 | 1,445,056 | ||||||||||
Class B | 68,381 | 1,663,900 | 40,699 | 1,071,284 | ||||||||||
Class C | 92,418 | 2,334,301 | 59,994 | 1,587,859 | ||||||||||
Class I | 38,368 | 957,248 | 27,154 | 713,386 | ||||||||||
Shares issued to shareholders due to reinvestment | ||||||||||||||
Class A | 114,850 | 2,811,167 | 75,480 | 1,957,274 | ||||||||||
Class B | 17,167 | 418,881 | 11,549 | 299,017 | ||||||||||
Class C | 14,244 | 347,605 | 8,569 | 222,038 | ||||||||||
Class I | 50,417 | 1,235,022 | 30,646 | 794,850 | ||||||||||
| 592,189 | 14,746,861 | 438,304 | 11,474,166 | |||||||||||
Shares redeemed: | ||||||||||||||
Class A | (239,949 | ) | (6,071,920 | ) | (212,229 | ) | (5,555,552 | ) | ||||||
Class B | (57,044 | ) | (1,424,732 | ) | (75,390 | ) | (1,986,262 | ) | ||||||
Class B – automatic conversion to Class A shares | (19,354 | ) | (487,364 | ) | (55,290 | ) | (1,445,056 | ) | ||||||
Class C | (69,510 | ) | (1,717,368 | ) | (69,756 | ) | (1,833,807 | ) | ||||||
Class I | (56,308 | ) | (1,389,591 | ) | (20,594 | ) | (537,994 | ) | ||||||
| (442,165 | ) | (11,090,975 | ) | (433,259 | ) | (11,358,671 | ) | |||||||
Net increase (decrease) | 150,024 | $ | 3,655,886 | 5,045 | $ | 115,495 | ||||||||
52
3. Investment Transactions
Purchases and sales (including maturities but excluding short-term investments) during the fiscal year ended June 30, 2008, were as follows:
| Multi-Manager Large-Cap Value | Municipal | Stock and | |||||||
Purchases: | |||||||||
Investment securities | $ | 671,780,325 | $ | 26,900,232 | $ | 25,693,862 | |||
U.S. Government and agency obligations | — | — | 2,906,328 | ||||||
Sales and maturities: | |||||||||
Investment securities | 736,500,751 | 31,792,192 | 25,259,306 | ||||||
U.S. Government and agency obligations | — | — | 4,897,614 | ||||||
4. Income Tax Information
The following information is presented on an income tax basis. Differences between amounts for financial statement and federal income tax purposes are primarily due to timing differences in recognizing taxable market discount, amortization of premium on taxable debt securities and timing differences in recognizing certain gains and losses on investment transactions. To the extent that differences arise that are permanent in nature, such amounts are reclassified within the capital accounts on the Statement of Assets and Liabilities presented in the annual report, based on their federal tax basis treatment; temporary differences do not require reclassification. Temporary and permanent differences do not impact the net asset values of the Funds.
At June 30, 2008, the cost of investments was as follows:
| Multi-Manager Large-Cap Value | Municipal | Stock and | |||||||
Cost of investments | $ | 439,863,847 | $ | 65,681,592 | $ | 51,826,100 | |||
Gross unrealized appreciation and gross unrealized depreciation of investments at June 30, 2008, were as follows:
| Multi-Manager Large-Cap Value | Municipal | Stock and | ||||||||||
Gross unrealized: | ||||||||||||
Appreciation | $ | 47,908,896 | $ | 3,107,867 | $ | 3,783,873 | ||||||
Depreciation | (42,759,837 | ) | (3,909,974 | ) | (3,429,306 | ) | ||||||
Net unrealized appreciation (depreciation) of investments | $ | 5,149,059 | $ | (802,107 | ) | $ | 354,567 | |||||
The tax components of undistributed net tax-exempt income, net ordinary income and net long-term capital gains at June 30, 2008, the Funds’ tax year end, were as follows:
| Multi-Manager Large-Cap Value | Municipal | Stock and | |||||||
Undistributed net tax-exempt income* | $ | — | $ | 218,845 | $ | — | |||
Undistributed net ordinary income** | 3,610,339 | 266,987 | 333,784 | ||||||
Undistributed net long-term capital gains | 29,199,213 | 1,126,739 | 949,419 | ||||||
| * | Undistributed net tax-exempt income (on a tax basis) has not been reduced for the dividends declared on June 9, 2008 for Municipal and Stock and June 27, 2008, for Stock and Bond, both of which were paid on July 1, 2008. |
| ** | Net ordinary income consists of net taxable income derived from dividends, interest, market discount accretion and net short-term capital gains, if any. |
53
Notes to Financial Statements (continued)
The tax character of distributions paid during the Funds’ tax years ended June 30, 2008 and June 30, 2007, was designated for purposes of the dividends paid deduction as follows:
| 2008 | Multi-Manager Large-Cap Value | Municipal | Stock and | ||||||
Distributions from net tax-exempt income*** | $ | — | $ | 1,424,542 | $ | — | |||
Distributions from net ordinary income** | 24,466,004 | 617,045 | 2,326,899 | ||||||
Distributions from net long-term capital gains**** | 62,244,184 | 1,879,234 | 3,967,128 | ||||||
| 2007 | Multi-Manager Large-Cap Value | Municipal | Stock | ||||||
Distributions from net tax-exempt income | $ | — | $ | 1,421,668 | $ | — | |||
Distributions from net ordinary income** | 18,894,924 | 559,542 | 2,176,221 | ||||||
Distributions from net long-term capital gains | 33,908,660 | — | 2,460,933 | ||||||
| ** | Net ordinary income consists of net taxable income derived from dividends, interest, market discount accretion and net short-term capital gains, if any. |
| *** | The Funds hereby designate these amounts paid during the fiscal year ended June 30, 2008, as Exempt Interest Dividends. |
| **** | The Funds designated as a long-term capital gain dividend, pursuant to the Internal Revenue Code Section 852(b)(3), the amount necessary to reduce earnings and profits of the Funds related to net capital gain to zero for the tax year ended June 30, 2008. |
5. Management Fee and Other Transactions with Affiliates
Each Fund’s management fee is separated into two components – a complex-level component, based on the aggregate amount of all fund assets managed by Nuveen Asset Management (the “Adviser”), a wholly owned subsidiary of Nuveen Investments, Inc. (“Nuveen”), and a specific fund-level component, based only on the amount of assets within each individual Fund. This pricing structure enables Nuveen fund shareholders to benefit from growth in the assets within each individual fund as well as from growth in the amount of complex-wide assets managed by the Adviser.
The annual fund-level fee, payable monthly, for each Fund is based upon the average daily net assets of each Fund as follows:
| Average Daily Net Assets | Multi-Manager Value Fund-Level Fee Rate* | Municipal Fee Rate | Stock and Fee Rate | ||||||
For the first $125 million | .6500 | % | .5500 | % | .5500 | % | |||
For the next $125 million | .6375 | .5375 | .5375 | ||||||
For the next $250 million | .6250 | .5250 | .5250 | ||||||
For the next $500 million | .6125 | .5125 | .5125 | ||||||
For the next $1 billion | .6000 | .5000 | .5000 | ||||||
For net assets over $2 billion | .5750 | .4750 | .4750 |
* For the period July 1, 2007, through November 13, 2007.
Effective November 14, 2007, the annual fund-level fee, payable monthly, for Multi-Manager Large-Cap Value is based upon the average daily net assets of the Fund as follows:
| Average Daily Net Assets | Multi-Manager Large-Cap Value Fund-Level Fee Rate | ||
For the first $125 million | .5500 | % | |
For the next $125 million | .5375 | ||
For the next $250 million | .5250 | ||
For the next $500 million | .5125 | ||
For the next $1 billion | .5000 | ||
For net assets over $2 billion | .4750 |
The annual complex-level fee, payable monthly, which is additive to the fund-level fee, for all Nuveen sponsored funds in the U.S., is based on the aggregate amount of total fund assets managed as stated in the tables below. As of June 30, 2008, the complex-level fee rate was .1868%.
54
Effective August 20, 2007, the complex-level fee schedule is as follows:
| Complex-Level Asset Breakpoint Level (1) | Effective Rate at Breakpoint Level | ||
$55 billion | .2000 | % | |
$56 billion | .1996 | ||
$57 billion | .1989 | ||
$60 billion | .1961 | ||
$63 billion | .1931 | ||
$66 billion | .1900 | ||
$71 billion | .1851 | ||
$76 billion | .1806 | ||
$80 billion | .1773 | ||
$91 billion | .1691 | ||
$125 billion | .1599 | ||
$200 billion | .1505 | ||
$250 billion | .1469 | ||
$300 billion | .1445 |
Prior to August 20, 2007, the complex-level fee schedule was as follows:
| Complex-Level Asset Breakpoint Level (1) | Effective Rate at Breakpoint Level | ||
$55 billion | .2000 | % | |
$56 billion | .1996 | ||
$57 billion | .1989 | ||
$60 billion | .1961 | ||
$63 billion | .1931 | ||
$66 billion | .1900 | ||
$71 billion | .1851 | ||
$76 billion | .1806 | ||
$80 billion | .1773 | ||
$91 billion | .1698 | ||
$125 billion | .1617 | ||
$200 billion | .1536 | ||
$250 billion | .1509 | ||
$300 billion | .1490 |
| (1) | The complex-level fee component of the management fee for the funds is calculated based upon the aggregate Managed Assets (“Managed Assets” means the average daily net assets of each fund including assets attributable to preferred stock issued by or borrowings by the Nuveen funds) of Nuveen-sponsored funds in the U.S. |
The management fee compensates the Adviser for overall investment advisory and administrative services and general office facilities. During the period the Adviser either had or entered into Sub-Advisory Agreements with Nuveen HydePark, Symphony and Institutional Capital LLC (“ICAP”). Nuveen HydePark, Symphony and ICAP manage Multi-Manager Large-Cap Value’s investment portfolio. ICAP also manages Municipal and Stock’s and Stock and Bond’s equity investments. ICAP is compensated for its services to the Funds from the management fee paid to the Adviser. Nuveen HydePark and Symphony are compensated for their services to Multi-Manager Large-Cap Value from the management fee paid to the Adviser.
Prior to November 14, 2007, the Adviser agreed to waive part of its management fees or reimburse certain expenses of Multi-Manager Large-Cap Value through October 31, 2008, in order to limit total operating expenses (excluding 12b-1 distribution and service fees, interest expense, taxes, fees incurred in acquiring and disposing of portfolio securities and extraordinary expenses) from exceeding 1.20% of the average daily net assets. Effective November 14, 2007, the Adviser agreed to waive part of its management fees or reimburse certain expenses of Multi-Manager Large-Cap Value through October 31, 2010, in order to limit total operating expenses (excluding 12b-1 distribution and service fees, interest expense, taxes, fees incurred in acquiring and disposing of portfolio securities and extraordinary expenses) from exceeding 0.95% of the average daily net assets and from exceeding 1.20% after October 31, 2010.
The Adviser agreed to waive part of its management fees or reimburse certain expenses of Municipal and Stock and Stock and Bond through October 31, 2008, in order to limit total operating expenses (excluding 12b-1 distribution and service fees, interest expense, taxes, fees incurred in acquiring and disposing of portfolio securities and extraordinary expenses) from exceeding 1.00% and 1.00%, respectively, of the average daily net assets.
The Adviser may also voluntarily reimburse additional expenses from time to time in any of the Funds. Voluntary reimbursements may be terminated at any time at the Adviser’s discretion.
The Trust pays no compensation directly to those of its Trustees who are affiliated with the Adviser or to its Officers, all of whom receive remuneration for their services to the Trust from the Adviser or its affiliates. The Board of Trustees has adopted a deferred
55
Notes to Financial Statements (continued)
compensation plan for independent Trustees that enables Trustees to elect to defer receipt of all or a portion of the annual compensation they are entitled to receive from certain Nuveen advised funds. Under the plan, deferred amounts are treated as though equal dollar amounts had been invested in shares of select Nuveen advised funds.
During the fiscal year ended June 30, 2008, Nuveen Investments, LLC (the “Distributor”), a wholly owned subsidiary of Nuveen, collected sales charges on purchases of Class A Shares, the majority of which were paid out as concessions to financial intermediaries as follows:
Multi-Manager Large-Cap | Municipal | Stock and | ||||
Sales charges collected (Unaudited) | $49,154 | $28,324 | $36,611 | |||
Paid to financial intermediaries (Unaudited) | 43,212 | 24,647 | 32,343 |
The Distributor also received 12b-1 service fees on Class A Shares, substantially all of which were paid to compensate financial intermediaries for providing services to shareholders relating to their investments.
During the fiscal year ended June 30, 2008, the Distributor compensated financial intermediaries directly with commission advances at the time of purchase as follows:
Multi-Manager Large-Cap | Municipal | Stock and | |||||||
Commission advances (Unaudited) | $ | 17,475 | $ | 8,191 | $ | 10,704 | |||
To compensate for commissions advanced to financial intermediaries, all 12b-1 service fees collected on Class B Shares during the first year following a purchase, all 12b-1 distribution fees collected on Class B Shares, and all 12b-1 service and distribution fees collected on Class C Shares during the first year following a purchase are retained by the Distributor. During the fiscal year ended June 30, 2008, the Distributor retained such 12b-1 fees as follows:
Multi-Manager Large-Cap | Municipal | Stock and | |||||||
12b-1 fees retained (Unaudited) | $ | 118,275 | $ | 46,781 | $ | 52,741 | |||
The remaining 12b-1 fees charged to the Funds were paid to compensate financial intermediaries for providing services to shareholders relating to their investments.
The Distributor also collected and retained CDSC on share redemptions during the fiscal year ended June 30, 2008, as follows:
Multi-Manager Large-Cap | Municipal | Stock and | |||||||
CDSC retained (Unaudited) | $ | 26,638 | $ | 7,966 | $ | 10,850 | |||
Agreement and Plan of Merger
On June 20, 2007, Nuveen Investments announced that it had entered into a definitive Agreement and Plan of Merger (“Merger Agreement”) with Windy City Investments, Inc. (“Windy City”), a corporation formed by investors led by Madison Dearborn Partners, LLC (“Madison Dearborn”), pursuant to which Windy City would acquire Nuveen Investments. Madison Dearborn is a private equity investment firm based in Chicago, Illinois. The merger was consummated on November 13, 2007.
The consummation of the merger was deemed to be an “assignment” (as that term is defined in the Investment Company Act of 1940) of the investment management agreement between each Fund and the Adviser and, if applicable, each sub-advisory agreement between the Adviser and any sub-adviser of the Fund, and resulted in the automatic termination of each such agreement. The Board of Trustees of each Fund considered and approved a new investment management agreement with the Adviser, and, if applicable, a new sub-advisory agreement between the Adviser and any sub-adviser on the same terms as the previous agreements. Each new ongoing investment management agreement and sub-advisory agreement, if applicable, was approved by the shareholders of each Fund and took effect on November 13, 2007.
The investors led by Madison Dearborn includes an affiliate of Merrill Lynch. As a result, Merrill Lynch is an indirect “affiliated person” (as that term is defined in the Investment Company Act of 1940) of each Fund. Certain conflicts of interest may arise as a result of such indirect affiliation. For example, the Funds are generally prohibited from entering into principal transactions with Merrill Lynch and its affiliates. The Adviser does not believe that any such prohibitions or limitations as a result of Merrill Lynch’s affiliation will significantly impact the ability of the Funds to pursue their investment objectives and policies.
56
Related Party Holdings
Nuveen is owned by an investor group led by Madison Dearborn Partners, LLC. An affiliate of Merrill Lynch & Co., as part of this investor group, owns more than 5% of Nuveen’s common stock. As a result, Merrill Lynch is an indirect “affiliated person” (as that term is defined in the Investment Company Act of 1940) of each Fund.
At June 30, 2008, Multi-Manager Large-Cap Value owned 26,200 shares of Merrill Lynch and Co., Inc. common stock with a market value of $830,802. Total income earned by Multi-Manager Large-Cap Value from such securities amounted to $12,565 and is included in dividend income on the Statement of Operations.
6. New Accounting Pronouncements
Financial Accounting Standards Board Statement of Financial Accounting Standards (SFAS) No. 157
In September 2006, the FASB issued SFAS No. 157, “Fair Value Measurements.” This standard establishes a single authoritative definition of fair value, sets out a framework for measuring fair value and requires additional disclosures about fair value measurements. SFAS No. 157 applies to fair value measurements already required or permitted by existing standards. SFAS No. 157 is effective for financial statements issued for fiscal years beginning after November 15, 2007, and interim periods within those fiscal years. The changes to current generally accepted accounting principles from the application of this standard relate to the definition of fair value, the methods used to measure fair value, and the expanded disclosures about fair value measurements. As of June 30, 2008, management does not believe the adoption of SFAS No. 157 will impact the financial statement amounts; however, additional disclosures may be required about the inputs used to develop the measurements and the effect of certain of the measurements included within the Statement of Operations for the period.
Financial Accounting Standards Board Statement of Financial Accounting Standards No. 161
In March 2008, the FASB issued SFAS No. 161, “Disclosures about Derivative Instruments and Hedging Activities.” This standard is intended to enhance financial statement disclosures for derivative instruments and hedging activities and enable investors to understand: a) how and why a fund uses derivative instruments, b) how derivative instruments and related hedge items are accounted for, and c) how derivative instruments and related hedge items affect a fund’s financial position, results of operations and cash flows. SFAS No. 161 is effective for financial statements issued for fiscal years and interim periods beginning after November 15, 2008. As of June 30, 2008, management does not believe the adoption of SFAS No. 161 will impact the financial statement amounts; however, additional footnote disclosures may be required about the use of derivative instruments and hedging items.
7. Subsequent Events
Distributions to Shareholders
Municipal and Stock declared a dividend distribution from its tax-exempt net investment income which was paid on August 1, 2008, to shareholders of record on July 30, 2008, as follows:
| Municipal and Stock | |||
Dividend per share: | |||
Class A | $ | .0430 | |
Class B | .0340 | ||
Class C | .0340 | ||
Class I | .0455 | ||
Sub-Advisory Agreements
Effective July 6, 2008 and July 31, 2008, ICAP no longer served as a sub-advisor for Municipal and Stock and Stock and Bond, respectively. Effective July 7, 2008 and August 1, 2008, Richards & Tierney, Inc. (“Richards & Tierney”) was appointed as a sub-advisor to Municipal and Stock and Stock and Bond, respectively.
57
Notes to Financial Statements (continued)
Fund Changes
Effective July 7, 2008 and August 1, 2008, as previously approved by the Funds’ Board of Trustees, Municipal and Stock and Stock and Bond, respectively changed their investment strategies to a multi-asset class/multi-manager strategy. In pursuing this multi-asset class/multi-manager strategy, the Funds will operate as “funds-of-funds” investing substantially all of their assets in other Nuveen mutual funds and unaffiliated exchange-traded funds (“Underlying Funds”). The Underlying Funds, in turn, invest in a variety of U.S. and non-U.S. equity and fixed income securities. The Funds will have a strategic allocation between equity and fixed income investments that correlate with the Funds’ targeted levels of investment risk. Richards & Tierney will adjust portfolio allocations from time to time consistent with the Funds’ investment risk target in its effort to produce performance consistent with their investment objectives. These changes are designed to improve risk/return profile of the Funds by (a) diversifying the Funds across a broader number of assets classes and (b) diversifying the Funds across multiple investment mangers advising the Underlying Funds. As part of these changes to their investment policies, initially the Funds may invest in the following Underlying Funds:
Equity Funds
| • | Nuveen NWQ Large-Cap Value Fund |
| • | Nuveen Symphony Large-Cap Growth Fund |
| • | Nuveen Tradewinds Value Opportunities Fund |
| • | Nuveen Santa Barbara Growth Fund |
| • | Nuveen Rittenhouse Growth Fund |
| • | Nuveen U.S. Equity Completeness Fund |
| • | Nuveen Tradewinds International Value Fund |
| • | iShares Dow Jones U.S. Real Estate Index Fund |
| • | iShares MSCI EAFE Growth Index Fund |
| • | iShares MSCI Emerging Markets Index Fund |
| • | Nuveen Tradewinds Global Resources Fund |
Fixed Income Funds
| • | Nuveen Multi-Strategy Income Fund |
| • | Nuveen High Yield Bond Fund |
| • | iShares Lehman TIPS Bond Fund |
| • | Nuveen Short Duration Bond Fund |
To reflect the foregoing changes to the Funds’ investment strategies, effective July 7, 2008 and August 1, 2008, Municipal and Stock and Stock and Bond changed their names to Nuveen Conservative Allocation Fund and Nuveen Moderate Allocation Fund, respectively.
Class R3 Shares
Effective August 1, 2008, each of the Funds began offering Class R3 Shares. Class R3 shares are available for purchase at the offering price, which is the net asset value per share without any up-front sales charge, to certain retirement plans. Class R3 shares are subject to annual distribution and service fees of 0.50% of the Fund’s average daily net assets.
58
Financial Highlights
Selected data for a share outstanding throughout each period:
| Class (Commencement Date) | |||||||||||||||||||||||||||||||||||||||||||||||||||||||||
| Investment Operations | Less Distributions | Ratios/Supplemental Data | |||||||||||||||||||||||||||||||||||||||||||||||||||||||
MULTI-MANAGER LARGE-CAP VALUE | Ratios to Average Net Assets Before Credit/ Reimbursement | Ratios to Average Net Assets After Reimbursement(c) | Ratios to Average Net Assets After Credit/ Reimbursement(d) | ||||||||||||||||||||||||||||||||||||||||||||||||||||||
| Year Ended June 30, | Beginning Net Asset Value | Net Invest- ment Income (Loss)(a) | Net Realized/ Unrealized Gain (Loss) | Total | Net Invest- ment Income | Capital Gains | Total | Ending Net Asset Value | Total Return(b) | Ending Net Assets (000) | Expenses | Net Invest- ment Income (Loss) | Expenses | Net Invest- ment Income (Loss) | Expenses | Net Invest- ment Income (Loss) | Portfolio Turnover Rate | ||||||||||||||||||||||||||||||||||||||||
| Class A (8/96) | |||||||||||||||||||||||||||||||||||||||||||||||||||||||||
2008 | $ | 30.05 | $ | .32 | $ | (3.15 | ) | $ | (2.83 | ) | $ | (.30 | ) | $ | (4.39 | ) | $ | (4.69 | ) | $ | 22.53 | (10.74 | )% | $ | 389,240 | 1.24 | % | 1.20 | % | 1.24 | % | 1.20 | % | 1.24 | % | 1.20 | % | 131 | % | ||||||||||||||||||
2007 | 27.23 | .35 | 5.33 | 5.68 | (.26 | ) | (2.60 | ) | (2.86 | ) | 30.05 | 21.71 | 491,489 | 1.25 | 1.22 | 1.25 | 1.22 | 1.25 | 1.22 | 75 | |||||||||||||||||||||||||||||||||||||
2006 | 25.58 | .22 | 3.26 | 3.48 | (.23 | ) | (1.60 | ) | (1.83 | ) | 27.23 | 13.97 | 440,403 | 1.28 | .83 | 1.28 | .83 | 1.28 | .83 | 81 | |||||||||||||||||||||||||||||||||||||
2005 | 23.41 | .32 | 2.13 | 2.45 | (.28 | ) | — | (.28 | ) | 25.58 | 10.51 | 416,407 | 1.31 | 1.31 | 1.31 | 1.31 | 1.31 | 1.31 | 81 | ||||||||||||||||||||||||||||||||||||||
2004 | 19.93 | .12 | 3.44 | 3.56 | (.08 | ) | — | (.08 | ) | 23.41 | 17.90 | 434,121 | 1.36 | .56 | 1.36 | .56 | 1.36 | .56 | 85 | ||||||||||||||||||||||||||||||||||||||
| Class B (8/96) | |||||||||||||||||||||||||||||||||||||||||||||||||||||||||
2008 | 29.32 | .11 | (3.06 | ) | (2.95 | ) | (.08 | ) | (4.39 | ) | (4.47 | ) | 21.90 | (11.39 | ) | 8,891 | 1.99 | .43 | 1.99 | .43 | 1.99 | .43 | 131 | ||||||||||||||||||||||||||||||||||
2007 | 26.64 | .12 | 5.21 | 5.33 | (.05 | ) | (2.60 | ) | (2.65 | ) | 29.32 | 20.77 | 18,491 | 2.00 | .44 | 2.00 | .44 | 2.00 | .44 | 75 | |||||||||||||||||||||||||||||||||||||
2006 | 25.06 | .02 | 3.20 | 3.22 | (.04 | ) | (1.60 | ) | (1.64 | ) | 26.64 | 13.13 | 26,995 | 2.03 | .08 | 2.03 | .08 | 2.03 | .08 | 81 | |||||||||||||||||||||||||||||||||||||
2005 | 22.95 | .14 | 2.08 | 2.22 | (.11 | ) | — | (.11 | ) | 25.06 | 9.66 | 45,224 | 2.06 | .57 | 2.06 | .57 | 2.06 | .57 | 81 | ||||||||||||||||||||||||||||||||||||||
2004 | 19.62 | (.04 | ) | 3.37 | 3.33 | — | — | — | 22.95 | 16.97 | 56,486 | 2.11 | (.18 | ) | 2.11 | (.18 | ) | 2.11 | (.18 | ) | 85 | ||||||||||||||||||||||||||||||||||||
| Class C (8/96) | |||||||||||||||||||||||||||||||||||||||||||||||||||||||||
2008 | 29.27 | .12 | (3.06 | ) | (2.94 | ) | (.08 | ) | (4.39 | ) | (4.47 | ) | 21.86 | (11.41 | ) | 25,007 | 1.99 | .45 | 1.99 | .45 | 1.99 | .45 | 131 | ||||||||||||||||||||||||||||||||||
2007 | 26.60 | .13 | 5.19 | 5.32 | (.05 | ) | (2.60 | ) | (2.65 | ) | 29.27 | 20.80 | 31,219 | 2.00 | .47 | 2.00 | .47 | 2.00 | .47 | 75 | |||||||||||||||||||||||||||||||||||||
2006 | 25.02 | .02 | 3.20 | 3.22 | (.04 | ) | (1.60 | ) | (1.64 | ) | 26.60 | 13.15 | 28,692 | 2.03 | .08 | 2.03 | .08 | 2.03 | .08 | 81 | |||||||||||||||||||||||||||||||||||||
2005 | 22.92 | .14 | 2.07 | 2.21 | (.11 | ) | — | (.11 | ) | 25.02 | 9.63 | 30,691 | 2.06 | .57 | 2.06 | .57 | 2.06 | .57 | 81 | ||||||||||||||||||||||||||||||||||||||
2004 | 19.58 | (.04 | ) | 3.38 | 3.34 | — | — | — | 22.92 | 17.06 | 43,607 | 2.11 | (.18 | ) | 2.11 | (.18 | ) | 2.11 | (.18 | ) | 85 | ||||||||||||||||||||||||||||||||||||
| Class I (8/96)(e) | |||||||||||||||||||||||||||||||||||||||||||||||||||||||||
2008 | 30.18 | .39 | (3.17 | ) | (2.78 | ) | (.37 | ) | (4.39 | ) | (4.76 | ) | 22.64 | (10.52 | ) | 23,684 | .99 | 1.45 | .99 | 1.45 | .99 | 1.45 | 131 | ||||||||||||||||||||||||||||||||||
2007 | 27.33 | .43 | 5.35 | 5.78 | (.33 | ) | (2.60 | ) | (2.93 | ) | 30.18 | 22.03 | 31,878 | 1.00 | 1.48 | 1.00 | 1.48 | 1.00 | 1.48 | 75 | |||||||||||||||||||||||||||||||||||||
2006 | 25.67 | .29 | 3.27 | 3.56 | (.30 | ) | (1.60 | ) | (1.90 | ) | 27.33 | 14.24 | 25,720 | 1.03 | 1.08 | 1.03 | 1.08 | 1.03 | 1.08 | 81 | |||||||||||||||||||||||||||||||||||||
2005 | 23.49 | .38 | 2.14 | 2.52 | (.34 | ) | — | (.34 | ) | 25.67 | 10.77 | 22,350 | 1.06 | 1.56 | 1.06 | 1.56 | 1.06 | 1.56 | 81 | ||||||||||||||||||||||||||||||||||||||
2004 | 19.99 | .18 | 3.45 | 3.63 | (.13 | ) | — | (.13 | ) | 23.49 | 18.20 | 20,533 | 1.11 | .83 | 1.11 | .83 | 1.11 | .83 | 85 | ||||||||||||||||||||||||||||||||||||||
| (a) | Per share Net Investment Income (Loss) is calculated using the average daily shares method. |
| (b) | Total return is the combination of changes in net asset value without any sales charge, reinvested dividend income at net asset value and reinvested capital gains distributions at net asset value, if any. Total returns are not annualized. |
| (c) | After expense reimbursement from the Adviser, where applicable. |
| (d) | After custodian fee credit and expense reimbursement, where applicable. |
| (e) | Effective May 1, 2008, Class R Shares were renamed Class I Shares. |
See accompanying notes to financial statements.
59
Financial Highlights (continued)
Selected data for a share outstanding throughout each period:
| Class (Commencement Date) | ||||||||||||||||||||||||||||||||||||||||||||||||||||||||
| Investment Operations | Less Distributions | Ratios/Supplemental Data | ||||||||||||||||||||||||||||||||||||||||||||||||||||||
MUNICIPAL AND STOCK* | Ratios to Average Net Assets Before Credit/ Reimbursement | Ratios to Average Net Assets After Reimbursement(c) | Ratios to Average Net Assets After Credit/ Reimbursement(d) | |||||||||||||||||||||||||||||||||||||||||||||||||||||
| Year Ended June 30, | Beginning Net Asset Value | Net Invest- ment Income(a) | Net Realized/ Unrealized Gain (Loss) | Total | Net Invest- ment Income | Capital Gains | Total | Ending Net Asset Value | Total Return(b) | Ending Net Assets (000) | Expenses | Net Invest- ment Income | Expenses | Net Invest- ment Income | Expenses | Net Invest- ment Income | Portfolio Turnover Rate | |||||||||||||||||||||||||||||||||||||||
| Class A (8/96) | ||||||||||||||||||||||||||||||||||||||||||||||||||||||||
2008 | $ | 25.76 | $ | .64 | $ | (2.17 | ) | $ | (1.53 | ) | $ | (.67 | ) | $ | (.72 | ) | $ | (1.39 | ) | $ | 22.84 | (6.23 | )% | $ | 52,785 | 1.28 | % | 2.53 | % | 1.23 | % | 2.58 | % | 1.21 | % | 2.60 | % | 37 | % | |||||||||||||||||
2007 | 23.86 | .67 | 1.91 | 2.58 | (.68 | ) | — | (.68 | ) | 25.76 | 10.90 | 61,577 | 1.22 | 2.64 | 1.22 | 2.64 | 1.19 | 2.67 | 37 | |||||||||||||||||||||||||||||||||||||
2006 | 23.01 | .60 | .89 | 1.49 | (.64 | ) | — | (.64 | ) | 23.86 | 6.52 | 58,064 | 1.26 | 2.51 | 1.24 | 2.53 | 1.22 | 2.55 | 44 | |||||||||||||||||||||||||||||||||||||
2005 | 21.96 | .62 | 1.10 | 1.72 | (.67 | ) | — | (.67 | ) | 23.01 | 7.91 | 54,323 | 1.24 | 2.76 | 1.24 | 2.76 | 1.23 | 2.77 | 47 | |||||||||||||||||||||||||||||||||||||
2004 | 20.79 | .54 | 1.14 | 1.68 | (.51 | ) | — | (.51 | ) | 21.96 | 8.13 | 56,787 | 1.28 | 2.47 | 1.25 | 2.51 | 1.25 | 2.51 | 45 | |||||||||||||||||||||||||||||||||||||
| Class B (8/96) | ||||||||||||||||||||||||||||||||||||||||||||||||||||||||
2008 | 27.36 | .48 | (2.30 | ) | (1.82 | ) | (.39 | ) | (.72 | ) | (1.11 | ) | 24.43 | (6.90 | ) | 3,480 | 2.03 | 1.76 | 1.98 | 1.81 | 1.96 | 1.83 | 37 | |||||||||||||||||||||||||||||||||
2007 | 25.32 | .50 | 2.04 | 2.54 | (.50 | ) | — | (.50 | ) | 27.36 | 10.09 | 5,916 | 1.98 | 1.87 | 1.98 | 1.87 | 1.95 | 1.90 | 37 | |||||||||||||||||||||||||||||||||||||
2006 | 24.26 | .45 | .94 | 1.39 | (.33 | ) | — | (.33 | ) | 25.32 | 5.73 | 10,700 | 2.00 | 1.75 | 1.99 | 1.76 | 1.97 | 1.79 | 44 | |||||||||||||||||||||||||||||||||||||
2005 | 22.99 | .47 | 1.15 | 1.62 | (.35 | ) | — | (.35 | ) | 24.26 | 7.08 | 18,671 | 2.00 | 2.01 | 2.00 | 2.01 | 1.99 | 2.02 | 47 | |||||||||||||||||||||||||||||||||||||
2004 | 21.63 | .40 | 1.19 | 1.59 | (.23 | ) | — | (.23 | ) | 22.99 | 7.36 | 23,110 | 2.03 | 1.72 | 2.00 | 1.76 | 2.00 | 1.76 | 45 | |||||||||||||||||||||||||||||||||||||
| Class C (8/96) | ||||||||||||||||||||||||||||||||||||||||||||||||||||||||
2008 | 27.32 | .49 | (2.31 | ) | (1.82 | ) | (.39 | ) | (.72 | ) | (1.11 | ) | 24.39 | (6.94 | ) | 8,192 | 2.03 | 1.78 | 1.98 | 1.83 | 1.96 | 1.85 | 37 | |||||||||||||||||||||||||||||||||
2007 | 25.29 | .51 | 2.02 | 2.53 | (.50 | ) | — | (.50 | ) | 27.32 | 10.10 | 9,363 | 1.97 | 1.90 | 1.97 | 1.90 | 1.94 | 1.93 | 37 | |||||||||||||||||||||||||||||||||||||
2006 | 24.24 | .45 | .93 | 1.38 | (.33 | ) | — | (.33 | ) | 25.29 | 5.70 | 7,992 | 2.01 | 1.76 | 1.99 | 1.77 | 1.97 | 1.80 | 44 | |||||||||||||||||||||||||||||||||||||
2005 | 22.96 | .48 | 1.15 | 1.63 | (.35 | ) | — | (.35 | ) | 24.24 | 7.13 | 7,979 | 1.99 | 2.01 | 1.99 | 2.01 | 1.98 | 2.02 | 47 | |||||||||||||||||||||||||||||||||||||
2004 | 21.61 | .40 | 1.18 | 1.58 | (.23 | ) | — | (.23 | ) | 22.96 | 7.32 | 8,229 | 2.03 | 1.72 | 2.00 | 1.75 | 2.00 | 1.76 | 45 | |||||||||||||||||||||||||||||||||||||
| Class I (8/96)(e) | ||||||||||||||||||||||||||||||||||||||||||||||||||||||||
2008 | 25.15 | .69 | (2.12 | ) | (1.43 | ) | (.76 | ) | (.72 | ) | (1.48 | ) | 22.24 | (5.99 | ) | 1,361 | 1.03 | 2.78 | .98 | 2.83 | .96 | 2.86 | 37 | |||||||||||||||||||||||||||||||||
2007 | 23.34 | .72 | 1.86 | 2.58 | (.77 | ) | — | (.77 | ) | 25.15 | 11.17 | 1,525 | .97 | 2.90 | .97 | 2.90 | .94 | 2.93 | 37 | |||||||||||||||||||||||||||||||||||||
2006 | 22.56 | .65 | .87 | 1.52 | (.74 | ) | — | (.74 | ) | 23.34 | 6.79 | 1,171 | 1.01 | 2.77 | .99 | 2.79 | .96 | 2.81 | 44 | |||||||||||||||||||||||||||||||||||||
2005 | 21.57 | .68 | 1.07 | 1.75 | (.76 | ) | — | (.76 | ) | 22.56 | 8.17 | 761 | .99 | 3.06 | .99 | 3.06 | .98 | 3.07 | 47 | |||||||||||||||||||||||||||||||||||||
2004 | 20.46 | .59 | 1.12 | 1.71 | (.60 | ) | — | (.60 | ) | 21.57 | 8.48 | 716 | 1.03 | 2.72 | 1.00 | 2.75 | 1.00 | 2.76 | 45 | |||||||||||||||||||||||||||||||||||||
| * | Effective July 7, 2008, Nuveen Balanced Municipal and Stock Fund changed its name to Nuveen Conservative Allocation Fund. |
| (a) | Per share Net Investment Income (Loss) is calculated using the average daily shares method. |
| (b) | Total return is the combination of changes in net asset value without any sales charge, reinvested dividend income at net asset value and reinvested capital gains distributions at net asset value, if any. Total returns are not annualized. |
| (c) | After expense reimbursement from the Adviser, where applicable. |
| (d) | After custodian fee credit and expense reimbursement, where applicable. |
| (e) | Effective May 1, 2008, Class R Shares were renamed Class I Shares. |
See accompanying notes to financial statements.
60
| Class (Commencement Date) | ||||||||||||||||||||||||||||||||||||||||||||||||||||||||
| Investment Operations | Less Distributions | Ratios/Supplemental Data | ||||||||||||||||||||||||||||||||||||||||||||||||||||||
STOCK AND BOND* | Ratios to Average Net Assets Before Credit/ Reimbursement | Ratios to Average Net Assets After Reimbursement(c) | Ratios to Average Net Assets After Credit/ Reimbursement(d) | |||||||||||||||||||||||||||||||||||||||||||||||||||||
| Year Ended June 30, | Beginning Net Asset Value | Net Invest- ment Income(a) | Net Realized/ Unrealized Gain (Loss) | Total | Net Invest- ment Income | Capital Gains | Total | Ending Net Asset Value | Total Return(b) | Ending Net Assets (000) | Expenses | Net Invest- ment Income | Expenses | Net Invest- ment Income | Expenses | Net Invest- ment Income | Portfolio Turnover Rate | |||||||||||||||||||||||||||||||||||||||
| Class A (8/96) | ||||||||||||||||||||||||||||||||||||||||||||||||||||||||
2008 | $ | 26.73 | $ | .54 | $ | (2.04 | ) | $ | (1.50 | ) | $ | (.56 | ) | $ | (2.32 | ) | $ | (2.88 | ) | $ | 22.35 | (6.31 | )% | $ | 29,612 | 1.32 | % | 2.04 | % | 1.23 | % | 2.12 | % | 1.23 | % | 2.13 | % | 51 | % | |||||||||||||||||
2007 | 25.40 | .58 | 2.97 | 3.55 | (.61 | ) | (1.61 | ) | (2.22 | ) | 26.73 | 14.40 | 33,519 | 1.26 | 2.17 | 1.24 | 2.19 | 1.24 | 2.19 | 61 | ||||||||||||||||||||||||||||||||||||
2006 | 25.95 | .50 | 1.41 | 1.91 | (.54 | ) | (1.92 | ) | (2.46 | ) | 25.40 | 7.60 | ** | 30,644 | 1.31 | 1.84 | 1.24 | 1.91 | 1.24 | 1.91 | 56 | |||||||||||||||||||||||||||||||||||
2005 | 24.56 | .56 | 1.47 | 2.03 | (.64 | ) | — | (.64 | ) | 25.95 | 8.33 | 31,248 | 1.30 | 2.16 | 1.25 | 2.21 | 1.25 | 2.21 | 62 | |||||||||||||||||||||||||||||||||||||
2004 | 22.72 | .41 | 1.92 | 2.33 | (.49 | ) | — | (.49 | ) | 24.56 | 10.29 | 33,312 | 1.36 | 1.61 | 1.25 | 1.72 | 1.25 | 1.72 | 61 | |||||||||||||||||||||||||||||||||||||
| Class B (8/96) | ||||||||||||||||||||||||||||||||||||||||||||||||||||||||
2008 | 26.73 | .35 | (2.04 | ) | (1.69 | ) | (.37 | ) | (2.32 | ) | (2.69 | ) | 22.35 | (7.02 | ) | 5,535 | 2.07 | 1.29 | 1.98 | 1.38 | 1.98 | 1.38 | 51 | |||||||||||||||||||||||||||||||||
2007 | 25.40 | .37 | 2.98 | 3.35 | (.41 | ) | (1.61 | ) | (2.02 | ) | 26.73 | 13.55 | 6,376 | 2.02 | 1.40 | 1.99 | 1.42 | 1.99 | 1.42 | 61 | ||||||||||||||||||||||||||||||||||||
2006 | 25.95 | .30 | 1.41 | 1.71 | (.34 | ) | (1.92 | ) | (2.26 | ) | 25.40 | 6.80 | ** | 8,051 | 2.06 | 1.09 | 1.99 | 1.15 | 1.99 | 1.15 | 56 | |||||||||||||||||||||||||||||||||||
2005 | 24.56 | .37 | 1.47 | 1.84 | (.45 | ) | — | (.45 | ) | 25.95 | 7.53 | 11,564 | 2.05 | 1.41 | 2.00 | 1.46 | 2.00 | 1.47 | 62 | |||||||||||||||||||||||||||||||||||||
2004 | 22.72 | .23 | 1.92 | 2.15 | (.31 | ) | — | (.31 | ) | 24.56 | 9.48 | 12,459 | 2.11 | .86 | 2.00 | .97 | 2.00 | .97 | 61 | |||||||||||||||||||||||||||||||||||||
| Class C (8/96) | ||||||||||||||||||||||||||||||||||||||||||||||||||||||||
2008 | 26.75 | .35 | (2.04 | ) | (1.69 | ) | (.37 | ) | (2.32 | ) | (2.69 | ) | 22.37 | (7.01 | ) | 7,265 | 2.07 | 1.29 | 1.98 | 1.38 | 1.98 | 1.38 | 51 | |||||||||||||||||||||||||||||||||
2007 | 25.42 | .38 | 2.97 | 3.35 | (.41 | ) | (1.61 | ) | (2.02 | ) | 26.75 | 13.54 | 7,694 | 2.01 | 1.42 | 1.99 | 1.44 | 1.99 | 1.44 | 61 | ||||||||||||||||||||||||||||||||||||
2006 | 25.97 | .30 | 1.41 | 1.71 | (.34 | ) | (1.92 | ) | (2.26 | ) | 25.42 | 6.79 | ** | 7,342 | 2.06 | 1.08 | 1.99 | 1.16 | 1.99 | 1.16 | 56 | |||||||||||||||||||||||||||||||||||
2005 | 24.58 | .37 | 1.47 | 1.84 | (.45 | ) | — | (.45 | ) | 25.97 | 7.53 | 7,947 | 2.05 | 1.41 | 2.00 | 1.46 | 2.00 | 1.46 | 62 | |||||||||||||||||||||||||||||||||||||
2004 | 22.73 | .23 | 1.93 | 2.16 | (.31 | ) | — | (.31 | ) | 24.58 | 9.52 | 8,632 | 2.11 | .87 | 2.00 | .98 | 2.00 | .98 | 61 | |||||||||||||||||||||||||||||||||||||
| Class I (8/96)(e) | ||||||||||||||||||||||||||||||||||||||||||||||||||||||||
2008 | 26.73 | .60 | (2.04 | ) | (1.44 | ) | (.62 | ) | (2.32 | ) | (2.94 | ) | 22.35 | (6.07 | ) | 9,662 | 1.07 | 2.29 | .98 | 2.38 | .98 | 2.38 | 51 | |||||||||||||||||||||||||||||||||
2007 | 25.40 | .64 | 2.98 | 3.62 | (.68 | ) | (1.61 | ) | (2.29 | ) | 26.73 | 14.68 | 10,690 | 1.01 | 2.42 | .99 | 2.44 | .99 | 2.44 | 61 | ||||||||||||||||||||||||||||||||||||
2006 | 25.95 | .56 | 1.41 | 1.97 | (.60 | ) | (1.92 | ) | (2.52 | ) | 25.40 | 7.87 | ** | 9,213 | 1.06 | 2.08 | .99 | 2.15 | .99 | 2.15 | 56 | |||||||||||||||||||||||||||||||||||
2005 | 24.56 | .62 | 1.47 | 2.09 | (.70 | ) | — | (.70 | ) | 25.95 | 8.60 | 10,753 | 1.05 | 2.41 | 1.00 | 2.46 | 1.00 | 2.46 | 62 | |||||||||||||||||||||||||||||||||||||
2004 | 22.72 | .47 | 1.92 | 2.39 | (.55 | ) | — | (.55 | ) | 24.56 | 10.56 | 9,117 | 1.11 | 1.87 | 1.00 | 1.98 | 1.00 | 1.98 | 61 | |||||||||||||||||||||||||||||||||||||
| * | Effective August 1, 2008, Nuveen Balanced Stock and Bond Fund changed its name to Nuveen Moderate Allocation Fund. |
| ** | During the fiscal year ended June 30, 2006, the Fund received a payment from the Adviser of $55,844, for losses realized on the disposal of investments purchased in violation of investment restrictions, which otherwise would have reduced total returns by .08%, .13%, .12% and .08% for Class A, B, C and I, respectively. |
| (a) | Per share Net Investment Income (Loss) is calculated using the average daily shares method. |
| (b) | Total return is the combination of changes in net asset value without any sales charge, reinvested dividend income at net asset value and reinvested capital gains distributions at net asset value, if any. Total returns are not annualized. |
| (c) | After expense reimbursement from the Adviser, where applicable. |
| (d) | After custodian fee credit and expense reimbursement, where applicable. |
| (e) | Effective May 1, 2008, Class R Shares were renamed Class I Shares. |
See accompanying notes to financial statements.
61
Report of Independent Registered Public Accounting Firm
To the Board of Trustees and Shareholders of Nuveen Investment Trust:
In our opinion, the accompanying statements of assets and liabilities, including the portfolios of investments, and the related statements of operations and of changes in net assets and the financial highlights present fairly, in all material respects, the financial position of Nuveen Multi-Manager Large-Cap Value Fund, Nuveen Balanced Municipal and Stock Fund and Nuveen Balanced Stock and Bond Fund (each a series of the Nuveen Investment Trust, hereafter referred to as the “Funds”) at June 30, 2008, the results of each of their operations for the year then ended, the changes in each of their net assets for each of the two years in the period then ended and the financial highlights for each of the five years in the period then ended, in conformity with accounting principles generally accepted in the United States of America. These financial statements and financial highlights (hereafter referred to as “financial statements”) are the responsibility of the Funds’ management; our responsibility is to express an opinion on these financial statements based on our audits. We conducted our audits of these financial statements in accordance with the standards of the Public Company Accounting Oversight Board, which require that we plan and perform the audit to obtain reasonable assurance about whether the financial statements are free of material misstatement. An audit includes examining, on a test basis, evidence supporting the amounts and disclosures in the financial statements, assessing the accounting principles used and significant estimates made by management, and evaluating the overall financial statement presentation. We believe that our audits, which included confirmation of securities at June 30, 2008 by correspondence with the custodian and brokers, provide a reasonable basis for our opinion.
PRICEWATERHOUSECOOPERS LLP
Chicago, IL
August 22, 2008
62
Annual Investment Management Agreement Approval Process
The Board of Trustees (the “Board,” and each Trustee, a “Board Member”) is responsible for overseeing the performance of the investment advisers to the Nuveen Balanced Municipal and Stock Fund (currently known as the Nuveen Conservative Allocation Fund) (the “Balanced Municipal and Stock Fund”), the Nuveen Balanced Stock and Bond Fund (currently known as the Nuveen Moderate Allocation Fund) (the “Balanced Stock and Bond Fund” and, together with the Balanced Municipal and Stock Fund, the “Balanced Funds”), and the Nuveen Multi-Manager Large-Cap Value Fund (formerly the Nuveen Large-Cap Value Fund) (the “Multi-Manager Fund” and, together with the Balanced Funds, the “Funds”) and determining whether to approve the Funds’ advisory arrangements, including sub-advisory arrangements.
At a meeting held on April 23, 2008 (the “April Meeting”), the Board, including the Board Members who are not parties to the advisory agreement or “interested persons” of any parties (the “Independent Board Members”), approved the continuance of the investment management agreement between each Balanced Fund and Nuveen Asset Management (“NAM”) and a new sub-advisory agreement between NAM and Richards & Tierney, Inc. (“R&T”) on behalf of each Balanced Fund.
At a meeting held on May 28-29, 2008 (the “May Meeting”), the Board of the Multi-Manager Fund, including a majority of the Independent Board Members, considered and approved the continuation of the advisory and sub-advisory agreements for such Fund that were up for renewal for an additional one-year period. These agreements include the investment advisory agreement between NAM and the Fund and the sub-advisory agreements between NAM and Institutional Capital LLC (“ICAP”), NAM and Symphony Asset Management LLC (“Symphony”), and NAM and Nuveen HydePark Group, LLC (“HydePark”), respectively. At the April Meeting, in addition to approving the advisory and sub-advisory agreements pertaining to the Balanced Funds, the Board also prepared for their considerations at the May Meeting. Accordingly, the factors considered and determinations made regarding the renewals by the Independent Board Members for the Multi-Manager Fund include those made at the April Meeting
The approvals for the Balanced Funds are set forth below in Section I, followed by the discussion in Section II of the approvals for the Multi-Manager Fund.
I. Balanced Municipal and Stock Fund and Balanced Stock and Bond Fund
As indicated above, at the April Meeting, the Board, including Independent Board Members, approved the continuance of the investment management agreement (for purposes of this Section I, the “Investment Management Agreement”) between each Balanced Fund (for purposes of this Section I, the “Funds”) and NAM and a sub-advisory agreement (the “R&T Sub-Advisory Agreement”) between NAM and R&T (for purposes of this Section I, the “Sub-Adviser”) on behalf of the Funds. NAM and R&T are referred to occasionally throughout this Section I each as a “Fund Adviser” and together as the “Fund Advisers.” The R&T Sub-Advisory Agreements were required to be submitted to shareholders for their approval.
The Approval Process
Since last year and during the course of this year, NAM has been evaluating the investment strategy of the Funds and considering potential changes to such strategies in an effort to continue to meet investors’ needs in the current marketplace. Beginning in February 2008, the Board received a variety of materials relating to proposed changes to convert each Fund to a “fund-of-funds” structure, including the changes to the respective Fund’s investment objective and policies, as well as the rationale for the proposed changes, the respective Fund’s proposed asset allocations and the modified fee structure. In considering the proposed changes, the Board considered each Fund’s past performance, including its total return for the quarter, one-year, three-year and five-year periods ending December 31, 2007 (as applicable) and each Fund’s performance compared to similar, unaffiliated funds based on information and data provided by an independent third party and to recognized and/or customized benchmarks. The Board reviewed the net flows from purchases and redemptions of the applicable Fund, noting the outflows experienced by the Funds. The Board further recognized the changes in the marketplace over the years with funds being offered with a broader multi-asset and multi-manager approach than that followed by the Funds by diversifying among multiple asset classes and managers. The Board recognized that the proposed change to the respective Fund’s investment strategy seeks, in part, to improve the Fund’s risk/return profile by using asset allocation to diversify risk and diversify sources of value-added returns by accessing multiple investment managers. The Board reviewed the revised management fee schedule and estimated expenses for the Funds, including NAM’s commitment to waive fees and reimburse expenses through October 31, 2011 (as described in further detail below). The Independent Board Members further noted that NAM would pay one-half of the costs incurred in connection with the solicitation of proxies in seeking the necessary shareholder approvals to change the respective Fund’s fundamental investment objectives and policies if shareholder approval were obtained and would pay all costs if shareholder approval were not obtained. Based on its considerations, the Board approved the changes to each Fund’s investment objectives and applicable investment policies, and recommended that shareholders approve such changes. The Board also approved an amendment to the respective Fund’s then-current investment management agreement to reflect the lower management fee effective upon shareholder approval of the changes to the respective Fund’s investment objectives and fundamental investment policies necessary to convert the Fund to a fund-of-funds structure. As described in further detail below, the Board also approved the R&T Sub-Advisory Agreements and recommended shareholders approve such agreements.
63
Annual Investment Management Agreement Approval Process (continued)
In conjunction with the changes to the applicable Fund’s investment strategy, the Board reviewed the advisory arrangements of the Funds. To assist the Board in its evaluation of the respective Investment Management Agreement and R&T Sub-Advisory Agreement, at the April Meeting or prior meetings, the Independent Board Members received, in adequate time in advance of the April Meeting or prior meetings, extensive materials which outlined, among other things:
| • | the nature, extent and quality of services to be provided by the Fund Advisers; |
| • | the organization and business operations of the Fund Advisers; |
| • | the performance of the Funds as described below; |
| • | the profitability of Nuveen Investments, Inc.; |
| • | the proposed management fees of the Fund Advisers, including comparisons of the management fees with the gross management fees of comparable, unaffiliated funds based on information and data provided by an independent third party; |
| • | the expected expenses of the Fund, including comparisons of the Fund’s expected expense ratios with the expense ratios of comparable, unaffiliated funds based on information and data provided by an independent third party; and |
| • | the soft dollar practices of the Fund Advisers, if any. |
At the April Meeting, NAM made a presentation to and responded to questions from the Board. Prior to and during the April Meeting, the Independent Board Members met privately with their legal counsel to review the Board’s duties under the Investment Company Act of 1940, as amended, and the general principles of state law in reviewing and approving advisory contracts, an adviser’s fiduciary duty with respect to advisory contracts and compensation, the standards used by courts in determining whether investment company boards of directors have fulfilled their duties and factors to be considered by the Board in voting on advisory contracts. As outlined in more detail below, the Independent Board Members considered all factors they believed relevant with respect to the Fund, including the following: (a) the nature, extent and quality of the services to be provided by the Fund Advisers; (b) performance information of the Funds (as described below); (c) the profitability of Nuveen and its affiliates; (d) the extent to which economies of scale would be realized as a Fund grows; and (e) whether fee levels reflect these economies of scale for the benefit of Fund investors. In addition, the Board met regularly throughout the year to oversee the Funds. The Board Members relied upon their knowledge resulting from their meetings and interactions with NAM in evaluating the Funds’ advisory arrangements. It is with this background that the Board considered each advisory agreement for each Fund.
A. Nature, Extent and Quality of Services
In considering the renewal of the Investment Management Agreement and approval of the R&T Sub-Advisory Agreement of each Fund, the Board considered the nature, extent and quality of the respective Fund Adviser’s services. In this regard, as NAM already serves as adviser to other Nuveen funds overseen by the Board, the Board has a good understanding of NAM’s organization, operations and personnel. At the April Meeting or at prior meetings, the Board had reviewed materials outlining, among other things, each Fund Adviser’s organization and business; the types of services that each Fund Adviser or its affiliates would provide to the Funds under the revised investment strategy; the experience of each Fund Adviser with respect to the revised investment strategies; and the experience and credentials of each Fund Adviser’s personnel. In addition, the Independent Board Members noted that the Funds generally will invest in other Nuveen funds advised by NAM and may be sub-advised by an affiliated person of NAM. In light of the Funds having a fund-of-funds structure, the Board considered whether the services to be provided by the Fund Adviser to the Funds are in addition to, and not duplicative of, the services provided by the advisers to the underlying funds under their advisory contracts. The Board further noted that NAM recommended R&T and considered the basis for such recommendation.
In addition to advisory services, the Independent Board Members considered the quality of any administrative or non-advisory services provided. With respect to NAM, the Board noted that NAM and its affiliates provide the Funds with a wide variety of services and officers and other personnel as are necessary for the operations of the Funds, including, among other things: product management, fund administration, oversight of shareholder services and other fund service providers (including R&T), administration of Board relations, regulatory and portfolio compliance and legal support. With respect to R&T, the Independent Board Members noted that each respective R&T Sub-Advisory Agreement was essentially an agreement for portfolio management services only and R&T was not expected to supply other significant administrative services to the Funds.
Based on their review, the Board found that, overall, the nature, extent and quality of services provided and expected to be provided to the Funds under the respective Investment Management Agreement and R&T Sub-Advisory Agreement were satisfactory.
B. The Investment Performance of the Fund
As described above, in considering the proposal to change the respective Fund’s investment strategy, the Independent Board Members reviewed each Fund’s past performance record. There is, however, no record of the applicable Fund’s performance under its modified investment strategy.
C. Fees, Expenses and Profitability
1. Fees and Expenses
In evaluating the management fees and expenses of the Funds, the Board recognized that the fee structure will change significantly under the Funds’ new fund-of-funds structure. With respect to the overall advisory fees and expenses of the Funds,
64
the Board reviewed, among other things, the respective Fund’s proposed advisory fees (gross management fees) and estimated total expense ratios (before and after expense reimbursements and/or waivers) in absolute terms as well as comparisons to the gross management fees (before waivers), and total expense ratios (before and after waivers) of comparable, unaffiliated funds as well as a subset of fund-of-funds peers. In addition, in reviewing the comparisons, the Board recognized the differences between the fee and expense arrangement of a fund-of-funds structure and a traditional fund format thereby limiting some of the usefulness of the fee comparisons with that of traditional funds. In reviewing the advisory fees, the Independent Board Members also noted that NAM and R&T do not currently advise other fund-of-funds and therefore meaningful comparisons of fees assessed for similar clients were not available. In addition, the Board further noted that, in a fund-of-funds structure, the Funds will indirectly pay a portion of the expenses incurred by the underlying funds, including their advisory fees. The Independent Board Members noted that many of the underlying funds may be advised by NAM and sub-advised by an affiliated person of NAM. Accordingly, although each Fund’s advisory fee rate will be reduced under the new structure, NAM and affiliated sub-advisers may receive advisory fees from the underlying funds in which the Funds invest, and the Funds will indirectly bear their pro rata portion of these fees as well as the other expenses of the underlying funds. In considering the services provided by the Fund Advisers and the fee arrangements, the Board determined, however, that the fees were for services in addition to, rather than duplicative of, the services provided under any underlying fund’s advisory contracts.
In addition to the foregoing, the Board noted that NAM has agreed to waive fees and reimburse expenses through October 31, 2011 such that total annual net operating expenses (excluding 12b-1 distribution and service fees, interest expenses, taxes, fees incurred in acquiring and disposing of portfolio securities, underlying fund fees and expenses, and extraordinary expenses) do not exceed 0.37% of the average daily net assets of any class of the Balanced Municipal and Stock Fund’s shares and 0.29% of the average daily net assets of any class of the Balanced Stock and Bond Fund’s shares. The Board recognized that, although this expense cap is intended to approximate the Fund’s current expense cap, as the Fund reallocates its investments among the underlying funds, the weighted average operating expenses of the underlying funds borne by the Fund may increase or decrease, which could cause the Fund’s total annual net operating expenses (including fees and expenses of underlying funds) to be above or below the Fund’s current expense cap.
With respect to sub-advisory fees, NAM will pay the sub-advisory fees out of the management fees it receives from the Funds. The Independent Board Members reviewed the proposed sub-advisory fee arrangements.
Based on its review of the fee and service information provided, the Board determined that the proposed advisory fees for the respective Fund Adviser were reasonable.
2. Profitability
In conjunction with their review of fees at prior meetings, the Independent Board Members have considered the profitability of Nuveen for advisory activities (which incorporated Nuveen’s wholly-owned affiliated sub-advisers except that profitability information prior to April 30, 2007 did not include R&T as it was acquired at that time). R&T is a wholly-owned subsidiary of Nuveen Investments, Inc. At prior meetings, the Independent Board Members reviewed Nuveen’s revenues, expenses and profitability for advisory activities and the methodology to determine profitability. The Independent Board Members also have reviewed data comparing Nuveen’s profitability with other fund sponsors prepared by three independent third party service providers as well as comparisons of the revenues, expenses and profit margins of various unaffiliated management firms with similar amounts of assets under management prepared by Nuveen. In considering profitability, the Board recognized the inherent limitations in determining profitability as well as the difficulties in comparing the profitability of other unaffiliated advisers, as the profitability of other advisers generally is not publicly available and information that is available may not be representative of the industry and may be affected by, among other things, the adviser’s particular business mix, capital costs, types of funds managed and expense allocations. As noted above, the Board recognized that the proposed advisory fee paid by the respective Fund to NAM, which in turn pays R&T, is being reduced, although the estimated expenses borne by shareholders of the Fund are expected to increase. NAM, however, will receive advisory fees from the underlying funds to the extent NAM serves as investment adviser to the underlying funds. Similarly, affiliates of NAM may also receive sub-advisory fees to the extent they serve as sub-advisers to the underlying funds. However, the Independent Board Members noted that NAM estimates that the advisory fees paid to NAM by the respective Fund, together with the advisory fees paid to NAM attributable to the Fund’s investment in the Nuveen underlying funds, will be lower than the Fund’s current advisory fees based on such Fund’s anticipated initial asset allocations (although this may change in the future as such Fund’s asset allocations are modified going forward). The Board also had previously received Nuveen’s 2006 Annual Report as well as its quarterly report ending September 30, 2007. Based on their review, the Independent Board Members were satisfied that Nuveen’s level of profitability for advisory activities was reasonable in light of the services provided.
In evaluating the reasonableness of the compensation, the Board also considered any other revenues paid to the Fund Advisers as well as any indirect benefits (such as soft dollar arrangements, if any) the Fund Advisers expect to receive that are directly attributable to their management of the Funds, if any. See Section E below for additional information.
D. Economies of Scale and Whether Fee Levels Reflect these Economies of Scale
Generally, management fees for funds in the Nuveen complex are comprised of a fund-level component and a complex-level component. The Independent Board Members have recognized that breakpoints are one way to share the benefits of economies of
65
Annual Investment Management Agreement Approval Process (continued)
scale with investors. In August 2004 (as modified in 2007), to help ensure shareholders share in these benefits, the Board approved a complex-level fee arrangement pursuant to which the complex-level component is reduced as assets in the fund complex reach certain levels. With respect to the Funds, the advisory fee schedule does not contain fund-level breakpoints. In addition, the Funds will not be assessed a complex-level fee as this is assessed at the Nuveen underlying fund level. The Independent Board Members recognized, however, that the Funds will benefit from reductions in complex-level fees and fund-level fees indirectly as the complex and Nuveen underlying funds reach breakpoint levels and reduce the fees of the Nuveen underlying funds. Further, assets of the Funds invested in non-Nuveen underlying funds will be counted in determining the complex-level fee component of the Nuveen underlying funds. Based on its review, the Independent Board Members had concluded that the absence of a breakpoint schedule and complex-level fee arrangement was acceptable.
E. Indirect Benefits
In evaluating fees, the Board also considered any indirect benefits or profits the Fund Advisers or their affiliates may receive as a result of their relationship with each Fund. In this regard, the Board considered, among other things, that an affiliate of the Fund Advisers will provide distribution and shareholder services to the Funds and therefore will receive sales charges as well as distribution and shareholder servicing fees pursuant to a Rule 12b-1 plan with respect to certain classes of shares of the Funds.
In addition to the above, the Board considered whether the Fund Advisers will receive any benefits from soft dollar arrangements whereby a portion of the commissions paid by a Fund for brokerage may be used to acquire research that may be helpful to the Fund Advisers in managing the assets of a Fund and other clients. With respect to NAM, the Independent Board Members noted that NAM does not currently have any soft dollar arrangements; however, to the extent certain bona fide agency transactions that occur on markets that traditionally trade on a principal basis and riskless principal transactions are considered as generating “commissions,” NAM intends to comply with applicable safe harbor provisions. With respect to R&T, the Independent Board Members noted that R&T does not have any soft dollar arrangements.
F. Conclusion
The Board did not identify any single factor discussed previously as all-important or controlling. The Board, including a majority of the Independent Board Members, concluded that the terms of the applicable Investment Management Agreement and R&T Sub-Advisory Agreement were fair and reasonable, that the respective Fund Adviser’s fees are reasonable in light of the services provided to each Fund, that the respective Investment Management Agreement be renewed and the respective R&T Sub-Advisory Agreement be approved and the Board recommended that shareholders approve the R&T Sub-Advisory Agreement of the respective Fund.
II. Multi-Manager Fund
The Investment Company Act of 1940, as amended, provides, in substance, that each investment advisory agreement between a fund and its investment adviser (including sub-advisers) will continue in effect from year to year only if its continuance is approved at least annually by the fund’s Board Members, including by a vote of a majority of the Independent Board Members, cast in person at a meeting called for the purpose of considering such approval. In connection with such approvals, the fund’s Board Members must request and evaluate, and the investment adviser is required to furnish, such information as may be reasonably necessary to evaluate the terms of the advisory agreement. As indicated above, at the May Meeting, the Board approved the continuance of the advisory and sub-advisory agreements for the Multi-Manager Fund.
With respect to the Multi-Manager Fund (for purposes of this Section II, the “Fund”), in evaluating the advisory agreement between the Fund and NAM (for purposes of this Section II, the “Investment Management Agreement”) and sub-advisory agreements between NAM and ICAP, NAM and Symphony, and NAM and HydePark, respectively (for purposes of this Section II, each a “Sub-Advisory Agreement,” and the Investment Management Agreement and the Sub-Advisory Agreements, each an “Advisory Agreement”), as described in further detail below, the Independent Board Members reviewed a broad range of information relating to the Fund, NAM, ICAP, Symphony and HydePark (ICAP, Symphony and HydePark are each a “Sub-Adviser” and NAM and the Sub-Advisers are each a “Fund Adviser”), including absolute performance, fee and expense information for the Fund as well as comparative performance, fee and expense information for a comparable peer group of funds, the performance information of recognized and/or customized benchmarks (as applicable), the profitability of Nuveen for its advisory activities (which includes its wholly owned subsidiaries), and other information regarding the organization, personnel, and services provided by the respective Fund Adviser. The Independent Board Members also met quarterly as well as at other times as the need arose during the year and took into account the information provided at such meetings and the knowledge gained therefrom. Prior to approving the renewal of the Advisory Agreements, the Independent Board Members reviewed the foregoing information with their independent legal counsel and with management, reviewed materials from independent legal counsel describing applicable law and their duties in reviewing advisory contracts, and met with independent legal counsel in private sessions without management present. The Independent Board Members considered the legal advice provided by independent legal counsel and relied upon their knowledge of the Fund Adviser, its services and the Fund resulting from their meetings and other interactions throughout the year and their own business judgment in determining the factors to be considered in evaluating the Advisory Agreements. Each Board Member may have accorded different weight to the various factors in reaching his or her conclusions with respect to the Fund’s Advisory Agreements. The Independent Board Members did not identify any single factor as all-important or controlling. The Independent Board Members’ considerations were instead based on a comprehensive consideration of all the information presented. The principal factors considered by the Board and its conclusions are described below.
66
A. Nature, Extent and Quality of Services
In considering renewal of the Investment Management Agreement, the Independent Board Members considered the nature, extent and quality of the Fund Adviser’s services, including advisory services and administrative services. The Independent Board Members reviewed materials outlining, among other things, NAM’s organization and business; the types of services that NAM or its affiliates provide and are expected to provide to the Fund; the performance record of the Fund (as described in further detail below); and any initiatives Nuveen had taken for the applicable fund product line. With respect to personnel, the Independent Board Members evaluated the background, experience and track record of the Fund Adviser’s investment personnel. In this regard, the Independent Board Members considered the additional investment in personnel to support Nuveen fund advisory activities, including in operations, product management and marketing as well as related fund support functions, including sales, executive, finance, human resources and information technology. The Independent Board Members also reviewed information regarding portfolio manager compensation arrangements to evaluate NAM’s ability to attract and retain high quality investment personnel.
In evaluating the services of NAM, the Independent Board Members also considered NAM’s oversight of the performance, business activities and compliance of the Sub-Advisers, the ability to supervise the Fund’s other service providers and given the importance of compliance, NAM’s compliance program. Among other things, the Independent Board Members considered the report of the chief compliance officer regarding the Fund’s compliance policies and procedures.
In addition to advisory services, the Independent Board Members considered the quality of administrative services provided by NAM and its affiliates including product management, fund administration, oversight of service providers, shareholder services, administration of Board relations, regulatory and portfolio compliance and legal support.
The Independent Board Members reviewed an evaluation of each Sub-Adviser from NAM, including information as to the process followed by NAM in evaluating sub-advisers. The evaluation also included information relating to each Sub-Adviser’s organization, operations, personnel, assets under management, investment philosophy, strategies and techniques in managing the Fund, developments affecting each Sub-Adviser, and an analysis of each Sub-Adviser. The Board considered the performance of the portion of the investment portfolio of the Fund for which the respective Sub-Adviser is responsible. The Board also recognized that the Sub-Advisory Agreements were essentially agreements for portfolio management services only and the Sub-Advisers were not expected to supply other significant administrative services to the Fund. During the last year, the Independent Board Members noted that they visited several sub-advisers to the Nuveen funds, meeting their key investment and business personnel. In this regard, during 2007, the Independent Board Members visited Symphony. The Independent Board Members also noted that they anticipate visiting each sub-adviser to the Nuveen funds at least once over the course of a multiple-year rotation. The Independent Board Members further noted that NAM recommended the renewal of the applicable Sub-Advisory Agreements and considered the basis for such recommendations and any qualifications in connection therewith.
Based on their review, the Independent Board Members found that, overall, the nature, extent and quality of services provided (and expected to be provided) to the Fund under the Investment Management Agreement or respective Sub-Advisory Agreement, as applicable, were satisfactory.
B. The Investment Performance of the Fund and Fund Advisers
The Board considered the investment performance of the Fund, including the Fund’s historic performance as well as its performance compared to funds with similar investment objectives (the “Performance Peer Group”) based on data provided by an independent third party (as described below). In addition, the Independent Board Members reviewed the Fund’s historic performance compared to recognized and/or customized benchmarks (as applicable).
In evaluating the performance information, the Board considered whether the Fund has operated within its investment objectives and parameters and the impact that the investment mandates may have had on performance. In addition, in comparing a fund’s performance with that of its Performance Peer Group, the Independent Board Members took into account that the closest Performance Peer Group in certain instances may not adequately reflect the respective fund’s investment objectives and strategies thereby hindering a meaningful comparison of the fund’s performance with that of the Performance Peer Group.
The Independent Board Members reviewed performance information including, among other things, total return information compared with the Fund’s Performance Peer Group as well as recognized and/or customized benchmarks (as appropriate) for the one-, three- and five-year periods (as applicable) ending December 31, 2007 and with the Fund’s Performance Peer Group for the quarter, one-, three-, and five- year periods ending March 31, 2008 (as applicable). This information supplemented the Fund performance information provided to the Board at each of its quarterly meetings. Based on their review, the Independent Board Members determined that the Fund’s investment performance over time had been satisfactory.
C. Fees, Expenses and Profitability
1. Fees and Expenses
The Board evaluated the management fees and expenses of the Fund reviewing, among other things, the Fund’s gross management fees (which take into account breakpoints), net management fees (which take into account fee waivers or reimbursements) and total expense ratios (before and after expense reimbursements and/or waivers) in absolute terms as well as compared to the gross management fees, net management fees (after waivers and/or reimbursements) and total expense ratios
67
Annual Investment Management Agreement Approval Process (continued)
(before and after waivers) of a comparable universe of unaffiliated funds based on data provided by an independent data provider (the “Peer Universe”) and/or a more focused subset of funds therein (the “Peer Group”). The Independent Board Members further reviewed data regarding the construction of Peer Groups as well as the methods of measurement for the fee and expense analysis and the performance analysis. In reviewing the comparisons of fee and expense information, the Independent Board Members took into account that in certain instances various factors such as the size of the Fund relative to peers, the size and particular composition of the Peer Group, the investment objectives of the peers, expense anomalies, and the timing of information used may impact the comparative data, thereby limiting the ability to make a meaningful comparison. In addition, the Independent Board Members noted the limited Peer Groups available for the Nuveen funds with multi-sleeves of investments. In reviewing the fee schedule for the Fund, the Independent Board Members also considered the fund-level and complex-wide breakpoint schedules (described in further detail below) and any fee waivers and reimbursements provided by Nuveen. Based on their review of the fee and expense information provided, the Independent Board Members determined that the Fund’s management fees and net total expense ratio were reasonable in light of the nature, extent and quality of services provided to the Fund.
2. Comparisons with the Fees of Other Clients
The Independent Board Members further reviewed information regarding the nature of services and fee rates offered by NAM to other clients. Such clients include separately managed accounts (both retail and institutional accounts) and funds that are not offered by Nuveen but are sub-advised by one of Nuveen’s investment management teams. In evaluating the comparisons of fees, the Independent Board Members noted that the fee rates charged to the Fund and other clients vary, among other things, because of the different services involved and the additional regulatory and compliance requirements associated with registered investment companies, such as the Fund. Accordingly, the Independent Board Members considered the differences in the product types, including, but not limited to, the services provided, the structure and operations, product distribution and costs thereof, portfolio investment policies, investor profiles, account sizes and regulatory requirements. The Independent Board Members noted, in particular, that the range of services provided to the Fund (as discussed above) is much more extensive than that provided to separately managed accounts. Given the inherent differences in the products, particularly the extensive services provided to the Fund, the Independent Board Members believe such facts justify the different levels of fees.
In considering the fees of a Sub-Adviser, the Independent Board Members also considered the pricing schedule or fees that the Sub-Adviser charges for similar investment management services for other fund sponsors or clients (such as retail and/or institutional managed accounts) as applicable. With respect to Symphony, the Independent Board Members also reviewed the fees it assesses for equity and taxable fixed-income hedge funds and hedge accounts it manages, which include a performance fee. In addition, the Independent Board Members noted that with respect to ICAP, the Sub-Adviser unaffiliated with Nuveen, such fees were the result of arm’s-length negotiations.
3. Profitability of Fund Advisers
In conjunction with its review of fees, the Independent Board Members also considered the profitability of Nuveen for its advisory activities (which incorporated Nuveen’s wholly-owned affiliated sub-advisers) and its financial condition. The Independent Board Members reviewed the revenues and expenses of Nuveen’s advisory activities for the last two years and the allocation methodology used in preparing the profitability data. The Independent Board Members noted this information supplemented the profitability information requested and received during the year to help keep them apprised of developments affecting profitability (such as changes in fee waivers and expense reimbursement commitments). In this regard, the Independent Board Members noted that they had also appointed an Independent Board Member as a point person to review and keep them apprised of changes to the profitability analysis and/or methodologies during the year. The Independent Board Members considered Nuveen’s profitability compared with other fund sponsors prepared by two independent third party service providers as well as comparisons of the revenues, expenses and profit margins of various unaffiliated management firms with similar amounts of assets under management prepared by Nuveen.
In reviewing profitability, the Independent Board Members recognized the subjective nature of determining profitability which may be affected by numerous factors including the allocation of expenses. Further, the Independent Board Members recognized the difficulties in making comparisons as the profitability of other advisers generally is not publicly available and the profitability information that is available for certain advisers or management firms may not be representative of the industry and may be affected by, among other things, the adviser’s particular business mix, capital costs, types of funds managed and expense allocations.
Notwithstanding the foregoing, the Independent Board Members reviewed Nuveen’s methodology and assumptions for allocating expenses across product lines to determine profitability. In reviewing profitability, the Independent Board Members recognized Nuveen’s investment in its fund business.
Based on its review, the Independent Board Members concluded that Nuveen’s level of profitability for its advisory activities was reasonable in light of the services provided. In addition, given that ICAP is unaffiliated with Nuveen, the Independent Board Members also considered such Sub-Adviser’s revenues, expenses (including the basis for allocating expenses) and profitability margins (pre- and post-tax). Based on their review, the Independent Board Members were satisfied that such Sub-Adviser’s level of profitability was reasonable in light of the services provided.
68
In evaluating the reasonableness of the compensation, the Independent Board Members also considered other amounts paid to a Fund Adviser by the Fund as well as any indirect benefits (such as soft dollar arrangements, if any) the Fund Adviser and its affiliates receive, or are expected to receive, that are directly attributable to the management of the Fund, if any. See Section E below for additional information on indirect benefits the Fund Adviser may receive as a result of its relationship with the Fund. Based on their review of the overall fee arrangements of the Fund, the Independent Board Members determined that the advisory fees and expenses of the Fund were reasonable.
D. Economies of Scale and Whether Fee Levels Reflect these Economies of Scale
With respect to economies of scale, the Independent Board Members recognized the potential benefits resulting from the costs of a fund being spread over a larger asset base. The Independent Board Members therefore considered whether the Fund has appropriately benefited from any economies of scale and whether there is potential realization of any further economies of scale. In considering economies of scale, the Independent Board Members have recognized that economies of scale are difficult to measure and predict with precision, particularly on a fund-by-fund basis. Notwithstanding the foregoing, one method to help ensure the shareholders share in these benefits is to include breakpoints in the advisory fee schedule. Accordingly, the Independent Board Members reviewed and considered the fund-level breakpoints in the advisory fee schedules that reduce advisory fees.
In addition to fund-level advisory fee breakpoints, the Board also considered the Fund’s complex-wide fee arrangement. Pursuant to the complex-wide fee arrangement, the fees of the funds in the Nuveen complex, including the Fund, are reduced as the assets in the fund complex reach certain levels. In evaluating the complex-wide fee arrangement, the Independent Board Members recognized that the complex-wide fee schedule was recently revised in 2007 to provide for additional fee savings to shareholders and considered the amended schedule. The Independent Board Members further considered that the complex-wide fee arrangement seeks to provide the benefits of economies of scale to fund shareholders when total fund complex assets increase, even if assets of a particular fund are unchanged or have decreased. The approach reflects the notion that some of Nuveen’s costs are attributable to services provided to all its funds in the complex and therefore all funds benefit if these costs are spread over a larger asset base. Based on their review, the Independent Board Members concluded that the breakpoint schedule and complex-wide fee arrangement were acceptable and desirable in providing benefits from economies of scale to shareholders.
E. Indirect Benefits
In evaluating fees, the Independent Board Members received and considered information regarding potential “fall out” or ancillary benefits the respective Fund Adviser or its affiliates may receive as a result of its relationship with the Fund. In this regard, the Independent Board Members considered, among other things, any sales charges, distribution fees and shareholder services fees received and retained by the Fund’s principal underwriter, an affiliate of NAM, which includes fees received pursuant to any 12b-1 plan. The Independent Board Members, therefore, considered the 12b-1 fees retained by Nuveen during the last calendar year.
In addition to the above, the Independent Board Members considered whether the Fund Adviser received any benefits from soft dollar arrangements whereby a portion of the commissions paid by the Fund for brokerage may be used to acquire research that may be useful to the Fund Adviser in managing the assets of the Fund and other clients. With respect to NAM, the Independent Board Members noted that NAM does not currently have any soft dollar arrangements; however, to the extent certain bona fide agency transactions that occur on markets that traditionally trade on a principal basis and riskless principal transactions are considered as generating “commissions,” NAM intends to comply with the applicable safe harbor provisions.
With respect to HydePark and ICAP, the Independent Board Members considered that such Sub-Advisers may benefit from their soft dollar arrangements pursuant to which the respective Sub-Adviser receives research from brokers that execute the Fund’s portfolio transactions. The Independent Board Members noted that such Sub-Advisers’ profitability may be lower if they were required to pay for this research with hard dollars. The Board also considered that Symphony currently does not enter into soft dollar arrangements; however, it has adopted a soft dollar policy in the event it does so in the future.
Based on their review, the Independent Board Members concluded that any indirect benefits received by a Fund Adviser as a result of its relationship with the Fund were reasonable and within acceptable parameters.
F. Other Considerations
The Independent Board Members did not identify any single factor discussed previously as all-important or controlling. The Board Members, including the Independent Board Members, unanimously concluded that the terms of the Investment Management Agreement and Sub-Advisory Agreements are fair and reasonable, that the respective Fund Adviser’s fees are reasonable in light of the services provided to the Fund and that the Investment Management Agreement and the Sub-Advisory Agreements be renewed.
69
Notes
70
Notes
71
Trustees and Officers
The management of the Funds, including general supervision of the duties performed for the Funds by the Adviser, is the responsibility of the Board of Trustees of the Funds. The number of trustees of the Funds is currently set at nine. None of the trustees who are not “interested” persons of the Funds (referred to herein as “independent trustees”) has ever been a director or employee of, or consultant to, Nuveen or its affiliates. The names and business addresses of the trustees and officers of the Funds, their principal occupations and other affiliations during the past five years, the number of portfolios each oversees and other directorships they hold are set forth below.
The Funds’ Statement of Additional Information (“SAI”) includes more information about the trustees. To request a free copy, call Nuveen Investments at (800) 257-8787 or visit the Funds’ website at www.nuveen.com.
Name, Birthdate and Address | Position(s) Held with the Funds | Year First Elected or Appointed (1) | Principal Occupation(s) Including other Directorships During Past 5 Years | Number of Portfolios in Fund Complex Overseen by Trustee | ||||
| Independent Trustees: | ||||||||
Robert P. Bremner 8/22/40 333 W. Wacker Drive Chicago, IL 60606 | Chairman of the Board and Trustee | 1997 | Private Investor and Management Consultant. | 186 | ||||
Jack B. Evans 10/22/48 333 W. Wacker Drive Chicago, IL 60606 | Trustee | 1999 | President, The Hall-Perrine Foundation, a private philanthropic corporation (since 1996); Director and Vice Chairman, United Fire Group, a publicly held company; Member of the Board of Regents for the State of Iowa University System; Director, Gazette Companies; Life Trustee of Coe College and Iowa College Foundation; Member of the Advisory Council of the Department of Finance in the Tippie College of Business, University of lowa; formerly, Director, Alliant Energy; formerly, Director, Federal Reserve Bank of Chicago; formerly, President and Chief Operating Officer, SCI Financial Group, Inc., a regional financial services firm. | 186 | ||||
William C. Hunter 3/6/48 333 W. Wacker Drive Chicago, IL 60606 | Trustee | 2004 | Dean, Tippie College of Business, University of Iowa (since July 2006); formerly, Dean and Distinguished Professor of Finance, School of Business at the University of Connecticut (2003-2006); previously, Senior Vice President and Director of Research at the Federal Reserve Bank of Chicago (1995-2003); Director (since 1997), Credit Research Center at George Washington University; Director (since 2004) of Xerox Corporation; Director (since 2005), Beta Gamma Sigma International Honor Society; Director, SS&C Technologies, Inc. (May 2005-October 2005). | 186 | ||||
David J. Kundert 10/28/42 333 W. Wacker Drive Chicago, IL 60606 | Trustee | 2005 | Director, Northwestern Mutual Wealth Management Company; Retired (since 2004) as Chairman, JPMorgan Fleming Asset Management, President and CEO, Banc One Investment Advisors Corporation, and President, One Group Mutual Funds; prior thereto, Executive Vice President, Banc One Corporation and Chairman and CEO, Banc One Investment Management Group; Member, Board of Regents, Luther College; member of the Wisconsin Bar Association; member of Board of Directors, Friends of Boerner Botanical Gardens; member of Investment Committee, Greater Milwaukee Foundation. | 186 | ||||
William J. Schneider 9/24/44 333 W. Wacker Drive Chicago, IL 60606 | Trustee | 1997 | Chairman, formerly, Senior Partner and Chief Operating Officer (retired, 2004) of Miller-Valentine Partners Ltd., a real estate investment company; Director, Dayton Development Coalition; formerly, Member, Business Advisory Council, Cleveland Federal Reserve Bank. | 186 | ||||
Judith M. Stockdale 12/29/47 333 W. Wacker Drive Chicago, IL 60606 | Trustee | 1997 | Executive Director, Gaylord and Dorothy Donnelley Foundation (since 1994); prior thereto, Executive Director, Great Lakes Protection Fund (from 1990 to 1994). | 186 | ||||
72
Name, Birthdate and Address | Position(s) Held with the Funds | Year First Elected or Appointed (1) | Principal Occupation(s) Including other Directorships During Past 5 Years | Number of Portfolios in Fund Complex Overseen by Trustee | ||||
Carole E. Stone 6/28/47 333 W. Wacker Drive Chicago, IL 60606 | Trustee | 2007 | Director, Chicago Board Options Exchange (since 2006); Commissioner, New York State Commission on Public Authority Reform (since 2005); formerly, Director, New York State Division of the Budget (2000-2004), Chair, Public Authorities Control Board (2000-2004) and Director, Local Government Assistance Corporation (2000-2004); formerly, Chair, New York Racing Association Oversight Board (2005-12/2007). | 186 | ||||
Terence J. Toth (2) 9/29/59 333 W. Wacker Drive Chicago, IL 60606 | Trustee | 2008 | Private Investor (since 2007); CEO and President, Northern Trust Investments (2004-2007); Executive Vice President, Quantitative Management & Securities Lending (2000-2004); prior thereto, various positions with Northern Trust Company (since 1994); Member: Goodman Theatre Board (since 2004); Chicago Fellowship Board (since 2005), University of Illinois Leadership Council Board (since 2007) and Catalyst Schools of Chicago Board (since 2008); formerly Member: Northern Trust Mutual Funds Board (2005-2007), Northern Trust Japan Board (2004-2007), Northern Trust Securities Inc. Board (2003-2007) and Northern Trust Hong Kong Board (1997-2004). | 186 | ||||
| Interested Trustee: | ||||||||
John P. Amboian (2)(3) 6/14/61 333 W. Wacker Drive Chicago, IL 60606 | Trustee | 2008 | Chief Executive Officer (since July 2007) and Director (since 1999) of Nuveen Investments, Inc.; Chief Executive Officer (since 2007) of Nuveen Asset Management, Rittenhouse Asset Management, Nuveen Investments Advisors, Inc. formerly, President (1999-2004) of Nuveen Advisory Corp. and Nuveen Institutional Advisory Corp. | 186 | ||||
Name, Birthdate and Address | Position(s) Held with the Funds | Year First Elected or Appointed (4) | Principal Occupation(s) During Past 5 Years | Number of Portfolios in Fund Complex Overseen by Officer | ||||
| Officers of the Funds: | ||||||||
Gifford R. Zimmerman 9/9/56 333 W. Wacker Drive Chicago, IL 60606 | Chief Administrative Officer | 1988 | Managing Director (since 2002), Assistant Secretary and Associate General Counsel, formerly, Vice President and Assistant General Counsel, of Nuveen Investments, LLC; Managing Director (since 2002), Associate General Counsel and Assistant Secretary, of Nuveen Asset Management; Vice President and Assistant Secretary of NWQ Investment Management Company, LLC. (since 2002), Nuveen Investments Advisers Inc. (since 2002), Symphony Asset Management LLC, and NWQ Investment Management Company, LLC (since 2003), Tradewinds Global Investors, LLC, and Santa Barbara Asset Management, LLC (since 2006), Nuveen HydePark Group LLC and Richards & Tierney, Inc. (since 2007); Managing Director, Associate General Counsel and Assistant Secretary of Rittenhouse Asset Management, Inc. (since 2003); Managing Director (since 2004) and Assistant Secretary (since 1994) of Nuveen Investments, Inc.; formerly, Managing Director (2002-2004), General Counsel (1998-2004) and Assistant Secretary of Nuveen Advisory Corp. and Nuveen Institutional Advisory Corp. (5); Chartered Financial Analyst. | 186 | ||||
Michael T. Atkinson 2/3/66 333 W. Wacker Drive Chicago, IL 60606 | Vice President and Assistant Secretary | 2000 | Vice President (since 2002) of Nuveen Investments, LLC. | 186 | ||||
Alan A. Brown 8/1/62 333 W. Wacker Drive Chicago, IL 60606 | Vice President | 2007 | Executive Vice President, Mutual Funds, Nuveen Investments, LLC, (since 2005), previously, Managing Director and Chief Marketing Officer (2001-2005). | 66 | ||||
73
Trustees and Officers (continued)
Name, Birthdate and Address | Position(s) Held with the Funds | Year First Elected or Appointed (4) | Principal Occupation(s) Including other Directorships During Past 5 Years | Number of Portfolios in Fund Complex Overseen by Officer | ||||
Lorna C. Ferguson 10/24/45 333 W. Wacker Drive Chicago, IL 60606 | Vice President | 1998 | Managing Director (since 2004), formerly, Vice President of Nuveen Investments, LLC, Managing Director (2004) formerly, Vice President (1998-2004) of Nuveen Advisory Corp. and Nuveen Institutional Advisory Corp. (5); Managing Director (since 2005) of Nuveen Asset Management. | 186 | ||||
Stephen D. Foy 5/31/54 333 W. Wacker Drive Chicago, IL 60606 | Vice President and Controller | 1998 | Vice President (since 1993) and Funds Controller (since 1998) of Nuveen Investments, LLC; Vice President (since 2005) of Nuveen Asset Management; formerly, Vice President and Funds Controller (1998-2004) of Nuveen Investments, Inc.; Certified Public Accountant. | 186 | ||||
Walter M. Kelly 2/24/70 333 W. Wacker Drive Chicago, IL 60606 | Chief Compliance Officer and Vice President | 2003 | Senior Vice President (since 2008), Vice President (2006- 2008) formerly, Assistant Vice President and Assistant General Counsel (2003-2006) of Nuveen Investments, LLC; Vice President (since 2006) and Assistant Secretary (since 2003) of Nuveen Asset Management. | 186 | ||||
David J. Lamb 3/22/63 333 W. Wacker Drive Chicago, IL 60606 | Vice President | 2000 | Vice President (since 2000) of Nuveen Investments, LLC; Certified Public Accountant. | 186 | ||||
Tina M. Lazar 8/27/61 333 W. Wacker Drive Chicago, IL 60606 | Vice President | 2002 | Vice President of Nuveen Investments, LLC (since 1999). | 186 | ||||
Larry W. Martin 7/27/51 333 W. Wacker Drive Chicago, IL 60606 | Vice President and Assistant Secretary | 1988 | Vice President, Assistant Secretary and Assistant General Counsel of Nuveen Investments, LLC; formerly, Vice President and Assistant Secretary of Nuveen Advisory Corp. and Nuveen Institutional Advisory Corp. (4); Vice President (since 2005) and Assistant Secretary of Nuveen Investments, Inc.; Vice President (since 2005) and Assistant Secretary (since 1997) of Nuveen Asset Management; Vice President (since 2000), Assistant Secretary and Assistant General Counsel (since 1998) of Rittenhouse Asset Management, Inc.; Vice President and Assistant Secretary of Nuveen Investments Advisers Inc. (since 2002), NWQ Investment Management Company, LLC (since 2002), Symphony Asset Management LLC (since 2003), Tradewinds NWQ Global Investors, LLC, Santa Barbara Asset Management, LLC (since 2006) and of Nuveen HydePark Group, LLC and Richards & Tierney, Inc. (since 2007); formerly, Vice President and Assistant Secretary of Nuveen Advisory Corp. and Nuveen Institutional Advisory Corp. (5) | 186 | ||||
Kevin J. McCarthy 3/26/66 333 W. Wacker Drive Chicago, IL 60606 | Vice President and Secretary | 2007 | Managing Director (since 2008), formerly, Vice President (2007-2008), Nuveen Investments, LLC; Managing Director (since 2008) Vice President and Assistant Secretary (since 2007), Nuveen Asset Management, Rittenhouse Asset Management, Inc., Nuveen Investment Advisers Inc., Nuveen Investment Institutional Services Group LLC, NWQ Investment Management Company, LLC, Tradewinds Global Investors LLC, NWQ Holdings, LLC, Symphony Asset Management LLC, Santa Barbara Asset Management LLC, Nuveen HydePark Group, LLC and Richards & Tierney, Inc, (since 2007); Managing Director (since 2008), Vice President (2007-2008) and Assistant General Counsel, Nuveen Investments, Inc., prior thereto, Partner, Bell, Boyd & Lloyd LLP (1997-2007). | 186 | ||||
74
Name, Birthdate and Address | Position(s) Held with the Funds | Year First Elected or Appointed (4) | Principal Occupation(s) Including other Directorships During Past 5 Years | Number of Portfolios in Fund Complex Overseen by Officer | ||||
John V. Miller 4/10/67 333 W. Wacker Drive Chicago, IL 60606 | Vice President | 2007 | Managing Director (since 2007), formerly, Vice President (2002-2007) of Nuveen Investments, LLC; Chartered Financial Analyst. | 186 | ||||
Christopher M. Rohrbacher 8/1/71 333 W. Wacker Drive Chicago, IL 60606 | Vice President and Assistant Secretary | 2008 | Vice President, Nuveen Investments, LLC (since 2008); Vice President and Assistant Secretary, Nuveen Asset Management (since 2008); Vice President and Assistant General Counsel, Nuveen Investments, Inc. (since 2008); prior thereto, Associate, Skadden, Arps, Slate Meagher & Flom LLP (2002-2008) | 186 | ||||
James F. Ruane 7/3/62 333 W. Wacker Drive Chicago, IL 60606 | Vice President and Assistant Secretary | 2007 | Vice President, Nuveen Investments (since 2007); prior thereto, Partner, Deloitte & Touche USA LLP (since 2005), formerly, senior tax manager (since 2002); Certified Public Accountant. | 186 | ||||
John S. White 5/12/67 333 W. Wacker Drive Chicago, IL 60606 | Vice President | 2007 | Vice President (since 2006) of Nuveen Investments, LLC, formerly, Assistant Vice President (since 2002); Lieutenant Colonel (since 2007), United States Marine Corps Reserve, formerly, Major (since 2001). | 66 | ||||
Mark L. Winget 12/21/68 333 W. Wacker Drive Chicago, IL 60606 | Vice President and Assistant Secretary | 2008 | Vice President, Nuveen Investments, LLC (since 2008); Vice President and Assistant Secretary, Nuveen Asset Management (since 2008); Vice President and Assistant General Counsel, Nuveen Investments Inc. (since 2008); prior thereto, Counsel, VedderPrice P.C. (1997-2007). | 186 | ||||
| (1) | Trustees serve an indefinite term until his/her successor is elected or appointed. The year first elected or appointed represents the year in which the trustee was first elected or appointed to any fund in the Nuveen Fund Complex. |
| (2) | Mr. Amboian and Mr. Toth were appointed to the Board of Trustees of certain Nuveen Funds, effective July 1, 2008. Mr. Amboian and Mr. Toth were subsequently elected to the Board of Trustees of the remainder of the funds in the Nuveen Fund Complex on July 28, 2008. In connection with the appointment of Mr. Amboian as trustee, Timothy R. Schwertfeger, an interested trustee, resigned from the Board of Trustees, effective July 1, 2008. |
| (3) | Mr. Amboian is an interested trustee because of his position with Nuveen Investments, Inc. and certain of its subsidiaries, which are affiliates of the Nuveen Funds. |
| (4) | Officers serve one year terms through July of each year. The year first elected or appointed represents the year in which the officer was first elected or appointed to any fund in the Nuveen Fund Complex. |
| (5) | Nuveen Advisory Corp. and Nuveen Institutional Advisory Corp. were reorganized into Nuveen Asset Management, effective January 1, 2005. |
75
Glossary of Terms Used in this Report
Average Annual Total Return: This is a commonly used method to express an investment’s performance over a particular, usually multi-year time period. It expresses the return that would have been necessary each year to equal the investment’s actual cumulative performance (including change in NAV or offer price and reinvested dividends and capital gains distributions, if any) over the time period being considered.
Average Duration: Duration is a measure of the expected period over which a bond’s principal and interest will be paid, and consequently is a measure of the sensitivity of a bond’s (or bond fund’s) value to changes when market interest rates change. Generally, the longer a bond or Fund’s duration, the more the price of the bond or Fund will change as interest rates change.
Dividend Yield (also known as Market Yield or Current Yield): An investment’s current annualized dividend divided by its current offering price.
Net Asset Value (NAV): A Fund’s NAV is the dollar value of one share in the Fund. It is calculated by subtracting the liabilities of the Fund from its total assets and then dividing the remainder by the number of shares outstanding. Fund NAVs are calculated at the end of each business day.
SEC 30-Day Yield: A standardized measure of a Fund’s yield that accounts for the future amortization of premiums or discounts of bonds held in the Fund’s portfolio.
Zero Coupon Bond: A zero coupon bond does not pay a regular interest coupon to its holders during the life of the bond. Tax-exempt income to the holder of the bond comes from accretion of the difference between the original purchase price of the bond at issuance and the par value of the bond at maturity and is effectively paid at maturity. The market prices of zero coupon bonds generally are more volatile than the market prices of bonds that pay interest periodically.
76
Fund Information
Fund Manager Nuveen Asset Management 333 West Wacker Drive Chicago, IL 60606
Sub-Advisers Institutional Capital LLC 225 West Wacker Drive Chicago, IL 60606
Symphony Asset Management 555 California Street Rene Suite 2975 San Francisco, CA 94104
Nuveen HydePark Group, LLC 111 West Jackson Blvd. Suite 1411 Chicago, IL 60604 | Legal Counsel Chapman and Cutler LLP Chicago, IL
Independent Registered Public Accounting Firm PricewaterhouseCoopers LLP Chicago, IL | Custodian State Street Bank & Trust Company Boston, MA
Transfer Agent and Shareholder Services Boston Financial Data Services
Nuveen Investor Services P.O. Box 8530 Boston, MA 02266-8530 (800) 257-8787 | ||
Distribution Information: Multi-Manager Large-Cap Value, Municipal and Stock and Stock and Bond hereby designate 43.73%, 87.56% and 37.32%, respectively, of dividends paid from net ordinary income as dividends qualifying for the 70% dividends received deduction for corporations and 53.33%, 100.00% and 45.21%, respectively, as qualified dividend income for individuals under Section 1 (h)(11) of the Internal Revenue Code. The actual qualified dividend income distributions will be reported to shareholders on Form 1099-DIV which will be sent to shareholders shortly after calendar year end.
Municipal and Stock designates $218,845 of dividends paid on July 1 and August 1, 2008 as exempt interest dividends under Internal Revenue Code Section 852(b)(5). The actual exempt interest dividends will be reported to shareholders on Form 1099-DIV which will be sent to shareholders shortly after calendar year end.
Quarterly Portfolio of Investments and Proxy Voting Information: You may obtain (i) each Fund’s quarterly portfolio of investments, (ii) information regarding how the Funds voted proxies relating to portfolio securities held during the most recent twelve-month period ended June 30, 2008, and (iii) a description of the policies and procedures that the Funds used to determine how to vote proxies relating to portfolio securities without charge, upon request, by calling Nuveen Investments at (800) 257-8787 or on Nuveen’s website at www.nuveen.com.
You may also obtain this and other Fund information directly from the Securities and Exchange Commission (“SEC”). The SEC may charge a copying fee for this information. Visit the SEC on-line at http://www.sec.gov or in person at the SEC’s Public Reference Room in Washington, D.C. Call the SEC at (202) 942-8090 for room hours and operation. You may also request fund information by sending an e-mail request to publicinfo@sec.gov or by writing to the SEC’s Public Reference Section at 100 F Street NE, Washington, D.C. 20549.
The Financial Industry Regulatory Authority (FINRA) provides a Public Disclosure Program which supplies certain information regarding the disciplinary history of FINRA members and their associated persons in response to either telephone inquiries at (800) 289-9999 or written inquiries at www.finra.org. Financial Industry Regulatory Authority also provides an investor brochure that includes information describing the Public Disclosure Program.
77
Learn more
about Nuveen Funds at
www.nuveen.com/mf
Nuveen Investments:
SERVING Investors
For GENERATIONS
Since 1898, financial advisors and their clients have relied on Nuveen Investments to provide dependable investment solutions. Over this time, Nuveen Investments has adhered to the belief that the best approach to investing is to apply conservative risk-management principles to help minimize volatility.
Building on this tradition, we today offer a range of high quality equity and fixed-income solutions that can be integral parts of a well-diversified core portfolio. Our clients have come to appreciate this diversity, as well as our continued adherence to proven, long-term investing principles.
We offer many different investing solutions for our clients’ different needs.
Nuveen Investments is a global investment management firm that seeks to help secure the long-term goals of institutions and high net worth investors as well as the consultants and financial advisors who serve them. Nuveen Investments markets its growing range of specialized investment solutions under the high-quality brands of HydePark, NWQ, Nuveen, Rittenhouse, Santa Barbara, Symphony and Tradewinds. In total, the Company managed $152 billion of assets on June 30, 2008.
Find out how we can help you reach your financial goals.
An investor should carefully consider the Fund’s objectives, risks, charges and expenses before investing. For a prospectus containing this and other information about the Fund, please contact your financial advisor or Nuveen Investments at (800) 257-8787. Read the prospectus carefully before you invest or send money.
| • | Share prices |
| • | Fund details |
| • | Daily financial news |
| • | Investor education |
MAN-GRINC-0608D
NUVEEN INVESTMENTS MUTUAL FUNDS
Annual Report June 30, 2008 | For investors seeking long-term capital appreciation. | |

Nuveen Investments
Equity Funds
Nuveen Enhanced Core Equity Fund
Nuveen Enhanced Mid-Cap Fund


NOW YOU CAN RECEIVE YOUR
NUVEEN INVESTMENTS FUND REPORTS FASTER.
NO MORE WAITING.
SIGN UP TODAY TO RECEIVE NUVEEN INVESTMENTS FUND INFORMATION BY E-MAIL.
It only takes a minute to sign up for E-Reports. Once enrolled, you’ll receive an e-mail as soon as your Nuveen Investments Fund information is ready — no more waiting for delivery by regular mail. Just click on the link within the e-mail to see the report, and save it on your computer if your wish.

IT’S FAST, EASY & FREE:
www.investordelivery.com
if you get your Nuveen Investments Fund dividends and statements from your financial advisor or brokerage account.
(Be sure to have the address sheet that accompanied this report handy. You’ll need it to complete the enrollment process.)
OR
www.nuveen.com/accountaccess
if you get your Nuveen Investments Fund dividends and statements directly from Nuveen Investments.

| Must be preceded by or accompanied by a prospectus. | NOT FDIC INSURED | MAY LOSE VALUE | NO BANK GUARANTEE |
Dear Fellow Shareholders,
I’d like to use my initial letter to you to accomplish several things. First, I want to report that after fourteen years of service on your Fund’s Board, including the last twelve as chairman, Tim Schwertfeger retired from the Board in June. The Board has elected me to replace him as the chairman, the first time this role has been filled by someone who is not an employee of Nuveen Investments. Electing an independent chairman marks a significant milestone in the management of your Fund, and it aligns us with what is now considered a “best practice” in the fund industry. Further, it demonstrates the independence with which your Board has always acted on your behalf.
Following Tim will not be easy. During my eleven previous years on the Nuveen Fund Board, I found that Tim always set a very high standard by combining insightful industry and market knowledge and sound, clear judgment. While the Board will miss his wise counsel, I am certain we will retain the primary commitment Tim shared with all of us – an unceasing dedication to creating and retaining value for Nuveen Fund shareholders. This focus on value over time is a touchstone that I and all the other Board members will continue to use when making decisions on your behalf.
Second, I also want to report that we are very fortunate to be welcoming two new Board members to our team. John Amboian, the current chairman and CEO of Nuveen Investments, has agreed to replace Tim as Nuveen’s representative on the Board. John’s presence will allow the independent Board members to benefit not only from his leadership role at Nuveen but also his broad understanding of the fund industry and Nuveen’s role within it. We also are adding Terry Toth as an independent director. A former CEO of the Northern Trust Company’s asset management group, Terry will bring extensive experience in the fund industry to our deliberations.
Finally, I urge you to take the time to review the Portfolio Managers’ Comments and Fund Spotlight sections of this report. All of us are grateful that you have chosen Nuveen Investments as a partner as you pursue your financial goals, and, on behalf of myself and the other members of your Fund’s Board, let me say we look forward to continuing to earn your trust in the months and years ahead.
Sincerely,

Robert P. Bremner
Chairman of the Board
August 22, 2008

Robert P. Bremner
Chairman of the Board
Annual Report l Page 1
Portfolio Managers’ Comments
The Nuveen Enhanced Core Equity Fund and Nuveen Enhanced Mid-Cap Fund feature management by Nuveen HydePark Group, LLC (HydePark), an affiliate of Nuveen Investments, Inc. Both Funds are co-managed by David Tierney, PHD, Senior Managing Director and Chief Investment Officer of HydePark, and Michael Lindh, CFA, CPA and the Director of Trading at HydePark. We recently spoke with David Tierney about the key investment strategies and performance of the Funds for the period since inception through June 30, 2008.
How did the Funds perform during the period since inception through June 30, 2008?
For the period since inception through the end of the reporting period, volatility reigned in the equity markets. The table on page three provides performance information for both Funds (Class A shares at net asset value) for the period since inception through June 30, 2008. The table also compares each Fund’s performance to appropriate benchmarks. A more detailed discussion of each Fund’s relative performance is provided later in this report.
What strategies were used to manage the Funds during the reporting period? How did these strategies influence performance?
Nuveen Enhanced Core Equity Fund
Class A shares at net asset value for the Nuveen Enhanced Core Equity Fund underperformed its comparative index for the period since inception through June 30, 2008. The proprietary risk-controlled HydePark wealth creation model was used to manage the Fund during this time period. This model utilizes both fundamental and momentum-related criteria to create a portfolio designed to maximize the reward-to-risk ratio. The HydePark model does not incorporate qualitative data or inputs into the portfolio construction process. Therefore, no top-down or macro-economic “themes” influence how the HydePark model works. The HydePark model evaluates all the securities contained in the benchmark portfolio, the S&P 500 Index, for possible inclusion in the HydePark model portfolio. The resultant HydePark portfolio typically contains a large number of holdings, by design. Each position can reflect a weighting that is over, under, or the same as that security’s weight in the benchmark portfolio. Consequently, the HydePark “favored” or “unfavored” segments of the market are reflected in the relative economic sector weights. From this economic sector-based attribution model, a comparison to the benchmark can be made. The underperformance of the Fund during the period since inception can be primarily attributed to an overweight in financials and performance was bolstered by an overweight to the energy sector and stock selection within the industrials sector as compared to the benchmark.
Nuveen Enhanced Mid-Cap Fund
Class A shares at net asset value for the Nuveen Enhanced Mid-Cap Fund outperformed its comparative index for the period since inception through June 30, 2008. The proprietary risk-controlled HydePark wealth creation model was used to manage the Fund during this time period. This model utilizes both fundamental and momentum-related criteria to create a portfolio designed to maximize the reward-to-risk ratio. The HydePark model does not incorporate qualitative data or inputs into the portfolio construction process. Therefore, no top-down or macro-economic “themes” influence how the HydePark model works. The HydePark model evaluates all the securities contained in the benchmark portfolio, the Russell Midcap Index, for possible
Discussions of specific investments are for illustration only and are not intended as recommendations of individual investments. The views expressed herein represent those of the portfolio managers as of the date of this report and are subject to change at any time, based on market conditions and other factors. The Funds disclaim any obligation to advise shareholders of such changes.
Annual Report Page 2
Class A Shares—
Cumulative Total Returns as of 6/30/08
Since (12/3/2007) | ||
Nuveen Enhanced Core Equity Fund | ||
A Shares at NAV | -12.67% | |
A Shares at Offer | -17.69% | |
Lipper Large-Cap Core Funds Index1 | -10.84% | |
S&P 500 Index2 | -12.01% | |
Nuveen Enhanced Mid-Cap Fund | ||
A Shares at NAV | -6.79% | |
A Shares at Offer | -12.15% | |
Lipper Mid-Cap Core Funds Index3 | -7.13% | |
Russell Midcap Index4 | -7.57% |
Returns quoted represent past performance, which is no guarantee of future results. Returns at NAV would be lower if the sales charge were included. Returns less than one year are cumulative. Current performance may be higher or lower than the performance shown. Investment returns and principal value will fluctuate so that when shares are redeemed, they may be worth more or less than their original cost. Class A shares have a 5.75% maximum sales charge. Returns do not reflect the deduction of taxes that a shareholder would pay on Fund distributions or the redemption of shares. For the most recent month-end performance, visit www.nuveen.com or call (800) 257-8787.
Please see each Fund’s Spotlight Page later in this report for more complete performance data and expense ratios.
inclusion in the HydePark model portfolio. The resultant HydePark portfolio typically contains a large number of holdings, by design. Each position can reflect a weighting that is over, under, or the same as that security’s weight in the benchmark portfolio. Consequently, the HydePark “favored” or “unfavored” segments of the market are reflected in the relative economic sector weights. From this economic sector-based attribution model, a comparison to the benchmark can be made. The main contributors to the Fund outperforming its comparative index during the period were an overweight to the energy and materials sectors, both strong performing sectors, as well as an underweight to the health care sector, a poor performing sector. Strong stock selection within the materials sector also contributed to the performance of the portfolio during this time period.
| 1 | The Lipper Large-Cap Core Funds Index is a managed index that represents the average annualized returns of the 30 largest funds in the Lipper Large-Cap Core Funds category. The returns assume reinvestment of dividends, but do not reflect any applicable sales charges. You cannot invest directly in an index. |
| 2 | The S&P 500 Index is an unmanaged index generally considered representative of the U.S. stock market. The index returns assume reinvestment of dividends, but do not reflect any applicable sales charges. You cannot invest directly in an index. |
| 3 | The Lipper Mid-Cap Core Funds Index is a managed index that represents the average annualized returns of the 30 largest funds in the Lipper Mid-Cap Core Funds category. The returns assume reinvestment of dividends, but do not reflect any applicable sales charges. You cannot invest directly in an index. |
| 4 | The Russell Midcap Index measures the performance of the mid-cap segment of the U.S. equity universe. The Russell Midcap Index is a subset of the Russell 1000 Index. It includes approximately 800 of the smallest securities based on a combination of their market cap and current index membership. You cannot invest directly in an index. |
Annual Report Page 3
Nuveen Enhanced Core Equity Fund
Growth of an Assumed $10,000 Investment
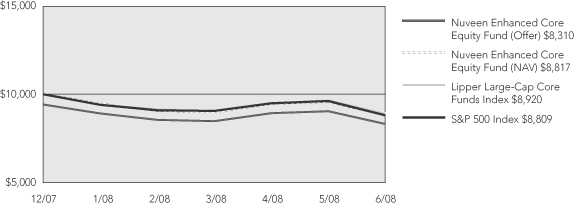
Nuveen Enhanced Mid-Cap Fund
Growth of an Assumed $10,000 Investment
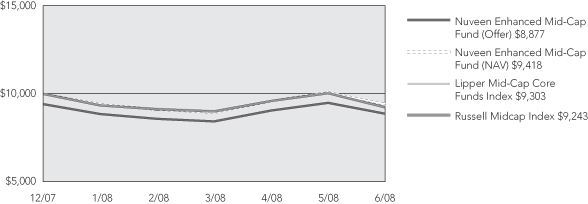
The graph does not reflect the deduction of taxes that a shareholder may pay on Fund distributions or the redemption of shares.
The index comparisons show the change in value of a $10,000 investment in the Class A shares of the Nuveen Funds compared with the corresponding indexes. The Lipper Large-Cap Core Funds Index is a managed index that represents the average annualized returns of the 30 largest funds in the Lipper Large-Cap Core Funds category. The S&P 500 Index is an unmanaged index generally considered to representative of the U.S. stock market. The Lipper Mid-Cap Core Funds Index is a managed index that represents the average annualized returns of the 30 largest funds in the Lipper Mid-Cap Core Funds category. The Russell Midcap Index measures the performance of the mid-cap segment of the U.S. equity universe. The Russell Midcap Index is a subset of the Russell 1000 Index. It includes approximately 800 of the smallest securities based on a combination of their market cap and current index membership. The index returns assume reinvestment of dividends and do not reflect any initial or ongoing expenses. You cannot invest directly in an index. The Nuveen Investments Funds’ returns include reinvestment of all dividends and distributions, and the Funds’ returns at the offer price depicted in the chart reflects the initial maximum sales charge applicable to A shares (5.75%) and all ongoing Fund expenses. The performance data quoted represents past performance, which is not indicative of future results. Current performance may be lower or higher than the performance shown.
Annual Report Page 4
Fund Spotlight as of 6/30/08 Nuveen Enhanced Core Equity Fund
| Quick Facts | ||||||
| A Shares | C Shares | I Shares1 | ||||
Fund Symbols | NEEAX | NEECX | NEERX | |||
NAV | $17.44 | $17.38 | $17.46 | |||
Latest Ordinary Income Distribution2 | $0.0302 | $0.0177 | $0.0343 | |||
Inception Date | 12/03/07 | 12/03/07 | 12/03/07 |
Returns quoted represent past performance which is no guarantee of future performance. Returns without sales charges would be lower if the sales charge were included. Current performance may be higher or lower than the performance shown. Investment returns and principal value will fluctuate so that when shares are redeemed, they may be worth more or less than their original cost. Returns do not reflect the deduction of taxes that a shareholder would pay on Fund distributions or the redemption of Shares. For the most recent month-end performance visit www.nuveen.com or call (800) 257-8787.
Fund returns assume reinvestment of dividends and capital gains. Class A Shares have a 5.75% maximum sales charge. Class C Shares have a 1% CDSC for redemptions within less than one year, which is not reflected in the one-year total return. Class I Shares have no sales charge and may be purchased under limited circumstances or by specified classes of investors. Returns may reflect a voluntary expense limitation by the Fund’s investment adviser which may be modified or discontinued at any time without notice.
| Cumulative Total Returns as of 6/30/08 | ||||
| A Shares | NAV | Offer | ||
Since Inception | -12.67% | -17.69% | ||
| C Shares | NAV | w/CDSC | ||
Since Inception | -13.02% | -13.89% | ||
| I Shares | NAV | |||
Since Inception | -12.55% | |||
| Top Five Common Stock Holdings3 | ||
Exxon Mobil Corporation | 4.8% | |
AT&T Inc. | 2.9% | |
Chevron Corporation | 2.9% | |
General Electric Company | 2.7% | |
ConocoPhillips | 2.1% | |
Portfolio Allocation3

| Portfolio Statistics | ||
Net Assets ($000) | $31,303 | |
Number of Common Stocks | 493 | |
| Expense Ratios | ||||||
| Share Class | Gross Expense Ratios | Net Expense Ratios | As of Date | |||
Class A | 1.12% | 0.75% | 1/16/08 | |||
Class C | 1.87% | 1.50% | 1/16/08 | |||
Class I | 0.87% | 0.50% | 1/16/08 | |||
The expense ratios shown factor in Total Annual Fund Operating Expenses including management fees and other fees and expenses, and are based on an estimated $50 million average net asset size for the Fund’s first full fiscal year. The Net Expense Ratios reflect a contractual commitment by the Fund’s investment adviser to waive fees and reimburse expenses through October 31, 2010. Absent the waiver and reimbursement, the Net Expense Ratios would be higher and total returns would be less.
These expense ratios may vary from the expense ratios elsewhere in this report.
| 1 | Effective May 1, 2008, Class R Shares were renamed Class I Shares. See the Fund’s prospectus for more information. |
| 2 | Paid December 31, 2007. |
| 3 | As a percentage of total investments as of June 30, 2008. Holdings are subject to change. |
Annual Report Page 5
Fund Spotlight as of 6/30/08 Nuveen Enhanced Core Equity Fund
| Industries1 | ||
Oil, Gas & Consumable Fuels | 16.6% | |
Pharmaceuticals | 5.2% | |
Diversified Telecommunication Services | 5.1% | |
Computers & Peripherals | 4.6% | |
Commercial Banks | 4.5% | |
Capital Markets | 3.8% | |
Energy Equipment & Services | 3.8% | |
Insurance | 3.5% | |
Industrial Conglomerates | 3.4% | |
Electric Utilities | 3.3% | |
Media | 3.1% | |
Aerospace & Defense | 2.6% | |
Food & Staples Retailing | 2.5% | |
Software | 2.3% | |
Machinery | 2.1% | |
Semiconductors & Equipment | 2.1% | |
Household Products | 2.1% | |
Food Products | 2.0% | |
Beverages | 1.9% | |
Metals & Mining | 1.8% | |
Chemicals | 1.7% | |
Specialty Retail | 1.5% | |
Communications Equipment | 1.4% | |
Other | 19.1% |
| 1 | As a percentage of total investments as of June 30, 2008. Holdings are subject to change. |
Expense Example (Unaudited)
As a shareholder of the Fund, you incur two types of costs: (1) transaction costs, including front and back end sales charges (loads) or redemption fees, where applicable; and (2) ongoing costs, including management fees; distribution and service (12b-1) fees, where applicable; and other Fund expenses. This Example is intended to help you understand your ongoing costs (in dollars) of investing in the Fund and to compare these costs with the ongoing costs of investing in other mutual funds.
The Example below is based on an investment of $1,000 invested at the beginning of the period and held for the period.
The information under “Actual Performance,” together with the amount you invested, allows you to estimate actual expenses incurred over the reporting period. Simply divide your account value by $1,000 (for example, an $8,600 account value divided by $1,000 = 8.60) and multiply the result by the cost shown for your share class, in the row entitled “Expenses Incurred During Period” to estimate the expenses incurred on your account during this period.
The information under “Hypothetical Performance,” provides information about hypothetical account values and hypothetical expenses based on the Fund’s actual expense ratio and an assumed rate of return of 5% per year before expenses, which is not the Fund’s actual return. The hypothetical account values and expenses may not be used to estimate the actual ending account balance or expense you incurred for the period. You may use this information to compare the ongoing costs of investing in the Fund and other Funds. To do so, compare this 5% hypothetical example with the 5% hypothetical examples that appear in the shareholder reports of the other funds.
Please note that the expenses shown in the table are meant to highlight your ongoing costs only and do not reflect any transactional costs, such as front and back end sales charges (loads) or redemption fees, where applicable. Therefore, the hypothetical information is useful in comparing ongoing costs only, and will not help you determine the relative total costs of owning different funds or share classes. In addition, if these transactional costs were included, your costs would have been higher.
| Hypothetical Performance | ||||||||||||||||||
| Actual Performance | (5% return before expenses) | |||||||||||||||||
| A Shares | C Shares | I Shares | A Shares | C Shares | I Shares | |||||||||||||
Beginning Account Value (1/01/08) | $ | 1,000.00 | $ | 1,000.00 | $ | 1,000.00 | $ | 1,000.00 | $ | 1,000.00 | $ | 1,000.00 | ||||||
Ending Account Value (6/30/08) | $ | 881.70 | $ | 878.20 | $ | 882.70 | $ | 1,021.23 | $ | 1,017.50 | $ | 1,022.48 | ||||||
Expenses Incurred During Period | $ | 3.42 | $ | 6.91 | $ | 2.25 | $ | 3.67 | $ | 7.42 | $ | 2.41 | ||||||
For each class of the Fund, expenses are equal to the Fund’s annualized expense ratio of .73%, 1.48% and .48% for Classes A, C and I, respectively, multiplied by the average account value over the period, multiplied by 182/366 (to reflect the one-half year period).
Annual Report Page 6
Fund Spotlight as of 6/30/08 Nuveen Enhanced Mid-Cap Fund
| Quick Facts | ||||||
| A Shares | C Shares | I Shares1 | ||||
Fund Symbols | NDPAX | NDPCX | NDPRX | |||
NAV | $18.59 | $18.53 | $18.62 | |||
Latest Ordinary Income Distribution2 | $0.0453 | $0.0326 | $0.0495 | |||
Inception Date | 12/03/07 | 12/03/07 | 12/03/07 |
Returns quoted represent past performance which is no guarantee of future performance. Returns without sales charges would be lower if the sales charge were included. Current performance may be higher or lower than the performance shown. Investment returns and principal value will fluctuate so that when shares are redeemed, they may be worth more or less than their original cost. Returns do not reflect the deduction of taxes that a shareholder would pay on Fund distributions or the redemption of Shares. For the most recent month-end performance visit www.nuveen.com or call (800) 257-8787.
Fund returns assume reinvestment of dividends and capital gains. Class A Shares have a 5.75% maximum sales charge. Class C Shares have a 1% CDSC for redemptions within less than one year, which is not reflected in the one-year total return. Class I Shares have no sales charge and may be purchased under limited circumstances or by specified classes of investors. Returns may reflect a voluntary expense limitation by the Fund’s investment adviser which may be modified or discontinued at any time without notice.
| Cumulative Total Returns as of 6/30/08 | ||||
| A Shares | NAV | Offer | ||
Since Inception | -6.79% | -12.15% | ||
| C Shares | NAV | w/CDSC | ||
Since Inception | -7.20% | -8.12% | ||
| I Shares | NAV | |||
Since Inception | -6.67% | |||
| Top Five Common Stock Holdings3 | ||
CONSOL Energy Inc. | 0.8% | |
Fluor Corporation | 0.7% | |
Noble Corporation | 0.7% | |
Noble Energy, Inc. | 0.7% | |
Cummins Inc. | 0.7% |
Portfolio Allocation3

| Portfolio Statistics | ||
Net Assets ($000) | $3,017 | |
Number of Common Stocks | 660 | |
| Expense Ratios | ||||||
| Share Class | Gross Expense Ratios | Net Expense Ratios | As of Date | |||
Class A | 1.17% | 0.80% | 1/16/08 | |||
Class C | 1.92% | 1.55% | 1/16/08 | |||
Class I | 0.92% | 0.55% | 1/16/08 | |||
The expense ratios shown factor in Total Annual Fund Operating Expenses including management fees and other fees and expenses, and are based on an estimated $50 million average net asset size for the Fund’s first full fiscal year. The Net Expense Ratios reflect a contractual commitment by the Fund’s investment adviser to waive fees and reimburse expenses through October 31, 2010. Absent the waiver and reimbursement, the Net Expense Ratios would be higher and total returns would be less.
These expense ratios may vary from the expense ratios elsewhere in this report.
| 1 | Effective May 1, 2008, Class R Shares were renamed Class I Shares. See the Fund’s prospectus for more information. |
| 2 | Paid December 31, 2007. |
| 3 | As a percentage of total investments as of June 30, 2008. Holdings are subject to change. |
Annual Report Page 7
Fund Spotlight as of 6/30/08 Nuveen Enhanced Mid-Cap Fund
| Industries1 | ||
Oil, Gas & Consumable Fuels | 8.2% | |
Energy Equipment & Services | 6.4% | |
Machinery | 4.8% | |
Electric Utilities | 4.5% | |
Insurance | 3.8% | |
Metals & Mining | 3.5% | |
Commercial Banks | 3.5% | |
Chemicals | 3.3% | |
Multiline Retail | 2.7% | |
Media | 2.6% | |
Specialty Retail | 2.4% | |
Food Products | 2.3% | |
Multi-Utilities | 2.2% | |
Construction & Engineering | 2.2% | |
Health Care Providers & Services | 2.0% | |
IT Services | 2.0% | |
Commercial Services & Supplies | 1.9% | |
Hotels, Restaurants & Leisure | 1.8% | |
Capital Markets | 1.8% | |
Health Care Equipment & Supplies | 1.7% | |
Computers & Peripherals | 1.7% | |
Specialized REIT | 1.6% | |
Industrial Conglomerates | 1.4% | |
Household Durables | 1.4% | |
Electronic Equipment & Instruments | 1.4% | |
Automobiles | 1.4% | |
Software | 1.4% | |
Containers & Packaging | 1.3% | |
Aerospace & Defense | 1.3% | |
Beverages | 1.2% | |
Semiconductors & Equipment | 1.2% | |
Food & Staples Retailing | 1.1% | |
Paper & Forest Products | 1.1% | |
Other | 18.9% |
| 1 | As a percentage of total investments as of June 30, 2008. Holdings are subject to change. |
Expense Example (Unaudited)
As a shareholder of the Fund, you incur two types of costs: (1) transaction costs, including front and back end sales charges (loads) or redemption fees, where applicable; and (2) ongoing costs, including management fees; distribution and service (12b-1) fees, where applicable; and other Fund expenses. This Example is intended to help you understand your ongoing costs (in dollars) of investing in the Fund and to compare these costs with the ongoing costs of investing in other mutual funds.
The Example below is based on an investment of $1,000 invested at the beginning of the period and held for the period.
The information under “Actual Performance,” together with the amount you invested, allows you to estimate actual expenses incurred over the reporting period. Simply divide your account value by $1,000 (for example, an $8,600 account value divided by $1,000 = 8.60) and multiply the result by the cost shown for your share class, in the row entitled “Expenses Incurred During Period” to estimate the expenses incurred on your account during this period.
The information under “Hypothetical Performance,” provides information about hypothetical account values and hypothetical expenses based on the Fund’s actual expense ratio and an assumed rate of return of 5% per year before expenses, which is not the Fund’s actual return. The hypothetical account values and expenses may not be used to estimate the actual ending account balance or expense you incurred for the period. You may use this information to compare the ongoing costs of investing in the Fund and other Funds. To do so, compare this 5% hypothetical example with the 5% hypothetical examples that appear in the shareholder reports of the other funds.
Please note that the expenses shown in the table are meant to highlight your ongoing costs only and do not reflect any transactional costs, such as front and back end sales charges (loads) or redemption fees, where applicable. Therefore, the hypothetical information is useful in comparing ongoing costs only, and will not help you determine the relative total costs of owning different funds or share classes. In addition, if these transactional costs were included, your costs would have been higher.
| Hypothetical Performance | ||||||||||||||||||
| Actual Performance | (5% return before expenses) | |||||||||||||||||
| A Shares | C Shares | I Shares | A Shares | C Shares | I Shares | |||||||||||||
Beginning Account Value (1/01/08) | $ | 1,000.00 | $ | 1,000.00 | $ | 1,000.00 | $ | 1,000.00 | $ | 1,000.00 | $ | 1,000.00 | ||||||
Ending Account Value (6/30/08) | $ | 941.80 | $ | 938.20 | $ | 942.80 | $ | 1,021.08 | $ | 1,017.35 | $ | 1,022.30 | ||||||
Expenses Incurred During Period | $ | 3.67 | $ | 7.28 | $ | 2.46 | $ | 3.82 | $ | 7.57 | $ | 2.56 | ||||||
For each class of the Fund, expenses are equal to the Fund’s annualized expense ratio of .76%, 1.51% and .51% for Classes A, C and I, respectively, multiplied by the average account value over the period, multiplied by 182/366 (to reflect the one-half year period).
Annual Report Page 8
Portfolio of Investments
Nuveen Enhanced Core Equity Fund
June 30, 2008
| Shares | Description (1) | Value | |||
| COMMON STOCKS – 99.6% | |||||
| Aerospace & Defense – 2.6% | |||||
| 1,700 | Boeing Company | $ | 111,724 | ||
| 1,100 | General Dynamics Corporation | 92,620 | |||
| 500 | Goodrich Corporation | 23,730 | |||
| 2,000 | Honeywell International Inc. | 100,560 | |||
| 400 | L-3 Communications Holdings, Inc. | 36,348 | |||
| 1,000 | Lockheed Martin Corporation | 98,660 | |||
| 1,200 | Northrop Grumman Corporation | 80,280 | |||
| 200 | Precision Castparts Corporation | 19,274 | |||
| 1,400 | Raytheon Company | 78,792 | |||
| 300 | Rockwell Collins, Inc. | 14,388 | |||
| 2,600 | United Technologies Corporation | 160,420 | |||
Total Aerospace & Defense | 816,796 | ||||
| Air Freight & Logistics – 0.8% | |||||
| 400 | C.H. Robinson Worldwide, Inc. | 21,936 | |||
| 300 | Expeditors International of Washington Inc. | 12,900 | |||
| 1,000 | FedEx Corporation | 78,790 | |||
| 2,100 | United Parcel Service, Inc., Class B | 129,087 | |||
Total Air Freight & Logistics | 242,713 | ||||
| Airlines – 0.1% | |||||
| 2,100 | Southwest Airlines Co. | 27,384 | |||
| Auto Components – 0.2% | |||||
| 1,000 | Goodyear Tire & Rubber Company, (2) | 17,830 | |||
| 1,300 | Johnson Controls, Inc. | 37,284 | |||
Total Auto Components | 55,114 | ||||
| Automobiles – 0.4% | |||||
| 12,900 | Ford Motor Company, (2) | 62,049 | |||
| 3,100 | General Motors Corporation | 35,650 | |||
| 600 | Harley-Davidson, Inc. | 21,756 | |||
Total Automobiles | 119,455 | ||||
| Beverages – 1.9% | |||||
| 1,400 | Anheuser-Busch Companies, Inc. | 86,968 | |||
| 200 | Brown-Forman Corporation | 15,114 | |||
| 4,100 | Coca-Cola Company | 213,118 | |||
| 1,400 | Coca-Cola Enterprises Inc. | 24,220 | |||
| 500 | Constellation Brands, Inc., Class A, (2) | 9,930 | |||
| 500 | Molson Coors Brewing Company, Class B | 27,165 | |||
| 600 | Pepsi Bottling Group, Inc. | 16,752 | |||
| 3,100 | PepsiCo, Inc. | 197,129 | |||
Total Beverages | 590,396 | ||||
| Biotechnology – 0.9% | |||||
| 1,900 | Amgen Inc., (2) | 89,604 | |||
| 600 | Biogen Idec Inc., (2) | 33,534 | |||
| 500 | Celgene Corporation, (2) | 31,935 | |||
9
Portfolio of Investments
Nuveen Enhanced Core Equity Fund (continued)
June 30, 2008
| Shares | Description (1) | Value | |||
| Biotechnology (continued) | |||||
| 400 | Genzyme Corporation, (2) | $ | 28,808 | ||
| 2,100 | Gilead Sciences, Inc., (2) | 111,195 | |||
Total Biotechnology | 295,076 | ||||
| Building Products – 0.0% | |||||
| 700 | Masco Corporation | 11,011 | |||
| Capital Markets – 3.8% | |||||
| 900 | American Capital Strategies Limited | 21,393 | |||
| 800 | Ameriprise Financial, Inc. | 32,536 | |||
| 3,200 | Bank of New York Company, Inc. | 121,056 | |||
| 1,800 | Charles Schwab Corporation | 36,972 | |||
| 500 | E*Trade Group Inc., (2) | 1,570 | |||
| 200 | Federated Investors Inc. | 6,884 | |||
| 200 | Franklin Resources, Inc. | 18,330 | |||
| 1,400 | Goldman Sachs Group, Inc. | 244,860 | |||
| 200 | Janus Capital Group Inc. | 5,294 | |||
| 12,400 | JPMorgan Chase & Co. | 425,444 | |||
| 300 | Legg Mason, Inc. | 13,071 | |||
| 2,200 | Lehman Brothers Holdings Inc. | 43,582 | |||
| 3,200 | Merrill Lynch & Co., Inc. | 101,472 | |||
| 700 | Morgan Stanley | 25,249 | |||
| 1,100 | State Street Corporation | 70,389 | |||
| 400 | T. Rowe Price Group Inc. | 22,588 | |||
Total Capital Markets | 1,190,690 | ||||
| Chemicals – 1.7% | |||||
| 600 | Air Products & Chemicals Inc. | 59,316 | |||
| 200 | Ashland Inc. | 9,640 | |||
| 4,100 | Dow Chemical Company | 143,131 | |||
| 3,000 | E.I. Du Pont de Nemours and Company | 128,670 | |||
| 300 | Eastman Chemical Company | 20,658 | |||
| 300 | Ecolab Inc. | 12,897 | |||
| 400 | Hercules Incorporated | 6,772 | |||
| 200 | International Flavors & Fragrances Inc. | 7,812 | |||
| 500 | PPG Industries, Inc. | 28,685 | |||
| 800 | Praxair, Inc. | 75,392 | |||
| 500 | Rohm and Haas Company | 23,220 | |||
| 300 | Sigma-Aldrich Corporation | 16,158 | |||
Total Chemicals | 532,351 | ||||
| Commercial Banks – 4.4% | |||||
| 19,000 | Bank of America Corporation | 453,530 | |||
| 2,300 | BB&T Corporation | 52,371 | |||
| 600 | Comerica Incorporated | 15,378 | |||
| 2,800 | Fifth Third Bancorp. | 28,504 | |||
| 500 | First Horizon National Corporation | 3,715 | |||
10
| Shares | Description (1) | Value | |||
| Commercial Banks (continued) | |||||
| 1,500 | Huntington BancShares Inc. | $ | 8,655 | ||
| 1,900 | KeyCorp. | 20,862 | |||
| 300 | M&T Bank Corporation | 21,162 | |||
| 800 | Marshall and Ilsley Corporation | 12,264 | |||
| 800 | National City Corporation | 3,816 | |||
| 600 | Northern Trust Corporation | 41,142 | |||
| 1,200 | PNC Financial Services Group, Inc. | 68,520 | |||
| 3,900 | Regions Financial Corporation | 42,549 | |||
| 1,200 | SunTrust Banks, Inc. | 43,464 | |||
| 6,900 | U.S. Bancorp | 192,441 | |||
| 9,200 | Wachovia Corporation | 142,876 | |||
| 9,600 | Wells Fargo & Company | 228,000 | |||
| 400 | Zions Bancorporation | 12,596 | |||
Total Commercial Banks | 1,391,845 | ||||
| Commercial Services & Supplies – 0.5% | |||||
| 900 | Allied Waste Industries, Inc., (2) | 11,358 | |||
| 300 | Avery Dennison Corporation | 13,179 | |||
| 400 | Cintas Corporation | 10,604 | |||
| 200 | Equifax Inc. | 6,724 | |||
| 400 | Pitney Bowes Inc. | 13,640 | |||
| 700 | R.R. Donnelley & Sons Company | 20,783 | |||
| 300 | Robert Half International Inc. | 7,191 | |||
| 1,800 | Waste Management, Inc. | 67,878 | |||
Total Commercial Services & Supplies | 151,357 | ||||
| Communications Equipment – 1.4% | |||||
| 100 | Ciena Corporation, (2) | 2,317 | |||
| 8,300 | Cisco Systems, Inc., (2) | 193,058 | |||
| 4,000 | Corning Incorporated | 92,200 | |||
| 300 | JDS Uniphase Corporation, (2) | 3,408 | |||
| 1,000 | Juniper Networks Inc., (2) | 22,180 | |||
| 300 | Motorola, Inc. | 2,202 | |||
| 3,000 | QUALCOMM Inc. | 133,110 | |||
| 300 | Tellabs Inc., (2) | 1,395 | |||
Total Communications Equipment | 449,870 | ||||
| Computers & Peripherals – 4.6% | |||||
| 2,500 | Apple, Inc., (2) | 418,600 | |||
| 3,300 | Dell Inc., (2) | 72,204 | |||
| 4,200 | EMC Corporation, (2) | 61,698 | |||
| 6,700 | Hewlett-Packard Company | 296,207 | |||
| 4,500 | International Business Machines Corporation (IBM) | 533,385 | |||
| 300 | Lexmark International, Inc., Class A, (2) | 10,029 | |||
| 100 | Network Appliance Inc., (2) | 2,166 | |||
| 100 | SanDisk Corporation, (2) | 1,870 | |||
11
Portfolio of Investments
Nuveen Enhanced Core Equity Fund (continued)
June 30, 2008
| Shares | Description (1) | Value | |||
| Computers & Peripherals (continued) | |||||
| 2,300 | Sun Microsystems Inc., (2) | $ | 25,024 | ||
| 400 | Teradata Corporation, (2) | 9,256 | |||
Total Computers & Peripherals | 1,430,439 | ||||
| Construction & Engineering – 0.2% | |||||
| 200 | Fluor Corporation | 37,216 | |||
| 400 | Jacobs Engineering Group Inc., (2) | 32,280 | |||
Total Construction & Engineering | 69,496 | ||||
| Construction Materials – 0.1% | |||||
| 300 | Vulcan Materials Company | 17,934 | |||
| Consumer Finance – 0.4% | |||||
| 1,500 | American Express Company | 56,505 | |||
| 1,200 | Capital One Financial Corporation | 45,612 | |||
| 100 | Discover Financial Services | 1,317 | |||
| 900 | Western Union Company | 22,248 | |||
Total Consumer Finance | 125,682 | ||||
| Containers & Packaging – 0.1% | |||||
| 200 | Ball Corporation | 9,548 | |||
| 300 | Bemis Company, Inc. | 6,726 | |||
| 400 | Pactiv Corporation, (2) | 8,492 | |||
| 600 | Sealed Air Corporation | 11,406 | |||
Total Containers & Packaging | 36,172 | ||||
| Diversified Consumer Services – 0.1% | |||||
| 100 | Apollo Group, Inc., (2) | 4,426 | |||
| 700 | H & R Block Inc. | 14,980 | |||
Total Diversified Consumer Services | 19,406 | ||||
| Diversified Financial Services – 0.7% | |||||
| 600 | CIT Group Inc. | 4,086 | |||
| 7,900 | Citigroup Inc. | 132,404 | |||
| 100 | CME Group, Inc. | 38,319 | |||
| 100 | Intercontinental Exchange Inc., (2) | 11,400 | |||
| 500 | Leucadia National Corporation | 23,470 | |||
| 100 | Moody’s Corporation | 3,444 | |||
| 300 | New York Stock Exchange Euronext | 15,198 | |||
Total Diversified Financial Services | 228,321 | ||||
| Diversified Telecommunication Services – 5.1% | |||||
| 27,000 | AT&T Inc. | 909,630 | |||
| 200 | CenturyTel, Inc. | 7,118 | |||
| 1,100 | Citizens Communications Company | 12,474 | |||
| 800 | Embarq Corporation | 37,816 | |||
| 8,600 | Qwest Communications International Inc. | 33,798 | |||
| 14,400 | Sprint Nextel Corporation | 136,800 | |||
| 12,200 | Verizon Communications Inc. | 431,880 | |||
| 2,500 | Windstream Corporation | 30,850 | |||
Total Diversified Telecommunication Services | 1,600,366 | ||||
12
| Shares | Description (1) | Value | |||
| Electric Utilities – 3.2% | |||||
| 300 | Allegheny Energy, Inc. | $ | 15,033 | ||
| 1,000 | Ameren Corporation | 42,230 | |||
| 1,900 | American Electric Power Company, Inc. | 76,437 | |||
| 1,300 | Consolidated Edison, Inc. | 50,817 | |||
| 800 | DTE Energy Company | 33,952 | |||
| 1,200 | Edison International | 61,656 | |||
| 500 | Entergy Corporation | 60,240 | |||
| 1,700 | Exelon Corporation | 152,932 | |||
| 1,100 | FirstEnergy Corp. | 90,563 | |||
| 1,300 | FPL Group, Inc. | 85,254 | |||
| 900 | Pepco Holdings, Inc. | 23,085 | |||
| 1,600 | PG&E Corporation | �� | 63,504 | ||
| 600 | Pinnacle West Capital Corporation | 18,462 | |||
| 1,200 | PPL Corporation | 62,724 | |||
| 1,100 | Progress Energy, Inc. | 46,013 | |||
| 3,200 | Southern Company | 111,744 | |||
| 900 | TECO Energy, Inc. | 19,341 | |||
Total Electric Utilities | 1,013,987 | ||||
| Electrical Equipment – 0.5% | |||||
| 500 | Cooper Industries, Ltd., Class A, (2) | 19,750 | |||
| 2,100 | Emerson Electric Company | 103,845 | |||
| 400 | Rockwell Automation, Inc. | 17,492 | |||
Total Electrical Equipment | 141,087 | ||||
| Electronic Equipment & Instruments – 0.5% | |||||
| 500 | Agilent Technologies, Inc., (2) | 17,770 | |||
| 300 | Jabil Circuit Inc. | 4,923 | |||
| 400 | MEMC Electronic Materials, (2) | 24,616 | |||
| 100 | Millipore Corporation, (2) | 6,786 | |||
| 300 | Molex Inc. | 7,323 | |||
| 1,000 | Thermo Fisher Scientific, Inc., (2) | 55,730 | |||
| 1,300 | Tyco Electronics, Limited | 46,566 | |||
| 100 | Waters Corporation, (2) | 6,450 | |||
Total Electronic Equipment & Instruments | 170,164 | ||||
| Energy Equipment & Services – 3.8% | |||||
| 700 | Baker Hughes Incorporated | 61,138 | |||
| 900 | BJ Services Company | 28,746 | |||
| 600 | Cooper Cameron Corporation, (2) | 33,210 | |||
| 500 | ENSCO International Incorporated | 40,370 | |||
| 2,600 | Halliburton Company | 137,982 | |||
| 1,200 | Nabors Industries Limited, (2) | 59,076 | |||
| 1,200 | National-Oilwell Varco Inc., (2) | 106,464 | |||
| 1,000 | Noble Corporation | 64,960 | |||
| 500 | Rowan Companies Inc. | 23,375 | |||
13
Portfolio of Investments
Nuveen Enhanced Core Equity Fund (continued)
June 30, 2008
| Shares | Description (1) | Value | |||
| Energy Equipment & Services (continued) | |||||
| 2,300 | Schlumberger Limited | $ | 247,089 | ||
| 400 | Smith International, Inc. | 33,256 | |||
| 1,600 | Transocean Inc., (2) | 243,824 | |||
| 2,100 | Weatherford International Ltd, (2) | 104,139 | |||
Total Energy Equipment & Services | 1,183,629 | ||||
| Food & Staples Retailing – 2.5% | |||||
| 3,100 | CVS Caremark Corporation | 122,667 | |||
| 2,100 | Kroger Co. | 60,627 | |||
| 1,600 | Safeway Inc. | 45,680 | |||
| 1,100 | SUPERVALU INC. | 33,979 | |||
| 1,500 | Sysco Corporation | 41,265 | |||
| 1,600 | Walgreen Co. | 52,016 | |||
| 7,400 | Wal-Mart Stores, Inc. | 415,880 | |||
| 200 | Whole Foods Market, Inc. | 4,738 | |||
Total Food & Staples Retailing | 776,852 | ||||
| Food Products – 2.0% | |||||
| 2,800 | Archer-Daniels-Midland Company | 94,500 | |||
| 500 | Campbell Soup Company | 16,730 | |||
| 1,600 | ConAgra Foods, Inc. | 30,848 | |||
| 200 | Dean Foods Company, (2) | 3,924 | |||
| 1,000 | General Mills, Inc. | 60,770 | |||
| 700 | H.J. Heinz Company | 33,495 | |||
| 200 | Hershey Foods Corporation | 6,556 | |||
| 600 | Kellogg Company | 28,812 | |||
| 4,000 | Kraft Foods Inc. | 113,800 | |||
| 300 | McCormick & Company, Incorporated | 10,698 | |||
| 1,300 | Monsanto Company | 164,372 | |||
| 1,800 | Sara Lee Corporation | 22,050 | |||
| 900 | Tyson Foods, Inc., Class A | 13,446 | |||
| 500 | Wm. Wrigley Jr. Company | 38,890 | |||
Total Food Products | 638,891 | ||||
| Gas Utilities – 0.3% | |||||
| 200 | Nicor Inc. | 8,518 | |||
| 400 | Questar Corporation | 28,416 | |||
| 2,000 | Spectra Energy Corporation | 57,480 | |||
Total Gas Utilities | 94,414 | ||||
| Health Care Equipment & Supplies – 1.4% | |||||
| 300 | AmerisourceBergen Corporation | 11,997 | |||
| 300 | Applera Corporation-Applied Biosystems Group | 10,044 | |||
| 1,200 | Baxter International Inc. | 76,728 | |||
| 500 | Becton, Dickinson and Company | 40,650 | |||
| 2,000 | Boston Scientific Corporation, (2) | 24,580 | |||
| 100 | C. R. Bard, Inc. | 8,795 | |||
14
| Shares | Description (1) | Value | |||
| Health Care Equipment & Supplies (continued) | |||||
| 600 | Cardinal Health, Inc. | $ | 30,948 | ||
| 1,200 | Covidien Limited | 57,468 | |||
| 300 | Hospira Inc., (2) | 12,033 | |||
| 100 | Intuitive Surgical, Inc., (2) | 26,940 | |||
| 1,400 | Medtronic, Inc. | 72,450 | |||
| 100 | Patterson Companies Inc., (2) | 2,939 | |||
| 400 | Saint Jude Medical Inc., (2) | 16,352 | |||
| 200 | Stryker Corporation | 12,576 | |||
| 200 | Varian Medical Systems, Inc., (2) | 10,370 | |||
| 200 | Zimmer Holdings, Inc., (2) | 13,610 | |||
Total Health Care Equipment & Supplies | 428,480 | ||||
| Health Care Providers & Services – 1.3% | |||||
| 1,200 | Aetna Inc. | 48,636 | |||
| 600 | CIGNA Corporation | 21,234 | |||
| 600 | Coventry Health Care, Inc., (2) | 18,252 | |||
| 700 | Express Scripts, Inc., (2) | 43,904 | |||
| 600 | Humana Inc., (2) | 23,862 | |||
| 200 | Laboratory Corporation of America Holdings, (2) | 13,926 | |||
| 600 | McKesson HBOC Inc. | 33,546 | |||
| 1,200 | Medco Health Solutions, Inc., (2) | 56,640 | |||
| 300 | Quest Diagnostics Incorporated | 14,541 | |||
| 600 | Tenet Healthcare Corporation, (2) | 3,336 | |||
| 2,400 | UnitedHealth Group Incorporated | 63,000 | |||
| 1,500 | Wellpoint Inc., (2) | 71,490 | |||
Total Health Care Providers & Services | 412,367 | ||||
| Health Care Technology – 0.0% | |||||
| 100 | IMS Health Incorporated | 2,330 | |||
| Hotels, Restaurants & Leisure – 1.0% | |||||
| 1,800 | Carnival Corporation | 59,328 | |||
| 300 | Darden Restaurants Inc. | 9,582 | |||
| 400 | International Game Technology | 9,992 | |||
| 100 | Marriott International, Inc., Class A | 2,624 | |||
| 3,100 | McDonald’s Corporation | 174,282 | |||
| 100 | Starbucks Corporation, (2) | 1,574 | |||
| 200 | Starwood Hotels & Resorts Worldwide, Inc. | 8,014 | |||
| 100 | Wendy’s International, Inc. | 2,722 | |||
| 500 | Wyndham Worldwide Corporation | 8,955 | |||
| 1,100 | YUM! Brands, Inc. | 38,599 | |||
Total Hotels, Restaurants & Leisure | 315,672 | ||||
| Household Durables – 0.4% | |||||
| 200 | Black & Decker Corporation | 11,502 | |||
| 1,100 | D.R. Horton, Inc. | 11,935 | |||
| 500 | Fortune Brands Inc. | 31,205 | |||
15
Portfolio of Investments
Nuveen Enhanced Core Equity Fund (continued)
June 30, 2008
| Shares | Description (1) | Value | |||
| Household Durables (continued) | |||||
| 100 | Harman International Industries Inc. | $ | 4,139 | ||
| 100 | KB Home | 1,693 | |||
| 600 | Leggett and Platt Inc. | 10,062 | |||
| 200 | Lennar Corporation, Class A | 2,468 | |||
| 800 | Newell Rubbermaid Inc. | 13,432 | |||
| 100 | Pulte Corporation | 963 | |||
| 200 | Snap-on Incorporated | 10,402 | |||
| 200 | Stanley Works | 8,966 | |||
| 400 | Whirlpool Corporation | 24,692 | |||
Total Household Durables | 131,459 | ||||
| Household Products – 2.1% | |||||
| 300 | Clorox Company | 15,660 | |||
| 900 | Colgate-Palmolive Company | 62,190 | |||
| 1,200 | Kimberly-Clark Corporation | 71,736 | |||
| 8,100 | Procter & Gamble Company | 492,561 | |||
Total Household Products | 642,147 | ||||
| Independent Power Producers & Energy Traders – 0.2% | |||||
| 1,700 | AES Corporation, (2) | 32,657 | |||
| 400 | Constellation Energy Group | 32,840 | |||
Total Independent Power Producers & Energy Traders | 65,497 | ||||
| Industrial Conglomerates – 3.4% | |||||
| 1,900 | 3M Co. | 132,221 | |||
| 31,200 | General Electric Company | 832,728 | |||
| 400 | Genuine Parts Company | 15,872 | |||
| 900 | Textron Inc. | 43,137 | |||
| 700 | Tyco International Ltd. | 28,028 | |||
Total Industrial Conglomerates | 1,051,986 | ||||
| Insurance – 3.4% | |||||
| 1,100 | Ace Limited | 60,599 | |||
| 1,400 | AFLAC Incorporated | 87,920 | |||
| 1,800 | Allstate Corporation | 82,062 | |||
| 600 | Ambac Financial Group, Inc. | 804 | |||
| 5,000 | American International Group, Inc. | 132,300 | |||
| 900 | Aon Corporation | 41,346 | |||
| 300 | Assurant Inc. | 19,788 | |||
| 1,300 | Chubb Corporation | 63,713 | |||
| 700 | Cincinnati Financial Corporation | 17,780 | |||
| 1,000 | Genworth Financial Inc., Class A | 17,810 | |||
| 700 | Hartford Financial Services Group, Inc. | 45,199 | |||
| 800 | Lincoln National Corporation | 36,256 | |||
| 1,300 | Loews Corporation | 60,970 | |||
| 1,400 | Marsh & McLennan Companies, Inc. | 37,170 | |||
| 400 | MBIA Inc. | 1,756 | |||
16
| Shares | Description (1) | Value | |||
| Insurance (continued) | |||||
| 2,000 | MetLife, Inc. | $ | 105,540 | ||
| 700 | Principal Financial Group, Inc. | 29,379 | |||
| 1,600 | Progressive Corporation | 29,952 | |||
| 900 | Prudential Financial, Inc. | 53,766 | |||
| 300 | SAFECO Corporation | 20,148 | |||
| 200 | Torchmark Corporation | 11,730 | |||
| 2,100 | Travelers Companies, Inc. | 91,140 | |||
| 1,100 | Unum Group | 22,495 | |||
| 500 | XL Capital Ltd, Class A | 10,280 | |||
Total Insurance | 1,079,903 | ||||
| Internet & Catalog Retail – 0.2% | |||||
| 500 | Amazon.com, Inc., (2) | 36,665 | |||
| 500 | Expedia, Inc., (2) | 9,190 | |||
| 400 | IAC/InterActiveCorp., (2) | 7,712 | |||
Total Internet & Catalog Retail | 53,567 | ||||
| Internet Software & Services – 0.9% | |||||
| 1,100 | eBay Inc., (2) | 30,063 | |||
| 400 | Google Inc., Class A, (2) | 210,568 | |||
| 1,800 | Yahoo! Inc., (2) | 37,188 | |||
Total Internet Software & Services | 277,819 | ||||
| IT Services – 0.6% | |||||
| 300 | Affiliated Computer Services Inc., (2) | 16,047 | |||
| 800 | Automatic Data Processing, Inc. | 33,520 | |||
| 800 | Computer Sciences Corporation, (2) | 37,472 | |||
| 100 | Convergys Corporation, (2) | 1,486 | |||
| 1,800 | Electronic Data Systems Corporation | 44,352 | |||
| 400 | Fidelity National Information Services | 14,764 | |||
| 400 | Fiserv, Inc., (2) | 18,148 | |||
| 400 | Paychex, Inc. | 12,512 | |||
| 300 | Total System Services Inc. | 6,666 | |||
Total IT Services | 184,967 | ||||
| Leisure Equipment & Products – 0.2% | |||||
| 600 | Brunswick Corporation | 6,360 | |||
| 900 | Eastman Kodak Company | 12,987 | |||
| 500 | Hasbro, Inc. | 17,860 | |||
| 1,000 | Mattel, Inc. | 17,120 | |||
Total Leisure Equipment & Products | 54,327 | ||||
| Life Sciences Tools & Services – 0.0% | |||||
| 300 | Perkinelmer Inc. | 8,355 | |||
| Machinery – 2.1% | |||||
| 2,100 | Caterpillar Inc. | 155,022 | |||
| 700 | Cummins Inc. | 45,864 | |||
| 500 | Danaher Corporation | 38,650 | |||
17
Portfolio of Investments
Nuveen Enhanced Core Equity Fund (continued)
June 30, 2008
| Shares | Description (1) | Value | |||
| Machinery (continued) | |||||
| 1,400 | Deere & Company | $ | 100,982 | ||
| 600 | Dover Corporation | 29,022 | |||
| 600 | Eaton Corporation | 50,982 | |||
| 1,200 | Illinois Tool Works Inc. | 57,012 | |||
| 700 | Ingersoll Rand Company Limited, Class A | 26,201 | |||
| 400 | ITT Industries Inc. | 25,332 | |||
| 400 | Manitowoc Company Inc. | 13,012 | |||
| 1,100 | PACCAR Inc. | 46,013 | |||
| 200 | Pall Corporation | 7,936 | |||
| 600 | Parker Hannifin Corporation | 42,792 | |||
| 300 | Terex Corporation, (2) | 15,411 | |||
Total Machinery | 654,231 | ||||
| Media – 3.1% | |||||
| 2,700 | CBS Corporation, Class B | 52,623 | |||
| 1,200 | Clear Channel Communications, Inc. | 42,240 | |||
| 8,700 | Comcast Corporation, Class A | 165,039 | |||
| 2,200 | DIRECTV Group, Inc., (2) | 57,002 | |||
| 200 | E.W. Scripps Company, Class A | 8,308 | |||
| 1,400 | Gannett Company Inc. | 30,338 | |||
| 900 | Interpublic Group Companies, Inc., (2) | 7,740 | |||
| 400 | McGraw-Hill Companies, Inc. | 16,048 | |||
| 100 | Meredith Corporation | 2,829 | |||
| 400 | New York Times, Class A | 6,156 | |||
| 5,100 | News Corporation, Class A | 76,704 | |||
| 700 | Omnicom Group Inc. | 31,416 | |||
| 15,800 | Time Warner Inc. | 233,840 | |||
| 2,600 | Viacom Inc., Class B, (2) | 79,404 | |||
| 5,500 | Walt Disney Company | 171,600 | |||
Total Media | 981,287 | ||||
| Metals & Mining – 1.8% | |||||
| 3,300 | Alcoa Inc. | 117,546 | |||
| 200 | Allegheny Technologies, Inc. | 11,856 | |||
| 400 | CONSOL Energy Inc. | 44,948 | |||
| 1,800 | Freeport-McMoRan Copper & Gold, Inc. | 210,942 | |||
| 800 | Newmont Mining Corporation | 41,728 | |||
| 1,100 | Nucor Corporation | 82,137 | |||
| 100 | Titanium Metals Corporation | 1,399 | |||
| 300 | United States Steel Corporation | 55,434 | |||
Total Metals & Mining | 565,990 | ||||
| Multiline Retail – 1.0% | |||||
| 200 | Big Lots, Inc., (2) | 6,248 | |||
| 900 | Costco Wholesale Corporation | 63,126 | |||
| 100 | Dillard’s, Inc., Class A | 1,157 | |||
18
| Shares | Description (1) | Value | |||
| Multiline Retail (continued) | |||||
| 400 | Family Dollar Stores, Inc. | $ | 7,976 | ||
| 2,300 | Federated Department Stores, Inc. | 44,666 | |||
| 700 | J.C. Penney Company, Inc. | 25,403 | |||
| 600 | Kohl’s Corporation, (2) | 24,024 | |||
| 500 | Nordstrom, Inc. | 15,150 | |||
| 400 | Sears Holding Corporation, (2) | 29,464 | |||
| 2,200 | Target Corporation | 102,278 | |||
Total Multiline Retail | 319,492 | ||||
| Multi-Utilities – 1.4% | |||||
| 1,600 | CenterPoint Energy, Inc. | 25,680 | |||
| 500 | CMS Energy Corporation | 7,450 | |||
| 1,600 | Dominion Resources, Inc. | 75,984 | |||
| 6,500 | Duke Energy Corporation | 112,970 | |||
| 1,000 | Dynegy Inc., (2) | 8,550 | |||
| 300 | Integrys Energy Group, Inc. | 15,249 | |||
| 1,500 | NiSource Inc. | 26,880 | |||
| 1,500 | Public Service Enterprise Group Incorporated | 68,895 | |||
| 1,000 | Sempra Energy | 56,450 | |||
| 2,200 | Xcel Energy, Inc. | 44,154 | |||
Total Multi-Utilities | 442,262 | ||||
| Office Electronics – 0.1% | |||||
| 2,000 | Xerox Corporation | 27,120 | |||
| Oil, Gas & Consumable Fuels – 16.5% | |||||
| 2,400 | Anadarko Petroleum Corporation | 179,616 | |||
| 1,600 | Apache Corporation | 222,400 | |||
| 1,700 | Chesapeake Energy Corporation | 112,132 | |||
| 9,100 | Chevron Corporation | 902,083 | |||
| 7,000 | ConocoPhillips | 660,730 | |||
| 2,000 | Devon Energy Corporation | 240,320 | |||
| 2,400 | El Paso Corporation | 52,176 | |||
| 700 | EOG Resources, Inc. | 91,840 | |||
| 17,100 | Exxon Mobil Corporation | 1,507,023 | |||
| 1,100 | Hess Corporation | 138,809 | |||
| 2,600 | Marathon Oil Corporation | 134,862 | |||
| 700 | Murphy Oil Corporation | 68,635 | |||
| 700 | Noble Energy, Inc. | 70,392 | |||
| 3,800 | Occidental Petroleum Corporation | 341,468 | |||
| 500 | Peabody Energy Corporation | 44,025 | |||
| 400 | Range Resources Corporation | 26,216 | |||
| 1,000 | Southwestern Energy Company, (2) | 47,610 | |||
| 600 | Sunoco, Inc. | 24,414 | |||
| 900 | Tesoro Petroleum Corporation | 17,793 | |||
| 2,600 | Valero Energy Corporation | 107,068 | |||
19
Portfolio of Investments
Nuveen Enhanced Core Equity Fund (continued)
June 30, 2008
| Shares | Description (1) | Value | |||
| Oil, Gas & Consumable Fuels (continued) | |||||
| 1,500 | Williams Companies, Inc. | $ | 60,465 | ||
| 1,800 | XTO Energy, Inc. | 123,318 | |||
Total Oil, Gas & Consumable Fuels | 5,173,395 | ||||
| Paper & Forest Products – 0.3% | |||||
| 2,200 | International Paper Company | 51,260 | |||
| 800 | MeadWestvaco Corporation | 19,072 | |||
| 600 | Weyerhaeuser Company | 30,684 | |||
Total Paper & Forest Products | 101,016 | ||||
| Personal Products – 0.1% | |||||
| 700 | Avon Products, Inc. | 25,214 | |||
| 200 | Estee Lauder Companies Inc., Class A | 9,290 | |||
Total Personal Products | 34,504 | ||||
| Pharmaceuticals – 5.2% | |||||
| 3,400 | Abbott Laboratories | 180,098 | |||
| 300 | Allergan, Inc. | 15,615 | |||
| 200 | Barr Laboratories Inc., (2) | 9,016 | |||
| 3,500 | Bristol-Myers Squibb Company | 71,855 | |||
| 2,300 | Eli Lilly and Company | 106,168 | |||
| 200 | Forest Laboratories, Inc., (2) | 6,948 | |||
| 7,700 | Johnson & Johnson | 495,418 | |||
| 300 | King Pharmaceuticals Inc., (2) | 3,141 | |||
| 5,200 | Merck & Co. Inc. | 195,988 | |||
| 300 | Mylan Laboratories Inc., (2) | 3,621 | |||
| 23,200 | Pfizer Inc. | 405,304 | |||
| 200 | Watson Pharmaceuticals Inc., (2) | 5,434 | |||
| 2,700 | Wyeth | 129,492 | |||
Total Pharmaceuticals | 1,628,098 | ||||
| Real Estate – 1.0% | |||||
| 300 | Apartment Investment & Management Company, Class A | 10,218 | |||
| 100 | AvalonBay Communities, Inc. | 8,916 | |||
| 300 | Boston Properties, Inc. | 27,066 | |||
| 300 | Developers Diversified Realty Corporation | 10,413 | |||
| 700 | Equity Residential | 26,789 | |||
| 300 | General Growth Properties Inc. | 10,509 | |||
| 800 | Health Care Property Investors Inc. | 25,448 | |||
| 2,200 | Host Hotels & Resorts Inc. | 30,030 | |||
| 500 | Kimco Realty Corporation | 17,260 | |||
| 400 | Plum Creek Timber Company | 17,084 | |||
| 900 | ProLogis | 48,915 | |||
| 200 | Public Storage, Inc. | 16,158 | |||
| 400 | Simon Property Group, Inc. | 35,956 | |||
| 200 | Vornado Realty Trust | 17,600 | |||
Total Real Estate | 302,362 | ||||
20
| Shares | Description (1) | Value | |||
| Real Estate Management & Development – 0.0% | |||||
| 200 | CB Richard Ellis Group, Inc., Class A, (2) | $ | 3,840 | ||
| Road & Rail – 1.3% | |||||
| 900 | Burlington Northern Santa Fe Corporation | 89,901 | |||
| 1,400 | CSX Corporation | 87,934 | |||
| 1,400 | Norfolk Southern Corporation | 87,738 | |||
| 300 | Ryder System, Inc. | 20,664 | |||
| 1,700 | Union Pacific Corporation | 128,350 | |||
Total Road & Rail | 414,587 | ||||
| Semiconductors & Equipment – 2.1% | |||||
| 400 | Altera Corporation | 8,280 | |||
| 800 | Analog Devices, Inc. | 25,416 | |||
| 3,300 | Applied Materials, Inc. | 62,997 | |||
| 500 | Broadcom Corporation, Class A, (2) | 13,645 | |||
| 14,800 | Intel Corporation | 317,904 | |||
| 200 | KLA-Tencor Corporation | 8,142 | |||
| 400 | Linear Technology Corporation | 13,028 | |||
| 800 | LSI Logic Corporation, (2) | 4,912 | |||
| 400 | Microchip Technology Incorporated | 12,216 | |||
| 3,000 | Micron Technology, Inc., (2) | 18,000 | |||
| 500 | National Semiconductor Corporation | 10,270 | |||
| 400 | Novellus Systems, Inc., (2) | 8,476 | |||
| 1,600 | NVIDIA Corporation, (2) | 29,952 | |||
| 200 | QLogic Corporation, (2) | 2,918 | |||
| 300 | Teradyne Inc., (2) | 3,321 | |||
| 3,500 | Texas Instruments Incorporated | 98,560 | |||
| 400 | Xilinx, Inc. | 10,100 | |||
Total Semiconductors & Equipment | 648,137 | ||||
| Software – 2.3% | |||||
| 700 | Adobe Systems Incorporated, (2) | 27,573 | |||
| 200 | Akamai Technologies, Inc., (2) | 6,958 | |||
| 200 | Autodesk, Inc., (2) | 6,762 | |||
| 400 | BMC Software, Inc., (2) | 14,400 | |||
| 600 | CA Inc. | 13,854 | |||
| 300 | Citrix Systems, (2) | 8,823 | |||
| 200 | Cognizant Technology Solutions Corporation, Class A, (2) | 6,502 | |||
| 800 | Compuware Corporation, (2) | 7,632 | |||
| 400 | Electronic Arts Inc. (EA), (2) | 17,772 | |||
| 400 | Intuit Inc., (2) | 11,028 | |||
| 14,600 | Microsoft Corporation | 401,646 | |||
| 700 | Novell Inc., (2) | 4,123 | |||
| 7,100 | Oracle Corporation, (2) | 149,100 | |||
| 1,900 | Symantec Corporation, (2) | 36,765 | |||
| 500 | VeriSign, Inc., (2) | 18,900 | |||
Total Software | 731,838 | ||||
21
Portfolio of Investments
Nuveen Enhanced Core Equity Fund (continued)
June 30, 2008
| Shares | Description (1) | Value | |||
| Specialty Retail – 1.5% | |||||
| 200 | Abercrombie & Fitch Co., Class A | $ | 12,536 | ||
| 700 | AutoNation Inc., (2) | 7,014 | |||
| 100 | AutoZone, Inc., (2) | 12,101 | |||
| 700 | Bed Bath and Beyond Inc., (2) | 19,670 | |||
| 1,100 | Best Buy Co., Inc. | 43,560 | |||
| 400 | GameStop Corporation, (2) | 16,160 | |||
| 1,600 | Gap, Inc. | 26,672 | |||
| 4,900 | Home Depot, Inc. | 114,758 | |||
| 1,200 | Limited Brands, Inc. | 20,220 | |||
| 3,900 | Lowe’s Companies, Inc. | 80,925 | |||
| 1,200 | Office Depot, Inc., (2) | 13,128 | |||
| 200 | OfficeMax Inc. | 2,780 | |||
| 500 | RadioShack Corporation | 6,135 | |||
| 300 | Sherwin-Williams Company | 13,779 | |||
| 1,800 | Staples, Inc. | 42,750 | |||
| 200 | Tiffany & Co. | 8,150 | |||
| 1,200 | TJX Companies, Inc. | 37,764 | |||
Total Specialty Retail | 478,102 | ||||
| Textiles, Apparel & Luxury Goods – 0.3% | |||||
| 300 | Coach, Inc., (2) | 8,664 | |||
| 300 | Jones Apparel Group, Inc. | 4,125 | |||
| 200 | Liz Claiborne, Inc. | 2,830 | |||
| 900 | Nike, Inc., Class B | 53,649 | |||
| 100 | Polo Ralph Lauren Corporation | 6,278 | |||
| 200 | VF Corporation | 14,236 | |||
Total Textiles, Apparel & Luxury Goods | 89,782 | ||||
| Thrifts & Mortgage Finance – 0.3% | |||||
| 1,800 | Countrywide Financial Corporation | 7,650 | |||
| 700 | Federal Home Loan Mortgage Corporation | 11,480 | |||
| 1,800 | Federal National Mortgage Association | 35,118 | |||
| 1,900 | Hudson City Bancorp, Inc. | 31,692 | |||
| 200 | MGIC Investment Corporation | 1,222 | |||
| 200 | Sovereign Bancorp, Inc., (2) | 1,472 | |||
| 1,400 | Washington Mutual, Inc. | 6,902 | |||
Total Thrifts & Mortgage Finance | 95,536 | ||||
| Tobacco – 1.1% | |||||
| 8,100 | Altria Group, Inc. | 166,536 | |||
| 2,200 | Philip Morris International, (2) | 108,658 | |||
| 700 | Reynolds American Inc. | 32,669 | |||
| 400 | UST Inc. | 21,844 | |||
Total Tobacco | 329,707 | ||||
| Trading Companies & Distributors – 0.1% | |||||
| 200 | W.W. Grainger, Inc. | 16,360 | |||
22
| Shares | Description (1) | Value | |||
| Wireless Telecommunication Services – 0.1% | |||||
| 600 | American Tower Corporation, (2) | $ | 25,350 | ||
| Total Investments (cost $34,647,215) – 99.6% | 31,192,770 | ||||
| Other Assets Less Liabilities – 0.4% | 110,072 | ||||
| Net Assets – 100% | $ | 31,302,842 | |||
| (1) | All percentages shown in the Portfolio of Investments are based on net assets. |
| (2) | Non-income producing. |
See accompanying notes to financial statements.
23
Portfolio of Investments
Nuveen Enhanced Mid-Cap Fund
June 30, 2008
| Shares | Description (1) | Value | |||
| COMMON STOCKS – 99.3% | |||||
| Aerospace & Defense – 1.3% | |||||
| 10 | Alliant Techsystems Inc., (2) | $ | 1,017 | ||
| 20 | BE Aerospace Inc., (2) | 466 | |||
| 80 | DRS Technologies Inc. | 6,298 | |||
| 120 | FLIR Systems Inc. | 4,868 | |||
| 150 | Goodrich Corporation | 7,119 | |||
| 110 | L-3 Communications Holdings, Inc. | 9,996 | |||
| 50 | Precision Castparts Corporation | 4,819 | |||
| 90 | Rockwell Collins, Inc. | 4,316 | |||
| 40 | Spirit AeroSystems Holdings Inc., (2) | 767 | |||
Total Aerospace & Defense | 39,666 | ||||
| Air Freight & Logistics – 0.3% | |||||
| 60 | C.H. Robinson Worldwide, Inc. | 3,290 | |||
| 90 | Expeditors International of Washington Inc. | 3,870 | |||
| 60 | UTI Worldwide, Inc. | 1,197 | |||
Total Air Freight & Logistics | 8,357 | ||||
| Airlines – 0.9% | |||||
| 1,180 | AMR Corporation-DEL, (2) | 6,042 | |||
| 600 | Continental Airlines, inc., (2) | 6,066 | |||
| 820 | Delta Air Lines, Inc. | 4,674 | |||
| 700 | Southwest Airlines Co. | 9,128 | |||
Total Airlines | 25,910 | ||||
| Auto Components – 0.9% | |||||
| 110 | Advance Auto Parts, Inc. | 4,271 | |||
| 80 | Autoliv Inc. | 3,730 | |||
| 140 | BorgWarner Inc. | 6,213 | |||
| 410 | Goodyear Tire & Rubber Company, (2) | 7,310 | |||
| 160 | LKQ Corporation | 2,891 | |||
| 30 | WABCO Holdings Inc. | 1,394 | |||
Total Auto Components | 25,809 | ||||
| Automobiles – 1.4% | |||||
| 4,210 | Ford Motor Company, (2) | 20,250 | |||
| 1,520 | General Motors Corporation | 17,480 | |||
| 110 | Harley-Davidson, Inc. | 3,989 | |||
Total Automobiles | 41,719 | ||||
| Beverages – 1.2% | |||||
| 30 | Brown-Forman Corporation | 2,267 | |||
| 420 | Coca-Cola Enterprises Inc. | 7,266 | |||
| 230 | Constellation Brands, Inc., Class A, (2) | 4,568 | |||
| 500 | Dr. Pepper Snapple Group | 10,490 | |||
| 130 | Molson Coors Brewing Company, Class B | 7,063 | |||
| 160 | Pepsi Bottling Group, Inc. | 4,467 | |||
| 60 | PepsiAmericas Inc. | 1,187 | |||
Total Beverages | 37,308 | ||||
24
| Shares | Description (1) | Value | |||
| Biotechnology – 0.4% | |||||
| 170 | BioMarin Pharmaceutical Inc. | $ | 4,927 | ||
| 30 | Idexx Labs Inc., (2) | 1,462 | |||
| 110 | Invitrogen Corporation, (2) | 4,319 | |||
| 40 | Vertex Pharmaceuticals Inc., (2) | 1,339 | |||
Total Biotechnology | 12,047 | ||||
| Building Products – 0.4% | |||||
| 30 | Armstrong World Industries Inc., (2) | 877 | |||
| 40 | Fastenal Company | 1,726 | |||
| 60 | Lennox International Inc. | 1,738 | |||
| 520 | Masco Corporation | 8,180 | |||
| 30 | USG Corporation, (2) | 887 | |||
Total Building Products | 13,408 | ||||
| Capital Markets – 1.8% | |||||
| 10 | Affiliated Managers Group Inc., (2) | 901 | |||
| 300 | American Capital Strategies Limited | 7,131 | |||
| 280 | Ameriprise Financial, Inc. | 11,388 | |||
| 10 | Federated Investors Inc. | 344 | |||
| 360 | Invesco LTD | 8,633 | |||
| 80 | Investment Technology Group, (2) | 2,677 | |||
| 10 | Lazard Limited | 342 | |||
| 250 | Legg Mason, Inc. | 10,893 | |||
| 30 | Raymond James Financial Inc. | 792 | |||
| 50 | SEI Investments Company | 1,176 | |||
| 100 | T. Rowe Price Group Inc. | 5,647 | |||
| 40 | TD Ameritrade Holding Corporation, (2) | 724 | |||
| 90 | Waddell & Reed Financial, Inc., Class A | 3,151 | |||
Total Capital Markets | 53,799 | ||||
| Chemicals – 3.3% | |||||
| 80 | Airgas, Inc. | 4,671 | |||
| 90 | Albemarle Corporation | 3,592 | |||
| 80 | Ashland Inc. | 3,856 | |||
| 30 | Cabot Corporation | 729 | |||
| 160 | Celanese Corporation, Series A | 7,306 | |||
| 110 | CF Industries Holdings, Inc. | 16,808 | |||
| 120 | Chemtura Corporation | 701 | |||
| 40 | Cytec Industries, Inc. | 2,182 | |||
| 80 | Eastman Chemical Company | 5,509 | |||
| 80 | Ecolab Inc. | 3,439 | |||
| 80 | FMC Corporation | 6,195 | |||
| 130 | Huntsman Corporation | 1,482 | |||
| 20 | International Flavors & Fragrances Inc. | 781 | |||
| 20 | Lubrizol Corporation | 927 | |||
| 80 | Nalco Holding Company | 1,692 | |||
25
Portfolio of Investments
Nuveen Enhanced Mid-Cap Fund (continued)
June 30, 2008
| Shares | Description (1) | Value | |||
| Chemicals (continued) | |||||
| 170 | PPG Industries, Inc. | $ | 9,753 | ||
| 150 | Rohm and Haas Company | 6,966 | |||
| 120 | RPM International, Inc. | 2,472 | |||
| 140 | Sigma-Aldrich Corporation | 7,540 | |||
| 210 | Terra Industries, Inc., (2) | 10,364 | |||
| 10 | Valhi Inc. | 273 | |||
| 50 | Valspar Corporation | 946 | |||
Total Chemicals | 98,184 | ||||
| Commercial Banks – 3.5% | |||||
| 160 | Associated Banc-Corp. | 3,086 | |||
| 80 | BancorpSouth Inc. | 1,399 | |||
| 50 | Bank of Hawaii Corporation | 2,390 | |||
| 20 | BOK Financial Corporation | 1,069 | |||
| 310 | Comerica Incorporated | 7,945 | |||
| 50 | Commerce Bancshares Inc. | 1,983 | |||
| 50 | Cullen/Frost Bankers, Inc. | 2,493 | |||
| 1,130 | Fifth Third Bancorp. | 11,503 | |||
| 180 | Fulton Financial Corporation | 1,809 | |||
| 850 | Huntington BancShares Inc. | 4,905 | |||
| 740 | KeyCorp. | 8,125 | |||
| 100 | M&T Bank Corporation | 7,054 | |||
| 430 | Marshall and Ilsley Corporation | 6,592 | |||
| 230 | Northern Trust Corporation | 15,771 | |||
| 210 | Popular, Inc. | 1,384 | |||
| 1,390 | Regions Financial Corporation | 15,165 | |||
| 460 | Synovus Financial Corp. | 4,016 | |||
| 30 | TCF Financial Corporation | 361 | |||
| 70 | Unionbancal Corporation | 2,829 | |||
| 50 | Valley National Bancorp. | 789 | |||
| 70 | Webster Financial Corporation | 1,302 | |||
| 80 | Whitney Holding Corporation | 1,464 | |||
| 30 | Wilmington Trust Corporation | 793 | |||
Total Commercial Banks | 104,227 | ||||
| Commercial Services & Supplies – 1.9% | |||||
| 380 | Allied Waste Industries, Inc., (2) | 4,796 | |||
| 50 | Avery Dennison Corporation | 2,197 | |||
| 20 | Brinks Company | 1,308 | |||
| 10 | Career Education Corporation, (2) | 146 | |||
| 30 | ChoicePoint Inc., (2) | 1,446 | |||
| 60 | Cintas Corporation | 1,591 | |||
| 50 | Copart Inc., (2) | 2,141 | |||
| 10 | Corporate Executive Board Company | 421 | |||
| 50 | Corrections Corporation of America, (2) | 1,374 | |||
26
| Shares | Description (1) | Value | |||
| Commercial Services & Supplies (continued) | |||||
| 30 | Dun and Bradstreet Inc. | $ | 2,629 | ||
| 70 | Equifax Inc. | 2,353 | |||
| 70 | FTI Consulting Inc. | 4,792 | |||
| 30 | Genpact Limited, (2) | 448 | |||
| 90 | Hewitt Associates Inc., Class A, (2) | 3,450 | |||
| 40 | IHS Inc. | 2,784 | |||
| 100 | Manpower Inc. | 5,824 | |||
| 110 | Pitney Bowes Inc. | 3,751 | |||
| 110 | R.R. Donnelley & Sons Company | 3,266 | |||
| 130 | Republic Services, Inc. | 3,861 | |||
| 40 | Robert Half International Inc. | 959 | |||
| 80 | Steelcase Inc. | 802 | |||
| 90 | Stericycle Inc., (2) | 4,653 | |||
| 10 | Strayer Education Inc. | 2,091 | |||
| 30 | Zebra Technologies Corporation, Class A, (2) | 979 | |||
Total Commercial Services & Supplies | 58,062 | ||||
| Communication Equipment – 0.1% | |||||
| 10 | Clearwire Corporation | 130 | |||
| 10 | CommScope Inc., (2) | 528 | |||
| 40 | Harris Corporation | 2,020 | |||
| 140 | Level 3 Communications Inc. | 413 | |||
Total Communication Equipment | 3,091 | ||||
| Computers & Peripherals – 1.7% | |||||
| 10 | Brocade Communications Systems Inc., (2) | 82 | |||
| 70 | Ingram Micro, Inc., (2) | 1,243 | |||
| 20 | Lexmark International, Inc., Class A, (2) | 669 | |||
| 40 | McAfee Inc., (2) | 1,361 | |||
| 30 | MSCI Inc., Class A Shares, (2) | 1,089 | |||
| 60 | NCR Corporation, (2) | 1,512 | |||
| 610 | Seagate Technology | 11,669 | |||
| 1,690 | Sun Microsystems Inc. | 18,413 | |||
| 90 | Teradata Corporation, (2) | 2,083 | |||
| 340 | Western Digital Corporation, (2) | 11,740 | |||
Total Computers & Peripherals | 49,861 | ||||
| Construction & Engineering – 2.2% | |||||
| 100 | AECOM Technology Corporation | 3,253 | |||
| 140 | Bucyrus International, Inc. | 10,223 | |||
| 120 | Fluor Corporation | 22,330 | |||
| 140 | Jacobs Engineering Group Inc., (2) | 11,298 | |||
| 170 | KBR Inc. | 5,935 | |||
| 40 | Quanta Services Incorporated, (2) | 1,331 | |||
| 110 | Shaw Group Inc., (2) | 6,797 | |||
| 90 | URS Corporation, (2) | 3,777 | |||
Total Construction & Engineering | 64,944 | ||||
27
Portfolio of Investments
Nuveen Enhanced Mid-Cap Fund (continued)
June 30, 2008
| Shares | Description (1) | Value | |||
| Construction Materials – 0.4% | |||||
| 10 | Eagle Materials Inc. | $ | 253 | ||
| 220 | Vulcan Materials Company | 13,152 | |||
Total Construction Materials | 13,405 | ||||
| Consumer Finance – 0.2% | |||||
| 40 | Americredit Corp., (2) | 345 | |||
| 280 | Capitalsource Inc. | 3,102 | |||
| 230 | Discover Financial Services | 3,029 | |||
Total Consumer Finance | 6,476 | ||||
| Containers & Packaging – 1.3% | |||||
| 60 | AptarGroup Inc. | 2,517 | |||
| 110 | Ball Corporation | 5,251 | |||
| 40 | Bemis Company, Inc. | 897 | |||
| 170 | Crown Holdings Inc., (2) | 4,418 | |||
| 30 | Greif Inc. | 1,921 | |||
| 270 | Owens-Illinois, Inc., (2) | 11,256 | |||
| 150 | Packaging Corp. of America | 3,227 | |||
| 200 | Pactiv Corporation, (2) | 4,246 | |||
| 80 | Sealed Air Corporation | 1,521 | |||
| 720 | Smurfit-Stone Container Corporation, (2) | 2,930 | |||
| 50 | Sonoco Products Company | 1,548 | |||
Total Containers & Packaging | 39,732 | ||||
| Diversified Consumer Services – 0.3% | |||||
| 60 | Devry, Inc. | 3,217 | |||
| 180 | H & R Block Inc. | 3,852 | |||
| 20 | Hillenbrand Inc., (2) | 428 | |||
| 130 | Service Corporation International | 1,282 | |||
| 10 | Weight Watcher’s International Inc. | 356 | |||
Total Diversified Consumer Services | 9,135 | ||||
| Diversified Financial Services – 0.5% | |||||
| 230 | Allied Capital Corporation | 3,195 | |||
| 30 | Eaton Vance Corporation | 1,193 | |||
| 170 | Leucadia National Corporation | 7,980 | |||
| 20 | MF Global LTD | 126 | |||
| 20 | NYMEX Holdings Inc. | 1,690 | |||
Total Diversified Financial Services | 14,184 | ||||
| Diversified REIT – 0.4% | |||||
| 180 | Duke Realty Corporation | 4,041 | |||
| 100 | Liberty Property Trust | 3,315 | |||
| 60 | Vornado Realty Trust | 5,280 | |||
Total Diversified REIT | 12,636 | ||||
| Diversified Telecommunication Services – 0.9% | |||||
| 30 | CenturyTel, Inc. | 1,068 | |||
| 410 | Citizens Communications Company | 4,649 | |||
| 170 | Embarq Corporation | 8,036 | |||
| 2,050 | Qwest Communications International Inc. | 8,057 | |||
28
| Shares | Description (1) | Value | |||
| Diversified Telecommunication Services (continued) | |||||
| 490 | Windstream Corporation | $ | 6,047 | ||
Total Diversified Telecommunication Services | 27,857 | ||||
| Electric Utilities – 4.5% | |||||
| 70 | Allegheny Energy, Inc. | 3,508 | |||
| 100 | Alliant Energy Corporation | 3,426 | |||
| 180 | Ameren Corporation | 7,601 | |||
| 390 | American Electric Power Company, Inc. | 15,690 | |||
| 260 | Consolidated Edison, Inc. | 10,163 | |||
| 60 | Covanta Holding Corporation, (2) | 1,601 | |||
| 110 | DPL Inc. | 2,902 | |||
| 150 | DTE Energy Company | 6,366 | |||
| 270 | Edison International | 13,873 | |||
| 80 | Great Plains Energy Incorporated | 2,022 | |||
| 70 | Hawaiian Electric Industries | 1,731 | |||
| 130 | Northeast Utilities | 3,319 | |||
| 80 | OGE Energy Corp. | 2,537 | |||
| 200 | Pepco Holdings, Inc. | 5,130 | |||
| 300 | PG&E Corporation | 11,907 | |||
| 100 | Pinnacle West Capital Corporation | 3,077 | |||
| 290 | PPL Corporation | 15,158 | |||
| 210 | Progress Energy, Inc. | 8,784 | |||
| 450 | Reliant Energy Inc., (2) | 9,572 | |||
| 120 | Sierra Pacific Resources | 1,525 | |||
| 260 | TECO Energy, Inc. | 5,587 | |||
Total Electric Utilities | 135,479 | ||||
| Electrical Equipment – 0.5% | |||||
| 60 | Ametek Inc. | 2,833 | |||
| 90 | Cooper Industries, Ltd., Class A, (2) | 3,555 | |||
| 10 | Energizer Holdings Inc., (2) | 731 | |||
| 30 | Hubbell Incorporated, Class B | 1,196 | |||
| 40 | Lincoln Electric Holdings Inc. | 3,148 | |||
| 40 | Rockwell Automation, Inc. | 1,749 | |||
| 10 | Thomas & Betts Corporation, (2) | 379 | |||
Total Electrical Equipment | 13,591 | ||||
| Electronic Equipment & Instruments – 1.4% | |||||
| 150 | Agilent Technologies, Inc., (2) | 5,331 | |||
| 80 | Amphenol Corporation, Class A | 3,590 | |||
| 50 | Arrow Electronics, Inc., (2) | 1,536 | |||
| 200 | Avnet Inc., (2) | 5,456 | |||
| 20 | AVX Group | 226 | |||
| 30 | Diebold Inc. | 1,067 | |||
| 60 | Dolby Laboratories, Inc., (2) | 2,418 | |||
| 100 | Gentex Corporation | 1,444 | |||
29
Portfolio of Investments
Nuveen Enhanced Mid-Cap Fund (continued)
June 30, 2008
| Shares | Description (1) | Value | |||
| Electronic Equipment & Instruments (continued) | |||||
| 50 | Itron Inc., (2) | $ | 4,918 | ||
| 40 | Jabil Circuit Inc. | 656 | |||
| 10 | Mettler-Toledo International Inc., (2) | 949 | |||
| 10 | Millipore Corporation, (2) | 679 | |||
| 70 | Molex Inc. | 1,709 | |||
| 30 | National Instruments Corporation | 851 | |||
| 40 | Roper Industries Inc. | 2,635 | |||
| 60 | Tech Data Corporation, (2) | 2,033 | |||
| 120 | Trimble Navigation Limited, (2) | 4,284 | |||
| 70 | Vishay Intertechnology Inc., (2) | 621 | |||
| 30 | Waters Corporation, (2) | 1,935 | |||
Total Electronic Equipment & Instruments | 42,338 | ||||
| Energy Equipment & Services – 6.3% | |||||
| 40 | Atwood Oceanics Inc., (2) | 4,974 | |||
| 420 | BJ Services Company | 13,415 | |||
| 110 | Cabot Oil & Gas Corporation | 7,450 | |||
| 30 | Dresser Rand Group, Inc., (2) | 1,173 | |||
| 200 | ENSCO International Incorporated | 16,148 | |||
| 70 | Exterran Holdings, Inc. | 5,004 | |||
| 170 | FMC Technologies Inc., (2) | 13,078 | |||
| 100 | Helix Energy Solutions Group, (2) | 4,164 | |||
| 110 | Helmerich & Payne Inc. | 7,922 | |||
| 180 | Hercules Offshore Inc. | 6,844 | |||
| 40 | Key Energy Services Inc. | 777 | |||
| 390 | Nabors Industries Limited, (2) | 19,200 | |||
| 340 | Noble Corporation | 22,086 | |||
| 80 | Oceaneering International Inc., (2) | 6,164 | |||
| 70 | Oil States International Inc. | 4,441 | |||
| 260 | Patterson-UTI Energy, Inc. | 9,370 | |||
| 220 | Pride International Inc., (2) | 10,404 | |||
| 200 | Rowan Companies Inc. | 9,350 | |||
| 100 | SandRidge Energy Inc. | 6,458 | |||
| 20 | SeaCor Smit Inc., (2) | 1,790 | |||
| 20 | Smith International, Inc. | 1,663 | |||
| 110 | Superior Energy Services, Inc., (2) | 6,065 | |||
| 20 | TETRA Technologies, (2) | 474 | |||
| 120 | Tidewater Inc. | 7,804 | |||
| 60 | Unit Corporation, (2) | 4,978 | |||
Total Energy Equipment & Services | 191,196 | ||||
| Food & Staples Retailing – 1.1% | |||||
| 120 | BJ’s Wholesale Club, (2) | 4,644 | |||
| 40 | Central European Distribution Corporation | 2,966 | |||
| 70 | Rite Aid Corporation, (2) | 111 | |||
30
| Shares | Description (1) | Value | |||
| Food & Staples Retailing (continued) | |||||
| 430 | Safeway Inc. | $ | 12,277 | ||
| 220 | SUPERVALU INC. | 6,796 | |||
| 320 | Whole Foods Market, Inc. | 7,581 | |||
Total Food & Staples Retailing | 34,375 | ||||
| Food Products – 2.3% | |||||
| 180 | Bunge Limited, (2) | 19,384 | |||
| 70 | Campbell Soup Company | 2,342 | |||
| 540 | ConAgra Foods, Inc. | 10,411 | |||
| 70 | Corn Products International, Inc. | 3,438 | |||
| 30 | Dean Foods Company, (2) | 589 | |||
| 110 | Del Monte Foods Company | 781 | |||
| 280 | H.J. Heinz Company | 13,398 | |||
| 70 | Hershey Foods Corporation | 2,295 | |||
| 70 | Hormel Foods Corporation | 2,423 | |||
| 20 | JM Smucker Company | 813 | |||
| 60 | McCormick & Company, Incorporated | 2,140 | |||
| 310 | Sara Lee Corporation | 3,798 | |||
| 50 | Smithfield Foods, Inc., (2) | 994 | |||
| 450 | Tyson Foods, Inc., Class A | 6,723 | |||
Total Food Products | 69,529 | ||||
| Gas Utilities – 1.1% | |||||
| 70 | AGL Resources Inc. | 2,421 | |||
| 70 | Atmos Energy Corporation | 1,930 | |||
| 70 | Energen Corporation | 5,462 | |||
| 140 | Equitable Resources Inc. | 9,668 | |||
| 130 | Questar Corporation | 9,235 | |||
| 50 | Southern Union Company | 1,351 | |||
| 80 | UGI Corporation | 2,297 | |||
Total Gas Utilities | 32,364 | ||||
| Health Care Equipment & Supplies – 1.7% | |||||
| 10 | Advanced Medical Optics | 187 | |||
| 70 | AmerisourceBergen Corporation | 2,799 | |||
| 180 | Applera Corporation-Applied Biosystems Group | 6,026 | |||
| 60 | Beckman Coulter, Inc. | 4,052 | |||
| 50 | C. R. Bard, Inc. | 4,398 | |||
| 20 | Cooper Companies, Inc. | 743 | |||
| 50 | DENTSPLY International Inc. | 1,840 | |||
| 20 | Gen-Probe, Inc., (2) | 950 | |||
| 20 | Hill Rom Holdings Inc. | 540 | |||
| 80 | Hospira Inc., (2) | 3,209 | |||
| 60 | Intuitive Surgical, Inc., (2) | 16,164 | |||
| 20 | Inverness Medical Innovation | 663 | |||
| 10 | Lincare Holdings, (2) | 284 | |||
31
Portfolio of Investments
Nuveen Enhanced Mid-Cap Fund (continued)
June 30, 2008
| Shares | Description (1) | Value | |||
| Health Care Equipment & Supplies (continued) | |||||
| 30 | Patterson Companies Inc., (2) | $ | 882 | ||
| 40 | ResMed Inc., (2) | 1,430 | |||
| 80 | Saint Jude Medical Inc., (2) | 3,270 | |||
| 50 | Varian Medical Systems, Inc., (2) | 2,593 | |||
Total Health Care Equipment & Supplies | 50,030 | ||||
| Health Care Providers & Services – 2.0% | |||||
| 10 | Brookdale Senior Living Inc. | 204 | |||
| 90 | CIGNA Corporation | 3,185 | |||
| 40 | Community Health Systems Inc., (2) | 1,319 | |||
| 70 | Coventry Health Care, Inc., (2) | 2,129 | |||
| 50 | Davita Inc., (2) | 2,657 | |||
| 270 | Express Scripts, Inc., (2) | 16,934 | |||
| 410 | Health Management Associates Inc., (2) | 2,669 | |||
| 40 | Henry Schein Inc., (2) | 2,063 | |||
| 290 | Humana Inc., (2) | 11,533 | |||
| 50 | Laboratory Corporation of America Holdings, (2) | 3,482 | |||
| 110 | Lifepoint Hospitals Inc., (2) | 3,113 | |||
| 10 | Omnicare, Inc. | 262 | |||
| 50 | Pharmaceutical Product Development Inc. | 2,145 | |||
| 80 | Quest Diagnostics Incorporated | 3,878 | |||
| 80 | Tenet Healthcare Corporation, (2) | 445 | |||
| 50 | Universal Health Services, Inc., Class B | 3,161 | |||
| 40 | VCA Antech, Inc., (2) | 1,111 | |||
Total Health Care Providers & Services | 60,290 | ||||
| Health Care Technology – 0.1% | |||||
| 20 | Cerner Corporation, (2) | 904 | |||
| 90 | Health Corporation, (2) | 1,019 | |||
| 80 | IMS Health Incorporated | 1,864 | |||
Total Health Care Technology | 3,787 | ||||
| Hotels, Restaurants & Leisure – 1.8% | |||||
| 10 | Choice Hotels International, Inc. | 265 | |||
| 210 | Darden Restaurants Inc. | 6,707 | |||
| 150 | International Game Technology | 3,747 | |||
| 20 | Intl Speedway Corporation | 781 | |||
| 130 | Marriott International, Inc., Class A | 3,411 | |||
| 270 | MGM Mirage Inc., (2) | 9,150 | |||
| 20 | Orient Express Hotels Limited | 869 | |||
| 10 | Penn National Gaming, Inc., (2) | 322 | |||
| 290 | Royal Caribbean Cruises Limited | 6,516 | |||
| 40 | Starwood Hotels & Resorts Worldwide, Inc. | 1,603 | |||
| 60 | Tim Hortons Inc. | 1,721 | |||
| 220 | Wyndham Worldwide Corporation | 3,940 | |||
| 460 | YUM! Brands, Inc. | 16,141 | |||
Total Hotels, Restaurants & Leisure | 55,173 | ||||
32
| Shares | Description (1) | Value | |||
| Household Durables – 1.4% | |||||
| 20 | Black & Decker Corporation | $ | 1,150 | ||
| 710 | D.R. Horton, Inc. | 7,704 | |||
| 130 | Fortune Brands Inc. | 8,113 | |||
| 10 | Harman International Industries Inc. | 414 | |||
| 210 | Leggett and Platt Inc. | 3,522 | |||
| 70 | Mohawk Industries Inc., (2) | 4,487 | |||
| 340 | Newell Rubbermaid Inc. | 5,709 | |||
| 70 | Snap-on Incorporated | 3,641 | |||
| 30 | Stanley Works | 1,345 | |||
| 110 | Whirlpool Corporation | 6,790 | |||
Total Household Durables | 42,875 | ||||
| Household Products – 0.1% | |||||
| 30 | Church & Dwight Company Inc. | 1,691 | |||
| 30 | Clorox Company | 1,566 | |||
Total Household Products | 3,257 | ||||
| Independent Power Producers & Energy Traders – 0.8% | |||||
| 310 | AES Corporation, (2) | 5,955 | |||
| 130 | Calpine Corporation | 2,933 | |||
| 40 | Constellation Energy Group | 3,284 | |||
| 40 | Mirant Corporation, (2) | 1,566 | |||
| 270 | NRG Energy Inc., (2) | 11,583 | |||
Total Independent Power Producers & Energy Traders | 25,321 | ||||
| Industrial Conglomerates – 1.4% | |||||
| 20 | Carlisle Companies Inc. | 580 | |||
| 90 | Genuine Parts Company | 3,571 | |||
| 230 | McDermott International Inc., (2) | 14,235 | |||
| 20 | Teleflex Inc. | 1,112 | |||
| 270 | Textron Inc. | 12,941 | |||
| 100 | Walter Industries Inc. | 10,877 | |||
Total Industrial Conglomerates | 43,316 | ||||
| Industrial REIT – 0.7% | |||||
| 100 | AMB Property Corp. | 5,038 | |||
| 300 | ProLogis | 16,305 | |||
Total Industrial REIT | 21,343 | ||||
| Insurance – 3.8% | |||||
| 30 | Allied World Assurance Holdings | 1,189 | |||
| 90 | American Financial Group Inc. | �� | 2,408 | ||
| 250 | Aon Corporation | 11,485 | |||
| 50 | Arch Capital Group Limited, (2) | 3,316 | |||
| 50 | Arthur J. Gallagher & Co. | 1,205 | |||
| 110 | Assurant Inc. | 7,256 | |||
| 80 | Axis Capital Holdings Limited | 2,385 | |||
| 60 | Brown & Brown Inc. | 1,043 | |||
33
Portfolio of Investments
Nuveen Enhanced Mid-Cap Fund (continued)
June 30, 2008
| Shares | Description (1) | Value | |||
| Insurance (continued) | |||||
| 170 | Cincinnati Financial Corporation | $ | 4,318 | ||
| 60 | CNA Financial Corporation | 1,509 | |||
| 100 | Conseco Inc., (2) | 992 | |||
| 50 | Endurance Specialty Holdings, Limited | 1,540 | |||
| 10 | Erie Indemnity Company | 462 | |||
| 30 | Everest Reinsurance Group Ltd | 2,391 | |||
| 110 | Fidelity National Title Group Inc., Class A | 1,386 | |||
| 40 | First American Corporation | 1,056 | |||
| 210 | Genworth Financial Inc., Class A | 3,740 | |||
| 50 | Hanover Insurance Group Inc. | 2,125 | |||
| 50 | HCC Insurance Holdings Inc. | 1,057 | |||
| 130 | Lincoln National Corporation | 5,892 | |||
| 240 | Marsh & McLennan Companies, Inc. | 6,372 | |||
| 30 | Mercury General Corporation | 1,402 | |||
| 20 | Nationwide Financial Services, Inc. | 960 | |||
| 120 | Old Republic International Corporation | 1,421 | |||
| 10 | OneBeacon Insurance Group Limited, Class A | 176 | |||
| 50 | PartnerRe Limited | 3,457 | |||
| 20 | Philadelphia Consolidated Holding Corporation, (2) | 679 | |||
| 160 | Principal Financial Group, Inc. | 6,715 | |||
| 330 | Progressive Corporation | 6,178 | |||
| 70 | Protective Life Corporation | 2,664 | |||
| 10 | Reinsurance Group of America Inc. | 435 | |||
| 70 | RenaisasnceRE Holdings, Limited | 3,127 | |||
| 120 | SAFECO Corporation | 8,059 | |||
| 40 | StanCorp Financial Group Inc. | 1,878 | |||
| 40 | Torchmark Corporation | 2,346 | |||
| 10 | Transatlantic Holdings Inc. | 565 | |||
| 20 | Unitrin, Inc. | 551 | |||
| 340 | Unum Group | 6,953 | |||
| 70 | WR Berkley Corporation | 1,691 | |||
| 70 | XL Capital Ltd, Class A | 1,439 | |||
Total Insurance | 113,823 | ||||
| Internet & Catalog Retail – 0.6% | |||||
| 10 | Expedia, Inc., (2) | 184 | |||
| 280 | IAC/InterActiveCorp., (2) | 5,398 | |||
| 20 | MSC Industrial Direct Inc., Class A | 882 | |||
| 100 | Priceline.com Incorporated | 11,546 | |||
Total Internet & Catalog Retail | 18,010 | ||||
| Internet Software & Services – 0.5% | |||||
| 70 | Ansys Inc., (2) | 3,298 | |||
| 30 | Metavante Technologies Inc., (2) | 679 | |||
| 160 | Sohu.com Inc. | 11,270 | |||
Total Internet Software & Services | 15,247 | ||||
34
| Shares | Description (1) | Value | |||
| IT Services – 2.0% | |||||
| 100 | Affiliated Computer Services Inc., (2) | $ | 5,349 | ||
| 70 | Broadridge Financial Solutions, Inc. | 1,474 | |||
| 140 | Computer Sciences Corporation, (2) | 6,558 | |||
| 70 | Convergys Corporation, (2) | 1,040 | |||
| 70 | DST Systems Inc., (2) | 3,854 | |||
| 820 | Electronic Data Systems Corporation | 20,205 | |||
| 20 | FactSet Research Systems Inc. | 1,127 | |||
| 90 | Fidelity National Information Services | 3,322 | |||
| 70 | Fiserv, Inc., (2) | 3,176 | |||
| 40 | Global Payments Inc. | 1,864 | |||
| 90 | Iron Mountain Inc., (2) | 2,390 | |||
| 120 | Paychex, Inc. | 3,754 | |||
| 180 | SAIC, Inc., (2) | 3,746 | |||
| 70 | Total System Services Inc. | 1,555 | |||
| 190 | Unisys Corporation, (2) | 751 | |||
Total IT Services | 60,165 | ||||
| Leisure Equipment & Products – 0.7% | |||||
| 490 | Eastman Kodak Company | 7,071 | |||
| 210 | Hasbro, Inc. | 7,501 | |||
| 410 | Mattel, Inc. | 7,019 | |||
Total Leisure Equipment & Products | 21,591 | ||||
| Life Sciences Tools & Services – 0.5% | |||||
| 60 | Charles River Laboratories International, Inc., (2) | 3,835 | |||
| 20 | Covance, Inc., (2) | 1,720 | |||
| 20 | Edwards Lifesciences Corporation, (2) | 1,241 | |||
| 60 | Illumina Inc., (2) | 5,227 | |||
| 40 | Perkinelmer Inc. | 1,114 | |||
| 30 | Techne Corporation, (2) | 2,322 | |||
Total Life Sciences Tools & Services | 15,459 | ||||
| Machinery – 4.8% | |||||
| 190 | AGCO Corporation, (2) | 9,958 | |||
| 30 | Crane Company | 1,156 | |||
| 320 | Cummins Inc. | 20,966 | |||
| 30 | Donaldson Company, Inc. | 1,339 | |||
| 230 | Dover Corporation | 11,125 | |||
| 220 | Eaton Corporation | 18,693 | |||
| 60 | Flowserve Corporation | 8,202 | |||
| 50 | Gardner Denver, Inc., (2) | 2,840 | |||
| 30 | Graco Inc. | 1,142 | |||
| 80 | Harsco Corporation | 4,353 | |||
| 70 | IDEX Corporation | 2,579 | |||
| 120 | Ingersoll Rand Company Limited, Class A | 4,492 | |||
| 80 | ITT Industries Inc. | 5,066 | |||
35
Portfolio of Investments
Nuveen Enhanced Mid-Cap Fund (continued)
June 30, 2008
| Shares | Description (1) | Value | |||
| Machinery (continued) | |||||
| 80 | Kennametal Inc. | $ | 2,604 | ||
| 10 | Manitowoc Company Inc. | 325 | |||
| 30 | Oshkosh Truck Corporation | 621 | |||
| 50 | Pall Corporation | 1,984 | |||
| 200 | Parker Hannifin Corporation | 14,264 | |||
| 90 | Pentair, Inc. | 3,152 | |||
| 60 | �� | SPX Corporation | 7,904 | ||
| 190 | Terex Corporation, (2) | 9,760 | |||
| 90 | Timken Company | 2,965 | |||
| 170 | Trinity Industries Inc. | 5,897 | |||
| 30 | Valmont Industries, Inc. | 3,129 | |||
Total Machinery | 144,516 | ||||
| Marine – 0.3% | |||||
| 50 | Alexander and Bald, Inc. | 2,278 | |||
| 70 | Kirby Corporation, (2) | 3,360 | |||
| 50 | Overseas Shipholding Group Inc. | 3,976 | |||
Total Marine | 9,614 | ||||
| Media – 2.5% | |||||
| 120 | Cablevision Systems Corporation, (2) | 2,712 | |||
| 770 | CBS Corporation, Class B | 15,007 | |||
| 40 | Central European Media Enterprises Limited, (2) | 3,621 | |||
| 10 | Clear Channel Outdoor Holdings Inc., Class A, (2) | 178 | |||
| 10 | CTC Media, Inc., (2) | 247 | |||
| 300 | Discovery Holding Company, Series A, (2) | 6,588 | |||
| 30 | DISH Network Corporation (2) | 878 | |||
| 90 | Dreamworks Animation SKG Inc., (2) | 2,683 | |||
| 20 | E.W. Scripps Company, Class A | 831 | |||
| 40 | Echostar Holding Corporation, Class A, (2) | 1,249 | |||
| 320 | Gannett Company Inc. | 6,934 | |||
| 10 | Hearst-Argyle Television Inc. | 192 | |||
| 650 | Interpublic Group Companies, Inc., (2) | 5,590 | |||
| 20 | John Wiley and Sons Inc., Class A | 901 | |||
| 190 | Liberty Global Inc, A Shares, (2) | 5,972 | |||
| 140 | Liberty Media Holding Corporation Capital, Class A, (2) | 2,016 | |||
| 330 | Liberty Media Holding Corporation Interactive, Class A, (2) | 4,871 | |||
| 120 | McGraw-Hill Companies, Inc. | 4,814 | |||
| 20 | Morningstar, Inc. | 1,441 | |||
| 60 | New York Times, Class A | 923 | |||
| 130 | Regal Entertainment Group, Class A | 1,986 | |||
| 10 | Sirius Satellite Radio Inc. | 19 | |||
| 460 | Virgin Media, Inc. | 6,261 | |||
| 20 | Warner Music Group Corporation | 143 | |||
| 60 | XM Satellite Radio Holdings Inc., Class A, (2) | 470 | |||
Total Media | 76,527 | ||||
36
| Shares | Description (1) | Value | |||
| Metals & Mining – 3.5% | |||||
| 210 | AK Steel Holding Corporation | $ | 14,490 | ||
| 220 | Allegheny Technologies, Inc. | 13,042 | |||
| 50 | Century Aluminum Company, (2) | 3,325 | |||
| 160 | Cleveland-Cliffs Inc. | 19,070 | |||
| 120 | Commercial Metals Company | 4,524 | |||
| 200 | CONSOL Energy Inc. | 22,474 | |||
| 70 | Foundation Coal Holding Corporation | 6,201 | |||
| 70 | Reliance Steel & Aluminum Company | 5,396 | |||
| 30 | Schnitzer Steel Industries, Inc. | 3,438 | |||
| 320 | Steel Dynamics Inc. | 12,502 | |||
Total Metals & Mining | 104,462 | ||||
| Mortgage REIT – 0.5% | |||||
| 740 | Annaly Capital Management Inc. | 11,477 | |||
| 230 | iStar Financial Inc. | 3,038 | |||
Total Mortgage REIT | 14,515 | ||||
| Multiline Retail – 2.7% | |||||
| 130 | Big Lots, Inc., (2) | 4,061 | |||
| 200 | Family Dollar Stores, Inc. | 3,988 | |||
| 640 | Federated Department Stores, Inc. | 12,429 | |||
| 400 | J.C. Penney Company, Inc. | 14,516 | |||
| 490 | Kohl’s Corporation, (2) | 19,620 | |||
| 450 | Nordstrom, Inc. | 13,635 | |||
| 30 | Saks Inc., (2) | 329 | |||
| 170 | Sears Holding Corporation, (2) | 12,522 | |||
Total Multiline Retail | 81,100 | ||||
| Multi-Utilities – 2.2% | |||||
| 350 | CenterPoint Energy, Inc. | 5,618 | |||
| 20 | CMS Energy Corporation | 298 | |||
| 20 | Dynegy Inc., (2) | 171 | |||
| 120 | Energy East Corporation | 2,966 | |||
| 70 | Integrys Energy Group, Inc. | 3,558 | |||
| 150 | MDU Resources Group Inc. | 5,229 | |||
| 70 | National Fuel Gas Company | 4,164 | |||
| 260 | NiSource Inc. | 4,659 | |||
| 80 | NSTAR | 2,706 | |||
| 100 | ONEOK, Inc. | 4,883 | |||
| 110 | Puget Energy, Inc. | 2,639 | |||
| 100 | Scana Corporation | 3,700 | |||
| 220 | Sempra Energy | 12,419 | |||
| 60 | Vectren Corporation | 1,873 | |||
| 100 | Wisconsin Energy Corporation | 4,522 | |||
| 360 | Xcel Energy, Inc. | 7,225 | |||
Total Multi-Utilities | 66,630 | ||||
37
Portfolio of Investments
Nuveen Enhanced Mid-Cap Fund (continued)
June 30, 2008
| Shares | Description (1) | Value | |||
| Office Electronics – 0.2% | |||||
| 350 | Xerox Corporation | $ | 4,746 | ||
| Office REIT – 0.8% | |||||
| 30 | Alexandria Real Estate Equities Inc. | 2,920 | |||
| 120 | Boston Properties, Inc. | 10,826 | |||
| 40 | Brandywine Realty Trust | 630 | |||
| 10 | Digital Realty Trust Inc. | 409 | |||
| 120 | Douglas Emmett Inc. | 2,636 | |||
| 260 | HRPT Properties Trust | 1,760 | |||
| 10 | Kilroy Realty Corporation | 470 | |||
| 80 | Mack-Cali Realty Corporation | 2,734 | |||
| 20 | SL Green Realty Corporation | 1,654 | |||
Total Office REIT | 24,039 | ||||
| Oil, Gas & Consumable Fuels – 8.1% | |||||
| 160 | Alpha Natural Resources Inc. | 16,686 | |||
| 100 | Cimarex Energy Company | 6,967 | |||
| 30 | CNX Gas Corporation, (2) | 1,261 | |||
| 80 | Continental Resources Inc., (2) | 5,546 | |||
| 240 | Denbury Resources Inc., (2) | 8,760 | |||
| 840 | El Paso Corporation | 18,262 | |||
| 70 | Encore Acquisition Company | 5,263 | |||
| 90 | Forest Oil Corporation, (2) | 6,705 | |||
| 80 | Frontline Limited | 5,582 | |||
| 90 | Mariner Energy Inc. | 3,327 | |||
| 110 | Massey Energy Company | 10,313 | |||
| 190 | Murphy Oil Corporation | 18,630 | |||
| 160 | Newfield Exploration Company, (2) | 10,440 | |||
| 210 | Noble Energy, Inc. | 21,118 | |||
| 30 | Patriot Coal Corporation, (2) | 4,599 | |||
| 230 | Petrohawk Energy Corporation, (2) | 10,651 | |||
| 150 | Pioneer Natural Resources Company | 11,742 | |||
| 200 | Quicksilver Resources Inc., (2) | 7,728 | |||
| 220 | Range Resources Corporation | 14,419 | |||
| 380 | Southwestern Energy Company, (2) | 18,092 | |||
| 70 | St Mary Land and Exploration Company | 4,525 | |||
| 300 | Sunoco, Inc. | 12,207 | |||
| 50 | Teekay Shipping Corporation | 2,259 | |||
| 580 | Tesoro Petroleum Corporation | 11,467 | |||
| 50 | W&T Offshore Inc. | 2,926 | |||
| 60 | Whiting Petroleum Corporation | 6,365 | |||
Total Oil, Gas & Consumable Fuels | 245,840 | ||||
| Paper & Forest Products – 1.1% | |||||
| 310 | Domtar Corporation, (2) | 1,690 | |||
| 540 | International Paper Company | 12,582 | |||
38
| Shares | Description (1) | Value | |||
| Paper & Forest Products (continued) | |||||
| 200 | MeadWestvaco Corporation | $ | 4,768 | ||
| 270 | Weyerhaeuser Company | 13,808 | |||
Total Paper & Forest Products | 32,848 | ||||
| Personal Products – 0.3% | |||||
| 20 | Alberto Culver Company | 525 | |||
| 190 | Avon Products, Inc. | 6,844 | |||
| 10 | Estee Lauder Companies Inc., Class A | 465 | |||
| 20 | NBTY Inc., (2) | 641 | |||
Total Personal Products | 8,475 | ||||
| Pharmaceuticals – 0.8% | |||||
| 130 | Allergan, Inc. | 6,767 | |||
| 10 | APP Pharmaceuticals Inc., (2) | 167 | |||
| 150 | Barr Laboratories Inc., (2) | 6,762 | |||
| 20 | Endo Pharmaceuticals Holdings Inc., (2) | 484 | |||
| 130 | Forest Laboratories, Inc., (2) | 4,516 | |||
| 70 | King Pharmaceuticals Inc., (2) | 733 | |||
| 140 | Perrigo Company | 4,448 | |||
| 40 | Warner Chilcott Limited, (2) | 678 | |||
| 40 | Watson Pharmaceuticals Inc., (2) | 1,087 | |||
Total Pharmaceuticals | 25,642 | ||||
| Real Estate Management & Development – 0.1% | |||||
| 40 | CB Richard Ellis Group, Inc., Class A, (2) | 768 | |||
| 40 | Forest City Enterprises, Inc. | 1,289 | |||
| 40 | St Joe Company, (2) | 1,373 | |||
Total Real Estate Management & Development | 3,430 | ||||
| Residential REIT – 0.7% | |||||
| 130 | Apartment Investment & Management Company, Class A | 4,428 | |||
| 20 | AvalonBay Communities, Inc. | 1,783 | |||
| 10 | BRE Properties, Inc. | 433 | |||
| 10 | Camden Property Trust | 443 | |||
| 270 | Equity Residential | 10,333 | |||
| 10 | Essex Property Trust Inc. | 1,065 | |||
| 150 | UDR Inc. | 3,357 | |||
Total Residential REIT | 21,842 | ||||
| Retail REIT – 0.5% | |||||
| 30 | CBL & Associates Properties Inc. | 685 | |||
| 40 | Developers Diversified Realty Corporation | 1,388 | |||
| 20 | Federal Realty Investment Trust | 1,380 | |||
| 70 | General Growth Properties Inc. | 2,452 | |||
| 100 | Kimco Realty Corporation | 3,452 | |||
| 20 | Macerich Company | 1,243 | |||
| 30 | Regency Centers Corporation | 1,774 | |||
| 20 | Taubman Centers Inc. | 973 | |||
39
Portfolio of Investments
Nuveen Enhanced Mid-Cap Fund (continued)
June 30, 2008
| Shares | Description (1) | Value | |||
| Retail REIT (continued) | |||||
| 80 | Weingarten Realty Investors Trust | $ | 2,426 | ||
Total Retail REIT | 15,773 | ||||
| Road & Rail – 0.4% | |||||
| 50 | Avis Budget Group Inc., (2) | 419 | |||
| 70 | Hertz Global Holdings, Inc., (2) | 672 | |||
| 100 | Kansas City Southern Industries, (2) | 4,399 | |||
| 10 | Landstar System | 552 | |||
| 100 | Ryder System, Inc. | 6,888 | |||
Total Road & Rail | 12,930 | ||||
| Semiconductors & Equipment – 1.2% | |||||
| 170 | Atmel Corporation, (2) | 592 | |||
| 330 | Cypress Semiconductor Corporation, (2) | 8,168 | |||
| 50 | Fairchild Semiconductor International Inc., Class A, (2) | 587 | |||
| 20 | International Rectifier Corporation, (2) | 384 | |||
| 260 | Lam Research Corporation, (2) | 9,399 | |||
| 20 | Microchip Technology Incorporated | 611 | |||
| 1,840 | Micron Technology, Inc., (2) | 11,040 | |||
| 240 | Novellus Systems, Inc., (2) | 5,086 | |||
Total Semiconductors & Equipment | 35,867 | ||||
| Software – 1.4% | |||||
| 330 | Activision Inc., (2) | 11,243 | |||
| 90 | Amdocs Limited, (2) | 2,648 | |||
| 60 | Autodesk, Inc., (2) | 2,029 | |||
| 40 | BMC Software, Inc., (2) | 1,440 | |||
| 140 | CA Inc. | 3,233 | |||
| 10 | Cadence Design Systems, Inc., (2) | 101 | |||
| 20 | Compuware Corporation, (2) | 191 | |||
| 90 | Electronic Arts Inc. (EA), (2) | 3,999 | |||
| 60 | Intuit Inc., (2) | 1,654 | |||
| 150 | NAVTEQ Corporation, (2) | 11,550 | |||
| 160 | Novell Inc., (2) | 942 | |||
| 60 | Red Hat, Inc., (2) | 1,241 | |||
| 60 | Synopsys Inc., (2) | 1,435 | |||
Total Software | 41,706 | ||||
| Specialized REIT – 1.6% | |||||
| 230 | Health Care Property Investors Inc. | 7,316 | |||
| 90 | Health Care REIT, Inc. | 4,005 | |||
| 140 | Hospitality Properties Trust | 3,424 | |||
| 750 | Host Hotels & Resorts Inc. | 10,238 | |||
| 110 | Nationwide Health Properties, Inc. | 3,464 | |||
| 170 | Plum Creek Timber Company | 7,261 | |||
| 50 | Public Storage, Inc. | 4,040 | |||
| 70 | Rayonier Inc. | 2,972 | |||
40
| Shares | Description (1) | Value | |||
| Specialized REIT (continued) | |||||
| 140 | Ventas Inc. | $ | 5,960 | ||
Total Specialized REIT | 48,680 | ||||
| Specialty Retail – 2.4% | |||||
| 160 | Abercrombie & Fitch Co., Class A | 10,029 | |||
| 390 | American Eagle Outfitters, Inc. | 5,316 | |||
| 250 | AutoNation Inc., (2) | 2,505 | |||
| 60 | AutoZone, Inc., (2) | 7,261 | |||
| 90 | CarMax, Inc., (2) | 1,277 | |||
| 70 | Foot Locker, Inc. | 872 | |||
| 790 | Gap, Inc. | 13,169 | |||
| 460 | Limited Brands, Inc. | 7,751 | |||
| 410 | Office Depot, Inc., (2) | 4,485 | |||
| 10 | OfficeMax Inc. | 139 | |||
| 20 | O’Reilly Automotive Inc., (2) | 447 | |||
| 80 | Penske Auto Group, Inc. | 1,178 | |||
| 10 | PetSmart Inc. | 199 | |||
| 370 | RadioShack Corporation | 4,539 | |||
| 150 | Sherwin-Williams Company | 6,889 | |||
| 90 | TJX Companies, Inc. | 2,831 | |||
| 140 | Williams-Sonoma Inc. | 2,777 | |||
Total Specialty Retail | 71,664 | ||||
| Textiles, Apparel & Luxury Goods – 0.4% | |||||
| 20 | Coach, Inc., (2) | 577 | |||
| 160 | Hanesbrands Inc., (2) | 4,341 | |||
| 150 | Jones Apparel Group, Inc. | 2,062 | |||
| 80 | VF Corporation | 5,693 | |||
Total Textiles, Apparel & Luxury Goods | 12,673 | ||||
| Thrifts & Mortgage Finance – 1.0% | |||||
| 130 | Astoria Financial Corporation | 2,609 | |||
| 20 | Capitol Federal Financial | 751 | |||
| 670 | Hudson City Bancorp, Inc. | 11,175 | |||
| 10 | MGIC Investment Corporation | 60 | |||
| 420 | New York Community Bancorp, Inc. | 7,492 | |||
| 380 | People’s United Financial, Inc. | 5,927 | |||
| 90 | TFS Financial Corporation | 1,042 | |||
| 130 | Washington Federal Inc. | 2,352 | |||
Total Thrifts & Mortgage Finance | 31,408 | ||||
| Tobacco – 0.3% | |||||
| 140 | UST Inc. | 7,644 | |||
| Trading Companies & Distributors – 0.2% | |||||
| 50 | GATX Corporation | 2,216 | |||
| 30 | United Rentals Inc., (2) | 587 | |||
| 30 | W.W. Grainger, Inc. | 2,453 | |||
Total Trading Companies & Distributors | 5,256 | ||||
41
Portfolio of Investments
Nuveen Enhanced Mid-Cap Fund (continued)
June 30, 2008
| Shares | Description (1) | Value | |||
| Water Utilities – 0.1% | |||||
| 70 | American water Works Company | $ | 1,552 | ||
| 40 | Aqua America Inc. | 638 | |||
Total Water Utilities | 2,190 | ||||
| Wireless Telecommunication Services – 0.6% | |||||
| 170 | American Tower Corporation, (2) | 7,182 | |||
| 150 | Crown Castle International Corporation, (2) | 5,809 | |||
| 80 | Metropcs Communications Inc., (2) | 1,416 | |||
| 10 | SBA Communications Corporation, (2) | 359 | |||
| 40 | Telephone and Data Systems Inc. | 1,890 | |||
| 10 | United States Cellular Corporation, (2) | 564 | |||
Total Wireless Telecommunication Services | 17,220 | ||||
| Total Investments (cost $3,115,344) – 99.3% | 2,995,613 | ||||
| Other Assets Less Liabilities – 0.7% | 21,170 | ||||
| Net Assets – 100% | $ | 3,016,783 | |||
| (1) | All percentages shown in the Portfolio of Investments are based on net assets. |
| (2) | Non-income producing. |
See accompanying notes to financial statements.
42
Statement of Assets and Liabilities
June 30, 2008
Enhanced Core Equity | Enhanced | |||||||
Assets | ||||||||
Investments, at value (cost $34,647,215 and $3,115,344, respectively) | $ | 31,192,770 | $ | 2,995,613 | ||||
Cash | 83,975 | 15,714 | ||||||
Receivables: | ||||||||
Dividends | 43,373 | 4,164 | ||||||
From Adviser | 3,091 | 17,406 | ||||||
Investments sold | — | 937,739 | ||||||
Other assets | — | 5 | ||||||
Total assets | 31,323,209 | 3,970,641 | ||||||
Liabilities | ||||||||
Payable for investments purchased | — | 933,485 | ||||||
Accrued expenses: | ||||||||
12b-1 distribution and service fees | 240 | 763 | ||||||
Other | 20,127 | 19,610 | ||||||
Total liabilities | 20,367 | 953,858 | ||||||
Net assets | $ | 31,302,842 | $ | 3,016,783 | ||||
Class A Shares | ||||||||
Net assets | $ | 218,010 | $ | 697,259 | ||||
Shares outstanding | 12,500 | 37,500 | ||||||
Net asset value per share | $ | 17.44 | $ | 18.59 | ||||
Offering price per share (net asset value per share plus | $ | 18.50 | $ | 19.72 | ||||
Class C Shares | ||||||||
Net assets | $ | 217,203 | $ | 694,692 | ||||
Shares outstanding | 12,500 | 37,500 | ||||||
Net asset value and offering price per share | $ | 17.38 | $ | 18.53 | ||||
Class I Shares (1) | ||||||||
Net assets | $ | 30,867,629 | $ | 1,624,832 | ||||
Shares outstanding | 1,767,640 | 87,284 | ||||||
Net asset value and offering price per share | $ | 17.46 | $ | 18.62 | ||||
Net Assets Consist of: | ||||||||
Capital paid-in | $ | 35,633,910 | $ | 3,246,592 | ||||
Undistributed (Over-distribution of) net investment income | 308,596 | 17,126 | ||||||
Accumulated net realized gain (loss) from investments and derivative transactions | (1,185,219 | ) | (127,205 | ) | ||||
Net unrealized appreciation (depreciation) of investments | (3,454,445 | ) | (119,731 | ) | ||||
Net assets | $ | 31,302,842 | $ | 3,016,783 | ||||
| (1) | Effective May 1, 2008, Class R Shares were renamed Class I Shares. |
See accompanying notes to financial statements.
43
Statement of Operations
For the period December 3, 2007 (commencement of operations) through June 30, 2008
Enhanced | Enhanced Mid-Cap | |||||||
Investment Income | ||||||||
Dividends (net of foreign tax withheld of $14 and $10, respectively) | $ | 450,361 | $ | 35,674 | ||||
Interest | 9,151 | 1,034 | ||||||
Total investment income | 459,512 | 36,708 | ||||||
Expenses | ||||||||
Management fees | 89,481 | 9,377 | ||||||
12b-1 service fees – Class A | 336 | 1,021 | ||||||
12b-1 distribution and service fees – Class B | 959 | 2,882 | ||||||
12b-1 distribution and service fees – Class C | 1,340 | 4,077 | ||||||
Shareholders’ servicing agent fees and expenses | 214 | 164 | ||||||
Custodian’s fees and expenses | 24,279 | 30,270 | ||||||
Trustees’ fees and expenses | 473 | 87 | ||||||
Professional fees | 7,694 | 6,450 | ||||||
Shareholders’ reports – printing and mailing expenses | 7,673 | 7,681 | ||||||
Federal and state registration fees | 5,865 | 5,806 | ||||||
Other expenses | 2,275 | 2,158 | ||||||
Total expenses before custodian fee credit and expense reimbursement | 140,589 | 69,973 | ||||||
Custodian fee credit | (807 | ) | (367 | ) | ||||
Expense reimbursement | (48,487 | ) | (52,617 | ) | ||||
Net expenses | 91,295 | 16,989 | ||||||
Net investment income | 368,217 | 19,719 | ||||||
Realized and Unrealized Gain (Loss) | ||||||||
Net realized gain (loss) from: | ||||||||
Investments | (1,201,717 | ) | (127,205 | ) | ||||
Futures | 16,498 | — | ||||||
Change in net unrealized appreciation (depreciation) of investments | (3,454,445 | ) | (119,731 | ) | ||||
Net realized and unrealized gain (loss) | (4,639,664 | ) | (246,936 | ) | ||||
Net increase (decrease) in net assets from operations | $ | (4,271,447 | ) | $ | (227,217 | ) | ||
See accompanying notes to financial statements.
44
Statement of Changes in Net Assets
For the period December 3, 2007 (commencement of operations) through June 30, 2008
Enhanced | Enhanced | |||||||
Operations | ||||||||
Net investment income | $ | 368,217 | $ | 19,719 | ||||
Net realized gain (loss) from: | ||||||||
Investments | (1,201,717 | ) | (127,205 | ) | ||||
Futures | 16,498 | — | ||||||
Change in net unrealized appreciation (depreciation) of investments | (3,454,445 | ) | (119,731 | ) | ||||
Net increase (decrease) in net assets from operations | (4,271,447 | ) | (227,217 | ) | ||||
Distributions to Shareholders | ||||||||
From net investment income: | ||||||||
Class A | (378 | ) | (1,699 | ) | ||||
Class B | (221 | ) | (1,222 | ) | ||||
Class C | (221 | ) | (1,222 | ) | ||||
Class I (1) | (60,142 | ) | (2,469 | ) | ||||
Decrease in net assets from distribution to shareholders | (60,962 | ) | (6,612 | ) | ||||
Fund Share Transactions | ||||||||
Proceeds from sale of shares | 35,600,000 | 3,250,000 | ||||||
Proceeds from shares issued to shareholders due | 35,251 | 612 | ||||||
Net increase (decrease) in net assets from Fund share transactions | 35,635,251 | 3,250,612 | ||||||
Net increase (decrease) in net assets | 31,302,842 | 3,016,783 | ||||||
Net assets at the beginning of period | — | — | ||||||
Net assets at the end of period | $ | 31,302,842 | $ | 3,016,783 | ||||
Undistributed (Over-distribution of) net investment income at the end of period | $ | 308,596 | $ | 17,126 | ||||
| (1) | Effective May 1, 2008, Class R Shares were renamed Class I Shares. |
See accompanying notes to financial statements.
45
Notes to Financial Statements
1. General Information and Significant Accounting Policies
The Nuveen Investment Trust (the “Trust”) is an open-end management investment company registered under the Investment Company Act of 1940, as amended. The Trust is comprised of Nuveen Enhanced Core Equity Fund (“Enhanced Core Equity”) and Nuveen Enhanced Mid-Cap Fund (“Enhanced Mid-Cap”) (collectively, the “Funds”), among others. The Trust was organized as a Massachusetts business trust in 1996.
Enhanced Core Equity ordinarily invests, under normal market conditions, in securities of companies within the S&P 500 Index in an attempt to provide long-term capital appreciation.
Enhanced Mid-Cap ordinarily invests, under normal market conditions, in equity securities of companies in the Russell Midcap Index in an attempt to provide long-term capital appreciation. The Fund may also invest in non-U.S. equity securities that are included in the Russell Midcap Index.
On March 31, 2008, the Nuveen Mutual Funds announced the following policy changes applicable to the Funds:
| • | Effective March 31, 2008, Class B shares are no longer available for the Funds. As of March 31, 2008, all outstanding Class B Shares for each Fund were owned by Nuveen Investments, Inc. (“Nuveen”) and transferred to Class I Shares on May 2, 2008. |
| • | Effective May 1, 2008, Class A share purchases at net asset value of $1 million or more that are subject to a contingent deferred sales charge (“CDSC”), the period over which the CDSC will apply has been reduced from eighteen months to twelve months for all purchases occurring on or after May 1, 2007. Class A shares purchased prior to May 1, 2007 that have not been redeemed are no longer be subject to a CDSC; |
| • | Effective May 1, 2008, Class R Shares have been renamed Class I Shares and are available for (i) purchases of $1 million or more, (ii) purchases using dividends and capital gains distributions on Class I Shares and (iii) purchase by limited categories of investors. |
The following is a summary of significant accounting policies followed by the Funds in the preparation of their financial statements in accordance with accounting principles generally accepted in the United States.
Investment Valuation
Exchange-listed securities are generally valued at the last sales price on the securities exchange on which such securities are primarily traded. Securities traded on a securities exchange for which there are no transactions on a given day or securities not listed on a securities exchange are valued at the mean of the closing bid and asked prices. Securities traded on Nasdaq are valued at the Nasdaq Official Closing Price. Futures contracts are valued using the closing settlement price, or, in the absence of such a price, at the mean of the bid and asked prices. If the pricing service is unable to supply a price for an investment or futures contract, each Fund may use market quotes provided by major broker/dealers in such investments. If it is determined that the market price for an investment or derivative instrument is unavailable or inappropriate, the Board of Trustees of the Fund, or its designee, may establish fair value in accordance with procedures established in good faith by the Board of Trustees. Short-term investments are valued at amortized cost, which approximates market value.
Investment Transactions
Investment transactions are recorded on a trade date basis. Realized gains and losses from investment transactions are determined on the specific identification method.
Investment Income
Dividend income is recorded on the ex-dividend date or, for foreign securities, when information is available. Interest income is recorded on an accrual basis.
Dividends and Distributions to Shareholders
Dividends from net investment income and net realized capital gains from investment transactions, if any, are declared and distributed to shareholders at least annually. Furthermore, capital gains are distributed only to the extent they exceed available capital loss carryforwards.
Distributions to shareholders are recorded on the ex-dividend date. The amount and timing of distributions are determined in accordance with federal income tax regulations, which may differ from accounting principles generally accepted in the United States.
Income Taxes
Each Fund is a separate taxpayer for federal income tax purposes. Each Fund intends to distribute substantially all of its net investment income and net capital gains to shareholders and to otherwise comply with the requirements of Subchapter M of the Internal Revenue Code applicable to regulated investment companies. Therefore, no federal income tax provision is required. Net realized capital gains and ordinary income distributions paid by the Funds are subject to federal taxation.
Effective December 31, 2007, the Funds adopted Financial Accounting Standards Board (FASB) Interpretation No. 48 “Accounting for Uncertainty in Income Taxes” (FIN 48). FIN 48 provides guidance for how uncertain tax positions should be recognized, measured, presented and disclosed in the financial statements. FIN 48 requires the affirmative evaluation of tax positions taken or expected to be taken in the course of preparing the Funds’ tax returns to determine whether it is “more-likely-than-not” (i.e., a greater than
46
50-percent likelihood) of being sustained by the applicable tax authority. Tax positions not deemed to meet the more-likely-than-not threshold may result in a tax expense in the current year.
Implementation of FIN 48 required management of the Funds to analyze all open tax years, if any, as defined by the statute of limitations, for all major jurisdictions, which includes federal and certain states. Open tax years are those that are open for examination by taxing authorities (i.e., generally the last four tax year ends and the interim tax period since then). The Funds have no examinations in progress.
For all open tax years and all major taxing jurisdictions through the end of the reporting period, management of the Funds has reviewed all tax positions taken or expected to be taken in the preparation of the Funds’ tax returns and concluded the adoption of FIN 48 resulted in no impact to the Funds’ net assets or results of operations as of and during the period December 3, 2007 (commencement of operations) through June 30, 2008.
The Funds are also not aware of any tax positions for which it is reasonably possible that the total amounts of unrecognized tax benefits will significantly change in the next twelve months.
Flexible Sales Charge Program
Each Fund offers Class A, C and I Shares. Class A Shares are generally sold with an up-front sales charge and incur a .25% annual 12b-1 service fee. Class A Share purchases of $1 million or more are sold at net asset value without an up-front sales charge but may be subject to a CDSC if redeemed within twelve months of purchase. Class C Shares are sold without an up-front sales charge but incur a .75% annual 12b-1 distribution fee and a .25% annual 12b-1 service fee. Class C Shares are subject to a CDSC of 1% if redeemed within one year of purchase. Class I Shares are not subject to any sales charge or 12b-1 distribution or service fees.
Futures Contracts
Each Fund is authorized to invest in futures contracts. Upon entering into a futures contract, a Fund is required to deposit with the broker an amount of cash or liquid securities equal to a specified percentage of the contract amount. This is known as the “initial margin.” Subsequent payments (“variation margin”) are made or received by a Fund each day, depending on the daily fluctuation of the value of the contract.
During the period the futures contract is open, changes in the value of the contract are recognized as an unrealized gain or loss by “marking-to-market” on a daily basis to reflect the changes in market value of the contract. When the contract is closed or expired, a Fund records a realized gain or loss equal to the difference between the value of the contract on the closing date and value of the contract when originally entered into. Cash held by the broker to cover initial margin requirements on open futures contracts, if any, is recognized in the Statement of Assets and Liabilities. Additionally, the Statement of Assets and Liabilities reflects a receivable or payable for the variation margin when applicable. Enhanced Core Equity was the only Fund to invest in futures contracts during the period December 3, 2007 (commencement of operations) through June 30, 2008.
Risks of investments in futures contracts include the possible adverse movement of the securities or indices underlying the contracts, the possibility that there may not be a liquid secondary market for the contracts and/or that a change in the value of the contract may not correlate with a change in the value of the underlying securities or indices.
Repurchase Agreements
In connection with transactions in repurchase agreements, it is the Funds’ policy that its custodian take possession of the underlying collateral securities, the fair value of which exceeds the principal amount of the repurchase transaction, including accrued interest, at all times. If the seller defaults, and the fair value of the collateral declines, realization of the collateral may be delayed or limited.
Expense Allocation
Expenses of the Funds that are not directly attributable to a specific class of shares are prorated among the classes based on the relative net assets of each class. Expenses directly attributable to a class of shares, which presently only include 12b-1 distribution and service fees, are recorded to the specific class.
Custodian Fee Credit
Each Fund has an arrangement with the custodian bank whereby certain custodian fees and expenses are reduced by net credits earned on each Fund’s cash on deposit with the bank. Such deposit arrangements are an alternative to overnight investments. Credits for cash balances may be offset by changes for any days on which a Fund overdraws its account at the custodian bank.
Indemnifications
Under the Trust’s organizational documents, its Officers and Trustees are indemnified against certain liabilities arising out of the performance of their duties to the Trust. In addition, in the normal course of business, the Trust enters into contracts that provide general indemnifications to other parties. The Trust’s maximum exposure under these arrangements is unknown as this would involve future claims that may be made against the Trust that have not yet occurred. However, the Trust has not had prior claims or losses pursuant to these contracts and expects the risk of loss to be remote.
47
Notes to Financial Statements (continued)
Use of Estimates
The preparation of financial statements in conformity with accounting principles generally accepted in the United States requires management to make estimates and assumptions that affect the reported amounts of assets and liabilities at the date of the financial statements and the reported amounts of increases and decreases in net assets from operations during the reporting period. Actual results may differ from those estimates.
2. Fund Shares
Transactions in Fund shares were as follows:
| Enhanced Core Equity | |||||
| For the Period 12/03/07 (commencement of operations) through 6/30/08 | |||||
| Shares | Amount | ||||
Shares sold: | |||||
Class A | 12,500 | $ | 250,000 | ||
Class C | 12,500 | 250,000 | |||
Class I* | 1,765,869 | 35,100,000 | |||
Shares issued to shareholders due to reinvestment of distributions: | |||||
Class A | — | — | |||
Class C | — | — | |||
Class I* | 1,771 | 35,251 | |||
Net increase (decrease) | 1,792,640 | $ | 35,635,251 | ||
| Enhanced Mid-Cap | |||||
| For the Period 12/03/07 (commencement of operations) through 6/30/08 | |||||
| Shares | Amount | ||||
Shares sold: | |||||
Class A | 37,500 | $ | 750,000 | ||
Class C | 37,500 | 750,000 | |||
Class I* | 87,253 | 1,750,000 | |||
Shares issued to shareholders due to reinvestment of distributions: | |||||
Class A | — | — | |||
Class C | — | — | |||
Class I* | 31 | 612 | |||
Net increase (decrease) | 162,284 | $ | 3,250,612 | ||
| * | Effective March 31, 2008, Class B Shares were no longer available to the Funds and transferred to Class I Shares on May 2, 2008. |
3. Investment Transactions
Purchases and sales (excluding short-term investments and derivative transactions) for the period December 3, 2007 (commencement of operations) through June 30, 2008, were as follows:
| Enhanced Core Equity | Enhanced Mid-Cap | |||||
Purchases | $ | 43,035,992 | $ | 5,996,905 | ||
Sales | 7,106,620 | 2,714,415 | ||||
4. Income Tax Information
The following information is presented on an income tax basis. Differences between amounts for financial statement and federal income tax purposes are primarily due to timing differences in recognizing certain gains and losses on investment transactions. To the extent that differences arise that are permanent in nature, such amounts are reclassified within the capital accounts on the Statement of Assets and Liabilities presented in the annual report, based on their federal tax basis treatment; temporary differences do not require reclassification. Temporary and permanent differences do not impact the net asset values of the Funds.
48
At June 30, 2008, the cost of investments was as follows:
| Enhanced Core Equity | Enhanced Mid-Cap | |||||
Cost of investments | $ | 34,649,378 | $ | 3,115,344 | ||
Gross unrealized appreciation and gross unrealized depreciation of investments at June 30, 2008, were as follows:
| Enhanced Core Equity | Enhanced Mid-Cap | |||||||
Gross unrealized: | ||||||||
Appreciation | $ | 1,347,678 | $ | 173,191 | ||||
Depreciation | (4,804,286 | ) | (292,922 | ) | ||||
Net unrealized appreciation (depreciation) of investments | $ | (3,456,608 | ) | $ | (119,731 | ) | ||
The tax components of undistributed net ordinary income and net long-term capital gains at June 30, 2008, the Funds’ tax year end, were as follows:
| Enhanced Core Equity | Enhanced Mid-Cap | |||||
Undistributed net ordinary income* | $ | 308,595 | $ | 17,126 | ||
| * | Net ordinary income consists of net taxable income derived from dividends, interest, and net short-term capital gains, if any. |
The tax character of distributions paid during the Funds’ tax year ended June 30, 2008, was designated for purposes of the dividends paid deduction as follows:
| For the period December 3, 2007 (commencement of operations) through June 30, 2008 | Enhanced Core Equity | Enhanced Mid-Cap | ||||
Distributions from net ordinary income* | $ | 60,962 | $ | 6,613 | ||
| * | Net ordinary income consists of net taxable income derived from dividends, interest and net short-term capital gains, if any. |
The Funds have elected to defer net realized losses from investments incurred from December 3, 2007 (commencement of operations) through June 30, 2008, the Funds’ tax year end, (“post-October losses”) in accordance with federal income tax regulations. Post-October losses are treated as having arisen on the first day of the following fiscal year:
| Enhanced Core Equity | Enhanced Mid-Cap | ||||
| $1,183,057 | $ | 127,200 | |||
5. Management Fees and Other Transactions with Affiliates
Each Fund’s management fee is separated into two components – a complex-level component, based on the aggregate amount of all fund assets managed by Nuveen Asset Management (the “Adviser”), a wholly owned subsidiary of Nuveen, and a specific fund-level component, based only on the amount of assets within each individual Fund. This pricing structure enables Nuveen fund shareholders to benefit from growth in the assets within each individual fund as well as from growth in the amount of complex-wide assets managed by the Adviser.
The annual fund-level fee, payable monthly, for each Fund is based upon the average daily net assets of each Fund as follows:
| Average Daily Net Assets | Enhanced Core Equity Fund-Level Fee Rate | Enhanced Mid-Cap Fund-Level Fee Rate | ||||
For the first $125 million | .3000 | % | .3500 | % | ||
For the next $125 million | .2875 | .3375 | ||||
For the next $250 million | .2750 | .3250 | ||||
For the next $500 million | .2625 | .3125 | ||||
For the next $1 billion | .2500 | .3000 | ||||
For net assets over $2 billion | .2250 | .2750 |
49
Notes to Financial Statements (continued)
The annual complex-level fee, payable monthly, which is additive to the fund-level fee, for all Nuveen sponsored funds in the U.S., is based on the aggregate amount of total fund assets managed as stated in the table below. As of June 30, 2008, the complex-level fee rate was .1868%.
The complex-level fee schedule is as follows:
| Complex-Level Asset Breakpoint Level (1) | Effective Rate at Breakpoint Level | ||
$55 billion | .2000 | % | |
$56 billion | .1996 | ||
$57 billion | .1989 | ||
$60 billion | .1961 | ||
$63 billion | .1931 | ||
$66 billion | .1900 | ||
$71 billion | .1851 | ||
$76 billion | .1806 | ||
$80 billion | .1773 | ||
$91 billion | .1691 | ||
$125 billion | .1599 | ||
$200 billion | .1505 | ||
$250 billion | .1469 | ||
$300 billion | .1445 |
| (1) | The complex-level fee component of the management fee for the funds is calculated based upon the aggregate Managed Assets (“Managed Assets” means the average daily net assets of each fund including assets attributable to preferred stock issued by or borrowings by the Nuveen funds) of Nuveen-sponsored funds in the U.S. |
The management fee compensates the Adviser for overall investment advisory and administrative services and general office facilities. The Adviser has entered into a Sub-Advisory Agreement with Nuveen HydePark Group, LLC (“Nuveen HydePark”), an indirect wholly-owned subsidiary of Nuveen, under which Nuveen HydePark manages the investment portfolios of the Funds. Nuveen HydePark is compensated for its services to the Funds from the management fee paid to the Adviser.
The Adviser has agreed to waive part of its management fees or reimburse certain expenses of Enhanced Core Equity and Enhanced Mid-Cap through October 31, 2010, in order to limit total operating expenses (excluding 12b-1 distribution and service fees, interest expense, taxes, fees incurred in acquiring and disposing of portfolio securities and extraordinary expenses) from exceeding .50% and .55% of the average daily net assets of Enhanced Core Equity and Enhanced Mid-Cap, respectively, and from exceeding 1.00% and 1.05%, respectively after October 31, 2010. The Adviser may also voluntarily reimburse additional expenses from time to time in either of the Funds. Voluntary reimbursements may be terminated at any time at the Adviser’s discretion.
The Trust pays no compensation directly to those of its Trustees who are affiliated with the Adviser or to its Officers, all of whom receive remuneration for their services to the Trust from the Adviser or its affiliates. The Board of Trustees has adopted a deferred compensation plan for independent Trustees that enables Trustees to elect to defer receipt of all or a portion of the annual compensation they are entitled to receive from certain Nuveen advised funds. Under the plan, deferred amounts are treated as though equal dollar amounts had been invested in shares of select Nuveen advised funds.
At June 30, 2008, Nuveen owned 12,500, 12,500 and 24,954 shares of Class A, C and I Shares, respectively, of Enhanced Core Equity and 37,500, 37,500 and 74,883 shares of Class A, C and I Shares, respectively, of Enhanced Mid-Cap.
During the period covered by this report, Nuveen Investments, LLC, a wholly owned subsidiary of Nuveen, retained all 12b-1 fees.
Related Party Holdings
Nuveen is owned by an investor group led by Madison Dearborn Partners, LLC. An affiliate of Merrill Lynch & Co., as part of this investor group, owns more than 5% of Nuveen’s common stock. As a result, Merrill Lynch is an indirect “affiliated person” (as that term is defined in the Investment Company Act of 1940) of each Fund.
At June 30, 2008, Enhanced Core Equity owned 3,200 shares of Merrill Lynch and Co., Inc. common stock with a market value of $101,472. Total income earned by Enhanced Core Equity from such securities amounted to $1,715.
6. New Accounting Pronouncements
Financial Accounting Standards Board Statement of Financial Accounting Standards (SFAS) No. 157
In September 2006, FASB issued SFAS No. 157, “Fair Value Measurements.” This standard establishes a single authoritative definition of fair value, sets out a framework for measuring fair value and requires additional disclosures about fair value measurements. SFAS No. 157 applies to fair value measurements already required or permitted by existing standards. SFAS No. 157 is effective for financial statements issued for fiscal years beginning after November 15, 2007, and interim periods within those fiscal years. The changes to current generally accepted accounting principles from the application of this standard relate to the definition of fair value, the methods used to measure fair value, and the expanded disclosures about fair value measurements. As of June 30, 2008, management does not believe the adoption of SFAS No. 157 will impact the financial statement amounts; however,
50
additional disclosures may be required about the inputs used to develop the measurements and the effect of certain of the measurements included within the Statement of Operations for the period. As the Trust was established prior to November 15, 2007, each Fund in the Trust will include SFAS No. 157 disclosures in the Trust’s interim report filed with the SEC as of September 30, 2008.
Financial Accounting Standards Board Statement of Financial Accounting Standards No. 161
In March 2008, the FASB issued SFAS No. 161, “Disclosures about Derivative Instruments and Hedging Activities.” This standard is intended to enhance financial statement disclosures for derivative instruments and hedging activities and enable investors to understand: a) how and why a fund uses derivative instruments, b) how derivative instruments and related hedge items are accounted for, and c) how derivative instruments and related hedge items affect a fund’s financial position, results of operations and cash flows. SFAS No. 161 is effective for financial statements issued for fiscal years and interim periods beginning after November 15, 2008. As of June 30, 2008, management does not believe the adoption of SFAS No. 161 will impact the financial statement amounts; however, additional footnote disclosures may be required about the use of derivative instruments and hedging items.
51
Financial Highlights
Selected data for a share outstanding throughout each period:
| Class (Commencement Date) | |||||||||||||||||||||||||||||||||||||||||||||||||||||||
| Investment Operations | Less Distributions | Ratios/Supplemental Data | |||||||||||||||||||||||||||||||||||||||||||||||||||||
| ENHANCED CORE EQUITY | Ratios to Average Net Assets Before Credit/ Reimbursement | Ratios to Average Net Assets After Reimbursement(c) | Ratios to Average Net Assets After Credit/ Reimbursement(d) | ||||||||||||||||||||||||||||||||||||||||||||||||||||
Year Ended June 30, | Beginning Asset | Net Invest- ment | Net Realized/ Unrealized Gain | Total | Net Invest- ment | Capital Gains | Total | Ending Net Asset Value | Total Return(b) | Ending Net Assets (000) | Expenses | Net ment | Expenses | Net ment | Expenses | Net ment | Portfolio Turnover Rate | ||||||||||||||||||||||||||||||||||||||
| Class A (12/07) | |||||||||||||||||||||||||||||||||||||||||||||||||||||||
2008(e) | $ | 20.00 | $ | .19 | $ | (2.72 | ) | $ | (2.53 | ) | $ | (.03 | ) | $ | — | $ | (.03 | ) | $ | 17.44 | (12.67 | )% | $ | 218 | 1.25 | %* | 1.26 | %* | .74 | %* | 1.77 | %* | .73 | %* | 1.77 | %* | 21 | % | |||||||||||||||||
| Class C (12/07) | |||||||||||||||||||||||||||||||||||||||||||||||||||||||
2008(e) | 20.00 | .11 | (2.71 | ) | (2.60 | ) | (.02 | ) | — | (.02 | ) | 17.38 | (13.02 | ) | 217 | 2.00 | * | .51 | * | 1.49 | * | 1.02 | * | 1.48 | * | 1.02 | * | 21 | |||||||||||||||||||||||||||
| Class I (12/07)(f) | |||||||||||||||||||||||||||||||||||||||||||||||||||||||
2008(e) | 20.00 | .22 | (2.73 | ) | (2.51 | ) | (.03 | ) | — | (.03 | ) | 17.46 | (12.55 | ) | 30,868 | .74 | * | 1.75 | * | .49 | * | 2.01 | * | .48 | * | 2.01 | * | 21 | |||||||||||||||||||||||||||
| * | Annualized |
| (a) | Per share Net Investment Income is calculated using the average daily shares method. |
| (b) | Total return is the combination of changes in net asset value without any sales charge, reinvested dividend income at net asset value and reinvested capital gains distributions at net asset value, if any. Total returns are not annualized. |
| (c) | After expense reimbursement from the Adviser, where applicable. |
| (d) | After custodian fee credit and expense reimbursement, where applicable. |
| (e) | For the period December 3, 2007 (commencement of operations) through June 30, 2008. |
| (f) | Effective May 1, 2008, Class R Shares were renamed Class I Shares. |
See accompanying notes to financial statements.
52
| Class (Commencement Date) | |||||||||||||||||||||||||||||||||||||||||||||||||||||||
| Investment Operations | Less Distributions | Ratios/Supplemental Data | |||||||||||||||||||||||||||||||||||||||||||||||||||||
| ENHANCED MID-CAP | Ratios to Average Net Assets Before Credit/ Reimbursement | Ratios to Average Net Assets After Reimbursement(c) | Ratios to Average Net Assets After Credit/ Reimbursement(d) | ||||||||||||||||||||||||||||||||||||||||||||||||||||
Year Ended June 30, | Beginning Asset | Net Invest- ment | Net Realized/ Unrealized Gain | Total | Net Invest- ment | Capital Gains | Total | Ending Net Asset Value | Total Return(b) | Ending Net Assets (000) | Expenses | Net ment | Expenses | Net ment | Expenses | Net ment | Portfolio Turnover Rate | ||||||||||||||||||||||||||||||||||||||
| Class A (12/07) | |||||||||||||||||||||||||||||||||||||||||||||||||||||||
2008(e) | $ | 20.00 | $ | .15 | $ | (1.51 | ) | $ | (1.36 | ) | $ | (.05 | ) | $ | — | $ | (.05 | ) | $ | 18.59 | (6.79 | )% | $ | 697 | 3.81 | %* | (1.70 | )%* | .78 | %* | 1.33 | %* | .76 | %* | 1.34 | %* | 89 | % | |||||||||||||||||
| Class C (12/07) | |||||||||||||||||||||||||||||||||||||||||||||||||||||||
2008(e) | 20.00 | .06 | (1.50 | ) | (1.44 | ) | (.03 | ) | — | (.03 | ) | 18.53 | (7.20 | ) | 695 | 4.56 | * | (2.45 | )* | 1.53 | * | .58 | * | 1.51 | * | .59 | * | 89 | |||||||||||||||||||||||||||
| Class I (12/07)(f) | |||||||||||||||||||||||||||||||||||||||||||||||||||||||
2008(e) | 20.00 | .15 | (1.48 | ) | (1.33 | ) | (.05 | ) | — | (.05 | ) | 18.62 | (6.67 | ) | 1,625 | 3.52 | * | (1.43 | )* | .53 | * | 1.55 | * | .51 | * | 1.57 | * | 89 | |||||||||||||||||||||||||||
| * | Annualized. |
| (a) | Per share Net Investment Income is calculated using the average daily shares method. |
| (b) | Total return is the combination of changes in net asset value without any sales charge, reinvested dividend income at net asset value and reinvested capital gains distributions at net asset value, if any. Total returns are not annualized. |
| (c) | After expense reimbursement from the Adviser, where applicable. |
| (d) | After custodian fee credit and expense reimbursement, where applicable. |
| (e) | For the period December 3, 2007 (commencement of operations) through June 30, 2008. |
| (f) | Effective May 1, 2008, Class R Shares were renamed Class I Shares. |
See accompanying notes to financial statements.
53
Report of Independent Registered Public Accounting Firm
To the Board of Trustees and Shareholders of
Nuveen Investment Trust:
In our opinion, the accompanying statement of assets and liabilities, including the portfolio of investments, and the related statement of operations and of changes in net assets and the financial highlights present fairly, in all material respects, the financial position of Nuveen Enhanced Core Equity Fund and Nuveen Enhanced Mid-Cap Value Fund (each a series of the Nuveen Investment Trust, hereafter referred to as the “Funds”) at June 30, 2008, and the results of its operations, the changes in its net assets and the financial highlights for the period December 3, 2007 (commencement of operations) through June 30, 2008, in conformity with accounting principles generally accepted in the United States of America. These financial statements and financial highlights (hereafter referred to as “financial statements”) are the responsibility of the Funds’ management; our responsibility is to express an opinion on these financial statements based on our audit. We conducted our audits of these financial statements in accordance with the standards of the Public Company Accounting Oversight Board (United States). These standards require that we plan and perform the audit to obtain reasonable assurance about whether the financial statements are free of material misstatement. An audit includes examining, on a test basis, evidence supporting the amounts and disclosures in the financial statements, assessing the accounting principles used and significant estimates made by management, and evaluating the overall financial statement presentation. We believe that our audits, which included confirmation of securities at June 30, 2008 by correspondence with the custodian and brokers, provide a reasonable basis for our opinion.
PricewaterhouseCoopers LLP
Chicago, IL
August 22, 2008
54
Notes
55
Trustees and Officers
The management of the Funds, including general supervision of the duties performed for the Funds by the Adviser, is the responsibility of the Board of Trustees of the Funds. The number of trustees of the Funds is currently set at nine. None of the trustees who are not “interested” persons of the Funds (referred to herein as “independent trustees”) has ever been a director or employee of, or consultant to, Nuveen or its affiliates. The names and business addresses of the trustees and officers of the Funds, their principal occupations and other affiliations during the past five years, the number of portfolios each oversees and other directorships they hold are set forth below.
The Funds’ Statement of Additional Information (“SAI”) includes more information about the trustees. To request a free copy, call Nuveen Investments at (800) 257-8787 or visit the Funds’ website at www.nuveen.com.
Name, Birthdate and Address | Position(s) Held with the Funds | Year First Elected or Appointed (1) | Principal Occupation(s) Including other Directorships During Past 5 Years | Number of Portfolios in Fund Complex Overseen by Trustee | ||||
| Independent Trustees: | ||||||||
Robert P. Bremner 8/22/40 333 W. Wacker Drive Chicago, IL 60606 | Chairman of the Board and Trustee | 1997 | Private Investor and Management Consultant. | 186 | ||||
Jack B. Evans 10/22/48 333 W. Wacker Drive Chicago, IL 60606 | Trustee | 1999 | President, The Hall-Perrine Foundation, a private philanthropic corporation (since 1996); Director and Vice Chairman, United Fire Group, a publicly held company; Member of the Board of Regents for the State of Iowa University System; Director, Gazette Companies; Life Trustee of Coe College and Iowa College Foundation; Member of the Advisory Council of the Department of Finance in the Tippie College of Business, University of lowa; formerly, Director, Alliant Energy; formerly, Director, Federal Reserve Bank of Chicago; formerly, President and Chief Operating Officer, SCI Financial Group, Inc., a regional financial services firm. | 186 | ||||
William C. Hunter 3/6/48 333 W. Wacker Drive Chicago, IL 60606 | Trustee | 2004 | Dean, Tippie College of Business, University of Iowa (since July 2006); formerly, Dean and Distinguished Professor of Finance, School of Business at the University of Connecticut (2003-2006); previously, Senior Vice President and Director of Research at the Federal Reserve Bank of Chicago (1995-2003); Director (since 1997), Credit Research Center at George Washington University; Director (since 2004) of Xerox Corporation; Director (since 2005), Beta Gamma Sigma International Honor Society; Director, SS&C Technologies, Inc. (May 2005-October 2005). | 186 | ||||
David J. Kundert 10/28/42 333 W. Wacker Drive Chicago, IL 60606 | Trustee | 2005 | Director, Northwestern Mutual Wealth Management Company; Retired (since 2004) as Chairman, JPMorgan Fleming Asset Management, President and CEO, Banc One Investment Advisors Corporation, and President, One Group Mutual Funds; prior thereto, Executive Vice President, Banc One Corporation and Chairman and CEO, Banc One Investment Management Group; Member, Board of Regents, Luther College; member of the Wisconsin Bar Association; member of Board of Directors, Friends of Boerner Botanical Gardens; member of Investment Committee, Greater Milwaukee Foundation. | 186 | ||||
William J. Schneider 9/24/44 333 W. Wacker Drive Chicago, IL 60606 | Trustee | 1997 | Chairman, formerly, Senior Partner and Chief Operating Officer (retired, 2004) of Miller-Valentine Partners Ltd., a real estate investment company; Director, Dayton Development Coalition; formerly, Member, Business Advisory Council, Cleveland Federal Reserve Bank. | 186 | ||||
Judith M. Stockdale 12/29/47 333 W. Wacker Drive Chicago, IL 60606 | Trustee | 1997 | Executive Director, Gaylord and Dorothy Donnelley Foundation (since 1994); prior thereto, Executive Director, Great Lakes Protection Fund (from 1990 to 1994). | 186 | ||||
56
Name, Birthdate and Address | Position(s) Held with the Funds | Year First Elected or Appointed (1) | Principal Occupation(s) Including other Directorships During Past 5 Years | Number of Portfolios in Fund Complex Overseen by Trustee | ||||
Carole E. Stone 6/28/47 333 W. Wacker Drive Chicago, IL 60606 | Trustee | 2007 | Director, Chicago Board Options Exchange (since 2006); Commissioner, New York State Commission on Public Authority Reform (since 2005); formerly, Director, New York State Division of the Budget (2000-2004), Chair, Public Authorities Control Board (2000-2004) and Director, Local Government Assistance Corporation (2000-2004); formerly, Chair, New York Racing Association Oversight Board (2005-12/2007). | 186 | ||||
Terence J. Toth (2) 9/29/59 333 W. Wacker Drive Chicago, IL 60606 | Trustee | 2008 | Private Investor (since 2007); CEO and President, Northern Trust Investments (2004-2007); Executive Vice President, Quantitative Management & Securities Lending (2000-2004); prior thereto, various positions with Northern Trust Company (since 1994); Member: Goodman Theatre Board (since 2004); Chicago Fellowship Board (since 2005), University of Illinois Leadership Council Board (since 2007) and Catalyst Schools of Chicago Board (since 2008); formerly Member: Northern Trust Mutual Funds Board (2005-2007), Northern Trust Japan Board (2004-2007), Northern Trust Securities Inc. Board (2003-2007) and Northern Trust Hong Kong Board (1997-2004). | 186 | ||||
| Interested Trustee: | ||||||||
John P. Amboian (2)(3) 6/14/61 333 W. Wacker Drive Chicago, IL 60606 | Trustee | 2008 | Chief Executive Officer (since July 2007) and Director (since 1999) of Nuveen Investments, Inc.; Chief Executive Officer (since 2007) of Nuveen Asset Management, Rittenhouse Asset Management, Nuveen Investments Advisors, Inc. formerly, President (1999-2004) of Nuveen Advisory Corp. and Nuveen Institutional Advisory Corp. | 186 | ||||
Name, Birthdate and Address | Position(s) Held with the Funds | Year First Elected or Appointed (4) | Principal Occupation(s) During Past 5 Years | Number of Portfolios in Fund Complex Overseen by Officer | ||||
| Officers of the Funds: | ||||||||
Gifford R. Zimmerman 9/9/56 333 W. Wacker Drive Chicago, IL 60606 | Chief Administrative Officer | 1988 | Managing Director (since 2002), Assistant Secretary and Associate General Counsel, formerly, Vice President and Assistant General Counsel, of Nuveen Investments, LLC; Managing Director (since 2002), Associate General Counsel and Assistant Secretary, of Nuveen Asset Management; Vice President and Assistant Secretary of NWQ Investment Management Company, LLC. (since 2002), Nuveen Investments Advisers Inc. (since 2002), Symphony Asset Management LLC, and NWQ Investment Management Company, LLC (since 2003), Tradewinds Global Investors, LLC, and Santa Barbara Asset Management, LLC (since 2006), Nuveen HydePark Group LLC and Richards & Tierney, Inc. (since 2007); Managing Director, Associate General Counsel and Assistant Secretary of Rittenhouse Asset Management, Inc. (since 2003); Managing Director (since 2004) and Assistant Secretary (since 1994) of Nuveen Investments, Inc.; formerly, Managing Director (2002-2004), General Counsel (1998-2004) and Assistant Secretary of Nuveen Advisory Corp. and Nuveen Institutional Advisory Corp. (5); Chartered Financial Analyst. | 186 | ||||
Michael T. Atkinson 2/3/66 333 W. Wacker Drive Chicago, IL 60606 | Vice President and Assistant Secretary | 2000 | Vice President (since 2002) of Nuveen Investments, LLC. | 186 | ||||
Alan A. Brown 8/1/62 333 W. Wacker Drive Chicago, IL 60606 | Vice President | 2007 | Executive Vice President, Mutual Funds, Nuveen Investments, LLC, (since 2005), previously, Managing Director and Chief Marketing Officer (2001-2005). | 66 | ||||
57
Trustees and Officers (continued)
Name, Birthdate and Address | Position(s) Held with the Funds | Year First Elected or Appointed (4) | Principal Occupation(s) Including other Directorships During Past 5 Years | Number of Portfolios in Fund Complex Overseen by Officer | ||||
Lorna C. Ferguson 10/24/45 333 W. Wacker Drive Chicago, IL 60606 | Vice President | 1998 | Managing Director (since 2004), formerly, Vice President of Nuveen Investments, LLC, Managing Director (2004) formerly, Vice President (1998-2004) of Nuveen Advisory Corp. and Nuveen Institutional Advisory Corp. (5); Managing Director (since 2005) of Nuveen Asset Management. | 186 | ||||
Stephen D. Foy 5/31/54 333 W. Wacker Drive Chicago, IL 60606 | Vice President and Controller | 1998 | Vice President (since 1993) and Funds Controller (since 1998) of Nuveen Investments, LLC; Vice President (since 2005) of Nuveen Asset Management; formerly, Vice President and Funds Controller (1998-2004) of Nuveen Investments, Inc.; Certified Public Accountant. | 186 | ||||
Walter M. Kelly 2/24/70 333 W. Wacker Drive Chicago, IL 60606 | Chief Compliance Officer and Vice President | 2003 | Senior Vice President (since 2008), Vice President (2006- 2008) formerly, Assistant Vice President and Assistant General Counsel (2003-2006) of Nuveen Investments, LLC; Vice President (since 2006) and Assistant Secretary (since 2003) of Nuveen Asset Management. | 186 | ||||
David J. Lamb 3/22/63 333 W. Wacker Drive Chicago, IL 60606 | Vice President | 2000 | Vice President (since 2000) of Nuveen Investments, LLC; Certified Public Accountant. | 186 | ||||
Tina M. Lazar 8/27/61 333 W. Wacker Drive Chicago, IL 60606 | Vice President | 2002 | Vice President of Nuveen Investments, LLC (since 1999). | 186 | ||||
Larry W. Martin 7/27/51 333 W. Wacker Drive Chicago, IL 60606 | Vice President and Assistant Secretary | 1988 | Vice President, Assistant Secretary and Assistant General Counsel of Nuveen Investments, LLC; formerly, Vice President and Assistant Secretary of Nuveen Advisory Corp. and Nuveen Institutional Advisory Corp. (4); Vice President (since 2005) and Assistant Secretary of Nuveen Investments, Inc.; Vice President (since 2005) and Assistant Secretary (since 1997) of Nuveen Asset Management; Vice President (since 2000), Assistant Secretary and Assistant General Counsel (since 1998) of Rittenhouse Asset Management, Inc.; Vice President and Assistant Secretary of Nuveen Investments Advisers Inc. (since 2002), NWQ Investment Management Company, LLC (since 2002), Symphony Asset Management LLC (since 2003), Tradewinds NWQ Global Investors, LLC, Santa Barbara Asset Management, LLC (since 2006) and of Nuveen HydePark Group, LLC and Richards & Tierney, Inc. (since 2007); formerly, Vice President and Assistant Secretary of Nuveen Advisory Corp. and Nuveen Institutional Advisory Corp. (5) | 186 | ||||
Kevin J. McCarthy 3/26/66 333 W. Wacker Drive Chicago, IL 60606 | Vice President and Secretary | 2007 | Managing Director (since 2008), formerly, Vice President (2007-2008), Nuveen Investments, LLC; Managing Director (since 2008) Vice President and Assistant Secretary (since 2007), Nuveen Asset Management, Rittenhouse Asset Management, Inc., Nuveen Investment Advisers Inc., Nuveen Investment Institutional Services Group LLC, NWQ Investment Management Company, LLC, Tradewinds Global Investors LLC, NWQ Holdings, LLC, Symphony Asset Management LLC, Santa Barbara Asset Management LLC, Nuveen HydePark Group, LLC and Richards & Tierney, Inc, (since 2007); Managing Director (since 2008), Vice President (2007-2008) and Assistant General Counsel, Nuveen Investments, Inc., prior thereto, Partner, Bell, Boyd & Lloyd LLP (1997-2007). | 186 | ||||
58
Name, Birthdate and Address | Position(s) Held with the Funds | Year First Elected or Appointed (4) | Principal Occupation(s) Including other Directorships During Past 5 Years | Number of Portfolios in Fund Complex Overseen by Officer | ||||
John V. Miller 4/10/67 333 W. Wacker Drive Chicago, IL 60606 | Vice President | 2007 | Managing Director (since 2007), formerly, Vice President (2002-2007) of Nuveen Investments, LLC; Chartered Financial Analyst. | 186 | ||||
Christopher M. Rohrbacher 8/1/71 333 W. Wacker Drive Chicago, IL 60606 | Vice President and Assistant Secretary | 2008 | Vice President, Nuveen Investments, LLC (since 2008); Vice President and Assistant Secretary, Nuveen Asset Management (since 2008); Vice President and Assistant General Counsel, Nuveen Investments, Inc. (since 2008); prior thereto, Associate, Skadden, Arps, Slate Meagher & Flom LLP (2002-2008) | 186 | ||||
James F. Ruane 7/3/62 333 W. Wacker Drive Chicago, IL 60606 | Vice President and Assistant Secretary | 2007 | Vice President, Nuveen Investments (since 2007); prior thereto, Partner, Deloitte & Touche USA LLP (since 2005), formerly, senior tax manager (since 2002); Certified Public Accountant. | 186 | ||||
John S. White 5/12/67 333 W. Wacker Drive Chicago, IL 60606 | Vice President | 2007 | Vice President (since 2006) of Nuveen Investments, LLC, formerly, Assistant Vice President (since 2002); Lieutenant Colonel (since 2007), United States Marine Corps Reserve, formerly, Major (since 2001). | 66 | ||||
Mark L. Winget 12/21/68 333 W. Wacker Drive Chicago, IL 60606 | Vice President and Assistant Secretary | 2008 | Vice President, Nuveen Investments, LLC (since 2008); Vice President and Assistant Secretary, Nuveen Asset Management (since 2008); Vice President and Assistant General Counsel, Nuveen Investments Inc. (since 2008); prior thereto, Counsel, VedderPrice P.C. (1997-2007). | 186 | ||||
| (1) | Trustees serve an indefinite term until his/her successor is elected or appointed. The year first elected or appointed represents the year in which the trustee was first elected or appointed to any fund in the Nuveen Fund Complex. |
| (2) | Mr. Amboian and Mr. Toth were appointed to the Board of Trustees of certain Nuveen Funds, effective July 1, 2008. Mr. Amboian and Mr. Toth were subsequently elected to the Board of Trustees of the remainder of the funds in the Nuveen Fund Complex on July 28, 2008. In connection with the appointment of Mr. Amboian as trustee, Timothy R. Schwertfeger, an interested trustee, resigned from the Board of Trustees, effective July 1, 2008. |
| (3) | Mr. Amboian is an interested trustee because of his position with Nuveen Investments, Inc. and certain of its subsidiaries, which are affiliates of the Nuveen Funds. |
| (4) | Officers serve one year terms through July of each year. The year first elected or appointed represents the year in which the officer was first elected or appointed to any fund in the Nuveen Fund Complex. |
| (5) | Nuveen Advisory Corp. and Nuveen Institutional Advisory Corp. were reorganized into Nuveen Asset Management, effective January 1, 2005. |
59
Glossary of Terms Used in this Report
Average Annual Total Return: This is a commonly used method to express an investment’s performance over a particular, usually multi-year time period. It expresses the return that would have been necessary each year to equal the investment’s actual cumulative performance (including change in NAV or offer price and reinvested dividends and capital gains distributions, if any) over the time period being considered.
Net Asset Value (NAV): A Fund’s NAV is the dollar value of one share in the Fund. It is calculated by subtracting the liabilities of the Fund from its total assets and then dividing the remainder by the number of shares outstanding. Fund NAVs are calculated at the end of each business day.
60
Fund Information
Fund Manager Nuveen Asset Management 333 West Wacker Drive Chicago, IL 60606
Sub-Advisers Nuveen HydePark Group, LLC 111 West Jackson Blvd. Suite 1411 Chicago, IL 60604 | Legal Counsel Chapman and Cutler LLP Chicago, IL
Independent Registered Public Accounting Firm PricewaterhouseCoopers LLP Chicago, IL
Custodian State Street Bank & Trust Company Boston, MA | Transfer Agent and Shareholder Services Boston Financial Data Services
Nuveen Investor Services P.O. Box 8530 Boston, MA 02266-8530 (800) 257-8787 | ||
Distribution Information: Enhanced Core Equity and Enhanced Mid-Cap hereby designate 67.35% and 74.66%, respectively, of dividends paid from net ordinary income as dividends qualifying for the 70% dividends received deduction for corporations and 100%, and 100%, respectively, as qualified dividend income for individuals under Section 1 (h)(11) of the Internal Revenue Code. The actual qualified dividend income distributions will be reported to shareholders on Form 1099-DIV which will be sent to shareholders shortly after calendar year end.
Nuveen Funds’ Quarterly Portfolio of Investments and Proxy Voting Information: You may obtain (i) each Fund’s quarterly portfolio of investments, (ii) information regarding how the Funds voted proxies relating to portfolio securities held during the most recent twelve-month period ended June 30, 2008, and (iii) a description of the policies and procedures that the Funds used to determine how to vote proxies relating to portfolio securities without charge, upon request, by calling Nuveen Investments at (800) 257-8787 or on Nuveen’s website at www.nuveen.com.
You may also obtain this and other Fund information directly from the Securities and Exchange Commission (“SEC”). The SEC may charge a copying fee for this information. Visit the SEC on-line at http://www.sec.gov or in person at the SEC’s Public Reference Room in Washington, D.C. Call the SEC at (202) 942-8090 for room hours and operation. You may also request fund information by sending an e-mail request to publicinfo@sec.gov or by writing to the SEC’s Public Reference Section at 100 F Street NE, Washington, D.C. 20549.
The Financial Industry Regulatory Authority (FINRA) provides a Public Disclosure Program which supplies certain information regarding the disciplinary history of FINRA members and their associated persons in response to either telephone inquiries at (800) 289-9999 or written inquiries at www.finra.org. Financial Industry Regulatory Authority also provides an investor brochure that includes information describing the Public Disclosure Program.
61
Learn more
about Nuveen Funds at
www.nuveen.com/mf
Nuveen Investments:
SERVING Investors
For GENERATIONS
Since 1898, financial advisors and their clients have relied on Nuveen Investments to provide dependable investment solutions. Over this time, Nuveen Investments has adhered to the belief that the best approach to investing is to apply conservative risk-management principles to help minimize volatility.
Building on this tradition, we today offer a range of high quality equity and fixed-income solutions that can be integral parts of a well-diversified core portfolio. Our clients have come to appreciate this diversity, as well as our continued adherence to proven, long-term investing principles.
We offer many different investing solutions for our clients’ different needs.
Nuveen Investments is a global investment management firm that seeks to help secure the long-term goals of institutions and high net worth investors as well as the consultants and financial advisors who serve them. Nuveen Investments markets its growing range of specialized investment solutions under the high-quality brands of HydePark, NWQ, Nuveen, Rittenhouse, Santa Barbara, Symphony and Tradewinds. In total, the Company managed $152 billion of assets on June 30, 2008.
Find out how we can help you reach your financial goals.
An investor should carefully consider the Fund’s objectives, risks, charges and expenses before investing. For a prospectus containing this and other information about the Fund, please contact your financial advisor or Nuveen Investments at (800) 257-8787. Read the prospectus carefully before you invest or send money.
| • | Share prices |
| • | Fund details |
| • | Daily financial news |
| • | Investor education |
MAN-ENHCM-0608D
NUVEEN INVESTMENTS VALUE FUNDS
Annual Report June 30, 2008 | For investors seeking long-term capital appreciation. | |

Nuveen Investments
Value Funds
Nuveen NWQ Multi-Cap Value Fund
Nuveen NWQ Large-Cap Value Fund
Nuveen NWQ Small/Mid-Cap Value Fund
Nuveen NWQ Small-Cap Value Fund
Nuveen Global Value Fund
(currently known as Nuveen Growth Allocation Fund)
Nuveen Tradewinds Value Opportunities Fund


NOW YOU CAN RECEIVE YOUR
NUVEEN INVESTMENTS FUND REPORTS FASTER.
NO MORE WAITING.
SIGN UP TODAY TO RECEIVE NUVEEN INVESTMENTS FUND INFORMATION BY
E-MAIL.
It only takes a minute to sign up for E-Reports. Once enrolled, you’ll receive an e-mail as soon as your Nuveen Investments Fund information is ready — no more waiting for delivery by regular mail. Just click on the link within the e-mail to see the report, and save it on your computer if your wish.

IT’S FAST, EASY & FREE:
www.investordelivery.com
if you get your Nuveen Investments Fund dividends and statements from your financial advisor or brokerage account.
(Be sure to have the address sheet that accompanied this report handy. You’ll need it to complete the enrollment process.)
OR
www.nuveen.com/accountaccess
if you get your Nuveen Investments Fund dividends and statements directly from Nuveen Investments.

Must be preceded by or accompanied by a prospectus.
NOT FDIC INSURED MAY LOSE VALUE NO BANK GUARANTEE
Dear Fellow Shareholders,
I’d like to use my initial letter to you to accomplish several things. First, I want to report that after fourteen years of service on your Fund’s Board, including the last twelve as chairman, Tim Schwertfeger retired from the Board in June. The Board has elected me to replace him as the chairman, the first time this role has been filled by someone who is not an employee of Nuveen Investments. Electing an independent chairman marks a significant milestone in the management of your Fund, and it aligns us with what is now considered a “best practice” in the fund industry. Further, it demonstrates the independence with which your Board has always acted on your behalf.
Following Tim will not be easy. During my eleven previous years on the Nuveen Fund Board, I found that Tim always set a very high standard by combining insightful industry and market knowledge and sound, clear judgment. While the Board will miss his wise counsel, I am certain we will retain the primary commitment Tim shared with all of us – an unceasing dedication to creating and retaining value for Nuveen Fund shareholders. This focus on value over time is a touchstone that I and all the other Board members will continue to use when making decisions on your behalf.
Second, I also want to report that we are very fortunate to be welcoming two new Board members to our team. John Amboian, the current chairman and CEO of Nuveen Investments, has agreed to replace Tim as Nuveen’s representative on the Board. John’s presence will allow the independent Board members to benefit not only from his leadership role at Nuveen but also his broad understanding of the fund industry and Nuveen’s role within it. We also are adding Terry Toth as an independent director. A former CEO of the Northern Trust Company’s asset management group, Terry will bring extensive experience in the fund industry to our deliberations.
Finally, I urge you to take the time to review the Portfolio Managers’ Comments and Fund Spotlight sections of this report. All of us are grateful that you have chosen Nuveen Investments as a partner as you pursue your financial goals, and, on behalf of myself and the other members of your Fund’s Board, let me say we look forward to continuing to earn your trust in the months and years ahead.
Sincerely,

Robert P. Bremner
Chairman of the Board
August 22, 2008

Robert P. Bremner
Chairman of the Board
Annual Report Page 1
Portfolio Managers’ Comments
The Nuveen NWQ Multi-Cap Value Fund, Nuveen NWQ Large-Cap Value Fund, Nuveen NWQ Small/Mid-Cap Value Fund, Nuveen NWQ Small-Cap Value Fund and the domestic portion of the Nuveen Global Value Fund feature equity management by NWQ Investment Management Company, LLC (NWQ). The Nuveen Tradewinds Value Opportunities Fund and the international portion of the Nuveen Global Value Fund feature portfolio management by Tradewinds Global Investors, LLC (Tradewinds). Both are affiliates of Nuveen Investments, Inc. In the following discussion, NWQ portfolio managers Jon Bosse, Phyllis Thomas, Gregg Tenser and Mark Morris and Tradewinds portfolio managers Paul Hechmer and Dave Iben discuss key investment strategies and the performance of the Funds. Jon Bosse is the Chief Investment Officer of NWQ and manages the Nuveen NWQ Multi-Cap Value and Nuveen NWQ Large-Cap Value Fund, Phyllis Thomas manages the Nuveen NWQ Small-Cap Value and Nuveen NWQ Small/Mid-Cap Value Fund and Gregg Tenser along with Mark Morris co-manage the domestic portion of the Nuveen Global Value Fund. Paul Hechmer manages the international portion of the Nuveen Global Value Fund, while Dave Iben, Chief Investment Officer of Tradewinds, is the portfolio manager for the Nuveen Tradewinds Value Opportunities Fund.
Effective October 29, 2007, the name of the Nuveen NWQ Global Value Fund changed to Nuveen Global Value Fund. After the end of the reporting period, effective August 1, 2008, based on the determination of the Nuveen Global Value Fund’s Board of Trustees and a shareholder vote, the Fund’s sub-adviser and primary investment object were changed. Richards & Tierney, Inc. was appointed the Fund’s sub-adviser and the new investment objective is to provide attractive long-term total return with a growth risk profile. The Fund also changed its name from the Nuveen Global Value Fund to the Nuveen Growth Allocation Fund.
What were the general market conditions during this reporting period?
The U.S. equity markets experienced significant turbulence during the reporting period as deterioration in the housing market, and subsequent rise in defaults within the sub-prime mortgage industry, contributed to a crisis in the capital markets. Most financial institutions were negatively impacted as the market for mortgage-related securities essentially shut-down in late July 2007, forcing firms that held these securities to take large write-offs/provisions over the past year. Liquidity in the capital markets has become extremely constrained as many financial institutions are reluctant to lend, and investors are unwilling to make a bid for debt securities. These actions forced some firms in need of capital out-of-business, most notably was Bear Stearns in March 2008. Many leading financial institutions were able to raise additional capital (often from sovereign funds) in an effort to shore up their balance sheet, which diluted existing shareholders.
While equities staged a small recovery during a rally from late-March through May 2008, they declined significantly in June as evidence emerged indicating that economic weakness was broadening as consumers were experiencing significant financial strain. Corporate profits were also being squeezed by higher input prices, namely energy and other raw materials. Understandably, weak consumer demand, combined with rising prices, has raised fears of stagflation. For the period, growth stocks outperformed value stocks across all capitalizations.
How did the Funds perform during the twelve months ended June 30, 2008?
The table on page three provides performance information for the six Funds (Class A shares at net asset value) for the one-year, five-year, ten-year and since inception periods ended June 30, 2008. The table also compares the Funds’ performance to appropriate benchmarks. A more detailed account of each Fund’s relative performance is provided later in this report.
What strategies were used to manage the Funds during the reporting period? How did these strategies influence performance?
Nuveen NWQ Multi-Cap Value Fund
Class A shares at net asset value for the Nuveen NWQ Multi-Cap Value Fund underperformed
Discussions of specific investments are for illustration only and are not intended as recommendations of individual investments. The views expressed herein represent those of the portfolio managers as of the date of this report and are subject to change at any time, based on market conditions and other factors. The Funds disclaim any obligation to advise shareholders of such changes.
Annual Report Page 2
Class A Shares
Average Annual Total Returns as of 6/30/08
| 1-Year | 5-Year | 10-Year | Since Inception1 | |||||
Nuveen NWQ Multi-Cap Value Fund | ||||||||
A Shares at NAV | -25.65% | 8.15% | 8.45% | 9.07% | ||||
A Shares at Offer | -29.94% | 6.88% | 7.81% | 8.47% | ||||
Lipper Multi-Cap Value Funds Index2 | -19.23% | 7.64% | 4.47% | 5.33% | ||||
Russell 3000 Value Index3 | -19.02% | 8.99% | 5.07% | 6.15% | ||||
S&P 500 Index3 | -13.12% | 7.58% | 2.88% | 4.49% | ||||
Nuveen NWQ Large-Cap Value Fund | ||||||||
A Shares at NAV | -18.24% | NA | NA | -8.35% | ||||
A Shares at Offer | -22.93% | NA | NA | -11.80% | ||||
Lipper Multi-Cap Value Funds Index2 | -19.23% | NA | NA | -9.40% | ||||
Russell 1000 Value Index3 | -18.78% | NA | NA | -9.17% | ||||
Nuveen NWQ Small/Mid-Cap Value Fund | ||||||||
A Shares at NAV | -20.02% | NA | NA | -9.68% | ||||
A Shares at Offer | -24.60% | NA | NA | -13.08% | ||||
Lipper Small-Cap Value Funds Index2 | -19.38% | NA | NA | -8.46% | ||||
Russell 2500 Value Index3 | -19.91% | NA | NA | -10.18% | ||||
Nuveen NWQ Small-Cap Value Fund | ||||||||
A Shares at NAV | -20.41% | NA | NA | 5.82% | ||||
A Shares at Offer | -25.00% | NA | NA | 4.08% | ||||
Lipper Small-Cap Value Funds Index2 | -19.38% | NA | NA | 3.81% | ||||
Russell 2000 Value Index3 | -21.63% | NA | NA | 2.40% | ||||
Nuveen Global Value Fund | ||||||||
A Shares at NAV | -9.84% | NA | NA | 7.76% | ||||
A Shares at Offer | -15.03% | NA | NA | 5.98% | ||||
Lipper Global Multi-Cap Core Funds Index2 | -10.37% | NA | NA | 8.19% | ||||
MSCI World Value Index3 | -18.01% | NA | NA | 5.76% | ||||
MSCI World Index3 | -9.27% | NA | NA | 9.62% | ||||
Nuveen Tradewinds Value Opportunities Fund | ||||||||
A Shares at NAV | -2.65% | NA | NA | 14.75% | ||||
A Shares at Offer | -8.24% | NA | NA | 12.86% | ||||
Lipper Mid-Cap Core Funds Index2 | -10.95% | NA | NA | 6.93% | ||||
Russell 2500 Value Index3 | -19.91% | NA | NA | 3.75% | ||||
Russell 3000 Value Index3 | -19.02% | NA | NA | 4.09% | ||||
Effective December 6, 2002, based on shareholder approval, the Nuveen NWQ Multi-Cap Value Fund acquired the assets and performance history of the PBHG Special Equity Fund. The Fund had no assets prior to the acquisition. In addition, on December 14, 2001, the PBHG Special Equity Fund acquired the assets of the NWQ Special Equity Portfolio. The information presented for the Nuveen NWQ Multi-Cap Value Fund prior to the acquisition date represents the expense adjusted performance of the predecessor funds.
On March 1, 2006, Tradewinds NWQ Global Investors, LLC assumed all of the sub-advisory responsibilities for the Nuveen NWQ Value Opportunities Fund and the international portion of the Nuveen NWQ Global Value Fund. Effective June 30, 2006, the name of the Nuveen NWQ Value Opportunities Fund changed to Nuveen Tradewinds Value Opportunities Fund. There have been no changes in the Funds’ portfolio management personnel, investment objectives, policies, or day-to-day portfolio management practices.
Returns quoted represent past performance, which is no guarantee of future results. Returns at NAV would be lower if the sales charge were included. Current performance may be higher or lower than the performance shown. Investment returns and principal value will fluctuate so that when shares are redeemed, they may be worth more or less than their original cost. Class A shares have a 5.75% maximum sales charge. Returns do not reflect the deduction of taxes that a shareholder would pay on Fund distributions or the redemption of shares. Returns reflect a voluntary expense limitation by the Funds’ investment adviser that may be modified or discontinued at any time without notice. For the most recent month-end performance, visit www.nuveen.com or call (800) 257-8787.
Please see each Fund’s Spotlight Page later in this report for more complete performance data and expense ratios.
| 1 | The since-inception return for the Nuveen NWQ Multi-Cap Value Fund is calculated from 11/4/97, the Nuveen NWQ Large-Cap Value Fund and the Nuveen NWQ Small/Mid-Cap Value Fund are from 12/15/06 and the since-inception returns for all the remaining Funds are from 12/9/04. |
| 2 | The Lipper Funds Indexes are managed indexes that represent the average annualized returns of the 30 largest funds in each respective Lipper Funds category. The since inception return for the Lipper Multi-Cap Value Funds Index for the Nuveen NWQ Multi-Cap Value Fund represent returns for the period 11/30/97-6/30/08 as returns for that time period are only available on a calendar month basis. The returns assume reinvestment of dividends, but do not reflect any applicable sales charges. You cannot invest directly in an index. |
| 3 | The Russell 3000 Value Index is a market-capitalization weighted index of those firms in the Russell 3000 Index with lower price-to-book ratios and lower forecasted growth values. The stocks in this index are also members of either the Russell 1000 Value or the Russell 2000 Value Indexes. The S&P 500 Index is an unmanaged index generally considered to be representative of the U.S. stock market. The Russell 1000 Value Index is a market-capitalization weighted index of those firms in the Russell 1000 Index with lower price-to-book ratios and lower forecasted growth values. The Russell 2000 Value Index measures the performance of those Russell 2000 companies with lower price-to-book ratios and lower forecasted growth values. The Russell 2500 Value Index measures the performance of those Russell 2500 companies with lower price-to-book ratios and lower forecasted growth values. The MSCI World Value Index is an index considered representative of value stocks of developed countries. The MSCI World Index is composed of companies representative of the market structure of 22 developed market countries in North America, Europe, and the Asia/Pacific Region. The index returns assume reinvestment of dividends and do not reflect any applicable sales charges. You cannot invest directly in an index. |
Annual Report Page 3
each of its comparative indexes for the twelve month period ended June 30, 2008.
In 2007 we had a cautious view of the housing and sub-prime lending sectors. As a result we did not have significant investments in homebuilders or sub-prime focused mortgage lenders. However, we did maintain investments in a number of mortgage-related companies which we believed could navigate the housing down cycle and improve their franchise value as the market inevitably consolidated. The companies we were invested in operated reasonably well for the first five to six months of 2007 even as sub-prime companies were experiencing severe difficulties. When the credit problems evolved into a liquidity crisis in late July, however, our mortgage finance investments declined significantly as fear and panic took over the markets. As a consequence, traditional measures of downside protection became irrelevant as industry leading firms traded below book value.
We continued to maintain a meaningful position in the financial sector, although we were underweight relative to the benchmark. We were active in the area, but did not significantly alter our sector weight and our exposure remained diversified within the sector. We established a small position in American International Group when the company raised capital in May. At the end of March, we eliminated Federal Home Loan Mortgage Corporation (Freddie Mac) as we did not believe the stock price fully reflected the ongoing deterioration in the housing market. In June, we eliminated IndyMac Bancorp from the Fund. We had hoped the company would be able to raise capital, either through equity issuance or by selling certain assets such as its reverse mortgage business. However, as it became more evident that the company’s options for raising capital were diminished, we eliminated the position. Our holdings of American International, Freddie Mac and IndyMac all detracted from the Fund’s performance over this period.
Despite the generally unfavorable environment, the Fund held several positions that performed very well, particularly in the energy, metal, and defense sectors as investors sought safe-haven, hard assets, and basic material stocks during a period of increased volatility. Crude prices surged to all time highs, surpassing $140 per barrel, as emerging market economies consumed more oil and OPEC member countries managed volumes to maximize revenues. Hess Corp. was a particular highlight in the Fund. The shares appreciated as investors recognized that the company’s vastly improved exploration program had the potential to significantly add to future organic growth. Most notable is their stake in Brazil’s deepwater Santos Basin. Our other exploration and production investments, including Apache Corp., Noble Energy Inc., and Warren Resources Inc., also contributed gains, given the forecast for future production growth and the bullish environment for crude and natural gas prices. We eliminated our position in Southwestern Energy Co. during the period following a strong gain in the stock price that made the risk/reward tradeoff less attractive. In addition, we trimmed positions in other energy companies, including Apache Corp. and Noble Energy based on valuation.
Gold prices rose to new highs, ignited by a declining dollar and renewed inflation fears brought on by the Federal Reserve lowering short-term interest rates. Our investment in Barrick Gold Corp. – the world’s largest gold producer – benefited from the sharp rise in gold prices as its shares reached new highs before settling back during the market’s sell-off in the spring. Barrick has a largely un-hedged gold position, a disciplined management team, and boasts the best cost controls in the industry. In March, we initiated a new position in AngloGold Ashanti Ltd. Over the past three years, while the price of gold has approximately doubled, most gold stocks appreciated significantly. South African gold mining companies, particularly AngloGold, did not participate in this appreciation and this holding detracted from Fund performance for the period we held it. New management appears focused on the reasons for AngloGold’s underperformance and has implemented changes to improve operations,
Annual Report Page 4
including taking aggressive actions to reduce their hedge book. Also in the metals category, shares of U.S. Steel Corp. gained due to very strong operating fundamentals as well as ongoing speculation of a takeover offer for the company. We eliminated our position in Korean steelmaker, POSCO, late in 2007.
Lockheed Martin Corp. and Raytheon Co. outperformed as military contractors are generally insulated from the more economically sensitive consumer and debt markets. Government defense policies, not the broader economy, tend to have more of an influence on top line growth of these firms. The fundamentals of our defense holdings continued to be healthy with both companies generating superior operating returns, and exercising strong discipline thus far in returning capital to shareholders.
As mentioned previously, liquidity problems in the credit markets, combined with further asset write-downs and credit quality problems, led to the significant underperformance of financial stocks. Our financial holdings were no exception as the environment made predicting a “bottom” in the sector extremely difficult. Even financial firms that were strongly capitalized and which we believed had the staying power to not only survive, but prosper over time, sold at compelling valuations. Notwithstanding the fact that many financial companies do face real challenges, particularly for companies that have any exposure to the mortgage market, we believed that stock prices in the financial sector were excessively punished, and this hurt the overall performance of the Fund.
The Fund’s investments in telecommunications/media stocks also adversely impaced performance. Sprint Nextel Corp. continued to have numerous operational challenges, including a secular decline in its iDEN (push-to-talk) business and declining revenues due to lost market share. As of the period end, we believed the stock was trading at a discount to the estimated value of its individual businesses. Moreover, the company recently put in place new management which should be a positive for business fundamentals. Therefore, given these elements, the stock remained attractive at these levels, in our opinion. Comcast Corporation’s stock price declined due to a secular slowdown in the growth of broadband, increased competitive pressures, and concerns about rising capital expenditures. We think free cash flows should improve, however, due to higher revenue from their high-speed data and VoIP businesses, and our expectation that capital spending will decline. We reduced our position in Comcast Corp. early in 2008 prior to its price decline.
Our investment in Motorola Inc. also underperformed as concerns over their cellular handset division led to a stock price that had difficulty showing any kind of downside support. This is despite $4 billion of net cash on the balance sheet, and other divisions that are performing very well. The handset business continued to lose money coming off a product cycle where they lost market share to their competitors. While the handset division struggled, these losses were being offset by free cash flows generated by their more profitable enterprise and home & network operations. At period end, we believed Motorola still represented a compelling investment opportunity.
Nuveen NWQ Large-Cap Value Fund
Class A shares at net asset value for the Nuveen NWQ Large-Cap Value Fund outperformed each of its comparative indexes for the twelve month period ended June 30, 2008.
During the reporting period, we maintained a similar market outlook and evaluation process in the management of both the Nuveen NWQ Multi-Cap Value and Nuveen NWQ Large-Cap Value Funds. As a result, there were a number of securities held by both Funds that had a significant impact on each Fund’s performance. Due to this, many of the same holdings are discussed in the commentaries of each Fund. In some cases, the timing of the position’s acquisition or sale, or the relative size of the position may have been different between the two Funds. This, and the impact of certain holdings like IndyMac that were only in
Annual Report Page 5
one Fund, account for most of the performance difference between these two Funds over this period.
In 2007 we had a cautious view of the housing and sub-prime lending sectors. As a result we did not have significant investments in homebuilders or sub-prime focused mortgage lenders. However, we did maintain investments in a number of mortgage-related companies which we believed could navigate the housing down cycle and improve their franchise value as the market inevitably consolidated. The companies we were invested in operated reasonably well for the first five to six months of 2007 even as sub-prime companies were experiencing severe difficulties. When the credit problems evolved into a liquidity crisis in late July, however, our mortgage finance investments declined significantly as fear and panic took over the markets. As a consequence, traditional measures of downside protection became irrelevant as industry leading firms traded below book value.
We continued to maintain a meaningful position in the financial sector, although we were underweight relative to the benchmark. We were active in the area, but did not significantly alter our sector weight and our exposure remained diversified within the sector. We established a small position in American International Group when the company raised capital in May. At the end of March, we eliminated Federal Home Loan Mortgage Corporation (Freddie Mac) as we did not believe the stock price fully reflected the ongoing deterioration in the housing market. Our holdings of American International Group and Freddie Mac detracted from the Fund’s performance over this period.
Despite the generally unfavorable environment, the Fund held several positions that performed very well, particularly in the energy, metal, and defense sectors as investors sought safe-haven, hard assets, and basic material stocks during a period of increased volatility. Crude prices surged to all time highs, surpassing $140 per barrel, as emerging market economies consumed more oil and OPEC member countries managed volumes to maximize revenues. Hess Corp. was a particular highlight in the Fund. The shares appreciated as investors recognized that the company’s vastly improved exploration program had the potential to significantly add to future organic growth. Most notable is their stake in Brazil’s deepwater Santos Basin. Our other exploration and production investments, including Apache Corp. and Noble Energy Inc. also contributed gains, given the forecast for future production growth and the bullish environment for crude and natural gas prices. In addition, we trimmed positions in other energy companies, including Apache Corp. and Noble Energy based on valuation.
Gold prices rose to new highs, ignited by a declining dollar and renewed inflation fears brought on by the Federal Reserve lowering short-term interest rates. Our investment in Barrick Gold Corp., the world’s largest gold producer, benefited from the sharp rise in gold prices as its shares reached new highs before settling back during the market’s sell-off in the spring. Barrick has a largely un-hedged gold position, a disciplined management team, and boasts the best cost controls in the industry. In March, we initiated a new position in AngloGold Ashanti Ltd. Over the past three years, while the price of gold has approximately doubled, most gold stocks appreciated significantly. South African gold mining companies, particularly AngloGold, did not participate in this appreciation and this holding detracted from Fund performance for the period we held it. New management appears focused on the reasons for AngloGold’s underperformance and has implemented changes to improve operations, including taking aggressive actions to reduce their hedge book. Also in the metals category, shares of U.S. Steel Corp. gained due to very strong operating fundamentals as well as ongoing speculation of a takeover offer for the company.
Lockheed Martin Corp. and Raytheon Co. outperformed as military contractors are generally insulated from the more economically sensitive consumer and debt markets. Government defense policies, not the broader economy, tend to have
Annual Report Page 6
more of an influence on top line growth of these firms. The fundamentals of our defense holdings continued to be healthy with both companies generating superior operating returns, and exercising strong discipline thus far in returning capital to shareholders.
As previously mentioned, liquidity problems in the credit markets, combined with further asset write-downs and credit quality problems, led to the significant underperformance of financial stocks. Our financial holdings were no exception as the environment made predicting a “bottom” in the sector extremely difficult. Even financial firms that were strongly capitalized and which we believed had the staying power to not only survive, but prosper over time, sold at compelling valuations. Notwithstanding the fact that many financial companies do face real challenges, particularly for companies that have any exposure to the mortgage market, we believed that stock prices in the financial sector were excessively punished, and this hurt the overall performance of the Fund.
The Fund’s investments in telecommunications and media stocks also adversely impacted performance. Sprint Nextel Corp. continued to have numerous operational challenges, including a secular decline in its iDEN (push-to-talk) business and declining revenues due to lost market share. As of the period end, we believed the stock was trading at a discount to the estimated value of its individual businesses. Moreover, the company recently put in place new management which should be a positive for business fundamentals. Therefore, given these elements, the stock remained attractive at these levels, in our opinion. Comcast Corporation’s stock price declined due to a secular slowdown in the growth of broadband, increased competitive pressures, and concerns about rising capital expenditures. We think free cash flows should improve, however, due to higher revenue from their high-speed data and VoIP businesses, and our expectation that capital spending will decline. We reduced our position in Comcast Corp. early in 2008 prior to its price decline.
Our investment in Motorola Inc. also underperformed as concerns over their cellular handset division led to a stock price that had difficulty showing any kind of downside support. This is despite $4 billion of net cash on the balance sheet, and other divisions that are performing very well. The handset business continued to lose money coming off a product cycle where they lost market share to their competitors. While the handset division struggled, these losses were being offset by free cash flows generated by their more profitable enterprise and home & network operations. At period end, we believed Motorola still represented a compelling investment opportunity.
Nuveen NWQ Small/Mid-Cap Value Fund
Class A shares at net asset value for the Nuveen NWQ Small/Mid-Cap Value Fund underperformed each of its comparative indexes for the one year period ended June 30, 2008. These returns reflected company specific issues across several different industries.
Shares of AbitibiBowater Inc., the Fund’s top detractor, decreased reflecting the sharp appreciation of the Canadian dollar and the rise in energy costs. North American newsprint demand has decreased by double digits. However, global demand continues to grow and AbitibiBowater is a low cost producer. Our investment in Newell Rubbermaid Inc. also underperformed as the company has been impacted by cost inflation, especially in resins, which is the company’s single largest component cost. Management plans to exit some consumer-product categories, raise prices, and begin quarterly price adjustments within its resin-intensive businesses. These actions are expected to raise gross margins and increase annual earnings. Oshkosh Truck Corporation is a leading manufacturer and marketer of access equipment, specialty vehicles, and truck bodies for the primary markets of defense, concrete placement, refuse hauling, access equipment and fire and emergency. The company also noted weakness in its international and domestic end-markets and said it would not meet its 2008 fiscal year earnings expectations and that fourth quarter results would
Annual Report Page 7
fall below last year’s. Oshkosh’s stock price declined during the period as the company pre-announced, lowering its previous earnings estimates and noting weakness in its international and domestic end-markets.
The current environment within the credit markets has made predicting a “bottom” in the financial sector extremely difficult. While it is clear that the government will support Fannie Mae and Freddie Mac, banking institutions in general are deleveraging and corporations and individuals are finding credit to be scarce and expensive. The small cap finance stocks are concentrated in smaller community banks which aggressively grew their loan portfolios into credit cards, construction loans, and auto loans as they were pushed out of the residential mortgage markets by the big institutions. Credit quality is just beginning to sharply deteriorate for these loan categories, and we continue to see above average downside risk in smaller cap banks. Although the portfolio was significantly underweight in financials versus the benchmark, stock selection negatively impacted performance during the period. American Home Mortgage and RAIT Financial Trust were among the Fund’s top detractors. We eliminated these positions early in the period.
Record crude prices and strong operating fundamentals contributed to our energy holdings performing well during the period. An overweight position within the energy sector contributed one of the top performers, Southwestern Energy. Southwestern Energy is primarily focused on the exploration and production of natural gas and crude oil. The company also conducts operations in natural gas extraction, transmission, and marketing. Noble Energy, Inc. also contributed positive returns. We eliminated Southwestern and Noble during the period as the stocks had achieved strong price appreciation and, in our opinion, full valuation. St. Mary Land and Exploration Company is involved in the exploration, development, and acquisition of gas and oil in five core areas. The new management team is capital-disciplined and focused on operations. This is a company in transition, with its portfolio of properties in the process of being restructured. The stock has most recently been a beneficiary of encouraging results and positive press about the Haynesville shale play.
Agrium, a retail supplier of agricultural products in North and South America and a wholesale producer of nitrogen, phosphate, and potash, has been a beneficiary of both rising prices and rising demand for its products. We believe Agrium’s stock price reflected full valuation and elected to exit the position. Other notable contributors to performance included Sauer-Danfoss and Acuity Brands.
Nuveen NWQ Small-Cap Value Fund
For the one year period ending June 30, 2008, the Nuveen NWQ Small-Cap Value Fund (Class A shares at NAV) outperformed the Russell 2000 Value Index and underperformed the Lipper Small-Cap Value Funds Index. During the period, larger capitalization stocks outperformed smaller capitalization stocks, and growth stocks out-performed value stocks across all capitalizations. In this very difficult environment for small cap value managers, these returns reflected company specific issues across several different industries.
Shares of AbitibiBowater Inc., the Fund’s top detractor, decreased reflecting the sharp appreciation of the Canadian dollar and the rise in energy costs. North American newsprint demand has decreased by double digits. However, global demand continues to grow and AbitibiBowater is a low cost producer. Griffon Corporation’s stock price declined during the period as the garage door and installation services segments underperformed due to continued weakness in the U.S. housing market and a fall-off in the number of home owners making improvements to their homes. Decreased sales in both segments led to an earnings drop for the company. The stock is trading at a substantial discount to the break up value of the company.
The current environment within the credit markets has made predicting a “bottom” in the financial sector extremely difficult. While it is clear that the
Annual Report Page 8
government will support Fannie Mae and Freddie Mac, banking institutions in general are deleveraging and corporations and individuals are finding credit to be scarce and expensive. The small-cap financial stocks are concentrated in smaller community banks which aggressively grew their loan portfolios into credit cards, construction loans, and auto loans as they were pushed out of the residential mortgage markets by the big institutions. Credit quality is just beginning to sharply deteriorate for these loan categories, and we continue to see above average downside risk in smaller cap banks. Although the portfolio was significantly underweight in financials versus the benchmark, stock selection negatively impacted performance. Alesco Financial Inc. and Franklin Bank were among the portfolio’s top detractors. We eliminated these positions early in the period.
Record crude prices and strong operating fundamentals contributed to our energy holdings performing well during the period. An overweight position within the energy sector contributed the top three performers, Denbury Resources, Approach Resources and Bill Barrett. Denbury Resources is the largest oil and gas operator in Mississippi, owns the largest reserves of carbon dioxide east of the Mississippi River, and holds significant onshore operating acreage. Denbury was the top performing stock during the period and we eliminated our position based on price appreciation. Approach Resources, is a smaller exploration and production energy company with nearly all of its production and reserves in West Texas. Approach has an experienced management team with a track record of adding value to its operations. Bill Barrett, also an exploration and production energy company, primarily concentrated in the Rocky Mountain region, benefited from increasing oil prices as well as positive production guidance. Other notable contributors to performance included Sauer-Danfoss and Acuity Brands.
Nuveen Global Value Fund (currently known as Nuveen Growth Allocation Fund)
The Nuveen Global Value Fund’s Class A shares at net asset value during the twelve month reporting period outperformed the Lipper Global Multi-Cap Core Funds Index and MSCI World Value Index, but underperformed the MSCI World Index. From a sector perspective, energy was the largest contributor to performance; industrials and telecommunications were also notable contributors. Not surprisingly, the financials sector was the largest detractor from performance, with information technology and utilities also among those sectors that also hampered performance.
Financials led many of the market headlines in the media throughout the period, as high-profile bankruptcies, takeovers (or more appropriately, “takeunders”), and bailouts tormented investors. As the markets attempted to digest the seemingly endless barrage of bad news and speculation of further troubles, investors in financials realized they were suffering from years of gorging in the sector. Within the Fund, Fannie Mae and Countrywide Financial, both of which have been eliminated, in addition to CitiGroup, were among the top five detractors from performance.
The energy sector was the largest contributor to outperformance, and also the best performing sector in the benchmark. Three of the four greatest individual contributors to performance came from the energy sector. While there was a lack of company-specific news to account for the good performance of many of these stocks, the moves during the period can be largely explained by the fact that investors began to assign greater value to these companies, due to sharply higher energy prices. Hess Corp was both the best performing stock and the largest contributor within the sector, with Apache Corp and Noble Energy also being significant contributors to performance.
Many of our technology holdings were down during the period, and accordingly, technology was the second largest detractor from performance. Weakness in the handset division at Motorola contributed to the stock continuing to be under
Annual Report Page 9
pressure. Motorola’s current valuation implies a significant negative value for the handset business. However, we believe new management is focused on addressing the challenges within this division and remain positive on the holding. Alcatel-Lucent, the Franco-American telecom equipment maker, also continued to be a laggard, principally over concerns about increased competition and over-capacity in the industry.
Utilities, while a small weight in the Fund, was also one of the larger detractors from performance, with Korea Electric Power being the primary culprit. The sector represents roughly half the weight in the Fund as it does in the benchmark.
Telecommunications, on the other hand, was overweighted in the Fund relative to the benchmark, and one of the larger contributors to performance. Within the sector, Chunghwa Telecom of Taiwan was the best performing holding, after local regulators allowed the company to return additional capital to shareholders. We sold out of the position amid the rise in the stock from the positive news. One of the worst performing holdings in the sector was Telecom Italia. The company’s shares were punished after announcing lower earnings and cash flow for the year, and consequently decreasing its dividend payout.
The materials sector remains a significant overweight relative to the benchmark, but was only a moderate contributor to performance. The top contributing holding in the Fund for the period, however, was Barrick Gold. Barrick, a Canadian gold producer, not surprisingly, benefited from the rally in the price of gold during the last year, as it traded above $1,000 for the first time ever. Newmont Mining Corp., based in the U.S. but with assets and operations throughout the Americas, Africa, Asia, and Australia, was also one of the larger contributors in the sector. The company announced significantly improved results in the first quarter of 2008, and while production was down slightly, the company’s ability to control costs, which have risen significantly in the gold industry in the recent past, was received positively by the market.
Nuveen Tradewinds Value Opportunities Fund
The Nuveen Tradewinds Value Opportunities Fund’s Class A shares at net asset value outperformed all of its benchmarks over the past twelve months ending June 30, 2008. A significant portion of the Fund’s relative out-performance was due to its significant underweight exposure to the financials sector which was the worst performing sector in the benchmark.
The energy sector was the best performing sector for the period, and our coal positions performed particularly well. Peabody Energy and Arch Coal Inc. (during the period we sold our position in Arch Coal), both U.S. coal producers were among the Fund’s top performers. While domestic demand for coal remained relatively stable, supply/demand conditions for the international coal market continued to be very tight from the second half of last year into the first half of this year. The surge in coal demand, especially from the emerging markets of China and India, coupled with weather-related output problems in Australia, has exacerbated the issue. As a result, global coal spot prices increased substantially to record highs. Both Peabody and Arch Coal gained as investors anticipated increased coal exports at these higher prices.
AGCO Corporation, a holding in the producer durables sector, was another top performer. The company manufactures and distributes agricultural equipment and related replacement parts, and has been benefiting from a global boom in the agricultural industry as a result of strong global demand for farm machinery.
During the period, the price of gold reached its highest level in 28 years, reaching over $1,000 an ounce in March 2008. Kinross Gold Corporation, a senior gold producer with operations located largely in North America, Brazil, Chile and Russia was the Fund’s top performing holding. Another top performer was Newmont Mining, one of the world’s largest gold producers, with significant assets or operations in the United States, Australia, Peru, Indonesia, Ghana, Canada, Bolivia, New Zealand and Mexico. Like many gold producers, these companies benefited due to higher gold prices.
Annual Report Page 10
Despite the top performance of Kinross and Newmont, the materials and mining sector, the Fund’s largest sector weighting, was one of the worst performing sectors this period. Apex Silver Mines Limited was the worst detractor in this sector and in the overall portfolio. Apex is a base metal mining company engaged in the exploration and development of silver and other mineral properties in Latin America. The company’s underperformance was due to several factors including the decline in zinc prices as a result of increased global supply. In addition, the company’s production ramp-up was slower than expected due to water salinity problems. Finally, the threat of nationalization after the Bolivian government’s move to nationalize the nation’s oil and gas reserves exacerbated the company’s woes. As a result, investors became increasingly concerned that continued production setbacks and the risk of losing its mining rights could result in liquidity challenges for the firm if it were unable to meet its hedge book commitments. Although the company is facing short term challenges, we are attracted to its large zinc and copper asset base and believe that the long term prospects look promising.
Another large detractor to the Fund’s performance was AbitibiBowater Inc., a producer of newsprint, commercial printing papers, market pulp and wood products. The paper and pulp industry has done poorly due to rising producer costs, oversupply and a poor economic outlook in the U.S. The company’s poor results are due to declining demand for its products and concerns that it would be unable to meet its liquidity needs.
PNM Resources, Inc., a public utility engaged in the generation, transmission and distribution of electricity and natural gas in the western United States was also a poor performer. In early March 2008, its share price dropped to its lowest levels this period after it received an unfavorable ruling by the New Mexico Public Regulation Commission on its request to increase the base rate for its services and a fuel-adjustment clause that would allow it to recover higher fuel and purchased-power costs. We remain attracted to this regional monopoly’s upside potential.
Smithfield Foods, Inc, a hog producer, and pork processor, within the consumer staples sector was also a drag on overall performance. The international segment includes international meat processing operations that produce a variety of fresh and packaged meats products. Its stock’s performance has been hampered by skyrocketing grain prices and concerns regarding the outlook for its balance sheet. During the fiscal year ended April 27, 2008, the company discontinued its beef segment operations, the sale of which is expected to close in September and we expect the proceeds to aid the company’s balance sheet.
Annual Report Page 11
Nuveen NWQ Multi-Cap Value Fund
Growth of an Assumed $10,000 Investment
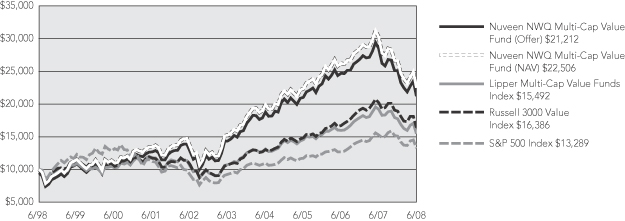
Nuveen NWQ Large-Cap Value Fund
Growth of an Assumed $10,000 Investment
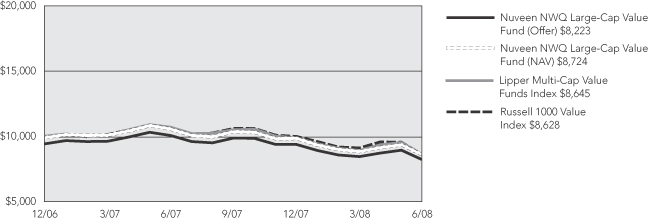
The graphs do not reflect the deduction of taxes that a shareholder may pay on Fund distributions or the redemption of shares.
The index comparisons show the change in value of a $10,000 investment in the Class A shares of the Nuveen Funds compared with the corresponding indexes. The Lipper Multi-Cap Value Funds Index is a managed index that represents the average annualized returns of the 30 largest funds in the Lipper Multi-Cap Value Funds category. The Russell 3000 Value Index is a market-capitalization weighted index of those firms in the Russell 3000 Index with lower price-to-book ratios and lower forecasted growth values. The Russell 3000 Index represents the 3000 largest U.S. companies. The S&P 500 Index is an unmanaged index generally considered to be representative of the U.S. stock market. The Russell 1000 Value Index is a market capitalization-weighted index of those firms in the Russell 1000 Index with lower price-to-book ratios and lower forecasted growth value. The index returns assume reinvestment of dividends and do not reflect any initial or ongoing expenses. You cannot invest directly in an index. The Nuveen Funds’ returns include reinvestment of all dividends and distributions, and the Funds’ returns at the offer price depicted in the chart reflects the initial maximum sales charge applicable to A shares (5.75%) and all ongoing Fund expenses. The performance data quoted represents past performance, which is not indicative of future results. Current performance may be lower or higher than the performance shown.
Annual Report Page 12
Nuveen NWQ Small/Mid-Cap Value Fund
Growth of an Assumed $10,000 Investment
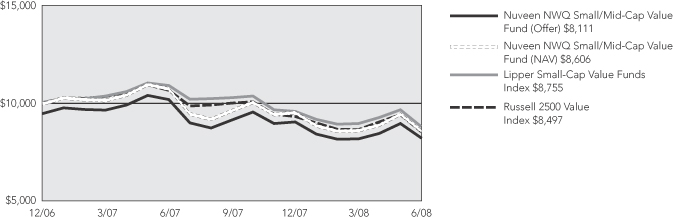
Nuveen NWQ Small-Cap Value Fund
Growth of an Assumed $10,000 Investment
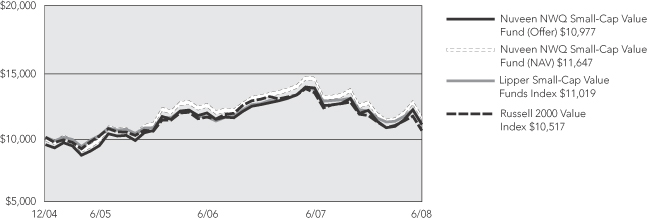
The graphs do not reflect the deduction of taxes that a shareholder may pay on Fund distributions or the redemption of shares.
The index comparisons show the change in value of a $10,000 investment in the Class A shares of the Nuveen Funds compared with the corresponding indexes. The Lipper Small-Cap Value Funds Index is a managed index that represents the average annualized returns of the 30 largest funds in the Lipper Small-Cap Value Funds category. The Russell 2500 Value Index is a market-capitalization weighted index of those firms in the Russell 2500 Index with lower price-to-book ratios and lower forecasted growth values. The Russell 2000 Value Index is a market capitalization-weighted index of those firms in the Russell 2000 Index with lower price-to-book ratios and lower forecasted growth value. The index returns assume reinvestment of dividends and do not reflect any initial or ongoing expenses. You cannot invest directly in an index. The Nuveen Funds’ returns include reinvestment of all dividends and distributions, and the Funds’ returns at the offer price depicted in the chart reflects the initial maximum sales charge applicable to A shares (5.75%) and all ongoing Fund expenses. The performance data quoted represents past performance, which is not indicative of future results. Current performance may be lower or higher than the performance shown.
Annual Report Page 13
Nuveen Global Value Fund (currently known as Nuveen Growth Allocation Fund)
Growth of an Assumed $10,000 Investment
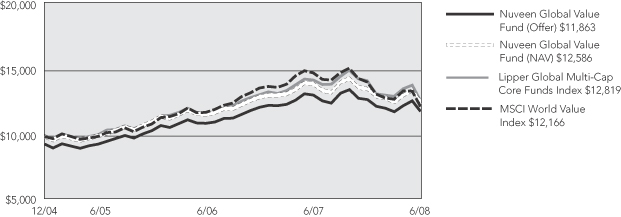
Nuveen Tradewinds Value Opportunities Fund
Growth of an Assumed $10,000 Investment
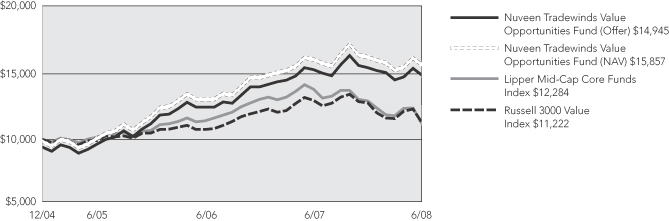
The graphs do not reflect the deduction of taxes that a shareholder may pay on Fund distributions or the redemption of shares.
The index comparisons show the change in value of a $10,000 investment in the Class A shares of the Nuveen Funds compared with the corresponding indexes. The Lipper Global Multi-Cap Core Funds Index is a managed index that represents the average annualized returns of the 30 largest funds in the Lipper Global Multi-Cap Core Funds category. The MSCI World Value Index is a free float-adjusted market capitalization index that is designed to measure global developed market equity performance. The Lipper Mid-Cap Core Funds Index is a managed index that represents the average annualized returns of the 30 largest funds in the Lipper Mid-Cap Core Funds category. The Russell 3000 Value Index represents the 3000 largest U.S. companies. The index returns assume reinvestment of dividends and do not reflect any initial or ongoing expenses. You cannot invest directly in an index. The Nuveen Funds’ returns include reinvestment of all dividends and distributions, and the Funds’ returns at the offer price depicted in the chart reflects the initial maximum sales charge applicable to A shares (5.75%) and all ongoing Fund expenses. The performance data quoted represents past performance, which is not indicative of future results. Current performance may be lower or higher than the performance shown.
Annual Report Page 14
Fund Spotlight as of 6/30/08 Nuveen NWQ Multi-Cap Value Fund
| Quick Facts | ||||||||
| A Shares | B Shares1 | C Shares | I Shares1 | |||||
Fund Symbols | NQVAX | NQVBX | NQVCX | NQVRX | ||||
NAV | $18.54 | $18.10 | $18.10 | $18.50 | ||||
Latest Capital Gain Distribution2 | $0.6054 | $0.6054 | $0.6054 | $0.6054 | ||||
Latest Ordinary Income Distribution3 | $0.4246 | $0.3336 | $0.3336 | $0.4862 | ||||
Inception Date | 12/09/02 | 12/09/02 | 12/09/02 | 11/04/97 |
Effective December 6, 2002, based on shareholder approval, the Nuveen NWQ Multi-Cap Value Fund acquired the assets and performance history of the PBHG Special Equity Fund. The Fund had no assets prior to the acquisition. In addition, on December 14, 2001, the PBHG Special Equity Fund acquired the assets of the NWQ Special Equity Portfolio. The information presented for the Nuveen NWQ Multi-Cap Value Fund prior to the acquisition date represents the expense adjusted performance of the predecessor funds.
Returns quoted represent past performance which is no guarantee of future performance. Returns without sales charges would be lower if the sales charge were included. Current performance may be higher or lower than the performance shown. Investment returns and principal value will fluctuate so that when shares are redeemed, they may be worth more or less than their original cost. Returns do not reflect the deduction of taxes that a shareholder would pay on Fund distributions or the redemption of shares. For the most recent month-end performance visit www.nuveen.com or call (800) 257-8787.
Class I total returns are actual and reflect the performance of the predecessor funds. The returns for Class A, B and C Shares are actual for the period since class inception; returns prior to class inception are Class I Share returns adjusted for differences in sales charges and expenses, which are primarily differences in distribution and service fees. Fund returns assume reinvestment of dividends and capital gains. Class A Shares have a 5.75% maximum sales charge. Class B Shares have a contingent deferred sales charge (CDSC), also known as a back-end sales charge, that for redemptions begins at 5% and declines periodically until after 6 years when the charge becomes 0%. Class B Shares automatically convert to Class A Shares eight years after purchase. Class C Shares have a 1% CDSC for redemptions within less than one year, which is not reflected in the one-year total return. Class I Shares have no sales charge and may be purchased under limited circumstances or by specified classes of investors. Returns may reflect a voluntary expense limitation by the Fund’s investment adviser which may be modified or discontinued at any time without notice.
| Average Annual Total Returns as of 6/30/08 | ||||
| A Shares | NAV | Offer | ||
1-Year | -25.65% | -29.94% | ||
5-Year | 8.15% | 6.88% | ||
10-Year | 8.45% | 7.81% | ||
| B Shares | w/o CDSC | w/CDSC | ||
1-Year | -26.20% | -29.03% | ||
5-Year | 7.34% | 7.19% | ||
10-Year | 7.81% | 7.81% | ||
| C Shares | NAV | |||
1-Year | -26.20% | |||
5-Year | 7.32% | |||
10-Year | 7.64% | |||
| I Shares | NAV | |||
1-Year | -25.47% | |||
5-Year | 8.40% | |||
10-Year | 8.73% | |||
| Top Five Common Stock Holdings4 | ||
CA Inc. | 7.7% | |
Hartford Financial Services Group, Inc. | 5.8% | |
Viacom Inc., Class B | 5.3% | |
Apache Corporation | 4.8% | |
Noble Energy, Inc. | 4.7% | |
Portfolio Allocation4
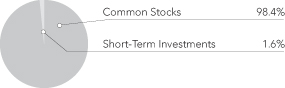
| Portfolio Statistics | ||
Net Assets ($000) | $794,162 | |
Number of Common Stocks | 45 | |
| Expense Ratios | ||||||
| Share Class | Gross Expense Ratios | Net Expense Ratios | As of Date | |||
Class A | 1.24% | 1.24% | 6/30/07 | |||
Class B | 2.00% | 2.00% | 6/30/07 | |||
Class C | 1.99% | 1.99% | 6/30/07 | |||
Class I | 0.99% | 0.99% | 6/30/07 | |||
The expense ratios shown factor in Total Annual Fund Operating Expenses including management fees and other fees and expenses.
| 1 | Effective May 1, 2008, Class B Shares will only be issued upon exchange of Class B Shares from another Nuveen Fund or for purposes of dividend reinvestment. Effective December 31, 2008, the reinvestment privilege for Class B will no longer be available. Effective May 1, 2008, Class R Shares were renamed Class I Shares. See the Fund’s prospectus for more information. |
| 2 | Paid December 17, 2007. |
| 3 | Ordinary income distribution consists of short-term capital gains paid on December 17, 2007, and ordinary income paid on December 31, 2007, if any. |
| 4 | As a percentage of total investments as of June 30, 2008. Holdings are subject to change. |
Annual Report Page 15
Fund Spotlight as of 6/30/08 Nuveen NWQ Multi-Cap Value Fund
Industries1
Oil, Gas & Consumable Fuels | 14.7% | |
Insurance | 12.0% | |
Media | 10.6% | |
Software | 8.8% | |
Metals & Mining | 8.4% | |
Aerospace & Defense | 5.1% | |
Commercial Services & Supplies | 4.4% | |
Tobacco | 4.2% | |
Independent Power Producers & Energy Traders | 3.3% | |
Biotechnology | 3.3% | |
Communications Equipment | 3.2% | |
Thrifts & Mortgage Finance | 2.9% | |
Pharmaceuticals | 2.7% | |
Short-Term Investments | 1.6% | |
Other | 14.8% |
| 1 | As a percentage of total investments as of June 30, 2008. Holdings are subject to change. |
Expense Example (Unaudited)
As a shareholder of the Fund, you incur two types of costs: (1) transaction costs, including front and back end sales charges (loads) or redemption fees, where applicable; and (2) ongoing costs, including management fees; distribution and service (12b-1) fees, where applicable; and other Fund expenses. This Example is intended to help you understand your ongoing costs (in dollars) of investing in the Fund and to compare these costs with the ongoing costs of investing in other mutual funds.
The Example below is based on an investment of $1,000 invested at the beginning of the period and held for the period.
The information under “Actual Performance,” together with the amount you invested, allows you to estimate actual expenses incurred over the reporting period. Simply divide your account value by $1,000 (for example, an $8,600 account value divided by $1,000 = 8.60) and multiply the result by the cost shown for your share class, in the row entitled “Expenses Incurred During Period” to estimate the expenses incurred on your account during this period.
The information under “Hypothetical Performance,” provides information about hypothetical account values and hypothetical expenses based on the Fund’s actual expense ratio and an assumed rate of return of 5% per year before expenses, which is not the Fund’s actual return. The hypothetical account values and expenses may not be used to estimate the actual ending account balance or expense you incurred for the period. You may use this information to compare the ongoing costs of investing in the Fund and other Funds. To do so, compare this 5% hypothetical example with the 5% hypothetical examples that appear in the shareholder reports of the other funds.
Please note that the expenses shown in the table are meant to highlight your ongoing costs only and do not reflect any transactional costs, such as front and back end sales charges (loads) or redemption fees, where applicable. Therefore, the hypothetical information is useful in comparing ongoing costs only, and will not help you determine the relative total costs of owning different funds or share classes. In addition, if these transactional costs were included, your costs would have been higher.
| Actual Performance | Hypothetical Performance (5% return before expenses) | |||||||||||||||||||||||||
| A Shares | B Shares | C Shares | I Shares | A Shares | B Shares | C Shares | I Shares | |||||||||||||||||||
Beginning Account Value (1/01/08) | $ | 1,000.00 | $ | 1,000.00 | $ | 1,000.00 | $ | 1,000.00 | $ | 1,000.00 | $ | 1,000.00 | $ | 1,000.00 | $ | 1,000.00 | ||||||||||
Ending Account Value (6/30/08) | $ | 845.50 | $ | 842.30 | $ | 842.30 | $ | 846.30 | $ | 1,018.00 | $ | 1,014.27 | $ | 1,014.27 | $ | 1,019.24 | ||||||||||
Expenses Incurred During Period | $ | 6.33 | $ | 9.76 | $ | 9.76 | $ | 5.19 | $ | 6.92 | $ | 10.67 | $ | 10.67 | $ | 5.67 | ||||||||||
For each class of the Fund, expenses are equal to the Fund’s annualized expense ratio of 1.38%, 2.13%, 2.13% and 1.13% for Classes A, B, C and I, respectively, multiplied by the average account value over the period, multiplied by 182/366 (to reflect the one-half year period).
Annual Report Page 16
Fund Spotlight as of 6/30/08 Nuveen NWQ Large-Cap Value Fund
| Quick Facts | ||||||||
| A Shares | B Shares1 | C Shares | I Shares1 | |||||
Fund Symbols | NQCAX | NQCBX | NQCCX | NQCRX | ||||
NAV | $17.41 | $17.28 | $17.28 | $17.43 | ||||
Latest Ordinary Income Distribution2 | $0.0807 | $0.0026 | $0.0026 | $0.1326 | ||||
Inception Date | 12/15/06 | 12/15/06 | 12/15/06 | 12/15/06 |
Returns quoted represent past performance which is no guarantee of future performance. Returns without sales charges would be lower if the sales charge were included. Current performance may be higher or lower than the performance shown. Investment returns and principal value will fluctuate so that when shares are redeemed, they may be worth more or less than their original cost. Returns do not reflect the deduction of taxes that a shareholder would pay on Fund distributions or the redemption of shares. For the most recent month-end performance visit www.nuveen.com or call (800) 257-8787.
Fund returns assume reinvestment of dividends and capital gains. Class A Shares have a 5.75% maximum sales charge. Class B Shares have a contingent deferred sales charge (CDSC), also known as a back-end sales charge, that for redemptions begins at 5% and declines periodically until after 6 years when the charge becomes 0%. Class B Shares automatically convert to Class A Shares eight years after purchase. Class C Shares have a 1% CDSC for redemptions within less than one year, which is not reflected in the one-year total return. Class I Shares have no sales charge and may be purchased under limited circumstances or by specified classes of investors. Returns reflect a voluntary expense limitation by the Fund’s investment adviser which may be modified or discontinued at any time without notice.
| Average Annual Total Returns as of 6/30/08 | ||||
| A Shares | NAV | Offer | ||
1-Year | -18.24% | -22.93% | ||
Since Inception | -8.35% | -11.80% | ||
| B Shares | w/o CDSC | w/CDSC | ||
1-Year | -18.82% | -22.06% | ||
Since Inception | -8.99% | -11.37% | ||
| C Shares | NAV | |||
1-Year | -18.82% | |||
Since Inception | -8.99% | |||
| I Shares | NAV | |||
1-Year | -18.05% | |||
Since Inception | -8.13% | |||
| Top Five Common Stock Holdings3 | ||
CA Inc. | 6.4% | |
Viacom Inc., Class B | 4.7% | |
Noble Energy, Inc. | 4.6% | |
Apache Corporation | 4.5% | |
Barrick Gold Corporation | 4.4% |
Portfolio Allocation3
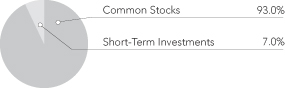
| Portfolio Statistics | ||
Net Assets ($000) | $24,117 | |
Number of Common Stocks | 44 | |
| Expense Ratios | ||||||
| Share Class | Gross Expense Ratios | Net Expense Ratios | As of Date | |||
Class A | 3.12% | 1.26% | 6/30/07 | |||
Class B | 4.68% | 2.01% | 6/30/07 | |||
Class C | 3.83% | 2.01% | 6/30/07 | |||
Class I | 2.65% | 1.01% | 6/30/07 | |||
The expense ratios shown factor in Total Annual Fund Operating Expenses including management fees and other fees and expenses. The Net Expense Ratios reflect a contractual commitment by the Fund’s investment adviser to waive fees and reimburse expenses through October 31, 2010. The Net Expense Ratios also reflect a custodian fee credit whereby certain fees and expenses are reduced by credits earned on the Fund’s cash on deposit with the bank. There is no guarantee that the Fund will earn such credits in the future. Absent the waiver, reimbursement and custodian fee credit, the Net Expense Ratios would be higher and total returns would be less.
| 1 | Effective May 1, 2008, Class B Shares will only be issued upon exchange of Class B Shares from another Nuveen Fund or for purposes of dividend reinvestment. Effective December 31, 2008, the reinvestment privilege for Class B will no longer be available. Effective May 1, 2008, Class R Shares were renamed Class I Shares. See the Fund’s prospectus for more information. |
| 2 | Ordinary income distribution consists of short-term capital gains paid on December 17, 2007, and ordinary income paid on December 31, 2007, if any. |
| 3 | As a percentage of total investments as of June 30, 2008. Holdings are subject to change. |
Annual Report Page 17
Fund Spotlight as of 6/30/08 Nuveen NWQ Large-Cap Value Fund
| Industries1 | ||
Oil, Gas & Consumable Fuels | 12.6% | |
Insurance | 11.2% | |
Software | 9.7% | |
Metals & Mining | 8.7% | |
Media | 6.8% | |
Aerospace & Defense | 5.0% | |
Commercial Services & Supplies | 4.4% | |
Tobacco | 4.1% | |
Communications Equipment | 3.7% | |
Commercial Banks | 3.2% | |
Pharmaceuticals | 2.6% | |
Biotechnology | 2.6% | |
Machinery | 2.4% | |
Diversified Telecommunication Services | 2.2% | |
Short-Term Investments | 7.0% | |
Other | 13.8% | |
| 1 | As a percentage of total investments as of June 30, 2008. Holdings are subject to change. |
Expense Example (Unaudited)
As a shareholder of the Fund, you incur two types of costs: (1) transaction costs, including front and back end sales charges (loads) or redemption fees, where applicable; and (2) ongoing costs, including management fees; distribution and service (12b-1) fees, where applicable; and other Fund expenses. This Example is intended to help you understand your ongoing costs (in dollars) of investing in the Fund and to compare these costs with the ongoing costs of investing in other mutual funds.
The Example below is based on an investment of $1,000 invested at the beginning of the period and held for the period.
The information under “Actual Performance,” together with the amount you invested, allows you to estimate actual expenses incurred over the reporting period. Simply divide your account value by $1,000 (for example, an $8,600 account value divided by $1,000 = 8.60) and multiply the result by the cost shown for your share class, in the row entitled “Expenses Incurred During Period” to estimate the expenses incurred on your account during this period.
The information under “Hypothetical Performance,” provides information about hypothetical account values and hypothetical expenses based on the Fund’s actual expense ratio and an assumed rate of return of 5% per year before expenses, which is not the Fund’s actual return. The hypothetical account values and expenses may not be used to estimate the actual ending account balance or expense you incurred for the period. You may use this information to compare the ongoing costs of investing in the Fund and other Funds. To do so, compare this 5% hypothetical example with the 5% hypothetical examples that appear in the shareholder reports of the other funds.
Please note that the expenses shown in the table are meant to highlight your ongoing costs only and do not reflect any transactional costs, such as front and back end sales charges (loads) or redemption fees, where applicable. Therefore, the hypothetical information is useful in comparing ongoing costs only, and will not help you determine the relative total costs of owning different funds or share classes. In addition, if these transactional costs were included, your costs would have been higher.
| Actual Performance | Hypothetical Performance (5% return before expenses) | |||||||||||||||||||||||||
| A Shares | B Shares | C Shares | I Shares | A Shares | B Shares | C Shares | I Shares | |||||||||||||||||||
Beginning Account Value (1/01/08) | $ | 1,000.00 | $ | 1,000.00 | $ | 1,000.00 | $ | 1,000.00 | $ | 1,000.00 | $ | 1,000.00 | $ | 1,000.00 | $ | 1,000.00 | ||||||||||
Ending Account Value (6/30/08) | $ | 876.20 | $ | 873.20 | $ | 873.20 | $ | 877.20 | $ | 1,018.25 | $ | 1,014.52 | $ | 1,014.47 | $ | 1,019.49 | ||||||||||
Expenses Incurred During Period | $ | 6.20 | $ | 9.69 | $ | 9.73 | $ | 5.04 | $ | 6.67 | $ | 10.42 | $ | 10.47 | $ | 5.42 | ||||||||||
For each class of the Fund, expenses are equal to the Fund’s annualized expense ratio of 1.33%, 2.08%, 2.09% and 1.08% for Classes A, B, C and I, respectively, multiplied by the average account value over the period, multiplied by 182/366 (to reflect the one-half year period).
Annual Report Page 18
Fund Spotlight as of 6/30/08 Nuveen NWQ Small/Mid-Cap Value Fund
| Quick Facts | ||||||||
| A Shares | B Shares1 | C Shares | I Shares1 | |||||
Fund Symbols | NSMAX | NSMBX | NSMCX | NSMRX | ||||
NAV | $17.12 | $16.90 | $16.92 | $17.11 | ||||
Latest Ordinary Income Distribution2 | $0.0023 | $ — | $ — | $0.0523 | ||||
Inception Date | 12/15/06 | 12/15/06 | 12/15/06 | 12/15/06 |
Returns quoted represent past performance which is no guarantee of future performance. Returns without sales charges would be lower if the sales charge were included. Current performance may be higher or lower than the performance shown. Investment returns and principal value will fluctuate so that when shares are redeemed, they may be worth more or less than their original cost. Returns do not reflect the deduction of taxes that a shareholder would pay on Fund distributions or the redemption of shares. For the most recent month-end performance visit www.nuveen.com or call (800) 257-8787.
Fund returns assume reinvestment of dividends and capital gains. Class A Shares have a 5.75% maximum sales charge. Class B Shares have a contingent deferred sales charge (CDSC), also known as a back-end sales charge, that for redemptions begins at 5% and declines periodically until after 6 years when the charge becomes 0%. Class B Shares automatically convert to Class A Shares eight years after purchase. Class C Shares have a 1% CDSC for redemptions within less than one year, which is not reflected in the one-year total return. Class I Shares have no sales charge and may be purchased under limited circumstances or by specified classes of investors. Returns reflect a voluntary expense limitation by the Fund’s investment adviser which may be modified or discontinued at any time without notice.
| Average Annual Total Returns as of 6/30/08 | ||||
| A Shares | NAV | Offer | ||
1-Year | -20.02% | -24.60% | ||
Since Inception | -9.68% | -13.08% | ||
| B Shares | w/o CDSC | w/CDSC | ||
1-Year | -20.62% | -23.80% | ||
Since Inception | -10.34% | -12.68% | ||
| C Shares | NAV | |||
1-Year | -20.63% | |||
Since Inception | -10.37% | |||
| I Shares | NAV | |||
1-Year | -19.82% | |||
Since Inception | -9.42% | |||
| Top Five Common Stock Holdings3 | ||
People’s United Financial, Inc. | 4.2% | |
Hanover Insurance Group Inc. | 4.2% | |
St Mary Land and Exploration Company | 3.8% | |
Domtar Corporation | 3.7% | |
Pacific Sunwear of California, Inc. | 3.6% |
Portfolio Allocation3
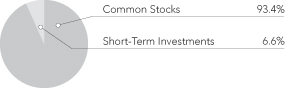
| Portfolio Statistics | ||
Net Assets ($000) | $43,298 | |
Number of Common Stocks | 41 | |
| Expense Ratios | ||||||
| Share Class | Gross Expense Ratios | Net Expense Ratios | As of Date | |||
Class A | 2.54% | 1.41% | 6/30/07 | |||
Class B | 4.09% | 2.17% | 6/30/07 | |||
Class C | 3.22% | 2.16% | 6/30/07 | |||
Class I | 1.49% | 1.15% | 6/30/07 | |||
The expense ratios shown factor in Total Annual Fund Operating Expenses including management fees and other fees and expenses. The Net Expense Ratios reflect a contractual commitment by the Fund’s investment adviser to waive fees and reimburse expenses through October 31, 2010. The Net Expense Ratios also reflect a custodian fee credit whereby certain fees and expenses are reduced by credits earned on the Fund’s cash on deposit with the bank. There is no guarantee that the Fund will earn such credits in the future. Absent the waiver, reimbursement and custodian fee credit, the Net Expense Ratios would be higher and total returns would be less.
| 1 | Effective May 1, 2008, Class B Shares will only be issued upon exchange of Class B Shares from another Nuveen Fund or for purposes of dividend reinvestment. Effective December 31, 2008, the reinvestment privilege for Class B will no longer be available. Effective May 1, 2008, Class R Shares were renamed Class I Shares. See the Fund’s prospectus for more information. |
| 2 | Ordinary income distribution paid on December 31, 2007, if any. |
| 3 | As a percentage of total investments as of June 30, 2008. Holdings are subject to change. |
Annual Report Page 19
Fund Spotlight as of 6/30/08 Nuveen NWQ Small/Mid-Cap Value Fund
| Industries1 | ||
Paper & Forest Products | 12.1% | |
Electronic Equipment & Instruments | 11.1% | |
Metals & Mining | 7.6% | |
Insurance | 7.0% | |
Machinery | 6.4% | |
Containers & Packaging | 4.4% | |
Thrifts & Mortgage Finance | 4.2% | |
Oil, Gas & Consumable Fuels | 3.8% | |
Specialty Retail | 3.6% | |
Multiline Retail | 3.6% | |
Health Care Providers & Services | 3.1% | |
Electrical Equipment | 3.1% | |
Household Durables | 2.9% | |
Electric Utilities | 2.8% | |
Independent Power Producers & Energy Traders | 2.8% | |
Short-Term Investments | 6.6% | |
Other | 14.9% | |
| 1 | As a percentage of total investments as of June 30, 2008. Holdings are subject to change. |
Expense Example (Unaudited)
As a shareholder of the Fund, you incur two types of costs: (1) transaction costs, including front and back end sales charges (loads) or redemption fees, where applicable; and (2) ongoing costs, including management fees; distribution and service (12b-1) fees, where applicable; and other Fund expenses. This Example is intended to help you understand your ongoing costs (in dollars) of investing in the Fund and to compare these costs with the ongoing costs of investing in other mutual funds.
The Example below is based on an investment of $1,000 invested at the beginning of the period and held for the period.
The information under “Actual Performance,” together with the amount you invested, allows you to estimate actual expenses incurred over the reporting period. Simply divide your account value by $1,000 (for example, an $8,600 account value divided by $1,000 = 8.60) and multiply the result by the cost shown for your share class, in the row entitled “Expenses Incurred During Period” to estimate the expenses incurred on your account during this period.
The information under “Hypothetical Performance,” provides information about hypothetical account values and hypothetical expenses based on the Fund’s actual expense ratio and an assumed rate of return of 5% per year before expenses, which is not the Fund’s actual return. The hypothetical account values and expenses may not be used to estimate the actual ending account balance or expense you incurred for the period. You may use this information to compare the ongoing costs of investing in the Fund and other Funds. To do so, compare this 5% hypothetical example with the 5% hypothetical examples that appear in the shareholder reports of the other funds.
Please note that the expenses shown in the table are meant to highlight your ongoing costs only and do not reflect any transactional costs, such as front and back end sales charges (loads) or redemption fees, where applicable. Therefore, the hypothetical information is useful in comparing ongoing costs only, and will not help you determine the relative total costs of owning different funds or share classes. In addition, if these transactional costs were included, your costs would have been higher.
Hypothetical Performance | ||||||||||||||||||||||||||
| Actual Performance | (5% return before expenses) | |||||||||||||||||||||||||
| A Shares | B Shares | C Shares | I Shares | A Shares | B Shares | C Shares | I Shares | |||||||||||||||||||
Beginning Account Value (1/01/08) | $ | 1,000.00 | $ | 1,000.00 | $ | 1,000.00 | $ | 1,000.00 | $ | 1,000.00 | $ | 1,000.00 | $ | 1,000.00 | $ | 1,000.00 | ||||||||||
Ending Account Value (6/30/08) | $ | 900.90 | $ | 898.00 | $ | 897.90 | $ | 902.50 | $ | 1,015.96 | $ | 1,011.88 | $ | 1,011.83 | $ | 1,017.80 | ||||||||||
Expenses Incurred During Period | $ | 8.46 | $ | 12.32 | $ | 12.36 | $ | 6.72 | $ | 8.97 | $ | 13.06 | $ | 13.11 | $ | 7.12 | ||||||||||
For each class of the Fund, expenses are equal to the Fund’s annualized expense ratio of 1.79%, 2.61%, 2.62% and 1.42% for Classes A, B, C and I, respectively, multiplied by the average account value over the period, multiplied by 182/366 (to reflect the one-half year period).
Annual Report Page 20
Fund Spotlight as of 6/30/08 Nuveen NWQ Small-Cap Value Fund
| Quick Facts | ||||||||
| A Shares | B Shares1 | C Shares | I Shares1 | |||||
Fund Symbols | NSCAX | NSCBX | NSCCX | NSCRX | ||||
NAV | $23.29 | $22.80 | $22.83 | $23.34 | ||||
Latest Capital Gain Distribution2 | $0.0890 | $0.0890 | $0.0890 | $0.0890 | ||||
Latest Ordinary Income Distribution3 | $0.6288 | $0.6059 | $0.6059 | $0.6992 | ||||
Inception Date | 12/09/04 | 12/09/04 | 12/09/04 | 12/09/04 |
Returns quoted represent past performance which is no guarantee of future performance. Returns without sales charges would be lower if the sales charge were included. Current performance may be higher or lower than the performance shown. Investment returns and principal value will fluctuate so that when shares are redeemed, they may be worth more or less than their original cost. Returns do not reflect the deduction of taxes that a shareholder would pay on Fund distributions or the redemption of shares. For the most recent month-end performance visit www.nuveen.com or call (800) 257-8787.
Fund returns assume reinvestment of dividends and capital gains, if any. Class A Shares have a 5.75% maximum sales charge. Class B Shares have a contingent deferred sales charge (CDSC), also known as a back-end sales charge, that for redemptions begins at 5% and declines periodically until after 6 years when the charge becomes 0%. Class B Shares automatically convert to Class A Shares eight years after purchase. Class C Shares have a 1% CDSC for redemptions within less than one year, which is not reflected in the one-year total return. Class I Shares have no sales charge and may be purchased under limited circumstances or by specified classes of investors. Returns reflect a voluntary expense limitation by the Fund’s investment adviser which may be modified or discontinued at any time without notice.
| Average Annual Total Returns as of 6/30/08 | ||||
| A Shares | NAV | Offer | ||
1-Year | -20.41% | -25.00% | ||
Since Inception | 5.82% | 4.08% | ||
| B Shares | w/o CDSC | w/CDSC | ||
1-Year | -21.02% | -24.09% | ||
Since Inception | 5.03% | 4.28% | ||
| C Shares | NAV | |||
1-Year | -21.03% | |||
Since Inception | 5.06% | |||
| I Shares | NAV | |||
1-Year | -20.22% | |||
Since Inception | 6.10% | |||
| Top Five Common Stock Holdings4 | ||||
Warren Resources Inc. | 3.9% | |||
WD-40 Company | 3.8% | |||
Sappi Limited, Sponsored ADR | 3.8% | |||
Marten Transport, Ltd. | 3.7% | |||
Pacific Sunwear of California, Inc. | 3.5% | |||
Portfolio Allocation4

| Portfolio Statistics | ||
Net Assets ($000) | $172,385 | |
Number of Common Stocks | 48 | |
| Expense Ratios | ||||||
| Share Class | Gross Expense Ratios | Net Expense Ratios | As of Date | |||
Class A | 1.50% | 1.49% | 6/30/07 | |||
Class B | 2.25% | 2.24% | 6/30/07 | |||
Class C | 2.25% | 2.24% | 6/30/07 | |||
Class I | 1.22% | 1.22% | 6/30/07 | |||
The expense ratios shown factor in Total Annual Fund Operating Expenses including management fees and other fees and expenses. The Net Expense Ratios reflect a contractual commitment by the Fund’s investment adviser to waive fees and reimburse expenses through October 31, 2009. Absent the waiver and reimbursement, the Net Expense Ratios would be higher and total returns would be less.
| 1 | Effective May 1, 2008, Class B Shares will only be issued upon exchange of Class B Shares from another Nuveen Fund or for purposes of dividend reinvestment. Effective December 31, 2008, the reinvestment privilege for Class B will no longer be available. Effective May 1, 2008, Class R Shares were renamed Class I Shares. See the Fund’s prospectus for more information. |
| 2 | Paid December 17, 2007. |
| 3 | Ordinary income distribution consists of short-term capital gains paid on December 17, 2007, and ordinary income paid on December 31, 2007, if any. |
| 4 | As a percentage of total investments as of June 30, 2008. Holdings are subject to change. |
Annual Report Page 21
Fund Spotlight as of 6/30/08 Nuveen NWQ Small-Cap Value Fund
| Industries1 | ||
Paper & Forest Products | 11.8% | |
Machinery | 10.1% | |
Oil, Gas & Consumable Fuels | 10.0% | |
Electronic Equipment & Instruments | 5.3% | |
Electrical Equipment | 5.3% | |
Metals & Mining | 4.4% | |
Insurance | 4.1% | |
Specialty Retail | 3.9% | |
Household Products | 3.8% | |
Road & Rail | 3.7% | |
Health Care Providers & Services | 3.5% | |
Containers & Packaging | 3.4% | |
Multiline Retail | 3.0% | |
Hotels, Restaurants & Leisure | 2.7% | |
Household Durables | 2.7% | |
Short-Term Investments | 7.5% | |
Other | 14.8% |
| 1 | As a percentage of total investments as of June 30, 2008. Holdings are subject to change. |
Expense Example (Unaudited)
As a shareholder of the Fund, you incur two types of costs: (1) transaction costs, including front and back end sales charges (loads) or redemption fees, where applicable; and (2) ongoing costs, including management fees; distribution and service (12b-1) fees, where applicable; and other Fund expenses. This Example is intended to help you understand your ongoing costs (in dollars) of investing in the Fund and to compare these costs with the ongoing costs of investing in other mutual funds.
The Example below is based on an investment of $1,000 invested at the beginning of the period and held for the period.
The information under “Actual Performance,” together with the amount you invested, allows you to estimate actual expenses incurred over the reporting period. Simply divide your account value by $1,000 (for example, an $8,600 account value divided by $1,000 = 8.60) and multiply the result by the cost shown for your share class, in the row entitled “Expenses Incurred During Period” to estimate the expenses incurred on your account during this period.
The information under “Hypothetical Performance,” provides information about hypothetical account values and hypothetical expenses based on the Fund’s actual expense ratio and an assumed rate of return of 5% per year before expenses, which is not the Fund’s actual return. The hypothetical account values and expenses may not be used to estimate the actual ending account balance or expense you incurred for the period. You may use this information to compare the ongoing costs of investing in the Fund and other Funds. To do so, compare this 5% hypothetical example with the 5% hypothetical examples that appear in the shareholder reports of the other funds.
Please note that the expenses shown in the table are meant to highlight your ongoing costs only and do not reflect any transactional costs, such as front and back end sales charges (loads) or redemption fees, where applicable. Therefore, the hypothetical information is useful in comparing ongoing costs only, and will not help you determine the relative total costs of owning different funds or share classes. In addition, if these transactional costs were included, your costs would have been higher.
| Hypothetical Performance | ||||||||||||||||||||||||||
| Actual Performance | (5% return before expenses) | |||||||||||||||||||||||||
| A Shares | B Shares | C Shares | I Shares | A Shares | B Shares | C Shares | I Shares | |||||||||||||||||||
Beginning Account Value (1/01/08) | $ | 1,000.00 | $ | 1,000.00 | $ | 1,000.00 | $ | 1,000.00 | $ | 1,000.00 | $ | 1,000.00 | $ | 1,000.00 | $ | 1,000.00 | ||||||||||
Ending Account Value (6/30/08) | $ | 909.80 | $ | 906.50 | $ | 906.30 | $ | 911.00 | $ | 1,017.55 | $ | 1,013.77 | $ | 1,013.77 | $ | 1,018.80 | ||||||||||
Expenses Incurred During Period | $ | 6.98 | $ | 10.57 | $ | 10.57 | $ | 5.80 | $ | 7.37 | $ | 11.17 | $ | 11.17 | $ | 6.12 | ||||||||||
For each class of the Fund, expenses are equal to the Fund’s annualized expense ratio of 1.47%, 2.23%, 2.23% and 1.22% for Classes A, B, C and I, respectively, multiplied by the average account value over the period, multiplied by 182/366 (to reflect the one-half year period).
Annual Report Page 22
Fund Spotlight as of 6/30/08 Nuveen Global Value Fund
(currently known as Nuveen Growth Allocation Fund)
| Quick Facts | ||||||||
| A Shares | B Shares1 | C Shares | I Shares1 | |||||
Fund Symbols | NGOAX | NGVBX | NGVCX | NGVRX | ||||
NAV | $23.58 | $23.34 | $23.35 | $23.63 | ||||
Latest Capital Gain Distribution2 | $0.5323 | $0.5323 | $0.5323 | $0.5323 | ||||
Latest Ordinary Income Distribution3 | $1.0256 | $0.8228 | $0.8228 | $1.0938 | ||||
Inception Date | 12/09/04 | 12/09/04 | 12/09/04 | 12/09/04 |
Returns quoted represent past performance which is no guarantee of future performance. Returns without sales charges would be lower if the sales charge were included. Current performance may be higher or lower than the performance shown. Investment returns and principal value will fluctuate so that when shares are redeemed, they may be worth more or less than their original cost. Returns do not reflect the deduction of taxes that a shareholder would pay on Fund distributions or the redemption of shares. For the most recent month-end performance visit www.nuveen.com or call (800) 257-8787.
Fund returns assume reinvestment of dividends and capital gains, if any. Class A Shares have a 5.75% maximum sales charge. Class B Shares have a contingent deferred sales charge (CDSC), also known as a back-end sales charge, that for redemptions begins at 5% and declines periodically until after 6 years when the charge becomes 0%. Class B Shares automatically convert to Class A Shares eight years after purchase. Class C Shares have a 1% CDSC for redemptions within less than one year, which is not reflected in the one-year total return. Class I Shares have no sales charge and may be purchased under limited circumstances or by specified classes of investors. Returns reflect a voluntary expense limitation by the Fund’s investment adviser which may be modified or discontinued at any time without notice.
| Average Annual Total Returns as of 6/30/08 | ||||
| A Shares | NAV | Offer | ||
1-Year | -9.84% | -15.03% | ||
Since Inception | 7.76% | 5.98% | ||
| B Shares | w/o CDSC | w/CDSC | ||
1-Year | -10.49% | -13.88% | ||
Since Inception | 6.96% | 6.25% | ||
| C Shares | NAV | |||
1-Year | -10.52% | |||
Since Inception | 6.97% | |||
| I Shares | NAV | |||
1-Year | -9.62% | |||
Since Inception | 8.04% | |||
| Top Five Common Stock Holdings4 | ||
AngloGold Ashanti Limited, Sponsored ADR | 3.0% | |
Nippon Telegraph and Telephone Corporation, Sponsored ADR | 3.0% | |
CA Inc. | 2.6% | |
Barrick Gold Corporation | 2.6% | |
Apache Corporation | 2.4% |
Portfolio Allocation4
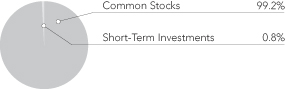
| Portfolio Statistics | ||
Net Assets ($000) | $14,497 | |
Number of Common Stocks | 82 | |
| Expense Ratios | ||||||
| Share Class | Gross Expense Ratios | Net Expense Ratios | As of Date | |||
Class A | 1.82% | 1.68% | 6/30/07 | |||
Class B | 2.54% | 2.44% | 6/30/07 | |||
Class C | 2.53% | 2.43% | 6/30/07 | |||
Class I | 1.58% | 1.43% | 6/30/07 | |||
The expense ratios shown factor in Total Annual Fund Operating Expenses including management fees and other fees and expenses. The Net Expense Ratios reflect a contractual commitment by the Fund’s investment adviser to waive fees and reimburse expenses through October 31, 2009. The Net Expense Ratios also reflect a custodian fee credit whereby certain fees and expenses are reduced by credits earned on the Fund’s cash on deposit with the bank. There is no guarantee that the Fund will earn such credits in the future. Absent the waiver, reimbursement and custodian fee credit, the Net Expense Ratios would be higher and total returns would be less.
These Fund Spotlight pages reflect the performance for the Nuveen Global Value Fund as of and for the fiscal year ended June 30, 2008.
| 1 | Effective May 1, 2008, Class B Shares will only be issued upon exchange of Class B Shares from another Nuveen Fund or for purposes of dividend reinvestment. Effective December 31, 2008, the reinvestment privilege for Class B will no longer be available. Effective May 1, 2008, Class R Shares were renamed Class I Shares. See the Fund’s prospectus for more information. |
| 2 | Paid December 17, 2007. |
| 3 | Ordinary income distribution consists of short-term capital gains paid on December 17, 2007, and ordinary income paid on December 31, 2007, if any. |
| 4 | As a percentage of total investments as of June 30, 2008. Holdings are subject to change. |
Annual Report Page 23
Fund Spotlight as of 6/30/08 Nuveen Global Value Fund
(currently known as Nuveen Growth Allocation Fund)
| Country Allocation1 | ||
United States | 44.6% | |
Japan | 21.0% | |
France | 6.7% | |
Canada | 5.6% | |
South Africa | 4.2% | |
Australia | 3.0% | |
South Korea | 2.9% | |
Netherlands | 2.0% | |
Germany | 2.0% | |
United Kingdom | 1.9% | |
Italy | 1.8% | |
Brazil | 1.4% | |
Belgium | 1.2% | |
Finland | 0.9% | |
Short-Term Investments | 0.8% |
| Industries1 | ||
Oil, Gas & Consumable Fuels | 14.8% | |
Metals & Mining | 14.3% | |
Diversified Telecommunication Services | 9.1% | |
Media | 5.7% | |
Insurance | 4.9% | |
Software | 4.8% | |
Commercial Services & Supplies | 3.2% | |
Beverages | 2.4% | |
Communications Equipment | 2.4% | |
Electric Utilities | 2.3% | |
Aerospace & Defense | 2.3% | |
Pharmaceuticals | 2.2% | |
Tobacco | 2.0% | |
Electronic Equipment & Instruments | 1.9% | |
Computers & Peripherals | 1.9% | |
Commercial Banks | 1.9% | |
Paper & Forest Products | 1.8% | |
Leisure Equipment & Products | 1.6% | |
Machinery | 1.6% | |
Food & Staples Retailing | 1.4% | |
Energy Equipment & Services | 1.3% | |
Household Products | 1.3% | |
Short-Term Investments | 0.8% | |
Other | 14.1% |
| 1 | As a percentage of total investments as of June 30, 2008. Holdings are subject to change. |
Expense Example (Unaudited)
As a shareholder of the Fund, you incur two types of costs: (1) transaction costs, including front and back end sales charges (loads) or redemption fees, where applicable; and (2) ongoing costs, including management fees; distribution and service (12b-1) fees, where applicable; and other Fund expenses. This Example is intended to help you understand your ongoing costs (in dollars) of investing in the Fund and to compare these costs with the ongoing costs of investing in other mutual funds.
The Example below is based on an investment of $1,000 invested at the beginning of the period and held for the period.
The information under “Actual Performance,” together with the amount you invested, allows you to estimate actual expenses incurred over the reporting period. Simply divide your account value by $1,000 (for example, an $8,600 account value divided by $1,000 = 8.60) and multiply the result by the cost shown for your share class, in the row entitled “Expenses Incurred During Period” to estimate the expenses incurred on your account during this period.
The information under “Hypothetical Performance,” provides information about hypothetical account values and hypothetical expenses based on the Fund’s actual expense ratio and an assumed rate of return of 5% per year before expenses, which is not the Fund’s actual return. The hypothetical account values and expenses may not be used to estimate the actual ending account balance or expense you incurred for the period. You may use this information to compare the ongoing costs of investing in the Fund and other Funds. To do so, compare this 5% hypothetical example with the 5% hypothetical examples that appear in the shareholder reports of the other funds.
Please note that the expenses shown in the table are meant to highlight your ongoing costs only and do not reflect any transactional costs, such as front and back end sales charges (loads) or redemption fees, where applicable. Therefore, the hypothetical information is useful in comparing ongoing costs only, and will not help you determine the relative total costs of owning different funds or share classes. In addition, if these transactional costs were included, your costs would have been higher.
| Hypothetical Performance | ||||||||||||||||||||||||||
| Actual Performance | (5% return before expenses) | |||||||||||||||||||||||||
| A Shares | B Shares | C Shares | I Shares | A Shares | B Shares | C Shares | I Shares | |||||||||||||||||||
Beginning Account Value (1/01/08) | $ | 1,000.00 | $ | 1,000.00 | $ | 1,000.00 | $ | 1,000.00 | $ | 1,000.00 | $ | 1,000.00 | $ | 1,000.00 | $ | 1,000.00 | ||||||||||
Ending Account Value (6/30/08) | $ | 925.40 | $ | 922.20 | $ | 921.80 | $ | 926.70 | $ | 1,016.61 | $ | 1,012.88 | $ | 1,012.88 | $ | 1,017.85 | ||||||||||
Expenses Incurred During Period | $ | 7.95 | $ | 11.52 | $ | 11.52 | $ | 6.75 | $ | 8.32 | $ | 12.06 | $ | 12.06 | $ | 7.07 | ||||||||||
For each class of the Fund, expenses are equal to the Fund’s annualized expense ratio of 1.66%, 2.41%, 2.41% and 1.41% for Classes A, B, C and I, respectively, multiplied by the average account value over the period, multiplied by 182/366 (to reflect the one-half year period).
Annual Report Page 24
Fund Spotlight as of 6/30/08 Nuveen Tradewinds Value Opportunities Fund
| Quick Facts | ||||||||
| A Shares | B Shares | C Shares | R Shares1 | |||||
Fund Symbols | NVOAX | NVOBX | NVOCX | NVORX | ||||
NAV | $29.60 | $29.29 | $29.29 | $29.66 | ||||
Latest Capital Gain Distribution2 | $1.0546 | $1.0546 | $1.0546 | $1.0546 | ||||
Latest Ordinary Income Distribution3 | $0.9973 | $0.7542 | $0.7542 | $1.0783 | ||||
Inception Date | 12/09/04 | 12/09/04 | 12/09/04 | 12/09/04 |
Returns quoted represent past performance which is no guarantee of future performance. Returns without sales charges would be lower if the sales charge were included. Current performance may be higher or lower than the performance shown. Investment returns and principal value will fluctuate so that when shares are redeemed, they may be worth more or less than their original cost. Returns do not reflect the deduction of taxes that a shareholder would pay on Fund distributions or the redemption of shares. For the most recent month-end performance visit www.nuveen.com or call (800) 257-8787.
Fund returns assume reinvestment of dividends and capital gains, if any. Class A Shares have a 5.75% maximum sales charge. Class B Shares have a contingent deferred sales charge (CDSC), also known as a back-end sales charge, that for redemptions begins at 5% and declines periodically until after 6 years when the charge becomes 0%. Class B Shares automatically convert to Class A Shares eight years after purchase. Class C Shares have a 1% CDSC for redemptions within less than one year, which is not reflected in the one-year total return. Class I Shares have no sales charge and may be purchased under limited circumstances or by specified classes of investors. Returns reflect a voluntary expense limitation by the Fund’s investment adviser which may be modified or discontinued at any time without notice.
| Average Annual Total Returns as of 6/30/08 | ||||
| A Shares | NAV | Offer | ||
1-Year | -2.65% | -8.24% | ||
Since Inception | 14.75% | 12.86% | ||
| B Shares | w/o CDSC | w/CDSC | ||
1-Year | -3.39% | -7.03% | ||
Since Inception | 13.88% | 13.28% | ||
| C Shares | NAV | |||
1-Year | -3.39% | |||
Since Inception | 13.88% | |||
| I Shares | NAV | |||
1-Year | -2.39% | |||
Since Inception | 15.04% | |||
| Top Five Common Stock Holdings4 | ||||
Newmont Mining Corporation | 4.7% | |||
Barrick Gold Corporation | 4.5% | |||
Smithfield Foods, Inc. | 3.3% | |||
AngloGold Ashanti Limited, Sponsored ADR | 3.3% | |||
Tyson Foods, Inc., Class A | 3.2% | |||
Portfolio Allocation4
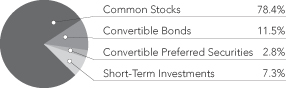
| Portfolio Statistics | ||
Net Assets ($000) | $770,021 | |
Number of Common Stocks | 72 | |
| Expense Ratios | ||||||
| Share Class | Gross Expense Ratios | Net Expense Ratios | As of Date | |||
Class A | 1.39% | 1.39% | 6/30/07 | |||
Class B | 2.14% | 2.14% | 6/30/07 | |||
Class C | 2.14% | 2.14% | 6/30/07 | |||
Class I | 1.14% | 1.14% | 6/30/07 | |||
The expense ratios shown factor in Total Annual Fund Operating Expenses including management fees and other fees and expenses.
| 1 | Effective May 1, 2008, Class B Shares will only be issued upon exchange of Class B Shares from another Nuveen Fund or for purposes of dividend reinvestment. Effective December 31, 2008, the reinvestment privilege for Class B will no longer be available. Effective May 1, 2008, Class R Shares were renamed Class I Shares. See the Fund’s prospectus for more information. |
| 2 | Paid December 17, 2007. |
| 3 | Ordinary income distribution consists of short-term capital gains paid on December 17, 2007, and ordinary income paid on December 31, 2007, if any. |
| 4 | As a percentage of total investments as of June 30, 2008. Holdings are subject to change. |
Annual Report Page 25
Fund Spotlight as of 6/30/08 Nuveen Tradewinds Value Opportunities Fund
| Country Allocation1 | ||
United States | 60.4% | |
Canada | 12.9% | |
Japan | 5.1% | |
South Africa | 4.9% | |
Australia | 3.0% | |
South Korea | 2.0% | |
Switzerland | 1.4% | |
Brazil | 1.1% | |
France | 0.6% | |
Turkey | 0.4% | |
Germany | 0.4% | |
Israel | 0.3% | |
Argentina | 0.2% | |
Short-Term Investments | 7.3% |
| Industries1 | ||
Metals & Mining | 24.5% | |
Electric Utilities | 8.1% | |
Food Products | 6.7% | |
Oil, Gas & Consumable Fuels | 6.4% | |
Health Care Providers & Services | 5.9% | |
Diversified Telecommunication Services | 5.8% | |
Commercial Services & Supplies | 3.4% | |
Communications Equipment | 3.2% | |
Biotechnology | 2.9% | |
Machinery | 2.8% | |
Paper & Forest Products | 2.4% | |
Airlines | 2.0% | |
Semiconductors & Equipment | 2.0% | |
Energy Equipment & Services | 1.5% | |
Pharmaceuticals | 1.5% | |
Short-Term Investments | 7.3% | |
Other | 13.6% |
| 1 | As a percentage of total investments as of June 30, 2008. Holdings are subject to change. |
Expense Example (Unaudited)
As a shareholder of the Fund, you incur two types of costs: (1) transaction costs, including front and back end sales charges (loads) or redemption fees, where applicable; and (2) ongoing costs, including management fees; distribution and service (12b-1) fees, where applicable; and other Fund expenses. This Example is intended to help you understand your ongoing costs (in dollars) of investing in the Fund and to compare these costs with the ongoing costs of investing in other mutual funds.
The Example below is based on an investment of $1,000 invested at the beginning of the period and held for the period.
The information under “Actual Performance,” together with the amount you invested, allows you to estimate actual expenses incurred over the reporting period. Simply divide your account value by $1,000 (for example, an $8,600 account value divided by $1,000 = 8.60) and multiply the result by the cost shown for your share class, in the row entitled “Expenses Incurred During Period” to estimate the expenses incurred on your account during this period.
The information under “Hypothetical Performance,” provides information about hypothetical account values and hypothetical expenses based on the Fund’s actual expense ratio and an assumed rate of return of 5% per year before expenses, which is not the Fund’s actual return. The hypothetical account values and expenses may not be used to estimate the actual ending account balance or expense you incurred for the period. You may use this information to compare the ongoing costs of investing in the Fund and other Funds. To do so, compare this 5% hypothetical example with the 5% hypothetical examples that appear in the shareholder reports of the other funds.
Please note that the expenses shown in the table are meant to highlight your ongoing costs only and do not reflect any transactional costs, such as front and back end sales charges (loads) or redemption fees, where applicable. Therefore, the hypothetical information is useful in comparing ongoing costs only, and will not help you determine the relative total costs of owning different funds or share classes. In addition, if these transactional costs were included, your costs would have been higher.
| Hypothetical Performance | ||||||||||||||||||||||||||
| Actual Performance | (5% return before expenses) | |||||||||||||||||||||||||
| A Shares | B Shares | C Shares | I Shares | A Shares | B Shares | C Shares | I Shares | |||||||||||||||||||
Beginning Account Value (1/01/08) | $ | 1,000.00 | $ | 1,000.00 | $ | 1,000.00 | $ | 1,000.00 | $ | 1,000.00 | $ | 1,000.00 | $ | 1,000.00 | $ | 1,000.00 | ||||||||||
Ending Account Value (6/30/08) | $ | 964.20 | $ | 960.60 | $ | 960.60 | $ | 965.50 | $ | 1,017.85 | $ | 1,014.12 | $ | 1,014.12 | $ | 1,019.05 | ||||||||||
Expenses Incurred During Period | $ | 6.89 | $ | 10.53 | $ | 10.53 | $ | 5.72 | $ | 7.07 | $ | 10.82 | $ | 10.82 | $ | 5.87 | ||||||||||
For each class of the Fund, expenses are equal to the Fund’s annualized expense ratio of 1.41%, 2.16%, 2.16% and 1.17% for Classes A, B, C and I, respectively, multiplied by the average account value over the period, multiplied by 182/366 (to reflect the one-half year period).
Annual Report Page 26
Shareholder
Meeting Report
The special meeting of shareholders for Nuveen Global Value Fund (currently known as Nuveen Growth Allocation Fund) was held in the offices of Nuveen Investments on June 23, 2008.
| Global Value (1) | ||
To approve a new sub-advisory agreement between Nuveen Asset Management and Richards & Tierney, Inc.: | ||
For | 362,970 | |
Against | 9,405 | |
Abstain | 2,661 | |
Total | 375,036 | |
To approve a change to the Fund’s investment objective: | ||
For | 361,497 | |
Against | 9,530 | |
Abstain | 4,009 | |
Total | 375,036 | |
To approve a change to the Fund’s diversification policy: | ||
For | 365,102 | |
Against | 5,925 | |
Abstain | 4,009 | |
Total | 375,036 | |
| (1) | Effective August 1, 2008, Nuveen Global Value Fund changed its name to Nuveen Growth Allocation Fund. |
27
Portfolio of Investments
Nuveen NWQ Multi-Cap Value Fund
June 30, 2008
| Shares | Description (1) | Value | |||
| COMMON STOCKS – 98.7% | |||||
| Aerospace & Defense – 5.1% | |||||
| 210,000 | Lockheed Martin Corporation | $ | 20,718,600 | ||
| 350,000 | Raytheon Company | 19,698,000 | |||
Total Aerospace & Defense | 40,416,600 | ||||
| Biotechnology – 3.3% | |||||
| 552,100 | Amgen Inc., (2) | 26,037,036 | |||
| Capital Markets – 2.4% | |||||
| 560,000 | JPMorgan Chase & Co. | 19,213,600 | |||
| Commercial Services & Supplies – 4.4% | |||||
| 1,025,600 | Pitney Bowes Inc. | 34,972,960 | |||
| Communications Equipment – 3.2% | |||||
| 3,500,000 | Motorola, Inc. | 25,690,000 | |||
| Computers & Peripherals – 0.6% | |||||
| 3,500,000 | Quantum Corporation, (2) | 4,725,000 | |||
| Containers & Packaging – 1.6% | |||||
| 600,000 | Packaging Corp. of America | 12,906,000 | |||
| Diversified Financial Services – 0.8% | |||||
| 358,400 | Citigroup Inc. | 6,006,784 | |||
| Diversified Telecommunication Services – 1.2% | |||||
| 1,000,000 | Sprint Nextel Corporation | 9,500,000 | |||
| Electronic Equipment & Instruments – 0.8% | |||||
| 180,052 | Agilent Technologies, Inc., (2) | 6,399,048 | |||
| Food Products – 1.2% | |||||
| 465,000 | Smithfield Foods, Inc., (2) | 9,244,200 | |||
| Health Care Providers & Services – 1.3% | |||||
| 250,200 | Aetna Inc. | 10,140,606 | |||
| Independent Power Producers & Energy Traders – 3.3% | |||||
| 610,000 | NRG Energy Inc., (2) | 26,169,000 | |||
| Insurance – 12.0% | |||||
| 250,000 | American International Group, Inc. | 6,615,000 | |||
| 420,000 | Aon Corporation | 19,294,800 | |||
| 1,287,500 | Genworth Financial Inc., Class A | 22,930,375 | |||
| 720,000 | Hartford Financial Services Group, Inc. | 46,490,400 | |||
Total Insurance | 95,330,575 | ||||
| Machinery – 2.1% | |||||
| 295,800 | Ingersoll Rand Company Limited, Class A | 11,071,794 | |||
| 175,000 | Timken Company | 5,764,500 | |||
Total Machinery | 16,836,294 | ||||
| Media – 10.7% | |||||
| 683,050 | CBS Corporation, Class B | 13,312,645 | |||
| 620,000 | Comcast Corporation, Special Class A | 11,631,200 | |||
| 1,430,000 | Interpublic Group Companies, Inc., (2) | 12,298,000 | |||
| 368,758 | Liberty Media Holding Corporation Interactive, Class A, (2) | 5,442,868 | |||
| 1,379,300 | Viacom Inc., Class B, (2) | 42,123,822 | |||
Total Media | 84,808,535 | ||||
28
| Shares | Description (1) | Value | |||
| Metals & Mining – 8.4% | |||||
| 607,429 | AngloGold Ashanti Limited, Sponsored ADR | $ | 20,616,140 | ||
| 813,000 | Barrick Gold Corporation | 36,991,500 | |||
| 50,000 | United States Steel Corporation | 9,239,000 | |||
Total Metals & Mining | 66,846,640 | ||||
| Mortgage REIT – 0.5% | |||||
| 2,875,070 | Friedman, Billings, Ramsey Group, Inc., Class A, (2) | 4,312,605 | |||
| Oil, Gas & Consumable Fuels – 14.8% | |||||
| 275,000 | Apache Corporation | 38,225,000 | |||
| 135,000 | Hess Corporation | 17,035,650 | |||
| 370,000 | Noble Energy, Inc. | 37,207,200 | |||
| 460,000 | Talisman Energy Inc. | 10,179,800 | |||
| 988,800 | Warren Resources Inc., (2) | 14,515,584 | |||
Total Oil, Gas & Consumable Fuels | 117,163,234 | ||||
| Paper & Forest Products – 1.7% | |||||
| 1,150,000 | Sappi Limited, Sponsored ADR | 13,673,500 | |||
| Pharmaceuticals – 2.7% | |||||
| 637,300 | Sanofi–Aventis, ADR | 21,177,479 | |||
| Semiconductors & Equipment – 0.7% | |||||
| 1,201,953 | Mattson Technology, Inc., (2) | 5,721,296 | |||
| Software – 8.8% | |||||
| 2,650,077 | CA Inc. | 61,190,278 | |||
| 320,000 | Microsoft Corporation | 8,803,200 | |||
Total Software | 69,993,478 | ||||
| Thrifts & Mortgage Finance – 2.9% | |||||
| 950,000 | Federal National Mortgage Association | 18,534,500 | |||
| 400,000 | MGIC Investment Corporation | 2,444,000 | |||
| 1,500,000 | Radian Group Inc. | 2,175,000 | |||
Total Thrifts & Mortgage Finance | 23,153,500 | ||||
| Tobacco – 4.2% | |||||
| 309,400 | Altria Group, Inc. | 6,361,264 | |||
| 149,532 | Lorillard Inc. | 10,341,633 | |||
| 340,000 | Philip Morris International | 16,792,600 | |||
Total Tobacco | 33,495,497 | ||||
| Total Common Stocks (cost $874,641,014) | 783,933,467 | ||||
| Principal Amount (000) | Description (1) | Coupon | Maturity | Value | ||||||
| SHORT-TERM INVESTMENTS – 1.6% | ||||||||||
| $ | 12,810 | Repurchase Agreement with Fixed Income Clearing Corporation, dated 6/30/08, repurchase price $12,810,441, collateralized by $13,195,000 U.S. Treasury Bills, 0.000%, due 12/11/08, value $13,069,648 | 1.350% | 7/01/08 | $ | 12,809,961 | ||||
| Total Short-Term Investments (cost $12,809,961) | 12,809,961 | |||||||||
| Total Investments (cost $887,450,975) – 100.3% | 796,743,428 | |||||||||
| Other Assets Less Liabilities – (0.3)% | (2,581,431) | |||||||||
| Net Assets – 100% | $ | 794,161,997 | ||||||||
| (1) | All percentages shown in the Portfolio of Investments are based on net assets. |
| (2) | Non-income producing. |
| ADR | American Depositary Receipt. |
See accompanying notes to financial statements.
29
Portfolio of Investments
Nuveen NWQ Large-Cap Value Fund
June 30, 2008
| Shares | Description (1) | Value | |||
| COMMON STOCKS – 91.6% | |||||
| Aerospace & Defense – 4.9% | |||||
| 6,400 | Lockheed Martin Corporation | $ | 631,424 | ||
| 9,800 | Raytheon Company | 551,544 | |||
Total Aerospace & Defense | 1,182,968 | ||||
| Biotechnology – 2.5% | |||||
| 13,000 | Amgen Inc., (2) | 613,080 | |||
| Capital Markets – 2.1% | |||||
| 14,900 | JPMorgan Chase & Co. | 511,219 | |||
| Commercial Banks – 3.1% | |||||
| 9,800 | Bank of America Corporation | 233,926 | |||
| 22,100 | Wells Fargo & Company | 524,875 | |||
Total Commercial Banks | 758,801 | ||||
| Commercial Services & Supplies – 4.3% | |||||
| 30,700 | Pitney Bowes Inc. | 1,046,870 | |||
| Communications Equipment – 3.7% | |||||
| 121,400 | Motorola, Inc. | 891,076 | |||
| Diversified Financial Services – 1.0% | |||||
| 14,000 | Citigroup Inc. | 234,640 | |||
| Diversified Telecommunication Services – 2.2% | |||||
| 11,000 | AT&T Inc. | 370,590 | |||
| 16,000 | Sprint Nextel Corporation | 152,000 | |||
Total Diversified Telecommunication Services | 522,590 | ||||
| Electronic Equipment & Instruments – 0.5% | |||||
| 3,200 | Agilent Technologies, Inc., (2) | 113,728 | |||
| Food Products – 1.4% | |||||
| 11,976 | Kraft Foods Inc. | 340,717 | |||
| Health Care Providers & Services – 1.2% | |||||
| 7,050 | Aetna Inc. | 285,737 | |||
| Household Products – 2.0% | |||||
| 8,200 | Kimberly – Clark Corporation | 490,196 | |||
| Independent Power Producers & Energy Traders – 2.2% | |||||
| 12,100 | NRG Energy Inc., (2) | 519,090 | |||
| Insurance – 11.0% | |||||
| 6,200 | American International Group, Inc. | 164,052 | |||
| 12,500 | Aon Corporation | 574,250 | |||
| 37,000 | Genworth Financial Inc., Class A | 658,970 | |||
| 14,200 | Hartford Financial Services Group, Inc. | 916,894 | |||
| 7,341 | Loews Corporation | 344,293 | |||
Total Insurance | 2,658,459 | ||||
| Machinery – 2.4% | |||||
| 7,000 | Illinois Tool Works Inc. | 332,570 | |||
| 6,300 | Ingersoll Rand Company Limited, Class A | 235,809 | |||
Total Machinery | 568,379 | ||||
30
| Shares | Description (1) | Value | |||
| Media – 6.7% | |||||
| 16,200 | Comcast Corporation, Special Class A | $ | 303,912 | ||
| 13,000 | Liberty Media Holding Corporation Interactive, Class A, (2) | 191,880 | |||
| 36,900 | Viacom Inc., Class B, (2) | 1,126,926 | |||
Total Media | 1,622,718 | ||||
| Metals & Mining – 8.6% | |||||
| 20,501 | AngloGold Ashanti Limited, Sponsored ADR | 695,804 | |||
| 23,100 | Barrick Gold Corporation | 1,051,050 | |||
| 1,800 | United States Steel Corporation | 332,604 | |||
Total Metals & Mining | 2,079,458 | ||||
| Oil, Gas & Consumable Fuels – 12.4% | |||||
| 7,700 | Apache Corporation | 1,070,300 | |||
| 2,000 | ConocoPhillips | 188,780 | |||
| 3,200 | Hess Corporation | 403,808 | |||
| 10,900 | Noble Energy, Inc. | 1,096,104 | |||
| 10,800 | Talisman Energy Inc. | 239,004 | |||
Total Oil, Gas & Consumable Fuels | 2,997,996 | ||||
| Paper & Forest Products – 1.2% | |||||
| 12,300 | International Paper Company | 286,590 | |||
| Pharmaceuticals – 2.6% | |||||
| 18,700 | Sanofi–Aventis, ADR | 621,401 | |||
| Software – 9.5% | |||||
| 65,600 | CA Inc. | 1,514,704 | |||
| 28,500 | Microsoft Corporation | 784,035 | |||
Total Software | 2,298,739 | ||||
| Thrifts & Mortgage Finance – 2.0% | |||||
| 21,300 | Federal National Mortgage Association | 415,563 | |||
| 7,500 | MGIC Investment Corporation | 45,825 | |||
| 7,700 | Radian Group Inc. | 11,164 | |||
Total Thrifts & Mortgage Finance | 472,552 | ||||
| Tobacco – 4.1% | |||||
| 8,000 | Altria Group, Inc. | 164,480 | |||
| 6,061 | Lorillard Inc. | 419,179 | |||
| 8,000 | Philip Morris International | 395,120 | |||
Total Tobacco | 978,779 | ||||
| Total Common Stocks (cost $25,558,894) | 22,095,783 | ||||
31
Portfolio of Investments
Nuveen NWQ Large-Cap Value Fund (continued)
June 30, 2008
| Principal Amount (000) | Description (1) | Coupon | Maturity | Value | ||||||
| SHORT-TERM INVESTMENTS – 7.0% | ||||||||||
| $ | 1,674 | Repurchase Agreement with State Street Bank, dated 6/30/08, repurchase price $1,673,601, collateralized by $1,705,000 U.S. Treasury Notes, 2.125%, due 1/31/10, value $1,709,263 | 1.350% | 7/01/08 | $ | 1,673,538 | ||||
| Total Short-Term Investments (cost $1,673,538) | 1,673,538 | |||||||||
| Total Investments (cost $27,232,432) – 98.6% | 23,769,321 | |||||||||
| Other Assets Less Liabilities – 1.4% | 348,148 | |||||||||
| Net Assets – 100% | $ | 24,117,469 | ||||||||
| (1) | All percentages shown in the Portfolio of Investments are based on net assets. |
| (2) | Non-income producing. |
| ADR | American Depositary Receipt. |
See accompanying notes to financial statements.
32
Portfolio of Investments
Nuveen NWQ Small/Mid-Cap Value Fund
June 30, 2008
| Shares | Description (1) | Value | |||
| COMMON STOCKS – 92.0% | |||||
| Biotechnology – 1.1% | |||||
| 24,400 | Sepracor Inc. | $ | 486,048 | ||
| Building Products – 1.7% | |||||
| 81,450 | Griffon Corporation, (2) | 713,502 | |||
| Chemicals – 1.9% | |||||
| 24,050 | Rockwood Holdings Inc., (2) | 836,940 | |||
| Computers & Peripherals – 1.1% | |||||
| 55,700 | Brocade Communications Systems Inc., (2) | 458,968 | |||
| Containers & Packaging – 4.3% | |||||
| 26,200 | Packaging Corp. of America | 563,562 | |||
| 115,000 | Temple-Inland Inc. | 1,296,050 | |||
Total Containers & Packaging | 1,859,612 | ||||
| Electric Utilities – 2.8% | |||||
| 57,000 | Reliant Energy Inc., (2) | 1,212,390 | |||
| Electrical Equipment – 3.0% | |||||
| 15,750 | Acuity Brands Inc. | 757,260 | |||
| 7,200 | Lincoln Electric Holdings Inc. | 566,640 | |||
Total Electrical Equipment | 1,323,900 | ||||
| Electronic Equipment & Instruments – 11.0% | |||||
| 47,950 | Arrow Electronics, Inc., (2) | 1,473,024 | |||
| 48,100 | Avnet Inc., (2) | 1,312,168 | |||
| 37,050 | Coherent Inc., (2) | 1,107,425 | |||
| 14,100 | General Cable Corporation, (2) | 857,985 | |||
Total Electronic Equipment & Instruments | 4,750,602 | ||||
| Energy Equipment & Services – 2.3% | |||||
| 44,400 | Acergy S.A., Sponsored ADR | 988,344 | |||
| Food Products – 1.6% | |||||
| 34,900 | Smithfield Foods, Inc., (2) | 693,812 | |||
| Health Care Providers & Services – 3.1% | |||||
| 40,400 | Community Health Systems Inc., (2) | 1,332,392 | |||
| Household Durables – 2.8% | |||||
| 72,700 | Newell Rubbermaid Inc. | 1,220,633 | |||
| Independent Power Producers & Energy Traders – 2.8% | |||||
| 27,900 | NRG Energy Inc., (2) | 1,196,910 | |||
| Insurance – 6.9% | |||||
| 41,900 | Hanover Insurance Group Inc. | 1,780,750 | |||
| 57,700 | Tower Group Inc. | 1,222,663 | |||
Total Insurance | 3,003,413 | ||||
| Machinery – 6.3% | |||||
| 8,600 | Gardner Denver, Inc., (2) | 488,480 | |||
| 13,800 | Kennametal Inc. | 449,190 | |||
| 29,300 | Oshkosh Truck Corporation | 606,217 | |||
| 38,470 | Sauer-Danfoss, Inc. | 1,198,341 | |||
Total Machinery | 2,742,228 | ||||
33
Portfolio of Investments
Nuveen NWQ Small/Mid-Cap Value Fund (continued)
June 30, 2008
| Shares | Description (1) | Value | |||
| Metals & Mining – 7.5% | |||||
| 10,900 | Carpenter Technology Inc. | $ | 475,785 | ||
| 8,050 | Century Aluminum Company, (2) | 535,245 | |||
| 71,700 | Gibraltar Industries Inc. | 1,145,049 | |||
| 14,150 | Reliance Steel & Aluminum Company | 1,090,824 | |||
Total Metals & Mining | 3,246,903 | ||||
| Mortgage REIT – 1.3% | |||||
| 61,950 | Anthracite Capital, Inc. | 436,128 | |||
| 71,950 | Friedman, Billings, Ramsey Group, Inc., Class A, (2) | 107,925 | |||
Total Mortgage REIT | 544,053 | ||||
| Multiline Retail – 3.5% | |||||
| 65,550 | Casey’s General Stores, Inc. | 1,518,794 | |||
| Oil, Gas & Consumable Fuels – 3.7% | |||||
| 24,800 | St Mary Land and Exploration Company | 1,603,072 | |||
| Paper & Forest Products – 11.9% | |||||
| 129,148 | AbitibiBowater Inc., (2) | 1,204,951 | |||
| 285,400 | Domtar Corporation, (2) | 1,555,430 | |||
| 37,200 | MeadWestvaco Corporation | 886,848 | |||
| 87,200 | Sappi Limited, Sponsored ADR | 1,036,808 | |||
| 62,650 | Wausau Paper Corp. | 483,032 | |||
Total Paper & Forest Products | 5,167,069 | ||||
| Specialty Retail – 3.6% | |||||
| 180,200 | Pacific Sunwear of California, Inc., (2) | 1,537,106 | |||
| Textiles, Apparel & Luxury Goods – 1.5% | |||||
| 22,950 | Fossil Inc., (2) | 667,153 | |||
| Thrifts & Mortgage Finance – 4.1% | |||||
| 114,200 | People’s United Financial, Inc. | 1,781,520 | |||
| Trading Companies & Distributors – 2.2% | |||||
| 23,550 | WESCO International Inc., (2) | 942,942 | |||
| Total Common Stocks (cost $46,482,558) | 39,828,306 | ||||
| Principal Amount (000) | Description (1) | Coupon | Maturity | Value | ||||||
| SHORT-TERM INVESTMENTS – 6.5% | ||||||||||
| $ | 2,821 | Repurchase Agreement with State Street Bank, dated 6/30/08, repurchase price $2,821,439, collateralized by $2,045,000 U.S. Treasury Bonds, 8.500%, due 2/15/20, value $2,884,553 | 1.350% | 7/01/08 | $ | 2,821,333 | ||||
| Total Short-Term Investments (cost $2,821,333) | 2,821,333 | |||||||||
| Total Investments (cost $49,303,891) – 98.5% | 42,649,639 | |||||||||
| Other Assets Less Liabilities – 1.5% | 648,671 | |||||||||
| Net Assets – 100% | $ | 43,298,310 | ||||||||
| (1) | All percentages shown in the Portfolio of Investments are based on net assets. |
| (2) | Non-income producing. |
| ADR | American Depositary Receipt. |
See accompanying notes to financial statements.
34
Portfolio of Investments
Nuveen NWQ Small-Cap Value Fund
June 30, 2008
| Shares | Description (1) | Value | |||
| COMMON STOCKS – 93.8% | |||||
| Biotechnology – 0.8% | |||||
| 67,000 | Sepracor Inc. | $ | 1,334,640 | ||
| Building Products – 2.0% | |||||
| 389,650 | Griffon Corporation, (2) | 3,413,334 | |||
| Chemicals – 1.3% | |||||
| 118,100 | Ferro Corporation | 2,215,556 | |||
| Commercial Banks – 0.9% | |||||
| 211,200 | Bancorp, Inc., (2) | 1,609,344 | |||
| Communications Equipment – 1.6% | |||||
| 52,000 | CommScope Inc., (2) | 2,744,040 | |||
| Computers & Peripherals – 0.5% | |||||
| 632,900 | Quantum Corporation, (2) | 854,415 | |||
| Containers & Packaging – 3.4% | |||||
| 521,200 | Temple-Inland Inc. | 5,873,924 | |||
| Electrical Equipment – 5.4% | |||||
| 67,500 | Acuity Brands Inc. | 3,245,400 | |||
| 125,700 | Belden Inc. | 4,258,716 | |||
| 21,900 | Lincoln Electric Holdings Inc. | 1,723,530 | |||
Total Electrical Equipment | 9,227,646 | ||||
| Electronic Equipment & Instruments – 5.4% | |||||
| 49,750 | General Cable Corporation, (2) | 3,027,288 | |||
| 391,500 | GSI Group, Inc., (2) | 3,038,040 | |||
| 344,300 | Keithley Instruments, Inc. | 3,270,850 | |||
Total Electronic Equipment & Instruments | 9,336,178 | ||||
| Energy Equipment & Services – 2.4% | |||||
| 184,800 | Acergy S.A., Sponsored ADR | 4,113,648 | |||
| Food Products – 1.4% | |||||
| 122,412 | Smithfield Foods, Inc., (2) | 2,433,551 | |||
| Health Care Providers & Services – 3.5% | |||||
| 152,300 | Community Health Systems Inc., (2) | 5,022,854 | |||
| 81,400 | Skilled Healthcare Group Inc. | 1,092,388 | |||
Total Health Care Providers & Services | 6,115,242 | ||||
| Hotels, Restaurants & Leisure – 2.7% | |||||
| 165,700 | Bob Evans Farms | 4,739,020 | |||
| Household Durables – 2.7% | |||||
| 267,500 | Hooker Furniture Corporation | 4,633,100 | |||
| Household Products – 3.8% | |||||
| 226,970 | WD-40 Company | 6,638,873 | |||
| Insurance – 4.1% | |||||
| 152,450 | Aspen Insurance Holdings Limited, (2) | 3,608,492 | |||
| 214,800 | PMA Capital Corporation, Class A, (2) | 1,978,308 | |||
| 72,850 | Tower Group Inc. | 1,543,692 | |||
Total Insurance | 7,130,492 | ||||
35
Portfolio of Investments
Nuveen NWQ Small-Cap Value Fund (continued)
June 30, 2008
| Shares | Description (1) | Value | |||
| Machinery – 10.2% | |||||
| 144,100 | Albany International Corporation, Class A | $ | 4,178,900 | ||
| 91,659 | Kadant Inc., (2) | 2,071,493 | |||
| 112,940 | Kennametal Inc. | 3,676,197 | |||
| 86,900 | RBC Bearings Inc., (2) | 2,895,508 | |||
| 152,250 | Sauer-Danfoss, Inc. | 4,742,588 | |||
Total Machinery | 17,564,686 | ||||
| Metals & Mining – 4.5% | |||||
| 36,000 | Century Aluminum Company, (2) | 2,393,640 | |||
| 332,900 | Gibraltar Industries Inc. | 5,316,413 | |||
Total Metals & Mining | 7,710,053 | ||||
| Mortgage REIT – 1.0% | |||||
| 240,929 | Anthracite Capital, Inc. | 1,696,140 | |||
| Multiline Retail – 3.1% | |||||
| 229,950 | Casey’s General Stores, Inc. | 5,327,942 | |||
| Oil, Gas & Consumable Fuels – 10.2% | |||||
| 149,950 | Approach Resources Inc., (2) | 4,017,161 | |||
| 83,600 | Bill Barrett Corporation, (2) | 4,966,676 | |||
| 224,400 | Cano Petroleum Inc. | 1,781,736 | |||
| 460,250 | Warren Resources Inc., (2) | 6,756,470 | |||
Total Oil, Gas & Consumable Fuels | 17,522,043 | ||||
| Paper & Forest Products – 11.9% | |||||
| 187,038 | AbitibiBowater Inc., (2) | 1,745,065 | |||
| 318,503 | Buckeye Technologies Inc., (2) | 2,694,535 | |||
| 432,900 | Domtar Corporation, (2) | 2,359,305 | |||
| 236,400 | Glatfelter | 3,193,764 | |||
| 556,500 | Sappi Limited, Sponsored ADR | 6,616,785 | |||
| 510,994 | Wausau Paper Corp. | 3,939,764 | |||
Total Paper & Forest Products | 20,549,218 | ||||
| Road & Rail – 3.8% | |||||
| 406,205 | Marten Transport, Ltd., (2) | 6,487,091 | |||
| Semiconductors & Equipment – 2.4% | |||||
| 142,600 | Mattson Technology, Inc., (2) | 678,776 | |||
| 128,600 | Standard Microsystems Corporation, (2) | 3,491,490 | |||
Total Semiconductors & Equipment | 4,170,266 | ||||
| Specialty Retail – 4.0% | |||||
| 325,591 | Golfsmith International Holdings Inc., (2) | 742,347 | |||
| 713,700 | Pacific Sunwear of California, Inc., (2) | 6,087,861 | |||
Total Specialty Retail | 6,830,208 | ||||
| Textiles, Apparel & Luxury Goods – 0.8% | |||||
| 48,500 | Fossil Inc., (2) | 1,409,895 | |||
| Total Common Stocks (cost $183,007,479) | 161,680,545 | ||||
36
| Principal Amount (000) | Description (1) | Coupon | Maturity | Value | ||||||
| SHORT-TERM INVESTMENTS – 7.6% | ||||||||||
| $ | 13,045 | Repurchase Agreement with Fixed Income Clearing Corporation, dated 6/30/08, repurchase price $13,045,184, collateralized by $13,435,000 U.S. Treasury Bills, 0.000%, due 12/11/08, value $13,307,368 | 1.350% | 7/01/08 | $ | 13,044,695 | ||||
| Total Short-Term Investments (cost $13,044,695) | 13,044,695 | |||||||||
| Total Investments (cost $196,052,174) – 101.4% | 174,725,240 | |||||||||
| Other Assets Less Liabilities – (1.4)% | (2,340,561) | |||||||||
| Net Assets – 100% | $ | 172,384,679 | ||||||||
| (1) | All percentages shown in the Portfolio of Investments are based on net assets. |
| (2) | Non-income producing. |
| ADR | American Depositary Receipt. |
See accompanying notes to financial statements.
37
Portfolio of Investments
Nuveen Global Value Fund
(currently known as Nuveen Growth Allocation Fund)
June 30, 2008
| Shares | Description (1) | Value | |||
| COMMON STOCKS – 99.1% | |||||
| Aerospace & Defense – 2.3% | |||||
| 1,550 | Lockheed Martin Corporation | $ | 152,923 | ||
| 3,100 | Raytheon Company | 174,468 | |||
Total Aerospace & Defense | 327,391 | ||||
| Beverages – 2.4% | |||||
| 7,800 | Coca Cola West Holdings Company | 181,805 | |||
| 11,000 | Kirin Brewery Company Limited | 171,757 | |||
Total Beverages | 353,562 | ||||
| Biotechnology – 1.1% | |||||
| 3,400 | Amgen Inc., (2) | 160,344 | |||
| Building Products – 1.2% | |||||
| 11,300 | JS Group Corporation | 179,527 | |||
| Capital Markets – 1.3% | |||||
| 5,350 | JPMorgan Chase & Co. | 183,559 | |||
| Commercial Banks – 1.9% | |||||
| 5,700 | Wachovia Corporation | 88,521 | |||
| 7,600 | Wells Fargo & Company | 180,500 | |||
Total Commercial Banks | 269,021 | ||||
| Commercial Services & Supplies – 3.2% | |||||
| 16,000 | Dai Nippon Printing Co., Ltd. | 235,815 | |||
| 6,800 | Pitney Bowes Inc. | 231,880 | |||
Total Commercial Services & Supplies | 467,695 | ||||
| Communications Equipment – 2.4% | |||||
| 32,170 | Alcatel – Lucent | 195,509 | |||
| 20,950 | Motorola, Inc. | 153,773 | |||
Total Communications Equipment | 349,282 | ||||
| Computers & Peripherals – 1.9% | |||||
| 7,560 | Gemalto N.V., (2) | 275,194 | |||
| Consumer Finance – 0.8% | |||||
| 7,840 | Takefuji Corporation | 109,052 | |||
| Containers & Packaging – 1.3% | |||||
| 10,300 | Toyo Seikan Kaisha | 181,779 | |||
| Diversified Financial Services – 0.6% | |||||
| 5,450 | Citigroup Inc. | 91,342 | |||
| Diversified Telecommunication Services – 9.1% | |||||
| 4,225 | AT&T Inc. | 142,340 | |||
| 4,060 | Belgacom S.A. | 175,148 | |||
| 10,200 | KT Corporation, Sponsored ADR | 217,464 | |||
| 17,750 | Nippon Telegraph and Telephone Corporation, Sponsored ADR | 431,325 | |||
| 9,800 | Sprint Nextel Corporation | 93,100 | |||
| 163,500 | Telecom Italia S.p.A. | 265,145 | |||
Total Diversified Telecommunication Services | 1,324,522 | ||||
38
| Shares | Description (1) | Value | |||
| Electric Utilities – 2.3% | |||||
| 11,284 | Centrais Electricas Brasileiras S.A., Electrobras | $ | 208,350 | ||
| 8,210 | Korea Electric Power Corporation, Sponsored ADR | 119,291 | |||
Total Electric Utilities | 327,641 | ||||
| Electronic Equipment & Instruments – 1.9% | |||||
| 1,381 | Agilent Technologies, Inc., (2) | 49,081 | |||
| 4,200 | Mabuchi Motor Company Limited | 227,829 | |||
Total Electronic Equipment & Instruments | 276,910 | ||||
| Energy Equipment & Services – 1.3% | |||||
| 160 | Areva CI | 187,171 | |||
| Food & Staples Retailing – 1.4% | |||||
| 6,900 | Seven & I Holdings | 196,892 | |||
| Food Products – 0.5% | |||||
| 2,404 | Kraft Foods Inc. | 68,394 | |||
| Health Care Providers & Services – 0.6% | |||||
| 2,175 | Aetna Inc. | 88,153 | |||
| Household Durables – 1.0% | |||||
| 16,000 | Sekisui House, Ltd. | 149,324 | |||
| Household Products – 1.3% | |||||
| 3,125 | Kimberly–Clark Corporation | 186,813 | |||
| Independent Power Producers & Energy Traders – 1.0% | |||||
| 3,300 | NRG Energy Inc., (2) | 141,570 | |||
| Insurance – 4.8% | |||||
| 1,800 | American International Group, Inc. | 47,628 | |||
| 3,000 | Aon Corporation | 137,820 | |||
| 8,825 | Genworth Financial Inc., Class A | 157,173 | |||
| 3,200 | Hartford Financial Services Group, Inc. | 206,624 | |||
| 1,514 | Loews Corporation | 71,007 | |||
| 2,400 | Mitsui Sumitomo Insurance Company Limited, | 82,724 | |||
Total Insurance | 702,976 | ||||
| Leisure Equipment & Products – 1.6% | |||||
| 6,900 | Fuji Photo Film Co., Ltd. | 237,180 | |||
| Machinery – 1.6% | |||||
| 1,975 | Illinois Tool Works Inc. | 93,832 | |||
| 3,600 | Ingersoll Rand Company Limited, Class A | 134,748 | |||
Total Machinery | 228,580 | ||||
| Media – 5.7% | |||||
| 6,050 | CBS Corporation, Class B | 117,915 | |||
| 6,600 | Comcast Corporation, Special Class A | 123,816 | |||
| 3,987 | Liberty Media Holding Corporation Interactive, Class A, (2) | 58,848 | |||
| 13,000 | Premiere AG, (2) | 286,345 | |||
| 7,900 | Viacom Inc., Class B, (2) | 241,266 | |||
Total Media | 828,190 | ||||
39
Portfolio of Investments
Nuveen Global Value Fund (continued)
(currently known as Nuveen Growth Allocation Fund)
June 30, 2008
| Shares | Description (1) | Value | |||
| Metals & Mining – 14.3% | |||||
| 40,090 | Alumina Limited | $ | 182,169 | ||
| 12,775 | AngloGold Ashanti Limited, Sponsored ADR | 433,584 | |||
| 8,148 | Barrick Gold Corporation | 370,734 | |||
| 2,800 | Gold Fields Limited, Sponsored ADR | 35,420 | |||
| 11,450 | Gold Fields Limited | 145,501 | |||
| 17,400 | Ivanhoe Mines Ltd., (2) | 189,834 | |||
| 44,800 | Lihir Gold Limited, (2) | 141,297 | |||
| 3,800 | Newcrest Mining Limited | 106,736 | |||
| 4,950 | Newmont Mining Corporation | 258,192 | |||
| 12,500 | NovaGold Resources Inc., (2) | 93,125 | |||
| 625 | United States Steel Corporation | 115,488 | |||
Total Metals & Mining | 2,072,080 | ||||
| Oil, Gas & Consumable Fuels – 14.8% | |||||
| 2,450 | Apache Corporation | 340,550 | |||
| 23,850 | BP PLC | 277,076 | |||
| 2,500 | Hess Corporation | 315,475 | |||
| 37,000 | Nippon Oil Corporation | 248,444 | |||
| 3,075 | Noble Energy, Inc. | 309,222 | |||
| 3,750 | Petro-Canada | 209,063 | |||
| 3,667 | Royal Dutch Shell PLC, Class B, Sponsored ADR | 293,763 | |||
| 2,620 | Suncor Energy, Inc. | 152,274 | |||
Total Oil, Gas & Consumable Fuels | 2,145,867 | ||||
| Paper & Forest Products – 1.8% | |||||
| 5,400 | International Paper Company | 125,820 | |||
| 13,700 | Stora Enso Oyj, R Shares | 128,557 | |||
Total Paper & Forest Products | 254,377 | ||||
| Personal Products – 0.9% | |||||
| 6,000 | Shiseido Company, Limited | 137,308 | |||
| Pharmaceuticals – 2.2% | |||||
| 4,720 | Sanofi-Aventis | 315,315 | |||
| Road & Rail – 1.2% | |||||
| 2,400 | Union Pacific Corporation | 181,200 | |||
| Software – 4.8% | |||||
| 16,200 | CA Inc. | 374,058 | |||
| 7,325 | Microsoft Corporation | 201,511 | |||
| 13,100 | Sega Sammy Holdings Inc. | 114,240 | |||
Total Software | 689,809 | ||||
| Textiles, Apparel & Luxury Goods – 1.1% | |||||
| 13,000 | Wacoal Holdings Corporation | 155,239 | |||
| Thrifts & Mortgage Finance – 0.9% | |||||
| 6,600 | Federal National Mortgage Association | 128,766 | |||
| 3,350 | Radian Group Inc. | 4,858 | |||
Total Thrifts & Mortgage Finance | 133,624 | ||||
40
| Shares | Description (1) | Value | |||
| Tobacco – 2.0% | |||||
| 3,000 | Altria Group, Inc. | $ | 61,680 | ||
| 1,250 | Lorillard Inc. | 86,450 | |||
| 3,000 | Philip Morris International | 148,170 | |||
Total Tobacco | 296,300 | ||||
| Wireless Telecommunication Services – 0.6% | |||||
| 4,200 | SK Telecom Company Limited, Sponsored ADR | 87,233 | |||
| Total Common Stocks (cost $14,791,536) | 14,360,416 | ||||
| Principal Amount (000) | Description (1) | Coupon | Maturity | Value | ||||||
| SHORT-TERM INVESTMENTS – 0.8% | ||||||||||
| $ | 117 | Repurchase Agreement with Fixed Income Clearing Corporation, dated 6/30/08, repurchase price $116,897, collateralized by $115,000 U.S. Treasury Notes, 4.500%, due 5/15/17, value $120,463 | 1.350% | 7/01/08 | $ | 116,893 | ||||
| Total Short-Term Investments (cost $116,893) | 116,893 | |||||||||
| Total Investments (cost $14,908,429) – 99.9% | 14,477,309 | |||||||||
| Other Assets Less Liabilities – 0.1% | 20,123 | |||||||||
| Net Assets – 100% | $ | 14,497,432 | ||||||||
| (1) | All percentages shown in the Portfolio of Investments are based on net assets. |
| (2) | Non-income producing. |
| ADR | American Depositary Receipt. |
See accompanying notes to financial statements.
41
Portfolio of Investments
Nuveen Tradewinds Value Opportunities Fund
June 30, 2008
| Shares | Description (1) | Value | |||
| COMMON STOCKS – 79.2% | |||||
| Auto Components – 0.9% | |||||
| 112,900 | Magna International Inc., Class A | $ | 6,688,196 | ||
| Biotechnology – 3.0% | |||||
| 484,000 | Amgen Inc., (2) | 22,825,440 | |||
| Capital Markets – 1.4% | |||||
| 528,337 | UBS AG | 10,915,442 | |||
| Commercial Banks – 0.7% | |||||
| 767,100 | Sumitomo Trust & Banking Company | 5,369,470 | |||
| Commercial Services & Supplies – 1.9% | |||||
| 1,131,600 | Allied Waste Industries, Inc., (2) | 14,280,792 | |||
| Computers & Peripherals – 1.0% | |||||
| 417,200 | Ingram Micro, Inc., (2) | 7,405,300 | |||
| Construction & Engineering – 0.3% | |||||
| 35,500 | Shaw Group Inc., (2) | 2,193,545 | |||
| Diversified Telecommunication Services – 5.9% | |||||
| 120,500 | KT Corporation, Sponsored ADR | 2,569,060 | |||
| 860,000 | Nippon Telegraph and Telephone Corporation, Sponsored ADR | 20,898,000 | |||
| 1,635,500 | Sprint Nextel Corporation | 15,537,250 | |||
| 155,600 | Telus Corporation | 6,275,348 | |||
Total Diversified Telecommunication Services | 45,279,658 | ||||
| Electric Utilities – 8.2% | |||||
| 148,300 | Ameren Corporation | 6,262,709 | |||
| 33,100 | American Electric Power Company, Inc. | 1,331,613 | |||
| 370,000 | Centrais Electricas Brasileiras S.A., ADR | 6,087,943 | |||
| 237,200 | DTE Energy Company | 10,066,768 | |||
| 423,700 | IDACORP, INC | 12,240,693 | |||
| 870,000 | Korea Electric Power Corporation, Sponsored ADR | 12,641,100 | |||
| 662,600 | PNM Resources Inc. | 7,924,696 | |||
| 164,200 | Progress Energy, Inc. | 6,868,486 | |||
Total Electric Utilities | 63,424,008 | ||||
| Electronic Equipment & Instruments – 1.4% | |||||
| 30,200 | Samsung SDI Company Ltd., Series 144A | 603,393 | |||
| 302,000 | Tech Data Corporation, (2) | 10,234,780 | |||
Total Electronic Equipment & Instruments | 10,838,173 | ||||
| Energy Equipment & Services – 1.5% | |||||
| 218,200 | BJ Services Company | 6,969,308 | |||
| 52,750 | Technip SA, ADR | 4,886,043 | |||
Total Energy Equipment & Services | 11,855,351 | ||||
| Food & Staples Retailing – 1.0% | |||||
| 278,900 | Kroger Co. | 8,051,843 | |||
| Food Products – 6.8% | |||||
| 121,896 | Cresud, Inc. | 1,811,375 | |||
| 1,286,900 | Smithfield Foods, Inc., (2) | 25,583,572 | |||
42
| Shares | Description (1) | Value | |||
| Food Products (continued) | |||||
| 1,651,000 | Tyson Foods, Inc., Class A | $ | 24,665,940 | ||
Total Food Products | 52,060,887 | ||||
| Health Care Providers & Services – 4.1% | |||||
| 901,500 | Apria Healthcare Group Inc., (2) | 17,480,085 | |||
| 424,400 | Health Net Inc., (2) | 10,211,064 | |||
| 88,600 | Humana Inc., (2) | 3,523,622 | |||
Total Health Care Providers & Services | 31,214,771 | ||||
| Household Durables – 0.7% | |||||
| 271,000 | Sekisui House, Ltd., Sponsored ADR | 2,523,010 | |||
| 2,628,009 | Woodbridge Holdings Corporation | 3,048,490 | |||
Total Household Durables | 5,571,500 | ||||
| Household Products – 1.1% | |||||
| 32,500 | KAO Corporation, Sponsored ADR | 8,538,514 | |||
| Internet Software & Services – 0.5% | |||||
| 153,300 | eBay Inc., (2) | 4,189,689 | |||
| IT Services – 0.9% | |||||
| 286,300 | Electronic Data Systems Corporation | 7,054,432 | |||
| Machinery – 1.4% | |||||
| 184,300 | AGCO Corporation, (2) | 9,659,163 | |||
| 52,600 | Alamo Group Inc. | 1,083,034 | |||
Total Machinery | 10,742,197 | ||||
| Media – 0.8% | |||||
| 220,700 | Scholastic Corporation, (2) | 6,325,262 | |||
| Metals & Mining – 23.9% | |||||
| 116,900 | Alumina Limited, Sponsored ADR | 2,118,228 | |||
| 750,957 | AngloGold Ashanti Limited, Sponsored ADR | 25,487,481 | |||
| 927,300 | Apex Silver Mines Limited, (2) | 4,553,043 | |||
| 314,700 | Banro Corporation, (2) | 2,218,635 | |||
| 771,300 | Barrick Gold Corporation | 35,094,150 | |||
| 2,156,100 | Crystallex International Corporation, (2) | 2,414,832 | |||
| 987,600 | Gold Fields Limited, Sponsored ADR | 12,493,140 | |||
| 590,000 | Gold Reserve Inc., Class A, (2) | 1,062,000 | |||
| 1,204,200 | Ivanhoe Mines Ltd., (2) | 13,137,822 | |||
| 902,300 | Kinross Gold Corporation | 21,303,303 | |||
| 389,700 | Lihir Gold Limited, Sponsored ADR | 12,380,769 | |||
| 313,600 | Newcrest Mining Limited, Sponsored ADR | 8,817,711 | |||
| 703,700 | Newmont Mining Corporation | 36,704,992 | |||
| 290,100 | NovaGold Resources Inc., (2) | 2,161,245 | |||
| 3,608,100 | Orezone Resources Inc., (2) | 4,329,720 | |||
Total Metals & Mining | 184,277,071 | ||||
| Multi-Utilities – 0.4% | |||||
| 122,600 | Puget Energy, Inc. | 2,941,174 | |||
43
Portfolio of Investments
Nuveen Tradewinds Value Opportunities Fund (continued)
June 30, 2008
| Shares | Description (1) | Value | |||
| Oil, Gas & Consumable Fuels – 5.0% | |||||
| 101,100 | Chevron Corporation | $ | 10,022,043 | ||
| 134,300 | Nexen Inc. | 5,338,425 | |||
| 93,000 | Peabody Energy Corporation | 8,188,650 | |||
| 60,800 | Petro-Canada | 3,389,600 | |||
| 156,200 | Tesoro Petroleum Corporation | 3,088,074 | |||
| 805,600 | USEC Inc., (2) | 4,898,048 | |||
| 254,300 | Warren Resources Inc., (2) | 3,733,124 | |||
Total Oil, Gas & Consumable Fuels | 38,657,964 | ||||
| Paper & Forest Products – 2.4% | |||||
| 559,200 | AbitibiBowater Inc., (2) | 5,217,336 | |||
| 2,185,700 | Domtar Corporation, (2) | 11,912,065 | |||
| 168,300 | Wausau Paper Corp. | 1,297,593 | |||
Total Paper & Forest Products | 18,426,994 | ||||
| Pharmaceuticals – 1.5% | |||||
| 651,800 | Pfizer Inc. | 11,386,946 | |||
| Road & Rail – 0.2% | |||||
| 18,000 | Union Pacific Corporation | 1,359,000 | |||
| Semiconductors & Equipment – 0.9% | |||||
| 690,700 | Axcelis Technologies Inc., (2) | 3,370,616 | |||
| 800,200 | Mattson Technology, Inc., (2) | 3,808,952 | |||
Total Semiconductors & Equipment | 7,179,568 | ||||
| Software – 0.7% | |||||
| 100,000 | Microsoft Corporation | 2,751,000 | |||
| 1,102,300 | Sega Sammy Holdings Inc., Sponsored ADR | 2,407,313 | |||
Total Software | 5,158,313 | ||||
| Water Utilities – 0.3% | |||||
| 50,700 | Companhia de Saneamento Basico do Estado de Sao Paulo, ADR | 2,593,811 | |||
| Wireless Telecommunication Services – 0.4% | |||||
| 216,600 | Turkcell Ilietisim Hizmetleri A.S | 3,151,530 | |||
| Total Common Stocks (cost $621,050,145) | 609,956,841 | ||||
| Shares | Description (1) | Coupon | Ratings (3) | Value | |||||
| CONVERTIBLE PREFERRED SECURITIES – 2.9% | |||||||||
| Communications Equipment – 2.9% | |||||||||
| 29,000 | Lucent Technologies Capital Trust I | 7.750% | B2 | $ | 22,040,000 | ||||
| Total Convertible Preferred Securities (cost $25,187,000) | 22,040,000 | ||||||||
44
| Principal Amount (000) | Description (1) | Coupon | Maturity | Ratings (3) | Value | |||||||
| CONVERTIBLE BONDS – 11.6% | ||||||||||||
| Airlines – 2.0% | ||||||||||||
| $ | 8,200 | ExpressJet Inc. | 4.250% | 8/01/23 | N/A | $ | 5,740,000 | |||||
| 10,131 | JetBlue Airways Corporation | 3.500% | 7/15/33 | CCC | 10,105,673 | |||||||
| 18,331 | Total Airlines | 15,845,673 | ||||||||||
| Commercial Services & Supplies – 1.6% | ||||||||||||
| 12,735 | Allied Waste Industries Inc., Convertible Debentures | 4.250% | 4/15/34 | B+ | 12,161,925 | |||||||
| Communications Equipment – 0.3% | ||||||||||||
| 2,705 | Audiocodes Limited, Convertible Bond | 2.000% | 11/09/24 | N/A | 2,556,225 | |||||||
| Computers & Peripherals – 0.0% | ||||||||||||
| 132 | Adaptec Inc. | 0.750% | 12/22/23 | CCC+ | 129,525 | |||||||
| Health Care Providers & Services – 1.9% | ||||||||||||
| 19,100 | Omnicare, Inc. | 3.250% | 12/15/35 | B+ | 14,372,750 | |||||||
| Machinery – 1.5% | ||||||||||||
| 12,130 | Albany International Corporation, Convertible Bond | 2.250% | 3/15/26 | N/A | 11,296,063 | |||||||
| Metals & Mining – 0.9% | ||||||||||||
| 193 | Apex Silver Mines Limited | 2.875% | 3/15/24 | N/A | 101,325 | |||||||
| 5,922 | Coeur d’Alene Mines Corporation, Convertible Bond | 1.250% | 1/15/24 | B– | 4,967,078 | |||||||
| 3,018 | Gold Reserve, Inc., Convertible Bonds | 5.500% | 6/15/22 | N/A | 1,690,080 | |||||||
| 9,133 | Total Metals & Mining | 6,758,483 | ||||||||||
| Oil, Gas & Consumable Fuels – 1.5% | ||||||||||||
| 15,035 | USEC Inc., Convertible Bond | 3.000% | 10/01/14 | CCC | 11,313,836 | |||||||
| Semiconductors & Equipment – 1.0% | ||||||||||||
| 6,457 | Credence Systems Corporation, Convertible Bond | 3.500% | 5/15/10 | N/R | 5,585,305 | |||||||
| 3,600 | Qimonda Finance LLC, Convertible Bond | 6.750% | 3/22/13 | N/A | 2,605,500 | |||||||
| 10,057 | Total Semiconductors & Equipment | 8,190,805 | ||||||||||
| Wireless Telecommunication Services – 0.9% | ||||||||||||
| 8,040 | NII Holdings Inc. | 3.125% | 6/15/12 | N/A | 6,813,900 | |||||||
| $ | 107,398 | Total Convertible Bonds (cost $95,259,990) | 89,439,185 | |||||||||
| Principal Amount (000) | Description (1) | Coupon | Maturity | Value | ||||||||
| SHORT-TERM INVESTMENTS – 7.4% | ||||||||||||
| $ | 57,216 | Repurchase Agreement with Fixed Income Clearing Corporation, dated 6/30/08, repurchase price $57,218,134, collateralized by $55,715,000 U.S. Treasury Notes, 4.500%, due 5/15/17, value $58,361,463 | 1.350% | 7/01/08 | $ | 57,215,988 | ||||||
| Total Short-Term Investments (cost $57,215,988) | 57,215,988 | |||||||||||
| Total Investments (cost $798,713,123) – 101.1% | 778,652,014 | |||||||||||
| Other Assets Less Liabilities – (1.1)% | (8,630,646) | |||||||||||
| Net Assets – 100% | $ | 770,021,368 | ||||||||||
| (1) | All percentages shown in the Portfolio of Investments are based on net assets. |
| (2) | Non-income producing. |
| (3) | Ratings (not covered by the report of independent registered public accounting firm): Using the higher of Standard & Poor’s Group (“Standard & Poor’s”) or Moody’s Investor Service, Inc. (“Moody’s”) rating. Ratings below BBB by Standard & Poor’s or Baa by Moody’s are considered to be below investment grade. |
| N/A | Not available. |
| N/R | Not rated. |
| 144A | Investment is exempt from registration under Rule 144A of the Securities Act of 1933, as amended. These investments may only be resold in transactions exempt from registration which are normally those transactions with qualified institutional buyers. |
| ADR | American Depositary Receipt. |
See accompanying notes to financial statements.
45
Statement of Assets and Liabilities
June 30, 2008
| Multi-Cap Value | Large-Cap Value | Small/Mid- Cap Value | Small-Cap Value | Global Value (1) | Value Opportunities | |||||||||||||||||||
Assets | ||||||||||||||||||||||||
Investments, at value (cost $874,641,014, $25,558,894, $46,482,558, $183,007,479, $14,791,536 and $741,497,135, respectively) | $ | 783,933,467 | $ | 22,095,783 | $ | 39,828,306 | $ | 161,680,545 | $ | 14,360,416 | $ | 721,436,026 | ||||||||||||
Short-term investments (at cost, which approximates value) | 12,809,961 | 1,673,538 | 2,821,333 | 13,044,695 | 116,893 | 57,215,988 | ||||||||||||||||||
Cash | — | 900 | — | — | — | — | ||||||||||||||||||
Cash denominated in foreign currencies (cost $0, $0, $0, $0, $13,325 and $0, respectively) | — | — | — | — | 12,571 | — | ||||||||||||||||||
Receivables: | ||||||||||||||||||||||||
Dividends | 1,216,094 | 27,897 | 28,949 | 111,304 | 18,697 | 620,002 | ||||||||||||||||||
Interest | 480 | 63 | 106 | 489 | — | 829,423 | ||||||||||||||||||
Investments sold | 1,228,602 | 8,253 | 771,038 | 1,261,551 | 26,936 | 2,912,112 | ||||||||||||||||||
Reclaims | 1,965 | 2,652 | — | 3,696 | 2,416 | 586 | ||||||||||||||||||
Shares sold | 1,497,659 | 372,253 | 194,470 | 200,775 | 19,164 | 10,551,440 | ||||||||||||||||||
Other assets | 39,878 | — | 64 | 170 | 23 | 8,722 | ||||||||||||||||||
Total assets | 800,728,106 | 24,181,339 | 43,644,266 | 176,303,225 | 14,557,116 | 793,574,299 | ||||||||||||||||||
Liabilities | ||||||||||||||||||||||||
Payables: | ||||||||||||||||||||||||
Investments purchased | — | — | 253,992 | 3,193,759 | — | 21,353,300 | ||||||||||||||||||
Shares redeemed | 4,742,824 | 12,418 | 33,922 | 444,350 | 16,590 | 1,141,920 | ||||||||||||||||||
Accrued expenses: | ||||||||||||||||||||||||
Management fees | 570,652 | 14,180 | 29,000 | 150,121 | 9,415 | 594,779 | ||||||||||||||||||
12b-1 distribution and service fees | 264,522 | 3,966 | 1,933 | 20,877 | 6,498 | 174,090 | ||||||||||||||||||
Other | 988,111 | 33,306 | 27,109 | 109,439 | 27,181 | 288,842 | ||||||||||||||||||
Total liabilities | 6,566,109 | 63,870 | 345,956 | 3,918,546 | 59,684 | 23,552,931 | ||||||||||||||||||
Net assets | $ | 794,161,997 | $ | 24,117,469 | $ | 43,298,310 | $ | 172,384,679 | $ | 14,497,432 | $ | 770,021,368 | ||||||||||||
Class A Shares | ||||||||||||||||||||||||
Net assets | $ | 293,777,032 | $ | 5,080,001 | $ | 3,595,093 | $ | 54,264,351 | $ | 3,419,660 | $ | 368,093,208 | ||||||||||||
Shares outstanding | 15,844,366 | 291,822 | 209,951 | 2,329,869 | 145,027 | 12,435,379 | ||||||||||||||||||
Net asset value per share | $ | 18.54 | $ | 17.41 | $ | 17.12 | $ | 23.29 | $ | 23.58 | $ | 29.60 | ||||||||||||
Offering price per share (net asset value per share plus maximum sales charge of 5.75% of offering price) | $ | 19.67 | $ | 18.47 | $ | 18.16 | $ | 24.71 | $ | 25.02 | $ | 31.41 | ||||||||||||
Class B Shares | ||||||||||||||||||||||||
Net assets | $ | 36,023,557 | $ | 834,741 | $ | 36,308 | $ | 374,233 | $ | 646,615 | $ | 6,815,578 | ||||||||||||
Shares outstanding | 1,989,811 | 48,308 | 2,149 | 16,417 | 27,708 | 232,684 | ||||||||||||||||||
Net asset value and offering price per share | $ | 18.10 | $ | 17.28 | $ | 16.90 | $ | 22.80 | $ | 23.34 | $ | 29.29 | ||||||||||||
Class C Shares | ||||||||||||||||||||||||
Net assets | $ | 189,475,258 | $ | 2,483,862 | $ | 1,093,210 | $ | 9,682,130 | $ | 6,035,055 | $ | 116,463,333 | ||||||||||||
Shares outstanding | 10,466,801 | 143,729 | 64,599 | 424,150 | 258,419 | 3,975,786 | ||||||||||||||||||
Net asset value and offering price per share | $ | 18.10 | $ | 17.28 | $ | 16.92 | $ | 22.83 | $ | 23.35 | $ | 29.29 | ||||||||||||
Class I Shares (2) | ||||||||||||||||||||||||
Net assets | $ | 274,886,150 | $ | 15,718,865 | $ | 38,573,699 | $ | 108,063,965 | $ | 4,396,102 | $ | 278,649,249 | ||||||||||||
Shares outstanding | 14,862,198 | 901,924 | 2,253,934 | 4,630,471 | 186,014 | 9,395,650 | ||||||||||||||||||
Net asset value and offering price per share | $ | 18.50 | $ | 17.43 | $ | 17.11 | $ | 23.34 | $ | 23.63 | $ | 29.66 | ||||||||||||
Net Assets Consist of: | ||||||||||||||||||||||||
Capital paid-in | $ | 928,873,968 | $ | 28,038,136 | $ | 63,018,872 | $ | 196,375,069 | $ | 14,361,608 | $ | 763,882,753 | ||||||||||||
Undistributed (Over-distribution of) net investment income | (38,774 | ) | 80,201 | — | — | (24,960 | ) | (4,918,826 | ) | |||||||||||||||
Accumulated net realized gain (loss) from investments, foreign currency and derivative transactions | (43,965,432 | ) | (537,757 | ) | (13,066,310 | ) | (2,663,456 | ) | 592,276 | 31,118,858 | ||||||||||||||
Net unrealized appreciation (depreciation) of investments and foreign currency | (90,707,765 | ) | (3,463,111 | ) | (6,654,252 | ) | (21,326,934 | ) | (431,492 | ) | (20,061,417 | ) | ||||||||||||
Net assets | $ | 794,161,997 | $ | 24,117,469 | $ | 43,298,310 | $ | 172,384,679 | $ | 14,497,432 | $ | 770,021,368 | ||||||||||||
| (1) | Effective August 1, 2008, Nuveen Global Value Fund changed its name to Nuveen Growth Allocation Fund. |
| (2) | Effective May 1, 2008, Class R Shares were renamed Class I Shares. |
See accompanying notes to financial statements.
46
Statement of Operations
Year Ended June 30, 2008
Multi-Cap Value | Large-Cap Value | Small/Mid- Cap Value | Small-Cap Value | Global Value (1) | Value Opportunities | |||||||||||||||||||
Investment Income | ||||||||||||||||||||||||
Dividends (net of foreign tax withheld of $204,214, $2,523, $0, $0, $19,817 and $269,997, respectively) | $ | 15,729,351 | $ | 336,852 | $ | 867,089 | $ | 2,116,690 | $ | 349,158 | $ | 7,448,381 | ||||||||||||
Interest (net of foreign tax withheld of $0, $0, $0, $0, $0 and $10,835, respectively) | 1,293,157 | 58,759 | 195,431 | 395,103 | 12,818 | 4,926,383 | ||||||||||||||||||
Total investment income | 17,022,508 | 395,611 | 1,062,520 | 2,511,793 | 361,976 | 12,374,764 | ||||||||||||||||||
Expenses | ||||||||||||||||||||||||
Management fees | 9,181,178 | 157,028 | 1,031,235 | 1,888,991 | 179,332 | 5,813,799 | ||||||||||||||||||
12b-1 service fees – Class A | 1,088,508 | 12,808 | 8,275 | 155,618 | 12,502 | 741,699 | ||||||||||||||||||
12b-1 distribution and service fees – Class B | 534,960 | 5,624 | 973 | 5,758 | 7,263 | 60,497 | ||||||||||||||||||
12b-1 distribution and service fees – Class C | 2,981,960 | 24,688 | 11,062 | 129,229 | 77,761 | 1,056,999 | ||||||||||||||||||
Shareholders’ servicing agent fees and expenses | 2,166,575 | 21,038 | 147,030 | 233,972 | 25,751 | 712,045 | ||||||||||||||||||
Custodian’s fees and expenses | 178,535 | 9,234 | 31,444 | 37,438 | 18,248 | 100,051 | ||||||||||||||||||
Trustees’ fees and expenses | 30,683 | 467 | 3,217 | 4,927 | 638 | 13,701 | ||||||||||||||||||
Professional fees | 151,812 | 14,184 | 17,761 | 31,101 | 14,801 | 74,646 | ||||||||||||||||||
Shareholders’ reports – printing and mailing expenses | 438,842 | 721 | 4,646 | 65,318 | 8,440 | 155,556 | ||||||||||||||||||
Federal and state registration fees | 146,425 | 59,365 | 50,123 | 87,210 | 75,473 | 144,097 | ||||||||||||||||||
Other expenses | 44,041 | 2,348 | 5,851 | 8,403 | 2,450 | 20,535 | ||||||||||||||||||
Total expenses before custodian fee credit and expense reimbursement | 16,943,519 | 307,505 | 1,311,617 | 2,647,965 | 422,659 | 8,893,625 | ||||||||||||||||||
Custodian fee credit | (5,285 | ) | (434 | ) | (7,456 | ) | (446 | ) | (3,978 | ) | (25,754 | ) | ||||||||||||
Expense reimbursement | — | (60,419 | ) | (9,297 | ) | — | (63,875 | ) | — | |||||||||||||||
Net expenses | 16,938,234 | 246,652 | 1,294,864 | 2,647,519 | 354,806 | 8,867,871 | ||||||||||||||||||
Net investment income (loss) | 84,274 | 148,959 | (232,344 | ) | (135,726 | ) | 7,170 | 3,506,893 | ||||||||||||||||
Realized and Unrealized Gain (Loss) | ||||||||||||||||||||||||
Net realized gain (loss) from: | (46,695,377 | ) | (537,756 | ) | (12,863,794 | ) | (2,486,235 | ) | 981,497 | 48,625,708 | ||||||||||||||
Foreign currency | — | — | — | — | (8,952 | ) | (254 | ) | ||||||||||||||||
Redemptions in-kind | — | — | (12,286,275 | ) | — | — | — | |||||||||||||||||
Change in net unrealized appreciation (depreciation) of: | (293,616,538 | ) | (3,537,399 | ) | (1,437,205 | ) | (43,296,876 | ) | (2,939,093 | ) | (70,243,058 | ) | ||||||||||||
Foreign currency | (218 | ) | — | — | — | (26 | ) | (295 | ) | |||||||||||||||
Net realized and unrealized gain (loss) | (340,312,133 | ) | (4,075,155 | ) | (26,587,274 | ) | (45,783,111 | ) | (1,966,574 | ) | (21,617,899 | ) | ||||||||||||
Net increase (decrease) in net assets from operations | $ | (340,227,859 | ) | $ | (3,926,196 | ) | $ | (26,819,618 | ) | $ | (45,918,837 | ) | $ | (1,959,404 | ) | $ | (18,111,006 | ) | ||||||
| (1) | Effective August 1, 2008, Nuveen Global Value Fund changed its name to Nuveen Growth Allocation Fund. |
See accompanying notes to financial statements.
47
Statement of Changes in Net Assets
| Multi-Cap Value | Large-Cap Value | Small/Mid-Cap Value | ||||||||||||||||||||||
| Year Ended 6/30/08 | Year Ended 6/30/07 | Year Ended 6/30/08 | For the Period 12/15/06 (commencement of operations) through 6/30/07 | Year Ended 6/30/08 | For the Period 12/15/06 (commencement of operations) through 6/30/07 | |||||||||||||||||||
Operations | ||||||||||||||||||||||||
Net investment income (loss) | $ | 84,274 | $ | 6,391,221 | $ | 148,959 | $ | 23,308 | $ | (232,344 | ) | $ | 487,097 | |||||||||||
Net realized gain (loss) from: | ||||||||||||||||||||||||
Investments | (46,695,377 | ) | 91,028,279 | (537,756 | ) | 2,383 | (12,863,794 | ) | 36,933 | |||||||||||||||
Foreign currency | — | (283 | ) | — | — | — | — | |||||||||||||||||
Futures | — | — | — | — | — | (862,861 | ) | |||||||||||||||||
Redemptions in-kind | — | — | — | — | (12,286,275 | ) | — | |||||||||||||||||
Change in net unrealized appreciation (depreciation) of: | ||||||||||||||||||||||||
Investments | (293,616,538 | ) | 84,696,120 | (3,537,399 | ) | 74,288 | (1,437,205 | ) | (5,217,047 | ) | ||||||||||||||
Foreign currency | (218 | ) | 38 | — | — | — | — | |||||||||||||||||
Net increase (decrease) in net assets from operations | (340,227,859 | ) | 182,115,375 | (3,926,196 | ) | 99,979 | (26,819,618 | ) | (5,555,878 | ) | ||||||||||||||
Distributions to Shareholders | ||||||||||||||||||||||||
Net investment income: | ||||||||||||||||||||||||
Class A | (319,967 | ) | (2,927,086 | ) | (20,911 | ) | — | (413 | ) | — | ||||||||||||||
Class B | — | — | — | — | — | — | ||||||||||||||||||
Class C | — | — | — | — | — | — | ||||||||||||||||||
Class I (1) | (485,483 | ) | (2,069,137 | ) | (72,607 | ) | — | (487,049 | ) | — | ||||||||||||||
From accumulated net realized gains: | ||||||||||||||||||||||||
Class A | (17,840,823 | ) | (24,405,454 | ) | (694 | ) | — | — | — | |||||||||||||||
Class B | (2,285,419 | ) | (3,122,917 | ) | (81 | ) | — | — | — | |||||||||||||||
Class C | (12,664,308 | ) | (17,573,222 | ) | (342 | ) | — | — | — | |||||||||||||||
Class I (1) | (15,616,418 | ) | (12,137,413 | ) | (1,364 | ) | — | — | — | |||||||||||||||
Tax return of capital: | ||||||||||||||||||||||||
Class A | (1,415,298 | ) | — | — | — | — | — | |||||||||||||||||
Class B | — | — | — | — | — | — | ||||||||||||||||||
Class C | — | — | — | — | — | — | ||||||||||||||||||
Class I (1) | (2,147,421 | ) | — | — | — | — | — | |||||||||||||||||
Decrease in net assets from distributions to shareholders | (52,775,137 | ) | (62,235,229 | ) | (95,999 | ) | — | (487,462 | ) | — | ||||||||||||||
Fund Share Transactions | ||||||||||||||||||||||||
Proceeds from sale of shares | 342,932,823 | 556,975,927 | 23,857,076 | 12,296,588 | 49,652,728 | 228,388,120 | ||||||||||||||||||
Proceeds from shares issued to shareholders due | 47,921,628 | 55,329,374 | 81,088 | — | 485,206 | — | ||||||||||||||||||
| 390,854,451 | 612,305,301 | 23,938,164 | 12,296,588 | 50,137,934 | 228,388,120 | |||||||||||||||||||
Cost of shares redeemed | (704,297,666 | ) | (220,159,751 | ) | (8,067,479 | ) | (127,588 | ) | (39,369,459 | ) | (3,609,137 | ) | ||||||||||||
Cost of redemptions in-kind | — | — | — | — | (159,386,190 | ) | — | |||||||||||||||||
Net increase (decrease) in net assets from Fund | (313,443,215 | ) | 392,145,550 | 15,870,685 | 12,169,000 | (148,617,715 | ) | 224,778,983 | ||||||||||||||||
Net increase (decrease) in net assets | (706,446,211 | ) | 512,025,696 | 11,848,490 | 12,268,979 | (175,924,795 | ) | 219,223,105 | ||||||||||||||||
Net assets at the beginning of period | 1,500,608,208 | 988,582,512 | 12,268,979 | — | 219,223,105 | — | ||||||||||||||||||
Net assets at the end of period | $ | 794,161,997 | $ | 1,500,608,208 | $ | 24,117,469 | $ | 12,268,979 | $ | 43,298,310 | $ | 219,223,105 | ||||||||||||
Undistributed (Over-distribution of) net investment income at the end of period | $ | (38,774 | ) | $ | 3,301,502 | $ | 80,201 | $ | 24,811 | $ | — | $ | 488,462 | |||||||||||
| (1) | Effective May 1, 2008, Class R Shares were renamed Class I Shares. |
See accompanying notes to financial statements.
48
| Small-Cap Value | Global Value (1) | Value Opportunities | ||||||||||||||||||||||
| Year Ended 6/30/08 | Year Ended 6/30/07 | Year Ended 6/30/08 | Year Ended 6/31/07 | Year Ended 6/30/08 | Year Ended 6/31/07 | |||||||||||||||||||
Operations | ||||||||||||||||||||||||
Net investment income (loss) | $ | (135,726 | ) | $ | 775,562 | $ | 7,170 | $ | 76,101 | $ | 3,506,893 | $ | 2,760,445 | |||||||||||
Net realized gain (loss) from: | (2,486,235 | ) | 5,290,173 | 981,497 | 884,733 | 48,625,708 | 10,410,719 | |||||||||||||||||
Foreign currency | — | — | (8,952 | ) | (9,282 | ) | (254 | ) | 11 | |||||||||||||||
Futures | — | — | — | — | — | — | ||||||||||||||||||
Redemptions in-kind | — | — | — | — | — | — | ||||||||||||||||||
Change in net unrealized appreciation (depreciation) of: | ||||||||||||||||||||||||
Investments | (43,296,876 | ) | 19,476,662 | (2,939,093 | ) | 2,059,637 | (70,243,058 | ) | 47,264,768 | |||||||||||||||
Foreign currency | — | — | (26 | ) | (426 | ) | (295 | ) | (10 | ) | ||||||||||||||
Net increase (decrease) in net assets from operations | (45,918,837 | ) | 25,542,397 | (1,959,404 | ) | 3,010,763 | (18,111,006 | ) | 60,435,933 | |||||||||||||||
Distributions to Shareholders | ||||||||||||||||||||||||
Net investment income: | ||||||||||||||||||||||||
Class A | (48,704 | ) | (88,033 | ) | (45,537 | ) | (46,899 | ) | (5,368,016 | ) | (1,500,116 | ) | ||||||||||||
Class B | — | — | (488 | ) | — | (67,198 | ) | (8,089 | ) | |||||||||||||||
Class C | — | — | (5,220 | ) | — | (1,191,878 | ) | (155,520 | ) | |||||||||||||||
Class I (2) | (373,600 | ) | (303,731 | ) | (53,512 | ) | (39,526 | ) | (3,787,679 | ) | (836,917 | ) | ||||||||||||
From accumulated net realized gains: | ||||||||||||||||||||||||
Class A | (1,644,070 | ) | (229,525 | ) | (269,734 | ) | (156,985 | ) | (12,301,149 | ) | (1,310,367 | ) | ||||||||||||
Class B | (17,075 | ) | (2,312 | ) | (39,043 | ) | (13,787 | ) | (267,415 | ) | (24,048 | ) | ||||||||||||
Class C | (357,868 | ) | (57,179 | ) | (421,581 | ) | (137,778 | ) | (4,745,567 | ) | (462,457 | ) | ||||||||||||
Class I (2) | (3,093,051 | ) | (329,848 | ) | (238,207 | ) | (102,310 | ) | (7,857,520 | ) | (563,686 | ) | ||||||||||||
Tax return of capital: | ||||||||||||||||||||||||
Class A | (6,531 | ) | — | — | — | — | — | |||||||||||||||||
Class B | — | — | — | — | — | — | ||||||||||||||||||
Class C | — | — | — | — | — | — | ||||||||||||||||||
Class I (1) | (50,092 | ) | — | — | — | — | — | |||||||||||||||||
Decrease in net assets from distributions to shareholders | (5,590,991 | ) | (1,010,628 | ) | (1,073,322 | ) | (497,285 | ) | (35,586,422 | ) | (4,861,200 | ) | ||||||||||||
Fund Share Transactions | ||||||||||||||||||||||||
Proceeds from sale of shares | 46,853,684 | 170,488,119 | 2,945,449 | 10,675,292 | 453,732,611 | 358,261,389 | ||||||||||||||||||
Proceeds from shares issued to shareholders due | 4,509,429 | 817,942 | 690,894 | 343,018 | 27,921,650 | 3,418,775 | ||||||||||||||||||
| 51,363,113 | 171,306,061 | 3,636,343 | 11,018,310 | 481,654,261 | 361,680,164 | |||||||||||||||||||
Cost of shares redeemed | (56,058,090 | ) | (21,905,595 | ) | (7,385,461 | ) | (3,464,488 | ) | (173,862,467 | ) | (35,252,078 | ) | ||||||||||||
Cost of redemptions in-kind | — | — | — | — | — | — | ||||||||||||||||||
Net increase (decrease) in net assets from Fund | (4,694,977 | ) | 149,400,466 | (3,749,118 | ) | 7,553,822 | 307,791,794 | 326,428,086 | ||||||||||||||||
Net increase (decrease) in net assets | (56,204,805 | ) | 173,932,235 | (6,781,844 | ) | 10,067,300 | 254,094,366 | 382,002,819 | ||||||||||||||||
Net assets at the beginning of period | 228,589,484 | 54,657,249 | 21,279,276 | 11,211,976 | 515,927,002 | 133,924,183 | ||||||||||||||||||
Net assets at the end of period | $ | 172,384,679 | $ | 228,589,484 | $ | 14,497,432 | $ | 21,279,276 | $ | 770,021,368 | $ | 515,927,002 | ||||||||||||
Undistributed (Over-distribution of) net investment income at the | $ | — | $ | 421,365 | $ | (24,960 | ) | $ | 21,526 | $ | (4,918,826 | ) | $ | 619,195 | ||||||||||
| (1) | Effective August 1, 2008, Nuveen Global Value Fund changed its name to Nuveen Growth Allocation Fund. |
| (2) | Effective May 1, 2008, Class R Shares were renamed Class I Shares. |
See accompanying notes to financial statements.
49
Notes to Financial Statements
1. General Information and Significant Accounting Policies
The Nuveen Investment Trust (the “Trust”) is an open-end management investment company registered under the Investment Company Act of 1940, as amended. The Trust is comprised of the Nuveen NWQ Multi-Cap Value Fund (“Multi-Cap Value”), Nuveen NWQ Large-Cap Value Fund (“Large-Cap Value”), Nuveen NWQ Small/Mid-Cap Value Fund (“Small/Mid-Cap Value”), Nuveen NWQ Small-Cap Value Fund (“Small-Cap Value”), Nuveen Global Value Fund (“Global Value”) (formerly Nuveen NWQ Global Value Fund) (currently Nuveen Growth Allocation Fund) and Nuveen Tradewinds Value Opportunities Fund (“Value Opportunities”) (collectively, the “Funds”), among others. The Trust was organized as a Massachusetts business trust in 1996.
As previously approved by the Fund’s Board of Trustees, effective October 16, 2007, the Nuveen NWQ Global Value Fund changed its name to Nuveen Global Value Fund.
Multi-Cap Value ordinarily invests at least 80% of its assets in equity securities of companies with large, medium and small capitalizations that are selected on an opportunistic basis in an attempt to provide long-term capital appreciation. The Fund primarily invests in equity securities of companies domiciled in the U.S. but may also invest up to 35% of its net assets in equity securities on non-U.S. companies, including up to 10% of its net assets invested in equity securities on companies domiciled in emerging markets.
Large-Cap Value ordinarily invests at least 80% of its net assets in equity securities of companies with market capitalizations at the time of investment comparable to companies in the Russell 1000 Index in an attempt to provide long-term capital appreciation. The Fund primarily invests in equity securities of companies domiciled in the U.S. but may also invest up to 35% of its net assets in equity securities on non-U.S. companies, including up to 10% of its net assets invested in equity securities on companies domiciled in emerging markets.
Small/Mid-Cap Value ordinarily invests at least 80% of its net assets in equity securities of companies with market capitalizations at the time of investment comparable to companies in the Russell 2500 Index in an attempt to provide long-term capital appreciation. The Fund primarily invests in equity securities of companies domiciled in the U.S. but may also invest up to 35% of its net assets in equity securities on non-U.S. companies, including up to 10% of its net assets invested in equity securities on companies domiciled in emerging markets.
Small-Cap Value ordinarily invests at least 80% of its net assets in equity securities of companies with small capitalizations at the time of purchase that are selected on an opportunistic basis in an attempt to provide long-term capital appreciation. The Fund primarily invests in equity securities of companies domiciled in the U.S. but may also invest up to 35% of its net assets in equity securities on non-U.S. companies, including up to 10% of its net assets invested in equity securities on companies domiciled in emerging markets.
Global Value ordinarily invested at least 80% of its net assets in equity securities of U.S. and non-U.S. companies in an attempt to provide long-term capital appreciation. The proportion of assets invested in foreign investments would fluctuate but generally was within 15 percentage points of the proportion of non-U.S. companies comprising the MSCI World Index. The Fund would also invest up to 10% of its assets in equity securities of non-U.S. companies domiciled in emerging markets. As described in detail in Footnote 7, Global Value changed its name and investment strategy effective August 1, 2008.
Value Opportunities net assets will primarily be invested in equity securities of companies with varying market capitalizations, and may include small-, mid- and large-capitalization companies. Eligible equity securities will include convertible securities. The Fund primarily invests in equity securities of companies domiciled in the U.S. but may also invest up to 35% of its net assets in equity securities on non-U.S. companies, including up to 10% of its net assets invested in equity securities on companies domiciled in emerging markets.
On March 31, 2008, the Nuveen Mutual Funds announced the following policy changes applicable to the Funds, effective May 1, 2008:
| • | For Class A Share purchases at net asset value of $1 million or more that are subject to a contingent deferred sales charge (“CDSC”), the period over which the CDSC will apply has been reduced from eighteen months to twelve months for all purchases occurring on or after May 1, 2007. Class A Shares purchased prior to May 1, 2007 that have not been redeemed are no longer be subject to a CDSC; |
| • | Class B Shares will only be issued (i) upon the exchange of Class B Shares from another Nuveen fund, (ii) for purposes of dividend reinvestment, and (iii) through December 31, 2008, for defined contribution plans and investors using automatic investment plans with investments in Class B Shares as of March 31, 2008. The reinstatement privilege for Class B Shares will no longer be available as of December 31, 2008; |
| • | Class R Shares have been renamed Class I Shares and are available for (i) purchases of $1 million or more, (ii) purchases using dividends and capital gains distributions on Class I Shares and (iii) purchase by limited categories of investors. |
The following is a summary of significant accounting policies followed by the Funds in the preparation of their financial statements in accordance with accounting principles generally accepted in the United States.
Investment Valuation
Exchange-listed securities are generally valued at the last sales price on the securities exchange on which such securities are primarily traded. Securities traded on a securities exchange for which there are no transactions on a given day or securities not listed
50
on a securities exchange are valued at the mean of the closing bid and asked prices. Securities traded on Nasdaq are valued at the Nasdaq Official Closing Price. If significant market events occur between the time of the determination of the closing price of a foreign security on an exchange and the time that the Funds’ NAV is determined, or if under the Funds’ procedures, the closing price of a foreign security is not deemed to be reliable, and there could be a material effect on the Funds’ NAV, the security would be valued at fair value as determined in accordance with procedures established in good faith by the Board of Trustees. The prices of fixed-income securities are generally provided by an independent pricing service approved by the Funds’ Board of Trustees. When price quotes are not readily available, the pricing service or, in the absence of a pricing service for a particular investment, the Board of Trustees of the Funds, or its designee, may establish fair value using a wide variety of market data including yields or prices of investments of comparable quality, type of issue, coupon, maturity and rating, market quotes or indications of value from securities dealers, evaluations of anticipated cash flows or collateral, general market conditions and other information and analysis, including the obligor’s credit characteristics considered relevant by the pricing service or the Board of Trustees’ designee. Futures contracts are valued using the closing settlement price, or, in the absence of such a price, at the mean of the bid and asked prices. If it is determined that the market price for an investment or derivative instrument is unavailable or inappropriate, the Board of Trustees of the Funds, or its designee, may establish fair value in accordance with procedures established in good faith by the Board of Trustees. Short-term investments are valued at amortized cost, which approximates market value.
Investment Transactions
Investment transactions are recorded on a trade date basis. Realized gains and losses from investment transactions are determined on the specific identification method. Investments purchased on a when-issued/delayed delivery basis may have extended settlement periods. Any investments so purchased are subject to market fluctuation during this period. The Funds have instructed the custodian to segregate assets with a current value at least equal to the amount of the when issued/delayed delivery purchase commitments. At June 30, 2008, there were no such outstanding purchase commitments in any of the Funds.
Investment Income
Dividend income is recorded on the ex-dividend date or, for foreign securities, when information is available. Interest income, which includes the amortization of premiums and accretion of discounts for financial reporting purposes, is recorded on an accrual basis. Interest income also includes paydown gains and losses, if any.
Dividends and Distributions to Shareholders
Distributions to shareholders are recorded on the ex-dividend date. The amount and timing of distributions are determined in accordance with federal income tax regulations, which may differ from accounting principles generally accepted in the United States.
Dividends from net investment income and net realized capital gains from investment transactions, if any, are declared and distributed to shareholders at least annually. Furthermore, capital gains are distributed only to the extent they exceed available capital loss carryforwards.
In-Kind Redemptions
In certain circumstances, a Fund may distribute portfolio securities rather than cash as payment for redemption of Fund shares (in-kind redemption). For financial reporting purposes, the Fund recognizes a gain on the in-kind redemptions to the extent the value of the distributed securities on the date of redemption exceeds the cost of those securities; the Fund recognizes a loss if cost exceeds value. Gains and losses realized on the in-kind redemptions are not recognized for tax purposes, and are reclassified from undistributed realized gain or loss to paid-in capital. During the fiscal year ended June 30, 2008, Small/Mid-Cap Value realized $12,286,275 of net loss on in-kind redemptions.
On June 14, 2007, Small/Mid-Cap Value, with current net assets of $12,395,858, received a $215,000,000 subscription to purchase Fund shares for a single shareholder. On June 15, 2007, NWQ Investment Management Company, LLC (“NWQ”) commenced investment of the shareholder subscription proceeds. On December 31, 2007, the shareholder redeemed $159,386,190, representing the remaining balance in the account at market value. In lieu of selling portfolio positions and settling the redemption in cash, the Fund elected to settle the redemption with an in-kind distribution representing a pro-rated share of each position in the portfolio and a small amount of cash. On January 31, 2008, Nuveen Asset Management (the “Adviser”), a wholly owned subsidiary of Nuveen Investments, Inc. (“Nuveen”), paid $89,561 to the Fund, which amount represents the cost to the Fund from a delay in investing this large shareholder’s subscription proceeds on June 15, 2007.
Income Taxes
Each Fund is a separate taxpayer for federal income tax purposes. Each Fund intends to distribute substantially all of its net investment income and net capital gains to shareholders and to otherwise comply with the requirements of Subchapter M of the Internal Revenue Code applicable to regulated investment companies. Therefore, no federal income tax provision is required.
Effective December 31, 2007, the Funds adopted Financial Accounting Standards Board (FASB) Interpretation No. 48 ‘‘Accounting for Uncertainty in Income Taxes’’ (FIN 48). FIN 48 provides guidance for how uncertain tax positions should be recognized, measured, presented and disclosed in the financial statements. FIN 48 requires the affirmative evaluation of tax positions taken or expected to be taken in the course of preparing the Funds’ tax returns to determine whether it is ‘‘more-likely-than-not’’ (i.e., a greater than 50 percent likelihood) of being sustained by the applicable tax authority. Tax positions not deemed to meet the more-likely-than-not threshold may result in a tax expense in the current year.
51
Notes to Financial Statements (continued)
Implementation of FIN 48 required management of the Funds to analyze all open tax years, as defined by the statute of limitations, for all major jurisdictions, which includes federal and certain states. Open tax years are those that are open for examination by taxing authorities (i.e., generally the last four tax year ends and the interim tax period since then). The Funds have no examinations in progress.
For all open tax years and all major taxing jurisdictions through the end of the reporting period, management of the Funds has reviewed all tax positions taken or expected to be taken in the preparation of the Funds’ tax returns and concluded the adoption of FIN 48 resulted in no impact to the Funds’ net assets or results of operations as of and during the fiscal year ended June 30, 2008.
The Funds are also not aware of any tax positions for which it is reasonably possible that the total amounts of unrecognized tax benefits will significantly change in the next twelve months.
Flexible Sales Charge Program
Each Fund offers Class A, C and I Shares. During the period July 1, 2007 through April 30, 2008, each Fund offered Class B Shares. Class A Shares are generally sold with an up-front sales charge and incur a .25% annual 12b-1 service fee. Class A Share purchases of $1 million or more are sold at net asset value without an up-front sales charge but may be subject to a CDSC if redeemed within twelve months of purchase. Class B Shares were sold without an up-front sales charge but incur a .75% annual 12b-1 distribution fee and a .25% annual 12b-1 service fee. Class B Shares are subject to a CDSC of up to 5% depending upon the length of time the shares are held by the investor (CDSC is reduced to 0% at the end of six years). Class B Shares convert to Class A Shares eight years after purchase. Class C Shares are sold without an up-front sales charge but incur a .75% annual 12b-1 distribution fee and a ..25% annual 12b-1 service fee. Class C Shares are subject to a CDSC of 1% if redeemed within one year of purchase. Class I Shares are not subject to any sales charge or 12b-1 distribution or service fees.
Foreign Currency Transactions
Each Fund is authorized to engage in foreign currency exchange transactions, including foreign currency futures, forward, options and swap contracts. To the extent that the Funds invest in securities and/or contracts that are denominated in a currency other than U.S. dollars, the Funds will be subject to currency risk, which is the risk that an increase in the U.S. dollar relative to the foreign currency will reduce returns or portfolio value. Generally, when the U.S. dollar rises in value against a foreign currency, the Funds’ investments denominated in that currency will lose value because its currency is worth fewer U.S. dollars; the opposite effect occurs if the U.S. dollar falls in relative value. Investments and other assets and liabilities denominated in foreign currencies are converted into U.S. dollars on a spot (i.e. cash) basis at the spot rate prevailing in the foreign currency exchange market at the time of valuation. Purchases and sales of investments and income denominated in foreign currencies are translated into U.S. dollars on the respective dates of such transactions. The gains or losses resulting from changes in foreign exchange rates are included in “Realized gain (loss) from foreign currency” and “Change in unrealized appreciation (depreciation) of foreign currency” on the Statement of Operations.
The books and records of the Funds are maintained in U.S. dollars. Foreign currencies, investments and other assets and liabilities are translated into U.S. dollars at 4:00 p.m. Eastern time. Investments and income and expenses are translated on the respective dates of such transactions. Net realized foreign currency gains and losses resulting from changes in exchange rates include foreign currency gains and losses between trade date and settlement date of the transactions, foreign currency transactions, and the difference between the amounts of interest and dividends recorded on the books of a Fund and the amounts actually received.
Futures Contracts
Each Fund is authorized to invest in futures contracts. Upon entering into a futures contract, a Fund is required to deposit with the broker an amount of cash or liquid securities equal to a specified percentage of the contract amount. This is known as the “initial margin.” Subsequent payments (“variation margin”) are made or received by a Fund each day, depending on the daily fluctuation of the value of the contract.
During the period the futures contract is open, changes in the value of the contract are recognized as an unrealized gain or loss by “marking-to-market” on a daily basis to reflect the changes in market value of the contract. When the contract is closed or expired, a Fund records a realized gain or loss equal to the difference between the value of the contract on the closing date and the value of the contract when originally entered into. Cash held by the broker to cover initial margin requirements on open futures contracts, if any, is recognized in the Statement of Assets and Liabilities. Additionally, the Statement of Assets and Liabilities reflects a receivable or payable for the variation margin when applicable. None of the Funds invested in futures contracts during the fiscal year ended June 30, 2008.
Risks of investments in futures contracts include the possible adverse movement of the securities or indices underlying the contracts, the possibility that there may not be a liquid secondary market for the contracts and/or that a change in the value of the contract may not correlate with a change in the value of the underlying securities or indices.
Repurchase Agreements
In connection with transactions in repurchase agreements, it is the Funds’ policy that its custodian take possession of the underlying collateral securities, the fair value of which exceeds the principal amount of the repurchase transaction, including accrued interest, at all times. If the seller defaults, and the fair value of the collateral declines, realization of the collateral may be delayed or limited.
52
Expense Allocation
Expenses of the Funds that are not directly attributable to a specific class of shares are prorated among the classes based on the relative net assets of each class. Expenses directly attributable to a class of shares, which presently only include 12b-1 distribution and service fees, are recorded to the specific class.
Custodian Fee Credit
Each Fund has an arrangement with the custodian bank whereby certain custodian fees and expenses are reduced by net credits earned on each Fund’s cash on deposit with the bank. Such deposit arrangements are an alternative to overnight investments. Credits for cash balances may be offset by charges for any days on which a Fund overdraws its account at the custodian bank.
Indemnifications
Under the Trust’s organizational documents, its Officers and Trustees are indemnified against certain liabilities arising out of the performance of their duties to the Trust. In addition, in the normal course of business, the Trust enters into contracts that provide general indemnifications to other parties. The Trust’s maximum exposure under these arrangements is unknown as this would involve future claims that may be made against the Trust that have not yet occurred. However, the Trust has not had prior claims or losses pursuant to these contracts and expects the risk of loss to be remote.
Use of Estimates
The preparation of financial statements in conformity with accounting principles generally accepted in the United States requires management to make estimates and assumptions that affect the reported amounts of assets and liabilities at the date of the financial statements and the reported amounts of increases and decreases in net assets from operations during the reporting period. Actual results may differ from those estimates.
2. Fund Shares
Transactions in Fund shares were as follows:
| Multi-Cap Value | |||||||||||||
| Year Ended 6/30/08 | Year Ended 6/30/07 | ||||||||||||
| Shares | Amount | Shares | Amount | ||||||||||
Shares sold: | |||||||||||||
Class A | 4,894,727 | $ | 108,742,080 | 10,818,605 | $ | 268,508,603 | |||||||
Class A – automatic conversion of Class B shares | 10,889 | 231,835 | 42,800 | 1,052,576 | |||||||||
Class B | 106,450 | 2,458,209 | 676,609 | 16,516,601 | |||||||||
Class C | 1,027,450 | 22,871,607 | 5,346,510 | 130,268,681 | |||||||||
Class I | 9,281,624 | 208,629,092 | 5,632,776 | 140,629,466 | |||||||||
Shares issued to shareholders due to reinvestment | |||||||||||||
Class A | 802,400 | 17,258,413 | 990,601 | 24,368,770 | |||||||||
Class B | 96,493 | 2,021,539 | 112,666 | 2,714,128 | |||||||||
Class C | 510,247 | 10,689,686 | 603,038 | 14,533,204 | |||||||||
Class I | 834,562 | 17,951,990 | 558,136 | 13,713,272 | |||||||||
| 17,564,842 | 390,854,451 | 24,781,741 | 612,305,301 | ||||||||||
Shares redeemed: | |||||||||||||
Class A | (14,115,576) | (314,563,687 | ) | (4,812,101 | ) | (121,622,643 | ) | ||||||
Class B | (1,129,737) | (24,400,345 | ) | (312,403 | ) | (7,741,099 | ) | ||||||
Class B – automatic conversion to Class A shares | (11,126) | (231,835 | ) | (43,554 | ) | (1,052,576 | ) | ||||||
Class C | (8,271,239) | (179,247,807 | ) | (1,913,409 | ) | (47,510,935 | ) | ||||||
Class I | (8,682,317) | (185,853,992 | ) | (1,687,855 | ) | (42,232,498 | ) | ||||||
| (32,209,995) | (704,297,666 | ) | (8,769,322 | ) | (220,159,751 | ) | |||||||
Net increase (decrease) | (14,645,153) | $ | (313,443,215 | ) | 16,012,419 | $ | 392,145,550 | ||||||
53
Notes to Financial Statements (continued)
| Large-Cap Value | ||||||||||||||
| Year Ended 6/30/08 | For the Period 12/15/06 (commencement of operations) through 6/30/07 | |||||||||||||
| Shares | Amount | Shares | Amount | |||||||||||
Shares sold: | ||||||||||||||
Class A | 278,929 | $ | 5,572,566 | 113,028 | $ | 2,391,626 | ||||||||
Class B | 49,539 | 955,457 | 13,200 | 265,000 | ||||||||||
Class C | 176,731 | 3,519,118 | 52,444 | 1,093,205 | ||||||||||
Class I | 731,693 | 13,809,935 | 400,872 | 8,546,757 | ||||||||||
Shares issued to shareholders due to reinvestment | ||||||||||||||
Class A | 605 | 12,060 | — | — | ||||||||||
Class B | 3 | 49 | — | — | ||||||||||
Class C | 13 | 255 | — | — | ||||||||||
Class I | 3,448 | 68,724 | — | — | ||||||||||
| 1,240,961 | 23,938,164 | 579,544 | 12,296,588 | |||||||||||
Shares redeemed: | ||||||||||||||
Class A | (97,992 | ) | (1,840,816 | ) | (2,748 | ) | (59,050 | ) | ||||||
Class B | (14,434 | ) | (268,025 | ) | — | — | ||||||||
Class C | (85,459 | ) | (1,590,105 | ) | — | — | ||||||||
Class I | (230,897 | ) | (4,368,533 | ) | (3,192 | ) | (68,538 | ) | ||||||
| (428,782 | ) | (8,067,479 | ) | (5,940 | ) | (127,588 | ) | |||||||
Net increase (decrease) | 812,179 | $ | 15,870,685 | 573,604 | $ | 12,169,000 | ||||||||
| Small/Mid-Cap Value | ||||||||||||||
| Year Ended 6/30/08 | For the Period 12/15/06 (commencement of operations) through 6/30/07 | |||||||||||||
| Shares | Amount | Shares | Amount | |||||||||||
Shares sold: | ||||||||||||||
Class A | 255,380 | $ | 4,773,951 | 52,945 | $ | 1,112,010 | ||||||||
Class B | 1,570 | 28,161 | 13,079 | 262,319 | ||||||||||
Class C | 57,368 | 1,067,460 | 45,776 | 940,817 | ||||||||||
Class I | 2,422,448 | 43,783,156 | 10,296,580 | 226,072,974 | ||||||||||
Shares issued to shareholders due to reinvestment | ||||||||||||||
Class A | 16 | 307 | — | — | ||||||||||
Class B | — | — | — | — | ||||||||||
Class C | — | — | — | — | ||||||||||
Class I | 25,441 | 484,899 | — | — | ||||||||||
| 2,762,223 | 50,137,934 | 10,408,380 | 228,388,120 | |||||||||||
Shares redeemed: | ||||||||||||||
Class A | (96,825 | ) | (1,753,199 | ) | (1,565 | ) | (34,014 | ) | ||||||
Class B | (12,500 | ) | (241,750 | ) | — | — | ||||||||
Class C | (38,545 | ) | (697,943 | ) | — | — | ||||||||
Class I | (1,922,973 | ) | (36,676,567 | ) | (165,875 | ) | (3,575,123 | ) | ||||||
Class I – In-kind | (8,401,687 | ) | (159,386,190 | ) | — | — | ||||||||
| (10,472,530 | ) | (198,755,649 | ) | (167,440 | ) | (3,609,137 | ) | |||||||
Net increase (decrease) | (7,710,307 | ) | $ | (148,617,715 | ) | 10,240,940 | $ | 224,778,983 | ||||||
54
| Small-Cap Value | ||||||||||||||
| Year Ended 6/30/08 | Year Ended 6/30/07 | |||||||||||||
| Shares | Amount | Shares | Amount | |||||||||||
Shares sold: | ||||||||||||||
Class A | 577,225 | $ | 15,246,182 | 1,585,220 | $ | 42,258,545 | ||||||||
Class A – automatic conversion of Class B shares | 351 | 9,483 | — | — | ||||||||||
Class B | 552 | 13,672 | 16,522 | 435,436 | ||||||||||
Class C | 18,299 | 460,704 | 359,329 | 9,444,793 | ||||||||||
Class I | 1,226,386 | 31,123,643 | 4,293,788 | 118,349,345 | ||||||||||
Shares issued to shareholders due to reinvestment | ||||||||||||||
Class A | 57,204 | 1,420,922 | 9,390 | 255,254 | ||||||||||
Class B | 383 | 9,334 | 53 | 1,421 | ||||||||||
Class C | 6,980 | 170,236 | 969 | 26,014 | ||||||||||
Class I | 116,381 | 2,908,937 | 19,629 | 535,253 | ||||||||||
| 2,003,761 | 51,363,113 | 6,284,900 | 171,306,061 | |||||||||||
Shares redeemed: | ||||||||||||||
Class A | (897,290 | ) | (23,632,590 | ) | (301,374 | ) | (8,326,649 | ) | ||||||
Class B | (12,223 | ) | (302,597 | ) | (2,799 | ) | (75,305 | ) | ||||||
Class B – automatic conversion to Class A shares | (356 | ) | (9,483 | ) | — | — | ||||||||
Class C | (182,726 | ) | (4,593,365 | ) | (58,320 | ) | (1,644,194 | ) | ||||||
Class I | (1,098,297 | ) | (27,520,055 | ) | (429,839 | ) | (11,859,447 | ) | ||||||
| (2,190,892 | ) | (56,058,090 | ) | (792,332 | ) | (21,905,595 | ) | |||||||
Net increase (decrease) | (187,131 | ) | $ | (4,694,977 | ) | 5,492,568 | $ | 149,400,466 | ||||||
| Global Value | ||||||||||||||
| Year Ended 6/30/08 | Year Ended 6/30/07 | |||||||||||||
| Shares | Amount | Shares | Amount | |||||||||||
Shares sold: | ||||||||||||||
Class A | 29,903 | $ | 782,276 | 167,536 | $ | 4,284,539 | ||||||||
Class A – automatic conversion of Class B shares | 1,343 | 33,180 | — | — | ||||||||||
Class B | 4,041 | 105,777 | 15,264 | 383,152 | ||||||||||
Class C | 40,305 | 1,054,689 | 180,091 | 4,616,293 | ||||||||||
Class I | 37,643 | 969,492 | 54,720 | 1,391,308 | ||||||||||
Shares issued to shareholders due to reinvestment | ||||||||||||||
Class A | 10,235 | 256,492 | 7,036 | 182,275 | ||||||||||
Class B | 1,390 | 34,237 | 497 | 12,728 | ||||||||||
Class C | 10,980 | 270,641 | 3,625 | 92,832 | ||||||||||
Class I | 5,146 | 129,524 | 2,125 | 55,183 | ||||||||||
| 140,986 | 3,636,308 | 430,894 | 11,018,310 | |||||||||||
Shares redeemed: | ||||||||||||||
Class A | (144,334 | ) | (3,676,826 | ) | (99,043 | ) | (2,617,785 | ) | ||||||
Class B | (3,743 | ) | (90,081 | ) | (978 | ) | (26,311 | ) | ||||||
Class B – automatic conversion to Class A shares | (1,327 | ) | (33,180 | ) | — | — | ||||||||
Class C | (111,495 | ) | (2,775,694 | ) | (13,434 | ) | (347,974 | ) | ||||||
Class I | (31,554 | ) | (809,680 | ) | (17,933 | ) | (472,418 | ) | ||||||
| (292,453 | ) | (7,385,461 | ) | (131,388 | ) | (3,464,488 | ) | |||||||
Net increase (decrease) | (151,467 | ) | $ | (3,749,153 | ) | 299,506 | $ | 7,553,822 | ||||||
55
Notes to Financial Statements (continued)
| Value Opportunities | ||||||||||||||
| Year Ended 6/30/08 | Year Ended 6/30/07 | |||||||||||||
| Shares | Amount | Shares | Amount | |||||||||||
Shares sold: | ||||||||||||||
Class A | 7,943,088 | $ | 242,248,967 | 5,707,916 | $ | 169,532,744 | ||||||||
Class A – automatic conversion of Class B shares | 1,176 | 35,598 | — | — | ||||||||||
Class B | 70,171 | 2,120,260 | 138,773 | 4,104,593 | ||||||||||
Class C | 1,258,098 | 38,073,818 | 2,395,820 | 70,941,868 | ||||||||||
Class I | 5,631,896 | 171,253,968 | 3,742,157 | 113,682,184 | ||||||||||
Shares issued to shareholders due to reinvestment | ||||||||||||||
Class A | 435,293 | 13,267,584 | 59,808 | 1,779,441 | ||||||||||
Class B | 8,806 | 264,607 | 764 | 22,505 | ||||||||||
Class C | 140,306 | 4,216,004 | 14,133 | 416,563 | ||||||||||
Class I | 332,868 | 10,173,455 | 40,295 | 1,200,266 | ||||||||||
| 15,821,702 | 481,654,261 | 12,099,666 | 361,680,164 | |||||||||||
Shares redeemed: | ||||||||||||||
Class A | (3,605,597 | ) | (109,855,588 | ) | (834,321 | ) | (24,951,989 | ) | ||||||
Class B | (16,825 | ) | (513,442 | ) | (6,864 | ) | (211,210 | ) | ||||||
Class B – automatic conversion to Class A shares | (1,186) | (35,598 | ) | — | — | |||||||||
Class C | (541,715 | ) | (16,374,312 | ) | (119,869 | ) | (3,629,750 | ) | ||||||
Class I | (1,526,242 | ) | (47,083,527 | ) | (212,810 | ) | (6,459,129 | ) | ||||||
| (5,691,565 | ) | (173,862,467 | ) | (1,173,864 | ) | (35,252,078 | ) | |||||||
Net increase (decrease) | 10,130,137 | $ | 307,791,794 | 10,925,802 | $ | 326,428,086 | ||||||||
3. Investment Transactions
Purchases and sales (including maturities but excluding short-term investments and derivative transactions) during the fiscal year ended June 30, 2008, were as follows:
| Multi-Cap Value | Large-Cap Value | Small/Mid-Cap Value | Small-Cap Value | Global Value | Value Opportunities | |||||||||||||
Purchases | $ | 279,737,669 | $ | 17,799,071 | $ | 94,478,225 | $ | 86,887,653 | $ | 6,137,276 | $ | 585,858,920 | ||||||
Sales and maturities | 514,199,287 | 2,223,028 | 232,391,620 | 87,416,393 | 9,757,217 | 264,259,130 | ||||||||||||
4. Income Tax Information
The following information is presented on an income tax basis. Differences between amounts for financial statement and federal income tax purposes are primarily due to timing differences in recognizing certain gains and losses on investment transactions. To the extent that differences arise that are permanent in nature, such amounts are reclassified within the capital accounts on the Statement of Assets and Liabilities presented in the annual report, based on their federal tax basis treatment; temporary differences do not require reclassification. Temporary and permanent differences do not impact the net asset values of the Funds.
At June 30, 2008, the cost of investments was as follows:
Multi-Cap Value | Large-Cap Value | Small/Mid-Cap Value | Small-Cap Value | Global Value | Value Opportunities | |||||||||||||
Cost of investments | $ | 887,483,312 | $ | 27,354,505 | $ | 49,304,740 | $ | 196,225,561 | $ | 14,911,526 | $ | 800,403,378 | ||||||
Gross unrealized appreciation and gross unrealized depreciation of investments at June 30, 2008, were as follows:
| Multi-Cap Value | Large-Cap Value | Small/Mid-Cap Value | Small-Cap Value | Global Value | Value Opportunities | |||||||||||||||||||
Gross unrealized: | ||||||||||||||||||||||||
Appreciation | $ | 148,630,520 | $ | 1,723,669 | $ | 1,430,524 | $ | 17,196,330 | $ | 2,046,157 | $ | 62,341,420 | ||||||||||||
Depreciation | (239,370,404 | ) | (5,308,853 | ) | (8,085,625 | ) | (38,696,651 | ) | (2,480,374 | ) | (84,092,784 | ) | ||||||||||||
Net unrealized appreciation (depreciation) of investments | $ | (90,739,884 | ) | $ | (3,585,184 | ) | $ | (6,655,101 | ) | $ | (21,500,321 | ) | $ | (434,217 | ) | $ | (21,751,364 | ) | ||||||
56
The tax components of undistributed net ordinary income and net long-term capital gains at June 30, 2008, the Funds’ tax year end, were as follows:
| Multi-Cap Value | Large-Cap Value | Small/Mid-Cap Value | Small-Cap Value | Global Value | Value Opportunities | |||||||||||||
Undistributed net ordinary income* | $ | — | $ | 80,189 | $ | — | $ | — | $ | 195,460 | $ | 18,418,987 | ||||||
Undistributed net long-term capital gains | — | — | — | — | 426,256 | 15,447,367 | ||||||||||||
* Net ordinary income consists of net taxable income derived from dividends, interest, and net short-term capital gains, if any.
The tax character of distributions paid during the Funds’ tax years ended June 30, 2008 and June 30, 2007, was designated for purposes of the dividends paid deduction as follows:
| 2008 | Multi-Cap Value | Large-Cap Value | Small/Mid-Cap Value | Small-Cap Value | Global Value | Value Opportunities | |||||||||
Distributions from net ordinary income* | $ | 17,918,255 | $ | 95,999 | $ | 488,463 | 4,860,282 | 688,341 | 17,424,118 | ||||||
Distributions from net long-term capital gains** | 31,305,510 | — | — | 674,086 | 384,981 | 18,162,304 | |||||||||
Tax return of capital | 3,562,719 | — | — | 56,623 | — | — | |||||||||
| 2007 | Multi-Cap Value | Large-Cap Value | Small/Mid-Cap Value | Small-Cap Value | Global Value | Value Opportunities | ||||||||||||
Distributions from net ordinary income* | $ | 30,245,242 | $ | — | $ | — | $ | 926,758 | $ | 306,095 | $ | 4,678,640 | ||||||
Distributions from net long-term capital gains | 31,980,136 | — | — | 83,870 | 191,190 | 182,560 | ||||||||||||
* Net ordinary income consists of net taxable income derived from dividends, interest, and net short-term capital gains, if any.
| ** | The Funds designated as a long-term capital gain dividend, pursuant to the Internal Revenue Code Section 852(b)(3), the amount necessary to reduce earnings and profits of the Funds related to net capital gain to zero for the tax year ended June 30, 2008. |
At June 30, 2008, the Funds’ tax year end, the following Funds had unused capital loss carryforwards available for federal tax purposes to be applied against future capital gains, if any. If not applied, the carryforwards will expire as follows:
| Multi-Cap Value | Small/Mid-Cap Value | Small-Cap Value | |||||||
June 30, 2016 | $ | 16,839,859 | $ | 13,065,462 | $ | 2,490,066 | |||
$6,221,107 of Small/Mid Cap Value’s capital loss carryforward at June 30, 2008 is subject to an annual utilization limitation of $960,055 under the Internal Revenue Code and related regulations.
The following Funds have elected to defer net realized losses from investments incurred from November 1, 2007 through June 30, 2008, the Funds’ tax year end, (“post-October losses”) in accordance with federal income tax regulations. Post-October losses are treated as having arisen on the first day of the following fiscal year:
| Multi-Cap Value | Large-Cap Value | Global Value | Value Opportunities | |||||||||
| $ | 27,093,236 | $ | 415,691 | $ | 51,993 | $ | 5,968,865 | |||||
5. Management Fees and Other Transactions with Affiliates
Each Fund’s management fee is separated into two components – a complex-level component, based on the aggregate amount of all fund assets managed by the Adviser, and a specific fund-level component, based only on the amount of assets within each individual Fund. This pricing structure enables Nuveen fund shareholders to benefit from growth in the assets within each individual fund as well as from growth in the amount of complex-wide assets managed by the Adviser.
The annual fund-level fee, payable monthly, for each Fund is based upon the average daily net assets of each Fund as follows:
| Average Daily Net Assets | Multi-Cap Value Fund-Level Fee Rate | Large-Cap Fund-Level Fee Rate | Small/Mid-Cap Fund-Level Fee Rate | Small-Cap Value Fund-Level Fee Rate | Global Value Fund-Level Fee Rate | Value Opportunities Fund-Level Fee Rate | ||||||||||||
For the first $125 million | .6500 | % | .6500 | % | .7500 | % | .8000 | % | .8000 | % | .8000 | % | ||||||
For the next $125 million | .6375 | .6375 | .7375 | .7875 | .7875 | .7875 | ||||||||||||
For the next $250 million | .6250 | .6250 | .7250 | .7750 | .7750 | .7750 | ||||||||||||
For the next $500 million | .6125 | .6125 | .7125 | .7625 | .7625 | .7625 | ||||||||||||
For the next $1 billion | .6000 | .6000 | .7000 | .7500 | .7500 | .7500 | ||||||||||||
For net assets over $2 billion | .5750 | .5750 | .6750 | .7250 | .7250 | .7250 |
The annual complex-level fee, payable monthly, which is additive to the fund-level fee, for all Nuveen sponsored funds in the U.S., is based on the aggregate amount of total fund assets managed as stated in the tables below. As of June 30, 2008, the complex-level fee rate was .1868%.
57
Notes to Financial Statements (continued)
Effective August 20, 2007, the complex-level fee schedule is as follows:
| Complex-Level Asset Breakpoint Level (1) | Effective Rate at Breakpoint Level | ||
$55 billion | .2000 | % | |
$56 billion | .1996 | ||
$57 billion | .1989 | ||
$60 billion | .1961 | ||
$63 billion | .1931 | ||
$66 billion | .1900 | ||
$71 billion | .1851 | ||
$76 billion | .1806 | ||
$80 billion | .1773 | ||
$91 billion | .1691 | ||
$125 billion | .1599 | ||
$200 billion | .1505 | ||
$250 billion | .1469 | ||
$300 billion | .1445 |
Prior to August 20, 2007, the complex-level fee schedule was as follows:
| Complex-Level Asset Breakpoint Level (1) | Effective Rate at Breakpoint Level | ||
$55 billion | .2000 | % | |
$56 billion | .1996 | ||
$57 billion | .1989 | ||
$60 billion | .1961 | ||
$63 billion | .1931 | ||
$66 billion | .1900 | ||
$71 billion | .1851 | ||
$76 billion | .1806 | ||
$80 billion | .1773 | ||
$91 billion | .1698 | ||
$125 billion | .1617 | ||
$200 billion | .1536 | ||
$250 billion | .1509 | ||
$300 billion | .1490 |
| (1) | The complex-level fee component of the management fee for the funds is calculated based upon the aggregate Managed Assets (“Managed Assets” means the average daily net assets of each fund including assets attributable to preferred stock issued by or borrowings by the Nuveen funds) of Nuveen-sponsored funds in the U.S. |
The management fee compensates the Adviser for overall investment advisory and administrative services and general office facilities. The Adviser has entered into Sub-Advisory Agreements with NWQ and Tradewinds Global Investors, LLC (“Tradewinds”), of which Nuveen owns a controlling interest while key management of NWQ and Tradewinds owns a non-controlling minority interest. NWQ and Tradewinds are compensated for their services to the Funds from the management fee paid to the Adviser.
The Adviser has agreed to waive part of its management fees or reimburse certain expenses of the following Funds in order to limit operating expenses (excluding 12b-1 distribution and service fees, interest expense, taxes, fees incurred in acquiring and disposing of portfolio securities and extraordinary expenses) in the amounts and for the time periods stated in the table below.
| Current Expense Cap | Current Expense Cap Expiration Date | Permanent Expense Cap | ||||||
NWQ Large-Cap Value | 1.10 | % | October 31, 2010 | 1.35 | % | |||
NWQ Small/Mid-Cap Value | 1.20 | October 31, 2010 | 1.45 | |||||
NWQ Small-Cap Value | 1.25 | October 31, 2009 | 1.50 | |||||
Global Value | 1.45 | October 31, 2009 | 1.55 | |||||
Tradewinds Value Opportunities | 1.25 | October 31, 2009 | 1.50 |
The Adviser may also voluntarily reimburse additional expenses from time to time in any of the Funds. Voluntary reimbursements may be terminated at any time at the Adviser's discretion.
The Trust pays no compensation directly to those of its Trustees who are affiliated with the Adviser or to its Officers, all of whom receive remuneration for their services to the Trust from the Adviser or its affiliates. The Board of Trustees has adopted a deferred compensation plan for independent Trustees that enables Trustees to elect to defer receipt of all or a portion of the annual compensation they are entitled to receive from certain Nuveen advised funds. Under the plan, deferred amounts are treated as though equal dollar amounts had been invested in shares of select Nuveen advised funds.
58
During the fiscal year ended June 30, 2008, Nuveen Investments, LLC (the “Distributor”), a wholly owned subsidiary of Nuveen, collected sales charges on purchases of Class A Shares, the majority of which were paid out as concessions to financial intermediaries as follows:
| Multi-Cap Value | Large-Cap Value | Small/Mid-Cap Value | Small-Cap Value | Global Value | Value Opportunities | |||||||
Sales charges collected (Unaudited) | $717,098 | $23,525 | $6,835 | $36,405 | $22,081 | $712,581 | ||||||
Paid to financial intermediaries (Unaudited) | 630,272 | 20,515 | 6,094 | 32,330 | 19,617 | 635,952 |
The Distributor also received 12b-1 service fees on Class A Shares, substantially all of which were paid to compensate financial intermediaries for providing services to shareholders relating to their investments.
During the fiscal year ended June 30, 2008, the Distributor compensated financial intermediaries directly with commission advances at the time of purchase as follows:
| Multi-Cap Value | Large-Cap Value | Small/Mid-Cap Value | Small-Cap Value | Global Value | Value Opportunities | |||||||||||||
Commission advances (Unaudited) | $ | 295,390 | $ | 30,309 | $ | 18,436 | $ | 11,147 | $ | 7,659 | $ | 474,170 | ||||||
To compensate for commissions advanced to financial intermediaries, all 12b-1 service fees collected on Class B Shares during the first year following a purchase, all 12b-1 distribution fees collected on Class B Shares, and all 12b-1 service and distribution fees collected on Class C Shares during the first year following a purchase are retained by the Distributor. During the fiscal year ended June 30, 2008, the Distributor retained such 12b-1 fees as follows:
| Multi-Cap Value | Large-Cap Value | Small/Mid-Cap Value | Small-Cap Value | Global Value | Value Opportunities | |||||||||||||
12b-1 fees retained (Unaudited) | $ | 1,034,289 | $ | 20,273 | $ | 10,418 | $ | 45,595 | $ | 30,145 | $ | 536,627 | ||||||
The remaining 12b-1 fees charged to the Funds were paid to compensate financial intermediaries for providing services to shareholders relating to their investments.
The Distributor also collected and retained CDSC on share redemptions during the fiscal year ended June 30, 2008, as follows:
| Multi-Cap Value | Large-Cap Value | Small/Mid-Cap Value | Small-Cap Value | Global Value | Value Opportunities | |||||||||||||
CDSC retained (Unaudited) | $ | 580,336 | $ | 2,139 | $ | 1,458 | $ | 24,092 | $ | 5,547 | $ | 63,579 | ||||||
At June 30, 2008, Nuveen owned 12,500 shares of each class of Large-Cap Value. The Adviser owned 125 shares of each class of Small-Cap Value. The Adviser owned 125 shares of Class A, Class B, Class C and 99,625 shares of Class I of Global Value.
Agreement and Plan of Merger
On June 20, 2007, Nuveen Investments announced that it had entered into a definitive Agreement and Plan of Merger (“Merger Agreement”) with Windy City Investments, Inc. (“Windy City”), a corporation formed by investors led by Madison Dearborn Partners, LLC (“Madison Dearborn”), pursuant to which Windy City would acquire Nuveen Investments. Madison Dearborn is a private equity investment firm based in Chicago, Illinois. The merger was consummated on November 13, 2007.
The consummation of the merger was deemed to be an “assignment” (as that term is defined in the Investment Company Act of 1940) of the investment management agreement between each Fund and the Adviser and, if applicable, each sub-advisory agreement between the Adviser and any sub-adviser of the Funds, and resulted in the automatic termination of each such agreement. The Board of Trustees of each Fund considered and approved a new investment management agreement with the Adviser, and, if applicable, a new sub-advisory agreement between the Adviser and any sub-adviser on the same terms as the previous agreements. Each new ongoing investment management agreement and sub-advisory agreement, if applicable, was approved by the shareholders of each Fund. The new agreements for Large-Cap Value, Small/Mid-Cap Value, Small Cap Value and Global Value took effect on November 13, 2007. The new agreements for Multi-Cap Value and Value Opportunities took effect on November 30, 2007.
The investors led by Madison Dearborn includes an affiliate of Merrill Lynch. As a result, Merrill Lynch is an indirect “affiliated person” (as that term is defined in the Investment Company Act of 1940) of each Fund. Certain conflicts of interest may arise as a result of such indirect affiliation. For example, the Funds are generally prohibited from entering into principal transactions with Merrill Lynch and its affiliates. The Adviser does not believe that any such prohibitions or limitations as a result of Merrill Lynch’s affiliation will significantly impact the ability of the Funds to pursue their investment objectives and policies.
59
Notes to Financial Statements (continued)
6. New Accounting Pronouncements
Financial Accounting Standards Board Statement of Financial Accounting Standards (SFAS) No. 157
In September 2006, the FASB issued SFAS No. 157, “Fair Value Measurements.” This standard establishes a single authoritative definition of fair value, sets out a framework for measuring fair value and requires additional disclosures about fair value measurements. SFAS No. 157 applies to fair value measurements already required or permitted by existing standards. SFAS No. 157 is effective for financial statements issued for fiscal years beginning after November 15, 2007, and interim periods within those fiscal years. The changes to current generally accepted accounting principles from the application of this standard relate to the definition of fair value, the methods used to measure fair value, and the expanded disclosures about fair value measurements. As of June 30, 2008, management does not believe the adoption of SFAS No. 157 will impact the financial statement amounts; however, additional disclosures may be required about the inputs used to develop the measurements and the effect of certain of the measurements included within the Statement of Operations for the period.
Financial Accounting Standards Board Statement of Financial Accounting Standards No. 161
In March 2008, the FASB issued SFAS No. 161, “Disclosures about Derivative Instruments and Hedging Activities.” This standard is intended to enhance financial statement disclosures for derivative instruments and hedging activities and enable investors to understand: a) how and why a fund uses derivative instruments, b) how derivative instruments and related hedge items are accounted for, and c) how derivative instruments and related hedge items affect a fund’s financial position, results of operations and cash flows. SFAS No. 161 is effective for financial statements issued for fiscal years and interim periods beginning after November 15, 2008. As of June 30, 2008, management does not believe the adoption of SFAS No. 161 will impact the financial statement amounts; however, additional footnote disclosures may be required about the use of derivative instruments and hedging items.
7. Subsequent Events
Sub-Advisory Agreements
Effective July 31, 2008, NWQ no longer served as a sub-advisor for Global Value. Effective August 1, 2008, Richards & Tierney, Inc. (“Richards & Tierney”) was appointed as a sub-advisor to Global Value.
Fund Changes
Effective August 1, 2008, Global Value changed its investment strategy to a multi-asset class/multi-manager strategy. In pursuing this multi-asset class/multi-manager strategy, the Fund will operate as “fund-of-funds” investing substantially all of its assets in other Nuveen mutual funds and unaffiliated exchange-traded funds (“Underlying Funds”). The Underlying Funds, in turn, invest in a variety of U.S. and non-U.S. equity and fixed income securities. The Fund will have a strategic allocation between equity and fixed income investments that correlate with the Fund’s targeted levels of investment risk. Richards & Tierney will adjust portfolio allocations from time to time consistent with the Fund’s investment risk target in its effort to produce performance consistent with their investment objectives. These changes are designed to improve risk/return profile of the Fund by (a) diversifying the Fund across a broader number of assets classes and (b) diversifying the Fund across multiple investment managers advising the Underlying Funds. As part of these changes to its investment policy, initially the Fund may invest in the following Underlying Funds:
Equity Funds
| • | Nuveen NWQ Large-Cap Value Fund |
| • | Nuveen Symphony Large-Cap Growth Fund |
| • | Nuveen Tradewinds Value Opportunities Fund |
| • | Nuveen Santa Barbara Growth Fund |
| • | Nuveen Rittenhouse Growth Fund |
| • | Nuveen U.S. Equity Completeness Fund |
| • | Nuveen Tradewinds International Value Fund |
| • | iShares Dow Jones U.S. Real Estate Index Fund |
| • | iShares MSCI EAFE Growth Index Fund |
| • | iShares MSCI Emerging Markets Index Fund |
| • | Nuveen Tradewinds Global Resources Fund |
Fixed Income Funds
| • | Nuveen Multi-Strategy Income Fund |
| • | Nuveen High Yield Bond Fund |
| • | iShares Lehman TIPS Bond Fund |
| • | Nuveen Short Duration Bond Fund |
To reflect the foregoing changes to the Fund’s investment strategy, effective August 1, 2008, Global Value changed its name to Nuveen Growth Allocation Fund.
Class R3 Shares
Effective August 1, 2008, Multi-Cap Value and Value Opportunities began offering Class R3 Shares. Class R3 Shares are available for purchase at the offering price, which is the net asset value per share without any up-front sales charge, to certain retirement plans. Class R3 Shares are subject to annual distribution and service fees of 0.50% of the Fund’s average daily net assets.
60
Financial Highlights
Selected data for a share outstanding throughout each period:
| Class (Inception Date) | |||||||||||||||||||||||||||||||||||||||||||||||||||||||||||||
| Investment Operations | Less Distributions | Ratios/Supplemental Data | |||||||||||||||||||||||||||||||||||||||||||||||||||||||||||
| MULTI-CAP VALUE | Ratios to Average Net Assets Before Credit/ Reimbursement | Ratios to Average Net Assets After Reimbursement(c) | Ratios to Average Net Assets After Credit/ Reimbursement(d) | ||||||||||||||||||||||||||||||||||||||||||||||||||||||||||
| Year Ended June 30, | Beginning Net Asset Value | Net Invest- ment Income (Loss)(a) | Net Realized/ Unrealized Gain (Loss) | Total | Net Invest- ment Income | Capital Gains | Tax Return of Capital | Total | Ending Net Asset Value | Total Return(b) | Ending Net Assets (000) | Expenses | Net Invest- ment Income (Loss) | Expenses | Net Invest- ment Income (Loss) | Expenses | Net Invest- ment Income (Loss) | Portfolio Turnover Rate | |||||||||||||||||||||||||||||||||||||||||||
Class A (12/02) | |||||||||||||||||||||||||||||||||||||||||||||||||||||||||||||
2008 | $ | 26.15 | $ | .04 | $ | (6.62 | ) | $ | (6.58 | ) | $ | (.02 | ) | $ | (.94 | ) | $ | (.07 | ) | $ | (1.03 | ) | $ | 18.54 | (25.65 | )% | $ | 293,777 | 1.33 | % | .17 | % | 1.33 | % | .17 | % | 1.33 | % | .17 | % | 25 | % | |||||||||||||||||||
2007 | 23.81 | .18 | 3.43 | 3.61 | (.13 | ) | (1.14 | ) | — | (1.27 | ) | 26.15 | 15.51 | 634,123 | 1.24 | .71 | 1.24 | .71 | 1.24 | .71 | 19 | ||||||||||||||||||||||||||||||||||||||||
2006 | 20.60 | .15 | 3.42 | 3.57 | (.06 | ) | (.30 | ) | — | (.36 | ) | 23.81 | 17.45 | 409,788 | 1.33 | .65 | 1.33 | .65 | 1.33 | .65 | 9 | ||||||||||||||||||||||||||||||||||||||||
2005 | 18.56 | .11 | 2.15 | 2.26 | (.05 | ) | (.17 | ) | — | (.22 | ) | 20.60 | 12.20 | 179,548 | 1.36 | .54 | 1.36 | .54 | 1.36 | .54 | 14 | ||||||||||||||||||||||||||||||||||||||||
2004 | 14.60 | .04 | 4.38 | 4.42 | (.02 | ) | (.44 | ) | — | (.46 | ) | 18.56 | 30.75 | 58,279 | 1.48 | .20 | 1.48 | .20 | 1.48 | .20 | 21 | ||||||||||||||||||||||||||||||||||||||||
| Class B (12/02) | |||||||||||||||||||||||||||||||||||||||||||||||||||||||||||||
2008 | 25.64 | (.13 | ) | (6.47 | ) | (6.60 | ) | — | (.94 | ) | — | (.94 | ) | 18.10 | (26.20 | ) | 36,024 | 2.08 | (.59 | ) | 2.08 | (.59 | ) | 2.08 | (.59 | ) | 25 | ||||||||||||||||||||||||||||||||||
2007 | 23.42 | (.01 | ) | 3.37 | 3.36 | — | (1.14 | ) | — | (1.14 | ) | 25.64 | 14.65 | 75,067 | 2.00 | (.04 | ) | 2.00 | (.04 | ) | 2.00 | (.04 | ) | 19 | |||||||||||||||||||||||||||||||||||||
2006 | 20.37 | (.02 | ) | 3.37 | 3.35 | — | (.30 | ) | — | (.30 | ) | 23.42 | 16.57 | 58,423 | 2.08 | (.10 | ) | 2.08 | (.10 | ) | 2.08 | (.10 | ) | 9 | |||||||||||||||||||||||||||||||||||||
2005 | 18.45 | (.04 | ) | 2.13 | 2.09 | — | (.17 | ) | — | (.17 | ) | 20.37 | 11.35 | 33,216 | 2.10 | (.20 | ) | 2.10 | (.20 | ) | 2.10 | (.20 | ) | 14 | |||||||||||||||||||||||||||||||||||||
2004 | 14.61 | (.09 | ) | 4.37 | 4.28 | — | (.44 | ) | — | (.44 | ) | 18.45 | 29.76 | 9,322 | 2.23 | (.53 | ) | 2.23 | (.53 | ) | 2.23 | (.53 | ) | 21 | |||||||||||||||||||||||||||||||||||||
| Class C (12/02) | |||||||||||||||||||||||||||||||||||||||||||||||||||||||||||||
2008 | 25.64 | (.13 | ) | (6.47 | ) | (6.60 | ) | — | (.94 | ) | — | (.94 | ) | 18.10 | (26.20 | ) | 189,475 | 2.08 | (.58 | ) | 2.08 | (.58 | ) | 2.08 | (.58 | ) | 25 | ||||||||||||||||||||||||||||||||||
2007 | 23.42 | (.01 | ) | 3.37 | 3.36 | — | (1.14 | ) | — | (1.14 | ) | 25.64 | 14.64 | 441,048 | 1.99 | (.04 | ) | 1.99 | (.04 | ) | 1.99 | (.04 | ) | 19 | |||||||||||||||||||||||||||||||||||||
2006 | 20.37 | (.02 | ) | 3.37 | 3.35 | — | (.30 | ) | — | (.30 | ) | 23.42 | 16.57 | 308,339 | 2.08 | (.10 | ) | 2.08 | (.10 | ) | 2.08 | (.10 | ) | 9 | |||||||||||||||||||||||||||||||||||||
2005 | 18.45 | (.04 | ) | 2.13 | 2.09 | — | (.17 | ) | — | (.17 | ) | 20.37 | 11.35 | 128,758 | 2.11 | (.21 | ) | 2.11 | (.21 | ) | 2.10 | (.21 | ) | 14 | |||||||||||||||||||||||||||||||||||||
2004 | 14.62 | (.09 | ) | 4.36 | 4.27 | — | (.44 | ) | — | (.44 | ) | 18.45 | 29.67 | 30,085 | 2.23 | (.53 | ) | 2.23 | (.53 | ) | 2.23 | (.53 | ) | 21 | |||||||||||||||||||||||||||||||||||||
| Class I (11/97) (e) | |||||||||||||||||||||||||||||||||||||||||||||||||||||||||||||
2008 | 26.09 | .09 | (6.59 | ) | (6.50 | ) | (.02 | ) | (.94 | ) | (.13 | ) | (1.09 | ) | 18.50 | (25.47 | ) | 274,886 | 1.09 | .39 | 1.09 | .39 | 1.09 | .39 | 25 | ||||||||||||||||||||||||||||||||||||
2007 | 23.76 | .24 | 3.42 | 3.66 | (.19 | ) | (1.14 | ) | — | (1.33 | ) | 26.09 | 15.77 | 350,370 | .99 | .96 | .99 | .96 | .99 | .96 | 19 | ||||||||||||||||||||||||||||||||||||||||
2006 | 20.55 | .20 | 3.42 | 3.62 | (.11 | ) | (.30 | ) | — | (.41 | ) | 23.76 | 17.77 | 212,033 | 1.09 | .90 | 1.09 | .90 | 1.09 | .90 | 9 | ||||||||||||||||||||||||||||||||||||||||
2005 | 18.52 | .15 | 2.15 | 2.30 | (.10 | ) | (.17 | ) | — | (.27 | ) | 20.55 | 12.43 | 82,413 | 1.10 | .78 | 1.10 | .78 | 1.10 | .78 | 14 | ||||||||||||||||||||||||||||||||||||||||
2004 | 14.57 | .06 | 4.38 | 4.44 | (.05 | ) | (.44 | ) | — | (.49 | ) | 18.52 | 31.02 | 46,546 | 1.24 | .39 | 1.24 | .39 | 1.24 | .39 | 21 | ||||||||||||||||||||||||||||||||||||||||
| (a) | Per share Net Investment Income (Loss) is calculated using the average daily shares method. |
| (b) | Total return is the combination of changes in net asset value without any sales charge, reinvested dividend income at net asset value and reinvested capital gains distributions at net asset value, if any. Total returns are not annualized. |
| (c) | After expense reimbursement from the Adviser, where applicable. |
| (d) | After custodian fee credit and expense reimbursement, where applicable. |
| (e) | Effective May 1, 2008, Class R Shares were renamed Class I Shares. |
See accompanying notes to financial statements.
61
Financial Highlights (continued)
Selected data for a share outstanding throughout each period:
| Class (Inception Date) | |||||||||||||||||||||||||||||||||||||||||||||||||||||||||
| Investment Operations | Less Distributions | Ratios/Supplemental Data | |||||||||||||||||||||||||||||||||||||||||||||||||||||||
| LARGE-CAP VALUE | Ratios to Average Net Assets Before Credit/ Reimbursement | Ratios to Average Net Assets After Reimbursement(c) | Ratios to Average Net Assets After Credit/ Reimbursement(d) | ||||||||||||||||||||||||||||||||||||||||||||||||||||||
| Year Ended June 30, | Beginning Net Asset Value | Net (Loss)(a) | Net (Loss) | Total | Net Invest- ment Income | Capital Gains | Total | Ending Net Asset Value | Total Return(b) | Ending Net Assets (000) | Expenses | Net Invest- ment Income (Loss) | Expenses | Net Invest- ment Income (Loss) | Expenses | Net Invest- ment Income (Loss) | Portfolio Turnover Rate | ||||||||||||||||||||||||||||||||||||||||
| Class A (12/06) | |||||||||||||||||||||||||||||||||||||||||||||||||||||||||
2008 | $ | 21.38 | $ | .15 | $ | (4.04 | ) | $ | (3.89 | ) | $ | (.08 | ) | $ | — | *** | $ | (.08 | ) | $ | 17.41 | (18.24 | )% | $ | 5,080 | 1.66 | % | .45 | % | 1.33 | % | .77 | % | 1.33 | % | .78 | % | 13 | % | ||||||||||||||||||
2007(e) | 20.00 | .12 | 1.26 | 1.38 | — | — | — | 21.38 | 6.90 | 2,358 | 3.12 | * | (.84 | )* | 1.33 | * | .95 | * | 1.26 | * | 1.02 | * | — | ||||||||||||||||||||||||||||||||||
| Class B (12/06) | |||||||||||||||||||||||||||||||||||||||||||||||||||||||||
2008 | 21.30 | — | ** | (4.02 | ) | (4.02 | ) | — | — | *** | — | *** | 17.28 | (18.82 | ) | 835 | 2.43 | (.34 | ) | 2.08 | — | **** | 2.08 | .01 | 13 | ||||||||||||||||||||||||||||||||
2007(e) | 20.00 | — | ** | 1.30 | 1.30 | — | — | — | 21.30 | 6.50 | 281 | 4.68 | * | (2.66 | )* | 2.08 | * | (.06 | )* | 2.01 | * | .01 | * | — | |||||||||||||||||||||||||||||||||
| Class C (12/06) | |||||||||||||||||||||||||||||||||||||||||||||||||||||||||
2008 | 21.30 | — | ** | (4.02 | ) | (4.02 | ) | — | — | *** | — | *** | 17.28 | (18.82 | ) | 2,484 | 2.42 | (.33 | ) | 2.08 | — | **** | 2.08 | — | **** | 13 | |||||||||||||||||||||||||||||||
2007(e) | 20.00 | .02 | 1.28 | 1.30 | — | — | — | 21.30 | 6.50 | 1,117 | 3.83 | * | (1.62 | )* | 2.08 | * | .13 | * | 2.01 | * | .20 | * | — | ||||||||||||||||||||||||||||||||||
| Class I (12/06) (f) | |||||||||||||||||||||||||||||||||||||||||||||||||||||||||
2008 | 21.41 | .20 | (4.05 | ) | (3.85 | ) | (.13 | ) | — | *** | (.13 | ) | 17.43 | (18.05 | ) | 15,719 | 1.40 | .71 | 1.08 | 1.02 | 1.08 | 1.02 | 13 | ||||||||||||||||||||||||||||||||||
2007(e) | 20.00 | .15 | 1.26 | 1.41 | — | — | — | 21.41 | 7.05 | 8,513 | 2.65 | * | (.32 | )* | 1.08 | * | 1.25 | * | 1.01 | * | 1.32 | * | — | ||||||||||||||||||||||||||||||||||
| * | Annualized. |
| ** | Net Investment Income (Loss) rounds to less than $.01 per share. |
| *** | Distributions from Capital Gains rounds to less than $.01 per share. |
| **** | Net Investment Income (Loss) rounds to less than .01%. |
| (a) | Per share Net Investment Income (Loss) is calculated using the average daily shares method. |
| (b) | Total return is the combination of changes in net asset value without any sales charge, reinvested dividend income at net asset value and reinvested capital gains distributions at net asset value, if any. Total returns are not annualized. |
| (c) | After expense reimbursement from the Adviser, where applicable. |
| (d) | After custodian fee credit and expense reimbursement, where applicable. |
| (e) | For the period December 15, 2006 (commencement of operations) through June 30, 2007. |
| (f) | Effective May 1, 2008, Class R Shares were renamed Class I Shares. |
See accompanying notes to financial statements.
62
| Class (Inception Date) | ||||||||||||||||||||||||||||||||||||||||||||||||||||||||
| Investment Operations | Less Distributions | Ratios/Supplemental Data | ||||||||||||||||||||||||||||||||||||||||||||||||||||||
| SMALL/MID-CAP VALUE | Ratios to Average Net Assets Before Credit/ Reimbursement | Ratios to Average Net Assets After Reimbursement(c) | Ratios to Average Net Assets After Credit/ Reimbursement(d) | |||||||||||||||||||||||||||||||||||||||||||||||||||||
| Year Ended June 30, | Beginning Net Asset Value | Net Invest- ment Income (Loss)(a) | Net (Loss) | Total | Net Invest- ment Income | Capital Gains | Total | Ending Net Asset Value | Total Return(b) | Ending Net Assets (000) | Expenses | Net Invest- ment Income (Loss) | Expenses | Net Invest- ment Income (Loss) | Expenses | Net Invest- ment Income (Loss) | Portfolio Turnover Rate | |||||||||||||||||||||||||||||||||||||||
| Class A (12/06) | ||||||||||||||||||||||||||||||||||||||||||||||||||||||||
2008 | $ | 21.37 | $ | (.09 | ) | $ | (4.16 | ) | $ | (4.25 | ) | $ | — | ** | $ | — | $ | — | ** | $ | 17.12 | (20.02 | )%*** | $ | 3,595 | 1.65 | % | (.70 | )% | 1.43 | % | (.49 | )% | 1.43 | % | (.48 | )% | 84 | % | |||||||||||||||||
2007(e) | 20.00 | .15 | 1.22 | 1.37 | — | — | — | 21.37 | 6.85 | 1,098 | 2.54 | * | .23 | * | 1.43 | * | 1.34 | * | 1.41 | * | 1.36 | * | 1 | |||||||||||||||||||||||||||||||||
| Class B (12/06) | ||||||||||||||||||||||||||||||||||||||||||||||||||||||||
2008 | 21.29 | (.22 | ) | (4.17 | ) | (4.39 | ) | — | — | — | 16.90 | (20.62 | )*** | 36 | 2.12 | (1.17 | ) | 2.12 | (1.17 | ) | 2.11 | (1.16 | ) | 84 | ||||||||||||||||||||||||||||||||
2007(e) | 20.00 | .02 | 1.27 | 1.29 | — | — | — | 21.29 | 6.45 | 279 | 4.09 | * | (1.70 | )* | 2.19 | * | .20 | * | 2.17 | * | .22 | * | 1 | |||||||||||||||||||||||||||||||||
| Class C (12/06) | ||||||||||||||||||||||||||||||||||||||||||||||||||||||||
2008 | 21.28 | (.22 | ) | (4.14 | ) | (4.36 | ) | — | — | — | 16.92 | (20.63 | )*** | 1,093 | 2.39 | (1.40 | ) | 2.18 | (1.20 | ) | 2.18 | (1.19 | ) | 84 | ||||||||||||||||||||||||||||||||
2007(e) | 20.00 | .05 | 1.23 | 1.28 | — | — | — | 21.28 | 6.40 | 974 | 3.22 | * | (.65 | )* | 2.18 | * | .39 | * | 2.16 | * | .41 | * | 1 | |||||||||||||||||||||||||||||||||
| Class I (12/06) (f) | ||||||||||||||||||||||||||||||||||||||||||||||||||||||||
2008 | 21.41 | (.04 | ) | (4.21 | ) | (4.25 | ) | (.05 | ) | — | (.05 | ) | 17.11 | (19.82 | )*** | 38,574 | 1.16 | (.20 | ) | 1.16 | (.20 | ) | 1.15 | (.19 | ) | 84 | ||||||||||||||||||||||||||||||
2007(e) | 20.00 | .49 | .92 | 1.41 | — | — | — | 21.41 | 7.05 | 216,872 | 1.49 | * | 3.93 | * | 1.16 | * | 4.25 | * | 1.15 | * | 4.27 | * | 1 | |||||||||||||||||||||||||||||||||
| * | Annualized. |
| ** | Distributions from Net Investment Income and Total Distributions round to less than $.01 per share. |
| *** | As discussed in Footnote 1 – In-Kind-Redemptions, during the fiscal year ended June 30, 2008, the Adviser reimbursed Small/Mid-Cap Value $89,561. This reimbursement resulted in an increase of .23%, .28%, .19% and .14% to classes A, B, C and I respectively. |
| (a) | Per share Net Investment Income (Loss) is calculated using the average daily shares method. |
| (b) | Total return is the combination of changes in net asset value without any sales charge, reinvested dividend income at net asset value and reinvested capital gains distributions at net asset value, if any. Total returns are not annualized. |
| (c) | After expense reimbursement from the Adviser, where applicable. |
| (d) | After custodian fee credit and expense reimbursement, where applicable. |
| (e) | For the period December 15, 2006 (commencement of operations) through June 30, 2007. |
| (f) | Effective May 1, 2008, Class R Shares were renamed Class I Shares. |
See accompanying notes to financial statements.
63
Financial Highlights (continued)
Selected data for a share outstanding throughout each period:
| Class (Inception Date) | |||||||||||||||||||||||||||||||||||||||||||||||||||||||||||||
| Investment Operations | Less Distributions | Ratios/Supplemental Data | |||||||||||||||||||||||||||||||||||||||||||||||||||||||||||
| SMALL-CAP VALUE | Ratios to Average Net Assets Before Credit/ Reimbursement | Ratios to Average Net Assets After Reimbursement(c) | Ratios to Average Net Assets After Credit/ Reimbursement(d) | ||||||||||||||||||||||||||||||||||||||||||||||||||||||||||
| Year Ended June 30, | Beginning Net Asset Value | Net Invest- ment Income (Loss)(a) | Net Realized/ Unrealized Gain (Loss) | Total | Net Invest- ment Income | Capital Gains | Tax Return of Capital | Total | Ending Net Asset Value | Total Return(b) | Ending Net Assets (000) | Expenses | Net Invest- ment Income (Loss) | Expenses | Net Invest- ment Income (Loss) | Expenses | Net Invest- ment Income (Loss) | Portfolio Turnover Rate | |||||||||||||||||||||||||||||||||||||||||||
| Class A (12/04) | |||||||||||||||||||||||||||||||||||||||||||||||||||||||||||||
2008 | $ | 30.12 | $ | (.04 | ) | $ | (6.08 | ) | $ | (6.12 | ) | $ | (.02 | ) | $ | (.69 | ) | $ | — | ** | $ | (.71 | ) | $ | 23.29 | (20.41 | )% | $ | 54,264 | 1.47 | % | (0.16 | )% | 1.47 | % | (0.16 | )% | 1.47 | % | (.16 | )% | 48 | % | ||||||||||||||||||
2007 | 26.10 | .13 | 4.05 | 4.18 | (.04 | ) | (.12 | ) | — | (.16 | ) | 30.12 | 16.09 | 78,081 | 1.50 | .44 | 1.49 | .46 | 1.49 | .46 | 24 | ||||||||||||||||||||||||||||||||||||||||
2006 2005(e) |
| 20.84 20.00 |
| .13 .05 |
|
| 5.48 .79 |
|
| 5.61 .84 |
|
| (.08 — | )
|
| (.27 — | )
|
| — — |
|
| (.35 — | )
|
| 26.10 20.84 | 27.08 4.20 | ***
|
| 33,907 3 | 1.95 2.85 | * | (.02 (.96 | ) )* | 1.42 1.49 | * | .51 .40 | * | 1.40 1.42 | * | .53 .47 | * | 26 22 |
| ||||||||||||||||||
| Class B (12/04) | |||||||||||||||||||||||||||||||||||||||||||||||||||||||||||||
2008 | 29.69 | (.23 | ) | (5.97 | ) | (6.20 | ) | — | (.69 | ) | — | (.69 | ) | 22.80 | (21.02 | ) | 374 | 2.22 | (.89 | ) | 2.22 | (.89 | ) | 2.22 | (.89 | ) | 48 | ||||||||||||||||||||||||||||||||||
2007 | 25.89 | (.08 | ) | 4.00 | 3.92 | — | (.12 | ) | — | (.12 | ) | 29.69 | 15.15 | 833 | 2.25 | (.31 | ) | 2.24 | (.30 | ) | 2.24 | (.30 | ) | 24 | |||||||||||||||||||||||||||||||||||||
2006 2005(e) |
| 20.76 20.00 |
| (.07 (.03 | ) ) |
| 5.47 .79 |
|
| 5.40 .76 |
|
| — — |
|
| (.27 — | )
|
| — — |
|
| (.27 — | )
|
| 25.89 20.76 | 26.17 3.80 | ***
|
| 370 3 | 2.75 3.60 | * | (.91 (1.70 | ) )* | 2.16 2.24 | * | (.33 (.35 | ) )* | 2.14 2.17 | * | (.31 (.28 | ) )* | 26 22 |
| ||||||||||||||||||
| Class C (12/04) | |||||||||||||||||||||||||||||||||||||||||||||||||||||||||||||
2008 | 29.73 | (.23 | ) | (5.98 | ) | (6.21 | ) | — | (.69 | ) | — | (.69 | ) | 22.83 | (21.03 | ) | 9,682 | 2.22 | (.91 | ) | 2.22 | (.91 | ) | 2.22 | (.91 | ) | 48 | ||||||||||||||||||||||||||||||||||
2007 | 25.91 | (.08 | ) | 4.02 | 3.94 | — | (.12 | ) | — | (.12 | ) | 29.73 | 15.26 | 17,290 | 2.25 | (.31 | ) | 2.24 | (.30 | ) | 2.24 | (.30 | ) | 24 | |||||||||||||||||||||||||||||||||||||
2006 2005(e) |
| 20.76 20.00 |
| (.07 (.03 | ) ) |
| 5.49 .79 |
|
| 5.42 .76 |
|
| — — |
|
| (.27 — | )
|
| — — |
|
| (.27 — | )
|
| 25.91 20.76 | 26.22 3.80 | ***
|
| 7,244 3 | 2.73 3.60 | * | (.86 (1.70 | ) )* | 2.17 2.24 | * | (.30 (.35 | ) )* | 2.15 2.17 | * | (.28 (.28 | ) )* | 26 22 |
| ||||||||||||||||||
| Class I (12/04) (f) | |||||||||||||||||||||||||||||||||||||||||||||||||||||||||||||
2008 | 30.18 | .02 | (6.08 | ) | (6.06 | ) | (.08 | ) | (.69 | ) | (.01 | ) | (.78 | ) | 23.34 | (20.22 | ) | 108,064 | 1.22 | .08 | 1.22 | .08 | 1.22 | .08 | 48 | ||||||||||||||||||||||||||||||||||||
2007 | 26.15 | .23 | 4.03 | 4.26 | (.11 | ) | (.12 | ) | — | (.23 | ) | 30.18 | 16.41 | 132,385 | 1.22 | .81 | 1.22 | .81 | 1.22 | .81 | 24 | ||||||||||||||||||||||||||||||||||||||||
2006 2005(e) |
| 20.87 20.00 |
| .16 .08 |
|
| 5.52 .79 |
|
| 5.68 .87 |
|
| (.13 — | )
|
| (.27 — | )
|
| — — |
|
| (.40 — | )
|
| 26.15 20.87 | 27.41 4.35 | ***
|
| 13,137 2,079 | 1.73 2.61 | * | .07 (.72 | )* | 1.17 1.25 | * | .63 .64 | * | 1.15 1.17 | * | .65 .72 | * | 26 22 |
| ||||||||||||||||||
| * | Annualized. |
| ** | Distributions from Tax Return of Capital rounds to less than $.01 per share. |
| *** | During the fiscal year ended June 30, 2006, NWQ reimbursed Small-Cap Value $9,060 for a cash balance maintained in the Fund. This reimbursement did not have an impact on the Fund’s Class A total return, but resulted in an increase of .05% in each of the total returns for Class B, C and I. |
| (a) | Per share Net Investment Income (Loss) is calculated using the average daily shares method. |
| (b) | Total return is the combination of changes in net asset value without any sales charge, reinvested dividend income at net asset value and reinvested capital gains distributions at net asset value, if any. Total returns are not annualized. |
| (c) | After expense reimbursement from the Adviser, where applicable. |
| (d) | After custodian fee credit and expense reimbursement, where applicable. |
| (e) | For the period December 9, 2004 (commencement of operations) through June 30, 2005. |
| (f) | Effective May 1, 2008, Class R Shares were renamed Class I Shares. |
See accompanying notes to financial statements.
64
| Class (Inception Date) | ||||||||||||||||||||||||||||||||||||||||||||||||||||||||
| Investment Operations | Less Distributions | Ratios/Supplemental Data | ||||||||||||||||||||||||||||||||||||||||||||||||||||||
| GLOBAL VALUE | Ratios to Average Net Assets Before Credit/ Reimbursement | Ratios to Average Net Assets After Reimbursement(c) | Ratios to Average Net Assets After Credit/ Reimbursement(d) | |||||||||||||||||||||||||||||||||||||||||||||||||||||
| Year Ended June 30, | Beginning Net Asset Value | Net (Loss)(a) | Net (Loss) | Total | Net Invest- ment Income | Capital Gains | Total | Ending Net Asset Value | Total Return(b) | Ending Net Assets (000) | Expenses | Net Invest- ment Income (Loss) | Expenses | Net Invest- ment Income (Loss) | Expenses | Net Invest- ment Income (Loss) | Portfolio Turnover Rate | |||||||||||||||||||||||||||||||||||||||
| Class A (12/04) | ||||||||||||||||||||||||||||||||||||||||||||||||||||||||
2008 | $ | 27.79 | $ | .08 | $ | (2.73 | ) | $ | (2.65 | ) | $ | (.22 | ) | $ | (1.34 | ) | (1.56 | ) | $ | 23.58 | (9.84 | )% | $ | 3,420 | 2.04 | % | (.07 | )% | 1.69 | % | .28 | % | 1.66 | % | .30 | % | 34 | % | ||||||||||||||||||
2007 | 23.95 | .17 | 4.48 | 4.65 | (.18 | ) | (.63 | ) | (.81 | ) | 27.79 | 19.67 | 6,888 | 1.82 | .52 | 1.68 | .66 | 1.68 | .67 | 31 | ||||||||||||||||||||||||||||||||||||
2006 | 20.71 | .27 | 3.20 | 3.47 | (.06 | ) | (.17 | ) | (.23 | ) | 23.95 | 16.81 | 4,128 | 2.32 | .43 | 1.69 | 1.06 | 1.61 | 1.14 | 21 | ||||||||||||||||||||||||||||||||||||
2005(e) | 20.00 | .10 | .61 | .71 | — | — | — | 20.71 | 3.55 | 3 | 2.87 | * | (.41 | )* | 1.72 | * | .74 | * | 1.58 | * | .88 | * | 6 | |||||||||||||||||||||||||||||||||
| Class B (12/04) | ||||||||||||||||||||||||||||||||||||||||||||||||||||||||
2008 | 27.51 | (.11 | ) | (2.70 | ) | (2.81 | ) | (.02 | ) | (1.34 | ) | (1.36 | ) | 23.34 | (10.49 | ) | 647 | 2.79 | (.79 | ) | 2.44 | (.44 | ) | 2.42 | (.42 | ) | 34 | |||||||||||||||||||||||||||||
2007 | 23.74 | (.02 | ) | 4.42 | 4.40 | — | (.63 | ) | (.63 | ) | 27.51 | 18.73 | 752 | 2.54 | (.19 | ) | 2.44 | (.09 | ) | 2.44 | (.08 | ) | 31 | |||||||||||||||||||||||||||||||||
2006 | 20.63 | .07 | 3.21 | 3.28 | — | (.17 | ) | (.17 | ) | 23.74 | 15.94 | 298 | 3.12 | (.47 | ) | 2.44 | .21 | 2.36 | .29 | 21 | ||||||||||||||||||||||||||||||||||||
2005(e) | 20.00 | .01 | .62 | .63 | — | — | — | 20.63 | 3.15 | 3 | 3.62 | * | (1.16 | )* | 2.47 | * | (.01 | )* | 2.33 | * | .13 | * | 6 | |||||||||||||||||||||||||||||||||
| Class C (12/04) | ||||||||||||||||||||||||||||||||||||||||||||||||||||||||
2008 | 27.53 | (.11 | ) | (2.71 | ) | (2.82 | ) | (.02 | ) | (1.34 | ) | (1.36 | ) | 23.35 | (10.52 | ) | 6,035 | 2.80 | (.81 | ) | 2.45 | (.46 | ) | 2.42 | (.44 | ) | 34 | |||||||||||||||||||||||||||||
2007 | 23.75 | (.02 | ) | 4.43 | 4.41 | — | (.63 | ) | (.63 | ) | 27.53 | 18.76 | 8,771 | 2.53 | (.17 | ) | 2.44 | (.07 | ) | 2.43 | (.07 | ) | 31 | |||||||||||||||||||||||||||||||||
2006 | 20.63 | .07 | 3.22 | 3.29 | — | (.17 | ) | (.17 | ) | 23.75 | 15.99 | 3,524 | 3.06 | (.39 | ) | 2.44 | .22 | 2.36 | .31 | 21 | ||||||||||||||||||||||||||||||||||||
2005(e) | 20.00 | .01 | .62 | .63 | — | — | — | 20.63 | 3.15 | 3 | 3.62 | * | (1.16 | )* | 2.47 | * | (.01 | )* | 2.33 | * | .13 | * | 6 | |||||||||||||||||||||||||||||||||
| Class I (12/04)(f) | ||||||||||||||||||||||||||||||||||||||||||||||||||||||||
2008 | 27.85 | .16 | (2.75 | ) | (2.59 | ) | (.29 | ) | (1.34 | ) | (1.63 | ) | 23.63 | (9.62 | ) | 4,396 | 1.76 | .25 | 1.41 | .60 | 1.39 | .62 | 34 | |||||||||||||||||||||||||||||||||
2007 | 24.00 | .24 | 4.48 | 4.72 | (.24 | ) | (.63 | ) | (.87 | ) | 27.85 | 19.95 | 4,868 | 1.58 | .78 | 1.43 | .93 | 1.43 | .93 | 31 | ||||||||||||||||||||||||||||||||||||
2006 | 20.74 | .22 | 3.32 | 3.54 | (.11 | ) | (.17 | ) | (.28 | ) | 24.00 | 17.15 | 3,261 | 2.09 | .22 | 1.44 | .88 | 1.36 | .96 | 21 | ||||||||||||||||||||||||||||||||||||
2005(e) | 20.00 | .13 | .61 | .74 | — | — | — | 20.74 | 3.70 | 2,066 | 2.59 | * | (.13 | )* | 1.44 | * | 1.02 | * | 1.33 | * | 1.13 | * | 6 | |||||||||||||||||||||||||||||||||
| * | Annualized. |
| (a) | Per share Net Investment Income (Loss) is calculated using the average daily shares method. |
| (b) | Total return is the combination of changes in net asset value without any sales charge, reinvested dividend income at net asset value and reinvested capital gains distributions at net asset value, if any. Total returns are not annualized. |
| (c) | After expense reimbursement from the Adviser, where applicable. |
| (d) | After custodian fee credit and expense reimbursement, where applicable. |
| (e) | For the period December 9, 2004 (commencement of operations) through June 30, 2005. |
| (f) | Effective May 1, 2008, Class R Shares were renamed Class I Shares. |
See accompanying notes to financial statements.
65
Financial Highlights (continued)
Selected data for a share outstanding throughout each period:
| Class (Inception Date) | |||||||||||||||||||||||||||||||||||||||||||||||||||||||||
| Investment Operations | Less Distributions | Ratios/Supplemental Data | |||||||||||||||||||||||||||||||||||||||||||||||||||||||
| VALUE OPPORTUNITIES | Ratios to Average Net Assets Before Credit/ Reimbursement | Ratios to Average Net Assets After Reimbursement(c) | Ratios to Average Net Assets After Credit/ Reimbursement(d) | ||||||||||||||||||||||||||||||||||||||||||||||||||||||
| Year Ended June 30, | Beginning Net Asset Value | Net Invest- ment Income (Loss)(a) | Net (Loss) | Total | Net Invest- ment Income | Capital Gains | Total | Ending Net Asset Value | Total Return(b) | Ending Net Assets (000) | Expenses | Net Invest- ment Income (Loss) | Expenses | Net Invest- ment Income (Loss) | Expenses | Net Invest- ment Income (Loss) | Portfolio Turnover Rate | ||||||||||||||||||||||||||||||||||||||||
| Class A (12/04) | |||||||||||||||||||||||||||||||||||||||||||||||||||||||||
2008 | $ | 32.48 | $ | .20 | $ | (1.03 | ) | $ | (.83 | ) | $ | (.59 | ) | $ | (1.46 | ) | $ | (2.05 | ) | $ | 29.60 | (2.65 | )% | $ | 368,093 | 1.42 | % | .63 | % | 1.42 | % | .63 | % | 1.41 | % | .64 | % | 48 | % | ||||||||||||||||||
2007 | 26.90 | .30 | 5.83 | 6.13 | (.29 | ) | (.26 | ) | (.55 | ) | 32.48 | 22.98 | 248,827 | 1.39 | .99 | 1.39 | .99 | 1.39 | .99 | 23 | |||||||||||||||||||||||||||||||||||||
2006 | 21.07 | .28 | 5.88 | 6.16 | (.07 | ) | (.26 | ) | (.33 | ) | 26.90 | 29.45 | 73,389 | 1.63 | .94 | 1.49 | 1.09 | 1.48 | 1.09 | 29 | |||||||||||||||||||||||||||||||||||||
2005(e) | 20.00 | .08 | .99 | 1.07 | — | — | — | 21.07 | 5.35 | 3 | 3.12 | * | (1.10 | )* | 1.51 | * | .52 | * | 1.30 | * | .73 | * | 45 | ||||||||||||||||||||||||||||||||||
| Class B (12/04) | |||||||||||||||||||||||||||||||||||||||||||||||||||||||||
2008 | 32.15 | (.03 | ) | (1.02 | ) | (1.05 | ) | (.35 | ) | (1.46 | ) | (1.81 | ) | 29.29 | (3.39 | ) | 6,816 | 2.17 | (.11 | ) | 2.17 | (.11 | ) | 2.16 | (.10 | ) | 48 | ||||||||||||||||||||||||||||||
2007 | 26.66 | .07 | 5.76 | 5.83 | (.08 | ) | (.26 | ) | (.34 | ) | 32.15 | 22.04 | 5,521 | 2.14 | .24 | 2.14 | .24 | 2.14 | .24 | 23 | |||||||||||||||||||||||||||||||||||||
2006 | 20.98 | .09 | 5.85 | 5.94 | — | (.26 | ) | (.26 | ) | 26.66 | 28.49 | 1,041 | 2.40 | .16 | 2.24 | .33 | 2.23 | .34 | 29 | ||||||||||||||||||||||||||||||||||||||
2005(e) | 20.00 | — | .98 | .98 | — | — | — | 20.98 | 4.90 | 3 | 3.87 | * | (1.85 | )* | 2.26 | * | (.23 | )* | 2.05 | * | (.02 | )* | 45 | ||||||||||||||||||||||||||||||||||
| Class C (12/04) | |||||||||||||||||||||||||||||||||||||||||||||||||||||||||
2008 | 32.16 | (.03 | ) | (1.03 | ) | (1.06 | ) | (.35 | ) | (1.46 | ) | (1.81 | ) | 29.29 | (3.39 | ) | 116,463 | 2.17 | (.10 | ) | 2.17 | (.10 | ) | 2.16 | (.10 | ) | 48 | ||||||||||||||||||||||||||||||
2007 | 26.66 | .07 | 5.77 | 5.84 | (.08 | ) | (.26 | ) | (.34 | ) | 32.16 | 22.04 | 100,295 | 2.14 | .24 | 2.14 | .24 | 2.14 | .24 | 23 | |||||||||||||||||||||||||||||||||||||
2006 | 20.98 | .08 | 5.86 | 5.94 | — | (.26 | ) | (.26 | ) | 26.66 | 28.49 | 22,102 | 2.40 | .15 | 2.24 | .31 | 2.23 | .32 | 29 | ||||||||||||||||||||||||||||||||||||||
2005(e) | 20.00 | — | .98 | .98 | — | — | — | 20.98 | 4.90 | 3 | 3.87 | * | (1.85 | )* | 2.26 | * | (.23 | )* | 2.05 | * | (.02 | )* | 45 | ||||||||||||||||||||||||||||||||||
| Class I (12/04) (f) | |||||||||||||||||||||||||||||||||||||||||||||||||||||||||
2008 | 32.54 | .28 | (1.03 | ) | (.75 | ) | (.67 | ) | (1.46 | ) | (2.13 | ) | 29.66 | (2.39 | ) | 278,649 | 1.17 | .89 | 1.17 | .89 | 1.17 | .89 | 48 | ||||||||||||||||||||||||||||||||||
2007 | 26.95 | .39 | 5.82 | 6.21 | (.36 | ) | (.26 | ) | (.62 | ) | 32.54 | 23.30 | 161,284 | 1.14 | 1.28 | 1.14 | 1.28 | 1.14 | 1.28 | 23 | |||||||||||||||||||||||||||||||||||||
2006 | 21.09 | .31 | 5.93 | 6.24 | (.12 | ) | (.26 | ) | (.38 | ) | 26.95 | 29.80 | 37,393 | 1.48 | .98 | 1.24 | 1.22 | 1.23 | 1.23 | 29 | |||||||||||||||||||||||||||||||||||||
2005(e) | 20.00 | .11 | .98 | 1.09 | — | — | — | 21.09 | 5.45 | 2,102 | 2.86 | * | (.84 | )* | 1.24 | * | .77 | * | 1.05 | * | .97 | * | 45 | ||||||||||||||||||||||||||||||||||
| * | Annualized. |
| (a) | Per share Net Investment Income (Loss) is calculated using the average daily shares method. |
| (b) | Total return is the combination of changes in net asset value without any sales charge, reinvested dividend income at net asset value and reinvested capital gains distributions at net asset value, if any. Total returns are not annualized. |
| (c) | After expense reimbursement from the Adviser, where applicable. |
| (d) | After custodian fee credit and expense reimbursement, where applicable. |
| (e) | For the period December 9, 2004 (commencement of operations) through June 30, 2005. |
| (f) | Effective May 1, 2008, Class R Shares were renamed Class I Shares. |
See accompanying notes to financial statements.
66
Report of Independent Registered Public Accounting Firm
To the Board of Trustees and Shareholders of
Nuveen Investment Trust:
In our opinion, the accompanying statements of assets and liabilities, including the portfolios of investments, and the related statements of operations and of changes in net assets and the financial highlights present fairly, in all material respects, the financial position of Nuveen NWQ Multi-Cap Value Fund, Nuveen NWQ Large-Cap Value Fund, Nuveen NWQ Small/Mid-Cap Value Fund, Nuveen NWQ Small-Cap Value Fund, Nuveen Global Value Fund and Nuveen Tradewinds Value Opportunities Fund (each a series of the Nuveen Investment Trust, hereafter referred to as the “Funds”) at June 30, 2008, the results of each of their operations for the periods indicated, the changes in each of their net assets for each of the periods indicated and the financial highlights for each of the periods indicated, in conformity with accounting principles generally accepted in the United States of America. These financial statements and financial highlights (hereafter referred to as “financial statements”) are the responsibility of the Funds’ management; our responsibility is to express an opinion on these financial statements based on our audits. We conducted our audits of these financial statements in accordance with the standards of the Public Company Accounting Oversight Board (United States). These standards require that we plan and perform the audit to obtain reasonable assurance about whether the financial statements are free of material misstatement. An audit includes examining, on a test basis, evidence supporting the amounts and disclosures in the financial statements, assessing the accounting principles used and significant estimates made by management, and evaluating the overall financial statement presentation. We believe that our audits, which included confirmation of securities at June 30, 2008 by correspondence with the custodian and brokers, provide a reasonable basis for our opinion.
PricewaterhouseCoopers LLP
Chicago, IL
August 22, 2008
67
Annual Investment Management Agreement Approval Process
The Investment Company Act of 1940, as amended (the “1940 Act”), provides, in substance, that each investment advisory agreement between a fund and its investment adviser (including sub-advisers) will continue in effect from year to year only if its continuance is approved at least annually by the fund’s board members, including by a vote of a majority of the board members who are not parties to the advisory agreement or “interested persons” of any parties (the “Independent Board Members”), cast in person at a meeting called for the purpose of considering such approval. In connection with such approvals, the fund’s board members must request and evaluate, and the investment adviser is required to furnish, such information as may be reasonably necessary to evaluate the terms of the advisory agreement. Accordingly, at a meeting held on May 28-29, 2008 (the “May Meeting”), the Boards of Trustees (each, a “Board” and each Trustee, a “Board Member”) of the Funds, including a majority of the Independent Board Members, considered and approved the continuation of the advisory and sub-advisory agreements that were up for renewal for an additional one-year period for the following funds: Nuveen NWQ Multi-Cap Value Fund; Nuveen NWQ Large-Cap Value Fund; Nuveen NWQ Small/Mid-Cap Value Fund; Nuveen NWQ Small-Cap Value Fund; and Nuveen Tradewinds Value Opportunities Fund. These agreements include the investment advisory agreements between Nuveen Asset Management (“NAM”) and each of the foregoing funds; the sub-advisory agreement between NAM and NWQ Investment Management Company, LLC (“NWQ”) on behalf of each of the following funds: Nuveen NWQ Multi-Cap Value Fund; Nuveen NWQ Large-Cap Value Fund; Nuveen NWQ Small/Mid-Cap Value Fund; and Nuveen NWQ Small-Cap Value Fund; and the sub-advisory agreement between NAM and Tradewinds Global Investors, LLC (“Tradewinds”) on behalf of the Nuveen Tradewinds Value Opportunities Fund. In preparation for their considerations at the May Meeting, the Board also held a separate meeting on April 23, 2008 (the “April Meeting”). Accordingly, the factors considered and determinations made regarding the renewals by the Independent Board Members include those made at the April Meeting.
The investment advisory agreement between NAM and the Nuveen Global Value Fund (currently known as the Nuveen Growth Allocation Fund) and sub-advisory agreement between NAM and Richards & Tierney, Inc. (“R&T”) on behalf of such fund were approved separately at the April Meeting, and were not up for renewal at the May Meeting.
The approvals for the Nuveen NWQ Multi-Cap Value Fund, Nuveen NWQ Large-Cap Value Fund, Nuveen NWQ Small/Mid-Cap Value Fund, Nuveen NWQ Small-Cap Value Fund and Nuveen Tradewinds Value Opportunities Fund are set forth below in Section I, followed by the discussion in Section II of the approvals for the Nuveen Global Value Fund.
I. Nuveen NWQ Multi-Cap Value Fund, Nuveen NWQ Large-Cap Value Fund, Nuveen NWQ Small/Mid-Cap Value Fund, Nuveen NWQ Small-Cap Value Fund and Nuveen Tradewinds Value Opportunities Fund
With respect to the Nuveen NWQ Multi-Cap Value Fund, Nuveen NWQ Large-Cap Value Fund, Nuveen NWQ Small/Mid-Cap Value Fund, Nuveen NWQ Small-Cap Value Fund and Nuveen Tradewinds Value Opportunities Fund (for purposes of this Section I, the “Funds”), in evaluating the applicable advisory agreements (for purposes of this Section I, each an “Investment Management Agreement”) and sub-advisory agreements (for purposes of this Section I, each a “Sub-Advisory Agreement,” and each Investment Management Agreement and Sub-Advisory Agreement, an “Advisory Agreement”), as described in further detail below, the Independent Board Members reviewed a broad range of information relating to the Funds, NAM, NWQ and Tradewinds (NWQ and Tradewinds are each a “Sub-Adviser” and NAM and the Sub-Advisers are each a “Fund Adviser”), including absolute performance, fee and expense information for the Funds as well as comparative performance, fee and expense information for a comparable peer group of funds, the performance information of recognized and/or customized benchmarks (as applicable), the profitability of Nuveen for its advisory activities (which includes its wholly owned subsidiaries), and other information regarding the organization, personnel, and services provided by the respective Fund Adviser. The Independent Board Members also met quarterly as well as at other times as the need arose during the year and took into account the information provided at such meetings and the knowledge gained therefrom. Prior to approving the renewal of the Advisory Agreements, the Independent Board Members reviewed the foregoing information with their independent legal counsel and with management, reviewed materials from independent legal counsel describing applicable law and their duties in reviewing advisory contracts, and met with independent legal counsel in private sessions without management present. The Independent Board Members considered the legal advice provided by independent legal counsel and relied upon their knowledge of the Fund Adviser, its services and the Funds resulting from their meetings and other interactions throughout the year and their own business judgment in determining the factors to be considered in evaluating the Advisory Agreements. Each Board Member may have accorded different weight to the various factors in reaching his or her conclusions with respect to a Fund’s Advisory Agreements. The Independent Board Members did not identify any single factor as all-important or controlling. The Independent Board Members’ considerations were instead based on a comprehensive consideration of all the information presented. The principal factors considered by the Board and its conclusions are described below.
A. Nature, Extent and Quality of Services
In considering renewal of the Investment Management Agreements, the Independent Board Members considered the nature, extent and quality of the Fund Adviser’s services, including advisory services and administrative services. The Independent Board Members reviewed materials outlining, among other things, NAM’s organization and business; the types of services that NAM or its affiliates provide and are expected to provide to the Funds; the performance record of the applicable Fund (as described in further detail below); and any initiatives Nuveen had taken for the applicable fund product line. With respect to personnel, the Independent Board Members evaluated the background, experience and track record of the Fund Adviser’s investment personnel. In this regard, the Independent Board Members considered the additional investment in personnel to support Nuveen fund advisory activities, including
68
in operations, product management and marketing as well as related fund support functions, including sales, executive, finance, human resources and information technology. The Independent Board Members also reviewed information regarding portfolio manager compensation arrangements to evaluate NAM’s ability to attract and retain high quality investment personnel.
In evaluating the services of NAM, the Independent Board Members also considered NAM’s oversight of the performance, business activities and compliance of the Sub-Advisers, the ability to supervise the Fund’s other service providers and given the importance of compliance, NAM’s compliance program. Among other things, the Independent Board Members considered the report of the chief compliance officer regarding the Funds’ compliance policies and procedures.
In addition to advisory services, the Independent Board Members considered the quality of administrative services provided by NAM and its affiliates including product management, fund administration, oversight of service providers, shareholder services, administration of Board relations, regulatory and portfolio compliance and legal support.
The Independent Board Members reviewed an evaluation of each Sub-Adviser from NAM, including information as to the process followed by NAM in evaluating sub-advisers. The evaluation also included information relating to each Sub-Adviser’s organization, operations, personnel, assets under management, investment philosophy, strategies and techniques in managing the Fund, developments affecting each Sub-Adviser, and an analysis of each Sub-Adviser. As described in further detail below, the Board considered the performance of the Fund sub-advised by the respective Sub-Adviser. The Board also recognized that the Sub-Advisory Agreements were essentially agreements for portfolio management services only and the respective Sub-Adviser was not expected to supply other significant administrative services to the Funds. During the last year, the Independent Board Members noted that they visited several sub-advisers to the Nuveen funds, meeting their key investment and business personnel. In this regard, during 2007, the Independent Board Members visited NWQ and Tradewinds. The Independent Board Members also noted that they anticipate visiting each sub-adviser to the Nuveen funds at least once over the course of a multiple-year rotation. The Independent Board Members further noted that NAM recommended the renewal of the applicable Sub-Advisory Agreements and considered the basis for such recommendations and any qualifications in connection therewith.
Based on their review, the Independent Board Members found that, overall, the nature, extent and quality of services provided (and expected to be provided) to the respective Funds under the Investment Management Agreement or Sub-Advisory Agreement, as applicable, were satisfactory.
B. The Investment Performance of the Funds and Fund Advisers
The Board considered the investment performance of each Fund, including the Fund’s historic performance as well as its performance compared to funds with similar investment objectives (the “Performance Peer Group”) based on data provided by an independent third party (as described below). In addition, the Independent Board Members reviewed the respective Fund’s historic performance compared to recognized and/or customized benchmarks (as applicable).
In evaluating the performance information, the Board considered whether the Fund has operated within its investment objectives and parameters and the impact that the investment mandates may have had on performance. In addition, in comparing a Fund’s performance with that of its Performance Peer Group, the Independent Board Members took into account that the closest Performance Peer Group in certain instances may not adequately reflect the respective fund’s investment objectives and strategies thereby hindering a meaningful comparison of the fund’s performance with that of the Performance Peer Group. These Performance Peer Groups include that of the Nuveen Tradewinds Value Opportunities Fund.
The Independent Board Members reviewed performance information including, among other things, total return information compared with the Fund’s Performance Peer Group as well as recognized and/or customized benchmarks (as appropriate) for the one-, three- and five-year periods (as applicable) ending December 31, 2007 and with the Fund’s Performance Peer Group for the quarter, one-, three-, and five- year periods ending March 31, 2008 (as applicable). This information supplemented the Fund performance information provided to the Board at each of its quarterly meetings. Based on their review, the Independent Board Members determined that the respective Fund’s investment performance over time had been satisfactory.
C. Fees, Expenses and Profitability
1. Fees and Expenses
The Board evaluated the management fees and expenses of each Fund reviewing, among other things, such Fund’s gross management fees (which take into account breakpoints), net management fees (which take into account fee waivers or reimbursements) and total expense ratios (before and after expense reimbursements and/or waivers) in absolute terms as well as compared to the gross management fees, net management fees (after waivers and/or reimbursements) and total expense ratios (before and after waivers) of a comparable universe of unaffiliated funds based on data provided by an independent data provider (the “Peer Universe”) and/or a more focused subset of funds therein (the “Peer Group”). The Independent Board Members further reviewed data regarding the construction of Peer Groups as well as the methods of measurement for the fee and expense analysis and the performance analysis. In reviewing the comparisons of fee and expense information, the Independent Board Members took into account that in certain instances various factors such as the size of the Fund relative to peers, the size and particular composition of the Peer Group, the investment objectives of the peers, expense anomalies, and the timing of information used may impact the comparative data, thereby limiting the ability to make a meaningful comparison. In reviewing the fee schedule for a Fund, the Independent Board Members also considered the fund-level and complex-wide breakpoint
69
Annual Investment Management Agreement Approval Process (continued)
schedules (described in further detail below) and any fee waivers and reimbursements provided by Nuveen. Based on their review of the fee and expense information provided, the Independent Board Members determined that each Fund’s management fees and net total expense ratio were reasonable in light of the nature, extent and quality of services provided to the Fund.
2. Comparisons with the Fees of Other Clients
The Independent Board Members further reviewed information regarding the nature of services and fee rates offered by NAM to other clients. Such clients include separately managed accounts (both retail and institutional accounts) and funds that are not offered by Nuveen but are sub-advised by one of Nuveen’s investment management teams. In evaluating the comparisons of fees, the Independent Board Members noted that the fee rates charged to the Funds and other clients vary, among other things, because of the different services involved and the additional regulatory and compliance requirements associated with registered investment companies, such as the Funds. Accordingly, the Independent Board Members considered the differences in the product types, including, but not limited to, the services provided, the structure and operations, product distribution and costs thereof, portfolio investment policies, investor profiles, account sizes and regulatory requirements. The Independent Board Members noted, in particular, that the range of services provided to the Funds (as discussed above) is much more extensive than that provided to separately managed accounts. Given the inherent differences in the products, particularly the extensive services provided to the Funds, the Independent Board Members believe such facts justify the different levels of fees.
In considering the fees of a Sub-Adviser, the Independent Board Members also considered the pricing schedule or fees that the Sub-Adviser charges for similar investment management services for other fund sponsors or clients (such as retail and/or institutional managed accounts) as applicable.
3. Profitability of Fund Advisers
In conjunction with its review of fees, the Independent Board Members also considered the profitability of Nuveen for its advisory activities (which incorporated Nuveen’s wholly-owned affiliated sub-advisers) and its financial condition. The Independent Board Members reviewed the revenues and expenses of Nuveen’s advisory activities for the last two years and the allocation methodology used in preparing the profitability data. The Independent Board Members noted this information supplemented the profitability information requested and received during the year to help keep them apprised of developments affecting profitability (such as changes in fee waivers and expense reimbursement commitments). In this regard, the Independent Board Members noted that they had also appointed an Independent Board Member as a point person to review and keep them apprised of changes to the profitability analysis and/or methodologies during the year. The Independent Board Members considered Nuveen’s profitability compared with other fund sponsors prepared by two independent third party service providers as well as comparisons of the revenues, expenses and profit margins of various unaffiliated management firms with similar amounts of assets under management prepared by Nuveen.
In reviewing profitability, the Independent Board Members recognized the subjective nature of determining profitability which may be affected by numerous factors including the allocation of expenses. Further, the Independent Board Members recognized the difficulties in making comparisons as the profitability of other advisers generally is not publicly available and the profitability information that is available for certain advisers or management firms may not be representative of the industry and may be affected by, among other things, the adviser’s particular business mix, capital costs, types of funds managed and expense allocations.
Notwithstanding the foregoing, the Independent Board Members reviewed Nuveen’s methodology and assumptions for allocating expenses across product lines to determine profitability. In reviewing profitability, the Independent Board Members recognized Nuveen’s investment in its fund business.
Based on its review, the Independent Board Members concluded that Nuveen’s level of profitability for its advisory activities was reasonable in light of the services provided.
In evaluating the reasonableness of the compensation, the Independent Board Members also considered other amounts paid to a Fund Adviser by the Funds as well as any indirect benefits (such as soft dollar arrangements, if any) the Fund Adviser and its affiliates receive, or are expected to receive, that are directly attributable to the management of the Funds, if any. See Section E below for additional information on indirect benefits the Fund Adviser may receive as a result of its relationship with the Funds. Based on their review of the overall fee arrangements of each Fund, the Independent Board Members determined that the advisory fees and expenses of the respective Fund were reasonable.
D. Economies of Scale and Whether Fee Levels Reflect These Economies of Scale
With respect to economies of scale, the Independent Board Members recognized the potential benefits resulting from the costs of a fund being spread over a larger asset base. The Independent Board Members therefore considered whether the Funds have appropriately benefited from any economies of scale and whether there is potential realization of any further economies of scale. In considering economies of scale, the Independent Board Members have recognized that economies of scale are difficult to measure and predict with precision, particularly on a fund-by-fund basis. Notwithstanding the foregoing, one method to help ensure the shareholders share in these benefits is to include breakpoints in the advisory fee schedule. Accordingly, the Independent Board Members reviewed and considered the fund-level breakpoints in the advisory fee schedules that reduce advisory fees.
70
In addition to fund-level advisory fee breakpoints, the Board also considered the Funds’ complex-wide fee arrangement. Pursuant to the complex-wide fee arrangement, the fees of the funds in the Nuveen complex, including the Funds, are reduced as the assets in the fund complex reach certain levels. In evaluating the complex-wide fee arrangement, the Independent Board Members recognized that the complex-wide fee schedule was recently revised in 2007 to provide for additional fee savings to shareholders and considered the amended schedule. The Independent Board Members further considered that the complex-wide fee arrangement seeks to provide the benefits of economies of scale to fund shareholders when total fund complex assets increase, even if assets of a particular fund are unchanged or have decreased. The approach reflects the notion that some of Nuveen’s costs are attributable to services provided to all its funds in the complex and therefore all funds benefit if these costs are spread over a larger asset base. Based on their review, the Independent Board Members concluded that the breakpoint schedule and complex-wide fee arrangement were acceptable and desirable in providing benefits from economies of scale to shareholders.
E. Indirect Benefits
In evaluating fees, the Independent Board Members received and considered information regarding potential “fall out” or ancillary benefits the respective Fund Adviser or its affiliates may receive as a result of its relationship with each Fund. In this regard, the Independent Board Members considered, among other things, any sales charges, distribution fees and shareholder services fees received and retained by the Funds’ principal underwriter, an affiliate of NAM, which includes fees received pursuant to any 12b-1 plan. The Independent Board Members, therefore, considered the 12b-1 fees retained by Nuveen during the last calendar year.
In addition to the above, the Independent Board Members considered whether the Fund Adviser received any benefits from soft dollar arrangements whereby a portion of the commissions paid by a Fund for brokerage may be used to acquire research that may be useful to the Fund Adviser in managing the assets of the Funds and other clients. With respect to NAM, the Independent Board Members noted that NAM does not currently have any soft dollar arrangements; however, to the extent certain bona fide agency transactions that occur on markets that traditionally trade on a principal basis and riskless principal transactions are considered as generating “commissions,” NAM intends to comply with the applicable safe harbor provisions.
In addition, the Independent Board Members considered that the Sub-Advisers may benefit from their soft dollar arrangements pursuant to which the respective Sub-Adviser receives research from brokers that execute the applicable Fund’s portfolio transactions. The Independent Board Members noted that such Sub-Advisers’ profitability may be lower if they were required to pay for this research with hard dollars.
Based on their review, the Independent Board Members concluded that any indirect benefits received by a Fund Adviser as a result of its relationship with the Funds were reasonable and within acceptable parameters.
F. Other Considerations
The Independent Board Members did not identify any single factor discussed previously as all-important or controlling. The Board Members, including the Independent Board Members, unanimously concluded that the terms of the Investment Management Agreements and Sub-Advisory Agreements are fair and reasonable, that the respective Fund Adviser’s fees are reasonable in light of the services provided to each Fund and that the Investment Management Agreements and the Sub-Advisory Agreements be renewed.
II. Nuveen Global Value Fund (currently known as the Nuveen Growth Allocation Fund)
The Board is responsible for overseeing the performance of the investment advisers to the Nuveen Global Value Fund (for purposes of this Section II, the “Fund”) and determining whether to approve the Fund’s advisory arrangements, including sub-advisory arrangements. As indicated above, at the April Meeting, the Board, including the Independent Board Members, approved the continuance of the investment management agreement (for purposes of this Section II, the “Investment Management Agreement”) between the Fund and NAM and a new sub-advisory agreement (the “R&T Sub-Advisory Agreement”) between NAM and R&T (for purposes of this Section II, the “Sub-Adviser”) on behalf of the Fund. NAM and R&T are referred to occasionally throughout this section each as a “Fund Adviser” and together as the “Fund Advisers.” The R&T Sub-Advisory Agreement was required to be submitted to shareholders for their approval.
The Approval Process
Since last year and during the course of this year, NAM has been evaluating the investment strategy of the Fund and considering potential changes to such strategies in an effort to continue to meet investors’ needs in the current marketplace. Beginning in February 2008, the Board received a variety of materials relating to proposed changes to convert the Fund to a “fund-of-funds” structure, including the changes to the Fund’s investment objective and policies, as well as the rationale for the proposed changes, the Fund’s proposed asset allocations and the modified fee structure. In considering the proposed changes, the Board considered the Fund’s past performance, including its total return for the quarter, one-year, three-year and five-year periods ending December 31, 2007 (as applicable) and the Fund’s performance compared to similar, unaffiliated funds based on information and data provided by an independent third party and to recognized and/or customized benchmarks. The Board reviewed the net flows from purchases and redemptions of the Fund, noting the limited growth of the Fund. The Board further recognized the changes in the marketplace over the years with funds being offered with a broader multi-asset and multi-manager approach than that followed by the Fund by diversifying among multiple asset classes and managers. The Board recognized that the proposed change to the Fund’s investment strategy seeks, in part, to improve the Fund’s risk/return profile by using asset allocation to diversify risk and diversify sources of
71
Annual Investment Management Agreement Approval Process (continued)
value-added returns by accessing multiple investment managers. The Board reviewed the revised management fee schedule and estimated expenses for the Fund, including NAM’s commitment to waive fees and reimburse expenses through October 31, 2011 (as described in further detail below). The Independent Board Members further noted that NAM would pay one-half of the costs incurred in connection with the solicitation of proxies in seeking the necessary shareholder approvals to change the Fund’s fundamental investment objectives and policies if shareholder approval were obtained and would pay all costs if shareholder approval were not obtained. Based on its considerations, the Board approved the changes to the Fund’s investment objectives and applicable investment policies, and recommended that shareholders approve such changes. The Board also approved an amendment to the Fund’s then-current investment management agreement to reflect the lower management fee effective upon shareholder approval of the changes to the Fund’s investment objectives and fundamental investment policies necessary to convert the Fund to a fund-of-funds structure. As described in further detail below, the Board also approved the R&T Sub-Advisory Agreement and recommended shareholders approve such agreement.
In conjunction with the changes to the Fund’s investment strategy, the Board reviewed the advisory arrangements of the Fund. To assist the Board in its evaluation of the Investment Management Agreement and R&T Sub-Advisory Agreement, at the April Meeting or prior meetings, the Independent Board Members received, in adequate time in advance of the April Meeting or prior meetings, extensive materials which outlined, among other things:
| • | the nature, extent and quality of services to be provided by the Fund Advisers; |
| • | the organization and business operations of the Fund Advisers; |
| • | the performance of the Fund as described below; |
| • | the profitability of Nuveen Investments, Inc.; |
| • | the proposed management fees of the Fund Advisers, including comparisons of the management fees with the gross management fees of comparable, unaffiliated funds based on information and data provided by an independent third party; |
| • | the expected expenses of the Fund, including comparisons of the Fund’s expected expense ratios with the expense ratios of comparable, unaffiliated funds based on information and data provided by an independent third party; and |
| • | the soft dollar practices of the Fund Advisers, if any. |
At the April Meeting, NAM made a presentation to and responded to questions from the Board. Prior to and during the April Meeting, the Independent Board Members met privately with their legal counsel to review the Board’s duties under the 1940 Act and the general principles of state law in reviewing and approving advisory contracts, an adviser’s fiduciary duty with respect to advisory contracts and compensation, the standards used by courts in determining whether investment company boards of directors have fulfilled their duties and factors to be considered by the Board in voting on advisory contracts. As outlined in more detail below, the Independent Board Members considered all factors they believed relevant with respect to the Fund, including the following: (a) the nature, extent and quality of the services to be provided by the Fund Advisers; (b) performance information of the Fund (as described below); (c) the profitability of Nuveen and its affiliates; (d) the extent to which economies of scale would be realized as the Fund grows; and (e) whether fee levels reflect these economies of scale for the benefit of Fund investors. In addition, the Board met regularly throughout the year to oversee the Fund. The Board Members relied upon their knowledge resulting from their meetings and interactions with NAM in evaluating the Fund’s advisory arrangements. It is with this background that the Board considered each advisory agreement for the Fund.
A. Nature, Extent and Quality of Services
In considering the renewal of the Investment Management Agreement and approval of the R&T Sub-Advisory Agreement of the Fund, the Board considered the nature, extent and quality of the respective Fund Adviser’s services. In this regard, as NAM already serves as adviser to other Nuveen funds overseen by the Board, the Board has a good understanding of NAM’s organization, operations and personnel. At the April Meeting or at prior meetings, the Board had reviewed materials outlining, among other things, each Fund Adviser’s organization and business; the types of services that each Fund Adviser or its affiliates would provide to the Fund under the revised investment strategy; the experience of each Fund Adviser with respect to the revised investment strategies; and the experience and credentials of each Fund Adviser’s personnel. In addition, the Independent Board Members noted that the Fund generally will invest in other Nuveen funds advised by NAM and may be sub-advised by an affiliated person of NAM. In light of the Fund having a fund-of-funds structure, the Board considered whether the services to be provided by the Fund Adviser to the Fund are in addition to, and not duplicative of, the services provided by the advisers to the underlying funds under their advisory contracts. The Board further noted that NAM recommended R&T and considered the basis for such recommendation.
In addition to advisory services, the Independent Board Members considered the quality of any administrative or non-advisory services provided. With respect to NAM, the Board noted that NAM and its affiliates provide the Fund with a wide variety of services and officers and other personnel as are necessary for the operations of the Fund, including, among other things: product management, fund administration, oversight of shareholder services and other fund service providers (including R&T), administration of Board relations, regulatory and portfolio compliance and legal support. With respect to R&T, the Independent Board Members noted that the R&T Sub-Advisory Agreement was essentially an agreement for portfolio management services only and R&T was not expected to supply other significant administrative services to the Fund.
72
Based on their review, the Board found that, overall, the nature, extent and quality of services provided and expected to be provided to the Fund under the Investment Management Agreement and R&T Sub-Advisory Agreement were satisfactory.
B. The Investment Performance of the Fund
As described above, in considering the proposal to change the Fund’s investment strategy, the Independent Board Members reviewed the Fund’s past performance record. There is, however, no record of the Fund’s performance under its modified investment strategy.
C. Fees, Expenses and Profitability
1. Fees and Expenses
In evaluating the management fees and expenses of the Fund, the Board recognized that the fee structure will change significantly under the Fund’s new fund-of-funds structure. With respect to the overall advisory fees and expenses of the Fund, the Board reviewed, among other things, the Fund’s proposed advisory fees (gross management fees) and estimated total expense ratios (before and after expense reimbursements and/or waivers) in absolute terms as well as comparisons to the gross management fees (before waivers), and total expense ratios (before and after waivers) of comparable, unaffiliated funds as well as a subset of fund-of-funds peers. In addition, in reviewing the comparisons, the Board recognized the differences between the fee and expense arrangement of a fund-of-funds structure and a traditional fund format thereby limiting some of the usefulness of the fee comparisons with that of traditional funds. In reviewing the advisory fees, the Independent Board Members also noted that NAM and R&T do not currently advise other fund-of-funds and therefore meaningful comparisons of fees assessed for similar clients were not available. In addition, the Board further noted that, in a fund-of-funds structure, the Fund will indirectly pay a portion of the expenses incurred by the underlying funds, including their advisory fees. The Independent Board Members noted that many of the underlying funds may be advised by NAM and sub-advised by an affiliated person of NAM. Accordingly, although the Fund’s advisory fee rate will be reduced under the new structure, NAM and affiliated sub-advisers may receive advisory fees from the underlying funds in which the Fund invests, and the Fund will indirectly bear its pro rata portion of these fees as well as the other expenses of the underlying funds. In considering the services provided by the Fund Advisers and the fee arrangements, the Board determined, however, that the fees were for services in addition to, rather than duplicative of, the services provided under any underlying fund’s advisory contracts.
In addition to the foregoing, the Board noted that NAM had agreed to waive fees and reimburse expenses through October 31, 2011 such that total annual net operating expenses (excluding 12b-1 distribution and service fees, interest expenses, taxes, fees incurred in acquiring and disposing of portfolio securities, underlying fund fees and expenses, and extraordinary expenses) would not exceed a specified percentage of the average daily net assets of any class of the Fund’s shares. The Board recognized that, although this expense cap is intended to approximate the Fund’s current expense cap, as the Fund reallocates its investments among the underlying funds, the weighted average operating expenses of the underlying funds borne by the Fund may increase or decrease, which could cause the Fund’s total annual net operating expenses (including fees and expenses of underlying funds) to be above or below the Fund’s current expense cap. Subsequently, at a meeting held in July 2008, the Board approved a reduced expense cap of 0.40% of the average daily net assets, subject to the exceptions noted above.
With respect to sub-advisory fees, NAM will pay the sub-advisory fees out of the management fees it receives from the Fund. The Independent Board Members reviewed the proposed sub-advisory fee arrangements.
Based on its review of the fee and service information provided, the Board determined that the proposed advisory fees for the respective Fund Adviser were reasonable.
2. Profitability
In conjunction with their review of fees at prior meetings, the Independent Board Members have considered the profitability of Nuveen for advisory activities (which incorporated Nuveen’s wholly-owned affiliated sub-advisers except that profitability information prior to April 30, 2007 did not include R&T as it was acquired at that time). R&T is a wholly-owned subsidiary of Nuveen Investments, Inc. At prior meetings, the Independent Board Members reviewed Nuveen’s revenues, expenses and profitability for advisory activities and the methodology to determine profitability. The Independent Board Members also have reviewed data comparing Nuveen’s profitability with other fund sponsors prepared by three independent third party service providers as well as comparisons of the revenues, expenses and profit margins of various unaffiliated management firms with similar amounts of assets under management prepared by Nuveen. In considering profitability, the Board recognized the inherent limitations in determining profitability as well as the difficulties in comparing the profitability of other unaffiliated advisers, as the profitability of other advisers generally is not publicly available and information that is available may not be representative of the industry and may be affected by, among other things, the adviser’s particular business mix, capital costs, types of funds managed and expense allocations. As noted above, the Board recognized that the proposed advisory fee paid by the Fund to NAM, which in turn pays R&T, is being reduced, although the estimated expenses borne by shareholders of the Fund are expected to increase. NAM, however, will receive advisory fees from the underlying funds to the extent NAM serves as investment adviser to the underlying funds. Similarly, affiliates of NAM may also receive sub-advisory fees to the extent they serve as sub-advisers to the underlying funds. However, the Independent Board Members noted that NAM estimates that the advisory fees paid to NAM by the Fund, together with the advisory fees paid to NAM attributable to the Fund’s investment in the Nuveen underlying funds, will be lower than the Fund’s current advisory fees based on the Fund’s anticipated initial asset allocations (although this may change
73
Annual Investment Management Agreement Approval Process (continued)
in the future as the Fund’s asset allocations are modified going forward). The Board also had previously received Nuveen’s 2006 Annual Report as well as its quarterly report ending September 30, 2007. Based on their review, the Independent Board Members were satisfied that Nuveen’s level of profitability for advisory activities was reasonable in light of the services provided.
In evaluating the reasonableness of the compensation, the Board also considered any other revenues paid to the Fund Advisers as well as any indirect benefits (such as soft dollar arrangements, if any) the Fund Advisers expect to receive that are directly attributable to their management of the Fund, if any. See Section E below for additional information.
D. Economies of Scale and Whether Fee Levels Reflect these Economies of Scale
Generally, management fees for funds in the Nuveen complex are comprised of a fund-level component and a complex-level component. The Independent Board Members have recognized that breakpoints are one way to share the benefits of economies of scale with investors. In August 2004 (as modified in 2007), to help ensure shareholders share in these benefits, the Board approved a complex-level fee arrangement pursuant to which the complex-level component is reduced as assets in the fund complex reach certain levels. With respect to the Fund, the advisory fee schedule does not contain fund-level breakpoints. In addition, the Fund will not be assessed a complex-level fee as this is assessed at the Nuveen underlying fund level. The Independent Board Members recognized, however, that the Fund will benefit from reductions in complex-level fees and fund-level fees indirectly as the complex and Nuveen underlying funds reach breakpoint levels and reduce the fees of the Nuveen underlying funds. Further, assets of the Fund invested in non-Nuveen underlying funds will be counted in determining the complex-level fee component of the Nuveen underlying funds. Based on its review, the Independent Board Members had concluded that the absence of a breakpoint schedule and complex-level fee arrangement was acceptable.
E. Indirect Benefits
In evaluating fees, the Board also considered any indirect benefits or profits the Fund Advisers or their affiliates may receive as a result of their relationship with the Fund. In this regard, the Board considered, among other things, that an affiliate of the Fund Advisers will provide distribution and shareholder services to the Fund and therefore will receive sales charges as well as distribution and shareholder servicing fees pursuant to a Rule 12b-1 plan with respect to certain classes of shares of the Fund.
In addition to the above, the Board considered whether the Fund Advisers will receive any benefits from soft dollar arrangements whereby a portion of the commissions paid by the Fund for brokerage may be used to acquire research that may be helpful to the Fund Advisers in managing the assets of the Fund and other clients. With respect to NAM, the Independent Board Members noted that NAM does not currently have any soft dollar arrangements; however, to the extent certain bona fide agency transactions that occur on markets that traditionally trade on a principal basis and riskless principal transactions are considered as generating “commissions,” NAM intends to comply with applicable safe harbor provisions. With respect to R&T, the Independent Board Members noted that R&T does not have any soft dollar arrangements.
F. Conclusion
The Board did not identify any single factor discussed previously as all-important or controlling. The Board, including a majority of the Independent Board Members, concluded that the terms of the Investment Management Agreement and R&T Sub-Advisory Agreement were fair and reasonable, that the respective Fund Adviser’s fees are reasonable in light of the services provided to the Fund, that the Investment Management Agreement be renewed and the respective R&T Sub-Advisory Agreement be approved and the Board recommended that shareholders approve the R&T Sub-Advisory Agreement of the Fund.
74
Notes
75
Trustees and Officers
The management of the Funds, including general supervision of the duties performed for the Funds by the Adviser, is the responsibility of the Board of Trustees of the Funds. The number of trustees of the Funds is currently set at nine. None of the trustees who are not “interested” persons of the Funds (referred to herein as “independent trustees”) has ever been a director or employee of, or consultant to, Nuveen or its affiliates. The names and business addresses of the trustees and officers of the Funds, their principal occupations and other affiliations during the past five years, the number of portfolios each oversees and other directorships they hold are set forth below.
The Funds’ Statement of Additional Information (“SAI”) includes more information about the trustees. To request a free copy, call Nuveen Investments at (800) 257-8787 or visit the Funds’ website at www.nuveen.com.
Name, Birthdate and Address | Position(s) Held with the Funds | Year First Elected or Appointed (1) | Principal Occupation(s) Including other Directorships During Past 5 Years | Number of Portfolios in Fund Complex Overseen by Trustee | ||||
| Independent Trustees: | ||||||||
Robert P. Bremner 8/22/40 333 W. Wacker Drive Chicago, IL 60606 | Chairman of the Board and Trustee | 1997 | Private Investor and Management Consultant. | 186 | ||||
Jack B. Evans 10/22/48 333 W. Wacker Drive Chicago, IL 60606 | Trustee | 1999 | President, The Hall-Perrine Foundation, a private philanthropic corporation (since 1996); Director and Vice Chairman, United Fire Group, a publicly held company; Member of the Board of Regents for the State of Iowa University System; Director, Gazette Companies; Life Trustee of Coe College and Iowa College Foundation; Member of the Advisory Council of the Department of Finance in the Tippie College of Business, University of lowa; formerly, Director, Alliant Energy; formerly, Director, Federal Reserve Bank of Chicago; formerly, President and Chief Operating Officer, SCI Financial Group, Inc., a regional financial services firm. | 186 | ||||
William C. Hunter 3/6/48 333 W. Wacker Drive Chicago, IL 60606 | Trustee | 2004 | Dean, Tippie College of Business, University of Iowa (since July 2006); formerly, Dean and Distinguished Professor of Finance, School of Business at the University of Connecticut (2003-2006); previously, Senior Vice President and Director of Research at the Federal Reserve Bank of Chicago (1995-2003); Director (since 1997), Credit Research Center at George Washington University; Director (since 2004) of Xerox Corporation; Director (since 2005), Beta Gamma Sigma International Honor Society; Director, SS&C Technologies, Inc. (May 2005-October 2005). | 186 | ||||
David J. Kundert 10/28/42 333 W. Wacker Drive Chicago, IL 60606 | Trustee | 2005 | Director, Northwestern Mutual Wealth Management Company; Retired (since 2004) as Chairman, JPMorgan Fleming Asset Management, President and CEO, Banc One Investment Advisors Corporation, and President, One Group Mutual Funds; prior thereto, Executive Vice President, Banc One Corporation and Chairman and CEO, Banc One Investment Management Group; Member, Board of Regents, Luther College; member of the Wisconsin Bar Association; member of Board of Directors, Friends of Boerner Botanical Gardens; member of Investment Committee, Greater Milwaukee Foundation. | 186 | ||||
William J. Schneider 9/24/44 333 W. Wacker Drive Chicago, IL 60606 | Trustee | 1997 | Chairman, formerly, Senior Partner and Chief Operating Officer (retired, 2004) of Miller-Valentine Partners Ltd., a real estate investment company; Director, Dayton Development Coalition; formerly, Member, Business Advisory Council, Cleveland Federal Reserve Bank. | 186 | ||||
Judith M. Stockdale 12/29/47 333 W. Wacker Drive Chicago, IL 60606 | Trustee | 1997 | Executive Director, Gaylord and Dorothy Donnelley Foundation (since 1994); prior thereto, Executive Director, Great Lakes Protection Fund (from 1990 to 1994). | 186 | ||||
76
Name, Birthdate and Address | Position(s) Held with the Funds | Year First Elected or Appointed (1) | Principal Occupation(s) Including other Directorships During Past 5 Years | Number of Portfolios in Fund Complex Overseen by Trustee | ||||
Carole E. Stone 6/28/47 333 W. Wacker Drive Chicago, IL 60606 | Trustee | 2007 | Director, Chicago Board Options Exchange (since 2006); Commissioner, New York State Commission on Public Authority Reform (since 2005); formerly, Director, New York State Division of the Budget (2000-2004), Chair, Public Authorities Control Board (2000-2004) and Director, Local Government Assistance Corporation (2000-2004); formerly, Chair, New York Racing Association Oversight Board (2005-12/2007). | 186 | ||||
Terence J. Toth (2) 9/29/59 333 W. Wacker Drive Chicago, IL 60606 | Trustee | 2008 | Private Investor (since 2007); CEO and President, Northern Trust Investments (2004-2007); Executive Vice President, Quantitative Management & Securities Lending (2000-2004); prior thereto, various positions with Northern Trust Company (since 1994); Member: Goodman Theatre Board (since 2004); Chicago Fellowship Board (since 2005), University of Illinois Leadership Council Board (since 2007) and Catalyst Schools of Chicago Board (since 2008); formerly Member: Northern Trust Mutual Funds Board (2005-2007), Northern Trust Japan Board (2004-2007), Northern Trust Securities Inc. Board (2003-2007) and Northern Trust Hong Kong Board (1997-2004). | 186 | ||||
| Interested Trustee: | ||||||||
John P. Amboian (2)(3) 6/14/61 333 W. Wacker Drive Chicago, IL 60606 | Trustee | 2008 | Chief Executive Officer (since July 2007) and Director (since 1999) of Nuveen Investments, Inc.; Chief Executive Officer (since 2007) of Nuveen Asset Management, Rittenhouse Asset Management, Nuveen Investments Advisors, Inc. formerly, President (1999-2004) of Nuveen Advisory Corp. and Nuveen Institutional Advisory Corp. | 186 | ||||
Name, Birthdate and Address | Position(s) Held with the Funds | Year First Elected or Appointed (4) | Principal Occupation(s) During Past 5 Years | Number of Portfolios in Fund Complex Overseen by Officer | ||||
| Officers of the Funds: | ||||||||
Gifford R. Zimmerman 9/9/56 333 W. Wacker Drive Chicago, IL 60606 | Chief Administrative Officer | 1988 | Managing Director (since 2002), Assistant Secretary and Associate General Counsel, formerly, Vice President and Assistant General Counsel, of Nuveen Investments, LLC; Managing Director (since 2002), Associate General Counsel and Assistant Secretary, of Nuveen Asset Management; Vice President and Assistant Secretary of NWQ Investment Management Company, LLC. (since 2002), Nuveen Investments Advisers Inc. (since 2002), Symphony Asset Management LLC, and NWQ Investment Management Company, LLC (since 2003), Tradewinds Global Investors, LLC, and Santa Barbara Asset Management, LLC (since 2006), Nuveen HydePark Group LLC and Richards & Tierney, Inc. (since 2007); Managing Director, Associate General Counsel and Assistant Secretary of Rittenhouse Asset Management, Inc. (since 2003); Managing Director (since 2004) and Assistant Secretary (since 1994) of Nuveen Investments, Inc.; formerly, Managing Director (2002-2004), General Counsel (1998-2004) and Assistant Secretary of Nuveen Advisory Corp. and Nuveen Institutional Advisory Corp. (5); Chartered Financial Analyst. | 186 | ||||
Michael T. Atkinson 2/3/66 333 W. Wacker Drive Chicago, IL 60606 | Vice President and Assistant Secretary | 2000 | Vice President (since 2002) of Nuveen Investments, LLC. | 186 | ||||
Alan A. Brown 8/1/62 333 W. Wacker Drive Chicago, IL 60606 | Vice President | 2007 | Executive Vice President, Mutual Funds, Nuveen Investments, LLC, (since 2005), previously, Managing Director and Chief Marketing Officer (2001-2005). | 66 | ||||
77
Trustees and Officers (continued)
Name, Birthdate and Address | Position(s) Held with the Funds | Year First Elected or Appointed (4) | Principal Occupation(s) Including other Directorships During Past 5 Years | Number of Portfolios in Fund Complex Overseen by Officer | ||||
Lorna C. Ferguson 10/24/45 333 W. Wacker Drive Chicago, IL 60606 | Vice President | 1998 | Managing Director (since 2004), formerly, Vice President of Nuveen Investments, LLC, Managing Director (2004) formerly, Vice President (1998-2004) of Nuveen Advisory Corp. and Nuveen Institutional Advisory Corp. (5); Managing Director (since 2005) of Nuveen Asset Management. | 186 | ||||
Stephen D. Foy 5/31/54 333 W. Wacker Drive Chicago, IL 60606 | Vice President and Controller | 1998 | Vice President (since 1993) and Funds Controller (since 1998) of Nuveen Investments, LLC; Vice President (since 2005) of Nuveen Asset Management; formerly, Vice President and Funds Controller (1998-2004) of Nuveen Investments, Inc.; Certified Public Accountant. | 186 | ||||
Walter M. Kelly 2/24/70 333 W. Wacker Drive Chicago, IL 60606 | Chief Compliance Officer and Vice President | 2003 | Senior Vice President (since 2008), Vice President (2006- 2008) formerly, Assistant Vice President and Assistant General Counsel (2003-2006) of Nuveen Investments, LLC; Vice President (since 2006) and Assistant Secretary (since 2003) of Nuveen Asset Management. | 186 | ||||
David J. Lamb 3/22/63 333 W. Wacker Drive Chicago, IL 60606 | Vice President | 2000 | Vice President (since 2000) of Nuveen Investments, LLC; Certified Public Accountant. | 186 | ||||
Tina M. Lazar 8/27/61 333 W. Wacker Drive Chicago, IL 60606 | Vice President | 2002 | Vice President of Nuveen Investments, LLC (since 1999). | 186 | ||||
Larry W. Martin 7/27/51 333 W. Wacker Drive Chicago, IL 60606 | Vice President and Assistant Secretary | 1988 | Vice President, Assistant Secretary and Assistant General Counsel of Nuveen Investments, LLC; formerly, Vice President and Assistant Secretary of Nuveen Advisory Corp. and Nuveen Institutional Advisory Corp. (4); Vice President (since 2005) and Assistant Secretary of Nuveen Investments, Inc.; Vice President (since 2005) and Assistant Secretary (since 1997) of Nuveen Asset Management; Vice President (since 2000), Assistant Secretary and Assistant General Counsel (since 1998) of Rittenhouse Asset Management, Inc.; Vice President and Assistant Secretary of Nuveen Investments Advisers Inc. (since 2002), NWQ Investment Management Company, LLC (since 2002), Symphony Asset Management LLC (since 2003), Tradewinds NWQ Global Investors, LLC, Santa Barbara Asset Management, LLC (since 2006) and of Nuveen HydePark Group, LLC and Richards & Tierney, Inc. (since 2007); formerly, Vice President and Assistant Secretary of Nuveen Advisory Corp. and Nuveen Institutional Advisory Corp. (5) | 186 | ||||
Kevin J. McCarthy 3/26/66 333 W. Wacker Drive Chicago, IL 60606 | Vice President and Secretary | 2007 | Managing Director (since 2008), formerly, Vice President (2007-2008), Nuveen Investments, LLC; Managing Director (since 2008) Vice President and Assistant Secretary (since 2007), Nuveen Asset Management, Rittenhouse Asset Management, Inc., Nuveen Investment Advisers Inc., Nuveen Investment Institutional Services Group LLC, NWQ Investment Management Company, LLC, Tradewinds Global Investors LLC, NWQ Holdings, LLC, Symphony Asset Management LLC, Santa Barbara Asset Management LLC, Nuveen HydePark Group, LLC and Richards & Tierney, Inc, (since 2007); Managing Director (since 2008), Vice President (2007-2008) and Assistant General Counsel, Nuveen Investments, Inc., prior thereto, Partner, Bell, Boyd & Lloyd LLP (1997-2007). | 186 | ||||
78
Name, Birthdate and Address | Position(s) Held with the Funds | Year First Elected or Appointed (4) | Principal Occupation(s) Including other Directorships During Past 5 Years | Number of Portfolios in Fund Complex Overseen by Officer | ||||
John V. Miller 4/10/67 333 W. Wacker Drive Chicago, IL 60606 | Vice President | 2007 | Managing Director (since 2007), formerly, Vice President (2002-2007) of Nuveen Investments, LLC; Chartered Financial Analyst. | 186 | ||||
Christopher M. Rohrbacher 8/1/71 333 W. Wacker Drive Chicago, IL 60606 | Vice President and Assistant Secretary | 2008 | Vice President, Nuveen Investments, LLC (since 2008); Vice President and Assistant Secretary, Nuveen Asset Management (since 2008); Vice President and Assistant General Counsel, Nuveen Investments, Inc. (since 2008); prior thereto, Associate, Skadden, Arps, Slate Meagher & Flom LLP (2002-2008) | 186 | ||||
James F. Ruane 7/3/62 333 W. Wacker Drive Chicago, IL 60606 | Vice President and Assistant Secretary | 2007 | Vice President, Nuveen Investments (since 2007); prior thereto, Partner, Deloitte & Touche USA LLP (since 2005), formerly, senior tax manager (since 2002); Certified Public Accountant. | 186 | ||||
John S. White 5/12/67 333 W. Wacker Drive Chicago, IL 60606 | Vice President | 2007 | Vice President (since 2006) of Nuveen Investments, LLC, formerly, Assistant Vice President (since 2002); Lieutenant Colonel (since 2007), United States Marine Corps Reserve, formerly, Major (since 2001). | 66 | ||||
Mark L. Winget 12/21/68 333 W. Wacker Drive Chicago, IL 60606 | Vice President and Assistant Secretary | 2008 | Vice President, Nuveen Investments, LLC (since 2008); Vice President and Assistant Secretary, Nuveen Asset Management (since 2008); Vice President and Assistant General Counsel, Nuveen Investments Inc. (since 2008); prior thereto, Counsel, VedderPrice P.C. (1997-2007). | 186 | ||||
| (1) | Trustees serve an indefinite term until his/her successor is elected or appointed. The year first elected or appointed represents the year in which the trustee was first elected or appointed to any fund in the Nuveen Fund Complex. |
| (2) | Mr. Amboian and Mr. Toth were appointed to the Board of Trustees of certain Nuveen Funds, effective July 1, 2008. Mr. Amboian and Mr. Toth were subsequently elected to the Board of Trustees of the remainder of the funds in the Nuveen Fund Complex on July 28, 2008. In connection with the appointment of Mr. Amboian as trustee, Timothy R. Schwertfeger, an interested trustee, resigned from the Board of Trustees, effective July 1, 2008. |
| (3) | Mr. Amboian is an interested trustee because of his position with Nuveen Investments, Inc. and certain of its subsidiaries, which are affiliates of the Nuveen Funds. |
| (4) | Officers serve one year terms through July of each year. The year first elected or appointed represents the year in which the officer was first elected or appointed to any fund in the Nuveen Fund Complex. |
| (5) | Nuveen Advisory Corp. and Nuveen Institutional Advisory Corp. were reorganized into Nuveen Asset Management, effective January 1, 2005. |
79
Glossary of Terms Used in this Report
Average Annual Total Return: This is a commonly used method to express an investment’s performance over a particular, usually multi-year time period. It expresses the return that would have been necessary each year to equal the investment’s actual cumulative performance (including change in NAV or offer price and reinvested dividends and capital gains distributions, if any) over the time period being considered.
Collateralized Debt Obligations (CDOs): Collateralized debt obligations are a type of asset-backed security constructed from a portfolio of fixed-income assets. CDOs usually are divided into different tranches having different ratings and paying different interest rages. Losses, if any, are applied in reverse order of seniority and so junior tranches generally offer higher coupons to compensate for added default risk.
Net Asset Value (NAV): A Fund’s NAV is the dollar value of one share in the Fund. It is calculated by subtracting the liabilities of the Fund from its total assets and then dividing the remainder by the number of shares outstanding. Fund NAVs are calculated at the end of each business day.
80
Fund Information
Fund Manager Nuveen Asset Management 333 West Wacker Drive Chicago, IL 60606
Sub-Advisers NWQ Investment Management Company, LLC 2049 Century Park East Los Angeles, CA 90067
Tradewinds Global Investors, LLC 2049 Century Park East Los Angeles, CA 90067 | Legal Counsel Chapman and Cutler LLP Chicago, IL
Independent Registered Public Accounting Firm PricewaterhouseCoopers LLP Chicago, IL
Custodian State Street Bank & Trust Company Boston, MA
| Transfer Agent and Shareholder Services Boston Financial Data Services
Nuveen Investor Services P.O. Box 8530 Boston, MA 02266-8530 (800) 257-8787 | ||
Distribution Information: Multi-Cap Value, Large-Cap Value, Small/Mid-Cap Value, Small-Cap Value, Global Value and Value Opportunities hereby designate 100.00%, 100.00%, 95.76%, 30.93%, 36.64% and 54.04%, respectively, of dividends paid from net ordinary income as dividends qualifying for the 70% dividends received deduction for corporations and 100.00%, 100.00%, 85.61%, 27.23%, 15.45% and 23.53%, respectively, as qualified dividend income for individuals under Section 1 (h)(11) of the Internal Revenue Code. The actual qualified dividend income distributions will be reported to shareholders on Form 1099-DIV which will be sent to shareholders shortly after calendar year end.
Quarterly Portfolio of Investments and Proxy Voting Information: You may obtain (i) each Fund’s quarterly portfolio of investments, (ii) information regarding how the Funds voted proxies relating to portfolio securities held during the most recent twelve-month period ended June 30, 2008, and (iii) a description of the policies and procedures that the Funds used to determine how to vote proxies relating to portfolio securities without charge, upon request, by calling Nuveen Investments at (800) 257-8787 or on Nuveen’s website at www.nuveen.com.
You may also obtain this and other Fund information directly from the Securities and Exchange Commission (“SEC”). The SEC may charge a copying fee for this information. Visit the SEC on-line at http://www.sec.gov or in person at the SEC’s Public Reference Room in Washington, D.C. Call the SEC at (202) 942-8090 for room hours and operation. You may also request fund information by sending an e-mail request to publicinfo@sec.gov or by writing to the SEC’s Public Reference Section at 100 F Street NE, Washington, D.C. 20549.
The Financial Industry Regulatory Authority (FINRA) provides a Public Disclosure Program which supplies certain information regarding the disciplinary history of FINRA members and their associated persons in response to either telephone inquiries at (800) 289-9999 or written inquiries at www.finra.org. Financial Industry Regulatory Authority also provides an investor brochure that includes information describing the Public Disclosure Program.
81
Learn more
about Nuveen Funds at
www.nuveen.com/mf
Nuveen Investments:
SERVING Investors
For GENERATIONS
Since 1898, financial advisors and their clients have relied on Nuveen Investments to provide dependable investment solutions. Over this time, Nuveen Investments has adhered to the belief that the best approach to investing is to apply conservative risk-management principles to help minimize volatility.
Building on this tradition, we today offer a range of high quality equity and fixed-income solutions that can be integral parts of a well-diversified core portfolio. Our clients have come to appreciate this diversity, as well as our continued adherence to proven, long-term investing principles.
We offer many different investing solutions for our clients’ different needs.
Nuveen Investments is a global investment management firm that seeks to help secure the long-term goals of institutions and high net worth investors as well as the consultants and financial advisors who serve them. Nuveen Investments markets its growing range of specialized investment solutions under the high-quality brands of HydePark, NWQ, Nuveen, Rittenhouse, Santa Barbara, Symphony and Tradewinds. In total, the Company managed $152 billion of assets on June 30, 2008.
Find out how we can help you reach your financial goals.
An investor should carefully consider the Fund’s objectives, risks, charges and expenses before investing. For a prospectus containing this and other information about the Fund, please contact your financial advisor or Nuveen Investments at (800) 257-8787. Read the prospectus carefully before you invest or send money.
| • | Share prices |
| • | Fund details |
| • | Daily financial news |
| • | Investor education |
MAN-NWQ-0608D
ITEM 2. CODE OF ETHICS.
As of the end of the period covered by this report, the registrant has adopted a code of ethics that applies to the registrant’s principal executive officer, principal financial officer, principal accounting officer or controller, or persons performing similar functions. There were no amendments to or waivers from the code during the period covered by this report. The registrant has posted the code of ethics on its website at www.nuveen.com/mf. (To view the code, click on the Shareholder Resources drop down menu box, click on Fund Governance and then click on Code of Conduct.)
ITEM 3. AUDIT COMMITTEE FINANCIAL EXPERT.
The registrant’s Board of Trustees determined that the registrant has at least one “audit committee financial expert” (as defined in Item 3 of Form N-CSR) serving on its Audit Committee. The registrant’s audit committee financial expert is Jack B. Evans, Chairman of the Audit Committee, who is “independent” for purposes of Item 3 of Form N-CSR.
Mr. Evans was formerly President and Chief Operating Office of SCI Financial Group, Inc., a full service registered broker-dealer and registered investment adviser (“SCI”). As part of his role as President and Chief Operating Officer, Mr. Evans actively supervised the Chief Financial Officer (the “CFO”) and actively supervised the CFO’s preparation of financial statements and other filings with various regulatory authorities. In such capacity, Mr. Evans was actively involved in the preparation of SCI’s financial statements and the resolution of issues raised in connection therewith. Mr. Evans has also served on the audit committee of various reporting companies. At such companies, Mr. Evans was involved in the oversight of audits, audit plans, and the preparation of financial statements. Mr. Evans also formerly chaired the audit committee of the Federal Reserve Bank of Chicago.
ITEM 4. PRINCIPAL ACCOUNTANT FEES AND SERVICES.
The following tables show the amount of fees that PricewaterhouseCoopers LLP, the Trust’s auditor, billed to the Trust during the Trust’s last two full fiscal years. The Audit Committee approved in advance all audit services and non-audit services that PricewaterhouseCoopers LLP provided to the Trust, except for those non-audit services that were subject to the pre-approval exception under Rule 2-01 of Regulation S-X (the “pre-approval exception”). The pre-approval exception for services provided directly to the Trust waives the pre-approval requirement for services other than audit, review or attest services if: (A) the aggregate amount of all such services provided constitutes no more than 5% of the total amount of revenues paid by the Trust during the fiscal year in which the services are provided; (B) the Trust did not recognize the services as non-audit services at the time of the engagement; and (C) the services are promptly brought to the Audit Committee’s attention, and the Committee (or its delegate) approves the services before the audit is completed.
The Audit Committee has delegated certain pre-approval responsibilities to its Chairman (or, in his absence, any other member of the Audit Committee).
SERVICES THAT THE TRUST’S AUDITOR BILLED TO THE TRUST
Fiscal Year Ended June 30, 2008 | Audit Fees Billed to Funds 1 | Audit-Related Fees Billed to Funds 2 | Tax Fees Billed to Funds 3 | All Other Fees Billed to Funds 4 | ||||||||
Name of Series | ||||||||||||
Balanced Stock and Bond Fund | 8,322 | 0 | 2,800 | 0 | ||||||||
Balanced Municipal and Stock Fund | 9,067 | 0 | 2,800 | 0 | ||||||||
Enhanced Core Equity Fund 5 | 7,287 | 0 | 0 | 0 | ||||||||
Enhanced Mid-Cap Fund 5 | 5,911 | 0 | 0 | 0 | ||||||||
Multi-Manager Large Cap Value Fund | 28,346 | 0 | 2,800 | 0 | ||||||||
NWQ Global Value Fund | 6,619 | 0 | 2,800 | 0 | ||||||||
NWQ Multi-Cap Value Fund | 53,591 | 0 | 2,800 | 0 | ||||||||
NWQ Small-Cap Value Fund | 13,569 | 0 | 2,800 | 0 | ||||||||
Tradewinds Value Opportunities Fund | 32,019 | 0 | 2,800 | 0 | ||||||||
NWQ Large-Cap Value Fund | 6,639 | 0 | 2,800 | 0 | ||||||||
NWQ Small-/Mid-Cap Value Fund | 6,770 | 0 | 2,800 | 0 | ||||||||
Total | $ | 178,140 | $ | 0 | $ | 25,200 | $ | 0 | ||||
1 | “Audit Fees” are the aggregate fees billed for professional services for the audit of the Fund’s annual financial statements and services provided in connection with statutory and regulatory filings or engagements. |
2 | “Audit Related Fees” are the aggregate fees billed for assurance and related services reasonably related to the performance of the audit or review of financial statements and are not reported under “Audit Fees”. |
3 | “Tax Fees” are the aggregate fees billed for professional services for tax advice, tax compliance, and tax planning. |
4 | “All Other Fees” are the aggregate fees billed for products and services other than “Audit Fees”, “Audit Related Fees”, and “Tax Fees”. |
5 | The funds commenced operations December 03, 2007. |
| Percentage Approved Pursuant to Pre-approval Exception | ||||||||
| Audit Fees Billed to Funds | Audit-Related Fees Billed to Funds | Tax Fees Billed to Funds | All Other Fees Billed to Funds | |||||
Name of Series | ||||||||
Balanced Stock and Bond Fund | 0 | 0 | 0 | 0 | ||||
Balanced Municipal and Stock Fund | 0 | 0 | 0 | 0 | ||||
Enhanced Core Equity Fund 1 | 0 | 0 | 0 | 0 | ||||
Enhanced Mid-Cap Fund 1 | 0 | 0 | 0 | 0 | ||||
Multi-Manager Large Cap Value Fund | 0 | 0 | 0 | 0 | ||||
NWQ Global Value Fund | 0 | 0 | 0 | 0 | ||||
NWQ Multi-Cap Value Fund | 0 | 0 | 0 | 0 | ||||
NWQ Small-Cap Value Fund | 0 | 0 | 0 | 0 | ||||
Tradewinds Value Opportunities Fund | 0 | 0 | 0 | 0 | ||||
NWQ Large-Cap Value Fund | 0 | 0 | 0 | 0 | ||||
NWQ Small-/Mid-Cap Value Fund | 0 | 0 | 0 | 0 | ||||
1 | The funds commenced operations December 03, 2007. |
Fiscal Year Ended June 30, 2007 | Audit Fees Billed to Funds 1 | Audit-Related Fees Billed to Funds 2 | Tax Fees Billed to Funds 3 | All Other Fees Billed to Funds 4 | ||||||||
Name of Series | ||||||||||||
Balanced Stock and Bond Fund | 7,506 | 0 | 262 | 0 | ||||||||
Balanced Municipal and Stock Fund | 8,210 | 0 | 348 | 0 | ||||||||
Enhanced Core Equity Fund 5 | N/A | N/A | N/A | N/A | ||||||||
Enhanced Mid-Cap Fund 5 | N/A | N/A | N/A | N/A | ||||||||
Multi-Manager Large Cap Value Fund | 24,408 | 0 | 2,475 | 0 | ||||||||
NWQ Global Value Fund | 6,230 | 0 | 70 | 0 | ||||||||
NWQ Multi-Cap Value Fund | 53,292 | 0 | 5,447 | 0 | ||||||||
NWQ Small-Cap Value Fund | 12,222 | 0 | 423 | 0 | ||||||||
Tradewinds Value Opportunities Fund | 18,475 | 0 | 1,051 | 0 | ||||||||
NWQ Large-Cap Value Fund | 5,629 | 0 | 0 | 0 | ||||||||
NWQ Small-/Mid-Cap Value Fund | 5,664 | 0 | 0 | 0 | ||||||||
Total | $ | 141,636 | $ | 0 | $ | 10,076 | $ | 0 | ||||
1 | “Audit Fees” are the aggregate fees billed for professional services for the audit of the Fund’s annual financial statements and services provided in connection with statutory and regulatory filings or engagements. |
2 | “Audit Related Fees” are the aggregate fees billed for assurance and related services reasonably related to the performance of the audit or review of financial statements and are not reported under “Audit Fees”. |
3 | “Tax Fees” are the aggregate fees billed for professional services for tax advice, tax compliance, and tax planning. |
4 | “All Other Fees” are the aggregate fees billed for products and services other than “Audit Fees”, “Audit Related Fees”, and “Tax Fees”. |
5 | The funds commenced operations December 03, 2007. |
| Percentage Approved Pursuant to Pre-approval Exception | ||||||||
| Audit Fees Billed to Funds | Audit-Related Fees Billed to Funds | Tax Fees Billed to Funds | All Other Fees Billed to Funds | |||||
Name of Series | ||||||||
Balanced Stock and Bond Fund | 0 | 0 | 0 | 0 | ||||
Balanced Municipal and Stock Fund | 0 | 0 | 0 | 0 | ||||
Enhanced Core Equity Fund 1 | N/A | N/A | N/A | N/A | ||||
Enhanced Mid-Cap Fund 1 | N/A | N/A | N/A | N/A | ||||
Multi-Manager Large Cap Value Fund | 0 | 0 | 0 | 0 | ||||
NWQ Global Value Fund | 0 | 0 | 0 | 0 | ||||
NWQ Multi-Cap Value Fund | 0 | 0 | 0 | 0 | ||||
NWQ Small-Cap Value Fund | 0 | 0 | 0 | 0 | ||||
Tradewinds Value Opportunities Fund | 0 | 0 | 0 | 0 | ||||
NWQ Large-Cap Value Fund | 0 | 0 | 0 | 0 | ||||
NWQ Small-/Mid-Cap Value Fund | 0 | 0 | 0 | 0 | ||||
1 | The funds commenced operations December 03, 2007. |
SERVICES THAT THE TRUST’S AUDITOR BILLED TO THE
ADVISER AND AFFILIATED FUND SERVICE PROVIDERS
The following tables show the amount of fees billed by PricewaterhouseCoopers LLP to Nuveen Asset Management (“NAM” or the “Adviser”), and any entity controlling, controlled by or under common control with NAM that provides ongoing services to the Trust (“Affiliated Fund Service Provider”), for engagements directly related to the Trust’s operations and financial reporting, during the Trust’s last two full fiscal years.
Fiscal Year Ended June 30, 2008 | Audit-Related Fees Billed to Adviser and Affiliated Fund Service Providers | Tax Fees Billed to Adviser and Affiliated Fund Service Providers | All Other Fees Billed to Adviser and Affiliated Fund Service Providers | |||||||||
Nuveen Investment Trust | $ | 0 | $ | 0 | $ | 0 | ||||||
| Percentage Approved Pursuant to Pre-approval Exception | ||||||||||||
| Audit-Related Fees Billed to Adviser and Affiliated Fund Service Providers | Tax Fees Billed to Adviser and Affiliated Fund Service Providers | All Other Fees Billed to Adviser and Affiliated Fund Service Providers | ||||||||||
| 0 | % | 0 | % | 0 | % | |||||||
Fiscal Year Ended June 30, 2007 | Audit-Related Fees Billed to Adviser and Affiliated Fund Service Providers | Tax Fees Billed to Adviser and Affiliated Fund Service Providers | All Other Fees Billed to Adviser and Affiliated Fund Service Providers | |||||||||
Nuveen Investment Trust | $ | 0 | $ | 0 | $ | 0 | ||||||
| Percentage Approved Pursuant to Pre-approval Exception | ||||||||||||
| Audit-Related Fees Billed to Adviser and Affiliated Fund Service Providers | Tax Fees Billed to Adviser and Affiliated Fund Service Providers | All Other Fees Billed to Adviser and Affiliated Fund Service Providers | ||||||||||
| 0 | % | 0 | % | 0 | % | |||||||
The tables also show the percentage of fees subject to the pre-approval exception. The pre-approval exception for services provided to the Adviser and any Affiliated Fund Service Provider (other than audit, review or attest services) waives the pre-approval requirement if: (A) the aggregate amount of all such services provided constitutes no more than 5% of the total amount of revenues paid to PricewaterhouseCoopers LLP by the Trust, the Adviser and Affiliated Fund Service Providers during the fiscal year in which the services are provided that would have to be pre-approved by the Audit Committee; (B) the Trust did not recognize the services as non-audit services at the time of the engagement; and (C) the services are promptly brought to the Audit Committee’s attention, and the Committee (or its delegate) approves the services before the Trust’s audit is completed.
NON-AUDIT SERVICES
Fiscal Year Ended June 30, 2008 | Total Non-Audit Fees Billed to Trust | Total Non-Audit Fees billed to Adviser and Affiliated Fund Service Providers (engagements related directly to the operations and financial reporting of the Trust) | Total Non-Audit Fees billed to Adviser and Affiliated Fund Service Providers (all other engagements) | Total | ||||||||
Name of Series | ||||||||||||
Balanced Stock and Bond Fund | 2,800 | 0 | 0 | 2,800 | ||||||||
Balanced Municipal and Stock Fund | 2,800 | 0 | 0 | 2,800 | ||||||||
Enhanced Core Equity Fund 1 | 0 | 0 | 0 | 0 | ||||||||
Enhanced Mid-Cap Fund 1 | 0 | 0 | 0 | 0 | ||||||||
Multi-Manager Large Cap Value Fund | 2,800 | 0 | 0 | 2,800 | ||||||||
NWQ Global Value Fund 2 | 5,515 | 0 | 0 | 5,515 | ||||||||
NWQ Multi-Cap Value Fund | 2,800 | 0 | 0 | 2,800 | ||||||||
NWQ Small-Cap Value Fund | 2,800 | 0 | 0 | 2,800 | ||||||||
Tradewinds Value Opportuities Fund 2 | 5,515 | 0 | 0 | 5,515 | ||||||||
NWQ Large-Cap Value Fund | 2,800 | 0 | 0 | 2,800 | ||||||||
NWQ Small-/Mid-Cap Value Fund | 2,800 | 0 | 0 | 2,800 | ||||||||
Total | $ | 13,915 | $ | 0 | $ | 0 | $ | 13,915 | ||||
“Non-Audit Fees billed to Adviser” for both fiscal year ends represent “Tax Fees” billed to Adviser in their respective amounts from the previous table.
1 | The funds commenced operations December 03, 2007. |
2 | The “Total Non-Audit Fees billed to Fund” were tax fees paid by the fund to Ernst & Young, LLP |
Fiscal Year Ended June 30, 2007 | Total Non-Audit Fees Billed to Trust | Total Non-Audit Fees billed to Adviser and Affiliated Fund Service Providers (engagements related directly to the operations and financial reporting of the Trust) | Total Non-Audit Fees billed to Adviser and Affiliated Fund Service Providers (all other engagements) | Total | ||||||||
Name of Series | ||||||||||||
Balanced Stock and Bond Fund | 262 | 0 | 0 | 262 | ||||||||
Balanced Municipal and Stock Fund | 348 | 0 | 0 | 348 | ||||||||
Enhanced Core Equity Fund 1 | N/A | N/A | N/A | N/A | ||||||||
Enhanced Mid-Cap Fund 1 | N/A | N/A | N/A | N/A | ||||||||
Multi-Manager Large Cap Value Fund | 2,475 | 0 | 0 | 2,475 | ||||||||
NWQ Global Value Fund | 70 | 0 | 0 | 70 | ||||||||
NWQ Multi-Cap Value Fund | 5,447 | 0 | 0 | 5,447 | ||||||||
NWQ Small-Cap Value Fund | 423 | 0 | 0 | 423 | ||||||||
Tradewinds Value Opportunities Fund | 1,051 | 0 | 0 | 1,051 | ||||||||
NWQ Large-Cap Value Fund | 0 | 0 | 0 | 0 | ||||||||
NWQ Small-/Mid-Cap Value Fund | 0 | 0 | 0 | 0 | ||||||||
Total | $ | 3,154 | $ | 0 | $ | 0 | $ | 3,154 | ||||
“Non-Audit Fees billed to Adviser” for both fiscal year ends represent “Tax Fees” billed to Adviser in their respective amounts from the previous table.
1 | The funds commenced operations December 03, 2007. |
Audit Committee Pre-Approval Policies and Procedures. Generally, the Audit Committee must approve (i) all non-audit services to be performed for the Trust by the Trust’s independent accountants and (ii) all audit and non-audit services to be performed by the Trust’s independent accountants for the Affiliated Fund Service Providers with respect to the operations and financial reporting of the Trust. Regarding tax and research projects conducted by the independent accountants for the Trust and Affiliated Fund Service Providers (with respect to operations and financial reports of the Trust), such engagements will be (i) pre-approved by the Audit Committee if they are expected to be for amounts greater than $10,000; (ii) reported to the Audit Committee Chairman for his verbal approval prior to engagement if they are expected to be for amounts under $10,000 but greater than $5,000; and (iii) reported to the Audit Committee at the next Audit Committee meeting if they are expected to be for an amount under $5,000.
ITEM 5. AUDIT COMMITTEE OF LISTED REGISTRANTS
Not applicable to this registrant.
ITEM 6. SCHEDULE OF INVESTMENTS
See Portfolio of Investments in Item 1
ITEM 7. DISCLOSURE OF PROXY VOTING POLICIES AND PROCEDURES FOR CLOSED-END
MANAGEMENT INVESTMENT COMPANIES
Not applicable to this registrant.
ITEM 8. PORTFOLIO MANAGERS OF CLOSED-END MANAGEMENT INVESTMENT COMPANIES
Not applicable to this registrant.
ITEM 9. PURCHASES OF EQUITY SECURITIES BY CLOSED-END MANAGEMENT INVESTMENT COMPANY AND AFFILIATED PURCHASERS
Not applicable to this registrant.
ITEM 10. SUBMISSION OF MATTERS TO A VOTE OF SECURITY HOLDERS
There have been no material changes to the procedures by which shareholders may recommend nominees to the registrant’s Board of Trustees implemented after the registrant last provided disclosure in response to this Item.
ITEM 11. CONTROLS AND PROCEDURES.
(a) | The registrant’s principal executive and principal financial officers, or persons performing similar functions, have concluded that the registrant’s disclosure controls and procedures (as defined in Rule 30a-3(c) under the Investment Company Act of 1940, as amended (the “1940 Act”) (17 CFR 270.30a-3(c))) are effective, as of a date within 90 days of the filing date of this report that includes the disclosure required by this paragraph, based on their evaluation of the controls and procedures required by Rule 30a-3(b) under the 1940 Act (17 CFR 270.30a-3(b)) and Rules 13a-15(b) or 15d-15(b) under the Securities Exchange Act of 1934, as amended (the “Exchange Act”) (17 CFR 240.13a-15(b) or 240.15d-15(b)). |
(b) | There were no changes in the registrant’s internal control over financial reporting (as defined in Rule 30a-3(d) under the 1940 Act (17 CFR 270.30a-3(d)) that occurred during the second fiscal quarter of the period covered by this report that has materially affected, or is reasonably likely to materially affect, the registrant’s internal control over financial reporting. |
ITEM 12. EXHIBITS
File the exhibits listed below as part of this Form.
| (a)(1) | Any code of ethics, or amendment thereto, that is the subject of the disclosure required by Item 2, to the extent that the registrant intends to satisfy the Item 2 requirements through filing of an exhibit: Not applicable because the code is posted on registrant’s website at www.nuveen.com/mf and there were no amendments during the period covered by this report. (To view the code, click on the Shareholder Resources drop down menu box, click on Fund Governance and then Code of Conduct.) | |
| (a)(2) | A separate certification for each principal executive officer and principal financial officer of the registrant as required by Rule 30a-2(a) under the 1940 Act (17 CFR 270.30a-2(a)) in the exact form set forth below: See EX-99.CERT attached hereto. | |
| (a)(3) | Any written solicitation to purchase securities under Rule 23c-1 under the 1940 Act (17 CFR 270.23c-1) sent or given during the period covered by the report by or on behalf of the registrant to 10 or more persons: Not applicable to this registrant. | |
| (b) | If the report is filed under Section 13(a) or 15(d) of the Exchange Act, provide the certifications required by Rule 30a-2(b) under the 1940 Act (17 CFR 270.30a-2(b)), Rule 13a-14(b) or Rule 15d-14(b) under the Exchange Act (17 CFR 240.13a-14(b) or 240.15d-14(b)), and Section 1350 of Chapter 63 of Title 18 of the United States Code (18 U.S.C. 1350) as an Exhibit. A certification furnished pursuant to this paragraph will not be deemed “filed” for purposes of Section 18 of the Exchange Act (15 U.S.C. 78r), or otherwise subject to the liability of that section. Such certification will not be deemed to be incorporated by reference into any filing under the Securities Act of 1933 or the Exchange Act, except to the extent that the registration specifically incorporates it by reference: See EX-99.906 CERT attached hereto. | |
SIGNATURES
Pursuant to the requirements of the Securities Exchange Act of 1934 and the Investment Company Act of 1940, the registrant has duly caused this report to be signed on its behalf by the undersigned, thereunto duly authorized.
(Registrant) Nuveen Investment Trust
By (Signature and Title)
| /s/ Kevin J. McCarthy | |
| Kevin J. McCarthy | ||
| Vice President and Secretary | ||
Date September 8, 2008
Pursuant to the requirements of the Securities Exchange Act of 1934 and the Investment Company Act of 1940, this report has been signed below by the following persons on behalf of the registrant and in the capacities and on the dates indicated.
By (Signature and Title)
| /s/ Gifford R. Zimmerman | |
| Gifford R. Zimmerman | ||
| Chief Administrative Officer | ||
| (principal executive officer) | ||
Date September 8, 2008
| By (Signature and Title) | /s/ Stephen D. Foy | |
| Stephen D. Foy | ||
| Vice President and Controller | ||
| (principal financial officer) | ||
Date September 8, 2008