UNITED STATES
SECURITIES AND EXCHANGE COMMISSION
Washington, D.C. 20549
FORM N-CSR
CERTIFIED SHAREHOLDER REPORT OF REGISTERED MANAGEMENT
INVESTMENT COMPANIES
Investment Company Act file number 811-07619
Nuveen Investment Trust
(Exact name of registrant as specified in charter)
Nuveen Investments
333 West Wacker Drive, Chicago, IL 60606
(Address of principal executive offices) (Zip code)
Kevin J. McCarthy
Nuveen Investments
333 West Wacker Drive
Chicago, IL 60606
(Name and address of agent for service)
Registrant’s telephone number, including area code: (312) 917-7700
Date of fiscal year end: June 30
Date of reporting period: June 30, 2010
Form N-CSR is to be used by management investment companies to file reports with the Commission not later than 10 days after the transmission to stockholders of any report that is required to be transmitted to stockholders under Rule 30e-1 under the Investment Company Act of 1940 (17 CFR 270.30e-1). The Commission may use the information provided on Form N-CSR in its regulatory, disclosure review, inspection, and policy making roles.
A registrant is required to disclose the information specified by Form N-CSR, and the Commission will make this information public. A registrant is not required to respond to the collection of information contained in Form N-CSR unless the Form displays a currently valid Office of Management and Budget (“OMB”) control number. Please direct comments concerning the accuracy of the information collection burden estimate and any suggestions for reducing the burden to Secretary, Securities and Exchange Commission, 450 Fifth Street, NW, Washington, DC 20549-0609. The OMB has reviewed this collection of information under the clearance requirements of 44 U.S.C. ss.3507.
ITEM 1. REPORTS TO STOCKHOLDERS.

Mutual Funds
Nuveen Asset Allocation Funds
For investors seeking attractive long-term total return.
Annual Report
June 30, 2010
| | | | | | | | | | | | |
| Nuveen Growth Allocation Fund | | | | Nuveen Moderate Allocation Fund | | | | Nuveen Conservative Allocation Fund | | | | |
NUVEEN INVESTMENTS ANNOUNCES STRATEGIC COMBINATION WITH FAF ADVISORS
On July 29, 2010, Nuveen Investments, Inc. announced that U.S. Bancorp will receive a 9.5% stake in Nuveen Investments and cash consideration in exchange for the long-term asset business of U.S. Bancorp’s FAF Advisors (FAF). Nuveen Investments is the parent of Nuveen Asset Management (NAM), the investment adviser for the Funds included in this report.
FAF Advisors, which currently manages about $25 billion of long-term assets and serves as the advisor of the First American Funds, will be combined with NAM, which currently manages about $75 billion in municipal fixed income assets. Upon completion of the transaction, Nuveen Investments, which currently manages about $150 billion of assets across several high-quality affiliates, will manage a combined total of about $175 billion in institutional and retail assets.
This combination will not affect the investment objectives, strategies or policies of the Funds in this report. Over time, Nuveen Investments expects that the combination will provide even more ways to meet the needs of investors who work with financial advisors and consultants by enhancing the multi-boutique model of Nuveen Investments, which also includes highly respected investment teams at NWQ Investment Management, Santa Barbara Asset Management, Symphony Asset Management, Tradewinds Global Investors, Winslow Capital and Nuveen HydePark.
The transaction is expected to close late in 2010, subject to customary conditions.
| | | | | | |
| Must be preceded by or accompanied by a prospectus. | | NOT FDIC INSURED | | MAY LOSE VALUE | | NO BANK GUARANTEE |
Chairman’s
Letter to Shareholders

Dear Shareholder,
The economic environment in which your Fund operates reflects continuing but uneven economic recovery. The U.S. and other major industrial countries are experiencing steady but comparatively low levels of economic growth, while emerging market countries are seeing a resumption of relatively strong economic expansion. The potential impact of steps being considered by many governments to counteract the extraordinary governmental spending and credit expansion to deal with the recent financial and economic crisis is injecting uncertainty into global financial markets. The implications for future tax rates, government spending, interest rates and the pace of economic recovery in the U.S. and other leading economies are extremely difficult to predict at the present time. The long term health of the global economy depends on restoring some measure of fiscal discipline around the world, but since all of the corrective steps require economic pain, it is not surprising that governments are reluctant to undertake them.
In the near term, governments remain committed to furthering economic recovery and realizing a meaningful reduction in their national unemployment rates. Such an environment should produce continued economic growth and, consequently, attractive investment opportunities. Over the longer term, the larger uncertainty mentioned earlier carries the risk of unexpected potholes in the road to sustained recovery. For this reason, Nuveen’s investment management teams are working hard to balance return and risk by building well-diversified portfolios, among other strategies. I encourage you to read the following commentary on the management of your Fund. As always, I also encourage you to contact your financial consultant if you have any questions about your Nuveen Fund investment. Please consult the Nuveen website for the most recent information on your Nuveen Fund at: www.nuveen.com.
On behalf of the other members of your Fund’s Board, we look forward to continuing to earn your trust in the months and years ahead.
Sincerely,

Robert P. Bremner
Chairman of the Board
August 17, 2010
Portfolio Manager’s Comments
Certain statements in this report are forward-looking statements. Discussions of specific investments are for illustration only and are not intended as recommendations of individual investments. The forward-looking statements and other views expressed herein are those of the portfolio manager as of the date of this report. Actual future results or occurrences may differ significantly from those anticipated in any forward-looking statements, and the views expressed herein are subject to change at any time, due to numerous market and other factors. The Funds disclaim any obligation to update publicly or revise any forward-looking statements or views expressed herein.
The Nuveen Growth Allocation, the Nuveen Moderate Allocation and the Nuveen Conservative Allocation Funds feature portfolio management by Nuveen Investment Solutions, Inc. (NIS), an affiliate of Nuveen Investments. For most of this period, the Funds were managed by Thomas Richards, CFA, Senior Managing Director of NIS, and John Simmons, CFA, Managing Director and Portfolio Manager for NIS.
Effective March 1, 2010, Thomas Richards relinquished his duties as a portfolio manager of the Funds, with John Simmons remaining as portfolio manager. We recently asked John to discuss general market conditions, key portfolio management strategies and the performance of these three Funds for the twelve-month period ended June 30, 2010.
What were the general market conditions for the reporting period?
As the reporting period began, there continued to be considerable downward pressure on the economy and both the Federal Reserve (Fed) and the federal government continued their efforts to improve the overall economic environment. For its part, the Fed continued to hold the benchmark fed funds rate in a target range of zero to 0.25% after cutting it to this record low level in December 2008.
At its June 2010 meeting, the central bank renewed its pledge to keep the fed funds rate “exceptionally low” for an “extended period.” As part of its efforts, the federal government put into place the American Recovery and Reinvestment Act of 2009, a $787 billion economic stimulus package intended to provide job creation, tax relief, fiscal assistance to state and local governments and expansion of unemployment benefits and other federal social welfare programs.
During the twelve-month period, these and other measures taken by the Fed and the government to ease the economic recession have helped to produce some signs of improvement. Over the four calendar quarters comprising this period, the U.S. economy, as measured by the U.S. gross domestic product (GDP), grew at annualized rates of 1.6%, 5.0%, 3.7% and an estimated 2.4%. This marked the first time since 2007 that the economy managed to string together four consecutive positive quarters. Housing also provided something of a bright spot, as the S&P/Case-Shiller Home Price Index of average residential prices from 20 large urban areas gained 4.6% for the twelve months ended May 2010 (the most recent data available at the time this report was produced). This moved average home prices across the United States to levels similar to where they were in the autumn of 2003.
Inflation also continued to be relatively tame, as the Consumer Price Index (CPI) rose 1.1% year-over-year as of June 2010. While labor markets remained weak, recent months have seen some improvement. As of June 2010, the national unemployment rate was 9.5%, the same level as June 2009 but below the 26-year high of 10.1% in October 2009.
Equity markets across the globe rallied during the reporting period and many indexes reached highs in April 2010 that had not been seen since 2008. Nevertheless, financial markets faced numerous obstacles throughout the period. Some rating agencies downgraded the sovereign debt of Greece and Spain. Dubai World announced over Thanksgiving that it would need to restructure its debt. In response to the financial crisis, the Bank for International Settlements issued the so-called “Basel III” guidelines, proposing stricter regulations regarding banks’ capital and liquidity requirements. Investors were divided over how the various proposals to address U.S. health care coverage would impact industry participants. Each new event seemed to be followed by market volatility.
How did the Funds perform during the twelve-month period ended June 30, 2010?
The table on page seven provides performance information for the three Funds (Class A shares at net asset value) for the one-year, five-year, ten-year and since inception periods ended June 30, 2010. The table also compares each Fund’s performance to a peer group, appropriate composite benchmark and general market index. A more detailed discussion of each Fund’s relative performance is provided later in this report.
What strategies were used to manage the Funds during the reporting period?
All of these Funds are managed using the same strategic approach. This involves seeking to: (1) identify a universe of investable asset classes with different risks, returns and relationships, (2) determine an allocation policy among these asset classes that produces the highest expected return consistent with a targeted level of investment risk, (3) utilize liquid, transparent, and value-added investment funds within each asset class, (4) structure these funds to produce value-added performance consistent with the Funds’ active management risk budgets, and (5) monitor, refine and revise all the investment inputs that go into each Fund’s portfolio building process.
How did these strategies influence performance?
Nuveen Growth Allocation Fund
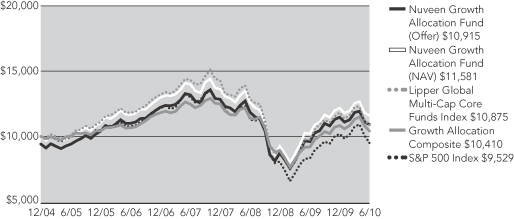
The Fund’s Class A shares at net asset value outperformed the Lipper Global Multi-Cap Core Funds Index and the Growth Allocation Composite over the twelve-month reporting period. The Class A Shares at NAV slightly underperformed the S&P 500 Index.
The Growth Allocation Fund’s policy allocation as of June 30, 2010, is presented below:
| | |
| Asset Class | | Asset Class Policy Weight |
Domestic Equity | | 27% |
International Equity | | 41% |
Global Resources | | 3% |
U.S. Public Real Estate | | 5% |
Domestic Fixed Income | | 4% |
Domestic High Yield | | 12% |
Treasury Inflation-Protected Securities (TIPS) | | 4% |
Short Duration & Cash | | 4% |
Total | | 100% |
As noted above, NIS monitors and manages the risk factors that impact the Fund’s performance, including (1) Investment Policy/Capital Market Risk, (2) Investment Style Risk, (3) Active Management Risk, and (4) Allocation Tactics Risk. The impact of each of these factors is quantified and analyzed as a part of our ongoing feedback and control management process.
Investment policy/capital market risk typically will have a large performance impact on the Fund. For the twelve-month reporting period, our asset class allocations produced a negative return, primarily because the last three months of the period saw materially negative absolute returns across most equity-oriented capital market segments.
Investment style risk involves an allocation policy to investment managers whose styles, in aggregate, differ from the asset class market target. NIS attempts to minimize this risk by investing in the Nuveen U.S. Equity Completeness Fund to gain exposure to the domestic equity asset class and in various exchange-traded funds to gain exposure to the international equity asset class. The return impact from investment style risk was slightly positive within international equity and negligible elsewhere during the reporting period.
Active management risk consists of the performance differential between an investment manager’s actual performance and the performance of the respective benchmark. NIS seeks to manage this active management risk by structuring teams of managers within asset classes that are believed to have the best chance of outperforming, in aggregate, their asset class target. During the reporting period, the Fund’s investment managers, in aggregate, generated positive incremental returns relative to their benchmarks. Manager performance within the global natural resources asset class, which consists of one mutual fund manager, generated the greatest level of outperformance. Strong manager performance was also realized in the international equity and domestic equity asset classes.
Allocation tactics risk involves the deviations of actual allocations versus the policy allocation weights. These deviations are often due to movements in the capital markets as well as to daily cash flows into and out of the Fund. During the reporting period, the performance impact due to allocation tactics has had a small, negative impact on total Fund performance.
Nuveen Moderate Allocation Fund
The Fund’s Class A shares at net asset value outperformed the Lipper Mixed-Asset Target Allocation Moderate Funds Index, the Moderate Allocation Composite and the S&P 500 Index during the twelve-month reporting period.
The Moderate Allocation Fund’s policy allocation as of June 30, 2010, is presented below:
| | |
| Asset Class | | Asset Class Policy Weight |
Domestic Equity | | 24% |
International Equity | | 28% |
Global Resources | | 2% |
U.S. Public Real Estate | | 3% |
Domestic Fixed Income | | 7% |
Domestic High Yield | | 16% |
Treasury Inflation-Protected Securities (TIPS) | | 13% |
Short Duration & Cash | | 7% |
Total | | 100% |
As noted above, NIS monitors and manages the risk factors that impact the Fund’s performance, including (1) Investment Policy/Capital Market Risk, (2) Investment Style Risk, (3) Active Management Risk, and (4) Allocation Tactics Risk. The impact of each of these factors is quantified and analyzed as a part of our ongoing feedback and control management process.
Investment policy/capital market risk will typically have a large performance impact on the Fund. During the reporting period, our asset class allocations produced a negative return, primarily because the last three months of the period saw materially negative absolute returns across most equity-oriented capital market segments.
Investment style risk involves an allocation policy to investment managers whose styles, in aggregate, differ from the asset class market target. NIS attempts to minimize this risk by investing in the Nuveen U.S. Equity Completeness Fund to gain exposure to the domestic equity asset class and various exchange traded funds to gain exposure to the international equity class. The return impact from investment style risk was slightly positive within international equity and negligible elsewhere during the reporting period.
Active management risk consists of the performance differential between an investment manager’s actual performance and the performance of the respective benchmark. NIS seeks to manage active management risk by structuring teams of managers within asset classes that are believed to have the best chance of outperforming, in aggregate, their asset class target. During the reporting period, the Fund’s investment managers, in aggregate, generated positive incremental returns, relative to their benchmarks. Manager performance within the global natural resources asset class, which consists of one mutual fund manager, generated the greatest level of outperformance. Strong manager performance was also realized in the international equity and domestic equity asset classes.
Allocation tactics risk involves the deviations of actual allocations versus the policy allocation weights. These deviations are often due to movements in the capital markets as well as to daily cash flows into and out of the Fund. During the reporting period the performance impact due to allocation tactics has had a small, negative impact on total Fund performance.
Nuveen Conservative Allocation Fund
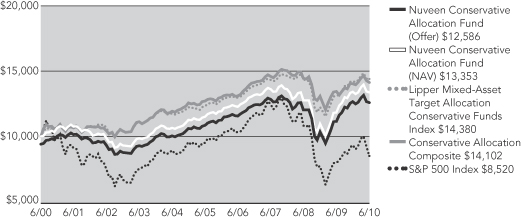
The Fund’s Class A shares at net asset value outperformed the Conservative Allocation Composite during the twelve-month reporting period, but underperformed the Lipper Mixed-Asset Target Allocation Conservative Funds Index and the S&P 500 Index.
The Conservative Allocation Fund’s policy allocation as of June 30, 2010, is presented in the accompanying table:
| | |
| Asset Class | | Asset Class Policy Weight |
Domestic Equity | | 16% |
International Equity | | 14% |
Global Resources | | 3% |
U.S. Public Real Estate | | 3% |
Domestic Fixed Income | | 18% |
Domestic High Yield | | 12% |
Treasury Inflation-Protected Securities (TIPS) | | 14% |
Short Duration & Cash | | 20% |
Total | | 100% |
As noted above, NIS monitors and manages the risk factors that impact the Fund’s performance, including (1) Investment Policy/Capital Market Risk, (2) Investment Style Risk, (3) Active Management Risk, and (4) Allocation Tactics Risk. The impact of each of these factors is quantified and analyzed as a part of our ongoing feedback and control management process.
Investment policy/capital market risk will typically have a large performance impact on the Fund. For the twelve-month reporting period, our asset class allocations produced a negative return, primarily because the last three months of the period saw materially negative absolute returns across most equity-oriented capital market segments.
Investment style risk involves an allocation policy to investment managers whose styles, in aggregate, differ from the asset class market target. NIS attempts to minimize this risk by investing in the Nuveen U.S. Equity Completeness Fund to gain exposure to the domestic equity asset class and various exchange traded funds to gain exposure to the international equity class. The return impact from investment style risk was positive within international equity and negligible elsewhere during the reporting period.
Active management risk consists of the performance differential between an investment manager’s actual performance and the performance of the respective benchmarks. NIS seeks to manage active management risk by structuring teams of managers within asset classes that are believed to have the best chance of outperforming their asset class target. During the period, the Fund’s investment managers, in aggregate, generated positive incremental returns, relative to their benchmarks. Manager performance within the global natural resources asset class, which consists of one mutual fund manager, generated the greatest level of outperformance. Strong manager performance was also realized in the international equity and domestic equity asset classes.
Allocation tactics risk involves the deviations of actual allocations versus the policy allocation weights. These deviations are often due to movements in the capital markets as well as to cash flows into and out of the Fund. During the reporting period the performance impact due to allocation tactics has had a small, positive impact on total Fund performance.
| 1 | Since inception return for the Nuveen Growth Allocation Fund is from 12/09/04; index and composite returns are from 12/31/04. Since inception returns for the Nuveen Moderate Allocation and Nuveen Conservative Allocation Funds are from 8/7/96; index and composite returns are form 8/31/96. |
| 2 | The Lipper Global Multi-Cap Core Funds Index is a managed index that represents the average annualized total return of the 10 largest funds in the Lipper Global Multi-Cap Core Funds category. The returns assume reinvestment of dividends and do not reflect any applicable sales charges. You cannot invest directly in an index. |
| 3 | The Growth Allocation Composite is an index comprised of a 76% weighting in the S&P 500 Index, a 19% weighting in the Barclays Capital U.S. Aggregate Bond Index, and a 5% weighting in Citigroup 3-Month U.S. Treasury Bill Index. The composite returns assume reinvestment of dividends and do not reflect any applicable sales charges. You cannot invest directly in a composite. |
| 4 | The S&P 500 Index is an unmanaged index generally considered representative of the U.S. stock market. The index returns assume reinvestment of dividends, but do not reflect any applicable sales charges. You cannot invest directly in an index. |
| 5 | The Lipper Mixed-Asset Target Allocation Moderate Funds Index is a managed index that represents the average annualized total return of the 10 largest funds in the Lipper Mixed Asset Target Allocation Moderate Funds category. The returns assume reinvestment of dividends and do not reflect any applicable sales charges. You cannot invest directly in an index. |
| 6 | The Moderate Allocation Composite is an index comprised of a 57% weighting in the S&P 500 Index, a 38% weighting in the Barclays Capital U.S. Aggregate Bond Index, and a 5% weighting in Citigroup 3-Month U.S. Treasury Bill Index. The composite returns assume reinvestment of dividends and do not reflect any applicable sales charges. You cannot invest directly in a composite. |
| 7 | The Lipper Mixed-Asset Target Allocation Conservative Funds Index is a managed index that represents the average annualized total return of the 10 largest funds in the Lipper Mixed-Asset Target Allocation Conservative Funds category. The returns assume reinvestment of dividends and do not reflect any applicable sales charges. You cannot invest directly in an index. |
| 8 | The Conservative Allocation Composite is an index comprised of a 38% weighting in the S&P 500 Index, a 57% weighting in the Barclays Capital U.S. Aggregate Bond Index, and a 5% weighting in Citigroup 3-Month U.S. Treasury Bill Index. The composite returns assume reinvestment of dividends and do not reflect any applicable sales charges. You cannot invest directly in a composite. |
Class A Shares – Average Annual Total Returns
As of 6/30/2010
| | | | | | | | |
| | | Average Annual |
| | | 1-Year | | 5-Year | | 10-Year | | Since
Inception1 |
Nuveen Growth Allocation Fund | | | | | | | | |
A Shares at NAV | | 13.56% | | 3.00% | | N/A | | 3.34% |
A Shares at Offer | | 7.03% | | 1.79% | | N/A | | 2.25% |
Lipper Global Multi-Cap Core Funds Index2 | | 11.54% | | 1.48% | | N/A | | 1.54% |
Growth Allocation Composite3 | | 13.01% | | 0.82% | | N/A | | 0.73% |
S&P 500 Index4 | | 14.43% | | -0.79% | | N/A | | -0.87% |
Nuveen Moderate Allocation Fund | | | | | | | | |
A Shares at NAV | | 14.49% | | 3.21% | | 3.80% | | 6.01% |
A Shares at Offer | | 7.93% | | 2.00% | | 3.18% | | 5.56% |
Lipper Mixed-Asset Target Allocation Moderate Funds Index5 | | 12.92% | | 1.56% | | 2.72% | | 5.48% |
Moderate Allocation Composite6 | | 12.17% | | 2.10% | | 1.98% | | 5.99% |
S&P 500 Index4 | | 14.43% | | -0.79% | | -1.59% | | 5.20% |
Nuveen Conservative Allocation Fund | | | | | | | | |
A Shares at NAV | | 12.93% | | 3.02% | | 2.94% | | 4.70% |
A Shares at Offer | | 6.46% | | 1.81% | | 2.33% | | 4.25% |
Lipper Mixed-Asset Target Allocation Conservative Funds Index7 | | 13.79% | | 3.87% | | 3.70% | | 5.54% |
Conservative Allocation Composite8 | | 11.22% | | 3.29% | | 3.50% | | 6.24% |
S&P 500 Index4 | | 14.43% | | -0.79% | | -1.59% | | 5.20% |
Returns quoted represent past performance which is no guarantee of future results. Current performance may be higher or lower than the performance shown. Investment returns and principal value will fluctuate so that when shares are redeemed, they may be worth more or less than their original cost. Class A Shares have a 5.75% maximum sales charge. Returns at NAV would be lower if the sales charge were included. Returns do not reflect the deduction of taxes that a shareholder would pay on Fund distributions or the redemption of shares. Returns may reflect a contractual agreement between certain Funds and the investment adviser to waive certain fees and expenses; see Notes to Financial Statements, Footnote 6 — Management Fees and Other Transactions with Affiliates for more information. In addition, returns may reflect a voluntary expense limitation by the Funds’ investment adviser that may be modified or discontinued at any time without notice. For the most recent month-end performance, visit www.nuveen.com or call (800) 257-8787.
Please see each Fund’s Spotlight Page later in this report for more complete performance data and expense ratios.
Nuveen Growth Allocation Fund
Growth of an Assumed $10,000 Investment
Nuveen Moderate Allocation Fund
Growth of an Assumed $10,000 Investment

The graphs do not reflect the deduction of taxes that a shareholder may pay on Fund distributions or the redemption of Fund shares.
The index comparisons show the change in value of a $10,000 investment in the Class A Shares of the Nuveen Funds compared with the corresponding indexes. The Lipper Global Multi-Cap Core Funds Index is a managed index that represents the average annualized returns of the 10 largest funds in the Lipper Global Multi-Cap Core Funds category. The Growth Allocation Composite is an index comprised of a 76% weighting in the S&P 500 Index, a 19% weighting in the Barclays Capital U.S. Aggregate Bond Index, and a 5% weighting in Citigroup 3-Month U.S. Treasury Bill Index. Growth Allocation Fund returns are from 12/09/04; index and composite returns are from 12/31/04. The Lipper Mixed-Asset Target Allocation Moderate Funds Index is a managed index that represents the average annualized total return of the 10 largest funds in the Lipper Mixed-Asset Target Allocation Moderate Funds category. The Moderate Allocation Composite is an index comprised of a 57% weighting in the S&P 500 Index, a 38% weighting in the Barclays Capital U.S. Aggregate Bond Index, and a 5% weighting in Citigroup 3-Month U.S. Treasury Bill Index. The S&P 500 Index is an unmanaged index generally considered representative of the U.S. stock market. The index returns assume reinvestment of dividends and do not reflect any initial or ongoing expenses. You cannot invest directly in an index or composite. The Nuveen Funds’ returns include reinvestment of all dividends and distributions, and the Funds’ returns at the offer price depicted in the charts reflect the initial maximum sales charge applicable to Class A Shares (5.75%) and all ongoing Fund expenses. The performance data quoted represents past performance, which is not indicative of future results. Current performance may be lower or higher than the performance shown.
Nuveen Conservative Allocation Fund
Growth of an Assumed $10,000 Investment
The graph does not reflect the deduction of taxes that a shareholder may pay on Fund distributions or the redemption of Fund shares.
The index comparisons show the change in value of a $10,000 investment in the Class A Shares of the Nuveen Conservative Allocation Fund compared with the corresponding indexes. The Lipper Mixed-Asset Target Allocation Conservative Funds Index is a managed index that represents the average annualized total return of the 10 largest funds in the Lipper Mixed-Asset Target Allocation Conservative Funds category. The Conservative Allocation Composite is an index comprised of a 38% weighting in the S&P 500 Index, a 57% weighting in the Barclays Capital U.S. Aggregate Bond Index, and a 5% weighting in Citigroup 3-Month U.S. Treasury Bill Index. The S&P 500 Index is an unmanaged index generally considered representative of the U.S. stock market. The index returns assume reinvestment of dividends and do not reflect any initial or ongoing expenses. You cannot invest directly in an index or composite. The Nuveen Conservative Allocation Fund’s returns include reinvestment of all dividends and distributions, and the Fund’s returns at the offer price depicted in the chart reflects the initial maximum sales charge applicable to Class A Shares (5.75%) and all ongoing Fund expenses. The performance data quoted represents past performance, which is not indicative of future results. Current performance may be lower or higher than the performance shown.
Fund Spotlight as of 6/30/10 Nuveen Growth Allocation Fund
| | | | | | | | | | |
| Quick Facts | | | | | | | | | | |
| | | A Shares | | B Shares | | C Shares | | R3 Shares | | I Shares |
Fund Symbols | | NGOAX | | NGVBX | | NGVCX | | NGATX | | NGVRX |
NAV | | $19.66 | | $19.34 | | $19.35 | | $19.73 | | $19.69 |
Latest Ordinary Income Distribution1 | | $0.4521 | | $0.3131 | | $0.3134 | | $0.4090 | | $0.4976 |
Inception Date | | 12/09/04 | | 12/09/04 | | 12/09/04 | | 8/04/08 | | 12/09/04 |
Returns quoted represent past performance which is no guarantee of future results. Investment returns and principal value will fluctuate so that when shares are redeemed, they may be worth more or less than their original cost. Current performance may be higher or lower than the performance shown. Returns without sales charges would be lower if the sales charge were included. Returns do not reflect the deduction of taxes that a shareholder would pay on Fund distributions or the redemption of shares. For the most recent month-end performance visit www.nuveen.com or call (800) 257-8787.
Class A, B, C and I Share returns are actual. The returns for Class R3 Shares are actual for the period since class inception on 8/04/08; returns prior to class inception are Class I Share returns adjusted for differences in sales charges and expenses, which are primarily differences in distribution and service fees. Fund returns assume reinvestment of dividends and capital gains. Class A Shares have a 5.75% maximum sales charge. Class A Share purchases of $1 million or more are sold at net asset value without an up-front sales charge but may be subject to a contingent deferred sales charge (CDSC), also known as a back-end sales charge, if redeemed within twelve months of purchase. Class B Shares have a CDSC that begins at 5% for redemptions during the first year and declines periodically until after six years when the charge becomes 0%. Class B Shares automatically convert to Class A Shares eight years after purchase. Class C Shares have a 1% CDSC for redemptions within less than one year, which is not reflected in the one-year total return. Class R3 Shares have no sales charge and are available to only certain retirement plans. Class I Shares have no sales charge and may be purchased under limited circumstances or by specified classes of investors. Returns may reflect an expense limitation by the Fund’s investment adviser.
Returns prior to August 1, 2008, are not indicative of the performance that the Fund, as currently managed, would have generated.
| | | | |
| Average Annual Total Returns as of 6/30/10 |
| | |
| A Shares | | NAV | | Offer |
1-Year | | 13.56% | | 7.03% |
5-Year | | 3.00% | | 1.79% |
Since Inception | | 3.34% | | 2.25% |
| | |
| B Shares | | w/o CDSC | | w/CDSC |
1-Year | | 12.72% | | 8.72% |
5-Year | | 2.23% | | 2.06% |
Since Inception | | 2.57% | | 2.42% |
| | |
| C Shares | | NAV | | |
1-Year | | 12.65% | | |
5-Year | | 2.24% | | |
Since Inception | | 2.58% | | |
| | |
| R3 Shares | | NAV | | |
1-Year | | 13.27% | | |
5-Year | | 2.75% | | |
Since Inception | | 3.09% | | |
| | |
| I Shares | | NAV | | |
1-Year | | 13.78% | | |
5-Year | | 3.26% | | |
Since Inception | | 3.60% | | |
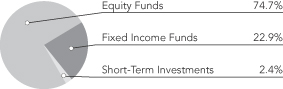
Portfolio Allocation2
| | |
| Portfolio Statistics |
| Net Assets ($000) | | $8,341 |
| Number of Holdings | | 16 |
| | | | |
| Expense Ratios | | | | |
| Share Class | | Gross
Expense
Ratios | | Net
Expense
Ratios |
| Class A | | 3.05% | | 1.29% |
| Class B | | 3.89% | | 2.04% |
| Class C | | 3.83% | | 2.04% |
| Class R3 | | 3.66% | | 1.54% |
| Class I | | 2.90% | | 1.04% |
The expense ratios shown factor in Total Annual Fund Operating Expenses including management fees and other fees and expenses, including the estimated fees and expenses of the Underlying Funds in which the Fund invests. The Net Expense Ratios reflect a contractual commitment by the Fund’s investment adviser to waive fees and reimburse expenses through October 31, 2011. Theses expense ratios will vary from the expense ratios included in the Financial Highlights of this report as they exclude the expenses of the Underlying Funds. The expense ratios are those shown in the most recent Fund prospectus.
| 2 | As a percentage of total investments as of June 30, 2010. Holdings are subject to change. |
Fund Spotlight as of 6/30/10 Nuveen Growth Allocation Fund
| | |
| Holding | | Weighting1 |
Nuveen NWQ Large-Cap Value Fund (Class I) | | 4.6% |
Nuveen Santa Barbara Growth Fund (Class I) | | 1.7% |
Nuveen Symphony Large-Cap Growth Fund (Class I) | | 6.0% |
Nuveen Tradewinds Global Resources Fund (Class I) | | 3.0% |
Nuveen Tradewinds International Value Fund (Class I) | | 13.2% |
Nuveen Tradewinds Value Opportunities Fund (Class I) | | 3.9% |
Nuveen U.S. Equity Completeness Fund | | 7.7% |
Nuveen Winslow Large-Cap Growth Fund (Class I) | | 2.6% |
Total Affiliated Equity Funds | | 42.7% |
| |
iShares Dow Jones U.S. Real Estate Index Fund | | 4.9% |
iShares MSCI EAFE Growth Index Fund | | 12.5% |
iShares MSCI Emerging Markets Index Fund | | 14.6% |
Total Non-Affiliated Equity Funds | | 32.0% |
| Total Equity Funds | | 74.7% |
| |
Nuveen High Yield Bond Fund (Class I) | | 12.4% |
Nuveen Multi-Strategy Core Bond Fund (Class I) | | 4.2% |
Nuveen Short Duration Bond Fund (Class I) | | 2.0% |
Total Affiliated Fixed Income Funds | | 18.6% |
| |
iShares Barclays U.S. Treasury Inflation Protected Securities Index Fund | | 4.3% |
Total Non-Affiliated Fixed Income Funds | | 4.3% |
| Total Fixed Income Funds | | 22.9% |
| Total Short-Term Investments | | 2.4% |
| Total Investments | | 100.0% |
| | |
| Affiliated Equity Funds | | 1-Year Average Annual
Total Returns as of 6/30/10 |
Nuveen NWQ Large-Cap Value Fund (Class I) | | 16.13% |
Nuveen Santa Barbara Growth Fund (Class I) | | 10.93% |
Nuveen Symphony Large-Cap Growth Fund (Class I) | | 20.26% |
Nuveen Tradewinds Global Resources Fund (Class I) | | 20.30% |
Nuveen Tradewinds International Value Fund (Class I) | | 4.77% |
Nuveen Tradewinds Value Opportunities Fund (Class I) | | 23.48% |
Nuveen U.S. Equity Completeness Fund | | 13.25% |
Nuveen Winslow Large-Cap Growth Fund (Class I) | | 10.33% |
| |
| Non-Affiliated Equity Funds | | |
iShares Dow Jones U.S. Real Estate Index Fund | | 50.80% |
iShares MSCI EAFE Growth Index Fund | | 8.40% |
iShares MSCI Emerging Markets Index Fund | | 19.11% |
| |
| Affiliated Fixed Income Funds | | |
Nuveen High Yield Bond Fund (Class I) | | 24.27% |
Nuveen Multi-Strategy Core Bond Fund (Class I) | | 11.23% |
Nuveen Short Duration Bond Fund (Class I) | | 5.40% |
| |
| Non-Affiliated Fixed Income Funds | | |
iShares Barclays U.S. Treasury Inflation Protected Securities Index Fund | | 9.36% |
| 1 | As a percentage of total investments as of June 30, 2010. Holdings are subject to change. |
Expense Example
As a shareholder of the Fund, you incur two types of costs: (1) transaction costs, including front- and back-end sales charges (loads) or redemption fees, where applicable; and (2) ongoing costs, including management fees; distribution and service (12b-1) fees, where applicable; and other Fund expenses. This Example is intended to help you understand your ongoing costs (in dollars) of investing in the Fund and to compare these costs with the ongoing costs of investing in other mutual funds.
The Example below is based on an investment of $1,000 invested at the beginning of the period and held for the period.
The information under “Actual Performance,” together with the amount you invested, allows you to estimate actual expenses incurred over the reporting period. Simply divide your account value by $1,000 (for example, an $8,600 account value divided by $1,000 = 8.60) and multiply the result by the cost shown for your share class, in the row entitled “Expenses Incurred During Period” to estimate the expenses incurred on your account during this period.
The information under “Hypothetical Performance,” provides information about hypothetical account values and hypothetical expenses based on the Fund’s actual expense ratio and an assumed rate of return of 5% per year before expenses, which is not the Fund’s actual return. The hypothetical account values and expenses may not be used to estimate the actual ending account balance or expense you incurred for the period. You may use this information to compare the ongoing costs of investing in the Fund and other Funds. To do so, compare this 5% hypothetical example with the 5% hypothetical examples that appear in the shareholder reports of the other funds.
Please note that the expenses shown in the table are meant to highlight your ongoing costs only and do not reflect any transactional costs, such as front- and back-end sales charges (loads) or redemption fees, where applicable. Therefore, the hypothetical information is useful in comparing ongoing costs only, and will not help you determine the relative total costs of owning different funds or share classes. In addition, if these transactional costs were included, your costs would have been higher.
| | | | | | | | | | | | | | | | | | | | | | | | | | | | | | | | |
| | | | | | | | | | | | | | | Hypothetical Performance |
| | | Actual Performance | | | | (5% return before expenses) |
| | | A Shares | | B Shares | | C Shares | | R3 Shares | | I Shares | | | | A Shares | | B Shares | | C Shares | | R3 Shares | | I Shares |
| Beginning Account Value (1/01/10) | | $ | 1,000.00 | | $ | 1,000.00 | | $ | 1,000.00 | | $ | 1,000.00 | | $ | 1,000.00 | | | | $ | 1,000.00 | | $ | 1,000.00 | | $ | 1,000.00 | | $ | 1,000.00 | | $ | 1,000.00 |
| Ending Account Value (6/30/10) | | $ | 952.10 | | $ | 948.50 | | $ | 948.10 | | $ | 950.80 | | $ | 952.60 | | | | $ | 1,021.57 | | $ | 1,017.85 | | $ | 1,017.85 | | $ | 1,020.33 | | $ | 1,022.81 |
| Expenses Incurred During Period | | $ | 3.15 | | $ | 6.76 | | $ | 6.76 | | $ | 4.35 | | $ | 1.94 | | | | $ | 3.26 | | $ | 7.00 | | $ | 7.00 | | $ | 4.51 | | $ | 2.01 |
For each class of the Fund, expenses are equal to the Fund’s annualized net expense ratio of 0.65%, 1.40%, 1.40%, 0.90% and 0.40% for Classes A, B, C, R3 and I, respectively, multiplied by the average account value over the period, multiplied by 181/365 (to reflect the one-half year period).
Fund Spotlight as of 6/30/10 Nuveen Moderate Allocation Fund
| | | | | | | | | | |
| Quick Facts | | | | | | | | | | |
| | | A Shares | | B Shares | | C Shares | | R3 Shares | | I Shares |
Fund Symbols | | NNSAX | | NNSBX | | NUVCX | | NMATX | | NNSRX |
NAV | | $21.08 | | $21.07 | | $21.10 | | $21.08 | | $21.08 |
Latest Ordinary Income Distribution1 | | $0.5761 | | $0.4336 | | $0.4342 | | $0.5288 | | $0.6235 |
Inception Date | | 8/07/96 | | 8/07/96 | | 8/07/96 | | 8/04/08 | | 8/07/96 |
Returns quoted represent past performance which is no guarantee of future results. Investment returns and principal value will fluctuate so that when shares are redeemed, they may be worth more or less than their original cost. Current performance may be higher or lower than the performance shown. Returns without sales charges would be lower if the sales charge were included. Returns do not reflect the deduction of taxes that a shareholder would pay on Fund distributions or the redemption of shares. For the most recent month-end performance visit www.nuveen.com or call (800) 257-8787.
Class A, B, C and I Share returns are actual. The returns for Class R3 Shares are actual for the period since class inception on 8/04/08; returns prior to class inception are Class I Share returns adjusted for differences in sales charges and expenses, which are primarily differences in distribution and service fees. Fund returns assume reinvestment of dividends and capital gains. Class A Shares have a 5.75% maximum sales charge. Class A Share purchases of $1 million or more are sold at net asset value without an up-front sales charge but may be subject to a contingent deferred sales charge (CDSC), also known as a back-end sales charge, if redeemed within twelve months of purchase. Class B Shares have a CDSC that begins at 5% for redemptions during the first year and declines periodically until after six years when the charge becomes 0%. Class B Shares automatically convert to Class A Shares eight years after purchase. Class C Shares have a 1% CDSC for redemptions within less than one year, which is not reflected in the one-year total return. Class R3 Shares have no sales charge and are available to only certain retirement plans. Class I Shares have no sales charge and may be purchased under limited circumstances or by specified classes of investors. Returns may reflect an expense limitation by the Fund’s investment adviser.
Returns prior to August 1, 2008, are not indicative of the performance that the Fund, as currently managed, would have generated.
| | | | |
| Average Annual Total Returns as of 6/30/10 |
| | |
| A Shares | | NAV | | Offer |
1-Year | | 14.49% | | 7.93% |
5-Year | | 3.21% | | 2.00% |
10-Year | | 3.80% | | 3.18% |
| | |
| B Shares | | w/o CDSC | | w/CDSC |
1-Year | | 13.64% | | 9.64% |
5-Year | | 2.44% | | 2.29% |
10-Year | | 3.16% | | 3.16% |
| | |
| C Shares | | NAV | | |
1-Year | | 13.62% | | |
5-Year | | 2.44% | | |
10-Year | | 3.03% | | |
| | |
| R3 Shares | | NAV | | |
1-Year | | 14.19% | | |
5-Year | | 2.94% | | |
10-Year | | 3.54% | | |
| | |
| I Shares | | NAV | | |
1-Year | | 14.80% | | |
5-Year | | 3.47% | | |
10-Year | | 4.06% | | |
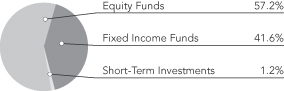
Portfolio Allocation2
| | |
| Portfolio Statistics |
| Net Assets ($000) | | $45,390 |
| Number of Holdings | | 16 |
| | | | |
| Expense Ratios | | | | |
| Share Class | | Gross
Expense
Ratios | | Net
Expense
Ratios |
| Class A | | 1.82% | | 1.14% |
| Class B | | 2.55% | | 1.89% |
| Class C | | 2.56% | | 1.89% |
| Class R3 | | 2.17% | | 1.39% |
| Class I | | 1.56% | | 0.89% |
The expense ratios shown factor in Total Annual Fund Operating Expenses including management fees and other fees and expenses, including the estimated fees and expenses of the Underlying Funds in which the Fund invests. The Net Expense Ratios reflect a contractual commitment by the Fund’s investment adviser to waive fees and reimburse expenses through October 31, 2011. Theses expense ratios will vary from the expense ratios included in the Financial Highlights of this report as they exclude the expenses of the Underlying Funds. The expense ratios are those shown in the most recent Fund prospectus.
| 2 | As a percentage of total investments as of June 30, 2010. Holdings are subject to change. |
Fund Spotlight as of 6/30/10 Nuveen Moderate Allocation Fund
| | |
| Holding | | Weighting1 |
Nuveen NWQ Large-Cap Value Fund (Class I) | | 4.2% |
Nuveen Santa Barbara Growth Fund (Class I) | | 1.5% |
Nuveen Symphony Large-Cap Growth Fund (Class I) | | 5.8% |
Nuveen Tradewinds Global Resources Fund (Class I) | | 2.0% |
Nuveen Tradewinds International Value Fund (Class I) | | 8.5% |
Nuveen Tradewinds Value Opportunities Fund (Class I) | | 3.6% |
Nuveen U.S. Equity Completeness Fund | | 7.2% |
Nuveen Winslow Large-Cap Growth Fund (Class I) | | 2.4% |
Total Affiliated Equity Funds | | 35.2% |
| |
iShares Dow Jones U.S. Real Estate Index Fund | | 3.1% |
iShares MSCI EAFE Growth Index Fund | | 8.0% |
iShares MSCI Emerging Markets Index Fund | | 10.9% |
Total Non-Affiliated Equity Funds | | 22.0% |
| Total Equity Funds | | 57.2% |
| |
Nuveen High Yield Bond Fund (Class I) | | 15.6% |
Nuveen Multi-Strategy Core Bond Fund (Class I) | | 7.4% |
Nuveen Short Duration Bond Fund (Class I) | | 5.9% |
Total Affiliated Fixed Income Funds | | 28.9% |
| |
iShares Barclays U.S. Treasury Inflation Protected Securities Index Fund | | 12.7% |
Total Non-Affiliated Fixed Income Funds | | 12.7% |
| Total Fixed Income Funds | | 41.6% |
| Total Short-Term Investments | | 1.2% |
| Total Investments | | 100.0% |
| | |
| Affiliated Equity Funds | | 1-Year
Average Annual
Total Returns
as of 6/30/10 |
Nuveen NWQ Large-Cap Value Fund (Class I) | | 16.13% |
Nuveen Santa Barbara Growth Fund (Class I) | | 10.93% |
Nuveen Symphony Large-Cap Growth Fund (Class I) | | 20.26% |
Nuveen Tradewinds Global Resources Fund (Class I) | | 20.30% |
Nuveen Tradewinds International Value Fund (Class I) | | 4.77% |
Nuveen Tradewinds Value Opportunities Fund (Class I) | | 23.48% |
Nuveen U.S. Equity Completeness Fund | | 13.25% |
Nuveen Winslow Large-Cap Growth Fund (Class I) | | 10.33% |
| |
| Non-Affiliated Equity Funds | | |
iShares Dow Jones U.S. Real Estate Index Fund | | 50.80% |
iShares MSCI EAFE Growth Index Fund | | 8.40% |
iShares MSCI Emerging Markets Index Fund | | 19.11% |
| |
| Affiliated Fixed Income Funds | | |
Nuveen High Yield Bond Fund (Class I) | | 24.27% |
Nuveen Multi-Strategy Core Bond Fund (Class I) | | 11.23% |
Nuveen Short Duration Bond Fund (Class I) | | 5.40% |
| |
| Non-Affiliated Fixed Income Funds | | |
iShares Barclays U.S. Treasury Inflation Protected Securities Index Fund | | 9.36% |
| 1 | As a percentage of total investments as of June 30, 2010. Holdings are subject to change. |
Expense Example
As a shareholder of the Fund, you incur two types of costs: (1) transaction costs, including front- and back-end sales charges (loads) or redemption fees, where applicable; and (2) ongoing costs, including management fees; distribution and service (12b-1) fees, where applicable; and other Fund expenses. This Example is intended to help you understand your ongoing costs (in dollars) of investing in the Fund and to compare these costs with the ongoing costs of investing in other mutual funds.
The Example below is based on an investment of $1,000 invested at the beginning of the period and held for the period.
The information under “Actual Performance,” together with the amount you invested, allows you to estimate actual expenses incurred over the reporting period. Simply divide your account value by $1,000 (for example, an $8,600 account value divided by $1,000 = 8.60) and multiply the result by the cost shown for your share class, in the row entitled “Expenses Incurred During Period” to estimate the expenses incurred on your account during this period.
The information under “Hypothetical Performance,” provides information about hypothetical account values and hypothetical expenses based on the Fund’s actual expense ratio and an assumed rate of return of 5% per year before expenses, which is not the Fund’s actual return. The hypothetical account values and expenses may not be used to estimate the actual ending account balance or expense you incurred for the period. You may use this information to compare the ongoing costs of investing in the Fund and other Funds. To do so, compare this 5% hypothetical example with the 5% hypothetical examples that appear in the shareholder reports of the other funds.
Please note that the expenses shown in the table are meant to highlight your ongoing costs only and do not reflect any transactional costs, such as front- and back-end sales charges (loads) or redemption fees, where applicable. Therefore, the hypothetical information is useful in comparing ongoing costs only, and will not help you determine the relative total costs of owning different funds or share classes. In addition, if these transactional costs were included, your costs would have been higher.
| | | | | | | | | | | | | | | | | | | | | | | | | | | | | | | | |
| | | | | | | | | | | | | | | Hypothetical Performance |
| | | Actual Performance | | | | (5% return before expenses) |
| | | A Shares | | B Shares | | C Shares | | R3 Shares | | I Shares | | | | A Shares | | B Shares | | C Shares | | R3 Shares | | I Shares |
| Beginning Account Value (1/01/10) | | $ | 1,000.00 | | $ | 1,000.00 | | $ | 1,000.00 | | $ | 1,000.00 | | $ | 1,000.00 | | | | $ | 1,000.00 | | $ | 1,000.00 | | $ | 1,000.00 | | $ | 1,000.00 | | $ | 1,000.00 |
| Ending Account Value (6/30/10) | | $ | 974.60 | | $ | 971.00 | | $ | 971.00 | | $ | 973.20 | | $ | 975.90 | | | | $ | 1,022.12 | | $ | 1,018.40 | | $ | 1,018.40 | | $ | 1,020.88 | | $ | 1,023.36 |
| Expenses Incurred During Period | | $ | 2.64 | | $ | 6.30 | | $ | 6.30 | | $ | 3.87 | | $ | 1.42 | | | | $ | 2.71 | | $ | 6.46 | | $ | 6.46 | | $ | 3.96 | | $ | 1.45 |
For each class of the Fund, expenses are equal to the Fund’s annualized net expense ratio of 0.54%, 1.29%, 1.29%, 0.79% and 0.29% for Classes A, B, C, R3 and I, respectively, multiplied by the average account value over the period, multiplied by 181/365 (to reflect the one-half year period).
Fund Spotlight as of 6/30/10 Nuveen Conservative Allocation Fund
| | | | | | | | | | |
| Quick Facts | | | | | | | | | | |
| | | A Shares | | B Shares | | C Shares | | R3 Shares | | I Shares |
Fund Symbols | | NBMSX | | NMNBX | | NBMCX | | NALTX | | NMNRX |
NAV | | $22.07 | | $23.67 | | $23.64 | | $21.49 | | $21.48 |
Latest Ordinary Income Distribution1 | | $0.7932 | | $0.6874 | | $0.6865 | | $0.7229 | | $0.8211 |
Inception Date | | 8/07/96 | | 8/07/96 | | 8/07/96 | | 8/04/08 | | 8/07/96 |
Returns quoted represent past performance which is no guarantee of future results. Investment returns and principal value will fluctuate so that when shares are redeemed, they may be worth more or less than their original cost. Current performance may be higher or lower than the performance shown. Returns without sales charges would be lower if the sales charge were included. Returns do not reflect the deduction of taxes that a shareholder would pay on Fund distributions or the redemption of shares. For the most recent month-end performance visit www.nuveen.com or call (800) 257-8787.
Class A, B, C and I Share returns are actual. The returns for Class R3 Shares are actual for the period since class inception on 8/04/08; returns prior to class inception are Class I Share returns adjusted for differences in sales charges and expenses, which are primarily differences in distribution and service fees. Fund returns assume reinvestment of dividends and capital gains. Class A Shares have a 5.75% maximum sales charge. Class A Share purchases of $1 million or more are sold at net asset value without an up-front sales charge but may be subject to a contingent deferred sales charge (CDSC), also known as a back-end sales charge, if redeemed within twelve months of purchase. Class B Shares have a CDSC that begins at 5% for redemptions during the first year and declines periodically until after six years when the charge becomes 0%. Class B Shares automatically convert to Class A Shares eight years after purchase. Class C Shares have a 1% CDSC for redemptions within less than one year, which is not reflected in the one-year total return. Class R3 Shares have no sales charge and are available to only certain retirement plans. Class I Shares have no sales charge and may be purchased under limited circumstances or by specified classes of investors. Returns may reflect an expense limitation by the Fund’s investment adviser.
Returns prior to July 7, 2008, are not indicative of the performance that the Fund, as currently managed, would have generated.
| | | | |
| Average Annual Total Returns as of 6/30/10 |
| | |
| A Shares | | NAV | | Offer |
1-Year | | 12.93% | | 6.46% |
5-Year | | 3.02% | | 1.81% |
10-Year | | 2.94% | | 2.33% |
| | |
| B Shares | | w/o CDSC | | w/CDSC |
1-Year | | 12.11% | | 8.11% |
5-Year | | 2.26% | | 2.08% |
10-Year | | 2.32% | | 2.32% |
| | |
| C Shares | | NAV | | |
1-Year | | 12.12% | | |
5-Year | | 2.25% | | |
10-Year | | 2.18% | | |
| | |
| R3 Shares | | NAV | | |
1-Year | | 12.67% | | |
5-Year | | 2.77% | | |
10-Year | | 2.69% | | |
| | |
| I Shares | | NAV | | |
1-Year | | 13.24% | | |
5-Year | | 3.29% | | |
10-Year | | 3.21% | | |
Portfolio Allocation2
| | |
| Portfolio Statistics |
| Net Assets ($000) | | $45,425 |
| Number of Holdings | | 16 |
| | | | |
| Expense Ratios | | | | |
| Share Class | | Gross
Expense
Ratios | | Net
Expense
Ratios |
| Class A | | 1.62% | | 1.21% |
| Class B | | 2.35% | | 1.96% |
| Class C | | 2.39% | | 1.96% |
| Class R3 | | 1.94% | | 1.46% |
| Class I | | 1.33% | | 0.96% |
The expense ratios shown factor in Total Annual Fund Operating Expenses including management fees and other fees and expenses, including the estimated fees and expenses of the Underlying Funds in which the Fund invests. The Net Expense Ratios reflect a contractual commitment by the Fund’s investment adviser to waive fees and reimburse expenses through October 31, 2011. Theses expense ratios will vary from the expense ratios included in the Financial Highlights of this report, as they exclude the expenses of the Underlying Funds. The expense ratios are those shown in the most recent Fund prospectus.
| 2 | As a percentage of total investments as of June 30, 2010. Holdings are subject to change. |
Fund Spotlight as of 6/30/10 Nuveen Conservative Allocation Fund
| | |
| Holding | | Weighting1 |
Nuveen NWQ Large-Cap Value Fund (Class I) | | 2.7% |
Nuveen Santa Barbara Growth Fund (Class I) | | 1.0% |
Nuveen Symphony Large-Cap Growth Fund (Class I) | | 3.7% |
Nuveen Tradewinds Global Resources Fund (Class I) | | 2.8% |
Nuveen Tradewinds International Value Fund (Class I) | | 4.3% |
Nuveen Tradewinds Value Opportunities Fund (Class I) | | 2.3% |
Nuveen U.S. Equity Completeness Fund | | 4.7% |
Nuveen Winslow Large-Cap Growth Fund (Class I) | | 1.6% |
Total Affiliated Equity Funds | | 23.1% |
| |
iShares Dow Jones U.S. Real Estate Index Fund | | 2.9% |
iShares MSCI EAFE Growth Index Fund | | 4.0% |
iShares MSCI Emerging Markets Index Fund | | 5.5% |
Total Non-Affiliated Equity Funds | | 12.4% |
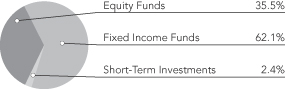
| Total Equity Funds | | 35.5% |
| |
Nuveen High Yield Bond Fund (Class I) | | 12.3% |
Nuveen Multi-Strategy Core Bond Fund (Class I) | | 17.9% |
Nuveen Short Duration Bond Fund (Class I) | | 17.3% |
Total Affiliated Fixed Income Funds | | 47.5% |
| |
iShares Barclays U.S. Treasury Inflation Protected Securities Index Fund | | 14.6% |
Total Non-Affiliated Fixed Income Funds | | 14.6% |
| Total Fixed Income Funds | | 62.1% |
| Total Short-Term Investments | | 2.4% |
| Total Investments | | 100.0% |
| | |
| Affiliated Equity Funds | | 1-Year
Average Annual
Total Returns
as of 6/30/10 |
Nuveen NWQ Large-Cap Value Fund (Class I) | | 16.13% |
Nuveen Santa Barbara Growth Fund (Class I) | | 10.93% |
Nuveen Symphony Large-Cap Growth Fund (Class I) | | 20.26% |
Nuveen Tradewinds Global Resources Fund (Class I) | | 20.30% |
Nuveen Tradewinds International Value Fund (Class I) | | 4.77% |
Nuveen Tradewinds Value Opportunities Fund (Class I) | | 23.48% |
Nuveen U.S. Equity Completeness Fund | | 13.25% |
Nuveen Winslow Large-Cap Growth Fund (Class I) | | 10.33% |
| |
| Non-Affiliated Equity Funds | | |
iShares Dow Jones U.S. Real Estate Index Fund | | 50.80% |
iShares MSCI EAFE Growth Index Fund | | 8.40% |
iShares MSCI Emerging Markets Index Fund | | 19.11% |
| |
| Affiliated Fixed Income Funds | | |
Nuveen High Yield Bond Fund (Class I) | | 24.27% |
Nuveen Multi-Strategy Core Bond Fund (Class I) | | 11.23% |
Nuveen Short Duration Bond Fund (Class I) | | 5.40% |
| |
| Non-Affiliated Fixed Income Funds | | |
iShares Barclays U.S. Treasury Inflation Protected Securities Index Fund | | 9.36% |
| 1 | As a percentage of total investments as of June 30, 2010. Holdings are subject to change. |
Expense Example
As a shareholder of the Fund, you incur two types of costs: (1) transaction costs, including front- and back-end sales charges (loads) or redemption fees, where applicable; and (2) ongoing costs, including management fees; distribution and service (12b-1) fees, where applicable; and other Fund expenses. This Example is intended to help you understand your ongoing costs (in dollars) of investing in the Fund and to compare these costs with the ongoing costs of investing in other mutual funds.
The Example below is based on an investment of $1,000 invested at the beginning of the period and held for the period.
The information under “Actual Performance,” together with the amount you invested, allows you to estimate actual expenses incurred over the reporting period. Simply divide your account value by $1,000 (for example, an $8,600 account value divided by $1,000 = 8.60) and multiply the result by the cost shown for your share class, in the row entitled “Expenses Incurred During Period” to estimate the expenses incurred on your account during this period.
The information under “Hypothetical Performance,” provides information about hypothetical account values and hypothetical expenses based on the Fund’s actual expense ratio and an assumed rate of return of 5% per year before expenses, which is not the Fund’s actual return. The hypothetical account values and expenses may not be used to estimate the actual ending account balance or expense you incurred for the period. You may use this information to compare the ongoing costs of investing in the Fund and other Funds. To do so, compare this 5% hypothetical example with the 5% hypothetical examples that appear in the shareholder reports of the other funds.
Please note that the expenses shown in the table are meant to highlight your ongoing costs only and do not reflect any transactional costs, such as front- and back-end sales charges (loads) or redemption fees, where applicable. Therefore, the hypothetical information is useful in comparing ongoing costs only, and will not help you determine the relative total costs of owning different funds or share classes. In addition, if these transactional costs were included, your costs would have been higher.
| | | | | | | | | | | | | | | | | | | | | | | | | | | | | | | | |
| | | | | | | Hypothetical Performance |
| | | Actual Performance | | | | (5% return before expenses) |
| | | A Shares | | B Shares | | C Shares | | R3 Shares | | I Shares | | | | A Shares | | B Shares | | C Shares | | R3 Shares | | I Shares |
| Beginning Account Value (1/01/10) | | $ | 1,000.00 | | $ | 1,000.00 | | $ | 1,000.00 | | $ | 1,000.00 | | $ | 1,000.00 | | | | $ | 1,000.00 | | $ | 1,000.00 | | $ | 1,000.00 | | $ | 1,000.00 | | $ | 1,000.00 |
| Ending Account Value (6/30/10) | | $ | 995.50 | | $ | 992.00 | | $ | 992.00 | | $ | 994.40 | | $ | 997.20 | | | | $ | 1,021.72 | | $ | 1,018.00 | | $ | 1,018.00 | | $ | 1,020.48 | | $ | 1,022.96 |
| Expenses Incurred During Period | | $ | 3.07 | | $ | 6.77 | | $ | 6.77 | | $ | 4.30 | | $ | 1.83 | | | | $ | 3.11 | | $ | 6.85 | | $ | 6.85 | | $ | 4.36 | | $ | 1.86 |
For each class of the Fund, expenses are equal to the Fund’s annualized net expense ratio of 0.62%, 1.37%, 1.37%, 0.87% and 0.37% for Classes A, B, C, R3 and I, respectively, multiplied by the average account value over the period, multiplied by 181/365 (to reflect the one-half year period).
Report of
Independent Registered Public Accounting Firm
To the Board of Trustees and Shareholders of
Nuveen Investment Trust:
In our opinion, the accompanying statement of assets and liabilities, including the portfolios of investments, and the related statements of operations, of changes in net assets and the financial highlights present fairly, in all material respects, the financial position of Nuveen Growth Allocation Fund, Nuveen Moderate Allocation Fund, and Nuveen Conservative Allocation (each a series of the Nuveen Investment Trust, hereafter referred to as the “Funds”) at June 30, 2010, the results of their operations for the year then ended, the changes in their net assets for each of the two years in the period then ended and the financial highlights for the periods presented in conformity with accounting principles generally accepted in the United States of America. These financial statements and financial highlights (hereafter referred to as “financial statements”) are the responsibility of the Funds’ management; our responsibility is to express an opinion on these financial statements based on our audits. We conducted our audits of these financial statements in accordance with the standards of the Public Company Accounting Oversight Board (United States). Those standards require that we plan and perform the audit to obtain reasonable assurance about whether the financial statements are free of material misstatement. An audit includes examining, on a test basis, evidence supporting the amounts and disclosures in the financial statements, assessing the accounting principles used and significant estimates made by management, and evaluating the overall financial statement presentation. We believe that our audits, which included confirmation of securities at June 30, 2010 by correspondence with the custodian and brokers, provide a reasonable basis for our opinion.
PRICEWATERHOUSECOOPERS LLP
Chicago, IL
August 25, 2010
Portfolio of Investments
Nuveen Growth Allocation Fund
June 30, 2010
| | | | | | | | | | | | |
| Shares | | Description (1) | | | | | | | | Value |
| | | | | | | | | | | | |
| | | EQUITY FUNDS – 74.9% | | | | | | | | | |
| | | | | |
| | | Affiliated Equity Funds – 42.8% | | | | | | | | | |
| | | | | |
| | 26,019 | | Nuveen NWQ Large-Cap Value Fund (Class I) | | | | | | | | $ | 383,782 |
| | | | | |
| | 8,432 | | Nuveen Santa Barbara Growth Fund (Class I) | | | | | | | | | 137,698 |
| | | | | |
| | 27,008 | | Nuveen Symphony Large-Cap Growth Fund (Class I) | | | | | | | | | 500,188 |
| | | | | |
| | 12,742 | | Nuveen Tradewinds Global Resources Fund (Class I) | | | | | | | | | 252,038 |
| | | | | |
| | 49,804 | | Nuveen Tradewinds International Value Fund (Class I) | | | | | | | | | 1,100,669 |
| | | | | |
| | 11,044 | | Nuveen Tradewinds Value Opportunities Fund (Class I) | | | | | | | | | 329,888 |
| | | | | |
| | 40,737 | | Nuveen U.S. Equity Completeness Fund, (2) | | | | | | | | | 642,825 |
| | | | | |
| | 9,465 | | Nuveen Winslow Large-Cap Growth Fund (Class I) | | | | | | | | | 221,190 |
| | | Total Affiliated Equity Funds (cost $4,021,651) | | | | | | | | | 3,568,278 |
| | | Non-Affiliated Equity Funds – 32.1% | | | | | | | | | |
| | | | | |
| | 8,585 | | iShares Dow Jones U.S. Real Estate Index Fund | | | | | | | | | 405,298 |
| | | | | |
| | 21,785 | | iShares MSCI EAFE Growth Index Fund | | | | | | | | | 1,047,205 |
| | | | | |
| | 32,780 | | iShares MSCI Emerging Markets Index Fund | | | | | | | | | 1,223,349 |
| | | Total Non-Affiliated Equity Funds (cost $2,626,044) | | | | | | | | | 2,675,852 |
| | | Total Equity Funds (cost $6,647,695) | | | | | | | | | 6,244,130 |
| | | FIXED INCOME FUNDS – 22.9% | | | | | | | | | |
| | | | | |
| | | Affiliated Fixed Income Funds – 18.7% | | | | | | | | | |
| | | | | |
| | 62,942 | | Nuveen High Yield Bond Fund (Class I) | | | | | | | | | 1,039,804 |
| | | | | |
| | 16,715 | | Nuveen Multi-Strategy Core Bond Fund (Class I) | | | | | | | | | 347,001 |
| | | | | |
| | 8,730 | | Nuveen Short Duration Bond Fund (Class I) | | | | | | | | | 170,582 |
| | | Total Affiliated Fixed Income Funds (cost $1,315,087) | | | | | | | | | 1,557,387 |
| | | Non-Affiliated Fixed Income Funds – 4.2% | | | | | | | | | |
| | | | | |
| | 3,320 | | iShares Barclays U.S. Treasury Inflation Protected Securities Index Fund | | | | | | | | | 354,941 |
| | | Total Non-Affiliated Fixed Income Funds (cost $341,405) | | | | | | | | | 354,941 |
| | | Total Fixed Income Funds (cost $1,656,492) | | | | | | | | | 1,912,328 |
| | | | | |
Principal
Amount (000) | | Description (1) | | | | Coupon | | Maturity | | Value |
| | | SHORT-TERM INVESTMENTS – 2.4% | | | | | | | | | |
| | | | | |
| $ | 200 | | Repurchase Agreement with Fixed Income Clearing Corporation, dated 6/30/10, repurchase price $200,099, collateralized by $205,000 U.S. Treasury Notes, 2.500%, due 6/30/17, value $204,231 | | | | 0.000% | | 7/01/10 | | $ | 200,099 |
| | | Total Short-Term Investments (cost $200,099) | | | | | | | | | 200,099 |
| | | Total Investments (cost $8,504,286) – 100.2% | | | | | | | | | 8,356,557 |
| | | Other Assets Less Liabilities – (0.2)% | | | | | | | | | (15,311) |
| | | Net Assets – 100% | | | | | | | | $ | 8,341,246 |
| | (1) | | All percentages shown in the Portfolio of Investments are based on net assets. |
| | (2) | | For fair value measurement disclosure purposes, Nuveen U.S. Equity Completeness Fund categorized as Level 2, as it is not publicly available to shareholders and may only be purchased by the Nuveen Conservative Allocation Fund, Nuveen Moderate Allocation Fund and Nuveen Growth Allocation Fund. See Notes to Financial Statements, Footnote 1– General Information and Significant Accounting Policies, Investment Valuation for more information. |
See accompanying notes to financial statements.
Portfolio of Investments
Nuveen Moderate Allocation Fund
June 30, 2010
| | | | | | | | | | | | |
| Shares | | Description (1) | | | | | | | | Value |
| | | | | | | | | | | | |
| | | EQUITY FUNDS – 56.1% | | | | | | | | | |
| | | | | |
| | | Affiliated Equity Funds – 34.6% | | | | | | | | | |
| | | | | |
| | 125,959 | | Nuveen NWQ Large-Cap Value Fund (Class I) | | | | | | | | $ | 1,857,902 |
| | | | | |
| | 40,140 | | Nuveen Santa Barbara Growth Fund (Class I) | | | | | | | | | 655,478 |
| | | | | |
| | 138,809 | | Nuveen Symphony Large-Cap Growth Fund (Class I) | | | | | | | | | 2,570,736 |
| | | | | |
| | 46,099 | | Nuveen Tradewinds Global Resources Fund (Class I) | | | | | | | | | 911,831 |
| | | | | |
| | 172,341 | | Nuveen Tradewinds International Value Fund (Class I) | | | | | | | | | 3,808,734 |
| | | | | |
| | 54,386 | | Nuveen Tradewinds Value Opportunities Fund (Class I) | | | | | | | | | 1,624,498 |
| | | | | |
| | 203,913 | | Nuveen U.S. Equity Completeness Fund, (2) | | | | | | | | | 3,217,749 |
| | | | | |
| | 44,861 | | Nuveen Winslow Large-Cap Growth Fund (Class I) | | | | | | | | | 1,048,403 |
| | | Total Affiliated Equity Funds (cost $17,109,100) | | | | | | | | | 15,695,331 |
| | | Non-Affiliated Equity Funds – 21.5% | | | | | | | | | |
| | | | | |
| | 28,750 | | iShares Dow Jones U.S. Real Estate Index Fund | | | | | | | | | 1,357,288 |
| | | | | |
| | 74,365 | | iShares MSCI EAFE Growth Index Fund | | | | | | | | | 3,574,726 |
| | | | | |
| | 130,005 | | iShares MSCI Emerging Markets Index Fund | | | | | | | | | 4,851,787 |
| | | Total Non-Affiliated Equity Funds (cost $8,620,311) | | | | | | | | | 9,783,801 |
| | | Total Equity Funds (cost $25,729,411) | | | | | | | | | 25,479,132 |
| | | FIXED INCOME FUNDS – 40.9% | | | | | | | | | |
| | | | | |
| | | Affiliated Fixed Income Funds – 28.4% | | | | | | | | | |
| | | | | |
| | 420,243 | | Nuveen High Yield Bond Fund (Class I) | | | | | | | | | 6,942,411 |
| | | | | |
| | 159,488 | | Nuveen Multi-Strategy Core Bond Fund (Class I) | | | | | | | | | 3,310,964 |
| | | | | |
| | 134,839 | | Nuveen Short Duration Bond Fund (Class I) | | | | | | | | | 2,634,759 |
| | | Total Affiliated Fixed Income Funds (cost $11,728,584) | | | | | | | | | 12,888,134 |
| | | Non-Affiliated Fixed Income Funds – 12.5% | | | | | | | | | |
| | | | | |
| | 52,965 | | iShares Barclays U.S. Treasury Inflation Protected Securities Index Fund | | | | | | | | | 5,662,488 |
| | | Total Non-Affiliated Fixed Income Funds (cost $5,515,383) | | | | | | | | | 5,662,488 |
| | | Total Fixed Income Funds (cost $17,243,967) | | | | | | | | | 18,550,622 |
| | | | | |
Principal
Amount (000) | | Description (1) | | | | Coupon | | Maturity | | Value |
| | | SHORT-TERM INVESTMENTS – 1.2% | | | | | | | | | |
| | | | | |
| $ | 553 | | Repurchase Agreement with Fixed Income Clearing Corporation, dated 6/30/10, repurchase price $552,846, collateralized by $540,000 U.S. Treasury Notes, 3.000%, due 2/28/17, value $564,975 | | | | 0.000% | | 7/01/10 | | $ | 552,846 |
| | | Total Short-Term Investments (cost $552,846) | | | | | | | | | 552,846 |
| | | Total Investments (cost $43,526,224) – 98.2% | | | | | | | | | 44,582,600 |
| | | Other Assets Less Liabilities – 1.8% | | | | | | | | | 807,599 |
| | | Net Assets – 100% | | | | | | | | $ | 45,390,199 |
| | (1) | | All percentages shown in the Portfolio of Investments are based on net assets. |
| | (2) | | For fair value measurement disclosure purposes, Nuveen U.S. Equity Completeness Fund categorized as Level 2, as it is not publicly available to shareholders and may only be purchased by the Nuveen Conservative Allocation Fund, Nuveen Moderate Allocation Fund and Nuveen Growth Allocation Fund. See Notes to Financial Statements, Footnote 1– General Information and Significant Accounting Policies, Investment Valuation for more information. |
See accompanying notes to financial statements.
Portfolio of Investments
Nuveen Conservative Allocation Fund
June 30, 2010
| | | | | | | | | | | | |
| Shares | | Description (1) | | | | | | | | Value |
| | | | | | | | | | | | |
| | | EQUITY FUNDS – 35.5% | | | | | | | | | |
| | | | | |
| | | Affiliated Equity Funds – 23.1% | | | | | | | | | |
| | | | | |
| | 82,760 | | Nuveen NWQ Large-Cap Value Fund (Class I) | | | | | | | | $ | 1,220,709 |
| | | | | |
| | 27,154 | | Nuveen Santa Barbara Growth Fund (Class I) | | | | | | | | | 443,424 |
| | | | | |
| | 91,852 | | Nuveen Symphony Large-Cap Growth Fund (Class I) | | | | | | | | | 1,701,098 |
| | | | | |
| | 64,397 | | Nuveen Tradewinds Global Resources Fund (Class I) | | | | | | | | | 1,273,763 |
| | | | | |
| | 87,865 | | Nuveen Tradewinds International Value Fund (Class I) | | | | | | | | | 1,941,811 |
| | | | | |
| | 35,558 | | Nuveen Tradewinds Value Opportunities Fund (Class I) | | | | | | | | | 1,062,118 |
| | | | | |
| | 135,445 | | Nuveen U.S. Equity Completeness Fund, (2) | | | | | | | | | 2,137,316 |
| | | | | |
| | 30,309 | | Nuveen Winslow Large-Cap Growth Fund (Class I) | | | | | | | | | 708,331 |
| | | Total Affiliated Equity Funds (cost $11,158,257) | | | | | | | | | 10,488,570 |
| | | Non-Affiliated Equity Funds – 12.4% | | | | | | | | | |
| | | | | |
| | 28,275 | | iShares Dow Jones U.S. Real Estate Index Fund | | | | | | | | | 1,334,863 |
| | | | | |
| | 38,060 | | iShares MSCI EAFE Growth Index Fund | | | | | | | | | 1,829,544 |
| | | | | |
| | 66,340 | | iShares MSCI Emerging Markets Index Fund | | | | | | | | | 2,475,809 |
| | | Total Non-Affiliated Equity Funds (cost $5,142,749) | | | | | | | | | 5,640,216 |
| | | Total Equity Funds (cost $16,301,006) | | | | | | | | | 16,128,786 |
| | | FIXED INCOME FUNDS – 62.1% | | | | | | | | | |
| | | | | |
| | | Affiliated Fixed Income Funds – 47.5% | | | | | | | | | |
| | | | | |
| | 338,094 | | Nuveen High Yield Bond Fund (Class I) | | | | | | | | | 5,585,316 |
| | | | | |
| | 391,407 | | Nuveen Multi-Strategy Core Bond Fund (Class I) | | | | | | | | | 8,125,612 |
| | | | | |
| | 403,414 | | Nuveen Short Duration Bond Fund (Class I) | | | | | | | | | 7,882,708 |
| | | Total Affiliated Fixed Income Funds (cost $20,383,502) | | | | | | | | | 21,593,636 |
| | | Non-Affiliated Fixed Income Funds – 14.6% | | | | | | | | | |
| | | | | |
| | 62,020 | | iShares Barclays U.S. Treasury Inflation Protected Securities Index Fund | | | | | | | | | 6,630,558 |
| | | Total Non-Affiliated Fixed Income Funds (cost $6,548,171) | | | | | | | | | 6,630,558 |
| | | Total Fixed Income Funds (cost $26,931,673) | | | | | | | | | 28,224,194 |
| | | | | |
Principal
Amount (000) | | Description (1) | | | | Coupon | | Maturity | | Value |
| | | SHORT-TERM INVESTMENTS – 2.4% | | | | | | | | | |
| | | | | |
| $ | 1,068 | | Repurchase Agreement with Fixed Income Clearing Corporation, dated 6/30/10, repurchase price $1,068,163, collateralized by $1,045,000 U.S. Treasury Notes, 3.000%, due 2/28/17, value $1,093,331 | | | | 0.000% | | 7/01/10 | | $ | 1,068,163 |
| | | Total Short-Term Investments (cost $1,068,163) | | | | | | | | | 1,068,163 |
| | | Total Investments (cost $44,300,842) – 100.0% | | | | | | | | | 45,421,143 |
| | | Other Assets Less Liabilities – 0.0% | | | | | | | | | 4,333 |
| | | Net Assets – 100% | | | | | | | | $ | 45,425,476 |
| | (1) | | All percentages shown in the Portfolio of Investments are based on net assets. |
| | (2) | | For fair value measurement disclosure purposes, Nuveen U.S. Equity Completeness Fund categorized as Level 2, as it is not publicly available to shareholders and may only be purchased by the Nuveen Conservative Allocation Fund, Nuveen Moderate Allocation Fund and Nuveen Growth Allocation Fund. See Notes to Financial Statements, Footnote 1– General Information and Significant Accounting Policies, Investment Valuation for more information. |
See accompanying notes to financial statements.
Statement of Assets and Liabilities
June 30, 2010
| | | | | | | | | | | | |
| | | Growth
Allocation | | | Moderate
Allocation | | | Conservative
Allocation | |
Assets | | | | | | | | | | | | |
Affiliated investments, at value (cost $5,336,738, $28,837,684 and $31,541,759, respectively) | | $ | 5,125,665 | | | $ | 28,583,465 | | | $ | 32,082,206 | |
Non-affiliated investments, at value (cost $3,167,548, $14,688,540 and $12,759,083, respectively) | | | 3,230,892 | | | | 15,999,135 | | | | 13,338,937 | |
Receivables: | | | | | | | | | | | | |
Dividends | | | 9,839 | | | | 75,907 | | | | 104,990 | |
From Adviser | | | 22,427 | | | | 5,886 | | | | — | |
Investments sold | | | — | | | | 575,505 | | | | — | |
Reclaims | | | 834 | | | | 6,058 | | | | 5,489 | |
Shares sold | | | 5,801 | | | | 251,280 | | | | 51,625 | |
Other assets | | | 11 | | | | 11,998 | | | | 20,592 | |
Total assets | | | 8,395,469 | | | | 45,509,234 | | | | 45,603,839 | |
Liabilities | | | | | | | | | | | | |
Payable for shares redeemed | | | 764 | | | | 7,302 | | | | 63,727 | |
Accrued expenses: | | | | | | | | | | | | |
Management fees | | | — | | | | — | | | | 3,381 | |
12b-1 distribution and service fees | | | 3,355 | | | | 12,721 | | | | 14,889 | |
Other | | | 50,104 | | | | 99,012 | | | | 96,366 | |
Total liabilities | | | 54,223 | | | | 119,035 | | | | 178,363 | |
Net assets | | $ | 8,341,246 | | | $ | 45,390,199 | | | $ | 45,425,476 | |
Class A Shares | | | | | | | | | | | | |
Net assets | | $ | 1,477,516 | | | $ | 25,189,584 | | | $ | 34,943,439 | |
Shares outstanding | | | 75,171 | | | | 1,194,959 | | | | 1,583,005 | |
Net asset value per share | | $ | 19.66 | | | $ | 21.08 | | | $ | 22.07 | |
Offering price per share (net asset value per share plus maximum sales charge of 5.75% of offering price) | | $ | 20.86 | | | $ | 22.37 | | | $ | 23.42 | |
Class B Shares | | | | | | | | | | | | |
Net assets | | $ | 411,308 | | | $ | 2,421,228 | | | $ | 1,030,776 | |
Shares outstanding | | | 21,272 | | | | 114,900 | | | | 43,552 | |
Net asset value and offering price per share | | $ | 19.34 | | | $ | 21.07 | | | $ | 23.67 | |
Class C Shares | | | | | | | | | | | | |
Net assets | | $ | 3,095,163 | | | $ | 6,354,009 | | | $ | 8,034,140 | |
Shares outstanding | | | 159,917 | | | | 301,134 | | | | 339,875 | |
Net asset value and offering price per share | | $ | 19.35 | | | $ | 21.10 | | | $ | 23.64 | |
Class R3 Shares | | | | | | | | | | | | |
Net assets | | $ | 132,931 | | | $ | 142,465 | | | $ | 145,461 | |
Shares outstanding | | | 6,738 | | | | 6,757 | | | | 6,769 | |
Net asset value and offering price per share | | $ | 19.73 | | | $ | 21.08 | | | $ | 21.49 | |
Class I Shares | | | | | | | | | | | | |
Net assets | | $ | 3,224,328 | | | $ | 11,282,913 | | | $ | 1,271,660 | |
Shares outstanding | | | 163,725 | | | | 535,224 | | | | 59,209 | |
Net asset value and offering price per share | | $ | 19.69 | | | $ | 21.08 | | | $ | 21.48 | |
Net Assets Consist of: | | | | | | | | | | | | |
Capital paid-in | | $ | 10,747,444 | | | $ | 48,389,993 | | | $ | 48,153,629 | |
Undistributed (Over-distribution of) net investment income | | | 156,003 | | | | 628,884 | | | | 1,382,075 | |
Accumulated net realized gain (loss) | | | (2,414,228 | ) | | | (4,685,054 | ) | | | (5,230,529 | ) |
Net unrealized appreciation (depreciation) | | | (147,973 | ) | | | 1,056,376 | | | | 1,120,301 | |
Net assets | | $ | 8,341,246 | | | $ | 45,390,199 | | | $ | 45,425,476 | |
Authorized shares Par value per share | |
$ | Unlimited
0.01 |
| |
$ | Unlimited
0.01 |
| |
$ | Unlimited
0.01 |
|
| | | | | | | | | | | | |
See accompanying notes to financial statements.
Statement of Operations
Year Ended June 30, 2010
| | | | | | | | | | | | |
| | | Growth
Allocation | | | Moderate
Allocation | | | Conservative
Allocation | |
Investment Income | | | | | | | | | | | | |
Dividends from affiliated investments | | $ | 178,266 | | | $ | 1,023,596 | | | $ | 1,406,407 | |
Dividends from non-affiliated investments and interest | | | 76,644 | | | | 366,346 | | | | 339,563 | |
Total investment income | | | 254,910 | | | | 1,389,942 | | | | 1,745,970 | |
Expenses | | | | | | | | | | | | |
Management fees | | | 14,170 | | | | 65,956 | | | | 70,507 | |
12b-1 service fees – Class A | | | 4,726 | | | | 62,886 | | | | 92,320 | |
12b-1 distribution and service fees – Class B | | | 4,452 | | | | 28,637 | | | | 14,093 | |
12b-1 distribution and service fees – Class C | | | 36,349 | | | | 57,808 | | | | 76,749 | |
12b-1 distribution and service fees – Class R3 | | | 679 | | | | 723 | | | | 731 | |
Shareholders’ servicing agent fees and expenses | | | 18,812 | | | | 59,556 | | | | 46,338 | |
Custodian’s fees and expenses | | | 5,070 | | | | 10,765 | | | | 11,878 | |
Trustees’ fees and expenses | | | 85 | | | | 360 | | | | 290 | |
Professional fees | | | 20,764 | | | | 20,676 | | | | 30,406 | |
Shareholders’ reports – printing and mailing expenses | | | 14,279 | | | | 41,756 | | | | 34,308 | |
Federal and state registration fees | | | 50,413 | | | | 50,616 | | | | 47,690 | |
Other expenses | | | 3,132 | | | | 4,160 | | | | 4,371 | |
Total expenses before expense reimbursement | | | 172,931 | | | | 403,899 | | | | 429,681 | |
Expense reimbursement | | | (88,945 | ) | | | (126,332 | ) | | | (71,998 | ) |
Net expenses | | | 83,986 | | | | 277,567 | | | | 357,683 | |
Net investment income | | | 170,924 | | | | 1,112,375 | | | | 1,388,287 | |
Realized and Unrealized Gain (Loss) | | | | | | | | | | | | |
Net realized gain (loss) from: | | | | | | | | | | | | |
Affiliated investments | | | (136,323 | ) | | | (151,442 | ) | | | (155,578 | ) |
Non-affiliated investments | | | (90,215 | ) | | | (278,316 | ) | | | (372,301 | ) |
Total net realized gain (loss) | | | (226,538 | ) | | | (429,758 | ) | | | (527,879 | ) |
Change in net unrealized appreciation (depreciation) of: | | | | | | | | | | | | |
Affiliated investments | | | 793,973 | | | | 2,593,307 | | | | 2,771,389 | |
Non-affiliated investments | | | 467,777 | | | | 1,735,770 | | | | 1,933,531 | |
Total change in net unrealized appreciation (depreciation) | | | 1,261,750 | | | | 4,329,077 | | | | 4,704,920 | |
Net realized and unrealized gain (loss) | | | 1,035,212 | | | | 3,899,319 | | | | 4,177,041 | |
Net increase (decrease) in net assets from operations | | $ | 1,206,136 | | | $ | 5,011,694 | | | $ | 5,565,328 | |
See accompanying notes to financial statements.
Statement of Changes in Net Assets
| | | | | | | | |
| | | Growth Allocation (1) | |
| | | Year Ended
6/30/10 | | | Year Ended
6/30/09 | |
Operations | | | | | | | | |
Net investment income | | $ | 170,924 | | | $ | 264,049 | |
Total net realized gain (loss) | | | (226,538 | ) | | | (2,207,748 | ) |
Total change in net unrealized appreciation (depreciation) | | | 1,261,750 | | | | (978,231 | ) |
Net increase (decrease) in net assets from operations | | | 1,206,136 | | | | (2,921,930 | ) |
Distributions to Shareholders | | | | | | | | |
From net investment income: | | | | | | | | |
Class A | | | (41,424 | ) | | | (6,103 | ) |
Class B | | | (6,798 | ) | | | — | |
Class C | | | (58,777 | ) | | | — | |
Class R3 | | | (2,707 | ) | | | (9 | ) |
Class I | | | (95,767 | ) | | | (20,152 | ) |
From accumulated net realized gains: | | | | | | | | |
Class A | | | — | | | | (115,060 | ) |
Class B | | | — | | | | (26,345 | ) |
Class C | | | — | | | | (245,868 | ) |
Class R3 | | | — | | | | (7,527 | ) |
Class I | | | — | | | | (199,754 | ) |
Decrease in net assets from distributions to shareholders | | | (205,473 | ) | | | (620,818 | ) |
Fund Share Transactions | | | | | | | | |
Proceeds from sale of shares | | | 1,875,121 | | | | 1,315,813 | |
Proceeds from shares issued to shareholders due to
reinvestment of distributions | | | 124,234 | | | | 387,345 | |
| | | 1,999,355 | | | | 1,703,158 | |
Cost of shares redeemed | | | (3,296,958 | ) | | | (4,019,656 | ) |
Net increase (decrease) in net assets from Fund share transactions | | | (1,297,603 | ) | | | (2,316,498 | ) |
Net increase (decrease) in net assets | | | (296,940 | ) | | | (5,859,246 | ) |
Net assets at the beginning of year | | | 8,638,186 | | | | 14,497,432 | |
Net assets at the end of year | | $ | 8,341,246 | | | $ | 8,638,186 | |
Undistributed (Over-distribution of) net investment income at the
end of year | | $ | 156,003 | | | $ | 205,950 | |
(1) Prior to August 1, 2008, the Fund was known as Nuveen Global Value Fund.
See accompanying notes to financial statements.
Statement of Changes in Net Assets
| | | | | | | | | | | | | | | | |
| | | Moderate Allocation (2) | | | Conservative Allocation (3) | |
| | | Year Ended
6/30/10 | | | Year Ended
6/30/09 | | | Year Ended
6/30/10 | | | Year Ended
6/30/09 | |
Operations | | | | | | | | | | | | | | | | |
Net investment income | | $ | 1,112,375 | | | $ | 1,355,811 | | | $ | 1,388,287 | | | $ | 2,015,879 | |
Total net realized gain (loss) | | | (429,758 | ) | | | (3,791,560 | ) | | | (527,879 | ) | | | (4,503,189 | ) |
Total change in net unrealized appreciation (depreciation) | | | 4,329,077 | | | | (4,115,576 | ) | | | 4,704,920 | | | | (2,986,071 | ) |
Net increase (decrease) in net assets from operations | | | 5,011,694 | | | | (6,551,325 | ) | | | 5,565,328 | | | | (5,473,381 | ) |
Distributions to Shareholders | | | | | | | | | | | | | | | | |
From net investment income: | | | | | | | | | | | | | | | | |
Class A | | | (672,528 | ) | | | (416,933 | ) | | | (1,297,304 | ) | | | (698,165 | ) |
Class B | | | (55,689 | ) | | | (38,487 | ) | | | (41,526 | ) | | | (25,577 | ) |
Class C | | | (112,259 | ) | | | (53,396 | ) | | | (221,070 | ) | | | (66,243 | ) |
Class R3 | | | (3,573 | ) | | | (2,011 | ) | | | (4,893 | ) | | | (1,799 | ) |
Class I | | | (307,372 | ) | | | (164,574 | ) | | | (19,969 | ) | | | (11,104 | ) |
From accumulated net realized gains: | | | | | | | | | | | | | | | | |
Class A | | | — | | | | (543,190 | ) | | | — | | | | (897,527 | ) |
Class B | | | — | | | | (89,182 | ) | | | — | | | | (57,601 | ) |
Class C | | | — | | | | (123,859 | ) | | | — | | | | (152,912 | ) |
Class R3 | | | — | | | | (3,117 | ) | | | — | | | | (3,253 | ) |
Class I | | | — | | | | (187,599 | ) | | | — | | | | (13,800 | ) |
Decrease in net assets from distributions to shareholders | | | (1,151,421 | ) | | | (1,622,348 | ) | | | (1,584,762 | ) | | | (1,927,981 | ) |
Fund Share Transactions | | | | | | | | | | | | | | | | |
Proceeds from sale of shares | | | 15,999,993 | | | | 3,611,691 | | | | 5,011,319 | | | | 4,028,251 | |
Proceeds from shares issued to shareholders due to
reinvestment of distributions | | | 821,617 | | | | 1,247,934 | | | | 1,184,288 | | | | 1,411,246 | |
| | | 16,821,610 | | | | 4,859,625 | | | | 6,195,607 | | | | 5,439,497 | |
Cost of shares redeemed | | | (10,629,089 | ) | | | (13,423,543 | ) | | | (8,982,212 | ) | | | (19,625,123 | ) |
Net increase (decrease) in net assets from Fund share transactions | | | 6,192,521 | | | | (8,563,918 | ) | | | (2,786,605 | ) | | | (14,185,626 | ) |
Net increase (decrease) in net assets | | | 10,052,794 | | | | (16,737,591 | ) | | | 1,193,961 | | | | (21,586,988 | ) |
Net assets at the beginning of year | | | 35,337,405 | | | | 52,074,996 | | | | 44,231,515 | | | | 65,818,503 | |
Net assets at the end of year | | $ | 45,390,199 | | | $ | 35,337,405 | | | $ | 45,425,476 | | | $ | 44,231,515 | |
Undistributed (Over-distribution of) net investment income at the end of year | | $ | 628,884 | | | $ | 696,819 | | | $ | 1,382,075 | | | $ | 1,585,855 | |
(2) Prior to August 1, 2008, the Fund was known as Nuveen Balanced Stock and Bond Fund.
(3) Prior to July 7, 2008, the Fund was known as Nuveen Balanced Municipal and Stock Fund.
See accompanying notes to financial statements.
Notes to Financial Statements
1. General Information and Significant Accounting Policies
The Nuveen Investment Trust (the “Trust”) is an open-end management investment company registered under the Investment Company Act of 1940, as amended. The Trust is comprised of Nuveen Growth Allocation Fund (“Growth Allocation”), Nuveen Moderate Allocation Fund (“Moderate Allocation”) and Nuveen Conservative Allocation Fund (“Conservative Allocation”) (collectively, the “Funds”), among others. The Trust was organized as a Massachusetts business trust in 1996.
Each Fund is a “fund of funds” that primarily invests in shares of other registered investment companies, including open-end mutual funds and exchange-traded funds (collectively, the “Underlying Funds”). Each Fund’s assets are allocated among broad asset classes through investment in a combination of the Underlying Funds. The Underlying Funds, in turn, invest in a variety of U.S. and non-U.S. equity and fixed income securities. Each Fund will have a strategic allocation between equity and fixed income investments that correlates with its risk profile. Nuveen Asset Management (the “Adviser”), a wholly-owned subsidiary of Nuveen Investments, Inc. (“Nuveen”), has selected Nuveen Investment Solutions, Inc. (“NIS”) (formerly, Richards & Tierney, Inc.), also a wholly-owned subsidiary of Nuveen, to serve as sub-adviser to the Funds. NIS will adjust portfolio allocations from time to time consistent with each Fund’s risk profile in its effort to produce performance consistent with its investment objective. Each Fund primarily invests in Underlying Funds within the Nuveen family of funds.
Growth Allocation’s investment objective is to provide attractive long-term total return. The Fund pursues this objective with a growth risk profile.
Moderate Allocation’s investment objective is to provide attractive long-term total return with a moderate risk profile.
Conservative Allocation’s investment objective is to provide attractive long-term total return with a conservative risk profile.
In June 2009, the Financial Accounting Standards Board (“FASB”) established the FASB Accounting Standards CodificationTM (the “Codification”) as the single source of authoritative accounting principles recognized by the FASB in the preparation of financial statements in conformity with generally accepted accounting principles (“GAAP”). The Codification supersedes existing non-grandfathered, non-SEC accounting and reporting standards. The Codification did not change GAAP but rather organized it into a hierarchy where all guidance within the Codification carries an equal level of authority. The Codification became effective for financial statements issued for interim and annual periods ending after September 15, 2009. The Codification did not have a material effect on the Funds’ financial statements.
The following is a summary of significant accounting policies followed by the Funds in the preparation of their financial statements in accordance with accounting principles generally accepted in the United States (“U.S. GAAP”).
Investment Valuation
The affiliated Underlying Funds in which the Funds invest are valued at their respective net asset values and securities and other assets for which market quotations are available, including non-affiliated Exchange Traded Funds (“ETFs”) in which the Funds invests, are valued at the last sales price on the securities exchange on which such securities are primarily traded and are generally classified as Level 1.
Temporary investments in securities that have variable rate and demand features qualifying them as short-term investments are valued at amortized cost, which approximates market value. These securities are generally classified as Level 1.
Certain securities may not be able to be priced by the pre-established pricing methods as described above. Such securities may be valued by the Funds’ Board of Trustees or its designee at fair value. These securities generally include, but are not limited to, restricted securities (securities which may not be publicly sold without registration under the Securities Act) for which a pricing service is unable to provide a market price; securities whose trading has been formally suspended; fixed-income securities that have gone into default and for which there is no current market quotation; a security whose market price is not available from a pre-established pricing source; a security with respect to which an event has occurred that is likely to materially affect the value of the security after the market has closed but before the calculation of a Fund’s net asset value (as may be the case in non-U.S. markets on which the security is primarily traded) or make it difficult or impossible to obtain a reliable market quotation; and a security whose price, as provided by the pricing service, is not deemed to reflect the security’s fair value. As a general principle, the fair value of an issue of securities would appear to be the amount that the owner might reasonably expect to receive for them in a current sale. A variety of factors may be considered in determining the fair value of these securities, which may include consideration of the following: yields or prices of investments of comparable quality, type of issue, coupon, maturity and rating, market quotes or indications of value from security dealers, evaluations of anticipated cash flows or collateral, general market conditions and other information and analysis, including the obligor’s credit characteristics considered relevant. These securities are classified as Level 2 or as Level 3 depending on the priority of the significant inputs. Regardless of the method employed to value a particular security, all valuations are subject to review by the Funds’ Board of Trustees or its designee.
Refer to Footnote 2 – Fair Value Measurements for further details on the leveling of securities held by the Funds as of the end of the reporting period.
Investment Transactions
Investment transactions are recorded on a trade date basis. Realized gains and losses from investment transactions are determined on the specific identification method.
Investment Income
Dividend income and realized gain distributions from the Underlying Funds are recorded on the ex-dividend date, or for foreign securities, when information is available. Interest income is recorded on an accrual basis.
Income Taxes
Each Fund is a separate taxpayer for federal income tax purposes. Each Fund intends to distribute substantially all of its net investment income and net capital gains to shareholders and to otherwise comply with the requirements of Subchapter M of the Internal Revenue Code applicable to regulated investment companies. Therefore, no federal income tax provision is required.
For all open tax years and all major taxing jurisdictions, management of the Funds has concluded that there are no significant uncertain tax positions that would require recognition in the financial statements. Open tax years are those that are open for examination by taxing authorities (i.e., generally the last four tax year ends and the interim tax period since then). Furthermore, management of the Funds is also not aware of any tax positions for which it is reasonably possible that the total amounts of unrecognized tax benefits will significantly change in the next twelve months.
Dividends and Distributions to Shareholders
Dividends from net investment income and net realized capital gains from investment transactions, if any, are declared and distributed to shareholders at least annually. Furthermore, capital gains are distributed only to the extent they exceed available capital loss carryforwards.
Distributions to shareholders are recorded on the ex-dividend date. The amount and timing of distributions are determined in accordance with federal income tax regulations, which may differ from U.S. GAAP.
Flexible Sales Charge Program
Class A Shares are generally sold with an up-front sales charge and incur a .25% annual 12b-1 service fee. Class A Share purchases of $1 million or more are sold at net asset value without an up-front sales charge but may be subject to a contingent deferred sales charge (“CDSC”) if redeemed within twelve months of purchase. Class B Shares were sold without an up-front sales charge but incur a .75% annual 12b-1 distribution fee and a .25% annual 12b-1 service fee. Class B Shares are subject to a CDSC of up to 5% depending upon the length of time the shares are held by the investor (CDSC is reduced to 0% at the end of six years). Class B Shares convert to Class A Shares eight years after purchase. Class C Shares are sold without an up-front sales charge but incur a .75% annual 12b-1 distribution fee and a .25% annual 12b-1 service fee. Class C Shares are subject to a CDSC of 1% if redeemed within one year of purchase. Class R3 Shares are sold without an up-front sales charge but incur a .50% annual 12b-1 distribution and service fee. Class I Shares are not subject to any sales charge or 12b-1 distribution or service fees.
Repurchase Agreements
In connection with transactions in repurchase agreements, it is each Fund’s policy that its custodian take possession of the underlying collateral securities, the fair value of which exceeds the principal amount of the repurchase transaction, including accrued interest, at all times. If the seller defaults, and the fair value of the collateral declines, realization of the collateral may be delayed or limited.
Multiclass Operations and Allocations
Income and expenses of the Funds that are not directly attributable to a specific class of shares are prorated among the classes based on the relative net assets of each class. Expenses directly attributable to a class of shares, which presently only include 12b-1 distribution and service fees, are recorded to the specific class.
Realized and unrealized capital gains and losses of the Fund are prorated among the classes based on the relative net assets of each class.
Custodian Fee Credit
Each Fund has an arrangement with the custodian bank whereby certain custodian fees and expenses are reduced by net credits earned on each Fund’s cash on deposit with the bank. Such deposit arrangements are an alternative to overnight investments. Credits for cash balances may be offset by charges for any days on which a Fund overdraws its account at the custodian bank.
Indemnifications
Under the Trust’s organizational documents, its officers and trustees are indemnified against certain liabilities arising out of the performance of their duties to the Trust. In addition, in the normal course of business, the Trust enters into contracts that provide general indemnifications to other parties. The Trust’s maximum exposure under these arrangements is unknown as this would involve future claims that may be made against the Trust that have not yet occurred. However, the Trust has not had prior claims or losses pursuant to these contracts and expects the risk of loss to be remote.
Use of Estimates
The preparation of financial statements in conformity with U.S. GAAP requires management to make estimates and assumptions that affect the reported amounts of assets and liabilities at the date of the financial statements and the reported amounts of increases and decreases in net assets from operations during the reporting period. Actual results may differ from those estimates.
Notes to Financial Statements (continued)
2. Fair Value Measurements
In determining the value of each Fund’s investments, various inputs are used. These inputs are summarized in the three broad levels listed below:
| | |
| Level 1 – | | Quoted prices in active markets for identical securities. |
| Level 2 – | | Other significant observable inputs (including quoted prices for similar securities, interest rates, prepayment speeds, credit risk, etc.). |
| Level 3 – | | Significant unobservable inputs (including management’s assumptions in determining the fair value of investments). |
The inputs or methodologies used for valuing securities are not an indication of the risk associated with investing in those securities.
The following is a summary of each Fund’s fair value measurements as of June 30, 2010:
| | | | | | | | | | | | |
| Growth Allocation | | Level 1 | | Level 2 | | Level 3 | | Total |
Investments: | | | | | | | | | | | | |
Equity Funds* | | $ | 5,601,305 | | $ | 642,825 | | $ | — | | $ | 6,244,130 |
Fixed Income Funds | | | 1,912,328 | | | — | | | — | | | 1,912,328 |
Short-Term Investments | | | 200,099 | | | — | | | — | | | 200,099 |
Total | | $ | 7,713,732 | | $ | 642,825 | | $ | — | | $ | 8,356,557 |
| Moderate Allocation | | Level 1 | | Level 2 | | Level 3 | | Total |
Investments: | | | | | | | | | | | | |
Equity Funds* | | $ | 22,261,383 | | $ | 3,217,749 | | $ | — | | $ | 25,479,132 |
Fixed Income Funds | | | 18,550,622 | | | — | | | — | | | 18,550,622 |
Short-Term Investments | | | 552,846 | | | — | | | — | | | 552,846 |
Total | | $ | 41,364,851 | | $ | 3,217,749 | | $ | — | | $ | 44,582,600 |
| Conservative Allocation | | Level 1 | | Level 2 | | Level 3 | | Total |
Investments: | | | | | | | | | | | | |
Equity Funds* | | $ | 13,991,470 | | $ | 2,137,316 | | $ | — | | $ | 16,128,786 |
Fixed Income Funds | | | 28,224,194 | | | — | | | — | | | 28,224,194 |
Short-Term Investments | | | 1,068,163 | | | — | | | — | | | 1,068,163 |
Total | | $ | 43,283,827 | | $ | 2,137,316 | | $ | — | | $ | 45,421,143 |
| * | Refer to the Fund’s Portfolio of Investments for industry breakdown of Equity Funds classified as Level 2. |
3. Fund Shares
Transactions in Fund shares were as follows:
| | | | | | | | | | | | | | |
| | | Growth Allocation | |
| | | Year Ended
6/30/10 | | | Year Ended
6/30/09 | |
| | | Shares | | | Amount | | | Shares | | | Amount | |
Shares sold: | | | | | | | | | | | | | | |
Class A | | 12,451 | | | $ | 254,499 | | | 22,684 | | | $ | 381,631 | |
Class A – automatic conversion of Class B Shares | | 1,414 | | | | 27,920 | | | 2,327 | | | | 52,210 | |
Class B | | 499 | | | | 10,072 | | | 1,035 | | | | 18,994 | |
Class C | | 13,567 | | | | 273,199 | | | 23,026 | | | | 376,709 | |
Class R3 | | 119 | | | | 2,510 | | | 6,619 | | | | 149,998 | |
Class I | | 63,274 | | | | 1,306,921 | | | 18,761 | | | | 336,271 | |
Shares issued to shareholders due to reinvestment of distributions: | | | | | | | | | | | | | | |
Class A | | 1,616 | | | | 33,497 | | | 6,667 | | | | 100,070 | |
Class B | | 286 | | | | 5,851 | | | 1,542 | | | | 22,743 | |
Class C | | 1,954 | | | | 40,044 | | | 11,463 | | | | 169,194 | |
Class R3 | | — | | | | — | | | — | | | | — | |
Class I | | 2,161 | | | | 44,842 | | | 6,314 | | | | 95,338 | |
| | | 97,341 | | | | 1,999,355 | | | 100,438 | | | | 1,703,158 | |
Shares redeemed: | | | | | | | | | | | | | | |
Class A | | (48,956 | ) | | | (992,985 | ) | | (68,059 | ) | | | (1,241,023 | ) |
Class B | | (3,013 | ) | | | (60,608 | ) | | (2,995 | ) | | | (54,166 | ) |
Class B – automatic conversion to Class A Shares | | (1,437 | ) | | | (27,920 | ) | | (2,353 | ) | | | (52,210 | ) |
Class C | | (48,532 | ) | | | (990,208 | ) | | (99,980 | ) | | | (1,749,840 | ) |
Class R3 | | — | | | | — | | | — | | | | — | |
Class I | | (59,727 | ) | | | (1,225,237 | ) | | (53,072 | ) | | | (922,417 | ) |
| | | (161,665 | ) | | | (3,296,958 | ) | | (226,459 | ) | | | (4,019,656 | ) |
Net increase (decrease) | | (64,324 | ) | | $ | (1,297,603 | ) | | (126,021 | ) | | $ | (2,316,498 | ) |
| | | | | | | | | | | | | | |
| | | Moderate Allocation | |
| | | Year Ended
6/30/10 | | | Year Ended
6/30/09 | |
| | | Shares | | | Amount | | | Shares | | | Amount | |
Shares sold: | | | | | | | | | | | | | | |
Class A | | 320,824 | | | $ | 6,838,312 | | | 102,436 | | | $ | 1,834,279 | |
Class A – automatic conversion of Class B Shares | | 16,654 | | | | 349,383 | | | 29,602 | | | | 582,726 | |
Class B | | 5,172 | | | | 111,052 | | | 13,050 | | | | 243,195 | |
Class C | | 102,608 | | | | 2,234,838 | | | 19,715 | | | | 372,822 | |
Class R3 | | — | | | | — | | | 6,757 | | | | 150,000 | |
Class I | | 294,986 | | | | 6,466,408 | | | 23,941 | | | | 428,669 | |
Shares issued to shareholders due to reinvestment of distributions: | | | | | | | | | | | | | | |
Class A | | 24,846 | | | | 539,393 | | | 44,517 | | | | 738,267 | |
Class B | | 1,900 | | | | 41,374 | | | 5,358 | | | | 88,276 | |
Class C | | 2,149 | | | | 46,866 | | | 4,762 | | | | 78,400 | |
Class R3 | | — | | | | — | | | — | | | | — | |
Class I | | 8,948 | | | | 193,984 | | | 20,652 | | | | 342,991 | |
| | | 778,087 | | | | 16,821,610 | | | 270,790 | | | | 4,859,625 | |
Shares redeemed: | | | | | | | | | | | | | | |
Class A | | (285,652 | ) | | | (6,155,361 | ) | | (383,365 | ) | | | (6,991,944 | ) |
Class B | | (36,986 | ) | | | (790,891 | ) | | (75,050 | ) | | | (1,375,894 | ) |
Class B – automatic conversion to Class A Shares | | (16,668 | ) | | | (349,383 | ) | | (29,582 | ) | | | (582,726 | ) |
Class C | | (51,008 | ) | | | (1,094,056 | ) | | (101,891 | ) | | | (1,868,363 | ) |
Class R3 | | — | | | | — | | | — | | | | — | |
Class I | | (103,972 | ) | | | (2,239,398 | ) | | (141,726 | ) | | | (2,604,616 | ) |
| | | (494,286 | ) | | | (10,629,089 | ) | | (731,614 | ) | | | (13,423,543 | ) |
Net increase (decrease) | | 283,801 | | | $ | 6,192,521 | | | (460,824 | ) | | $ | (8,563,918 | ) |
| |
| | | Conservative Allocation | |
| | | Year Ended
6/30/10 | | | Year Ended
6/30/09 | |
| | | Shares | | | Amount | | | Shares | | | Amount | |
Shares sold: | | | | | | | | | | | | | | |
Class A | | 64,709 | | | $ | 1,429,477 | | | 79,504 | | | $ | 1,516,830 | |
Class A – automatic conversion of Class B Shares | | 12,695 | | | | 277,918 | | | 42,217 | | | | 823,945 | |
Class B | | 3,707 | | | | 88,335 | | | 14,022 | | | | 303,204 | |
Class C | | 77,397 | | | | 1,845,358 | | | 59,012 | | | | 1,193,915 | |
Class R3 | | — | | | | — | | | 6,769 | | | | 149,999 | |
Class I | | 62,604 | | | | 1,370,231 | | | 2,168 | | | | 40,358 | |
Shares issued to shareholders due to reinvestment of distributions: | | | | | | | | | | | | | | |
Class A | | 43,904 | | | | 976,421 | | | 65,040 | | | | 1,198,430 | |
Class B | | 1,297 | | | | 31,032 | | | 2,454 | | | | 48,167 | |
Class C | | 6,737 | | | | 161,004 | | | 7,544 | | | | 147,431 | |
Class R3 | | — | | | | — | | | — | | | | — | |
Class I | | 734 | | | | 15,831 | | | 960 | | | | 17,218 | |
| | | 273,784 | | | | 6,195,607 | | | 279,690 | | | | 5,439,497 | |
Shares redeemed: | | | | | | | | | | | | | | |
Class A | | (279,645 | ) | | | (6,196,925 | ) | | (756,055 | ) | | | (15,105,375 | ) |
Class B | | (29,273 | ) | | | (695,626 | ) | | (39,958 | ) | | | (853,943 | ) |
Class B – automatic conversion to Class A Shares | | (11,842 | ) | | | (277,918 | ) | | (39,336 | ) | | | (823,945 | ) |
Class C | | (50,787 | ) | | | (1,205,324 | ) | | (95,838 | ) | | | (1,982,801 | ) |
Class R3 | | — | | | | — | | | — | | | | — | |
Class I | | (28,076 | ) | | | (606,419 | ) | | (40,361 | ) | | | (859,059 | ) |
| | | (399,623 | ) | | | (8,982,212 | ) | | (971,548 | ) | | | (19,625,123 | ) |
Net increase (decrease) | | (125,839 | ) | | $ | (2,786,605 | ) | | (691,858 | ) | | $ | (14,185,626 | ) |
Notes to Financial Statements (continued)
4. Investment Transactions
Purchases and sales (excluding short-term investments) during the fiscal year ended June 30, 2010, were as follows:
| | | | | | | | | |
| | | Growth
Allocation | | Moderate
Allocation | | Conservative
Allocation |
Purchases: | | | | | | | | | |
Affiliated investments | | $ | 1,127,000 | | $ | 7,165,000 | | $ | 3,686,000 |
Non-affiliated investments | | | 697,584 | | | 4,406,358 | | | 2,660,661 |
| | | |
Sales and maturities: | | | | | | | | | |
Affiliated investments | | | 1,957,000 | | | 4,040,000 | | | 6,912,000 |
Non-affiliated investments | | | 1,035,372 | | | 1,558,549 | | | 2,422,197 |
5. Income Tax Information
The following information is presented on an income tax basis. Differences between amounts for financial statement and federal income tax purposes are primarily due to timing differences in recognizing certain gains and losses on investment transactions. To the extent that differences arise that are permanent in nature, such amounts are reclassified within the capital accounts as detailed below. Temporary differences do not require reclassification. Temporary and permanent differences do not impact the net asset values of the Funds.
At June 30, 2010, the cost and unrealized appreciation (depreciation) of investments, as determined on a federal income tax basis, were as follows:
| | | | | | | | | | | | |
| | | Growth
Allocation | | | Moderate
Allocation | | | Conservative
Allocation | |
Cost of investments | | $ | 8,676,123 | | | $ | 44,601,484 | | | $ | 44,560,049 | |
Gross unrealized: | | | | | | | | | | | | |
Appreciation | | $ | 725,066 | | | $ | 3,110,263 | | | $ | 3,009,598 | |
Depreciation | | | (1,044,632 | ) | | | (3,129,147 | ) | | | (2,148,504 | ) |
Net unrealized appreciation (depreciation) of investments | | $ | (319,566 | ) | | $ | (18,884 | ) | | $ | 861,094 | |
Permanent differences, primarily due to investments in other regulated investment companies and reclassification of litigation settlements, resulted in reclassifications among the Funds’ components of net assets at June 30, 2010, the Funds’ tax year-end, as follows:
| | | | | | | | | | | | |
| | | Growth
Allocation | | | Moderate
Allocation | | | Conservative
Allocation | |
Capital paid-in | | $ | — | | | $ | — | | | $ | — | |
Undistributed (Over-distribution of) net investment income | | | (15,398 | ) | | | (28,889 | ) | | | (7,305 | ) |
Accumulated net realized gain (loss) | | | 15,398 | | | | 28,889 | | | | 7,305 | |
The tax components of undistributed net ordinary income and net long-term capital gains at June 30, 2010, the Funds’ tax year end, were as follows:
| | | | | | | | | |
| | | Growth
Allocation | | Moderate
Allocation | | Conservative
Allocation |
Undistributed net ordinary income* | | $ | 156,003 | | $ | 628,884 | | $ | 1,382,075 |
Undistributed net long-term capital gains | | | — | | | — | | | — |
| * | Net ordinary income consists of net taxable income derived from dividends, interest and net short-term capital gains, if any. |
The tax character of distributions paid during the Funds’ tax years ended June 30, 2010 and June 30, 2009, was designated for purposes of the dividends paid deduction as follows:
| | | | | | | | | |
| 2010 | | Growth
Allocation | | Moderate
Allocation | | Conservative
Allocation |
Distributions from net tax-exempt income | | $ | — | | $ | — | | $ | — |
Distributions from net ordinary income* | | | 205,473 | | | 1,151,421 | | | 1,584,762 |
Distributions from net long-term capital gains | | | — | | | — | | | — |
| | | | | | | | | |
| 2009 | | Growth
Allocation | | Moderate
Allocation | | Conservative
Allocation |
Distributions from net tax-exempt income | | $ | — | | $ | — | | $ | 218,845 |
Distributions from net ordinary income* | | | 194,562 | | | 990,267 | | | 700,213 |
Distributions from net long-term capital gains | | | 426,256 | | | 946,947 | | | 1,126,739 |
| * | Net ordinary income consists of net taxable income derived from dividends, interest, market discount accretion and net short-term capital gains, if any. |
At June 30, 2010, the Funds’ tax year end, the Funds had unused capital loss carryforwards available for federal income tax purposes to be applied against future capital gains, if any. If not applied, the carryforwards will expire as follows:
| | | | | | | | | |
| | | Growth
Allocation | | Moderate
Allocation | | Conservative
Allocation |
Expiration: | | | | | | | | | |
June 30, 2017 | | $ | 993,554 | | $ | 165,573 | | $ | 1,329,027 |
June 30, 2018 | | | 1,140,368 | | | 3,307,885 | | | 3,632,756 |
Total | | $ | 2,133,922 | | $ | 3,473,458 | | $ | 4,961,783 |
The Funds have elected to defer net realized losses from investments incurred from November 1, 2009 through June 30, 2010, the Funds’ tax year end, (“post-October losses”) in accordance with federal income tax regulations. Post-October losses are treated as having arisen on the first day of the following fiscal year:
| | | | | | | | | |
| | | Growth
Allocation | | Moderate
Allocation | | Conservative
Allocation |
Post-October capital losses | | $ | 108,469 | | $ | 136,334 | | $ | 9,537 |
6. Management Fees and Other Transactions with Affiliates
The management fee for each Fund, payable monthly, is .15% of the average daily net assets of each Fund.
The management fee compensates the Adviser for overall investment advisory and administrative services and general office facilities. The Adviser has entered into a Sub-Advisory Agreement with NIS under which NIS manages the investment portfolios of the Funds. NIS is compensated for its services to the Funds from the management fee paid to the Adviser.
The Adviser has agreed to waive fees and reimburse expenses (“Expense Cap”) of the Funds, so that total annual fund operating expenses (excluding 12b-1 distribution and service fees, interest expenses, taxes, fees incurred in acquiring and disposing of portfolio securities, Underlying Fund fees and expenses and extraordinary expenses) do not exceed the average daily net assets of any class of Fund shares in the amounts and for the time periods stated in the following table:
| | | | | | | | |
| | | Current/Temporary
Expense Cap | | | Current/Temporary
Expense Cap
Expiration Date | | Permanent
Expense Cap | |
Growth Allocation | | .40 | % | | October 31, 2011 | | .84 | % |
Moderate Allocation | | .29 | | | October 31, 2011 | | N/A | |
Conservative Allocation | | .37 | | | October 31, 2011 | | N/A | |
The Adviser may also voluntarily reimburse additional expenses from time to time in any of the Funds. Voluntary reimbursements may be terminated at any time at the Adviser’s discretion.
The Trust pays no compensation directly to those of its trustees who are affiliated with the Adviser or to its officers, all of whom receive remuneration for their services to the Trust from the Adviser or its affiliates. The Board of Trustees has adopted a deferred compensation plan for independent trustees that enables trustees to elect to defer receipt of all or a portion of the annual compensation they are entitled to receive from certain Nuveen advised funds. Under the plan, deferred amounts are treated as though equal dollar amounts had been invested in shares of select Nuveen advised funds.
During the fiscal year ended June 30, 2010, Nuveen Investments, LLC (the “Distributor”), a wholly-owned subsidiary of Nuveen, collected sales charges on purchases of Class A Shares, the majority of which were paid out as concessions to financial intermediaries as follows:
| | | | | | | | | |
| | | Growth
Allocation | | Moderate
Allocation | | Conservative
Allocation |
Sales charges collected (Unaudited) | | $ | 1,721 | | $ | 78,175 | | $ | 38,794 |
Paid to financial intermediaries (Unaudited) | | | 1,489 | | | 68,904 | | | 33,893 |
The Distributor also received 12b-1 service fees on Class A Shares, substantially all of which were paid to compensate financial intermediaries for providing services to shareholders relating to their investments.
During the fiscal year ended June 30, 2010, the Distributor compensated financial intermediaries directly with commission advances at the time of purchase as follows:
| | | | | | | | | |
| | | Growth
Allocation | | Moderate
Allocation | | Conservative
Allocation |
Commission advances (Unaudited) | | $ | 1,116 | | $ | 21,451 | | $ | 14,727 |
Notes to Financial Statements (continued)
To compensate for commissions advanced to financial intermediaries, all 12b-1 service fees collected on Class B Shares during the first year following a purchase, all 12b-1 distribution fees collected on Class B Shares, and all 12b-1 service and distribution fees collected on Class C Shares during the first year following a purchase are retained by the Distributor. During the fiscal year ended June 30, 2010, the Distributor retained such 12b-1 fees as follows:
| | | | | | | | | |
| | | Growth
Allocation | | Moderate
Allocation | | Conservative
Allocation |
12b-1 fees retained (Unaudited) | | $ | 4,905 | | $ | 31,058 | | $ | 21,508 |
The remaining 12b-1 fees charged to the Funds were paid to compensate financial intermediaries for providing services to shareholders relating to their investments.
The Distributor also collected and retained CDSC on share redemptions during the fiscal year ended June 30, 2010, as follows:
| | | | | | | | | |
| | | Growth
Allocation | | Moderate
Allocation | | Conservative
Allocation |
CDSC retained (Unaudited) | | $ | 1,454 | | $ | 3,615 | | $ | 4,232 |
7. New Accounting Standards
Fair Value Measurements
On January 21, 2010, FASB issued changes to the authoritative guidance under U.S. GAAP for fair value measurements. The objective of which is to provide guidance on how investment assets and liabilities are to be valued and disclosed. Specifically, the amendment requires reporting entities disclose Level 3 activity for purchases, sales, issuances and settlements in the Level 3 roll-forward on a gross basis rather than as one net number. The effective date of the amendment is for interim and annual periods beginning after December 15, 2010. At this time, management is evaluating the implications of this guidance and the impact it will have to the financial statement amounts and footnote disclosures, if any.
Financial Highlights
Financial Highlights
| | | | | | | | | | | | | | | | | | | | | | | | | | | | | | | | | |
| Selected data for a share outstanding throughout each period: | |
| | | | | | | |
| Class (Commencement Date) | | | | | | | | | | | | | | | | | | | | | |
| | | | | Investment Operations | | | Less Distributions | | | | |
| | | | | | | |
| GROWTH ALLOCATION | | | | | | | | | | | | | | | | | | | | | |
Year Ended
June 30, | | Beginning
Net
Asset
Value | | Net
Invest-
ment
Income (Loss)(a) | | | Net
Realized/
Unrealized
Gain (Loss) | | | Total | | | Net
Invest-
ment
Income | | | Capital
Gains | | | Total | | | Ending
Net
Asset
Value | | Total
Return(b) | |
Class A (12/04) | | | | | | | | | | | | | | | | | | | | | | | | | | | | | | |
2010 | | $ | 17.69 | | $ | .40 | | | $ | 2.02 | | | $ | 2.42 | | | $ | (.45 | ) | | $ | — | | | $ | (.45 | ) | | $ | 19.66 | | 13.56 | % |
2009 | | | 23.58 | | | .49 | | | | (5.18 | ) | | | (4.69 | ) | | | (.06 | ) | | | (1.14 | ) | | | (1.20 | ) | | | 17.69 | | (19.00 | ) |
2008 | | | 27.79 | | | .08 | | | | (2.73 | ) | | | (2.65 | ) | | | (.22 | ) | | | (1.34 | ) | | | (1.56 | ) | | | 23.58 | | (9.84 | ) |
2007 | | | 23.95 | | | .17 | | | | 4.48 | | | | 4.65 | | | | (.18 | ) | | | (.63 | ) | | | (.81 | ) | | | 27.79 | | 19.67 | |
2006 | | | 20.71 | | | .27 | | | | 3.20 | | | | 3.47 | | | | (.06 | ) | | | (.17 | ) | | | (.23 | ) | | | 23.95 | | 16.81 | |
Class B (12/04) | | | | | | | | | | | | | | | | | | | | | | | | | | | | | | |
2010 | | | 17.42 | | | .25 | | | | 1.98 | | | | 2.23 | | | | (.31 | ) | | | — | | | | (.31 | ) | | | 19.34 | | 12.72 | |
2009 | | | 23.34 | | | .41 | | | | (5.19 | ) | | | (4.78 | ) | | | — | | | | (1.14 | ) | | | (1.14 | ) | | | 17.42 | | (19.61 | ) |
2008 | | | 27.51 | | | (.11 | ) | | | (2.70 | ) | | | (2.81 | ) | | | (.02 | ) | | | (1.34 | ) | | | (1.36 | ) | | | 23.34 | | (10.49 | ) |
2007 | | | 23.74 | | | (.02 | ) | | | 4.42 | | | | 4.40 | | | | — | | | | (.63 | ) | | | (.63 | ) | | | 27.51 | | 18.73 | |
2006 | | | 20.63 | | | .07 | | | | 3.21 | | | | 3.28 | | | | — | | | | (.17 | ) | | | (.17 | ) | | | 23.74 | | 15.94 | |
Class C (12/04) | | | | | | | | | | | | | | | | | | | | | | | | | | | | | | |
2010 | | | 17.44 | | | .25 | | | | 1.97 | | | | 2.22 | | | | (.31 | ) | | | — | | | | (.31 | ) | | | 19.35 | | 12.65 | |
2009 | | | 23.35 | | | .41 | | | | (5.18 | ) | | | (4.77 | ) | | | — | | | | (1.14 | ) | | | (1.14 | ) | | | 17.44 | | (19.56 | ) |
2008 | | | 27.53 | | | (.11 | ) | | | (2.71 | ) | | | (2.82 | ) | | | (.02 | ) | | | (1.34 | ) | | | (1.36 | ) | | | 23.35 | | (10.52 | ) |
2007 | | | 23.75 | | | (.02 | ) | | | 4.43 | | | | 4.41 | | | | — | | | | (.63 | ) | | | (.63 | ) | | | 27.53 | | 18.76 | |
2006 | | | 20.63 | | | .07 | | | | 3.22 | | | | 3.29 | | | | — | | | | (.17 | ) | | | (.17 | ) | | | 23.75 | | 15.99 | |
Class R3 (8/08) | | | | | | | | | | | | | | | | | | | | | | | | | | | | | | |
2010 | | | 17.76 | | | .36 | | | | 2.02 | | | | 2.38 | | | | (.41 | ) | | | — | | | | (.41 | ) | | | 19.73 | | 13.27 | |
2009(f) | | | 22.66 | | | .53 | | | | (4.29 | ) | | | (3.76 | ) | | | — | ** | | | (1.14 | ) | | | (1.14 | ) | | | 17.76 | | (15.68 | ) |
Class I (12/04)(e) | | | | | | | | | | | | | | | | | | | | | | | | | | | | | | |
2010 | | | 17.72 | | | .48 | | | | 1.99 | | | | 2.47 | | | | (.50 | ) | | | — | | | | (.50 | ) | | | 19.69 | | 13.78 | |
2009 | | | 23.63 | | | .61 | | | | (5.27 | ) | | | (4.66 | ) | | | (.11 | ) | | | (1.14 | ) | | | (1.25 | ) | | | 17.72 | | (18.77 | ) |
2008 | | | 27.85 | | | .16 | | | | (2.75 | ) | | | (2.59 | ) | | | (.29 | ) | | | (1.34 | ) | | | (1.63 | ) | | | 23.63 | | (9.62 | ) |
2007 | | | 24.00 | | | .24 | | | | 4.48 | | | | 4.72 | | | | (.24 | ) | | | (.63 | ) | | | (.87 | ) | | | 27.85 | | 19.95 | |
2006 | | | 20.74 | | | .22 | | | | 3.32 | | | | 3.54 | | | | (.11 | ) | | | (.17 | ) | | | (.28 | ) | | | 24.00 | | 17.15 | |
| | | | | | | | | | | | | | | | |
| | | | | | | | | | | | | | | | |
| | | | | |
| | | | | | | | | | | | | | | | |
| Ratios/Supplemental Data | |
| | | Ratios to Average
Net Assets Before
Reimbursement | | | Ratios to Average
Net Assets After
Reimbursement(c) | | | | |
Ending
Net
Assets
(000) | | Expenses(d) | | | Net
Invest-
ment
Income
(Loss) | | | Expenses(d) | | | Net
Invest-
ment
Income
(Loss) | | | Portfolio
Turnover
Rate | |
| | | | | | | | | | | | | | | | |
| $ | 1,478 | | 1.58 | % | | 1.04 | % | | .65 | % | | 1.97 | % | | 20 | % |
| | 1,922 | | 2.52 | | | 1.01 | | | .79 | | | 2.74 | | | 173 | |
| | 3,420 | | 2.04 | | | (.07 | ) | | 1.69 | | | .28 | | | 34 | |
| | 6,888 | | 1.82 | | | .52 | | | 1.68 | | | .66 | | | 31 | |
| | 4,128 | | 2.32 | | | .43 | | | 1.69 | | | 1.06 | | | 21 | |
| | | | | | | | | | | | | | | | |
| | 411 | | 2.34 | | | .32 | | | 1.40 | | | 1.26 | | | 20 | |
| | 434 | | 3.35 | | | .52 | | | 1.52 | | | 2.34 | | | 173 | |
| | 647 | | 2.79 | | | (.79 | ) | | 2.44 | | | (.44 | ) | | 34 | |
| | 752 | | 2.54 | | | (.19 | ) | | 2.44 | | | (.09 | ) | | 31 | |
| | 298 | | 3.12 | | | (.47 | ) | | 2.44 | | | .21 | | | 21 | |
| | | | | | | | | | | | | | | | |
| | 3,095 | | 2.34 | | | .33 | | | 1.40 | | | 1.27 | | | 20 | |
| | 3,364 | | 3.30 | | | .53 | | | 1.53 | | | 2.30 | | | 173 | |
| | 6,035 | | 2.80 | | | (.81 | ) | | 2.45 | | | (.46 | ) | | 34 | |
| | 8,771 | | 2.53 | | | (.17 | ) | | 2.44 | | | (.07 | ) | | 31 | |
| | 3,524 | | 3.06 | | | (.39 | ) | | 2.44 | | | .22 | | | 21 | |
| | | | | | | | | | | | | | | | |
| | 133 | | 1.85 | | | .84 | | | .90 | | | 1.78 | | | 20 | |
| | 118 | | 3.01 | * | | 1.29 | * | | .90 | * | | 3.39 | * | | 173 | |
| | | | | | | | | | | | | | | | |
| | 3,224 | | 1.35 | | | 1.43 | | | .40 | | | 2.38 | | | 20 | |
| | 2,800 | | 2.36 | | | 1.55 | | | .52 | | | 3.39 | | | 173 | |
| | 4,396 | | 1.76 | | | .25 | | | 1.41 | | | .60 | | | 34 | |
| | 4,868 | | 1.58 | | | .78 | | | 1.43 | | | .93 | | | 31 | |
| | 3,261 | | 2.09 | | | .22 | | | 1.44 | | | .88 | | | 21 | |
| (a) | Per share Net Investment Income (Loss) is calculated using the average daily shares method. |
| (b) | •Total return is the combination of changes in net asset value without any sales charge, reinvested dividend income at net asset value and |
| | reinvested capital gains distributions at net asset value, if any. Total returns are not annualized. |
| | •Total returns for the year ended June 30, 2008, and prior reflect the performance of the Nuveen Global Value Fund. Total returns for the year |
| | ended June 30, 2009, include performance of the Nuveen Global Value Fund for the period July 1, 2008 through July 31, 2008. Returns prior to August 1, 2008, are not indicative of the performance that the Fund would have generated as currently managed. |
| (c) | After expense reimbursement from the Adviser, where applicable. Ratios do not reflect the effect of custodian fee credits earned on the Fund’s net cash on deposit with the custodian bank, where applicable. |
| (d) | The expense ratios subsequent to the year ended June 30, 2008, do not reflect the expenses of the Underlying Funds in which the Fund invests. |
| (e) | Effective May 1, 2008, Class R Shares were renamed Class I Shares. |
| (f) | For the period August 4, 2008 (commencement of operations) through June 30, 2009. |
| ** | Rounds to less than $.01 per share. |
See accompanying notes to financial statements.
Financial Highlights (continued)
| | | | | | | | | | | | | | | | | | | | | | | | | | | | | | | | |
| Selected data for a share outstanding throughout each period: | | | | | | | | | |
| | | | | | | |
| Class (Commencement Date) | | | | | | | | | | | | | | | | | | | | |
| | | | | Investment Operations | | | Less Distributions | | | | |
| | | | | | | |
| MODERATE ALLOCATION | | | | | | | | | | | | | | | | | | | | |
Year Ended
June 30, | | Beginning
Net
Asset
Value | | Net
Invest-
ment
Income(a) | | Net
Realized/
Unrealized
Gain
(Loss) | | | Total | | | Net
Invest-
ment
Income | | | Capital
Gains | | | Total | | | Ending
Net
Asset
Value | | Total
Return(b) | |
Class A (8/96) | | | | | | | | | | | | | | | | | | | | | | | | | | | | | |
2010 | | $ | 18.90 | | $ | .56 | | $ | 2.20 | | | $ | 2.76 | | | $ | (.58 | ) | | $ | — | | | $ | (.58 | ) | | $ | 21.08 | | 14.49 | % |
2009 | | | 22.35 | | | .67 | | | (3.32 | ) | | | (2.65 | ) | | | (.34 | ) | | | (.46 | ) | | | (.80 | ) | | | 18.90 | | (11.28 | ) |
2008 | | | 26.73 | | | .54 | | | (2.04 | ) | | | (1.50 | ) | | | (.56 | ) | | | (2.32 | ) | | | (2.88 | ) | | | 22.35 | | (6.31 | ) |
2007 | | | 25.40 | | | .58 | | | 2.97 | | | | 3.55 | | | | (.61 | ) | | | (1.61 | ) | | | (2.22 | ) | | | 26.73 | | 14.40 | |
2006 | | | 25.95 | | | .50 | | | 1.41 | | | | 1.91 | | | | (.54 | ) | | | (1.92 | ) | | | (2.46 | ) | | | 25.40 | | 7.60 | ** |
Class B (8/96) | | | | | | | | | | | | | | | | | | | | | | | | | | | | | |
2010 | | | 18.91 | | | .39 | | | 2.20 | | | | 2.59 | | | | (.43 | ) | | | — | | | | (.43 | ) | | | 21.07 | | 13.64 | |
2009 | | | 22.35 | | | .52 | | | (3.30 | ) | | | (2.78 | ) | | | (.20 | ) | | | (.46 | ) | | | (.66 | ) | | | 18.91 | | (11.98 | ) |
2008 | | | 26.73 | | | .35 | | | (2.04 | ) | | | (1.69 | ) | | | (.37 | ) | | | (2.32 | ) | | | (2.69 | ) | | | 22.35 | | (7.02 | ) |
2007 | | | 25.40 | | | .37 | | | 2.98 | | | | 3.35 | | | | (.41 | ) | | | (1.61 | ) | | | (2.02 | ) | | | 26.73 | | 13.55 | |
2006 | | | 25.95 | | | .30 | | | 1.41 | | | | 1.71 | | | | (.34 | ) | | | (1.92 | ) | | | (2.26 | ) | | | 25.40 | | 6.80 | ** |
Class C (8/96) | | | | | | | | | | | | | | | | | | | | | | | | | | | | | |
2010 | | | 18.94 | | | .40 | | | 2.19 | | | | 2.59 | | | | (.43 | ) | | | — | | | | (.43 | ) | | | 21.10 | | 13.62 | |
2009 | | | 22.37 | | | .53 | | | (3.30 | ) | | | (2.77 | ) | | | (.20 | ) | | | (.46 | ) | | | (.66 | ) | | | 18.94 | | (11.93 | ) |
2008 | | | 26.75 | | | .35 | | | (2.04 | ) | | | (1.69 | ) | | | (.37 | ) | | | (2.32 | ) | | | (2.69 | ) | | | 22.37 | | (7.01 | ) |
2007 | | | 25.42 | | | .38 | | | 2.97 | | | | 3.35 | | | | (.41 | ) | | | (1.61 | ) | | | (2.02 | ) | | | 26.75 | | 13.54 | |
2006 | | | 25.97 | | | .30 | | | 1.41 | | | | 1.71 | | | | (.34 | ) | | | (1.92 | ) | | | (2.26 | ) | | | 25.42 | | 6.79 | ** |
Class R3 (8/08) | | | | | | | | | | | | | | | | | | | | | | | | | | | | | |
2010 | | | 18.91 | | | .51 | | | 2.19 | | | | 2.70 | | | | (.53 | ) | | | — | | | | (.53 | ) | | | 21.08 | | 14.19 | |
2009(f) | | | 22.20 | | | .59 | | | (3.12 | ) | | | (2.53 | ) | | | (.30 | ) | | | (.46 | ) | | | (.76 | ) | | | 18.91 | | (10.87 | ) |
Class I (8/96)(e) | | | | | | | | | | | | | | | | | | | | | | | | | | | | | |
2010 | | | 18.89 | | | .63 | | | 2.18 | | | | 2.81 | | | | (.62 | ) | | | — | | | | (.62 | ) | | | 21.08 | | 14.80 | |
2009 | | | 22.35 | | | .71 | | | (3.32 | ) | | | (2.61 | ) | | | (.39 | ) | | | (.46 | ) | | | (.85 | ) | | | 18.89 | | (11.08 | ) |
2008 | | | 26.73 | | | .60 | | | (2.04 | ) | | | (1.44 | ) | | | (.62 | ) | | | (2.32 | ) | | | (2.94 | ) | | | 22.35 | | (6.07 | ) |
2007 | | | 25.40 | | | .64 | | | 2.98 | | | | 3.62 | | | | (.68 | ) | | | (1.61 | ) | | | (2.29 | ) | | | 26.73 | | 14.68 | |
2006 | | | 25.95 | | | .56 | | | 1.41 | | | | 1.97 | | | | (.60 | ) | | | (1.92 | ) | | | (2.52 | ) | | | 25.40 | | 7.87 | ** |
| | | | | | | | | | | | | | | | |
| | | | | |
| | | | | | | | | | | | | | | | |
| Ratios/Supplemental Data | |
| | | Ratios to Average
Net Assets Before
Reimbursement | | | Ratios to Average
Net Assets After
Reimbursement(c) | | | | |
| | | | | |
Ending
Net
Assets
(000) | | Expenses(d) | | | Net
Invest-
ment
Income | | | Expenses(d) | | | Net
Invest-
ment
Income | | | Portfolio
Turnover
Rate | |
| | | | | | | | | | | | | | | | |
| $ | 25,190 | | .83 | % | | 2.32 | % | | .54 | % | | 2.61 | % | | 13 | % |
| | 21,136 | | 1.29 | | | 2.97 | | | .62 | | | 3.64 | | | 171 | |
| | 29,612 | | 1.32 | | | 2.04 | | | 1.23 | | | 2.12 | | | 51 | |
| | 33,519 | | 1.26 | | | 2.17 | | | 1.24 | | | 2.19 | | | 61 | |
| | 30,644 | | 1.31 | | | 1.84 | | | 1.24 | | | 1.91 | | | 56 | |
| | | | | | | | | | | | | | | | |
| | 2,421 | | 1.58 | | | 1.53 | | | 1.29 | | | 1.82 | | | 13 | |
| | 3,054 | | 2.02 | | | 2.18 | | | 1.38 | | | 2.81 | | | 171 | |
| | 5,535 | | 2.07 | | | 1.29 | | | 1.98 | | | 1.38 | | | 51 | |
| | 6,376 | | 2.02 | | | 1.40 | | | 1.99 | | | 1.42 | | | 61 | |
| | 8,051 | | 2.06 | | | 1.09 | | | 1.99 | | | 1.15 | | | 56 | |
| | | | | | | | | | | | | | | | |
| | 6,354 | | 1.58 | | | 1.58 | | | 1.29 | | | 1.87 | | | 13 | |
| | 4,685 | | 2.03 | | | 2.19 | | | 1.37 | | | 2.85 | | | 171 | |
| | 7,265 | | 2.07 | | | 1.29 | | | 1.98 | | | 1.38 | | | 51 | |
| | 7,694 | | 2.01 | | | 1.42 | | | 1.99 | | | 1.44 | | | 61 | |
| | 7,342 | | 2.06 | | | 1.08 | | | 1.99 | | | 1.16 | | | 56 | |
| | | | | | | | | | | | | | | | |
| | 142 | | 1.08 | | | 2.07 | | | .79 | | | 2.36 | | | 13 | |
| | 128 | | 1.57 | * | | 2.84 | * | | .79 | * | | 3.62 | * | | 171 | |
| | | | | | | | | | | | | | | | |
| | 11,283 | | .58 | | | 2.64 | | | .29 | | | 2.93 | | | 13 | |
| | 6,334 | | 1.02 | | | 3.19 | | | .36 | | | 3.84 | | | 171 | |
| | 9,662 | | 1.07 | | | 2.29 | | | .98 | | | 2.38 | | | 51 | |
| | 10,690 | | 1.01 | | | 2.42 | | | .99 | | | 2.44 | | | 61 | |
| | 9,213 | | 1.06 | | | 2.08 | | | .99 | | | 2.15 | | | 56 | |
| (a) | Per share Net Investment Income is calculated using the average daily shares method. |
| (b) | •Total return is the combination of changes in net asset value without any sales charge, reinvested dividend income at net asset value and |
| | reinvested capital gains distributions at net asset value, if any. Total returns are not annualized. |
| | •Total returns for the year ended June 30, 2008, and prior reflect the performance of the Nuveen Balanced Stock and Bond Fund. Total returns for |
| | the year ended June 30, 2009, include performance of the Nuveen Balanced Stock and Bond Fund for the period July 1, 2008 through July 31, 2008. Returns prior to August 1, 2008, are not indicative of the performance that the Fund would have generated as currently managed. |
| (c) | After expense reimbursement from the Adviser, where applicable. Ratios do not reflect the effect of custodian fee credits earned on the Fund’s net cash on deposit with the custodian bank, where applicable. |
| (d) | The expense ratios subsequent to the year ended June 30, 2008, do not reflect the expenses of the Underlying Funds in which the Fund invests. |
| (e) | Effective May 1, 2008, Class R Shares were renamed Class I Shares. |
| (f) | For the period August 4, 2008 (commencement of operations) through June 30, 2009. |
| ** | During the year ended June 30, 2006, the Fund received a payment from the Adviser of $55,844, for losses realized on the disposal of investments purchased in violation of investment restrictions, which otherwise would have reduced total returns by .08%, .13%, .12% and .08% for Class A, B, C and I, respectively. |
See accompanying notes to financial statements.
Financial Highlights (continued)
| | | | | | | | | | | | | | | | | | | | | | | | | | | | | | | | |
| Selected data for a share outstanding throughout each period: | |
|
| Class (Commencement Date) | |
| | | | | Investment Operations | | | Less Distributions | | | | |
| | | | | | | |
| CONSERVATIVE ALLOCATION | | | | | | | | | | | | | | | | | | | | |
Year Ended
June 30, | | Beginning
Net
Asset
Value | | Net
Invest-
ment
Income(a) | | Net
Realized/
Unrealized
Gain
(Loss) | | | Total | | | Net
Invest-
ment
Income | | | Capital
Gains | | | Total | | | Ending
Net
Asset
Value | | Total
Return(b) | |
Class A (8/96) | | | | | | | | | | | | | | | | | | | | | | | | | | | | | |
2010 | | $ | 20.24 | | $ | .69 | | $ | 1.93 | | | $ | 2.62 | | | $ | (.79 | ) | | $ | — | | | $ | (.79 | ) | | $ | 22.07 | | 12.93 | % |
2009 | | | 22.84 | | | .85 | | | (2.60 | ) | | | (1.75 | ) | | | (.37 | ) | | | (.48 | ) | | | (.85 | ) | | | 20.24 | | (7.25 | ) |
2008 | | | 25.76 | | | .64 | | | (2.17 | ) | | | (1.53 | ) | | | (.67 | ) | | | (.72 | ) | | | (1.39 | ) | | | 22.84 | | (6.23 | ) |
2007 | | | 23.86 | | | .67 | | | 1.91 | | | | 2.58 | | | | (.68 | ) | | | — | | | | (.68 | ) | | | 25.76 | | 10.90 | |
2006 | | | 23.01 | | | .60 | | | .89 | | | | 1.49 | | | | (.64 | ) | | | — | | | | (.64 | ) | | | 23.86 | | 6.52 | |
Class B (8/96) | | | | | | | | | | | | | | | | | | | | | | | | | | | | | |
2010 | | | 21.72 | | | .55 | | | 2.09 | | | | 2.64 | | | | (.69 | ) | | | — | | | | (.69 | ) | | | 23.67 | | 12.11 | |
2009 | | | 24.43 | | | .77 | | | (2.80 | ) | | | (2.03 | ) | | | (.20 | ) | | | (.48 | ) | | | (.68 | ) | | | 21.72 | | (7.97 | ) |
2008 | | | 27.36 | | | .48 | | | (2.30 | ) | | | (1.82 | ) | | | (.39 | ) | | | (.72 | ) | | | (1.11 | ) | | | 24.43 | | (6.90 | ) |
2007 | | | 25.32 | | | .50 | | | 2.04 | | | | 2.54 | | | | (.50 | ) | | | — | | | | (.50 | )�� | | | 27.36 | | 10.09 | |
2006 | | | 24.26 | | | .45 | | | .94 | | | | 1.39 | | | | (.33 | ) | | | — | | | | (.33 | ) | | | 25.32 | | 5.73 | |
Class C (8/96) | | | | | | | | | | | | | | | | | | | | | | | | | | | | | |
2010 | | | 21.69 | | | .56 | | | 2.08 | | | | 2.64 | | | | (.69 | ) | | | — | | | | (.69 | ) | | | 23.64 | | 12.12 | |
2009 | | | 24.39 | | | .77 | | | (2.79 | ) | | | (2.02 | ) | | | (.20 | ) | | | (.48 | ) | | | (.68 | ) | | | 21.69 | | (7.94 | ) |
2008 | | | 27.32 | | | .49 | | | (2.31 | ) | | | (1.82 | ) | | | (.39 | ) | | | (.72 | ) | | | (1.11 | ) | | | 24.39 | | (6.94 | ) |
2007 | | | 25.29 | | | .51 | | | 2.02 | | | | 2.53 | | | | (.50 | ) | | | — | | | | (.50 | ) | | | 27.32 | | 10.10 | |
2006 | | | 24.24 | | | .45 | | | .93 | | | | 1.38 | | | | (.33 | ) | | | — | | | | (.33 | ) | | | 25.29 | | 5.70 | |
Class R3 (8/08) | | | | | | | | | | | | | | | | | | | | | | | | | | | | | |
2010 | | | 19.71 | | | .62 | | | 1.88 | | | | 2.50 | | | | (.72 | ) | | | — | | | | (.72 | ) | | | 21.49 | | 12.67 | |
2009(f) | | | 22.16 | | | .70 | | | (2.40 | ) | | | (1.70 | ) | | | (.27 | ) | | | (.48 | ) | | | (.75 | ) | | | 19.71 | | (7.27 | ) |
Class I (8/96)(e) | | | | | | | | | | | | | | | | | | | | | | | | | | | | | |
2010 | | | 19.69 | | | .72 | | | 1.89 | | | | 2.61 | | | | (.82 | ) | | | — | | | | (.82 | ) | | | 21.48 | | 13.24 | |
2009 | | | 22.24 | | | .88 | | | (2.53 | ) | | | (1.65 | ) | | | (.42 | ) | | | (.48 | ) | | | (.90 | ) | | | 19.69 | | (6.98 | ) |
2008 | | | 25.15 | | | .69 | | | (2.12 | ) | | | (1.43 | ) | | | (.76 | ) | | | (.72 | ) | | | (1.48 | ) | | | 22.24 | | (5.99 | ) |
2007 | | | 23.34 | | | .72 | | | 1.86 | | | | 2.58 | | | | (.77 | ) | | | — | | | | (.77 | ) | | | 25.15 | | 11.17 | |
2006 | | | 22.56 | | | .65 | | | .87 | | | | 1.52 | | | | (.74 | ) | | | — | | | | (.74 | ) | | | 23.34 | | 6.79 | |
| | | | | | | | | | | | | | | | |
| | | | | | | | | | | | | | | | |
| | | | | |
| | | | | | | | | | | | | | | | |
| Ratios/Supplemental Data | |
| | | Ratios to Average
Net Assets Before
Reimbursement | | | Ratios to Average
Net Assets After
Reimbursement(c) | | | | |
Ending
Net
Assets
(000) | | Expenses(d) | | | Net
Invest-
ment
Income | | | Expenses(d) | | | Net
Invest-
ment
Income | | | Portfolio
Turnover
Rate | |
| | | | | | | | | | | | | | | | |
| $ | 34,943 | | .77 | % | | 2.94 | % | | .62 | % | | 3.09 | % | | 14 | % |
| | 35,247 | | 1.04 | | | 3.88 | | | .63 | | | 4.28 | | | 166 | |
| | 52,785 | | 1.28 | | | 2.53 | | | 1.23 | | | 2.58 | | | 37 | |
| | 61,577 | | 1.22 | | | 2.64 | | | 1.22 | | | 2.64 | | | 37 | |
| | 58,064 | | 1.26 | | | 2.51 | | | 1.24 | | | 2.53 | | | 44 | |
| | | | | | | | | | | | | | | | |
| | 1,031 | | 1.53 | | | 2.16 | | | 1.37 | | | 2.32 | | | 14 | |
| | 1,730 | | 1.77 | | | 3.22 | | | 1.38 | | | 3.60 | | | 166 | |
| | 3,480 | | 2.03 | | | 1.76 | | | 1.98 | | | 1.81 | | | 37 | |
| | 5,916 | | 1.98 | | | 1.87 | | | 1.98 | | | 1.87 | | | 37 | |
| | 10,700 | | 2.00 | | | 1.75 | | | 1.99 | | | 1.76 | | | 44 | |
| | | | | | | | | | | | | | | | |
| | 8,034 | | 1.52 | | | 2.22 | | | 1.37 | | | 2.37 | | | 14 | |
| | 6,649 | | 1.81 | | | 3.21 | | | 1.38 | | | 3.63 | | | 166 | |
| | 8,192 | | 2.03 | | | 1.78 | | | 1.98 | | | 1.83 | | | 37 | |
| | 9,363 | | 1.97 | | | 1.90 | | | 1.97 | | | 1.90 | | | 37 | |
| | 7,992 | | 2.01 | | | 1.76 | | | 1.99 | | | 1.77 | | | 44 | |
| | | | | | | | | | | | | | | | |
| | 145 | | 1.02 | | | 2.71 | | | .87 | | | 2.86 | | | 14 | |
| | 133 | | 1.35 | * | | 3.59 | * | | .87 | * | | 4.08 | * | | 166 | |
| | | | | | | | | | | | | | | | |
| | 1,272 | | .50 | | | 3.20 | | | .37 | | | 3.32 | | | 14 | |
| | 472 | | .76 | | | 4.09 | | | .39 | | | 4.46 | | | 166 | |
| | 1,361 | | 1.03 | | | 2.78 | | | .98 | | | 2.83 | | | 37 | |
| | 1,525 | | .97 | | | 2.90 | | | .97 | | | 2.90 | | | 37 | |
| | 1,171 | | 1.01 | | | 2.77 | | | .99 | | | 2.79 | | | 44 | |
| (a) | Per share Net Investment Income is calculated using the average daily shares method. |
| (b) | •Total return is the combination of changes in net asset value without any sales charge, reinvested dividend income at net asset value and |
| | reinvested capital gains distributions at net asset value, if any. Total returns are not annualized. |
| | •Total returns for the year ended June 30, 2008, and prior reflect the performance of the Nuveen Balanced Municipal and Stock Fund. Total returns |
| | for the year ended June 30, 2009, include performance of the Nuveen Balanced Municipal and Stock Fund for the period July 1, 2008 through July 6, 2008. Returns prior to July 7, 2008, are not indicative of the performance that the Fund would have generated as currently managed. |
| (c) | After expense reimbursement from the Adviser, where applicable. Ratios do not reflect the effect of custodian fee credits earned on the Fund’s net cash on deposit with the custodian bank, where applicable. |
| (d) | The expense ratios subsequent to the year ended June 30, 2008, do not reflect the expenses of the Underlying Funds in which the Fund invests. |
| (e) | Effective May 1, 2008, Class R Shares were renamed Class I Shares. |
| (f) | For the period August 4, 2008 (commencement of operations) through June 30, 2009. |
See accompanying notes to financial statements.
Trustees and Officers
The management of the Funds, including general supervision of the duties performed for the Funds by the Adviser, is the responsibility of the Board of Trustees of the Funds. The number of trustees of the Funds is currently set at nine. None of the trustees who are not “interested” persons of the Funds (referred to herein as “independent trustees”) has ever been a director or employee of, or consultant to, Nuveen or its affiliates. The names and business addresses of the trustees and officers of the Funds, their principal occupations and other affiliations during the past five years, the number of portfolios each oversees and other directorships they hold are set forth below.
The Funds’ Statement of Additional Information (“SAI”) includes more information about the trustees. To request a free copy, call Nuveen Investments at (800) 257-8787 or visit the Funds’ website at www.nuveen.com.
| | | | | | | | |
Name, Birthdate and Address | | Position(s) Held with the Funds | | Year First Elected or Appointed (1) | | Principal Occupation(s) Including other Directorships During Past 5 Years | | Number of Portfolios in Fund Complex Overseen by Trustee |
| | |
| Independent Trustees: | | | | |
Robert P. Bremner (2) 8/22/40 333 W. Wacker Drive Chicago, IL 60606 | | Chairman of the Board and Trustee | | 1996 | | Private Investor and Management Consultant; Treasurer and Director, Humanities Council of Washington, D.C. | | 200 |
Jack B. Evans 10/22/48 333 W. Wacker Drive Chicago, IL 60606 | | Trustee | | 1999 | | President, The Hall-Perrine Foundation, a private philanthropic corporation (since 1996); Director and Chairman, United Fire Group, a publicly held company; President Pro Tem of the Board of Regents for the State of Iowa University System; Director, Gazette Companies; Life Trustee of Coe College and the Iowa College Foundation; formerly, Director, Alliant Energy; formerly, Director, Federal Reserve Bank of Chicago; formerly, President and Chief Operating Officer, SCI Financial Group, Inc., a regional financial services firm. | | 200 |
William C. Hunter 3/6/48 333 W. Wacker Drive Chicago, IL 60606 | | Trustee | | 2004 | | Dean, Tippie College of Business, University of Iowa (since 2006); Director (since 2004) of Xerox Corporation; Director (since 2005), Beta Gamma Sigma International Honor Society; formerly, Dean and Distinguished Professor of Finance, School of Business at the University of Connecticut (2003-2006); previously, Senior Vice President and Director of Research at the Federal Reserve Bank of Chicago (1995-2003); Director, SS&C Technologies, Inc. (May 2005-October 2005); formerly, Director (1997-2007), Credit Research Center at George Washington University. | | 200 |
David J. Kundert (2) 10/28/42 333 W. Wacker Drive Chicago, IL 60606 | | Trustee | | 2005 | | Director, Northwestern Mutual Wealth Management Company; retired (since 2004) as Chairman, JPMorgan Fleming Asset Management, President and CEO, Banc One Investment Advisors Corporation, and President, One Group Mutual Funds; prior thereto, Executive Vice President, Banc One Corporation and Chairman and CEO, Banc One Investment Management Group; Member, Board of Regents, Luther College; member of the Wisconsin Bar Association; member of Board of Directors, Friends of Boerner Botanical Gardens; member of Board of Directors and Chair of Investment Committee, Greater Milwaukee Foundation. | | 200 |
William J. Schneider (2) 9/24/44 333 W. Wacker Drive Chicago, IL 60606 | | Trustee | | 1997 | | Chairman of Miller-Valentine Partners Ltd., a real estate investment company; formerly, Senior Partner and Chief Operating Officer (retired, 2004) of Miller-Valentine Group; member, University of Dayton Business School Advisory Council; member, Mid-America Health System Board; formerly, member and Chair, Dayton Philharmonic Orchestra Association; formerly, member, Business Advisory Council, Cleveland Federal Reserve Bank. | | 200 |
Judith M. Stockdale 12/29/47 333 W. Wacker Drive Chicago, IL 60606 | | Trustee | | 1997 | | Executive Director, Gaylord and Dorothy Donnelley Foundation (since 1994); prior thereto, Executive Director, Great Lakes Protection Fund (1990-1994). | | 200 |
Carole E. Stone (2) 6/28/47 333 W. Wacker Drive Chicago, IL 60606 | | Trustee | | 2007 | | Director, Chicago Board Options Exchange (since 2006); Director, C2 Options Exchange, Incorporated (since 2009); Commissioner, New York State Commission on Public Authority Reform (since 2005); formerly, Chair, New York Racing Association Oversight Board (2005-2007). | | 200 |
| | | | | | | | |
Name, Birthdate and Address | | Position(s) Held with the Funds | | Year First Elected or Appointed (1) | | Principal Occupation(s) Including other Directorships During Past 5 Years | | Number of Portfolios in Fund Complex Overseen by Trustee |
Terence J. Toth (2) 9/29/59 333 W. Wacker Drive Chicago, IL 60606 | | Trustee | | 2008 | | Director, Legal & General Investment Management America, Inc. (since 2008); Managing Partner, Promus Capital (since 2008); formerly, CEO and President, Northern Trust Global Investments (2004-2007); Executive Vice President, Quantitative Management & Securities Lending (2000-2004); prior thereto, various positions with Northern Trust Company (since 1994); member: Goodman Theatre Board (since 2004); Chicago Fellowship Board (since 2005), University of Illinois Leadership Council Board (since 2007) and Catalyst Schools of Chicago Board (since 2008); formerly, member: Northern Trust Mutual Funds Board (2005-2007), Northern Trust Global Investments Board (2004-2007), Northern Trust Japan Board (2004-2007), Northern Trust Securities Inc. Board (2003-2007) and Northern Trust Hong Kong Board (1997-2004). | | 200 |
| | |
| Interested Trustee: | | | | |
John P. Amboian (3) 6/14/61 333 W. Wacker Drive Chicago, IL 60606 | | Trustee | | 2008 | | Chief Executive Officer (since July 2007), Director (since 1999) and Chairman (since 2007) of Nuveen Investments, Inc.; Chief Executive Officer (since 2007) of Nuveen Asset Management, Nuveen Investments Advisors, Inc.; President (since 2005) of Nuveen Commodities Asset Management, LLC. | | 200 |
Name, Birthdate and Address | | Position(s) Held with the Funds | | Year First Elected or Appointed (4) | | Principal Occupation(s) During Past 5 Years | | Number of Portfolios in Fund Complex Overseen by Officer |
| | |
| Officers of the Funds: | | | | |
Gifford R. Zimmerman 9/9/56 333 W. Wacker Drive Chicago, IL 60606 | | Chief Administrative Officer | | 1988 | | Managing Director (since 2002), Assistant Secretary and Associate General Counsel of Nuveen Investments, LLC; Managing Director, Associate General Counsel and Assistant Secretary, of Nuveen Asset Management (since 2002) and of Symphony Asset Management LLC (since 2003); Vice President and Assistant Secretary of NWQ Investment Management Company, LLC. (since 2002), Nuveen Investments Advisers Inc. (since 2002), Tradewinds Global Investors, LLC, and Santa Barbara Asset Management, LLC (since 2006), Nuveen HydePark Group LLC and Nuveen Investment Solutions, Inc. (since 2007); Managing Director (since 2004) and Assistant Secretary (since 1994) of Nuveen Investments, Inc.; Managing Director (since 2005) of Nuveen Commodities Asset Management, LLC; Chartered Financial Analyst. | | 200 |
Nizida Arriaga 6/1/68 333 W. Wacker Drive Chicago, IL 60606 | | Vice President | | 2009 | | Senior Vice President of Nuveen Investments, LLC (since 2010); formerly, Vice President (2007-2010); previously, Portfolio Manager, Allstate Investments, LLC (1996-2006); Chartered Financial Analyst. | | 200 |
Michael T. Atkinson 2/3/66 333 W. Wacker Drive Chicago, IL 60606 | | Vice President and Assistant Secretary | | 2000 | | Vice President (since 2002) of Nuveen Investments, LLC; Vice President of Nuveen Asset Management (since 2005). | | 200 |
Margo L. Cook 4/11/64 333 W. Wacker Drive Chicago, IL 60606 | | Vice President | | 2009 | | Executive Vice President (since Oct 2008) of Nuveen Investments, Inc.; previously, Head of Institutional Asset Management (2007-2008) of Bear Stearns Asset Management; Head of Institutional Asset Mgt (1986-2007) of Bank of NY Mellon; Chartered Financial Analyst. | | 200 |
Alan A. Brown 8/1/62 333 W. Wacker Drive Chicago, IL 60606 | | Vice President | | 2007 | | Executive Vice President, Global Client Private Group (since 2007); Executive Vice President, Mutual Funds, Nuveen Investments, LLC, (since 2005), previously, Managing Director and Chief Marketing Officer (2001-2005). | | 75 |
Trustees and Officers (continued)
| | | | | | | | |
Name, Birthdate and Address | | Position(s) Held with the Funds | | Year First Elected or Appointed (4) | | Principal Occupation(s) Including other Directorships During Past 5 Years | | Number of Portfolios in Fund Complex Overseen by Officer |
Lorna C. Ferguson 10/24/45 333 W. Wacker Drive Chicago, IL 60606 | | Vice President | | 1998 | | Managing Director (since 2004) of Nuveen Investments, LLC and Managing Director (since 2005) of Nuveen Asset Management. | | 200 |
Stephen D. Foy 5/31/54 333 W. Wacker Drive Chicago, IL 60606 | | Vice President and Controller | | 1998 | | Senior Vice President (since 2010), formerly, Vice President (1993-2010) and Funds Controller (since 1998) of Nuveen Investments, LLC; Vice President (2005-2010) of Nuveen Asset Management; Certified Public Accountant. | | 200 |
Scott S. Grace 8/20/70 333 W. Wacker Drive Chicago, IL 60606 | | Vice President and Treasurer | | 2009 | | Managing Director, Corporate Finance & Development, Treasurer (since 2009) of Nuveen Investments, LLC; Managing Director and Treasurer of Nuveen Asset Management (since 2009); formerly, Treasurer (2006-2009), Senior Vice President (2008-2009), previously, Vice President (2006-2008) of Janus Capital Group, Inc.; formerly, Senior Associate in Morgan Stanley’s Global Financial Services Group (2000-2003); Chartered Accountant Designation. | | 200 |
William T. Huffman 5/7/1969 333 W. Wacker Drive Chicago, IL 60606 | | Vice President | | 2009 | | Chief Operating Officer, Municipal Fixed Income (since 2008) of Nuveen Asset Management; previously, Chairman, President and Chief Executive Officer (2002 – 2007) of Northern Trust Global Advisors, Inc. and Chief Executive Officer (2007) of Northern Trust Global Investments Limited; Certified Public Accountant. | | 136 |
Walter M. Kelly 2/24/70 333 W. Wacker Drive Chicago, IL 60606 | | Chief Compliance Officer and Vice President | | 2003 | | Senior Vice President (since 2008), Vice President (2006-2008) formerly, Assistant Vice President and Assistant General Counsel (2003-2006) of Nuveen Investments, LLC; Senior Vice President (since 2008), formerly, Vice President (2006-2008) and Assistant Secretary (since 2003) of Nuveen Asset Management. | | 200 |
David J. Lamb 3/22/63 333 W. Wacker Drive Chicago, IL 60606 | | Vice President | | 2000 | | Senior Vice President (since 2009), formerly, Vice President (2000-2009) of Nuveen Investments, LLC; Vice President (since 2005) of Nuveen Asset Management, Certified Public Accountant. | | 200 |
Tina M. Lazar 8/27/61 333 W. Wacker Drive Chicago, IL 60606 | | Vice President | | 2002 | | Senior Vice President (since 2009), formerly, Vice President of Nuveen Investments, LLC (1999-2009); Vice President of Nuveen Asset Management (since 2005). | | 200 |
Larry W. Martin 7/27/51 333 W. Wacker Drive Chicago, IL 60606 | | Vice President and Assistant Secretary | | 1988 | | Senior Vice President (since 2010), formerly, Vice President (1993-2010), Assistant Secretary and Assistant General Counsel of Nuveen Investments, LLC; Vice President (since 2005) and Assistant Secretary of Nuveen Investments, Inc.; Vice President (since 2005) and Assistant Secretary (since 1997) of Nuveen Asset Management Vice President and Assistant Secretary of Nuveen Investments Advisers Inc. (since 2002), NWQ Investment Management Company, LLC (since 2002), Symphony Asset Management LLC (since 2003), Tradewinds Global Investors, LLC, Santa Barbara Asset Management, LLC (since 2006) and of Nuveen HydePark Group, LLC and Nuveen Investment Solutions, Inc. (since 2007). | | 200 |
Kevin J. McCarthy 3/26/66 333 W. Wacker Drive Chicago, IL 60606 | | Vice President and Secretary | | 2007 | | Managing Director (since 2008), formerly, Vice President (2007-2008), Nuveen Investments, LLC; Managing Director (since 2008), formerly, Vice President and Assistant Secretary, Nuveen Asset Management and Nuveen Investments Holdings, Inc.; Vice President (since 2007) and Assistant Secretary, Nuveen Investment Advisers Inc., NWQ Investment Management Company, LLC, Tradewinds Global Investors LLC, NWQ Holdings, LLC, Symphony Asset Management LLC, Santa Barbara Asset Management LLC, Nuveen HydePark Group, LLC and Nuveen Investment Solutions, Inc. (since 2007); prior thereto, Partner, Bell, Boyd & Lloyd LLP (1997-2007). | | 200 |
| | | | | | | | |
Name, Birthdate and Address | | Position(s) Held with the Funds | | Year First Elected or Appointed (4) | | Principal Occupation(s) Including other Directorships During Past 5 Years | | Number of Portfolios in Fund Complex Overseen by Officer |
Michelle A. McCarthy 7/6/65 333 West Wacker Drive Chicago, IL 60606 | | Vice President | | 2010 | | Managing Director, Director of Risk Management (since May, 2010), Nuveen Investments, LLC; formerly, Chief Risk Officer (2009-2010) of Russell Investment Group; formerly, SVP (2003-2009), Chief Market & Operational Risk Officer (2006-2009), Washington Mutual Bank. | | 200 |
John V. Miller 4/10/67 333 W. Wacker Drive Chicago, IL 60606 | | Vice President | | 2007 | | Chief Investment Officer and Managing Director (since 2007), formerly, Vice President (2002-2007) of Nuveen Asset Management and Managing Director (since 2007), formerly, Vice President (2002-2007) Nuveen Investments, LLC; Chartered Financial Analyst. | | 136 |
Gregory T. Mino 1/4/71 333 W. Wacker Drive Chicago, IL 60606 | | Vice President | | 2009 | | Senior Vice President (since 2010) of Nuveen Investments, LLC, formerly, Vice President (2008-2010); previously, Director (2004-2007) and Executive Director (2007-2008) of UBS Global Asset Management; previously, Vice President (2000-2003) and Director (2003-2004) of Merrill Lynch Investment Managers; Chartered Financial Analyst. | | 200 |
Christopher M. Rohrbacher 8/1/71 333 W. Wacker Drive Chicago, IL 60606 | | Vice President and Assistant Secretary | | 2008 | | Vice President, Nuveen Investments, LLC (since 2008); Vice President and Assistant Secretary, Nuveen Asset Management (since 2008); prior thereto, Associate, Skadden, Arps, Slate, Meagher & Flom LLP (2002-2008) | | 200 |
James F. Ruane 7/3/62 333 W. Wacker Drive Chicago, IL 60606 | | Vice President and Assistant Secretary | | 2007 | | Vice President, Nuveen Investments (since 2007); prior thereto, Partner, Deloitte & Touche USA LLP (2005-2007), formerly, senior tax manager (2002-2005); Certified Public Accountant. | | 200 |
John S. White 5/12/67 333 W. Wacker Drive Chicago, IL 60606 | | Vice President | | 2007 | | Senior Vice President (since 2009), formerly, Vice President (2006-2009) of Nuveen Investments, LLC, formerly, Assistant Vice President (since 2002); Lieutenant Colonel (since 2007), United States Marine Corps Reserve, formerly, Major (since 2001). | | 75 |
Mark L. Winget 12/21/68 333 W. Wacker Drive Chicago, IL 60606 | | Vice President and Assistant Secretary | | 2008 | | Vice President, Nuveen Investments, LLC (since 2008); Vice President and Assistant Secretary, Nuveen Asset Management (since 2008); prior thereto, Counsel, Vedder Price P.C. (1997-2007). | | 200 |
| (1) | Trustees serve an indefinite term until his/her successor is elected or appointed. The year first elected or appointed represents the year in which the trustee was first elected or appointed to any fund in the Nuveen Fund Complex. |
| (2) | Also serves as a trustee of the Nuveen Diversified Commodity Fund, a Nuveen-sponsored commodity pool that has filed a registration statement on Form S-1 with the SEC for a proposed initial public offering. The S-1 has not been declared effective, and the commodity pool has not commenced operations. |
| (3) | Mr. Amboian is an interested trustee because of his position with Nuveen Investments, Inc. and certain of its subsidiaries, which are affiliates of the Nuveen Funds. |
| (4) | Officers serve one year terms through August of each year. The year first elected or appointed represents the year in which the officer was first elected or appointed to any fund in the Nuveen Fund Complex. |
Annual Investment Management Agreement Approval Process
The Investment Company Act of 1940, as amended (the “1940 Act”), provides, in substance, that each investment advisory agreement between a fund and its investment adviser (including sub-advisers) will continue in effect from year to year only if its continuance is approved at least annually by the fund’s board members, including by a vote of a majority of the board members who are not parties to the advisory agreement or “interested persons” of any parties (the “Independent Board Members”), cast in person at a meeting called for the purpose of considering such approval. In connection with such approvals, the fund’s board members must request and evaluate, and the investment adviser is required to furnish, such information as may be reasonably necessary to evaluate the terms of the advisory agreement. Accordingly, at a meeting held on May 25-26, 2010 (the “May Meeting”), the Boards of Trustees (each, a “Board” and each Trustee, a “Board Member”) of the Funds, including a majority of the Independent Board Members, considered and approved the continuation of the advisory and sub-advisory agreements for the Funds for an additional one-year period. These agreements include the investment advisory agreements between Nuveen Asset Management (“NAM”) and each Fund and the sub-advisory agreements between NAM and Nuveen Investment Solutions, Inc. (the “Sub-Adviser”). In preparation for their considerations at the May Meeting, the Board also held a separate meeting on April 21-22, 2010 (the “April Meeting”). Accordingly, the factors considered and determinations made regarding the renewals by the Independent Board Members include those made at the April Meeting.
In addition, in evaluating the applicable advisory agreements (each an “Investment Management Agreement”) and sub-advisory agreements (each, a “Sub-advisory Agreement,” and each Investment Management Agreement and Sub-advisory Agreement, an “Advisory Agreement”), the Independent Board Members reviewed a broad range of information relating to the Funds, NAM and the Sub-Adviser (NAM and the Sub-Adviser are each a “Fund Adviser”), including absolute and comparative performance, fee and expense information for the Funds (as described in more detail below), the profitability of Nuveen for its advisory activities (which includes its wholly owned subsidiaries), and other information regarding the organization, personnel, and services provided by the respective Fund Adviser. The Independent Board Members also met quarterly as well as at other times as the need arose during the year and took into account the information provided at such meetings and the knowledge gained therefrom. Prior to approving the renewal of the Advisory Agreements, the Independent Board Members reviewed the foregoing information with their independent legal counsel and with management, reviewed materials from independent legal counsel describing applicable law and their duties in reviewing advisory contracts, and met with independent legal counsel in private sessions without management present. The Independent Board Members considered the legal advice provided by independent legal counsel and relied upon their knowledge of the Fund Adviser, its services and the Funds resulting from their meetings and other interactions throughout the year and their own business judgment in determining the factors to be considered in evaluating the Advisory Agreements. Each Board Member may have accorded different weight to the various factors in reaching his or her conclusions with respect to a Fund’s Advisory Agreements. The Independent Board Members did not identify any single factor as all-important or controlling. The Independent Board Members’ considerations were instead based on a comprehensive consideration of all the information presented. The principal factors considered by the Board and its conclusions are described below.
A. Nature, Extent and Quality of Services
In considering renewal of the Advisory Agreements, the Independent Board Members considered the nature, extent and quality of the Fund Adviser’s services, including advisory services and administrative services. The Independent Board Members reviewed materials outlining, among other things, the Fund Adviser’s organization and business; the types of services that the Fund Adviser or its affiliates provide and are expected to provide to the Funds; the performance record of the applicable Fund (as described in further detail below); and any initiatives Nuveen had taken for the applicable fund product line, including the development of new practices and coordination among business units with respect to large shareholder transactions, streamlining the classes offered, and adding funds to various distribution platforms.
As part of their review, the Independent Board Members also evaluated the background, experience and track record of the Fund Adviser’s investment personnel. In this regard, the Independent Board Members considered any changes in the personnel, and the impact on the level of services provided to the Funds, if any. The Independent Board Members also reviewed information regarding portfolio manager compensation arrangements to evaluate the Fund Adviser’s ability to attract and retain high quality investment personnel, preserve stability, and reward performance but not provide an incentive for taking undue risks.
In addition to advisory services, the Independent Board Members considered the quality of administrative services provided by NAM and its affiliates including product management, fund administration, oversight of service providers, shareholder services, administration of Board relations, regulatory and portfolio compliance and legal support. Given the importance of compliance, the Independent Board Members also considered NAM’s compliance program, including the report of the chief compliance officer regarding the Funds’ compliance policies and procedures.
The Independent Board Members also considered NAM’s oversight of the performance, business activities and compliance of the Sub-Adviser. In that regard, the Independent Board Members reviewed an evaluation of the Sub-Adviser from NAM. The evaluation also included information relating to the Sub-Adviser’s organization, operations, personnel, assets under management, investment philosophy, strategies and techniques in managing the Funds, developments affecting the Sub-Adviser, and an analysis of the Sub-Adviser. As described in further detail below, the Board also considered the performance of each Fund. In addition, the Board recognized that the Sub-advisory Agreements were essentially agreements for portfolio management services only and the Sub-Adviser was not expected to supply other significant administrative services to the Funds. As part of their oversight, the Independent
Board Members also continued their program of seeking to visit each sub-adviser to the Nuveen funds at least once over a multiple year rotation, meeting with key investment and business personnel. The Independent Board Members noted that NAM recommended the renewal of the Sub-advisory Agreements and considered the basis for such recommendations.
Based on their review, the Independent Board Members found that, overall, the nature, extent and quality of services provided (and expected to be provided) to the Funds under the respective Investment Management Agreement or Sub-advisory Agreement, as applicable, were satisfactory.
B. The Investment Performance of the Funds and Fund Advisers
The Board considered the performance results of each Fund over various time periods. The Board reviewed, among other things, each Fund’s historic investment performance as well as information comparing the Fund’s performance information with that of other funds (the “Performance Peer Group”) based on data provided by an independent provider of mutual fund data and with recognized and/or customized benchmarks. In this regard, the performance information the Board reviewed included the Fund’s total return information compared to the returns of its Performance Peer Group and recognized and/or customized benchmarks for the quarter, one-, three- and five-year periods ending December 31, 2009 and for the same periods ending March 31, 2010. The Board also reviewed the peer ranking of the Nuveen funds sub-advised by the Sub-Adviser in the aggregate. This information supplemented the Fund performance information provided to the Board at each of its quarterly meetings.
In reviewing peer comparison information, the Independent Board Members recognized that the Performance Peer Group of certain funds may not adequately represent the objectives and strategies of the funds, thereby limiting the usefulness of comparing a fund’s performance with that of its Performance Peer Group. In addition, the Independent Board Members noted that the previous changes to the investment strategies of the Funds limit somewhat the usefulness of reviewing the Funds’ past performance beyond recent periods. Based on their review, the Independent Board Members determined that each Fund’s investment performance over time had been satisfactory. The Nuveen Moderate Allocation Fund generally demonstrated favorable performance in comparison to peers, performing in the first or second quartile over various periods. While the Nuveen Growth Allocation Fund lagged its peers somewhat in the short-term one-year period, it demonstrated more favorable performance in the longer three- and five-year periods. The performance of the Nuveen Conservative Allocation Fund over time was satisfactory compared to peers, falling within the second or third quartile over various periods.
C. Fees, Expenses and Profitability
1. Fees and Expenses
The Independent Board Members recognized that the Funds were launched in their present fund-of-funds form in the summer of 2008. Prior to that time, each Fund’s investment strategy and structure were materially different. The Independent Board Members recognized that the fee and expense arrangement of a fund-of-funds structure differs from that of a traditional fund format. The Independent Board Members noted that, in light of their fund-of-funds structure, the Funds will indirectly pay a portion of the expenses incurred by the underlying funds, including their advisory fees. Accordingly, the Independent Board Members reviewed, among other things, the gross management fees, net expense ratios (including indirect fees but net of reimbursements) and indirect fees of each Fund compared to such fee and expense information for a comparable set of unaffiliated fund-of-funds (the “Peer Universe”) and a subset thereof (the “Peer Group”). As a related matter, the Independent Board Members further reviewed the methodology regarding the construction of the applicable Peer Universe and/or Peer Group. In reviewing the comparisons of fee and expense information, the Independent Board Members took into account that in certain instances various factors such as: the asset level of a fund relative to peers; the limited size and particular composition of the Peer Universe or Peer Group; the investment objectives of the peers; expense anomalies; changes in the funds comprising the Peer Universe or Peer Group from year to year; levels of reimbursement; and the timing of information used may impact the comparative data, thereby limiting the ability to make a meaningful comparison with peers, including for each of the Funds. It was noted that the gross management fees of Nuveen Conservative Allocation Fund were slightly higher than that of the averages of its Peer Group and Peer Universe and its net expense ratio was the same as the average for the Peer Universe and below that of the Peer Group; the gross management fees and net expense ratios of Nuveen Moderate Allocation Fund were below the averages of the Peer Group and Peer Universe; and the gross management fees of Nuveen Growth Allocation Fund were below the average of the Peer Group and above that of its Peer Universe and its net expense ratio was above the average of its Peer Universe and Peer Group (due in part to the small size of such Fund compared to peers). In addition, the Independent Board Members considered that many of the underlying funds may be advised by NAM and sub-advised by an affiliated person of NAM. Accordingly, NAM and affiliated sub-advisers may receive advisory fees from the underlying funds in which the Funds invest, and the Funds will indirectly bear their pro rata portion of these fees as well as the other expenses of the underlying funds. In considering the services provided by the Fund Advisers to the Funds and the fee arrangements, the Board determined, however, that the fees were for services in addition to, rather than duplicative of, the services provided under any underlying fund’s advisory contracts.
Based on their review of the fee and expense information provided, the Independent Board Members determined that each Fund’s management fees were reasonable in light of the nature, extent and quality of services provided to the Fund.
2. Comparisons with the Fees of Other Clients
The Independent Board Members further reviewed information regarding the nature of services and fee rates offered by NAM to other clients. Such clients include separately managed accounts (both retail and institutional accounts), foreign investment funds
Annual Investment Management Agreement Approval Process (continued)
offered by Nuveen and funds that are not offered by Nuveen but are sub-advised by one of Nuveen’s investment management teams. In evaluating the comparisons of fees, the Independent Board Members noted that the fee rates charged to the Funds and other clients vary, among other things, because of the different services involved and the additional regulatory and compliance requirements associated with registered investment companies, such as the Funds. Accordingly, the Independent Board Members considered the differences in the product types, including, but not limited to, the services provided, the structure and operations, product distribution and costs thereof, portfolio investment policies, investor profiles, account sizes and regulatory requirements. The Independent Board Members noted, in particular, that the range of services provided to the Funds (as discussed above) is much more extensive than that provided to separately managed accounts. The Independent Board Members also recognized that NAM and the Sub-Adviser do not currently advise other fund-of-funds and, therefore, meaningful comparisons of fees for similar types of clients were not available. Given the inherent differences in the products, particularly the extensive services provided to the Funds, the Independent Board Members believe such facts justify the different levels of fees.
In considering the fees of the Sub-Adviser, the Independent Board Members also considered the pricing schedule or fees that the Sub-Adviser charges for similar investment management services for other fund sponsors or clients (such as retail and/or institutional managed accounts) as applicable.
3. Profitability of Fund Advisers
In conjunction with its review of fees, the Independent Board Members also considered the profitability of Nuveen for its advisory activities (which incorporated Nuveen’s wholly-owned affiliated sub-advisers) and its financial condition. The Independent Board Members reviewed the revenues and expenses of Nuveen’s advisory activities for the last two years, the allocation methodology used in preparing the profitability data and an analysis of the key drivers behind the changes in revenues and expenses that impacted profitability in 2009. The Independent Board Members noted this information supplemented the profitability information requested and received during the year to help keep them apprised of developments affecting profitability (such as changes in fee waivers and expense reimbursement commitments). In this regard, the Independent Board Members noted that they had also appointed an Independent Board Member as a point person to review and keep them apprised of changes to the profitability analysis and/or methodologies during the year. The Independent Board Members also considered Nuveen’s revenues for advisory activities, expenses, and profit margin compared to that of various unaffiliated management firms with similar amounts of assets under management and relatively comparable asset composition prepared by Nuveen.
In reviewing profitability, the Independent Board Members recognized the subjective nature of determining profitability which may be affected by numerous factors including the allocation of expenses. Further, the Independent Board Members recognized the difficulties in making comparisons as the profitability of other advisers generally is not publicly available and the profitability information that is available for certain advisers or management firms may not be representative of the industry and may be affected by, among other things, the adviser’s particular business mix, capital costs, types of funds managed and expense allocations. Notwithstanding the foregoing, the Independent Board Members reviewed Nuveen’s methodology and assumptions for allocating expenses across product lines to determine profitability. In reviewing profitability, the Independent Board Members recognized Nuveen’s investment in its fund business. Based on their review, the Independent Board Members concluded that Nuveen’s level of profitability for its advisory activities was reasonable in light of the services provided.
In evaluating the reasonableness of the compensation, the Independent Board Members also considered other amounts paid to a Fund Adviser by the Funds as well as any indirect benefits (such as soft dollar arrangements, if any) the Fund Adviser and its affiliates receive, or are expected to receive, that are directly attributable to the management of the Funds, if any. See Section E below for additional information on indirect benefits a Fund Adviser may receive as a result of its relationship with the Funds. Based on their review of the overall fee arrangements of each Fund, the Independent Board Members determined that the advisory fees and expenses of the respective Fund were reasonable.
D. Economies of Scale and Whether Fee Levels Reflect These Economies of Scale
With respect to economies of scale, the Independent Board Members have recognized the potential benefits resulting from the costs of a fund being spread over a larger asset base, although economies of scale are difficult to measure and predict with precision, particularly on a fund-by-fund basis. One method to help ensure the shareholders share in these benefits is to include breakpoints in the advisory fee schedule. Generally, management fees for funds in the Nuveen complex are comprised of a fund-level component and a complex-level component. With respect to the fund-level breakpoint schedules, the Independent Board Members generally review and consider the applicable fund-level breakpoints in the advisory fee schedules for the funds in the Nuveen fund complex that reduce advisory fees as asset levels increase. The Independent Board Members recognized, however, that the Funds do not have fund-level breakpoints given their unique structures. In addition, pursuant to the complex-wide fee arrangement, the fees of the funds in the Nuveen complex generally are reduced as the assets in the fund complex reach certain levels. The Funds, however, are not assessed a complex-level fee as this is assessed at the Nuveen underlying fund level. The Independent Board Members further recognized that the Funds nevertheless will benefit from reductions in complex-level fees and fund-level fees indirectly as the complex and Nuveen underlying funds reach breakpoint levels and reduce the fees of the Nuveen underlying funds.
Based on their review, the Independent Board Members concluded that the absence of a fund-level breakpoint schedule and of a complex-wide fee arrangement was acceptable.
E. Indirect Benefits
In evaluating fees, the Independent Board Members received and considered information regarding potential “fall out” or ancillary benefits the respective Fund Adviser or its affiliates may receive as a result of its relationship with each Fund. In this regard, the Independent Board Members considered, among other things, any sales charges, distribution fees and shareholder services fees received and retained by the Funds’ principal underwriter, an affiliate of NAM, which includes fees received pursuant to any 12b-1 plan. The Independent Board Members, therefore, considered the 12b-1 fees retained by Nuveen during the last calendar year.
In addition to the above, the Independent Board Members considered whether each Fund Adviser received any benefits from soft dollar arrangements whereby a portion of the commissions paid by a Fund for brokerage may be used to acquire research that may be useful to the Fund Adviser in managing the assets of the Funds and other clients. With respect to NAM, the Independent Board Members noted that NAM does not currently have any soft dollar arrangements; however, to the extent certain bona fide agency transactions that occur on markets that traditionally trade on a principal basis and riskless principal transactions are considered as generating “commissions,” NAM intends to comply with the applicable safe harbor provisions. With respect to the Sub-Adviser, the Independent Board Members considered that the Sub-Adviser may benefit from its soft dollar arrangements pursuant to which it receives research from brokers that execute the applicable Fund’s portfolio transactions. The Independent Board Members further noted that the Sub-Adviser’s profitability may be lower if it were required to pay for this research with hard dollars.
Based on their review, the Independent Board Members concluded that any indirect benefits received by a Fund Adviser as a result of its relationship with the Funds were reasonable and within acceptable parameters.
F. Other Considerations
The Independent Board Members did not identify any single factor discussed previously as all-important or controlling. The Board Members, including the Independent Board Members, unanimously concluded that the terms of the Investment Management Agreements and Sub-advisory Agreements are fair and reasonable, that the respective Fund Adviser’s fees are reasonable in light of the services provided to each Fund and that the Investment Management Agreements and the Sub-advisory Agreements be renewed.
Notes
Notes
Glossary of Terms Used in this Report
Average Annual Total Return: This is a commonly used method to express an investment’s performance over a particular, usually multi-year time period. It expresses the return that would have been necessary each year to equal the investment’s actual cumulative performance (including change in NAV or offer price and reinvested dividends and capital gains distributions, if any) over the time period being considered.
Net Asset Value (NAV): A Fund’s NAV is the dollar value of one share in the Fund. It is calculated by subtracting the liabilities of the Fund from its total assets and then dividing the remainder by the number of shares outstanding. Fund NAVs are calculated at the end of each business day.
Fund Information
Fund Manager
Nuveen Asset Management
333 West Wacker Drive
Chicago, IL 60606
Sub-Adviser
Nuveen Investment Solutions, Inc.
333 West Wacker Drive
Chicago, IL 60606
Legal Counsel
Chapman and Cutler LLP
Chicago, IL
Independent Registered Public Accounting Firm
PricewaterhouseCoopers LLP
Chicago, IL
Custodian
State Street Bank & Trust Company
Boston, MA
Transfer Agent and Shareholder Services
Boston Financial
Data Services
Nuveen Investor Services
P.O. Box 8530
Boston, MA 02266-8530
(800) 257-8787
Distribution Information: The Funds hereby designate their percentages of dividends paid from net ordinary income as dividends qualifying for the 70% dividends received deduction (“DRD”) for corporations and their percentages as qualified dividend income (“QDI”) for individuals under Section 1 (h)(11) of the Internal Revenue Code as shown in the accompanying table. The actual qualified dividend income distributions will be reported to shareholders on Form 1099-DIV which will be sent to shareholders shortly after calendar year end.
| | | | |
| Fund | | % of DRD | | % of QDI |
Nuveen Growth Allocation Fund | | 9.01% | | 49.39% |
Nuveen Moderate Allocation Fund | | 12.07% | | 29.24% |
Nuveen Conservative Allocation Fund | | 3.45% | | 11.79% |
Quarterly Portfolio of Investments and Proxy Voting Information: You may obtain (i) each Fund’s quarterly portfolio of investments, (ii) information regarding how the Funds voted proxies relating to portfolio securities held during the most recent twelve-month period ended June 30, and (iii) a description of the policies and procedures that the Funds used to determine how to vote proxies relating to portfolio securities without charge, upon request, by calling Nuveen Investments at (800) 257-8787 or on Nuveen’s website at www.nuveen.com.
You may also obtain this and other Fund information directly from the Securities and Exchange Commission (“SEC”). The SEC may charge a copying fee for this information. Visit the SEC on-line at http://www.sec.gov or in person at the SEC’s Public Reference Room in Washington, D.C. Call the SEC at (202) 942-8090 for room hours and operation. You may also request Fund information by sending an e-mail request to publicinfo@sec.gov or by writing to the SEC’s Public Reference Section at 100 F Street NE, Washington, D.C. 20549.
The Financial Industry Regulatory Authority (“FINRA”) provides a Public Disclosure Program which supplies certain information regarding the disciplinary history of FINRA members and their associated persons in response to either telephone inquiries at (800) 289-9999 or written inquiries at www.finra.org. FINRA also provides an investor brochure that includes information describing the Public Disclosure Program.
Nuveen Investments:
Serving Investors For Generations
Since 1898, financial advisors and their clients have relied on Nuveen Investments to provide dependable investment solutions through continued adherence to proven, long-term investing principles. Today, we offer a range of high quality equity and fixed-income solutions designed to be integral components of a well-diversified core portfolio.
Focused on meeting investor needs.
Nuveen Investments is a global investment management firm that seeks to help secure the long-term goals of institutions and high net worth investors as well as the consultants and financial advisors who serve them. We market our growing range of specialized investment solutions under the high-quality brands of HydePark, NWQ, Nuveen, Santa Barbara, Symphony, Tradewinds and Winslow Capital. In total, Nuveen Investments managed approximately $150 billion of assets on June 30, 2010.
Find out how we can help you.
To learn more about the products and services of Nuveen Investments may be able to help you meet your financial goals, talk to your financial advisor, or call us at (800) 257-8787. Please read the information provided carefully before you invest. Investors should consider the investment objective and policies, risk considerations, charges and expenses of any investment carefully. Where applicable, be sure to obtain a prospectus, which contains this and other relevant information. To obtain a prospectus, please contact your securities representative or Nuveen Investments, 333 W. Wacker Dr., Chicago, IL 60606. Please read the prospectus carefully before you invest or send money.
Learn more about Nuveen Funds at: www.nuveen.com/mf
Nuveen makes things e-simple.
It only takes a minute to sign up for e-Reports. Once enrolled, you’ll receive an e-mail as soon as your Nuveen Fund information is ready. No more waiting for delivery by regular mail. Just click on the link within the e-mail to see the report and save it on your computer if you wish.
Free e-Reports right to your e-mail!
www.investordelivery.com
If you receive your Nuveen Fund dividends and statements from your financial advisor or brokerage account.
OR
www.nuveen.com/accountaccess
If you receive your Nuveen Fund dividends and statements directly from Nuveen.
| | |
Distributed by Nuveen Investments, LLC 333 West Wacker Drive Chicago, IL 60606 www.nuveen.com | | |
MAN-ALLO-0610P

Mutual Funds
Nuveen Value Funds
For investors seeking long-term capital appreciation.
Annual Report
June 30, 2010
| | | | | | | | | | | | | | | | |
| Nuveen Multi-Manager Large-Cap Value Fund | | | | Nuveen NWQ
Multi-Cap
Value Fund | | | | Nuveen NWQ
Large-Cap
Value Fund | | | | Nuveen NWQ
Small/Mid-Cap
Value Fund | | | | Nuveen NWQ
Small-Cap
Value Fund |
| | | | | | | | | | | | | | | | |
| Nuveen Tradewinds Value Opportunities Fund | | | | | | | | | | | | | | | | |
NUVEEN INVESTMENTS ANNOUNCES STRATEGIC COMBINATION WITH FAF ADVISORS
On July 29, 2010, Nuveen Investments, Inc. announced that U.S. Bancorp will receive a 9.5% stake in Nuveen Investments and cash consideration in exchange for the long-term asset business of U.S. Bancorp’s FAF Advisors (FAF). Nuveen Investments is the parent of Nuveen Asset Management (NAM), the investment adviser for the Funds included in this report.
FAF Advisors, which currently manages about $25 billion of long-term assets and serves as the advisor of the First American Funds, will be combined with NAM, which currently manages about $75 billion in municipal fixed income assets. Upon completion of the transaction, Nuveen Investments, which currently manages about $150 billion of assets across several high-quality affiliates, will manage a combined total of about $175 billion in institutional and retail assets.
This combination will not affect the investment objectives, strategies or policies of the Funds in this report. Over time, Nuveen Investments expects that the combination will provide even more ways to meet the needs of investors who work with financial advisors and consultants by enhancing the multi-boutique model of Nuveen Investments, which also includes highly respected investment teams at NWQ Investment Management, Santa Barbara Asset Management, Symphony Asset Management, Tradewinds Global Investors, Winslow Capital and Nuveen HydePark.
The transaction is expected to close late in 2010, subject to customary conditions.
| | | | | | |
| Must be preceded by or accompanied by a prospectus. | | NOT FDIC INSURED | | MAY LOSE VALUE | | NO BANK GUARANTEE |
Chairman’s
Letter to Shareholders

Dear Shareholder,
The economic environment in which your Fund operates reflects continuing but uneven economic recovery. The U.S. and other major industrial countries are experiencing steady but comparatively low levels of economic growth, while emerging market countries are seeing a resumption of relatively strong economic expansion. The potential impact of steps being considered by many governments to counteract the extraordinary governmental spending and credit expansion to deal with the recent financial and economic crisis is injecting uncertainty into global financial markets. The implications for future tax rates, government spending, interest rates and the pace of economic recovery in the U.S. and other leading economies are extremely difficult to predict at the present time. The long term health of the global economy depends on restoring some measure of fiscal discipline around the world, but since all of the corrective steps require economic pain, it is not surprising that governments are reluctant to undertake them.
In the near term, governments remain committed to furthering economic recovery and realizing a meaningful reduction in their national unemployment rates. Such an environment should produce continued economic growth and, consequently, attractive investment opportunities. Over the longer term, the larger uncertainty mentioned earlier carries the risk of unexpected potholes in the road to sustained recovery. For this reason, Nuveen’s investment management teams are working hard to balance return and risk by building well-diversified portfolios, among other strategies. I encourage you to read the following commentary on the management of your Fund. As always, I also encourage you to contact your financial consultant if you have any questions about your Nuveen Fund investment. Please consult the Nuveen website for the most recent information on your Nuveen Fund at: www.nuveen.com.
On behalf of the other members of your Fund’s Board, we look forward to continuing to earn your trust in the months and years ahead.
Sincerely,

Robert P. Bremner
Chairman of the Board
August 17, 2010
Portfolio Managers’ Comments
Certain statements in this report are forward-looking statements. Discussions of specific investments are for illustration only and are not intended as recommendations of individual investments. The forward-looking statements and other views expressed herein are those of the portfolio managers as of the date of this report. Actual future results or occurrences may differ significantly from those anticipated in any forward-looking statements, and the views expressed herein are subject to change at any time, due to numerous market and other factors. The Funds disclaim any obligation to update publicly or revise any forward-looking statements or views expressed herein.
The Nuveen Multi-Manager Large-Cap Value Fund is co-managed by Institutional Capital LLC (ICAP), HydePark Group, LLC, and Symphony Asset Management, LLC. HydePark and Symphony are affiliates of Nuveen Investments. Jerrold Senser and Thomas R. Wenzel oversee the portion of the Fund’s assets managed by ICAP. David Tierney, PhD, John Gambla, CFA, and Rob Guttschow, CFA, performed a similar function at HydePark during most of this reporting period. In June 2010, David Tierney relinquished his management responsibilities for the Fund. David Wang and Rick Brandt oversaw the portion of the Fund’s assets managed by Symphony for most of the period. In June 2010, David and Rick’s management duties for this Fund were transferred to Gunther Stein, director of investment strategies at Symphony. In July 2010, after the close of the reporting period, Ross Sakamoto joined Gunther on the management team for Symphony’s portion of the Fund’s assets. All these individuals have more than 15 years of investment industry experience.
The Nuveen NWQ Multi-Cap Value Fund, Nuveen NWQ Large-Cap Value Fund, Nuveen NWQ Small/Mid-Cap Value Fund and Nuveen NWQ Small-Cap Value Fund feature equity management by NWQ Investment Management Company, LLC, an affiliate of Nuveen Investments. Jon Bosse is the Chief Investment Officer of NWQ and manages the Multi-Cap Value and Large-Cap Value Funds. Phyllis Thomas manages the Nuveen Small/Mid-Cap Value and Small-Cap Value Funds. Both Jon and Phyllis have more than 25 years of investment industry experience.
The Nuveen Tradewinds Value Opportunities Fund features portfolio management by Tradewinds Global Investors, LLC, an affiliate of Nuveen Investments. Dave Iben, Chief Investment Officer of Tradewinds, is the portfolio manager for the Fund. Dave has more than 25 years of investment management experience.
In the following discussion, representatives from each management team review key investment strategies and the performance of the Funds for the twelve-month period ended June 30, 2010.
What were the general economic and market conditions during the reporting period?
As the reporting period began, there continued to be considerable downward pressure on the economy and both the Federal Reserve (Fed) and the federal government continued their efforts to improve the overall economic environment. For its part, the Fed continued to hold the benchmark fed funds rate in a target range of zero to 0.25% after cutting it to this record low level in December 2008.
At its June 2010 meeting, the central bank renewed its pledge to keep the fed funds rate “exceptionally low” for an “extended period.” As part of its efforts, the federal government put into place the American Recovery and Reinvestment Act of 2009, a $787
billion economic stimulus package intended to provide job creation, tax relief, fiscal assistance to state and local governments and expansion of unemployment benefits and other federal social welfare programs.
During the twelve-month period, these and other measures taken by the Fed and the government to ease the economic recession helped to produce some signs of improvement. Over the four calendar quarters comprising this period, the U.S. economy, as measured by the U.S. gross domestic product (GDP), grew at annualized rates of 1.6%, 5.0%, 3.7% and an estimated 2.4%. This marked the first time since 2007 that the economy managed to string together four consecutive positive quarters. Housing also provided something of a bright spot, as the S&P/Case-Shiller Home Price Index of average residential prices from 20 large urban areas gained 4.6% for the twelve months ended May 2010 (the most recent data available at the time this report was produced). This moved average home prices across the United States to levels similar to where they were in the autumn of 2003.
Inflation also continued to be relatively tame, as the Consumer Price Index (CPI) rose 1.1% year-over-year as of June 2010. While labor markets remained weak, recent months have seen some improvement. As of June 2010, the national unemployment rate was 9.5%, the same level as June 2009 but below the 26-year high of 10.1% in October 2009.
Equity markets across the globe rallied during the reporting period and many indexes reached highs in April 2010 that had not been seen since 2008. Nevertheless, financial markets faced numerous obstacles throughout the period. Rating agencies downgraded the sovereign debt of Greece and threatened to downgrade Spain’s obligations. Dubai World announced over Thanksgiving that it would need to restructure its debt. In response to the financial crisis, the Bank for International Settlements issued the so-called “Basel III” guidelines, proposing stricter regulations regarding banks’ capital and liquidity requirements. Investors were divided over how the various proposals to address U.S. health care coverage would impact industry participants. Each new event seemed to be followed by market volatility.
The U.S. large cap equity indices, while volatile, performed favorably for most of the year. This was driven in part by generally attractive stock valuations, and economic data that seemed to point toward greater stability and a moderate economic recovery. Retail sales, equipment spending, and exports had strengthened, while manufacturing and trade inventories had started to build following nearly two years of inventory liquidation. The housing market also appeared to be on a gradual mend, although there were some potential warning signs emerging. On the corporate front, access to the debt and equity markets vastly improved as companies were able to raise capital to bolster their balance sheets without being severely punished, which had been the case previously. The strong upward momentum in stock prices was derailed in May and June, however, on heightened concerns that a sovereign debt crisis in Greece could imperil other European countries also facing default. Stocks weakened as investors feared that fiscal belt-tightening, increased taxes, and financial reform could choke off the global economic recovery that was taking hold.
How did the Funds perform during the twelve-months ended June 30, 2010?
The table on page 14 provides performance information for the six Funds (Class A Shares at net asset value) for the one-year, five-year, ten-year and since inception periods ended
June 30, 2010. The table also compares the Funds’ performance to appropriate general market indexes. A more detailed account of each Fund’s relative performance is provided later in this report.
What strategies were used to manage the Funds during the reporting period? How did these strategies influence performance?
Nuveen Multi-Manager Large-Cap Value Fund
The Nuveen Multi-Manager Large-Cap Value Fund’s Class A Shares at net asset value outperformed the comparative Lipper Index and S&P 500 Index, but underperformed the Russell 1000 Value Index over the twelve-months ending June 30, 2010.
The Fund uses three separate sub-advisors to seek large capitalization value stocks with the potential for long-term capital appreciation. ICAP uses a value-oriented investment strategy that attempts to identify stocks offering the best relative value and stable to rising earnings from a universe of large and mid-sized companies. It then selects a portion of those stocks that are identified to have a catalyst for change, and monitors these holdings closely to determine if circumstances change. HydePark’s investment process does not endeavor to pick individual stocks. Rather, the investment process is implemented through proprietary software that takes a given benchmark, along with specified tracking risk, and produces a portfolio that seeks to maximize value-added performance within the defined risk parameters relative to the benchmark. Symphony seeks to deliver consistent returns though an investment process that combines quantitative screens and fundamental research. The portfolio construction process utilizes a proprietary optimizer designed to potentially generate an optimal risk reward balance versus the stated benchmark.
For the portion of the Fund managed by ICAP, modestly negative stock selection was the main factor behind a slight underperformance relative to the comparative indexes. However, the Fund did benefit to a small extent from helpful sector positioning.
Within this portion of the portfolio, specific stock selection within the financials, retail and technology sectors detracted from relative performance, while positive results from our energy, communications and basic industries investments added to relative performance. Meanwhile, on a sector-positioning basis, the largest relative performance contributions came from having less exposure than the Russell Index to the weak-performing energy and utilities groups. In contrast, maintaining an underweighting in property companies — which did well as a whole — and an overweighting in the lagging health care group detracted from return.
During the reporting period, we maintained our consistent bottom-up stock-selection investment process. That is, we selected investments one-by-one, based on our assessment of their valuation and prospects for price improvement compared with other stocks. We continued to sell or reduce our exposure to stocks we believed offered limited upside potential, while we bought or added to positions that appeared to provide good value and offered a potential catalyst for a rising stock price.
As the stock market’s rally became extended, we felt that many of the portfolio’s most economically sensitive holdings offered more limited upside potential. At the same time, we started to see better values among noncyclical companies — meaning those that were
less sensitive to a fluctuating economy — and felt that a slowing economy could put added pressure on cyclical stocks. Accordingly, we reduced the portfolio’s allocation to cyclical businesses while adding to our weighting in their noncyclical counterparts. Another area of emphasis was on well-run companies displaying strong financial positions — qualities we believed could help these businesses gain market share from weaker competitors and more easily grow their earnings.
The biggest individual detractors from the Fund’s performance during the past year were Qualcomm, Aflac and Sanofi-Aventis. Qualcomm, which makes a key technology found in mobile telephones, saw its stock price fall on investors’ concerns about the company’s earnings power. Aflac was hurt by worries about exposure to troubled European debt in its investment portfolio, which could affect the insurance provider’s financial position. Shares of Sanofi-Aventis, a global pharmaceutical maker based in France, were hampered by uncertainty about the outlook for the health care industry. In all three cases, we continued to own the stocks at period end, as we believed they were attractively valued and displayed strong catalysts for potential future outperformance.
On the positive side, rail transportation company CSX was the Fund’s top individual contributor. CSX benefited from its ability to preserve pricing power and manage costs effectively throughout the economy’s decline. In addition, when the economy recovered, the company took advantage of its strong market position to improve profit margins and earnings. Another helpful stock was Caterpillar, a maker of construction and mining equipment that also benefited from favorable pricing and cost controls — two factors that, along with strong demand for its products, lifted the company’s earnings. In addition, gold miner and producer Newmont Mining continued to benefit from the high price of gold. At period end, we continued to own all three of these positive performers. We did, however, trim our position in CSX because we believed its upside potential was more limited following its recent strength.
For the portion of the Fund’s assets managed by Hyde Park, the Fund on average was overweighted in consumer discretionary, financials, and telecommunication services issues and underweighted in energy, industrials, consumer staples, and information technology stocks during the reporting period. The largest single sector overweight was in telecommunication services, where the Fund on average was 0.80% overweight versus the index. The largest single underweight was in industrials, where the Fund on average was 0.70% underweight versus the index. Overall, sector weightings were a negative to the Fund’s relative performance versus the Russell Index.
Performance attributable to the individual stock holdings within each sector was a positive for the Fund, with the stock picks within the consumer discretionary and industrial sectors having the largest positive impacts. The holdings within the materials, health care and utility sectors provided positive results. Holdings within the information technology and financials produced negative relative performance for the Fund.
For the portion of the Fund managed by Symphony, we remained invested in companies with relatively strong fundamentals. Our overweight exposure to semiconductor and computer hardware companies detracted modestly from total return, but our underweight exposure to oil refiners and long distance telephone industries compensated for this underperformance. Our underweight exposure to electrical utilities also hurt performance. Our emphasis on selecting companies with good growth characteristics and sound fundamentals struggled in this period.
The Fund’s exposure to Cimarex, an oil exploration & production company, DirecTV and the Hershey Company all positively contributed to performance. Seagate Technology, a computer memory devices company, Freeport-McMoran Copper & Gold and United States Steel all detracted from performance. We eliminated our position in Cimarex during the reporting period.
Nuveen NWQ Multi-Cap Value Fund
The Nuveen NWQ Multi-Cap Value Fund’s Class A Shares at net asset value outperformed each of the comparative indexes for the twelve-month period ended June 30, 2010.
The Fund seeks long-term capital appreciation by investing in equity securities of companies with large, medium and small market capitalizations that are selected on an opportunistic basis. Generally, the Fund’s managers look for undervalued companies where catalysts exist that may help unlock value or improve profitability. Such catalysts can be new management, improving fundamentals, renewed management focus, industry consolidation or company restructuring.
Our investments in Genworth Financial Inc. and Hartford Financial Services Group Inc. were standout performers for the period. Similar factors drove both stocks, including improved financial flexibility due to recent capital raises; continued improvement in the prices of securities held within their investment portfolios; and appreciation in the global equity markets and signs of stabilization in the housing market. Both companies continue to trade at what we think are significant discounts to book value, and we believe both still offer favorable risk/reward potential.
In the durables sector, equipment manufacturer, Ingersoll-Rand Co. Ltd, appreciated as recent restructuring efforts, as well as synergies from the integration of Trane (a large acquisition they made last year), resulted in better than expected earnings. Solid free cash flow growth is also allowing the company to de-lever its business. Our investments in media companies, CBS Corp., Interpublic Group of Companies, and Viacom Inc., also posted strong gains reflecting recovery from depressed valuations and an anticipation of a continued improvement in the economy. The valuations of these firms had been overly punished based on recession concerns and muted corporate advertising levels.
Biovail Corp., a specialty Canadian pharmaceutical that we added to the portfolio in February, rose sharply as the company agreed to merge with Valeant Pharmaceutical. The deal significantly expands the asset base for Biovail, thus reducing the risk of any single pipeline asset derailing its growth trajectory. Valeant brings with it a strong portfolio of growing pharmaceutical assets with extremely limited patent expiration risk.
A few names in particular detracted from performance. Our investment in independent power producer, NRG Energy Inc., declined as natural gas prices have not appreciated as much as investors had anticipated. NRG earns a greater operating margin when natural gas prices move higher and its hedged coal costs remain stable. Fears of potential pricing pressure in Europe as a result of fiscal tightening weighed on our large cap pharmaceutical investments, an industry in which we have made significant purchases recently. Our large cap pharmaceutical holdings include Amgen Inc., Merck & Co. Inc., Pfizer Inc., and Sanofi-Aventis S.A. Pharmaceutical companies generally operate with
healthy margins, and we expect that the European governments will look towards these companies to help offset some of their budget deficits through increased taxes and/or price concessions. Our investment in Hess Corp., an energy exploration and production firm, also underperformed as the company had disappointing exploration results offshore Brazil (Guarani prospect) in July 2009, and more recently due to concerns about the moratorium on drilling activity in the Gulf of Mexico as a consequence of the tragic accident and oil spill in the region. Ten percent of Hess’ current production (40% of U.S. production) is generated offshore in the Gulf of Mexico, and the company has two large exploration projects in the area.
Throughout the period we added several names to the Fund. In addition to Biovail Corp., we added to our health care investments with new positions in Merck & Co. Inc. and Pfizer Inc. We believed Merck was trading at a compelling valuation, and it has a disciplined management team that has not historically diluted shareholders. In addition, in our opinion, the company has one of the best track records in bringing a number of highly profitable new drugs to market. Pfizer’s stock has lagged following its merger with Wyeth, as the company’s large deals historically have not earned sufficient returns on capital. In addition, Pfizer is facing the expiration of its patent on Lipitor, its largest drug. However, we believe that the free cash flow story beginning next year at Pfizer (post the Wyeth cash restructuring charges) is not being properly valued by the market, and we expect that management will be focused on paying down debt and driving shareholder value rather than on doing additional large acquisitions.
In the insurance industry, we invested in Tower Group Inc. and Unum Group. Tower Group is a specialized small-cap insurer that provides property casualty insurance to small and mid-sized businesses. Unum Group is the largest writer of disability income products in the U.S. and U.K. Despite the economic and market turmoil that has wreaked havoc on other life insurers, Unum has continued to deliver steadily rising earnings.
We also re-invested in Citigroup as the company was raising capital to repay obligations assumed under the Troubled Asset Relief Program (TARP) and terminate its loss sharing agreement with the U.S. Treasury. We had eliminated our previous position in Citigroup in early October 2008 at more than five times the price of this most recent purchase. We believed the stock offered compelling valuation, trading at a steep discount to tangible book value, and roughly six times its estimated normalized earnings power — which we believe could provide some downside protection. We also invested opportunistically in PrivateBancorp, a regional commercial bank located in Chicago, as the company was recapitalizing. We believed the stock provided a very attractive risk/reward profile given its depressed valuation, strong capital position, and experienced management team.
In the energy sector, we invested in Denbury Resources, Inc. and Petrohawk Energy Corp. Denbury is a mid-sized exploration & production company that focuses on tertiary oil recovery from mature oil fields by injecting carbon dioxide (CO2) into the reservoir. The company has recently shed a natural gas asset (Barnett Shale) to purchase an oil asset (Conroe Field) that should result in higher margins and improved net cash flow.
In the durables sector, Convergys Corp. and Trinity Industries Inc. were new investments. Convergys is an Ohio-based customer management firm that operates call centers
(predominately in India and the Philippines), and provides billing and information software to the communications industry. Trinity Industries controls 40-45% of the freight railcar market, and also produces barges, highway products, and structural wind towers.
Lastly, we invested in Aurizon Mines Ltd., a Canadian gold company with major assets in Quebec. The company’s main asset, the Casa Berardi mine, produces roughly 150,000 ounces of gold annually at a cost that is comparable to its peers.
Throughout the period we eliminated several positions as well. We sold Agilent Technologies Inc., as we felt the stock offered a less compelling risk/reward following strong appreciation. We also exited our position in Lorillard Inc. following strong appreciation in its stock price. In July, we eliminated U.S. Steel Corp., as the stock had doubled off its recent lows on expectations of a recovery in the steel industry. CF Industries Holdings Inc. was eliminated because we thought the shares had reached fair value in relation to the hostile takeover bid by rival Agrium Inc. Other holdings eliminated during the period include Comcast Corp., EOG Resources Inc., Sepracor Inc., and TransAtlantic Holdings Inc.
Nuveen NWQ Large-Cap Value Fund
The Nuveen NWQ Large-Cap Value Fund’s Class A Shares at net asset value outperformed the comparative Lipper Index, but underperformed the Russell 1000 Value Index for the twelve-month period ended June 30, 2010.
The Fund seeks long-term capital appreciation by investing in equity securities of companies with large market capitalizations that are selected on an opportunistic basis. Generally, the Fund’s managers look for undervalued companies where catalysts exist that may help unlock value or improve profitability. Such catalysts can be new management, improving fundamentals, renewed management focus, industry consolidation or company restructuring.
For this reporting period, our Genworth Financial Inc. and Hartford Financial Services Group Inc. investments were standout performers. Similar factors drove both stocks, including improved financial flexibility due to recent capital raise ups, continued improvement in the prices of securities held within their investment portfolios, appreciation in the global equity markets and signs of stabilization in the domestic housing market. Both companies continue to trade at what we believe are significant discounts to book value, and we think both still offer favorable risk/reward potential.
Gold bullion hit a new nominal high above $1,250 per ounce in June 2010, spurred by the sovereign debt crisis in Europe, and a flight to safety into gold on fears over the future of the European currency. Our gold mining equities AngloGold Ashanti Ltd. and Barrick Gold Corp. benefited from the rise in the bullion price as well as from stable input costs, particularly energy costs, which translated into higher margins. Barrick Gold posted record unit margins and operating cash flow for the first quarter, surpassing market expectations on production and unit costs. AngloGold continues to work though electricity and labor cost issues that have plagued its South African mines. Although the company continues to make progress, it is going to be a multi-quarter effort. Nevertheless, with sixty percent of its production outside of South Africa, AngloGold represents solid leverage to the price of gold, and continues to trade at a significant discount to its peer group of senior gold producers.
In the durables sector, equipment manufacturer, Ingersoll-Rand Co. Ltd, appreciated as recent restructuring efforts, as well as synergies from the integration of Trane (a large acquisition they made last year), resulted in better than expected earnings. Solid free cash flow growth is also allowing the company to de-lever its business. Union Pacific Corp. also outperformed on expectations that demand for railroad services is set to recover as inventory destocking appears to have come to an end in many sectors of the economy. As the economic recovery continues to unfold, volume growth, operating leverage, and earnings power for the rails is expected to continue to improve.
Negatively impacting the Fund’s performance was our investment in fertilizer producer Mosaic Co., which declined as potash pricing, while stable, did not increase as much as expected. Moreover, the outlook for crop prices, particularly for corn and soybeans, has weakened due to favorable weather conditions and increased acreage planted. Fertilizer stocks such as Mosaic are highly correlated to crop prices. Independent power producer NRG Energy Inc., declined as natural gas prices have not appreciated as much as investors had anticipated. NRG earns a greater operating margin when natural gas prices move higher and its hedged coal costs remain stable. Lockheed Martin Corp. underperformed given concerns about reduced defense spending and expectations for higher pension expense in 2010. However, we believe that many of the potential headwinds that Lockheed faces are already priced in the stock and that the company remains attractively valued given its historically strong cash flows, exposure to international markets, and management’s solid track record.
Throughout the period, we added several names to the Fund’s portfolio. In the insurance industry, we invested in Lincoln National Corp. and Unum Group. We bought Lincoln National as the company was raising capital to repay TARP loans and to provide long-term financing for its universal life reserves. This capital raise up improved the company’s financial position, and removed an overhang on the stock. Unum Group is the largest writer of disability income products in the U.S. and U.K. Despite the economic and market turmoil that has wreaked havoc on other life insurers, Unum has continued to deliver steadily rising earnings. The company has an extremely high quality investment portfolio, and the strongest balance sheet of any of its peers.
We re-invested in Citigroup as the company was raising capital to repay its TARP obligation and terminate its loss sharing agreement with the U.S. Treasury. We had eliminated our previous position in Citigroup in early October 2008 at more than five times the price of this most recent purchase. We believed the stock offered compelling valuation, trading at a steep discount to tangible book value, and roughly six times its estimated normalized earnings power – which we believe could provide some downside protection.
We invested in Kroger Co., one of the nation’s leading food and drug retailers, based on attractive valuation and the expectation of upcoming catalysts, as the stock has been out of favor for reasons that have plagued the entire food and retailing industry. We also invested in CVS Caremark Corp., a retail pharmacy and pharmacy services provider, on premise that the market was not giving the company any credit for the synergies created by its purchase of pharmacy benefit manager (PBM) Caremark Rx two years ago in a deal which created the most vertically integrated pharmacy in the country. We added to our energy exposure by swapping our position in EOG Resources Inc. for Canadian Natural
Resources (CNQ), given that we believed CNQ offered a better valuation and more visible catalysts. We also purchased ConocoPhillips, and Occidental Petroleum Corp., although we sold the ConocoPhillips position and reduced our holdings of Occidental before the end of the period. ConocoPhillips announced a corporate restructuring where the company will focus on selling $15-$20 billion of assets, thereby raising returns, paying down some debt, and repurchasing shares. Occidental has a strong balance sheet, low cost structure, and one of the highest returns on capital employed in the industry.
In the health care sector, we added a position in Pfizer, Inc., the world’s largest branded pharmaceutical company. Pfizer’s stock has lagged post its merger with Wyeth, as the company’s large deals have historically not earned sufficient returns on capital. In addition, Pfizer is facing the expiration of its patent on Lipitor, its largest drug. However, we believe that the free cash flow story beginning next year at Pfizer (post the Wyeth cash restructuring charges) is not being properly discounted by the market, and we expect that management will be focused on paying down debt and driving shareholder value rather than on doing additional large acquisitions.
We eliminated several positions throughout the period as well. We sold Agilent Technologies Inc. as we felt the stock offered a less compelling risk/reward profile following strong appreciation. We also exited our position in Lorillard Inc. following strong appreciation in its stock price. We eliminated U.S. Steel Corp. as the stock had doubled off its recent lows on expectations of a recovery in the steel industry. Kraft Foods Inc. was sold from the portfolio after the company announced a bid to acquire U.K. chocolate maker, Cadbury PLC. Cadbury’s business is extremely complementary to Kraft’s European chocolate assets, plus Cadbury provides a strong, growing emerging markets platform. However, given our expectation that Kraft might increase its bid to a level dilutive to its shareholders, we exited the position. Cable operator, Comcast Corp., was eliminated based on valuation. We were also disappointed in management’s decision to enter into a joint-venture with GE to own a majority stake in NBC Universal. AT&T Inc. was sold following the company’s successful restructuring efforts and concerns over slower growth in the wireless market.
Nuveen NWQ Small/Mid-Cap Value Fund
The Nuveen NWQ Small/Mid-Cap Value Fund’s Class A Shares at net asset value outperformed each of the comparative indexes for the twelve-month period ended June 30, 2010.
The Fund continued to follow its disciplined investment approach which seeks long-term capital appreciation by investing in equity securities of companies with small- to mid-market capitalizations selected using an analyst-driven, value-oriented process. The portfolio manager looks for undervalued companies where catalysts exist to unlock value or improve profitability. Such catalysts can be new management, improving fundamentals, renewed management focus, industry consolidation or company restructuring.
For the twelve-month period, the Fund benefited from an overweighted position in the energy and materials and processing sectors. Avocent was the top contributor to the portfolio performance. In the first week of October 2009, Emerson Electric acquired Avocent for $25 per share. We eliminated this position during the reporting period.
Elizabeth Arden was the second largest contributor to positive performance. The company has aggressively cut costs, introduced new fragrances, and broadened its international footprint. As the fragrance category manager for most mass market retailers and with the number one market share in mass market fragrances, the company should benefit significantly from restocking in the retail channel this past spring. We continue to believe the stock is quite undervalued.
SM Energy also contributed positively to performance. SM Energy garnered better attention from the market due to their exposure to a number of top unconventional shale plays, including the Eagleford, Bakken, Haynesville, and Marcellus. During the reporting period, a large well-respected exploration and production competitor highlighted the attractive economics of the Eagleford Shale, where SM Energy has a large acreage position. Another top performer was Gibraltar Industries, a metals processing company. This position was eliminated during the reporting period.
We also had several positions which negatively impacted performance. Brocade Communications Systems underperformed following soft sales in the networking equipment division in the company’s fiscal 2010 first quarter. This reflected the company’s realignment in 2009 of the sales resources and their incentive plans. Also negatively impacting performance was Jaguar Mining. Jaguar acquires, develops and operates gold mineral properties in Brazil. After extensive meetings on-site at Jaguar’s operations in Brazil, we became less convinced of the company’s ability to reach internal growth forecasts, and eliminated the position.
During the reporting period, we established new positions in Aurizon Mines and Forestar Group, and added to existing positions in Brocade, Biovail, Coherent, Globe Specialty Metals, Hormel Foods, Intrepid Potash, Northgate Minerals, and Teradyne. We trimmed positions in Casey’s, Texas Capital, Western Alliance, and Willis Group Holdings, and eliminated General Cable, Jaguar Mining, and Tower Group.
Nuveen NWQ Small-Cap Value Fund
The Nuveen NWQ Small-Cap Value Fund’s Class A Shares at net asset value outperformed each of the comparative indexes for the twelve-month period ended June 30, 2010.
Over this period, the Fund continued to follow its disciplined investment approach. The Fund seeks long-term capital appreciation by investing in equity securities of companies with small market capitalizations selected using an analyst-driven, value-oriented process. Portfolio managers look for undervalued companies where catalysts exist to unlock value or improve profitability. Such catalysts can be new management, improving fundamentals, renewed management focus, industry consolidation or company restructuring.
For the twelve-month period, the Fund benefited from an overweighted position in the energy and materials and processing sectors. Avocent was the top contributor to the portfolio. In the first week of October 2009, Emerson Electric acquired Avocent for $25 per share. We eliminated this position during the reporting period.
SM Energy was the second largest contributor to positive performance. SM Energy garnered better attention from the market due to their exposure to a number of top
unconventional shale plays, including the Eagleford, Bakken, Haynesville, and Marcellus. During the reporting period, a large well-respected exploration and production competitor highlighted the attractive economics of the Eagleford Shale, where SM Energy has a large acreage position. Another top performer was Gibraltar Industries, a metals processing company. The position was trimmed during the reporting period.
Elizabeth Arden also was a contributor to positive performance. The company has aggressively cut costs, introduced new fragrances, and broadened its international footprint. As the fragrance category manager for most mass market retailers and with the number one market share in mass market fragrances, the company should benefit significantly from restocking in the retail channel this past spring. We continue to believe the stock is quite undervalued.
We also had several positions which negatively impacted performance. Brocade Communications Systems underperformed following soft sales in the networking equipment division in the company’s fiscal 2010 first quarter. This reflected the company’s realignment in 2009 of the sales resources and their incentive plans. Smart Balance also was a detractor on performance. Smart Balance was weak on the heels of an earnings preannouncement, as the company reduced its sales guidance from mid-teens to low single digits. Also negatively impacting performance was Bob Evans. Higher sow costs lowered profits in the food processing division. However, we expect sow prices to normalize over time. The company’s management team continues to efficiently manage capital spending on the remodeling initiative. Finally, Jaguar Mining negatively impacted performance. Jaguar acquires, develops and operates gold mineral properties in Brazil. After extensive meetings on-site at Jaguar’s operations in Brazil, we became less convinced of the company’s ability to reach internal growth forecasts, and eliminated the position.
During the reporting period, we established new positions in Aurizon Mines, Convergys, Forestar Group, and Smart Balance, and added to existing positions in Actel, Albany, Bob Evans, Coherent, Globe Specialty Metals, Marten Transport, Northgate Minerals, and Thompson Creek. We trimmed positions in Casey’s, Circor, California Pizza Kitchen, Keithley Instruments, Royal Gold, Texas Capital, and Western Alliance, and eliminated General Cable, Jaguar Mining, RBC Bearings, and Tower Group.
Nuveen Tradewinds Value Opportunities Fund
The Nuveen Tradewinds Value Opportunities Fund’s Class A Shares at net asset value outperformed each of the comparative indexes for the twelve-months ending June 30, 2010.
The Fund seeks long-term capital appreciation by investing in equity securities of companies with varying market capitalizations selected using an active, value-oriented process. Tradewinds seeks to provide superior risk-adjusted returns through an analyst-driven, value-oriented approach. Portfolio managers look for undervalued companies where catalysts exist to unlock value or improve profitability. Such catalysts can be new management, improving fundamentals, renewed management focus, industry consolidation or company restructuring.
A significant portion of the Fund’s relative outperformance was due to its exposure in the energy, materials, and utilities sectors. The Fund’s return in the period was most negatively impaired on a relative basis by its investments in the consumer discretionary, producer durables, and technology sectors. The Fund continued to maintain a significant relative overweight in the materials sector and relative underweight in the financials sector.
The portfolio’s materials sector outperformed the benchmark both on a relative and absolute basis. Gold’s spot price reached an all-time high of more than $1,250 an ounce in mid-June as demand for gold as a store of value soared amid investor fears of the Euro zone debt crisis. The sector’s rally yielded several of the portfolio’s top performers for the period. Newmont Mining, one of the world’s largest gold producers with significant assets or operations in the United States, Australia, Peru, Indonesia, Ghana, Canada, Bolivia, New Zealand, and Mexico was the best performing holding for the period. Lihir Gold Limited, a gold producer in the Australasian region with operations in Papua New Guinea, Australia and West Africa, also made significant contributions to performance. During the period, Lihir announced its merger with Newcrest Mining Limited and the stock price rallied on the news. Another strong performer was Domtar Corporation, a manufacturer and marketer of paper and pulp in North America, which operates in three segments: papers, paper merchants and wood. The company took positive steps to close some of its operations to reduce capacity, and the share price improved due to higher shipments, lower inventories, lower materials and freight costs, improved overall cost control and successful refinancing in June 2009.
The Fund’s single largest detractor from performance during the period was Cameco Corporation, the world’s largest uranium producer. The stock underperformed due to the continual weakness in the mineral’s spot price, which has fallen below last year’s levels. Despite the weakness in the industry, the company’s first quarter 2010 earnings were ahead of consensus expectations. We are still attracted to the long-term fundamentals of the company and the industry and added to the position during the period.
Health Net Incorporated, even though sold from the Fund in July 2009, also was a significant detractor from performance. The company provides managed health care services through health plans and government-sponsored, managed-care plans through its health maintenance organizations (HMOs), insured preferred provider organizations (PPOs) and point-of-service (POS) plans. The stock underperformed during the period along with the entire HMO sector due to concerns about rate cuts resulting from U.S. health care reform efforts.
Tesoro Corporation was another significant detractor from performance. The company refines and markets petroleum products in the United States. The rebound in oil prices during the fourth quarter 2009 period squeezed the company’s refining prices and margins. During the second quarter of 2010 the company had an accident in its Washington refinery resulting in fatalities and investors reacted negatively on the potential impact of the liability to the company.
With all the negative ‘big picture’ news however, many opportunities have been created at the individual company level. As our team of global sector specialists continue to search for companies which fit what we look for — quality companies or survivors trading at a discount to their intrinsic value — we continue to believe that equities will be a source of wealth preservation in these uncertain times.
| 1 | The since-inception returns for the Nuveen NWQ Large-Cap Value Fund and the Nuveen NWQ Small/Mid-Cap Value Fund are from 12/15/06 and the corresponding index returns are from 12/31/06. Since inception returns for the Nuveen NWQ Small Cap Value Fund and the Nuveen Tradewinds Value Opportunities Fund are from 12/9/04 and the corresponding index returns are from 12/31/04. |
| 2 | The Lipper Funds Indexes are managed indexes that represent the average annualized returns of the 30 largest funds in each respective Lipper Funds category. The returns assume reinvestment of dividends, but do not reflect any applicable sales charges. You cannot invest directly in an index. |
| 3 | The Russell 1000 Value Index is a market-capitalization weighted index of those firms in the Russell 1000 Index with lower price-to-book ratios and lower forecasted growth values. The Russell 3000 Value Index is a market capitalization weighted index of those firms in the Russell 3000 Index with lower price-to-book ratios and lower forecasted growth values. The Russell 2500 Value Index is a market capitalization weighted index of those firms in the Russell 2500 Index with lower price-to-book ratios and lower forecasted growth values. The Russell 2000 Value Index measures the performance of those Russell 2000 companies with lower price-to-book ratios and lower forecasted growth values. The index returns assume reinvestment of dividends and do not reflect any applicable sales charges. You cannot invest directly in an index. |
| 4 | The S&P 500 Index is an unmanaged index generally considered to be representative of the U.S. stock market. The index returns assume reinvestment of dividends and do not reflect any applicable sales charges. You cannot invest directly in an index. |
Class A Shares – Average Annual Total Returns
As of 6/30/2010
| | | | | | |
| | | Average Annual |
| | | 1-Year | | 5-Year | | 10-Year |
Nuveen Multi-Manager Large-Cap Value Fund | | | | | | |
A Shares at NAV | | 15.19% | | 0.27% | | 1.89% |
A Shares at Offer | | 8.56% | | -0.91% | | 1.29% |
Lipper Large-Cap Value Funds Index2 | | 13.04% | | -1.29% | | 0.31% |
Russell 1000 Value Index3 | | 16.92% | | -1.64% | | 2.38% |
S&P 500 Index4 | | 14.43% | | -0.79% | | -1.59% |
Nuveen NWQ Multi-Cap Value Fund | | | | | | |
A Shares at NAV | | 20.85% | | -4.29% | | 5.04% |
A Shares at Offer | | 13.86% | | -5.42% | | 4.42% |
Lipper Multi-Cap Value Funds Index2 | | 14.68% | | -2.08% | | 2.49% |
Russell 3000 Value Index3 | | 17.57% | | -1.56% | | 2.74% |
S&P 500 Index4 | | 14.43% | | -0.79% | | -1.59% |
| |
| | | Average Annual |
| | | 1-Year | | 5-Year | | Since
inception1 |
Nuveen NWQ Large-Cap Value Fund | | | | | | |
A Shares at NAV | | 15.89% | | N/A | | -8.02% |
A Shares at Offer | | 9.19% | | N/A | | -9.54% |
Lipper Multi-Cap Value Funds Index2 | | 14.68% | | N/A | | -8.59% |
Russell 1000 Value Index3 | | 16.92% | | N/A | | -9.11% |
Nuveen NWQ Small/Mid-Cap Value Fund | | | | | | |
A Shares at NAV | | 29.50% | | N/A | | -9.01% |
A Shares at Offer | | 22.10% | | N/A | | -10.52% |
Lipper Small-Cap Value Funds Index2 | | 25.50% | | N/A | | -4.70% |
Russell 2500 Value Index3 | | 26.46% | | N/A | | -6.43% |
Nuveen NWQ Small-Cap Value Fund | | | | | | |
A Shares at NAV | | 29.41% | | -1.60% | | -0.71% |
A Shares at Offer | | 21.99% | | -2.76% | | -1.76% |
Lipper Small-Cap Value Funds Index2 | | 25.50% | | 0.90% | | 1.06% |
Russell 2000 Value Index3 | | 25.07% | | -0.51% | | -0.33% |
Nuveen Tradewinds Value Opportunities Fund | | | | | | |
A Shares at NAV | | 23.13% | | 10.55% | | 10.47% |
A Shares at Offer | | 16.07% | | 9.24% | | 9.30% |
Lipper Multi-Cap Core Funds Index2 | | 16.87% | | 0.14% | | 1.62% |
Russell 3000 Value Index3 | | 17.57% | | -1.56% | | -1.13% |
Effective December 6, 2002, based on shareholder approval, the Nuveen NWQ Multi-Cap Value Fund acquired the assets and performance history of the PBHG Special Equity Fund. The Fund had no assets prior to the acquisition. In addition, on December 14, 2001, the PBHG Special Equity Fund acquired the assets of the NWQ Special Equity Portfolio. The information presented for the Nuveen NWQ Multi-Cap Value Fund prior to the acquisition date represents the expense adjusted performance of the predecessor funds.
On March 1, 2006, Tradewinds NWQ Global Investors, LLC assumed all of the sub-advisory responsibilities for the Nuveen NWQ Value Opportunities Fund. Effective June 30, 2006, the name of the Nuveen NWQ Value Opportunities Fund changed to Nuveen Tradewinds Value Opportunities Fund. There have been no changes in the Funds’ portfolio management personnel, investment objectives, policies, or day-to-day portfolio management practices.
Effective November 14, 2007, the Nuveen Multi-Manager Large-Cap Value Fund added two additional sub-advisers and changed its investment objective. Along with Institutional Capital LLC, the additional sub-advisers are Symphony Asset Management, LLC and Nuveen HydePark Group, LLC. The Fund’s investment objective became to provide investors with long-term capital appreciation. Effective May 1, 2008, the Fund changed its name from Nuveen Large-Cap Value Fund to Nuveen Multi-Manager Large-Cap Value Fund.
Returns quoted represent past performance which is no guarantee of future results. Current performance may be higher or lower than the performance shown. Investment returns and principal value will fluctuate so that when shares are redeemed, they may be worth more or less than their original cost. Class A Shares have a 5.75% maximum sales charge. Returns at NAV would be lower if the sales charge were included. Returns do not reflect the deduction of taxes that a shareholder would pay on Fund distributions or the redemption of shares. Returns may reflect a contractual agreement between certain Funds and the investment adviser to waive certain fees and expenses; see Notes to Financial Statements, Footnote 7 — Management Fees and Other Transactions with Affiliates for more information. In addition, returns may reflect a voluntary expense limitation by the Funds’ investment adviser that may be modified or discontinued at any time without notice. For the most recent month-end performance, visit www.nuveen.com or call (800) 257-8787.
Please see each Fund’s Spotlight Page later in this report for more complete performance data and expense ratios.
Nuveen Multi-Manager Large-Cap Value Fund
Growth of an Assumed $10,000 Investment
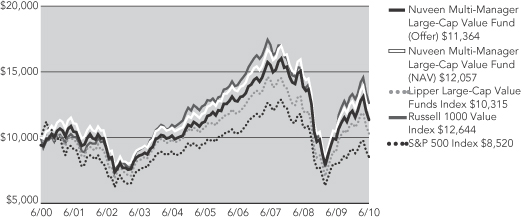
Nuveen NWQ Multi-Cap Value Fund
Growth of an Assumed $10,000 Investment
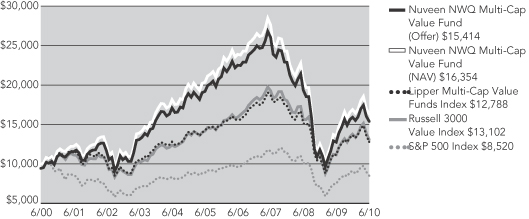
The graphs do not reflect the deduction of taxes that a shareholder may pay on Fund distributions or the redemption of Fund shares.
The index comparisons show the change in value of a $10,000 investment in the Class A Shares of the Nuveen Funds compared with the corresponding indexes. The Lipper Large-Cap Value Funds Index is a managed index that represents the average annualized returns of the 30 largest funds in the Lipper Large-Cap Value Funds category. The Russell 1000 Value Index is a market capitalization-weighted index of those firms in the Russell 1000 Index with lower price-to-book ratios and lower forecasted growth value. The S&P 500 Index is an unmanaged index generally considered to be representative of the U.S. stock market. The Lipper Multi-Cap Value Funds Index is a managed index that represents the average annualized returns of the 30 largest funds in the Lipper Multi-Cap Value Funds category. The Russell 3000 Value Index is a market-capitalization weighted index of those firms in the Russell 3000 Index with lower price-to-book ratios and lower forecasted growth values. The index returns assume reinvestment of dividends and do not reflect any initial or ongoing expenses. You cannot invest directly in an index. The Nuveen Funds’ returns include reinvestment of all dividends and distributions, and the Funds’ returns at the offer price depicted in the charts reflect the initial maximum sales charge applicable to Class A Shares (5.75%) and all ongoing Fund expenses. The performance data quoted represents past performance, which is not indicative of future results. Current performance may be lower or higher than the performance shown.
Nuveen NWQ Large-Cap Value Fund
Growth of an Assumed $10,000 Investment
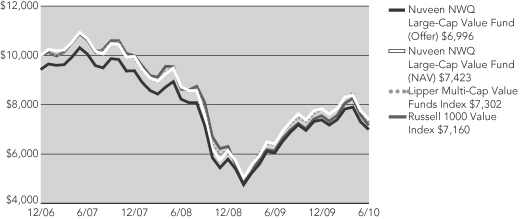
Nuveen NWQ Small/Mid-Cap Value Fund
Growth of an Assumed $10,000 Investment
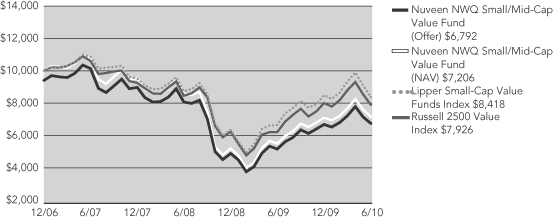
The graphs do not reflect the deduction of taxes that a shareholder may pay on Fund distributions or the redemption of Fund shares.
The index comparisons show the change in value of a $10,000 investment in the Class A Shares of the Nuveen Funds compared with the corresponding indexes. The Lipper Multi-Cap Value Funds Index is a managed index that represents the average annualized returns of the 30 largest funds in the Lipper Multi-Cap Value Funds category. The Russell 1000 Value Index is a market capitalization-weighted index of those firms in the Russell 1000 Index with lower price-to-book ratios and lower forecasted growth value. The Lipper Small-Cap Value Funds Index is a managed index that represents the average annualized returns of the 30 largest funds in the Lipper Small-Cap Value Funds category. The Russell 2500 Value Index is a market capitalization-weighted index of those firms in the Russell 2500 Index with lower price-to-book ratios and lower forecasted growth value. Nuveen Fund returns are from 12/15/06 through 6/30/10. Index returns are from 12/31/06 through 6/30/10. The index returns assume reinvestment of dividends and do not reflect any initial or ongoing expenses. You cannot invest directly in an index. The Nuveen Funds’ returns include reinvestment of all dividends and distributions, and the Funds’ returns at the offer price depicted in the charts reflect the initial maximum sales charge applicable to Class A Shares (5.75%) and all ongoing Fund expenses. The performance data quoted represents past performance, which is not indicative of future results. Current performance may be lower or higher than the performance shown.
Nuveen NWQ Small-Cap Value Fund
Growth of an Assumed $10,000 Investment
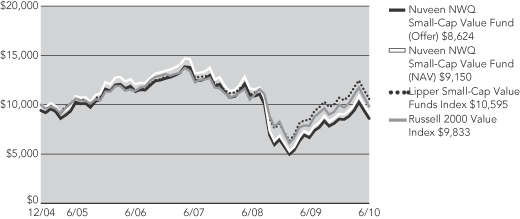
Nuveen Tradewinds Value Opportunities Fund
Growth of an Assumed $10,000 Investment
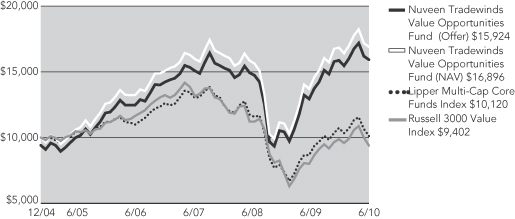
The graphs do not reflect the deduction of taxes that a shareholder may pay on Fund distributions or the redemption of Fund shares.
The index comparisons show the change in value of a $10,000 investment in the Class A Shares of the Nuveen Funds compared with the corresponding indexes. The Lipper Small-Cap Value Funds Index is a managed index that represents the average annualized returns of the 30 largest funds in the Lipper Small-Cap Value Funds category. The Russell 2000 Value Index is a market capitalization-weighted index of those firms in the Russell 2000 Index with lower price-to-book ratios and lower forecasted growth value. The Lipper Multi-Cap Core Funds Index is a managed index that represents the average annualized returns of the 30 largest funds in the Lipper Multi-Cap Core Funds category. The Russell 3000 Value Index is a market capitalization-weighted index of those firms in the Russell 3000 Index with lower price-to-book ratios and lower forecasted growth value. Nuveen Fund returns are from 12/9/04 through 6/30/10. Index returns are from 12/31/04 through 6/30/10. The index returns assume reinvestment of dividends and do not reflect any initial or ongoing expenses. You cannot invest directly in an index. The Nuveen Funds’ returns include reinvestment of all dividends and distributions, and the Funds’ returns at the offer price depicted in the charts reflect the initial maximum sales charge applicable to Class A Shares (5.75%) and all ongoing Fund expenses. The performance data quoted represents past performance, which is not indicative of future results. Current performance may be lower or higher than the performance shown.
Fund Spotlight as of 6/30/10 Nuveen Multi-Manager Large-Cap Value Fund
| | | | | | | | | | |
| Quick Facts | | | | | | | | | | |
| | | A Shares | | B Shares | | C Shares | | R3 Shares | | I Shares |
Fund Symbol | | NNGAX | | NNGBX | | NNGCX | | NMMTX | | NNGRX |
NAV | | $16.11 | | $15.65 | | $15.61 | | $16.19 | | $16.18 |
Latest Ordinary Income Distribution1 | | $0.3017 | | $0.1860 | | $0.1856 | | $0.2665 | | $0.3399 |
Inception Date | | 8/07/96 | | 8/07/96 | | 8/07/96 | | 8/04/08 | | 8/07/96 |
Returns quoted represent past performance which is no guarantee of future results. Investment returns and principal value will fluctuate so that when shares are redeemed, they may be worth more or less than their original cost. Current performance may be higher or lower than the performance shown. Returns without sales charges would be lower if the sales charge were included. Returns do not reflect the deduction of taxes that a shareholder would pay on Fund distributions or the redemption of shares. For the most recent month-end performance visit www.nuveen.com or call (800) 257-8787.
Class A, B, C and I Share returns are actual. The returns for Class R3 Shares are actual for the period since class inception on 8/04/08; returns prior to class inception are Class I Share returns adjusted for differences in sales charges and expenses, which are primarily differences in distribution and service fees. Fund returns assume reinvestment of dividends and capital gains. Class A Shares have a 5.75% maximum sales charge. Class A Share purchases of $1 million or more are sold at net asset value without an up-front sales charge but may be subject to a contingent deferred sales charge (CDSC), also known as a back-end sales charge, if redeemed within twelve months of purchase. Class B Shares have a CDSC that begins at 5% for redemptions during the first year and declines periodically until after six years when the charge becomes 0%. Class B Shares automatically convert to Class A Shares eight years after purchase. Class C Shares have a 1% CDSC for redemptions within less than one year, which is not reflected in the one-year total return. Class I Shares have no sales charge and may be purchased under limited circumstances or by specified classes of investors. Class R3 Shares have no sales charge and are available to only certain retirement plan clients of financial intermediaries. Returns may reflect an expense limitation by the Fund’s investment adviser.
| | | | |
| Average Annual Total Returns as of 6/30/10 |
| | |
| A Shares | | NAV | | Offer |
1-Year | | 15.19% | | 8.56% |
5-Year | | 0.27% | | -0.91% |
10-Year | | 1.89% | | 1.29% |
| | |
| B Shares | | w/o CDSC | | w/CDSC |
1-Year | | 14.26% | | 10.26% |
5-Year | | -0.49% | | -0.62% |
10-Year | | 1.29% | | 1.29% |
| | |
| C Shares | | NAV | | |
1-Year | | 14.37% | | |
5-Year | | -0.48% | | |
10-Year | | 1.13% | | |
| | |
| R3 Shares | | NAV | | |
1-Year | | 14.88% | | |
5-Year | | -0.04% | | |
10-Year | | 1.61% | | |
| | |
| I Shares | | NAV | | |
1-Year | | 15.53% | | |
5-Year | | 0.51% | | |
10-Year | | 2.15% | | |
| | |
| Top Five Common Stock Holdings2 |
Bank of America Corporation | | 2.4% |
U.S. Bancorp | | 2.3% |
Wells Fargo & Company | | 2.1% |
Occidental Petroleum Corporation | | 1.8% |
Merck & Company Inc. | | 1.8% |
Portfolio Allocation 2
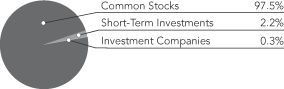
| | |
| Portfolio Statistics |
| Net Assets ($000) | | $295,355 |
| Number of Common Stocks | | 686 |
| | | | |
| Expense Ratios | | | | |
| Share Class | | Gross
Expense
Ratios | | Net
Expense
Ratios |
| Class A | | 1.27% | | 1.20% |
| Class B | | 2.01% | | 1.95% |
| Class C | | 2.02% | | 1.95% |
| Class R3 | | 1.53% | | 1.45% |
| Class I | | 1.02% | | .95% |
The expense ratios shown factor in Total Annual Fund Operating Expenses including management fees and other fees and expenses. The Net Expense Ratios reflect a contractual commitment by the Fund’s investment adviser to waive fees and reimburse expenses through October 31, 2011. The expense ratios are those shown in the most recent Fund prospectus.
| 1 | Ordinary income distribution consists of ordinary income paid on December 31, 2009. |
| 2 | As a percentage of total investments as of June 30, 2010. Holdings are subject to change. |
Fund Spotlight as of 6/30/10 Nuveen Multi-Manager Large-Cap Value Fund
| | |
| Portfolio Composition1 | | |
Oil, Gas & Consumable Fuels | | 10.2% |
Commercial Banks | | 7.8% |
Pharmaceuticals | | 7.7% |
Insurance | | 6.8% |
Diversified Financial Services | | 4.9% |
Media | | 4.9% |
Beverages | | 4.1% |
Machinery | | 3.1% |
Semiconductors & Equipment | | 3.0% |
Metals & Mining | | 2.7% |
Diversified Telecommunication Services | | 2.5% |
Food Products | | 2.3% |
Computers & Peripherals | | 2.1% |
Capital Markets | | 2.1% |
Specialty Retail | | 2.0% |
Aerospace & Defense | | 1.9% |
IT Services | | 1.8% |
Communications Equipment | | 1.8% |
Health Care Providers & Services | | 1.6% |
Electric Utilities | | 1.5% |
Health Care Equipment & Supplies | | 1.5% |
Road & Rail | | 1.5% |
Tobacco | | 1.3% |
Industrial Conglomerates | | 1.2% |
Wireless Telecommunication Services | | 1.1% |
Consumer Finance | | 1.0% |
Multi-Utilities | | 1.0% |
Investment Companies | | 0.3% |
Short-Term Investments | | 2.2% |
Other | | 14.1% |
| 1 | As a percentage of total investments as of June 30, 2010. Holdings are subject to change. |
Expense Example
As a shareholder of the Fund, you incur two types of costs: (1) transaction costs, including up-front and back-end sales charges (loads) or redemption fees, where applicable; and (2) ongoing costs, including management fees; distribution and service (12b-1) fees, where applicable; and other Fund expenses. This Example is intended to help you understand your ongoing costs (in dollars) of investing in the Fund and to compare these costs with the ongoing costs of investing in other mutual funds.
The Example below is based on an investment of $1,000 invested at the beginning of the period and held for the period.
The information under “Actual Performance,” together with the amount you invested, allows you to estimate actual expenses incurred over the reporting period. Simply divide your account value by $1,000 (for example, an $8,600 account value divided by $1,000 = 8.60) and multiply the result by the cost shown for your share class, in the row entitled “Expenses Incurred During Period” to estimate the expenses incurred on your account during this period.
The information under “Hypothetical Performance,” provides information about hypothetical account values and hypothetical expenses based on the Fund’s actual expense ratio and an assumed rate of return of 5% per year before expenses, which is not the Fund’s actual return. The hypothetical account values and expenses may not be used to estimate the actual ending account balance or expense you incurred for the period. You may use this information to compare the ongoing costs of investing in the Fund and other Funds. To do so, compare this 5% hypothetical example with the 5% hypothetical examples that appear in the shareholder reports of the other funds.
Please note that the expenses shown in the table are meant to highlight your ongoing costs only and do not reflect any transactional costs, such as front and back end sales charges (loads) or redemption fees, where applicable. Therefore, the hypothetical information is useful in comparing ongoing costs only, and will not help you determine the relative total costs of owning different funds or share classes. In addition, if these transactional costs were included, your costs would have been higher.
| | | | | | | | | | | | | | | | | | | | | | | | | | | | | | | | |
| | | | | | | | | | | | | | | Hypothetical Performance
|
| | | Actual Performance | | | | (5% return before expenses) |
| | | A Shares | | B Shares | | C Shares | | R3 Shares | | I Shares | | | | A Shares | | B Shares | | C Shares | | R3 Shares | | I Shares |
| Beginning Account Value (1/01/10) | | $ | 1,000.00 | | $ | 1,000.00 | | $ | 1,000.00 | | $ | 1,000.00 | | $ | 1,000.00 | | | | $ | 1,000.00 | | $ | 1,000.00 | | $ | 1,000.00 | | $ | 1,000.00 | | $ | 1,000.00 |
| Ending Account Value (6/30/10) | | $ | 943.20 | | $ | 939.30 | | $ | 939.80 | | $ | 941.80 | | $ | 944.50 | | | | $ | 1,018.89 | | $ | 1,015.22 | | $ | 1,015.22 | | $ | 1,017.65 | | $ | 1,020.13 |
| Expenses Incurred During Period | | $ | 5.73 | | $ | 9.28 | | $ | 9.28 | | $ | 6.93 | | $ | 4.53 | | | | $ | 5.96 | | $ | 9.64 | | $ | 9.64 | | $ | 7.20 | | $ | 4.71 |
For each class of the Fund, expenses are equal to the Fund’s annualized net expense ratio of 1.19%, 1.93%, 1.93%, 1.44% and 0.94% for Classes A, B, C, R3 and I, respectively, multiplied by the average account value over the period, multiplied by 181/365 (to reflect the one-half year period).
Fund Spotlight as of 6/30/10 Nuveen NWQ Multi-Cap Value Fund
| | | | | | | | | | |
| Quick Facts | | | | | | | | | | |
| | | A Shares | | B Shares | | C Shares | | R3 Shares | | I Shares |
Fund Symbols | | NQVAX | | NQVBX | | NQVCX | | NMCTX | | NQVRX |
NAV | | $14.73 | | $14.21 | | $14.21 | | $14.66 | | $14.74 |
Latest Ordinary Income Distribution1 | | $0.0390 | | $ — | | $ — | | $0.0073 | | $0.0707 |
Inception Date | | 12/09/02 | | 12/09/02 | | 12/09/02 | | 8/04/08 | | 11/04/97 |
Effective December 6, 2002, based on shareholder approval, the Nuveen NWQ Multi-Cap Value Fund acquired the assets and performance history of the PBHG Special Equity Fund. The Fund had no assets prior to the acquisition. In addition, on December 14, 2001, the PBHG Special Equity Fund acquired the assets of the NWQ Special Equity Portfolio. The information presented for the Nuveen NWQ Multi-Cap Value Fund prior to the acquisition date represents the expense adjusted performance of the predecessor funds.
Returns quoted represent past performance which is no guarantee of future results. Investment returns and principal value will fluctuate so that when shares are redeemed, they may be worth more or less than their original cost. Current performance may be higher or lower than the performance shown. Returns without sales charges would be lower if the sales charge were included. Returns do not reflect the deduction of taxes that a shareholder would pay on Fund distributions or the redemption of shares. For the most recent month-end performance visit www.nuveen.com or call (800) 257-8787.
Class A, B, C and I Share returns are actual. The returns for Class R3 Shares are actual for the period since class inception on 8/04/08; returns prior to class inception are Class I Share returns adjusted for differences in sales charges and expenses, which are primarily differences in distribution and service fees. Fund returns assume reinvestment of dividends and capital gains. Class A Shares have a 5.75% maximum sales charge. Class A Share purchases of $1 million or more are sold at net asset value without an up-front sales charge but may be subject to a contingent deferred sales charge (CDSC), also known as a back-end sales charge, if redeemed within twelve months of purchase. Class B Shares have a CDSC that begins at 5% for redemptions during the first year and declines periodically until after six years when the charge becomes 0%. Class B Shares automatically convert to Class A Shares eight years after purchase. Class C Shares have a 1% CDSC for redemptions within less than one year, which is not reflected in the one-year total return. Class I Shares have no sales charge and may be purchased under limited circumstances or by specified classes of investors. Class R3 Shares have no sales charge and are available to only certain retirement plan clients of financial intermediaries.
| | | | |
| Average Annual Total Returns as of 6/30/10 |
| | |
| A Shares | | NAV | | Offer |
1-Year | | 20.85% | | 13.86% |
5-Year | | -4.29% | | -5.42% |
10-Year | | 5.04% | | 4.42% |
| | |
| B Shares | | w/o CDSC | | w/CDSC |
1-Year | | 20.02% | | 16.02% |
5-Year | | -5.00% | | -5.17% |
10-Year | | 4.42% | | 4.42% |
| | |
| C Shares | | NAV | | |
1-Year | | 20.02% | | |
5-Year | | -5.00% | | |
10-Year | | 4.27% | | |
| | |
| R3 Shares | | NAV | | |
1-Year | | 20.62% | | |
5-Year | | -4.55% | | |
10-Year | | 4.75% | | |
| | |
| I Shares | | NAV | | |
1-Year | | 21.18% | | |
5-Year | | -4.05% | | |
10-Year | | 5.32% | | |
| | |
| Top Five Common Stock Holdings2 |
CA Inc. | | 6.7% |
Barrick Gold Corporation | | 4.9% |
Motorola, Inc. | | 4.7% |
Amgen Inc. | | 4.3% |
Viacom Inc., Class B | | 3.8% |
Portfolio Allocation2
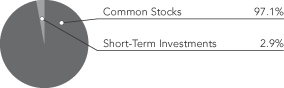
| | |
| Portfolio Statistics |
| Net Assets ($000) | | $371,647 |
| Number of Common Stocks | | 43 |
| | |
| Expense Ratios | | |
| Share Class | | Gross
Expense
Ratios |
| Class A | | 1.48% |
| Class B | | 2.26% |
| Class C | | 2.25% |
| Class R3 | | 1.79% |
| Class I | | 1.27% |
The expense ratios shown factor in Total Annual Fund Operating Expenses including management fees and other fees and expenses. The expense ratios are those shown in the most recent Fund prospectus.
| 1 | Ordinary income distribution consists of ordinary income paid on December 31, 2009. |
| 2 | As a percentage of total investments as of June 30, 2010. Holdings are subject to change. |
Fund Spotlight as of 6/30/10 Nuveen NWQ Multi-Cap Value Fund
| | |
| Portfolio Composition1 | | |
Insurance | | 16.2% |
Oil, Gas & Consumable Fuels | | 12.2% |
Pharmaceuticals | | 10.4% |
Metals & Mining | | 9.6% |
Software | | 6.7% |
Media | | 6.7% |
Communications Equipment | | 4.7% |
Machinery | | 4.4% |
Biotechnology | | 4.3% |
Diversified Financial Services | | 4.0% |
Aerospace & Defense | | 2.5% |
Mortgage REIT | | 2.2% |
Short-Term Investments | | 2.9% |
Other | | 13.2% |
| 1 | As a percentage of total investments as of June 30, 2010. Holdings are subject to change. |
Expense Example
As a shareholder of the Fund, you incur two types of costs: (1) transaction costs, including up-front and back-end sales charges (loads) or redemption fees, where applicable; and (2) ongoing costs, including management fees; distribution and service (12b-1) fees, where applicable; and other Fund expenses. This Example is intended to help you understand your ongoing costs (in dollars) of investing in the Fund and to compare these costs with the ongoing costs of investing in other mutual funds.
The Example below is based on an investment of $1,000 invested at the beginning of the period and held for the period.
The information under “Actual Performance,” together with the amount you invested, allows you to estimate actual expenses incurred over the reporting period. Simply divide your account value by $1,000 (for example, an $8,600 account value divided by $1,000 = 8.60) and multiply the result by the cost shown for your share class, in the row entitled “Expenses Incurred During Period” to estimate the expenses incurred on your account during this period.
The information under “Hypothetical Performance,” provides information about hypothetical account values and hypothetical expenses based on the Fund’s actual expense ratio and an assumed rate of return of 5% per year before expenses, which is not the Fund’s actual return. The hypothetical account values and expenses may not be used to estimate the actual ending account balance or expense you incurred for the period. You may use this information to compare the ongoing costs of investing in the Fund and other Funds. To do so, compare this 5% hypothetical example with the 5% hypothetical examples that appear in the shareholder reports of the other funds.
Please note that the expenses shown in the table are meant to highlight your ongoing costs only and do not reflect any transactional costs, such as front and back end sales charges (loads) or redemption fees, where applicable. Therefore, the hypothetical information is useful in comparing ongoing costs only, and will not help you determine the relative total costs of owning different funds or share classes. In addition, if these transactional costs were included, your costs would have been higher.
| | | | | | | | | | | | | | | | | | | | | | | | | | | | | | | | |
| | | | | | | Hypothetical Performance |
| | | Actual Performance | | | | (5% return before expenses) |
| | | A Shares | | B Shares | | C Shares | | R3 Shares | | I Shares | | | | A Shares | | B Shares | | C Shares | | R3 Shares | | I Shares |
| Beginning Account Value (1/01/10) | | $ | 1,000.00 | | $ | 1,000.00 | | $ | 1,000.00 | | $ | 1,000.00 | | $ | 1,000.00 | | | | $ | 1,000.00 | | $ | 1,000.00 | | $ | 1,000.00 | | $ | 1,000.00 | | $ | 1,000.00 |
| Ending Account Value (6/30/10) | | $ | 968.40 | | $ | 965.40 | | $ | 965.40 | | $ | 967.70 | | $ | 969.70 | | | | $ | 1,018.25 | | $ | 1,014.53 | | $ | 1,014.53 | | $ | 1,017.36 | | $ | 1,019.69 |
| Expenses Incurred During Period | | $ | 6.44 | | $ | 10.09 | | $ | 10.09 | | $ | 7.32 | | $ | 5.03 | | | | $ | 6.61 | | $ | 10.34 | | $ | 10.34 | | $ | 7.50 | | $ | 5.16 |
For each class of the Fund, expenses are equal to the Fund’s annualized net expense ratio of 1.32%, 2.07%, 2.07%, 1.50% and 1.03% for Classes A, B, C, R3 and I, respectively, multiplied by the average account value over the period, multiplied by 181/365 (to reflect the one-half year period).
Fund Spotlight as of 6/30/10 Nuveen NWQ Large-Cap Value Fund
| | | | | | | | | | |
| Quick Facts | | | | | | | | | | |
| | | A Shares | | B Shares | | C Shares | | R3 Shares | | I Shares |
Fund Symbols | | NQCAX | | NQCBX | | NQCCX | | NQCQX | | NQCRX |
NAV | | $14.73 | | $14.48 | | $14.49 | | $14.71 | | $14.75 |
Latest Ordinary Income Distribution1 | | $ — | | $ — | | $ — | | $ — | | $0.0228 |
Inception Date | | 12/15/06 | | 12/15/06 | | 12/15/06 | | 9/29/09 | | 12/15/06 |
Returns quoted represent past performance which is no guarantee of future results. Investment returns and principal value will fluctuate so that when shares are redeemed, they may be worth more or less than their original cost. Current performance may be higher or lower than the performance shown. Returns without sales charges would be lower if the sales charge were included. Returns do not reflect the deduction of taxes that a shareholder would pay on Fund distributions or the redemption of shares. For the most recent month-end performance visit www.nuveen.com or call (800) 257-8787.
Class A, B, C and I Share returns are actual. The returns for Class R3 Shares are actual for the period since class inception on 9/29/09; returns prior to class inception are Class I Share returns adjusted for differences in sales charges and expenses, which are primarily differences in distribution and service fees. Fund returns assume reinvestment of dividends and capital gains. Class A Shares have a 5.75% maximum sales charge. Class A Share purchases of $1 million or more are sold at net asset value without an up-front sales charge but may be subject to a contingent deferred sales charge (CDSC), also known as a back-end sales charge, if redeemed within twelve months of purchase. Class B Shares have a CDSC that begins at 5% for redemptions during the first year and declines periodically until after six years when the charge becomes 0%. Class B Shares automatically convert to Class A Shares eight years after purchase. Class C Shares have a 1% CDSC for redemptions within less than one year, which is not reflected in the one-year total return. Class R3 Shares have no sales charge and are available to only certain retirement plan clients of financial intermediaries. Class I Shares have no sales charge and may be purchased under limited circumstances or by specified classes of investors. Returns may reflect an expense limitation by the Fund’s investment adviser.
| | | | |
| Average Annual Total Returns as of 6/30/10 |
| | |
| A Shares | | NAV | | Offer |
1-Year | | 15.89% | | 9.19% |
Since Inception | | -8.02% | | -9.54% |
| | |
| B Shares | | w/o CDSC | | w/CDSC |
1-Year | | 14.92% | | 10.92% |
Since Inception | | -8.71% | | -9.49% |
| | |
| C Shares | | NAV | | |
1-Year | | 15.00% | | |
Since Inception | | -8.69% | | |
| | |
| R3 Shares | | NAV | | |
1-Year | | 15.46% | | |
Since Inception | | -8.26% | | |
| | |
| I Shares | | NAV | | |
1-Year | | 16.13% | | |
Since Inception | | -7.79% | | |
| | |
| Top Five Common Stock Holdings 2 |
CA Inc. | | 6.5% |
Motorola, Inc. | | 5.4% |
Barrick Gold Corporation | | 4.8% |
Amgen Inc. | | 4.2% |
Viacom Inc., Class B | | 4.0% |
Portfolio Allocation2
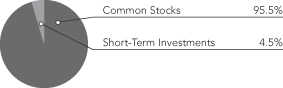
| | |
| Portfolio Statistics |
| Net Assets ($000) | | $272,548 |
| Number of Common Stocks | | 42 |
| | | | |
| Expense Ratios | | | | |
| Share Class | | Gross
Expense
Ratios | | Net
Expense
Ratios |
| Class A | | 1.51% | | 1.35% |
| Class B | | 2.25% | | 2.10% |
| Class C | | 2.27% | | 2.10% |
| Class R3 | | 1.76% | | 1.60% |
| Class I | | 1.26% | | 1.10% |
The expense ratios shown factor in Total Annual Fund Operating Expenses including management fees and other fees and expenses. The Net Expense Ratios reflect a contractual commitment by the Fund’s investment adviser to waive fees and reimburse expenses through October 31, 2011. The expense ratios are those shown in the most recent Fund prospectus.
| 1 | Ordinary income distribution consists of ordinary income paid on December 31, 2009. |
| 2 | As a percentage of total investments as of June 30, 2010. Holdings are subject to change. |
Fund Spotlight as of 6/30/10 Nuveen NWQ Large-Cap Value Fund
| | |
| Portfolio Composition1 |
Insurance | | 16.3% |
Oil, Gas & Consumable Fuels | | 13.7% |
Pharmaceuticals | | 8.8% |
Metals & Mining | | 8.5% |
Software | | 7.8% |
Communications Equipment | | 5.4% |
Media | | 4.9% |
Biotechnology | | 4.2% |
Diversified Financial Services | | 3.9% |
Aerospace & Defense | | 3.8% |
Food & Staples Retailing | | 2.2% |
Household Products | | 2.1%
|
Short-Term Investments | | 4.5% |
Other | | 13.9% |
| 1 | As a percentage of total investments as of June 30, 2010. Holdings are subject to change. |
Expense Example
As a shareholder of the Fund, you incur two types of costs: (1) transaction costs, including up-front and back-end sales charges (loads) or redemption fees, where applicable; and (2) ongoing costs, including management fees; distribution and service (12b-1) fees, where applicable; and other Fund expenses. This Example is intended to help you understand your ongoing costs (in dollars) of investing in the Fund and to compare these costs with the ongoing costs of investing in other mutual funds.
The Example below is based on an investment of $1,000 invested at the beginning of the period and held for the period.
The information under “Actual Performance,” together with the amount you invested, allows you to estimate actual expenses incurred over the reporting period. Simply divide your account value by $1,000 (for example, an $8,600 account value divided by $1,000 = 8.60) and multiply the result by the cost shown for your share class, in the row entitled “Expenses Incurred During Period” to estimate the expenses incurred on your account during this period.
The information under “Hypothetical Performance,” provides information about hypothetical account values and hypothetical expenses based on the Fund’s actual expense ratio and an assumed rate of return of 5% per year before expenses, which is not the Fund’s actual return. The hypothetical account values and expenses may not be used to estimate the actual ending account balance or expense you incurred for the period. You may use this information to compare the ongoing costs of investing in the Fund and other Funds. To do so, compare this 5% hypothetical example with the 5% hypothetical examples that appear in the shareholder reports of the other funds.
Please note that the expenses shown in the table are meant to highlight your ongoing costs only and do not reflect any transactional costs, such as front and back end sales charges (loads) or redemption fees, where applicable. Therefore, the hypothetical information is useful in comparing ongoing costs only, and will not help you determine the relative total costs of owning different funds or share classes. In addition, if these transactional costs were included, your costs would have been higher.
| | | | | | | | | | | | | | | | | | | | | | | | | | | | | | | | |
| | | | | | | Hypothetical Performance |
| | | Actual Performance | | | | (5% return before expenses) |
| | | A Shares | | B Shares | | C Shares | | R3 Shares | | I Shares | | | | A Shares | | B Shares | | C Shares | | R3 Shares | | I Shares |
| Beginning Account Value (1/01/10) | | $ | 1,000.00 | | $ | 1,000.00 | | $ | 1,000.00 | | $ | 1,000.00 | | $ | 1,000.00 | | | | $ | 1,000.00 | | $ | 1,000.00 | | $ | 1,000.00 | | $ | 1,000.00 | | $ | 1,000.00 |
| Ending Account Value (6/30/10) | | $ | 947.30 | | $ | 943.90 | | $ | 944.00 | | $ | 946.00 | | $ | 948.60 | | | | $ | 1,018.30 | | $ | 1,014.53 | | $ | 1,014.58 | | $ | 1,016.96 | | $ | 1,019.49 |
| Expenses Incurred During Period | | $ | 6.32 | | $ | 9.98 | | $ | 9.93 | | $ | 7.62 | | $ | 5.17 | | | | $ | 6.56 | | $ | 10.34 | | $ | 10.29 | | $ | 7.90 | | $ | 5.36 |
For each class of the Fund, expenses are equal to the Fund’s annualized net expense ratio of 1.31%, 2.07%, 2.06%,1.58% and 1.07% for Classes A, B, C, R3 and I, respectively, multiplied by the average account value over the period, multiplied by 181/365 (to reflect the one-half year period).
Fund Spotlight as of 6/30/10 Nuveen NWQ Small/Mid-Cap Value Fund
| | | | | | | | |
| Quick Facts | | | | | | | | |
| | | A Shares1 | | C Shares | | R3 Shares | | I Shares |
Fund Symbols | | NSMAX | | NSMCX | | NWQRX | | NSMRX |
NAV | | $14.32 | | $13.93 | | $14.19 | | $14.24 |
Inception Date | | 12/15/06 | | 12/15/06 | | 9/29/09 | | 12/15/06 |
Returns quoted represent past performance which is no guarantee of future results. Investment returns and principal value will fluctuate so that when shares are redeemed, they may be worth more or less than their original cost. Current performance may be higher or lower than the performance shown. Returns without sales charges would be lower if the sales charge were included. Returns do not reflect the deduction of taxes that a shareholder would pay on Fund distributions or the redemption of shares. For the most recent month-end performance visit www.nuveen.com or call (800) 257-8787.
Class A, C and I Share returns are actual. The returns for Class R3 Shares are actual for the period since class inception on 9/29/09; returns prior to class inception are Class I Share returns adjusted for differences in sales charges and expenses, which are primarily differences in distribution and service fees. Fund returns assume reinvestment of dividends and capital gains. Class A Shares have a 5.75% maximum sales charge. Class A Share purchases of $1 million or more are sold at net asset value without an up-front sales charge but may be subject to a contingent deferred sales charge (CDSC), also known as a back-end sales charge, if redeemed within twelve months of purchase. Class C Shares have a 1% CDSC for redemptions within less than one year, which is not reflected in the one-year total return. Class R3 Shares have no sales charge and are available to only certain retirement plan clients of financial intermediaries. Class I Shares have no sales charge and may be purchased under limited circumstances or by specified classes of investors. Returns may reflect an expense limitation by the Fund’s investment adviser.
| | | | |
| Average Annual Total Returns as of 6/30/10 |
| | |
| A Shares | | NAV | | Offer |
1-Year | | 29.50% | | 22.10% |
Since Inception | | -9.01% | | -10.52% |
| | |
| C Shares | | NAV | | |
1-Year | | 28.53% | | |
Since Inception | | -9.72% | | |
| | |
| R3 Shares | | NAV | | |
1-Year | | 29.35% | | |
Since Inception | | -9.53% | | |
| | |
| I Shares | | NAV | | |
1-Year | | 29.93% | | |
Since Inception | | -9.07% | | |
| | |
| Top Five Common Stock Holdings 2 |
Coherent Inc. | | 4.4% |
Biovail Corporation | | 4.3% |
Griffon Corporation | | 3.6% |
Elizabeth Arden, Inc. | | 3.5% |
Hormel Foods Corporation | | 3.3% |
Portfolio Allocation 2

| | |
| Portfolio Statistics |
| Net Assets ($000) | | $11,235 |
| Number of Common Stocks | | 46 |
| | | | |
| Expense Ratios | | | | |
| Share Class | | Gross
Expense
Ratios | | Net
Expense
Ratios |
| Class A | | 2.88% | | 1.35% |
| Class C | | 3.96% | | 2.10% |
| Class R3 | | 1.99% | | 1.60% |
| Class I | | 1.29% | | 1.10% |
The expense ratios shown factor in Total Annual Fund Operating Expenses including management fees and other fees and expenses. The Net Expense Ratios reflect a contractual commitment by the Fund’s investment adviser to waive fees and reimburse expenses through October 31, 2011. The expense ratios are those shown in the most recent Fund prospectus.
| 1 | As of October 5, 2009, Class B Shares are no longer available through an exchange from another Nuveen Fund and were converted to Class A Shares at the close of business on October 27, 2009. |
| 2 | As a percentage of total investments as of June 30, 2010. Holdings are subject to change. |
Fund Spotlight as of 6/30/10 Nuveen NWQ Small/Mid-Cap Value Fund
| | |
| Portfolio Composition1 |
Insurance | | 14.0% |
Machinery | | 10.9% |
Metals & Mining | | 8.7% |
Electronic Equipment & Instruments | | 8.0% |
Oil, Gas & Consumable Fuels | | 6.2% |
Electrical Equipment | | 5.5% |
Food Products | | 5.0%
|
Commercial Banks | | 4.8% |
Pharmaceuticals | | 4.3%
|
Building Products | | 3.6% |
Personal Products | | 3.5% |
Communications Equipment | | 3.2%
|
Semiconductors & Equipment | | 3.0%
|
Health Care Providers & Services | | 3.0%
|
Thrifts & Mortgage Finance | | 2.9% |
Short-Term Investments | | 1.0% |
Other | | 12.4% |
| 1 | As a percentage of total investments as of 6/30/10. Holdings are subject to change. |
Expense Example
As a shareholder of the Fund, you incur two types of costs: (1) transaction costs, including up-front and back-end sales charges (loads) or redemption fees, where applicable; and (2) ongoing costs, including management fees; distribution and service (12b-1) fees, where applicable; and other Fund expenses. This Example is intended to help you understand your ongoing costs (in dollars) of investing in the Fund and to compare these costs with the ongoing costs of investing in other mutual funds.
The Example below is based on an investment of $1,000 invested at the beginning of the period and held for the period.
The information under “Actual Performance,” together with the amount you invested, allows you to estimate actual expenses incurred over the reporting period. Simply divide your account value by $1,000 (for example, an $8,600 account value divided by $1,000 = 8.60) and multiply the result by the cost shown for your share class, in the row entitled “Expenses Incurred During Period” to estimate the expenses incurred on your account during this period.
The information under “Hypothetical Performance,” provides information about hypothetical account values and hypothetical expenses based on the Fund’s actual expense ratio and an assumed rate of return of 5% per year before expenses, which is not the Fund’s actual return. The hypothetical account values and expenses may not be used to estimate the actual ending account balance or expense you incurred for the period. You may use this information to compare the ongoing costs of investing in the Fund and other Funds. To do so, compare this 5% hypothetical example with the 5% hypothetical examples that appear in the shareholder reports of the other funds.
Please note that the expenses shown in the table are meant to highlight your ongoing costs only and do not reflect any transactional costs, such as front and back end sales charges (loads) or redemption fees, where applicable. Therefore, the hypothetical information is useful in comparing ongoing costs only, and will not help you determine the relative total costs of owning different funds or share classes. In addition, if these transactional costs were included, your costs would have been higher.
| | | | | | | | | | | | | | | | | | | | | | | | | | |
| | | | | | | | | | | | | Hypothetical Performance |
| | | Actual Performance | | | | (5% return before expenses) |
| | | A Shares | | C Shares | | R3 Shares | | I Shares | | | | A Shares | | C Shares | | R3 Shares | | I Shares |
| Beginning Account Value (1/01/10) | | $ | 1,000.00 | | $ | 1,000.00 | | $ | 1,000.00 | | $ | 1,000.00 | | | | $ | 1,000.00 | | $ | 1,000.00 | | $ | 1,000.00 | | $ | 1,000.00 |
| Ending Account Value (6/30/10) | | $ | 1,007.70 | | $ | 1,003.60 | | $ | 1,007.10 | | $ | 1,009.20 | | | | $ | 1,017.70 | | $ | 1,013.93 | | $ | 1,016.46 | | $ | 1,018.94 |
| Expenses Incurred During Period | | $ | 7.12 | | $ | 10.88 | | $ | 8.36 | | $ | 5.88 | | | | $ | 7.15 | | $ | 10.94 | | $ | 8.40 | | $ | 5.91 |
For each class of the Fund, expenses are equal to the Fund’s annualized net expense ratio of 1.43%, 2.19%, 1.68% and 1.18% for Classes A, C, R3 and I, respectively, multiplied by the average account value over the period, multiplied by 181/365 (to reflect the one-half year period).
Fund Spotlight as of 6/30/10 Nuveen NWQ Small-Cap Value Fund
| | | | | | | | |
| Quick Facts | | | | | | | | |
| | | A Shares1 | | C Shares | | R3 Shares | | I Shares |
Fund Symbols | | NSCAX | | NSCCX | | NSCQX | | NSCRX |
NAV | | $18.30 | | $17.68 | | $18.37 | | $18.40 |
Latest Ordinary Income Distribution2 | | $0.0085 | | $ — | | $ — | | $0.0458 |
Inception Date | | 12/09/04 | | 12/09/04 | | 9/29/09 | | 12/09/04 |
Returns quoted represent past performance which is no guarantee of future results. Investment returns and principal value will fluctuate so that when shares are redeemed, they may be worth more or less than their original cost. Current performance may be higher or lower than the performance shown. Returns without sales charges would be lower if the sales charge were included. Returns do not reflect the deduction of taxes that a shareholder would pay on Fund distributions or the redemption of shares. For the most recent month-end performance visit www.nuveen.com or call (800) 257-8787.
Class A, C and I Share returns are actual. The returns for Class R3 Shares are actual for the period since class inception on 9/29/09; returns prior to class inception are Class I Share returns adjusted for differences in sales charges and expenses, which are primarily differences in distribution and service fees. Fund returns assume reinvestment of dividends and capital gains. Class A Shares have a 5.75% maximum sales charge. Class A Share purchases of $1 million or more are sold at net asset value without an up-front sales charge but may be subject to a contingent deferred sales charge (CDSC), also known as a back-end sales charge, if redeemed within twelve months of purchase. Class C Shares have a 1% CDSC for redemptions within less than one year, which is not reflected in the one-year total return. Class R3 Shares have no sales charge and are available to only certain retirement plan clients of financial intermediaries. Class I Shares have no sales charge and may be purchased under limited circumstances or by specified classes of investors. Returns may reflect an expense limitation by the Fund’s investment adviser.
| | | | |
| Average Annual Total Returns as of 6/30/10 |
| | |
| A Shares | | NAV | | Offer |
1-Year | | 29.41% | | 21.99% |
5-Year | | -1.60% | | -2.76% |
Since Inception | | -0.71% | | -1.76% |
| | |
| C Shares | | NAV | | |
1-Year | | 28.42% | | |
5-Year | | -2.31% | | |
Since Inception | | -1.42% | | |
| | |
| R3 Shares | | NAV | | |
1-Year | | 29.02% | | |
5-Year | | -1.85% | | |
Since Inception | | -0.96% | | |
| | |
| I Shares | | NAV | | |
1-Year | | 29.74% | | |
5-Year | | -1.34% | | |
Since Inception | | -0.45% | | |
| | | | |
| Top Five Common Stock Holdings 3 |
Actel Corporation | | 4.8% |
Bob Evans Farms | | 4.3% |
Standard Microsystems Corporation | | 4.3% |
Coherent Inc. | | 4.3% |
Griffon Corporation | | 3.8% |
Portfolio Allocation 3
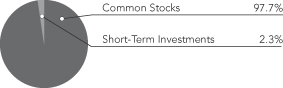
| | |
| Portfolio Statistics |
| Net Assets ($000) | | $85,378 |
| Number of Common Stocks | | 48 |
| | |
| Expense Ratios | | |
| Share Class | | Gross
Expense
Ratios |
| Class A | | 1.41% |
| Class C | | 2.18% |
| Class R3 | | 1.68% |
| Class I | | 1.19% |
The expense ratios shown factor in Total Annual Fund Operating Expenses including management fees and other fees and expenses. The expense ratios are those shown in the most recent Fund prospectus.
| 1 | As of October 5, 2009, Class B Shares are no longer available through an exchange from another Nuveen Fund and were converted to Class A Shares at the close of business on October 27, 2009. |
| 2 | Ordinary income distribution consists of ordinary income paid on December 31, 2009. |
| 3 | As a percentage of total investments as of June 30, 2010. Holdings are subject to change. |
Fund Spotlight as of 6/30/10 Nuveen NWQ Small-Cap Value Fund
| | |
| Portfolio Composition1 | | |
Machinery | | 10.3% |
Insurance | | 10.3% |
Semiconductors & Equipment | | 9.1% |
Metals & Mining | | 8.8% |
Commercial Banks | | 7.8% |
Electronic Equipment & Instruments | | 5.9% |
Hotels, Restaurants & Leisure | | 5.6% |
Building Products | | 4.2% |
Oil, Gas & Consumable Fuels | | 4.0% |
Personal Products | | 3.6% |
Communications Equipment | | 3.2% |
Food & Staples Retailing | | 2.7% |
Road & Rail | | 2.7% |
Food Products | | 2.7% |
Paper & Forest Products | �� | 2.4% |
Short-Term Investments | | 2.3% |
Other | | 14.4% |
| 1 | As a percentage of total investments as of June 30, 2010. Holdings are subject to change. |
Expense Example
As a shareholder of the Fund, you incur two types of costs: (1) transaction costs, including up-front and back-end sales charges (loads) or redemption fees, where applicable; and (2) ongoing costs, including management fees; distribution and service (12b-1) fees, where applicable; and other Fund expenses. This Example is intended to help you understand your ongoing costs (in dollars) of investing in the Fund and to compare these costs with the ongoing costs of investing in other mutual funds.
The Example below is based on an investment of $1,000 invested at the beginning of the period and held for the period.
The information under “Actual Performance,” together with the amount you invested, allows you to estimate actual expenses incurred over the reporting period. Simply divide your account value by $1,000 (for example, an $8,600 account value divided by $1,000 = 8.60) and multiply the result by the cost shown for your share class, in the row entitled “Expenses Incurred During Period” to estimate the expenses incurred on your account during this period.
The information under “Hypothetical Performance,” provides information about hypothetical account values and hypothetical expenses based on the Fund’s actual expense ratio and an assumed rate of return of 5% per year before expenses, which is not the Fund’s actual return. The hypothetical account values and expenses may not be used to estimate the actual ending account balance or expense you incurred for the period. You may use this information to compare the ongoing costs of investing in the Fund and other Funds. To do so, compare this 5% hypothetical example with the 5% hypothetical examples that appear in the shareholder reports of the other funds.
Please note that the expenses shown in the table are meant to highlight your ongoing costs only and do not reflect any transactional costs, such as front and back end sales charges (loads) or redemption fees, where applicable. Therefore, the hypothetical information is useful in comparing ongoing costs only, and will not help you determine the relative total costs of owning different funds or share classes. In addition, if these transactional costs were included, your costs would have been higher.
| | | | | | | | | | | | | | | | | | | | | | | | | | |
| | | | | | | | | | | | | Hypothetical Performance |
| | | Actual Performance | | | | (5% return before expenses) |
| | | A Shares | | C Shares | | R3 Shares | | I Shares | | | | A Shares | | C Shares | | R3 Shares | | I Shares |
| Beginning Account Value (1/01/10) | | $ | 1,000.00 | | $ | 1,000.00 | | $ | 1,000.00 | | $ | 1,000.00 | | | | $ | 1,000.00 | | $ | 1,000.00 | | $ | 1,000.00 | | $ | 1,000.00 |
| Ending Account Value (6/30/10) | | $ | 1,007.70 | | $ | 1,003.40 | | $ | 1,006.00 | | $ | 1,008.80 | | | | $ | 1,017.65 | | $ | 1,013.84 | | $ | 1,016.31 | | $ | 1,018.84 |
| Expenses Incurred During Period | | $ | 7.17 | | $ | 10.98 | | $ | 8.51 | | $ | 5.98 | | | | $ | 7.20 | | $ | 11.03 | | $ | 8.55 | | $ | 6.01 |
For each class of the Fund, expenses are equal to the Fund’s annualized net expense ratio of 1.44%, 2.21%, 1.71% and 1.20% for Classes A, C, R3 and I, respectively, multiplied by the average account value over the period, multiplied by 181/365 (to reflect the one-half year period).
Fund Spotlight as of 6/30/10 Nuveen Tradewinds Value Opportunities Fund
| | | | | | | | | | |
| Quick Facts | | | | | | | | | | |
| | | A Shares | | B Shares | | C Shares | | R3 Shares | | I Shares |
Fund Symbols | | NVOAX | | NVOBX | | NVOCX | | NTVTX | | NVORX |
NAV | | $29.76 | | $29.07 | | $29.06 | | $29.76 | | $29.87 |
Inception Date | | 12/09/04 | | 12/09/04 | | 12/09/04 | | 8/04/08 | | 12/09/04 |
Returns quoted represent past performance which is no guarantee of future results. Investment returns and principal value will fluctuate so that when shares are redeemed, they may be worth more or less than their original cost. Current performance may be higher or lower than the performance shown. Returns without sales charges would be lower if the sales charge were included. Returns do not reflect the deduction of taxes that a shareholder would pay on Fund distributions or the redemption of shares. For the most recent month-end performance visit www.nuveen.com or call (800) 257-8787.
Class A, B, C and I Share returns are actual. The returns for Class R3 Shares are actual for the period since class inception on 8/04/08; returns prior to class inception are Class I Share returns adjusted for differences in sales charges and expenses, which are primarily differences in distribution and service fees. Fund returns assume reinvestment of dividends and capital gains. Class A Shares have a 5.75% maximum sales charge. Class A Share purchases of $1 million or more are sold at net asset value without an up-front sales charge but may be subject to a contingent deferred sales charge (CDSC), also known as a back-end sales charge, if redeemed within twelve months of purchase. Class B Shares have a CDSC that begins at 5% for redemptions during the first year and declines periodically until after six years when the charge becomes 0%. Class B Shares automatically convert to Class A Shares eight years after purchase. Class C Shares have a 1% CDSC for redemptions within less than one year, which is not reflected in the one-year total return. Class I Shares have no sales charge and may be purchased under limited circumstances or by specified classes of investors. Class R3 Shares have no sales charge and are available to only certain retirement plan clients of financial intermediaries. Returns may reflect an expense limitation by the Fund’s investment adviser.
| | | | |
| Average Annual Total Returns as of 6/30/10 |
| | |
| A Shares | | NAV | | Offer |
1-Year | | 23.13% | | 16.07% |
5-Year | | 10.55% | | 9.24% |
Since Inception | | 10.47% | | 9.30% |
| | |
| B Shares | | w/o CDSC | | w/CDSC |
1-Year | | 22.25% | | 18.25% |
5-Year | | 9.73% | | 9.59% |
Since Inception | | 9.64% | | 9.52% |
| | |
| C Shares | | NAV | | |
1-Year | | 22.25% | | |
5-Year | | 9.72% | | |
Since Inception | | 9.64% | | |
| | |
| R3 Shares | | NAV | | |
1-Year | | 22.82% | | |
5-Year | | 10.28% | �� | |
Since Inception | | 10.18% | | |
| | |
| I Shares | | NAV | | |
1-Year | | 23.48% | | |
5-Year | | 10.83% | | |
Since Inception | | 10.74% | | |
| | |
| Top Five Common Stock Holdings1 | | |
Newmont Mining Corporation | | 4.2% |
Barrick Gold Corporation | | 3.5% |
Kinross Gold Corporation | | 3.3% |
Cameco Corporation | | 3.3% |
Ameren Corporation | | 2.9% |
Portfolio Allocation1
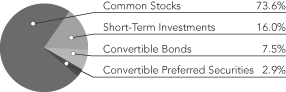
| | |
| Portfolio Statistics |
| Net Assets ($000) | | $1,904,553 |
| Number of Common Stocks | | 55 |
| | |
| Expense Ratios | | |
| Share Class | | Gross
Expense
Ratios |
| Class A | | 1.31% |
| Class B | | 2.05% |
| Class C | | 2.05% |
| Class R3 | | 1.59% |
| Class I | | 1.07% |
The expense ratios shown factor in Total Annual Fund Operating Expenses including management fees and other fees and expenses. The expense ratios are those shown in the most recent Fund prospectus.
| 1 | As a percentage of total investments as of June 30, 2010. Holdings are subject to change. |
Fund Spotlight as of 6/30/10 Nuveen Tradewinds Value Opportunities Fund
| | |
| Country Allocation1 | | |
United States | | 51.0% |
Canada | | 15.2% |
Japan | | 5.5% |
Australia | | 3.4% |
Brazil | | 1.9% |
South Korea | | 1.9% |
United Kingdom | | 1.4% |
South Africa | | 1.4% |
Turkey | | 1.0% |
Argentina | | 0.6%
|
Hong Kong | | 0.5%
|
China | | 0.2%
|
Short-Term Investments | | 16.0% |
| | |
| Portfolio Composition1 | | |
Metals & Mining | | 18.6% |
Oil, Gas & Consumable Fuels | | 14.2% |
Diversified Telecommunication Services | | 4.9% |
Food & Staples Retailing | | 4.6% |
Pharmaceuticals | | 4.4% |
Health Care Providers & Services | | 3.7% |
Electric Utilities | | 2.9% |
Multi-Utilities | | 2.9% |
Insurance | | 2.7% |
Biotechnology | | 2.6% |
Food Products | | 2.4% |
Electronic Equipment & Instruments | | 2.1% |
Communications Equipment | | 2.1% |
Wireless Telecommunication Services | | 1.8% |
Short-Term Investments | | 16.0% |
Other | | 14.1% |
| 1 | As a percentage of total investments as of June 30, 2010. Holdings are subject to change. |
Expense Example
As a shareholder of the Fund, you incur two types of costs: (1) transaction costs, including up-front and back-end sales charges (loads) or redemption fees, where applicable; and (2) ongoing costs, including management fees; distribution and service (12b-1) fees, where applicable; and other Fund expenses. This Example is intended to help you understand your ongoing costs (in dollars) of investing in the Fund and to compare these costs with the ongoing costs of investing in other mutual funds.
The Example below is based on an investment of $1,000 invested at the beginning of the period and held for the period.
The information under “Actual Performance,” together with the amount you invested, allows you to estimate actual expenses incurred over the reporting period. Simply divide your account value by $1,000 (for example, an $8,600 account value divided by $1,000 = 8.60) and multiply the result by the cost shown for your share class, in the row entitled “Expenses Incurred During Period” to estimate the expenses incurred on your account during this period.
The information under “Hypothetical Performance,” provides information about hypothetical account values and hypothetical expenses based on the Fund’s actual expense ratio and an assumed rate of return of 5% per year before expenses, which is not the Fund’s actual return. The hypothetical account values and expenses may not be used to estimate the actual ending account balance or expense you incurred for the period. You may use this information to compare the ongoing costs of investing in the Fund and other Funds. To do so, compare this 5% hypothetical example with the 5% hypothetical examples that appear in the shareholder reports of the other funds.
Please note that the expenses shown in the table are meant to highlight your ongoing costs only and do not reflect any transactional costs, such as front and back end sales charges (loads) or redemption fees, where applicable. Therefore, the hypothetical information is useful in comparing ongoing costs only, and will not help you determine the relative total costs of owning different funds or share classes. In addition, if these transactional costs were included, your costs would have been higher.
| | | | | | | | | | | | | | | | | | | | | | | | | | | | | | | | |
| | | | | | | | | | | | | | | Hypothetical Performance |
| | | Actual Performance | | | | (5% return before expenses) |
| | | A Shares | | B Shares | | C Shares | | R3 Shares | | I Shares | | | | A Shares | | B Shares | | C Shares | | R3 Shares | | I Shares |
| Beginning Account Value (1/01/10) | | $ | 1,000.00 | | $ | 1,000.00 | | $ | 1,000.00 | | $ | 1,000.00 | | $ | 1,000.00 | | | | $ | 1,000.00 | | $ | 1,000.00 | | $ | 1,000.00 | | $ | 1,000.00 | | $ | 1,000.00 |
| Ending Account Value (6/30/10) | | $ | 1,002.40 | | $ | 998.60 | | $ | 998.60 | | $ | 1,001.00 | | $ | 1,003.70 | | | | $ | 1,017.50 | | $ | 1,013.79 | | $ | 1,013.79 | | $ | 1,016.17 | | $ | 1,018.74 |
| Expenses Incurred During Period | | $ | 7.30 | | $ | 11.00 | | $ | 11.00 | | $ | 8.63 | | $ | 6.06 | | | | $ | 7.35 | | $ | 11.08 | | $ | 11.08 | | $ | 8.70 | | $ | 6.11 |
For each class of the Fund, expenses are equal to the Fund’s annualized net expense ratio of 1.47%, 2.22%, 2.22%, 1.74% and 1.22% for Classes A, B, C, R3 and I, respectively, multiplied by the average account value over the period, multiplied by 181/365 (to reflect the one-half year period).
Report of
Independent Registered Public Accounting Firm
To the Board of Trustees and Shareholders of
Nuveen Investment Trust:
In our opinion, the accompanying statement of assets and liabilities, including the portfolios of investments, and the related statements of operations, of changes in net assets and the financial highlights present fairly, in all material respects, the financial position of Nuveen Multi-Manager Large-Cap Value Fund, Nuveen NWQ Multi-Cap Value Fund, Nuveen NWQ Large-Cap Value Fund, Nuveen NWQ Small/Mid-Cap Value Fund, Nuveen NWQ Small-Cap Value Fund, and Nuveen Tradewinds Value Opportunities Fund (each a series of the Nuveen Investment Trust, hereafter referred to as the “Funds”) at June 30, 2010, the results of their operations for the year then ended, the changes in their net assets for each of the two years in the period then ended and the financial highlights for each of the periods presented in conformity with accounting principles generally accepted in the United States of America. These financial statements and financial highlights (hereafter referred to as “financial statements”) are the responsibility of the Funds’ management; our responsibility is to express an opinion on these financial statements based on our audits. We conducted our audits of these financial statements in accordance with the standards of the Public Company Accounting Oversight Board (United States). Those standards require that we plan and perform the audit to obtain reasonable assurance about whether the financial statements are free of material misstatement. An audit includes examining, on a test basis, evidence supporting the amounts and disclosures in the financial statements, assessing the accounting principles used and significant estimates made by management, and evaluating the overall financial statement presentation. We believe that our audits, which included confirmation of securities at June 30, 2010 by correspondence with the custodian and brokers, provide a reasonable basis for our opinion.
PRICEWATERHOUSECOOPERS LLP
Chicago, IL
August 25, 2010
Portfolio of Investments
Nuveen Multi-Manager Large-Cap Value Fund
June 30, 2010
| | | | | | | | | | | |
| Shares | | Description (1) | | | | | | | | Value |
| | | | | | | | | | | |
| | COMMON STOCKS – 97.5% | | | | | | | | | |
| | | | | |
| | Aerospace & Defense – 1.9% | | | | | | | | | |
| | | | | |
| 2,800 | | BE Aerospace Inc., (2) | | | | | | | | $ | 71,204 |
| | | | | |
| 2,800 | | Boeing Company | | | | | | | | | 175,700 |
| | | | | |
| 6,100 | | General Dynamics Corporation | | | | | | | | | 357,216 |
| | | | | |
| 1,800 | | Goodrich Corporation | | | | | | | | | 119,250 |
| | | | | |
| 64,550 | | Honeywell International Inc. | | | | | | | | | 2,519,387 |
| | | | | |
| 2,800 | | ITT Industries, Inc. | | | | | | | | | 125,776 |
| | | | | |
| 2,000 | | L-3 Communications Holdings, Inc. | | | | | | | | | 141,680 |
| | | | | |
| 700 | | Lockheed Martin Corporation | | | | | | | | | 52,150 |
| | | | | |
| 6,200 | | Northrop Grumman Corporation | | | | | | | | | 337,528 |
| | | | | |
| 28,390 | | Raytheon Company | | | | | | | | | 1,373,792 |
| | | | | |
| 1,400 | | Rockwell Collins, Inc. | | | | | | | | | 74,382 |
| | | | | |
| 1,700 | | Spirit AeroSystems Holdings Inc., (2) | | | | | | | | | 32,402 |
| | | | | |
| 1,400 | | United Technologies Corporation | | | | | | | | | 90,874 |
| | Total Aerospace & Defense | | | | | | | | | 5,471,341 |
| | Air Freight & Logistics – 0.1% | | | | | | | | | |
| | | | | |
| 2,500 | | FedEx Corporation | | | | | | | | | 175,275 |
| | | | | |
| 200 | | UTI Worldwide, Inc. | | | | | | | | | 2,476 |
| | Total Air Freight & Logistics | | | | | | | | | 177,751 |
| | Airlines – 0.1% | | | | | | | | | |
| | | | | |
| 7,300 | | AMR Corporation, (2) | | | | | | | | | 49,494 |
| | | | | |
| 300 | | Copa Holdings SA | | | | | | | | | 13,266 |
| | | | | |
| 18,700 | | Southwest Airlines Co. | | | | | | | | | 207,757 |
| | | | | |
| 1,700 | | UAL Corporation, (2) | | | | | | | | | 34,952 |
| | Total Airlines | | | | | | | | | 305,469 |
| | Auto Components – 0.7% | | | | | | | | | |
| | | | | |
| 1,500 | | Autoliv Inc. | | | | | | | | | 71,775 |
| | | | | |
| 100 | | BorgWarner Inc., (2) | | | | | | | | | 3,734 |
| | | | | |
| 500 | | Federal Mogul Corporation, Class A Shares, (2) | | | | | | | | | 6,510 |
| | | | | |
| 68,550 | | Johnson Controls, Inc. | | | | | | | | | 1,841,939 |
| | | | | |
| 600 | | Lear Corporation, (2) | | | | | | | | | 39,720 |
| | | | | |
| 1,000 | | TRW Automotive Holdings Corporation, (2) | | | | | | | | | 27,570 |
| | Total Auto Components | | | | | | | | | 1,991,248 |
| | Beverages – 4.1% | | | | | | | | | |
| | | | | |
| 400 | | Brown-Forman Corporation | | | | | | | | | 22,892 |
| | | | | |
| 500 | | Central European Distribution Corporation, (2) | | | | | | | | | 10,690 |
| | | | | |
| 67,250 | | Coca-Cola Company | | | | | | | | | 3,370,570 |
| | | | | |
| 2,900 | | Coca-Cola Enterprises Inc. | | | | | | | | | 74,994 |
| | | | | |
| 3,900 | | Constellation Brands, Inc., Class A, (2) | | | | | | | | | 60,918 |
| | | | | |
| 49,510 | | Dr. Pepper Snapple Group | | | | | | | | | 1,851,179 |
| | | | | |
| 100 | | Hansen Natural Corporation, (2) | | | | | | | | | 3,911 |
| | | | | |
| 41,200 | | Molson Coors Brewing Company, Class B | | | | | | | | | 1,745,232 |
| | | | | |
| 79,550 | | PepsiCo, Inc. | | | | | | | | | 4,848,573 |
| | Total Beverages | | | | | | | | | 11,988,959 |
| | | | | | | | | | | |
| Shares | | Description (1) | | | | | | | | Value |
| | | | | | | | | | | |
| | Biotechnology – 0.6% | | | | | | | | | |
| | | | | |
| 34,190 | | Amgen Inc., (2) | | | | | | | | $ | 1,798,394 |
| | | | | |
| 1,100 | | Biogen Idec Inc., (2) | | | | | | | | | 52,195 |
| | | | | |
| 800 | | Cephalon, Inc., (2) | | | | | | | | | 45,400 |
| | | | | |
| 200 | | Genzyme Corporation, (2) | | | | | | | | | 10,154 |
| | Total Biotechnology | | | | | | | | | 1,906,143 |
| | Building Products – 0.4% | | | | | | | | | |
| | | | | |
| 800 | | Armstrong World Industries Inc., (2) | | | | | | | | | 24,144 |
| | | | | |
| 104,150 | | Masco Corporation | | | | | | | | | 1,120,654 |
| | | | | |
| 2,200 | | Owens Corning, (2) | | | | | | | | | 65,802 |
| | | | | |
| 1,000 | | USG Corporation, (2) | | | | | | | | | 12,080 |
| | Total Building Products | | | | | | | | | 1,222,680 |
| | Capital Markets – 2.1% | | | | | | | | | |
| | | | | |
| 4,100 | | Ameriprise Financial, Inc. | | | | | | | | | 148,133 |
| | | | | |
| 11,300 | | Bank of New York Company, Inc. | | | | | | | | | 278,997 |
| | | | | |
| 300 | | BlackRock Inc. | | | | | | | | | 43,020 |
| | | | | |
| 3,700 | | E*Trade Group Inc., (2) | | | | | | | | | 43,734 |
| | | | | |
| 200 | | Federated Investors Inc. | | | | | | | | | 4,142 |
| | | | | |
| 100 | | GLG Partners Inc., (2) | | | | | | | | | 438 |
| | | | | |
| 10,200 | | Goldman Sachs Group, Inc. | | | | | | | | | 1,338,954 |
| | | | | |
| 78,200 | | Invesco LTD | | | | | | | | | 1,316,106 |
| | | | | |
| 1,100 | | Janus Capital Group Inc. | | | | | | | | | 9,768 |
| | | | | |
| 1,100 | | Jefferies Group, Inc. | | | | | | | | | 23,188 |
| | | | | |
| 55,800 | | Legg Mason, Inc. | | | | | | | | | 1,564,074 |
| | | | | |
| 5,300 | | Morgan Stanley | | | | | | | | | 123,013 |
| | | | | |
| 900 | | Northern Trust Corporation | | | | | | | | | 42,030 |
| | | | | |
| 2,700 | | Raymond James Financial Inc. | | | | | | | | | 66,663 |
| | | | | |
| 2,300 | | State Street Corporation | | | | | | | | | 77,786 |
| | | | | |
| 67,650 | | TD Ameritrade Holding Corporation, (2) | | | | | | | | | 1,035,045 |
| | Total Capital Markets | | | | | | | | | 6,115,091 |
| | Chemicals – 1.0% | | | | | | | | | |
| | | | | |
| 2,700 | | Ashland Inc. | | | | | | | | | 125,334 |
| | | | | |
| 2,000 | | Cabot Corporation | | | | | | | | | 48,220 |
| | | | | |
| 100 | | CF Industries Holdings, Inc. | | | | | | | | | 6,345 |
| | | | | |
| 1,700 | | Cytec Industries, Inc. | | | | | | | | | 67,983 |
| | | | | |
| 27,500 | | Dow Chemical Company | | | | | | | | | 652,300 |
| | | | | |
| 11,800 | | E.I. Du Pont de Nemours and Company | | | | | | | | | 408,162 |
| | | | | |
| 20,610 | | Eastman Chemical Company | | | | | | | | | 1,099,750 |
| | | | | |
| 300 | | FMC Corporation | | | | | | | | | 17,229 |
| | | | | |
| 7,300 | | Huntsman Corporation | | | | | | | | | 63,291 |
| | | | | |
| 100 | | Intrepid Potash Inc., (2) | | | | | | | | | 1,957 |
| | | | | |
| 3,100 | | PPG Industries, Inc. | | | | | | | | | 187,271 |
| | | | | |
| 1,400 | | RPM International, Inc. | | | | | | | | | 24,976 |
| | | | | |
| 800 | | Sherwin-Williams Company | | | | | | | | | 55,352 |
| | | | | |
| 100 | | Sigma-Aldrich Corporation | | | | | | | | | 4,983 |
| | | | | |
| 1,900 | | Valspar Corporation | | | | | | | | | 57,228 |
| | Total Chemicals | | | | | | | | | 2,820,381 |
Portfolio of Investments
Nuveen Multi-Manager Large-Cap Value Fund (continued)
June 30, 2010
| | | | | | | | | | | |
| Shares | | Description (1) | | | | | | | | Value |
| | | | | | | | | | | |
| | Commercial & Professional Services – 0.0% | | | | | | | | | |
| | | | | |
| 1,600 | | Corrections Corporation of America, (2) | | | | | | | | $ | 30,528 |
| | Commercial Banks – 7.8% | | | | | | | | | |
| | | | | |
| 126,597 | | Associated Banc-Corp. | | | | | | | | | 1,552,079 |
| | | | | |
| 1,100 | | BancorpSouth Inc. | | | | | | | | | 19,668 |
| | | | | |
| 600 | | Bank of Hawaii Corporation | | | | | | | | | 29,010 |
| | | | | |
| 122,640 | | BB&T Corporation | | | | | | | | | 3,226,658 |
| | | | | |
| 500 | | BOK Financial Corporation | | | | | | | | | 23,735 |
| | | | | |
| 4,400 | | Capitalsource Inc. | | | | | | | | | 20,944 |
| | | | | |
| 5,200 | | CIT Group Inc., (2) | | | | | | | | | 176,072 |
| | | | | |
| 1,100 | | City National Corporation | | | | | | | | | 56,353 |
| | | | | |
| 4,700 | | Comerica Incorporated | | | | | | | | | 173,101 |
| | | | | |
| 1,200 | | Commerce Bancshares, Inc. | | | | | | | | | 43,188 |
| | | | | |
| 800 | | Cullen/Frost Bankers, Inc. | | | | | | | | | 41,120 |
| | | | | |
| 5,400 | | East West Bancorp Inc. | | | | | | | | | 82,350 |
| | | | | |
| 166,250 | | Fifth Third Bancorp. | | | | | | | | | 2,043,213 |
| | | | | |
| 100 | | First Citizens BancShares, Inc. | | | | | | | | | 19,233 |
| | | | | |
| 3,200 | | First Horizon National Corporation, (2) | | | | | | | | | 36,640 |
| | | | | |
| 5,500 | | Fulton Financial Corporation | | | | | | | | | 53,075 |
| | | | | |
| 21,700 | | Huntington BancShares, Inc. | | | | | | | | | 120,218 |
| | | | | |
| 28,600 | | KeyCorp. | | | | | | | | | 219,934 |
| | | | | |
| 1,900 | | M&T Bank Corporation | | | | | | | | | 161,405 |
| | | | | |
| 13,200 | | Marshall and Ilsley Corporation | | | | | | | | | 94,776 |
| | | | | |
| 13,600 | | PNC Financial Services Group, Inc. | | | | | | | | | 768,400 |
| | | | | |
| 14,400 | | Popular, Inc., (2) | | | | | | | | | 38,592 |
| | | | | |
| 50,300 | | Regions Financial Corporation | | | | | | | | | 330,974 |
| | | | | |
| 21,600 | | SunTrust Banks, Inc. | | | | | | | | | 503,280 |
| | | | | |
| 10,100 | | Synovus Financial Corp. | | | | | | | | | 25,654 |
| | | | | |
| 2,200 | | TCF Financial Corporation | | | | | | | | | 36,542 |
| | | | | |
| 302,070 | | U.S. Bancorp | | | | | | | | | 6,751,265 |
| | | | | |
| 3,300 | | Valley National Bancorp. | | | | | | | | | 44,946 |
| | | | | |
| 237,170 | | Wells Fargo & Company | | | | | | | | | 6,071,552 |
| | | | | |
| 1,500 | | Wilmington Trust Corporation | | | | | | | | | 16,635 |
| | | | | |
| 6,000 | | Zions Bancorporation | | | | | | | | | 129,420 |
| | Total Commercial Banks | | | | | | | | | 22,910,032 |
| | Commercial Services & Supplies – 0.6% | | | | | | | | | |
| | | | | |
| 1,800 | | Avery Dennison Corporation | | | | | | | | | 57,834 |
| | | | | |
| 1,900 | | Cintas Corporation | | | | | | | | | 45,543 |
| | | | | |
| 1,000 | | Covanta Holding Corporation | | | | | | | | | 16,590 |
| | | | | |
| 300 | | KAR Auction Services Inc., (2) | | | | | | | | | 3,711 |
| | | | | |
| 3,400 | | Pitney Bowes Inc. | | | | | | | | | 74,664 |
| | | | | |
| 5,800 | | R.R. Donnelley & Sons Company | | | | | | | | | 94,946 |
| | | | | |
| 43,810 | | Republic Services, Inc. | | | | | | | | | 1,302,471 |
| | | | | |
| 100 | | St Joe Company, (2) | | | | | | | | | 2,316 |
| | | | | |
| 300 | | Waste Connections Inc., (2) | | | | | | | | | 10,467 |
| | | | | |
| 8,500 | | Waste Management, Inc. | | | | | | | | | 265,965 |
| | Total Commercial Services & Supplies | | | | | | | | | 1,874,507 |
| | | | | | | | | | | |
| Shares | | Description (1) | | | | | | | | Value |
| | | | | | | | | | | |
| | Communications Equipment – 1.7% | | | | | | | | | |
| | | | | |
| 2,400 | | Brocade Communications Systems Inc., (2) | | | | | | | | $ | 12,384 |
| | | | | |
| 123,950 | | Cisco Systems, Inc., (2) | | | | | | | | | 2,641,375 |
| | | | | |
| 1,300 | | CommScope Inc., (2) | | | | | | | | | 30,901 |
| | | | | |
| 1,100 | | Echostar Holding Corporation, Class A, (2) | | | | | | | | | 20,988 |
| | | | | |
| 19,300 | | Motorola, Inc., (2) | | | | | | | | | 125,836 |
| | | | | |
| 69,000 | | QUALCOMM, Inc. | | | | | | | | | 2,265,960 |
| | | | | |
| 13,000 | | Tellabs Inc. | | | | | | | | | 83,070 |
| | Total Communications Equipment | | | | | | | | | 5,180,514 |
| | Computers & Peripherals – 2.1% | | | | | | | | | |
| | | | | |
| 900 | | Diebold Inc. | | | | | | | | | 24,525 |
| | | | | |
| 78,640 | | Hewlett-Packard Company | | | | | | | | | 3,403,539 |
| | | | | |
| 3,300 | | Lexmark International, Inc., Class A, (2) | | | | | | | | | 108,999 |
| | | | | |
| 121,340 | | Seagate Technology, (2) | | | | | | | | | 1,582,274 |
| | | | | |
| 35,430 | | Western Digital Corporation, (2) | | | | | | | | | 1,068,569 |
| | Total Computers & Peripherals | | | | | | | | | 6,187,906 |
| | Construction & Engineering – 0.4% | | | | | | | | | |
| | | | | |
| 300 | | AECOM Technology Corporation, (2) | | | | | | | | | 6,918 |
| | | | | |
| 1,500 | | Chicago Bridge & Iron Company N.V., (2) | | | | | | | | | 28,215 |
| | | | | |
| 1,500 | | Fluor Corporation | | | | | | | | | 63,750 |
| | | | | |
| 300 | | Jacobs Engineering Group, Inc., (2) | | | | | | | | | 10,932 |
| | | | | |
| 2,200 | | KBR Inc. | | | | | | | | | 44,748 |
| | | | | |
| 800 | | Quanta Services Incorporated, (2) | | | | | | | | | 16,520 |
| | | | | |
| 28,970 | | Shaw Group Inc., (2) | | | | | | | | | 991,353 |
| | | | | |
| 700 | | URS Corporation, (2) | | | | | | | | | 27,545 |
| | Total Construction & Engineering | | | | | | | | | 1,189,981 |
| | Construction Materials – 0.0% | | | | | | | | | |
| | | | | |
| 1,700 | | Vulcan Materials Company | | | | | | | | | 74,511 |
| | Consumer Finance – 1.0% | | | | | | | | | |
| | | | | |
| 2,600 | | Americredit Corp., (2) | | | | | | | | | 47,372 |
| | | | | |
| 67,370 | | Capital One Financial Corporation | | | | | | | | | 2,715,011 |
| | | | | |
| 14,200 | | Discover Financial Services | | | | | | | | | 198,516 |
| | | | | |
| 11,600 | | SLM Corporation, (2) | | | | | | | | | 120,524 |
| | Total Consumer Finance | | | | | | | | | 3,081,423 |
| | Containers & Packaging – 0.6% | | | | | | | | | |
| | | | | |
| 1,200 | | AptarGroup Inc. | | | | | | | | | 45,384 |
| | | | | |
| 1,100 | | Ball Corporation | | | | | | | | | 58,113 |
| | | | | |
| 1,800 | | Bemis Company, Inc. | | | | | | | | | 48,600 |
| | | | | |
| 500 | | Greif Inc. | | | | | | | | | 27,770 |
| | | | | |
| 51,700 | | Owens-Illinois, Inc., (2) | | | | | | | | | 1,367,465 |
| | | | | |
| 2,200 | | Packaging Corp. of America | | | | | | | | | 48,444 |
| | | | | |
| 200 | | Pactiv Corporation, (2) | | | | | | | | | 5,570 |
| | | | | |
| 2,200 | | Sealed Air Corporation | | | | | | | | | 43,384 |
| | | | | |
| 1,900 | | Sonoco Products Company | | | | | | | | | 57,912 |
| | | | | |
| 2,600 | | Temple-Inland Inc. | | | | | | | | | 53,742 |
| | Total Containers & Packaging | | | | | | | | | 1,756,384 |
Portfolio of Investments
Nuveen Multi-Manager Large-Cap Value Fund (continued)
June 30, 2010
| | | | | | | | | | | |
| Shares | | Description (1) | | | | | | | | Value |
| | | | | | | | | | | |
| | Distributors – 0.0% | | | | | | | | | |
| | | | | |
| 2,800 | | Genuine Parts Company | | | | | | | | $ | 110,460 |
| | Diversified Consumer Services – 0.0% | | | | | | | | | |
| | | | | |
| 300 | | Education Management Corporation, (2) | | | | | | | | | 4,575 |
| | | | | |
| 2,600 | | H & R Block Inc. | | | | | | | | | 40,794 |
| | | | | |
| 7,300 | | Service Corporation International | | | | | | | | | 54,020 |
| | Total Diversified Consumer Services | | | | | | | | | 99,389 |
| | Diversified Financial Services – 4.8% | | | | | | | | | |
| | | | | |
| 485,160 | | Bank of America Corporation | | | | | | | | | 6,971,749 |
| | | | | |
| 312,300 | | Citigroup Inc., (2) | | | | | | | | | 1,174,248 |
| | | | | |
| 4,170 | | CME Group, Inc. | | | | | | | | | 1,174,064 |
| | | | | |
| 400 | | Interactive Brokers Group, Inc., (2) | | | | | | | | | 6,640 |
| | | | | |
| 133,500 | | JPMorgan Chase & Co. | | | | | | | | | 4,887,435 |
| | | | | |
| 2,000 | | Leucadia National Corporation, (2) | | | | | | | | | 39,020 |
| | | | | |
| 900 | | Nasdaq Stock Market, Inc., (2) | | | | | | | | | 16,002 |
| | | | | |
| 2,300 | | New York Stock Exchange Euronext | | | | | | | | | 63,549 |
| | Total Diversified Financial Services | | | | | | | | | 14,332,707 |
| | Diversified REIT – 0.1% | | | | | | | | | |
| | | | | |
| 2,400 | | Liberty Property Trust | | | | | | | | | 69,240 |
| | | | | |
| 3,700 | | Vornado Realty Trust | | | | | | | | | 269,915 |
| | Total Diversified REIT | | | | | | | | | 339,155 |
| | Diversified Telecommunication Services – 2.5% | | | | | | | | | |
| | | | | |
| 97,300 | | AT&T Inc. | | | | | | | | | 2,353,687 |
| | | | | |
| 84,200 | | BCE INC. | | | | | | | | | 2,464,534 |
| | | | | |
| 25,900 | | CenturyTel, Inc. | | | | | | | | | 862,729 |
| | | | | |
| 4,600 | | Frontier Communications Corporation | | | | | | | | | 32,706 |
| | | | | |
| 15,400 | | Level 3 Communications Inc., (2) | | | | | | | | | 16,786 |
| | | | | |
| 44,800 | | Qwest Communications International Inc. | | | | | | | | | 235,200 |
| | | | | |
| 43,900 | | Verizon Communications Inc. | | | | | | | | | 1,230,078 |
| | | | | |
| 6,500 | | Windstream Corporation | | | | | | | | | 68,640 |
| | Total Diversified Telecommunication Services | | | | | | | | | 7,264,360 |
| | Electric Utilities – 1.5% | | | | | | | | | |
| | | | | |
| 2,000 | | Allegheny Energy, Inc. | | | | | | | | | 41,360 |
| | | | | |
| 9,900 | | American Electric Power Company, Inc. | | | | | | | | | 319,770 |
| | | | | |
| 2,200 | | DPL Inc. | | | | | | | | | 52,580 |
| | | | | |
| 26,400 | | Duke Energy Corporation | | | | | | | | | 422,400 |
| | | | | |
| 6,200 | | Edison International | | | | | | | | | 196,664 |
| | | | | |
| 2,800 | | Entergy Corporation | | | | | | | | | 200,536 |
| | | | | |
| 41,210 | | Exelon Corporation | | | | | | | | | 1,564,744 |
| | | | | |
| 4,300 | | FirstEnergy Corp. | | | | | | | | | 151,489 |
| | | | | |
| 2,700 | | Great Plains Energy Incorporated | | | | | | | | | 45,954 |
| | | | | |
| 1,900 | | Hawaiian Electric Industries | | | | | | | | | 43,282 |
| | | | | |
| 100 | | ITC Holdings Corporation | | | | | | | | | 5,291 |
| | | | | |
| 5,000 | | NextEra Energy Inc. | | | | | | | | | 243,800 |
| | | | | |
| 3,900 | | Northeast Utilities | | | | | | | | | 99,372 |
| | | | | |
| 4,600 | | NV Energy Inc. | | | | | | | | | 54,326 |
| | | | | | | | | | | |
| Shares | | Description (1) | | | | | | | | Value |
| | | | | | | | | | | |
| | Electric Utilities (continued) | | | | | | | | | |
| | | | | |
| 5,400 | | Pepco Holdings, Inc. | | | | | | | | $ | 84,672 |
| | | | | |
| 2,700 | | Pinnacle West Capital Corporation | | | | | | | | | 98,172 |
| | | | | |
| 4,300 | | PPL Corporation | | | | | | | | | 107,285 |
| | | | | |
| 5,500 | | Progress Energy, Inc. | | | | | | | | | 215,710 |
| | | | | |
| 14,800 | | Southern Company | | | | | | | | | 492,544 |
| | | | | |
| 2,700 | | Westar Energy Inc. | | | | | | | | | 58,347 |
| | Total Electric Utilities | | | | | | | | | 4,498,298 |
| | Electrical Equipment – 0.7% | | | | | | | | | |
| | | | | |
| 500 | | General Cable Corporation, (2) | | | | | | | | | 13,325 |
| | | | | |
| 700 | | Hubbell Incorporated, Class B | | | | | | | | | 27,783 |
| | | | | |
| 200 | | Regal-Beloit Corporation | | | | | | | | | 11,156 |
| | | | | |
| 38,470 | | Rockwell Automation, Inc. | | | | | | | | | 1,888,492 |
| | | | | |
| 800 | | Thomas & Betts Corporation, (2) | | | | | | | | | 27,760 |
| | Total Electrical Equipment | | | | | | | | | 1,968,516 |
| | Electronic Components – 0.1% | | | | | | | | | |
| | | | | |
| 1,000 | | AVX Group | | | | | | | | | 12,820 |
| | | | | |
| 20,700 | | Corning Incorporated | | | | | | | | | 334,305 |
| | | | | |
| 5,100 | | Vishay Intertechnology Inc., (2) | | | | | | | | | 39,474 |
| | Total Electronic Components | | | | | | | | | 386,599 |
| | Electronic Equipment & Instruments – 0.1% | | | | | | | | | |
| | | | | |
| 1,900 | | Arrow Electronics, Inc., (2) | | | | | | | | | 42,465 |
| | | | | |
| 2,800 | | Avnet Inc., (2) | | | | | | | | | 67,508 |
| | | | | |
| 1,600 | | Ingram Micro, Inc., Class A, (2) | | | | | | | | | 24,304 |
| | | | | |
| 1,300 | | Jabil Circuit Inc. | | | | | | | | | 17,290 |
| | | | | |
| 2,600 | | Molex Inc. | | | | | | | | | 47,424 |
| | | | | |
| 1,300 | | Tech Data Corporation, (2) | | | | | | | | | 46,306 |
| | Total Electronic Equipment & Instruments | | | | | | | | | 245,297 |
| | Energy Equipment & Services – 0.7% | | | | | | | | | |
| | | | | |
| 500 | | Atwood Oceanics Inc., (2) | | | | | | | | | 12,760 |
| | | | | |
| 2,000 | | Baker Hughes Incorporated | | | | | | | | | 83,140 |
| | | | | |
| 1,300 | | Cooper Cameron Corporation, (2) | | | | | | | | | 42,276 |
| | | | | |
| 500 | | Diamond Offshore Drilling, Inc. | | | | | | | | | 31,095 |
| | | | | |
| 100 | | Dresser Rand Group, Inc., (2) | | | | | | | | | 3,155 |
| | | | | |
| 1,300 | | Exterran Holdings, Inc., (2) | | | | | | | | | 33,553 |
| | | | | |
| 43,540 | | Halliburton Company | | | | | | | | | 1,068,907 |
| | | | | |
| 1,200 | | Helmerich & Payne Inc. | | | | | | | | | 43,824 |
| | | | | |
| 2,100 | | Nabors Industries Inc., (2) | | | | | | | | | 37,002 |
| | | | | |
| 5,100 | | National-Oilwell Varco Inc. | | | | | | | | | 168,657 |
| | | | | |
| 400 | | Oceaneering International Inc., (2) | | | | | | | | | 17,960 |
| | | | | |
| 1,200 | | Oil States International Inc., (2) | | | | | | | | | 47,496 |
| | | | | |
| 1,700 | | Patterson-UTI Energy, Inc. | | | | | | | | | 21,879 |
| | | | | |
| 1,300 | | Pride International Inc., (2) | | | | | | | | | 29,042 |
| | | | | |
| 2,200 | | Rowan Companies Inc., (2) | | | | | | | | | 48,268 |
| | | | | |
| 200 | | SeaCor Smit Inc., (2) | | | | | | | | | 14,132 |
| | | | | |
| 4,200 | | Smith International, Inc. | | | | | | | | | 158,130 |
Portfolio of Investments
Nuveen Multi-Manager Large-Cap Value Fund (continued)
June 30, 2010
| | | | | | | | | | | |
| Shares | | Description (1) | | | | | | | | Value |
| | | | | | | | | | | |
| | Energy Equipment & Services (continued) | | | | | | | | | |
| | | | | |
| 600 | | Superior Energy Services, Inc., (2) | | | | | | | | $ | 11,202 |
| | | | | |
| 700 | | Tidewater Inc. | | | | | | | | | 27,104 |
| | | | | |
| 700 | | Unit Corporation, (2) | | | | | | | | | 28,413 |
| | | | | |
| 1,800 | | Weatherford International Ltd., (2) | | | | | | | | | 23,652 |
| | Total Energy Equipment & Services | | | | | | | | | 1,951,647 |
| | Food & Staples Retailing – 0.8% | | | | | | | | | |
| | | | | |
| 800 | | BJ’s Wholesale Club, (2) | | | | | | | | | 29,608 |
| | | | | |
| 19,200 | | CVS Caremark Corporation | | | | | | | | | 562,944 |
| | | | | |
| 62,450 | | Kroger Co. | | | | | | | | | 1,229,641 |
| | | | | |
| 6,600 | | Safeway Inc. | | | | | | | | | 129,756 |
| | | | | |
| 4,300 | | SUPERVALU INC. | | | | | | | | | 46,612 |
| | | | | |
| 1,100 | | Walgreen Co. | | | | | | | | | 29,370 |
| | | | | |
| 8,800 | | Wal-Mart Stores, Inc. | | | | | | | | | 423,016 |
| | Total Food & Staples Retailing | | | | | | | | | 2,450,947 |
| | Food Products – 2.3% | | | | | | | | | |
| | | | | |
| 5,000 | | Archer-Daniels-Midland Company | | | | | | | | | 129,100 |
| | | | | |
| 1,000 | | Bunge Limited | | | | | | | | | 49,190 |
| | | | | |
| 1,300 | | Campbell Soup Company | | | | | | | | | 46,579 |
| | | | | |
| 8,100 | | ConAgra Foods, Inc. | | | | | | | | | 188,892 |
| | | | | |
| 1,600 | | Corn Products International, Inc. | | | | | | | | | 48,480 |
| | | | | |
| 2,300 | | Dean Foods Company, (2) | | | | | | | | | 23,161 |
| | | | | |
| 6,000 | | Del Monte Foods Company | | | | | | | | | 86,340 |
| | | | | |
| 700 | | Flowers Foods Inc. | | | | | | | | | 17,101 |
| | | | | |
| 5,100 | | General Mills, Inc. | | | | | | | | | 181,152 |
| | | | | |
| 3,000 | | H.J. Heinz Company | | | | | | | | | 129,660 |
| | | | | |
| 24,690 | | Hershey Foods Corporation | | | | | | | | | 1,183,392 |
| | | | | |
| 900 | | Hormel Foods Corporation | | | | | | | | | 36,432 |
| | | | | |
| 2,100 | | JM Smucker Company | | | | | | | | | 126,462 |
| | | | | |
| 400 | | Kellogg Company | | | | | | | | | 20,120 |
| | | | | |
| 23,100 | | Kraft Foods Inc. | | | | | | | | | 646,800 |
| | | | | |
| 1,100 | | McCormick & Company, Incorporated | | | | | | | | | 41,756 |
| | | | | |
| 36,980 | | Mead Johnson Nutrition Company, Class A Shares | | | | | | | | | 1,853,438 |
| | | | | |
| 600 | | Ralcorp Holdings Inc., (2) | | | | | | | | | 32,880 |
| | | | | |
| 4,600 | | Sara Lee Corporation | | | | | | | | | 64,860 |
| | | | | |
| 3,200 | | Smithfield Foods, Inc., (2) | | | | | | | | | 47,680 |
| | | | | |
| 104,910 | | Tyson Foods, Inc., Class A | | | | | | | | | 1,719,475 |
| | Total Food Products | | | | | | | | | 6,672,950 |
| | Gas Utilities – 0.2% | | | | | | | | | |
| | | | | |
| 1,800 | | AGL Resources Inc. | | | | | | | | | 64,476 |
| | | | | |
| 2,100 | | Atmos Energy Corporation | | | | | | | | | 56,784 |
| | | | | |
| 1,200 | | Energen Corporation | | | | | | | | | 53,196 |
| | | | | |
| 100 | | EQT Corporation | | | | | | | | | 3,614 |
| | | | | |
| 1,700 | | National Fuel Gas Company | | | | | | | | | 77,996 |
| | | | | |
| 2,900 | | ONEOK, Inc. | | | | | | | | | 125,425 |
| | | | | |
| 3,500 | | Questar Corporation | | | | | | | | | 159,215 |
| | | | | | | | | | | |
| Shares | | Description (1) | | | | | | | | Value |
| | | | | | | | | | | |
| | Gas Utilities (continued) | | | | | | | | | |
| | | | | |
| 1,800 | | UGI Corporation | | | | | | | | $ | 45,792 |
| | Total Gas Utilities | | | | | | | | | 586,498 |
| | Health Care Equipment & Supplies – 1.5% | | | | | | | | | |
| | | | | |
| 700 | | Baxter International, Inc. | | | | | | | | | 28,448 |
| | | | | |
| 700 | | Beckman Coulter, Inc. | | | | | | | | | 42,203 |
| | | | | |
| 10,100 | | Boston Scientific Corporation, (2) | | | | | | | | | 58,580 |
| | | | | |
| 3,900 | | CareFusion Corporation, (2) | | | | | | | | | 88,530 |
| | | | | |
| 700 | | Cooper Companies, Inc. | | | | | | | | | 27,853 |
| | | | | |
| 74,050 | | Covidien PLC | | | | | | | | | 2,975,329 |
| | | | | |
| 200 | | Hill Rom Holdings Inc. | | | | | | | | | 6,086 |
| | | | | |
| 54,030 | | Hologic Inc., (2) | | | | | | | | | 752,638 |
| | | | | |
| 700 | | Inverness Medical Innovation, (2) | | | | | | | | | 18,662 |
| | | | | |
| 1,500 | | Kinetic Concepts Inc., (2) | | | | | | | | | 54,765 |
| | | | | |
| 3,500 | | Medtronic, Inc. | | | | | | | | | 126,945 |
| | | | | |
| 600 | | Teleflex Inc. | | | | | | | | | 32,568 |
| | | | | |
| 3,400 | | Zimmer Holdings, Inc., (2) | | | | | | | | | 183,770 |
| | Total Health Care Equipment & Supplies | | | | | | | | | 4,396,377 |
| | Health Care Providers & Services – 1.6% | | | | | | | | | |
| | | | | |
| 6,100 | | Aetna Inc. | | | | | | | | | 160,918 |
| | | | | |
| 1,800 | | Brookdale Senior Living Inc., (2) | | | | | | | | | 27,000 |
| | | | | |
| 5,100 | | Cardinal Health, Inc. | | | | | | | | | 171,411 |
| | | | | |
| 6,400 | | CIGNA Corporation | | | | | | | | | 198,784 |
| | | | | |
| 1,000 | | Community Health Systems, Inc., (2) | | | | | | | | | 33,810 |
| | | | | |
| 3,000 | | Coventry Health Care, Inc., (2) | | | | | | | | | 53,040 |
| | | | | |
| 11,550 | | Davita Inc., (2) | | | | | | | | | 721,182 |
| | | | | |
| 2,400 | | Health Net Inc., (2) | | | | | | | | | 58,488 |
| | | | | |
| 4,600 | | Humana Inc., (2) | | | | | | | | | 210,082 |
| | | | | |
| 1,400 | | Lifepoint Hospitals Inc., (2) | | | | | | | | | 43,960 |
| | | | | |
| 26,877 | | Lincare Holdings | | | | | | | | | 873,771 |
| | | | | |
| 20,260 | | McKesson HBOC Inc. | | | | | | | | | 1,360,662 |
| | | | | |
| 1,100 | | Omnicare, Inc. | | | | | | | | | 26,070 |
| | | | | |
| 200 | | Quest Diagnostics Incorporated | | | | | | | | | 9,954 |
| | | | | |
| 4,200 | | Tenet Healthcare Corporation, (2) | | | | | | | | | 18,228 |
| | | | | |
| 15,700 | | UnitedHealth Group Incorporated | | | | | | | | | 445,880 |
| | | | | |
| 2,200 | | Universal Health Services, Inc., Class B | | | | | | | | | 83,930 |
| | | | | |
| 6,900 | | Wellpoint Inc., (2) | | | | | | | | | 337,617 |
| | Total Health Care Providers & Services | | | | | | | | | 4,834,787 |
| | Hotels, Restaurants & Leisure – 0.4% | | | | | | | | | |
| | | | | |
| 200 | | Brinker International Inc. | | | | | | | | | 2,892 |
| | | | | |
| 6,800 | | Carnival Corporation | | | | | | | | | 205,632 |
| | | | | |
| 400 | | Choice Hotels International, Inc. | | | | | | | | | 12,084 |
| | | | | |
| 1,900 | | Hyatt Hotels Corporation, Class A, (2) | | | | | | | | | 70,471 |
| | | | | |
| 300 | | Intl Speedway Corporation | | | | | | | | | 7,728 |
| | | | | |
| 9,500 | | McDonald’s Corporation | | | | | | | | | 625,765 |
| | | | | |
| 6,200 | | MGM Mirage Inc., (2) | | | | | | | | | 59,768 |
Portfolio of Investments
Nuveen Multi-Manager Large-Cap Value Fund (continued)
June 30, 2010
| | | | | | | | | | | |
| Shares | | Description (1) | | | | | | | | Value |
| | | | | | | | | | | |
| | Hotels, Restaurants & Leisure (continued) | | | | | | | | | |
| | | | | |
| 400 | | Penn National Gaming, Inc., (2) | | | | | | | | $ | 9,240 |
| | | | | |
| 3,100 | | Royal Caribbean Cruises Limited, (2) | | | | | | | | | 70,587 |
| | | | | |
| 2,800 | | Wendy’s International, Inc. | | | | | | | | | 11,200 |
| | | | | |
| 6,500 | | Wyndham Worldwide Corporation | | | | | | | | | 130,910 |
| | Total Hotels, Restaurants & Leisure | | | | | | | | | 1,206,277 |
| | Household Durables – 0.8% | | | | | | | | | |
| | | | | |
| 5,200 | | D.R. Horton, Inc. | | | | | | | | | 51,116 |
| | | | | |
| 3,000 | | Fortune Brands Inc. | | | | | | | | | 117,540 |
| | | | | |
| 3,100 | | Garmin Limited | | | | | | | | | 90,458 |
| | | | | |
| 800 | | Harman International Industries Inc., (2) | | | | | | | | | 23,912 |
| | | | | |
| 2,600 | | Jarden Corporation | | | | | | | | | 69,862 |
| | | | | |
| 800 | | KB Home | | | | | | | | | 8,800 |
| | | | | |
| 1,800 | | Leggett and Platt Inc. | | | | | | | | | 36,108 |
| | | | | |
| 5,400 | | Lennar Corporation, Class A | | | | | | | | | 75,114 |
| | | | | |
| 400 | | MDC Holdings Inc. | | | | | | | | | 10,780 |
| | | | | |
| 1,300 | | Mohawk Industries Inc., (2) | | | | | | | | | 59,488 |
| | | | | |
| 88,380 | | Newell Rubbermaid Inc. | | | | | | | | | 1,293,883 |
| | | | | |
| 5,400 | | Pulte Corporation, (2) | | | | | | | | | 44,712 |
| | | | | |
| 4,100 | | Stanley Black & Decker Inc. | | | | | | | | | 207,132 |
| | | | | |
| 1,600 | | Toll Brothers Inc., (2) | | | | | | | | | 26,176 |
| | | | | |
| 1,800 | | Whirlpool Corporation | | | | | | | | | 158,076 |
| | Total Household Durables | | | | | | | | | 2,273,157 |
| | Household Products – 0.9% | | | | | | | | | |
| | | | | |
| 100 | | Clorox Company | | | | | | | | | 6,216 |
| | | | | |
| 1,000 | | Colgate-Palmolive Company | | | | | | | | | 78,760 |
| | | | | |
| 800 | | Energizer Holdings Inc., (2) | | | | | | | | | 40,224 |
| | | | | |
| 1,400 | | Kimberly-Clark Corporation | | | | | | | | | 84,882 |
| | | | | |
| 42,200 | | Procter & Gamble Company | | | | | | | | | 2,531,156 |
| | Total Household Products | | | | | | | | | 2,741,238 |
| | Independent Power Producers & Energy Traders – 0.9% | | | | | | | | | |
| | | | | |
| 9,500 | | AES Corporation, (2) | | | | | | | | | 87,780 |
| | | | | |
| 1,900 | | Calpine Corporation, (2) | | | | | | | | | 24,168 |
| | | | | |
| 71,900 | | Constellation Energy Group | | | | | | | | | 2,318,775 |
| | | | | |
| 3,200 | | Mirant Corporation, (2) | | | | | | | | | 33,792 |
| | | | | |
| 5,200 | | NRG Energy Inc., (2) | | | | | | | | | 110,292 |
| | | | | |
| 100 | | Ormat Technologies Inc. | | | | | | | | | 2,829 |
| | | | | |
| 3,200 | | RRI Energy Inc., (2) | | | | | | | | | 12,128 |
| | Total Independent Power Producers & Energy Traders | | | | | | | | | 2,589,764 |
| | Industrial Conglomerates – 1.2% | | | | | | | | | |
| | | | | |
| 1,600 | | Carlisle Companies Inc. | | | | | | | | | 57,808 |
| | | | | |
| 159,200 | | General Electric Company | | | | | | | | | 2,295,664 |
| | | | | |
| 300 | | McDermott International Inc., (2) | | | | | | | | | 6,498 |
| | | | | |
| 47,100 | | Textron Inc. | | | | | | | | | 799,287 |
| | | | | |
| 8,700 | | Tyco International Ltd. | | | | | | | | | 306,501 |
| | Total Industrial Conglomerates | | | | | | | | | 3,465,758 |
| | | | | | | | | | | |
| Shares | | Description (1) | | | | | | | | Value |
| | | | | | | | | | | |
| | Industrial REIT – 0.1% | | | | | | | | | |
| | | | | |
| 3,400 | | AMB Property Corp. | | | | | | | | $ | 80,614 |
| | | | | |
| 9,500 | | ProLogis | | | | | | | | | 96,235 |
| | Total Industrial REIT | | | | | | | | | 176,849 |
| | Insurance – 6.8% | | | | | | | | | |
| | | | | |
| 28,900 | | Ace Limited | | | | | | | | | 1,487,772 |
| | | | | |
| 49,750 | | AFLAC Incorporated | | | | | | | | | 2,122,833 |
| | | | | |
| 100 | | Alleghany Corporation, Term Loan, (2) | | | | | | | | | 29,330 |
| | | | | |
| 1,200 | | Allied World Assurance Holdings | | | | | | | | | 54,456 |
| | | | | |
| 56,420 | | Allstate Corporation | | | | | | | | | 1,620,947 |
| | | | | |
| 2,300 | | American Financial Group Inc. | | | | | | | | | 62,836 |
| | | | | |
| 2,400 | | American International Group, (2) | | | | | | | | | 82,656 |
| | | | | |
| 200 | | American National Insurance Company | | | | | | | | | 16,194 |
| | | | | |
| 55,600 | | Aon Corporation | | | | | | | | | 2,063,872 |
| | | | | |
| 1,300 | | Arch Capital Group Limited, (2) | | | | | | | | | 96,850 |
| | | | | |
| 1,200 | | Arthur J. Gallagher & Co. | | | | | | | | | 29,256 |
| | | | | |
| 1,800 | | Aspen Insurance Holdings Limited | | | | | | | | | 44,532 |
| | | | | |
| 2,600 | | Assurant Inc. | | | | | | | | | 90,220 |
| | | | | |
| 3,700 | | Assured Guaranty Limited | | | | | | | | | 49,099 |
| | | | | |
| 2,100 | | Axis Capital Holdings Limited | | | | | | | | | 62,412 |
| | | | | |
| 24,700 | | Berkshire Hathaway Inc., Class B, (2) | | | | | | | | | 1,968,343 |
| | | | | |
| 500 | | Brown & Brown Inc. | | | | | | | | | 9,570 |
| | | | | |
| 6,800 | | Chubb Corporation | | | | | | | | | 340,068 |
| | | | | |
| 3,200 | | Cincinnati Financial Corporation | | | | | | | | | 82,784 |
| | | | | |
| 900 | | CNA Financial Corporation, (2) | | | | | | | | | 23,004 |
| | | | | |
| 1,100 | | Endurance Specialty Holdings, Limited | | | | | | | | | 41,283 |
| | | | | |
| 200 | | Erie Indemnity Company | | | | | | | | | 9,100 |
| | | | | |
| 1,000 | | Everest Reinsurance Group Ltd. | | | | | | | | | 70,720 |
| | | | | |
| 3,600 | | Fidelity National Title Group Inc., Class A | | | | | | | | | 46,764 |
| | | | | |
| 20,300 | | Genworth Financial Inc., Class A, (2) | | | | | | | | | 265,321 |
| | | | | |
| 900 | | Hanover Insurance Group Inc. | | | | | | | | | 39,150 |
| | | | | |
| 13,200 | | Hartford Financial Services Group, Inc. | | | | | | | | | 292,116 |
| | | | | |
| 1,700 | | HCC Insurance Holdings Inc. | | | | | | | | | 42,092 |
| | | | | |
| 90,473 | | Lincoln National Corporation | | | | | | | | | 2,197,589 |
| | | | | |
| 6,900 | | Loews Corporation | | | | | | | | | 229,839 |
| | | | | |
| 200 | | Markel Corporation, (2) | | | | | | | | | 68,000 |
| | | | | |
| 500 | | Marsh & McLennan Companies, Inc. | | | | | | | | | 11,275 |
| | | | | |
| 3,800 | | MBIA Inc., (2) | | | | | | | | | 21,318 |
| | | | | |
| 600 | | Mercury General Corporation | | | | | | | | | 24,864 |
| | | | | |
| 7,500 | | MetLife, Inc. | | | | | | | | | 283,200 |
| | | | | |
| 149,215 | | Old Republic International Corporation | | | | | | | | | 1,809,978 |
| | | | | |
| 700 | | OneBeacon Insurance Group Limited, Class A | | | | | | | | | 10,024 |
| | | | | |
| 1,600 | | PartnerRe Limited | | | | | | | | | 112,224 |
| | | | | |
| 7,700 | | Principal Financial Group, Inc. | | | | | | | | | 180,488 |
| | | | | |
| 11,300 | | Progressive Corporation | | | | | | | | | 211,536 |
| | | | | |
| 3,500 | | Protective Life Corporation | | | | | | | | | 74,865 |
Portfolio of Investments
Nuveen Multi-Manager Large-Cap Value Fund (continued)
June 30, 2010
| | | | | | | | | | | |
| Shares | | Description (1) | | | | | | | | Value |
| | | | | | | | | | | |
| | Insurance (continued) | | | | | | | | | |
| | | | | |
| 43,550 | | Prudential Financial, Inc. | | | | | | | | $ | 2,336,893 |
| | | | | |
| 2,000 | | Reinsurance Group of America Inc. | | | | | | | | | 91,420 |
| | | | | |
| 1,100 | | RenaisasnceRE Holdings, Limited | | | | | | | | | 61,897 |
| | | | | |
| 1,200 | | StanCorp Financial Group Inc. | | | | | | | | | 48,648 |
| | | | | |
| 1,300 | | Symetra Financial Corporation | | | | | | | | | 15,600 |
| | | | | |
| 1,900 | | Torchmark Corporation | | | | | | | | | 94,069 |
| | | | | |
| 1,500 | | Transatlantic Holdings Inc. | | | | | | | | | 71,940 |
| | | | | |
| 8,700 | | Travelers Companies, Inc. | | | | | | | | | 428,475 |
| | | | | |
| 1,300 | | Unitrin, Inc. | | | | | | | | | 33,280 |
| | | | | |
| 8,000 | | Unum Group | | | | | | | | | 173,600 |
| | | | | |
| 1,400 | | Valdius Holdings Limited | | | | | | | | | 34,188 |
| | | | | |
| 200 | | White Mountain Insurance Group | | | | | | | | | 64,840 |
| | | | | |
| 2,200 | | WR Berkley Corporation | | | | | | | | | 58,212 |
| | | | | |
| 9,400 | | XL Capital Ltd, Class A | | | | | | | | | 150,494 |
| | Total Insurance | | | | | | | | | 20,042,336 |
| | Internet & Catalog Retail – 0.1% | | | | | | | | | |
| | | | | |
| 2,000 | | Expedia, Inc. | | | | | | | | | 37,560 |
| | | | | |
| 26,300 | | Liberty Media Holding Corporation Interactive, Class A, (2) | | | | | | | | | 276,150 |
| | Total Internet & Catalog Retail | | | | | | | | | 313,710 |
| | Internet Software & Services – 0.1% | | | | | | | | | |
| | | | | |
| 1,700 | | AOL Inc., (2) | | | | | | | | | 35,343 |
| | | | | |
| 10,400 | | eBay Inc., (2) | | | | | | | | | 203,944 |
| | | | | |
| 1,300 | | IAC/InterActiveCorp., (2) | | | | | | | | | 28,561 |
| | | | | |
| 900 | | Monster Worldwide Inc., (2) | | | | | | | | | 10,485 |
| | | | | |
| 3,800 | | Yahoo! Inc., (2) | | | | | | | | | 52,554 |
| | Total Internet Software & Services | | | | | | | | | 330,887 |
| | IT Services – 1.8% | | | | | | | | | |
| | | | | |
| 49,550 | | Accenture Limited | | | | | | | | | 1,915,108 |
| | | | | |
| 2,800 | | Amdocs Limited, (2) | | | | | | | | | 75,180 |
| | | | | |
| 200 | | Broadridge Financial Solutions, Inc. | | | | | | | | | 3,810 |
| | | | | |
| 3,100 | | Computer Sciences Corporation | | | | | | | | | 140,275 |
| | | | | |
| 1,700 | | Convergys Corporation, (2) | | | | | | | | | 16,677 |
| | | | | |
| 3,400 | | CoreLogic Inc. | | | | | | | | | 60,044 |
| | | | | |
| 6,700 | | Fidelity National Information Services | | | | | | | | | 179,694 |
| | | | | |
| 600 | | Fiserv, Inc., (2) | | | | | | | | | 27,396 |
| | | | | |
| 5,140 | | International Business Machines Corporation (IBM) | | | | | | | | | 634,687 |
| | | | | |
| 2,100 | | Total System Services Inc. | | | | | | | | | 28,560 |
| | | | | |
| 33,290 | | Visa Inc. | | | | | | | | | 2,355,268 |
| | Total IT Services | | | | | | | | | 5,436,699 |
| | Leisure Equipment & Products – 0.0% | | | | | | | | | |
| | | | | |
| 3,200 | | Mattel, Inc. | | | | | | | | | 67,712 |
| | Life Sciences Tools & Services – 0.2% | | | | | | | | | |
| | | | | |
| 300 | | Bio-Rad Laboratories Inc., (2) | | | | | | | | | 25,947 |
| | | | | |
| 400 | | Charles River Laboratories International, Inc., (2) | | | | | | | | | 13,684 |
| | | | | |
| 800 | | Life Technologies Corporation, (2) | | | | | | | | | 37,800 |
| | | | | | | | | | | |
| Shares | | Description (1) | | | | | | | | Value |
| | | | | | | | | | | |
| | Life Sciences Tools & Services (continued) | | | | | | | | | |
| | | | | |
| 1,300 | | Perkinelmer Inc. | | | | | | | | $ | 26,871 |
| | | | | |
| 7,600 | | Thermo Fisher Scientific, Inc., (2) | | | | | | | | | 372,780 |
| | Total Life Sciences Tools & Services | | | | | | | | | 477,082 |
| | Machinery – 3.1% | | | | | | | | | |
| | | | | |
| 700 | | AGCO Corporation, (2) | | | | | | | | | 18,879 |
| | | | | |
| 57,360 | | Caterpillar Inc. | | | | | | | | | 3,445,615 |
| | | | | |
| 600 | | CNH Global N.V. | | | | | | | | | 13,590 |
| | | | | |
| 1,100 | | Crane Company | | | | | | | | | 33,231 |
| | | | | |
| 17,000 | | Cummins Inc. | | | | | | | | | 1,107,210 |
| | | | | |
| 700 | | Danaher Corporation | | | | | | | | | 25,984 |
| | | | | |
| 400 | | Deere & Company | | | | | | | | | 22,272 |
| | | | | |
| 1,500 | | Dover Corporation | | | | | | | | | 62,685 |
| | | | | |
| 3,200 | | Eaton Corporation | | | | | | | | | 209,408 |
| | | | | |
| 100 | | Flowserve Corporation | | | | | | | | | 8,480 |
| | | | | |
| 100 | | Gardner Denver, Inc. | | | | | | | | | 4,459 |
| | | | | |
| 800 | | Harsco Corporation | | | | | | | | | 18,800 |
| | | | | |
| 200 | | IDEX Corporation | | | | | | | | | 5,714 |
| | | | | |
| 8,600 | | Ingersoll Rand Company Limited, Class A | | | | | | | | | 296,614 |
| | | | | |
| 400 | | Kennametal Inc. | | | | | | | | | 10,172 |
| | | | | |
| 49,940 | | Oshkosh Truck Corporation, (2) | | | | | | | | | 1,556,130 |
| | | | | |
| 35,900 | | Parker Hannifin Corporation | | | | | | | | | 1,991,014 |
| | | | | |
| 1,000 | | Pentair, Inc. | | | | | | | | | 32,200 |
| | | | | |
| 1,400 | | Snap-on Incorporated | | | | | | | | | 57,274 |
| | | | | |
| 800 | | SPX Corporation | | | | | | | | | 42,248 |
| | | | | |
| 2,700 | | Terex Corporation, (2) | | | | | | | | | 50,598 |
| | | | | |
| 700 | | Timken Company | | | | | | | | | 18,193 |
| | | | | |
| 2,600 | | Trinity Industries Inc. | | | | | | | | | 46,072 |
| | | | | |
| 600 | | Wabtec Corporation | | | | | | | | | 23,934 |
| | Total Machinery | | | | | | | | | 9,100,776 |
| | Marine – 0.0% | | | | | | | | | |
| | | | | |
| 800 | | Alexander and Bald, Inc. | | | | | | | | | 23,824 |
| | | | | |
| 800 | | Kirby Corporation, (2) | | | | | | | | | 30,600 |
| | Total Marine | | | | | | | | | 54,424 |
| | Media – 4.8% | | | | | | | | | |
| | | | | |
| 51,230 | | Cablevision Systems Corporation | | | | | | | | | 1,230,032 |
| | | | | |
| 19,900 | | CBS Corporation, Class B | | | | | | | | | 257,307 |
| | | | | |
| 600 | | Central European Media Enterprises Limited, (2) | | | | | | | | | 11,940 |
| | | | | |
| 2,000 | | Clear Channel Outdoor Holdings Inc., Class A, (2) | | | | | | | | | 17,360 |
| | | | | |
| 177,110 | | Comcast Corporation, Class A | | | | | | | | | 3,076,401 |
| | | | | |
| 28,050 | | DIRECTV Group, Inc., (2) | | | | | | | | | 951,456 |
| | | | | |
| 2,000 | | Discovery Communications Inc., Class A Shares, (2) | | | | | | | | | 71,420 |
| | | | | |
| 5,500 | | Echostar Communications Corporation, Variable Prepaid Forward | | | | | | | | | 99,825 |
| | | | | |
| 9,900 | | Gannett Company Inc. | | | | | | | | | 133,254 |
| | | | | |
| 100 | | Interactive Data Corporation | | | | | | | | | 3,338 |
| | | | | |
| 100 | | John Wiley and Sons Inc., Class A | | | | | | | | | 3,867 |
Portfolio of Investments
Nuveen Multi-Manager Large-Cap Value Fund (continued)
June 30, 2010
| | | | | | | | | | | |
| Shares | | Description (1) | | | | | | | | Value |
| | | | | | | | | | | |
| | Media (continued) | | | | | | | | | |
| | | | | |
| 24,010 | | Lamar Advertising Company, (2) | | | | | | | | $ | 588,725 |
| | | | | |
| 9,600 | | Liberty Global Inc., A Shares, (2) | | | | | | | | | 249,504 |
| | | | | |
| 3,100 | | Liberty Media Holding Corporation, Capital Tracking Stock, Class A, (2) | | | | | | | | | 129,921 |
| | | | | |
| 1,200 | | Liberty Media Starz, (2) | | | | | | | | | 62,208 |
| | | | | |
| 12,160 | | Madison Square Garden Inc., (2) | | | | | | | | | 239,187 |
| | | | | |
| 700 | | McGraw-Hill Companies, Inc. | | | | | | | | | 19,698 |
| | | | | |
| 400 | | Meredith Corporation | | | | | | | | | 12,452 |
| | | | | |
| 3,100 | | New York Times, Class A, (2) | | | | | | | | | 26,815 |
| | | | | |
| 36,600 | | News Corporation, Class A | | | | | | | | | 437,736 |
| | | | | |
| 1,000 | | Omnicom Group, Inc. | | | | | | | | | 34,300 |
| | | | | |
| 1,300 | | Regal Entertainment Group, Class A | | | | | | | | | 16,952 |
| | | | | |
| 3,700 | | Thomson Corporation | | | | | | | | | 132,571 |
| | | | | |
| 11,800 | | Time Warner Cable, Class A | | | | | | | | | 614,544 |
| | | | | |
| 23,000 | | Time Warner Inc. | | | | | | | | | 664,930 |
| | | | | |
| 122,600 | | Viacom Inc., Class B | | | | | | | | | 3,845,962 |
| | | | | |
| 9,600 | | Virgin Media, Inc. | | | | | | | | | 160,224 |
| | | | | |
| 37,800 | | Walt Disney Company | | | | | | | | | 1,190,700 |
| | | | | |
| 100 | | Washington Post Company | | | | | | | | | 41,048 |
| | Total Media | | | | | | | | | 14,323,677 |
| | Metals & Mining – 2.7% | | | | | | | | | |
| | | | | |
| 500 | | AK Steel Holding Corporation | | | | | | | | | 5,960 |
| | | | | |
| 14,100 | | Alcoa Inc. | | | | | | | | | 141,846 |
| | | | | |
| 18,390 | | Cliffs Natural Resources Inc. | | | | | | | | | 867,272 |
| | | | | |
| 1,500 | | Commercial Metals Company | | | | | | | | | 19,830 |
| | | | | |
| 26,133 | | Freeport-McMoRan Copper & Gold, Inc. | | | | | | | | | 1,545,244 |
| | | | | |
| 1,200 | | Gerdau AmeriSteel Corporation, (2) | | | | | | | | | 13,080 |
| | | | | |
| 53,850 | | Newmont Mining Corporation | | | | | | | | | 3,324,699 |
| | | | | |
| 1,400 | | Nucor Corporation | | | | | | | | | 53,592 |
| | | | | |
| 1,500 | | Reliance Steel & Aluminum Company | | | | | | | | | 54,225 |
| | | | | |
| 400 | | Royal Gold, Inc. | | | | | | | | | 19,200 |
| | | | | |
| 100 | | Schnitzer Steel Industries, Inc. | | | | | | | | | 3,920 |
| | | | | |
| 66,134 | | Steel Dynamics Inc. | | | | | | | | | 872,307 |
| | | | | |
| 23,770 | | United States Steel Corporation | | | | | | | | | 916,334 |
| | | | | |
| 400 | | Walter Industries Inc. | | | | | | | | | 24,340 |
| | Total Metals & Mining | | | | | | | | | 7,861,849 |
| | Mortgage REIT – 0.1% | | | | | | | | | |
| | | | | |
| 18,100 | | Annaly Capital Management Inc. | | | | | | | | | 310,415 |
| | | | | |
| 16,400 | | Chimera Investments Corporation | | | | | | | | | 59,204 |
| | Total Mortgage REIT | | | | | | | | | 369,619 |
| | Multiline Retail – 0.5% | | | | | | | | | |
| | | | | |
| 2,500 | | J.C. Penney Company, Inc. | | | | | | | | | 53,700 |
| | | | | |
| 1,100 | | Kohl’s Corporation, (2) | | | | | | | | | 52,250 |
| | | | | |
| 70,560 | | Macy’s, Inc. | | | | | | | | | 1,263,024 |
| 1,400 | | Sears Holding Corporation, (2) | | | | | | | | | 90,510 |
| | Total Multiline Retail | | | | | | | | | 1,459,484 |
| | | | | | | | | | | |
| Shares | | Description (1) | | | | | | | | Value |
| | | | | | | | | | | |
| | Multi-Utilities – 1.0% | | | | | | | | | |
| | | | | |
| 2,700 | | Alliant Energy Corporation | | | | | | | | $ | 85,698 |
| | | | | |
| 5,300 | | Ameren Corporation | | | | | | | | | 125,981 |
| | | | | |
| 10,700 | | CenterPoint Energy, Inc. | | | | | | | | | 140,812 |
| | | | | |
| 5,500 | | CMS Energy Corporation | | | | | | | | | 80,575 |
| | | | | |
| 5,700 | | Consolidated Edison, Inc. | | | | | | | | | 245,670 |
| | | | | |
| 11,500 | | Dominion Resources, Inc. | | | | | | | | | 445,510 |
| | | | | |
| 4,900 | | DTE Energy Company | | | | | | | | | 223,489 |
| | | | | |
| 2,500 | | Integrys Energy Group, Inc. | | | | | | | | | 109,350 |
| | | | | |
| 2,300 | | MDU Resources Group Inc. | | | | | | | | | 41,469 |
| | | | | |
| 7,700 | | NiSource Inc. | | | | | | | | | 111,650 |
| | | | | |
| 2,000 | | NSTAR | | | | | | | | | 70,000 |
| | | | | |
| 2,400 | | OGE Energy Corp. | | | | | | | | | 87,744 |
| | | | | |
| 6,800 | | PG&E Corporation | | | | | | | | | 279,480 |
| | | | | |
| 5,900 | | Public Service Enterprise Group Incorporated | | | | | | | | | 184,847 |
| | | | | |
| 2,300 | | Scana Corporation | | | | | | | | | 82,248 |
| | | | | |
| 3,000 | | Sempra Energy | | | | | | | | | 140,370 |
| | | | | |
| 5,500 | | TECO Energy, Inc. | | | | | | | | | 82,885 |
| | | | | |
| 1,300 | | Vectren Corporation | | | | | | | | | 30,758 |
| | | | | |
| 2,100 | | Wisconsin Energy Corporation | | | | | | | | | 106,554 |
| | | | | |
| 9,200 | | Xcel Energy, Inc. | | | | | | | | | 189,612 |
| | Total Multi-Utilities | | | | | | | | | 2,864,702 |
| | Office Electronics – 0.1% | | | | | | | | | |
| | | | | |
| 31,700 | | Xerox Corporation | | | | | | | | | 254,868 |
| | | | | |
| 400 | | Zebra Technologies Corporation, Class A, (2) | | | | | | | | | 10,148 |
| | Total Office Electronics | | | | | | | | | 265,016 |
| | Office REIT – 0.7% | | | | | | | | | |
| | | | | |
| 1,200 | | Alexandria Real Estate Equities Inc. | | | | | | | | | 76,044 |
| | | | | |
| 20,030 | | Boston Properties, Inc. | | | | | | | | | 1,428,940 |
| | | | | |
| 3,700 | | Brandywine Realty Trust | | | | | | | | | 39,775 |
| | | | | |
| 1,000 | | Corporate Office Properties | | | | | | | | | 37,760 |
| | | | | |
| 100 | | Digital Realty Trust Inc. | | | | | | | | | 5,768 |
| | | | | |
| 3,400 | | Douglas Emmett Inc. | | | | | | | | | 48,348 |
| | | | | |
| 4,300 | | Duke Realty Corporation | | | | | | | | | 48,805 |
| | | | | |
| 7,500 | | HRPT Properties Trust | | | | | | | | | 46,575 |
| | | | | |
| 1,800 | | Mack-Cali Realty Corporation | | | | | | | | | 53,514 |
| | | | | |
| 1,400 | | Piedmont Office Realty Trust | | | | | | | | | 26,222 |
| | | | | |
| 2,900 | | SL Green Realty Corporation | | | | | | | | | 159,616 |
| | Total Office REIT | | | | | | | | | 1,971,367 |
| | Oil, Gas & Consumable Fuels – 10.2% | | | | | | | | | |
| | | | | |
| 1,900 | | Alpha Natural Resources Inc., (2) | | | | | | | | | 64,353 |
| | | | | |
| 8,200 | | Anadarko Petroleum Corporation | | | | | | | | | 295,938 |
| | | | | |
| 20,350 | | Apache Corporation | | | | | | | | | 1,713,267 |
| | | | | |
| 700 | | Arch Coal Inc. | | | | | | | | | 13,867 |
| | | | | |
| 600 | | Atlas Energy Inc, (2) | | | | | | | | | 16,242 |
| | | | | |
| 900 | | Cabot Oil & Gas Corporation | | | | | | | | | 28,188 |
Portfolio of Investments
Nuveen Multi-Manager Large-Cap Value Fund (continued)
June 30, 2010
| | | | | | | | | | | |
| Shares | | Description (1) | | | | | | | | Value |
| | | | | | | | | | | |
| | Oil, Gas & Consumable Fuels (continued) | | | | | | | | | |
| | | | | |
| 54,800 | | Chesapeake Energy Corporation | | | | | | | | $ | 1,148,060 |
| | | | | |
| 76,900 | | Chevron Corporation | | | | | | | | | 5,218,434 |
| | | | | |
| 300 | | Cobalt International Energy, Inc., (2) | | | | | | | | | 2,235 |
| | | | | |
| 200 | | Comstock Resources Inc., (2) | | | | | | | | | 5,544 |
| | | | | |
| 93,100 | | ConocoPhillips | | | | | | | | | 4,570,279 |
| | | | | |
| 800 | | CONSOL Energy Inc. | | | | | | | | | 27,008 |
| | | | | |
| 24,420 | | Continental Resources Inc., (2) | | | | | | | | | 1,089,620 |
| | | | | |
| 2,000 | | Denbury Resources Inc., (2) | | | | | | | | | 29,280 |
| | | | | |
| 27,160 | | Devon Energy Corporation | | | | | | | | | 1,654,587 |
| | | | | |
| 8,800 | | El Paso Corporation | | | | | | | | | 97,768 |
| | | | | |
| 8,304 | | Exxon Mobil Corporation | | | | | | | | | 473,909 |
| | | | | |
| 800 | | Forest Oil Corporation, (2) | | | | | | | | | 21,888 |
| | | | | |
| 300 | | Frontier Oil Corporation | | | | | | | | | 4,035 |
| | | | | |
| 200 | | Frontline Limited | | | | | | | | | 5,708 |
| | | | | |
| 26,140 | | Hess Corporation | | | | | | | | | 1,315,888 |
| | | | | |
| 200 | | Holly Corporation | | | | | | | | | 5,316 |
| | | | | |
| 102,900 | | Marathon Oil Corporation | | | | | | | | | 3,199,161 |
| | | | | |
| 2,600 | | Mariner Energy Inc., (2) | | | | | | | | | 55,848 |
| | | | | |
| 2,100 | | Massey Energy Company | | | | | | | | | 57,435 |
| | | | | |
| 1,700 | | Murphy Oil Corporation | | | | | | | | | 84,235 |
| | | | | |
| 49,430 | | Newfield Exploration Company, (2) | | | | | | | | | 2,415,150 |
| | | | | |
| 1,300 | | Noble Energy, Inc. | | | | | | | | | 78,429 |
| | | | | |
| 69,913 | | Occidental Petroleum Corporation | | | | | | | | | 5,393,788 |
| | | | | |
| 2,900 | | Peabody Energy Corporation | | | | | | | | | 113,477 |
| | | | | |
| 300 | | Petrohawk Energy Corporation, (2) | | | | | | | | | 5,091 |
| | | | | |
| 3,800 | | Pioneer Natural Resources Company | | | | | | | | | 225,910 |
| | | | | |
| 1,100 | | Plains Exploration & Production Company, (2) | | | | | | | | | 22,671 |
| | | | | |
| 1,500 | | Quicksilver Resources Inc., (2) | | | | | | | | | 16,500 |
| | | | | |
| 900 | | SandRidge Energy Inc., (2) | | | | | | | | | 5,247 |
| | | | | |
| 600 | | SM Energy Company | | | | | | | | | 24,096 |
| | | | | |
| 2,500 | | Southern Union Company | | | | | | | | | 54,650 |
| | | | | |
| 12,300 | | Spectra Energy Corporation | | | | | | | | | 246,861 |
| | | | | |
| 1,200 | | Sunoco, Inc. | | | | | | | | | 41,724 |
| | | | | |
| 1,200 | | Teekay Shipping Corporation | | | | | | | | | 31,404 |
| | | | | |
| 2,000 | | Tesoro Corporation | | | | | | | | | 23,340 |
| | | | | |
| 4,600 | | Valero Energy Corporation | | | | | | | | | 82,708 |
| | | | | |
| 1,400 | | Whiting Petroleum Corporation, (2) | | | | | | | | | 109,788 |
| | | | | |
| 6,400 | | Williams Companies, Inc. | | | | | | | | | 116,992 |
| | Total Oil, Gas & Consumable Fuels | | | | | | | | | 30,205,919 |
| | Paper & Forest Products – 0.1% | | | | | | | | | |
| | | | | |
| 2,400 | | Domtar Corporation | | | | | | | | | 117,960 |
| | | | | |
| 2,900 | | International Paper Company | | | | | | | | | 65,627 |
| | | | | |
| 4,700 | | MeadWestvaco Corporation | | | | | | | | | 104,340 |
| | | | | |
| 3,100 | | Weyerhaeuser Company | | | | | | | | | 109,120 |
| | Total Paper & Forest Products | | | | | | | | | 397,047 |
| | | | | | | | | | | |
| Shares | | Description (1) | | | | | | | | Value |
| | | | | | | | | | | |
| | Personal Products – 0.0% | | | | | | | | | |
| | | | | |
| 900 | | Alberto Culver Company | | | | | | | | $ | 24,381 |
| | | | | |
| 1,000 | | NBTY Inc., (2) | | | | | | | | | 34,010 |
| | Total Personal Products | | | | | | | | | 58,391 |
| | Pharmaceuticals – 7.7% | | | | | | | | | |
| | | | | |
| 1,800 | | Abbott Laboratories | | | | | | | | | 84,204 |
| | | | | |
| 114,050 | | Bristol-Myers Squibb Company | | | | | | | | | 2,844,407 |
| | | | | |
| 9,100 | | Eli Lilly and Company | | | | | | | | | 304,850 |
| | | | | |
| 2,000 | | Endo Pharmaceuticals Holdings Inc., (2) | | | | | | | | | 43,640 |
| | | | | |
| 3,100 | | Forest Laboratories, Inc., (2) | | | | | | | | | 85,033 |
| | | | | |
| 59,650 | | Johnson & Johnson | | | | | | | | | 3,522,929 |
| | | | | |
| 2,400 | | King Pharmaceuticals Inc., (2) | | | | | | | | | 18,216 |
| | | | | |
| 150,689 | | Merck & Company Inc. | | | | | | | | | 5,269,594 |
| | | | | |
| 1,200 | | Mylan Laboratories Inc., (2) | | | | | | | | | 20,448 |
| | | | | |
| 343,800 | | Pfizer Inc. | | | | | | | | | 4,902,588 |
| | | | | |
| 113,800 | | Sanofi-Aventis, ADR | | | | | | | | | 3,420,828 |
| | | | | |
| 53,730 | | Watson Pharmaceuticals Inc., (2) | | | | | | | | | 2,179,826 |
| | Total Pharmaceuticals | | | | | | | | | 22,696,563 |
| | Professional Services – 0.2% | | | | | | | | | |
| | | | | |
| 1,600 | | Equifax Inc. | | | | | | | | | 44,896 |
| | | | | |
| 800 | | Manpower Inc. | | | | | | | | | 34,544 |
| | | | | |
| 21,650 | | Robert Half International Inc. | | | | | | | | | 509,858 |
| | | | | |
| 500 | | Towers Watson & Company, Class A Shares | | | | | | | | | 19,425 |
| | Total Professional Services | | | | | | | | | 608,723 |
| | Real Estate Management & Devlopment – 0.0% | | | | | | | | | |
| | | | | |
| 4,700 | | Forest City Enterprises, Inc., (2) | | | | | | | | | 53,204 |
| | Residential REIT – 0.3% | | | | | | | | | |
| | | | | |
| 2,000 | | Apartment Investment & Management Company, Class A | | | | | | | | | 38,740 |
| | | | | |
| 2,100 | | AvalonBay Communities, Inc. | | | | | | | | | 196,077 |
| | | | | |
| 1,800 | | BRE Properties, Inc. | | | | | | | | | 66,474 |
| | | | | |
| 1,600 | | Camden Property Trust | | | | | | | | | 65,360 |
| | | | | |
| 8,200 | | Equity Residential | | | | | | | | | 341,448 |
| | | | | |
| 500 | | Essex Property Trust Inc. | | | | | | | | | 48,770 |
| | | | | |
| 4,700 | | UDR Inc. | | | | | | | | | 89,911 |
| | Total Residential REIT | | | | | | | | | 846,780 |
| | Retail REIT – 0.9% | | | | | | | | | |
| | | | | |
| 7,500 | | Developers Diversified Realty Corporation | | | | | | | | | 74,250 |
| | | | | |
| 500 | | Federal Realty Investment Trust | | | | | | | | | 35,135 |
| | | | | |
| 1,600 | | General Growth Properties Inc. | | | | | | | | | 21,216 |
| | | | | |
| 70,900 | | Kimco Realty Corporation | | | | | | | | | 952,896 |
| | | | | |
| 4,900 | | Macerich Company | | | | | | | | | 182,868 |
| | | | | |
| 2,500 | | Realty Income Corporation | | | | | | | | | 75,825 |
| | | | | |
| 1,000 | | Regency Centers Corporation | | | | | | | | | 34,400 |
| | | | | |
| 2,100 | | Simon Property Group, Inc. | | | | | | | | | 169,575 |
| | | | | |
| 25,720 | | Taubman Centers Inc. | | | | | | | | | 967,844 |
| | | | | |
| 2,700 | | Weingarten Realty Trust | | | | | | | | | 51,435 |
| | Total Retail REIT | | | | | | | | | 2,565,444 |
Portfolio of Investments
Nuveen Multi-Manager Large-Cap Value Fund (continued)
June 30, 2010
| | | | | | | | | | | |
| Shares | | Description (1) | | | | | | | | Value |
| | | | | | | | | | | |
| | Road & Rail – 1.5% | | | | | | | | | |
| | | | | |
| 500 | | Con-Way, Inc. | | | | | | | | $ | 15,010 |
| | | | | |
| 21,500 | | CSX Corporation | | | | | | | | | 1,067,045 |
| | | | | |
| 1,000 | | Hertz Global Holdings Inc., (2) | | | | | | | | | 9,460 |
| | | | | |
| 1,600 | | Kansas City Southern Industries, (2) | | | | | | | | | 58,160 |
| | | | | |
| 48,300 | | Norfolk Southern Corporation | | | | | | | | | 2,562,315 |
| | | | | |
| 900 | | Ryder System, Inc. | | | | | | | | | 36,207 |
| | | | | |
| 9,300 | | Union Pacific Corporation | | | | | | | | | 646,443 |
| | Total Road & Rail | | | | | | | | | 4,394,640 |
| | Semiconductors & Equipment – 3.0% | | | | | | | | | |
| | | | | |
| 12,300 | | Advanced Micro Devices, Inc., (2) | | | | | | | | | 90,036 |
| | | | | |
| 700 | | Atmel Corporation, (2) | | | | | | | | | 3,360 |
| | | | | |
| 3,000 | | Fairchild Semiconductor International Inc., Class A, (2) | | | | | | | | | 25,230 |
| | | | | |
| 157,380 | | Intel Corporation | | | | | | | | | 3,061,041 |
| | | | | |
| 1,400 | | International Rectifier Corporation, (2) | | | | | | | | | 26,054 |
| | | | | |
| 1,000 | | Intersil Holding Corporation, Class A | | | | | | | | | 12,110 |
| | | | | |
| 53,030 | | KLA-Tencor Corporation | | | | | | | | | 1,478,476 |
| | | | | |
| 8,000 | | LSI Logic Corporation, (2) | | | | | | | | | 36,800 |
| | | | | |
| 57,890 | | Marvell Technology Group Ltd., (2) | | | | | | | | | 912,346 |
| | | | | |
| 200 | | MEMC Electronic Materials, (2) | | | | | | | | | 1,976 |
| | | | | |
| 26,600 | | Micron Technology, Inc., (2) | | | | | | | | | 225,834 |
| | | | | |
| 200 | | National Semiconductor Corporation | | | | | | | | | 2,692 |
| | | | | |
| 200 | | Novellus Systems, Inc., (2) | | | | | | | | | 5,072 |
| | | | | |
| 1,600 | | PMC-Sierra, Inc., (2) | | | | | | | | | 12,032 |
| | | | | |
| 600 | | SunPower Corporation, (2) | | | | | | | | | 7,260 |
| | | | | |
| 129,850 | | Texas Instruments Incorporated | | | | | | | | | 3,022,908 |
| | Total Semiconductors & Equipment | | | | | | | | | 8,923,227 |
| | Software – 0.4% | | | | | | | | | |
| | | | | |
| 2,100 | | Activision Blizzard Inc. | | | | | | | | | 22,029 |
| | | | | |
| 1,000 | | CA Inc. | | | | | | | | | 18,400 |
| | | | | |
| 1,200 | | Compuware Corporation, (2) | | | | | | | | | 9,576 |
| | | | | |
| 38,700 | | Microsoft Corporation | | | | | | | | | 890,487 |
| | | | | |
| 5,900 | | Novell Inc., (2) | | | | | | | | | 33,512 |
| | | | | |
| 3,500 | | Symantec Corporation, (2) | | | | | | | | | 48,580 |
| | | | | |
| 1,600 | | Synopsys Inc., (2) | | | | | | | | | 33,392 |
| | Total Software | | | | | | | | | 1,055,976 |
| | Specialized REIT – 0.3% | | | | | | | | | |
| | | | | |
| 6,200 | | Health Care Property Investors Inc. | | | | | | | | | 199,950 |
| | | | | |
| 2,400 | | Health Care REIT, Inc. | | | | | | | | | 101,088 |
| | | | | |
| 3,600 | | Hospitality Properties Trust | | | | | | | | | 75,960 |
| | | | | |
| 14,400 | | Host Hotels & Resorts Inc. | | | | | | | | | 194,112 |
| | | | | |
| 2,300 | | Nationwide Health Properties, Inc. | | | | | | | | | 82,271 |
| | | | | |
| 1,000 | | Plum Creek Timber Company | | | | | | | | | 34,530 |
| | | | | |
| 300 | | Public Storage, Inc. | | | | | | | | | 26,373 |
| | | | | |
| 900 | | Rayonier Inc. | | | | | | | | | 39,618 |
| | | | | |
| 2,600 | | Senior Housing Properties Trust | | | | | | | | | 52,286 |
| | | | | | | | | | | |
| Shares | | Description (1) | | | | | | | | Value |
| | | | | | | | | | | |
| | Specialized REIT (continued) | | | | | | | | | |
| | | | | |
| 2,700 | | Ventas Inc. | | | | | | | | $ | 126,765 |
| | Total Specialized REIT | | | | | | | | | 932,953 |
| | Specialty Retail – 2.0% | | | | | | | | | |
| | | | | |
| 200 | | Aaron Rents Inc. | | | | | | | | | 3,414 |
| | | | | |
| 300 | | Abercrombie & Fitch Co., Class A | | | | | | | | | 9,207 |
| | | | | |
| 1,400 | | American Eagle Outfitters, Inc. | | | | | | | | | 16,450 |
| | | | | |
| 800 | | AutoNation Inc., (2) | | | | | | | | | 15,600 |
| | | | | |
| 4,100 | | Foot Locker, Inc. | | | | | | | | | 51,742 |
| | | | | |
| 1,600 | | GameStop Corporation, (2) | | | | | | | | | 30,064 |
| | | | | |
| 900 | | Gap, Inc. | | | | | | | | | 17,514 |
| | | | | |
| 33,540 | | Home Depot, Inc. | | | | | | | | | 941,468 |
| | | | | |
| 166,800 | | Lowe’s Companies, Inc. | | | | | | | | | 3,406,056 |
| | | | | |
| 4,500 | | Office Depot, Inc., (2) | | | | | | | | | 18,180 |
| | | | | |
| 2,600 | | RadioShack Corporation | | | | | | | | | 50,726 |
| | | | | |
| 2,700 | | Signet Jewelers Limited, (2) | | | | | | | | | 74,250 |
| | | | | |
| 47,380 | | Williams-Sonoma Inc. | | | | | | | | | 1,175,972 |
| | Total Specialty Retail | | | | | | | | | 5,810,643 |
| | Textiles, Apparel & Luxury Goods – 0.0% | | | | | | | | | |
| | | | | |
| 1,900 | | VF Corporation | | | | | | | | | 135,242 |
| | Thrifts & Mortgage Finance – 0.1% | | | | | | | | | |
| | | | | |
| 200 | | Capitol Federal Financial | | | | | | | | | 6,632 |
| | | | | |
| 2,600 | | First Niagara Financial Group Inc. | | | | | | | | | 32,578 |
| | | | | |
| 5,000 | | Hudson City Bancorp, Inc. | | | | | | | | | 61,200 |
| | | | | |
| 11,500 | | New York Community Bancorp, Inc. | | | | | | | | | 175,605 |
| | | | | |
| 2,500 | | People’s United Financial, Inc. | | | | | | | | | 33,750 |
| | | | | |
| 1,100 | | TFS Financial Corporation | | | | | | | | | 13,651 |
| | | | | |
| 2,000 | | Washington Federal Inc. | | | | | | | | | 32,360 |
| | Total Thrifts & Mortgage Finance | | | | | | | | | 355,776 |
| | Tobacco – 1.3% | | | | | | | | | |
| | | | | |
| 16,500 | | Altria Group, Inc. | | | | | | | | | 330,660 |
| | | | | |
| 28,570 | | Lorillard Inc. | | | | | | | | | 2,056,469 |
| | | | | |
| 24,970 | | Philip Morris International | | | | | | | | | 1,144,625 |
| | | | | |
| 3,700 | | Reynolds American Inc. | | | | | | | | | 192,844 |
| | Total Tobacco | | | | | | | | | 3,724,598 |
| | Trading Companies & Distributors – 0.0% | | | | | | | | | |
| | | | | |
| 700 | | GATX Corporation | | | | | | | | | 18,676 |
| | | | | |
| 800 | | WESCO International Inc., (2) | | | | | | | | | 26,936 |
| | Total Trading Companies & Distributors | | | | | | | | | 45,612 |
| | Water Utilities – 0.0% | | | | | | | | | |
| | | | | |
| 3,100 | | American Water Works Company | | | | | | | | | 63,860 |
| | | | | |
| 1,700 | | Aqua America Inc. | | | | | | | | | 30,056 |
| | Total Water Utilities | | | | | | | | | 93,916 |
| | Wireless Telecommunication Services – 1.1% | | | | | | | | | |
| | | | | |
| 1,000 | | Clearwire Corporation, (2) | | | | | | | | | 7,280 |
| | | | | |
| 600 | | Leap Wireless International, Inc., (2) | | | | | | | | | 7,788 |
Portfolio of Investments
Nuveen Multi-Manager Large-Cap Value Fund (continued)
June 30, 2010
| | | | | | | | | | | | |
| Shares | | Description (1) | | | | | | | | Value |
| | | | | | | | | | | | |
| | | Wireless Telecommunication Services (continued) | | | | | | | | | |
| | | | | |
| | 1,100 | | NII Holdings Inc., Class B, (2) | | | | | | | | $ | 35,772 |
| | | | | |
| | 58,900 | | Sprint Nextel Corporation, (2) | | | | | | | | | 249,736 |
| | | | | |
| | 1,400 | | Telephone and Data Systems Inc. | | | | | | | | | 42,546 |
| | | | | |
| | 300 | | United States Cellular Corporation, (2) | | | | | | | | | 12,345 |
| | | | | |
| | 135,650 | | Vodafone Group PLC, Sponsored ADR | | | | | | | | | 2,803,881 |
| | | Total Wireless Telecommunication Services | | | | | | | | | 3,159,348 |
| | | Total Common Stocks (cost $278,258,317) | | | | | | | | | 287,879,221 |
| | | | | |
| Shares | | Description (1) | | | | | | | | Value |
| | | INVESTMENT COMPANIES – 0.3% | | | | | | | | | |
| | | | | |
| | 18,000 | | I-Shares Russell 1000 Value Index Fund | | | | | | | | $ | 975,780 |
| | | Total Investment Companies (cost $845,910) | | | | | | | | | 975,780 |
| | | | | |
Principal
Amount (000) | | Description (1) | | | | Coupon | | Maturity | | Value |
| | | SHORT-TERM INVESTMENTS – 2.1% | | | | | | | | | |
| | | | | |
| $ | 6,352 | | Repurchase Agreement with Fixed Income Clearing Corporation, dated 6/30/10, repurchase price $6,352,349, collateralized by $6,325,000 U.S. Treasury Notes, 1.750%, due 1/31/14, value $6,483,125 | | | | 0.000% | | 7/01/10 | | $ | 6,352,349 |
| | | Total Short-Term Investments (cost $6,352,349) | | | | | | | | | 6,352,349 |
| | | Total Investments (cost $285,456,576) – 99.9% | | | | | | | | | 295,207,350 |
| | | Other Assets Less Liabilities – 0.1% | | | | | | | | | 147,925 |
| | | Net Assets – 100% | | | | | | | | $ | 295,355,275 |
| | | | For Fund portfolio compliance purposes, the Fund’s industry classifications refer to any one or more of the industry sub-classifications used by one or more widely recognized market indexes or ratings group indexes, and/or as defined by Fund management. This definition may not apply for purposes of this report, which may combine industry sub-classifications into sectors for reporting ease. |
| | (1) | | All percentages shown in the Portfolio of Investments are based on net assets. |
| | (2) | | Non-income producing; issuer has not declared a dividend within the past twelve months. |
| | ADR | | American Depositary Receipt. |
See accompanying notes to financial statements.
Portfolio of Investments
Nuveen NWQ Multi-Cap Value Fund
June 30, 2010
| | | | | | | | | | | |
| Shares | | Description (1) | | | | | | | | Value |
| | | | | | | | | | | |
| | COMMON STOCKS – 97.1% | | | | | | | | | |
| | | | | |
| | Aerospace & Defense – 2.5% | | | | | | | | | |
| | | | | |
| 125,000 | | Lockheed Martin Corporation | | | | | | | | $ | 9,312,500 |
| | Biotechnology – 4.3% | | | | | | | | | |
| | | | | |
| 301,500 | | Amgen Inc., (2) | | | | | | | | | 15,858,900 |
| | Capital Markets – 0.5% | | | | | | | | | |
| | | | | |
| 562,300 | | FBR Capital Markets Corporation, (2) | | | | | | | | | 1,872,459 |
| | Commercial Banks – 1.6% | | | | | | | | | |
| | | | | |
| 520,200 | | Privatebancorp, Inc. | | | | | | | | | 5,763,816 |
| | Commercial Services & Supplies – 1.9% | | | | | | | | | |
| | | | | |
| 325,100 | | Pitney Bowes Inc. | | | | | | | | | 7,139,196 |
| | Communications Equipment – 4.7% | | | | | | | | | |
| | | | | |
| 2,700,000 | | Motorola, Inc., (2) | | | | | | | | | 17,604,000 |
| | Containers & Packaging – 0.9% | | | | | | | | | |
| | | | | |
| 151,900 | | Packaging Corp. of America | | | | | | | | | 3,344,838 |
| | Diversified Financial Services – 4.0% | | | | | | | | | |
| | | | | |
| 2,245,000 | | Citigroup Inc., (2) | | | | | | | | | 8,441,200 |
| | | | | |
| 180,000 | | JPMorgan Chase & Co. | | | | | | | | | 6,589,800 |
| | Total Diversified Financial Services | | | | | | | | | 15,031,000 |
| | Health Care Providers & Services – 1.2% | | | | | | | | | |
| | | | | |
| 170,000 | | Aetna Inc. | | | | | | | | | 4,484,600 |
| | Independent Power Producers & Energy Traders – 1.7% | | | | | | | | | |
| | | | | |
| 300,000 | | NRG Energy Inc., (2) | | | | | | | | | 6,363,000 |
| | Insurance – 16.2% | | | | | | | | | |
| | | | | |
| 284,500 | | Aon Corporation | | | | | | | | | 10,560,640 |
| | | | | |
| 398,100 | | Genworth Financial Inc., Class A, (2) | | | | | | | | | 5,203,167 |
| | | | | |
| 375,000 | | Hartford Financial Services Group, Inc. | | | | | | | | | 8,298,750 |
| | | | | |
| 380,000 | | Loews Corporation | | | | | | | | | 12,657,800 |
| | | | | |
| 245,287 | | Reinsurance Group of America Inc. | | | | | | | | | 11,212,069 |
| | | | | |
| 324,500 | | Tower Group Inc. | | | | | | | | | 6,986,485 |
| | | | | |
| 249,100 | | Unum Group | | | | | | | | | 5,405,470 |
| | Total Insurance | | | | | | | | | 60,324,381 |
| | IT Services – 2.0% | | | | | | | | | |
| | | | | |
| 772,000 | | Convergys Corporation, (2) | | | | | | | | | 7,573,320 |
| | Machinery – 4.4% | | | | | | | | | |
| | | | | |
| 230,000 | | Ingersoll Rand Company Limited, Class A | | | | | | | | | 7,932,700 |
| | | | | |
| 178,500 | | Timken Company | | | | | | | | | 4,639,215 |
| | | | | |
| 216,700 | | Trinity Industries Inc. | | | | | | | | | 3,839,924 |
| | Total Machinery | | | | | | | | | 16,411,839 |
| | Media – 6.7% | | | | | | | | | |
| | | | | |
| 300,050 | | CBS Corporation, Class B | | | | | | | | | 3,879,647 |
| | | | | |
| 950,000 | | Interpublic Group Companies, Inc., (2) | | | | | | | | | 6,773,500 |
| | | | | |
| 455,097 | | Viacom Inc., Class B | | | | | | | | | 14,276,393 |
| | Total Media | | | | | | | | | 24,929,540 |
| | Metals & Mining – 9.6% | | | | | | | | | |
| | | | | |
| 307,199 | | AngloGold Ashanti Limited, Sponsored ADR | | | | | | | | | 13,264,853 |
Portfolio of Investments
Nuveen NWQ Multi-Cap Value Fund (continued)
June 30, 2010
| | | | | | | | | | | | |
| Shares | | Description (1) | | | | | | | | Value |
| | | | | | | | | | | | |
| | | Metals & Mining (continued) | | | | | | | | | |
| | | | | |
| | 848,000 | | Aurizon Mines Ltd., (2) | | | | | | | | $ | 4,189,120 |
| | | | | |
| | 400,000 | | Barrick Gold Corporation | | | | | | | | | 18,164,000 |
| | | Total Metals & Mining | | | | | | | | | 35,617,973 |
| | | Mortgage REIT – 2.2% | | | | | | | | | |
| | | | | |
| | 550,000 | | Redwood Trust Inc. | | | | | | | | | 8,052,000 |
| | | Oil, Gas & Consumable Fuels – 12.2% | | | | | | | | | |
| | | | | |
| | 155,000 | | Apache Corporation | | | | | | | | | 13,049,450 |
| | | | | |
| | 405,200 | | Denbury Resources Inc., (2) | | | | | | | | | 5,932,128 |
| | | | | |
| | 100,000 | | Hess Corporation | | | | | | | | | 5,034,000 |
| | | | | |
| | 152,600 | | Noble Energy, Inc. | | | | | | | | | 9,206,358 |
| | | | | |
| | 235,000 | | Petrohawk Energy Corporation, (2) | | | | | | | | | 3,987,950 |
| | | | | |
| | 350,000 | | Talisman Energy Inc. | | | | | | | | | 5,313,000 |
| | | | | |
| | 988,800 | | Warren Resources Inc., (2) | | | | | | | | | 2,867,520 |
| | | Total Oil, Gas & Consumable Fuels | | | | | | | | | 45,390,406 |
| | | Pharmaceuticals – 10.4% | | | | | | | | | |
| | | | | |
| | 600,000 | | Biovail Corporation | | | | | | | | | 11,544,000 |
| | | | | |
| | 179,000 | | Merck & Company Inc. | | | | | | | | | 6,259,630 |
| | | | | |
| | 749,400 | | Pfizer Inc. | | | | | | | | | 10,686,444 |
| | | | | |
| | 339,500 | | Sanofi-Aventis, ADR | | | | | | | | | 10,205,370 |
| | | Total Pharmaceuticals | | | | | | | | | 38,695,444 |
| | | Semiconductors & Equipment – 1.2% | | | | | | | | | |
| | | | | |
| | 1,135,144 | | Mattson Technology, Inc., (2) | | | | | | | | | 4,302,196 |
| | | Software – 6.7% | | | | | | | | | |
| | | | | |
| | 1,356,077 | | CA Inc. | | | | | | | | | 24,951,816 |
| | | Tobacco – 2.2% | | | | | | | | | |
| | | | | |
| | 174,500 | | Philip Morris International | | | | | | | | | 7,999,080 |
| | | Total Common Stocks (cost $378,898,044) | | | | | | | | | 361,022,304 |
| | | | | |
Principal
Amount (000) | | Description (1) | | | | Coupon | | Maturity | | Value |
| | | SHORT-TERM INVESTMENTS – 2.9% | | | | | | | | | |
| | | | | |
| $ | 10,661 | | Repurchase Agreement with Fixed Income Clearing Corporation, dated 6/30/10, repurchase price $10,660,817, collateralized by $10,610,000 U.S. Treasury Notes, 1.750%, due 1/31/14, value $10,875,250 | | | | 0.000% | | 7/01/10 | | $ | 10,660,817 |
| | | Total Short-Term Investments (cost $10,660,817) | | | | | | | | | 10,660,817 |
| | | Total Investments (cost $389,558,861) – 100.0% | | | | | | | | | 371,683,121 |
| | | Other Assets Less Liabilities – (0.0)% | | | | | | | | | (35,831) |
| | | Net Assets – 100% | | | | | | | | $ | 371,647,290 |
| | | | For Fund portfolio compliance purposes, the Fund’s industry classifications refer to any one or more of the industry sub-classifications used by one or more widely recognized market indexes or ratings group indexes, and/or as defined by Fund management. This definition may not apply for purposes of this report, which may combine industry sub-classifications into sectors for reporting ease. |
| | (1) | | All percentages shown in the Portfolio of Investments are based on net assets. |
| | (2) | | Non-income producing; issuer has not declared a dividend within the past twelve months. |
| | ADR | | American Depositary Receipt. |
See accompanying notes to financial statements.
Portfolio of Investments
Nuveen NWQ Large-Cap Value Fund
June 30, 2010
| | | | | | | | | | | |
| Shares | | Description (1) | | | | | | | | Value |
| | | | | | | | | | | |
| | COMMON STOCKS – 95.6% | | | | | | | | | |
| | | | | |
| | Aerospace & Defense – 3.8% | | | | | | | | | |
| | | | | |
| 101,000 | | Lockheed Martin Corporation | | | | | | | | $ | 7,524,500 |
| | | | | |
| 57,700 | | Raytheon Company | | | | | | | | | 2,792,103 |
| | Total Aerospace & Defense | | | | | | | | | 10,316,603 |
| | Biotechnology – 4.2% | | | | | | | | | |
| | | | | |
| 218,700 | | Amgen Inc., (2) | | | | | | | | | 11,503,620 |
| | Chemicals – 1.4% | | | | | | | | | |
| | | | | |
| 99,000 | | Mosaic Company | | | | | | | | | 3,859,020 |
| | Commercial Banks – 1.6% | | | | | | | | | |
| | | | | |
| 175,400 | | Wells Fargo & Company | | | | | | | | | 4,490,240 |
| | Commercial Services & Supplies – 1.2% | | | | | | | | | |
| | | | | |
| 150,000 | | Pitney Bowes Inc. | | | | | | | | | 3,294,000 |
| | Communications Equipment – 5.4% | | | | | | | | | |
| | | | | |
| 2,250,000 | | Motorola, Inc., (2) | | | | | | | | | 14,670,000 |
| | Diversified Financial Services – 4.0% | | | | | | | | | |
| | | | | |
| 1,550,000 | | Citigroup Inc., (2) | | | | | | | | | 5,828,000 |
| | | | | |
| 135,000 | | JPMorgan Chase & Co. | | | | | | | | | 4,942,350 |
| | Total Diversified Financial Services | | | | | | | | | 10,770,350 |
| | Diversified Telecommunication Services – 1.3% | | | | | | | | | |
| | | | | |
| 122,000 | | Verizon Communications Inc. | | | | | | | | | 3,418,440 |
| | Energy Equipment & Services – 1.0% | | | | | | | | | |
| | | | | |
| 109,000 | | Halliburton Company | | | | | | | | | 2,675,950 |
| | Food & Staples Retailing – 2.2% | | | | | | | | | |
| | | | | |
| 88,100 | | CVS Caremark Corporation | | | | | | | | | 2,583,092 |
| | | | | |
| 175,000 | | Kroger Co. | | | | | | | | | 3,445,750 |
| | Total Food & Staples Retailing | | | | | | | | | 6,028,842 |
| | Health Care Providers & Services – 1.6% | | | | | | | | | |
| | | | | |
| 170,050 | | Aetna Inc. | | | | | | | | | 4,485,919 |
| | Household Products – 2.1% | | | | | | | | | |
| | | | | |
| 93,000 | | Kimberly-Clark Corporation | | | | | | | | | 5,638,590 |
| | Independent Power Producers & Energy Traders – 1.3% | | | | | | | | | |
| | | | | |
| 164,000 | | NRG Energy Inc., (2) | | | | | | | | | 3,478,440 |
| | Insurance – 16.3% | | | | | | | | | |
| | | | | |
| 165,000 | | Aon Corporation | | | | | | | | | 6,124,800 |
| | | | | |
| 300,000 | | Genworth Financial Inc., Class A, (2) | | | | | | | | | 3,921,000 |
| | | | | |
| 286,000 | | Hartford Financial Services Group, Inc. | | | | | | | | | 6,329,180 |
| | | | | |
| 154,400 | | Lincoln National Corporation | | | | | | | | | 3,750,376 |
| | | | | |
| 226,441 | | Loews Corporation | | | | | | | | | 7,542,750 |
| | | | | |
| 200,000 | | MetLife, Inc. | | | | | | | | | 7,552,000 |
| | | | | |
| 110,000 | | Travelers Companies, Inc. | | | | | | | | | 5,417,500 |
| | | | | |
| 180,300 | | Unum Group | | | | | | | | | 3,912,510 |
| | Total Insurance | | | | | | | | | 44,550,116 |
| | Machinery – 1.7% | | | | | | | | | |
| | | | | |
| 134,000 | | Ingersoll Rand Company Limited, Class A | | | | | | | | | 4,621,660 |
Portfolio of Investments
Nuveen NWQ Large-Cap Value Fund (continued)
June 30, 2010
| | | | | | | | | | | | |
| Shares | | Description (1) | | | | | | | | Value |
| | | | | | | | | | | | |
| | | Media – 4.9% | | | | | | | | | |
| | | | | |
| | 200,000 | | CBS Corporation, Class B | | | | | | | | $ | 2,586,000 |
| | | | | |
| | 345,000 | | Viacom Inc., Class B | | | | | | | | | 10,822,650 |
| | | Total Media | | | | | | | | | 13,408,650 |
| | | Metals & Mining – 8.5% | | | | | | | | | |
| | | | | |
| | 230,001 | | AngloGold Ashanti Limited, Sponsored ADR | | | | | | | | | 9,931,443 |
| | | | | |
| | 290,000 | | Barrick Gold Corporation | | | | | | | | | 13,168,900 |
| | | Total Metals & Mining | | | | | | | | | 23,100,343 |
| | | Oil, Gas & Consumable Fuels – 13.7% | | | | | | | | | |
| | | | | |
| | 125,000 | | Apache Corporation | | | | | | | | | 10,523,750 |
| | | | | |
| | 186,800 | | Canadian Natural Resources Limited | | | | | | | | | 6,207,364 |
| | | | | |
| | 81,000 | | Hess Corporation | | | | | | | | | 4,077,540 |
| | | | | |
| | 120,000 | | Noble Energy, Inc. | | | | | | | | | 7,239,600 |
| | | | | |
| | 67,975 | | Occidental Petroleum Corporation | | | | | | | | | 5,244,271 |
| | | | | |
| | 275,000 | | Talisman Energy Inc. | | | | | | | | | 4,174,500 |
| | | Total Oil, Gas & Consumable Fuels | | | | | | | | | 37,467,025 |
| | | Pharmaceuticals – 8.8% | | | | | | | | | |
| | | | | |
| | 250,000 | | Merck & Company Inc. | | | | | | | | | 8,742,500 |
| | | | | |
| | 550,000 | | Pfizer Inc. | | | | | | | | | 7,843,000 |
| | | | | |
| | 245,000 | | Sanofi-Aventis, ADR | | | | | | | | | 7,364,700 |
| | | Total Pharmaceuticals | | | | | | | | | 23,950,200 |
| | | Road & Rail – 0.8% | | | | | | | | | |
| | | | | |
| | 32,000 | | Union Pacific Corporation | | | | | | | | | 2,224,320 |
| | | Software – 7.8% | | | | | | | | | |
| | | | | |
| | 967,100 | | CA Inc. | | | | | | | | | 17,794,640 |
| | | | | |
| | 150,000 | | Microsoft Corporation | | | | | | | | | 3,451,500 |
| | | Total Software | | | | | | | | | 21,246,140 |
| | | Tobacco – 2.0% | | | | | | | | | |
| | | | | |
| | 118,000 | | Philip Morris International | | | | | | | | | 5,409,120 |
| | | Total Common Stocks (cost $274,588,733) | | | | | | | | | 260,607,588 |
| | | | | |
Principal
Amount (000) | | Description (1) | | | | Coupon | | Maturity | | Value |
| | | SHORT-TERM INVESTMENTS – 4.5% | | | | | | | | | |
| | | | | |
| $ | 12,344 | | Repurchase Agreement with State Street Bank, dated 6/30/10, repurchase price $12,344,159, collateralized by $12,105,000 U.S. Treasury Notes, 2.500%, due 4/30/15, value $12,594,042 | | | | 0.000% | | 7/01/10 | | $ | 12,344,159 |
| | | Total Short-Term Investments (cost $12,344,159) | | | | | | | | | 12,344,159 |
| | | Total Investments (cost $286,932,892) – 100.1% | | | | | | | | | 272,951,747 |
| | | Other Assets Less Liabilities – (0.1)% | | | | | | | | | (404,200) |
| | | Net Assets – 100% | | | | | | | | $ | 272,547,547 |
| | | | For Fund portfolio compliance purposes, the Fund’s industry classifications refer to any one or more of the industry sub-classifications used by one or more widely recognized market indexes or ratings group indexes, and/or as defined by Fund management. This definition may not apply for purposes of this report, which may combine industry sub-classifications into sectors for reporting ease. |
| | (1) | | All percentages shown in the Portfolio of Investments are based on net assets. |
| | (2) | | Non-income producing; issuer has not declared a dividend within the past twelve months. |
| | ADR | | American Depositary Receipt. |
See accompanying notes to financial statements.
Portfolio of Investments
Nuveen NWQ Small/Mid-Cap Value Fund
June 30, 2010
| | | | | | | | | | | |
| Shares | | Description (1) | | | | | | | | Value |
| | | | | | | | | | | |
| | COMMON STOCKS – 97.0% | | | | | | | | | |
| | | | | |
| | Building Products – 3.5% | | | | | | | | | |
| | | | | |
| 35,900 | | Griffon Corporation, (2) | | | | | | | | $ | 397,054 |
| | Chemicals – 0.6% | | | | | | | | | |
| | | | | |
| 3,600 | | Intrepid Potash Inc., (2) | | | | | | | | | 70,452 |
| | Commercial Banks – 4.7% | | | | | | | | | |
| | | | | |
| 16,300 | | Texas Capital BancShares, Inc., (2) | | | | | | | | | 267,320 |
| | | | | |
| 36,400 | | Western Alliance Bancorporation, (2) | | | | | | | | | 260,988 |
| | Total Commercial Banks | | | | | | | | | 528,308 |
| | Communications Equipment – 3.1% | | | | | | | | | |
| | | | | |
| 67,550 | | Brocade Communications Systems Inc., (2) | | | | | | | | | 348,558 |
| | Containers & Packaging – 2.6% | | | | | | | | | |
| | | | | |
| 5,050 | | Packaging Corp. of America | | | | | | | | | 111,201 |
| | | | | |
| 9,000 | | Temple-Inland Inc. | | | | | | | | | 186,030 |
| | Total Containers & Packaging | | | | | | | | | 297,231 |
| | Electrical Equipment – 5.4% | | | | | | | | | |
| | | | | |
| 12,850 | | Belden Inc. | | | | | | | | | 282,700 |
| | | | | |
| 22,250 | | GrafTech International Ltd., (2) | | | | | | | | | 325,295 |
| | Total Electrical Equipment | | | | | | | | | 607,995 |
| | Electronic Equipment & Instruments – 7.8% | | | | | | | | | |
| | | | | |
| 8,500 | | Arrow Electronics, Inc., (2) | | | | | | | | | 189,975 |
| | | | | |
| 8,400 | | Avnet Inc., (2) | | | | | | | | | 202,524 |
| | | | | |
| 14,100 | | Coherent Inc., (2) | | | | | | | | | 483,628 |
| | Total Electronic Equipment & Instruments | | | | | | | | | 876,127 |
| | Energy Equipment & Services – 1.9% | | | | | | | | | |
| | | | | |
| 14,500 | | Acergy S.A., ADR | | | | | | | | | 214,455 |
| | Food & Staples Retailing – 2.7% | | | | | | | | | |
| | | | | |
| 8,700 | | Casey’s General Stores, Inc. | | | | | | | | | 303,630 |
| | Food Products – 4.9% | | | | | | | | | |
| | | | | |
| 9,000 | | Hormel Foods Corporation | | | | | | | | | 364,320 |
| | | | | |
| 4,050 | | Treehouse Foods Inc., (2) | | | | | | | | | 184,923 |
| | Total Food Products | | | | | | | | | 549,243 |
| | Health Care Providers & Services – 2.9% | | | | | | | | | |
| | | | | |
| 13,800 | | Omnicare, Inc. | | | | | | | | | 327,060 |
| | Insurance – 13.8% | | | | | | | | | |
| | | | | |
| 5,450 | | Allied World Assurance Holdings | | | | | | | | | 247,321 |
| | | | | |
| 7,600 | | Assurant Inc. | | | | | | | | | 263,720 |
| | | | | |
| 7,000 | | Hanover Insurance Group Inc. | | | | | | | | | 304,500 |
| | | | | |
| 4,700 | | HCC Insurance Holdings Inc. | | | | | | | | | 116,372 |
| | | | | |
| 6,050 | | Reinsurance Group of America Inc. | | | | | | | | | 276,546 |
| | | | | |
| 5,600 | | StanCorp Financial Group Inc. | | | | | | | | | 227,024 |
| | | | | |
| 3,650 | | Willis Group Holdings PLC | | | | | | | | | 109,683 |
| | Total Insurance | | | | | | | | | 1,545,166 |
| | Machinery – 10.7% | | | | | | | | | |
| | | | | |
| 12,100 | | CIRCOR International Inc. | | | | | | | | | 309,518 |
| | | | | |
| 7,000 | | Gardner Denver, Inc. | | | | | | | | | 312,130 |
| | | | | |
| 5,900 | | Harsco Corporation | | | | | | | | | 138,650 |
Portfolio of Investments
Nuveen Small/Mid-Cap Value Fund (continued)
June 30, 2010
| | | | | | | | | | | | |
| Shares | | Description (1) | | | | | | | | Value |
| | | | | | | | | | | | |
| | | Machinery (continued) | | | | | | | | | |
| | | | | |
| | 3,400 | | Lincoln Electric Holdings Inc. | | | | | | | | $ | 173,366 |
| | | | | |
| | 3,050 | | Middleby Corporation, (2) | | | | | | | | | 162,230 |
| | | | | |
| | 3,850 | | Timken Company | | | | | | | | | 100,062 |
| | | Total Machinery | | | | | | | | | 1,195,956 |
| | | Metals & Mining – 8.5% | | | | | | | | | |
| | | | | |
| | 27,400 | | Aurizon Mines Ltd., (2) | | | | | | | | | 135,356 |
| | | | | |
| | 17,000 | | Globe Specialty Metals Inc., (2) | | | | | | | | | 175,610 |
| | | | | |
| | 67,900 | | Northgate Minerals Corporation, (2) | | | | | | | | | 203,700 |
| | | | | |
| | 5,900 | | Reliance Steel & Aluminum Company | | | | | | | | | 213,285 |
| | | | | |
| | 4,750 | | Royal Gold, Inc. | | | | | | | | | 228,000 |
| | | Total Metals & Mining | | | | | | | | | 955,951 |
| | | Oil, Gas & Consumable Fuels – 6.1% | | | | | | | | | |
| | | | | |
| | 18,600 | | Denbury Resources Inc., (2) | | | | | | | | | 272,304 |
| | | | | |
| | 18,600 | | Petroquest Energy Inc., (2) | | | | | | | | | 125,736 |
| | | | | |
| | 7,000 | | SM Energy Company | | | | | | | | | 281,120 |
| | | Total Oil, Gas & Consumable Fuels | | | | | | | | | 679,160 |
| | | Paper & Forest Products – 1.7% | | | | | | | | | |
| | | | | |
| | 29,000 | | Wausau Paper Corp., (2) | | | | | | | | | 196,330 |
| | | Personal Products – 3.5% | | | | | | | | | |
| | | | | |
| | 26,700 | | Elizabeth Arden, Inc., (2) | | | | | | | | | 387,684 |
| | | Pharmaceuticals – 4.2% | | | | | | | | | |
| | | | | |
| | 24,800 | | Biovail Corporation | | | | | | | | | 477,152 |
| | | Real Estate Management & Development – 1.6% | | | | | | | | | |
| | | | | |
| | 10,100 | | Forestar Real Estate Group Inc., (2) | | | | | | | | | 181,396 |
| | | Semiconductors & Equipment – 3.0% | | | | | | | | | |
| | | | | |
| | 34,400 | | Teradyne Inc., (2) | | | | | | | | | 335,400 |
| | | Thrifts & Mortgage Finance – 2.9% | | | | | | | | | |
| | | | | |
| | 9,900 | | Northwest Bancshares Inc. | | | | | | | | | 113,553 |
| | | | | |
| | 15,650 | | People’s United Financial, Inc. | | | | | | | | | 211,275 |
| | | Total Thrifts & Mortgage Finance | | | | | | | | | 324,828 |
| | | Trading Companies & Distributors – 0.9% | | | | | | | | | |
| | | | | |
| | 3,150 | | WESCO International Inc., (2) | | | | | | | | | 106,061 |
| | | Total Common Stocks (cost $9,795,282) | | | | | | | | | 10,905,197 |
| | | | | |
Principal
Amount (000) | | Description (1) | | | | Coupon | | Maturity | | Value |
| | | SHORT-TERM INVESTMENTS – 1.0% | | | | | | | | | |
| | | | | |
| $ | 109 | | Repurchase Agreement with State Street Bank, dated 6/30/10,
repurchase price $109,157, collateralized by $110,000 U.S. Treasury Notes,
2.500%, due 4/30/15, value $114,444 | | | | 0.000% | | 7/01/10 | | $ | 109,157 |
| | | Total Short-Term Investments (cost $109,157) | | | | | | | | | 109,157 |
| | | Total Investments (cost $9,904,439) – 98.0% | | | | | | | | | 11,014,354 |
| | | Other Assets Less Liabilities – 2.0% | | | | | | | | | 220,453 |
| | | Net Assets – 100% | | | | | | | | $ | 11,234,807 |
| | | | For Fund portfolio compliance purposes, the Fund’s industry classifications refer to any one or more of the industry sub-classifications used by one or more widely recognized market indexes or ratings group indexes, and/or as defined by Fund management. This definition may not apply for purposes of this report, which may combine industry sub-classifications into sectors for reporting ease. |
| | (1) | | All percentages shown in the Portfolio of Investments are based on net assets. |
| | (2) | | Non-income producing; issuer has not declared a dividend within the past twelve months. |
| | ADR | | American Depositary Receipt. |
See accompanying notes to financial statements.
Portfolio of Investments
Nuveen NWQ Small-Cap Value Fund
June 30, 2010
| | | | | | | | | | | |
| Shares | | Description (1) | | | | | | | | Value |
| | | | | | | | | | | |
| | COMMON STOCKS – 96.1% | | | | | | | | | |
| | | | | |
| | Building Products – 4.1% | | | | | | | | | |
| | | | | |
| 28,080 | | Gibraltar Industries Inc., (2) | | | | | | | | $ | 283,608 |
| | | | | |
| 291,650 | | Griffon Corporation, (2) | | | | | | | | | 3,225,649 |
| | Total Building Products | | | | | | | | | 3,509,257 |
| | Commercial Banks – 7.7% | | | | | | | | | |
| | | | | |
| 85,350 | | PacWest Bancorp. | | | | | | | | | 1,562,759 |
| | | | | |
| 106,500 | | Privatebancorp, Inc. | | | | | | | | | 1,180,020 |
| | | | | |
| 128,950 | | Texas Capital BancShares, Inc., (2) | | | | | | | | | 2,114,780 |
| | | | | |
| 237,450 | | Western Alliance Bancorporation, (2) | | | | | | | | | 1,702,517 |
| | Total Commercial Banks | | | | | | | | | 6,560,076 |
| | Communications Equipment – 3.1% | | | | | | | | | |
| | | | | |
| 517,550 | | Brocade Communications Systems Inc., (2) | | | | | | | | | 2,670,558 |
| | Containers & Packaging – 2.1% | | | | | | | | | |
| | | | | |
| 36,600 | | Packaging Corp. of America | | | | | | | | | 805,932 |
| | | | | |
| 48,050 | | Temple-Inland Inc. | | | | | | | | | 993,194 |
| | Total Containers & Packaging | | | | | | | | | 1,799,126 |
| | Electrical Equipment – 2.3% | | | | | | | | | |
| | | | | |
| 89,300 | | Belden Inc. | | | | | | | | | 1,964,600 |
| | Electronic Equipment & Instruments – 5.8% | | | | | | | | | |
| | | | | |
| 104,500 | | Coherent Inc., (2) | | | | | | | | | 3,584,350 |
| | | | | |
| 156,600 | | Keithley Instruments, Inc. | | | | | | | | | 1,382,778 |
| | Total Electronic Equipment & Instruments | | | | | | | | | 4,967,128 |
| | Energy Equipment & Services – 1.1% | | | | | | | | | |
| | | | | |
| 64,750 | | Acergy S.A., ADR | | | | | | | | | 957,653 |
| | Food & Staples Retailing – 2.7% | | | | | | | | | |
| | | | | |
| 65,250 | | Casey’s General Stores, Inc. | | | | | | | | | 2,277,225 |
| | Food Products – 2.6% | | | | | | | | | |
| | | | | |
| 234,200 | | Smart Balance Inc., (2) | | | | | | | | | 957,878 |
| | | | | |
| 27,850 | | Treehouse Foods Inc., (2) | | | | | | | | | 1,271,631 |
| | Total Food Products | | | | | | | | | 2,229,509 |
| | Health Care Providers & Services – 1.8% | | | | | | | | | |
| | | | | |
| 231,450 | | Skilled Healthcare Group Inc., (2) | | | | | | | | | 1,571,546 |
| | Hotels, Restaurants & Leisure – 5.5% | | | | | | | | | |
| | | | | |
| 147,000 | | Bob Evans Farms | | | | | | | | | 3,619,140 |
| | | | | |
| 72,050 | | California Pizza Kitchen, Inc., (2) | | | | | | | | | 1,091,558 |
| | Total Hotels, Restaurants & Leisure | | | | | | | | | 4,710,698 |
| | Household Durables – 0.8% | | | | | | | | | |
| | | | | |
| 61,000 | | Hooker Furniture Corporation | | | | | | | | | 650,260 |
| | Insurance – 10.2% | | | | | | | | | |
| | | | | |
| 91,800 | | Aspen Insurance Holdings Limited | | | | | | | | | 2,271,132 |
| | | | | |
| 161,150 | | First Mercury Financial Corporation | | | | | | | | | 1,704,967 |
| | | | | |
| 30,900 | | Hanover Insurance Group Inc. | | | | | | | | | 1,344,150 |
| | | | | |
| 189,300 | | PMA Capital Corporation, Class A, (2) | | | | | | | | | 1,239,915 |
| | | | | |
| 52,500 | | StanCorp Financial Group Inc. | | | | | | | | | 2,128,350 |
| | Total Insurance | | | | | | | | | 8,688,514 |
Portfolio of Investments
Nuveen NWQ Small-Cap Value Fund (continued)
June 30, 2010
| | | | | | | | | | | |
| Shares | | Description (1) | | | | | | | | Value |
| | | | | | | | | | | |
| | IT Services – 2.0% | | | | | | | | | |
| | | | | |
| 177,750 | | Convergys Corporation, (2) | | | | | | | | $ | 1,743,728 |
| | Machinery – 10.2% | | | | | | | | | |
| | | | | |
| 193,500 | | Albany International Corporation, Class A | | | | | | | | | 3,132,765 |
| | | | | |
| 89,400 | | CIRCOR International Inc. | | | | | | | | | 2,286,852 |
| | | | | |
| 24,073 | | Lincoln Electric Holdings Inc. | | | | | | | | | 1,227,482 |
| | | | | |
| 24,100 | | Middleby Corporation, (2) | | | | | | | | | 1,281,879 |
| | | | | |
| 24,150 | | WABCO Holdings Inc., (2) | | | | | | | | | 760,242 |
| | Total Machinery | | | | | | | | | 8,689,220 |
| | Metals & Mining – 8.7% | | | | | | | | | |
| | | | | |
| 213,700 | | Aurizon Mines Ltd., (2) | | | | | | | | | 1,055,678 |
| | | | | |
| 132,600 | | Globe Specialty Metals Inc., (2) | | | | | | | | | 1,369,758 |
| | | | | |
| 538,250 | | Northgate Minerals Corporation, (2) | | | | | | | | | 1,614,750 |
| | | | | |
| 28,650 | | Royal Gold, Inc. | | | | | | | | | 1,375,200 |
| | | | | |
| 232,600 | | Thompson Creek Metals Company Inc., (2) | | | | | | | | | 2,018,968 |
| | Total Metals & Mining | | | | | | | | | 7,434,354 |
| | Oil, Gas & Consumable Fuels – 4.0% | | | | | | | | | |
| | | | | |
| 48,100 | | Carrizo Oil & Gas, Inc., (2) | | | | | | | | | 746,993 |
| | | | | |
| 159,400 | | Petroquest Energy Inc., (2) | | | | | | | | | 1,077,544 |
| | | | | |
| 39,200 | | SM Energy Company | | | | | | | | | 1,574,272 |
| | Total Oil, Gas & Consumable Fuels | | | | | | | | | 3,398,809 |
| | Paper & Forest Products – 2.3% | | | | | | | | | |
| | | | | |
| 83,703 | | Buckeye Technologies Inc., (2) | | | | | | | | | 832,845 |
| | | | | |
| 170,954 | | Wausau Paper Corp., (2) | | | | | | | | | 1,157,359 |
| | Total Paper & Forest Products | | | | | | | | | 1,990,204 |
| | Personal Products – 3.5% | | | | | | | | | |
| | | | | |
| 205,950 | | Elizabeth Arden, Inc., (2) | | | | | | | | | 2,990,394 |
| | Real Estate Management & Development – 1.7% | | | | | | | | | |
| | | | | |
| 79,100 | | Forestar Real Estate Group Inc., (2) | | | | | | | | | 1,420,636 |
| | Road & Rail – 2.6% | | | | | | | | | |
| | | | | |
| 107,805 | | Marten Transport, Ltd., (2) | | | | | | | | | 2,240,188 |
| | Semiconductors & Equipment – 8.9% | | | | | | | | | |
| | | | | |
| 314,550 | | Actel Corporation, (2) | | | | | | | | | 4,032,527 |
| | | | | |
| 154,300 | | Standard Microsystems Corporation, (2) | | | | | | | | | 3,592,104 |
| | Total Semiconductors & Equipment | | | | | | | | | 7,624,631 |
| | Specialty Retail – 1.3% | | | | | | | | | |
| | | | | |
| 325,591 | | Golfsmith International Holdings Inc., (2) | | | | | | | | | 1,090,730 |
| | Thrifts & Mortgage Finance – 1.1% | | | | | | | | | |
| | | | | |
| 80,100 | | Northwest Bancshares Inc. | | | | | | | | | 918,747 |
| | Total Common Stocks (cost $83,468,213) | | | | | | | | | 82,097,791 |
| | | | | | | | | | | | |
Principal
Amount (000) | | Description (1) | | | | Coupon | | Maturity | | Value |
| | | | | | | | | | | | |
| | | SHORT-TERM INVESTMENTS – 2.3% | | | | | | | | | |
| | | | | |
| $ | 1,952 | | Repurchase Agreement with Fixed Income Clearing Corporation, dated 6/30/10, repurchase price $1,952,069, collateralized by $1,850,000 U.S. Treasury Bonds, 4.375%, due 11/15/39, value $1,994,929 | | | | 0.000% | | 7/01/10 | | $ | 1,952,069 |
| | | Total Short-Term Investments (cost $1,952,069) | | | | | | | | | 1,952,069 |
| | | Total Investments (cost $85,420,282) – 98.4% | | | | | | | | | 84,049,860 |
| | | Other Assets Less Liabilities – 1.6% | | | | | | | | | 1,327,998 |
| | | Net Assets – 100% | | | | | | | | $ | 85,377,858 |
| | | | For Fund portfolio compliance purposes, the Fund’s industry classifications refer to any one or more of the industry sub-classifications used by one or more widely recognized market indexes or ratings group indexes, and/or as defined by Fund management. This definition may not apply for purposes of this report, which may combine industry sub-classifications into sectors for reporting ease. |
| | (1) | | All percentages shown in the Portfolio of Investments are based on net assets. |
| | (2) | | Non-income producing; issuer has not declared a dividend within the past twelve months. |
| | ADR | | American Depositary Receipt. |
See accompanying notes to financial statements.
Portfolio of Investments
Nuveen Tradewinds Value Opportunities Fund
June 30, 2010
| | | | | | | | | | | |
| Shares | | Description (1) | | | | | | | | Value |
| | | | | | | | | | | |
| | COMMON STOCKS – 74.3% | | | | | | | | | |
| | | | | |
| | Aerospace & Defense – 1.5% | | | | | | | | | |
| | | | | |
| 373,000 | | Lockheed Martin Corporation | | | | | | | | $ | 27,788,500 |
| | Airlines – 0.5% | | | | | | | | | |
| | | | | |
| 720,000 | | Skywest Inc. | | | | | | | | | 8,798,400 |
| | Commercial Banks – 1.5% | | | | | | | | | |
| | | | | |
| 2,650,000 | | Bank of East Asia, ADR, (2) | | | | | | | | | 9,725,500 |
| | | | | |
| 3,750,000 | | Sumitomo Trust & Banking Company, ADR, (2) | | | | | | | | | 19,200,000 |
| | Total Commercial Banks | | | | | | | | | 28,925,500 |
| | Construction & Engineering – 0.9% | | | | | | | | | |
| | | | | |
| 510,502 | | Shaw Group Inc., (3) | | | | | | | | | 17,469,378 |
| | Diversified Telecommunication Services – 4.9% | | | | | | | | | |
| | | | | |
| 274,260 | | China Unicom Limited, ADR | | | | | | | | | 3,647,658 |
| | | | | |
| 495,000 | | KT Corporation, Sponsored ADR | | | | | | | | | 9,489,150 |
| | | | | |
| 2,345,000 | | Nippon Telegraph and Telephone Corporation, ADR | | | | | | | | | 47,697,300 |
| | | | | |
| 910,000 | | Telus Corporation | | | | | | | | | 32,942,000 |
| | Total Diversified Telecommunication Services | | | | | | | | | 93,776,108 |
| | Electric Utilities – 3.0% | | | | | | | | | |
| | | | | |
| 1,854,000 | | Centrais Electricas Brasileiras S.A., PFD B ADR | | | | | | | | | 29,348,820 |
| | | | | |
| 2,090,000 | | Korea Electric Power Corporation, Sponsored ADR | | | | | | | | | 26,919,200 |
| | Total Electric Utilities | | | | | | | | | 56,268,020 |
| | Electronic Equipment & Instruments – 2.1% | | | | | | | | | |
| | | | | |
| 1,480,000 | | Ingram Micro, Inc., Class A, (3) | | | | | | | | | 22,481,200 |
| | | | | |
| 490,000 | | Tech Data Corporation, (3) | | | | | | | | | 17,453,800 |
| | Total Electronic Equipment & Instruments | | | | | | | | | 39,935,000 |
| | Food & Staples Retailing – 4.7% | | | | | | | | | |
| | | | | |
| 1,970,000 | | Kroger Co. | | | | | | | | | 38,789,300 |
| | | | | |
| 1,045,000 | | Wal-Mart Stores, Inc. | | | | | | | | | 50,233,150 |
| | Total Food & Staples Retailing | | | | | | | | | 89,022,450 |
| | Food Products – 2.4% | | | | | | | | | |
| | | | | |
| 548,832 | | Cresud S.A., ADR | | | | | | | | | 6,662,820 |
| | | | | |
| 895,000 | | Smithfield Foods, Inc., (3) | | | | | | | | | 13,335,500 |
| | | | | |
| 1,625,000 | | Tyson Foods, Inc., Class A | | | | | | | | | 26,633,750 |
| | Total Food Products | | | | | | | | | 46,632,070 |
| | Health Care Equipment & Supplies – 0.8% | | | | | | | | | |
| | | | | |
| 267,237 | | Zimmer Holdings, Inc., (3) | | | | | | | | | 14,444,160 |
| | Health Care Providers & Services – 2.8% | | | | | | | | | |
| | | | | |
| 1,316,000 | | Aetna Inc. | | | | | | | | | 34,716,080 |
| | | | | |
| 770,000 | | Omnicare, Inc. | | | | | | | | | 18,249,000 |
| | Total Health Care Providers & Services | | | | | | | | | 52,965,080 |
| | Household Durables – 1.0% | | | | | | | | | |
| | | | | |
| 2,200,000 | | Sekisui House, Ltd., Sponsored ADR, (2) | | | | | | | | | 18,612,000 |
| | Insurance – 2.8% | | | | | | | | | |
| | | | | |
| 550,000 | | CNA Financial Corporation, (3) | | | | | | | | | 14,058,000 |
| | | | | |
| 1,700,000 | | Marsh & McLennan Companies, Inc. | | | | | | | | | 38,335,000 |
| | Total Insurance | | | | | �� | | | | 52,393,000 |
| | | | | | | | | | | |
| Shares | | Description (1) | | | | | | | | Value |
| | | | | | | | | | | |
| | Internet Software & Services – 1.5% | | | | | | | | | |
| | | | | |
| 1,483,000 | | eBay Inc., (3) | | | | | | | | $ | 29,081,630 |
| | Machinery – 1.1% | | | | | | | | | |
| | | | | |
| 805,000 | | AGCO Corporation, (3) | | | | | | | | | 21,710,850 |
| | Metals & Mining – 18.6% | | | | | | | | | |
| | | | | |
| 1,500,000 | | Barrick Gold Corporation | | | | | | | | | 68,115,000 |
| | | | | |
| 55,795 | | Crystallex International Corporation, (3) | | | | | | | | | 22,318 |
| | | | | |
| 3,034,003 | | Geovic Mining Corporation, (3) | | | | | | | | | 1,729,382 |
| | | | | |
| 1,990,531 | | Gold Fields Limited, Sponsored ADR | | | | | | | | | 26,613,399 |
| | | | | |
| 627,901 | | Ivanhoe Mines Ltd., (3) | | | | | | | | | 8,187,829 |
| | | | | |
| 3,725,000 | | Kinross Gold Corporation | | | | | | | | | 63,660,250 |
| | | | | |
| 1,364,000 | | Lihir Gold Limited, Sponsored ADR | | | | | | | | | 49,090,360 |
| | | | | |
| 587,000 | | Newcrest Mining Limited, Sponsored ADR, (2) | | | | | | | | | 17,316,500 |
| | | | | |
| 1,323,000 | | Newmont Mining Corporation | | | | | | | | | 81,682,020 |
| | | | | |
| 3,115,584 | | NovaGold Resources Inc., (3) | | | | | | | | | 21,746,776 |
| | | | | |
| 915,000 | | Silver Standard Resources, Inc., (3) | | | | | | | | | 16,332,750 |
| | Total Metals & Mining | | | | | | | | | 354,496,584 |
| | Multi-Utilities – 2.9% | | | | | | | | | |
| | | | | |
| 2,310,000 | | Ameren Corporation | | | | | | | | | 54,908,700 |
| | Oil, Gas & Consumable Fuels – 12.8% | | | | | | | | | |
| | | | | |
| 1,584,000 | | Arch Coal Inc. | | | | | | | | | 31,379,040 |
| | | | | |
| 927,000 | | BP PLC, ADR | | | | | | | | | 26,771,760 |
| | | | | |
| 2,950,000 | | Cameco Corporation | | | | | | | | | 62,776,000 |
| | | | | |
| 230,150 | | Chevron Corporation | | | | | | | | | 15,617,979 |
| | | | | |
| 510,000 | | ConocoPhillips | | | | | | | | | 25,035,900 |
| | | | | |
| 426,511 | | Peabody Energy Corporation | | | | | | | | | 16,689,375 |
| | | | | |
| 408,000 | | Petrobras Energia S.A., ADR | | | | | | | | | 5,879,280 |
| | | | | |
| 564,000 | | Suncor Energy, Inc. | | | | | | | | | 16,604,160 |
| | | | | |
| 3,750,000 | | Tesoro Petroleum Corporation | | | | | | | | | 43,762,500 |
| | Total Oil, Gas & Consumable Fuels | | | | | | | | | 244,515,994 |
| | Paper & Forest Products – 0.3% | | | | | | | | | |
| | | | | |
| 135,000 | | Domtar Corporation | | | | | | | | | 6,635,250 |
| | Pharmaceuticals – 4.4% | | | | | | | | | |
| | | | | |
| 700,000 | | Forest Laboratories, Inc., (3) | | | | | | | | | 19,201,000 |
| | | | | |
| 3,200,000 | | Pfizer Inc. | | | | | | | | | 45,632,000 |
| | | | | |
| 920,000 | | Takeda Pharmaceuticals Company Limited, ADR, (2) | | | | | | | | | 19,577,600 |
| | Total Pharmaceuticals | | | | | | | | | 84,410,600 |
| | Road & Rail – 0.9% | | | | | | | | | |
| | | | | |
| 238,900 | | Union Pacific Corporation | | | | | | | | | 16,605,939 |
| | Software – 1.5% | | | | | | | | | |
| | | | | |
| 1,275,000 | | Microsoft Corporation | | | | | | | | | 29,337,750 |
| | Wireless Telecommunication Services – 1.4% | | | | | | | | | |
| | | | | |
| 261,200 | | TIM Participacoes S.A., ADR | | | | | | | | | 7,088,968 |
| | | | | |
| 1,456,000 | | Turkcell Iletisim Hizmetleri A.S., ADR | | | | | | | | | 18,898,882 |
| | Total Wireless Telecommunication Services | | | | | | | | | 25,987,850 |
| | Total Common Stocks (cost $1,325,481,472) | | | | | | | | | 1,414,720,813 |
Portfolio of Investments
Nuveen Tradewinds Value Opportunities Fund (continued)
June 30, 2010
| | | | | | | | | | | | |
| Shares | | Description (1) | | Coupon | | | | Ratings (4) | | Value |
| | | CONVERTIBLE PREFERRED SECURITIES – 2.9% | | | | | | | | | |
| | | | | |
| | | Communications Equipment – 2.1% | | | | | | | | | |
| | | | | |
| | 54,500 | | Lucent Technologies Capital Trust I | | 7.750% | | | | B3 | | $ | 39,485,250 |
| | | Road & Rail – 0.8% | | | | | | | | | |
| | | | | |
| | 12,362 | | Kansas City Southern Industries Inc. | | 5.125% | | | | B– | | | 15,625,568 |
| | | Total Convertible Preferred Securities (cost $43,259,236) | | | | | | | | | 55,110,818 |
| | | | | |
Principal
Amount (000) | | Description (1) | | Coupon | | Maturity | | Ratings (4) | | Value |
| | | CONVERTIBLE BONDS – 7.6% | | | | | | | | | |
| | | | | |
| | | Biotechnology – 2.6% | | | | | | | | | |
| | | | | |
| $ | 50,000 | | Amgen Inc. | | 0.125% | | 2/01/11 | | A+ | | $ | 49,687,500 |
| | | Building Products – 0.5% | | | | | | | | | |
| | | | | |
| | 9,764 | | Griffon Corporation | | 4.000% | | 7/18/23 | | N/A | | | 9,812,820 |
| | | Energy Equipment & Services – 1.4% | | | | | | | | | |
| | | | | |
| | 27,730 | | Transocean Inc. | | 1.625% | | 12/15/37 | | BBB+ | | | 27,002,088 |
| | | Health Care Providers & Services – 1.0% | | | | | | | | | |
| | | | | |
| | 22,949 | | Omnicare, Inc. | | 3.250% | | 12/15/35 | | B+ | | | 19,105,043 |
| | | Metals & Mining – 0.1% | | | | | | | | | |
| | | | | |
| | 3,018 | | Gold Reserve, Inc. | | 5.500% | | 6/15/22 | | N/A | | | 2,176,733 |
| | | Oil, Gas & Consumable Fuels – 1.5% | | | | | | | | | |
| | | | | |
| | 15,120 | | Goodrich Petroleum Corporation | | 3.250% | | 12/01/26 | | N/A | | | 14,382,900 |
| | | | | |
| | 19,159 | | USEC Inc. | | 3.000% | | 10/01/14 | | Caa2 | | | 13,890,275 |
| | | | | |
| | 34,279 | | Total Oil, Gas & Consumable Fuels | | | | | | | | | 28,273,175 |
| | | Wireless Telecommunication Services – 0.5% | | | | | | | | | |
| | | | | |
| | 9,628 | | NII Holdings Inc. | | 3.125% | | 6/15/12 | | B– | | | 9,134,563 |
| $ | 157,368 | | Total Convertible Bonds (cost $141,490,155) | | | | | | | | | 145,191,922 |
| | | | | |
Principal
Amount (000) | | Description (1) | | Coupon | | Maturity | | | | Value |
| | | SHORT-TERM INVESTMENTS – 16.1% | | | | | | | | | |
| | | | | |
| $ | 307,394 | | Repurchase Agreement with Fixed Income Clearing Corporation, dated 6/30/10, repurchase price $307,394,203, collateralized by: $175,000,000 U.S. Treasury Notes, 5.125%, due 6/30/11, value $183,225,000 and $20,445,000 U.S. Treasury Notes, 1.750%, due 11/15/11, value $20,849,811 and $74,465,000 U.S. Treasury Notes, 0.875%, due 5/31/11, value $74,837,325 and $75,000 U.S. Treasury Notes, 1.125%, due 6/30/11, value $75,563 and $15,745,000 U.S. Treasury Notes, 1.000%, due 7/31/11, value $15,902,450 and $14,000,000 U.S. Treasury Notes, 1.000%, due 8/31/11, value $14,140,000 and $4,480,000 U.S. Treasury Notes, 1.000%, due 12/31/11, value $4,513,600 | | 0.000% | | 7/01/10 | | | | $ | 307,394,203 |
| | | Total Short-Term Investments (cost $307,394,203) | | | | | | | | | 307,394,203 |
| | | Total Investments (cost $1,817,625,066) – 100.9% | | | | | | | | | 1,922,417,756 |
| | | Other Assets Less Liabilities – (0.9)% | | | | | | | | | (17,864,691) |
| | | Net Assets – 100% | | | | | | | | $ | 1,904,553,065 |
| | | | For Fund portfolio compliance purposes, the Fund’s industry classifications refer to any one or more of the industry sub-classifications used by one or more widely recognized market indexes or ratings group indexes, and/or as defined by Fund management. This definition may not apply for purposes of this report, which may combine industry sub-classifications into sectors for reporting ease. |
| | (1) | | All percentages shown in the Portfolio of Investments are based on net assets. |
| | (2) | | For fair value measurement disclosure purposes, Common Stock categorized as Level 2. See Notes to Financial Statements, Footnote 1 – General Information and Significant Accounting Policies, Investment Valuation for more information. |
| | (3) | | Non-income producing; issuer has not declared a dividend within the past twelve months. |
| | (4) | | Ratings (not covered by the report of independent registered public accounting firm): Using the highest of Standard & Poor’s Group (“Standard & Poor’s”), Moody’s Investor Service, Inc. (“Moody’s”) or Fitch, Inc. (“Fitch”) rating. Ratings below BBB by Standard & Poor’s, Baa by Moody’s or BBB by Fitch are considered to be below investment grade. |
| | ADR | | American Depositary Receipt. |
See accompanying notes to financial statements.
—
Statement of Assets and Liabilities
June 30, 2010
| | | | | | | | | | | | | | | | | | | | | | | |
| | | Multi-Manager
Large-Cap Value | | | Multi-Cap
Value | | | Large-Cap
Value | | | Small/Mid- Cap Value | | | Small-Cap
Value | | | Value
Opportunities |
Assets | | | | | | | | | | | | | | | | | | | | | | | |
Investments, at value (cost $279,104,227, $378,898,044, $274,588,733, $9,795,282, $83,468,213 and $1,510,230,863, respectively) | | $ | 288,855,001 | | | $ | 361,022,304 | | | $ | 260,607,588 | | | $ | 10,905,197 | | | $ | 82,097,791 | | | $ | 1,615,023,553 |
Short-term investments (at cost, which approximates value) | | | 6,352,349 | | | | 10,660,817 | | | | 12,344,159 | | | | 109,157 | | | | 1,952,069 | | | | 307,394,203 |
Cash | | | 2,183,657 | | | | 34,983 | | | | 27,488 | | | | — | | | | — | | | | — |
Receivables: | | | | | | | | | | | | | | | | | | | | | | | |
Dividends | | | 552,532 | | | | 475,730 | | | | 348,447 | | | | 6,060 | | | | 37,938 | | | | 922,464 |
Interest | | | — | | | | — | | | | — | | | | — | | | | — | | | | 461,446 |
Investments sold | | | 429,963 | | | | — | | | | — | | | | 204,587 | | | | 1,360,746 | | | | 6,557,158 |
Reclaims | | | 27,767 | | | | — | | | | — | | | | — | | | | — | | | | — |
Shares sold | | | 266,443 | | | | 1,054,206 | | | | 1,386,167 | | | | 88,050 | | | | 179,050 | | | | 10,247,508 |
Other assets | | | 124,185 | | | | 41,422 | | | | 42 | | | | 16 | | | | 115 | | | | 34,685 |
Total assets | | | 298,791,897 | | | | 373,289,462 | | | | 274,713,891 | | | | 11,313,067 | | | | 85,627,709 | | | | 1,940,641,017 |
Liabilities | | | | | | | | | | | | | | | | | | | | | | | |
Cash overdraft | | | — | | | | — | | | | — | | | | — | | | | — | | | | 9,039,997 |
Cash overdraft denominated in foreign currencies (cost $0, $37,188, $0, $0, $0 and $0, respectively) | | | — | | | | 34,933 | | | | — | | | | — | | | | — | | | | — |
Payables: | | | | | | | | | | | | | | | | | | | | | | | |
Investments purchased | | | 2,605,720 | | | | — | | | | — | | | | 6,592 | | | | — | | | | 15,953,136 |
Shares redeemed | | | 208,638 | | | | 693,116 | | | | 1,751,811 | | | | 14,987 | | | | 99,054 | | | | 7,801,288 |
Accrued expenses: | | | | | | | | | | | | | | | | | | | | | | | |
Management fees | | | 192,831 | | | | 261,078 | | | | 245,023 | | | | 3,822 | | | | 63,618 | | | | 1,533,330 |
12b-1 distribution and service fees | | | 71,085 | | | | 89,531 | | | | 7,335 | | | | 1,308 | | | | 4,694 | | | | 303,014 |
Other | | | 358,348 | | | | 563,514 | | | | 162,175 | | | | 51,551 | | | | 82,485 | | | | 1,457,187 |
Total liabilities | | | 3,436,622 | | | | 1,642,172 | | | | 2,166,344 | | | | 78,260 | | | | 249,851 | | | | 36,087,952 |
Net assets | | $ | 295,355,275 | | | $ | 371,647,290 | | | $ | 272,547,547 | | | $ | 11,234,807 | | | $ | 85,377,858 | | | $ | 1,904,553,065 |
Class A Shares | | | | | | | | | | | | | | | | | | | | | | | |
Net assets | | $ | 254,730,226 | | | $ | 61,514,071 | | | $ | 13,819,963 | | | $ | 3,267,200 | | | $ | 7,008,517 | | | $ | 658,036,602 |
Shares outstanding | | | 15,814,555 | | | | 4,175,058 | | | | 938,241 | | | | 228,118 | | | | 383,069 | | | | 22,107,913 |
Net asset value per share | | $ | 16.11 | | | $ | 14.73 | | | $ | 14.73 | | | $ | 14.32 | | | $ | 18.30 | | | $ | 29.76 |
Offering price per share (net asset value per share plus maximum sales charge of 5.75% of offering price) | | $ | 17.09 | | | $ | 15.63 | | | $ | 15.63 | | | $ | 15.19 | | | $ | 19.41 | | | $ | 31.58 |
Class B Shares | | | | | | | | | | | | | | | | | | | | | | | |
Net assets | | $ | 1,999,954 | | | $ | 16,015,873 | | | $ | 456,385 | | | | N/A | | | | N/A | | | $ | 5,800,667 |
Shares outstanding | | | 127,833 | | | | 1,127,424 | | | | 31,513 | | | | N/A | | | | N/A | | | | 199,537 |
Net asset value and offering price per share | | $ | 15.65 | | | $ | 14.21 | | | $ | 14.48 | | | | N/A | | | | N/A | | | $ | 29.07 |
Class C Shares | | | | | | | | | | | | | | | | | | | | | | | |
Net assets | | $ | 15,564,692 | | | $ | 71,208,569 | | | $ | 4,665,352 | | | $ | 636,236 | | | $ | 3,494,099 | | | $ | 192,332,437 |
Shares outstanding | | | 996,985 | | | | 5,012,749 | | | | 322,081 | | | | 45,666 | | | | 197,583 | | | | 6,617,694 |
Net asset value and offering price per share | | $ | 15.61 | | | $ | 14.21 | | | $ | 14.49 | | | $ | 13.93 | | | $ | 17.68 | | | $ | 29.06 |
Class R3 Shares | | | | | | | | | | | | | | | | | | | | | | | |
Net assets | | $ | 110,166 | | | $ | 202,115 | | | $ | 48,276 | | | $ | 52,455 | | | $ | 50,834 | | | $ | 1,444,187 |
Shares outstanding | | | 6,803 | | | | 13,789 | | | | 3,281 | | | | 3,695 | | | | 2,767 | | | | 48,521 |
Net asset value and offering price per share | | $ | 16.19 | | | $ | 14.66 | | | $ | 14.71 | | | $ | 14.19 | | | $ | 18.37 | | | $ | 29.76 |
Class I Shares | | | | | | | | | | | | | | | | | | | | | | | |
Net assets | | $ | 22,950,237 | | | $ | 222,706,662 | | | $ | 253,557,571 | | | $ | 7,278,916 | | | $ | 74,824,408 | | | $ | 1,046,939,172 |
Shares outstanding | | | 1,418,762 | | | | 15,110,678 | | | | 17,191,910 | | | | 511,003 | | | | 4,067,610 | | | | 35,047,484 |
Net asset value and offering price per share | | $ | 16.18 | | | $ | 14.74 | | | $ | 14.75 | | | $ | 14.24 | | | $ | 18.40 | | | $ | 29.87 |
Net Assets Consist of: | | | | | | | | | | | | | | | | | | | | | | | |
Capital paid-in | | $ | 381,651,359 | | | $ | 685,741,935 | | | $ | 290,199,024 | | | $ | 45,344,488 | | | $ | 155,208,380 | | | $ | 1,773,777,635 |
Undistributed (Over-distribution of) net investment income | | | 3,857,753 | | | | (41,594 | ) | | | 738,707 | | | | — | | | | — | | | | 6,805,973 |
Accumulated net realized gain (loss) | | | (99,903,863 | ) | | | (296,179,617 | ) | | | (4,408,753 | ) | | | (35,219,596 | ) | | | (68,460,100 | ) | | | 19,184,120 |
Net unrealized appreciation (depreciation) | | | 9,750,026 | | | | (17,873,434 | ) | | | (13,981,431 | ) | | | 1,109,915 | | | | (1,370,422 | ) | | | 104,785,337 |
Net assets | | $ | 295,355,275 | | | $ | 371,647,290 | | | $ | 272,547,547 | | | $ | 11,234,807 | | | $ | 85,377,858 | | | $ | 1,904,553,065 |
Authorized shares | | | Unlimited | | | | Unlimited | | | | Unlimited | | | | Unlimited | | | | Unlimited | | | | Unlimited |
Par value per share | | $ | 0.01 | | | $ | 0.01 | | | $ | 0.01 | | | $ | 0.01 | | | $ | 0.01 | | | $ | 0.01 |
| N/A | Effective October 5, 2009, Class B Shares of Small/Mid-Cap Value and Small-Cap Value are no longer available through an exchange of another Nuveen fund and converted to Class A Shares on October 27, 2009. |
See accompanying notes to financial statements.
Statement of Operations
Year Ended June 30, 2010
| | | | | | | | | | | | |
| | | Multi-Manager
Large-Cap Value | | | Multi-Cap Value | | | Large-Cap Value | |
Investment Income | | | | | | | | | | | | |
Dividends (net of foreign tax withheld of $39,054, $179,362 and $79,813, respectively) | | $ | 6,915,479 | | | $ | 4,178,095 | | | $ | 2,474,271 | |
Interest | | | 831 | | | | 1,947 | | | | 1,771 | |
Total investment income | | | 6,916,310 | | | | 4,180,042 | | | | 2,476,042 | |
Expenses | | | | | | | | | | | | |
Management fees | | | 2,329,647 | | | | 3,158,424 | | | | 1,289,000 | |
12b-1 service fees – Class A | | | 693,922 | | | | 193,995 | | | | 28,876 | |
12b-1 distribution and service fees – Class B | | | 26,917 | | | | 184,363 | | | | 5,082 | |
12b-1 distribution and service fees – Class C | | | 174,507 | | | | 836,301 | | | | 38,076 | |
12b-1 distribution and service fees – Class R3 | | | 577 | | | | 747 | | | | 194 | |
Shareholders’ servicing agent fees and expenses | | | 469,489 | | | | 1,004,503 | | | | 165,441 | |
Custodian’s fees and expenses | | | 157,162 | | | | 68,664 | | | | 29,211 | |
Trustees’ fees and expenses | | | 10,209 | | | | 8,854 | | | | 3,143 | |
Professional fees | | | 49,560 | | | | 56,816 | | | | 24,214 | |
Shareholders’ reports – printing and mailing expenses | | | 66,381 | | | | 139,025 | | | | 40,574 | |
Federal and state registration fees | | | 112,361 | | | | 105,807 | | | | 105,080 | |
Other expenses | | | 18,136 | | | | 33,439 | | | | 7,034 | |
Total expenses before custodian fee credit and expense reimbursement | | | 4,108,868 | | | | 5,790,938 | | | | 1,735,925 | |
Custodian fee credit | | | (6 | ) | | | — | | | | — | |
Expense reimbursement | | | (208,540 | ) | | | — | | | | — | |
Net expenses | | | 3,900,322 | | | | 5,790,938 | | | | 1,735,925 | |
Net investment income (loss) | | | 3,015,988 | | | | (1,610,896 | ) | | | 740,117 | |
Realized and Unrealized Gain (Loss) | | | | | | | | | | | | |
Net realized gain (loss) from investments and foreign currency | | | 3,750,889 | | | | (30,044,317 | ) | | | 60,957 | |
Change in net unrealized appreciation (depreciation) of investments and foreign currency | | | 35,915,040 | | | | 106,504,316 | | | | (8,731,166 | ) |
Net realized and unrealized gain (loss) | | | 39,665,929 | | | | 76,459,999 | | | | (8,670,209 | ) |
Net increase (decrease) in net assets from operations | | $ | 42,681,917 | | | $ | 74,849,103 | | | $ | (7,930,092 | ) |
See accompanying notes to financial statements.
Statement of Operations (continued)
Year Ended June 30, 2010
| | | | | | | | | | | | |
| | | Small/Mid
Cap Value | | | Small-Cap Value | | | Value Opportunities | |
Investment Income | | | | | | | | | | | | |
Dividends (net of foreign tax withheld of $71, $0 and $1,165,551, respectively) | | $ | 79,448 | | | $ | 887,976 | | | $ | 22,583,475 | |
Interest | | | 68 | | | | 525 | | | | 6,616,518 | |
Total investment income | | | 79,516 | | | | 888,501 | | | | 29,199,993 | |
Expenses | | | | | | | | | | | | |
Management fees | | | 90,491 | | | | 901,739 | | | | 14,883,083 | |
12b-1 service fees – Class A | | | 6,975 | | | | 21,496 | | | | 1,373,982 | |
12b-1 distribution and service fees – Class B | | | — | | | | — | | | | 59,577 | |
12b-1 distribution and service fees – Class C | | | 7,101 | | | | 40,640 | | | | 1,516,156 | |
12b-1 distribution and service fees – Class R3 | | | 204 | | | | 200 | | | | 3,928 | |
Shareholders’ servicing agent fees and expenses | | | 20,003 | | | | 71,471 | | | | 2,394,392 | |
Custodian’s fees and expenses | | | 10,366 | | | | 21,778 | | | | 248,608 | |
Trustees’ fees and expenses | | | 223 | | | | 2,124 | | | | 45,351 | |
Professional fees | | | 14,147 | | | | 22,567 | | | | 160,085 | |
Shareholders’ reports – printing and mailing expenses | | | 11,058 | | | | 8,480 | | | | 426,816 | |
Federal and state registration fees | | | 50,541 | | | | 62,628 | | | | 224,370 | |
Other expenses | | | 4,017 | | | | 9,768 | | | | 75,742 | |
Total expenses before custodian fee credit and expense reimbursement | | | 215,126 | | | | 1,162,891 | | | | 21,412,090 | |
Custodian fee credit | | | — | | | | — | | | | (233 | ) |
Expense reimbursement | | | (86,181 | ) | | | (14,951 | ) | | | — | |
Net expenses | | | 128,945 | | | | 1,147,940 | | | | 21,411,857 | |
Net investment income (loss) | | | (49,429 | ) | | | (259,439 | ) | | | 7,788,136 | |
Realized and Unrealized Gain (Loss) | | | | | | | | | | | | |
Net realized gain (loss) from investments and foreign currency | | | 621,080 | | | | 5,246,292 | | | | 110,998,312 | |
Change in net unrealized appreciation (depreciation) of investments and foreign currency | | | 1,280,479 | | | | 17,007,810 | | | | 135,738,189 | |
Net realized and unrealized gain (loss) | | | 1,901,559 | | | | 22,254,102 | | | | 246,736,501 | |
Net increase (decrease) in net assets from operations | | $ | 1,852,130 | | | $ | 21,994,663 | | | $ | 254,524,637 | |
See accompanying notes to financial statements.
Statement of Changes in Net Assets
| | | | | | | | | | | | | | | | |
| | | Multi-Manager Large-Cap Value | | | Multi-Cap Value | |
| | | Year Ended
6/30/10 | | | Year Ended
6/30/09 | | | Year Ended
6/30/10 | | | Year Ended
6/30/09 | |
Operations | | | | | | | | | | | | | | | | |
Net investment income (loss) | | $ | 3,015,988 | | | $ | 5,602,681 | | | $ | (1,610,896 | ) | | $ | 945,024 | |
Net realized gain (loss) from investments and foreign currency | | | 3,750,889 | | | | (99,556,386 | ) | | | (30,044,317 | ) | | | (222,172,003 | ) |
Change in net unrealized appreciation (depreciation) of
investments and foreign currency | | | 35,915,040 | | | | (34,549,238 | ) | | | 106,504,316 | | | | (33,669,985 | ) |
Net increase (decrease) in net assets from operations | | | 42,681,917 | | | | (128,502,943 | ) | | | 74,849,103 | | | | (254,896,964 | ) |
Distributions to Shareholders | | | | | | | | | | | | | | | | |
Net investment income: | | | | | | | | | | | | | | | | |
Class A | | | (4,929,821 | ) | | | (3,290,647 | ) | | | (125,185 | ) | | | — | |
Class B | | | (29,067 | ) | | | (10,009 | ) | | | — | | | | — | |
Class C | | | (194,187 | ) | | | (32,922 | ) | | | — | | | | — | |
Class R3 | | | (1,813 | ) | | | (948 | ) | | | (40 | ) | | | — | |
Class I | | | (443,196 | ) | | | (268,967 | ) | | | (547,790 | ) | | | — | |
From accumulated net realized gains: | | | | | | | | | | | | | | | | |
Class A | | | — | | | | (25,379,143 | ) | | | — | | | | — | |
Class B | | | — | | | | (509,457 | ) | | | — | | | | — | |
Class C | | | — | | | | (1,646,216 | ) | | | — | | | | — | |
Class R3 | | | — | | | | (10,722 | ) | | | — | | | | — | |
Class I | | | — | | | | (1,582,389 | ) | | | — | | | | — | |
From return of capital: | | | | | | | | | | | | | | | | |
Class A | | | — | | | | — | | | | (68,530 | ) | | | — | |
Class B | | | — | | | | — | | | | — | | | | — | |
Class C | | | — | | | | — | | | | — | | | | — | |
Class R3 | | | — | | | | — | | | | (22 | ) | | | — | |
Class I | | | — | | | | — | | | | (299,879 | ) | | | — | |
Decrease in net assets from distributions to shareholders | | | (5,598,084 | ) | | | (32,731,420 | ) | | | (1,041,446 | ) | | | — | |
Fund Share Transactions | | | | | | | | | | | | | | | | |
Proceeds from sale of shares | | | 37,463,350 | | | | 25,703,284 | | | | 165,234,343 | | | | 192,693,604 | |
Proceeds from shares issued to shareholders due to reinvestment of distributions | | | 4,377,343 | | | | 24,773,422 | | | | 940,552 | | | | — | |
| | | 41,840,693 | | | | 50,476,706 | | | | 166,174,895 | | | | 192,693,604 | |
Cost of shares redeemed | | | (58,316,687 | ) | | | (61,316,966 | ) | | | (267,368,882 | ) | | | (332,925,017 | ) |
Net increase (decrease) in net assets from Fund share transactions | | | (16,475,994 | ) | | | (10,840,260 | ) | | | (101,193,987 | ) | | | (140,231,413 | ) |
Capital contribution from Adviser | | | — | | | | — | | | | — | | | | — | |
Net increase (decrease) in net assets | | | 20,607,839 | | | | (172,074,623 | ) | | | (27,386,330 | ) | | | (395,128,377 | ) |
Net assets at the beginning of year | | | 274,747,436 | | | | 446,822,059 | | | | 399,033,620 | | | | 794,161,997 | |
Net assets at the end of year | | $ | 295,355,275 | | | $ | 274,747,436 | | | $ | 371,647,290 | | | $ | 399,033,620 | |
Undistributed (Over-distribution of) net investment income at
the end of year | | $ | 3,857,753 | | | $ | 5,609,527 | | | $ | (41,594 | ) | | $ | 1,013,587 | |
See accompanying notes to financial statements.
Statement of Changes in Net Assets (continued)
| | | | | | | | | | | | | | | | |
| | | Large-Cap Value | | | Small/Mid-Cap Value | |
| | | Year Ended
6/30/10 | | | Year Ended
6/30/09 | | | Year Ended
6/30/10 | | | Year Ended
6/30/09 | |
Operations | | | | | | | | | | | | | | | | |
Net investment income (loss) | | $ | 740,117 | | | $ | 248,489 | | | $ | (49,429 | ) | | $ | (15,552 | ) |
Net realized gain (loss) from investments and foreign currency | | | 60,957 | | | | (3,940,065 | ) | | | 621,080 | | | | (22,774,366 | ) |
Change in net unrealized appreciation (depreciation) of
investments and foreign currency | | | (8,731,166 | ) | | | (1,787,154 | ) | | | 1,280,479 | | | | 6,483,688 | |
Net increase (decrease) in net assets from operations | | | (7,930,092 | ) | | | (5,478,730 | ) | | | 1,852,130 | | | | (16,306,230 | ) |
Distributions to Shareholders | | | | | | | | | | | | | | | | |
Net investment income: | | | | | | | | | | | | | | | | |
Class A | | | — | | | | (22,861 | ) | | | — | | | | — | |
Class B | | | — | | | | — | | | | — | | | | — | |
Class C | | | — | | | | — | | | | — | | | | — | |
Class R3 | | | — | | | | N/A | | | | — | | | | N/A | |
Class I | | | (165,020 | ) | | | (141,733 | ) | | | — | | | | — | |
From accumulated net realized gains: | | | | | | | | | | | | | | | | |
Class A | | | — | | | | — | | | | — | | | | — | |
Class B | | | — | | | | — | | | | — | | | | — | |
Class C | | | — | | | | — | | | | — | | | | — | |
Class R3 | | | — | | | | N/A | | | | — | | | | N/A | |
Class I | | | — | | | | — | | | | — | | | | — | |
From return of capital: | | | | | | | | | | | | | | | | |
Class A | | | — | | | | — | | | | — | | | | — | |
Class B | | | — | | | | — | | | | — | | | | — | |
Class C | | | — | | | | — | | | | — | | | | — | |
Class R3 | | | — | | | | N/A | | | | — | | | | N/A | |
Class I | | | — | | | | — | | | | — | | | | — | |
Decrease in net assets from distributions to shareholders | | | (165,020 | ) | | | (164,594 | ) | | | — | | | | — | |
Fund Share Transactions | | | | | | | | | | | | | | | | |
Proceeds from sale of shares | | | 266,036,468 | | | | 59,453,469 | | | | 8,754,586 | | | | 7,428,866 | |
Proceeds from shares issued to shareholders due to reinvestment of distributions | | | 150,445 | | | | 128,769 | | | | — | | | | — | |
| | | 266,186,913 | | | | 59,582,238 | | | | 8,754,586 | | | | 7,428,866 | |
Cost of shares redeemed | | | (46,859,395 | ) | | | (16,741,242 | ) | | | (5,190,001 | ) | | | (28,728,824 | ) |
Net increase (decrease) in net assets from Fund share transactions | | | 219,327,518 | | | | 42,840,996 | | | | 3,564,585 | | | | (21,299,958 | ) |
Capital contribution from Adviser | | | — | | | | — | | | | — | | | | 125,970 | |
Net increase (decrease) in net assets | | | 211,232,406 | | | | 37,197,672 | | | | 5,416,715 | | | | (37,480,218 | ) |
Net assets at the beginning of year | | | 61,315,141 | | | | 24,117,469 | | | | 5,818,092 | | | | 43,298,310 | |
Net assets at the end of year | | $ | 272,547,547 | | | $ | 61,315,141 | | | $ | 11,234,807 | | | $ | 5,818,092 | |
Undistributed (Over-distribution of) net investment income at the end of year | | $ | 738,707 | | | $ | 164,141 | | | $ | — | | | $ | — | |
| N/A | Large-Cap Value and Small/Mid-Cap Value did not offer Class R3 Shares prior to September 29, 2009. |
See accompanying notes to financial statements.
| | | | | | | | | | | | | | | | |
| | | Small-Cap Value | | | Value Opportunities | |
| | | Year Ended
6/30/10 | | | Year Ended
6/30/09 | | | Year Ended
6/30/10 | | | Year Ended
6/30/09 | |
Operations | | | | | | | | | | | | | | | | |
Net investment income (loss) | | $ | (259,439 | ) | | $ | 197,909 | | | $ | 7,788,136 | | | $ | 6,825,534 | |
Net realized gain (loss) from investments and foreign currency | | | 5,246,292 | | | | (71,043,262 | ) | | | 110,998,312 | | | | (92,304,086 | ) |
Change in net unrealized appreciation (depreciation) of
investments and foreign currency | | | 17,007,810 | | | | 2,948,702 | | | | 135,738,189 | | | | (10,891,435 | ) |
Net increase (decrease) in net assets from operations | | | 21,994,663 | | | | (67,896,651 | ) | | | 254,524,637 | | | | (96,369,987 | ) |
Distributions to Shareholders | | | | | | | | | | | | | | | | |
Net investment income: | | | | | | | | | | | | | | | | |
Class A | | | (3,183 | ) | | | — | | | | — | | | | (611,878 | ) |
Class B | | | — | | | | — | | | | — | | | | — | |
Class C | | | — | | | | — | | | | — | | | | — | |
Class R3 | | | — | | | | N/A | | | | — | | | | — | |
Class I | | | (192,552 | ) | | | — | | | | — | | | | (1,649,711 | ) |
From accumulated net realized gains: | | | | | | | | | | | | | | | | |
Class A | | | — | | | | — | | | | — | | | | (12,960,049 | ) |
Class B | | | — | | | | — | | | | — | | | | (230,149 | ) |
Class C | | | — | | | | — | | | | — | | | | (3,976,760 | ) |
Class R3 | | | — | | | | N/A | | | | — | | | | (5,448 | ) |
Class I | | | — | | | | — | | | | — | | | | (14,167,425 | ) |
From return of capital: | | | | | | | | | | | | | | | | |
Class A | | | — | | | | — | | | | — | | | | — | |
Class B | | | — | | | | — | | | | — | | | | — | |
Class C | | | — | | | | — | | | | — | | | | — | |
Class R3 | | | — | | | | N/A | | | | — | | | | — | |
Class I | | | — | | | | — | | | | — | | | | — | |
Decrease in net assets from distributions to shareholders | | | (195,735 | ) | | | — | | | | — | | | | (33,601,420 | ) |
Fund Share Transactions | | | | | | | | | | | | | | | | |
Proceeds from sale of shares | | | 27,648,194 | | | | 36,286,766 | | | | 1,059,742,767 | | | | 761,448,921 | |
Proceeds from shares issued to shareholders due to reinvestment of distributions | | | 178,041 | | | | — | | | | — | | | | 22,479,299 | |
| | | 27,826,235 | | | | 36,286,766 | | | | 1,059,742,767 | | | | 783,928,220 | |
Cost of shares redeemed | | | (38,022,996 | ) | | | (66,999,103 | ) | | | (472,945,062 | ) | | | (360,747,458 | ) |
Net increase (decrease) in net assets from Fund share transactions | | | (10,196,761 | ) | | | (30,712,337 | ) | | | 586,797,705 | | | | 423,180,762 | |
Capital contribution from Adviser | | | — | | | | — | | | | — | | | | — | |
Net increase (decrease) in net assets | | | 11,602,167 | | | | (98,608,988 | ) | | | 841,322,342 | | | | 293,209,355 | |
Net assets at the beginning of year | | | 73,775,691 | | | | 172,384,679 | | | | 1,063,230,723 | | | | 770,021,368 | |
Net assets at the end of year | | $ | 85,377,858 | | | $ | 73,775,691 | | | $ | 1,904,553,065 | | | $ | 1,063,230,723 | |
Undistributed (Over-distribution of) net investment income at the end of year | | $ | — | | | $ | 197,909 | | | $ | 6,805,973 | | | $ | (728,391) | |
| N/A | Small-Cap Value did not offer Class R3 Shares prior to September 29, 2009. |
See accompanying notes to financial statements.
Notes to Financial Statements
1. General Information and Significant Accounting Policies
The Nuveen Investment Trust (the “Trust”) is an open-end management investment company registered under the Investment Company Act of 1940, as amended. The Trust is comprised of the Nuveen Multi-Manager Large-Cap Value Fund (“Multi-Manager Large-Cap Value”), Nuveen NWQ Multi-Cap Value Fund (“Multi-Cap Value”), Nuveen NWQ Large-Cap Value Fund (“Large-Cap Value”), Nuveen NWQ Small/Mid-Cap Value Fund (“Small/Mid-Cap Value”), Nuveen NWQ Small-Cap Value Fund (“Small-Cap Value”) and Nuveen Tradewinds Value Opportunities Fund (“Value Opportunities”) (collectively, the “Funds”), among others. The Trust was organized as a Massachusetts business trust in 1996.
Multi-Manager Large-Cap Value’s investment objective is to provide long-term capital appreciation. Under normal market conditions, the Fund invests at least 80% of its net assets in equity securities of companies with market capitalizations comparable to companies in the Russell 1000 Value Index. The Fund will not be forced to sell a stock because it has exceeded or fallen below the current market capitalization range. The Fund’s investment portfolio is managed by three sub-advisers, Institutional Capital LLC (“ICAP”), Nuveen HypePark Group, LLC (“HydePark”) and Symphony Asset Management LLC (“Symphony”). HydePark and Symphony are subsidiaries of Nuveen Investments, Inc. (“Nuveen”). Nuveen Asset Management (the “Adviser”), a wholly-owned subsidiary of Nuveen, maintains a strategic asset allocation of between 25% and 40% of the Fund’s assets with each sub-adviser. The Fund may also invest up to 25% of its net assets in non-U.S. equity securities denominated in U.S. dollars.
Multi-Cap Value’s investment objective is to provide long-term capital appreciation. Under normal market conditions, the Fund invests at least 80% of its net assets in equity securities of companies with large, medium and small capitalizations. The Fund’s sub-adviser is NWQ Investment Management Company, LLC (“NWQ”). NWQ maintains a long-term investment view and a focus on securities it believes can appreciate over an extended time, regardless of interim fluctuations. The Fund invests primarily in U.S. equity securities, but it may invest up to 35% of its net assets in non-U.S. equity securities, including up to 10% of its net assets in equity securities of companies located in emerging market countries.
Large-Cap Value’s, Small/Mid-Cap Value’s and Small-Cap Value’s investment objective is to provide long-term capital appreciation. Under normal market conditions, Large-Cap Value and Small/Mid-Cap Value invest at least 80% of their net assets in equity securities of companies with market capitalizations at the time of investment comparable to companies in the Russell 1000 Value Index and Russell 2500 Value Index, respectively. Under normal market conditions, Small-Cap Value invests at least 80% of its net assets in equity securities of companies with market capitalizations at the time of investment comparable to companies in either the Russell 2000 Value Index or the Standard & Poor’s SmallCap 600 Index. The Funds will not be forced to sell a stock because it has exceeded or fallen below the current market capitalization range. The Funds’ sub-adviser, NWQ, maintains a long-term investment view and a focus on securities it believes can appreciate over an extended time, regardless of interim fluctuations. Each Fund invests primarily in U.S. equity securities, but may invest up to 35% of its net assets in non-U.S. equity securities, including up to 10% of its net assets in equity securities of companies located in emerging market countries. Large-Cap Value and Small/Mid-Cap Value are non-diversified and thus may invest a relatively high percentage of their assets in a limited number of issuers.
Value Opportunities’ investment objective is to provide long-term capital appreciation. Under normal market conditions, the Fund invests primarily in equity securities of companies with varying market capitalizations, which may include small-, mid- and large-capitalization companies. The Fund’s sub-adviser is Tradewinds Global Investors, LLC (“Tradewinds”). The Fund invests primarily in U.S. equity securities, but it may invest up to 35% of its net assets in non-U.S. equity securities, including up to 10% of its net assets in equity securities of companies located in emerging market countries.
Effective October 5, 2009, Class B Shares of Small/Mid-Cap Value and Small Cap Value are no longer available through an exchange from other Nuveen funds and converted to Class A shares on October 27, 2009.
In June 2009, the Financial Accounting Standards Board (“FASB”) established the FASB Accounting Standards Codification™ (the “Codification”) as the single source of authoritative accounting principles recognized by the FASB in the preparation of financial statements in conformity with generally accepted accounting principles (“GAAP”). The Codification supersedes existing non-grandfathered, non-SEC accounting and reporting standards. The Codification did not change GAAP but rather organized it into a hierarchy where all guidance within the Codification carries an equal level of authority. The Codification became effective for financial statements issued for interim and annual periods ending after September 15, 2009. The Codification did not have a material effect on the Funds’ financial statements.
The following is a summary of significant accounting policies followed by the Funds in the preparation of their financial statements in accordance with accounting principles generally accepted in the United States (“U.S. GAAP”).
Investment Valuation
Common stocks and other equity-type securities are valued at the last sales price on the securities exchange on which such securities are primarily traded and are generally classified as Level 1. Securities primarily traded on the NASDAQ National Market (“NASDAQ”) are valued, except as indicated below, at the NASDAQ Official Closing Price and are generally classified as Level 1. However, securities traded on a securities exchange or NASDAQ for which there were no transactions on a given day or securities not listed on a securities exchange or NASDAQ are valued at the mean between the quoted bid and ask prices. Prices of certain American Depository Receipts (“ADR”) held by the Funds that trade in only limited volume in the United States are valued based on the mean
between the most recent bid and ask prices of the underlying non-U.S.-traded stock, adjusted as appropriate for the underlying-to-ADR conversion ratio and foreign exchange rate, and from time-to-time may also be adjusted further to take into account material events that may take place after the close of the local non-U.S. market but before the close of the New York Stock Exchange. These securities generally represent a transfer from a Level 1 to a Level 2 security.
Prices of fixed-income securities are provided by a pricing service approved by the Funds’ Board of Trustees. Fixed-income securities are valued by a pricing service that values portfolio securities at the mean between the quoted bid and ask prices or the yield equivalent when quotations are readily available. These securities are generally classified as Level 2. Securities for which quotations are not readily available are valued at fair value as determined by the pricing service using methods that may include consideration of the following: yields or prices of investments of comparable quality, type of issue, coupon, maturity and rating, market quotes or indications of value from security dealers, evaluations of anticipated cash flows or collateral, general market conditions and other information and analysis, including the obligor’s credit characteristics considered relevant. The pricing service may employ electronic data processing techniques and/or a matrix system to determine valuations. These securities are generally classified as Level 2. Highly rated zero coupon fixed-income securities, like US Treasury Bills, issued with maturities of one year or less, are valued using the amortized cost method when 60 days or less remain until maturity. With amortized cost, any discount or premium is amortized each day, regardless of the impact of fluctuating rates on the market value of the security. These securities will generally be classified as Level 1 or Level 2.
Temporary investments in securities that have variable rate and demand features qualifying them as short-term investments are valued at amortized cost, which approximates market value. These securities are generally classified as Level 1.
Certain securities may not be able to be priced by the pre-established pricing methods as described above. Such securities may be valued by the Funds’ Board of Trustees or its designee at fair value. These securities generally include, but are not limited to, restricted securities (securities which may not be publicly sold without registration under the Securities Act) for which a pricing service is unable to provide a market price; securities whose trading has been formally suspended; fixed-income securities that have gone into default and for which there is no current market quotation; a security whose market price is not available from a pre-established pricing source; a security with respect to which an event has occurred that is likely to materially affect the value of the security after the market has closed but before the calculation of a Fund’s net asset value (as may be the case in non-U.S. markets on which the security is primarily traded) or make it difficult or impossible to obtain a reliable market quotation; and a security whose price, as provided by the pricing service, is not deemed to reflect the security’s fair value. As a general principle, the fair value of an issue of securities would appear to be the amount that the owner might reasonably expect to receive for them in a current sale. A variety of factors may be considered in determining the fair value of these securities, which may include consideration of the following: yields or prices of investments of comparable quality, type of issue, coupon, maturity and rating, market quotes or indications of value from security dealers, evaluations of anticipated cash flows or collateral, general market conditions and other information and analysis, including the obligor’s credit characteristics considered relevant. These securities are classified as Level 2 or as Level 3 depending on the priority of the significant inputs. Regardless of the method employed to value a particular security, all valuations are subject to review by the Funds’ Board of Trustees or its designee.
Refer to Footnote 2 – Fair Value Measurements for further details on the leveling of securities held by the Funds as of the end of the reporting period.
Investment Transactions
Investment transactions are recorded on a trade date basis. Realized gains and losses from investment transactions are determined on the specific identification method. Investments purchased on a when-issued/delayed delivery basis may have extended settlement periods. Any investments so purchased are subject to market fluctuation during this period. The Funds have instructed the custodian to segregate assets with a current value at least equal to the amount of the when-issued/delayed delivery purchase commitments. At June 30, 2010, there were no such outstanding purchase commitments in any of the Funds.
Investment Income
Dividend income is recorded on the ex-dividend date or, for foreign securities, when information is available. Interest income, which includes the amortization of premiums and accretion of discounts for financial reporting purposes, is recorded on an accrual basis. Interest income also includes paydown gains and losses, if any.
Income Taxes
Each Fund is a separate taxpayer for federal income tax purposes. Each Fund intends to distribute substantially all of its net investment income and net capital gains to shareholders and to otherwise comply with the requirements of Subchapter M of the Internal Revenue Code applicable to regulated investment companies. Therefore, no federal income tax provision is required.
For all open tax years and all major taxing jurisdictions, management of the Funds has concluded that there are no significant uncertain tax positions that would require recognition in the financial statements. Open tax years are those that are open for examination by taxing authorities (i.e., generally the last four tax year ends and the interim tax period since then). Furthermore, management of the Funds is also not aware of any tax positions for which it is reasonably possible that the total amounts of unrecognized tax benefits will significantly change in the next twelve months.
Notes to Financial Statements (continued)
Dividends and Distributions to Shareholders
Dividends from net investment income and net realized capital gains from investment transactions, if any, are declared and distributed to shareholders at least annually. Furthermore, capital gains are distributed only to the extent they exceed available capital loss carryforwards.
Distributions to shareholders are recorded on the ex-dividend date. The amount and timing of distributions are determined in accordance with federal income tax regulations, which may differ from U.S. GAAP.
Flexible Sales Charge Program
Class A Shares are generally sold with an up-front sales charge and incur a .25% annual 12b-1 service fee. Class A Share purchases of $1 million or more are sold at net asset value without an up-front sales charge but may be subject to a contingent deferred sales charge (“CDSC”) if redeemed within twelve months of purchase. Class B Shares were sold without an up-front sales charge but incur a .75% annual 12b-1 distribution fee and a .25% annual 12b-1 service fee. Class B Shares are subject to a CDSC of up to 5% depending upon the length of time the shares are held by the investor (CDSC is reduced to 0% at the end of six years). Class B Shares convert to Class A Shares eight years after purchase. Class C Shares are sold without an up-front sales charge but incur a .75% annual 12b-1 distribution fee and a .25% annual 12b-1 service fee. Class C Shares are subject to a CDSC of 1% if redeemed within one year of purchase. Class R3 Shares are sold without an up-front sales charge but incur a .50% annual 12b-1 distribution and service fee. Class I Shares are not subject to any sales charge or 12b-1 distribution or service fees.
Foreign Currency Transactions
Each Fund is authorized to engage in foreign currency exchange transactions, including foreign currency forwards, futures, options and swap contracts. To the extent that the Funds invest in securities and/or contracts that are denominated in a currency other than U.S. dollars, the Funds will be subject to currency risk, which is the risk that an increase in the U.S. dollar relative to the foreign currency will reduce returns or portfolio value. Generally, when the U.S. dollar rises in value against a foreign currency, the Funds’ investments denominated in that currency will lose value because its currency is worth fewer U.S. dollars; the opposite effect occurs if the U.S. dollar falls in relative value. Investments and other assets and liabilities denominated in foreign currencies are converted into U.S. dollars on a spot (i.e. cash) basis at the spot rate prevailing in the foreign currency exchange market at the time of valuation. Purchases and sales of investments and income denominated in foreign currencies are translated into U.S. dollars on the respective dates of such transactions.
The books and records of the Funds are maintained in U.S. dollars. Foreign currencies, investments and other assets and liabilities are translated into U.S. dollars at 4:00 p.m. Eastern time. Investments, income and expenses are translated on the respective dates of such transactions. Net realized foreign currency gains and losses resulting from changes in exchange rates include foreign currency gains and losses between trade date and settlement date of the transactions, foreign currency transactions, and the difference between the amounts of interest and dividends recorded on the books of a Fund and the amounts actually received.
The realized and unrealized gains or losses resulting from changes in foreign currency exchange rates are recognized as a component of “Net realized gain (loss) from investments and foreign currency” and “Change in net unrealized appreciation (depreciation) of investments and foreign currency” on the Statement of Operations, when applicable.
Market and Counterparty Credit Risk
In the normal course of business each Fund may invest in financial instruments and enter into financial transactions where risk of potential loss exists due to changes in the market (market risk) or failure of the other party to the transaction to perform (counterparty credit risk). The potential loss could exceed the value of the financial assets recorded on the financial statements. Financial assets, which potentially expose each Fund to counterparty credit risk, consist principally of cash due from counterparties on forward, option and swap transactions, when applicable. The extent of each Fund’s exposure to counterparty credit risk in respect to these financial assets approximates their carrying value as recorded on the Statement of Assets and Liabilities. Futures contracts, when applicable, expose a Fund to minimal counterparty credit risk as they are exchange traded and the exchange’s clearinghouse, which is counterparty to all exchange traded futures, guarantees the futures contracts against default.
Each Fund helps manage counterparty credit risk by entering into agreements only with counterparties the Adviser believes have the financial resources to honor their obligations and by having the Adviser monitor the financial stability of the counterparties. Additionally, counterparties may be required to pledge collateral daily (based on the daily valuation of the financial asset) on behalf of each Fund with a value approximately equal to the amount of any unrealized gain above a pre-determined threshold. Reciprocally, when each Fund has an unrealized loss, the Funds have instructed the custodian to pledge assets of the Funds as collateral with a value approximately equal to the amount of the unrealized loss above a pre-determined threshold. Collateral pledges are monitored and subsequently adjusted if and when the valuations fluctuate, either up or down, by at least the predetermined threshold amount.
Derivative Financial Instruments
Each Fund is authorized to invest in futures, options, swaps and other derivative instruments. Although the Funds are authorized to invest in such derivative instruments, and may do so in the future, they did not make any such investments during the fiscal year ended June 30, 2010.
Repurchase Agreements
In connection with transactions in repurchase agreements, it is each Fund’s policy that its custodian take possession of the underlying collateral securities, the fair value of which exceeds the principal amount of the repurchase transaction, including accrued interest, at all times. If the seller defaults, and the fair value of the collateral declines, realization of the collateral may be delayed or limited.
Multiclass Operations and Allocations
Income and Expenses of the Funds that were not directly attributable to a specific class of shares were prorated among the classes based on the relative net assets of each class. Expenses directly attributable to a class of shares, which presently only include 12b-1 distribution and service fees, are recorded to the specific class.
Realized and unrealized capital gains and losses of the Funds are prorated among the classes based on the relative net assets of each class.
Custodian Fee Credit
Each Fund has an arrangement with the custodian bank whereby certain custodian fees and expenses are reduced by net credits earned on each Fund’s cash on deposit with the bank. Such deposit arrangements are an alternative to overnight investments. Credits for cash balances may be offset by charges for any days on which a Fund overdraws its account at the custodian bank.
Indemnifications
Under the Trust’s organizational documents, its officers and trustees are indemnified against certain liabilities arising out of the performance of their duties to the Trust. In addition, in the normal course of business, the Trust enters into contracts that provide general indemnifications to other parties. The Trust’s maximum exposure under these arrangements is unknown as this would involve future claims that may be made against the Trust that have not yet occurred. However, the Trust has not had prior claims or losses pursuant to these contracts and expects the risk of loss to be remote.
Use of Estimates
The preparation of financial statements in conformity with U.S. GAAP requires management to make estimates and assumptions that affect the reported amounts of assets and liabilities at the date of the financial statements and the reported amounts of increases and decreases in net assets from operations during the reporting period. Actual results may differ from those estimates.
2. Fair Value Measurements
In determining the value of each Fund’s investments, various inputs are used. These inputs are summarized in the three broad levels listed below:
| | |
| Level 1 – | | Quoted prices in active markets for identical securities. |
| Level 2 – | | Other significant observable inputs (including quoted prices for similar securities, interest rates, prepayment speeds, credit risk, etc.). |
| Level 3 – | | Significant unobservable inputs (including management’s assumptions in determining the fair value of investments). |
The inputs or methodologies used for valuing securities are not an indication of the risk associated with investing in those securities.
The following is a summary of each Fund’s fair value measurements as of June 30, 2010:
| | | | | | | | | | | | |
| Multi-Manager Large-Cap Value | | Level 1 | | Level 2 | | Level 3 | | Total |
Investments: | | | | | | | | | | | | |
Common Stocks | | $ | 287,879,221 | | $ | — | | $ | — | | $ | 287,879,221 |
Investment Companies | | | 975,780 | | | — | | | — | | | 975,780 |
Short-Term Investments | | | 6,352,349 | | | — | | | — | | | 6,352,349 |
Total | | $ | 295,207,350 | | $ | — | | $ | — | | $ | 295,207,350 |
| | | | |
| Multi-Cap Value | | Level 1 | | Level 2 | �� | Level 3 | | Total |
Investments: | | | | | | | | | | | | |
Common Stocks | | $ | 361,022,304 | | $ | — | | $ | — | | $ | 361,022,304 |
Short-Term Investments | | | 10,660,817 | | | — | | | — | | | 10,660,817 |
Total | | $ | 371,683,121 | | $ | — | | $ | — | | $ | 371,683,121 |
| | | | |
| Large-Cap Value | | Level 1 | | Level 2 | | Level 3 | | Total |
Investments: | | | | | | | | | | | | |
Common Stocks | | $ | 260,607,588 | | $ | — | | $ | — | | $ | 260,607,588 |
Short-Term Investments | | | 12,344,159 | | | — | | | — | | | 12,344,159 |
Total | | $ | 272,951,747 | | $ | — | | $ | — | | $ | 272,951,747 |
| | | | |
| Small/Mid-Cap Value | | Level 1 | | Level 2 | | Level 3 | | Total |
Investments: | | | | | | | | | | | | |
Common Stocks | | $ | 10,905,197 | | $ | — | | $ | — | | $ | 10,905,197 |
Short-Term Investments | | | 109,157 | | | — | | | — | | | 109,157 |
Total | | $ | 11,014,354 | | $ | — | | $ | — | | $ | 11,014,354 |
| | | | |
| Small-Cap Value | | Level 1 | | Level 2 | | Level 3 | | Total |
Investments: | | | | | | | | | | | | |
Common Stocks | | $ | 82,097,791 | | $ | — | | $ | — | | $ | 82,097,791 |
Short-Term Investments | | | 1,952,069 | | | — | | | — | | | 1,952,069 |
Total | | $ | 84,049,860 | | $ | — | | $ | — | | $ | 84,049,860 |
Notes to Financial Statements (continued)
| | | | | | | | | | | | |
| | | | |
| Value Opportunities | | Level 1 | | Level 2 | | Level 3 | | Total |
Investments: | | | | | | | | | | | | |
Common Stocks* | | $ | 1,330,289,213 | | $ | 84,431,600 | | $ | — | | $ | 1,414,720,813 |
Preferred Securities** | | | — | | | 55,110,818 | | | — | | | 55,110,818 |
Convertible Bonds | | | — | | | 145,191,922 | | | — | | | 145,191,922 |
Short-Term Investments | | | 307,394,203 | | | — | | | — | | | 307,394,203 |
Total | | $ | 1,637,683,416 | | $ | 284,734,340 | | $ | — | | $ | 1,922,417,756 |
| * | Refer to the Fund’s Portfolio of Investments for industry breakdown of Common Stocks classified as Level 2. |
| ** | Preferred Securities includes Convertible Preferred Securities, $25 Par (or similar) Preferred Securities and Capital Preferred Securities held by the Fund at the end of the reporting period, if any. |
The following is a reconciliation of Value Opportunities’ Level 3 investments held at the beginning and end of the measurement period:
| | | | |
| | | Value
Opportunities
Level 3
Convertible Bonds | |
Balance at the beginning of year | | $ | 1,612,885 | |
Gains (losses): | | | | |
Net realized gains (losses) | | | 4,164,730 | |
Net change in unrealized appreciation (depreciation) | | | (1,111,137 | ) |
Net purchases at cost (sales at proceeds) | | | (4,666,478 | ) |
Net discounts (premiums) | | | — | |
Net transfers in to (out of) at end of period fair value | | | — | |
Balance at the end of year | | $ | — | |
3. Derivative Instruments and Hedging Activities
The Funds record derivative instruments at fair value, with changes in fair value recognized on the Statement of Operations, when applicable. Even though the Funds’ investments in derivatives may represent economic hedges, they are not considered to be hedge transactions for financial reporting purposes. The Funds did not invest in derivative instruments during the fiscal year ended June 30, 2010.
4. Fund Shares
Transactions in Fund shares were as follows:
| | | | | | | | | | | | | | |
| | | Multi-Manager Large-Cap Value | |
| | | Year Ended
6/30/10 | | | Year Ended
6/30/09 | |
| | | Shares | | | Amount | | | Shares | �� | | Amount | |
Shares sold: | | | | | | | | | | | | | | |
Class A | | 1,676,101 | | | $ | 28,372,824 | | | 1,038,170 | | | $ | 15,636,485 | |
Class A – automatic conversion of Class B Shares | | 13,936 | | | | 235,899 | | | 68,221 | | | | 1,019,928 | |
Class B | | 1,985 | | | | 33,090 | | | 8,883 | | | | 145,467 | |
Class C | | 97,095 | | | | 1,600,643 | | | 233,580 | | | | 3,405,310 | |
Class R3 | | — | | | | — | | | 6,803 | | | | 150,000 | |
Class I | | 420,151 | | | | 7,220,894 | | | 368,345 | | | | 5,346,094 | |
Shares issued to shareholders due to reinvestment of distributions: | | | | | | | | | | | | | | |
Class A | | 223,062 | | | | 3,843,347 | | | 1,515,317 | | | | 21,678,068 | |
Class B | | 1,268 | | | | 21,300 | | | 24,991 | | | | 346,027 | |
Class C | | 7,793 | | | | 130,619 | | | 69,563 | | | | 961,070 | |
Class R3 | | — | | | | — | | | — | | | | — | |
Class I | | 22,111 | | | | 382,077 | | | 124,387 | | | | 1,788,257 | |
| | | 2,463,502 | | | | 41,840,693 | | | 3,458,260 | | | | 50,476,706 | |
Shares redeemed: | | | | | | | | | | | | | | |
Class A | | (2,910,640 | ) | | | (49,432,426 | ) | | (3,087,008 | ) | | | (47,678,912 | ) |
Class B | | (80,313 | ) | | | (1,311,698 | ) | | (150,585 | ) | | | (2,293,048 | ) |
Class B – automatic conversion to Class A Shares | | (14,332 | ) | | | (235,899 | ) | | (70,093 | ) | | | (1,019,928 | ) |
Class C | | (252,676 | ) | | | (4,153,799 | ) | | (302,468 | ) | | | (4,498,048 | ) |
Class R3 | | — | | | | — | | | — | | | | — | |
Class I | | (185,922 | ) | | | (3,182,865 | ) | | (376,550 | ) | | | (5,827,030 | ) |
| | | (3,443,883 | ) | | | (58,316,687 | ) | | (3,986,704 | ) | | | (61,316,966 | ) |
Net increase (decrease) | | (980,381 | ) | | $ | (16,475,994 | ) | | (528,444 | ) | | $ | (10,840,260 | ) |
| | | | | | | | | | | | | | |
| | | Multi-Cap Value | |
| | | Year Ended
6/30/10 | | | Year Ended
6/30/09 | |
| | | Shares | | | Amount | | | Shares | | | Amount | |
Shares sold: | | | | | | | | | | | | | | |
Class A | | 627,873 | | | $ | 9,323,721 | | | 1,490,296 | | | $ | 20,013,543 | |
Class A – automatic conversion of Class B Shares | | 2,673 | | | | 42,121 | | | 12,748 | | | | 176,020 | |
Class B | | 8,749 | | | | 123,334 | | | 6,519 | | | | 81,686 | |
Class C | | 184,090 | | | | 2,656,674 | | | 301,887 | | | | 3,735,694 | |
Class R3 | | 5,266 | | | | 80,000 | | | 8,523 | | | | 150,000 | |
Class I | | 10,184,665 | | | | 153,008,493 | | | 13,576,526 | | | | 168,536,661 | |
Shares issued to shareholders due to reinvestment of distributions: | | | | | | | | | | | | | | |
Class A | | 11,622 | | | | 178,402 | | | — | | | | — | |
Class B | | — | | | | — | | | — | | | | — | |
Class C | | — | | | | — | | | — | | | | — | |
Class R3 | | — | | | | — | | | — | | | | — | |
Class I | | 49,684 | | | | 762,150 | | | — | | | | — | |
| | | 11,074,622 | | | | 166,174,895 | | | 15,396,499 | | | | 192,693,604 | |
Shares redeemed: | | | | | | | | | | | | | | |
Class A | | (2,751,308 | ) | | | (41,130,477 | ) | | (11,063,212 | ) | | | (153,131,622 | ) |
Class B | | (280,574 | ) | | | (4,105,538 | ) | | (581,198 | ) | | | (6,970,880 | ) |
Class B – automatic conversion to Class A Shares | | (2,766 | ) | | | (42,121 | ) | | (13,117 | ) | | | (176,020 | ) |
Class C | | (1,778,572 | ) | | | (25,758,309 | ) | | (4,161,457 | ) | | | (51,502,643 | ) |
Class R3 | | — | | | | — | | | — | | | | — | |
Class I | | (13,730,474 | ) | | | (196,332,437 | ) | | (9,831,921 | ) | | | (121,143,852 | ) |
| | | (18,543,694 | ) | | | (267,368,882 | ) | | (25,650,905 | ) | | | (332,925,017 | ) |
Net increase (decrease) | | (7,469,072 | ) | | $ | (101,193,987 | ) | | (10,254,406 | ) | | $ | (140,231,413 | ) |
| |
| | | Large-Cap Value | |
| | | Year Ended
6/30/10 | | | Year Ended
6/30/09 | |
| | | Shares | | | Amount | | | Shares | | | Amount | |
Shares sold: | | | | | | | | | | | | | | |
Class A | | 751,282 | | | $ | 11,492,047 | | | 437,267 | | | $ | 5,473,447 | |
Class B | | 6,984 | | | | 104,974 | | | 10,688 | | | | 124,561 | |
Class C | | 198,629 | | | | 2,979,285 | | | 132,478 | | | | 1,618,650 | |
Class R3 | | 3,281 | | | | 50,000 | | | N/A | | | | N/A | |
Class I | | 15,731,019 | | | | 251,410,162 | | | 4,145,758 | | | | 52,236,811 | |
Shares issued to shareholders due to reinvestment of distributions: | | | | | | | | | | | | | | |
Class A | | — | | | | — | | | 1,543 | | | | 18,534 | |
Class B | | — | | | | — | | | — | | | | — | |
Class C | | — | | | | — | | | — | | | | — | |
Class R3 | | — | | | | — | | | N/A | | | | N/A | |
Class I | | 9,607 | | | | 150,445 | | | 9,186 | | | | 110,235 | |
| | | 16,700,802 | | | | 266,186,913 | | | 4,736,920 | | | | 59,582,238 | |
Shares redeemed: | | | | | | | | | | | | | | |
Class A | | (290,821 | ) | | | (4,518,603 | ) | | (252,852 | ) | | | (3,125,125 | ) |
Class B | | (7,652 | ) | | | (117,818 | ) | | (26,815 | ) | | | (332,584 | ) |
Class C | | (52,499 | ) | | | (789,834 | ) | | (100,256 | ) | | | (1,201,071 | ) |
Class R3 | | — | | | | — | | | N/A | | | | N/A | |
Class I | | (2,686,292 | ) | | | (41,433,140 | ) | | (919,292 | ) | | | (12,082,462 | ) |
| | | (3,037,264 | ) | | | (46,859,395 | ) | | (1,299,215 | ) | | | (16,741,242 | ) |
Net increase (decrease) | | 13,663,538 | | | $ | 219,327,518 | | | 3,437,705 | | | $ | 42,840,996 | |
Notes to Financial Statements (continued)
| | | | | | | | | | | | | | |
| | | Small/Mid-Cap Value | |
| | | Year Ended
6/30/10 | | | Year Ended
6/30/09 | |
| | | Shares | | | Amount | | | Shares | | | Amount | |
Shares sold: | | | | | | | | | | | | | | |
Class A | | 241,034 | | | $ | 3,457,571 | | | 110,634 | | | $ | 1,210,334 | |
Class B | | — | | | | — | | | 3,754 | | | | 49,057 | |
Class C | | 8,768 | | | | 126,801 | | | 27,757 | | | | 290,402 | |
Class R3 | | 3,695 | | | | 50,000 | | | N/A | | | | N/A | |
Class I | | 362,144 | | | | 5,120,214 | | | 454,978 | | | | 5,879,073 | |
Shares issued to shareholders due to reinvestment of distributions: | | | | | | | | | | | | | | |
Class A | | — | | | | — | | | — | | | | — | |
Class B | | — | | | | — | | | — | | | | — | |
Class C | | — | | | | — | | | — | | | | — | |
Class R3 | | — | | | | — | | | N/A | | | | N/A | |
Class I | | — | | | | — | | | — | | | | — | |
| | | 615,641 | | | | 8,754,586 | | | 597,123 | | | | 7,428,866 | |
Shares redeemed: | | | | | | | | | | | | | | |
Class A | | (138,059 | ) | | | (2,080,874 | ) | | (195,442 | ) | | | (2,681,788 | ) |
Class B | | (3,131 | ) | | | (41,857 | ) | | (2,772 | ) | | | (29,711 | ) |
Class C | | (19,452 | ) | | | (273,599 | ) | | (36,006 | ) | | | (374,276 | ) |
Class R3 | | — | | | | — | | | N/A | | | | N/A | |
Class I | | (197,171 | ) | | | (2,793,671 | ) | | (2,362,882 | ) | | | (25,643,049 | ) |
| | | (357,813 | ) | | | (5,190,001 | ) | | (2,597,102 | ) | | | (28,728,824 | ) |
Net increase (decrease) | | 257,828 | | | $ | 3,564,585 | | | (1,999,979 | ) | | $ | (21,299,958 | ) |
N/A – Large-Cap Value and Small/Mid-Cap Value did not issue Class R3 Shares prior to September 29, 2009.
| | | | | | | | | | | | | | |
| | | Small-Cap Value | |
| | | Year Ended
6/30/10 | | | Year Ended
6/30/09 | |
| | | Shares | | | Amount | | | Shares | | | Amount | |
Shares sold: | | | | | | | | | | | | | | |
Class A | | 382,855 | | | $ | 7,506,236 | | | 357,969 | | | $ | 5,864,631 | |
Class A – automatic conversion of Class B Shares | | — | | | | — | | | 57 | | | | 1,086 | |
Class B | | — | | | | — | | | 1,265 | | | | 15,145 | |
Class C | | 48,848 | | | | 835,965 | | | 27,028 | | | | 376,243 | |
Class R3 | | 2,767 | | | | 50,000 | | | N/A | | | | N/A | |
Class I | | 1,072,278 | | | | 19,255,993 | | | 2,201,187 | | | | 30,029,661 | |
Shares issued to shareholders due to reinvestment of distributions: | | | | | | | | | | | | | | |
Class A | | 157 | | | | 2,887 | | | — | | | | — | |
Class B | | — | | | | — | | | — | | | | — | |
Class C | | — | | | | — | | | — | | | | — | |
Class R3 | | — | | | | — | | | N/A | | | | N/A | |
Class I | | 9,463 | | | | 175,154 | | | — | | | | — | |
| | | 1,516,368 | | | | 27,826,235 | | | 2,587,506 | | | | 36,286,766 | |
Shares redeemed: | | | | | | | | | | | | | | |
Class A | | (546,989 | ) | | | (9,955,503 | ) | | (2,140,849 | ) | | | (29,729,040 | ) |
Class B | | (12,603 | ) | | | (214,987 | ) | | (5,021 | ) | | | (68,967 | ) |
Class B – automatic conversion to Class A Shares | | — | | | | — | | | (58 | ) | | | (1,086 | ) |
Class C | | (101,700 | ) | | | (1,781,003 | ) | | (200,743 | ) | | | (2,971,696 | ) |
Class R3 | | — | | | | — | | | N/A | | | | N/A | |
Class I | | (1,407,884 | ) | | | (26,071,503 | ) | | (2,437,905 | ) | | | (34,228,314 | ) |
| | | (2,069,176 | ) | | | (38,022,996 | ) | | (4,784,576 | ) | | | (66,999,103 | ) |
Net increase (decrease) | | (552,808 | ) | | $ | (10,196,761 | ) | | (2,197,070 | ) | | $ | (30,712,337 | ) |
| | | | | | | | | | | | | | |
| | | Value Opportunities | |
| | | Year Ended
6/30/10 | | | Year Ended
6/30/09 | |
| | | Shares | | | Amount | | | Shares | | | Amount | |
Shares sold: | | | | | | | | | | | | | | |
Class A | | 14,799,422 | | | $ | 432,820,362 | | | 10,158,154 | | | $ | 228,277,031 | |
Class A – automatic conversion of Class B Shares | | 268 | | | | 8,362 | | | 1,166 | | | | 28,045 | |
Class B | | 12,924 | | | | 368,325 | | | 25,804 | | | | 609,022 | |
Class C | | 3,311,121 | | | | 96,049,664 | | | 1,546,790 | | | | 34,769,188 | |
Class R3 | | 39,711 | | | | 1,215,106 | | | 24,474 | | | | 558,032 | |
Class I | | 18,071,924 | | | | 529,280,948 | | | 22,348,087 | | | | 497,207,603 | |
Shares issued to shareholders due to reinvestment of distributions: | | | | | | | | | | | | | | |
Class A | | — | | | | — | | | 580,049 | | | | 10,690,843 | |
Class B | | — | | | | — | | | 10,220 | | | | 185,195 | |
Class C | | — | | | | — | | | 156,448 | | | | 2,834,837 | |
Class R3 | | — | | | | — | | | — | | | | — | |
Class I | | — | | | | — | | | 473,586 | | | | 8,768,424 | |
| | | 36,235,370 | | | | 1,059,742,767 | | | 35,324,778 | | | | 783,928,220 | |
Shares redeemed: | | | | | | | | | | | | | | |
Class A | | (8,367,527 | ) | | | (241,527,563 | ) | | (7,498,998 | ) | | | (158,924,417 | ) |
Class B | | (26,775 | ) | | | (769,996 | ) | | (53,866 | ) | | | (1,118,016 | ) |
Class B – automatic conversion to Class A Shares | | (273 | ) | | | (8,362 | ) | | (1,181 | ) | | | (28,045 | ) |
Class C | | (846,652 | ) | | | (24,411,478 | ) | | (1,525,799 | ) | | | (31,579,562 | ) |
Class R3 | | (8,289 | ) | | | (243,107 | ) | | (7,375 | ) | | | (161,002 | ) |
Class I | | (7,004,555 | ) | | | (205,984,556 | ) | | (8,237,208 | ) | | | (168,936,416 | ) |
| | | (16,254,071 | ) | | | (472,945,062 | ) | | (17,324,427 | ) | | | (360,747,458 | ) |
Net increase (decrease) | | 19,981,299 | | | $ | 586,797,705 | | | 18,000,351 | | | $ | 423,180,762 | |
N/A – Small-Cap Value did not issue Class R3 Shares prior to September 29, 2009.
5. Investment Transactions
Purchases and sales (including maturities but excluding short-term investments) during the fiscal year ended June 30, 2010, were as follows:
| | | | | | | | | | | | | | | | | | |
| | | Multi-Manager
Large-Cap
Value | | Multi-Cap
Value | | Large-Cap
Value | | Small/Mid-Cap
Value | | Small-Cap
Value | | Value
Opportunities |
Purchases | | $ | 230,660,414 | | $ | 126,143,414 | | $ | 235,741,226 | | $ | 9,097,344 | | $ | 50,557,696 | | $ | 1,093,461,742 |
Sales and maturities | | | 247,628,728 | | | 231,028,159 | | | 21,629,657 | | | 5,778,271 | | | 62,205,174 | | | 647,979,665 |
6. Income Tax Information
The following information is presented on an income tax basis. Differences between amounts for financial statement and federal income tax purposes are primarily due to timing differences in recognizing certain gains and losses on investment transactions. To the extent that differences arise that are permanent in nature, such amounts are reclassified within the capital accounts as detailed below. Temporary differences do not require reclassification. Temporary and permanent differences do not impact the net asset values of the Funds.
At June 30, 2010, the cost and unrealized appreciation (depreciation) of investments, as determined on a federal income tax basis, were as follows:
| | | | | | | | | | | | | | | | | | | | | | | | |
| | | Multi-Manager
Large-Cap
Value | | | Multi-Cap
Value | | | Large-Cap
Value | | | Small/Mid-Cap
Value | | | Small-Cap
Value | | | Value
Opportunities | |
Cost of investments | | $ | 294,726,456 | | | $ | 393,925,710 | | | $ | 287,587,610 | | | $ | 10,087,111 | | | $ | 87,838,365 | | | $ | 1,837,535,946 | |
Gross unrealized: | | | | | | | | | | | | | | | | | | | | | | | | |
Appreciation | | $ | 26,694,370 | | | $ | 48,287,241 | | | $ | 7,368,846 | | | $ | 1,453,008 | | | $ | 10,618,285 | | | $ | 164,876,902 | |
Depreciation | | | (26,213,476 | ) | | | (70,529,830 | ) | | | (22,004,709 | ) | | | (525,765 | ) | | | (14,406,790 | ) | | | (79,995,092 | ) |
Net unrealized appreciation (depreciation) of investments | | $ | 480,894 | | | $ | (22,242,589 | ) | | $ | (14,635,863 | ) | | $ | 927,243 | | | $ | (3,788,505 | ) | | $ | 84,881,810 | |
Notes to Financial Statements (continued)
Permanent differences, primarily due to federal taxes paid, net operating losses, return of capital distribution, foreign currency reclassifications, adjustments for investments in passive foreign investment companies, and litigation proceeds, resulted in reclassifications among the Funds’ components of net assets at June 30, 2010, the Funds’ tax year-end, as follows:
| | | | | | | | | | | | | | | | | | | | | | | | |
| | | Multi-Manager
Large-Cap
Value | | | Multi-Cap
Value | | | Large-Cap
Value | | | Small/Mid-Cap
Value | | | Small-Cap
Value | | | Value
Opportunities | |
Capital paid-in | | $ | — | | | $ | (1,600,145 | ) | | $ | (6,207 | ) | | $ | (49,429 | ) | | $ | (257,591 | ) | | $ | 501,693 | |
Undistributed (Over-distribution of) net investment income | | | 830,322 | | | | 1,597,161 | | | | (531 | ) | | | 49,429 | | | | 257,265 | | | | (253,772 | ) |
Accumulated net realized gain (loss) | | | (830,322 | ) | | | 2,984 | | | | 6,738 | | | | — | | | | 326 | | | | (247,921 | ) |
The tax components of undistributed net ordinary income and net long-term capital gains at June 30, 2010, the Funds’ tax year end, were as follows:
| | | | | | | | | | | | | | | | | | |
| | | Multi-Manager
Large-Cap
Value | | Multi-Cap
Value | | Large-Cap
Value | | Small/Mid-Cap
Value | | Small-Cap
Value | | Value
Opportunities |
Undistributed net ordinary income* | | $ | 3,859,724 | | $ | — | | $ | 739,073 | | $ | — | | $ | — | | $ | 45,934,751 |
Undistributed net long-term capital gains | | | — | | | — | | | �� | | | — | | | — | | | — |
| * | Net ordinary income consists of net taxable income derived from dividends, interest, and net short-term capital gains, if any. |
The tax character of distributions paid during the Funds’ tax years ended June 30, 2010 and June 30, 2009, was designated for purposes of the dividends paid deduction as follows:
| | | | | | | | | | | | | | | | | | |
| 2010 | | Multi-Manager
Large-Cap
Value | | Multi-Cap
Value | | Large-Cap
Value | | Small/Mid-Cap
Value | | Small-Cap
Value | | Value
Opportunities |
Distributions from net ordinary income* | | $ | 5,598,084 | | $ | 673,015 | | $ | 165,020 | | $ | — | | $ | 195,735 | | $ | — |
Distributions from net long-term capital gains | | | — | | | — | | | — | | | — | | | — | | | — |
Return of capital | | | — | | | 368,431 | | | — | | | — | | | — | | | — |
| | | | | | | | | | | | | | | | | | |
| 2009 | | Multi-Manager
Large-Cap
Value | | Multi-Cap
Value | | Large-Cap
Value | | Small/Mid-Cap
Value | | Small-Cap
Value | | Value
Opportunities |
Distributions from net ordinary income* | | $ | 3,603,493 | | $ | — | | $ | 164,594 | | $ | — | | $ | — | | $ | 18,284,961 |
Distributions from net long-term capital gains | | | 29,127,927 | | | — | | | — | | | — | | | — | | | 15,316,459 |
Return of capital | | | — | | | — | | | — | | | — | | | — | | | — |
| * | Net ordinary income consists of net taxable income derived from dividends, interest, and net short-term capital gains, if any. |
At June 30, 2010, the Funds’ tax year end, the following Funds had unused capital loss carryforwards available for federal tax purposes to be applied against future capital gains, if any. If not applied, the carryforwards will expire as follows:
| | | | | | | | | | | | | | | |
| | | Multi-Manager
Large-Cap
Value | | Multi-Cap
Value | | Large-Cap
Value | | Small/Mid-Cap
Value | | Small-Cap
Value |
June 30, 2016 | | $ | — | | $ | 16,839,859 | | $ | — | | $ | 13,065,462 | | $ | 2,490,066 |
June 30, 2017 | | | 24,629,447 | | | 174,357,114 | | | 3,754,035 | | | 21,132,667 | | | 16,942,331 |
June 30, 2018 | | | 66,004,538 | | | 100,615,795 | | | — | | | 838,796 | | | 46,609,617 |
Total | | $ | 90,633,985 | | $ | 291,812,768 | | $ | 3,754,035 | | $ | 35,036,925 | | $ | 66,042,014 |
Small/Mid-Cap Value’s capital loss carryforward is subject to an annual limitation under the Internal Revenue Code and related regulations.
During the tax year ended June 30, 2010, the following Funds utilized their capital loss carryforwards as follows:
| | | | | | |
| | | Large-Cap
Value | | Value
Opportunities |
Capital loss carryforward utilized | | $ | 126,360 | | $ | 11,117,092 |
The following Funds have elected to defer net realized losses from investments incurred from November 1, 2009 through June 30, 2010, the Funds’ tax year end, (“post-October losses”) in accordance with federal income tax regulations. Post-October losses are treated as having arisen on the first day of the following fiscal year:
| | | | | | | | | |
| | | Multi-Manager
Large-Cap
Value | | Multi-Cap
Value | | Large-Cap
Value |
Post-October currency losses | | $ | 1,971 | | $ | 583 | | $ | 366 |
7. Management Fees and Other Transactions with Affiliates
Each Fund’s management fee is separated into two components – a fund-level fee, based only on the amount of assets within each individual Fund, and a complex-level fee, based on the aggregate amount of all fund assets managed by the Adviser. This pricing structure enables each Fund’s shareholders to benefit from growth in the assets within their respective Fund as well as from growth in the amount of complex-wide assets managed by the Adviser.
The annual fund-level fee for each Fund, payable monthly, is calculated according to the following schedule:
| | | | | | | | | | | | | | | | | | |
| Average Daily Net Assets | | Multi-Manager
Large-Cap
Value
Fund-Level
Fee Rate | | | Multi-Cap
Value
Fund-Level
Fee Rate | | | Large-Cap
Value
Fund-Level
Fee Rate | | | Small/Mid-Cap
Value
Fund-Level
Fee Rate | | | Small-Cap
Value
Fund-Level
Fee Rate | | | Value
Opportunities
Fund-Level
Fee Rate | |
For the first $125 million | | .5500 | % | | .6500 | % | | .6500 | % | | .7500 | % | | .8000 | % | | .8000 | % |
For the next $125 million | | .5375 | | | .6375 | | | .6375 | | | .7375 | | | .7875 | | | .7875 | |
For the next $250 million | | .5250 | | | .6250 | | | .6250 | | | .7250 | | | .7750 | | | .7750 | |
For the next $500 million | | .5125 | | | .6125 | | | .6125 | | | .7125 | | | .7625 | | | .7625 | |
For the next $1 billion | | .5000 | | | .6000 | | | .6000 | | | .7000 | | | .7500 | | | .7500 | |
For net assets over $2 billion | | .4750 | | | .5750 | | | .5750 | | | .6750 | | | .7250 | | | .7250 | |
The annual complex-level fee for each Fund, payable monthly, is calculated according to the following schedule:
| | | |
| Complex-Level Managed Asset Breakpoint Level* | | Effective Rate at Breakpoint Level | |
$55 billion | | .2000 | % |
$56 billion | | .1996 | |
$57 billion | | .1989 | |
$60 billion | | .1961 | |
$63 billion | | .1931 | |
$66 billion | | .1900 | |
$71 billion | | .1851 | |
$76 billion | | .1806 | |
$80 billion | | .1773 | |
$91 billion | | .1691 | |
$125 billion | | .1599 | |
$200 billion | | .1505 | |
$250 billion | | .1469 | |
$300 billion | | .1445 | |
| * | The complex-level fee is calculated based upon the aggregate daily managed assets of all Nuveen funds, with such daily managed assets defined separately for each fund in its management agreement, but excluding assets attributable to investments in other Nuveen funds. Daily managed assets include closed-end fund assets managed by the Adviser that are attributable to financial leverage. For these purposes, financial leverage includes the funds’ use of preferred stock and borrowings and certain investments in the residual interest certificates (also called inverse floating rate securities) in tender option bond (TOB) trusts, including the portion of assets held by a TOB trust that has been effectively financed by the trust’s issuance of floating rate securities, subject to an agreement by the Adviser to limit the amount of such assets for determining managed assets in certain circumstances. As of June 30, 2010, the complex-level fee rate was .1857%. |
The management fee compensates the Adviser for overall investment advisory and administrative services and general office facilities. The Adviser has entered into Sub-Advisory Agreements with HydePark, Symphony, ICAP, NWQ and Tradewinds (collectively the “Sub-Advisers”). The Sub-Advisers are compensated for their services to the Funds from the management fee paid to the Adviser.
The Adviser has agreed to waive fees and reimburse expenses (“Expense Cap”) of the following Funds so that total annual Fund operating expenses (excluding 12b-1 distribution and service fees, interest expenses, taxes, fees incurred in acquiring and disposing of portfolio securities and extraordinary expenses) do not exceed the average daily net assets of any class of Fund shares in the amounts and for the time periods stated in the following table.
| | | | | | | | |
| Fund | | Current/Temporary
Expense Cap | | | Current/Temporary
Expense Cap
Expiration Date | | Permanent
Expense Cap | |
Multi-Manager Large-Cap Value | | 0.95 | % | | October 31, 2010 | | 1.20 | % |
NWQ Large-Cap Value | | 1.10 | | | October 31, 2010 | | 1.35 | |
NWQ Small/Mid-Cap Value | | 1.20 | | | October 31, 2010 | | 1.45 | |
NWQ Small-Cap Value | | 1.25 | | | July 31, 2010 | | 1.50 | |
Tradewinds Value Opportunities | | 1.25 | | | October 31, 2009 | | 1.50 | |
Notes to Financial Statements (continued)
Effective July 1, 2010, each Fund’s annual fund-level fee has been lowered and Multi-Manager Large Cap Value’s, Large-Cap Value’s and Small/Mid-Cap Values Expense Cap has been modified. Effective July 1, 2010, each Fund’s annual fund-level fee and Expense Cap are as follows:
| | | | | | | | |
| Fund | | Current/Temporary
Expense Cap | | | Current/Temporary
Expense Cap
Expiration Date | | Permanent
Expense Cap | |
Multi-Manager Large-Cap Value | | 0.95 | % | | October 31, 2011 | | 1.20 | % |
NWQ Large-Cap Value | | 1.10 | | | October 31, 2011 | | 1.35 | |
NWQ Small/Mid-Cap Value | | 1.10 | | | October 31, 2011 | | 1.45 | |
NWQ Small-Cap Value | | 1.25 | | | July 31, 2010 | | 1.50 | |
Tradewinds Value Opportunities | | 1.50 | | | N/A | | 1.50 | |
| | | | | | | | | | | | | | | | | | |
| Average Daily Net Assets | | Multi-Manager
Large-Cap
Value
Fund-Level
Fee Rate | | | Multi-Cap
Value
Fund-Level
Fee Rate | | | Large-Cap
Value
Fund-Level
Fee Rate | | | Small/Mid-Cap
Value
Fund-Level
Fee Rate | | | Small-Cap
Value
Fund-Level
Fee Rate | | | Value
Opportunities
Fund-Level
Fee Rate | |
For the first $125 million | | .5500 | % | | .6300 | % | | .5500 | % | | .6000 | % | | .7500 | % | | .6300 | % |
For the next $125 million | | .5375 | | | .6175 | | | .5375 | | | .5875 | | | .7375 | | | .6175 | |
For the next $250 million | | .5250 | | | .6050 | | | .5250 | | | .5750 | | | .7250 | | | .6050 | |
For the next $500 million | | .5125 | | | .5925 | | | .5125 | | | .5625 | | | .7125 | | | .5925 | |
For the next $1 billion | | .5000 | | | .5800 | | | .5000 | | | .5500 | | | .7000 | | | .5800 | |
For net assets over $2 billion | | .4750 | | | .5550 | | | .4750 | | | .5250 | | | .6750 | | | .5550 | |
The Adviser may voluntarily reimburse expenses from time to time in any of the Funds. Voluntary reimbursements may be terminated at any time at the Adviser's discretion.
The Trust pays no compensation directly to those of its trustees who are affiliated with the Adviser or to its officers, all of whom receive remuneration for their services to the Trust from the Adviser or its affiliates. The Board of Trustees has adopted a deferred compensation plan for independent trustees that enables trustees to elect to defer receipt of all or a portion of the annual compensation they are entitled to receive from certain Nuveen advised funds. Under the plan, deferred amounts are treated as though equal dollar amounts had been invested in shares of select Nuveen advised funds.
During the fiscal year ended June 30, 2010, Nuveen Investments, LLC (the “Distributor”), a wholly-owned subsidiary of Nuveen, collected sales charges on purchases of Class A Shares, the majority of which were paid out as concessions to financial intermediaries as follows:
| | | | | | | | | | | | | | | | | | |
| | | Multi-Manager
Large-Cap
Value | | Multi-Cap
Value | | Large-Cap
Value | | Small/Mid-Cap
Value | | Small-Cap
Value | | Value
Opportunities |
Sales charges collected (Unaudited) | | $ | 25,283 | | $ | 43,212 | | $ | 61,530 | | $ | 7,632 | | $ | 8,021 | | $ | 1,906,705 |
Paid to financial intermediaries (Unaudited) | | | 22,135 | | | 38,179 | | | 55,652 | | | 7,100 | | | 6,981 | | | 1,684,725 |
The Distributor also received 12b-1 service fees on Class A Shares, substantially all of which were paid to compensate financial intermediaries for providing services to shareholders relating to their investments.
During the fiscal year ended June 30, 2010, the Distributor compensated financial intermediaries directly with commission advances at the time of purchase as follows:
| | | | | | | | | | | | | | | | | | |
| | | Multi-Manager
Large-Cap
Value | | Multi-Cap
Value | | Large-Cap
Value | | Small/Mid-Cap
Value | | Small-Cap
Value | | Value
Opportunities |
Commission advances (Unaudited) | | $ | 12,131 | | $ | 26,644 | | $ | 44,360 | | $ | 4,497 | | $ | 7,718 | | $ | 1,039,903 |
To compensate for commissions advanced to financial intermediaries, all 12b-1 service fees collected on Class B Shares during the first year following a purchase, all 12b-1 distribution fees collected on Class B Shares, and all 12b-1 service and distribution fees collected on Class C Shares during the first year following a purchase are retained by the Distributor. During the fiscal year ended June 30, 2010, the Distributor retained such 12b-1 fees as follows:
| | | | | | | | | | | | | | | | | | |
| | | Multi-Manager
Large-Cap
Value | | Multi-Cap
Value | | Large-Cap
Value | | Small/Mid-Cap
Value | | Small-Cap
Value | | Value
Opportunities |
12b-1 fees retained (Unaudited) | | $ | 32,253 | | $ | 190,901 | | $ | 21,532 | | $ | 673 | | $ | 9,840 | | $ | 635,163 |
The remaining 12b-1 fees charged to the Funds were paid to compensate financial intermediaries for providing services to shareholders relating to their investments.
The Distributor also collected and retained CDSC on share redemptions during the fiscal year ended June 30, 2010, as follows:
| | | | | | | | | | | | | | | | | | |
| | | Multi-Manager
Large-Cap
Value | | Multi-Cap
Value | | Large-Cap
Value | | Small/Mid-Cap Value | | Small-Cap
Value | | Value
Opportunities |
CDSC retained (Unaudited) | | $ | 3,692 | | $ | 75,650 | | $ | 2,479 | | $ | 220 | | $ | 1,298 | | $ | 48,838 |
At June 30, 2010, Nuveen owned shares of the Funds as follows:
| | | | | | | | | | | | |
| | | Multi-Manager
Large-Cap
Value | | Multi-Cap
Value | | Large-Cap
Value | | Small/Mid-Cap
Value | | Small-Cap
Value | | Value
Opportunities |
Class A | | 919 | | 84 | | — | | — | | — | | — |
Class B | | — | | 84 | | — | | N/A | | N/A | | — |
Class C | | 464 | | 84 | | — | | — | | — | | — |
Class R3 | | 6,803 | | 8,523 | | 3,281 | | 3,695 | | 2,767 | | 5,185 |
Class I | | 464 | | 84 | | — | | — | | — | | — |
8. New Accounting Standards
Fair Value Measurements
On January 21, 2010, FASB issued changes to the authoritative guidance under U.S. GAAP for fair value measurements. The objective of which is to provide guidance on how investment assets and liabilities are to be valued and disclosed. Specifically, the amendment requires reporting entities disclose Level 3 activity for purchases, sales, issuances and settlements in the Level 3 roll-forward on a gross basis rather than as one net number. The effective date of the amendment is for interim and annual periods beginning after December 15, 2010. At this time, management is evaluating the implications of this guidance and the impact it will have to the financial statement amounts and footnote disclosures, if any.
Financial Highlights
| | | | | | | | | | | | | | | | | | | | | | | | | | | | | |
| Selected data for a share outstanding throughout each period: | | | |
| | | | | | |
| Class (Commencement Date) | | | | | | | | | | | | | | | | | |
| | | | | Investment Operations | | | Less Distributions | | | |
| | | | | |
MULTI-MANAGER LARGE-CAP VALUE | | | | | | | | | | | | | | | |
| | | | | | | | |
Year Ended
June 30, | | Beginning
Net
Asset
Value | | Net
Invest-
ment
Income
(Loss)(a) | | Net
Realized/
Unrealized
Gain
(Loss) | | | Total | | | Net
Invest-
ment
Income | | | Capital
Gains | | | Total | | | Ending
Net
Asset
Value |
Class A (8/96) | | | | | | | | | | | | | | | | | | | | | | | | | | |
2010 | | $ | 14.23 | | $ | .16 | | $ | 2.02 | | | $ | 2.18 | | | $ | (.30 | ) | | $ | — | | | $ | (.30 | ) | | $ | 16.11 |
2009 | | | 22.53 | | | .29 | | | (6.82 | ) | | | (6.53 | ) | | | (.19 | ) | | | (1.58 | ) | | | (1.77 | ) | | | 14.23 |
2008 | | | 30.05 | | | .32 | | | (3.15 | ) | | | (2.83 | ) | | | (.30 | ) | | | (4.39 | ) | | | (4.69 | ) | | | 22.53 |
2007 | | | 27.23 | | | .35 | | | 5.33 | | | | 5.68 | | | | (.26 | ) | | | (2.60 | ) | | | (2.86 | ) | | | 30.05 |
2006 | | | 25.58 | | | .22 | | | 3.26 | | | | 3.48 | | | | (.23 | ) | | | (1.60 | ) | | | (1.83 | ) | | | 27.23 |
Class B (8/96) | | | | | | | | | | | | | | | | | | | | | | | | | | |
2010 | | | 13.84 | | | .04 | | | 1.96 | | | | 2.00 | | | | (.19 | ) | | | — | | | | (.19 | ) | | | 15.65 |
2009 | | | 21.90 | | | .18 | | | (6.63 | ) | | | (6.45 | ) | | | (.03 | ) | | | (1.58 | ) | | | (1.61 | ) | | | 13.84 |
2008 | | | 29.32 | | | .11 | | | (3.06 | ) | | | (2.95 | ) | | | (.08 | ) | | | (4.39 | ) | | | (4.47 | ) | | | 21.90 |
2007 | | | 26.64 | | | .12 | | | 5.21 | | | | 5.33 | | | | (.05 | ) | | | (2.60 | ) | | | (2.65 | ) | | | 29.32 |
2006 | | | 25.06 | | | .02 | | | 3.20 | | | | 3.22 | | | | (.04 | ) | | | (1.60 | ) | | | (1.64 | ) | | | 26.64 |
Class C (8/96) | | | | | | | | | | | | | | | | | | | | | | | | | | |
2010 | | | 13.80 | | | .04 | | | 1.96 | | | | 2.00 | | | | (.19 | ) | | | — | | | | (.19 | ) | | | 15.61 |
2009 | | | 21.86 | | | .17 | | | (6.62 | ) | | | (6.45 | ) | | | (.03 | ) | | | (1.58 | ) | | | (1.61 | ) | | | 13.80 |
2008 | | | 29.27 | | | .12 | | | (3.06 | ) | | | (2.94 | ) | | | (.08 | ) | | | (4.39 | ) | | | (4.47 | ) | | | 21.86 |
2007 | | | 26.60 | | | .13 | | | 5.19 | | | | 5.32 | | | | (.05 | ) | | | (2.60 | ) | | | (2.65 | ) | | | 29.27 |
2006 | | | 25.02 | | | .02 | | | 3.20 | | | | 3.22 | | | | (.04 | ) | | | (1.60 | ) | | | (1.64 | ) | | | 26.60 |
Class R3 (8/08) | | | | | | | | | | | | | | | | | | | | | | | | | | |
2010 | | | 14.31 | | | .12 | | | 2.03 | | | | 2.15 | | | | (.27 | ) | | | — | | | | (.27 | ) | | | 16.19 |
2009(e) | | | 22.05 | | | .23 | | | (6.25 | ) | | | (6.02 | ) | | | (.14 | ) | | | (1.58 | ) | | | (1.72 | ) | | | 14.31 |
Class I (8/96)(d) | | | | | | | | | | | | | | | | | | | | | | | | | | |
2010 | | | 14.28 | | | .21 | | | 2.03 | | | | 2.24 | | | | (.34 | ) | | | — | | | | (.34 | ) | | | 16.18 |
2009 | | | 22.64 | | | .33 | | | (6.87 | ) | | | (6.54 | ) | | | (.24 | ) | | | (1.58 | ) | | | (1.82 | ) | | | 14.28 |
2008 | | | 30.18 | | | .39 | | | (3.17 | ) | | | (2.78 | ) | | | (.37 | ) | | | (4.39 | ) | | | (4.76 | ) | | | 22.64 |
2007 | | | 27.33 | | | .43 | | | 5.35 | | | | 5.78 | | | | (.33 | ) | | | (2.60 | ) | | | (2.93 | ) | | | 30.18 |
2006 | | | 25.67 | | | .29 | | | 3.27 | | | | 3.56 | | | | (.30 | ) | | | (1.60 | ) | | | (1.90 | ) | | | 27.33 |
| | | | | | | | | | | | | | | | | | | |
| | | | | | |
| | | | | | | | | | | | | | | | | | | |
| | | | Ratios/Supplemental Data | |
| | | | | | Ratios to Average
Net Assets Before
Reimbursement | | | Ratios to Average
Net Assets After
Reimbursement(c) | | | | |
Total
Return(b) | | | Ending
Net
Assets
(000) | | Expenses | | | Net
Invest-
ment
Income
(Loss) | | | Expenses | | | Net
Invest-
ment
Income
(Loss) | | | Portfolio
Turnover
Rate | |
| | | | | | | | | | | | | | | | | | | |
| 15.19 | % | | $ | 254,730 | | 1.26 | % | | .91 | % | | 1.19 | % | | .97 | % | | 74 | % |
| (28.95 | ) | | | 239,210 | | 1.27 | | | 1.71 | | | 1.20 | | | 1.83 | | | 85 | |
| (10.74 | ) | | | 389,240 | | 1.24 | | | 1.20 | | | 1.21 | | | 1.23 | | | 131 | |
| 21.71 | | | | 491,489 | | 1.25 | | | 1.22 | | | 1.25 | | | 1.22 | | | 75 | |
| 13.97 | | | | 440,403 | | 1.28 | | | .83 | | | 1.28 | | | .83 | | | 81 | |
| | | | | | | | | | | | | | | | | | | |
| 14.26 | | | | 2,000 | | 2.01 | | | .16 | | | 1.94 | | | .23 | | | 74 | |
| (29.46 | ) | | | 3,033 | | 2.01 | | | .97 | | | 1.95 | | | 1.10 | | | 85 | |
| (11.39 | ) | | | 8,891 | | 1.99 | | | .43 | | | 1.96 | | | .46 | | | 131 | |
| 20.77 | | | | 18,491 | | 2.00 | | | .44 | | | 2.00 | | | .44 | | | 75 | |
| 13.13 | | | | 26,995 | | 2.03 | | | .08 | | | 2.03 | | | .08 | | | 81 | |
| | | | | | | | | | | | | | | | | | | |
| 14.37 | | | | 15,565 | | 2.01 | | | .16 | | | 1.94 | | | .22 | | | 74 | |
| (29.52 | ) | | | 15,803 | | 2.02 | | | .96 | | | 1.95 | | | 1.08 | | | 85 | |
| (11.41 | ) | | | 25,007 | | 1.99 | | | .45 | | | 1.96 | | | .48 | | | 131 | |
| 20.80 | | | | 31,219 | | 2.00 | | | .47 | | | 2.00 | | | .47 | | | 75 | |
| 13.15 | | | | 28,692 | | 2.03 | | | .08 | | | 2.03 | | | .08 | | | 81 | |
| | | | | | | | | | | | | | | | | | | |
| 14.88 | | | | 110 | | 1.50 | | | .66 | | | 1.44 | | | .72 | | | 74 | |
| (27.29 | ) | | | 97 | | 1.53 | * | | 1.55 | * | | 1.45 | * | | 1.63 | * | | 85 | |
| | | | | | | | | | | | | | | | | | | |
| 15.53 | | | | 22,950 | | 1.00 | | | 1.16 | | | .94 | | | 1.22 | | | 74 | |
| (28.83 | ) | | | 16,604 | | 1.02 | | | 1.95 | | | .95 | | | 2.08 | | | 85 | |
| (10.52 | ) | | | 23,684 | | .99 | | | 1.45 | | | .96 | | | 1.48 | | | 131 | |
| 22.03 | | | | 31,878 | | 1.00 | | | 1.48 | | | 1.00 | | | 1.48 | | | 75 | |
| 14.24 | | | | 25,720 | | 1.03 | | | 1.08 | | | 1.03 | | | 1.08 | | | 81 | |
| (a) | Per share Net Investment Income (Loss) is calculated using the average daily shares method. |
| (b) | Total return is the combination of changes in net asset value without any sales charge, reinvested dividend income at net asset value and reinvested capital gains distributions at net asset value, if any. Total returns are not annualized. |
| (c) | After expense reimbursement from the Adviser, where applicable. Ratios do not reflect the effect of custodian fee credits earned on the Fund’s net cash on deposit with the custodian bank, where applicable. |
| (d) | Effective May 1, 2008, Class R Shares were renamed Class I Shares. |
| (e) | For the period August 4, 2008 (commencement of operations) through June 30, 2009. |
See accompanying notes to financial statements.
Financial Highlights (continued)
| | | | | | | | | | | | | | | | | | | | | | | | | | | | | | | | | | |
| Selected data for a share outstanding throughout each period: | | | | | | | | | | | | | | | |
| | | | | | | |
| Class (Commencement Date) | | | | | | | | | | | | | | | | | | | | | |
| | | | | Investment Operations | | | Less Distributions | | | |
| | | | | | | | |
| MULTI-CAP VALUE | | | | | | | | | | | | | | | | | | | | | | | |
Year Ended
June 30, | | Beginning
Net
Asset
Value | | Net
Invest-
ment
Income
(Loss)(a) | | | Net
Realized/
Unrealized
Gain
(Loss) | | | Total | | | Net
Invest-
ment
Income | | | Capital
Gains | | | Tax
Return
of
Capital | | | Total | | | Ending
Net
Asset
Value |
Class A (12/02) | | | | | | | | | | | | | | | | | | | | | | | | | | | | | | | | | | |
2010 | | $ | 12.22 | | $ | (.06 | ) | | $ | 2.61 | | | $ | 2.55 | | | $ | (.03 | ) | | $ | — | | | $ | (.01 | ) | | $ | (.04 | ) | | $ | 14.73 |
2009 | | | 18.54 | | | .04 | | | | (6.36 | ) | | | (6.32 | ) | | | — | | | | — | | | | — | | | | — | | | | 12.22 |
2008 | | | 26.15 | | | .04 | | | | (6.62 | ) | | | (6.58 | ) | | | (.02 | ) | | | (.94 | ) | | | (.07 | ) | | | (1.03 | ) | | | 18.54 |
2007 | | | 23.81 | | | .18 | | | | 3.43 | | | | 3.61 | | | | (.13 | ) | | | (1.14 | ) | | | — | | | | (1.27 | ) | | | 26.15 |
2006 | | | 20.60 | | | .15 | | | | 3.42 | | | | 3.57 | | | | (.06 | ) | | | (.30 | ) | | | — | | | | (.36 | ) | | | 23.81 |
Class B (12/02) | | | | | | | | | | | | | | | | | | | | | | | | | | | | | | | | | | |
2010 | | | 11.84 | | | (.16 | ) | | | 2.53 | | | | 2.37 | | | | — | | | | — | | | | — | | | | — | | | | 14.21 |
2009 | | | 18.10 | | | (.06 | ) | | | (6.20 | ) | | | (6.26 | ) | | | — | | | | — | | | | — | | | | — | | | | 11.84 |
2008 | | | 25.64 | | | (.13 | ) | | | (6.47 | ) | | | (6.60 | ) | | | — | | | | (.94 | ) | | | — | | | | (.94 | ) | | | 18.10 |
2007 | | | 23.42 | | | (.01 | ) | | | 3.37 | | | | 3.36 | | | | — | | | | (1.14 | ) | | | — | | | | (1.14 | ) | | | 25.64 |
2006 | | | 20.37 | | | (.02 | ) | | | 3.37 | | | | 3.35 | | | | — | | | | (.30 | ) | | | — | | | | (.30 | ) | | | 23.42 |
Class C (12/02) | | | | | | | | | | | | | | | | | | | | | | | | | | | | | | | | | | |
2010 | | | 11.84 | | | (.16 | ) | | | 2.53 | | | | 2.37 | | | | — | | | | — | | | | — | | | | — | | | | 14.21 |
2009 | | | 18.10 | | | (.06 | ) | | | (6.20 | ) | | | (6.26 | ) | | | — | | | | — | | | | — | | | | — | | | | 11.84 |
2008 | | | 25.64 | | | (.13 | ) | | | (6.47 | ) | | | (6.60 | ) | | | — | | | | (.94 | ) | | | — | | | | (.94 | ) | | | 18.10 |
2007 | | | 23.42 | | | (.01 | ) | | | 3.37 | | | | 3.36 | | | | — | | | | (1.14 | ) | | | — | | | | (1.14 | ) | | | 25.64 |
2006 | | | 20.37 | | | (.02 | ) | | | 3.37 | | | | 3.35 | | | | — | | | | (.30 | ) | | | — | | | | (.30 | ) | | | 23.42 |
Class R3 (8/08) | | | | | | | | | | | | | | | | | | | | | | | | | | | | | | | | | | |
2010 | | | 12.16 | | | (.08 | ) | | | 2.59 | | | | 2.51 | | | | (.01 | ) | | | — | | | | — | ** | | | (.01 | ) | | | 14.66 |
2009(e) | | | 17.60 | | | .01 | | | | (5.45 | ) | | | (5.44 | ) | | | — | | | | — | | | | — | | | | — | | | | 12.16 |
Class I (11/97)(d) | | | | | | | | | | | | | | | | | | | | | | | | | | | | | | | | | | |
2010 | | | 12.22 | | | (.01 | ) | | | 2.60 | | | | 2.59 | | | | (.05 | ) | | | — | | | | (.02 | ) | | | (.07 | ) | | | 14.74 |
2009 | | | 18.50 | | | .07 | | | | (6.35 | ) | | | (6.28 | ) | | | — | | | | — | | | | — | | | | — | | | | 12.22 |
2008 | | | 26.09 | | | .09 | | | | (6.59 | ) | | | (6.50 | ) | | | (.02 | ) | | | (.94 | ) | | | (.13 | ) | | | (1.09 | ) | | | 18.50 |
2007 | | | 23.76 | | | .24 | | | | 3.42 | | | | 3.66 | | | | (.19 | ) | | | (1.14 | ) | | | — | | | | (1.33 | ) | | | 26.09 |
2006 | | | 20.55 | | | .20 | | | | 3.42 | | | | 3.62 | | | | (.11 | ) | | | (.30 | ) | | | — | | | | (.41 | ) | | | 23.76 |
| | | | | | | | | | | | | | | | | | | |
| | | | | | | | | | | | | | | | | | | |
| |
| | | | Ratios/Supplemental Data | |
| | | | |
| | | | | | Ratios to Average
Net Assets Before
Reimbursement | | | Ratios to Average
Net Assets After
Reimbursement(c) | | | | |
Total
Return(b) | | | Ending
Net
Assets
(000) | | Expenses | | | Net
Invest-
ment
Income
(Loss) | | | Expenses | | | Net
Invest-
ment
Income
(Loss) | | | Portfolio
Turnover
Rate | |
| | | | | | | | | | | | | | | | | | | |
| 20.85 | % | | $ | 61,514 | | 1.47 | % | | (.38 | )% | | 1.47 | % | | (.38 | )% | | 34 | % |
| (34.12 | ) | | | 76,785 | | 1.50 | | | .27 | | | 1.50 | | | .27 | | | 32 | |
| (25.65 | ) | | | 293,777 | | 1.33 | | | .17 | | | 1.33 | | | .17 | | | 25 | |
| 15.51 | | | | 634,123 | | 1.24 | | | .71 | | | 1.24 | | | .71 | | | 19 | |
| 17.45 | | | | 409,788 | | 1.33 | | | .65 | | | 1.33 | | | .65 | | | 9 | |
| | | | | | | | | | | | | | | | | | | |
| 20.02 | | | | 16,016 | | 2.21 | | | (1.12 | ) | | 2.21 | | | (1.12 | ) | | 34 | |
| (34.62 | ) | | | 16,599 | | 2.28 | | | (.46 | ) | | 2.28 | | | (.46 | ) | | 32 | |
| (26.20 | ) | | | 36,024 | | 2.08 | | | (.59 | ) | | 2.08 | | | (.59 | ) | | 25 | |
| 14.65 | | | | 75,067 | | 2.00 | | | (.04 | ) | | 2.00 | | | (.04 | ) | | 19 | |
| 16.57 | | | | 58,423 | | 2.08 | | | (.10 | ) | | 2.08 | | | (.10 | ) | | 9 | |
| | | | | | | | | | | | | | | | | | | |
| 20.02 | | | | 71,209 | | 2.21 | | | (1.13 | ) | | 2.21 | | | (1.13 | ) | | 34 | |
| (34.62 | ) | | | 78,225 | | 2.27 | | | (.46 | ) | | 2.27 | | | (.46 | ) | | 32 | |
| (26.20 | ) | | | 189,475 | | 2.08 | | | (.58 | ) | | 2.08 | | | (.58 | ) | | 25 | |
| 14.64 | | | | 441,048 | | 1.99 | | | (.04 | ) | | 1.99 | | | (.04 | ) | | 19 | |
| 16.57 | | | | 308,339 | | 2.08 | | | (.10 | ) | | 2.08 | | | (.10 | ) | | 9 | |
| | | | | | | | | | | | | | | | | | | |
| 20.62 | | | | 202 | | 1.65 | | | (.55 | ) | | 1.65 | | | (.55 | ) | | 34 | |
| (30.91 | ) | | | 104 | | 1.81 | * | | .12 | * | | 1.81 | * | | .12 | * | | 32 | |
| | | | | | | | | | | | | | | | | | | |
| 21.18 | | | | 222,707 | | 1.18 | | | (.08 | ) | | 1.18 | | | (.08 | ) | | 34 | |
| (33.95 | ) | | | 227,320 | | 1.29 | | | .55 | | | 1.29 | | | .55 | | | 32 | |
| (25.47 | ) | | | 274,886 | | 1.09 | | | .39 | | | 1.09 | | | .39 | | | 25 | |
| 15.77 | | | | 350,370 | | .99 | | | .96 | | | .99 | | | .96 | | | 19 | |
| 17.77 | | | | 212,033 | | 1.09 | | | .90 | | | 1.09 | | | .90 | | | 9 | |
| (a) | Per share Net Investment Income (Loss) is calculated using the average daily shares method. |
| (b) | Total return is the combination of changes in net asset value without any sales charge, reinvested dividend income at net asset value and reinvested capital gains distributions at net asset value, if any. Total returns are not annualized. |
| (c) | After expense reimbursement from the Adviser, where applicable. Ratios do not reflect the effect of custodian fee credits earned on the Fund’s net cash on deposit with the custodian bank, where applicable. |
| (d) | Effective May 1, 2008, Class R Shares were renamed Class I Shares. |
| (e) | For the period August 4, 2008 (commencement of operations) through June 30, 2009. |
| ** | Amount rounds to less than $.01 per share. |
See accompanying notes to financial statements.
Financial Highlights (continued)
| | | | | | | | | | | | | | | | | | | | | | | | | | | | | | |
| Selected data for a share outstanding throughout each period: | | | | | | | | | | | | | | | |
| | | | | | |
| Class (Commencement Date) | | | | | | | | | | | | | | | | | | |
| | | | | Investment Operations | | | Less Distributions | | | |
| | | | | | | |
| LARGE-CAP VALUE | | | | | | | | | | | | | | | | | | | | |
Year Ended
June 30, | | Beginning
Net
Asset
Value | | Net
Invest-
ment
Income (Loss)(a) | | | Net
Realized/
Unrealized
Gain (Loss) | | | Total | | | Net
Invest-
ment
Income | | | Capital
Gains | | | Total | | | Ending
Net
Asset
Value |
Class A (12/06) | | | | | | | | | | | | | | | | | | | | | | | | | | | |
2010 | | $ | 12.71 | | $ | .03 | | | $ | 1.99 | | | $ | 2.02 | | | $ | — | | | $ | — | | | $ | — | | | $ | 14.73 |
2009 | | | 17.41 | | | .10 | | | | (4.73 | ) | | | (4.63 | ) | | | (.07 | ) | | | — | | | | (.07 | ) | | | 12.71 |
2008 | | | 21.38 | | | .15 | | | | (4.04 | ) | | | (3.89 | ) | | | (.08 | ) | | | — | ** | | | (.08 | ) | | | 17.41 |
2007(e) | | | 20.00 | | | .12 | | | | 1.26 | | | | 1.38 | | | | — | | | | — | | | | — | | | | 21.38 |
Class B (12/06) | | | | | | | | | | | | | | | | | | | | | | | | | | | |
2010 | | | 12.60 | | | (.09 | ) | | | 1.97 | | | | 1.88 | | | | — | | | | — | | | | — | | | | 14.48 |
2009 | | | 17.28 | | | — | ** | | | (4.68 | ) | | | (4.68 | ) | | | — | | | | — | | | | — | | | | 12.60 |
2008 | | | 21.30 | | | — | ** | | | (4.02 | ) | | | (4.02 | ) | | | — | | | | — | ** | | | — | ** | | | 17.28 |
2007(e) | | | 20.00 | | | — | ** | | | 1.30 | | | | 1.30 | | | | — | | | | — | | | | — | | | | 21.30 |
Class C (12/06) | | | | | | | | | | | | | | | | | | | | | | | | | | | |
2010 | | | 12.60 | | | (.08 | ) | | | 1.97 | | | | 1.89 | | | | — | | | | — | | | | — | | | | 14.49 |
2009 | | | 17.28 | | | — | ** | | | (4.68 | ) | | | (4.68 | ) | | | — | | | | — | | | | — | | | | 12.60 |
2008 | | | 21.30 | | | — | ** | | | (4.02 | ) | | | (4.02 | ) | | | — | | | | — | ** | | | — | ** | | | 17.28 |
2007(e) | | | 20.00 | | | .02 | | | | 1.28 | | | | 1.30 | | | | — | | | | — | | | | — | | | | 21.30 |
Class R3 (9/09) | | | | | | | | | | | | | | | | | | | | | | | | | | | |
2010(f) | | | 15.24 | | | — | ** | | | (.53 | ) | | | (.53 | ) | | | — | | | | — | | | | — | | | | 14.71 |
Class I (12/06)(d) | | | | | | | | | | | | | | | | | | | | | | | | | | | |
2010 | | | 12.72 | | | .08 | | | | 1.97 | | | | 2.05 | | | | (.02 | ) | | | — | | | | (.02 | ) | | | 14.75 |
2009 | | | 17.43 | | | .12 | | | | (4.72 | ) | | | (4.60 | ) | | | (.11 | ) | | | — | | | | (.11 | ) | | | 12.72 |
2008 | | | 21.41 | | | .20 | | | | (4.05 | ) | | | (3.85 | ) | | | (.13 | ) | | | — | ** | | | (.13 | ) | | | 17.43 |
2007(e) | | | 20.00 | | | .15 | | | | 1.26 | | | | 1.41 | | | | — | | | | — | | | | — | | | | 21.41 |
| | | | | | | | | | | | | | | | | | | |
| | | | | | |
| | | | | | | | | | | | | | | | | | | |
| | | | Ratios/Supplemental Data | |
| | | | |
| | | | | | Ratios to Average
Net Assets Before
Reimbursement | | | Ratios to Average
Net Assets After
Reimbursement(c) | | | | |
Total
Return(b) | | | Ending
Net
Assets
(000) | | Expenses | | | Net
Invest-
ment
Income
(Loss) | | | Expenses | | | Net
Invest-
ment
Income
(Loss) | | | Portfolio
Turnover
Rate | |
| | | | | | | | | | | | | | | | | | | |
| 15.89 | % | | $ | 13,820 | | 1.32 | % | | .20 | % | | 1.32 | % | | .20 | % | | 15 | % |
| (26.57 | ) | | | 6,075 | | 1.61 | | | .49 | | | 1.35 | | | .76 | | | 16 | |
| (18.24 | ) | | | 5,080 | | 1.66 | | | .45 | | | 1.33 | | | .77 | | | 13 | |
| 6.90 | | | | 2,358 | | 3.12 | * | | (.84 | )* | | 1.33 | * | | .95 | * | | — | **** |
| | | | | | | | | | | | | | | | | | | |
| 14.92 | | | | 456 | | 2.07 | | | (.60 | ) | | 2.07 | | | (.60 | ) | | 15 | |
| (27.13 | ) | | | 405 | | 2.35 | | | (.22 | ) | | 2.10 | | | .03 | | | 16 | |
| (18.82 | ) | | | 835 | | 2.43 | | | (.34 | ) | | 2.08 | | | — | *** | | 13 | |
| 6.50 | | | | 281 | | 4.68 | * | | (2.66 | )* | | 2.08 | * | | (.06 | )* | | — | **** |
| | | | | | | | | | | | | | | | | | | |
| 15.00 | | | | 4,665 | | 2.07 | | | (.55 | ) | | 2.07 | | | (.55 | ) | | 15 | |
| (27.13 | ) | | | 2,217 | | 2.37 | | | (.25 | ) | | 2.10 | | | .02 | | | 16 | |
| (18.82 | ) | | | 2,484 | | 2.42 | | | (.33 | ) | | 2.08 | | | — | *** | | 13 | |
| 6.50 | | | | 1,117 | | 3.83 | * | | (1.62 | )* | | 2.08 | * | | .13 | * | | — | **** |
| | | | | | | | | | | | | | | | | | | |
| (3.48 | ) | | | 48 | | 1.58 | * | | (.02 | )* | | 1.58 | * | | (.02 | )* | | 15 | |
| | | | | | | | | | | | | | | | | | | |
| 16.13 | | | | 253,558 | | 1.08 | | | .53 | | | 1.08 | | | .53 | | | 15 | |
| (26.35 | ) | | | 52,618 | | 1.36 | | | .71 | | | 1.10 | | | .97 | | | 16 | |
| (18.05 | ) | | | 15,719 | | 1.40 | | | .71 | | | 1.08 | | | 1.02 | | | 13 | |
| 7.05 | | | | 8,513 | | 2.65 | * | | (.32 | )* | | 1.08 | * | | 1.25 | * | | — | **** |
| (a) | Per share Net Investment Income (Loss) is calculated using the average daily shares method. |
| (b) | Total return is the combination of changes in net asset value without any sales charge, reinvested dividend income at net asset value and reinvested capital gains distributions at net asset value, if any. Total returns are not annualized. |
| (c) | After expense reimbursement from the Adviser, where applicable. Ratios do not reflect the effect of custodian fee credits earned on the Fund’s net cash on deposit with the custodian bank, where applicable. |
| (d) | Effective May 1, 2008, Class R Shares were renamed Class I Shares. |
| (e) | For the period December 15, 2006 (commencement of operations) through June 30, 2007. |
| (f) | For the period September 29, 2009 (commencement of operations) through June 30, 2010. |
| ** | Rounds to less than $.01 per share. |
| *** | Rounds to less than .01%. |
| **** | Rounds to less than 1%. |
See accompanying notes to financial statements.
Financial Highlights (continued)
| | | | | | | | | | | | | | | | | | | | | | | | | | | | | |
| Selected data for a share outstanding throughout each period: | | | | | | | | | | | | | | |
| | | | | | |
| Class (Commencement Date) | | | | | | | | | | | | | | | | | |
| | | | | Investment Operations | | | Less Distributions | | | |
| | | | | | | |
| SMALL/MID-CAP VALUE | | | | | | | | | | | | | | | | | | | |
Year Ended
June 30, | | Beginning
Net
Asset
Value | | Net
Invest-
ment
Income
(Loss)(a) | | | Net
Realized/
Unrealized
Gain (Loss) | | | Total | | | Net
Invest-
ment
Income | | | Capital
Gains | | Total | | | Ending
Net
Asset
Value |
Class A (12/06) | | | | | | | | | | | | | | | | | | | | | | | | | | |
2010 | | $ | 11.05 | | $ | (.09 | ) | | $ | 3.36 | | | $ | 3.27 | | | $ | — | | | $ | — | | $ | — | | | $ | 14.32 |
2009 | | | 17.12 | | | — | ** | | | (6.07 | ) | | | (6.07 | ) | | | — | | | | — | | | — | | | | 11.05 |
2008 | | | 21.37 | | | (.09 | ) | | | (4.16 | ) | | | (4.25 | ) | | | — | ** | | | — | | | — | ** | | | 17.12 |
2007(e) | | | 20.00 | | | .15 | | | | 1.22 | | | | 1.37 | | | | — | | | | — | | | — | | | | 21.37 |
Class C (12/06) | | | | | | | | | | | | | | | | | | | | | | | | | | |
2010 | | | 10.83 | | | (.19 | ) | | | 3.29 | | | | 3.10 | | | | — | | | | — | | | — | | | | 13.93 |
2009 | | | 16.92 | | | (.07 | ) | | | (6.02 | ) | | | (6.09 | ) | | | — | | | | — | | | — | | | | 10.83 |
2008 | | | 21.28 | | | (.22 | ) | | | (4.14 | ) | | | (4.36 | ) | | | — | | | | — | | | — | | | | 16.92 |
2007(e) | | | 20.00 | | | .05 | | | | 1.23 | | | | 1.28 | | | | — | | | | — | | | — | | | | 21.28 |
Class R3 (9/09) | | | | | | | | | | | | | | | | | | | | | | | | | | |
2010(f) | | | 13.53 | | | (.09 | ) | | | .75 | | | | .66 | | | | — | | | | — | | | — | | | | 14.19 |
Class I (12/06)(d) | | | | | | | | | | | | | | | | | | | | | | | | | | |
2010 | | | 10.96 | | | (.05 | ) | | | 3.33 | | | | 3.28 | | | | — | | | | — | | | — | | | | 14.24 |
2009 | | | 17.11 | | | (.01 | ) | | | (6.14 | ) | | | (6.15 | ) | | | — | | | | — | | | — | | | | 10.96 |
2008 | | | 21.41 | | | (.04 | ) | | | (4.21 | ) | | | (4.25 | ) | | | (.05 | ) | | | — | | | (.05 | ) | | | 17.11 |
2007(e) | | | 20.00 | | | .49 | | | | .92 | | | | 1.41 | | | | — | | | | — | | | — | | | | 21.41 |
| | | | | | | | | | | | | | | | | | | |
| | | | | | | | | | | | | | | | | | | |
| |
| | | | Ratios/Supplemental Data | |
| | | | | | Ratios to Average
Net Assets Before
Reimbursement | | | Ratios to Average
Net Assets After
Reimbursement(c) | | | | |
Total
Return(b) | | | Ending
Net
Assets
(000) | | Expenses | | | Net
Invest-
ment
Income
(Loss) | | | Expenses | | | Net
Invest-
ment
Income
(Loss) | | | Portfolio
Turnover
Rate | |
| | | | | | | | | | | | | | | | | | | |
| 29.50 | % | | $ | 3,267 | | 2.32 | % | | (1.51 | )% | | 1.44 | % | | (.63 | )% | | 64 | % |
| (35.34 | ) | | | 1,382 | | 3.03 | | | (1.60 | ) | | 1.45 | | | (.02 | ) | | 204 | |
| (20.02 | )*** | | | 3,595 | | 1.65 | | | (.70 | ) | | 1.43 | | | (.49 | ) | | 84 | |
| 6.85 | | | | 1,098 | | 2.54 | * | | .23 | * | | 1.43 | * | | 1.34 | * | | 1 | |
| | | | | | | | | | | | | | | | | | | |
| 28.53 | | | | 636 | | 3.11 | | | (2.29 | ) | | 2.19 | | | (1.37 | ) | | 64 | |
| (35.88 | ) | | | 610 | | 4.11 | | | (2.50 | ) | | 2.20 | | | (.59 | ) | | 204 | |
| (20.63 | )*** | | | 1,093 | | 2.39 | | | (1.40 | ) | | 2.18 | | | (1.20 | ) | | 84 | |
| 6.40 | | | | 974 | | 3.22 | * | | (.65 | )* | | 2.18 | * | | .39 | * | | 1 | |
| | | | | | | | | | | | | | | | | | | |
| 4.88 | | | | 52 | | 2.54 | * | | (1.67 | )* | | 1.69 | * | | (.81 | )* | | 64 | |
| | | | | | | | | | | | | | | | | | | |
| 29.93 | | | | 7,279 | | 2.09 | | | (1.26 | ) | | 1.19 | | | (.36 | ) | | 64 | |
| (35.98 | ) | | | 3,792 | | 1.44 | | | (.33 | ) | | 1.20 | | | (.08 | ) | | 204 | |
| (19.82 | )*** | | | 38,574 | | 1.16 | | | (.20 | ) | | 1.16 | | | (.20 | ) | | 84 | |
| 7.05 | | | | 216,872 | | 1.49 | * | | 3.93 | * | | 1.16 | * | | 4.25 | * | | 1 | |
| (a) | Per share Net Investment Income (Loss) is calculated using the average daily shares method. |
| (b) | Total return is the combination of changes in net asset value without any sales charge, reinvested dividend income at net asset value and reinvested capital gains distributions at net asset value, if any. Total returns are not annualized. |
| (c) | After expense reimbursement from the Adviser, where applicable. Ratios do not reflect the effect of custodian fee credits earned on the Fund’s net cash on deposit with the custodian bank, where applicable. |
| (d) | Effective May 1, 2008, Class R Shares were renamed Class I Shares. |
| (e) | For the period December 15, 2006 (commencement of operations) through June 30, 2007. |
| (f) | For the period September 29, 2009 (commencement of operations) through June 30, 2010. |
| ** | Rounds to less than $.01 per share. |
| *** | During the year ended June 30, 2008, the Adviser reimbursed the Fund $89,561 for a cash balance maintained in the Fund. This reimbursement resulted in an increase of .23%, .28%, ..19% and .14% to Classes A, B, C and I, respectively. |
See accompanying notes to financial statements.
Financial Highlights (continued)
| | | | | | | | | | | | | | | | | | | | | | | | | | | | | | | | | | |
| Selected data for a share outstanding throughout each period: | | | | | | | | | | | | | | | |
| | | | | | | |
| Class (Commencement Date) | | | | | | | | | | | | | | | | | | | | | |
| | | | | Investment Operations | | | Less Distributions | | | |
| | | | | | | | |
| SMALL-CAP VALUE | | | | | | | | | | | | | | | | | | | | | | | |
Year Ended
June 30, | | Beginning
Net
Asset
Value | | Net
Invest-
ment
Income
(Loss)(a) | | | Net
Realized/
Unrealized
Gain
(Loss) | | | Total | | | Net
Invest-
ment
Income | | | Capital
Gains | | | Tax
Return
of
Capital | | | Total | | | Ending
Net
Asset
Value |
Class A (12/04) | | | | | | | | | | | | | | | | | | | | | | | | | | | | | | | |
2010 | | $ | 14.14 | | $ | (.10 | ) | | $ | 4.27 | | | $ | 4.17 | | | $ | (.01 | ) | | $ | — | | | $ | — | | | $ | (.01 | ) | | $ | 18.30 |
2009 | | | 23.29 | | | .02 | | | | (9.17 | ) | | | (9.15 | ) | | | — | | | | — | | | | — | | | | — | | | | 14.14 |
2008 | | | 30.12 | | | (.04 | ) | | | (6.08 | ) | | | (6.12 | ) | | | (.02 | ) | | | (.69 | ) | | | — | ** | | | (.71 | ) | | | 23.29 |
2007 | | | 26.10 | | | .13 | | | | 4.05 | | | | 4.18 | | | | (.04 | ) | | | (.12 | ) | | | — | | | | (.16 | ) | | | 30.12 |
2006 | | | 20.84 | | | .13 | | | | 5.48 | | | | 5.61 | | | | (.08 | ) | | | (.27 | ) | | | — | | | | (.35 | ) | | | 26.10 |
Class C (12/04) | | | | | | | | | | | | | | | | | | | | | | | | | | | | | | | |
2010 | | | 13.76 | | | (.21 | ) | | | 4.13 | | | | 3.92 | | | | — | | | | — | | | | — | | | | — | | | | 17.68 |
2009 | | | 22.83 | | | (.11 | ) | | | (8.96 | ) | | | (9.07 | ) | | | — | | | | — | | | | — | | | | — | | | | 13.76 |
2008 | | | 29.73 | | | (.23 | ) | | | (5.98 | ) | | | (6.21 | ) | | | — | | | | (.69 | ) | | | — | | | | (.69 | ) | | | 22.83 |
2007 | | | 25.91 | | | (.08 | ) | | | 4.02 | | | | 3.94 | | | | — | | | | (.12 | ) | | | — | | | | (.12 | ) | | | 29.73 |
2006 | | | 20.76 | | | (.07 | ) | | | 5.49 | | | | 5.42 | | | | — | | | | (.27 | ) | | | — | | | | (.27 | ) | | | 25.91 |
Class R3 (9/09) | | | | | | | | | | | | | | | | | | | | | | | | | | | | | | | |
2010(e) | | | 18.07 | | | (.08 | ) | | | .38 | | | | .30 | | | | — | | | | — | | | | — | | | | — | | | | 18.37 |
Class I (12/04)(d) | | | | | | | | | | | | | | | | | | | | | | | | | | | | | | | |
2010 | | | 14.21 | | | (.04 | ) | | | 4.28 | | | | 4.24 | | | | (.05 | ) | | | — | | | | — | | | | (.05 | ) | | | 18.40 |
2009 | | | 23.34 | | | .05 | | | | (9.18 | ) | | | (9.13 | ) | | | — | | | | — | | | | — | | | | — | | | | 14.21 |
2008 | | | 30.18 | | | .02 | | | | (6.08 | ) | | | (6.06 | ) | | | (.08 | ) | | | (.69 | ) | | | (.01 | ) | | | (.78 | ) | | | 23.34 |
2007 | | | 26.15 | | | .23 | | | | 4.03 | | | | 4.26 | | | | (.11 | ) | | | (.12 | ) | | | — | | | | (.23 | ) | | | 30.18 |
2006 | | | 20.87 | | | .16 | | | | 5.52 | | | | 5.68 | | | | (.13 | ) | | | (.27 | ) | | | — | | | | (.40 | ) | | | 26.15 |
| | | | | | | | | | | | | | | | | | | |
| | | | | | | | | | | | | | | | | | | |
| |
| | | | Ratios/Supplemental Data | |
| | | | |
| | | | | | Ratios to Average
Net Assets Before
Reimbursement | | | Ratios to Average
Net Assets After
Reimbursement(c) | | | | |
Total
Return(b) | | | Ending
Net
Assets
(000) | | Expenses | | | Net
Invest-
ment
Income
(Loss) | | | Expenses | | | Net
Invest-
ment
Income
(Loss) | | | Portfolio
Turnover
Rate | |
| | | | | | | | | | | | | | | | | | | |
| 29.41 | % | | $ | 7,009 | | 1.47 | % | | (.56 | )% | | 1.45 | % | | (.54 | )% | | 58 | % |
| (39.29 | ) | | | 7,733 | | 1.46 | | | .13 | | | 1.46 | | | .13 | | | 71 | |
| (20.41 | ) | | | 54,264 | | 1.47 | | | (.16 | ) | | 1.47 | | | (.16 | ) | | 48 | |
| 16.09 | | | | 78,081 | | 1.50 | | | .44 | | | 1.49 | | | .46 | | | 24 | |
| 27.08 | *** | | | 33,907 | | 1.95 | | | (.02 | ) | | 1.42 | | | .51 | | | 26 | |
| | | | | | | | | | | | | | | | | | | |
| 28.42 | | | | 3,494 | | 2.21 | | | (1.23 | ) | | 2.19 | | | (1.21 | ) | | 58 | |
| (39.70 | ) | | | 3,446 | | 2.23 | | | (.70 | ) | | 2.23 | | | (.70 | ) | | 71 | |
| (21.03 | ) | | | 9,682 | | 2.22 | | | (.91 | ) | | 2.22 | | | (.91 | ) | | 48 | |
| 15.26 | | | | 17,290 | | 2.25 | | | (.31 | ) | | 2.24 | | | (.30 | ) | | 24 | |
| 26.22 | *** | | | 7,244 | | 2.73 | | | (.86 | ) | | 2.17 | | | (.30 | ) | | 26 | |
| | | | | | | | | | | | | | | | | | | |
| 1.60 | | | | 51 | | 1.68 | * | | (.57 | )* | | 1.68 | * | | (.57 | )* | | 58 | |
| | | | | | | | | | | | | | | | | | | |
| 29.74 | | | | 74,824 | | 1.21 | | | (.23 | ) | | 1.19 | | | (.21 | ) | | 58 | |
| (39.12 | ) | | | 62,423 | | 1.24 | | | .29 | | | 1.24 | | | .29 | | | 71 | |
| (20.22 | ) | | | 108,064 | | 1.22 | | | .08 | | | 1.22 | | | .08 | | | 48 | |
| 16.41 | | | | 132,385 | | 1.22 | | | .81 | | | 1.22 | | | .81 | | | 24 | |
| 27.41 | *** | | | 13,137 | | 1.73 | | | .07 | | | 1.17 | | | .63 | | | 26 | |
| (a) | Per share Net Investment Income (Loss) is calculated using the average daily shares method. |
| (b) | Total return is the combination of changes in net asset value without any sales charge, reinvested dividend income at net asset value and reinvested capital gains distributions at net asset value, if any. Total returns are not annualized. |
| (c) | After expense reimbursement from the Adviser, where applicable. Ratios do not reflect the effect of custodian fee credits earned on the Fund’s net cash on deposit with the custodian bank, where applicable. |
| (d) | Effective May 1, 2008, Class R Shares were renamed Class I Shares. |
| (e) | For the period September 29, 2009 (commencement of operations) through June 30, 2010. |
| ** | Rounds to less than $.01 per share. |
| *** | During the year ended June 30, 2006, NWQ reimbursed the Fund $9,060 for a cash balance maintained in the Fund. This reimbursement did not have an impact on the Fund’s Class A total return, but resulted in an increase of .05% in each of the total returns for Classes B, C and I. |
See accompanying notes to financial statements.
Financial Highlights (continued)
| | | | | | | | | | | | | | | | | | | | | | | | | | | | | | |
| Selected data for a share outstanding throughout each period: | | | | | | | | | | | | |
| | | | | | | |
| Class (Inception Date) | | | | | | | | | | | | | | | | | | | | |
| | | | | Investment Operations
| | | Less Distributions | | | |
| | | | | |
| VALUE OPPORTUNITIES | | | | | | | | | | | | | | | |
Year Ended
June 30, | | Beginning
Net
Asset
Value | | Net
Invest-
ment
Income
(Loss)(a) | | | Net
Realized/
Unrealized
Gain (Loss) | | | Total | | | Net
Invest-
ment
Income | | | Capital
Gains | | | Total | | | Ending
Net
Asset
Value |
Class A (12/04) | | | | | | | | | | | | | | | | | | | | | | | | | | | |
2010 | | $ | 24.17 | | $ | .13 | | | $ | 5.46 | | | $ | 5.59 | | | $ | — | | | $ | — | | | $ | — | | | $ | 29.76 |
2009 | | | 29.60 | | | .20 | | | | (4.53 | ) | | | (4.33 | ) | | | (.05 | ) | | | (1.05 | ) | | | (1.10 | ) | | | 24.17 |
2008 | | | 32.48 | | | .20 | | | | (1.03 | ) | | | (.83 | ) | | | (.59 | ) | | | (1.46 | ) | | | (2.05 | ) | | | 29.60 |
2007 | | | 26.90 | | | .30 | | | | 5.83 | | | | 6.13 | | | | (.29 | ) | | | (.26 | ) | | | (.55 | ) | | | 32.48 |
2006 | | | 21.07 | | | .28 | | | | 5.88 | | | | 6.16 | | | | (.07 | ) | | | (.26 | ) | | | (.33 | ) | | | 26.90 |
Class B (12/04) | | | | | | | | | | | | | | | | | | | | | | | | | | | |
2010 | | | 23.78 | | | (.09 | ) | | | 5.38 | | | | 5.29 | | | | — | | | | — | | | | — | | | | 29.07 |
2009 | | | 29.29 | | | .03 | | | | (4.49 | ) | | | (4.46 | ) | | | — | | | | (1.05 | ) | | | (1.05 | ) | | | 23.78 |
2008 | | | 32.15 | | | (.03 | ) | | | (1.02 | ) | | | (1.05 | ) | | | (.35 | ) | | | (1.46 | ) | | | (1.81 | ) | | | 29.29 |
2007 | | | 26.66 | | | .07 | | | | 5.76 | | | | 5.83 | | | | (.08 | ) | | | (.26 | ) | | | (.34 | ) | | | 32.15 |
2006 | | | 20.98 | | | .09 | | | | 5.85 | | | | 5.94 | | | | — | | | | (.26 | ) | | | (.26 | ) | | | 26.66 |
Class C (12/04) | | | | | | | | | | | | | | | | | | | | | | | | | | | |
2010 | | | 23.77 | | | (.09 | ) | | | 5.38 | | | | 5.29 | | | | — | | | | — | | | | — | | | | 29.06 |
2009 | | | 29.29 | | | .03 | | | | (4.50 | ) | | | (4.47 | ) | | | — | | | | (1.05 | ) | | | (1.05 | ) | | | 23.77 |
2008 | | | 32.16 | | | (.03 | ) | | | (1.03 | ) | | | (1.06 | ) | | | (.35 | ) | | | (1.46 | ) | | | (1.81 | ) | | | 29.29 |
2007 | | | 26.66 | | | .07 | | | | 5.77 | | | | 5.84 | | | | (.08 | ) | | | (.26 | ) | | | (.34 | ) | | | 32.16 |
2006 | | | 20.98 | | | .08 | | | | 5.86 | | | | 5.94 | | | | — | | | | (.26 | ) | | | (.26 | ) | | | 26.66 |
Class R3 (8/08) | | | | | | | | | | | | | | | | | | | | | | | | | | | |
2010 | | | 24.23 | | | .07 | | | | 5.46 | | | | 5.53 | | | | — | | | | — | | | | — | | | | 29.76 |
2009(e) | | | 28.93 | | | .15 | | | | (3.80 | ) | | | (3.65 | ) | | | — | | | | (1.05 | ) | | | (1.05 | ) | | | 24.23 |
Class I (12/04)(d) | | | | | | | | | | | | | | | | | | | | | | | | | | | |
2010 | | | 24.19 | | | .20 | | | | 5.48 | | | | 5.68 | | | | — | | | | — | | | | — | | | | 29.87 |
2009 | | | 29.66 | | | .26 | | | | (4.57 | ) | | | (4.31 | ) | | | (.11 | ) | | | (1.05 | ) | | | (1.16 | ) | | | 24.19 |
2008 | | | 32.54 | | | .28 | | | | (1.03 | ) | | | (.75 | ) | | | (.67 | ) | | | (1.46 | ) | | | (2.13 | ) | | | 29.66 |
2007 | | | 26.95 | | | .39 | | | | 5.82 | | | | 6.21 | | | | (.36 | ) | | | (.26 | ) | | | (.62 | ) | | | 32.54 |
2006 | | | 21.09 | | | .31 | | | | 5.93 | | | | 6.24 | | | | (.12 | ) | | | (.26 | ) | | | (.38 | ) | | | 26.95 |
| | | | | | | | | | | | | | | | | | | |
| | | | | | |
| | | | | | | | | | | | | | | | | | | |
| | | | Ratios/Supplemental Data | |
| | | | | | Ratios to Average
Net Assets Before
Reimbursement | | | Ratios to Average
Net Assets After
Reimbursement(c) | | | | |
Total
Return(b) | | | Ending
Net
Assets
(000) | | Expenses | | | Net
Invest-
ment
Income
(Loss) | | | Expenses | | | Net
Invest-
ment
Income
(Loss) | | | Portfolio
Turnover
Rate | |
| | | | | | | | | | | | | | | | | | | |
| 23.13 | % | | $ | 658,037 | | 1.43 | % | | .44 | % | | 1.43 | % | | .44 | % | | 48 | % |
| (13.47 | ) | | | 378,845 | | 1.48 | | | .89 | | | 1.48 | | | .89 | | | 61 | |
| (2.65 | ) | | | 368,093 | | 1.42 | | | .63 | | | 1.42 | | | .63 | | | 48 | |
| 22.98 | | | | 248,827 | | 1.39 | | | .99 | | | 1.39 | | | .99 | | | 23 | |
| 29.45 | | | | 73,389 | | 1.63 | | | .94 | | | 1.49 | | | 1.09 | | | 29 | |
| | | | | | | | | | | | | | | | | | | |
| 22.25 | | | | 5,801 | | 2.17 | | | (.32 | ) | | 2.17 | | | (.32 | ) | | 48 | |
| (14.10 | ) | | | 5,080 | | 2.22 | | | .14 | | | 2.22 | | | .14 | | | 61 | |
| (3.39 | ) | | | 6,816 | | 2.17 | | | (.11 | ) | | 2.17 | | | (.11 | ) | | 48 | |
| 22.04 | | | | 5,521 | | 2.14 | | | .24 | | | 2.14 | | | .24 | | | 23 | |
| 28.49 | | | | 1,041 | | 2.40 | | | .16 | | | 2.24 | | | .33 | | | 29 | |
| | | | | | | | | | | | | | | | | | | |
| 22.25 | | | | 192,332 | | 2.19 | | | (.31 | ) | | 2.19 | | | (.31 | ) | | 48 | |
| (14.14 | ) | | | 98,742 | | 2.22 | | | .14 | | | 2.22 | | | .14 | | | 61 | |
| (3.39 | ) | | | 116,463 | | 2.17 | | | (.10 | ) | | 2.17 | | | (.10 | ) | | 48 | |
| 22.04 | | | | 100,295 | | 2.14 | | | .24 | | | 2.14 | | | .24 | | | 23 | |
| 28.49 | | | | 22,102 | | 2.40 | | | .15 | | | 2.24 | | | .31 | | | 29 | |
| | | | | | | | | | | | | | | | | | | |
| 22.82 | | | | 1,444 | | 1.71 | | | .22 | | | 1.71 | | | .22 | | | 48 | |
| (11.47 | ) | | | 414 | | 1.76 | * | | .73 | * | | 1.75 | * | | .75 | * | | 61 | |
| | | | | | | | | | | | | | | | | | | |
| 23.48 | | | | 1,046,939 | | 1.18 | | | .69 | | | 1.18 | | | .69 | | | 48 | |
| (13.29 | ) | | | 580,149 | | 1.24 | | | 1.19 | | | 1.23 | | | 1.20 | | | 61 | |
| (2.39 | ) | | | 278,649 | | 1.17 | | | .89 | | | 1.17 | | | .89 | | | 48 | |
| 23.30 | | | | 161,284 | | 1.14 | | | 1.28 | | | 1.14 | | | 1.28 | | | 23 | |
| 29.80 | | | | 37,393 | | 1.48 | | | .98 | | | 1.24 | | | 1.22 | | | 29 | |
| (a) | Per share Net Investment Income (Loss) is calculated using the average daily shares method. |
| (b) | Total return is the combination of changes in net asset value without any sales charge, reinvested dividend income at net asset value and reinvested capital gains distributions at net asset value, if any. Total returns are not annualized. |
| (c) | After expense reimbursement from the Adviser, where applicable. Ratios do not reflect the effect of custodian fee credits earned on the Fund’s net cash on deposit with the custodian bank, where applicable. |
| (d) | Effective May 1, 2008, Class R Shares were renamed Class I Shares. |
| (e) | For the period August 4, 2008 (commencement of operations) through June 30, 2009. |
See accompanying notes to financial statements.
Trustees and Officers
The management of the Funds, including general supervision of the duties performed for the Funds by the Adviser, is the responsibility of the Board of Trustees of the Funds. The number of trustees of the Funds is currently set at nine. None of the trustees who are not “interested” persons of the Funds (referred to herein as “independent trustees”) has ever been a director or employee of, or consultant to, Nuveen or its affiliates. The names and business addresses of the trustees and officers of the Funds, their principal occupations and other affiliations during the past five years, the number of portfolios each oversees and other directorships they hold are set forth below.
The Funds’ Statement of Additional Information (“SAI”) includes more information about the trustees. To request a free copy, call Nuveen Investments at (800) 257-8787 or visit the Funds’ website at www.nuveen.com.
| | | | | | | | |
Name, Birthdate and Address | | Position(s) Held with the Funds | | Year First Elected or Appointed (1) | | Principal Occupation(s) Including other Directorships During Past 5 Years | | Number of Portfolios in Fund Complex Overseen by Trustee |
| | |
| Independent Trustees: | | | | |
Robert P. Bremner (2) 8/22/40 333 W. Wacker Drive Chicago, IL 60606 | | Chairman of the Board and Trustee | | 1996 | | Private Investor and Management Consultant; Treasurer and Director, Humanities Council of Washington, D.C. | | 200 |
Jack B. Evans 10/22/48 333 W. Wacker Drive Chicago, IL 60606 | | Trustee | | 1999 | | President, The Hall-Perrine Foundation, a private philanthropic corporation (since 1996); Director and Chairman, United Fire Group, a publicly held company; President Pro Tem of the Board of Regents for the State of Iowa University System; Director, Gazette Companies; Life Trustee of Coe College and the Iowa College Foundation; formerly, Director, Alliant Energy; formerly, Director, Federal Reserve Bank of Chicago; formerly, President and Chief Operating Officer, SCI Financial Group, Inc., a regional financial services firm. | | 200 |
William C. Hunter 3/6/48 333 W. Wacker Drive Chicago, IL 60606 | | Trustee | | 2004 | | Dean, Tippie College of Business, University of Iowa (since 2006); Director (since 2004) of Xerox Corporation; Director (since 2005), Beta Gamma Sigma International Honor Society; formerly, Dean and Distinguished Professor of Finance, School of Business at the University of Connecticut (2003-2006); previously, Senior Vice President and Director of Research at the Federal Reserve Bank of Chicago (1995-2003); Director, SS&C Technologies, Inc. (May 2005-October 2005); formerly, Director (1997-2007), Credit Research Center at George Washington University. | | 200 |
David J. Kundert (2) 10/28/42 333 W. Wacker Drive Chicago, IL 60606 | | Trustee | | 2005 | | Director, Northwestern Mutual Wealth Management Company; retired (since 2004) as Chairman, JPMorgan Fleming Asset Management, President and CEO, Banc One Investment Advisors Corporation, and President, One Group Mutual Funds; prior thereto, Executive Vice President, Banc One Corporation and Chairman and CEO, Banc One Investment Management Group; Member, Board of Regents, Luther College; member of the Wisconsin Bar Association; member of Board of Directors, Friends of Boerner Botanical Gardens; member of Board of Directors and Chair of Investment Committee, Greater Milwaukee Foundation. | | 200 |
William J. Schneider (2) 9/24/44 333 W. Wacker Drive Chicago, IL 60606 | | Trustee | | 1997 | | Chairman of Miller-Valentine Partners Ltd., a real estate investment company; formerly, Senior Partner and Chief Operating Officer (retired, 2004) of Miller-Valentine Group; member, University of Dayton Business School Advisory Council; member, Mid-America Health System Board; formerly, member and Chair, Dayton Philharmonic Orchestra Association; formerly, member, Business Advisory Council, Cleveland Federal Reserve Bank. | | 200 |
Judith M. Stockdale 12/29/47 333 W. Wacker Drive Chicago, IL 60606 | | Trustee | | 1997 | | Executive Director, Gaylord and Dorothy Donnelley Foundation (since 1994); prior thereto, Executive Director, Great Lakes Protection Fund (1990-1994). | | 200 |
Carole E. Stone (2) 6/28/47 333 W. Wacker Drive Chicago, IL 60606 | | Trustee | | 2007 | | Director, Chicago Board Options Exchange (since 2006); Director, C2 Options Exchange, Incorporated (since 2009); Commissioner, New York State Commission on Public Authority Reform (since 2005); formerly, Chair, New York Racing Association Oversight Board (2005-2007). | | 200 |
| | | | | | | | |
Name, Birthdate and Address | | Position(s) Held with the Funds | | Year First Elected or Appointed (1) | | Principal Occupation(s) Including other Directorships During Past 5 Years | | Number of Portfolios in Fund Complex Overseen by Trustee |
Terence J. Toth (2) 9/29/59 333 W. Wacker Drive Chicago, IL 60606 | | Trustee | | 2008 | | Director, Legal & General Investment Management America, Inc. (since 2008); Managing Partner, Promus Capital (since 2008); formerly, CEO and President, Northern Trust Global Investments (2004-2007); Executive Vice President, Quantitative Management & Securities Lending (2000-2004); prior thereto, various positions with Northern Trust Company (since 1994); member: Goodman Theatre Board (since 2004); Chicago Fellowship Board (since 2005), University of Illinois Leadership Council Board (since 2007) and Catalyst Schools of Chicago Board (since 2008); formerly, member: Northern Trust Mutual Funds Board (2005-2007), Northern Trust Global Investments Board (2004-2007), Northern Trust Japan Board (2004-2007), Northern Trust Securities Inc. Board (2003-2007) and Northern Trust Hong Kong Board (1997-2004). | | 200 |
| | |
| Interested Trustee: | | | | |
John P. Amboian (3) 6/14/61 333 W. Wacker Drive Chicago, IL 60606 | | Trustee | | 2008 | | Chief Executive Officer (since July 2007), Director (since 1999) and Chairman (since 2007) of Nuveen Investments, Inc.; Chief Executive Officer (since 2007) of Nuveen Asset Management, Nuveen Investments Advisors, Inc.; President (since 2005) of Nuveen Commodities Asset Management, LLC. | | 200 |
Name, Birthdate and Address | | Position(s) Held with the Funds | | Year First Elected or Appointed (4) | | Principal Occupation(s) During Past 5 Years | | Number of Portfolios in Fund Complex Overseen by Officer |
| | |
| Officers of the Funds: | | | | |
Gifford R. Zimmerman 9/9/56 333 W. Wacker Drive Chicago, IL 60606 | | Chief Administrative Officer | | 1988 | | Managing Director (since 2002), Assistant Secretary and Associate General Counsel of Nuveen Investments, LLC; Managing Director, Associate General Counsel and Assistant Secretary, of Nuveen Asset Management (since 2002) and of Symphony Asset Management LLC (since 2003); Vice President and Assistant Secretary of NWQ Investment Management Company, LLC. (since 2002), Nuveen Investments Advisers Inc. (since 2002), Tradewinds Global Investors, LLC, and Santa Barbara Asset Management, LLC (since 2006), Nuveen HydePark Group LLC and Nuveen Investment Solutions, Inc. (since 2007); Managing Director (since 2004) and Assistant Secretary (since 1994) of Nuveen Investments, Inc.; Managing Director (since 2005) of Nuveen Commodities Asset Management, LLC; Chartered Financial Analyst. | | 200 |
Nizida Arriaga 6/1/68 333 W. Wacker Drive Chicago, IL 60606 | | Vice President | | 2009 | | Senior Vice President of Nuveen Investments, LLC (since 2010); formerly, Vice President (2007-2010); previously, Portfolio Manager, Allstate Investments, LLC (1996-2006); Chartered Financial Analyst. | | 200 |
Michael T. Atkinson 2/3/66 333 W. Wacker Drive Chicago, IL 60606 | | Vice President and Assistant Secretary | | 2000 | | Vice President (since 2002) of Nuveen Investments, LLC; Vice President of Nuveen Asset Management (since 2005). | | 200 |
Margo L. Cook 4/11/64 333 W. Wacker Drive Chicago, IL 60606 | | Vice President | | 2009 | | Executive Vice President (since Oct 2008) of Nuveen Investments, Inc.; previously, Head of Institutional Asset Management (2007-2008) of Bear Stearns Asset Management; Head of Institutional Asset Mgt (1986-2007) of Bank of NY Mellon; Chartered Financial Analyst. | | 200 |
Alan A. Brown 8/1/62 333 W. Wacker Drive Chicago, IL 60606 | | Vice President | | 2007 | | Executive Vice President, Global Client Private Group (since 2007); Executive Vice President, Mutual Funds, Nuveen Investments, LLC, (since 2005), previously, Managing Director and Chief Marketing Officer (2001-2005). | | 75 |
Trustees and Officers (continued)
| | | | | | | | |
Name, Birthdate and Address | | Position(s) Held with the Funds | | Year First Elected or Appointed (4) | | Principal Occupation(s) Including other Directorships During Past 5 Years | | Number of Portfolios in Fund Complex Overseen by Officer |
Lorna C. Ferguson 10/24/45 333 W. Wacker Drive Chicago, IL 60606 | | Vice President | | 1998 | | Managing Director (since 2004) of Nuveen Investments, LLC and Managing Director (since 2005) of Nuveen Asset Management. | | 200 |
Stephen D. Foy 5/31/54 333 W. Wacker Drive Chicago, IL 60606 | | Vice President and Controller | | 1998 | | Senior Vice President (since 2010), formerly, Vice President (1993-2010) and Funds Controller (since 1998) of Nuveen Investments, LLC; Vice President (2005-2010) of Nuveen Asset Management; Certified Public Accountant. | | 200 |
Scott S. Grace 8/20/70 333 W. Wacker Drive Chicago, IL 60606 | | Vice President and Treasurer | | 2009 | | Managing Director, Corporate Finance & Development, Treasurer (since 2009) of Nuveen Investments, LLC; Managing Director and Treasurer of Nuveen Asset Management (since 2009); formerly, Treasurer (2006-2009), Senior Vice President (2008-2009), previously, Vice President (2006-2008) of Janus Capital Group, Inc.; formerly, Senior Associate in Morgan Stanley’s Global Financial Services Group (2000-2003); Chartered Accountant Designation. | | 200 |
William T. Huffman 5/7/1969 333 W. Wacker Drive Chicago, IL 60606 | | Vice President | | 2009 | | Chief Operating Officer, Municipal Fixed Income (since 2008) of Nuveen Asset Management; previously, Chairman, President and Chief Executive Officer (2002 – 2007) of Northern Trust Global Advisors, Inc. and Chief Executive Officer (2007) of Northern Trust Global Investments Limited; Certified Public Accountant. | | 136 |
Walter M. Kelly 2/24/70 333 W. Wacker Drive Chicago, IL 60606 | | Chief Compliance Officer and Vice President | | 2003 | | Senior Vice President (since 2008), Vice President (2006-2008) formerly, Assistant Vice President and Assistant General Counsel (2003-2006) of Nuveen Investments, LLC; Senior Vice President (since 2008), formerly, Vice President (2006-2008) and Assistant Secretary (since 2003) of Nuveen Asset Management. | | 200 |
David J. Lamb 3/22/63 333 W. Wacker Drive Chicago, IL 60606 | | Vice President | | 2000 | | Senior Vice President (since 2009), formerly, Vice President (2000-2009) of Nuveen Investments, LLC; Vice President (since 2005) of Nuveen Asset Management, Certified Public Accountant. | | 200 |
Tina M. Lazar 8/27/61 333 W. Wacker Drive Chicago, IL 60606 | | Vice President | | 2002 | | Senior Vice President (since 2009), formerly, Vice President of Nuveen Investments, LLC (1999-2009); Vice President of Nuveen Asset Management (since 2005). | | 200 |
Larry W. Martin 7/27/51 333 W. Wacker Drive Chicago, IL 60606 | | Vice President and Assistant Secretary | | 1988 | | Senior Vice President (since 2010), formerly, Vice President (1993-2010), Assistant Secretary and Assistant General Counsel of Nuveen Investments, LLC; Vice President (since 2005) and Assistant Secretary of Nuveen Investments, Inc.; Vice President (since 2005) and Assistant Secretary (since 1997) of Nuveen Asset Management Vice President and Assistant Secretary of Nuveen Investments Advisers Inc. (since 2002), NWQ Investment Management Company, LLC (since 2002), Symphony Asset Management LLC (since 2003), Tradewinds Global Investors, LLC, Santa Barbara Asset Management, LLC (since 2006) and of Nuveen HydePark Group, LLC and Nuveen Investment Solutions, Inc. (since 2007). | | 200 |
Kevin J. McCarthy 3/26/66 333 W. Wacker Drive Chicago, IL 60606 | | Vice President and Secretary | | 2007 | | Managing Director (since 2008), formerly, Vice President (2007-2008), Nuveen Investments, LLC; Managing Director (since 2008), formerly, Vice President and Assistant Secretary, Nuveen Asset Management and Nuveen Investments Holdings, Inc.; Vice President (since 2007) and Assistant Secretary, Nuveen Investment Advisers Inc., NWQ Investment Management Company, LLC, Tradewinds Global Investors LLC, NWQ Holdings, LLC, Symphony Asset Management LLC, Santa Barbara Asset Management LLC, Nuveen HydePark Group, LLC and Nuveen Investment Solutions, Inc. (since 2007); prior thereto, Partner, Bell, Boyd & Lloyd LLP (1997-2007). | | 200 |
| | | | | | | | |
Name, Birthdate and Address | | Position(s) Held with the Funds | | Year First Elected or Appointed (4) | | Principal Occupation(s) Including other Directorships During Past 5 Years | | Number of Portfolios in Fund Complex Overseen by Officer |
Michelle A. McCarthy 7/6/65 333 West Wacker Drive Chicago, IL 60606 | | Vice President | | 2010 | | Managing Director, Director of Risk Management (since May, 2010), Nuveen Investments, LLC; formerly, Chief Risk Officer (2009-2010) of Russell Investment Group; formerly, SVP (2003-2009), Chief Market & Operational Risk Officer (2006-2009), Washington Mutual Bank. | | 200 |
John V. Miller 4/10/67 333 W. Wacker Drive Chicago, IL 60606 | | Vice President | | 2007 | | Chief Investment Officer and Managing Director (since 2007), formerly, Vice President (2002-2007) of Nuveen Asset Management and Managing Director (since 2007), formerly, Vice President (2002-2007) Nuveen Investments, LLC; Chartered Financial Analyst. | | 136 |
Gregory T. Mino 1/4/71 333 W. Wacker Drive Chicago, IL 60606 | | Vice President | | 2009 | | Senior Vice President (since 2010) of Nuveen Investments, LLC, formerly, Vice President (2008-2010); previously, Director (2004-2007) and Executive Director (2007-2008) of UBS Global Asset Management; previously, Vice President (2000-2003) and Director (2003-2004) of Merrill Lynch Investment Managers; Chartered Financial Analyst. | | 200 |
Christopher M. Rohrbacher 8/1/71 333 W. Wacker Drive Chicago, IL 60606 | | Vice President and Assistant Secretary | | 2008 | | Vice President, Nuveen Investments, LLC (since 2008); Vice President and Assistant Secretary, Nuveen Asset Management (since 2008); prior thereto, Associate, Skadden, Arps, Slate, Meagher & Flom LLP (2002-2008) | | 200 |
James F. Ruane 7/3/62 333 W. Wacker Drive Chicago, IL 60606 | | Vice President and Assistant Secretary | | 2007 | | Vice President, Nuveen Investments (since 2007); prior thereto, Partner, Deloitte & Touche USA LLP (2005-2007), formerly, senior tax manager (2002-2005); Certified Public Accountant. | | 200 |
John S. White 5/12/67 333 W. Wacker Drive Chicago, IL 60606 | | Vice President | | 2007 | | Senior Vice President (since 2009), formerly, Vice President (2006-2009) of Nuveen Investments, LLC, formerly, Assistant Vice President (since 2002); Lieutenant Colonel (since 2007), United States Marine Corps Reserve, formerly, Major (since 2001). | | 75 |
Mark L. Winget 12/21/68 333 W. Wacker Drive Chicago, IL 60606 | | Vice President and Assistant Secretary | | 2008 | | Vice President, Nuveen Investments, LLC (since 2008); Vice President and Assistant Secretary, Nuveen Asset Management (since 2008); prior thereto, Counsel, Vedder Price P.C. (1997-2007). | | 200 |
| (1) | Trustees serve an indefinite term until his/her successor is elected or appointed. The year first elected or appointed represents the year in which the trustee was first elected or appointed to any fund in the Nuveen Fund Complex. |
| (2) | Also serves as a trustee of the Nuveen Diversified Commodity Fund, a Nuveen-sponsored commodity pool that has filed a registration statement on Form S-1 with the SEC for a proposed initial public offering. The S-1 has not been declared effective, and the commodity pool has not commenced operations. |
| (3) | Mr. Amboian is an interested trustee because of his position with Nuveen Investments, Inc. and certain of its subsidiaries, which are affiliates of the Nuveen Funds. |
| (4) | Officers serve one year terms through August of each year. The year first elected or appointed represents the year in which the officer was first elected or appointed to any fund in the Nuveen Fund Complex. |
Annual Investment Management Agreement Approval Process
The Investment Company Act of 1940, as amended (the “1940 Act”), provides, in substance, that each investment advisory agreement between a fund and its investment adviser (including sub-advisers) will continue in effect from year to year only if its continuance is approved at least annually by the fund’s board members, including by a vote of a majority of the board members who are not parties to the advisory agreement or “interested persons” of any parties (the “Independent Board Members”), cast in person at a meeting called for the purpose of considering such approval. In connection with such approvals, the fund’s board members must request and evaluate, and the investment adviser is required to furnish, such information as may be reasonably necessary to evaluate the terms of the advisory agreement. Accordingly, at a meeting held on May 25-26, 2010 (the “May Meeting”), the Boards of Trustees (each a “Board” and each Trustee, a “Board Member”) of the Funds, including a majority of the Independent Board Members, considered and approved the continuation of the advisory and sub-advisory agreements for the Funds for an additional one-year period. These agreements include (a) the investment advisory agreements between Nuveen Asset Management (“NAM”) and each of the Funds; (b) the sub-advisory agreements between NAM and NWQ Investment Management Company, LLC (“NWQ”) on behalf of each of the following Funds: Nuveen NWQ Multi-Cap Value Fund, Nuveen NWQ Large-Cap Value Fund, Nuveen NWQ Small/Mid-Cap Value Fund and Nuveen NWQ Small-Cap Value Fund; (c) the sub-advisory agreement between NAM and Tradewinds Global Investors, LLC (“Tradewinds”) on behalf of the Nuveen Tradewinds Value Opportunities Fund; and (d) the sub-advisory agreements between NAM and Institutional Capital LLC (“ICAP”), Nuveen HydePark Group, LLC (“HydePark”) and Symphony Asset Management LLC (“Symphony”), respectively, on behalf of the Nuveen Multi-Manager Large-Cap Value Fund. NWQ, Tradewinds, ICAP, HydePark and Symphony are each a “Sub-Adviser.” In preparation for their considerations at the May Meeting, the Board also held a separate meeting on April 21-22, 2010 (the “April Meeting”). Accordingly, the factors considered and determinations made regarding the renewals by the Independent Board Members include those made at the April Meeting.
In addition, in evaluating the applicable advisory agreements (each an “Investment Management Agreement”) and sub-advisory agreements (each, a “Sub-advisory Agreement,” and each Investment Management Agreement and Sub-advisory Agreement, an “Advisory Agreement”), the Independent Board Members reviewed a broad range of information relating to the Funds, NAM and each Sub-Adviser (NAM and the Sub-Advisers are each a “Fund Adviser”), including absolute and comparative performance, fee and expense information for the Funds (as described in more detail below), the profitability of Nuveen for its advisory activities (which includes its wholly owned subsidiaries), and other information regarding the organization, personnel, and services provided by the respective Fund Adviser. The Independent Board Members also met quarterly as well as at other times as the need arose during the year and took into account the information provided at such meetings and the knowledge gained therefrom. Prior to approving the renewal of the Advisory Agreements, the Independent Board Members reviewed the foregoing information with their independent legal counsel and with management, reviewed materials from independent legal counsel describing applicable law and their duties in reviewing advisory contracts, and met with independent legal counsel in private sessions without management present. The Independent Board Members considered the legal advice provided by independent legal counsel and relied upon their knowledge of the Fund Adviser, its services and the Funds resulting from their meetings and other interactions throughout the year and their own business judgment in determining the factors to be considered in evaluating the Advisory Agreements. Each Board Member may have accorded different weight to the various factors in reaching his or her conclusions with respect to a Fund’s Advisory Agreements. The Independent Board Members did not identify any single factor as all-important or controlling. The Independent Board Members’ considerations were instead based on a comprehensive consideration of all the information presented. The principal factors considered by the Board and its conclusions are described below.
A. Nature, Extent and Quality of Services
In considering renewal of the Advisory Agreements, the Independent Board Members considered the nature, extent and quality of the Fund Adviser’s services, including advisory services and administrative services. The Independent Board Members reviewed materials outlining, among other things, the Fund Adviser’s organization and business; the types of services that the Fund Adviser or its affiliates provide and are expected to provide to the Funds; the performance record of the applicable Fund (as described in further detail below); and any initiatives Nuveen had taken for the applicable fund product line, including the development of new practices and coordination among business units with respect to large shareholder transactions, streamlining the classes offered, and adding funds to various distribution platforms.
As part of their review, the Independent Board Members also evaluated the background, experience and track record of the Fund Adviser’s investment personnel. In this regard, the Independent Board Members considered any changes in the personnel, and the impact on the level of services provided to the Funds, if any. The Independent Board Members also reviewed information regarding portfolio manager compensation arrangements to evaluate the Fund Adviser’s ability to attract and retain high quality investment personnel, preserve stability, and reward performance but not provide an incentive for taking undue risks.
In addition to advisory services, the Independent Board Members considered the quality of administrative services provided by NAM and its affiliates including product management, fund administration, oversight of service providers, shareholder services, administration of Board relations, regulatory and portfolio compliance and legal support. Given the importance of compliance, the Independent Board Members also considered NAM’s compliance program, including the report of the chief compliance officer regarding the Funds’ compliance policies and procedures.
The Independent Board Members also considered NAM’s oversight of the performance, business activities and compliance of the Sub-Advisers. In that regard, the Independent Board Members reviewed an evaluation of each Sub-Adviser from NAM. The evaluation also included information relating to the respective Sub-Adviser’s organization, operations, personnel, assets under management,
investment philosophy, strategies and techniques in managing the applicable Fund(s), developments affecting each Sub-Adviser, and an analysis of each Sub-Adviser. As described in further detail below, the Board also considered the performance of each Fund sub-advised by the respective Sub-Adviser (or, with respect to the Nuveen Multi-Manager Large-Cap Value Fund (the “Multi-Manager Fund”), the portion of the investment portfolio for which the Sub-Adviser is responsible). In addition, the Board recognized that the Sub-advisory Agreements were essentially agreements for portfolio management services only and the Sub-Advisers were not expected to supply other significant administrative services to the respective Funds. As part of their oversight, the Independent Board Members also continued their program of seeking to visit each sub-adviser to the Nuveen funds at least once over a multiple year rotation, meeting with key investment and business personnel. In this regard, the Independent Board Members met with Tradewinds and NWQ in 2009 and 2010 and Symphony in 2010. The Independent Board Members noted that NAM recommended the renewal of the applicable Sub-advisory Agreements and considered the basis for such recommendations.
Based on their review, the Independent Board Members found that, overall, the nature, extent and quality of services provided (and expected to be provided) to the Funds under the respective Investment Management Agreement or respective Sub-advisory Agreement, as applicable, were satisfactory.
B. The Investment Performance of the Funds and Fund Advisers
The Board considered the performance results of each Fund over various time periods. The Board reviewed, among other things, each Fund’s historic investment performance as well as information comparing the Fund’s performance information with that of other funds (the “Performance Peer Group”) based on data provided by an independent provider of mutual fund data and with recognized and/or customized benchmarks. In this regard, the performance information the Board reviewed included the Fund’s total return information compared to the returns of its Performance Peer Group and recognized and/or customized benchmarks for the quarter, one-, three- and five-year periods ending December 31, 2009 and for the same periods ending March 31, 2010 (or for the periods available for Funds that did not exist for part of the foregoing time frames). With respect to the Multi-Manager Fund, the Independent Board Members also reviewed, among other things, the returns of each sleeve of such Fund relative to the benchmark of such sleeve for the quarter, one- and three-year periods ending December 31, 2009 and for the same periods ending March 31, 2010. The Board also reviewed the peer ranking of the Nuveen funds sub-advised by each of NWQ, Tradewinds, HydePark and Symphony, respectively, in the aggregate. This information supplemented the Fund performance information provided to the Board at each of its quarterly meetings. In reviewing peer comparison information, the Independent Board Members recognized that the Performance Peer Group of certain funds may not adequately represent the objectives and strategies of the funds, thereby limiting the usefulness of comparing a fund’s performance with that of its Performance Peer Group.
Based on their review, the Independent Board Members determined that each Fund’s investment performance over time had been satisfactory. It was noted that the Nuveen Tradewinds Value Opportunities Fund (the “Value Opportunities Fund”) and the Multi-Manager Fund generally demonstrated favorable performance in comparison to peers, performing in the first or second quartile over various periods, with the exception that the Multi-Manager Fund fell within the third quartile for the one-year period but was in the top quartile for the three- and five-year periods. In addition, it was recognized that while the Nuveen NWQ Small/Mid-Cap Value Fund (the “Small/Mid-Cap Value Fund”), the Nuveen NWQ Multi-Cap Value Fund (the “Multi-Cap Value Fund”) and the Nuveen NWQ Small-Cap Value Fund (the “Small-Cap Value Fund”) lagged their peers somewhat in the longer three- to five-year periods (as applicable), the performance had improved in the one-year period, performing in the first or second quartile. Moreover, it was noted that the performance of the Nuveen NWQ Large-Cap Value Fund (the “Large-Cap Value Fund”) over time was satisfactory compared to peers, falling within the second or third quartile over various periods.
C. Fees, Expenses and Profitability
1. Fees and Expenses
The Board evaluated the management fees and expenses of each Fund reviewing, among other things, such Fund’s gross management fees, net management fees and net expense ratios in absolute terms as well as compared to the fee and expenses of a comparable universe of funds based on data provided by an independent fund data provider (the “Peer Universe”) and in certain cases, to a more focused subset of funds in the Peer Universe (the “Peer Group”) and any expense limitations.
The Independent Board Members further reviewed the methodology regarding the construction of the applicable Peer Universe and/or Peer Group. In reviewing the comparisons of fee and expense information, the Independent Board Members took into account that in certain instances various factors such as: the asset level of a fund relative to peers; the limited size and particular composition of the Peer Universe or Peer Group; the investment objectives of the peers; expense anomalies; changes in the funds comprising the Peer Universe or Peer Group from year to year; levels of reimbursement; and the timing of information used; may impact the comparative data thereby limiting the ability to make a meaningful comparison with peers.
In reviewing the fee schedule for a Fund, the Independent Board Members also considered the fund-level and complex-wide breakpoint schedules (described in further detail below) and any fee waivers and reimbursements provided by Nuveen. Except as set forth below, the Independent Board Members noted that the Funds had net management fees and/or net expense ratios below, at or near (within 5 basis points or less) the peer average of their Peer Group or Peer Universe. The Value Opportunities Fund (due in part to the composition of the Peer Universe) and the Multi-Cap Value Fund (due in part to a decrease in net assets) had net advisory fees and net expense ratios above (over 5 basis points) their respective peer average. In addition, the Small-Cap Value Fund had net advisory fees above the peer average but net expense ratios below or at the peer average.
Annual Investment Management Agreement Approval Process (continued)
Notwithstanding the foregoing, the Independent Board Members recognized that NAM intended to reduce the management fees and/or expense caps on certain of the Nuveen funds. More specifically, they noted that NAM intended to reduce the management fees for the Value Opportunities Fund, the Multi-Cap Value Fund, the Large-Cap Value Fund, the Small/Mid-Cap Value Fund and the Small-Cap Value Fund. The Small/Mid-Cap Value Fund would also have a corresponding reduction in its temporary expense cap. Further, the Independent Board Members recognized that the temporary expense cap of the Small-Cap Value Fund would expire as the Fund operates under the expense cap.
Based on their review of the fee and expense information provided, the Independent Board Members determined that each Fund’s management fees were reasonable in light of the nature, extent and quality of services provided to the Fund.
2. Comparisons with the Fees of Other Clients
The Independent Board Members further reviewed information regarding the nature of services and fee rates offered by NAM to other clients. Such clients include separately managed accounts (both retail and institutional accounts), foreign investment funds offered by Nuveen and funds that are not offered by Nuveen but are sub-advised by one of Nuveen’s investment management teams. In evaluating the comparisons of fees, the Independent Board Members noted that the fee rates charged to the Funds and other clients vary, among other things, because of the different services involved and the additional regulatory and compliance requirements associated with registered investment companies, such as the Funds. Accordingly, the Independent Board Members considered the differences in the product types, including, but not limited to, the services provided, the structure and operations, product distribution and costs thereof, portfolio investment policies, investor profiles, account sizes and regulatory requirements. The Independent Board Members noted, in particular, that the range of services provided to the Funds (as discussed above) is much more extensive than that provided to separately managed accounts. Given the inherent differences in the products, particularly the extensive services provided to the Funds, the Independent Board Members believe such facts justify the different levels of fees.
In considering the fees of the Sub-Advisers, the Independent Board Members also considered the pricing schedule or fees that each Sub-Adviser charges for similar investment management services for other fund sponsors or clients (such as retail and/or institutional managed accounts) as applicable. With respect to Symphony, the Independent Board Members also reviewed the fees it assesses for equity and taxable fixed-income hedge funds it manages, which include a performance fee.
3. Profitability of Fund Advisers
In conjunction with its review of fees, the Independent Board Members also considered the profitability of Nuveen for its advisory activities (which incorporated Nuveen’s wholly-owned affiliated sub-advisers) and its financial condition. The Independent Board Members reviewed the revenues and expenses of Nuveen’s advisory activities for the last two years, the allocation methodology used in preparing the profitability data and an analysis of the key drivers behind the changes in revenues and expenses that impacted profitability in 2009. The Independent Board Members noted this information supplemented the profitability information requested and received during the year to help keep them apprised of developments affecting profitability (such as changes in fee waivers and expense reimbursement commitments). In this regard, the Independent Board Members noted that they had also appointed an Independent Board Member as a point person to review and keep them apprised of changes to the profitability analysis and/or methodologies during the year. The Independent Board Members also considered Nuveen’s revenues for advisory activities, expenses, and profit margin compared to that of various unaffiliated management firms with similar amounts of assets under management and relatively comparable asset composition prepared by Nuveen.
In reviewing profitability, the Independent Board Members recognized the subjective nature of determining profitability which may be affected by numerous factors including the allocation of expenses. Further, the Independent Board Members recognized the difficulties in making comparisons as the profitability of other advisers generally is not publicly available and the profitability information that is available for certain advisers or management firms may not be representative of the industry and may be affected by, among other things, the adviser’s particular business mix, capital costs, types of funds managed and expense allocations. Notwithstanding the foregoing, the Independent Board Members reviewed Nuveen’s methodology and assumptions for allocating expenses across product lines to determine profitability. In reviewing profitability, the Independent Board Members recognized Nuveen’s investment in its fund business. Based on their review, the Independent Board Members concluded that Nuveen’s level of profitability for its advisory activities was reasonable in light of the services provided.
In addition, with respect to ICAP, the Independent Board Members also considered such Sub-Adviser’s revenues, expenses and profitability margins (pre- and post-tax). Based on their review, the Independent Board Members were satisfied that such Sub-Adviser’s level of profitability was reasonable in light of the services provided.
In evaluating the reasonableness of the compensation, the Independent Board Members also considered other amounts paid to a Fund Adviser by the Funds as well as any indirect benefits (such as soft dollar arrangements, if any) the Fund Adviser and its affiliates receive, or are expected to receive, that are directly attributable to the management of the Funds, if any. See Section E below for additional information on indirect benefits a Fund Adviser may receive as a result of its relationship with the Funds. Based on their review of the overall fee arrangements of each Fund, the Independent Board Members determined that the advisory fees and expenses of the respective Fund were reasonable.
D. Economies of Scale and Whether Fee Levels Reflect These Economies of Scale
With respect to economies of scale, the Independent Board Members have recognized the potential benefits resulting from the costs of a fund being spread over a larger asset base, although economies of scale are difficult to measure and predict with precision, particularly on a fund-by-fund basis. One method to help ensure the shareholders share in these benefits is to include breakpoints in the advisory fee schedule. Generally, management fees for funds in the Nuveen complex are comprised of a fund-level component and a complex-level component, subject to certain exceptions. Accordingly, the Independent Board Members reviewed and considered the applicable fund-level breakpoints in the advisory fee schedules that reduce advisory fees as asset levels increase.
In addition to fund-level advisory fee breakpoints, the Board also considered the Funds’ complex-wide fee arrangement. Pursuant to the complex-wide fee arrangement, the fees of the funds in the Nuveen complex are generally reduced as the assets in the fund complex reach certain levels. The complex-wide fee arrangement seeks to provide the benefits of economies of scale to fund shareholders when total fund complex assets increase, even if assets of a particular fund are unchanged or have decreased. The approach reflects the notion that some of Nuveen’s costs are attributable to services provided to all its funds in the complex and therefore all funds benefit if these costs are spread over a larger asset base.
Based on their review, the Independent Board Members concluded that the breakpoint schedules and complex-wide fee arrangement were acceptable and reflect economies of scale to be shared with shareholders when assets under management increase.
E. Indirect Benefits
In evaluating fees, the Independent Board Members received and considered information regarding potential “fall out” or ancillary benefits the respective Fund Adviser or its affiliates may receive as a result of its relationship with each Fund. In this regard, the Independent Board Members considered, among other things, any sales charges, distribution fees and shareholder services fees received and retained by the Funds’ principal underwriter, an affiliate of NAM, which includes fees received pursuant to any 12b-1 plan. The Independent Board Members, therefore, considered the 12b-1 fees retained by Nuveen during the last calendar year.
In addition to the above, the Independent Board Members considered whether each Fund Adviser received any benefits from soft dollar arrangements whereby a portion of the commissions paid by a Fund for brokerage may be used to acquire research that may be useful to the Fund Adviser in managing the assets of the Funds and other clients. With respect to NAM, the Independent Board Members noted that NAM does not currently have any soft dollar arrangements; however, to the extent certain bona fide agency transactions that occur on markets that traditionally trade on a principal basis and riskless principal transactions are considered as generating “commissions,” NAM intends to comply with the applicable safe harbor provisions. With respect to HydePark, ICAP, NWQ and Tradewinds, the Independent Board Members considered that such Sub-Advisers may benefit from their soft dollar arrangements pursuant to which the respective Sub-Adviser receives research from brokers that execute the applicable Fund’s portfolio transactions. For these Sub-Advisers, the Independent Board Members further noted that such Sub-Advisers’ profitability may be lower if they were required to pay for this research with hard dollars. With respect to Symphony, the Board considered that Symphony currently does not enter into soft dollar arrangements; however, it has adopted a soft dollar policy in the event it does so in the future.
Based on their review, the Independent Board Members concluded that any indirect benefits received by a Fund Adviser as a result of its relationship with the applicable Fund(s) were reasonable and within acceptable parameters.
F. Other Considerations
The Independent Board Members did not identify any single factor discussed previously as all-important or controlling. The Board Members, including the Independent Board Members, unanimously concluded that the terms of the Investment Management Agreements and Sub-advisory Agreements are fair and reasonable, that the respective Fund Adviser’s fees are reasonable in light of the services provided to each Fund and that the Investment Management Agreements and the Sub-advisory Agreements be renewed.
Notes
Notes
Glossary of Terms Used in this Report
Average Annual Total Return: This is a commonly used method to express an investment’s performance over a particular, usually multi-year time period. It expresses the return that would have been necessary each year to equal the investment’s actual cumulative performance (including change in NAV or offer price and reinvested dividends and capital gains distributions, if any) over the time period being considered.
Net Asset Value (NAV): A Fund’s NAV is the dollar value of one share in the Fund. It is calculated by subtracting the liabilities of the Fund from its total assets and then dividing the remainder by the number of shares outstanding. Fund NAVs are calculated at the end of each business day.
Fund Information
Fund Manager
Nuveen Asset Management
333 West Wacker Drive
Chicago, IL 60606
Sub-Advisers
Institutional Capital LLC
225 West Wacker Drive
Chicago, IL 60606
Nuveen Hyde Park Group, LLC
111 West Jackson Blvd.
Suite 1411
Chicago, IL 60604
NWQ Investment Management Company, LLC
2049 Century Park East
Los Angeles, CA 90067
Symphony Asset Management, LLC
555 California Street
Rene Suite 2975
San Francisco, CA 94104
Tradewinds Global Investors, LLC
2049 Century Park East
Los Angeles, CA 90067
Legal Counsel
Chapman and Cutler LLP
Chicago, IL
Independent Registered Public Accounting Firm
PricewaterhouseCoopers LLP
Chicago, IL
Custodian
State Street Bank & Trust Company
Boston, MA
Transfer Agent and Shareholder Services
Boston Financial
Data Services
Nuveen Investor Services
P.O. Box 8530
Boston, MA 02266-8530
(800) 257-8787
Distribution Information: The following Funds hereby designate their percentages of dividends paid from net ordinary income as dividends qualifying for the 70% dividends received deduction (“DRD”) for corporations and their percentages as qualified dividend income (“QDI”) for individuals under Section 1 (h)(11) of the Internal Revenue Code as shown in the accompanying table. The actual qualified dividend income distributions will be reported to shareholders on Form 1099-DIV which will be sent to shareholders shortly after calendar year end.
| | | | |
| Fund | | % of DRD | | % of QDI |
Nuveen Multi-Manager Large-Cap Value Fund | | 100% | | 100% |
Nuveen NWQ Multi-Cap Value Fund | | 100% | | 100% |
Nuveen NWQ Large-Cap Value Fund | | 100% | | 100% |
Nuveen NWQ Small-Cap Value Fund | | 100% | | 100% |
Quarterly Portfolio of Investments and Proxy Voting Information: You may obtain (i) each Fund’s quarterly portfolio of investments, (ii) information regarding how the Funds voted proxies relating to portfolio securities held during the most recent twelve-month period ended June 30, and (iii) a description of the policies and procedures that the Funds used to determine how to vote proxies relating to portfolio securities without charge, upon request, by calling Nuveen Investments at (800) 257-8787 or on Nuveen’s website at www.nuveen.com.
You may also obtain this and other Fund information directly from the Securities and Exchange Commission (“SEC”). The SEC may charge a copying fee for this information. Visit the SEC on-line at http://www.sec.gov or in person at the SEC’s Public Reference Room in Washington, D.C. Call the SEC at (202) 942-8090 for room hours and operation. You may also request fund information by sending an e-mail request to publicinfo@sec.gov or by writing to the SEC’s Public Reference Section at 100 F Street NE, Washington, D.C. 20549.
The Financial Industry Regulatory Authority (“FINRA”) provides a Public Disclosure Program which supplies certain information regarding the disciplinary history of FINRA members and their associated persons in response to either telephone inquiries at (800) 289-9999 or written inquiries at www.finra.org. FINRA also provides an investor brochure that includes information describing the Public Disclosure Program.
Nuveen Investments:
Serving Investors For Generations
Since 1898, financial advisors and their clients have relied on Nuveen Investments to provide dependable investment solutions through continued adherence to proven, long-term investing principles. Today, we offer a range of high quality equity and fixed-income solutions designed to be integral components of a well-diversified core portfolio.
Focused on meeting investor needs.
Nuveen Investments is a global investment management firm that seeks to help secure the long-term goals of institutions and high net worth investors as well as the consultants and financial advisors who serve them. We market our growing range of specialized investment solutions under the high-quality brands of HydePark, NWQ, Nuveen, Santa Barbara, Symphony, Tradewinds and Winslow Capital. In total, Nuveen Investments managed approximately $150 billion of assets on June 30, 2010.
Find out how we can help you.
To learn more about the products and services of Nuveen Investments may be able to help you meet your financial goals, talk to your financial advisor, or call us at (800) 257-8787. Please read the information provided carefully before you invest. Investors should consider the investment objective and policies, risk considerations, charges and expenses of any investment carefully. Where applicable, be sure to obtain a prospectus, which contains this and other relevant information. To obtain a prospectus, please contact your securities representative or Nuveen Investments, 333 W. Wacker Dr., Chicago, IL 60606. Please read the prospectus carefully before you invest or send money.
Learn more about Nuveen Funds at: www.nuveen.com/mf
Nuveen makes things e-simple.
It only takes a minute to sign up for e-Reports. Once enrolled, you’ll receive an e-mail as soon as your Nuveen Fund information is ready. No more waiting for delivery by regular mail. Just click on the link within the e-mail to see the report and save it on your computer if you wish.
Free e-Reports right to your e-mail!
www.investordelivery.com
If you receive your Nuveen Fund dividends and statements from your financial advisor or brokerage account.
OR
www.nuveen.com/accountaccess
If you receive your Nuveen Fund dividends and statements directly from Nuveen.
| | |
Distributed by Nuveen Investments, LLC 333 West Wacker Drive Chicago, IL 60606 www.nuveen.com | | |
MAN-NWQ-0610D

Mutual Funds
��
Nuveen Equity Funds
For investors seeking long-term capital appreciation.
Annual Report
June 30, 2010
| | | | | | | | | | | | |
Nuveen Enhanced
Core Equity Fund | | | | Nuveen Enhanced
Mid-Cap Fund | | | | | | | | |
NUVEEN INVESTMENTS ANNOUNCES STRATEGIC COMBINATION WITH FAF ADVISORS
On July 29, 2010, Nuveen Investments, Inc. announced that U.S. Bancorp will receive a 9.5% stake in Nuveen Investments and cash consideration in exchange for the long-term asset business of U.S. Bancorp’s FAF Advisors (FAF). Nuveen Investments is the parent of Nuveen Asset Management (NAM), the investment adviser for the Funds included in this report.
FAF Advisors, which currently manages about $25 billion of long-term assets and serves as the advisor of the First American Funds, will be combined with NAM, which currently manages about $75 billion in municipal fixed income assets. Upon completion of the transaction, Nuveen Investments, which currently manages about $150 billion of assets across several high-quality affiliates, will manage a combined total of about $175 billion in institutional and retail assets.
This combination will not affect the investment objectives, strategies or policies of the Funds in this report. Over time, Nuveen Investments expects that the combination will provide even more ways to meet the needs of investors who work with financial advisors and consultants by enhancing the multi-boutique model of Nuveen Investments, which also includes highly respected investment teams at NWQ Investment Management, Santa Barbara Asset Management, Symphony Asset Management, Tradewinds Global Investors, Winslow Capital and Nuveen HydePark.
The transaction is expected to close late in 2010, subject to customary conditions.
| | | | | | |
| Must be preceded by or accompanied by a prospectus. | | NOT FDIC INSURED | | MAY LOSE VALUE | | NO BANK GUARANTEE |
Chairman’s
Letter to Shareholders

Dear Shareholder,
The economic environment in which your Fund operates reflects continuing but uneven economic recovery. The U.S. and other major industrial countries are experiencing steady but comparatively low levels of economic growth, while emerging market countries are seeing a resumption of relatively strong economic expansion. The potential impact of steps being considered by many governments to counteract the extraordinary governmental spending and credit expansion to deal with the recent financial and economic crisis is injecting uncertainty into global financial markets. The implications for future tax rates, government spending, interest rates and the pace of economic recovery in the U.S. and other leading economies are extremely difficult to predict at the present time. The long term health of the global economy depends on restoring some measure of fiscal discipline around the world, but since all of the corrective steps require economic pain, it is not surprising that governments are reluctant to undertake them.
In the near term, governments remain committed to furthering economic recovery and realizing a meaningful reduction in their national unemployment rates. Such an environment should produce continued economic growth and, consequently, attractive investment opportunities. Over the longer term, the larger uncertainty mentioned earlier carries the risk of unexpected potholes in the road to sustained recovery. For this reason, Nuveen’s investment management teams are working hard to balance return and risk by building well-diversified portfolios, among other strategies. I encourage you to read the following commentary on the management of your Fund. As always, I also encourage you to contact your financial consultant if you have any questions about your Nuveen Fund investment. Please consult the Nuveen website for the most recent information on your Nuveen Fund at: www.nuveen.com.
On behalf of the other members of your Fund’s Board, we look forward to continuing to earn your trust in the months and years ahead.
Sincerely,

Robert P. Bremner
Chairman of the Board
August 17, 2010
Portfolio Managers’ Comments
Certain statements in this report are forward-looking statements. Discussions of specific investments are for illustration only and are not intended as recommendations of individual investments. The forward-looking statements and other views expressed herein are those of the portfolio managers as of the date of this report. Actual future results or occurrences may differ significantly from those anticipated in any forward-looking statements, and the views expressed herein are subject to change at any time, due to numerous market and other factors. The Funds disclaim any obligation to update publicly or revise any forward-looking statements or views expressed herein.
The Nuveen Enhanced Core Equity Fund and the Nuveen Enhanced Mid-Cap Fund feature management by Nuveen HydePark Group, LLC, an affiliate of Nuveen Investments, Inc. For most of this period, both Funds were managed by David Tierney, PhD, Senior Managing Director and Chief Investment Officer of HydePark, John Gambla, CFA, and Rob Guttschow, CFA. In June 2010, David Tierney relinquished his management responsibilities for both Funds. We recently spoke with John and Rob about general market conditions, key investment strategies and the performance of the Funds for the twelve-month period ended June 30, 2010.
What were the general market conditions during the reporting period?
As the reporting period began, there continued to be considerable downward pressure on the economy and both the Federal Reserve (Fed) and the federal government continued their efforts to improve the overall economic environment. For its part, the Fed continued to hold the benchmark fed funds rate in a target range of zero to 0.25% after cutting it to this record low level in December 2008.
At its June 2010 meeting, the central bank renewed its pledge to keep the fed funds rate “exceptionally low” for an “extended period.” As part of its efforts, the federal government put into place the American Recovery and Reinvestment Act of 2009, a $787 billion economic stimulus package intended to provide job creation, tax relief, fiscal assistance to state and local governments and expansion of unemployment benefits and other federal social welfare programs.
During the twelve-month period, these and other measures taken by the Fed and the government to ease the economic recession helped to produce some signs of improvement. Over the four calendar quarters comprising this period, the U.S. economy, as measured by the U.S. gross domestic product (GDP), grew at annualized rates of 1.6%, 5.0%, 3.7% and an estimated 2.4%. This marked the first time since 2007 that the economy managed to string together four consecutive positive quarters. Housing also provided something of a bright spot, as the S&P/Case-Shiller Home Price Index of average residential prices from 20 large urban areas gained 4.6% for the twelve months ended May 2010 (the most recent data available at the time this report was produced). This moved average home prices across the United States to levels similar to where they were in the autumn of 2003.
Inflation also continued to be relatively tame, as the Consumer Price Index (CPI) rose 1.1% year-over-year as of June 2010. While labor markets remained weak, recent months have seen some improvement. As of June 2010, the national unemployment rate was 9.5%, the same level as June 2009 but below the 26-year high of 10.1% in October 2009.
Equity markets across the globe rallied during the reporting period and many indexes reached highs in April 2010 that had not been seen since 2008. Nevertheless, financial markets faced numerous obstacles throughout the period. Rating agencies downgraded the sovereign debt of Greece and threatened to downgrade Spain’s obligations. Dubai World announced over Thanksgiving that it would need to restructure its debt. In response to the financial crisis, the Bank for International Settlements issued the so-called “Basel III” guidelines, proposing stricter regulations regarding banks’ capital and liquidity requirements. Investors were divided over how the various proposals to address U.S. health care coverage would impact industry participants. Each new event seemed to be followed by market volatility.
How did the Funds perform during the twelve-month period ended June 30, 2010?
The table on page five provides performance information for both Funds (Class A Shares at net asset value) for the twelve-month and since inception periods ended June 30, 2010. The table also compares each Fund’s performance to general market indexes. A more detailed discussion of each Fund’s relative performance is provided later in this report.
What strategies were used to manage the Funds during the reporting period?
The proprietary, risk-controlled HydePark wealth creation model was used to manage the Funds during this period, and has been used since the inception of the Funds. This model utilizes both fundamental and momentum-related criteria to create a portfolio designed to maximize the reward-to-risk ratio of the Funds.
Our investment process is a combination of traditional fundamental security valuation and quantitative risk-control techniques. The philosophy that underlies our value-added process is that a stock’s price must follow the wealth creation fundamentals of the company. A stock’s weight in the portfolio is directly related to its wealth creation fundamentals. Our process has five “wealth creation” factors. Four are fundamentally oriented — two are traditional measures of revenues versus excess of expenses (specifically, earnings and cash flow), and two are traditional measures of the uses for those monies (book value and dividends). The fifth factor is a proprietary measure of stock price momentum. Importantly, the process also considers a stock’s liquidity. Due to the quantitative, model-driven process, top-down macroeconomic “themes” do not influence the model or how we select stocks for the Funds.
The model evaluates all the securities contained in the benchmark portfolio (S&P 500 Index for the Enhanced Core Equity Fund and Russell Midcap Index for the Enhanced Mid-Cap Fund) for possible inclusion in the respective portfolios. The process does not consider a stock for possible inclusion if it is not contained in the respective benchmark portfolio. This process produces what HydePark believes are well-diversified, efficient portfolios that attempt to perform within a specific, narrow range versus the stated benchmarks. Both portfolios typically contain a large number of holdings with each relative weighting reflecting the five-dimensional view of that stock’s wealth creation characteristics. The portfolios are monitored daily with rebalances occurring quarterly.
How did these strategies influence performance?
Nuveen Enhanced Core Equity Fund
The Fund’s Class A Shares at net asset value outperformed the Lipper Index, but underperformed S&P 500 Index during the reporting period.
We believe the quantitative, risk-controlled stock selection process described above should, under normal circumstances, cause the Fund to track its benchmark portfolio closely, with value-added potential coming from the Fund’s relative overweights or underweights of each stock versus the index. We attempt to express an overweight/underweight opinion on every stock in the benchmark based on our analysis of its five wealth creation factors.
The sum of the Fund’s individual security overweights/underweights versus the index is, by definition, equal to zero. However, the HydePark process does not constrain the portfolio to be industry or sector neutral relative to the benchmark. As a result, the Fund sometimes will overweight a sector because the stocks in that sector had what we judged to be attractive wealth creation fundamentals versus the benchmark. Performance for the portfolio can then be viewed in two parts: the return attributable to the Fund’s sector weightings and the return attributable to the performance of individual stocks within each sector.
On average during the reporting period, the Fund was overweighted in consumer discretionary, financials, and telecommunication services and underweighted in energy, industrials, consumer staples, health care, and information technology. The largest single sector overweight was in telecommunication services, where the Fund was, on average, 0.50% overweight versus the index. The largest single underweight was, on average, in information technology, where the Fund was 0.90% underweight versus the index. Overall, sector weightings were a negative to the Funds relative performance versus the index.
Performance attributable to the individual stock holdings within each sector was a positive for the Fund during the reporting period, with the stock picks within the information technology sector having the largest positive impact. The holdings within the health care and utility sectors were also a positive for the Fund. Holdings within the financials and consumer discretionary resulted in negative relative performance for the Fund.
Nuveen Enhanced Mid-Cap Fund
The Fund’s Class A Shares at net asset value outperformed the Lipper and S&P 500 indexes and underperformed the Russell MidCap Index during the reporting period.
Similar to the Nuveen Enhanced Core Equity Fund, we employ a quantitative, risk-controlled process for this Fund that weighted every stock in the portfolio according to our five wealth creation fundamentals. We believe the resultant portfolio should, under normal circumstances, track its benchmark portfolios closely, with value-added potential coming from our relative overweights or underweights of each stock versus the index. We attempt to express an overweight/underweight opinion on every stock in the benchmark based on our analysis of its five wealth creation factors.
As with the Nuveen Enhanced Core Equity Fund, the sum of the Fund’s individual security overweights/underweights versus the index is, by definition, equal to zero. However, the
| 1 | Since inception returns for the Funds are from 12/3/07. Returns for the Lipper, S&P and Russell Indexes are from 12/31/07. |
| 2 | The Lipper Large-Cap Core Funds Index is a managed index that represents the average annualized returns of the 30 largest funds in the Lipper Large-Cap Core Funds category. The returns assume reinvestment of dividends, but do not reflect any applicable sales charges. You cannot invest directly in an index. |
| 3 | The S&P 500 Index is an unmanaged index generally considered representative of the U.S. stock market. The index returns assume reinvestment of dividends, but do not reflect any applicable sales charges. You cannot invest directly in an index. |
| 4 | The Lipper Mid-Cap Core Funds Index is a managed index that represents the average annualized returns of the 30 largest funds in the Lipper Mid-Cap Core Funds category. The returns assume reinvestment of dividends, but do not reflect any applicable sales charges. You cannot invest directly in an index. |
| 5 | The Russell Midcap Index includes the smallest 800 securities in the Russell 1000 Index. The index returns assume reinvestment of dividends and do not reflect any applicable sales charges. You cannot invest directly in an index. |
HydePark process is not constrained to be industry or sector neutral. As a result, the Fund sometimes is overweight stocks within a sector because all the individual stocks in that sector had what we judged to be attractive wealth creation fundamentals versus the benchmark in aggregate. Performance for the portfolio can then be viewed in two parts: the return attributable to the Fund’s sector weightings and the return attributable to the performance of individual stocks within each sector.
On average during the annual reporting period, the Fund was overweighted in the consumer discretionary, financials, materials, and utilities sectors. The largest single sector overweight was in financials, where the Fund was, on average, 2.0% overweight versus the index. The largest single sector underweight was, on average, in information technology, where the Fund was 2.5% underweight versus the index. Overall, sector weightings were a drag on the Funds relative performance versus the Russell Index.
Performance attributable to the individual stock weightings within each sector also was a net negative for the Fund during this period. Stock selection was positive within the financial, consumer staples and utilities sectors sectors. Selection was a negative within the energy, consumer discretionary, industrials, information technology and health care sectors.
Class A Shares – Average Annual Total Returns
As of 6/30/10
| | | | |
| | | Average Annual |
| | | 1-Year | | Since
inception1 |
Nuveen Enhanced Core Equity Fund | | | | |
A Shares at NAV | | 12.94% | | -12.06% |
A Shares at Offer | | 6.43% | | -14.06% |
Lipper Large-Cap Core Funds Index2 | | 12.33% | | -10.73% |
S&P 500 Index3 | | 14.43% | | -10.90% |
Nuveen Enhanced Mid-Cap Fund | | | | |
A Shares at NAV | | 23.91% | | -11.22% |
A Shares at Offer | | 16.79% | | -13.23% |
Lipper Mid-Cap Core Funds Index4 | | 22.12% | | -7.17% |
Russell Midcap Index5 | | 25.13% | | -8.06% |
S&P 500 Index3 | | 14.43% | | -10.90% |
Returns quoted represent past performance which is no guarantee of future results. Current performance may be higher or lower than the performance shown. Investment returns and principal value will fluctuate so that when shares are redeemed, they may be worth more or less than their original cost. Class A Shares have a 5.75% maximum sales charge. Returns at NAV would be lower if the sales charge were included. Returns do not reflect the deduction of taxes that a shareholder would pay on Fund distributions or the redemption of shares. Returns may reflect a contractual agreement between certain Funds and the investment adviser to waive certain fees and expenses; see Notes to Financial Statements, Footnote 7 — Management Fees and Other Transactions with Affiliates for more information. In addition, returns may reflect a voluntary expense limitation by the Funds’ investment adviser that may be modified or discontinued at any time without notice. For the most recent month-end performance, visit www.nuveen.com or call (800) 257-8787.
Please see each Fund’s Spotlight Page later in this report for more complete performance data and expense ratios.
Nuveen Enhanced Core Equity Fund
Growth of an Assumed $10,000 Investment
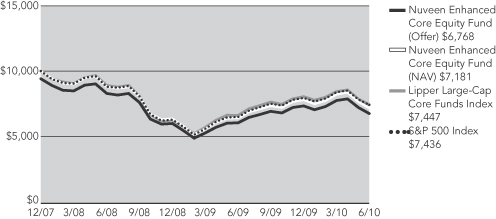
Nuveen Enhanced Mid-Cap Fund
Growth of an Assumed $10,000 Investment
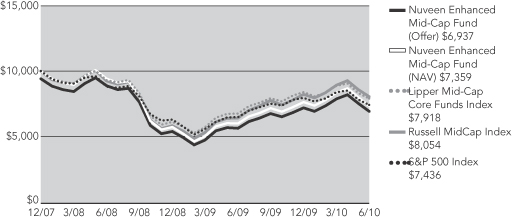
The graphs do not reflect the deduction of taxes that a shareholder may pay on Fund distributions or the redemption of Fund shares.
The index comparisons show the change in value of a $10,000 investment in the Class A Shares of the Nuveen Funds compared with appropriate indexes. The Lipper Large-Cap Core Funds Index is a managed index that represents the average annualized returns of the 30 largest funds in the Lipper Large-Cap Core Funds category. The S&P 500 Index is an unmanaged index generally considered to be representative of the U.S. stock market. The Lipper Mid-Cap Core Funds Index is a managed index that represents the average annualized returns of the 30 largest funds in the Lipper Mid-Cap Core Funds category. The Russell MidCap Index includes the smallest 800 securities in the Russell 1000 Index. The index returns assume reinvestment of dividends and do not reflect any initial or ongoing expenses. You cannot invest directly in an index. The Nuveen Funds’ returns include reinvestment of all dividends and distributions, and the Funds’ returns at the offer price depicted in the charts reflect the initial maximum sales charge applicable to Class A Shares (5.75%) and all ongoing Fund expenses. The performance data quoted represents past performance, which is not indicative of future results. Current performance may be lower or higher than the performance shown.
Fund Spotlight as of 6/30/10 Nuveen Enhanced Core Equity Fund
| | | | | | |
| Quick Facts | | | | | | |
| | | A Shares | | C Shares | | I Shares |
Fund Symbols | | NEEAX | | NEECX | | NEERX |
NAV | | $13.66 | | $13.63 | | $13.67 |
Latest Ordinary Income Distribution1 | | $0.4107 | | $0.3144 | | $0.4428 |
Inception Date | | 12/03/07 | | 12/03/07 | | 12/03/07 |
Returns quoted represent past performance which is no guarantee of future results. Investment returns and principal value will fluctuate so that when shares are redeemed, they may be worth more or less than their original cost. Current performance may be higher or lower than the performance shown. Returns without sales charges would be lower if the sales charge were included. Returns do not reflect the deduction of taxes that a shareholder would pay on Fund distributions or the redemption of shares. For the most recent month-end performance visit www.nuveen.com or call (800) 257-8787.
Returns reflect differences in sales charges and expenses, which are primarily differences in distribution and service fees. Fund returns assume reinvestment of dividends and capital gains. Class A Shares have a 5.75% maximum sales charge. Class A Share purchases of $1 million or more are sold at net asset value without an up-front sales charge but may be subject to a contingent deferred sales charge (CDSC), also known as a back-end sales charge, if redeemed within twelve months of purchase. Class C Shares have a 1% CDSC for redemptions within less than one year, which is not reflected in the one-year total return. Class I Shares have no sales charge and may be purchased under limited circumstances or by specified classes of investors. Returns may reflect an expense limitation by the Fund’s investment adviser.
| | | | |
| Average Annual Total Returns as of 6/30/10 |
| | |
| A Shares | | NAV | | Offer |
1-Year | | 12.94% | | 6.43% |
Since Inception | | -12.06% | | -14.06% |
| | |
| C Shares | | NAV | | |
1-Year | | 12.16% | | |
Since Inception | | -12.72% | | |
| | |
| I Shares | | NAV | | |
1-Year | | 13.26% | | |
Since Inception | | -11.84% | | |
| | |
|
| Top Five Common Stock Holdings 3 |
Apple, Inc. | | 2.9% |
Exxon Mobil Corporation | | 2.5% |
General Electric Company | | 2.0% |
Bank of America Corporation | | 2.0% |
JP Morgan Chase & Co. | | 1.9% |
Portfolio Allocation 2
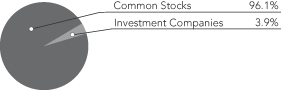
| | |
| Portfolio Statistics |
| Net Assets ($000) | | $3,141 |
| Number of Common Stocks | | 495 |
| | | | |
| Expense Ratios | | | | |
| Share Class | | Gross
Expense
Ratios | | Net
Expense
Ratios |
| Class A | | 1.52% | | 0.75% |
| Class C | | 2.31% | | 1.50% |
| Class I | | 1.23% | | 0.50% |
The expense ratios shown factor in Total Annual Fund Operating Expenses including management fees and other fees and expenses. The Net Expense Ratios reflect a contractual commitment by the Fund’s investment adviser to waive fees and reimburse expenses through October 31, 2011. The expense ratios are those shown in the most recent Fund prospectus.
| 1 | Ordinary income distribution consists of short-term capital gains paid on December 16, 2009, and ordinary income paid on December 31, 2009, if any. |
| 2 | As a percentage of total investments as of June 30, 2010. Holdings are subject to change. |
| 3 | As a percentage of total common stocks as of June 30, 2010. Holdings are subject to change. |
Fund Spotlight as of 6/30/10 Nuveen Enhanced Core Equity Fund
| | |
| Portfolio Composition1 | | |
Oil, Gas & Consumable Fuels | | 7.3% |
Computers & Peripherals | | 5.2% |
Pharmaceuticals | | 5.0% |
Insurance | | 4.5% |
Diversified Financial Services | | 4.4% |
Media | | 4.2% |
Investment Companies | | 3.9% |
Commercial Banks | | 3.8% |
Aerospace & Defense | | 3.0% |
Diversified Telecommunication Services | | 2.8% |
Software | | 2.8% |
Industrial Conglomerates | | 2.7% |
IT Services | | 2.5% |
Semiconductors & Equipment | | 2.5% |
Household Products | | 2.4% |
Specialty Retail | | 2.4% |
Health Care Providers & Services | | 2.2% |
Beverages | | 2.1% |
Electric Utilities | | 2.1% |
Food & Staples Retailing | | 2.1% |
Machinery | | 2.0% |
Food Products | | 2.0% |
Hotels, Restaurants & Leisure | | 1.8% |
Multi-Utilities | | 1.8% |
Real Estate | | 1.7% |
Capital Markets | | 1.7% |
Chemicals | | 1.6% |
Other | | 19.5%
|
| 1 | As a percentage of total investments as of June 30, 2010. Holdings are subject to change. |
Expense Example
As a shareholder of the Fund, you incur two types of costs: (1) transaction costs, including up-front and back-end sales charges (loads) or redemption fees, where applicable; and (2) ongoing costs, including management fees; distribution and service (12b-1) fees, where applicable; and other Fund expenses. This Example is intended to help you understand your ongoing costs (in dollars) of investing in the Fund and to compare these costs with the ongoing costs of investing in other mutual funds.
The Example below is based on an investment of $1,000 invested at the beginning of the period and held for the period.
The information under “Actual Performance,” together with the amount you invested, allows you to estimate actual expenses incurred over the reporting period. Simply divide your account value by $1,000 (for example, an $8,600 account value divided by $1,000 = 8.60) and multiply the result by the cost shown for your share class, in the row entitled “Expenses Incurred During Period” to estimate the expenses incurred on your account during this period.
The information under “Hypothetical Performance,” provides information about hypothetical account values and hypothetical expenses based on the Fund’s actual expense ratio and an assumed rate of return of 5% per year before expenses, which is not the Fund’s actual return. The hypothetical account values and expenses may not be used to estimate the actual ending account balance or expense you incurred for the period. You may use this information to compare the ongoing costs of investing in the Fund and other Funds. To do so, compare this 5% hypothetical example with the 5% hypothetical examples that appear in the shareholder reports of the other funds.
Please note that the expenses shown in the table are meant to highlight your ongoing costs only and do not reflect any transactional costs, such as up-front and back-end sales charges (loads) or redemption fees, where applicable. Therefore, the hypothetical information is useful in comparing ongoing costs only, and will not help you determine the relative total costs of owning different funds or share classes. In addition, if these transactional costs were included, your costs would have been higher.
| | | | | | | | | | | | | | | | | | | | |
| | | | | | | | | | | Hypothetical Performance |
| | | Actual Performance | | | | (5% return before expenses) |
| | | A Shares | | C Shares | | I Shares | | | | A Shares | | C Shares | | I Shares |
| Beginning Account Value (1/01/10) | | $ | 1,000.00 | | $ | 1,000.00 | | $ | 1,000.00 | | | | $ | 1,000.00 | | $ | 1,000.00 | | $ | 1,000.00 |
| Ending Account Value (6/30/10) | | $ | 929.30 | | $ | 926 | | $ | 930.60 | | | | $ | 1,021.12 | | $ | 1,017.46 | | $ | 1,022.32 |
| Expenses Incurred During Period | | $ | 3.54 | | $ | 7.07 | | $ | 2.39 | | | | $ | 3.71 | | $ | 7.40 | | $ | 2.51 |
For each class of the Fund, expenses are equal to the Fund’s annualized net expense ratio of .74%, 1.48% and .50% for Classes A, C and I, respectively, multiplied by the average account value over the period, multiplied by 181/365 (to reflect the one-half year period).
Fund Spotlight as of 6/30/10 Nuveen Enhanced Mid-Cap Fund
| | | | | | |
| Quick Facts | | | | | | |
| | | A Shares | | C Shares | | I Shares |
Fund Symbols | | NDPAX | | NDPCX | | NDPRX |
NAV | | $14.25 | | $14.23 | | $14.25 |
Latest Ordinary Income Distribution1 | | $0.1922 | | $0.1017 | | $0.2224 |
Inception Date | | 12/03/07 | | 12/03/07 | | 12/03/07 |
Returns quoted represent past performance which is no guarantee of future results. Investment returns and principal value will fluctuate so that when shares are redeemed, they may be worth more or less than their original cost. Current performance may be higher or lower than the performance shown. Returns without sales charges would be lower if the sales charge were included. Returns do not reflect the deduction of taxes that a shareholder would pay on Fund distributions or the redemption of shares. For the most recent month-end performance visit www.nuveen.com or call (800) 257-8787.
Returns reflect differences in sales charges and expenses, which are primarily differences in distribution and service fees. Fund returns assume reinvestment of dividends and capital gains. Class A Shares have a 5.75% maximum sales charge. Class A Share purchases of $1 million or more are sold at net asset value without an up-front sales charge but may be subject to a contingent deferred sales charge (CDSC), also known as a back-end sales charge, if redeemed within twelve months of purchase. Class C Shares have a 1% CDSC for redemptions within less than one year, which is not reflected in the one-year total return. Class I Shares have no sales charge and may be purchased under limited circumstances or by specified classes of investors. Returns may reflect an expense limitation by the Fund’s investment adviser.
| | | | |
| Average Annual Total Returns as of 6/30/10 |
| | |
| A Shares | | NAV | | Offer |
1-Year | | 23.91% | | 16.79% |
Since Inception | | -11.22% | | -13.23% |
| | |
| C Shares | | NAV | | |
1-Year | | 22.88% | | |
Since Inception | | -11.89% | | |
| | |
| I Shares | | NAV | | |
1-Year | | 24.16% | | |
Since Inception | | -11.01% | | |
| | |
| |
| Top Five Common Stock Holdings2 | | |
Suntrust Banks, Inc. | | 1.2% |
Fifth Third Bancorp. | | 0.9% |
Annaly Capital Management Inc. | | 0.9% |
Regions Financial Corporation | | 0.9% |
Cummins Inc. | | 0.8% |
Portfolio Allocation2

| | |
| Portfolio Statistics |
| Net Assets ($000) | | $2,297 |
| Number of Common Stocks | | 673 |
| | | | |
| Expense Ratios | | | | |
| Share Class | | Gross
Expense
Ratios | | Net
Expense
Ratios |
| Class A | | 7.84% | | 0.80% |
| Class C | | 8.61% | | 1.55% |
| Class I | | 7.68% | | 0.55% |
The expense ratios shown factor in Total Annual Fund Operating Expenses including management fees and other fees and expenses. The Net Expense Ratios reflect a contractual commitment by the Fund’s investment adviser to waive fees and reimburse expenses through October 31, 2011. The expense ratios are those shown in the most recent Fund prospectus.
| 1 | Ordinary income distribution consists of ordinary income paid December 31, 2009. |
| 2 | As a percentage of total investments as of June 30, 2010. Holdings are subject to change. |
Fund Spotlight as of 6/30/10 Nuveen Enhanced Mid-Cap Fund
| | |
| Portfolio Composition1 | | |
Insurance | | 7.0% |
Commercial Banks | | 6.5% |
Machinery | | 5.1% |
Multi-Utilities | | 4.2% |
Media | | 4.0% |
Specialty Retail | | 3.2% |
Oil, Gas & Consumable Fuels | | 3.1% |
Health Care Providers & Services | | 3.0% |
Chemicals | | 3.0% |
Electric Utilities | | 2.8% |
Food Products | | 2.8% |
Household Durables | | 2.6% |
Computers & Peripherals | | 2.5% |
Semiconductors & Equipment | | 2.2% |
Health Care Equipment & Supplies | | 2.2% |
Hotels, Restaurants & Leisure | | 2.0% |
Multiline Retail | | 1.9% |
Airlines | | 1.9% |
Software | | 1.6% |
Diversified Telecommunication Services | | 1.6% |
Residential REIT | | 1.5% |
Office REIT | | 1.5% |
Specialized REIT | | 1.4% |
Paper & Forest Products | | 1.4% |
IT Services | | 1.3% |
Internet & Catalog Retail | | 1.2% |
Retail REIT | | 1.2% |
Metals & Mining | | 1.2% |
Textiles, Apparel & Luxury Goods | | 1.2% |
Gas Utilities | | 1.2% |
Beverages | | 1.0% |
Capital Markets | | 1.0% |
Commercial Services & Supplies | | 1.0% |
Electrical Equipment | | 1.0% |
Other | | 19.7% |
| 1 | As a percentage of total investments as of June 30, 2010. Holdings are subject to change. |
Expense Example
As a shareholder of the Fund, you incur two types of costs: (1) transaction costs, including up-front and back-end sales charges (loads) or redemption fees, where applicable; and (2) ongoing costs, including management fees; distribution and service (12b-1) fees, where applicable; and other Fund expenses. This Example is intended to help you understand your ongoing costs (in dollars) of investing in the Fund and to compare these costs with the ongoing costs of investing in other mutual funds.
The Example below is based on an investment of $1,000 invested at the beginning of the period and held for the period.
The information under “Actual Performance,” together with the amount you invested, allows you to estimate actual expenses incurred over the reporting period. Simply divide your account value by $1,000 (for example, an $8,600 account value divided by $1,000 = 8.60) and multiply the result by the cost shown for your share class, in the row entitled “Expenses Incurred During Period” to estimate the expenses incurred on your account during this period.
The information under “Hypothetical Performance,” provides information about hypothetical account values and hypothetical expenses based on the Fund’s actual expense ratio and an assumed rate of return of 5% per year before expenses, which is not the Fund’s actual return. The hypothetical account values and expenses may not be used to estimate the actual ending account balance or expense you incurred for the period. You may use this information to compare the ongoing costs of investing in the Fund and other Funds. To do so, compare this 5% hypothetical example with the 5% hypothetical examples that appear in the shareholder reports of the other funds.
Please note that the expenses shown in the table are meant to highlight your ongoing costs only and do not reflect any transactional costs, such as up-front and back-end sales charges (loads) or redemption fees, where applicable. Therefore, the hypothetical information is useful in comparing ongoing costs only, and will not help you determine the relative total costs of owning different funds or share classes. In addition, if these transactional costs were included, your costs would have been higher.
| | | | | | | | | | | | | | | | | | | | |
| | | | | | | Hypothetical Performance |
| | | Actual Performance | | | | (5% return before expenses) |
| | | A Shares | | C Shares | | I Shares | | | | A Shares | | C Shares | | I Shares |
| Beginning Account Value (1/01/10) | | $ | 1,000.00 | | $ | 1,000.00 | | $ | 1,000.00 | | | | $ | 1,000.00 | | $ | 1,000.00 | | $ | 1,000.00 |
| Ending Account Value (6/30/10) | | $ | 974 | | $ | 970 | | $ | 974.70 | | | | $ | 1,020.88 | | $ | 1,017.21 | | $ | 1,022.12 |
| Expenses Incurred During Period | | $ | 3.87 | | $ | 7.47 | | $ | 2.64 | | | | $ | 3.96 | | $ | 7.65 | | $ | 2.71 |
For each class of the Fund, expenses are equal to the Fund’s annualized net expense ratio of .79%, 1.53% and .54% for Classes A, C and I, respectively, multiplied by the average account value over the period, multiplied by 181/365 (to reflect the one-half year period).
Report of
Independent Registered Public Accounting Firm
To the Board of Trustees and Shareholders of
Nuveen Investment Trust:
In our opinion, the accompanying statement of assets and liabilities, including the portfolios of investments, and the related statements of operations, of changes in net assets and the financial highlights present fairly, in all material respects, the financial position of Nuveen Enhanced Core Equity Fund and Nuveen Enhanced Mid-Cap Fund (each a series of the Nuveen Investment Trust, hereafter referred to as the “Funds”) at June 30, 2010, the results of their operations for the year then ended, the changes in their net assets for each of the two years in the period then ended and the financial highlights for the periods presented in conformity with accounting principles generally accepted in the United States of America. These financial statements and financial highlights (hereafter referred to as “financial statements”) are the responsibility of the Funds’ management; our responsibility is to express an opinion on these financial statements based on our audits. We conducted our audits of these financial statements in accordance with the standards of the Public Company Accounting Oversight Board (United States). Those standards require that we plan and perform the audit to obtain reasonable assurance about whether the financial statements are free of material misstatement. An audit includes examining, on a test basis, evidence supporting the amounts and disclosures in the financial statements, assessing the accounting principles used and significant estimates made by management, and evaluating the overall financial statement presentation. We believe that our audits, which included confirmation of securities at June 30, 2010 by correspondence with the custodian and brokers, provide a reasonable basis for our opinion.
PRICEWATERHOUSECOOPERS LLP
Chicago, IL
August 25, 2010
Portfolio of Investments
Nuveen Enhanced Core Equity Fund
June 30, 2010
| | | | | | | | | | | |
| Shares | | Description (1) | | | | | | | | Value |
| | | | | | | | | | | |
| | COMMON STOCKS – 97.2% | | | | | | | | | |
| | | | | |
| | Aerospace & Defense – 3.0% | | | | | | | | | |
| | | | | |
| 270 | | Boeing Company | | | | | | | | $ | 16,942 |
| | | | | |
| 130 | | General Dynamics Corporation | | | | | | | | | 7,613 |
| | | | | |
| 50 | | Goodrich Corporation | | | | | | | | | 3,313 |
| | | | | |
| 310 | | Honeywell International Inc. | | | | | | | | | 12,099 |
| | | | | |
| 60 | | ITT Industries, Inc. | | | | | | | | | 2,695 |
| | | | | |
| 40 | | L-3 Communications Holdings, Inc. | | | | | | | | | 2,834 |
| | | | | |
| 70 | | Lockheed Martin Corporation | | | | | | | | | 5,215 |
| | | | | |
| 130 | | Northrop Grumman Corporation | | | | | | | | | 7,077 |
| | | | | |
| 50 | | Precision Castparts Corporation | | | | | | | | | 5,146 |
| | | | | |
| 130 | | Raytheon Company | | | | | | | | | 6,291 |
| | | | | |
| 60 | | Rockwell Collins, Inc. | | | | | | | | | 3,188 |
| | | | | |
| 330 | | United Technologies Corporation | | | | | | | | | 21,420 |
| | Total Aerospace & Defense | | | | | | | | | 93,833 |
| | Air Freight & Logistics – 0.9% | | | | | | | | | |
| | | | | |
| 30 | | C.H. Robinson Worldwide, Inc. | | | | | | | | | 1,670 |
| | | | | |
| 40 | | Expeditors International of Washington, Inc. | | | | | | | | | 1,380 |
| | | | | |
| 130 | | FedEx Corporation | | | | | | | | | 9,114 |
| | | | | |
| 290 | | United Parcel Service, Inc., Class B | | | | | | | | | 16,498 |
| | Total Air Freight & Logistics | | | | | | | | | 28,662 |
| | Airlines – 0.1% | | | | | | | | | |
| | | | | |
| 390 | | Southwest Airlines Co. | | | | | | | | | 4,333 |
| | Auto Components – 0.2% | | | | | | | | | |
| | | | | |
| 60 | | Goodyear Tire & Rubber Company, (2) | | | | | | | | | 596 |
| | | | | |
| 250 | | Johnson Controls, Inc. | | | | | | | | | 6,718 |
| | Total Auto Components | | | | | | | | | 7,314 |
| | Automobiles – 0.8% | | | | | | | | | |
| | | | | |
| 2,140 | | Ford Motor Company, (2) | | | | | | | | | 21,571 |
| | | | | |
| 130 | | Harley-Davidson, Inc. | | | | | | | | | 2,890 |
| | Total Automobiles | | | | | | | | | 24,461 |
| | Beverages – 2.2% | | | | | | | | | |
| | | | | |
| 30 | | Brown-Forman Corporation | | | | | | | | | 1,717 |
| | | | | |
| 500 | | Coca-Cola Company | | | | | | | | | 25,060 |
| | | | | |
| 150 | | Coca-Cola Enterprises Inc. | | | | | | | | | 3,879 |
| | | | | |
| 80 | | Constellation Brands, Inc., Class A, (2) | | | | | | | | | 1,249 |
| | | | | |
| 120 | | Dr. Pepper Snapple Group | | | | | | | | | 4,487 |
| | | | | |
| 30 | | Molson Coors Brewing Company, Class B | | | | | | | | | 1,271 |
| | | | | |
| 500 | | PepsiCo, Inc. | | | | | | | | | 30,475 |
| | Total Beverages | | | | | | | | | 68,138 |
| | Biotechnology – 0.6% | | | | | | | | | |
| | | | | |
| 160 | | Amgen Inc., (2) | | | | | | | | | 8,416 |
| | | | | |
| 30 | | Biogen Idec Inc., (2) | | | | | | | | | 1,423 |
| | | | | |
| 80 | | Celgene Corporation, (2) | | | | | | | | | 4,066 |
| | | | | |
| 20 | | Cephalon, Inc., (2) | | | | | | | | | 1,135 |
| | | | | |
| 10 | | Genzyme Corporation, (2) | | | | | | | | | 508 |
| | | | | | | | | | | |
| Shares | | Description (1) | | | | | | | | Value |
| | | | | | | | | | | |
| | Biotechnology (continued) | | | | | | | | | |
| | | | | |
| 110 | | Gilead Sciences, Inc., (2) | | | | | | | | $ | 3,771 |
| | Total Biotechnology | | | | | | | | | 19,319 |
| | Building Products – 0.0% | | | | | | | | | |
| | | | | |
| 130 | | Masco Corporation | | | | | | | | | 1,399 |
| | Capital Markets – 1.7% | | | | | | | | | |
| | | | | |
| 100 | | Ameriprise Financial, Inc. | | | | | | | | | 3,613 |
| | | | | |
| 200 | | Bank of New York Company, Inc. | | | | | | | | | 4,938 |
| | | | | |
| 50 | | Charles Schwab Corporation | | | | | | | | | 709 |
| | | | | |
| 70 | | E*Trade Group Inc., (2) | | | | | | | | | 827 |
| | | | | |
| 20 | | Federated Investors Inc. | | | | | | | | | 414 |
| | | | | |
| 60 | | Franklin Resources, Inc. | | | | | | | | | 5,171 |
| | | | | |
| 210 | | Goldman Sachs Group, Inc. | | | | | | | | | 27,567 |
| | | | | |
| 100 | | Invesco LTD | | | | | | | | | 1,683 |
| | | | | |
| 20 | | Janus Capital Group Inc. | | | | | | | | | 178 |
| | | | | |
| 60 | | Legg Mason, Inc. | | | | | | | | | 1,682 |
| | | | | |
| 90 | | Morgan Stanley | | | | | | | | | 2,089 |
| | | | | |
| 30 | | Northern Trust Corporation | | | | | | | | | 1,401 |
| | | | | |
| 20 | | State Street Corporation | | | | | | | | | 676 |
| | | | | |
| 60 | | T. Rowe Price Group Inc. | | | | | | | | | 2,663 |
| | Total Capital Markets | | | | | | | | | 53,611 |
| | Chemicals – 1.6% | | | | | | | | | |
| | | | | |
| 50 | | Air Products & Chemicals Inc. | | | | | | | | | 3,240 |
| | | | | |
| 30 | | Airgas, Inc. | | | | | | | | | 1,866 |
| | | | | |
| 20 | | CF Industries Holdings, Inc. | | | | | | | | | 1,269 |
| | | | | |
| 500 | | Dow Chemical Company | | | | | | | | | 11,860 |
| | | | | |
| 380 | | E.I. Du Pont de Nemours and Company | | | | | | | | | 13,144 |
| | | | | |
| 30 | | Eastman Chemical Company | | | | | | | | | 1,601 |
| | | | | |
| 60 | | Ecolab Inc. | | | | | | | | | 2,695 |
| | | | | |
| 20 | | FMC Corporation | | | | | | | | | 1,149 |
| | | | | |
| 30 | | International Flavors & Fragrances Inc. | | | | | | | | | 1,273 |
| | | | | |
| 30 | | Monsanto Company | | | | | | | | | 1,386 |
| | | | | |
| 70 | | PPG Industries, Inc. | | | | | | | | | 4,229 |
| | | | | |
| 50 | | Praxair, Inc. | | | | | | | | | 3,799 |
| | | | | |
| 40 | | Sherwin-Williams Company | | | | | | | | | 2,768 |
| | | | | |
| 20 | | Sigma-Aldrich Corporation | | | | | | | | | 996 |
| | Total Chemicals | | | | | | | | | 51,275 |
| | Commercial Banks – 3.9% | | | | | | | | | |
| | | | | |
| 380 | | BB&T Corporation | | | | | | | | | 9,998 |
| | | | | |
| 90 | | Comerica Incorporated | | | | | | | | | 3,315 |
| | | | | |
| 530 | | Fifth Third Bancorp. | | | | | | | | | 6,514 |
| | | | | |
| 70 | | First Horizon National Corporation, (2) | | | | | | | | | 802 |
| | | | | |
| 410 | | Huntington BancShares Inc. | | | | | | | | | 2,271 |
| | | | | |
| 540 | | KeyCorp. | | | | | | | | | 4,152 |
| | | | | |
| 40 | | M&T Bank Corporation | | | | | | | | | 3,398 |
| | | | | |
| 260 | | Marshall and Ilsley Corporation | | | | | | | | | 1,867 |
Portfolio of Investments
Nuveen Enhanced Core Equity Fund (continued)
June 30, 2010
| | | | | | | | | | | |
| Shares | | Description (1) | | | | | | | | Value |
| | | | | | | | | | | |
| | Commercial Banks (continued) | | | | | | | | | |
| | | | | |
| 270 | | PNC Financial Services Group, Inc. | | | | | | | | $ | 15,255 |
| | | | | |
| 930 | | Regions Financial Corporation | | | | | | | | | 6,119 |
| | | | | |
| 400 | | SunTrust Banks, Inc. | | | | | | | | | 9,320 |
| | | | | |
| 620 | | U.S. Bancorp | | | | | | | | | 13,857 |
| | | | | |
| 1,640 | | Wells Fargo & Company | | | | | | | | | 41,984 |
| | | | | |
| 110 | | Zions Bancorporation | | | | | | | | | 2,373 |
| | Total Commercial Banks | | | | | | | | | 121,225 |
| | Commercial Services & Supplies – 0.5% | | | | | | | | | |
| | | | | |
| 40 | | Avery Dennison Corporation | | | | | | | | | 1,285 |
| | | | | |
| 30 | | Cintas Corporation | | | | | | | | | 719 |
| | | | | |
| 10 | | Iron Mountain Inc. | | | | | | | | | 225 |
| | | | | |
| 80 | | Pitney Bowes Inc. | | | | | | | | | 1,757 |
| | | | | |
| 120 | | R.R. Donnelley & Sons Company | | | | | | | | | 1,964 |
| | | | | |
| 110 | | Republic Services, Inc. | | | | | | | | | 3,270 |
| | | | | |
| 10 | | Stericycle Inc., (2) | | | | | | | | | 656 |
| | | | | |
| 180 | | Waste Management, Inc. | | | | | | | | | 5,632 |
| | Total Commercial Services & Supplies | | | | | | | | | 15,508 |
| | Communications Equipment – 1.3% | | | | | | | | | |
| | | | | |
| 1,280 | | Cisco Systems, Inc., (2) | | | | | | | | | 27,277 |
| | | | | |
| 50 | | Harris Corporation | | | | | | | | | 2,082 |
| | | | | |
| 140 | | JDS Uniphase Corporation, (2) | | | | | | | | | 1,378 |
| | | | | |
| 70 | | Juniper Networks Inc., (2) | | | | | | | | | 1,597 |
| | | | | |
| 330 | | Motorola, Inc., (2) | | | | | | | | | 2,151 |
| | | | | |
| 120 | | QUALCOMM, Inc. | | | | | | | | | 3,941 |
| | | | | |
| 230 | | Tellabs Inc. | | | | | | | | | 1,470 |
| | Total Communications Equipment | | | | | | | | | 39,896 |
| | Computers & Peripherals – 5.3% | | | | | | | | | |
| | | | | |
| 350 | | Apple, Inc., (2) | | | | | | | | | 88,035 |
| | | | | |
| 290 | | Dell Inc., (2) | | | | | | | | | 3,497 |
| | | | | |
| 820 | | EMC Corporation, (2) | | | | | | | | | 15,006 |
| | | | | |
| 820 | | Hewlett-Packard Company | | | | | | | | | 35,490 |
| | | | | |
| 60 | | Lexmark International, Inc., Class A, (2) | | | | | | | | | 1,982 |
| | | | | |
| 180 | | Network Appliance Inc., (2) | | | | | | | | | 6,716 |
| | | | | |
| 30 | | QLogic Corporation, (2) | | | | | | | | | 499 |
| | | | | |
| 190 | | SanDisk Corporation, (2) | | | | | | | | | 7,993 |
| | | | | |
| 60 | | Teradata Corporation, (2) | | | | | | | | | 1,829 |
| | | | | |
| 130 | | Western Digital Corporation, (2) | | | | | | | | | 3,921 |
| | Total Computers & Peripherals | | | | | | | | | 164,968 |
| | Construction & Engineering – 0.1% | | | | | | | | | |
| | | | | |
| 40 | | Fluor Corporation | | | | | | | | | 1,700 |
| | | | | |
| 20 | | Jacobs Engineering Group, Inc., (2) | | | | | | | | | 729 |
| | | | | |
| 10 | | Quanta Services Incorporated, (2) | | | | | | | | | 206 |
| | Total Construction & Engineering | | | | | | | | | 2,635 |
| | Construction Materials – 0.0% | | | | | | | | | |
| | | | | |
| 30 | | Vulcan Materials Company | | | | | | | | | 1,315 |
| | | | | | | | | | | |
| Shares | | Description (1) | | | | | | | | Value |
| | | | | | | | | | | |
| | Consumer Finance – 1.2% | | | | | | | | | |
| | | | | |
| 490 | | American Express Company | | | | | | | | $ | 19,453 |
| | | | | |
| 260 | | Capital One Financial Corporation | | | | | | | | | 10,478 |
| | | | | |
| 300 | | Discover Financial Services | | | | | | | | | 4,194 |
| | | | | |
| 230 | | SLM Corporation, (2) | | | | | | | | | 2,390 |
| | Total Consumer Finance | | | | | | | | | 36,515 |
| | Containers & Packaging – 0.2% | | | | | | | | | |
| | | | | |
| 30 | | Ball Corporation | | | | | | | | | 1,585 |
| | | | | |
| 30 | | Bemis Company, Inc. | | | | | | | | | 810 |
| | | | | |
| 30 | | Owens-Illinois, Inc., (2) | | | | | | | | | 794 |
| | | | | |
| 50 | | Pactiv Corporation, (2) | | | | | | | | | 1,392 |
| | | | | |
| 50 | | Sealed Air Corporation | | | | | | | | | 986 |
| | Total Containers & Packaging | | | | | | | | | 5,567 |
| | Distributors – 0.1% | | | | | | | | | |
| | | | | |
| 60 | | Genuine Parts Company | | | | | | | | | 2,367 |
| | Diversified Consumer Services – 0.1% | | | | | | | | | |
| | | | | |
| 20 | | Apollo Group, Inc., (2) | | | | | | | | | 849 |
| | | | | |
| 20 | | Devry, Inc. | | | | | | | | | 1,050 |
| | | | | |
| 100 | | H & R Block Inc. | | | | | | | | | 1,569 |
| | Total Diversified Consumer Services | | | | | | | | | 3,468 |
| | Diversified Financial Services – 4.5% | | | | | | | | | |
| | | | | |
| 4,170 | | Bank of America Corporation | | | | | | | | | 59,923 |
| | | | | |
| 4,260 | | Citigroup Inc., (2) | | | | | | | | | 16,018 |
| | | | | |
| 10 | | CME Group, Inc. | | | | | | | | | 2,815 |
| | | | | |
| 10 | | Intercontinental Exchange, Inc., (2) | | | | | | | | | 1,130 |
| | | | | |
| 1,550 | | JP Morgan Chase & Co. | | | | | | | | | 56,746 |
| | | | | |
| 40 | | Leucadia National Corporation, (2) | | | | | | | | | 780 |
| | | | | |
| 40 | | Moody’s Corporation | | | | | | | | | 797 |
| | | | | |
| 40 | | Nasdaq Stock Market, Inc., (2) | | | | | | | | | 711 |
| | | | | |
| 50 | | New York Stock Exchange Euronext | | | | | | | | | 1,382 |
| | Total Diversified Financial Services | | | | | | | | | 140,302 |
| | Diversified Telecommunication Services – 2.9% | | | | | | | | | |
| | | | | |
| 2,120 | | AT&T Inc. | | | | | | | | | 51,283 |
| | | | | |
| 140 | | CenturyTel, Inc. | | | | | | | | | 4,663 |
| | | | | |
| 150 | | Frontier Communications Corporation | | | | | | | | | 1,067 |
| | | | | |
| 910 | | Qwest Communications International Inc. | | | | | | | | | 4,777 |
| | | | | |
| 930 | | Verizon Communications Inc. | | | | | | | | | 26,059 |
| | | | | |
| 240 | | Windstream Corporation | | | | | | | | | 2,534 |
| | Total Diversified Telecommunication Services | | | | | | | | | 90,383 |
| | Electric Utilities – 2.1% | | | | | | | | | |
| | | | | |
| 50 | | Allegheny Energy, Inc. | | | | | | | | | 1,034 |
| | | | | |
| 220 | | American Electric Power Company, Inc. | | | | | | | | | 7,106 |
| | | | | |
| 600 | | Duke Energy Corporation | | | | | | | | | 9,600 |
| | | | | |
| 130 | | Edison International | | | | | | | | | 4,124 |
| | | | | |
| 60 | | Entergy Corporation | | | | | | | | | 4,297 |
| | | | | |
| 190 | | Exelon Corporation | | | | | | | | | 7,214 |
Portfolio of Investments
Nuveen Enhanced Core Equity Fund (continued)
June 30, 2010
| | | | | | | | | | | |
| Shares | | Description (1) | | | | | | | | Value |
| | | | | | | | | | | |
| | Electric Utilities (continued) | | | | | | | | | |
| | | | | |
| 110 | | FirstEnergy Corp. | | | | | | | | $ | 3,875 |
| | | | | |
| 100 | | NextEra Energy Inc. | | | | | | | | | 4,876 |
| | | | | |
| 80 | | Northeast Utilities | | | | | | | | | 2,038 |
| | | | | |
| 120 | | Pepco Holdings, Inc. | | | | | | | | | 1,882 |
| | | | | |
| 50 | | Pinnacle West Capital Corporation | | | | | | | | | 1,818 |
| | | | | |
| 90 | | PPL Corporation | | | | | | | | | 2,246 |
| | | | | |
| 120 | | Progress Energy, Inc. | | | | | | | | | 4,706 |
| | | | | |
| 330 | | Southern Company | | | | | | | | | 10,982 |
| | Total Electric Utilities | | | | | | | | | 65,798 |
| | Electrical Equipment – 0.6% | | | | | | | | | |
| | | | | |
| 290 | | Emerson Electric Company | | | | | | | | | 12,670 |
| | | | | |
| 70 | | Rockwell Automation, Inc. | | | | | | | | | 3,436 |
| | | | | |
| 30 | | Roper Industries Inc. | | | | | | | | | 1,679 |
| | Total Electrical Equipment | | | | | | | | | 17,785 |
| | Electronic Equipment & Instruments – 0.6% | | | | | | | | | |
| | | | | |
| 160 | | Agilent Technologies, Inc., (2) | | | | | | | | | 4,549 |
| | | | | |
| 40 | | Amphenol Corporation, Class A | | | | | | | | | 1,571 |
| | | | | |
| 480 | | Corning Incorporated | | | | | | | | | 7,752 |
| | | | | |
| 40 | | FLIR Systems Inc., (2) | | | | | | | | | 1,164 |
| | | | | |
| 100 | | Jabil Circuit Inc. | | | | | | | | | 1,330 |
| | | | | |
| 50 | | Molex Inc. | | | | | | | | | 912 |
| | Total Electronic Equipment & Instruments | | | | | | | | | 17,278 |
| | Energy Equipment & Services – 0.9% | | | | | | | | | |
| | | | | |
| 40 | | Baker Hughes Incorporated | | | | | | | | | 1,663 |
| | | | | |
| 50 | | Cooper Cameron Corporation, (2) | | | | | | | | | 1,626 |
| | | | | |
| 20 | | Diamond Offshore Drilling, Inc. | | | | | | | | | 1,244 |
| | | | | |
| 40 | | FMC Technologies Inc., (2) | | | | | | | | | 2,106 |
| | | | | |
| 150 | | Halliburton Company | | | | | | | | | 3,683 |
| | | | | |
| 20 | | Helmerich & Payne Inc. | | | | | | | | | 730 |
| | | | | |
| 70 | | Nabors Industries Inc., (2) | | | | | | | | | 1,233 |
| | | | | |
| 120 | | National-Oilwell Varco Inc. | | | | | | | | | 3,968 |
| | | | | |
| 60 | | Rowan Companies Inc., (2) | | | | | | | | | 1,316 |
| | | | | |
| 130 | | Schlumberger Limited | | | | | | | | | 7,194 |
| | | | | |
| 80 | | Smith International, Inc. | | | | | | | | | 3,012 |
| | Total Energy Equipment & Services | | | | | | | | | 27,775 |
| | Food & Staples Retailing – 2.1% | | | | | | | | | |
| | | | | |
| 110 | | Costco Wholesale Corporation | | | | | | | | | 6,031 |
| | | | | |
| 440 | | CVS Caremark Corporation | | | | | | | | | 12,901 |
| | | | | |
| 100 | | Kroger Co. | | | | | | | | | 1,969 |
| | | | | |
| 130 | | Safeway Inc. | | | | | | | | | 2,556 |
| | | | | |
| 90 | | SUPERVALU INC. | | | | | | | | | 975 |
| | | | | |
| 210 | | Sysco Corporation | | | | | | | | | 6,000 |
| | | | | |
| 270 | | Walgreen Co. | | | | | | | | | 7,209 |
| | | | | |
| 500 | | Wal-Mart Stores, Inc. | | | | | | | | | 24,035 |
| | | | | |
| 110 | | Whole Foods Market, Inc., (2) | | | | | | | | | 3,962 |
| | Total Food & Staples Retailing | | | | | | | | | 65,638 |
| | | | | | | | | | | |
| Shares | | Description (1) | | | | | | | | Value |
| | | | | | | | | | | |
| | Food Products – 2.0% | | | | | | | | | |
| | | | | |
| 110 | | Archer-Daniels-Midland Company | | | | | | | | $ | 2,840 |
| | | | | |
| 70 | | Campbell Soup Company | | | | | | | | | 2,508 |
| | | | | |
| 190 | | ConAgra Foods, Inc. | | | | | | | | | 4,431 |
| | | | | |
| 60 | | Dean Foods Company, (2) | | | | | | | | | 604 |
| | | | | |
| 260 | | General Mills, Inc. | | | | | | | | | 9,235 |
| | | | | |
| 110 | | H.J. Heinz Company | | | | | | | | | 4,754 |
| | | | | |
| 50 | | Hershey Foods Corporation | | | | | | | | | 2,397 |
| | | | | |
| 20 | | Hormel Foods Corporation | | | | | | | | | 810 |
| | | | | |
| 50 | | JM Smucker Company | | | | | | | | | 3,011 |
| | | | | |
| 90 | | Kellogg Company | | | | | | | | | 4,527 |
| | | | | |
| 560 | | Kraft Foods Inc. | | | | | | | | | 15,680 |
| | | | | |
| 50 | | McCormick & Company, Incorporated | | | | | | | | | 1,898 |
| | | | | |
| 70 | | Mead Johnson Nutrition Company, Class A Shares | | | | | | | | | 3,508 |
| | | | | |
| 360 | | Sara Lee Corporation | | | | | | | | | 5,076 |
| | | | | |
| 130 | | Tyson Foods, Inc., Class A | | | | | | | | | 2,131 |
| | Total Food Products | | | | | | | | | 63,410 |
| | Gas Utilities – 0.2% | | | | | | | | | |
| | | | | |
| 30 | | EQT Corporation | | | | | | | | | 1,084 |
| | | | | |
| 20 | | Nicor Inc. | | | | | | | | | 810 |
| | | | | |
| 60 | | ONEOK, Inc. | | | | | | | | | 2,595 |
| | | | | |
| 70 | | Questar Corporation | | | | | | | | | 3,184 |
| | Total Gas Utilities | | | | | | | | | 7,673 |
| | Health Care Equipment & Supplies – 1.5% | | | | | | | | | |
| | | | | |
| 110 | | Baxter International, Inc. | | | | | | | | | 4,470 |
| | | | | |
| 50 | | Becton, Dickinson and Company | | | | | | | | | 3,381 |
| | | | | |
| 210 | | Boston Scientific Corporation, (2) | | | | | | | | | 1,218 |
| | | | | |
| 20 | | C. R. Bard, Inc. | | | | | | | | | 1,551 |
| | | | | |
| 100 | | CareFusion Corporation, (2) | | | | | | | | | 2,270 |
| | | | | |
| 20 | | DENTSPLY International Inc. | | | | | | | | | 598 |
| | | | | |
| 60 | | Hospira Inc., (2) | | | | | | | | | 3,447 |
| | | | | |
| 20 | | Intuitive Surgical, Inc., (2) | | | | | | | | | 6,312 |
| | | | | |
| 310 | | Medtronic, Inc. | | | | | | | | | 11,244 |
| | | | | |
| 30 | | Saint Jude Medical Inc., (2) | | | | | | | | | 1,083 |
| | | | | |
| 90 | | Stryker Corporation | | | | | | | | | 4,505 |
| | | | | |
| 40 | | Varian Medical Systems, Inc., (2) | | | | | | | | | 2,091 |
| | | | | |
| 80 | | Zimmer Holdings, Inc., (2) | | | | | | | | | 4,324 |
| | Total Health Care Equipment & Supplies | | | | | | | | | 46,494 |
| | Health Care Providers & Services – 2.2% | | | | | | | | | |
| | | | | |
| 120 | | Aetna Inc. | | | | | | | | | 3,166 |
| | | | | |
| 150 | | AmerisourceBergen Corporation | | | | | | | | | 4,763 |
| | | | | |
| 140 | | Cardinal Health, Inc. | | | | | | | | | 4,705 |
| | | | | |
| 120 | | CIGNA Corporation | | | | | | | | | 3,727 |
| | | | | |
| 70 | | Coventry Health Care, Inc., (2) | | | | | | | | | 1,238 |
| | | | | |
| 40 | | Davita Inc., (2) | | | | | | | | | 2,498 |
| | | | | |
| 210 | | Express Scripts, Inc., (2) | | | | | | | | | 9,874 |
Portfolio of Investments
Nuveen Enhanced Core Equity Fund (continued)
June 30, 2010
| | | | | | | | | | | |
| Shares | | Description (1) | | | | | | | | Value |
| | | | | | | | | | | |
| | Health Care Providers & Services (continued) | | | | | | | | | |
| | | | | |
| 90 | | Humana Inc., (2) | | | | | | | | $ | 4,110 |
| | | | | |
| 30 | | Laboratory Corporation of America Holdings, (2) | | | | | | | | | 2,260 |
| | | | | |
| 140 | | McKesson HBOC Inc. | | | | | | | | | 9,402 |
| | | | | |
| 110 | | Medco Health Solutions, Inc., (2) | | | | | | | | | 6,059 |
| | | | | |
| 30 | | Patterson Companies, Inc. | | | | | | | | | 856 |
| | | | | |
| 30 | | Quest Diagnostics Incorporated | | | | | | | | | 1,493 |
| | | | | |
| 240 | | Tenet Healthcare Corporation, (2) | | | | | | | | | 1,042 |
| | | | | |
| 300 | | UnitedHealth Group Incorporated | | | | | | | | | 8,520 |
| | | | | |
| 140 | | Wellpoint Inc., (2) | | | | | | | | | 6,850 |
| | Total Health Care Providers & Services | | | | | | | | | 70,563 |
| | Health Care Technology – 0.0% | | | | | | | | | |
| | | | | |
| 20 | | Cerner Corporation, (2) | | | | | | | | | 1,518 |
| | Hotels, Restaurants & Leisure – 1.8% | | | | | | | | | |
| | | | | |
| 220 | | Carnival Corporation | | | | | | | | | 6,653 |
| | | | | |
| 60 | | Darden Restaurants, Inc. | | | | | | | | | 2,331 |
| | | | | |
| 60 | | International Game Technology | | | | | | | | | 942 |
| | | | | |
| 80 | | Marriott International, Inc., Class A | | | | | | | | | 2,395 |
| | | | | |
| 330 | | McDonald’s Corporation | | | | | | | | | 21,737 |
| | | | | |
| 330 | | Starbucks Corporation | | | | | | | | | 8,019 |
| | | | | |
| 90 | | Starwood Hotels & Resorts Worldwide, Inc. | | | | | | | | | 3,729 |
| | | | | |
| 130 | | Wyndham Worldwide Corporation | | | | | | | | | 2,618 |
| | | | | |
| 40 | | Wynn Resorts Ltd | | | | | | | | | 3,051 |
| | | | | |
| 130 | | YUM! Brands, Inc. | | | | | | | | | 5,075 |
| | Total Hotels, Restaurants & Leisure | | | | | | | | | 56,550 |
| | Household Durables – 0.6% | | | | | | | | | |
| | | | | |
| 100 | | D.R. Horton, Inc. | | | | | | | | | 983 |
| | | | | |
| 60 | | Fortune Brands Inc. | | | | | | | | | 2,351 |
| | | | | |
| 30 | | Harman International Industries Inc., (2) | | | | | | | | | 897 |
| | | | | |
| 80 | | Leggett and Platt Inc. | | | | | | | | | 1,605 |
| | | | | |
| 110 | | Lennar Corporation, Class A | | | | | | | | | 1,530 |
| | | | | |
| 140 | | Newell Rubbermaid Inc. | | | | | | | | | 2,050 |
| | | | | |
| 100 | | Pulte Corporation, (2) | | | | | | | | | 828 |
| | | | | |
| 80 | | Stanley Black & Decker Inc. | | | | | | | | | 4,041 |
| | | | | |
| 50 | | Whirlpool Corporation | | | | | | | | | 4,391 |
| | Total Household Durables | | | | | | | | | 18,676 |
| | Household Products – 2.4% | | | | | | | | | |
| | | | | |
| 50 | | Clorox Company | | | | | | | | | 3,108 |
| | | | | |
| 110 | | Colgate-Palmolive Company | | | | | | | | | 8,664 |
| | | | | |
| 140 | | Kimberly-Clark Corporation | | | | | | | | | 8,488 |
| | | | | |
| 930 | | Procter & Gamble Company | | | | | | | | | 55,781 |
| | Total Household Products | | | | | | | | | 76,041 |
| | Independent Power Producers & Energy Traders – 0.3% | | | | | | | | | |
| | | | | |
| 220 | | AES Corporation, (2) | | | | | | | | | 2,033 |
| | | | | |
| 120 | | Constellation Energy Group | | | | | | | | | 3,870 |
| | | | | |
| 120 | | NRG Energy Inc., (2) | | | | | | | | | 2,545 |
| | Total Independent Power Producers & Energy Traders | | | | | | | | | 8,448 |
| | | | | | | | | | | |
| Shares | | Description (1) | | | | | | | | Value |
| | | | | | | | | | | |
| | Industrial Conglomerates – 2.7% | | | | | | | | | |
| | | | | |
| 280 | | 3M Co. | | | | | | | | $ | 22,117 |
| | | | | |
| 4,240 | | General Electric Company | | | | | | | | | 61,141 |
| | | | | |
| 150 | | Textron Inc. | | | | | | | | | 2,545 |
| | Total Industrial Conglomerates | | | | | | | | | 85,803 |
| | Insurance – 4.6% | | | | | | | | | |
| | | | | |
| 230 | | AFLAC Incorporated | | | | | | | | | 9,814 |
| | | | | |
| 240 | | Allstate Corporation | | | | | | | | | 6,895 |
| | | | | |
| 50 | | American International Group, (2) | | | | | | | | | 1,722 |
| | | | | |
| 60 | | Aon Corporation | | | | | | | | | 2,227 |
| | | | | |
| 60 | | Assurant Inc. | | | | | | | | | 2,082 |
| | | | | |
| 480 | | Berkshire Hathaway Inc., Class B, (2) | | | | | | | | | 38,251 |
| | | | | |
| 140 | | Chubb Corporation | | | | | | | | | 7,001 |
| | | | | |
| 80 | | Cincinnati Financial Corporation | | | | | | | | | 2,070 |
| | | | | |
| 430 | | Genworth Financial Inc., Class A, (2) | | | | | | | | | 5,620 |
| | | | | |
| 270 | | Hartford Financial Services Group, Inc. | | | | | | | | | 5,975 |
| | | | | |
| 110 | | Lincoln National Corporation | | | | | | | | | 2,672 |
| | | | | |
| 160 | | Loews Corporation | | | | | | | | | 5,330 |
| | | | | |
| 120 | | Marsh & McLennan Companies, Inc. | | | | | | | | | 2,706 |
| | | | | |
| 300 | | MetLife, Inc. | | | | | | | | | 11,328 |
| | | | | |
| 160 | | Principal Financial Group, Inc. | | | | | | | | | 3,750 |
| | | | | |
| 220 | | Progressive Corporation | | | | | | | | | 4,118 |
| | | | | |
| 250 | | Prudential Financial, Inc. | | | | | | | | | 13,415 |
| | | | | |
| 40 | | Torchmark Corporation | | | | | | | | | 1,980 |
| | | | | |
| 210 | | Travelers Companies, Inc. | | | | | | | | | 10,343 |
| | | | | |
| 160 | | Unum Group | | | | | | | | | 3,472 |
| | | | | |
| 170 | | XL Capital Ltd, Class A | | | | | | | | | 2,722 |
| | Total Insurance | | | | | | | | | 143,493 |
| | Internet & Catalog Retail – 0.6% | | | | | | | | | |
| | | | | |
| 130 | | Amazon.com, Inc., (2) | | | | | | | | | 14,204 |
| | | | | |
| 60 | | Expedia, Inc. | | | | | | | | | 1,127 |
| | | | | |
| 20 | | Priceline.com Incorporated, (2) | | | | | | | | | 3,531 |
| | Total Internet & Catalog Retail | | | | | | | | | 18,862 |
| | Internet Software & Services – 1.0% | | | | | | | | | |
| | | | | |
| 80 | | Akamai Technologies, Inc., (2) | | | | | | | | | 3,246 |
| | | | | |
| 380 | | eBay Inc., (2) | | | | | | | | | 7,452 |
| | | | | |
| 40 | | Google Inc., Class A, (2) | | | | | | | | | 17,798 |
| | | | | |
| 30 | | Monster Worldwide Inc., (2) | | | | | | | | | 349 |
| | | | | |
| 40 | | VeriSign, Inc., (2) | | | | | | | | | 1,062 |
| | | | | |
| 80 | | Yahoo! Inc., (2) | | | | | | | | | 1,106 |
| | Total Internet Software & Services | | | | | | | | | 31,013 |
| | IT Services – 2.5% | | | | | | | | | |
| | | | | |
| 130 | | Automatic Data Processing, Inc. | | | | | | | | | 5,234 |
| | | | | |
| 150 | | Cognizant Technology Solutions Corporation, Class A, (2) | | | | | | | | | 7,509 |
| | | | | |
| 60 | | Computer Sciences Corporation | | | | | | | | | 2,715 |
| | | | | |
| 120 | | Fidelity National Information Services | | | | | | | | | 3,218 |
Portfolio of Investments
Nuveen Enhanced Core Equity Fund (continued)
June 30, 2010
| | | | | | | | | | | |
| Shares | | Description (1) | | | | | | | | Value |
| | | | | | | | | | | |
| | IT Services (continued) | | | | | | | | | |
| | | | | |
| 40 | | Fiserv, Inc., (2) | | | | | | | | $ | 1,826 |
| | | | | |
| 380 | | International Business Machines Corporation (IBM) | | | | | | | | | 46,922 |
| | | | | |
| 20 | | MasterCard, Inc. | | | | | | | | | 3,991 |
| | | | | |
| 60 | | Paychex, Inc. | | | | | | | | | 1,558 |
| | | | | |
| 40 | | SAIC, Inc., (2) | | | | | | | | | 670 |
| | | | | |
| 50 | | Total System Services Inc. | | | | | | | | | 680 |
| | | | | |
| 50 | | Visa Inc. | | | | | | | | | 3,538 |
| | | | | |
| 90 | | Western Union Company | | | | | | | | | 1,342 |
| | Total IT Services | | | | | | | | | 79,203 |
| | Leisure Equipment & Products – 0.2% | | | | | | | | | |
| | | | | |
| 260 | | Eastman Kodak Company, (2) | | | | | | | | | 1,128 |
| | | | | |
| 70 | | Hasbro, Inc. | | | | | | | | | 2,877 |
| | | | | |
| 170 | | Mattel, Inc. | | | | | | | | | 3,597 |
| | Total Leisure Equipment & Products | | | | | | | | | 7,602 |
| | Life Sciences Tools & Services – 0.5% | | | | | | | | | |
| | | | | |
| 50 | | Life Technologies Corporation, (2) | | | | | | | | | 2,362 |
| | | | | |
| 30 | | Millipore Corporation, (2) | | | | | | | | | 3,200 |
| | | | | |
| 40 | | Perkinelmer Inc. | | | | | | | | | 827 |
| | | | | |
| 130 | | Thermo Fisher Scientific, Inc., (2) | | | | | | | | | 6,376 |
| | | | | |
| 30 | | Waters Corporation, (2) | | | | | | | | | 1,941 |
| | Total Life Sciences Tools & Services | | | | | | | | | 14,706 |
| | Machinery – 2.1% | | | | | | | | | |
| | | | | |
| 300 | | Caterpillar Inc. | | | | | | | | | 18,021 |
| | | | | |
| 110 | | Cummins Inc. | | | | | | | | | 7,164 |
| | | | | |
| 140 | | Danaher Corporation | | | | | | | | | 5,197 |
| | | | | |
| 140 | | Deere & Company | | | | | | | | | 7,795 |
| | | | | |
| 70 | | Dover Corporation | | | | | | | | | 2,925 |
| | | | | |
| 80 | | Eaton Corporation | | | | | | | | | 5,235 |
| | | | | |
| 20 | | Flowserve Corporation | | | | | | | | | 1,696 |
| | | | | |
| 150 | | Illinois Tool Works, Inc. | | | | | | | | | 6,192 |
| | | | | |
| 100 | | PACCAR Inc. | | | | | | | | | 3,987 |
| | | | | |
| 40 | | Pall Corporation | | | | | | | | | 1,375 |
| | | | | |
| 70 | | Parker Hannifin Corporation | | | | | | | | | 3,882 |
| | | | | |
| 30 | | Snap-on Incorporated | | | | | | | | | 1,227 |
| | Total Machinery | | | | | | | | | 64,696 |
| | Media – 4.2% | | | | | | | | | |
| | | | | |
| 410 | | CBS Corporation, Class B | | | | | | | | | 5,301 |
| | | | | |
| 1,350 | | Comcast Corporation, Class A | | | | | | | | | 23,450 |
| | | | | |
| 470 | | DIRECTV Group, Inc., (2) | | | | | | | | | 15,942 |
| | | | | |
| 130 | | Discovery Communications inc., Class A Shares, (2) | | | | | | | | | 4,642 |
| | | | | |
| 170 | | Gannett Company Inc. | | | | | | | | | 2,288 |
| | | | | |
| 230 | | Interpublic Group Companies, Inc., (2) | | | | | | | | | 1,640 |
| | | | | |
| 60 | | McGraw-Hill Companies, Inc. | | | | | | | | | 1,688 |
| | | | | |
| 10 | | Meredith Corporation | | | | | | | | | 311 |
| | | | | |
| 40 | | New York Times, Class A, (2) | | | | | | | | | 346 |
| | | | | | | | | | | |
| Shares | | Description (1) | | | | | | | | Value |
| | | | | | | | | | | |
| | Media (continued) | | | | | | | | | |
| | | | | |
| 900 | | News Corporation, Class A | | | | | | | | $ | 10,764 |
| | | | | |
| 120 | | Omnicom Group, Inc. | | | | | | | | | 4,116 |
| | | | | |
| 40 | | Scripps Networks Interactive, Class A Shares | | | | | | | | | 1,614 |
| | | | | |
| 240 | | Time Warner Cable, Class A | | | | | | | | | 12,499 |
| | | | | |
| 610 | | Time Warner Inc. | | | | | | | | | 17,635 |
| | | | | |
| 310 | | Viacom Inc., Class B | | | | | | | | | 9,725 |
| | | | | |
| 640 | | Walt Disney Company | | | | | | | | | 20,160 |
| | Total Media | | | | | | | | | 132,121 |
| | Metals & Mining – 1.1% | | | | | | | | | |
| | | | | |
| 10 | | AK Steel Holding Corporation | | | | | | | | | 119 |
| | | | | |
| 320 | | Alcoa Inc. | | | | | | | | | 3,219 |
| | | | | |
| 40 | | Allegheny Technologies, Inc. | | | | | | | | | 1,768 |
| | | | | |
| 80 | | Cliffs Natural Resources Inc. | | | | | | | | | 3,773 |
| | | | | |
| 220 | | Freeport-McMoRan Copper & Gold, Inc. | | | | | | | | | 13,009 |
| | | | | |
| 140 | | Newmont Mining Corporation | | | | | | | | | 8,644 |
| | | | | |
| 50 | | Nucor Corporation | | | | | | | | | 1,914 |
| | | | | |
| 50 | | Titanium Metals Corporation, (2) | | | | | | | | | 879 |
| | | | | |
| 40 | | United States Steel Corporation | | | | | | | | | 1,542 |
| | Total Metals & Mining | | | | | | | | | 34,867 |
| | Multiline Retail – 1.2% | | | | | | | | | |
| | | | | |
| 50 | | Big Lots, Inc., (2) | | | | | | | | | 1,605 |
| | | | | |
| 60 | | Family Dollar Stores, Inc. | | | | | | | | | 2,261 |
| | | | | |
| 70 | | J.C. Penney Company, Inc. | | | | | | | | | 1,504 |
| | | | | |
| 100 | | Kohl’s Corporation, (2) | | | | | | | | | 4,750 |
| | | | | |
| 270 | | Macy’s, Inc. | | | | | | | | | 4,833 |
| | | | | |
| 100 | | Nordstrom, Inc. | | | | | | | | | 3,219 |
| | | | | |
| 30 | | Sears Holding Corporation, (2) | | | | | | | | | 1,940 |
| | | | | |
| 330 | | Target Corporation | | | | | | | | | 16,226 |
| | Total Multiline Retail | | | | | | | | | 36,338 |
| | Multi-Utilities – 1.8% | | | | | | | | | |
| | | | | |
| 120 | | Ameren Corporation | | | | | | | | | 2,852 |
| | | | | |
| 240 | | CenterPoint Energy, Inc. | | | | | | | | | 3,158 |
| | | | | |
| 120 | | CMS Energy Corporation | | | | | | | | | 1,758 |
| | | | | |
| 130 | | Consolidated Edison, Inc. | | | | | | | | | 5,603 |
| | | | | |
| 240 | | Dominion Resources, Inc. | | | | | | | | | 9,298 |
| | | | | |
| 100 | | DTE Energy Company | | | | | | | | | 4,561 |
| | | | | |
| 50 | | Integrys Energy Group, Inc. | | | | | | | | | 2,187 |
| | | | | |
| 170 | | NiSource Inc. | | | | | | | | | 2,465 |
| | | | | |
| 150 | | PG&E Corporation | | | | | | | | | 6,165 |
| | | | | |
| 130 | | Public Service Enterprise Group Incorporated | | | | | | | | | 4,073 |
| | | | | |
| 50 | | Scana Corporation | | | | | | | | | 1,788 |
| | | | | |
| 70 | | Sempra Energy | | | | | | | | | 3,275 |
| | | | | |
| 120 | | TECO Energy, Inc. | | | | | | | | | 1,808 |
| | | | | |
| 50 | | Wisconsin Energy Corporation | | | | | | | | | 2,537 |
| | | | | |
| 200 | | Xcel Energy, Inc. | | | | | | | | | 4,122 |
| | Total Multi-Utilities | | | | | | | | | 55,650 |
Portfolio of Investments
Nuveen Enhanced Core Equity Fund (continued)
June 30, 2010
| | | | | | | | | | | |
| Shares | | Description (1) | | | | | | | | Value |
| | | | | | | | | | | |
| | Office Electronics – 0.1% | | | | | | | | | |
| | | | | |
| 550 | | Xerox Corporation | | | | | | | | $ | 4,422 |
| | Oil, Gas & Consumable Fuels – 7.4% | | | | | | | | | |
| | | | | |
| 130 | | Anadarko Petroleum Corporation | | | | | | | | | 4,692 |
| | | | | |
| 60 | | Apache Corporation | | | | | | | | | 5,051 |
| | | | | |
| 10 | | Cabot Oil & Gas Corporation | | | | | | | | | 313 |
| | | | | |
| 140 | | Chesapeake Energy Corporation | | | | | | | | | 2,933 |
| | | | | |
| 720 | | Chevron Corporation | | | | | | | | | 48,859 |
| | | | | |
| 600 | | ConocoPhillips | | | | | | | | | 29,454 |
| | | | | |
| 40 | | CONSOL Energy Inc. | | | | | | | | | 1,350 |
| | | | | |
| 30 | | Denbury Resources Inc., (2) | | | | | | | | | 439 |
| | | | | |
| 70 | | Devon Energy Corporation | | | | | | | | | 4,264 |
| | | | | |
| 190 | | El Paso Corporation | | | | | | | | | 2,111 |
| | | | | |
| 90 | | EOG Resources, Inc. | | | | | | | | | 8,853 |
| | | | | |
| 1,323 | | Exxon Mobil Corporation | | | | | | | | | 75,504 |
| | | | | |
| 60 | | Hess Corporation | | | | | | | | | 3,020 |
| | | | | |
| 230 | | Marathon Oil Corporation | | | | | | | | | 7,151 |
| | | | | |
| 40 | | Massey Energy Company | | | | | | | | | 1,094 |
| | | | | |
| 40 | | Murphy Oil Corporation | | | | | | | | | 1,982 |
| | | | | |
| 20 | | Noble Energy, Inc. | | | | | | | | | 1,207 |
| | | | | |
| 220 | | Occidental Petroleum Corporation | | | | | | | | | 16,973 |
| | | | | |
| 50 | | Peabody Energy Corporation | | | | | | | | | 1,957 |
| | | | | |
| 60 | | Pioneer Natural Resources Company | | | | | | | | | 3,567 |
| | | | | |
| 10 | | Range Resources Corporation | | | | | | | | | 402 |
| | | | | |
| 10 | | Southwestern Energy Company, (2) | | | | | | | | | 386 |
| | | | | |
| 260 | | Spectra Energy Corporation | | | | | | | | | 5,218 |
| | | | | |
| 20 | | Sunoco, Inc. | | | | | | | | | 695 |
| | | | | |
| 40 | | Tesoro Corporation | | | | | | | | | 467 |
| | | | | |
| 90 | | Valero Energy Corporation | | | | | | | | | 1,618 |
| | | | | |
| 200 | | Williams Companies, Inc. | | | | | | | | | 3,656 |
| | Total Oil, Gas & Consumable Fuels | | | | | | | | | 233,216 |
| | Paper & Forest Products – 0.3% | | | | | | | | | |
| | | | | |
| 240 | | International Paper Company | | | | | | | | | 5,431 |
| | | | | |
| 100 | | MeadWestvaco Corporation | | | | | | | | | 2,220 |
| | | | | |
| 60 | | Weyerhaeuser Company | | | | | | | | | 2,112 |
| | Total Paper & Forest Products | | | | | | | | | 9,763 |
| | Personal Products – 0.1% | | | | | | | | | |
| | | | | |
| 40 | | Avon Products, Inc. | | | | | | | | | 1,060 |
| | | | | |
| 60 | | Estee Lauder Companies Inc., Class A | | | | | | | | | 3,344 |
| | Total Personal Products | | | | | | | | | 4,404 |
| | Pharmaceuticals – 5.1% | | | | | | | | | |
| | | | | |
| 400 | | Abbott Laboratories | | | | | | | | | 18,712 |
| | | | | |
| 80 | | Allergan, Inc. | | | | | | | | | 4,661 |
| | | | | |
| 590 | | Bristol-Myers Squibb Company | | | | | | | | | 14,715 |
| | | | | |
| 270 | | Eli Lilly and Company | | | | | | | | | 9,045 |
| | | | | |
| 80 | | Forest Laboratories, Inc., (2) | | | | | | | | | 2,194 |
| | | | | | | | | | | |
| Shares | | Description (1) | | | | | | | | Value |
| | | | | | | | | | | |
| | Pharmaceuticals (continued) | | | | | | | | | |
| | | | | |
| 710 | | Johnson & Johnson | | | | | | | | $ | 41,933 |
| | | | | |
| 40 | | King Pharmaceuticals Inc., (2) | | | | | | | | | 304 |
| | | | | |
| 850 | | Merck & Company Inc. | | | | | | | | | 29,725 |
| | | | | |
| 130 | | Mylan Laboratories Inc., (2) | | | | | | | | | 2,215 |
| | | | | |
| 2,430 | | Pfizer Inc. | | | | | | | | | 34,652 |
| | | | | |
| 40 | | Watson Pharmaceuticals Inc., (2) | | | | | | | | | 1,623 |
| | Total Pharmaceuticals | | | | | | | | | 159,779 |
| | Professional Services – 0.1% | | | | | | | | | |
| | | | | |
| 10 | | Dun and Bradstreet Inc. | | | | | | | | | 671 |
| | | | | |
| 30 | | Equifax Inc. | | | | | | | | | 842 |
| | | | | |
| 30 | | Robert Half International Inc. | | | | | | | | | 707 |
| | Total Professional Services | | | | | | | | | 2,220 |
| | Real Estate – 1.7% | | | | | | | | | |
| | | | | |
| 70 | | Apartment Investment & Management Company, Class A | | | | | | | | | 1,356 |
| | | | | |
| 40 | | AvalonBay Communities, Inc. | | | | | | | | | 3,735 |
| | | | | |
| 60 | | Boston Properties, Inc. | | | | | | | | | 4,280 |
| | | | | |
| 170 | | Equity Residential | | | | | | | | | 7,079 |
| | | | | |
| 130 | | Health Care Property Investors Inc. | | | | | | | | | 4,193 |
| | | | | |
| 50 | | Health Care REIT, Inc. | | | | | | | | | 2,106 |
| | | | | |
| 260 | | Host Hotels & Resorts Inc. | | | | | | | | | 3,505 |
| | | | | |
| 130 | | Kimco Realty Corporation | | | | | | | | | 1,747 |
| | | | | |
| 30 | | Plum Creek Timber Company | | | | | | | | | 1,036 |
| | | | | |
| 200 | | ProLogis | | | | | | | | | 2,026 |
| | | | | |
| 50 | | Public Storage, Inc. | | | | | | | | | 4,396 |
| | | | | |
| 130 | | Simon Property Group, Inc. | | | | | | | | | 10,498 |
| | | | | |
| 70 | | Ventas Inc. | | | | | | | | | 3,287 |
| | | | | |
| 70 | | Vornado Realty Trust | | | | | | | | | 5,107 |
| | Total Real Estate | | | | | | | | | 54,351 |
| | Real Estate Management & Development – 0.1% | | | | | | | | | |
| | | | | |
| 170 | | CB Richard Ellis Group, Inc., Class A, (2) | | | | | | | | | 2,314 |
| | Road & Rail – 1.0% | | | | | | | | | |
| | | | | |
| 200 | | CSX Corporation | | | | | | | | | 9,926 |
| | | | | |
| 150 | | Norfolk Southern Corporation | | | | | | | | | 7,958 |
| | | | | |
| 40 | | Ryder System, Inc. | | | | | | | | | 1,609 |
| | | | | |
| 190 | | Union Pacific Corporation | | | | | | | | | 13,207 |
| | Total Road & Rail | | | | | | | | | 32,700 |
| | Semiconductors & Equipment – 2.5% | | | | | | | | | |
| | | | | |
| 470 | | Advanced Micro Devices, Inc., (2) | | | | | | | | | 3,440 |
| | | | | |
| 80 | | Altera Corporation | | | | | | | | | 1,985 |
| | | | | |
| 80 | | Analog Devices, Inc. | | | | | | | | | 2,229 |
| | | | | |
| 260 | | Applied Materials, Inc. | | | | | | | | | 3,125 |
| | | | | |
| 120 | | Broadcom Corporation, Class A | | | | | | | | | 3,956 |
| | | | | |
| 10 | | First Solar Inc., (2) | | | | | | | | | 1,138 |
| | | | | |
| 2,000 | | Intel Corporation | | | | | | | | | 38,900 |
| | | | | |
| 30 | | KLA-Tencor Corporation | | | | | | | | | 836 |
Portfolio of Investments
Nuveen Enhanced Core Equity Fund (continued)
June 30, 2010
| | | | | | | | | | | |
| Shares | | Description (1) | | | | | | | | Value |
| | | | | | | | | | | |
| | Semiconductors & Equipment (continued) | | | | | | | | | |
| | | | | |
| 60 | | Linear Technology Corporation | | | | | | | | $ | 1,669 |
| | | | | |
| 140 | | LSI Logic Corporation, (2) | | | | | | | | | 644 |
| | | | | |
| 60 | | Microchip Technology Incorporated | | | | | | | | | 1,664 |
| | | | | |
| 510 | | Micron Technology, Inc., (2) | | | | | | | | | 4,330 |
| | | | | |
| 30 | | National Semiconductor Corporation | | | | | | | | | 404 |
| | | | | |
| 30 | | Novellus Systems, Inc., (2) | | | | | | | | | 761 |
| | | | | |
| 130 | | NVIDIA Corporation, (2) | | | | | | | | | 1,327 |
| | | | | |
| 70 | | Teradyne Inc., (2) | | | | | | | | | 683 |
| | | | | |
| 430 | | Texas Instruments Incorporated | | | | | | | | | 10,010 |
| | | | | |
| 60 | | Xilinx, Inc. | | | | | | | | | 1,516 |
| | Total Semiconductors & Equipment | | | | | | | | | 78,617 |
| | Software – 2.9% | | | | | | | | | |
| | | | | |
| 70 | | Adobe Systems Incorporated, (2) | | | | | | | | | 1,850 |
| | | | | |
| 70 | | Autodesk, Inc., (2) | | | | | | | | | 1,705 |
| | | | | |
| 20 | | BMC Software, Inc., (2) | | | | | | | | | 693 |
| | | | | |
| 120 | | CA Inc. | | | | | | | | | 2,208 |
| | | | | |
| 90 | | Citrix Systems, (2) | | | | | | | | | 3,801 |
| | | | | |
| 60 | | Compuware Corporation, (2) | | | | | | | | | 479 |
| | | | | |
| 90 | | Intuit, Inc., (2) | | | | | | | | | 3,129 |
| | | | | |
| 2,320 | | Microsoft Corporation | | | | | | | | | 53,383 |
| | | | | |
| 110 | | Novell Inc., (2) | | | | | | | | | 625 |
| | | | | |
| 690 | | Oracle Corporation | | | | | | | | | 14,807 |
| | | | | |
| 60 | | Red Hat, Inc., (2) | | | | | | | | | 1,736 |
| | | | | |
| 60 | | Salesforce.com, Inc., (2) | | | | | | | | | 5,149 |
| | | | | |
| 50 | | Symantec Corporation, (2) | | | | | | | | | 694 |
| | Total Software | | | | | | | | | 90,259 |
| | Specialty Retail – 2.4% | | | | | | | | | |
| | | | | |
| 30 | | Abercrombie & Fitch Co., Class A | | | | | | | | | 921 |
| | | | | |
| 40 | | AutoNation Inc., (2) | | | | | | | | | 780 |
| | | | | |
| 10 | | AutoZone, Inc., (2) | | | | | | | | | 1,932 |
| | | | | |
| 120 | | Bed Bath and Beyond Inc., (2) | | | | | | | | | 4,450 |
| | | | | |
| 140 | | Best Buy Co., Inc. | | | | | | | | | 4,740 |
| | | | | |
| 50 | | GameStop Corporation, (2) | | | | | | | | | 940 |
| | | | | |
| 190 | | Gap, Inc. | | | | | | | | | 3,697 |
| | | | | |
| 760 | | Home Depot, Inc. | | | | | | | | | 21,333 |
| | | | | |
| 190 | | Limited Brands, Inc. | | | | | | | | | 4,193 |
| | | | | |
| 530 | | Lowe’s Companies, Inc. | | | | | | | | | 10,823 |
| | | | | |
| 100 | | Office Depot, Inc., (2) | | | | | | | | | 404 |
| | | | | |
| 50 | | O’Reilly Automotive Inc., (2) | | | | | | | | | 2,378 |
| | | | | |
| 60 | | RadioShack Corporation | | | | | | | | | 1,171 |
| | | | | |
| 50 | | Ross Stores, Inc. | | | | | | | | | 2,665 |
| | | | | |
| 130 | | Staples, Inc. | | | | | | | | | 2,477 |
| | | | | |
| 60 | | Tiffany & Co. | | | | | | | | | 2,275 |
| | | | | |
| 200 | | TJX Companies, Inc. | | | | | | | | | 8,390 |
| | | | | |
| 60 | | Urban Outfitters, Inc., (2) | | | | | | | | | 2,063 |
| | Total Specialty Retail | | | | | | | | | 75,632 |
| | | | | | | | | | | |
| Shares | | Description (1) | | | | | | | | Value |
| | Textiles, Apparel & Luxury Goods – 0.5% | | | | | | | | | |
| | | | | |
| 120 | | Coach, Inc. | | | | | | | | $ | 4,386 |
| | | | | |
| 110 | | Nike, Inc., Class B | | | | | | | | | 7,431 |
| | | | | |
| 30 | | Polo Ralph Lauren Corporation | | | | | | | | | 2,189 |
| | | | | |
| 40 | | VF Corporation | | | | | | | | | 2,847 |
| | Total Textiles, Apparel & Luxury Goods | | | | | | | | | 16,853 |
| | Thrifts & Mortgage Finance – 0.1% | | | | | | | | | |
| | | | | |
| 140 | | Hudson City Bancorp, Inc. | | | | | | | | | 1,714 |
| | | | | |
| 40 | | People’s United Financial, Inc. | | | | | | | | | 540 |
| | Total Thrifts & Mortgage Finance | | | | | | | | | 2,254 |
| | Tobacco – 1.5% | | | | | | | | | |
| | | | | |
| 880 | | Altria Group, Inc. | | | | | | | | | 17,635 |
| | | | | |
| 50 | | Lorillard Inc. | | | | | | | | | 3,599 |
| | | | | |
| 470 | | Philip Morris International | | | | | | | | | 21,545 |
| | | | | |
| 80 | | Reynolds American Inc. | | | | | | | | | 4,170 |
| | Total Tobacco | | | | | | | | | 46,949 |
| | Trading Companies & Distributors – 0.1% | | | | | | | | | |
| | | | | |
| 50 | | Fastenal Company | | | | | | | | | 2,510 |
| | | | | |
| 20 | | W.W. Grainger, Inc. | | | | | | | | | 1,989 |
| | Total Trading Companies & Distributors | | | | | | | | | 4,499 |
| | Wireless Telecommunication Services – 0.3% | | | | | | | | | |
| | | | | |
| 80 | | American Tower Corporation, (2) | | | | | | | | | 3,560 |
| | | | | |
| 50 | | Metropcs Communications Inc., (2) | | | | | | | | | 410 |
| | | | | |
| 1,270 | | Sprint Nextel Corporation, (2) | | | | | | | | | 5,385 |
| | Total Wireless Telecommunication Services | | | | | | | | | 9,355 |
| | Total Common Stocks (cost $3,323,838) | | | | | | | | | 3,052,082 |
| | | | | |
| Shares | | Description (1) | | | | | | | | Value |
| | INVESTMENT COMPANIES – 3.9% | | | | | | | | | |
| | | | | |
| 1,200 | | iShares S&P 500 Index Fund | | | | | | | | $ | 123,864 |
| | Total Investment Companies (cost $135,150) | | | | | | | | | 123,864 |
| | Total Investments (cost $3,458,988) – 101.1% | | | | | | | | | 3,175,946 |
| | Other Assets Less Liabilities – (1.1)% | | | | | | | | | (35,073) |
| | Net Assets – 100% | | | | | | | | $ | 3,140,873 |
| | | | For Fund portfolio compliance purposes, the Fund’s industry classifications refer to any one or more of the industry sub-classifications used by one or more widely recognized market indexes or ratings group indexes, and/or as defined by Fund management. This definition may not apply for purposes of this report, which may combine industry sub-classifications into sectors for reporting ease. |
| | (1) | | All percentages shown in the Portfolio of Investments are based on net assets. |
| | (2) | | Non-income producing; issuer has not declared a dividend within the past twelve months. |
See accompanying notes to financial statements.
Portfolio of Investments
Nuveen Enhanced Mid-Cap Fund
June 30, 2010
| | | | | | | | | | | |
| Shares | | Description (1) | | | | | | | | Value |
| | | | | | | | | | | |
| | COMMON STOCKS – 101.2% | | | | | | | | | |
| | | | | |
| | Aerospace & Defense – 1.0% | | | | | | | | | |
| | | | | |
| 110 | | BE Aerospace Inc., (2) | | | | | | | | $ | 2,797 |
| | | | | |
| 90 | | Goodrich Corporation | | | | | | | | | 5,963 |
| | | | | |
| 50 | | ITT Industries, Inc. | | | | | | | | | 2,246 |
| | | | | |
| 50 | | L-3 Communications Holdings, Inc. | | | | | | | | | 3,542 |
| | | | | |
| 90 | | Rockwell Collins, Inc. | | | | | | | | | 4,782 |
| | | | | |
| 50 | | Spirit AeroSystems Holdings Inc., (2) | | | | | | | | | 953 |
| | | | | |
| 40 | | TransDigm Group Inc. | | | | | | | | | 2,041 |
| | Total Aerospace & Defense | | | | | | | | | 22,324 |
| | Air Freight & Logistics – 0.2% | | | | | | | | | |
| | | | | |
| 30 | | C.H. Robinson Worldwide, Inc. | | | | | | | | | 1,670 |
| | | | | |
| 40 | | Expeditors International of Washington, Inc. | | | | | | | | | 1,380 |
| | | | | |
| 50 | | UTI Worldwide, Inc. | | | | | | | | | 619 |
| | Total Air Freight & Logistics | | | | | | | | | 3,669 |
| | Airlines – 1.9% | | | | | | | | | |
| | | | | |
| 530 | | AMR Corporation, (2) | | | | | | | | | 3,593 |
| | | | | |
| 240 | | Continental Airlines, inc., (2) | | | | | | | | | 5,280 |
| | | | | |
| 30 | | Copa Holdings SA | | | | | | | | | 1,327 |
| | | | | |
| 1,390 | | Delta Air Lines, Inc., (2) | | | | | | | | | 16,333 |
| | | | | |
| 870 | | Southwest Airlines Co. | | | | | | | | | 9,666 |
| | | | | |
| 340 | | UAL Corporation, (2) | | | | | | | | | 6,990 |
| | Total Airlines | | | | | | | | | 43,189 |
| | Auto Components – 0.6% | | | | | | | | | |
| | | | | |
| 80 | | Autoliv Inc. | | | | | | | | | 3,828 |
| | | | | |
| 30 | | Federal Mogul Corporation, Class A Shares, (2) | | | | | | | | | 391 |
| | | | | |
| 130 | | Gentex Corporation | | | | | | | | | 2,337 |
| | | | | |
| 80 | | Goodyear Tire & Rubber Company, (2) | | | | | | | | | 795 |
| | | | | |
| 20 | | Lear Corporation, (2) | | | | | | | | | 1,324 |
| | | | | |
| 160 | | TRW Automotive Holdings Corporation, (2) | | | | | | | | | 4,411 |
| | Total Auto Components | | | | | | | | | 13,086 |
| | Automobiles – 0.3% | | | | | | | | | |
| | | | | |
| 250 | | Harley-Davidson, Inc. | | | | | | | | | 5,557 |
| | | | | |
| 30 | | Thor Industries, Inc. | | | | | | | | | 713 |
| | Total Automobiles | | | | | | | | | 6,270 |
| | Beverages – 1.0% | | | | | | | | | |
| | | | | |
| 40 | | Brown-Forman Corporation | | | | | | | | | 2,289 |
| | | | | |
| 340 | | Coca-Cola Enterprises Inc. | | | | | | | | | 8,792 |
| | | | | |
| 100 | | Constellation Brands, Inc., Class A, (2) | | | | | | | | | 1,562 |
| | | | | |
| 290 | | Dr. Pepper Snapple Group | | | | | | | | | 10,843 |
| | | | | |
| 10 | | Molson Coors Brewing Company, Class B | | | | | | | | | 424 |
| | Total Beverages | | | | | | | | | 23,910 |
| | Biotechnology – 0.6% | | | | | | | | | |
| | | | | |
| 20 | | Alexion Pharmaceuticals Inc., (2) | | | | | | | | | 1,024 |
| | | | | |
| 30 | | BioMarin Pharmaceutical Inc., (2) | | | | | | | | | 569 |
| | | | | |
| 140 | | Dendreon Corporation, (2) | | | | | | | | | 4,526 |
| | | | | |
| 240 | | Human Genome Sciences, Inc., (2) | | | | | | | | | 5,438 |
| | | | | | | | | | | |
| Shares | | Description (1) | | | | | | | | Value |
| | | | | | | | | | | |
| | Biotechnology (continued) | | | | | | | | | |
| | | | | |
| 70 | | Regeneron Pharmaceuticals, Inc., (2) | | | | | | | | $ | 1,562 |
| | | | | |
| 40 | | Vertex Pharmaceuticals Inc., (2) | | | | | | | | | 1,316 |
| | Total Biotechnology | | | | | | | | | 14,435 |
| | Building Products – 0.5% | | | | | | | | | |
| | | | | |
| 40 | | Armstrong World Industries Inc., (2) | | | | | | | | | 1,207 |
| | | | | |
| 20 | | Lennox International Inc. | | | | | | | | | 831 |
| | | | | |
| 140 | | Masco Corporation | | | | | | | | | 1,506 |
| | | | | |
| 220 | | Owens Corning, (2) | | | | | | | | | 6,580 |
| | | | | |
| 30 | | USG Corporation, (2) | | | | | | | | | 362 |
| | Total Building Products | | | | | | | | | 10,486 |
| | Capital Markets – 1.0% | | | | | | | | | |
| | | | | |
| 10 | | Affiliated Managers Group Inc., (2) | | | | | | | | | 608 |
| | | | | |
| 200 | | Ameriprise Financial, Inc. | | | | | | | | | 7,226 |
| | | | | |
| 150 | | E*Trade Group Inc., (2) | | | | | | | | | 1,773 |
| | | | | |
| 40 | | Eaton Vance Corporation | | | | | | | | | 1,104 |
| | | | | |
| 80 | | Invesco LTD | | | | | | | | | 1,346 |
| | | | | |
| 10 | | Jefferies Group, Inc. | | | | | | | | | 211 |
| | | | | |
| 20 | | Lazard Limited | | | | | | | | | 534 |
| | | | | |
| 130 | | Legg Mason, Inc. | | | | | | | | | 3,644 |
| | | | | |
| 130 | | Raymond James Financial Inc. | | | | | | | | | 3,210 |
| | | | | |
| 60 | | SEI Investments Company | | | | | | | | | 1,222 |
| | | | | |
| 60 | | T. Rowe Price Group Inc. | | | | | | | | | 2,663 |
| | Total Capital Markets | | | | | | | | | 23,541 |
| | Chemicals – 3.0% | | | | | | | | | |
| | | | | |
| 80 | | Airgas, Inc. | | | | | | | | | 4,976 |
| | | | | |
| 90 | | Albemarle Corporation | | | | | | | | | 3,574 |
| | | | | |
| 160 | | Ashland Inc. | | | | | | | | | 7,427 |
| | | | | |
| 90 | | Cabot Corporation | | | | | | | | | 2,170 |
| | | | | |
| 120 | | Celanese Corporation, Series A | | | | | | | | | 2,989 |
| | | | | |
| 90 | | Cytec Industries, Inc. | | | | | | | | | 3,599 |
| | | | | |
| 70 | | Eastman Chemical Company | | | | | | | | | 3,735 |
| | | | | |
| 50 | | Ecolab Inc. | | | | | | | | | 2,245 |
| | | | | |
| 470 | | Huntsman Corporation | | | | | | | | | 4,075 |
| | | | | |
| 50 | | International Flavors & Fragrances Inc. | | | | | | | | | 2,121 |
| | | | | |
| 110 | | Lubrizol Corporation | | | | | | | | | 8,834 |
| | | | | |
| 60 | | Nalco Holding Company | | | | | | | | | 1,228 |
| | | | | |
| 160 | | PPG Industries, Inc. | | | | | | | | | 9,666 |
| | | | | |
| 120 | | RPM International, Inc. | | | | | | | | | 2,141 |
| | | | | |
| 20 | | Scotts Miracle Gro Company | | | | | | | | | 888 |
| | | | | |
| 80 | | Sherwin-Williams Company | | | | | | | | | 5,535 |
| | | | | |
| 40 | | Sigma-Aldrich Corporation | | | | | | | | | 1,993 |
| | | | | |
| 80 | | Valspar Corporation | | | | | | | | | 2,410 |
| �� | Total Chemicals | | | | | | | | | 69,606 |
| | Commercial & Professional Services – 0.0% | | | | | | | | | |
| | | | | |
| 50 | | Corrections Corporation of America, (2) | | | | | | | | | 954 |
Portfolio of Investments
Nuveen Enhanced Mid-Cap Fund (continued)
June 30, 2010
| | | | | | | | | | | |
| Shares | | Description (1) | | | | | | | | Value |
| | | | | | | | | | | |
| | Commercial Banks – 6.6% | | | | | | | | | |
| | | | | |
| 20 | | Associated Banc-Corp. | | | | | | | | $ | 245 |
| | | | | |
| 70 | | BancorpSouth Inc. | | | | | | | | | 1,252 |
| | | | | |
| 30 | | Bank of Hawaii Corporation | | | | | | | | | 1,450 |
| | | | | |
| 20 | | BOK Financial Corporation | | | | | | | | | 949 |
| | | | | |
| 280 | | Capitalsource Inc. | | | | | | | | | 1,333 |
| | | | | |
| 360 | | CIT Group Inc., (2) | | | | | | | | | 12,190 |
| | | | | |
| 40 | | City National Corporation | | | | | | | | | 2,049 |
| | | | | |
| 190 | | Comerica Incorporated | | | | | | | | | 6,998 |
| | | | | |
| 40 | | Commerce Bancshares Inc. | | | | | | | | | 1,440 |
| | | | | |
| 20 | | Cullen/Frost Bankers, Inc. | | | | | | | | | 1,028 |
| | | | | |
| 250 | | East West Bancorp Inc. | | | | | | | | | 3,813 |
| | | | | |
| 1,650 | | Fifth Third Bancorp. | | | | | | | | | 20,278 |
| | | | | |
| 51 | | First Horizon National Corporation, (2) | | | | | | | | | 582 |
| | | | | |
| 270 | | Fulton Financial Corporation | | | | | | | | | 2,606 |
| | | | | |
| 1,130 | | Huntington BancShares Inc. | | | | | | | | | 6,260 |
| | | | | |
| 1,710 | | KeyCorp. | | | | | | | | | 13,150 |
| | | | | |
| 100 | | M&T Bank Corporation | | | | | | | | | 8,495 |
| | | | | |
| 750 | | Marshall and Ilsley Corporation | | | | | | | | | 5,385 |
| | | | | |
| 790 | | Popular, Inc., (2) | | | | | | | | | 2,117 |
| | | | | |
| 3,040 | | Regions Financial Corporation | | | | | | | | | 20,002 |
| | | | | |
| 1,170 | | SunTrust Banks, Inc. | | | | | | | | | 27,261 |
| | | | | |
| 410 | | Synovus Financial Corp. | | | | | | | | | 1,041 |
| | | | | |
| 80 | | TCF Financial Corporation | | | | | | | | | 1,329 |
| | | | | |
| 130 | | Valley National Bancorp. | | | | | | | | | 1,771 |
| | | | | |
| 20 | | Wilmington Trust Corporation | | | | | | | | | 222 |
| | | | | |
| 360 | | Zions Bancorporation | | | | | | | | | 7,765 |
| | Total Commercial Banks | | | | | | | | | 151,011 |
| | Commercial Services & Supplies – 1.0% | | | | | | | | | |
| | | | | |
| 50 | | Avery Dennison Corporation | | | | | | | | | 1,607 |
| | | | | |
| 40 | | Cintas Corporation | | | | | | | | | 959 |
| | | | | |
| 30 | | Copart Inc., (2) | | | | | | | | | 1,074 |
| | | | | |
| 10 | | Covanta Holding Corporation | | | | | | | | | 166 |
| | | | | |
| 60 | | Iron Mountain Inc. | | | | | | | | | 1,348 |
| | | | | |
| 20 | | KAR Auction Services Inc., (2) | | | | | | | | | 247 |
| | | | | |
| 50 | | Pitney Bowes Inc. | | | | | �� | | | | 1,098 |
| | | | | |
| 320 | | R.R. Donnelley & Sons Company | | | | | | | | | 5,238 |
| | | | | |
| 260 | | Republic Services, Inc. | | | | | | | | | 7,730 |
| | | | | |
| 20 | | St Joe Company, (2) | | | | | | | | | 463 |
| | | | | |
| 20 | | Stericycle Inc., (2) | | | | | | | | | 1,312 |
| | | | | |
| 50 | | Waste Connections Inc., (2) | | | | | | | | | 1,744 |
| | Total Commercial Services & Supplies | | | | | | | | | 22,986 |
| | Communication Equipment – 0.9% | | | | | | | | | |
| | | | | |
| 20 | | CommScope Inc., (2) | | | | | | | | | 475 |
| | | | | |
| 30 | | Echostar Holding Corproation, Class A, (2) | | | | | | | | | 572 |
| | | | | |
| 90 | | F5 Networks, Inc., (2) | | | | | | | | | 6,171 |
| | | | | | | | | | | |
| Shares | | Description (1) | | | | | | | | Value |
| | | | | | | | | | | |
| | Communication Equipment (continued) | | | | | | | | | |
| | | | | |
| 130 | | Harris Corporation | | | | | | | | $ | 5,415 |
| | | | | |
| 260 | | JDS Uniphase Corporation, (2) | | | | | | | | | 2,558 |
| | | | | |
| 60 | | Polycom Inc., (2) | | | | | | | | | 1,787 |
| | | | | |
| 610 | | Tellabs Inc. | | | | | | | | | 3,898 |
| | Total Communication Equipment | | | | | | | | | 20,876 |
| | Computers & Peripherals – 2.5% | | | | | | | | | |
| | | | | |
| 30 | | Diebold Inc. | | | | | | | | | 818 |
| | | | | |
| 170 | | Lexmark International, Inc., Class A, (2) | | | | | | | | | 5,615 |
| | | | | |
| 280 | | Network Appliance Inc., (2) | | | | | | | | | 10,447 |
| | | | | |
| 440 | | SanDisk Corporation, (2) | | | | | | | | | 18,511 |
| | | | | |
| 880 | | Seagate Technology, (2) | | | | | | | | | 11,475 |
| | | | | |
| 80 | | Teradata Corporation, (2) | | | | | | | | | 2,438 |
| | | | | |
| 270 | | Western Digital Corporation, (2) | | | | | | | | | 8,143 |
| | Total Computers & Peripherals | | | | | | | | | 57,447 |
| | Construction & Engineering – 0.3% | | | | | | | | | |
| | | | | |
| 30 | | AECOM Technology Corporation, (2) | | | | | | | | | 692 |
| | | | | |
| 100 | | Chicago Bridge & Iron Company N.V., (2) | | | | | | | | | 1,881 |
| | | | | |
| 30 | | KBR Inc. | | | | | | | | | 610 |
| | | | | |
| 80 | | Shaw Group Inc., (2) | | | | | | | | | 2,738 |
| | | | | |
| 10 | | URS Corporation, (2) | | | | | | | | | 393 |
| | Total Construction & Engineering | | | | | | | | | 6,314 |
| | Construction Materials – 0.0% | | | | | | | | | |
| | | | | |
| 10 | | Eagle Materials Inc. | | | | | | | | | 259 |
| | | | | |
| 10 | | Vulcan Materials Company | | | | | | | | | 438 |
| | Total Construction Materials | | | | | | | | | 697 |
| | Consumer Finance – 0.8% | | | | | | | | | |
| | | | | |
| 170 | | Americredit Corp., (2) | | | | | | | | | 3,097 |
| | | | | |
| 860 | | Discover Financial Services | | | | | | | | | 12,023 |
| | | | | |
| 410 | | SLM Corporation, (2) | | | | | | | | | 4,260 |
| | Total Consumer Finance | | | | | | | | | 19,380 |
| | Containers & Packaging – 0.7% | | | | | | | | | |
| | | | | |
| 30 | | AptarGroup Inc. | | | | | | | | | 1,135 |
| | | | | |
| 30 | | Ball Corporation | | | | | | | | | 1,585 |
| | | | | |
| 70 | | Bemis Company, Inc. | | | | | | | | | 1,890 |
| | | | | |
| 30 | | Crown Holdings Inc., (2) | | | | | | | | | 751 |
| | | | | |
| 20 | | Greif Inc. | | | | | | | | | 1,111 |
| | | | | |
| 90 | | Packaging Corp. of America | | | | | | | | | 1,982 |
| | | | | |
| 30 | | Pactiv Corporation, (2) | | | | | | | | | 835 |
| | | | | |
| 60 | | Sealed Air Corporation | | | | | | | | | 1,183 |
| | | | | |
| 80 | | Sonoco Products Company | | | | | | | | | 2,438 |
| | | | | |
| 180 | | Temple-Inland Inc. | | | | | | | | | 3,721 |
| | Total Containers & Packaging | | | | | | | | | 16,631 |
| | Distributors – 0.2% | | | | | | | | | |
| | | | | |
| 90 | | Genuine Parts Company | | | | | | | | | 3,550 |
| | | | | |
| 70 | | LKQ Corporation, (2) | | | | | | | | | 1,350 |
| | Total Distributors | | | | | | | | | 4,900 |
Portfolio of Investments
Nuveen Enhanced Mid-Cap Fund (continued)
June 30, 2010
| | | | | | | | | | | |
| Shares | | Description (1) | | | | | | | | Value |
| | | | | | | | | | | |
| | Diversified Consumer Services – 0.4% | | | | | | | | | |
| | | | | |
| 60 | | Career Education Corporation, (2) | | | | | | | | $ | 1,381 |
| | | | | |
| 20 | | Devry, Inc. | | | | | | | | | 1,050 |
| | | | | |
| 30 | | Education Management Corporation, (2) | | | | | | | | | 458 |
| | | | | |
| 80 | | H & R Block Inc. | | | | | | | | | 1,255 |
| | | | | |
| 60 | | Hillenbrand Inc. | | | | | | | | | 1,283 |
| | | | | |
| 360 | | Service Corporation International | | | | | | | | | 2,664 |
| | | | | |
| 10 | | Weight Watcher’s International Inc. | | | | | | | | | 257 |
| | Total Diversified Consumer Services | | | | | | | | | 8,348 |
| | Diversified Financial Services – 0.2% | | | | | | | | | |
| | | | | |
| 30 | | Interactive Brokers Group, Inc., (2) | | | | | | | | | 498 |
| | | | | |
| 10 | | Intercontinental Exchange, Inc., (2) | | | | | | | | | 1,130 |
| | | | | |
| 90 | | Leucadia National Corporation, (2) | | | | | | | | | 1,756 |
| | | | | |
| 40 | | MSCI Inc., Class A Shares, (2) | | | | | | | | | 1,096 |
| | | | | |
| 30 | | New York Stock Exchange Euronext | | | | | | | | | 829 |
| | Total Diversified Financial Services | | | | | | | | | 5,309 |
| | Diversified REIT – 0.6% | | | | | | | | | |
| | | | | |
| 90 | | Liberty Property Trust | | | | | | | | | 2,597 |
| | | | | |
| 140 | | Vornado Realty Trust | | | | | | | | | 10,213 |
| | Total Diversified REIT | | | | | | | | | 12,810 |
| | Diversified Telecommunication Services – 1.6% | | | | | | | | | |
| | | | | |
| 320 | | CenturyTel, Inc. | | | | | | | | | 10,659 |
| | | | | |
| 400 | | Frontier Communications Corporation | | | | | | | | | 2,844 |
| | | | | |
| 780 | | Level 3 Communications Inc., (2) | | | | | | | | | 850 |
| | | | | |
| 2,700 | | Qwest Communications International Inc. | | | | | | | | | 14,175 |
| | | | | |
| 120 | | TW Telecom Inc., (2) | | | | | | | | | 2,002 |
| | | | | |
| 540 | | Windstream Corporation | | | | | | | | | 5,702 |
| | Total Diversified Telecommunication Services | | | | | | | | | 36,232 |
| | Electric Utilities – 2.9% | | | | | | | | | |
| | | | | |
| 90 | | Allegheny Energy, Inc. | | | | | | | | | 1,861 |
| | | | | |
| 90 | | DPL Inc. | | | | | | | | | 2,151 |
| | | | | |
| 310 | | Edison International | | | | | | | | | 9,833 |
| | | | | |
| 250 | | FirstEnergy Corp. | | | | | | | | | 8,808 |
| | | | | |
| 130 | | Great Plains Energy Incorporated | | | | | | | | | 2,213 |
| | | | | |
| 80 | | Hawaiian Electric Industries | | | | | | | | | 1,822 |
| | | | | |
| 20 | | ITC Holdings Corporation | | | | | | | | | 1,058 |
| | | | | |
| 200 | | Northeast Utilities | | | | | | | | | 5,096 |
| | | | | |
| 200 | | NV Energy Inc. | | | | | | | | | 2,362 |
| | | | | |
| 300 | | Pepco Holdings, Inc. | | | | | | | | | 4,704 |
| | | | | |
| 160 | | Pinnacle West Capital Corporation | | | | | | | | | 5,818 |
| | | | | |
| 260 | | PPL Corporation | | | | | | | | | 6,487 |
| | | | | |
| 270 | | Progress Energy, Inc. | | | | | | | | | 10,589 |
| | | | | |
| 150 | | Westar Energy Inc. | | | | | | | | | 3,242 |
| | Total Electric Utilities | | | | | | | | | 66,044 |
| | Electrical Equipment – 1.0% | | | | | | | | | |
| | | | | |
| 50 | | Ametek Inc. | | | | | | | | | 2,008 |
| | | | | | | | | | | |
| Shares | | Description (1) | | | | | | | | Value |
| | | | | | | | | | | |
| | Electrical Equipment (continued) | | | | | | | | | |
| | | | | |
| 130 | | Cooper Industries Inc. | | | | | | | | $ | 5,720 |
| | | | | |
| 50 | | General Cable Corporation, (2) | | | | | | | | | 1,332 |
| | | | | |
| 50 | | Hubbell Incorporated, Class B | | | | | | | | | 1,985 |
| | | | | |
| 40 | | Regal-Beloit Corporation | | | | | | | | | 2,231 |
| | | | | |
| 130 | | Rockwell Automation, Inc. | | | | | | | | | 6,382 |
| | | | | |
| 40 | | Roper Industries Inc. | | | | | | | | | 2,238 |
| | | | | |
| 20 | | Thomas & Betts Corporation, (2) | | | | | | | | | 694 |
| | Total Electrical Equipment | | | | | | | | | 22,590 |
| | Electronic Components – 0.4% | | | | | | | | | |
| | | | | |
| 60 | | Amphenol Corporation, Class A | | | | | | | | | 2,357 |
| | | | | |
| 40 | | AVX Group | | | | | | | | | 513 |
| | | | | |
| 60 | | Dolby Laboratories, Inc., (2) | | | | | | | | | 3,761 |
| | | | | |
| 210 | | Vishay Intertechnology Inc., (2) | | | | | | | | | 1,625 |
| | Total Electronic Components | | | | | | | | | 8,256 |
| | Electronic Equipment & Instruments – 0.9% | | | | | | | | | |
| | | | | |
| 250 | | Agilent Technologies, Inc., (2) | | | | | | | | | 7,107 |
| | | | | |
| 70 | | Arrow Electronics, Inc., (2) | | | | | | | | | 1,564 |
| | | | | |
| 70 | | Avnet Inc., (2) | | | | | | | | | 1,688 |
| | | | | |
| 30 | | FLIR Systems Inc., (2) | | | | | | | | | 873 |
| | | | | |
| 30 | | Ingram Micro, Inc., Class A, (2) | | | | | | | | | 456 |
| | | | | |
| 190 | | Jabil Circuit Inc. | | | | | | | | | 2,527 |
| | | | | |
| 70 | | Molex Inc. | | | | | | | | | 1,277 |
| | | | | |
| 40 | | National Instruments Corporation | | | | | | | | | 1,271 |
| | | | | |
| 60 | | Tech Data Corporation, (2) | | | | | | | | | 2,137 |
| | | | | |
| 60 | | Trimble Navigation Limited, (2) | | | | | | | | | 1,680 |
| | Total Electronic Equipment & Instruments | | | | | | | | | 20,580 |
| | Energy Equipment & Services – 0.9% | | | | | | | | | |
| | | | | |
| 10 | | Core Laboratories NV | | | | | | | | | 1,476 |
| | | | | |
| 20 | | Diamond Offshore Drilling, Inc. | | | | | | | | | 1,244 |
| | | | | |
| 10 | | Dresser Rand Group, Inc., (2) | | | | | | | | | 315 |
| | | | | |
| 80 | | Exterran Holdings, Inc., (2) | | | | | | | | | 2,065 |
| | | | | |
| 50 | | FMC Technologies Inc., (2) | | | | | | | | | 2,633 |
| | | | | |
| 30 | | Helmerich & Payne Inc. | | | | | | | | | 1,095 |
| | | | | |
| 30 | | Nabors Industries Inc., (2) | | | | | | | | | 529 |
| | | | | |
| 50 | | Oil States International Inc., (2) | | | | | | | | | 1,979 |
| | | | | |
| 10 | | Patterson-UTI Energy, Inc. | | | | | | | | | 129 |
| | | | | |
| 20 | | Pride International Inc., (2) | | | | | | | | | 447 |
| | | | | |
| 130 | | Rowan Companies Inc., (2) | | | | | | | | | 2,852 |
| | | | | |
| 10 | | SeaCor Smit Inc., (2) | | | | | | | | | 707 |
| | | | | |
| 90 | | Smith International, Inc. | | | | | | | | | 3,388 |
| | | | | |
| 40 | | Tidewater Inc. | | | | | | | | | 1,549 |
| | | | | |
| 30 | | Unit Corporation, (2) | | | | | | | | | 1,218 |
| | Total Energy Equipment & Services | | | | | | | | | 21,626 |
| | Food & Staples Retailing – 0.6% | | | | | | | | | |
| | | | | |
| 10 | | BJ’s Wholesale Club, (2) | | | | | | | | | 370 |
Portfolio of Investments
Nuveen Enhanced Mid-Cap Fund (continued)
June 30, 2010
| | | | | | | | | | | |
| Shares | | Description (1) | | | | | | | | Value |
| | | | | | | | | | | |
| | Food & Staples Retailing (continued) | | | | | | | | | |
| | | | | |
| 210 | | Safeway Inc. | | | | | | | | $ | 4,129 |
| | | | | |
| 260 | | SUPERVALU INC. | | | | | | | | | 2,818 |
| | | | | |
| 180 | | Whole Foods Market, Inc., (2) | | | | | | | | | 6,484 |
| | Total Food & Staples Retailing | | | | | | | | | 13,801 |
| | Food Products – 2.8% | | | | | | | | | |
| | | | | |
| 30 | | Bunge Limited | | | | | | | | | 1,476 |
| | | | | |
| 90 | | Campbell Soup Company | | | | | | | | | 3,225 |
| | | | | |
| 370 | | ConAgra Foods, Inc. | | | | | | | | | 8,628 |
| | | | | |
| 70 | | Corn Products International, Inc. | | | | | | | | | 2,121 |
| | | | | |
| 110 | | Dean Foods Company, (2) | | | | | | | | | 1,108 |
| | | | | |
| 260 | | Del Monte Foods Company | | | | | | | | | 3,741 |
| | | | | |
| 20 | | Flowers Foods Inc. | | | | | | | | | 489 |
| | | | | |
| 130 | | H.J. Heinz Company | | | | | | | | | 5,618 |
| | | | | |
| 100 | | Hershey Foods Corporation | | | | | | | | | 4,793 |
| | | | | |
| 10 | | Hormel Foods Corporation | | | | | | | | | 405 |
| | | | | |
| 90 | | JM Smucker Company | | | | | | | | | 5,420 |
| | | | | |
| 50 | | McCormick & Company, Incorporated | | | | | | | | | 1,898 |
| | | | | |
| 160 | | Mead Johnson Nutrition Company, Class A Shares | | | | | | | | | 8,019 |
| | | | | |
| 10 | | Ralcorp Holdings Inc., (2) | | | | | | | | | 548 |
| | | | | |
| 760 | | Sara Lee Corporation | | | | | | | | | 10,716 |
| | | | | |
| 110 | | Smithfield Foods, Inc., (2) | | | | | | | | | 1,639 |
| | | | | |
| 280 | | Tyson Foods, Inc., Class A | | | | | | | | | 4,589 |
| | Total Food Products | | | | | | | | | 64,433 |
| | Gas Utilities – 1.2% | | | | | | | | | |
| | | | | |
| 80 | | AGL Resources Inc. | | | | | | | | | 2,866 |
| | | | | |
| 80 | | Atmos Energy Corporation | | | | | | | | | 2,163 |
| | | | | |
| 50 | | Energen Corporation | | | | | | | | | 2,217 |
| | | | | |
| 30 | | EQT Corporation | | | | | | | | | 1,084 |
| | | | | |
| 70 | | National Fuel Gas Company | | | | | | | | | 3,212 |
| | | | | |
| 150 | | ONEOK, Inc. | | | | | | | | | 6,487 |
| | | | | |
| 160 | | Questar Corporation | | | | | | | | | 7,278 |
| | | | | |
| 80 | | UGI Corporation | | | | | | | | | 2,035 |
| | Total Gas Utilities | | | | | | | | | 27,342 |
| | Health Care Equipment & Supplies – 2.2% | | | | | | | | | |
| | | | | |
| 10 | | Beckman Coulter, Inc. | | | | | | | | | 603 |
| | | | | |
| 120 | | Boston Scientific Corporation, (2) | | | | | | | | | 696 |
| | | | | |
| 30 | | C. R. Bard, Inc. | | | | | | | | | 2,326 |
| | | | | |
| 220 | | CareFusion Corporation, (2) | | | | | | | | | 4,994 |
| | | | | |
| 40 | | Cooper Companies, Inc. | | | | | | | | | 1,592 |
| | | | | |
| 20 | | DENTSPLY International Inc. | | | | | | | | | 598 |
| | | | | |
| 80 | | Edwards Lifesciences Corporation, (2) | | | | | | | | | 4,481 |
| | | | | |
| 20 | | Gen-Probe, Inc., (2) | | | | | | | | | 908 |
| | | | | |
| 60 | | Hill Rom Holdings Inc. | | | | | | | | | 1,826 |
| | | | | |
| 10 | | Hologic Inc., (2) | | | | | | | | | 139 |
| | | | | |
| 100 | | Hospira Inc., (2) | | | | | | | | | 5,745 |
| | | | | | | | | | | |
| Shares | | Description (1) | | | | | | | | Value |
| | | | | | | | | | | |
| | Health Care Equipment & Supplies (continued) | | | | | | | | | |
| | | | | |
| 30 | | Idexx Labs Inc., (2) | | | | | | | | $ | 1,827 |
| | | | | |
| 40 | | Intuitive Surgical, Inc., (2) | | | | | | | | | 12,625 |
| | | | | |
| 20 | | Inverness Medical Innovation, (2) | | | | | | | | | 533 |
| | | | | |
| 70 | | Kinetic Concepts Inc., (2) | | | | | | | | | 2,556 |
| | | | | |
| 70 | | ResMed Inc., (2) | | | | | | | | | 4,257 |
| | | | | |
| 20 | | Teleflex Inc. | | | | | | | | | 1,086 |
| | | | | |
| 40 | | Thoratec Corporation, (2) | | | | | | | | | 1,709 |
| | | | | |
| 30 | | Varian Medical Systems, Inc., (2) | | | | | | | | | 1,568 |
| | Total Health Care Equipment & Supplies | | | | | | | | | 50,069 |
| | Health Care Providers & Services – 3.1% | | | | | | | | | |
| | | | | |
| 310 | | AmerisourceBergen Corporation | | | | | | | | | 9,842 |
| | | | | |
| 60 | | Brookdale Senior Living Inc., (2) | | | | | | | | | 900 |
| | | | | |
| 260 | | CIGNA Corporation | | | | | | | | | 8,076 |
| | | | | |
| 170 | | Community Health Systems, Inc., (2) | | | | | | | | | 5,748 |
| | | | | |
| 140 | | Coventry Health Care, Inc., (2) | | | | | | | | | 2,475 |
| | | | | |
| 60 | | Davita Inc., (2) | | | | | | | | | 3,746 |
| | | | | |
| 40 | | Emergency Medical Services Corporation, (2) | | | | | | | | | 1,961 |
| | | | | |
| 380 | | Health Management Associates Inc., (2) | | | | | | | | | 2,953 |
| | | | | |
| 90 | | Health Net Inc., (2) | | | | | | | | | 2,193 |
| | | | | |
| 40 | | Henry Schein Inc., (2) | | | | | | | | | 2,196 |
| | | | | |
| 220 | | Humana Inc., (2) | | | | | | | | | 10,047 |
| | | | | |
| 10 | | Laboratory Corporation of America Holdings, (2) | | | | | | | | | 753 |
| | | | | |
| 60 | | Lifepoint Hospitals Inc., (2) | | | | | | | | | 1,884 |
| | | | | |
| 160 | | Lincare Holdings | | | | | | | | | 5,202 |
| | | | | |
| 20 | | Medax Inc., (2) | | | | | | | | | 1,112 |
| | | | | |
| 70 | | Omnicare, Inc. | | | | | | | | | 1,659 |
| | | | | |
| 60 | | Patterson Companies, Inc. | | | | | | | | | 1,712 |
| | | | | |
| 10 | | Quest Diagnostics Incorporated | | | | | | | | | 498 |
| | | | | |
| 620 | | Tenet Healthcare Corporation, (2) | | | | | | | | | 2,691 |
| | | | | |
| 110 | | Universal Health Services, Inc., Class B | | | | | | | | | 4,197 |
| | | | | |
| 40 | | VCA Antech, Inc., (2) | | | | | | | | | 990 |
| | Total Health Care Providers & Services | | | | | | | | | 70,835 |
| | Health Care Technology – 0.2% | | | | | | | | | |
| | | | | |
| 20 | | Cerner Corporation, (2) | | | | | | | | | 1,518 |
| | | | | |
| 30 | | SXC Health Solutions Corporation, (2) | | | | | | | | | 2,197 |
| | Total Health Care Technology | | | | | | | | | 3,715 |
| | Hotels, Restaurants & Leisure – 2.0% | | | | | | | | | |
| | | | | |
| 40 | | Bally Technologies, Inc., (2) | | | | | | | | | 1,296 |
| | | | | |
| 30 | | Brinker International Inc. | | | | | | | | | 434 |
| | | | | |
| 20 | | Burger King Holdings Inc. | | | | | | | | | 337 |
| | | | | |
| 20 | | Chipotle Mexican Grill, (2) | | | | | | | | | 2,736 |
| | | | | |
| 10 | | Choice Hotels International, Inc. | | | | | | | | | 302 |
| | | | | |
| 90 | | Darden Restaurants, Inc. | | | | | | | | | 3,496 |
| | | | | |
| 70 | | Hyatt Hotels Corporation, Class A, (2) | | | | | �� | | | | 2,596 |
| | | | | |
| 10 | | Intl Speedway Corporation | | | | | | | | | 258 |
Portfolio of Investments
Nuveen Enhanced Mid-Cap Fund (continued)
June 30, 2010
| | | | | | | | | | | |
| Shares | | Description (1) | | | | | | | | Value |
| | | | | | | | | | | |
| | Hotels, Restaurants & Leisure (continued) | | | | | | | | | |
| | | | | |
| 40 | | Marriott International, Inc., Class A | | | | | | | | $ | 1,198 |
| | | | | |
| 200 | | MGM Mirage Inc., (2) | | | | | | | | | 1,928 |
| | | | | |
| 20 | | Panera Bread Company, (2) | | | | | | | | | 1,506 |
| | | | | |
| 10 | | Penn National Gaming, Inc., (2) | | | | | | | | | 231 |
| | | | | |
| 280 | | Royal Caribbean Cruises Limited, (2) | | | | | | | | | 6,376 |
| | | | | |
| 180 | | Starwood Hotels & Resorts Worldwide, Inc. | | | | | | | | | 7,457 |
| | | | | |
| 50 | | Wendy’s International, Inc. | | | | | | | | | 200 |
| | | | | |
| 10 | | WMS Industries Inc., (2) | | | | | | | | | 392 |
| | | | | |
| 340 | | Wyndham Worldwide Corporation | | | | | | | | | 6,847 |
| | | | | |
| 110 | | Wynn Resorts Ltd | | | | | | | | | 8,390 |
| | Total Hotels, Restaurants & Leisure | | | | | | | | | 45,980 |
| | Household Durables – 2.6% | | | | | | | | | |
| | | | | |
| 100 | | D.R. Horton, Inc. | | | | | | | | | 983 |
| | | | | |
| 140 | | Fortune Brands Inc. | | | | | | | | | 5,485 |
| | | | | |
| 170 | | Garmin Limited | | | | | | | | | 4,974 |
| | | | | |
| 40 | | Harman International Industries Inc., (2) | | | | | | | | | 1,196 |
| | | | | |
| 120 | | Jarden Corporation | | | | | | | | | 3,224 |
| | | | | |
| 210 | | Leggett and Platt Inc. | | | | | | | | | 4,213 |
| | | | | |
| 270 | | Lennar Corporation, Class A | | | | | | | | | 3,756 |
| | | | | |
| 50 | | Mohawk Industries Inc., (2) | | | | | | | | | 2,288 |
| | | | | |
| 280 | | Newell Rubbermaid Inc. | | | | | | | | | 4,099 |
| | | | | |
| 150 | | Stanley Black & Decker Inc. | | | | | | | | | 7,578 |
| | | | | |
| 110 | | Tempur Pedic International Inc., (2) | | | | | | | | | 3,382 |
| | | | | |
| 80 | | Tupperware Corporation | | | | | | | | | 3,188 |
| | | | | |
| 180 | | Whirlpool Corporation | | | | | | | | | 15,808 |
| | Total Household Durables | | | �� | | | | | | 60,174 |
| | Household Products – 0.2% | | | | | | | | | |
| | | | | |
| 30 | | Church & Dwight Company Inc. | | | | | | | | | 1,881 |
| | | | | |
| 30 | | Clorox Company | | | | | | | | | 1,865 |
| | | | | |
| 10 | | Energizer Holdings Inc., (2) | | | | | | | | | 503 |
| | Total Household Products | | | | | | | | | 4,249 |
| | Independent Power Producers & Energy Traders – 0.9% | | | | | | | | | |
| | | | | |
| 330 | | AES Corporation, (2) | | | | | | | | | 3,049 |
| | | | | |
| 60 | | Calpine Corporation, (2) | | | | | | | | | 763 |
| | | | | |
| 300 | | Constellation Energy Group | | | | | | | | | 9,675 |
| | | | | |
| 200 | | Mirant Corporation, (2) | | | | | | | | | 2,112 |
| | | | | |
| 280 | | NRG Energy Inc., (2) | | | | | | | | | 5,939 |
| | Total Independent Power Producers & Energy Traders | | | | | | | | | 21,538 |
| | Industrial Conglomerates – 0.4% | | | | | | | | | |
| | | | | |
| 90 | | Carlisle Companies Inc. | | | | | | | | | 3,252 |
| | | | | |
| 10 | | McDermott International Inc., (2) | | | | | | | | | 217 |
| | | | | |
| 320 | | Textron Inc. | | | | | | | | | 5,430 |
| | Total Industrial Conglomerates | | | | | | | | | 8,899 |
| | Industrial REIT – 0.3% | | | | | | | | | |
| | | | | |
| 140 | | AMB Property Corp. | | | | | | | | | 3,319 |
| | | | | | | | | | | |
| Shares | | Description (1) | | | | | | | | Value |
| | | | | | | | | | | |
| | Industrial REIT (continued) | | | | | | | | | |
| | | | | |
| 400 | | ProLogis | | | | | | | | $ | 4,052 |
| | Total Industrial REIT | | | | | | | | | 7,371 |
| | Insurance – 7.1% | | | | | | | | | |
| | | | | |
| 50 | | Allied World Assurance Holdings | | | | | | | | | 2,269 |
| | | | | |
| 100 | | American Financial Group Inc. | | | | | | | | | 2,732 |
| | | | | |
| 120 | | American International Group, (2) | | | | | | | | | 4,133 |
| | | | | |
| 10 | | American National Insurance Company | | | | | | | | | 810 |
| | | | | |
| 90 | | Aon Corporation | | | | | | | | | 3,341 |
| | | | | |
| 60 | | Arch Capital Group Limited, (2) | | | | | | | | | 4,470 |
| | | | | |
| 50 | | Arthur J. Gallagher & Co. | | | | | | | | | 1,219 |
| | | | | |
| 90 | | Aspen Insurance Holdings Limited | | | | | | | | | 2,227 |
| | | | | |
| 120 | | Assurant Inc. | | | | | | | | | 4,164 |
| | | | | |
| 60 | | Assured Guaranty Limited | | | | | | | | | 796 |
| | | | | |
| 150 | | Axis Capital Holdings Limited | | | | | | | | | 4,458 |
| | | | | |
| 30 | | Brown & Brown Inc. | | | | | | | | | 574 |
| | | | | |
| 160 | | Cincinnati Financial Corporation | | | | | | | | | 4,139 |
| | | | | |
| 50 | | CNA Financial Corporation, (2) | | | | | | | | | 1,278 |
| | | | | |
| 60 | | Endurance Specialty Holdings, Limited | | | | | | | | | 2,252 |
| | | | | |
| 20 | | Erie Indemnity Company | | | | | | | | | 910 |
| | | | | |
| 50 | | Everest Reinsurance Group Ltd | | | | | | | | | 3,536 |
| | | | | |
| 160 | | Fidelity National Title Group Inc., Class A | | | | | | | | | 2,078 |
| | | | | |
| 1,390 | | Genworth Financial Inc., Class A, (2) | | | | | | | | | 18,167 |
| | | | | |
| 40 | | Hanover Insurance Group Inc. | | | | | | | | | 1,740 |
| | | | | |
| 750 | | Hartford Financial Services Group, Inc. | | | | | | | | | 16,597 |
| | | | | |
| 90 | | HCC Insurance Holdings Inc. | | | | | | | | | 2,228 |
| | | | | |
| 250 | | Lincoln National Corporation | | | | | | | | | 6,073 |
| | | | | |
| 210 | | Marsh & McLennan Companies, Inc. | | | | | | | | | 4,736 |
| | | | | |
| 190 | | MBIA Inc., (2) | | | | | | | | | 1,066 |
| | | | | |
| 30 | | Mercury General Corporation | | | | | | | | | 1,243 |
| | | | | |
| 350 | | Old Republic International Corporation | | | | | | | | | 4,246 |
| | | | | |
| 20 | | OneBeacon Insurance Group Limited, Class A | | | | | | | | | 286 |
| | | | | |
| 70 | | PartnerRe Limited | | | | | | | | | 4,910 |
| | | | | |
| 410 | | Principal Financial Group, Inc. | | | | | | | | | 9,610 |
| | | | | |
| 250 | | Progressive Corporation | | | | | | | | | 4,680 |
| | | | | |
| 100 | | Protective Life Corporation | | | | | | | | | 2,139 |
| | | | | |
| 80 | | Reinsurance Group of America Inc. | | | | | | | | | 3,657 |
| | | | | |
| 50 | | RenaisasnceRE Holdings, Limited | | | | | | | | | 2,814 |
| | | | | |
| 60 | | StanCorp Financial Group Inc. | | | | | | | | | 2,432 |
| | | | | |
| 60 | | Symetra Financial Corporation | | | | | | | | | 720 |
| | | | | |
| 90 | | Torchmark Corporation | | | | | | | | | 4,456 |
| | | | | |
| 50 | | Transatlantic Holdings Inc. | | | | | | | | | 2,398 |
| | | | | |
| 40 | | Unitrin, Inc. | | | | | | | | | 1,024 |
| | | | | |
| 400 | | Unum Group | | | | | | | | | 8,680 |
| | | | | |
| 70 | | Valdius Holdings Limited | | | | | | | | | 1,709 |
| | | | | |
| 10 | | White Mountain Insurance Group | | | | | | | | | 3,242 |
Portfolio of Investments
Nuveen Enhanced Mid-Cap Fund (continued)
June 30, 2010
| | | | | | | | | | | |
| Shares | | Description (1) | | | | | | | | Value |
| | | | | | | | | | | |
| | Insurance (continued) | | | | | | | | | |
| | | | | |
| 70 | | WR Berkley Corporation | | | | | | | | $ | 1,852 |
| | | | | |
| 390 | | XL Capital Ltd, Class A | | | | | | | | | 6,244 |
| | Total Insurance | | | | | | | | | 162,335 |
| | Internet & Catalog Retail – 1.2% | | | | | | | | | |
| | | | | |
| 110 | | Expedia, Inc. | | | | | | | | | 2,066 |
| | | | | |
| 1,170 | | Liberty Media Holding Corporation Interactive, Class A, (2) | | | | | | | | | 12,285 |
| | | | | |
| 50 | | NetFlix.com Inc., (2) | | | | | | | | | 5,432 |
| | | | | |
| 50 | | Priceline.com Incorporated, (2) | | | | | | | | | 8,827 |
| | Total Internet & Catalog Retail | | | | | | | | | 28,610 |
| | Internet Software & Services – 0.5% | | | | | | | | | |
| | | | | |
| 140 | | Akamai Technologies, Inc., (2) | | | | | | | | | 5,680 |
| | | | | |
| 100 | | AOL Inc., (2) | | | | | | | | | 2,079 |
| | | | | |
| 90 | | IAC/InterActiveCorp., (2) | | | | | | | | | 1,977 |
| | | | | |
| 50 | | WebMD Health Corporation, Class A, (2) | | | | | | | | | 2,322 |
| | Total Internet Software & Services | | | | | | | | | 12,058 |
| | IT Services – 1.3% | | | | | | | | | |
| | | | | |
| 70 | | Alliance Data Systems Corporation, (2) | | | | | | | | | 4,166 |
| | | | | |
| 80 | | Amdocs Limited, (2) | | | | | | | | | 2,148 |
| | | | | |
| 70 | | Broadridge Financial Solutions, Inc. | | | | | | | | | 1,334 |
| | | | | |
| 120 | | Computer Sciences Corporation | | | | | | | | | 5,430 |
| | | | | |
| 40 | | Convergys Corporation, (2) | | | | | | | | | 392 |
| | | | | |
| 140 | | CoreLogic Inc. | | | | | | | | | 2,472 |
| | | | | |
| 200 | | Fidelity National Information Services | | | | | | | | | 5,364 |
| | | | | |
| 40 | | Gartner Inc., (2) | | | | | | | | | 930 |
| | | | | |
| 40 | | Genpact Limited, (2) | | | | | | | | | 621 |
| | | | | |
| 10 | | Global Payments Inc. | | | | | | | | | 365 |
| | | | | |
| 30 | | Hewitt Associates Inc., Class A, (2) | | | | | | | | | 1,034 |
| | | | | |
| 30 | | Lender Processing Services Inc. | | | | | | | | | 939 |
| | | | | |
| 30 | | NeuStar, Inc., (2) | | | | | | | | | 619 |
| | | | | |
| 70 | | Paychex, Inc. | | | | | | | | | 1,818 |
| | | | | |
| 40 | | SAIC, Inc., (2) | | | | | | | | | 670 |
| | | | | |
| 20 | | Total System Services Inc. | | | | | | | | | 272 |
| | | | | |
| 40 | | Western Union Company | | | | | | | | | 596 |
| | Total IT Services | | | | | | | | | 29,170 |
| | Leisure Equipment & Products – 0.6% | | | | | | | | | |
| | | | | |
| 140 | | Hasbro, Inc. | | | | | | | | | 5,754 |
| | | | | |
| 330 | | Mattel, Inc. | | | | | | | | | 6,983 |
| | Total Leisure Equipment & Products | | | | | | | | | 12,737 |
| | Life Sciences Tools & Services – 0.8% | | | | | | | | | |
| | | | | |
| 10 | | Bio-Rad Laboratories Inc., (2) | | | | | | | | | 865 |
| | | | | |
| 10 | | Covance, Inc., (2) | | | | | | | | | 513 |
| | | | | |
| 20 | | Illumina Inc., (2) | | | | | | | | | 871 |
| | | | | |
| 40 | | Life Technologies Corporation, (2) | | | | | | | | | 1,890 |
| | | | | |
| 20 | | Mettler-Toledo International Inc., (2) | | | | | | | | | 2,233 |
| | | | | |
| 40 | | Millipore Corporation, (2) | | | | | | | | | 4,266 |
| | | | | | | | | | | |
| Shares | | Description (1) | | | | | | | | Value |
| | | | | | | | | | | |
| | Life Sciences Tools & Services (continued) | | | | | | | | | |
| | | | | |
| 40 | | Perkinelmer Inc. | | | | | | | | $ | 827 |
| | | | | |
| 70 | | Pharmaceutical Product Development Inc. | | | | | | | | | 1,779 |
| | | | | |
| 20 | | Techne Corporation | | | | | | | | | 1,149 |
| | | | | |
| 60 | | Waters Corporation, (2) | | | | | | | | | 3,882 |
| | Total Life Sciences Tools & Services | | | | | | | | | 18,275 |
| | Machinery – 5.1% | | | | | | | | | |
| | | | | |
| 120 | | Bucyrus International, Inc. | | | | | | | | | 5,694 |
| | | | | |
| 50 | | CNH Global N.V. | | | | | | | | | 1,132 |
| | | | | |
| 40 | | Crane Company | | | | | | | | | 1,208 |
| | | | | |
| 290 | | Cummins Inc. | | | | | | | | | 18,888 |
| | | | | |
| 40 | | Donaldson Company, Inc. | | | | | | | | | 1,706 |
| | | | | |
| 160 | | Dover Corporation | | | | | | | | | 6,686 |
| | | | | |
| 200 | | Eaton Corporation | | | | | | | | | 13,088 |
| | | | | |
| 30 | | Flowserve Corporation | | | | | | | | | 2,544 |
| | | | | |
| 40 | | Gardner Denver, Inc. | | | | | | | | | 1,784 |
| | | | | |
| 40 | | Graco Inc. | | | | | | | | | 1,128 |
| | | | | |
| 30 | | Harsco Corporation | | | | | | | | | 705 |
| | | | | |
| 40 | | IDEX Corporation | | | | | | | | | 1,143 |
| | | | | |
| 410 | | Ingersoll Rand Company Limited, Class A | | | | | | | | | 14,141 |
| | | | | |
| 80 | | Joy Global Inc. | | | | | | | | | 4,007 |
| | | | | |
| 50 | | Kennametal Inc. | | | | | | | | | 1,271 |
| | | | | |
| 30 | | Lincoln Electric Holdings Inc. | | | | | | | | | 1,530 |
| | | | | |
| 200 | | Manitowoc Company Inc. | | | | | | | | | 1,828 |
| | | | | |
| 60 | | Navistar International Corporation, (2) | | | | | | | | | 2,952 |
| | | | | |
| 230 | | Oshkosh Truck Corporation, (2) | | | | | | | | | 7,167 |
| | | | | |
| 60 | | Pall Corporation | | | | | | | | | 2,062 |
| | | | | |
| 140 | | Parker Hannifin Corporation | | | | | | | | | 7,764 |
| | | | | |
| 80 | | Pentair, Inc. | | | | | | | | | 2,576 |
| | | | | |
| 60 | | Snap-on Incorporated | | | | | | | | | 2,455 |
| | | | | |
| 30 | | SPX Corporation | | | | | | | | | 1,584 |
| | | | | |
| 70 | | Terex Corporation, (2) | | | | | | | | | 1,312 |
| | | | | |
| 120 | | Timken Company | | | | | | | | | 3,119 |
| | | | | |
| 50 | | Toro Company | | | | | | | | | 2,456 |
| | | | | |
| 150 | | Trinity Industries Inc. | | | | | | | | | 2,658 |
| | | | | |
| 10 | | Valmont Industries, Inc. | | | | | | | | | 727 |
| | | | | |
| 50 | | WABCO Holdings Inc., (2) | | | | | | | | | 1,574 |
| | | | | |
| 20 | | Wabtec Corporation | | | | | | | | | 798 |
| | Total Machinery | | | | | | | | | 117,687 |
| | Marine – 0.1% | | | | | | | | | |
| | | | | |
| 40 | | Alexander and Bald, Inc. | | | | | | | | | 1,191 |
| | | | | |
| 20 | | Kirby Corporation, (2) | | | | | | | | | 765 |
| | Total Marine | | | | | | | | | 1,956 |
| | Media – 4.0% | | | | | | | | | |
| | | | | |
| 320 | | Cablevision Systems Corporation | | | | | | | | | 7,683 |
| | | | | |
| 990 | | CBS Corporation, Class B | | | | | | | | | 12,801 |
| | | | | |
| 100 | | Clear Channel Outdoor Holdings Inc., Class A, (2) | | | | | | | | | 868 |
Portfolio of Investments
Nuveen Enhanced Mid-Cap Fund (continued)
June 30, 2010
| | | | | | | | | | | |
| Shares | | Description (1) | | | | | | | | Value |
| | | | | | | | | | | |
| | Media (continued) | | | | | | | | | |
| | | | | |
| 290 | | Discovery Communications inc., Class A Shares, (2) | | | | | | | | $ | 10,356 |
| | | | | |
| 290 | | Echostar Communications Corporation, Variable Prepaid Forward | | | | | | | | | 5,263 |
| | | | | |
| 520 | | Gannett Company Inc. | | | | | | | | | 6,999 |
| | | | | |
| 30 | | Interactive Data Corporation | | | | | | | | | 1,001 |
| | | | | |
| 400 | | Interpublic Group Companies, Inc., (2) | | | | | | | | | 2,852 |
| | | | | |
| 20 | | John Wiley and Sons Inc., Class A | | | | | | | | | 773 |
| | | | | |
| 40 | | Lamar Advertising Company, (2) | | | | | | | | | 981 |
| | | | | |
| 490 | | Liberty Global Inc, A Shares, (2) | | | | | | | | | 12,735 |
| | | | | |
| 140 | | Liberty Media Holding Corporation, Capital Tracking Stock, Class A, (2) | | | | | | | | | 5,867 |
| | | | | |
| 40 | | Liberty Media Starz, (2) | | | | | | | | | 2,074 |
| | | | | |
| 30 | | Madison Square Garden Inc., (2) | | | | | | | | | 590 |
| | | | | |
| 50 | | McGraw-Hill Companies, Inc. | | | | | | | | | 1,407 |
| | | | | |
| 20 | | Meredith Corporation | | | | | | | | | 623 |
| | | | | |
| 10 | | Morningstar, Inc., (2) | | | | | | | | | 425 |
| | | | | |
| 120 | | New York Times, Class A, (2) | | | | | | | | | 1,038 |
| | | | | |
| 90 | | Regal Entertainment Group, Class A | | | | | | | | | 1,174 |
| | | | | |
| 80 | | Scripps Networks Interactive, Class A Shares | | | | | | | | | 3,227 |
| | | | | |
| 5,790 | | Sirius XM Radio Inc., (2) | | | | | | | | | 5,498 |
| | | | | |
| 510 | | Virgin Media, Inc. | | | | | | | | | 8,512 |
| | Total Media | | | | | | | | | 92,747 |
| | Metals & Mining – 1.2% | | | | | | | | | |
| | | | | |
| 70 | | Allegheny Technologies, Inc. | | | | | | | | | 3,093 |
| | | | | |
| 60 | | Carpenter Technology Inc. | | | | | | | | | 1,970 |
| | | | | |
| 210 | | Cliffs Natural Resources Inc. | | | | | | | | | 9,904 |
| | | | | |
| 50 | | Commercial Metals Company | | | | | | | | | 661 |
| | | | | |
| 20 | | Compass Minerals International, Inc. | | | | | | | | | 1,406 |
| | | | | |
| 30 | | Gerdau AmeriSteel Corporation, (2) | | | | | | | | | 327 |
| | | | | |
| 90 | | Reliance Steel & Aluminum Company | | | | | | | | | 3,253 |
| | | | | |
| 90 | | Titanium Metals Corporation, (2) | | | | | | | | | 1,583 |
| | | | | |
| 20 | | United States Steel Corporation | | | | | | | | | 771 |
| | | | | |
| 80 | | Walter Industries Inc. | | | | | | | | | 4,868 |
| | Total Metals & Mining | | | | | | | | | 27,836 |
| | Mortgage REIT – 1.0% | | | | | | | | | |
| | | | | |
| 1,170 | | Annaly Capital Management Inc. | | | | | | | | | 20,066 |
| | | | | |
| 660 | | Chimera Investments Corporation | | | | | | | | | 2,383 |
| | Total Mortgage REIT | | | | | | | | | 22,449 |
| | Multiline Retail – 1.9% | | | | | | | | | |
| | | | | |
| 100 | | Big Lots, Inc., (2) | | | | | | | | | 3,209 |
| | | | | |
| 90 | | Dollar General Corporation, (2) | | | | | | | | | 2,480 |
| | | | | |
| 75 | | Dollar Tree Stores Inc., (2) | | | | | | | | | 3,122 |
| | | | | |
| 110 | | Family Dollar Stores, Inc. | | | | | | | | | 4,146 |
| | | | | |
| 170 | | J.C. Penney Company, Inc. | | | | | | | | | 3,652 |
| | | | | |
| 840 | | Macy’s, Inc. | | | | | | | | | 15,036 |
| | | | | |
| 280 | | Nordstrom, Inc. | | | | | | | | | 9,013 |
| | | | | | | | | | | |
| Shares | | Description (1) | | | | | | | | Value |
| | | | | | | | | | | |
| | Multiline Retail (continued) | | | | | | | | | |
| | | | | |
| 50 | | Sears Holding Corporation, (2) | | | | | | | | $ | 3,232 |
| | Total Multiline Retail | | | | | | | | | 43,890 |
| | Multi-Utilities – 4.2% | | | | | | | | | |
| | | | | |
| 140 | | Alliant Energy Corporation | | | | | | | | | 4,444 |
| | | | | |
| 310 | | Ameren Corporation | | | | | | | | | 7,369 |
| | | | | |
| 620 | | CenterPoint Energy, Inc. | | | | | | | | | 8,159 |
| | | | | |
| 320 | | CMS Energy Corporation | | | | | | | | | 4,688 |
| | | | | |
| 270 | | Consolidated Edison, Inc. | | | | | | | | | 11,637 |
| | | | | |
| 240 | | DTE Energy Company | | | | | | | | | 10,946 |
| | | | | |
| 140 | | Integrys Energy Group, Inc. | | | | | | | | | 6,123 |
| | | | | |
| 110 | | MDU Resources Group Inc. | | | | | | | | | 1,983 |
| | | | | |
| 450 | | NiSource Inc. | | | | | | | | | 6,525 |
| | | | | |
| 70 | | NSTAR | | | | | | | | | 2,450 |
| | | | | |
| 110 | | OGE Energy Corp. | | | | | | | | | 4,022 |
| | | | | |
| 110 | | Scana Corporation | | | | | | | | | 3,934 |
| | | | | |
| 110 | | Sempra Energy | | | | | | | | | 5,147 |
| | | | | |
| 290 | | TECO Energy, Inc. | | | | | | | | | 4,370 |
| | | | | |
| 60 | | Vectren Corporation | | | | | | | | | 1,420 |
| | | | | |
| 90 | | Wisconsin Energy Corporation | | | | | | | | | 4,567 |
| | | | | |
| 430 | | Xcel Energy, Inc. | | | | | | | | | 8,862 |
| | Total Multi-Utilities | | | | | | | | | 96,646 |
| | Office Electronics – 0.6% | | | | | | | | | |
| | | | | |
| 1,510 | | Xerox Corporation | | | | | | | | | 12,140 |
| | | | | |
| 30 | | Zebra Technologies Corporation, Class A, (2) | | | | | | | | | 761 |
| | Total Office Electronics | | | | | | | | | 12,901 |
| | Office REIT – 1.5% | | | | | | | | | |
| | | | | |
| 60 | | Alexandria Real Estate Equities Inc. | | | | | | | | | 3,802 |
| | | | | |
| 110 | | Boston Properties, Inc. | | | | | | | | | 7,847 |
| | | | | |
| 190 | | Brandywine Realty Trust | | | | | | | | | 2,043 |
| | | | | |
| 20 | | Corporate Office Properties | | | | | | | | | 755 |
| | | | | |
| 60 | | Digital Realty Trust Inc. | | | | | | | | | 3,461 |
| | | | | |
| 160 | | Douglas Emmett Inc. | | | | | | | | | 2,275 |
| | | | | |
| 170 | | Duke Realty Corporation | | | | | | | | | 1,930 |
| | | | | |
| 450 | | HRPT Properties Trust | | | | | | | | | 2,795 |
| | | | | |
| 70 | | Mack-Cali Realty Corporation | | | | | | | | | 2,081 |
| | | | | |
| 50 | | Piedmont Office Realty Trust | | | | | | | | | 937 |
| | | | | |
| 140 | | SL Green Realty Corporation | | | | | | | | | 7,706 |
| | Total Office REIT | | | | | | | | | 35,632 |
| | Oil, Gas & Consumable Fuels – 3.2% | | | | | | | | | |
| | | | | |
| 10 | | Alpha Natural Resources Inc., (2) | | | | | | | | | 339 |
| | | | | |
| 10 | | Arch Coal Inc. | | | | | | | | | 198 |
| | | | | |
| 70 | | Atlas Energy Inc, (2) | | | | | | | | | 1,895 |
| | | | | |
| 130 | | Cimarex Energy Company | | | | | | | | | 9,305 |
| | | | | |
| 10 | | Cobalt International Energy, Inc., (2) | | | | | | | | | 75 |
| | | | | |
| 50 | | Concho Resources Inc., (2) | | | | | | | | | 2,767 |
Portfolio of Investments
Nuveen Enhanced Mid-Cap Fund (continued)
June 30, 2010
| | | | | | | | | | | |
| Shares | | Description (1) | | | | | | | | Value |
| | | | | | | | | | | |
| | Oil, Gas & Consumable Fuels (continued) | | | | | | | | | |
| | | | | |
| 10 | | Continental Resources Inc., (2) | | | | | | | | $ | 446 |
| | | | | |
| 240 | | El Paso Corporation | | | | | | | | | 2,666 |
| | | | | |
| 90 | | Forest Oil Corporation, (2) | | | | | | | | | 2,462 |
| | | | | |
| 60 | | Frontline Limited | | | | | | | | | 1,712 |
| | | | | |
| 130 | | Mariner Energy Inc., (2) | | | | | | | | | 2,792 |
| | | | | |
| 40 | | Massey Energy Company | | | | | | | | | 1,094 |
| | | | | |
| 80 | | Murphy Oil Corporation | | | | | | | | | 3,964 |
| | | | | |
| 150 | | Newfield Exploration Company, (2) | | | | | | | | | 7,329 |
| | | | | |
| 30 | | Peabody Energy Corporation | | | | | | | | | 1,174 |
| | | | | |
| 160 | | Pioneer Natural Resources Company | | | | | | | | | 9,512 |
| | | | | |
| 20 | | Plains Exploration & Production Company, (2) | | | | | | | | | 412 |
| | | | | |
| 20 | | Quicksilver Resources Inc., (2) | | | | | | | | | 220 |
| | | | | |
| 90 | | SM Energy Company | | | | | | | | | 3,614 |
| | | | | |
| 120 | | Southern Union Company | | | | | | | | | 2,623 |
| | | | | |
| 500 | | Spectra Energy Corporation | | | | | | | | | 10,035 |
| | | | | |
| 70 | | Teekay Shipping Corporation | | | | | | | | | 1,832 |
| | | | | |
| 130 | | Tesoro Corporation | | | | | | | | | 1,517 |
| | | | | |
| 20 | | Ultra Petroleum Corporation, (2) | | | | | | | | | 885 |
| | | | | |
| 50 | | Whiting Petroleum Corporation, (2) | | | | | | | | | 3,921 |
| | Total Oil, Gas & Consumable Fuels | | | | | | | | | 72,789 |
| | Paper & Forest Products – 1.4% | | | | | | | | | |
| | | | | |
| 140 | | Domtar Corporation | | | | | | | | | 6,881 |
| | | | | |
| 790 | | International Paper Company | | | | | | | | | 17,878 |
| | | | | |
| 250 | | MeadWestvaco Corporation | | | | | | | | | 5,550 |
| | | | | |
| 40 | | Weyerhaeuser Company | | | | | | | | | 1,408 |
| | Total Paper & Forest Products | | | | | | | | | 31,717 |
| | Personal Products – 0.5% | | | | | | | | | |
| | | | | |
| 20 | | Alberto Culver Company | | | | | | | | | 542 |
| | | | | |
| 140 | | Estee Lauder Companies Inc., Class A | | | | | | | | | 7,802 |
| | | | | |
| 50 | | Herbalife, Limited | | | | | | | | | 2,303 |
| | | | | |
| 30 | | NBTY Inc., (2) | | | | | | | | | 1,020 |
| | Total Personal Products | | | | | | | | | 11,667 |
| | Pharmaceuticals – 0.9% | | | | | | | | | |
| | | | | |
| 50 | | Endo Pharmaceuticals Holdings Inc., (2) | | | | | | | | | 1,091 |
| | | | | |
| 90 | | King Pharmaceuticals Inc., (2) | | | | | | | | | 683 |
| | | | | |
| 170 | | Mylan Laboratories Inc., (2) | | | | | | | | | 2,897 |
| | | | | |
| 120 | | Perrigo Company | | | | | | | | | 7,088 |
| | | | | |
| 70 | | Valeant Pharmaceuticals International | | | | | | | | | 3,660 |
| | | | | |
| 90 | | Warner Chilcott Limited, (2) | | | | | | | | | 2,057 |
| | | | | |
| 90 | | Watson Pharmaceuticals Inc., (2) | | | | | | | | | 3,651 |
| | Total Pharmaceuticals | | | | | | | | | 21,127 |
| | Professional Services – 0.2% | | | | | | | | | |
| | | | | |
| 20 | | Dun and Bradstreet Inc. | | | | | | | | | 1,342 |
| | | | | |
| 20 | | Equifax Inc. | | | | | | | | | 561 |
| | | | | |
| 20 | | IHS Inc., (2) | | | | | | | | | 1,168 |
| | | | | | | | | | | |
| Shares | | Description (1) | | | | | | | | Value |
| | | | | | | | | | | |
| | Professional Services (continued) | | | | | | | | | |
| | | | | |
| 40 | | Towers Watson & Company, Class A Shares | | | | | | | | $ | 1,554 |
| | | | | |
| 30 | | Verisk Analytics Inc, Class A Shares, (2) | | | | | | | | | 897 |
| | Total Professional Services | | | | | | | | | 5,522 |
| | Real Estate Management & Devlopment – 0.5% | | | | | | | | | |
| | | | | |
| 310 | | CB Richard Ellis Group, Inc., Class A, (2) | | | | | | | | | 4,219 |
| | | | | |
| 240 | | Forest City Enterprises, Inc., (2) | | | | | | | | | 2,717 |
| | | | | |
| 60 | | Jones Lang LaSalle Inc. | | | | | | | | | 3,938 |
| | Total Real Estate Management & Devlopment | | | | | | | | | 10,874 |
| | Residential REIT – 1.6% | | | | | | | | | |
| | | | | |
| 170 | | Apartment Investment & Management Company, Class A | | | | | | | | | 3,293 |
| | | | | |
| 70 | | AvalonBay Communities, Inc. | | | | | | | | | 6,536 |
| | | | | |
| 60 | | BRE Properties, Inc. | | | | | | | | | 2,216 |
| | | | | |
| 60 | | Camden Property Trust | | | | | | | | | 2,451 |
| | | | | |
| 350 | | Equity Residential | | | | | | | | | 14,574 |
| | | | | |
| 30 | | Essex Property Trust Inc. | | | | | | | | | 2,926 |
| | | | | |
| 210 | | UDR Inc. | | | | | | | | | 4,017 |
| | Total Residential REIT | | | | | | | | | 36,013 |
| | Retail REIT – 1.2% | | | | | | | | | |
| | | | | |
| 350 | | Developers Diversified Realty Corporation | | | | | | | | | 3,465 |
| | | | | |
| 30 | | Federal Realty Investment Trust | | | | | | | | | 2,108 |
| | | | | |
| 390 | | General Growth Properties Inc. | | | | | | | | | 5,171 |
| | | | | |
| 130 | | Kimco Realty Corporation | | | | | | | | | 1,747 |
| | | | | |
| 220 | | Macerich Company | | | | | | | | | 8,210 |
| | | | | |
| 100 | | Realty Income Corporation | | | | | | | | | 3,033 |
| | | | | |
| 60 | | Taubman Centers Inc. | | | | | | | | | 2,258 |
| | | | | |
| 120 | | Weingarten Realty Trust | | | | | | | | | 2,286 |
| | Total Retail REIT | | | | | | | | | 28,278 |
| | Road & Rail – 0.6% | | | | | | | | | |
| | | | | |
| 390 | | Hertz Global Holdings Inc., (2) | | | | | | | | | 3,689 |
| | | | | |
| 160 | | Kansas City Southern Industries, (2) | | | | | | | | | 5,816 |
| | | | | |
| 10 | | Landstar System | | | | | | | | | 390 |
| | | | | |
| 100 | | Ryder System, Inc. | | | | | | | | | 4,023 |
| | Total Road & Rail | | | | | | | | | 13,918 |
| | Semiconductors & Equipment – 2.2% | | | | | | | | | |
| | | | | |
| 980 | | Advanced Micro Devices, Inc., (2) | | | | | | | | | 7,174 |
| | | | | |
| 160 | | Altera Corporation | | | | | | | | | 3,970 |
| | | | | |
| 70 | | Analog Devices, Inc. | | | | | | | | | 1,950 |
| | | | | |
| 80 | | Atheros Communications, Inc., (2) | | | | | | | | | 2,203 |
| | | | | |
| 50 | | Avago Technologies Limtied, (2) | | | | | | | | | 1,053 |
| | | | | |
| 120 | | Cree, Inc., (2) | | | | | | | | | 7,204 |
| | | | | |
| 100 | | Fairchild Semiconductor International Inc., Class A, (2) | | | | | | | | | 841 |
| | | | | |
| 10 | | International Rectifier Corporation, (2) | | | | | | | | | 186 |
| | | | | |
| 50 | | Linear Technology Corporation | | | | | | | | | 1,390 |
| | | | | |
| 280 | | Marvell Technology Group Ltd., (2) | | | | | | | | | 4,413 |
| | | | | |
| 50 | | Microchip Technology Incorporated | | | | | | | | | 1,387 |
Portfolio of Investments
Nuveen Enhanced Mid-Cap Fund (continued)
June 30, 2010
| | | | | | | | | | | |
| Shares | | Description (1) | | | | | | | | Value |
| | | | | | | | | | | |
| | Semiconductors & Equipment (continued) | | | | | | | | | |
| | | | | |
| 1,280 | | Micron Technology, Inc., (2) | | | | | | | | $ | 10,867 |
| | | | | |
| 10 | | Novellus Systems, Inc., (2) | | | | | | | | | 254 |
| | | | | |
| 70 | | Rambus Inc., (2) | | | | | | | | | 1,226 |
| | | | | |
| 10 | | Silicon Laboratories Inc., (2) | | | | | | | | | 406 |
| | | | | |
| 190 | | Skyworks Solutions Inc., (2) | | | | | | | | | 3,190 |
| | | | | |
| 50 | | SunPower Corporation, (2) | | | | | | | | | 605 |
| | | | | |
| 60 | | Teradyne Inc., (2) | | | | | | | | | 585 |
| | | | | |
| 10 | | Varian Semiconductor Equipment Associate, (2) | | | | | | | | | 287 |
| | | | | |
| 80 | | Xilinx, Inc. | | | | | | | | | 2,021 |
| | Total Semiconductors & Equipment | | | | | | | | | 51,212 |
| | Software – 1.6% | | | | | | | | | |
| | | | | |
| 40 | | Ansys Inc., (2) | | | | | | | | | 1,623 |
| | | | | |
| 60 | | CA Inc. | | | | | | | | | 1,104 |
| | | | | |
| 30 | | Cadence Design Systems, Inc., (2) | | | | | | | | | 174 |
| | | | | |
| 200 | | Citrix Systems, (2) | | | | | | | | | 8,446 |
| | | | | |
| 10 | | FactSet Research Systems Inc. | | | | | | | | | 670 |
| | | | | |
| 10 | | Informatica Corporation, (2) | | | | | | | | | 239 |
| | | | | |
| 60 | | Intuit, Inc., (2) | | | | | | | | | 2,086 |
| | | | | |
| 40 | | Micros Systems, Inc., (2) | | | | | | | | | 1,275 |
| | | | | |
| 10 | | Novell Inc., (2) | | | | | | | | | 57 |
| | | | | |
| 10 | | Red Hat, Inc., (2) | | | | | | | | | 289 |
| | | | | |
| 50 | | Rovi Corporation, (2) | | | | | | | | | 1,896 |
| | | | | |
| 130 | | Salesforce.com, Inc., (2) | | | | | | | | | 11,157 |
| | | | | |
| 20 | | Solera Holdings Inc. | | | | | | | | | 724 |
| | | | | |
| 100 | | Sybase, Inc., (2) | | | | | | | | | 6,466 |
| | | | | |
| 20 | | Synopsys Inc., (2) | | | | | | | | | 417 |
| | Total Software | | | | | | | | | 36,623 |
| | Specialized REIT – 1.4% | | | | | | | | | |
| | | | | |
| 230 | | Health Care Property Investors Inc. | | | | | | | | | 7,418 |
| | | | | |
| 70 | | Health Care REIT, Inc. | | | | | | | | | 2,948 |
| | | | | |
| 190 | | Hospitality Properties Trust | | | | | | | | | 4,009 |
| | | | | |
| 480 | | Host Hotels & Resorts Inc. | | | | | | | | | 6,470 |
| | | | | |
| 70 | | Nationwide Health Properties, Inc. | | | | | | | | | 2,504 |
| | | | | |
| 30 | | Rayonier Inc. | | | | | | | | | 1,321 |
| | | | | |
| 120 | | Senior Housing Properties Trust | | | | | | | | | 2,413 |
| | | | | |
| 130 | | Ventas Inc. | | | | | | | | | 6,104 |
| | Total Specialized REIT | | | | | | | | | 33,187 |
| | Specialty Retail – 3.2% | | | | | | | | | |
| | | | | |
| 10 | | Abercrombie & Fitch Co., Class A | | | | | | | | | 307 |
| | | | | |
| 30 | | Advance Auto Parts, Inc. | | | | | | | | | 1,505 |
| | | | | |
| 20 | | Aeropostale, Inc., (2) | | | | | | | | | 573 |
| | | | | |
| 30 | | American Eagle Outfitters, Inc. | | | | | | | | | 353 |
| | | | | |
| 50 | | AutoNation Inc., (2) | | | | | | | | | 975 |
| | | | | |
| 10 | | AutoZone, Inc., (2) | | | | | | | | | 1,932 |
| | | | | |
| 230 | | Bed Bath and Beyond Inc., (2) | | | | | | | | | 8,528 |
| | | | | | | | | | | |
| Shares | | Description (1) | | | | | | | | Value |
| | | | | | | | | | | |
| | Specialty Retail (continued) | | | | | | | | | |
| | | | | |
| 280 | | CarMax, Inc., (2) | | | | | | | | $ | 5,572 |
| | | | | |
| 110 | | Dick’s Sporting Goods Inc., (2) | | | | | | | | | 2,738 |
| | | | | |
| 180 | | Foot Locker, Inc. | | | | | | | | | 2,272 |
| | | | | |
| 70 | | Guess Inc. | | | | | | | | | 2,187 |
| | | | | |
| 70 | | J. Crew Group Inc., (2) | | | | | | | | | 2,577 |
| | | | | |
| 510 | | Limited Brands, Inc. | | | | | | | | | 11,256 |
| | | | | |
| 70 | | O’Reilly Automotive Inc., (2) | | | | | | | | | 3,329 |
| | | | | |
| 130 | | PetSmart Inc. | | | | | | | | | 3,922 |
| | | | | |
| 110 | | RadioShack Corporation | | | | | | | | | 2,146 |
| | | | | |
| 70 | | Ross Stores, Inc. | | | | | | | | | 3,730 |
| | | | | |
| 120 | | Signet Jewelers Limited, (2) | | | | | | | | | 3,300 |
| | | | | |
| 150 | | Tiffany & Co. | | | | | | | | | 5,687 |
| | | | | |
| 40 | | Tractor Supply Company | | | | | | | | | 2,439 |
| | | | | |
| 110 | | Urban Outfitters, Inc., (2) | | | | | | | | | 3,783 |
| | | | | |
| 200 | | Williams-Sonoma Inc. | | | | | | | | | 4,964 |
| | Total Specialty Retail | | | | | | | | | 74,075 |
| | Textiles, Apparel & Luxury Goods – 1.2% | | | | | | | | | |
| | | | | |
| 240 | | Coach, Inc. | | | | | | | | | 8,772 |
| | | | | |
| 60 | | Fossil Inc., (2) | | | | | | | | | 2,082 |
| | | | | |
| 100 | | Hanesbrands Inc., (2) | | | | | | | | | 2,406 |
| | | | | |
| 80 | | Phillips-Van Heusen Corporation | | | | | | | | | 3,702 |
| | | | | |
| 70 | | Polo Ralph Lauren Corporation | | | | | | | | | 5,107 |
| | | | | |
| 80 | | VF Corporation | | | | | | | | | 5,694 |
| | Total Textiles, Apparel & Luxury Goods | | | | | | | | | 27,763 |
| | Thrifts & Mortgage Finance – 0.5% | | | | | | | | | |
| | | | | |
| 10 | | Capitol Federal Financial | | | | | | | | | 332 |
| | | | | |
| 40 | | First Niagara Financial Group Inc. | | | | | | | | | 501 |
| | | | | |
| 50 | | Hudson City Bancorp, Inc. | | | | | | | | | 612 |
| | | | | |
| 550 | | New York Community Bancorp, Inc. | | | | | | | | | 8,399 |
| | | | | |
| 30 | | TFS Financial Corporation | | | | | | | | | 372 |
| | | | | |
| 70 | | Washington Federal Inc. | | | | | | | | | 1,133 |
| | Total Thrifts & Mortgage Finance | | | | | | | | | 11,349 |
| | Tobacco – 0.0% | | | | | | | | | |
| | | | | |
| 10 | | Lorillard Inc. | | | | | | | | | 720 |
| | Trading Companies & Distributors – 0.5% | | | | | | | | | |
| | | | | |
| 70 | | Fastenal Company | | | | | | | | | 3,513 |
| | | | | |
| 50 | | GATX Corporation | | | | | | | | | 1,334 |
| | | | | |
| 20 | | MSC Industrial Direct Inc., Class A | | | | | | | | | 1,013 |
| | | | | |
| 30 | | W.W. Grainger, Inc. | | | | | | | | | 2,984 |
| | | | | |
| 50 | | WESCO International Inc., (2) | | | | | | | | | 1,684 |
| | Total Trading Companies & Distributors | | | | | | | | | 10,528 |
| | Water Utilities – 0.2% | | | | | | | | | |
| | | | | |
| 140 | | American Water Works Company | | | | | | | | | 2,884 |
| | | | | |
| 60 | | Aqua America Inc. | | | | | | | | | 1,061 |
| | Total Water Utilities | | | | | | | | | 3,945 |
Portfolio of Investments
Nuveen Enhanced Mid-Cap Fund (continued)
June 30, 2010
| | | | | | | | | | | |
| Shares | | Description (1) | | | | | | | | Value |
| | Wireless Telecommunication Services – 0.7% | | | | | | | | | |
| | | | | |
| 150 | | Clearwire Corporation, (2) | | | | | | | | $ | 1,092 |
| | | | | |
| 150 | | Crown Castle International Corporation, (2) | | | | | | | | | 5,589 |
| | | | | |
| 230 | | NII Holdings Inc., Class B, (2) | | | | | | | | | 7,480 |
| | | | | |
| 30 | | Telephone and Data Systems Inc. | | | | | | | | | 912 |
| | | | | |
| 10 | | United States Cellular Corporation, (2) | | | | | | | | | 413 |
| | Total Wireless Telecommunication Services | | | | | | | | | 15,486 |
| | Total Investments (cost $2,087,894) – 101.2% | | | | | | | | | 2,323,635 |
| | Other Assets Less Liabilities – (1.2)% | | | | | | | | | (27,103) |
| | Net Assets – 100% | | | | | | | | $ | 2,296,532 |
| | | | For Fund portfolio compliance purposes, the Fund’s industry classifications refer to any one or more of the industry sub-classifications used by one or more widely recognized market indexes or ratings group indexes, and/or as defined by Fund management. This definition may not apply for purposes of this report, which may combine industry sub-classifications into sectors for reporting ease. |
| | (1) | | All percentages shown in the Portfolio of Investments are based on net assets. |
| | (2) | | Non-income producing; issuer has not declared a dividend within the past twelve months. |
See accompanying notes to financial statements.
Statement of Assets and Liabilities
June 30, 2010
| | | | | | | | |
| | | Enhanced Core Equity | | | Enhanced
Mid-Cap | |
Assets | | | | | | | | |
Investments, at value (cost $3,458,988 and $2,087,894, respectively) | | $ | 3,175,946 | | | $ | 2,323,635 | |
Cash | | | 28,954 | | | | 34,437 | |
Receivables: | | | | | | | | |
Dividends | | | 5,021 | | | | 3,548 | |
From Adviser | | | 9,693 | | | | 5,060 | |
Shares sold | | | 577 | | | | 300 | |
Other assets | | | 25 | | | | 2 | |
Total assets | | | 3,220,216 | | | | 2,366,982 | |
Liabilities | | | | | | | | |
Accrued expenses: | | | | | | | | |
12b-1 distribution and service fees | | | 339 | | | | 626 | |
Other | | | 79,004 | | | | 69,824 | |
Total liabilities | | | 79,343 | | | | 70,450 | |
Net assets | | $ | 3,140,873 | | | $ | 2,296,532 | |
Class A Shares | | | | | | | | |
Net assets | | $ | 218,619 | | | $ | 570,886 | |
Shares outstanding | | | 16,007 | | | | 40,073 | |
Net asset value per share | | $ | 13.66 | | | $ | 14.25 | |
Offering price per share (net asset value per share plus
maximum sales charge of 5.75% of offering price) | | $ | 14.49 | | | $ | 15.12 | |
Class C Shares | | | | | | | | |
Net assets | | $ | 328,537 | | | $ | 550,968 | |
Shares outstanding | | | 24,109 | | | | 38,723 | |
Net asset value and offering price per share | | $ | 13.63 | | | $ | 14.23 | |
Class I Shares | | | | | | | | |
Net assets | | $ | 2,593,717 | | | $ | 1,174,678 | |
Shares outstanding | | | 189,763 | | | | 82,427 | |
Net asset value and offering price per share | | $ | 13.67 | | | $ | 14.25 | |
Net Assets Consist of: | | | | | | | | |
Capital paid-in | | $ | 4,508,613 | | | $ | 3,210,132 | |
Undistributed (Over-distribution of) net investment income | | | 57,482 | | | | 15,172 | |
Accumulated net realized gain (loss) | | | (1,142,180 | ) | | | (1,164,513 | ) |
Net unrealized appreciation (depreciation) | | | (283,042 | ) | | | 235,741 | |
Net assets | | $ | 3,140,873 | | | $ | 2,296,532 | |
Authorized shares | | | Unlimited | | | | Unlimited | |
Par value per share | | $ | 0.01 | | | $ | 0.01 | |
See accompanying notes to financial statements.
Statement of Operations
Year Ended June 30, 2010
| | | | | | | | |
| | | Enhanced
Core Equity | | | Enhanced
Mid-Cap | |
Investment Income | | $ | 194,572 | | | $ | 44,010 | |
Expenses | | | | | | | | |
Management fees | | | 46,274 | | | | 12,674 | |
12b-1 service fees – Class A | | | 653 | | | | 1,388 | |
12b-1 distribution and service fees – Class C | | | 4,096 | | | | 5,520 | |
Shareholders’ servicing agent fees and expenses | | | 1,104 | | | | 743 | |
Custodian’s fees and expenses | | | 42,538 | | | | 42,752 | |
Trustees’ fees and expenses | | | 188 | | | | 56 | |
Professional fees | | | 18,039 | | | | 16,985 | |
Shareholders’ reports – printing and mailing expenses | | | 42,309 | | | | 24,932 | |
Federal and state registration fees | | | 37,929 | | | | 38,045 | |
Other expenses | | | 2,691 | | | | 2,089 | |
Total expenses before custodian fee credit and expense reimbursement | | | 195,821 | | | | 145,184 | |
Custodian fee credit | | | (10 | ) | | | (18 | ) |
Expense reimbursement | | | (144,850 | ) | | | (125,583 | ) |
Net expenses | | | 50,961 | | | | 19,583 | |
Net investment income | | | 143,611 | | | | 24,427 | |
Realized and Unrealized Gain (Loss) | | | | | | | | |
Net realized gain (loss) from: | | | | | | | | |
Investments | | | (439,798 | ) | | | (73,926 | ) |
Redemptions in-kind | | | 1,445,040 | | | | — | |
Change in net unrealized appreciation (depreciation) of investments | | | 1,107,734 | | | | 509,917 | |
Net realized and unrealized gain (loss) | | | 2,112,976 | | | | 435,991 | |
Net increase (decrease) in net assets from operations | | $ | 2,256,587 | | | $ | 460,418 | |
See accompanying notes to financial statements.
Statement of Changes in Net Assets
| | | | | | | | | | | | | | | | |
| | | Enhanced Core Equity | | | Enhanced Mid-Cap | |
| | | Year Ended
6/30/10 | | | Year Ended
6/30/09 | | | Year Ended
6/30/10 | | | Year Ended
6/30/09 | |
Operations | | | | | | | | | | | | | | | | |
Net investment income | | $ | 143,611 | | | $ | 555,799 | | | $ | 24,427 | | | $ | 33,637 | |
Net realized gain (loss) from: | | | | | | | | | | | | | | | | |
Investments | | | (439,798 | ) | | | (5,726,772 | ) | | | (73,926 | ) | | | (963,769 | ) |
Redemptions in-kind | | | 1,445,040 | | | | (5,326,612 | ) | | | — | | | | — | |
Change in net unrealized appreciation
(depreciation) of investments | | | 1,107,734 | | | | 2,063,669 | | | | 509,917 | | | | (154,445 | ) |
Net increase (decrease) in net assets from operations | | | 2,256,587 | | | | (8,433,916 | ) | | | 460,418 | | | | (1,084,577 | ) |
Distributions to Shareholders | | | | | | | | | | | | | | | | |
From net investment income: | | | | | | | | | | | | | | | | |
Class A | | | (6,228 | ) | | | (4,627 | ) | | | (7,313 | ) | | | (7,243 | ) |
Class C | | | (8,461 | ) | | | (4,554 | ) | | | (3,842 | ) | | | (2,473 | ) |
Class I | | | (385,276 | ) | | | (541,428 | ) | | | (18,842 | ) | | | (20,296 | ) |
From accumulated net realized gains: | | | | | | | | | | | | | | | | |
Class A | | | (342 | ) | | | — | | | | — | | | | — | |
Class C | | | (618 | ) | | | — | | | | — | | | | — | |
Class I | | | (19,881 | ) | | | — | | | | — | | | | — | |
Decrease in net assets from distributions to shareholders | | | (420,806 | ) | | | (550,609 | ) | | | (29,997 | ) | | | (30,012 | ) |
Fund Share Transactions | | | | | | | | | | | | | | | | |
Proceeds from sale of shares | | | 2,147,036 | | | | 394,408 | | | | 70,256 | | | | 76,843 | |
Proceeds from shares issued to shareholders due to reinvestment of distributions | | | 14,834 | | | | 318,368 | | | | 2,294 | | | | 3,025 | |
| | | 2,161,870 | | | | 712,776 | | | | 72,550 | | | | 79,868 | |
Cost of shares redeemed | | | (746,997 | ) | | | (69,427 | ) | | | (113,577 | ) | | | (74,924 | ) |
Cost of redemptions in-kind | | | (10,291,391 | ) | | | (12,780,056 | ) | | | — | | | | — | |
Net increase (decrease) in net assets from Fund share transactions | | | (8,876,518 | ) | | | (12,136,707 | ) | | | (41,027 | ) | | | 4,944 | |
Net increase (decrease) in net assets | | | (7,040,737 | ) | | | (21,121,232 | ) | | | 389,394 | | | | (1,109,645 | ) |
Net assets at the beginning of year | | | 10,181,610 | | | | 31,302,842 | | | | 1,907,138 | | | | 3,016,783 | |
Net assets at the end of year | | $ | 3,140,873 | | | $ | 10,181,610 | | | $ | 2,296,532 | | | $ | 1,907,138 | |
Undistributed (Over-distribution of) net investment income at the end of year | | $ | 57,482 | | | $ | 313,847 | | | $ | 15,172 | | | $ | 20,745 | |
See accompanying notes to financial statements.
Notes to Financial Statements
1. General Information and Significant Accounting Policies
The Nuveen Investment Trust (the “Trust”) is an open-end management investment company registered under the Investment Company Act of 1940, as amended. The Trust is comprised of Nuveen Enhanced Core Equity Fund (“Enhanced Core Equity”) and Nuveen Enhanced Mid-Cap Fund (“Enhanced Mid-Cap”) (collectively, the “Funds”), among others. The Trust was organized as a Massachusetts business trust in 1996.
Enhanced Core Equity’s investment objective is to seek long-term capital appreciation. Under normal market conditions, the Fund primarily invests in equity securities of companies within the S&P 500 Index. The strength of fundamental characteristics of such companies, as well as recent stock performance, are evaluated and measured to assign a weight to each stock to construct a portfolio that is based on these fundamental factors, recent stock price performance and how these factors are correlated. While the Fund will contain many of the names within the S&P 500 Index, the relative weights assigned to each name will differ from the weights in the S&P 500 Index. The process seeks to maximize return while maintaining overall risk in the targeted range.
Enhanced Mid-Cap’s investment objective is to seek long-term capital appreciation. Under normal market conditions, the Fund primarily invests in equity securities of companies within the Russell Midcap Index. The Fund will not be forced to sell a stock because it has exceeded or fallen below the current market capitalization range. The strength of fundamental characteristics of such companies, as well as recent stock performance, are evaluated and measured to assign a weight to each stock to construct a portfolio that is based on these fundamental factors, recent stock price performance and how these factors are correlated. While the Fund will contain many of the names within the Russell Midcap Index, the relative weights assigned to each name will differ from the weights in the Russell Midcap Index. The process seeks to maximize return while maintaining overall risk in the targeted range.
In June 2009, the Financial Accounting Standards Board (“FASB”) established the FASB Accounting Standards Codification™ (the “Codification”) as the single source of authoritative accounting principles recognized by FASB in the preparation of financial statements in conformity with generally accepted accounting principles (“GAAP”). The Codification supersedes existing non-grandfathered, non-SEC accounting and reporting standards. The Codification did not change GAAP but rather organized it into a hierarchy where all guidance within the Codification carries an equal level of authority. The Codification became effective for financial statements issued for interim and annual periods ending after September 15, 2009. The Codification did not have a material effect on the Funds’ financial statements.
The following is a summary of significant accounting policies followed by the Funds in the preparation of their financial statements in accordance with accounting principles generally accepted in the United States (“U.S. GAAP”).
Investment Valuation
Common stocks and other equity-type securities are valued at the last sales price on the securities exchange on which such securities are primarily traded and are generally classified as Level 1. Securities primarily traded on the NASDAQ National Market (“NASDAQ”) are valued, except as indicated below, at the NASDAQ Official Closing Price and are generally classified as Level 1. However, securities traded on a securities exchange or NASDAQ for which there were no transactions on a given day or securities not listed on a securities exchange or NASDAQ are valued at the mean between the quoted bid and ask prices.
Temporary investments in securities that have variable rate and demand features qualifying them as short-term investments are valued at amortized cost, which approximates market value. These securities and are generally classified as Level 1.
Certain securities may not be able to be priced by the pre-established pricing methods as described above. Such securities may be valued by the Funds’ Board of Trustees or its designee at fair value. These securities generally include, but are not limited to, restricted securities (securities which may not be publicly sold without registration under the Securities Act) for which a pricing service is unable to provide a market price; securities whose trading has been formally suspended; fixed-income securities that have gone into default and for which there is no current market quotation; a security whose market price is not available from a pre-established pricing source; a security with respect to which an event has occurred that is likely to materially affect the value of the security after the market has closed but before the calculation of a Fund’s net asset value (as may be the case in non-U.S. markets on which the security is primarily traded) or make it difficult or impossible to obtain a reliable market quotation; and a security whose price, as provided by the pricing service, is not deemed to reflect the security’s fair value. As a general principle, the fair value of an issue of securities would appear to be the amount that the owner might reasonably expect to receive for them in a current sale. A variety of factors may be considered in determining the fair value of these securities, which may include consideration of the following: yields or prices of investments of comparable quality, type of issue, coupon, maturity and rating, market quotes or indications of value from security dealers, evaluations of anticipated cash flows or collateral, general market conditions and other information and analysis, including the obligor’s credit characteristics considered relevant. These securities are classified as Level 2 or as Level 3 depending on the priority of the significant inputs. Regardless of the method employed to value a particular security, all valuations are subject to review by the Funds’ Board of Trustees or its designee.
Refer to Footnote 2 – Fair Value Measurements for further details on the leveling of securities held by the Funds as of the end of the reporting period.
Investment Transactions
Investment transactions are recorded on a trade date basis. Realized gains and losses from investment transactions are determined on the specific identification method.
Investment Income
Dividend income is recorded on the ex-dividend date or, for foreign securities, when information is available. Interest income is recorded on an accrual basis.
Income Taxes
Each Fund is a separate taxpayer for federal income tax purposes. Each Fund intends to distribute substantially all of its net investment income and net capital gains to shareholders and to otherwise comply with the requirements of Subchapter M of the Internal Revenue Code applicable to regulated investment companies. Therefore, no federal income tax provision is required.
For all open tax years and all major taxing jurisdictions, management of the Funds has concluded that there are no significant uncertain tax positions that would require recognition in the financial statements. Open tax years are those that are open for examination by taxing authorities (i.e., generally the last four tax year ends and the interim tax period since then). Furthermore, management of the Funds is also not aware of any tax positions for which it is reasonably possible that the total amounts of unrecognized tax benefits will significantly change in the next twelve months.
Dividends and Distributions to Shareholders
Dividends from net investment income and net realized capital gains from investment transactions, if any, are declared and distributed to shareholders at least annually. Furthermore, capital gains are distributed only to the extent they exceed available capital loss carryforwards.
Distributions to shareholders are recorded on the ex-dividend date. The amount and timing of distributions are determined in accordance with federal income tax regulations, which may differ from U.S. GAAP.
Flexible Sales Charge Program
Class A Shares are generally sold with an up-front sales charge and incur a .25% annual 12b-1 service fee. Class A Share purchases of $1 million or more are sold at net asset value without an up-front sales charge but may be subject to a contingent deferred sales charge (“CDSC”) if redeemed within twelve months of purchase. Class C Shares are sold without an up-front sales charge but incur a .75% annual 12b-1 distribution fee and a .25% annual 12b-1 service fee. Class C Shares are subject to a CDSC of 1% if redeemed within one year of purchase. Class I Shares are not subject to any sales charge or 12b-1 distribution or service fees.
Derivative Instruments
Each Fund is authorized to invest in futures, options, swaps and other derivative instruments. Although the Funds are authorized to invest in such derivative instruments, and may do so in the future, they did not make any such investments during the fiscal year ended June 30, 2010.
Repurchase Agreements
In connection with transactions in repurchase agreements, it is each Fund’s policy that its custodian take possession of the underlying collateral securities, the fair value of which exceeds the principal amount of the repurchase transaction, including accrued interest, at all times. If the seller defaults, and the fair value of the collateral declines, realization of the collateral may be delayed or limited.
Redemptions In-Kind
In certain circumstances, a Fund may distribute portfolio securities rather than cash as payment for redemption of Fund shares (redemptions in-kind ). For financial reporting purposes, the Fund recognizes a gain on the redemptions in-kind to the extent the value of the distributed securities on the date of redemption exceeds the cost of those securities; the Fund recognizes a loss if cost exceeds value. Gains and losses realized on the redemptions in-kind are not recognized for tax purposes, and are reclassified from undistributed realized gain or loss to paid-in capital. During the fiscal years ended June 30, 2010 and June 30, 2009, Enhanced Core Equity realized a net gain (loss) of $1,445,040 and $(5,326,612) on redemptions in-kind, respectively. There were no redemptions in-kind for Enhanced Mid-Cap during the fiscal years ended June 30, 2010 and June 30, 2009.
Multiclass Operations and Allocations
Income and expenses of the Funds that are not directly attributable to a specific class of shares are prorated among the classes based on the relative net assets of each class. Expenses directly attributable to a class of shares, which presently only include 12b-1 distribution and service fees, are recorded to the specific class.
Realized and unrealized capital gains and losses of the Funds are prorated among the classes based on the relative net assets of each class.
Custodian Fee Credit
Each Fund has an arrangement with the custodian bank whereby certain custodian fees and expenses are reduced by net credits earned on each Fund’s cash on deposit with the bank. Such deposit arrangements are an alternative to overnight investments. Credits for cash balances may be offset by changes for any days on which a Fund overdraws its account at the custodian bank.
Indemnifications
Under the Trust’s organizational documents, its officers and trustees are indemnified against certain liabilities arising out of the performance of their duties to the Trust. In addition, in the normal course of business, the Trust enters into contracts that provide general indemnifications to other parties. The Trust’s maximum exposure under these arrangements is unknown as this would involve
Notes to Financial Statements (continued)
future claims that may be made against the Trust that have not yet occurred. However, the Trust has not had prior claims or losses pursuant to these contracts and expects the risk of loss to be remote.
Use of Estimates
The preparation of financial statements in conformity with U.S. GAAP requires management to make estimates and assumptions that affect the reported amounts of assets and liabilities at the date of the financial statements and the reported amounts of increases and decreases in net assets from operations during the reporting period. Actual results may differ from those estimates.
2. Fair Value Measurements
In determining the value of each Fund’s investments, various inputs are used. These inputs are summarized in the three broad levels listed below:
| | |
| Level 1 – | | Quoted prices in active markets for identical securities. |
| Level 2 – | | Other significant observable inputs (including quoted prices for similar securities, interest rates, prepayment speeds, credit risk, etc.). |
| Level 3 – | | Significant unobservable inputs (including management’s assumptions in determining the fair value of investments). |
The inputs or methodologies used for valuing securities are not an indication of the risk associated with investing in those securities. The following is a summary of each Fund’s fair value measurements as of June 30, 2010:
| | | | | | | | | | | | |
| Enhanced Core Equity | | Level 1 | | Level 2 | | Level 3 | | Total |
Investments: | | | | | | | | | | | | |
Common Stocks | | $ | 3,052,082 | | $ | — | | $ | — | | $ | 3,052,082 |
Investment Companies | | | 123,864 | | | — | | | — | | | 123,864 |
Total | | $ | 3,175,946 | | | — | | | — | | $ | 3,175,946 |
| | | | |
| Enhanced Mid-Cap | | Level 1 | | Level 2 | | Level 3 | | Total |
Investments: | | | | | | | | | | | | |
Common Stocks | | $ | 2,323,635 | | $ | — | | $ | — | | $ | 2,323,635 |
3. Derivative Instruments and Hedging Activities
The Funds record derivative instruments at fair value, with changes in fair value recognized on the Statement of Operations, when applicable. Even though the Funds’ investments in derivatives may represent economic hedges, they are not considered to be hedge transactions for financial reporting purposes. The Funds did not invest in derivative instruments during the fiscal year ended June 30, 2010.
4. Fund Shares
Transactions in Fund shares were as follows:
| | | | | | | | | | | | | | |
| | | Enhanced Core Equity | |
| | | Year Ended
6/30/10 | | | Year Ended
6/30/09 | |
| | | Shares | | | Amount | | | Shares | | | Amount | |
Shares sold: | | | | | | | | | | | | | | |
Class A | | 12,188 | | | $ | 177,255 | | | 6,044 | | | $ | 79,142 | |
Class C | | 215 | | | | 3,111 | | | 22,849 | | | | 280,616 | |
Class I | | 160,311 | | | | 1,966,670 | | | 3,059 | | | | 34,650 | |
Shares issued to shareholders due to reinvestment of distributions: | | | | | | | | | | | | | | |
Class A | | 68 | | | | 1,006 | | | 22 | | | | 270 | |
Class C | | 339 | | | | 5,036 | | | 226 | | | | 2,765 | |
Class I | | 592 | | | | 8,792 | | | 25,889 | | | | 315,333 | |
| | | 173,713 | | | | 2,161,870 | | | 58,089 | | | | 712,776 | |
Shares redeemed: | | | | | | | | | | | | | | |
Class A | | (14,815 | ) | | | (213,687 | ) | | — | | | | — | |
Class C | | (5,299 | ) | | | (81,970 | ) | | (6,721 | ) | | | (69,427 | ) |
Class I | | (29,670 | ) | | | (451,340 | ) | | — | | | | — | |
Class I – Redemptions in-kind | | (713,194 | ) | | | (10,291,391 | ) | | (1,024,864 | ) | | | (12,780,056 | ) |
| | | (762,978 | ) | | | (11,038,388 | ) | | (1,031,585 | ) | | | (12,849,483 | ) |
Net increase (decrease) | | (589,265 | ) | | $ | (8,876,518 | ) | | (973,496 | ) | | $ | (12,136,707 | ) |
| | | | | | | | | | | | | | |
| | | Enhanced Mid-Cap | |
| | | Year Ended
6/30/10 | | | Year Ended
6/30/09 | |
| | | Shares | | | Amount | | | Shares | | | Amount | |
Shares sold: | | | | | | | | | | | | | | |
Class A | | 2,576 | | | $ | 40,146 | | | 541 | | | $ | 9,552 | |
Class C | | 1,223 | | | | 18,502 | | | 313 | | | | 3,346 | |
Class I | | 772 | | | | 11,608 | | | 6,452 | | | | 63,945 | |
Shares issued to shareholders due to reinvestment of distributions: | | | | | | | | | | | | | | |
Class A | | 7 | | | | 106 | | | 9 | | | | 103 | |
Class C | | — | | | | — | | | 2 | | | | 21 | |
Class I | | 148 | | | | 2,188 | | | 268 | | | | 2,901 | |
| | | 4,726 | | | | 72,550 | | | 7,585 | | | | 79,868 | |
Shares redeemed: | | | | | | | | | | | | | | |
Class A | | (560 | ) | | | (8,994 | ) | | — | | | | — | |
Class C | | (315 | ) | | | (4,568 | ) | | — | | | | — | |
Class I | | (6,279 | ) | | | (100,015 | ) | | (6,218 | ) | | | (74,924 | ) |
| | | (7,154 | ) | | | (113,577 | ) | | (6,218 | ) | | | (74,924 | ) |
Net increase (decrease) | | (2,428 | ) | | $ | (41,027) | | | 1,367 | | | $ | 4,944 | |
5. Investment Transactions
Purchases and sales (excluding short-term investments) during the fiscal year end June 30, 2010, were as follows:
| | | | | | |
| | | Enhanced
Core Equity | | Enhanced
Mid-Cap |
Purchases | | $ | 5,644,246 | | $ | 2,634,191 |
Sales | | | 4,522,167 | | | 2,643,382 |
6. Income Tax Information
The following information is presented on an income tax basis. Differences between amounts for financial statement and federal income tax purposes are primarily due to timing differences in recognizing certain gains and losses on investment transactions. To the extent that differences arise that are permanent in nature, such amounts are reclassified within the capital accounts as detailed below. Temporary differences do not require reclassification. Temporary and permanent differences do not impact the net asset values of the Funds.
At June 30, 2010, the cost and unrealized appreciation (depreciation) of investments, as determined on a federal income tax basis, were as follows:
| | | | | | | | |
| | | Enhanced
Core Equity | | | Enhanced
Mid-Cap | |
Cost of investments | | $ | 3,460,212 | | | $ | 2,087,894 | |
Gross unrealized: | | | | | | | | |
Appreciation | | $ | 132,466 | | | $ | 289,874 | |
Depreciation | | | (416,732 | ) | | | (54,133 | ) |
Net unrealized appreciation (depreciation) of investments | | $ | (284,266 | ) | | $ | 235,741 | |
Permanent differences, primarily due to federal taxes paid, limitations of capital losses, redemptions in-kind and distribution character reclassifications, resulted in reclassifications among the Funds’ components of net assets at June 30, 2010, the Funds’ tax year-end, as follows:
| | | | | | | | |
| | | Enhanced
Core Equity | | | Enhanced
Mid-Cap | |
Capital paid-in | | $ | (2,253,782 | ) | | $ | (133 | ) |
Undistributed (Over-distribution of) net investment income | | | (11 | ) | | | (3 | ) |
Accumulated net realized gain (loss) | | | 2,253,793 | | | | 136 | |
The tax components of undistributed net ordinary income and net long-term capital gains at June 30, 2010, the Funds’ tax year end, were as follows:
| | | | | | |
| | | Enhanced
Core Equity | | Enhanced
Mid-Cap |
Undistributed net ordinary income* | | $ | 57,482 | | $ | 15,172 |
Undistributed net long-term capital gains | | | — | | | — |
| * | Net ordinary income consists of net taxable income derived from dividends, interest, and net short-term capital gains, if any. |
Notes to Financial Statements (continued)
The tax character of distributions paid during the Funds’ tax years ended June 30, 2010 and June 30, 2009, was designated for purposes of the dividends paid deduction as follows:
| | | | | | |
| 2010 | | Enhanced
Core Equity | | Enhanced
Mid-Cap |
Distributions from net ordinary income* | | $ | 420,806 | | $ | 29,997 |
Distributions from net long-term capital gains | | | — | | | — |
| | | | | | |
2009 | | Enhanced
Core Equity | | Enhanced
Mid-Cap |
Distributions from net ordinary income* | | $ | 550,609 | | $ | 30,012 |
Distributions from net long-term capital gains | | | — | | | — |
| * | Net ordinary income consists of net taxable income derived from dividends, interest and net short-term capital gains, if any. |
At June 30, 2010, the Funds’ tax year end, the Funds had unused capital loss carryforwards available for federal income tax purposes to be applied against future capital gains, if any. If not applied, the carryforwards will expire as follows:
| | | | | | |
| | | Enhanced
Core Equity | | Enhanced
Mid-Cap |
Expiration: | | | | | | |
June 30, 2017 | | $ | — | | $ | 289,649 |
June 30, 2018 | | | 1,140,956 | | | 874,864 |
Total | | $ | 1,140,956 | | $ | 1,164,513 |
Enhanced Core Equity’s capital loss carryforward at June 30, 2010, the Fund’s tax year end, is subject to an annual limitation under the Internal Revenue Code and related regulations.
7. Management Fees and Other Transactions with Affiliates
Each Fund’s management fee is separated into two components – a fund-level fee, based only on the amount of assets within each individual Fund, and a complex-level fee, based on the aggregate amount of all fund assets managed by Nuveen Asset Management (the “Adviser”), a wholly-owned subsidiary of Nuveen Investments, Inc. (“Nuveen”). This pricing structure enables each Fund’s shareholders to benefit from growth in the assets within their respective Fund as well as from growth in the amount of complex-wide assets managed by the Adviser.
The annual fund-level fee for each Fund, payable monthly, is calculated according to the following schedule:
| | | | | | |
| Average Daily Net Assets | | Enhanced
Core Equity
Fund-Level
Fee Rate | | | Enhanced
Mid-Cap
Fund-Level
Fee Rate | |
For the first $125 million | | .3000 | % | | .3500 | % |
For the next $125 million | | .2875 | | | .3375 | |
For the next $250 million | | .2750 | | | .3250 | |
For the next $500 million | | .2625 | | | .3125 | |
For the next $1 billion | | .2500 | | | .3000 | |
For net assets over $2 billion | | .2250 | | | .2750 | |
The annual complex-level fee for each Fund, payable monthly, is calculated according to the following schedule:
| | | |
| Complex-Level Managed Asset Breakpoint Level* | | Effective Rate at Breakpoint Level | |
$55 billion | | .2000 | % |
$56 billion | | .1996 | |
$57 billion | | .1989 | |
$60 billion | | .1961 | |
$63 billion | | .1931 | |
$66 billion | | .1900 | |
$71 billion | | .1851 | |
$76 billion | | .1806 | |
$80 billion | | .1773 | |
$91 billion | | .1691 | |
$125 billion | | .1599 | |
$200 billion | | .1505 | |
$250 billion | | .1469 | |
$300 billion | | .1445 | |
| * | The complex-level fee is calculated based upon the aggregate daily managed assets of all Nuveen funds, with such daily managed assets defined separately for each fund in its management agreement, but excluding assets attributable to investments in other Nuveen funds. Daily managed assets include closed-end fund assets managed by the Adviser that are attributable to financial leverage. For these purposes, financial leverage includes the funds’ use of preferred stock and borrowings and certain investments in the residual interest certificates (also called inverse floating rate securities) in tender option bond (TOB) trusts, including the portion of assets held by a TOB trust that has been effectively financed by the trust’s issuance of floating rate securities, subject to an agreement by the Adviser to limit the amount of such assets for determining managed assets in certain circumstances. As of June 30, 2010, the complex-level fee rate was .1857%. |
The management fee compensates the Adviser for overall investment advisory and administrative services and general office facilities. The Adviser has entered into a Sub-Advisory Agreement with Nuveen HydePark Group, LLC (“HydePark”), a subsidiary of Nuveen, under which HydePark manages the investment portfolios of the Funds. HydePark is compensated for its services to the Funds from the management fees paid to the Adviser.
The Adviser has agreed to waive fees and reimburse expenses of Enhanced Core Equity and Enhanced Mid-Cap through October 31, 2011, so that total annual Fund operating expenses (excluding 12b-1 distribution and service fees, interest expenses, taxes, fees incurred in acquiring and disposing of portfolio securities and extraordinary expenses) do not exceed .50% and .55% of the average daily net assets of any class of Fund shares of Enhanced Core Equity and Enhanced Mid-Cap, respectively, and from exceeding 1.00% and 1.05%, respectively, after October 31, 2011. The Adviser may also voluntarily reimburse additional expenses from time to time in either of the Funds. Voluntary reimbursements may be terminated at any time at the Adviser’s discretion.
The Trust pays no compensation directly to those of its trustees who are affiliated with the Adviser or to its officers, all of whom receive remuneration for their services to the Trust from the Adviser or its affiliates. The Board of Trustees has adopted a deferred compensation plan for independent trustees that enables trustees to elect to defer receipt of all or a portion of the annual compensation they are entitled to receive from certain Nuveen advised funds. Under the plan, deferred amounts are treated as though equal dollar amounts had been invested in shares of select Nuveen advised funds.
During the fiscal year ended June 30, 2010, Nuveen Investments, LLC (the “Distributor”), a wholly-owned subsidiary of Nuveen, compensated financial intermediaries directly with commission advances at the time of purchase as follows:
| | | | | | |
| | | Enhanced
Core Equity | | Enhanced
Mid-Cap |
Commission advances (Unaudited) | | $ | — | | $ | — |
To compensate for commissions advanced to financial intermediaries, all 12b-1 service and distribution fees collected on Class C Shares during the first year following a purchase are retained by the Distributor. During the fiscal year ended June 30, 2010, the Distributor retained such 12b-1 fees as follows:
| | | | | | |
| | | Enhanced
Core Equity | | Enhanced
Mid-Cap |
12b-1 fees retained (Unaudited) | | $ | 1,826 | | $ | 5,467 |
The remaining 12b-1 fees charged to the Funds were paid to compensate financial intermediaries for providing services to shareholders relating to their investments.
The Distributor also collected and retained CDSC on share redemptions during the fiscal year ended June 30, 2010, as follows:
| | | | | | |
| | | Enhanced
Core Equity | | Enhanced
Mid-Cap |
CDSC retained (Unaudited) | | $ | — | | $ | — |
At June 30, 2010, Nuveen owned 12,500, 12,500 and 24,954 shares of Class A, C and I, respectively, of Enhanced Core Equity and 37,500, 37,500 and 74,883 shares of Class A, C and I, respectively, of Enhanced Mid-Cap.
8. New Accounting Standards
Fair Value Measurements
On January 21, 2010, FASB issued changes to the authoritative guidance under U.S. GAAP for fair value measurements. The objective of which is to provide guidance on how investment assets and liabilities are to be valued and disclosed. Specifically, the amendment requires reporting entities disclose Level 3 activity for purchases, sales, issuances and settlements in the Level 3 roll-forward on a gross basis rather than as one net number. The effective date of the amendment is for interim and annual periods beginning after December 15, 2010. At this time, management is evaluating the implications of this guidance and the impact it will have to the financial statement amounts and footnote disclosures, if any.
Financial Highlights
| | | | | | | | | | | | | | | | | | | | | | | | | | | | | | | | |
| Selected data for a share outstanding throughout each period: | |
| | | | | | | |
| Class (Commencement Date) | | | | | | | | | | | | | | | | | | | | |
| | | | | Investment Operations | | | Less Distributions | | | | | | |
| | | | | |
| ENHANCED CORE EQUITY | | | | | | | | | | | | | | | |
Year Ended June 30, | | Beginning
Net Asset
Value | | Net Invest- ment
Income(a) | | Net Realized/ Unrealized Gain
(Loss) | | | Total | | | Net Invest- ment
Income | | | Capital
Gains | | | Total | | | Ending
Net
Asset
Value | | Total
Return(b) | |
Class A (12/07) | | | | | | | | | | | | | | | | | | | | | | | | | | | | | |
2010 | | $ | 12.43 | | $ | .18 | | $ | 1.46 | | | $ | 1.64 | | | $ | (.39 | ) | | $ | (.02 | ) | | $ | (.41 | ) | | $ | 13.66 | | 12.94 | % |
2009 | | | 17.44 | | | .27 | | | (5.02 | ) | | | (4.75 | ) | | | (.26 | ) | | | — | | | | (.26 | ) | | | 12.43 | | (27.18 | ) |
2008(d) | | | 20.00 | | | .19 | | | (2.72 | ) | | | (2.53 | ) | | | (.03 | ) | | | — | | | | (.03 | ) | | | 17.44 | | (12.67 | ) |
Class C (12/07) | | | | | | | | | | | | | | | | | | | | | | | | | | | | | |
2010 | | | 12.41 | | | .07 | | | 1.46 | | | | 1.53 | | | | (.29 | ) | | | (.02 | ) | | | (.31 | ) | | | 13.63 | | 12.16 | |
2009 | | | 17.38 | | | .18 | | | (5.01 | ) | | | (4.83 | ) | | | (.14 | ) | | | — | | | | (.14 | ) | | | 12.41 | | (27.78 | ) |
2008(d) | | | 20.00 | | | .11 | | | (2.71 | ) | | | (2.60 | ) | | | (.02 | ) | | | — | | | | (.02 | ) | | | 17.38 | | (13.02 | ) |
Class I (12/07) | | | | | | | | | | | | | | | | | | | | | | | | | | | | | |
2010 | | | 12.43 | | | .23 | | | 1.45 | | | | 1.68 | | | | (.42 | ) | | | (.02 | ) | | | (.44 | ) | | | 13.67 | | 13.26 | |
2009 | | | 17.46 | | | .32 | | | (5.04 | ) | | | (4.72 | ) | | | (.31 | ) | | | — | | | | (.31 | ) | | | 12.43 | | (27.02 | ) |
2008(d) | | | 20.00 | | | .22 | | | (2.73 | ) | | | (2.51 | ) | | | (.03 | ) | | | — | | | | (.03 | ) | | | 17.46 | | (12.55 | ) |
| | | | | | | | | | | | | | | | |
| | | | | |
| | | | | | | | | | | | | | | | |
| Ratios/Supplemental Data | |
| | | |
| | | Ratios to Average
Net Assets Before
Reimbursement | | | Ratios to Average
Net Assets After
Reimbursement(c) | | | | |
Ending
Net
Assets
(000) | | Expenses | | | Net
Invest- ment
Income (Loss) | | | Expenses | | | Net
Invest- ment
Income (Loss) | | | Portfolio
Turnover
Rate | |
| | | | | | | | | | | | | | | | |
| $ | 219 | | 3.07 | % | | (1.07 | )% | | .74 | % | | 1.26 | % | | 52 | % |
| | 231 | | 1.52 | | | 1.36 | | | .75 | | | 2.13 | | | 33 | |
| | 218 | | 1.25 | * | | 1.26 | * | | .74 | * | | 1.77 | * | | 21 | |
| | | | | | | | | | | | | | | | |
| | 328 | | 3.79 | | | (1.79 | ) | | 1.49 | | | .51 | | | 52 | |
| | 358 | | 2.31 | | | .63 | | | 1.50 | | | 1.44 | | | 33 | |
| | 217 | | 2.00 | * | | .51 | * | | 1.49 | * | | 1.02 | * | | 21 | |
| | | | | | | | | | | | | | | | |
| | 2,594 | | 1.97 | | | .10 | | | .49 | | | 1.58 | | | 52 | |
| | 9,593 | | 1.23 | | | 1.65 | | | .50 | | | 2.38 | | | 33 | |
| | 30,868 | | .74 | * | | 1.75 | * | | .49 | * | | 2.01 | * | | 21 | |
| (a) | Per share Net Investment Income is calculated using the average daily shares method. |
| (b) | Total return is the combination of changes in net asset value without any sales charge, reinvested dividend income at net asset value and reinvested capital gains distributions at net asset value, if any. Total returns are not annualized. |
| (c) | After expense reimbursement from the Adviser, where applicable. Ratios do not reflect the effect of custodian fee credits earned on the Fund’s net cash on deposit with the custodian bank, where applicable. |
| (d) | For the period December 3, 2007 (commencement of operations) through June 30, 2008. |
See accompanying notes to financial statements.
Financial Highlights (continued)
| | | | | | | | | | | | | | | | | | | | | | | | | | | | | | | |
| Selected data for a share outstanding throughout each period: | |
Class (Commencement Date) | | | | | | | | | | | | | | | | | | | |
| | | | | Investment Operations | | | Less Distributions | | | | | | |
| | | | | | |
| ENHANCED MID-CAP | | | | | | | | | | | | | | | | | |
Year Ended June 30, | | Beginning
Net Asset
Value | | Net Invest- ment
Income(a) | | Net Realized/ Unrealized Gain
(Loss) | | | Total | | | Net Invest- ment
Income | | | Capital
Gains | | Total | | | Ending
Net
Asset
Value | | Total
Return(b) | |
Class A (12/07) | | | | | | | | | | | | | | | | | | | | | | | | | | | | |
2010 | | $ | 11.65 | | $ | .16 | | $ | 2.63 | | | $ | 2.79 | | | $ | (.19 | ) | | $ | — | | $ | (.19 | ) | | $ | 14.25 | | 23.91 | % |
2009 | | | 18.59 | | | .21 | | | (6.96 | ) | | | (6.75 | ) | | | (.19 | ) | | | — | | | (.19 | ) | | | 11.65 | | (36.27 | ) |
2008(d) | | | 20.00 | | | .15 | | | (1.51 | ) | | | (1.36 | ) | | | (.05 | ) | | | — | | | (.05 | ) | | | 18.59 | | (6.79 | ) |
Class C (12/07) | | | | | | | | | | | | | | | | | | | | | | | | | | | | |
2010 | | | 11.66 | | | .05 | | | 2.62 | | | | 2.67 | | | | (.10 | ) | | | — | | | (.10 | ) | | | 14.23 | | 22.88 | |
2009 | | | 18.53 | | | .11 | | | (6.91 | ) | | | (6.80 | ) | | | (.07 | ) | | | — | | | (.07 | ) | | | 11.66 | | (36.70 | ) |
2008(d) | | | 20.00 | | | .06 | | | (1.50 | ) | | | (1.44 | ) | | | (.03 | ) | | | — | | | (.03 | ) | | | 18.53 | | (7.20 | ) |
Class I (12/07) | | | | | | | | | | | | | | | | | | | | | | | | | | | | |
2010 | | | 11.65 | | | .19 | | | 2.63 | | | | 2.82 | | | | (.22 | ) | | | — | | | (.22 | ) | | | 14.25 | | 24.16 | |
2009 | | | 18.62 | | | .24 | | | (6.98 | ) | | | (6.74 | ) | | | (.23 | ) | | | — | | | (.23 | ) | | | 11.65 | | (36.09 | ) |
2008(d) | | | 20.00 | | | .15 | | | (1.48 | ) | | | (1.33 | ) | | | (.05 | ) | | | — | | | (.05 | ) | | | 18.62 | | (6.67 | ) |
| | | | | | | | | | | | | | | | |
| | | | | | | | | | | | | | | | |
| | | |
| | | | | | | | | | | |
| Ratios/Supplemental Data | |
| | | Ratios to Average
Net Assets Before
Reimbursement | | | Ratios to Average
Net Assets After
Reimbursement(c) | | | | |
| | | | | |
Ending
Net
Assets
(000) | | Expenses | | | Net
Invest- ment
Income
(Loss) | | | Expenses | | | Net
Invest- ment
Income
(Loss) | | | Portfolio
Turnover
Rate | |
| | | | | | | | | | | | | | | | |
| $ | 571 | | 6.13 | % | | (4.26 | )% | | .79 | % | | 1.08 | % | | 113 | % |
| | 443 | | 7.84 | | | (5.39 | ) | | .80 | | | 1.65 | | | 76 | |
| | 697 | | 3.81 | * | | (1.70 | )* | | .78 | * | | 1.33 | * | | 89 | |
| | | | | | | | | | | | | | | | |
| | 551 | | 6.88 | | | (5.01 | ) | | 1.54 | | | .33 | | | 113 | |
| | 441 | | 8.61 | | | (6.16 | ) | | 1.55 | | | .90 | | | 76 | |
| | 695 | | 4.56 | * | | (2.45 | )* | | 1.53 | * | | .58 | * | | 89 | |
| | | | | | | | | | | | | | | | |
| | 1,175 | | 5.88 | | | (4.01 | ) | | .54 | | | 1.33 | | | 113 | |
| | 1,023 | | 7.68 | | | (5.24 | ) | | .55 | | | 1.90 | | | 76 | |
| | 1,625 | | 3.52 | * | | (1.43 | )* | | .53 | * | | 1.55 | * | | 89 | |
| (a) | Per share Net Investment Income is calculated using the average daily shares method. |
| (b) | Total return is the combination of changes in net asset value without any sales charge, reinvested dividend income at net asset value and reinvested capital gains distributions at net asset value, if any. Total returns are not annualized. |
| (c) | After expense reimbursement from the Adviser, where applicable. Ratios do not reflect the effect of custodian fee credits earned on the Fund’s net cash on deposit with the custodian bank, where applicable. |
| (d) | For the period December 3, 2007 (commencement of operations) through June 30, 2008. |
See accompanying notes to financial statements.
Trustees and Officers
The management of the Funds, including general supervision of the duties performed for the Funds by the Adviser, is the responsibility of the Board of Trustees of the Funds. The number of trustees of the Funds is currently set at nine. None of the trustees who are not “interested” persons of the Funds (referred to herein as “independent trustees”) has ever been a director or employee of, or consultant to, Nuveen or its affiliates. The names and business addresses of the trustees and officers of the Funds, their principal occupations and other affiliations during the past five years, the number of portfolios each oversees and other directorships they hold are set forth below.
The Funds’ Statement of Additional Information (“SAI”) includes more information about the trustees. To request a free copy, call Nuveen Investments at (800) 257-8787 or visit the Funds’ website at www.nuveen.com.
| | | | | | | | |
Name, Birthdate and Address | | Position(s) Held with the Funds | | Year First Elected or Appointed (1) | | Principal Occupation(s) Including other Directorships During Past 5 Years | | Number of Portfolios in Fund Complex Overseen by Trustee |
| | |
| Independent Trustees: | | | | |
Robert P. Bremner (2) 8/22/40 333 W. Wacker Drive Chicago, IL 60606 | | Chairman of the Board and Trustee | | 1996 | | Private Investor and Management Consultant; Treasurer and Director, Humanities Council of Washington, D.C. | | 200 |
Jack B. Evans 10/22/48 333 W. Wacker Drive Chicago, IL 60606 | | Trustee | | 1999 | | President, The Hall-Perrine Foundation, a private philanthropic corporation (since 1996); Director and Chairman, United Fire Group, a publicly held company; President Pro Tem of the Board of Regents for the State of Iowa University System; Director, Gazette Companies; Life Trustee of Coe College and the Iowa College Foundation; formerly, Director, Alliant Energy; formerly, Director, Federal Reserve Bank of Chicago; formerly, President and Chief Operating Officer, SCI Financial Group, Inc., a regional financial services firm. | | 200 |
William C. Hunter 3/6/48 333 W. Wacker Drive Chicago, IL 60606 | | Trustee | | 2004 | | Dean, Tippie College of Business, University of Iowa (since 2006); Director (since 2004) of Xerox Corporation; Director (since 2005), Beta Gamma Sigma International Honor Society; formerly, Dean and Distinguished Professor of Finance, School of Business at the University of Connecticut (2003-2006); previously, Senior Vice President and Director of Research at the Federal Reserve Bank of Chicago (1995-2003); Director, SS&C Technologies, Inc. (May 2005-October 2005); formerly, Director (1997-2007), Credit Research Center at George Washington University. | | 200 |
David J. Kundert (2) 10/28/42 333 W. Wacker Drive Chicago, IL 60606 | | Trustee | | 2005 | | Director, Northwestern Mutual Wealth Management Company; retired (since 2004) as Chairman, JPMorgan Fleming Asset Management, President and CEO, Banc One Investment Advisors Corporation, and President, One Group Mutual Funds; prior thereto, Executive Vice President, Banc One Corporation and Chairman and CEO, Banc One Investment Management Group; Member, Board of Regents, Luther College; member of the Wisconsin Bar Association; member of Board of Directors, Friends of Boerner Botanical Gardens; member of Board of Directors and Chair of Investment Committee, Greater Milwaukee Foundation. | | 200 |
William J. Schneider (2) 9/24/44 333 W. Wacker Drive Chicago, IL 60606 | | Trustee | | 1997 | | Chairman of Miller-Valentine Partners Ltd., a real estate investment company; formerly, Senior Partner and Chief Operating Officer (retired, 2004) of Miller-Valentine Group; member, University of Dayton Business School Advisory Council; member, Mid-America Health System Board; formerly, member and Chair, Dayton Philharmonic Orchestra Association; formerly, member, Business Advisory Council, Cleveland Federal Reserve Bank. | | 200 |
Judith M. Stockdale 12/29/47 333 W. Wacker Drive Chicago, IL 60606 | | Trustee | | 1997 | | Executive Director, Gaylord and Dorothy Donnelley Foundation (since 1994); prior thereto, Executive Director, Great Lakes Protection Fund (1990-1994). | | 200 |
Carole E. Stone (2) 6/28/47 333 W. Wacker Drive Chicago, IL 60606 | | Trustee | | 2007 | | Director, Chicago Board Options Exchange (since 2006); Director, C2 Options Exchange, Incorporated (since 2009); Commissioner, New York State Commission on Public Authority Reform (since 2005); formerly, Chair, New York Racing Association Oversight Board (2005-2007). | | 200 |
| | | | | | | | |
Name, Birthdate and Address | | Position(s) Held with the Funds | | Year First Elected or Appointed (1) | | Principal Occupation(s) Including other Directorships During Past 5 Years | | Number of Portfolios in Fund Complex Overseen by Trustee |
Terence J. Toth (2) 9/29/59 333 W. Wacker Drive Chicago, IL 60606 | | Trustee | | 2008 | | Director, Legal & General Investment Management America, Inc. (since 2008); Managing Partner, Promus Capital (since 2008); formerly, CEO and President, Northern Trust Global Investments (2004-2007); Executive Vice President, Quantitative Management & Securities Lending (2000-2004); prior thereto, various positions with Northern Trust Company (since 1994); member: Goodman Theatre Board (since 2004); Chicago Fellowship Board (since 2005), University of Illinois Leadership Council Board (since 2007) and Catalyst Schools of Chicago Board (since 2008); formerly, member: Northern Trust Mutual Funds Board (2005-2007), Northern Trust Global Investments Board (2004-2007), Northern Trust Japan Board (2004-2007), Northern Trust Securities Inc. Board (2003-2007) and Northern Trust Hong Kong Board (1997-2004). | | 200 |
| | |
| Interested Trustee: | | | | |
John P. Amboian (3) 6/14/61 333 W. Wacker Drive Chicago, IL 60606 | | Trustee | | 2008 | | Chief Executive Officer (since July 2007), Director (since 1999) and Chairman (since 2007) of Nuveen Investments, Inc.; Chief Executive Officer (since 2007) of Nuveen Asset Management, Nuveen Investments Advisors, Inc.; President (since 2005) of Nuveen Commodities Asset Management, LLC. | | 200 |
Name, Birthdate and Address | | Position(s) Held with the Funds | | Year First Elected or Appointed (4) | | Principal Occupation(s) During Past 5 Years | | Number of Portfolios in Fund Complex Overseen by Officer |
| | |
| Officers of the Funds: | | | | |
Gifford R. Zimmerman 9/9/56 333 W. Wacker Drive Chicago, IL 60606 | | Chief Administrative Officer | | 1988 | | Managing Director (since 2002), Assistant Secretary and Associate General Counsel of Nuveen Investments, LLC; Managing Director, Associate General Counsel and Assistant Secretary, of Nuveen Asset Management (since 2002) and of Symphony Asset Management LLC (since 2003); Vice President and Assistant Secretary of NWQ Investment Management Company, LLC. (since 2002), Nuveen Investments Advisers Inc. (since 2002), Tradewinds Global Investors, LLC, and Santa Barbara Asset Management, LLC (since 2006), Nuveen HydePark Group LLC and Nuveen Investment Solutions, Inc. (since 2007); Managing Director (since 2004) and Assistant Secretary (since 1994) of Nuveen Investments, Inc.; Managing Director (since 2005) of Nuveen Commodities Asset Management, LLC; Chartered Financial Analyst. | | 200 |
Nizida Arriaga 6/1/68 333 W. Wacker Drive Chicago, IL 60606 | | Vice President | | 2009 | | Senior Vice President of Nuveen Investments, LLC (since 2010); formerly, Vice President (2007-2010); previously, Portfolio Manager, Allstate Investments, LLC (1996-2006); Chartered Financial Analyst. | | 200 |
Michael T. Atkinson 2/3/66 333 W. Wacker Drive Chicago, IL 60606 | | Vice President and Assistant Secretary | | 2000 | | Vice President (since 2002) of Nuveen Investments, LLC; Vice President of Nuveen Asset Management (since 2005). | | 200 |
Margo L. Cook 4/11/64 333 W. Wacker Drive Chicago, IL 60606 | | Vice President | | 2009 | | Executive Vice President (since Oct 2008) of Nuveen Investments, Inc.; previously, Head of Institutional Asset Management (2007-2008) of Bear Stearns Asset Management; Head of Institutional Asset Mgt (1986-2007) of Bank of NY Mellon; Chartered Financial Analyst. | | 200 |
Alan A. Brown 8/1/62 333 W. Wacker Drive Chicago, IL 60606 | | Vice President | | 2007 | | Executive Vice President, Global Client Private Group (since 2007); Executive Vice President, Mutual Funds, Nuveen Investments, LLC, (since 2005), previously, Managing Director and Chief Marketing Officer (2001-2005). | | 75 |
Trustees and Officers (continued)
| | | | | | | | |
Name, Birthdate and Address | | Position(s) Held with the Funds | | Year First Elected or Appointed (4) | | Principal Occupation(s) Including other Directorships During Past 5 Years | | Number of Portfolios in Fund Complex Overseen by Officer |
Lorna C. Ferguson 10/24/45 333 W. Wacker Drive Chicago, IL 60606 | | Vice President | | 1998 | | Managing Director (since 2004) of Nuveen Investments, LLC and Managing Director (since 2005) of Nuveen Asset Management. | | 200 |
Stephen D. Foy 5/31/54 333 W. Wacker Drive Chicago, IL 60606 | | Vice President and Controller | | 1998 | | Senior Vice President (since 2010), formerly, Vice President (1993-2010) and Funds Controller (since 1998) of Nuveen Investments, LLC; Vice President (2005-2010) of Nuveen Asset Management; Certified Public Accountant. | | 200 |
Scott S. Grace 8/20/70 333 W. Wacker Drive Chicago, IL 60606 | | Vice President and Treasurer | | 2009 | | Managing Director, Corporate Finance & Development, Treasurer (since 2009) of Nuveen Investments, LLC; Managing Director and Treasurer of Nuveen Asset Management (since 2009); formerly, Treasurer (2006-2009), Senior Vice President (2008-2009), previously, Vice President (2006-2008) of Janus Capital Group, Inc.; formerly, Senior Associate in Morgan Stanley’s Global Financial Services Group (2000-2003); Chartered Accountant Designation. | | 200 |
William T. Huffman 5/7/1969 333 W. Wacker Drive Chicago, IL 60606 | | Vice President | | 2009 | | Chief Operating Officer, Municipal Fixed Income (since 2008) of Nuveen Asset Management; previously, Chairman, President and Chief Executive Officer (2002 – 2007) of Northern Trust Global Advisors, Inc. and Chief Executive Officer (2007) of Northern Trust Global Investments Limited; Certified Public Accountant. | | 136 |
Walter M. Kelly 2/24/70 333 W. Wacker Drive Chicago, IL 60606 | | Chief Compliance Officer and Vice President | | 2003 | | Senior Vice President (since 2008), Vice President (2006-2008) formerly, Assistant Vice President and Assistant General Counsel (2003-2006) of Nuveen Investments, LLC; Senior Vice President (since 2008), formerly, Vice President (2006-2008) and Assistant Secretary (since 2003) of Nuveen Asset Management. | | 200 |
David J. Lamb 3/22/63 333 W. Wacker Drive Chicago, IL 60606 | | Vice President | | 2000 | | Senior Vice President (since 2009), formerly, Vice President (2000-2009) of Nuveen Investments, LLC; Vice President (since 2005) of Nuveen Asset Management, Certified Public Accountant. | | 200 |
Tina M. Lazar 8/27/61 333 W. Wacker Drive Chicago, IL 60606 | | Vice President | | 2002 | | Senior Vice President (since 2009), formerly, Vice President of Nuveen Investments, LLC (1999-2009); Vice President of Nuveen Asset Management (since 2005). | | 200 |
Larry W. Martin 7/27/51 333 W. Wacker Drive Chicago, IL 60606 | | Vice President and Assistant Secretary | | 1988 | | Senior Vice President (since 2010), formerly, Vice President (1993-2010), Assistant Secretary and Assistant General Counsel of Nuveen Investments, LLC; Vice President (since 2005) and Assistant Secretary of Nuveen Investments, Inc.; Vice President (since 2005) and Assistant Secretary (since 1997) of Nuveen Asset Management Vice President and Assistant Secretary of Nuveen Investments Advisers Inc. (since 2002), NWQ Investment Management Company, LLC (since 2002), Symphony Asset Management LLC (since 2003), Tradewinds Global Investors, LLC, Santa Barbara Asset Management, LLC (since 2006) and of Nuveen HydePark Group, LLC and Nuveen Investment Solutions, Inc. (since 2007). | | 200 |
Kevin J. McCarthy 3/26/66 333 W. Wacker Drive Chicago, IL 60606 | | Vice President and Secretary | | 2007 | | Managing Director (since 2008), formerly, Vice President (2007-2008), Nuveen Investments, LLC; Managing Director (since 2008), formerly, Vice President and Assistant Secretary, Nuveen Asset Management and Nuveen Investments Holdings, Inc.; Vice President (since 2007) and Assistant Secretary, Nuveen Investment Advisers Inc., NWQ Investment Management Company, LLC, Tradewinds Global Investors LLC, NWQ Holdings, LLC, Symphony Asset Management LLC, Santa Barbara Asset Management LLC, Nuveen HydePark Group, LLC and Nuveen Investment Solutions, Inc. (since 2007); prior thereto, Partner, Bell, Boyd & Lloyd LLP (1997-2007). | | 200 |
| | | | | | | | |
Name, Birthdate and Address | | Position(s) Held with the Funds | | Year First Elected or Appointed (4) | | Principal Occupation(s) Including other Directorships During Past 5 Years | | Number of Portfolios in Fund Complex Overseen by Officer |
Michelle A. McCarthy 7/6/65 333 West Wacker Drive Chicago, IL 60606 | | Vice President | | 2010 | | Managing Director, Director of Risk Management (since May, 2010), Nuveen Investments, LLC; formerly, Chief Risk Officer (2009-2010) of Russell Investment Group; formerly, SVP (2003-2009), Chief Market & Operational Risk Officer (2006-2009), Washington Mutual Bank. | | 200 |
John V. Miller 4/10/67 333 W. Wacker Drive Chicago, IL 60606 | | Vice President | | 2007 | | Chief Investment Officer and Managing Director (since 2007), formerly, Vice President (2002-2007) of Nuveen Asset Management and Managing Director (since 2007), formerly, Vice President (2002-2007) Nuveen Investments, LLC; Chartered Financial Analyst. | | 136 |
Gregory T. Mino 1/4/71 333 W. Wacker Drive Chicago, IL 60606 | | Vice President | | 2009 | | Senior Vice President (since 2010) of Nuveen Investments, LLC, formerly, Vice President (2008-2010); previously, Director (2004-2007) and Executive Director (2007-2008) of UBS Global Asset Management; previously, Vice President (2000-2003) and Director (2003-2004) of Merrill Lynch Investment Managers; Chartered Financial Analyst. | | 200 |
Christopher M. Rohrbacher 8/1/71 333 W. Wacker Drive Chicago, IL 60606 | | Vice President and Assistant Secretary | | 2008 | | Vice President, Nuveen Investments, LLC (since 2008); Vice President and Assistant Secretary, Nuveen Asset Management (since 2008); prior thereto, Associate, Skadden, Arps, Slate, Meagher & Flom LLP (2002-2008) | | 200 |
James F. Ruane 7/3/62 333 W. Wacker Drive Chicago, IL 60606 | | Vice President and Assistant Secretary | | 2007 | | Vice President, Nuveen Investments (since 2007); prior thereto, Partner, Deloitte & Touche USA LLP (2005-2007), formerly, senior tax manager (2002-2005); Certified Public Accountant. | | 200 |
John S. White 5/12/67 333 W. Wacker Drive Chicago, IL 60606 | | Vice President | | 2007 | | Senior Vice President (since 2009), formerly, Vice President (2006-2009) of Nuveen Investments, LLC, formerly, Assistant Vice President (since 2002); Lieutenant Colonel (since 2007), United States Marine Corps Reserve, formerly, Major (since 2001). | | 75 |
Mark L. Winget 12/21/68 333 W. Wacker Drive Chicago, IL 60606 | | Vice President and Assistant Secretary | | 2008 | | Vice President, Nuveen Investments, LLC (since 2008); Vice President and Assistant Secretary, Nuveen Asset Management (since 2008); prior thereto, Counsel, Vedder Price P.C. (1997-2007). | | 200 |
| (1) | Trustees serve an indefinite term until his/her successor is elected or appointed. The year first elected or appointed represents the year in which the trustee was first elected or appointed to any fund in the Nuveen Fund Complex. |
| (2) | Also serves as a trustee of the Nuveen Diversified Commodity Fund, a Nuveen-sponsored commodity pool that has filed a registration statement on Form S-1 with the SEC for a proposed initial public offering. The S-1 has not been declared effective, and the commodity pool has not commenced operations. |
| (3) | Mr. Amboian is an interested trustee because of his position with Nuveen Investments, Inc. and certain of its subsidiaries, which are affiliates of the Nuveen Funds. |
| (4) | Officers serve one year terms through August of each year. The year first elected or appointed represents the year in which the officer was first elected or appointed to any fund in the Nuveen Fund Complex. |
Annual Investment Management Agreement Approval Process
The Investment Company Act of 1940, as amended (the “1940 Act”), provides, in substance, that each investment advisory agreement between a fund and its investment adviser (including sub-advisers) will continue in effect from year to year only if its continuance is approved at least annually by the fund’s board members, including by a vote of a majority of the board members who are not parties to the advisory agreement or “interested persons” of any parties (the “Independent Board Members”), cast in person at a meeting called for the purpose of considering such approval. In connection with such approvals, the fund’s board members must request and evaluate, and the investment adviser is required to furnish, such information as may be reasonably necessary to evaluate the terms of the advisory agreement. Accordingly, at a meeting held on May 25-26, 2010 (the “May Meeting”), the Boards of Trustees (each a “Board” and each Trustee, a “Board Member”) of the Funds, including a majority of the Independent Board Members, considered and approved the continuation of the advisory and sub-advisory agreements for the Funds for an additional one-year period. These agreements include the investment advisory agreements between Nuveen Asset Management (“NAM”) and each Fund and the sub-advisory agreements between NAM and Nuveen HydePark Group, LLC (the “Sub-Adviser”). In preparation for their considerations at the May Meeting, the Board also held a separate meeting on April 21-22, 2010 (the “April Meeting”). Accordingly, the factors considered and determinations made regarding the renewals by the Independent Board Members include those made at the April Meeting.
In addition, in evaluating the applicable advisory agreements (each an “Investment Management Agreement”) and sub-advisory agreements (each, a “Sub-advisory Agreement,” and each Investment Management Agreement and Sub-advisory Agreement, an “Advisory Agreement”), the Independent Board Members reviewed a broad range of information relating to the Funds, NAM and the Sub-Adviser (NAM and the Sub-Adviser are each a “Fund Adviser”), including absolute and comparative performance, fee and expense information for the Funds (as described in more detail below), the profitability of Nuveen for its advisory activities (which includes its wholly owned subsidiaries), and other information regarding the organization, personnel, and services provided by the respective Fund Adviser. The Independent Board Members also met quarterly as well as at other times as the need arose during the year and took into account the information provided at such meetings and the knowledge gained therefrom. Prior to approving the renewal of the Advisory Agreements, the Independent Board Members reviewed the foregoing information with their independent legal counsel and with management, reviewed materials from independent legal counsel describing applicable law and their duties in reviewing advisory contracts, and met with independent legal counsel in private sessions without management present. The Independent Board Members considered the legal advice provided by independent legal counsel and relied upon their knowledge of the Fund Adviser, its services and the Funds resulting from their meetings and other interactions throughout the year and their own business judgment in determining the factors to be considered in evaluating the Advisory Agreements. Each Board Member may have accorded different weight to the various factors in reaching his or her conclusions with respect to a Fund’s Advisory Agreements. The Independent Board Members did not identify any single factor as all-important or controlling. The Independent Board Members’ considerations were instead based on a comprehensive consideration of all the information presented. The principal factors considered by the Board and its conclusions are described below.
A. Nature, Extent and Quality of Services
In considering renewal of the Advisory Agreements, the Independent Board Members considered the nature, extent and quality of the Fund Adviser’s services, including advisory services and administrative services. The Independent Board Members reviewed materials outlining, among other things, the Fund Adviser’s organization and business; the types of services that the Fund Adviser or its affiliates provide and are expected to provide to the Funds; the performance record of the applicable Fund (as described in further detail below); and any initiatives Nuveen had taken for the applicable fund product line, including the development of new practices and coordination among business units with respect to large shareholder transactions, streamlining the classes offered, and adding funds to various distribution platforms.
As part of their review, the Independent Board Members also evaluated the background, experience and track record of the Fund Adviser’s investment personnel. In this regard, the Independent Board Members considered any changes in the personnel, and the impact on the level of services provided to the Funds, if any. The Independent Board Members also reviewed information regarding portfolio manager compensation arrangements to evaluate the Fund Adviser’s ability to attract and retain high quality investment personnel, preserve stability, and reward performance but not provide an incentive for taking undue risks.
In addition to advisory services, the Independent Board Members considered the quality of administrative services provided by NAM and its affiliates including product management, fund administration, oversight of service providers, shareholder services, administration of Board relations, regulatory and portfolio compliance and legal support. Given the importance of compliance, the Independent Board Members also considered NAM’s compliance program, including the report of the chief compliance officer regarding the Funds’ compliance policies and procedures.
The Independent Board Members also considered NAM’s oversight of the performance, business activities and compliance of the Sub-Adviser. In that regard, the Independent Board Members reviewed an evaluation of the Sub-Adviser from NAM. The evaluation also included information relating to the Sub-Adviser’s organization, operations, personnel, assets under management, investment philosophy, strategies and techniques in managing the Funds, developments affecting the Sub-Adviser, and an analysis of the Sub-Adviser. As described in further detail below, the Board also considered the performance of each Fund. In addition, the Board recognized that the Sub-advisory Agreements were essentially agreements for portfolio management services only and the Sub-Adviser was not expected to supply other significant administrative services to the Funds. As part of their oversight, the
Independent Board Members also continued their program of seeking to visit each sub-adviser to the Nuveen funds at least once over a multiple year rotation, meeting with key investment and business personnel. The Independent Board Members noted that NAM recommended the renewal of the Sub-advisory Agreements and considered the basis for such recommendations.
Based on their review, the Independent Board Members found that, overall, the nature, extent and quality of services provided (and expected to be provided) to the Funds under the respective Investment Management Agreement or Sub-advisory Agreement, as applicable, were satisfactory.
B. The Investment Performance of the Funds and Fund Advisers
The Board considered the performance results of each Fund over various time periods. The Board reviewed, among other things, each Fund’s historic investment performance as well as information comparing the Fund’s performance information with that of other funds (the “Performance Peer Group”) based on data provided by an independent provider of mutual fund data and with recognized and/or customized benchmarks. In this regard, the performance information the Board reviewed included the Fund’s total return information compared to the returns of its Performance Peer Group and recognized and/or customized benchmarks for the quarter and one-year periods ending December 31, 2009 and for the same periods ending March 31, 2010. Moreover, the Board reviewed the peer ranking of the Nuveen funds sub-advised by the Sub-Adviser in the aggregate. This information supplemented the Fund performance information provided to the Board at each of its quarterly meetings. In reviewing peer comparison information, the Independent Board Members recognized that the Performance Peer Group of certain funds may not adequately represent the objectives and strategies of the funds, thereby limiting the usefulness of comparing a fund’s performance with that of its Performance Peer Group.
Based on their review, the Independent Board Members determined that each Fund’s investment performance over time had been satisfactory. The Board recognized, however, that the Funds are relatively new funds with a performance history that is generally too short for a meaningful assessment of performance.
C. Fees, Expenses and Profitability
1. Fees and Expenses
The Board evaluated the management fees and expenses of each Fund reviewing, among other things, such Fund’s gross management fees, net management fees and net expense ratios in absolute terms as well as compared to the fee and expenses of a comparable universe of funds based on data provided by an independent fund data provider (the “Peer Universe”) and in certain cases, to a more focused subset of funds in the Peer Universe (the “Peer Group”) and any expense limitations.
The Independent Board Members further reviewed the methodology regarding the construction of the applicable Peer Universe and/or Peer Group. In reviewing the comparisons of fee and expense information, the Independent Board Members took into account that in certain instances various factors such as: the asset level of a fund relative to peers; the limited size and particular composition of the Peer Universe or Peer Group; the investment objectives of the peers; expense anomalies; changes in the funds comprising the Peer Universe or Peer Group from year to year; levels of reimbursement; and the timing of information used; may impact the comparative data thereby limiting the ability to make a meaningful comparison with peers.
In reviewing the fee schedule for a Fund, the Independent Board Members also considered the fund-level and complex-wide breakpoint schedules (described in further detail below) and any fee waivers and reimbursements provided by Nuveen. The Independent Board Members noted that the Funds had net management fees and/or net expense ratios below the peer average of their Peer Group or Peer Universe. In addition, the Independent Board Members recognized that each Fund received significant management fee waivers and/or expense reimbursements.
Based on their review of the fee and expense information provided, the Independent Board Members determined that each Fund’s management fees were reasonable in light of the nature, extent and quality of services provided to the Fund.
2. Comparisons with the Fees of Other Clients
The Independent Board Members further reviewed information regarding the nature of services and fee rates offered by NAM to other clients. Such clients include separately managed accounts (both retail and institutional accounts), foreign investment funds offered by Nuveen and funds that are not offered by Nuveen but are sub-advised by one of Nuveen’s investment management teams. In evaluating the comparisons of fees, the Independent Board Members noted that the fee rates charged to the Funds and other clients vary, among other things, because of the different services involved and the additional regulatory and compliance requirements associated with registered investment companies, such as the Funds. Accordingly, the Independent Board Members considered the differences in the product types, including, but not limited to, the services provided, the structure and operations, product distribution and costs thereof, portfolio investment policies, investor profiles, account sizes and regulatory requirements. The Independent Board Members noted, in particular, that the range of services provided to the Funds (as discussed above) is much more extensive than that provided to separately managed accounts. Given the inherent differences in the products, particularly the extensive services provided to the Funds, the Independent Board Members believe such facts justify the different levels of fees.
In considering the fees of the Sub-Adviser, the Independent Board Members also considered the pricing schedule or fees that the Sub-Adviser charges for similar investment management services for other fund sponsors or clients (such as retail and/or institutional managed accounts) as applicable.
Annual Investment Management Agreement Approval Process (continued)
3. Profitability of Fund Advisers
In conjunction with its review of fees, the Independent Board Members also considered the profitability of Nuveen for its advisory activities (which incorporated Nuveen’s wholly-owned affiliated sub-advisers) and its financial condition. The Independent Board Members reviewed the revenues and expenses of Nuveen’s advisory activities for the last two years, the allocation methodology used in preparing the profitability data and an analysis of the key drivers behind the changes in revenues and expenses that impacted profitability in 2009. The Independent Board Members noted this information supplemented the profitability information requested and received during the year to help keep them apprised of developments affecting profitability (such as changes in fee waivers and expense reimbursement commitments). In this regard, the Independent Board Members noted that they had also appointed an Independent Board Member as a point person to review and keep them apprised of changes to the profitability analysis and/or methodologies during the year. The Independent Board Members also considered Nuveen’s revenues for advisory activities, expenses, and profit margin compared to that of various unaffiliated management firms with similar amounts of assets under management and relatively comparable asset composition prepared by Nuveen.
In reviewing profitability, the Independent Board Members recognized the subjective nature of determining profitability which may be affected by numerous factors including the allocation of expenses. Further, the Independent Board Members recognized the difficulties in making comparisons as the profitability of other advisers generally is not publicly available and the profitability information that is available for certain advisers or management firms may not be representative of the industry and may be affected by, among other things, the adviser’s particular business mix, capital costs, types of funds managed and expense allocations. Notwithstanding the foregoing, the Independent Board Members reviewed Nuveen’s methodology and assumptions for allocating expenses across product lines to determine profitability. In reviewing profitability, the Independent Board Members recognized Nuveen’s investment in its fund business. Based on their review, the Independent Board Members concluded that Nuveen’s level of profitability for its advisory activities was reasonable in light of the services provided.
In evaluating the reasonableness of the compensation, the Independent Board Members also considered other amounts paid to a Fund Adviser by the Funds as well as any indirect benefits (such as soft dollar arrangements, if any) the Fund Adviser and its affiliates receive, or are expected to receive, that are directly attributable to the management of the Funds, if any. See Section E below for additional information on indirect benefits a Fund Adviser may receive as a result of its relationship with the Funds. Based on their review of the overall fee arrangements of each Fund, the Independent Board Members determined that the advisory fees and expenses of the respective Fund were reasonable.
D. Economies of Scale and Whether Fee Levels Reflect These Economies of Scale
With respect to economies of scale, the Independent Board Members have recognized the potential benefits resulting from the costs of a fund being spread over a larger asset base, although economies of scale are difficult to measure and predict with precision, particularly on a fund-by-fund basis. One method to help ensure the shareholders share in these benefits is to include breakpoints in the advisory fee schedule. Generally, management fees for funds in the Nuveen complex are comprised of a fund-level component and a complex-level component, subject to certain exceptions. Accordingly, the Independent Board Members reviewed and considered the applicable fund-level breakpoints in the advisory fee schedules that reduce advisory fees as asset levels increase.
In addition to fund-level advisory fee breakpoints, the Board also considered the Funds’ complex-wide fee arrangement. Pursuant to the complex-wide fee arrangement, the fees of the funds in the Nuveen complex are generally reduced as the assets in the fund complex reach certain levels. The complex-wide fee arrangement seeks to provide the benefits of economies of scale to fund shareholders when total fund complex assets increase, even if assets of a particular fund are unchanged or have decreased. The approach reflects the notion that some of Nuveen’s costs are attributable to services provided to all its funds in the complex and therefore all funds benefit if these costs are spread over a larger asset base.
Based on their review, the Independent Board Members concluded that the breakpoint schedules and complex-wide fee arrangement were acceptable and reflect economies of scale to be shared with shareholders when assets under management increase.
E. Indirect Benefits
In evaluating fees, the Independent Board Members received and considered information regarding potential “fall out” or ancillary benefits the respective Fund Adviser or its affiliates may receive as a result of its relationship with each Fund. In this regard, the Independent Board Members considered, among other things, any sales charges, distribution fees and shareholder services fees received and retained by the Funds’ principal underwriter, an affiliate of NAM, which includes fees received pursuant to any 12b-1 plan. The Independent Board Members, therefore, considered the 12b-1 fees retained by Nuveen during the last calendar year.
In addition to the above, the Independent Board Members considered whether each Fund Adviser received any benefits from soft dollar arrangements whereby a portion of the commissions paid by a Fund for brokerage may be used to acquire research that may be useful to the Fund Adviser in managing the assets of the Funds and other clients. With respect to NAM, the Independent Board Members noted that NAM does not currently have any soft dollar arrangements; however, to the extent certain bona fide agency transactions that occur on markets that traditionally trade on a principal basis and riskless principal transactions are considered as generating “commissions,” NAM intends to comply with the applicable safe harbor provisions. With respect to the Sub-Adviser, the Independent Board Members considered that the Sub-Adviser may benefit from its soft dollar arrangements pursuant to which it receives research from brokers that execute the applicable Fund’s portfolio transactions. The Independent Board Members further noted that the Sub-Adviser’s profitability may be lower if it were required to pay for this research with hard dollars.
Based on their review, the Independent Board Members concluded that any indirect benefits received by a Fund Adviser as a result of its relationship with the Funds were reasonable and within acceptable parameters.
F. Other Considerations
The Independent Board Members did not identify any single factor discussed previously as all-important or controlling. The Board Members, including the Independent Board Members, unanimously concluded that the terms of the Investment Management Agreements and Sub-advisory Agreements are fair and reasonable, that the respective Fund Adviser’s fees are reasonable in light of the services provided to each Fund and that the Investment Management Agreements and the Sub-advisory Agreements be renewed.
Notes
Notes
Glossary of Terms Used in this Report
Average Annual Total Return: This is a commonly used method to express an investment’s performance over a particular, usually multi-year time period. It expresses the return that would have been necessary each year to equal the investment’s actual cumulative performance (including change in NAV or offer price and reinvested dividends and capital gains distributions, if any) over the time period being considered.
Net Asset Value (NAV): A Fund’s NAV is the dollar value of one share in the Fund. It is calculated by subtracting the liabilities of the Fund from its total assets and then dividing the remainder by the number of shares outstanding. Fund NAVs are calculated at the end of each business day.
Fund Information
Fund Manager
Nuveen Asset Management
333 West Wacker Drive
Chicago, IL 60606
Sub-Adviser
Nuveen HydePark Group, LLC
333 West Wacker Drive
Chicago, IL 60606
Legal Counsel
Chapman and Cutler LLP
Chicago, IL
Independent Registered Public Accounting Firm
PricewaterhouseCoopers LLP
Chicago, IL
Custodian
State Street Bank & Trust Company
Boston, MA
Transfer Agent and Shareholder Services
Boston Financial
Data Services
Nuveen Investor Services
P.O. Box 8530
Boston, MA 02266-8530
(800) 257-8787
Distribution Information: The Funds hereby designate their percentages of dividends paid from net ordinary income as dividends qualifying for the 70% dividends received deduction (“DRD”) for corporations and their percentages as qualified dividend income (“QDI”) for individuals under Section 1 (h)(11) of the Internal Revenue Code as shown in the accompanying table. The actual qualified dividend income distributions will be reported to shareholders on Form 1099-DIV which will be sent to shareholders shortly after calendar year end.
| | | | |
| Fund | | % of DRD | | % of QDI |
Nuveen Enhanced Core Equity Fund | | 100% | | 100% |
Nuveen Enhanced Mid-Cap Fund | | 100% | | 100% |
Quarterly Portfolio of Investments and Proxy Voting Information: You may obtain (i) each Fund’s quarterly portfolio of investments, (ii) information regarding how the Funds voted proxies relating to portfolio securities held during the most recent twelve-month period ended June 30, and (iii) a description of the policies and procedures that the Funds used to determine how to vote proxies relating to portfolio securities without charge, upon request, by calling Nuveen Investments at (800) 257-8787 or on Nuveen’s website at www.nuveen.com.
You may also obtain this and other Fund information directly from the Securities and Exchange Commission (“SEC”). The SEC may charge a copying fee for this information. Visit the SEC on-line at http://www.sec.gov or in person at the SEC’s Public Reference Room in Washington, D.C. Call the SEC at (202) 942-8090 for room hours and operation. You may also request Fund information by sending an e-mail request to publicinfo@sec.gov or by writing to the SEC’s Public Reference Section at 100 F Street NE, Washington, D.C. 20549.
The Financial Industry Regulatory Authority (“FINRA”) provides a Public Disclosure Program which supplies certain information regarding the disciplinary history of FINRA members and their associated persons in response to either telephone inquiries at (800) 289-9999 or written inquiries at www.finra.org. FINRA also provides an investor brochure that includes information describing the Public Disclosure Program.
Nuveen Investments:
Serving Investors For Generations
Since 1898, financial advisors and their clients have relied on Nuveen Investments to provide dependable investment solutions through continued adherence to proven, long-term investing principles. Today, we offer a range of high quality equity and fixed-income solutions designed to be integral components of a well-diversified core portfolio.
Focused on meeting investor needs.
Nuveen Investments is a global investment management firm that seeks to help secure the long-term goals of institutions and high net worth investors as well as the consultants and financial advisors who serve them. We market our growing range of specialized investment solutions under the high-quality brands of HydePark, NWQ, Nuveen, Santa Barbara, Symphony, Tradewinds and Winslow Capital. In total, Nuveen Investments managed approximately $150 billion of assets on June 30, 2010.
Find out how we can help you.
To learn more about the products and services of Nuveen Investments may be able to help you meet your financial goals, talk to your financial advisor, or call us at (800) 257-8787. Please read the information provided carefully before you invest. Investors should consider the investment objective and policies, risk considerations, charges and expenses of any investment carefully. Where applicable, be sure to obtain a prospectus, which contains this and other relevant information. To obtain a prospectus, please contact your securities representative or Nuveen Investments, 333 W. Wacker Dr., Chicago, IL 60606. Please read the prospectus carefully before you invest or send money.
Learn more about Nuveen Funds at: www.nuveen.com/mf
Nuveen makes things e-simple.
It only takes a minute to sign up for e-Reports. Once enrolled, you’ll receive an e-mail as soon as your Nuveen Fund information is ready. No more waiting for delivery by regular mail. Just click on the link within the e-mail to see the report and save it on your computer if you wish.
Free e-Reports right to your e-mail!
www.investordelivery.com
If you receive your Nuveen Fund dividends and statements from your financial advisor or brokerage account.
OR
www.nuveen.com/accountaccess
If you receive your Nuveen Fund dividends and statements directly from Nuveen.
| | |
Distributed by Nuveen Investments, LLC 333 West Wacker Drive Chicago, IL 60606 www.nuveen.com | | |
MAN-ENHCM-0610P

Mutual Funds
Nuveen Equity Funds
For investors seeking high current income and long-term capital appreciation.
Annual Report
June 30, 2010
|
| Nuveen NWQ Equity Income Fund |
NUVEEN INVESTMENTS ANNOUNCES STRATEGIC COMBINATION WITH FAF ADVISORS
On July 29, 2010, Nuveen Investments, Inc. announced that U.S. Bancorp will receive a 9.5% stake in Nuveen Investments and cash consideration in exchange for the long-term asset business of U.S. Bancorp’s FAF Advisors (FAF). Nuveen Investments is the parent of Nuveen Asset Management (NAM), the investment adviser for the Funds included in this report.
FAF Advisors, which currently manages about $25 billion of long-term assets and serves as the advisor of the First American Funds, will be combined with NAM, which currently manages about $75 billion in municipal fixed income assets. Upon completion of the transaction, Nuveen Investments, which currently manages about $150 billion of assets across several high-quality affiliates, will manage a combined total of about $175 billion in institutional and retail assets.
This combination will not affect the investment objectives, strategies or policies of this Fund. Over time, Nuveen Investments expects that the combination will provide even more ways to meet the needs of investors who work with financial advisors and consultants by enhancing the multi-boutique model of Nuveen Investments, which also includes highly respected investment teams at NWQ Investment Management, Santa Barbara Asset Management, Symphony Asset Management, Tradewinds Global Investors, Winslow Capital and Nuveen HydePark.
The transaction is expected to close late in 2010, subject to customary conditions.
| | | | | | |
| Must be preceded by or accompanied by a prospectus. | | NOT FDIC INSURED | | MAY LOSE VALUE | | NO BANK GUARANTEE |
Chairman’s
Letter to Shareholders

Dear Shareholder,
The economic environment in which your Fund operates reflects continuing but uneven economic recovery. The U.S. and other major industrial countries are experiencing steady but comparatively low levels of economic growth, while emerging market countries are seeing a resumption of relatively strong economic expansion. The potential impact of steps being considered by many governments to counteract the extraordinary governmental spending and credit expansion to deal with the recent financial and economic crisis is injecting uncertainty into global financial markets. The implications for future tax rates, government spending, interest rates and the pace of economic recovery in the U.S. and other leading economies are extremely difficult to predict at the present time. The long term health of the global economy depends on restoring some measure of fiscal discipline around the world, but since all of the corrective steps require economic pain, it is not surprising that governments are reluctant to undertake them.
In the near term, governments remain committed to furthering economic recovery and realizing a meaningful reduction in their national unemployment rates. Such an environment should produce continued economic growth and, consequently, attractive investment opportunities. Over the longer term, the larger uncertainty mentioned earlier carries the risk of unexpected potholes in the road to sustained recovery. For this reason, Nuveen’s investment management teams are working hard to balance return and risk by building well-diversified portfolios, among other strategies. I encourage you to read the following commentary on the management of your Fund. As always, I also encourage you to contact your financial consultant if you have any questions about your Nuveen Fund investment. Please consult the Nuveen website for the most recent information on your Nuveen Fund at: www.nuveen.com.
On behalf of the other members of your Fund’s Board, we look forward to continuing to earn your trust in the months and years ahead.
Sincerely,

Robert P. Bremner
Chairman of the Board
August 17, 2010
Portfolio Manager’s Comments
Certain statements in this report are forward-looking statements. Discussions of specific investments are for illustration only and are not intended as recommendations of individual investments. The forward-looking statements and other views expressed herein are those of the portfolio manager as of the date of this report. Actual future results or occurrences may differ significantly from those anticipated in any forward-looking statements, and the views expressed herein are subject to change at any time, due to numerous market and other factors. The Fund disclaims any obligation to update publicly or revise any forward-looking statements or views expressed herein.
The Nuveen NWQ Equity Income Fund features management by NWQ Investment Management Company, LLC, an affiliate of Nuveen Investments. Jon Bosse, Chief Investment Officer of NWQ, leads the Fund’s management team at that firm. He has more than 27 years of corporate finance and investment management experience. Here Jon talks about general economic and market conditions, his management strategy and the performance of the Fund for the period since the inception of the Fund on September 15, 2009, through June 30, 2010.
What were the general market conditions for the reporting period?
Since the Fund’s inception, there continued to be considerable downward pressure on the economy and both the Federal Reserve (Fed) and the federal government continued their efforts to improve the overall economic environment. For its part, the Fed continued to hold the benchmark fed funds rate in a target range of zero to 0.25% after cutting it to this record low level in December 2008.
At its June 2010 meeting, the central bank renewed its pledge to keep the fed funds rate “exceptionally low” for an “extended period.” As part of its efforts, the federal government put into place the American Recovery and Reinvestment Act of 2009, a $787 billion economic stimulus package intended to provide job creation, tax relief, fiscal assistance to state and local governments and expansion of unemployment benefits and other federal social welfare programs.
During this period, these and other measures taken by the Fed and the government to ease the economic recession have helped to produce some signs of improvement. Over the four calendar quarters comprising the period from July 2009 through June 2010, the U.S. economy, as measured by the U.S. gross domestic product (GDP), grew at annualized rates of 1.6%, 5.0%, 3.7% and an estimated 2.4%. This marked the first time since 2007 that the economy managed to string together four consecutive positive quarters. Housing also provided something of a bright spot, as the S&P/Case-Shiller Home Price Index of average residential prices from 20 large urban areas gained 4.6% for the twelve months ended May 2010 (the most recent data available at the time this report was produced). This moved average home prices across the United States to levels similar to where they were in the autumn of 2003.
Inflation also continued to be relatively tame, as the Consumer Price Index (CPI) rose 1.1% year-over-year as of June 2010. While labor markets remained weak, recent months have seen some improvement. As of June 2010, the national unemployment rate was 9.5%, the same level as June 2009 but below the 26-year high of 10.1% in October 2009.
The U.S. large cap equity indices, while volatile, ended the period roughly where they started given the broad market declines incurred during May and June. A fairly robust rally occurred from September 2009 through April 2010, driven by attractive stock valuations and economic data that had pointed to stability, and most likely, a moderate economic recovery. Retail sales, equipment spending, and exports had strengthened, while
manufacturing and trade inventories had started to build following nearly two years of inventory liquidation. On the corporate front, access to the debt and equity markets vastly improved as companies were able to raise capital to bolster their balance sheets without being severely punished. The strong upward momentum in stock prices was derailed in May and June, however, on heightened concerns that a sovereign debt crisis in Greece could imperil other European countries also facing default. Stocks weakened as investors feared that fiscal belt-tightening, increased taxes, and financial reform could choke off the global economic recovery that was taken hold.
How did the Fund perform during the period since inception through June 30, 2010?
The table on page five provides performance information for the Fund (Class A Shares at net asset value) for the period since its inception on September 15, 2009, through June 30, 2010. The table also compares the Fund’s performance to industry and general market indexes.
What was the Fund’s investment strategy?
The Fund’s investment objective is to provide high current income and long-term capital appreciation. NWQ attempts to meet this investment objective by investing primarily in dividend-paying equity securities, including common stocks, preferred stocks, warrants to purchase common stocks or preferred stocks, securities convertible into common or preferred stocks (such as convertible bonds and debentures), and other securities with equity characteristics. The Fund does not invest more than 25% of its net assets in non-common stock investments. Although the Fund invests primarily in U.S. equity securities, the Fund may invest up to 25% of its net assets in non-U.S. equity securities. The Fund also has the ability to sell covered call options. There can be no assurance the Fund will achieve its investment objective.
How did this strategy influence performance?
The Nuveen NWQ Equity Income Fund outperformed its benchmark for its inception period from September 15, 2009, through June 30, 2010.
Among the top performers included Biovail Corp., a specialty Canadian pharmaceutical with new management in place that is reinventing the company to target attractive specialty niches that treat the central nervous system. We added the position in February, and shares rose sharply soon thereafter as the company agreed to merge with Valeant Pharmaceutical. The deal significantly expands the asset base for Biovail, thus reducing the risk of any single pipeline asset derailing its growth trajectory. Valeant brings with it a strong portfolio of growing pharmaceutical assets with extremely limited patent expiration risk.
Gold bullion hit a new nominal high above $1,250 per ounce in June, spurred by the sovereign debt crisis in Europe, and a flight to safety into gold on fears over the future of the European currency. Our gold mining equities AngloGold Ashanti Ltd. and Barrick Gold Corp. benefited from the rise in the price of bullion as well as from stable input costs, particularly energy costs, which translated into higher margins.
Also Union Pacific Corp. outperformed on expectations that demand for railroad services is set to recover as inventory destocking appears to have come to an end in many sectors of the economy. As the economic recovery continues to unfold, volume growth, operating leverage, and earnings power for the rails is expected to continue to improve. Union
Pacific is also poised to achieve pricing gains as lower priced legacy contracts roll off and are replaced with market-based pricing.
Several holdings detracted from performance, including fertilizer producer, Mosaic Co., which declined as potash pricing, while stable, has not increased as much as expected. Investors had hoped potash prices would regain upward momentum, driven by the resumption of Chinese imports. Although volumes have returned to normal levels, price increases have failed to meet investors’ expectations. We believe that the long-term fundamentals for higher fertilizer prices are still favorable, and that Mosaic is well-positioned both financially and operationally to benefit. It is useful to note that we had previously purchased and sold a position in Mosaic at a gain, and that the current position was hedged, which limited the loss to the Fund.
Our energy investments declined, given the weak outlook for natural gas. Additionally, there have been concerns about increased regulation and the cost of doing business given the tragic accident and oil spill that began in the Gulf of Mexico on April 20, 2010. Natural gas prices have been pressured this year due to rising gas rig counts, productivity gains, and a more sluggish recovery in demand than had originally been expected. Our energy investments are levered more towards international oil drilling activity (rather than domestic natural gas markets) where we believe the fundamentals are more attractive. Our energy holdings include Exxon Mobil Corp., Occidental Petroleum Corp., as well as foreign holdings Eni S.p.A. and Total SA, where the ADRs declined significantly more than their ordinary shares, given the sharp decline in the Euro currency. None of our energy investments have a significant presence in the Gulf of Mexico.
Also detracting from performance was our investment in Motorola, Inc. The company underperformed as the shares had appreciated in advance of the release of its Android-based smartphone, and then subsequently declined as the company provided guidance that was modestly below investors’ expectations. Since then, the company’s smartphone sales have beaten expectations. Motorola continues on its path towards profitability this year, and the spinoff of its handset division in the first quarter of 2011. We had hedged our investment in Motorola by selling calls against the position, which limited the loss to the Fund.
We added several positions to the Fund throughout the reporting period. In the financial sector, we invested in Citigroup as the company was raising capital to repay its TARP obligation and terminate its loss sharing agreement with the U.S. Treasury. We thought the stock offered compelling valuation, was trading at a steep discount to tangible book value, and was available at roughly six times its estimated normalized earnings power — which we believed would provide downside protection. While we expect little to no earnings for Citigroup in 2010 as the company continues to wind down non-core businesses and troubled assets, we anticipate a sharp earnings recovery beginning in 2011 that will be driven by improved credit quality and expense management efforts. More recently, we invested in Unum Group, the largest writer of disability income products in the U.S. and U.K. Despite the economic and market turmoil that has wreaked havoc on other life insurers, Unum has continued to deliver steadily rising earnings. The company has an extremely high quality investment portfolio, and the strongest balance sheet of any of its peers. We believe that an increased valuation is warranted given its consistent earnings and steady book value growth.
In addition to Biovail Corp., we added to our health care investments with a new position in Amgen Inc. Our valuation models suggests that Amgen’s downside risk should be limited due to the company’s strong cash flows, solid balance sheet, cost cutting opportunities, and future growth potential given its pipeline of new drugs.
| 1 | Fund returns are from 9/15/09; index return is from 9/30/09. |
| 2 | The Russell 1000 Value Index measures the performance of Russell 1000 Index companies with lower price-to-book ratios and lower expected growth values. The index returns assume reinvestment of dividends, but do not reflect any applicable sales charges. You cannot invest directly in an index. |
We also added to our energy exposure with the purchases of Occidental Petroleum Corp. Occidental has a strong balance sheet, low cost structure, and one of the highest returns on capital employed in the industry with an asset base and project list that should allow this to continue. From a valuation standpoint, we believe the current stock price discounts oil prices well below current levels.
Additionally, we invested in freight railcar manufacturer Trinity Industries Inc. The company controls 40-45% of the railcar market, and also produces barges, highway products, and structural wind towers. Trinity’s operations have been severely impacted by the economic recession with the company’s earnings projected to be down at least 50% in 2010 — among the worst in the industrial space. Given the negative short-term outlook, investors have priced in very low expectations, which provided an attractive risk reward opportunity as we believe the company is well-positioned to benefit as the economy recovers. From a valuation standpoint, investors are paying only for the value of Trinity’s leasing business, while getting the rest of the company for free.
Throughout the period we eliminated several positions including Comcast Corp., which was eliminated based on valuation. We were also disappointed in management’s decision to enter into a joint-venture with GE to own a majority stake in NBC Universal. AT&T Inc. was sold following the company’s successful restructuring efforts and concerns over slower growth in the wireless market. Though AT&T has shown success in reducing its wireline costs, we see little opportunity for further meaningful cost-savings for the company and decided to exit our position. After initially reducing our investment in ConocoPhillips and investing in Occidental Petroleum, we eliminated the remaining position in ConocoPhillips as we believed the share price reflected the company’s current restructuring efforts and therefore had a less attractive risk/reward valuation.
Class A Shares – Cumulative Total Returns
As of 6/30/10
| | |
| | | Since
Inception1 |
Nuveen NWQ Equity Income Fund | | |
A Shares at NAV | | 0.48% |
A Shares at Offer | | -5.30% |
Russell 1000 Value Index2 | | -1.11% |
Returns quoted represent past performance which is no guarantee of future results. Current performance may be higher or lower than the performance shown. Investment returns and principal value will fluctuate so that when shares are redeemed, they may be worth more or less than their original cost. Class A Shares have a 5.75% maximum sales charge. Returns at NAV would be lower if the sales charge were included. Returns do not reflect the deduction of taxes that a shareholder would pay on Fund distributions or the redemption of shares. Returns reflect a contractual agreement between the Fund and the investment adviser to waive certain fees and expenses; see Notes to Financial Statements, Footnote 7 — Management Fees and Other Transactions with Affiliates for more information. In addition, returns may reflect a voluntary expense limitation by the Fund’s investment adviser that may be modified or discontinued at any time without notice. For the most recent month-end performance, visit www.nuveen.com or call (800) 257-8787.
Please see the Fund’s Spotlight Page later in this report for more complete performance data and expense ratios.
Nuveen NWQ Equity Income Fund
Growth of an Assumed $10,000 Investment
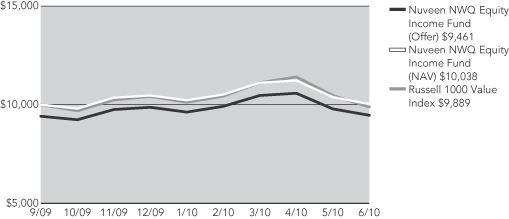
The graph does not reflect the deduction of taxes that a shareholder may pay on Fund distributions or the redemption of Fund shares.
The index comparisons show the change in value of a $10,000 investment in the Class A Shares of the Nuveen Fund compared with the corresponding indexes. The Russell 1000 Value Index measures the performance of Russell 1000 Index companies with lower price-to-book ratios and lower expected growth values. Fund returns are from 9/15/09 and index return is from 9/30/09. The index returns assume reinvestment of dividends and do not reflect any initial or ongoing expenses. You cannot invest directly in an index. The Nuveen NWQ Equity Income Fund’s returns include reinvestment of all dividends and distributions, and the Fund’s returns at the offer price depicted in the chart reflects the initial maximum sales charge applicable to Class A Shares (5.75%) and all ongoing Fund expenses. The performance data quoted represents past performance, which is not indicative of future results. Current performance may be lower or higher than the performance shown.
Fund Spotlight as of 6/30/10 Nuveen NWQ Equity Income Fund
| | | | | | | | |
| Quick Facts | | | | | | | | |
| | | A Shares | | C Shares | | R3 Shares | | I Shares |
NAV | | $19.81 | | $19.80 | | $19.80 | | $19.81 |
Latest Ordinary Income Distribution1 | | $0.1120 | | $0.0717 | | $0.0985 | | $0.1254 |
Inception Date | | 9/15/09 | | 9/15/09 | | 9/15/09 | | 9/15/09 |
Returns quoted represent past performance which is no guarantee of future results. Investment returns and principal value will fluctuate so that when shares are redeemed, they may be worth more or less than their original cost. Current performance may be higher or lower than the performance shown. Returns without sales charges would be lower if the sales charge were included. Returns do not reflect the deduction of taxes that a shareholder would pay on Fund distributions or the redemption of shares. For the most recent month-end performance visit www.nuveen.com or call (800) 257-8787.
Returns reflect differences in sales charges and expenses, which are primarily differences in distribution and service fees. Fund returns assume reinvestment of dividends and capital gains. Class A Shares have a 5.75% maximum sales charge. Class A Share purchases of $1 million or more are sold at net asset value without an up-front sales charge but may be subject to a contingent deferred sales charge (CDSC), also known as a back-end sales charge, if redeemed within twelve months of purchase. Class C Shares have a 1% CDSC for redemptions within less than one year, which is not reflected in the one-year total return. Class R3 shares have no sales charge and are available to only certain retirement plans. Class I Shares have no sales charge and may be purchased under limited circumstances or by specified classes of investors. Returns may reflect an expense limitation by the Fund’s investment adviser.
| | | | |
| Cumulative Total Returns as of 6/30/10 |
| | |
| A Shares | | NAV | | Offer |
Since Inception | | 0.48% | | -5.30% |
| | |
| C Shares | | NAV | | w/CDSC |
Since Inception | | -0.14% | | -1.13% |
| | |
| R3 Shares | | NAV | | |
Since Inception | | 0.24% | | |
| | |
| I Shares | | NAV | | |
Since Inception | | 0.67% | | |
| | |
|
| Top Five Common Stock Holdings 3 |
CA Inc. | | 4.7% |
Merck & Company Inc. | | 4.7% |
Lockheed Martin Corporation | | 4.3% |
Hartford Financial Services Group, Inc. | | 3.9% |
Sanofi-Aventis, Sponsored ADR | | 3.9% |
Portfolio Allocation 2

| | |
| Portfolio Statistics |
| Net Assets ($000) | | $990 |
| Number of Common Stocks | | 38 |
| | | | |
| Expense Ratios | | | | |
| Share Class | | Gross
Expense
Ratios | | Net
Expense
Ratios |
| Class A | | 1.39% | | 1.15% |
| Class C | | 2.14% | | 1.90% |
| Class R3 | | 1.64% | | 1.40% |
| Class I | | 1.14% | | 0.90% |
The expense ratios shown factor in Total Annual Fund Operating Expenses including management fees and other fees and expenses, and are based on an estimated $50 million average net asset size for the Fund’s first fiscal year. The Net Expense Ratios reflect a contractual commitment by the Fund’s investment adviser to waive fees and reimburse expenses through October 31, 2012. The expense ratios are those shown in the most recent Fund prospectus.
| 2 | As a percentage of total investments (excluding investments in derivatives) as of June 30, 2010. Holdings are subject to change. |
| 3 | As a percentage of total common stocks as of June 30, 2010. Holdings are subject to change. |
Fund Spotlight as of 6/30/10 Nuveen NWQ Equity Income Fund
| | |
| Portfolio Composition1 | | |
Insurance | | 23.8% |
Pharmaceuticals | | 14.2% |
Metals & Mining | | 8.3% |
Oil, Gas & Consumable Fuels | | 7.1% |
Aerospace & Defense | | 6.5% |
Software | | 6.0% |
Diversified Financial Services | | 5.7% |
Media | | 3.5% |
Commercial Services & Supplies | | 3.2% |
Communications Equipment | | 3.1% |
Household Products | | 3.0% |
Tobacco | | 3.0% |
Other | | 12.6% |
| 1 | As a percentage of total investments (excluding investments in derivatives) as of June 30, 2010. Holdings are subject to change. |
Expense Example
As a shareholder of the Fund, you incur two types of costs: (1) transaction costs, including up-front and back-end sales charges (loads) or redemption fees, where applicable; and (2) ongoing costs, including management fees; distribution and service (12b-1) fees, where applicable; and other Fund expenses. This Example is intended to help you understand your ongoing costs (in dollars) of investing in the Fund and to compare these costs with the ongoing costs of investing in other mutual funds.
The Example below is based on an investment of $1,000 invested at the beginning of the period and held for the period.
The information under “Actual Performance,” together with the amount you invested, allows you to estimate actual expenses incurred over the reporting period. Simply divide your account value by $1,000 (for example, an $8,600 account value divided by $1,000 = 8.60) and multiply the result by the cost shown for your share class, in the row entitled “Expenses Incurred During Period” to estimate the expenses incurred on your account during this period.
The information under “Hypothetical Performance,” provides information about hypothetical account values and hypothetical expenses based on the Fund’s actual expense ratio and an assumed rate of return of 5% per year before expenses, which is not the Fund’s actual return. The hypothetical account values and expenses may not be used to estimate the actual ending account balance or expense you incurred for the period. You may use this information to compare the ongoing costs of investing in the Fund and other Funds. To do so, compare this 5% hypothetical example with the 5% hypothetical examples that appear in the shareholder reports of the other funds.
Please note that the expenses shown in the table are meant to highlight your ongoing costs only and do not reflect any transactional costs, such as up-front and back-end sales charges (loads) or redemption fees, where applicable. Therefore, the hypothetical information is useful in comparing ongoing costs only, and will not help you determine the relative total costs of owning different funds or share classes. In addition, if these transactional costs were included, your costs would have been higher.
| | | | | | | | | | | | | | | | | | | | | | | | | | |
| | | | | | | | | | | | | Hypothetical Performance |
| | | Actual Performance | | | | (5% return before expenses) |
| | | A Shares | | C Shares | | R3 Shares | | I Shares | | | | A Shares | | C Shares | | R3 Shares | | I Shares |
| Beginning Account Value (1/01/10) | | $ | 1,000.00 | | $ | 1,000.00 | | $ | 1,000.00 | | $ | 1,000.00 | | | | $ | 1,000.00 | | $ | 1,000.00 | | $ | 1,000.00 | | $ | 1,000.00 |
| Ending Account Value (6/30/10) | | $ | 958.80 | | $ | 955.20 | | $ | 957.60 | | $ | 960.10 | | | | $ | 1,019.14 | | $ | 1,015.42 | | $ | 1,017.90 | | $ | 1,020.38 |
| Expenses Incurred During Period | | $ | 5.54 | | $ | 9.16 | | $ | 6.75 | | $ | 4.33 | | | | $ | 5.71 | | $ | 9.44 | | $ | 6.95 | | $ | 4.46 |
For each class of the Fund, expenses are equal to the Fund’s annualized net expense ratio of 1.14%, 1.89%, 1.39% and .89% for Classes A, C, R3 and I, respectively, multiplied by the average account value over the period, multiplied by 181/365 (to reflect the one-half year period).
Report of
Independent Registered Public Accounting Firm
To the Board of Trustees and Shareholders of
Nuveen Investment Trust:
In our opinion, the accompanying statement of assets and liabilities, including the portfolio of investments, and the related statements of operations, of changes in net assets and the financial highlights present fairly, in all material respects, the financial position of Nuveen NWQ Equity Income Fund (a series of the Nuveen Investment Trust, hereafter referred to as the “Fund”) at June 30, 2010, the results of its operations, the changes in its net assets and the financial highlights for the period September 15, 2009 (commencement of operations) through June 30, 2010, in conformity with accounting principles generally accepted in the United States of America. These financial statements and financial highlights (hereafter referred to as “financial statements”) are the responsibility of the Fund’s management; our responsibility is to express an opinion on these financial statements based on our audit. We conducted our audit of these financial statements in accordance with the standards of the Public Company Accounting Oversight Board (United States). Those standards require that we plan and perform the audit to obtain reasonable assurance about whether the financial statements are free of material misstatement. An audit includes examining, on a test basis, evidence supporting the amounts and disclosures in the financial statements, assessing the accounting principles used and significant estimates made by management, and evaluating the overall financial statement presentation. We believe that our audit, which included confirmation of securities at June 30, 2010 by correspondence with the custodian and brokers, provides a reasonable basis for our opinion.
PRICEWATERHOUSECOOPERS LLP
Chicago, IL
August 25, 2010
Portfolio of Investments
Nuveen NWQ Equity Income Fund
June 30, 2010
| | | | | | | | | | | | | |
| Shares | | Description (1) | | | | | | | | | | Value |
| | Common Stocks – 96.8% | | | | | | | | | | | |
| | | | | | |
| | Aerospace & Defense – 6.6% | | | | | | | | | | | |
| | | | | | |
| 550 | | Lockheed Martin Corporation | | | | | | | | | | $ | 40,975 |
| | | | | | |
| 500 | | Raytheon Company | | | | | | | | | | | 24,195 |
| | Total Aerospace & Defense | | | | | | | | | | | 65,170 |
| | Biotechnology – 1.1% | | | | | | | | | | | |
| | | | | | |
| 200 | | Amgen Inc., (2) | | | | | | | | | | | 10,520 |
| | Chemicals – 1.6% | | | | | | | | | | | |
| | | | | | |
| 400 | | Mosaic Company, (2) | | | | | | | | | | | 15,592 |
| | Commercial Banks – 2.1% | | | | | | | | | | | |
| | | | | | |
| 800 | | Wells Fargo & Company | | | | | | | | | | | 20,480 |
| | Commercial Services & Supplies – 3.2% | | | | | | | | | | | |
| | | | | | |
| 1,450 | | Pitney Bowes Inc. | | | | | | | | | | | 31,842 |
| | Communications Equipment – 3.1% | | | | | | | | | | | |
| | | | | | |
| 4,700 | | Motorola, Inc., (2) | | | | | | | | | | | 30,644 |
| | Containers & Packaging – 1.0% | | | | | | | | | | | |
| | | | | | |
| 450 | | Packaging Corp. of America | | | | | | | | | | | 9,909 |
| | Diversified Financial Services – 5.7% | | | | | | | | | | | |
| | | | | | |
| 1,400 | | Bank of America Corporation | | | | | | | | | | | 20,118 |
| | | | | | |
| 9,800 | | Citigroup Inc., (2),(3) | | | | | | | | | | | 36,848 |
| | Total Diversified Financial Services | | | | | | | | | | | 56,966 |
| | Diversified Telecommunication Services – 1.4% | | | | | | | | | | | |
| | | | | | |
| 500 | | Verizon Communications Inc. | | | | | | | | | | | 14,010 |
| | Food & Staples Retailing – 1.8% | | | | | | | | | | | |
| | | | | | |
| 900 | | Kroger Co. | | | | | | | | | | | 17,721 |
| | Household Products – 3.1% | | | | | �� | | | | | | |
| | | | | | |
| 500 | | Kimberly-Clark Corporation | | | | | | | | | | | 30,315 |
| | Insurance – 20.0% | | | | | | | | | | | |
| | | | | | |
| 650 | | Aon Corporation | | | | | | | | | | | 24,128 |
| | | | | | |
| 1,900 | | Genworth Financial Inc., Class A, (2) | | | | | | | | | | | 24,833 |
| | | | | | |
| 1,700 | | Hartford Financial Services Group, Inc. | | | | | | | | | | | 37,621 |
| | | | | | |
| 750 | | Loews Corporation | | | | | | | | | | | 24,983 |
| | | | | | |
| 950 | | MetLife, Inc. | | | | | | | | | | | 35,872 |
| | | | | | |
| 600 | | Travelers Companies, Inc. | | | | | | | | | | | 29,550 |
| | | | | | |
| 975 | | Unum Group | | | | | | | | | | | 21,158 |
| | Total Insurance | | | | | | | | | | | 198,145 |
| | Machinery – 1.1% | | | | | | | | | | | |
| | | | | | |
| 600 | | Trinity Industries Inc. | | | | | | | | | | | 10,632 |
| | Media – 3.5% | | | | | | | | | | | |
| | | | | | |
| 1,100 | | Viacom Inc., Class B, (2) | | | | | | | | | | | 34,507 |
| | Metals & Mining – 8.4% | | | | | | | | | | | |
| | | | | | |
| 600 | | AngloGold Ashanti Limited, Sponsored ADR, (3) | | | | | | | | | | | 25,908 |
| | | | | | |
| 800 | | Barrick Gold Corporation | | | | | | | | | | | 36,328 |
| | | | | | |
| 550 | | Nucor Corporation | | | | | | | | | | | 21,054 |
| | Total Metals & Mining | | | | | | | | | | | 83,290 |
| | | | | | | | | | | |
| Shares | | Description (1) | | | | | | | | Value |
| | Oil, Gas & Consumable Fuels – 7.1% | | | | | | | | | |
| | | | | |
| 400 | | Eni S.p.A., Sponsored ADR | | | | | | | | $ | 14,620 |
| | | | | |
| 400 | | Exxon Mobil Corporation | | | | | | | | | 22,828 |
| | | | | |
| 225 | | Occidental Petroleum Corporation | | | | | | | | | 17,359 |
| | | | | |
| 350 | | Total SA, Sponsored ADR | | | | | | | | | 15,624 |
| | Total Oil, Gas & Consumable Fuels | | | | | | | | | 70,431 |
| | Pharmaceuticals – 14.3% | | | | | | | | | |
| | | | | |
| 1,400 | | Biovail Corporation | | | | | | | | | 26,936 |
| | | | | |
| 1,275 | | Merck & Company Inc. | | | | | | | | | 44,587 |
| | | | | |
| 2,300 | | Pfizer Inc. | | | | | | | | | 32,798 |
| | | | | |
| 1,250 | | Sanofi-Aventis, Sponsored ADR | | | | | | | | | 37,575 |
| | Total Pharmaceuticals | | | | | | | | | 141,896 |
| | Road & Rail – 1.4% | | | | | | | | | |
| | | | | |
| 200 | | Union Pacific Corporation, (3) | | | | | | | | | 13,902 |
| | Software – 6.0% | | | | | | | | | |
| | | | | |
| 2,450 | | CA Inc. | | | | | | | | | 45,078 |
| | | | | |
| 625 | | Microsoft Corporation | | | | | | | | | 14,381 |
| | Total Software | | | | | | | | | 59,459 |
| | Tobacco – 3.0% | | | | | | | | | |
| | | | | |
| 650 | | Philip Morris International | | | | | | | | | 29,796 |
| | Wireless Telecommunication Services – 1.3% | | | | | | | | | |
| | | | | |
| 650 | | Vodafone Group PLC, Sponsored ADR | | | | | | | | | 13,436 |
| | Total Common Stocks (cost $1,013,413) | | | | | | | | | 958,663 |
| | | | | |
Principal
Amount (000) | | Description (1) | | Coupon | | Maturity | | Ratings (4) | | Value |
| | Corporate Bonds – 4.1% | | | | | | | | | |
| | | | | |
| | Insurance – 4.1% | | | | | | | | | |
| | | | | |
| 40 | | Genworth Financial Inc. | | 5.750% | | 6/15/14 | | BBB | | $ | 40,001 |
| | Total Corporate Bonds (cost $36,817) | | | | | | | | | 40,001 |
| | Total Investments (cost $1,050,230) –100.9% | | | | | | | | | 998,664 |
| | Other Assets Less Liabilities – (0.9)% | | | | | | | (8,434) |
| | Net Assets – 100% | | | | | | | | $ | 990,230 |
Investments in Derivatives
| | | | | | | | | | | | | |
| | | | | |
Number of
Contracts | | Type | | Notional
Amount (5) | | Expiration
Date | | Strike Price | | Value |
| | Call Options Written – (0.4)% | | | | | | | | | | | |
| | | | | |
| (6) | | AngloGold Ashanti Limited | | $ | (24,000) | | 10/16/10 | | $ | 40.0 | | $ | (3,120) |
| | | | | |
| (40) | | Citigroup Inc. | | | (16,000) | | 9/18/10 | | | 4.0 | | | (940) |
| | | | | |
| (2) | | Union Pacific Corporation | | | (15,000) | | 8/21/10 | | | 75.0 | | | (315) |
| (48) | | Total Call Options Written (premiums received $4,580) | | $ | (55,000) | | | | | | | $ | (4,375) |
Portfolio of Investments
Nuveen NWQ Equity Income Fund (continued)
June 30, 2010
| | | | For Fund portfolio compliance purposes, the Fund’s industry classifications refer to any one or more of the industry sub-classifications used by one or more widely recognized market indexes or ratings group indexes, and/or as defined by Fund management. This definition may not apply for purposes of this report, which may combine industry sub-classifications into sectors for reporting ease. |
| | (1) | | All percentages shown in the Portfolio of Investments are based on net assets. |
| | (2) | | Non-income producing; issuer has not declared a dividend within the past twelve months. |
| | (3) | | Investment, or portion of investment, has been pledged as collateral for call options written. |
| | (4) | | Ratings (not covered by the report of independent registered public accounting firm): Using the highest of Standard & Poor’s Group (“Standard & Poor’s”), Moody’s Investor Service, Inc. (“Moody’s”) or Fitch, Inc. (“Fitch”) rating. Ratings below BBB by Standard & Poor’s, Baa by Moody’s or BBB by Fitch are considered to be below investment grade. |
| | (5) | | For disclosure purposes, Notional Amount is calculated by multiplying the Number of Contracts by the Strike Price by 100. |
| | ADR | | American Depositary Receipt. |
See accompanying notes to financial statements.
Statement of Assets and Liabilities
June 30, 2010
| | | | |
Assets | | | | |
Investments, at value (cost $1,050,230) | | $ | 998,664 | |
Cash | | | 24,375 | |
Receivables: | | | | |
Dividends | | | 2,499 | |
Interest | | | 102 | |
Reclaims | | | 129 | |
Total assets | | | 1,025,769 | |
Liabilities | | | | |
Call options written, at value (premiums received $4,580) | | | 4,375 | |
Dividends payable | | | 5,095 | |
Accrued expenses: | | | | |
Management fees | | | 6,588 | |
12b-1 distribution and service fees | | | 371 | |
Other | | | 19,110 | |
Total liabilities | | | 35,539 | |
Net assets | | $ | 990,230 | |
Class A Shares | | | | |
Net assets | | $ | 247,576 | |
Shares outstanding | | | 12,500 | |
Net asset value per share | | $ | 19.81 | |
Offering price per share (net asset value per share plus
maximum sales charge of 5.75% of offering price) | | $ | 21.02 | |
Class C Shares | | | | |
Net assets | | $ | 247,503 | |
Shares outstanding | | | 12,500 | |
Net asset value and offering price per share | | $ | 19.80 | |
Class R3 Shares | | | | |
Net assets | | $ | 247,550 | |
Shares outstanding | | | 12,500 | |
Net asset value and offering price per share | | $ | 19.80 | |
Class I Shares | | | | |
Net assets | | $ | 247,601 | |
Shares outstanding | | | 12,500 | |
Net asset value and offering price per share | | $ | 19.81 | |
Net Assets Consist of: | | | | |
Capital paid-in | | $ | 998,741 | |
Undistributed (Over-distribution of) net investment income | | | 1,275 | |
Accumulated net realized gain (loss) | | | 41,575 | |
Net unrealized appreciation (depreciation) | | | (51,361 | ) |
Net assets | | $ | 990,230 | |
Authorized shares | | | Unlimited | |
Par value per share | | $ | 0.01 | |
See accompanying notes to financial statements.
Statement of Operations
For the Period September 15, 2009 (commencement of operations) through June 30, 2010
| | | | |
Dividend and Interest Income (net of foreign tax withheld of $662) | | $ | 24,656 | |
Expenses | | | | |
Management fees | | | 6,135 | |
12b-1 service fees – Class A | | | 520 | |
12b-1 distribution and service fees – Class C | | | 2,077 | |
12b-1 distribution and service fees – Class R3 | | | 1,039 | |
Shareholders’ servicing agent fees and expenses | | | 106 | |
Custodian’s fees and expenses | | | 4,282 | |
Trustees’ fees and expenses | | | 22 | |
Professional fees | | | 10,297 | |
Shareholders’ reports – printing and mailing expenses | | | 8,180 | |
Federal and state registration fees | | | 71 | |
Other expenses | | | 322 | |
Total expenses before custodian fee credit and expense reimbursement | | | 33,051 | |
Custodian fee credit | | | (30 | ) |
Expense reimbursement | | | (22,028 | ) |
Net expenses | | | 10,993 | |
Net investment income | | | 13,663 | |
Realized and Unrealized Gain (Loss) | | | | |
Net realized gain (loss) from: | | | | |
Investments | | | 18,690 | |
Call options written | | | 22,704 | |
Net unrealized appreciation (depreciation) of: | | | | |
Investments | | | (51,566 | ) |
Call options written | | | 205 | |
Net realized and unrealized gain (loss) | | | (9,967 | ) |
Net increase (decrease) in net assets from operations | | $ | 3,696 | |
See accompanying notes to financial statements.
Statement of Changes in Net Assets
For the Period September 15, 2009 (commencement of operations) through June 30, 2010
| | | | |
Operations | | | | |
Net investment income | | $ | 13,663 | |
Net realized gain (loss) from: | | | | |
Investments | | | 18,690 | |
Call options written | | | 22,704 | |
Net unrealized appreciation (depreciation) of: | | | | |
Investments | | | (51,566 | ) |
Call options written | | | 205 | |
Net increase (decrease) in net assets from operations | | | 3,696 | |
Distributions to Shareholders | | | | |
From net investment income: | | | | |
Class A | | | (3,737 | ) |
Class C | | | (2,254 | ) |
Class R3 | | | (3,242 | ) |
Class I | | | (4,233 | ) |
Decrease in net assets from distributions to shareholders | | | (13,466 | ) |
Fund Share Transactions | | | | |
Net proceeds from sale of shares | | | 1,000,000 | |
Net increase (decrease) in net assets from Fund share transactions | | | 1,000,000 | |
Net increase (decrease) in net assets | | | 990,230 | |
Net assets at the beginning of period | | | — | |
Net assets at the end of period | | $ | 990,230 | |
Undistributed (Over-distribution of) net investment income at the end of period | | $ | 1,275 | |
See accompanying notes to financial statements.
Notes to Financial Statements
1. General Information and Significant Accounting Policies
The Nuveen Investment Trust (the “Trust”) is an open-end management investment company registered under the Investment Company Act of 1940, as amended. The Trust is comprised of Nuveen NWQ Equity Income Fund (the “Fund”), among others. The Trust was organized as a Massachusetts business trust in 1996. The Fund commenced operations on September 15, 2009.
The Fund’s investment objective is to provide high current income and long-term capital appreciation. Under normal market conditions, the Fund invests at least 80% of its net assets in equity securities. The Fund seeks to meet its investment objective by investing primarily in income producing common stocks, but may also invest in preferred securities, convertible securities and corporate debt securities. The Fund may also write covered call options on securities in which the Fund holds a long position. The Fund may invest up to 20% of its net assets in fixed-income securities, including up to 10% of its net assets in below investment-grade debt securities, commonly referred to as “high yield,” “high risk” or “junk” bonds. Although the Fund invests primarily in securities issued by U.S. companies, it may invest up to 25% of its net assets in non-U.S. securities, including up to 10% of its net assets in securities of companies located in emerging markets.
In June 2009, the Financial Accounting Standards Board (“FASB”) established the FASB Accounting Standards Codification™ (the “Codification”) as the single source of authoritative accounting principles recognized by the FASB in the preparation of financial statements in conformity with generally accepted accounting principles (“GAAP”). The Codification supersedes existing non-grandfathered, non-SEC accounting and reporting standards. The Codification did not change GAAP but rather organized it into a hierarchy where all guidance within the Codification carries an equal level of authority. The Codification became effective for financial statements issued for interim and annual periods ending after September 15, 2009. The Codification did not have a material effect on the Fund’s financial statements.
The following is a summary of significant accounting policies followed by the Fund in the preparation of its financial statements in accordance with accounting principles generally accepted in the United States (“U.S. GAAP”).
Investment Valuation
Common stocks and other equity-type securities are valued at the last sales price on the securities exchange on which such securities are primarily traded and are generally classified as Level 1. Securities primarily traded on the NASDAQ National Market (“NASDAQ”) are valued, except as indicated below, at the NASDAQ Official Closing Price and are generally classified as Level 1. However, securities traded on a securities exchange or NASDAQ for which there were no transactions on a given day or securities not listed on a securities exchange or NASDAQ are valued at the mean between the quoted bid and ask prices. Prices of certain American Depository Receipts (“ADR”) held by the Fund that trade in only limited volume in the United States are valued based on the mean between the most recent bid and ask prices of the underlying non-U.S.-traded stock, adjusted as appropriate for the underlying-to-ADR conversion ratio and foreign exchange rate, and from time-to-time may also be adjusted further to take into account material events that may take place after the close of the local non-U.S. market but before the close of the New York Stock Exchange. These securities generally represent a transfer from a Level 1 to a Level 2 security.
Prices of fixed-income securities are provided by a pricing service approved by the Fund’s Board of Trustees. Fixed-income securities are valued by a pricing service that values portfolio securities at the mean between the quoted bid and ask prices or the yield equivalent when quotations are readily available. These securities are generally classified as Level 2. Securities for which quotations are not readily available are valued at fair value as determined by the pricing service using methods that may include consideration of the following: yields or prices of investments of comparable quality, type of issue, coupon, maturity and rating, market quotes or indications of value from security dealers, evaluations of anticipated cash flows or collateral, general market conditions and other information and analysis, including the obligor’s credit characteristics considered relevant. The pricing service may employ electronic data processing techniques and/or a matrix system to determine valuations and are generally classified as Level 2. Highly rated zero coupon fixed-income securities, like US Treasury Bills, issued with maturities of one year or less, are valued using the amortized cost method when 60 days or less remain until maturity. With amortized cost, any discount or premium is amortized each day, regardless of the impact of fluctuating rates on the market value of the security. These securities will generally be classified as Level 1 or Level 2.
The value of exchange-traded options are based on the last sale price or, in the absence of such a price, at the mean of the bid and ask prices. Exchange-traded options are generally classified as Level 1.
Temporary investments in securities that have variable rate and demand features qualifying them as short-term investments are valued at amortized cost, which approximates market value. These securities are generally classified as Level 1.
Certain securities may not be able to be priced by the pre-established pricing methods as described above. Such securities may be valued by the Fund’s Board of Trustees or its designee at fair value. These securities generally include, but are not limited to, restricted securities (securities which may not be publicly sold without registration under the Securities Act) for which a pricing service is unable to provide a market price; securities whose trading has been formally suspended; fixed-income securities that have gone into default and for which there is no current market quotation; a security whose market price is not available from a pre-established pricing source; a security with respect to which an event has occurred that is likely to materially affect the value of the security after the market has closed but before the calculation of the Fund’s net asset value (as may be the case in non-U.S. markets on which the security is primarily traded) or make it difficult or impossible to obtain a reliable market quotation; and a security whose price, as provided by the pricing service, is not deemed to reflect the security’s fair value. As a general principle, the fair value of an issue of securities would appear to be the amount that the owner might reasonably expect to receive for them in a current sale. A variety of factors may be considered in determining the fair value of these securities, which may include consideration of the following: yields or
prices of investments of comparable quality, type of issue, coupon, maturity and rating, market quotes or indications of value from security dealers, evaluations of anticipated cash flows or collateral, general market conditions and other information and analysis, including the obligor’s credit characteristics considered relevant. These securities are classified as Level 2 or as Level 3 depending on the priority of the significant inputs. Regardless of the method employed to value a particular security, all valuations are subject to review by the Fund’s Board of Trustees or its designee.
Refer to Footnote 2 – Fair Value Measurements for further details on the leveling of securities held by the Funds as of the end of the reporting period.
Investment Transactions
Investment transactions are recorded on a trade date basis. Realized gains and losses from investment transactions are determined on the specific identification method. Investments purchased on a when-issued/delayed delivery basis may have extended settlement periods. Any investments so purchased are subject to market fluctuation during this period. The Fund has instructed the custodian to segregate assets with a current value at least equal to the amount of the when-issued/delayed delivery purchase commitments. At June 30, 2010, the Fund had no such outstanding purchase commitments.
Investment Income
Dividend income is recorded on the ex-dividend date or, for foreign securities, when information is available. Interest income, which includes the amortization of premiums and accretion of discounts for financial reporting purposes, is recorded on an accrual basis.
Income Taxes
The Fund intends to distribute substantially all of its net investment income and net capital gains to shareholders and to otherwise comply with the requirements of Subchapter M of the Internal Revenue Code applicable to regulated investment companies. Therefore, no federal income tax provision is required.
For all open tax years and all major taxing jurisdictions, management of the Fund has concluded that there are no significant uncertain tax positions that would require recognition in the financial statements. Open tax years are those that are open for examination by taxing authorities (i.e., generally the last four tax year ends and the interim tax period since then). Furthermore, management of the Fund is also not aware of any tax positions for which it is reasonably possible that the total amounts of unrecognized tax benefits will significantly change in the next twelve months.
Dividends and Distributions to Shareholders
Dividends from net investment income are declared and distributed to shareholders quarterly. Dividends from net realized capital gains from investment transactions, if any, are declared and distributed to shareholder at least annually. Furthermore, capital gains are distributed only to the extent they exceed available capital loss carryforwards.
Distributions to shareholders are recorded on the ex-dividend date. The amount and timing of distributions are determined in accordance with federal income tax regulations, which may differ from U.S. GAAP.
Flexible Sales Charge Program
Class A Shares are generally sold with an up-front sales charge and incur a .25% annual 12b-1 service fee. Class A Share purchases of $1 million or more are sold at net asset value without an up-front sales charge but may be subject to a contingent deferred sales charge (“CDSC”) if redeemed within twelve months of purchase. Class C Shares are sold without an up-front sales charge but incur a .75% annual 12b-1 distribution fee and a .25% annual 12b-1 service fee. Class C Shares are subject to a CDSC of 1% if redeemed within one year of purchase. Class R3 Shares are sold without an up-front sales charge but incur a .50% annual 12b-1 distribution and service fee. Class I Shares are not subject to any sales charge or 12b-1 distribution or service fees.
Options Transactions
The Fund is subject to equity price risk in the normal course of pursuing its investment objectives and is authorized to write (sell) call options on securities, in an attempt to manage such risk. When the Fund writes a call option, an amount equal to the net premium received (the premium less commission) is recognized as a component of “Call options written, at value” on the Statement of Assets and Liabilities and is subsequently adjusted to reflect the current value of the written option until the option expires or the Fund enters into a closing purchase transaction. The changes in value of the options written during the reporting period are recognized as “Net unrealized appreciation (depreciation) of call options written” on the Statement of Operations. When a call option expires or the Fund enters into a closing purchase transaction, the difference between the net premium received and any amount paid at expiration or upon executing a closing purchase transaction, including commission, is recognized as “Net realized gain (loss) from call options written” on the Statement of Operations. The Fund, as writer of a call option, has no control over whether the underlying instrument may be sold (called) and as a result bears the risk of an unfavorable change in the market value of the instrument underlying the written option. There is the risk the Fund may not be able to enter into a closing transaction because of an illiquid market.
The average notional amount of call options written during the period September 15, 2009 (commencement of operations) through June 30, 2010, was ($122,325). Refer to Footnote 3 – Derivative Instruments and Hedging Activities for further details on call options written.
Market and Counterparty Credit Risk
In the normal course of business the Fund may invest in financial instruments and enter into financial transactions where risk of potential loss exists due to changes in the market (market risk) or failure of the other party to the transaction to perform (counterparty credit risk). The potential loss could exceed the value of the financial assets recorded on the financial statements. Financial assets,
Notes to Financial Statements (continued)
which potentially expose the Fund to counterparty credit risk, consist principally of cash due from counterparties on forward, option and swap transactions, when applicable. The extent of the Fund’s exposure to counterparty credit risk in respect to these financial assets approximates their carrying value as recorded on the Statement of Assets and Liabilities. Futures contracts, when applicable, expose the Fund to minimal counterparty credit risk as they are exchange traded and the exchange’s clearing house, which is counterparty to all exchange traded futures, guarantees the futures contract against default.
The Fund helps manage counterparty credit risk by entering into agreements only with counterparties Nuveen Asset Management (the “Adviser”), a wholly-owned subsidiary of Nuveen Investments, Inc. (“Nuveen”), believes have the financial resources to honor their obligations and by having the Adviser monitor the financial stability of the counterparties. Additionally, counterparties may be required to pledge collateral daily (based on the daily valuation of the financial asset) on behalf of the Fund with a value approximately equal to the amount of any unrealized gain above a predetermined threshold. Reciprocally, when the Fund has an unrealized loss, the Fund has instructed the custodian to pledge assets of the Fund as collateral with a value approximately equal to the amount of the unrealized loss above a pre-determined threshold. Collateral pledges are monitored and subsequently adjusted if and when the valuations fluctuate, either up or down, by at least the predetermined threshold amount.
Repurchase Agreements
In connection with transactions in repurchase agreements, it is the Fund’s policy that its custodian take possession of the underlying collateral securities, the fair value of which exceeds the principal amount of the repurchase transaction, including accrued interest, at all times. If the seller defaults, and the fair value of the collateral declines, realization of the collateral may be delayed or limited.
Multiclass Operations and Allocations
Income and expenses of the Fund that are not directly attributable to a specific class of shares are prorated among the classes based on the relative net assets of each class. Expenses directly attributable to a class of shares, which presently only include 12b-1 distribution and service fees, are recorded to the specific class.
Realized and unrealized capital gains and losses of the Fund are prorated among the classes based on the relative net assets of each class.
Custodian Fee Credit
The Fund has an arrangement with the custodian bank whereby certain custodian fees and expenses are reduced by net credits earned on the Fund’s cash on deposit with the bank. Such deposit arrangements are an alternative to overnight investments. Credits for cash balances may be offset by charges for any days on which the Fund overdraws its account at the custodian bank.
Indemnifications
Under the Trust’s organizational documents, its officers and trustees are indemnified against certain liabilities arising out of the performance of their duties to the Trust. In addition, in the normal course of business, the Trust enters into contracts that provide general indemnifications to other parties. The Trust’s maximum exposure under these arrangements is unknown as this would involve future claims that may be made against the Trust that have not yet occurred. However, the Trust has not had prior claims or losses pursuant to these contracts and expects the risk of loss to be remote.
Use of Estimates
The preparation of financial statements in conformity with U.S. GAAP requires management to make estimates and assumptions that affect the reported amounts of assets and liabilities at the date of the financial statements and the reported amounts of increases and decreases in net assets from operations during the reporting period. Actual results may differ from those estimates.
2. Fair Value Measurements
In determining the value of the Fund’s investments, various inputs are used. These inputs are summarized in the three broad levels listed below:
| | |
| Level 1 – | | Quoted prices in active markets for identical securities. |
| Level 2 – | | Other significant observable inputs (including quoted prices for similar securities, interest rates, prepayment speeds, credit risk, etc.). |
| Level 3 – | | Significant unobservable inputs (including management’s assumptions in determining the fair value of investments). |
The inputs or methodologies used for valuing securities are not an indication of the risk associated with investing in those securities. The following is a summary of the Fund’s fair value measurements as of June 30, 2010:
| | | | | | | | | | | | | | |
| | | Level 1 | | | Level 2 | | Level 3 | | Total | |
Investments: | | | | | | | | | | | | | | |
Common Stocks | | $ | 958,663 | | | $ | — | | $ | — | | $ | 958,663 | |
Corporate Bonds | | | — | | | | 40,001 | | | — | | | 40,001 | |
Derivatives: | | | | | | | | | | | | | | |
Call Options Written | | | (4,375 | ) | | | — | | | — | | | (4,375 | ) |
Total | | $ | 954,288 | | | $ | 40,001 | | $ | — | | $ | 994,289 | |
3. Derivative Instruments and Hedging Activities
The Fund records derivative instruments at fair value, with changes in fair value recognized on the Statement of Operations, when applicable. Even though the Fund’s investments in derivatives may represent economic hedges, they are not considered to be hedge transactions for financial reporting purposes. For additional information on the derivative instruments in which the Fund was invested during and at the end of the reporting period, refer to the Portfolio of Investments, Financial Statements and Footnote 1 – General Information and Significant Accounting Policies.
The following table presents the fair value of all derivative instruments held by the Fund as of June 30, 2010, the location of these instruments on the Statement of Assets and Liabilities, and the primary underlying risk exposure.
| | | | | | | | | | | | |
| | | | | Location on the Statement of Assets and Liabilities |
| | | | | Asset Derivatives | | Liability Derivatives |
Underlying Risk Exposure | | Derivative Instrument | | Location | | Value | | Location | | Value |
Equity Price | | Options | �� | — | | $ | — | | Call options written, at value | | $ | 4,375 |
The following tables present the amount of net realized gain (loss) and net unrealized appreciation (depreciation) recognized for the period September 15, 2009 (commencement of operations) through June 30, 2010, on derivative instruments, as well as the primary risk exposure associated with each.
| | | |
| Net Realized Gain (Loss) from Call Options Written | | |
Risk Exposure | | | |
Equity Price | | $ | 22,704 |
| |
| Net Unrealized Appreciation (Depreciation) of Call Options Written | | |
Risk Exposure | | | |
Equity Price | | $ | 205 |
4. Fund Shares
Transactions in Fund shares were as follows:
| | | | | |
| | | For the period
September 15, 2009
(commencement of
operations) through
June 30, 2010 |
| | | Shares | | Amount |
Shares sold: | | | | | |
Class A | | 12,500 | | $ | 250,000 |
Class C | | 12,500 | | | 250,000 |
Class R3 | | 12,500 | | | 250,000 |
Class I | | 12,500 | | | 250,000 |
Net increase (decrease) | | 50,000 | | $ | 1,000,000 |
5. Investment Transactions
Purchases and sales (excluding call options written) during the period September 15, 2009 (commencement of operations) through June 30, 2010, aggregated $1,271,169 and $240,327, respectively.
Transactions in call options written during the period September 15, 2009 (commencement of operations) through June 30, 2010, were as follows:
| | | | | | | |
| | | Number of
Contracts | | | Premiums
Received | |
Outstanding, beginning of period | | — | | | $ | — | |
Call options written | | 157 | | | | 28,695 | |
Call options terminated in closing purchase transactions | | (42 | ) | | | (9,974 | ) |
Call options exercised | | (12 | ) | | | (4,542 | ) |
Call options expired | | (55 | ) | | | (9,599 | ) |
Outstanding, end of period | | 48 | | | $ | 4,580 | |
Notes to Financial Statements (continued)
6. Income Tax Information
The following information is presented on an income tax basis. Differences between amounts for financial statement and federal income tax purposes are primarily due to timing differences in recognizing certain gains and losses on investment transactions. To the extent that differences arise that are permanent in nature, such amounts are reclassified within the capital accounts as detailed below. Temporary differences do not require reclassification. Temporary and permanent differences do not impact the net asset values of the Fund.
At June 30, 2010, the cost and unrealized appreciation (depreciation) of investments (excluding investments in derivatives), as determined on a federal income tax basis, were as follows:
| | | | |
Cost of investments | | $ | 1,050,230 | |
Gross unrealized: | | | | |
Appreciation | | $ | 34,357 | |
Depreciation | | | (85,923 | ) |
Net unrealized appreciation (depreciation) of investments | | $ | (51,566 | ) |
Permanent differences, primarily due to federal taxes paid and nondeductible stock issuance costs, resulted in reclassifications among the Fund’s components of net assets at June 30, 2010, the Fund’s tax year-end, as follows:
| | | | |
Capital paid-in | | $ | (1,259 | ) |
Undistributed (Over-distribution of) net investment income | | | 1,078 | |
Accumulated net realized gain (loss) | | | 181 | |
The tax components of undistributed net ordinary income and net long-term capital gains at June 30, 2010, the Fund’s tax year end, were as follows:
| | | |
Undistributed net ordinary income* | | $ | 47,945 |
Undistributed net long-term capital gains | | | — |
| * | Net ordinary income consists of net taxable income derived from dividends, interest, and net short-term capital gains, if any. |
The tax character of distributions paid during the Fund’s tax year ended June 30, 2010, was designated for purposes of the dividends paid deduction as follows:
| | | |
| For the period September 15, 2009 (commencement of operations) through June 30, 2010 | | |
Distributions from net ordinary income* | | $ | 8,371 |
Distributions from net long-term capital gains | | | — |
| * | Net ordinary income consists of net taxable income derived from dividends, interest, and net short-term capital gains, if any. |
7. Management Fees and Other Transactions with Affiliates
The Fund’s management fee is separated into two components – a fund-level fee, based only on the amount of assets within the Fund, and a complex-level fee, based on the aggregate amount of all fund assets managed by the Adviser. This pricing structure enables Fund shareholders to benefit from growth in the assets within the Fund as well as from growth in the amount of complex-wide assets managed by the Adviser.
The annual fund-level fee, payable monthly, is calculated according to the following schedule:
| | | |
| Average Daily Net Assets | | Fund-Level Fee | |
For the first $125 million | | 0.5500 | % |
For the next $125 million | | 0.5375 | |
For the next $250 million | | 0.5250 | |
For the next $500 million | | 0.5125 | |
For the next $1 billion | | 0.5000 | |
For net assets over $2 billion | | 0.4750 | |
Effective July 1, 2010, the Fund’s management fee has been lowered as follows:
| | | |
| Average Daily Net Assets | | Fund-Level Fee | |
For the first $125 million | | 0.5000 | % |
For the next $125 million | | 0.4875 | |
For the next $250 million | | 0.4750 | |
For the next $500 million | | 0.4625 | |
For the next $1 billion | | 0.4500 | |
For net assets over $2 billion | | 0.4250 | |
The annual complex-level fee, payable monthly, is calculated according to the following schedule:
| | | |
| Complex-Level Managed Asset Breakpoint Level* | | Effective Rate at Breakpoint Level | |
$55 billion | | .2000 | % |
$56 billion | | .1996 | |
$57 billion | | .1989 | |
$60 billion | | .1961 | |
$63 billion | | .1931 | |
$66 billion | | .1900 | |
$71 billion | | .1851 | |
$76 billion | | .1806 | |
$80 billion | | .1773 | |
$91 billion | | .1691 | |
$125 billion | | .1599 | |
$200 billion | | .1505 | |
$250 billion | | .1469 | |
$300 billion | | .1445 | |
| * | The complex-level fee is calculated based upon the aggregate daily managed assets of all Nuveen funds, with such daily managed assets defined separately for each fund in its management agreement, but excluding assets attributable to investments in other Nuveen funds. Daily managed assets include closed-end fund assets managed by the Adviser that are attributable to financial leverage. For these purposes, financial leverage includes the funds’ use of preferred stock and borrowings and certain investments in the residual interest certificates (also called inverse floating rate securities) in tender option bond (TOB) trusts, including the portion of assets held by a TOB trust that has been effectively financed by the trust’s issuance of floating rate securities, subject to an agreement by the Adviser to limit the amount of such assets for determining managed assets in certain circumstances. As of June 30, 2010, the complex-level fee rate was .1857%. |
The management fee compensates the Adviser for overall investment advisory and administrative services and general office facilities. The Adviser has entered into a Sub-Advisory Agreement with NWQ Investment Management Company, LLC (“NWQ”), a subsidiary of Nuveen, under which NWQ manages the investment portfolio of the Fund. NWQ is compensated for its services to the Fund from the management fee paid to the Adviser.
The Adviser has agreed to waive fees and reimburse expenses through October 31, 2012, so that total annual Fund operating expenses (excluding 12b-1 distribution and service fees, interest expenses, taxes, fees incurred in acquiring and disposing of portfolio securities and extraordinary expenses) do not exceed .90% (1.15% after October 31, 2012) of the average daily net assets of any class of Fund shares. The Adviser may also voluntarily reimburse additional expenses from time to time. Voluntary reimbursements may be terminated at any time at the Adviser’s discretion.
The Trust pays no compensation directly to those of its trustees who are affiliated with the Adviser or to its officers, all of whom receive remuneration for their services to the Trust from the Adviser or its affiliates. The Board of Trustees has adopted a deferred compensation plan for independent trustees that enables trustees to elect to defer receipt of all or a portion of the annual compensation they are entitled to receive from certain Nuveen advised funds. Under the plan, deferred amounts are treated as though equal dollar amounts had been invested in shares of select Nuveen advised funds.
At June 30, 2010, Nuveen owned shares of the Fund as follows:
| | |
Class A | | 12,500 |
Class C | | 12,500 |
Class R3 | | 12,500 |
Class I | | 12,500 |
8. New Accounting Standards
Fair Value Measurements
On January 21, 2010, FASB issued changes to the authoritative guidance under U.S. GAAP for fair value measurements. The objective of which is to provide guidance on how investment assets and liabilities are to be valued and disclosed. Specifically, the amendment requires reporting entities disclose Level 3 activity for purchases, sales, issuances and settlements in the Level 3 roll-forward on a gross basis rather than as one net number. The effective date of the amendment is for interim and annual periods beginning after December 15, 2010. At this time, management is evaluating the implications of this guidance and the impact it will have to the financial statement amounts and footnote disclosures, if any.
Financial Highlights
| | | | | | | | | | | | | | | | | | | | | | | | | | | | | | | |
| Selected data for a share outstanding throughout the period: | |
| | | | | | | |
| Class (Commencement Date) | | | | | | | | | | | | | | | | | | | |
| | | | |
| | | | | Investment Operations | | | Less Distributions | | | | |
| | | | | | | | | | | | | | | | | | | | | | | | |
Year Ended
June 30, | | Beginning
Net
Asset
Value | | Net
Invest-
ment
Income(a) | | Net
Realized/
Unrealized
Gain
(Loss) | | | Total | | | Net
Invest-
ment
Income | | | Capital
Gains | | Total | | | Ending
Net
Asset
Value | | Total
Return(b) | |
Class A (9/09) | | | | | | | | | | | | | | | | | | | | | | | | | | | | | | | |
2010(d) | | $ | 20.00 | | $ | .30 | | $ | (.19 | ) | | $ | .11 | | | $ | (.30 | ) | | $ | — | | $ | (.30 | ) | | $ | 19.81 | | .48 | % |
Class C (9/09) | | | | | | | | | | | | | | | | | | | | | | | | | | | | | | | |
2010(d) | | | 20.00 | | | .18 | | | (.20 | ) | | | (.02 | ) | | | (.18 | ) | | | — | | | (.18 | ) | | | 19.80 | | (.14 | ) |
Class R3 (9/09) | | | | | | | | | | | | | | | | | | | | | | | | | | | | | | | |
2010(d) | | | 20.00 | | | .26 | | | (.20 | ) | | | .06 | | | | (.26 | ) | | | — | | | (.26 | ) | | | 19.80 | | .24 | |
Class I (9/09) | | | | | | | | | | | | | | | | | | | | | | | | | | | | | | | |
2010(d) | | | 20.00 | | | .35 | | | (.20 | ) | | | .15 | | | | (.34 | ) | | | — | | | (.34 | ) | | | 19.81 | | .67 | |
| | | | | | | | | | | | | | | | |
|
Ratios/Supplemental Data | |
| | | Ratios to Average
Net Assets Before
Reimbursement | | | Ratios to Average
Net Assets After
Reimbursement(c) | | | | |
Ending
Net
Assets
(000) | | Expenses | | | Net
Invest-
ment
Income
(Loss) | | | Expenses | | | Net
Invest-
ment
Income
(Loss) | | | Portfolio
Turnover
Rate | |
| | | | | | | | | | | | | | | | |
| $ | 248 | | 3.79 | %* | | (.82 | )%* | | 1.14 | %* | | 1.83 | %* | | 24 | % |
| | | | | | | | | | | | | | | | |
| | 248 | | 4.54 | * | | (1.57 | )* | | 1.89 | * | | 1.08 | * | | 24 | |
| | | | | | | | | | | | | | | | |
| | 248 | | 4.04 | * | | (1.07 | )* | | 1.39 | * | | 1.58 | * | | 24 | |
| | | | | | | | | | | | | | | | |
| | 248 | | 3.54 | * | | (.57 | )* | | .89 | * | | 2.08 | * | | 24 | |
| (a) | Per share Net Investment Income is calculated using the average daily shares method. |
| (b) | Total return is the combination of changes in net asset value without any sales charge, reinvested dividend income at net asset value and reinvested capital gains distributions at net asset value, if any. Total returns are not annualized. |
| (c) | After expense reimbursement from the Adviser, where applicable. Ratios do not reflect the effect of custodian credits earned on the Fund’s net cash on deposit with the custodian bank, where applicable. |
| (d) | For the period September 15, 2009 (commencement of operations) through June 30, 2010. |
See accompanying notes to financial statements.
Trustees and Officers
The management of the Funds, including general supervision of the duties performed for the Funds by the Adviser, is the responsibility of the Board of Trustees of the Funds. The number of trustees of the Funds is currently set at nine. None of the trustees who are not “interested” persons of the Funds (referred to herein as “independent trustees”) has ever been a director or employee of, or consultant to, Nuveen or its affiliates. The names and business addresses of the trustees and officers of the Funds, their principal occupations and other affiliations during the past five years, the number of portfolios each oversees and other directorships they hold are set forth below.
The Funds’ Statement of Additional Information (“SAI”) includes more information about the trustees. To request a free copy, call Nuveen Investments at (800) 257-8787 or visit the Funds’ website at www.nuveen.com.
| | | | | | | | |
Name, Birthdate and Address | | Position(s) Held with the Funds | | Year First Elected or Appointed (1) | | Principal Occupation(s) Including other Directorships During Past 5 Years | | Number of Portfolios in Fund Complex Overseen by Trustee |
| | |
| Independent Trustees: | | | | |
Robert P. Bremner (2) 8/22/40 333 W. Wacker Drive Chicago, IL 60606 | | Chairman of the Board and Trustee | | 1996 | | Private Investor and Management Consultant; Treasurer and Director, Humanities Council of Washington, D.C. | | 200 |
Jack B. Evans 10/22/48 333 W. Wacker Drive Chicago, IL 60606 | | Trustee | | 1999 | | President, The Hall-Perrine Foundation, a private philanthropic corporation (since 1996); Director and Chairman, United Fire Group, a publicly held company; President Pro Tem of the Board of Regents for the State of Iowa University System; Director, Gazette Companies; Life Trustee of Coe College and the Iowa College Foundation; formerly, Director, Alliant Energy; formerly, Director, Federal Reserve Bank of Chicago; formerly, President and Chief Operating Officer, SCI Financial Group, Inc., a regional financial services firm. | | 200 |
William C. Hunter 3/6/48 333 W. Wacker Drive Chicago, IL 60606 | | Trustee | | 2004 | | Dean, Tippie College of Business, University of Iowa (since 2006); Director (since 2004) of Xerox Corporation; Director (since 2005), Beta Gamma Sigma International Honor Society; formerly, Dean and Distinguished Professor of Finance, School of Business at the University of Connecticut (2003-2006); previously, Senior Vice President and Director of Research at the Federal Reserve Bank of Chicago (1995-2003); Director, SS&C Technologies, Inc. (May 2005-October 2005); formerly, Director (1997-2007), Credit Research Center at George Washington University. | | 200 |
David J. Kundert (2) 10/28/42 333 W. Wacker Drive Chicago, IL 60606 | | Trustee | | 2005 | | Director, Northwestern Mutual Wealth Management Company; retired (since 2004) as Chairman, JPMorgan Fleming Asset Management, President and CEO, Banc One Investment Advisors Corporation, and President, One Group Mutual Funds; prior thereto, Executive Vice President, Banc One Corporation and Chairman and CEO, Banc One Investment Management Group; Member, Board of Regents, Luther College; member of the Wisconsin Bar Association; member of Board of Directors, Friends of Boerner Botanical Gardens; member of Board of Directors and Chair of Investment Committee, Greater Milwaukee Foundation. | | 200 |
William J. Schneider (2) 9/24/44 333 W. Wacker Drive Chicago, IL 60606 | | Trustee | | 1997 | | Chairman of Miller-Valentine Partners Ltd., a real estate investment company; formerly, Senior Partner and Chief Operating Officer (retired, 2004) of Miller-Valentine Group; member, University of Dayton Business School Advisory Council; member, Mid-America Health System Board; formerly, member and Chair, Dayton Philharmonic Orchestra Association; formerly, member, Business Advisory Council, Cleveland Federal Reserve Bank. | | 200 |
Judith M. Stockdale 12/29/47 333 W. Wacker Drive Chicago, IL 60606 | | Trustee | | 1997 | | Executive Director, Gaylord and Dorothy Donnelley Foundation (since 1994); prior thereto, Executive Director, Great Lakes Protection Fund (1990-1994). | | 200 |
Carole E. Stone (2) 6/28/47 333 W. Wacker Drive Chicago, IL 60606 | | Trustee | | 2007 | | Director, Chicago Board Options Exchange (since 2006); Director, C2 Options Exchange, Incorporated (since 2009); Commissioner, New York State Commission on Public Authority Reform (since 2005); formerly, Chair, New York Racing Association Oversight Board (2005-2007). | | 200 |
| | | | | | | | |
Name, Birthdate and Address | | Position(s) Held with the Funds | | Year First Elected or Appointed (1) | | Principal Occupation(s) Including other Directorships During Past 5 Years | | Number of Portfolios in Fund Complex Overseen by Trustee |
Terence J. Toth (2) 9/29/59 333 W. Wacker Drive Chicago, IL 60606 | | Trustee | | 2008 | | Director, Legal & General Investment Management America, Inc. (since 2008); Managing Partner, Promus Capital (since 2008); formerly, CEO and President, Northern Trust Global Investments (2004-2007); Executive Vice President, Quantitative Management & Securities Lending (2000-2004); prior thereto, various positions with Northern Trust Company (since 1994); member: Goodman Theatre Board (since 2004); Chicago Fellowship Board (since 2005), University of Illinois Leadership Council Board (since 2007) and Catalyst Schools of Chicago Board (since 2008); formerly, member: Northern Trust Mutual Funds Board (2005-2007), Northern Trust Global Investments Board (2004-2007), Northern Trust Japan Board (2004-2007), Northern Trust Securities Inc. Board (2003-2007) and Northern Trust Hong Kong Board (1997-2004). | | 200 |
| | |
| Interested Trustee: | | | | |
John P. Amboian (3) 6/14/61 333 W. Wacker Drive Chicago, IL 60606 | | Trustee | | 2008 | | Chief Executive Officer (since July 2007), Director (since 1999) and Chairman (since 2007) of Nuveen Investments, Inc.; Chief Executive Officer (since 2007) of Nuveen Asset Management, Nuveen Investments Advisors, Inc.; President (since 2005) of Nuveen Commodities Asset Management, LLC. | | 200 |
Name, Birthdate and Address | | Position(s) Held with the Funds | | Year First Elected or Appointed (4) | | Principal Occupation(s) During Past 5 Years | | Number of Portfolios in Fund Complex Overseen by Officer |
| | |
| Officers of the Funds: | | | | |
Gifford R. Zimmerman 9/9/56 333 W. Wacker Drive Chicago, IL 60606 | | Chief Administrative Officer | | 1988 | | Managing Director (since 2002), Assistant Secretary and Associate General Counsel of Nuveen Investments, LLC; Managing Director, Associate General Counsel and Assistant Secretary, of Nuveen Asset Management (since 2002) and of Symphony Asset Management LLC (since 2003); Vice President and Assistant Secretary of NWQ Investment Management Company, LLC. (since 2002), Nuveen Investments Advisers Inc. (since 2002), Tradewinds Global Investors, LLC, and Santa Barbara Asset Management, LLC (since 2006), Nuveen HydePark Group LLC and Nuveen Investment Solutions, Inc. (since 2007); Managing Director (since 2004) and Assistant Secretary (since 1994) of Nuveen Investments, Inc.; Managing Director (since 2005) of Nuveen Commodities Asset Management, LLC; Chartered Financial Analyst. | | 200 |
Nizida Arriaga 6/1/68 333 W. Wacker Drive Chicago, IL 60606 | | Vice President | | 2009 | | Senior Vice President of Nuveen Investments, LLC (since 2010); formerly, Vice President (2007-2010); previously, Portfolio Manager, Allstate Investments, LLC (1996-2006); Chartered Financial Analyst. | | 200 |
Michael T. Atkinson 2/3/66 333 W. Wacker Drive Chicago, IL 60606 | | Vice President and Assistant Secretary | | 2000 | | Vice President (since 2002) of Nuveen Investments, LLC; Vice President of Nuveen Asset Management (since 2005). | | 200 |
Margo L. Cook 4/11/64 333 W. Wacker Drive Chicago, IL 60606 | | Vice President | | 2009 | | Executive Vice President (since Oct 2008) of Nuveen Investments, Inc.; previously, Head of Institutional Asset Management (2007-2008) of Bear Stearns Asset Management; Head of Institutional Asset Mgt (1986-2007) of Bank of NY Mellon; Chartered Financial Analyst. | | 200 |
Alan A. Brown 8/1/62 333 W. Wacker Drive Chicago, IL 60606 | | Vice President | | 2007 | | Executive Vice President, Global Client Private Group (since 2007); Executive Vice President, Mutual Funds, Nuveen Investments, LLC, (since 2005), previously, Managing Director and Chief Marketing Officer (2001-2005). | | 75 |
Trustees and Officers (continued)
| | | | | | | | |
Name, Birthdate and Address | | Position(s) Held with the Funds | | Year First Elected or Appointed (4) | | Principal Occupation(s) Including other Directorships During Past 5 Years | | Number of Portfolios in Fund Complex Overseen by Officer |
Lorna C. Ferguson 10/24/45 333 W. Wacker Drive Chicago, IL 60606 | | Vice President | | 1998 | | Managing Director (since 2004) of Nuveen Investments, LLC and Managing Director (since 2005) of Nuveen Asset Management. | | 200 |
Stephen D. Foy 5/31/54 333 W. Wacker Drive Chicago, IL 60606 | | Vice President and Controller | | 1998 | | Senior Vice President (since 2010), formerly, Vice President (1993-2010) and Funds Controller (since 1998) of Nuveen Investments, LLC; Vice President (2005-2010) of Nuveen Asset Management; Certified Public Accountant. | | 200 |
Scott S. Grace 8/20/70 333 W. Wacker Drive Chicago, IL 60606 | | Vice President and Treasurer | | 2009 | | Managing Director, Corporate Finance & Development, Treasurer (since 2009) of Nuveen Investments, LLC; Managing Director and Treasurer of Nuveen Asset Management (since 2009); formerly, Treasurer (2006-2009), Senior Vice President (2008-2009), previously, Vice President (2006-2008) of Janus Capital Group, Inc.; formerly, Senior Associate in Morgan Stanley’s Global Financial Services Group (2000-2003); Chartered Accountant Designation. | | 200 |
William T. Huffman 5/7/1969 333 W. Wacker Drive Chicago, IL 60606 | | Vice President | | 2009 | | Chief Operating Officer, Municipal Fixed Income (since 2008) of Nuveen Asset Management; previously, Chairman, President and Chief Executive Officer (2002 – 2007) of Northern Trust Global Advisors, Inc. and Chief Executive Officer (2007) of Northern Trust Global Investments Limited; Certified Public Accountant. | | 136 |
Walter M. Kelly 2/24/70 333 W. Wacker Drive Chicago, IL 60606 | | Chief Compliance Officer and Vice President | | 2003 | | Senior Vice President (since 2008), Vice President (2006-2008) formerly, Assistant Vice President and Assistant General Counsel (2003-2006) of Nuveen Investments, LLC; Senior Vice President (since 2008), formerly, Vice President (2006-2008) and Assistant Secretary (since 2003) of Nuveen Asset Management. | | 200 |
David J. Lamb 3/22/63 333 W. Wacker Drive Chicago, IL 60606 | | Vice President | | 2000 | | Senior Vice President (since 2009), formerly, Vice President (2000-2009) of Nuveen Investments, LLC; Vice President (since 2005) of Nuveen Asset Management, Certified Public Accountant. | | 200 |
Tina M. Lazar 8/27/61 333 W. Wacker Drive Chicago, IL 60606 | | Vice President | | 2002 | | Senior Vice President (since 2009), formerly, Vice President of Nuveen Investments, LLC (1999-2009); Vice President of Nuveen Asset Management (since 2005). | | 200 |
Larry W. Martin 7/27/51 333 W. Wacker Drive Chicago, IL 60606 | | Vice President and Assistant Secretary | | 1988 | | Senior Vice President (since 2010), formerly, Vice President (1993-2010), Assistant Secretary and Assistant General Counsel of Nuveen Investments, LLC; Vice President (since 2005) and Assistant Secretary of Nuveen Investments, Inc.; Vice President (since 2005) and Assistant Secretary (since 1997) of Nuveen Asset Management Vice President and Assistant Secretary of Nuveen Investments Advisers Inc. (since 2002), NWQ Investment Management Company, LLC (since 2002), Symphony Asset Management LLC (since 2003), Tradewinds Global Investors, LLC, Santa Barbara Asset Management, LLC (since 2006) and of Nuveen HydePark Group, LLC and Nuveen Investment Solutions, Inc. (since 2007). | | 200 |
Kevin J. McCarthy 3/26/66 333 W. Wacker Drive Chicago, IL 60606 | | Vice President and Secretary | | 2007 | | Managing Director (since 2008), formerly, Vice President (2007-2008), Nuveen Investments, LLC; Managing Director (since 2008), formerly, Vice President and Assistant Secretary, Nuveen Asset Management and Nuveen Investments Holdings, Inc.; Vice President (since 2007) and Assistant Secretary, Nuveen Investment Advisers Inc., NWQ Investment Management Company, LLC, Tradewinds Global Investors LLC, NWQ Holdings, LLC, Symphony Asset Management LLC, Santa Barbara Asset Management LLC, Nuveen HydePark Group, LLC and Nuveen Investment Solutions, Inc. (since 2007); prior thereto, Partner, Bell, Boyd & Lloyd LLP (1997-2007). | | 200 |
| | | | | | | | |
Name, Birthdate and Address | | Position(s) Held with the Funds | | Year First Elected or Appointed (4) | | Principal Occupation(s) Including other Directorships During Past 5 Years | | Number of Portfolios in Fund Complex Overseen by Officer |
Michelle A. McCarthy 7/6/65 333 West Wacker Drive Chicago, IL 60606 | | Vice President | | 2010 | | Managing Director, Director of Risk Management (since May, 2010), Nuveen Investments, LLC; formerly, Chief Risk Officer (2009-2010) of Russell Investment Group; formerly, SVP (2003-2009), Chief Market & Operational Risk Officer (2006-2009), Washington Mutual Bank. | | 200 |
John V. Miller 4/10/67 333 W. Wacker Drive Chicago, IL 60606 | | Vice President | | 2007 | | Chief Investment Officer and Managing Director (since 2007), formerly, Vice President (2002-2007) of Nuveen Asset Management and Managing Director (since 2007), formerly, Vice President (2002-2007) Nuveen Investments, LLC; Chartered Financial Analyst. | | 136 |
Gregory T. Mino 1/4/71 333 W. Wacker Drive Chicago, IL 60606 | | Vice President | | 2009 | | Senior Vice President (since 2010) of Nuveen Investments, LLC, formerly, Vice President (2008-2010); previously, Director (2004-2007) and Executive Director (2007-2008) of UBS Global Asset Management; previously, Vice President (2000-2003) and Director (2003-2004) of Merrill Lynch Investment Managers; Chartered Financial Analyst. | | 200 |
Christopher M. Rohrbacher 8/1/71 333 W. Wacker Drive Chicago, IL 60606 | | Vice President and Assistant Secretary | | 2008 | | Vice President, Nuveen Investments, LLC (since 2008); Vice President and Assistant Secretary, Nuveen Asset Management (since 2008); prior thereto, Associate, Skadden, Arps, Slate, Meagher & Flom LLP (2002-2008) | | 200 |
James F. Ruane 7/3/62 333 W. Wacker Drive Chicago, IL 60606 | | Vice President and Assistant Secretary | | 2007 | | Vice President, Nuveen Investments (since 2007); prior thereto, Partner, Deloitte & Touche USA LLP (2005-2007), formerly, senior tax manager (2002-2005); Certified Public Accountant. | | 200 |
John S. White 5/12/67 333 W. Wacker Drive Chicago, IL 60606 | | Vice President | | 2007 | | Senior Vice President (since 2009), formerly, Vice President (2006-2009) of Nuveen Investments, LLC, formerly, Assistant Vice President (since 2002); Lieutenant Colonel (since 2007), United States Marine Corps Reserve, formerly, Major (since 2001). | | 75 |
Mark L. Winget 12/21/68 333 W. Wacker Drive Chicago, IL 60606 | | Vice President and Assistant Secretary | | 2008 | | Vice President, Nuveen Investments, LLC (since 2008); Vice President and Assistant Secretary, Nuveen Asset Management (since 2008); prior thereto, Counsel, Vedder Price P.C. (1997-2007). | | 200 |
| (1) | Trustees serve an indefinite term until his/her successor is elected or appointed. The year first elected or appointed represents the year in which the trustee was first elected or appointed to any fund in the Nuveen Fund Complex. |
| (2) | Also serves as a trustee of the Nuveen Diversified Commodity Fund, a Nuveen-sponsored commodity pool that has filed a registration statement on Form S-1 with the SEC for a proposed initial public offering. The S-1 has not been declared effective, and the commodity pool has not commenced operations. |
| (3) | Mr. Amboian is an interested trustee because of his position with Nuveen Investments, Inc. and certain of its subsidiaries, which are affiliates of the Nuveen Funds. |
| (4) | Officers serve one year terms through August of each year. The year first elected or appointed represents the year in which the officer was first elected or appointed to any fund in the Nuveen Fund Complex. |
Annual Investment Management Agreement Approval Process
The Board of Trustees of the Fund (the “Board,” and each Trustee, a “Board Member”) is responsible for approving advisory arrangements and, at a meeting held on July 28-29, 2009 (the “Meeting”), was asked to approve the advisory arrangements on behalf of the Fund. At the Meeting, the Board Members, including the Board Members who are not parties to the advisory agreements or “interested persons” of any parties (“Independent Board Members”), approved the investment management agreement (the “Investment Management Agreement”) between the Fund and Nuveen Asset Management (“NAM”) and the investment sub-advisory agreement (the “Sub-Advisory Agreement”) between NAM and NWQ Investment Management Company, LLC (the “Sub-Adviser”), on behalf of the Fund. The Sub-Adviser and NAM are each hereafter a “Fund Adviser.” The Investment Management Agreement and the Sub-Advisory Agreement are each hereafter an “Advisory Agreement.”
To assist the Board in its evaluation of an Advisory Agreement with a Fund Adviser at the Meeting, the Independent Board Members had received, in adequate time in advance of the Meeting or at prior meetings, materials which outlined, among other things:
| | • | | the nature, extent and quality of services expected to be provided by the Fund Adviser; |
| | • | | the organization of the Fund Adviser, including the responsibilities of various departments and key personnel; |
| | • | | the expertise and background of the Fund Adviser with respect to the Fund’s investment strategy; |
| | • | | certain performance-related information (as described below); |
| | • | | the profitability of Nuveen Investments, Inc. (“Nuveen”) (which incorporated Nuveen’s wholly-owned affiliated sub-advisers other than Winslow Capital Management, Inc. (“Winslow Capital”) which was acquired in December 2008); |
| | • | | the proposed management fees of the Fund Adviser, including comparisons of such fees with the management fees of comparable funds; |
| | • | | the expected expenses of the Fund, including comparisons of the Fund’s expected expense ratio with the expense ratios of comparable funds; and |
| | • | | the soft dollar practices of the Fund Adviser, if any. |
At the Meeting, NAM made a presentation to and responded to questions from the Board. During the Meeting, the Independent Board Members also met privately with their legal counsel to review the Board’s duties under the Investment Company Act of 1940 (the “1940 Act”), the general principles of state law in reviewing and approving advisory contracts, the standards used by courts in determining whether investment company boards of directors have fulfilled their duties, factors to be considered in voting on advisory contracts and an adviser’s fiduciary duty with respect to advisory agreements and compensation. It is with this background that the Independent Board Members considered the Advisory Agreements with the Fund Advisers for the Fund. As outlined in more detail below, the Independent Board Members considered all factors they believed relevant with respect to the Fund, including the following: (a) the nature, extent and quality of the services to be provided by the Fund Adviser; (b) investment performance, as described below; (c) the profitability of Nuveen and its affiliates; (d) the extent to which economies of scale would be realized; and (e) whether fee levels reflect these economies of scale for the benefit of Fund investors.
A. Nature, Extent and Quality of Services
The Independent Board Members considered the nature, extent and quality of the respective Fund Adviser’s services, including advisory services and administrative services. As NAM and the Sub-Adviser already serve as adviser and sub-adviser, respectively, to other Nuveen funds overseen by the Board Members, the Board has a good understanding of each such Fund Adviser’s organization, operations and personnel. As the Independent Board Members meet regularly throughout the year to oversee the Nuveen funds, including funds currently advised by the Fund Advisers, the Independent Board Members have relied upon their knowledge from their meetings and any other interactions throughout the year of the respective Fund Adviser and its services in evaluating the Advisory Agreements.
At the Meeting and at prior meetings, the Independent Board Members reviewed materials outlining, among other things, the respective Fund Adviser’s organization and business; the types of services that such Fund Adviser or its affiliates provide to the Nuveen funds and are expected to provide to the Fund; and the experience of the respective Fund Adviser with applicable investment strategies. Further, the Independent Board Members have evaluated the background, experience and track record of the Fund Adviser’s investment personnel.
In addition to advisory services, the Independent Board Members considered the quality of any administrative or non-advisory services to be provided. In this regard, NAM is expected to provide the Fund with such administrative and other services (exclusive of, and in addition to, any such services provided by others for the Fund) and officers and other personnel as are necessary for the operations of the Fund. In addition to investment management services, NAM and its affiliates will provide the Fund with a wide range of services, including, among other things, product management, fund administration, oversight of service providers, shareholder services, administration of Board relations, regulatory and portfolio compliance and legal support. The Independent Board Members also recognized that NAM would oversee the Sub-Adviser.
In evaluating the services of the Sub-Adviser, the Independent Board Members noted that the Sub-Advisory Agreement was essentially an agreement for portfolio management services only and the Sub-Adviser was not expected to supply other significant administrative services to the Fund.
Based on their review, the Independent Board Members found that, overall, the nature, extent and quality of services expected to be provided to the Fund under each Advisory Agreement were satisfactory.
B. Investment Performance
The Fund is new and therefore does not have its own performance history. However, the Independent Board Members are familiar with each Fund Adviser’s performance record on other Nuveen funds. The Sub-Adviser is expected to apply research techniques similar to those applied with respect to the NWQ Large-Cap Value strategy, which draws on a universe of stocks similar to those anticipated for the Fund. In this regard, the Independent Board Members were provided with certain performance information pertaining to such strategy, including returns for such strategy and its benchmark for the year-to-date, one-year, three-year, five-year and ten-year periods through May 2009.
C. Fees, Expenses and Profitability
1. Fees and Expenses
In evaluating the management fees and expenses that the Fund was expected to bear, the Independent Board Members considered, among other things, the Fund’s proposed management fee structure and its expected expense ratios in absolute terms as well as compared with the fees and expense ratios of comparable, unaffiliated funds and comparable, affiliated fund(s), if any. The Independent Board Members also considered the Fund’s proposed sub-advisory arrangement. In addition, the Independent Board Members considered the fund-level breakpoint schedule and the complex-wide breakpoint schedule (described in further detail below) and any applicable fee waivers and expense reimbursements expected to be provided. Based on their review of the fee and expense information provided, the Independent Board Members determined that the Fund’s management fees and net total expense ratio were reasonable in light of the nature, extent and quality of services to be provided to the Fund.
2. Comparisons with the Fees of Other Clients
Due to their experience with other Nuveen funds, the Board Members were familiar with the fees NAM assesses to other clients. Such other clients include separately managed accounts (both retail and institutional accounts) and funds that are not offered by Nuveen but are sub-advised by one of Nuveen’s investment management teams. In evaluating the comparisons of fees, the Independent Board Members have noted, at the Meeting or at prior meetings, that the fee rates charged to a fund (such as the Fund) and charged to other clients vary, among other things, because of the different services involved and the additional regulatory and compliance requirements associated with registered investment companies, such as the Fund. Accordingly, the Independent Board Members have considered the differences in the product types, including, but not limited to, the services to be provided, the structure and operations, product distribution and costs thereof, portfolio investment policies, investor profiles, account sizes and regulatory requirements. The Independent Board Members have noted, in particular, that the range of services as described above to be provided to a fund (such as the Fund) is much more extensive than that provided to separately managed accounts. Given the inherent differences in the products, particularly the extensive services to be provided to the Fund, the Independent Board Members believe such facts justify the different levels of fees.
In considering the advisory fees of the Sub-Adviser, the Independent Board Members are familiar with the pricing schedule the Sub-Adviser charges for similar investment management services for other clients (such as retail and/or institutional managed accounts) as applicable.
3. Profitability of Nuveen
In conjunction with its review of fees at prior meetings, the Independent Board Members have considered the profitability of Nuveen for its advisory activities (which incorporated Nuveen’s wholly-owned affiliated sub-advisers other than Winslow Capital) and its financial condition. At the Meeting or prior meetings, the Independent Board Members reviewed the revenues and expenses of Nuveen’s advisory activities, the allocation methodology used in preparing the profitability data and an analysis of the key drivers behind the changes in revenues and expenses that impacted profitability in 2008. In addition, the Independent Board Members have reviewed information regarding the financial results of Nuveen for 2008 based on its Form 8-K filed on March 31, 2009. They also reviewed the Form 8-K filed by Nuveen on July 9, 2009 (relating to, among other things, proposed financing and amendments to Nuveen’s credit facility). The Independent Board Members have also considered, at the Meeting or at prior
Annual Investment Management Agreement Approval Process (continued)
meetings, Nuveen’s revenues for advisory activities, expenses, and profit margin compared to that of various unaffiliated management firms with similar amounts of assets under management and relatively comparable asset composition prepared by Nuveen.
In reviewing profitability, the Independent Board Members have recognized the subjective nature of determining profitability, which may be affected by numerous factors, including the allocation of expenses. Further, the Independent Board Members have recognized the difficulties in making comparisons as the profitability of other advisers generally is not publicly available and the profitability information that is available for certain advisers or management firms may not be representative of the industry and may be affected by, among other things, the adviser’s particular business mix, capital costs, types of funds managed and expense allocations. Notwithstanding the foregoing, the Independent Board Members reviewed Nuveen’s methodology and assumptions for allocating expenses across product lines to determine profitability. In reviewing profitability, the Independent Board Members recognized Nuveen’s investment in its fund business. Based on their review, the Independent Board Members concluded that Nuveen’s level of profitability for its advisory activities was reasonable in light of the services to be provided.
In evaluating the reasonableness of the compensation, the Independent Board Members also considered any other amounts expected to be paid to a Fund Adviser as well as any indirect benefits (such as soft dollar arrangements, if any) the respective Fund Adviser and its affiliates are expected to receive that are directly attributable to their management of the Fund, if any. See Section E below for additional information on indirect benefits a Fund Adviser may receive as a result of its relationship with the Fund. Based on their review of the overall fee arrangements of the Fund, the Independent Board Members determined that the advisory fees and expected expenses of the Fund were reasonable.
D. Economies of Scale and Whether Fee Levels Reflect These Economies of Scale
With respect to economies of scale, the Independent Board Members have recognized the potential benefits resulting from the costs of a fund being spread over a larger asset base, although economies of scale are difficult to measure and predict with precision, particularly on a fund-by-fund basis. The Independent Board Members therefore considered whether the Fund could be expected to benefit from any economies of scale. One method to help ensure that shareholders share in these benefits is to include breakpoints in the advisory fee schedule. Generally, management fees for funds in the Nuveen complex are comprised of a fund-level component and a complex-level component. Accordingly, the Independent Board Members received and reviewed the schedule of proposed advisory fees for the Fund, including fund-level breakpoints thereto.
In addition to fund-level advisory fee breakpoints, the Board also considered the Fund’s complex-wide fee arrangement. Pursuant to the complex-wide fee arrangement, the fees of the funds in the Nuveen complex, including the Fund, are generally reduced as the assets in the fund complex reach certain levels. In evaluating the complex-wide fee arrangement, the Independent Board Members have considered that the complex-wide fee arrangement seeks to provide the benefits of economies of scale to fund shareholders when total fund complex assets increase, even if assets of a particular fund are unchanged or have decreased. The approach reflects the notion that some of Nuveen’s costs are attributable to services provided to all its funds in the complex and therefore all funds benefit if these costs are spread over a larger asset base. Based on their review, the Independent Board Members concluded that the breakpoint schedules and complex-wide fee arrangement were acceptable and reflect economies of scale to be shared with the Fund’s shareholders.
E. Indirect Benefits
In evaluating fees, the Independent Board Members also considered information regarding potential “fall out” or ancillary benefits that a Fund Adviser or its affiliates may receive as a result of its relationship with the Fund. The Independent Board Members considered, among other things, any sales charges, distribution fees and shareholder services fees expected to be received and retained by the Fund’s principal underwriter, an affiliate of NAM, including fees to be received pursuant to any 12b-1 plan.
In addition to the above, the Independent Board Members considered whether the Fund Advisers will receive any benefits from soft dollar arrangements whereby a portion of the commissions paid by the Fund for brokerage may be used to acquire research that may be useful to a Fund Adviser in managing the assets of the Fund and other clients. With respect to NAM, the Independent Board Members noted that NAM does not currently have any soft dollar arrangements; however, to the extent certain bona fide agency transactions that occur on markets that traditionally trade on a principal basis and riskless principal transactions are considered as generating “commissions,” NAM intends to comply with the applicable safe harbor provisions. With respect to the Sub-Adviser, the Independent Board Members considered that the Sub-Adviser may benefit from its arrangements pursuant to which it receives research from brokers that execute the Fund’s portfolio transactions. The Independent Board Members noted that the Sub-Adviser’s profitability may be lower if it were required to pay for this research with hard dollars.
Based on their review, the Independent Board Members concluded that any indirect benefits received by a Fund Adviser as a result of its relationship with the Fund were reasonable and within acceptable parameters.
F. Approval
The Independent Board Members did not identify any single factor discussed previously as all-important or controlling. The Board Members, including a majority of the Independent Board Members, concluded that the terms of the Investment Management Agreement and the Sub-Advisory Agreement were fair and reasonable, that the respective Fund Adviser’s fees are reasonable in light of the services to be provided to the Fund and that the Investment Management Agreement and Sub-Advisory Agreement should be and were approved on behalf of the Fund.
Glossary of Terms Used in this Report
Average Annual Total Return: This is a commonly used method to express an investment’s performance over a particular, usually multi-year time period. It expresses the return that would have been necessary each year to equal the investment’s actual cumulative performance (including change in NAV or offer price and reinvested dividends and capital gains distributions, if any) over the time period being considered.
Net Asset Value (NAV): A Fund’s NAV is the dollar value of one share in the Fund. It is calculated by subtracting the liabilities of the Fund from its total assets and then dividing the remainder by the number of shares outstanding. Fund NAVs are calculated at the end of each business day.
Fund Information
Fund Manager
Nuveen Asset Management
333 West Wacker Drive
Chicago, IL 60606
Sub-Adviser
NWQ Investment Management
Company, LLC
2049 Century Park East
Los Angeles, CA 90097
Legal Counsel
Chapman and Cutler LLP
Chicago, IL
Independent Registered
Public Accounting Firm
PricewaterhouseCoopers LLP
Chicago, IL
Custodian
State Street Bank & Trust Company
Boston, MA
Transfer Agent and Shareholder Services
Boston Financial
Data Services
Nuveen Investor Services
P.O. Box 8530
Boston, MA 02266-8530
(800) 257-8787
Distribution Information: The Fund hereby designates its percentages of dividends paid from net ordinary income as dividends qualifying for the 70% dividends received deduction (“DRD”) for corporations and its percentages as qualified dividend income (“QDI”) for individuals under Section 1 (h)(11) of the Internal Revenue Code as shown in the accompanying table. The actual qualified dividend income distributions will be reported to shareholders on Form 1099-DIV which will be sent to shareholders shortly after calendar year end.
| | | | |
| Fund | | % of DRD | | % of QDI |
Nuveen NWQ Equity Income Fund | | 100% | | 100% |
Fund’s Quarterly Portfolio of Investments and Proxy Voting Information: You may obtain (i) the Fund’s quarterly portfolio of investments, (ii) information regarding how the Fund voted proxies relating to portfolio securities held during the most recent twelve-month period ended June 30, and (iii) a description of the policies and procedures that the Fund used to determine how to vote proxies relating to portfolio securities without charge, upon request, by calling Nuveen Investments at (800) 257-8787 or on Nuveen’s website at www.nuveen.com.
You may also obtain this and other Fund information directly from the Securities and Exchange Commission (“SEC”). The SEC may charge a copying fee for this information. Visit the SEC on-line at http://www.sec.gov or in person at the SEC’s Public Reference Room in Washington, D.C. Call the SEC at (202) 942-8090 for room hours and operation. You may also request Fund information by sending an e-mail request to publicinfo@sec.gov or by writing to the SEC’s Public Reference Section at 100 F Street NE, Washington, D.C. 20549.
The Financial Industry Regulatory Authority (“FINRA”) provides a Public Disclosure Program which supplies certain information regarding the disciplinary history of FINRA members and their associated persons in response to either telephone inquiries at (800) 289-9999 or written inquiries at www.finra.org. FINRA also provides an investor brochure that includes information describing the Public Disclosure Program.
Nuveen Investments:
Serving Investors For Generations
Since 1898, financial advisors and their clients have relied on Nuveen Investments to provide dependable investment solutions through continued adherence to proven, long-term investing principles. Today, we offer a range of high quality equity and fixed-income solutions designed to be integral components of a well-diversified core portfolio.
Focused on meeting investor needs.
Nuveen Investments is a global investment management firm that seeks to help secure the long-term goals of institutions and high net worth investors as well as the consultants and financial advisors who serve them. We market our growing range of specialized investment solutions under the high-quality brands of HydePark, NWQ, Nuveen, Santa Barbara, Symphony, Tradewinds and Winslow Capital. In total, Nuveen Investments managed approximately $150 billion of assets on June 30, 2010.
Find out how we can help you.
To learn more about the products and services of Nuveen Investments may be able to help you meet your financial goals, talk to your financial advisor, or call us at (800) 257-8787. Please read the information provided carefully before you invest. Investors should consider the investment objective and policies, risk considerations, charges and expenses of any investment carefully. Where applicable, be sure to obtain a prospectus, which contains this and other relevant information. To obtain a prospectus, please contact your securities representative or Nuveen Investments, 333 W. Wacker Dr., Chicago, IL 60606. Please read the prospectus carefully before you invest or send money.
Learn more about Nuveen Funds at: www.nuveen.com/mf
Nuveen makes things e-simple.
It only takes a minute to sign up for e-Reports. Once enrolled, you’ll receive an e-mail as soon as your Nuveen Fund information is ready. No more waiting for delivery by regular mail. Just click on the link within the e-mail to see the report and save it on your computer if you wish.
Free e-Reports right to your e-mail!
www.investordelivery.com
If you receive your Nuveen Fund dividends and statements from your financial advisor or brokerage account.
OR
www.nuveen.com/accountaccess
If you receive your Nuveen Fund dividends and statements directly from Nuveen.
| | |
Distributed by Nuveen Investments, LLC 333 West Wacker Drive Chicago, IL 60606 www.nuveen.com | | |
MAN-NEQ-0610P

Mutual Funds
Nuveen Equity Funds
Designed to provide capital appreciation and to enhance the risk/return profile of the domestic equity portion of the Nuveen Asset Allocation Funds.
Annual Report
June 30, 2010
|
| Nuveen U.S. Equity Completeness Fund |
NUVEEN INVESTMENTS ANNOUNCES STRATEGIC COMBINATION WITH FAF ADVISORS
On July 29, 2010, Nuveen Investments, Inc. announced that U.S. Bancorp will receive a 9.5% stake in Nuveen Investments and cash consideration in exchange for the long-term asset business of U.S. Bancorp’s FAF Advisors (FAF). Nuveen Investments is the parent of Nuveen Asset Management (NAM), the investment adviser for the Funds included in this report.
FAF Advisors, which currently manages about $25 billion of long-term assets and serves as the advisor of the First American Funds, will be combined with NAM, which currently manages about $75 billion in municipal fixed income assets. Upon completion of the transaction, Nuveen Investments, which currently manages about $150 billion of assets across several high-quality affiliates, will manage a combined total of about $175 billion in institutional and retail assets.
This combination will not affect the investment objectives, strategies or policies of this Fund. Over time, Nuveen Investments expects that the combination will provide even more ways to meet the needs of investors who work with financial advisors and consultants by enhancing the multi-boutique model of Nuveen Investments, which also includes highly respected investment teams at NWQ Investment Management, Santa Barbara Asset Management, Symphony Asset Management, Tradewinds Global Investors, Winslow Capital and Nuveen HydePark.
The transaction is expected to close late in 2010, subject to customary conditions.
| | | | | | |
| Must be preceded by or accompanied by a prospectus. | | NOT FDIC INSURED | | MAY LOSE VALUE | | NO BANK GUARANTEE |
Chairman’s
Letter to Shareholders

Dear Shareholder,
The economic environment in which your Fund operates reflects continuing but uneven economic recovery. The U.S. and other major industrial countries are experiencing steady but comparatively low levels of economic growth, while emerging market countries are seeing a resumption of relatively strong economic expansion. The potential impact of steps being considered by many governments to counteract the extraordinary governmental spending and credit expansion to deal with the recent financial and economic crisis is injecting uncertainty into global financial markets. The implications for future tax rates, government spending, interest rates and the pace of economic recovery in the U.S. and other leading economies are extremely difficult to predict at the present time. The long term health of the global economy depends on restoring some measure of fiscal discipline around the world, but since all of the corrective steps require economic pain, it is not surprising that governments are reluctant to undertake them.
In the near term, governments remain committed to furthering economic recovery and realizing a meaningful reduction in their national unemployment rates. Such an environment should produce continued economic growth and, consequently, attractive investment opportunities. Over the longer term, the larger uncertainty mentioned earlier carries the risk of unexpected potholes in the road to sustained recovery. For this reason, Nuveen’s investment management teams are working hard to balance return and risk by building well-diversified portfolios, among other strategies. I encourage you to read the following commentary on the management of your Fund. As always, I also encourage you to contact your financial consultant if you have any questions about your Nuveen Fund investment. Please consult the Nuveen website for the most recent information on your Nuveen Fund at: www.nuveen.com.
On behalf of the other members of your Fund’s Board, we look forward to continuing to earn your trust in the months and years ahead.
Sincerely,

Robert P. Bremner
Chairman of the Board
August 17, 2010
Portfolio Managers’ Comments
Certain statements in this report are forward-looking statements. Discussions of specific investments are for illustration only and are not intended as recommendations of individual investments. The forward-looking statements and other views expressed herein are those of the portfolio managers as of the date of this report. Actual future results or occurrences may differ significantly from those anticipated in any forward-looking statements, and the views expressed herein are subject to change at any time, due to numerous market and other factors. The Fund disclaims any obligation to update publicly or revise any forward-looking statements or views expressed herein.
The Nuveen U.S. Equity Completeness Fund features management by Nuveen HydePark Group, LLC, an affiliate of Nuveen Investments, Inc. For most of this period, the Fund was co-managed by David Tierney, PhD, Senior Managing Director and Chief Investment Officer of HydePark, John Gambla, CFA, and Rob Guttschow, CFA. In June 2010, David Tierney relinquished his management responsibility for the Fund. We recently spoke with John and Rob about general market conditions, key investment strategies and the performance of the Fund for the twelve-month period ended June 30, 2010.
What were the general market conditions during the twelve-month reporting period?
As the reporting period began, there continued to be considerable downward pressure on the economy and both the Federal Reserve (Fed) and the federal government continued their efforts to improve the overall economic environment. For its part, the Fed continued to hold the benchmark fed funds rate in a target range of zero to 0.25% after cutting it to this record low level in December 2008.
At its June 2010 meeting, the central bank renewed its pledge to keep the fed funds rate “exceptionally low” for an “extended period.” As part of its efforts, the federal government put into place the American Recovery and Reinvestment Act of 2009, a $787 billion economic stimulus package intended to provide job creation, tax relief, fiscal assistance to state and local governments and expansion of unemployment benefits and other federal social welfare programs.
During the twelve-month period, these and other measures taken by the Fed and the government to ease the economic recession have helped to produce some signs of improvement. Over the four calendar quarters comprising this period, the U.S. economy, as measured by the U.S. gross domestic product (GDP), grew at annualized rates of 1.6%, 5.0%, 3.7% and an estimated 2.4%. This marked the first time since 2007 that the economy managed to string together four consecutive positive quarters. Housing also provided something of a bright spot, as the S&P/Case-Shiller Home Price Index of average residential prices from 20 large urban areas gained 4.6% for the twelve months ended May 2010 (the most recent data available at the time this report was produced). This moved average home prices across the United States to levels similar to where they were in the autumn of 2003.
Inflation also continued to be relatively tame, as the Consumer Price Index (CPI) rose 1.1% year-over-year as of June 2010. While labor markets remained weak, recent months have seen some improvement. As of June 2010, the national unemployment rate was 9.5%, the same level as June 2009 but below the 26-year high of 10.1% in October 2009.
Equity markets across the globe rallied during the reporting period and many indexes reached highs in April 2010 that had not been seen since 2008. Nevertheless, financial markets faced numerous obstacles throughout the period. Rating agencies downgraded the sovereign debt of Greece and threatened to downgrade Spain’s obligations. Dubai World announced over Thanksgiving that it would need to restructure its debt. In response to the financial crisis, the Bank for International Settlements issued the so-called “Basel III” guidelines, proposing stricter regulations regarding banks’ capital and liquidity requirements. Investors were divided over how the various proposals to address U.S. health care coverage would impact industry participants. Each new event seemed to be followed by market volatility.
How did the Fund perform during the twelve-months ended June 30, 2010?
The table on page four provides performance information for the Fund for the one-year and since inception periods ended June 30, 2010. The table also compares the Fund’s performance to a general market index. A more detailed discussion of the Fund’s relative performance is provided later in this report.
What is the Fund’s investment strategy?
The Nuveen U.S. Equity Completeness Fund is designed to serve as an investment option for the Nuveen Asset Allocation portfolios, helping them to offset or correct the style risk that may exist between those Funds’ U.S. equity benchmark and the benchmarks of the Funds’ underlying equity managers.
The proprietary, risk-controlled HydePark wealth creation model was used to manage the Fund during this period, and has been used since the inception of the Fund. This model utilizes both fundamental and momentum-related criteria to create a portfolio designed to maximize the reward-to-risk ratio of the Fund’s holdings.
Our investment process is a combination of traditional fundamental security valuation and quantitative risk-control techniques. The philosophy that underlies our value-added process is that a stock’s price must follow the wealth creation fundamentals of the company. A stock’s weight in the portfolio is directly related to its wealth creation fundamentals. Our process has five “wealth creation” factors. Four are fundamentally oriented — two are traditional measures of revenues versus excess of expenses (specifically, earnings and cash flow), and two are traditional measures of the uses for those monies (book value and dividends). The fifth factor is a proprietary measure of stock price momentum. Importantly, the process also considers a stock’s liquidity. Due to the quantitative, model-driven process, top-down macroeconomic “themes” do not influence the model or how we select stocks for the Fund.
The model evaluates all the securities contained in the benchmark portfolio (Russell 3000 Index) for possible inclusion in the Fund’s portfolio. The process will not consider a stock for possible inclusion if it is not contained in the Russell 3000 Index.
This process produces what HydePark believes is a well-diversified, efficient portfolio that attempts to perform within a specific, narrow tracking range (the degree of difference) versus the stated benchmark. The Fund’s portfolio typically contains a large number of holdings, with each relative weighting reflecting the five-dimensional view of that stock’s wealth creation characteristics. The portfolio is monitored daily with rebalances occurring quarterly.
| 1 | All returns are from 7/1/08. |
| 2 | The Russell 3000 Index measures the performance of the 3,000 largest U.S. companies based on total market capitalization, which represents approximately 98% of the investable U.S. equity market. The index returns assume reinvestment of dividends and do not reflect any applicable sales charges. You cannot invest directly in an index. |
How did this strategy influence performance?
The Nuveen U.S. Equity Completeness Fund underperformed the Russell 3000 Index during the reporting period.
We believe the quantitative, risk-controlled process described above should, under normal circumstances, cause the Fund to track its benchmark portfolio closely, with value-added potential coming from the Fund’s relative overweights or underweights of each stock versus the index. We attempt to express an overweight/underweight opinion on every stock in the benchmark, based on our analysis of its five wealth creation factors.
The sum of the Fund’s individual security overweights/underweights versus the index is, by definition, equal to zero. However, the HydePark process does not constrain the portfolio to be industry or sector neutral relative to the benchmark. As a result, the Fund sometimes will overweight a sector because the stocks in that sector had what we judged to be attractive wealth creation fundamentals versus the benchmark. Performance for the portfolio can then be viewed in two parts: the return attributable to the Fund’s sector weightings and the return attributable to the performance of individual stocks within each sector.
On average during the reporting period, the Fund was overweighted in energy, consumer discretionary, consumer staples, telecommunication services and utilities. The largest single sector overweight was in utilities, where the Fund was, on average, 1.71% overweight versus the index. The largest single underweight was, on average, in information technology, where the Fund was 3.50% underweight versus the index. Overall, sector weightings were a negative to the Fund’s relative performance versus the index.
Performance attributable to the individual stock holdings within each sector was a slight negative for the Fund during the reporting period, with the stock picks within the consumer staples sector having the largest positive impact. The holdings within the materials, financials and utility sectors were also a positive for the Fund. Holdings within the energy, industrials, and information technology resulted in negative relative performance for the Fund.
Class I Shares – Average Annual Total Returns
As of 6/30/2010
| | | | |
| | | Average Annual |
| | | 1-Year | | Since
Inception1 |
Nuveen U.S. Equity Completeness Fund | | | | |
I Shares | | 13.25% | | -10.30% |
Russell 3000 Index2 | | 15.72% | | -7.81% |
Returns quoted represent past performance which is no guarantee of future results. Current performance may be higher or lower than the performance shown. Investment returns and principal value will fluctuate so that when shares are redeemed, they may be worth more or less than their original cost. Returns do not reflect the deduction of taxes that a shareholder would pay on Fund distributions or the redemption of shares. Returns may reflect a contractual agreement between the Fund and the investment adviser to waive certain fees and expenses; see Notes to Financial Statements, Footnote 7 — Management Fees and Other Transactions with Affiliates for more information. In addition, returns may reflect a voluntary expense limitation by the Fund’s investment adviser that may be modified or discontinued at any time without notice. For the most recent month-end performance, visit www.nuveen.com or call (800) 257-8787.
Please see each Fund’s Spotlight Page later in this report for more complete performance data and expense ratios.
Nuveen U.S. Equity Completeness Fund
Growth of an Assumed $10,000 Investment
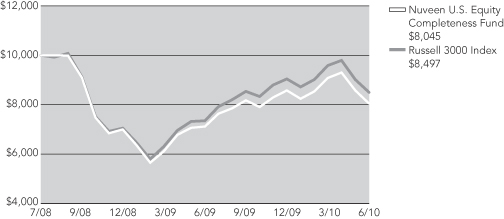
The graph does not reflect the deduction of taxes that a shareholder may pay on Fund distributions or the redemption of Fund shares.
The index comparison shows the change in value of a $10,000 investment in the Nuveen U.S. Equity Completeness Fund compared with the corresponding index. The Russell 3000 Index measures the performance of the 3000 largest U.S. companies based on market capitalization, which represents approximately 98% of the investable U.S. equity market. The index return assumes reinvestment of dividends and does not reflect any initial or ongoing expenses. You cannot invest directly in an index. The Nuveen U.S. Equity Completeness Fund’s return includes reinvestment of all dividends and distributions. The performance data quoted represents past performance, which is not indicative of future results. Current performance may be lower or higher than the performance shown.
Fund Spotlight as of 6/30/10Nuveen U.S. Equity Completeness Fund
| | |
| Quick Facts | | |
| | | |
NAV | | $15.78 |
Latest Ordinary Income Distribution1 | | $0.2513 |
Inception Date | | 7/01/08 |
Returns quoted represent past performance which is no guarantee of future results. Investment returns and principal value will fluctuate so that when shares are redeemed, they may be worth more or less than their original cost. Current performance may be higher or lower than the performance shown. Returns do not reflect the deduction of taxes that a shareholder would pay on Fund distributions or the redemption of shares.
Fund returns assume reinvestment of dividends and capital gains. Shares have no sales charge and may only be purchased by the Nuveen Allocation Funds. Returns may reflect an expense limitation by the Fund’s investment adviser.
| | |
| Average Annual Total Returns as of 6/30/10 |
| |
| | | NAV |
1-Year | | 13.25% |
Since Inception | | -10.30% |
| | |
| |
| Top Five Common Stock Holdings3 | | |
Exxon Mobil Corporation | | 2.8% |
Merck & Company Inc. | | 1.9% |
Bank of America Corporation | | 1.8% |
General Electric Company | | 1.7% |
AT&T Inc. | | 1.7% |
Portfolio Allocation2
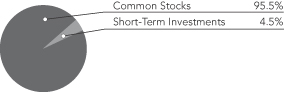
| | |
| Portfolio Statistics |
| Net Assets ($000) | | $6,016 |
| Number of Common Stocks | | 1,500 |
| | | | |
| Expense Ratios | | | | |
| | | Gross
Expense
Ratio | | Net
Expense
Ratio |
| | | 3.38% | | 0.80% |
The expense ratios shown factor in Total Annual Fund Operating Expenses including management fees and other fees and expenses. The Net Expense Ratio reflects a contractual commitment by the Fund’s investment adviser to waive fees and reimburse certain expenses through October 31, 2011. The expense ratios are those shown in the most recent Fund prospectus.
| 2 | As a percentage of total investments as of June 30, 2010. Holdings are subject to change. |
| 3 | As a percentage of total common stocks as of June 30, 2010. Holdings are subject to change. |
Fund Spotlight as of 6/30/10 Nuveen U.S. Equity Completeness Fund
| | |
| Portfolio Composition1 | | |
Oil, Gas & Consumable Fuels | | 8.9% |
Media | | 4.9% |
Pharmaceuticals | | 4.8% |
Commercial Banks | | 4.6% |
Insurance | | 4.4% |
Diversified Financial Services | | 4.1% |
Diversified Telecommunication Services | | 3.1% |
Health Care Providers & Services | | 2.9% |
Real Estate | | 2.7% |
Electric Utilities | | 2.5% |
Capital Markets | | 2.4% |
Software | | 2.3% |
Chemicals | | 2.1% |
Machinery | | 2.1% |
Semiconductors & Equipment | | 2.1% |
Computers & Peripherals | | 2.1% |
Aerospace & Defense | | 2.0% |
Industrial Conglomerates | | 2.0% |
Multi-Utilities | | 1.9% |
Specialty Retail | | 1.9% |
Health Care Equipment & Supplies | | 1.7% |
Energy Equipment & Services | | 1.7% |
Food Products | | 1.7% |
IT Services | | 1.6% |
Hotels, Restaurants & Leisure | | 1.5% |
Food & Staples Retailing | | 1.3% |
Biotechnology | | 1.3% |
Communications Equipment | | 1.2% |
Short-Term Investments | | 4.5% |
Other | | 19.7% |
| 1 | As a percentage of total investments as of June 30, 2010. Holdings are subject to change. |
Expense Example
As a shareholder of the Fund, you incur two types of costs: (1) transaction costs, including up-front and back-end sales charges (loads) or redemption fees, where applicable; and (2) ongoing costs, including management fees; distribution and service (12b-1) fees, where applicable; and other Fund expenses. This Example is intended to help you understand your ongoing costs (in dollars) of investing in the Fund and to compare these costs with the ongoing costs of investing in other mutual funds.
The Example below is based on an investment of $1,000 invested at the beginning of the period and held for the period.
The information under “Actual Performance,” together with the amount you invested, allows you to estimate actual expenses incurred over the reporting period. Simply divide your account value by $1,000 (for example, an $8,600 account value divided by $1,000 = 8.60) and multiply the result by the cost shown for your share class, in the row entitled “Expenses Incurred During Period” to estimate the expenses incurred on your account during this period.
The information under “Hypothetical Performance,” provides information about hypothetical account values and hypothetical expenses based on the Fund’s actual expense ratio and an assumed rate of return of 5% per year before expenses, which is not the Fund’s actual return. The hypothetical account values and expenses may not be used to estimate the actual ending account balance or expense you incurred for the period. You may use this information to compare the ongoing costs of investing in the Fund and other Funds. To do so, compare this 5% hypothetical example with the 5% hypothetical examples that appear in the shareholder reports of the other funds.
| | | | | | | | |
| | | Actual Performance | | | | Hypothetical Performance
(5% return before expenses) |
| Beginning Account Value (1/01/10) | | $ | 1,000.00 | | | | $ | 1,000.00 |
| Ending Account Value (6/30/10) | | $ | 938.70 | | | | $ | 1,020.88 |
| Expenses Incurred During Period | | $ | 3.78 | | | | $ | 3.96 |
Expenses are equal to the Fund’s annualized net expense ratio of .79% multiplied by the average account value over the period, multiplied by 181/365 (to reflect the one-half year period).
Report of
Independent Registered Public Accounting Firm
To the Board of Trustees and Shareholders of
Nuveen Investment Trust:
In our opinion, the accompanying statement of assets and liabilities, including the portfolio of investments, and the related statements of operations, of changes in net assets and the financial highlights present fairly, in all material respects, the financial position of Nuveen U.S. Equity Completeness Fund (a series of the Nuveen Investment Trust, hereafter referred to as the “Fund”) at June 30, 2010, the results of its operations, the changes in its net assets for each of the two years in the period then ended and the financial highlights for the periods presented in conformity with accounting principles generally accepted in the United States of America. These financial statements and financial highlights (hereafter referred to as “financial statements”) are the responsibility of the Fund’s management; our responsibility is to express an opinion on these financial statements based on our audits. We conducted our audits of these financial statements in accordance with the standards of the Public Company Accounting Oversight Board (United States). Those standards require that we plan and perform the audit to obtain reasonable assurance about whether the financial statements are free of material misstatement. An audit includes examining, on a test basis, evidence supporting the amounts and disclosures in the financial statements, assessing the accounting principles used and significant estimates made by management, and evaluating the overall financial statement presentation. We believe that our audit, which included confirmation of securities at June 30, 2010 by correspondence with the custodian and brokers, provides a reasonable basis for our opinion.
PRICEWATERHOUSECOOPERS LLP
Chicago, IL
August 25, 2010
Portfolio of Investments
Nuveen U.S. Equity Completeness Fund
June 30, 2010
| | | | | | | | | | | |
| Shares | | Description (1) | | | | | | | | Value |
| | | | | | | | | | | |
| | COMMON STOCKS – 96.1% | | | | | | | | | |
| | | | | |
| | Aerospace & Defense – 2.0% | | | | | | | | | |
| | | | | |
| 10 | | Alliant Techsystems Inc., (2) | | | | | | | | $ | 621 |
| | | | | |
| 10 | | American Science & Engineering Inc. | | | | | | | | | 762 |
| | | | | |
| 10 | | Argon ST, Inc., (2) | | | | | | | | | 343 |
| | | | | |
| 250 | | BE Aerospace Inc., (2) | | | | | | | | | 6,358 |
| | | | | |
| 320 | | Boeing Company | | | | | | | | | 20,080 |
| | | | | |
| 10 | | Cubic Corporation | | | | | | | | | 364 |
| | | | | |
| 10 | | Curtiss Wright Corporation | | | | | | | | | 290 |
| | | | | |
| 30 | | Digitalglobe Inc., (2) | | | | | | | | | 789 |
| | | | | |
| 20 | | Esterline Technologies Corporation, (2) | | | | | | | | | 949 |
| | | | | |
| 480 | | GenCorp Inc., (2) | | | | | | | | | 2,102 |
| | | | | |
| 310 | | General Dynamics Corporation | | | | | | | | | 18,154 |
| | | | | |
| 10 | | GeoEye, Inc., (2) | | | | | | | | | 311 |
| | | | | |
| 60 | | Goodrich Corporation | | | | | | | | | 3,975 |
| | | | | |
| 70 | | Heico Corporation | | | | | | | | | 2,514 |
| | | | | |
| 180 | | Hexcel Corporation, (2) | | | | | | | | | 2,792 |
| | | | | |
| 150 | | Honeywell International Inc. | | | | | | | | | 5,855 |
| | | | | |
| 180 | | ITT Industries, Inc. | | | | | | | | | 8,086 |
| | | | | |
| 60 | | L-3 Communications Holdings, Inc. | | | | | | | | | 4,250 |
| | | | | |
| 60 | | Lockheed Martin Corporation | | | | | | | | | 4,470 |
| | | | | |
| 90 | | Moog Inc., Class A Shares, (2) | | | | | | | | | 2,901 |
| | | | | |
| 190 | | Northrop Grumman Corporation | | | | | | | | | 10,344 |
| | | | | |
| 30 | | Precision Castparts Corporation | | | | | | | | | 3,088 |
| | | | | |
| 120 | | Raytheon Company | | | | | | | | | 5,807 |
| | | | | |
| 190 | | Taser International, Inc., (2) | | | | | | | | | 741 |
| | | | | |
| 40 | | Teledyne Technologies Inc., (2) | | | | | | | | | 1,543 |
| | | | | |
| 40 | | Triumph Group Inc. | | | | | | | | | 2,665 |
| | | | | |
| 190 | | United Technologies Corporation | | | | | | | | | 12,333 |
| | Total Aerospace & Defense | | | | | | | | | 122,487 |
| | Air Freight & Logistics – 0.4% | | | | | | | | | |
| | | | | |
| 190 | | FedEx Corporation | | | | | | | | | 13,321 |
| | | | | |
| 100 | | Hub Group, Inc., (2) | | | | | | | | | 3,001 |
| | | | | |
| 560 | | Pacer International, Inc., (2) | | | | | | | | | 3,914 |
| | | | | |
| 80 | | United Parcel Service, Inc., Class B | | | | | | | | | 4,551 |
| | Total Air Freight & Logistics | | | | | | | | | 24,787 |
| | Airlines – 0.5% | | | | | | | | | |
| | | | | |
| 40 | | AirTran Holdings, Inc., (2) | | | | | | | | | 194 |
| | | | | |
| 20 | | Alaska Air Group, Inc., (2) | | | | | | | | | 899 |
| | | | | |
| 150 | | AMR Corporation, (2) | | | | | | | | | 1,017 |
| | | | | |
| 130 | | Delta Air Lines, Inc., (2) | | | | | | | | | 1,528 |
| | | | | |
| 460 | | Hawaiian Holdings Inc., (2) | | | | | | | | | 2,378 |
| | | | | |
| 130 | | Republic Airways Holdings, Inc., (2) | | | | | | | | | 794 |
| | | | | |
| 210 | | Skywest Inc. | | | | | | | | | 2,566 |
| | | | | |
| 650 | | Southwest Airlines Co. | | | | | | | | | 7,222 |
| | | | | |
| 410 | | UAL Corporation, (2) | | | | | | | | | 8,430 |
Portfolio of Investments
Nuveen U.S. Equity Completeness Fund (continued)
June 30, 2010
| | | | | | | | | | | |
| Shares | | Description (1) | | | | | | | | Value |
| | | | | | | | | | | |
| | Airlines (continued) | | | | | | | | | |
| | | | | |
| 370 | | US Airways Group Inc., (2) | | | | | | | | $ | 3,186 |
| | Total Airlines | | | | | | | | | 28,214 |
| | Auto Components – 0.3% | | | | | | | | | |
| | | | | |
| 160 | | Dana Holding Corporation, (2) | | | | | | | | | 1,600 |
| | | | | |
| 200 | | Goodyear Tire & Rubber Company, (2) | | | | | | | | | 1,988 |
| | | | | |
| 280 | | Johnson Controls, Inc. | | | | | | | | | 7,524 |
| | | | | |
| 50 | | Spartan Motors, Inc. | | | | | | | | | 210 |
| | | | | |
| 70 | | Standard Motor Products Inc. | | | | | | | | | 565 |
| | | | | |
| 120 | | Superior Industries International Inc. | | | | | | | | | 1,613 |
| | | | | |
| 350 | | Wonder Auto Technology, Inc., (2) | | | | | | | | | 2,562 |
| | Total Auto Components | | | | | | | | | 16,062 |
| | Automobiles – 0.8% | | | | | | | | | |
| | | | | |
| 4,030 | | Ford Motor Company, (2) | | | | | | | | | 40,622 |
| | | | | |
| 90 | | Harley-Davidson, Inc. | | | | | | | | | 2,001 |
| | | | | |
| 120 | | Thor Industries, Inc. | | | | | | | | | 2,850 |
| | Total Automobiles | | | | | | | | | 45,473 |
| | Beverages – 1.1% | | | | | | | | | |
| | | | | |
| 210 | | Central European Distribution Corporation, (2) | | | | | | | | | 4,490 |
| | | | | |
| 550 | | Coca-Cola Company | | | | | | | | | 27,566 |
| | | | | |
| 50 | | Coca-Cola Enterprises Inc. | | | | | | | | | 1,293 |
| | | | | |
| 30 | | Constellation Brands, Inc., Class A, (2) | | | | | | | | | 469 |
| | | | | |
| 150 | | Dr. Pepper Snapple Group | | | | | | | | | 5,609 |
| | | | | |
| 70 | | Molson Coors Brewing Company, Class B | | | | | | | | | 2,965 |
| | | | | |
| 360 | | PepsiCo, Inc. | | | | | | | | | 21,942 |
| | Total Beverages | | | | | | | | | 64,334 |
| | Biotechnology – 1.3% | | | | | | | | | |
| | | | | |
| 70 | | Acorda Therapeutics, Inc., (2) | | | | | | | | | 2,178 |
| | | | | |
| 10 | | Alexion Pharmaceuticals Inc., (2) | | | | | | | | | 512 |
| | | | | |
| 50 | | Alkermes Inc., (2) | | | | | | | | | 623 |
| | | | | |
| 10 | | Allos Therapeutics, Inc., (2) | | | | | | | | | 61 |
| | | | | |
| 150 | | Amgen Inc., (2) | | | | | | | | | 7,890 |
| | | | | |
| 10 | | Amylin Pharmaceuticals Inc., (2) | | | | | | | | | 188 |
| | | | | |
| 50 | | Array Biopharma, Inc., (2) | | | | | | | | | 153 |
| | | | | |
| 70 | | BioCryst Pharaceuticals, Inc., (2) | | | | | | | | | 414 |
| | | | | |
| 40 | | Biogen Idec Inc., (2) | | | | | | | | | 1,898 |
| | | | | |
| 40 | | Celgene Corporation, (2) | | | | | | | | | 2,033 |
| | | | | |
| 80 | | Cepheid, Inc., (2) | | | | | | | | | 1,282 |
| | | | | |
| 40 | | Clinical Data, Inc., (2) | | | | | | | | | 498 |
| | | | | |
| 70 | | Cubist Pharmaceuticals Inc., (2) | | | | | | | | | 1,442 |
| | | | | |
| 90 | | Cytori Therapeutics, Inc., (2) | | | | | | | | | 313 |
| | | | | |
| 10 | | Emergent BioSolutions, Inc., (2) | | | | | | | | | 163 |
| | | | | |
| 20 | | Exelixis, Inc., (2) | | | | | | | | | 69 |
| | | | | |
| 30 | | Genzyme Corporation, (2) | | | | | | | | | 1,523 |
| | | | | |
| 120 | | Geron Corporation, (2) | | | | | | | | | 602 |
| | | | | |
| 50 | | Gilead Sciences, Inc., (2) | | | | | | | | | 1,714 |
| | | | | | | | | | | |
| Shares | | Description (1) | | | | | | | | Value |
| | | | | | | | | | | |
| | Biotechnology (continued) | | | | | | | | | |
| | | | | |
| 1,080 | | Human Genome Sciences, Inc., (2) | | | | | | | | $ | 24,473 |
| | | | | |
| 20 | | Immunogen, Inc., (2) | | | | | | | | | 185 |
| | | | | |
| 240 | | Incyte Pharmaceuticals Inc., (2) | | | | | | | | | 2,657 |
| | | | | |
| 80 | | Intermune, Inc., (2) | | | | | | | | | 748 |
| | | | | |
| 90 | | ISIS Pharmaceuticals, Inc., (2) | | | | | | | | | 861 |
| | | | | |
| 100 | | Martek Biosciences Corporation, (2) | | | | | | | | | 2,371 |
| | | | | |
| 20 | | Myriad Genentics Inc., (2) | | | | | | | | | 299 |
| | | | | |
| 70 | | Nabi Biopharmaceuticals, (2) | | | | | | | | | 381 |
| | | | | |
| 920 | | Novavax, Inc., (2) | | | | | | | | | 1,996 |
| | | | | |
| 10 | | OncoGenex Pharmacuetical Inc., (2) | | | | | | | | | 135 |
| | | | | |
| 40 | | Onyx Pharmaceuticals Inc., (2) | | | | | | | | | 864 |
| | | | | |
| 30 | | PDL Biopahrma Inc. | | | | | | | | | 169 |
| | | | | |
| 10 | | Pharmasett Inc., (2) | | | | | | | | | 273 |
| | | | | |
| 100 | | Regeneron Pharmaceuticals, Inc., (2) | | | | | | | | | 2,232 |
| | | | | |
| 200 | | Rigel Pharmaceuticals, Inc., (2) | | | | | | | | | 1,440 |
| | | | | |
| 160 | | Savient Pharmaceuticals, Inc., (2) | | | | | | | | | 2,016 |
| | | | | |
| 70 | | Seattle Genetics, Inc., (2) | | | | | | | | | 839 |
| | | | | |
| 80 | | SIGA Technologies, Inc., (2) | | | | | | | | | 616 |
| | | | | |
| 550 | | Spectrum Pharmaceuticals, Inc., (2) | | | | | | | | | 2,156 |
| | | | | |
| 160 | | Talecris Biotherapeutics Holdings Inc., (2) | | | | | | | | | 3,376 |
| | | | | |
| 80 | | Theravance Inc., (2) | | | | | | | | | 1,006 |
| | | | | |
| 370 | | Vanda Pharmaceuticals, Inc., (2) | | | | | | | | | 2,446 |
| | | | | |
| 30 | | Vertex Pharmaceuticals Inc., (2) | | | | | | | | | 987 |
| | | | | |
| 40 | | Vical, Inc., (2) | | | | | | | | | 124 |
| | Total Biotechnology | | | | | | | | | 76,206 |
| | Building Products – 0.2% | | | | | | | | | |
| | | | | |
| 10 | | American Woodmark Company | | | | | | | | | 171 |
| | | | | |
| 20 | | Apogee Enterprises, Inc. | | | | | | | | | 217 |
| | | | | |
| 20 | | Armstrong World Industries Inc., (2) | | | | | | | | | 604 |
| | | | | |
| 220 | | Gibraltar Industries Inc., (2) | | | | | | | | | 2,222 |
| | | | | |
| 110 | | Griffon Corporation, (2) | | | | | | | | | 1,217 |
| | | | | |
| 10 | | Insteel Industries, Inc. | | | | | | | | | 116 |
| | | | | |
| 160 | | Masco Corporation | | | | | | | | | 1,722 |
| | | | | |
| 60 | | Quanex Building Products Corporation | | | | | | | | | 1,037 |
| | | | | |
| 40 | | Simpson Manufacturing Company Inc. | | | | | | | | | 982 |
| | | | | |
| 20 | | Trex Company Inc., (2) | | | | | | | | | 402 |
| | | | | |
| 60 | | Universal Forest Products Inc. | | | | | | | | | 1,819 |
| | | | | |
| 20 | | USG Corporation, (2) | | | | | | | | | 242 |
| | Total Building Products | | | | | | | | | 10,751 |
| | Capital Markets – 2.4% | | | | | | | | | |
| | | | | |
| 10 | | Affiliated Managers Group Inc., (2) | | | | | | | | | 608 |
| | | | | |
| 410 | | American Capital Limited, (2) | | | | | | | | | 1,976 |
| | | | | |
| 330 | | Ameriprise Financial, Inc. | | | | | | | | | 11,923 |
| | | | | |
| 340 | | Bank of New York Company, Inc. | | | | | | | | | 8,395 |
| | | | | |
| 50 | | BlackRock Inc. | | | | | | | | | 7,170 |
Portfolio of Investments
Nuveen U.S. Equity Completeness Fund (continued)
June 30, 2010
| | | | | | | | | | | |
| Shares | | Description (1) | | | | | | | | Value |
| | | | | | | | | | | |
| | Capital Markets (continued) | | | | | | | | | |
| | | | | |
| 330 | | Calamos Asset Management, Inc. Class A | | | | | | | | $ | 3,062 |
| | | | | |
| 140 | | Charles Schwab Corporation | | | | | | | | | 1,985 |
| | | | | |
| 70 | | Cohen & Steers Inc. | | | | | | | | | 1,452 |
| | | | | |
| 10 | | Duff & Phelps Corporation, Class A | | | | | | | | | 126 |
| | | | | |
| 80 | | Eaton Vance Corporation | | | | | | | | | 2,209 |
| | | | | |
| 40 | | Fifth Street Finance Corporation | | | | | | | | | 441 |
| | | | | |
| 50 | | Franklin Resources, Inc. | | | | | | | | | 4,310 |
| | | | | |
| 50 | | GAMCO Investors Inc. | | | | | | | | | 1,860 |
| | | | | |
| 240 | | Gleacher & Company Inc., (2) | | | | | | | | | 612 |
| | | | | |
| 440 | | Goldman Sachs Group, Inc. | | | | | | | | | 57,759 |
| | | | | |
| 170 | | Invesco LTD | | | | | | | | | 2,861 |
| | | | | |
| 120 | | Investment Technology Group, (2) | | | | | | | | | 1,927 |
| | | | | |
| 220 | | Janus Capital Group Inc. | | | | | | | | | 1,954 |
| | | | | |
| 50 | | Jefferies Group, Inc. | | | | | | | | | 1,054 |
| | | | | |
| 40 | | Kbw Inc., (2) | | | | | | | | | 858 |
| | | | | |
| 80 | | Knight Trading Group Inc., (2) | | | | | | | | | 1,103 |
| | | | | |
| 80 | | Legg Mason, Inc. | | | | | | | | | 2,242 |
| | | | | |
| 60 | | MCG Capital Corporation | | | | | | | | | 290 |
| | | | | |
| 370 | | Morgan Stanley | | | | | | | | | 8,588 |
| | | | | |
| 30 | | Northern Trust Corporation | | | | | | | | | 1,401 |
| | | | | |
| 10 | | OptionsXpress Holdings Inc., (2) | | | | | | | | | 157 |
| | | | | |
| 140 | | Pennantpark Investment Corporation | | | | | | | | | 1,337 |
| | | | | |
| 150 | | Raymond James Financial Inc. | | | | | | | | | 3,704 |
| | | | | |
| 160 | | Safeguard Scientifics Inc., (2) | | | | | | | | | 1,690 |
| | | | | |
| 190 | | State Street Corporation | | | | | | | | | 6,426 |
| | | | | |
| 30 | | Stifel Financial Corporation, (2) | | | | | | | | | 1,302 |
| | | | | |
| 50 | | T. Rowe Price Group Inc. | | | | | | | | | 2,220 |
| | | | | |
| 20 | | TradeStation Group, Inc., (2) | | | | | | | | | 135 |
| | | | | |
| 70 | | Waddell & Reed Financial, Inc., Class A | | | | | | | | | 1,532 |
| | Total Capital Markets | | | | | | | | | 144,669 |
| | Chemicals – 2.1% | | | | | | | | | |
| | | | | |
| 80 | | Air Products & Chemicals Inc. | | | | | | | | | 5,185 |
| | | | | |
| 100 | | Airgas, Inc. | | | | | | | | | 6,220 |
| | | | | |
| 50 | | Albemarle Corporation | | | | | | | | | 1,986 |
| | | | | |
| 70 | | Ashland Inc. | | | | | | | | | 3,249 |
| | | | | |
| 10 | | Balchem Corporation | | | | | | | | | 250 |
| | | | | |
| 110 | | Cabot Corporation | | | | | | | | | 2,652 |
| | | | | |
| 60 | | Calgon Carbon Corporation, (2) | | | | | | | | | 794 |
| | | | | |
| 270 | | Celanese Corporation, Series A | | | | | | | | | 6,726 |
| | | | | |
| 10 | | CF Industries Holdings, Inc. | | | | | | | | | 635 |
| | | | | |
| 20 | | Cytec Industries, Inc. | | | | | | | | | 800 |
| | | | | |
| 840 | | Dow Chemical Company | | | | | | | | | 19,925 |
| | | | | |
| 590 | | E.I. Du Pont de Nemours and Company | | | | | | | | | 20,408 |
| | | | | |
| 50 | | Eastman Chemical Company | | | | | | | | | 2,668 |
| | | | | |
| 10 | | Ecolab Inc. | | | | | | | | | 449 |
| | | | | | | | | | | |
| Shares | | Description (1) | | | | | | | | Value |
| | | | | | | | | | | |
| | Chemicals (continued) | | | | | | | | | |
| | | | | |
| 30 | | FMC Corporation | | | | | | | | $ | 1,723 |
| | | | | |
| 130 | | H.B. Fuller Company | | | | | | | | | 2,469 |
| | | | | |
| 90 | | Hawkins Inc | | | | | | | | | 2,167 |
| | | | | |
| 20 | | Innophos Holdings, Inc. | | | | | | | | | 522 |
| | | | | |
| 10 | | Koppers Holdings Inc. | | | | | | | | | 225 |
| | | | | |
| 80 | | Lubrizol Corporation | | | | | | | | | 6,425 |
| | | | | |
| 50 | | Monsanto Company | | | | | | | | | 2,311 |
| | | | | |
| 20 | | Mosaic Company | | | | | | | | | 780 |
| | | | | |
| 20 | | NewMarket Corporation | | | | | | | | | 1,746 |
| | | | | |
| 180 | | Olin Corporation | | | | | | | | | 3,256 |
| | | | | |
| 290 | | OMNOVA Solutions Inc., (2) | | | | | | | | | 2,265 |
| | | | | |
| 40 | | PolyOne Corporation, (2) | | | | | | | | | 337 |
| | | | | |
| 80 | | PPG Industries, Inc. | | | | | | | | | 4,833 |
| | | | | |
| 50 | | Praxair, Inc. | | | | | | | | | 3,800 |
| | | | | |
| 10 | | Quaker Chemical Corporation | | | | | | | | | 271 |
| | | | | |
| 170 | | Rockwood Holdings Inc., (2) | | | | | | | | | 3,857 |
| | | | | |
| 120 | | RPM International, Inc. | | | | | | | | | 2,141 |
| | | | | |
| 60 | | Sensient Technologies Corporation | | | | | | | | | 1,556 |
| | | | | |
| 20 | | Sherwin-Williams Company | | | | | | | | | 1,384 |
| | | | | |
| 20 | | Sigma-Aldrich Corporation | | | | | | | | | 997 |
| | | | | |
| 600 | | Solutia Inc., (2) | | | | | | | | | 7,860 |
| | | | | |
| 60 | | Valspar Corporation | | | | | | | | | 1,807 |
| | | | | |
| 20 | | Westlake Chemical Corporation | | | | | | | | | 371 |
| | | | | |
| 160 | | WR Grace & Company, (2) | | | | | | | | | 3,366 |
| | Total Chemicals | | | | | | | | | 128,416 |
| | Commercial Banks – 4.6% | | | | | | | | | |
| | | | | |
| 20 | | Associated Banc-Corp. | | | | | | | | | 245 |
| | | | | |
| 50 | | BancorpSouth Inc. | | | | | | | | | 894 |
| | | | | |
| 20 | | Bank of the Ozarks, Inc. | | | | | | | | | 709 |
| | | | | |
| 800 | | BB&T Corporation | | | | | | | | | 21,048 |
| | | | | |
| 10 | | Camden National Corporation | | | | | | | | | 275 |
| | | | | |
| 60 | | Cathay General Bancorp. | | | | | | | | | 620 |
| | | | | |
| 120 | | Centerstate Banks of Florida, Inc. | | | | | | | | | 1,211 |
| | | | | |
| 70 | | Chemical Financial Corporation | | | | | | | | | 1,525 |
| | | | | |
| 80 | | City Holding Company | | | | | | | | | 2,230 |
| | | | | |
| 130 | | Comerica Incorporated | | | | | | | | | 4,788 |
| | | | | |
| 60 | | Community Trust Bancorp, Inc. | | | | | | | | | 1,506 |
| | | | | |
| 10 | | Cullen/Frost Bankers, Inc. | | | | | | | | | 514 |
| | | | | |
| 110 | | CVB Financial | | | | | | | | | 1,045 |
| | | | | |
| 110 | | Danvers Bancorp Inc. | | | | | | | | | 1,590 |
| | | | | |
| 180 | | East West Bancorp Inc. | | | | | | | | | 2,745 |
| | | | | |
| 110 | | F.N.B. Corporation PA | | | | | | | | | 883 |
| | | | | |
| 730 | | Fifth Third Bancorp. | | | | | | | | | 8,972 |
| | | | | |
| 130 | | First Bancorp of North Carolina, Inc. | | | | | | | | | 1,884 |
| | | | | |
| 80 | | First Bancorp of Puerto Rico, (2) | | | | | | | | | 42 |
Portfolio of Investments
Nuveen U.S. Equity Completeness Fund (continued)
June 30, 2010
| | | | | | | | | | | |
| Shares | | Description (1) | | | | | | | | Value |
| | | | | | | | | | | |
| | Commercial Banks (continued) | | | | | | | | | |
| | | | | |
| 250 | | First Financial Bancorp. | | | | | | | | $ | 3,738 |
| | | | | |
| 20 | | First Financial Bankshares, Inc. | | | | | | | | | 962 |
| | | | | |
| 60 | | First Midwest Bancorp, Inc. | | | | | | | | | 730 |
| | | | | |
| 170 | | FirstMerit Corporation | | | | | | | | | 2,912 |
| | | | | |
| 90 | | Fulton Financial Corporation | | | | | | | | | 869 |
| | | | | |
| 10 | | German American Bancorp, Inc. | | | | | | | | | 153 |
| | | | | |
| 130 | | Glacier Bancorp, Inc. | | | | | | | | | 1,907 |
| | | | | |
| 20 | | Great Southern Bancorp. | | | | | | | | | 406 |
| | | | | |
| 30 | | Hancock Holding Company | | | | | | | | | 1,001 |
| | | | | |
| 90 | | Heartland Financial USA, Inc. | | | | | | | | | 1,555 |
| | | | | |
| 99 | | Home Bancshares, Inc. | | | | | | | | | 2,258 |
| | | | | |
| 530 | | Huntington BancShares Inc. | | | | | | | | | 2,936 |
| | | | | |
| 30 | | IberiaBank Corporation | | | | | | | | | 1,544 |
| | | | | |
| 10 | | Independent Bank Corporation | | | | | | | | | 247 |
| | | | | |
| 90 | | International Bancshares Corporation | | | | | | | | | 1,502 |
| | | | | |
| 720 | | KeyCorp. | | | | | | | | | 5,537 |
| | | | | |
| 70 | | Lakeland Financial Corporation | | | | | | | | | 1,399 |
| | | | | |
| 50 | | M&T Bank Corporation | | | | | | | | | 4,248 |
| | | | | |
| 240 | | Marshall and Ilsley Corporation | | | | | | | | | 1,723 |
| | | | | |
| 50 | | MB Financial, Inc. | | | | | | | | | 920 |
| | | | | |
| 80 | | National Penn Bancshares, Inc. | | | | | | | | | 481 |
| | | | | |
| 20 | | NBT Bancorp, Inc. | | | | | | | | | 408 |
| | | | | |
| 210 | | Northfield Bancorp Inc. | | | | | | | | | 2,726 |
| | | | | |
| 60 | | Old National Bancorp. | | | | | | | | | 622 |
| | | | | |
| 100 | | Oriental Financial Group Inc. | | | | | | | | | 1,266 |
| | | | | |
| 10 | | Orrstown Financial Services Inc. | | | | | | | | | 221 |
| | | | | |
| 30 | | Pacwest Bancorp. | | | | | | | | | 549 |
| | | | | |
| 10 | | Pinnacle Financial Partners, Inc., (2) | | | | | | | | | 129 |
| | | | | |
| 340 | | PNC Financial Services Group, Inc. | | | | | | | | | 19,210 |
| | | | | |
| 30 | | Privatebancorp, Inc. | | | | | | | | | 332 |
| | | | | |
| 70 | | Prosperity Bancshares, Inc. | | | | | | | | | 2,433 |
| | | | | |
| 790 | | Regions Financial Corporation | | | | | | | | | 5,198 |
| | | | | |
| 70 | | SCBT Financial Corporation | | | | | | | | | 2,465 |
| | | | | |
| 70 | | Signature Bank, (2) | | | | | | | | | 2,661 |
| | | | | |
| 20 | | Simmons First National Corporation | | | | | | | | | 525 |
| | | | | |
| 350 | | SunTrust Banks, Inc. | | | | | | | | | 8,155 |
| | | | | |
| 140 | | Susquehanna Bancshs Inc. | | | | | | | | | 1,166 |
| | | | | |
| 120 | | SVB Financial Group, (2) | | | | | | | | | 4,948 |
| | | | | |
| 10 | | SY Bancorp, Inc. | | | | | | | | | 230 |
| | | | | |
| 170 | | Synovus Financial Corp. | | | | | | | | | 432 |
| | | | | |
| 190 | | TCF Financial Corporation | | | | | | | | | 3,156 |
| | | | | |
| 70 | | Texas Capital BancShares, Inc., (2) | | | | | | | | | 1,148 |
| | | | | |
| 180 | | Trustmark Corporation | | | | | | | | | 3,748 |
| | | | | |
| 1,100 | | U.S. Bancorp | | | | | | | | | 24,585 |
| | | | | |
| 30 | | UMB Financial Corporation | | | | | | | | | 1,067 |
| | | | | | | | | | | |
| Shares | | Description (1) | | | | | | | | Value |
| | | | | | | | | | | |
| | Commercial Banks (continued) | | | | | | | | | |
| | | | | |
| 100 | | Umpqua Holdings Corporation | | | | | | | | $ | 1,148 |
| | | | | |
| 50 | | United Bankshares, Inc. | | | | | | | | | 1,197 |
| | | | | |
| 40 | | United Community Banks, Inc., (2) | | | | | | | | | 158 |
| | | | | |
| 10 | | Univest Corporation of Pennsylvania | | | | | | | | | 173 |
| | | | | |
| 220 | | Valley National Bancorp. | | | | | | | | | 2,996 |
| | | | | |
| 30 | | Washington Trust Bancorp, Inc. | | | | | | | | | 511 |
| | | | | |
| 90 | | Webster Financial Corporation | | | | | | | | | 1,615 |
| | | | | |
| 3,310 | | Wells Fargo & Company | | | | | | | | | 84,736 |
| | | | | |
| 60 | | Westamerica Bancorp. | | | | | | | | | 3,151 |
| | | | | |
| 20 | | Whitney Holding Corporation | | | | | | | | | 185 |
| | | | | |
| 140 | | Wilmington Trust Corporation | | | | | | | | | 1,553 |
| | | | | |
| 240 | | Wilshire Bancorp, Inc. | | | | | | | | | 2,100 |
| | | | | |
| 50 | | Wintrust Financial Corporation | | | | | | | | | 1,667 |
| | Total Commercial Banks | | | | | | | | | 278,324 |
| | Commercial Services & Supplies – 0.8% | | | | | | | | | |
| | | | | |
| 50 | | ABM Industries Inc. | | | | | | | | | 1,048 |
| | | | | |
| 170 | | American Ecology Corporation | | | | | | | | | 2,477 |
| | | | | |
| 410 | | American Reprographics Co, (2) | | | | | | | | | 3,579 |
| | | | | |
| 60 | | Brinks Company | | | | | | | | | 1,142 |
| | | | | |
| 340 | | Cenveo Inc., (2) | | | | | | | | | 1,863 |
| | | | | |
| 200 | | Cintas Corporation | | | | | | | | | 4,794 |
| | | | | |
| 70 | | Cornell Companies Inc., (2) | | | | | | | | | 1,881 |
| | | | | |
| 200 | | Corrections Corporation of America, (2) | | | | | | | | | 3,816 |
| | | | | |
| 30 | | Covanta Holding Corporation | | | | | | | | | 498 |
| | | | | |
| 50 | | EnerNOC, Inc., (2) | | | | | | | | | 1,572 |
| | | | | |
| 70 | | Geo Group Inc., (2) | | | | | | | | | 1,453 |
| | | | | |
| 60 | | Healthcare Services Group, Inc. | | | | | | | | | 1,137 |
| | | | | |
| 20 | | HNI Corporation | | | | | | | | | 552 |
| | | | | |
| 80 | | Interface, Inc. | | | | | | | | | 859 |
| | | | | |
| 50 | | Kimball International Inc., Class B | | | | | | | | | 277 |
| | | | | |
| 20 | | McGrath Rentcorp. | | | | | | | | | 456 |
| | | | | |
| 420 | | Metalico Inc., (2) | | | | | | | | | 1,672 |
| | | | | |
| 30 | | Mine Safety Appliances Company | | | | | | | | | 743 |
| | | | | |
| 250 | | Pitney Bowes Inc. | | | | | | | | | 5,490 |
| | | | | |
| 170 | | Republic Services, Inc. | | | | | | | | | 5,054 |
| | | | | |
| 40 | | Sykes Enterprises Inc., (2) | | | | | | | | | 569 |
| | | | | |
| 130 | | Tetra Tech, Inc., (2) | | | | | | | | | 2,549 |
| | | | | |
| 20 | | Viad Corporation | | | | | | | | | 353 |
| | | | | |
| 130 | | Waste Management, Inc. | | | | | | | | | 4,068 |
| | Total Commercial Services & Supplies | | | | | | | | | 47,902 |
| | Communications Equipment – 1.2% | | | | | | | | | |
| | | | | |
| 10 | | ADC Telecommunications Inc., (2) | | | | | | | | | 74 |
| | | | | |
| 160 | | ADTRAN, Inc. | | | | | | | | | 4,363 |
| | | | | |
| 40 | | Anaren Microwave Inc., (2) | | | | | | | | | 598 |
| | | | | |
| 120 | | Aruba Networks, Inc., (2) | | | | | | | | | 1,709 |
Portfolio of Investments
Nuveen U.S. Equity Completeness Fund (continued)
June 30, 2010
| | | | | | | | | | | |
| Shares | | Description (1) | | | | | | | | Value |
| | | | | | | | | | | |
| | Communications Equipment (continued) | | | | | | | | | |
| | | | | |
| 110 | | Bel Fuse, Inc., Class B | | | | | | | | $ | 1,816 |
| | | | | |
| 70 | | Blue Coat Systems Inc., (2) | | | | | | | | | 1,430 |
| | | | | |
| 740 | | Cisco Systems, Inc., (2) | | | | | | | | | 15,769 |
| | | | | |
| 30 | | Comtech Telecom Corporation, (2) | | | | | | | | | 898 |
| | | | | |
| 10 | | Digi International, Inc., (2) | | | | | | | | | 83 |
| | | | | |
| 40 | | EMS Tech Inc., (2) | | | | | | | | | 601 |
| | | | | |
| 240 | | Emulex Corporation, (2) | | | | | | | | | 2,203 |
| | | | | |
| 50 | | Extreme Networks Inc., (2) | | | | | | | | | 135 |
| | | | | |
| 180 | | Harmonic Inc., (2) | | | | | | | | | 979 |
| | | | | |
| 20 | | Hughes Communications, Inc., (2) | | | | | | | | | 487 |
| | | | | |
| 150 | | Infinera Corporation, (2) | | | | | | | | | 965 |
| | | | | |
| 40 | | Interdigital Inc., (2) | | | | | | | | | 988 |
| | | | | |
| 460 | | JDS Uniphase Corporation, (2) | | | | | | | | | 4,526 |
| | | | | |
| 120 | | Juniper Networks Inc., (2) | | | | | | | | | 2,738 |
| | | | | |
| 20 | | Loral Space & Communications, Inc., (2) | | | | | | | | | 854 |
| | | | | |
| 1,230 | | Motorola, Inc., (2) | | | | | | | | | 8,020 |
| | | | | |
| 20 | | Netgear, Inc., (2) | | | | | | | | | 357 |
| | | | | |
| 70 | | Oplink Communications, Inc., (2) | | | | | | | | | 1,003 |
| | | | | |
| 90 | | Plantronics Inc. | | | | | | | | | 2,574 |
| | | | | |
| 130 | | Polycom Inc., (2) | | | | | | | | | 3,873 |
| | | | | |
| 170 | | QUALCOMM Inc. | | | | | | | | | 5,583 |
| | | | | |
| 60 | | Riverbed Technology, Inc., (2) | | | | | | | | | 1,657 |
| | | | | |
| 80 | | ShoreTel, Inc., (2) | | | | | | | | | 371 |
| | | | | |
| 490 | | Sonus Networks, Inc., (2) | | | | | | | | | 1,328 |
| | | | | |
| 40 | | Sycamore Networks, Inc., (2) | | | | | | | | | 665 |
| | | | | |
| 80 | | Symmetricom Inc., (2) | | | | | | | | | 407 |
| | | | | |
| 130 | | Tekelec, (2) | | | | | | | | | 1,721 |
| | | | | |
| 920 | | UTStarcom, Inc., (2) | | | | | | | | | 1,693 |
| | | | | |
| 40 | | ViaSat, Inc., (2) | | | | | | | | | 1,302 |
| | Total Communications Equipment | | | | | | | | | 71,770 |
| | Computers & Peripherals – 2.1% | | | | | | | | | |
| | | | | |
| 20 | | 3Par Inc., (2) | | | | | | | | | 186 |
| | | | | |
| 110 | | Adaptec Inc., (2) | | | | | | | | | 318 |
| | | | | |
| 180 | | Apple, Inc., (2) | | | | | | | | | 45,275 |
| | | | | |
| 10 | | Compellent Technologies Inc., (2) | | | | | | | | | 121 |
| | | | | |
| 230 | | Dell Inc., (2) | | | | | | | | | 2,774 |
| | | | | |
| 130 | | Diebold Inc. | | | | | | | | | 3,543 |
| | | | | |
| 60 | | Electronics For Imaging, (2) | | | | | | | | | 585 |
| | | | | |
| 550 | | EMC Corporation, (2) | | | | | | | | | 10,065 |
| | | | | |
| 810 | | Hewlett-Packard Company | | | | | | | | | 35,057 |
| | | | | |
| 230 | | Imation Corporation, (2) | | | | | | | | | 2,114 |
| | | | | |
| 60 | | Immersion Corporation, (2) | | | | | | | | | 304 |
| | | | | |
| 170 | | Intermec Inc, (2) | | | | | | | | | 1,743 |
| | | | | |
| 20 | | Isilon Systems, Inc., (2) | | | | | | | | | 257 |
| | | | | |
| 30 | | Netezza Corporation, (2) | | | | | | | | | 410 |
| | | | | | | | | | | |
| Shares | | Description (1) | | | | | | | | Value |
| | | | | | | | | | | |
| | Computers & Peripherals (continued) | | | | | | | | | |
| | | | | |
| 10 | | Network Appliance Inc., (2) | | | | | | | | $ | 373 |
| | | | | |
| 60 | | Novatel Wireless, (2) | | | | | | | | | 344 |
| | | | | |
| 320 | | Quantum Corporation, (2) | | | | | | | | | 602 |
| | | | | |
| 90 | | SanDisk Corporation, (2) | | | | | | | | | 3,786 |
| | | | | |
| 810 | | Seagate Technology, (2) | | | | | | | | | 10,562 |
| | | | | |
| 300 | | Silicon Graphics International Corporation, (2) | | | | | | | | | 2,124 |
| | | | | |
| 110 | | Stratasys, Inc., (2) | | | | | | | | | 2,702 |
| | | | | |
| 20 | | Synaptics, Inc., (2) | | | | | | | | | 550 |
| | | | | |
| 60 | | Western Digital Corporation, (2) | | | | | | | | | 1,810 |
| | Total Computers & Peripherals | | | | | | | | | 125,605 |
| | Construction & Engineering – 0.2% | | | | | | | | | |
| | | | | |
| 110 | | Comfort Systems USA Inc. | | | | | | | | | 1,063 |
| | | | | |
| 70 | | Emcor Group Inc., (2) | | | | | | | | | 1,622 |
| | | | | |
| 10 | | Insituform Technologies, Inc., (2) | | | | | | | | | 205 |
| | | | | |
| 10 | | Jacobs Engineering Group, Inc., (2) | | | | | | | | | 364 |
| | | | | |
| 70 | | KBR Inc. | | | | | | | | | 1,424 |
| | | | | |
| 40 | | Michael Baker Corporation, (2) | | | | | | | | | 1,396 |
| | | | | |
| 10 | | MYR Group Inc., (2) | | | | | | | | | 167 |
| | | | | |
| 50 | | Orion Marine Group Inc., (2) | | | | | | | | | 710 |
| | | | | |
| 10 | | Pike Electric Corporation, (2) | | | | | | | | | 94 |
| | | | | |
| 10 | | Quanta Services Incorporated, (2) | | | | | | | | | 207 |
| | | | | |
| 60 | | Shaw Group Inc., (2) | | | | | | | | | 2,053 |
| | | | | |
| 80 | | Sterling Construction Company, Inc., (2) | | | | | | | | | 1,035 |
| | | | | |
| 40 | | URS Corporation, (2) | | | | | | | | | 1,574 |
| | Total Construction & Engineering | | | | | | | | | 11,914 |
| | Construction Materials – 0.0% | | | | | | | | | |
| | | | | |
| 10 | | Eagle Materials Inc. | | | | | | | | | 259 |
| | | | | |
| 10 | | Martin Marietta Materials | | | | | | | | | 848 |
| | | | | |
| 40 | | Vulcan Materials Company | | | | | | | | | 1,753 |
| | Total Construction Materials | | | | | | | | | 2,860 |
| | Consumer Finance – 0.8% | | | | | | | | | |
| | | | | |
| 140 | | Advance America Cash Advance Centers Inc | | | | | | | | | 578 |
| | | | | |
| 500 | | American Express Company | | | | | | | | | 19,850 |
| | | | | |
| 50 | | Americredit Corp., (2) | | | | | | | | | 911 |
| | | | | |
| 280 | | Capital One Financial Corporation | | | | | | | | | 11,284 |
| | | | | |
| 140 | | Cardtronics Inc., (2) | | | | | | | | | 1,814 |
| | | | | |
| 510 | | Discover Financial Services | | | | | | | | | 7,130 |
| | | | | |
| 70 | | EZCORP, Inc., (2) | | | | | | | | | 1,299 |
| | | | | |
| 190 | | First Cash Financial Services, Inc., (2) | | | | | | | | | 4,142 |
| | | | | |
| 340 | | SLM Corporation, (2) | | | | | | | | | 3,533 |
| | Total Consumer Finance | | | | | | | | | 50,541 |
| | Containers & Packaging – 0.2% | | | | | | | | | |
| | | | | |
| 10 | | AEP Industries, Inc., (2) | | | | | | | | | 239 |
| | | | | |
| 60 | | Ball Corporation | | | | | | | | | 3,170 |
| | | | | |
| 10 | | Bemis Company, Inc. | | | | | | | | | 270 |
Portfolio of Investments
Nuveen U.S. Equity Completeness Fund (continued)
June 30, 2010
| | | | | | | | | | | |
| Shares | | Description (1) | | | | | | | | Value |
| | | | | | | | | | | |
| | Containers & Packaging (continued) | | | | | | | | | |
| | | | | |
| 20 | | Packaging Corp. of America | | | | | | | | $ | 440 |
| | | | | |
| 10 | | Pactiv Corporation, (2) | | | | | | | | | 279 |
| | | | | |
| 90 | | Rock-Tenn Company | | | | | | | | | 4,470 |
| | | | | |
| 180 | | Sealed Air Corporation | | | | | | | | | 3,550 |
| | | | | |
| 20 | | Silgan Holdings, Inc. | | | | | | | | | 568 |
| | | | | |
| 20 | | Sonoco Products Company | | | | | | | | | 610 |
| | | | | |
| 40 | | Temple-Inland Inc. | | | | | | | | | 827 |
| | Total Containers & Packaging | | | | | | | | | 14,423 |
| | Distributors – 0.1% | | | | | | | | | |
| | | | | |
| 100 | | Core-Mark Holding Company, Inc., (2) | | | | | | | | | 2,740 |
| | | | | |
| 70 | | Genuine Parts Company | | | | | | | | | 2,762 |
| | | | | |
| 170 | | LKQ Corporation, (2) | | | | | | | | | 3,278 |
| | Total Distributors | | | | | | | | | 8,780 |
| | Diversified Consumer Services – 0.4% | | | | | | | | | |
| | | | | |
| 20 | | American Public Education Inc., (2) | | | | | | | | | 874 |
| | | | | |
| 20 | | Capella Education Company, (2) | | | | | | | | | 1,627 |
| | | | | |
| 70 | | Chinacast Education Corporation, (2) | | | | | | | | | 416 |
| | | | | |
| 60 | | Coinstar Inc., (2) | | | | | | | | | 2,578 |
| | | | | |
| 50 | | Corinthian Colleges Inc., (2) | | | | | | | | | 493 |
| | | | | |
| 30 | | Devry, Inc. | | | | | | | | | 1,575 |
| | | | | |
| 90 | | Grand Canyon Education Inc., (2) | | | | | | | | | 2,109 |
| | | | | |
| 210 | | H & R Block Inc. | | | | | | | | | 3,295 |
| | | | | |
| 10 | | K12, Inc., (2) | | | | | | | | | 222 |
| | | | | |
| 20 | | Lincoln Educational Services Corporation, (2) | | | | | | | | | 412 |
| | | | | |
| 40 | | Matthews International Corporation | | | | | | | | | 1,171 |
| | | | | |
| 150 | | Regis Corporation | | | | | | | | | 2,336 |
| | | | | |
| 170 | | Service Corporation International | | | | | | | | | 1,258 |
| | | | | |
| 140 | | Sothebys Holdings Inc. | | | | | | | | | 3,202 |
| | | | | |
| 120 | | Stewart Enterprises Class A | | | | | | | | | 649 |
| | | | | |
| 20 | | Weight Watcher's International Inc. | | | | | | | | | 514 |
| | Total Diversified Consumer Services | | | | | | | | | 22,731 |
| | Diversified Financial Services – 4.2% | | | | | | | | | |
| | | | | |
| 7,160 | | Bank of America Corporation | | | | | | | | | 102,889 |
| | | | | |
| 8,560 | | Citigroup Inc., (2) | | | | | | | | | 32,186 |
| | | | | |
| 20 | | CME Group, Inc. | | | | | | | | | 5,631 |
| | | | | |
| 30 | | Encore Capital Group, Inc., (2) | | | | | | | | | 618 |
| | | | | |
| 90 | | Interactive Brokers Group, Inc., (2) | | | | | | | | | 1,494 |
| | | | | |
| 2,340 | | JP Morgan Chase & Co. | | | | | | | | | 85,667 |
| | | | | |
| 80 | | Leucadia National Corporation, (2) | | | | | | | | | 1,561 |
| | | | | |
| 20 | | Life Partners Holdings, Inc. | | | | | | | | | 409 |
| | | | | |
| 30 | | Marketaxess | | | | | | | | | 414 |
| | | | | |
| 30 | | Moody's Corporation | | | | | | | | | 598 |
| | | | | |
| 10 | | MSCI Inc., Class A Shares, (2) | | | | | | | | | 274 |
| | | | | |
| 190 | | Nasdaq Stock Market, Inc., (2) | | | | | | | | | 3,378 |
| | | | | |
| 340 | | New York Stock Exchange Euronext | | | | | | | | | 9,394 |
| | | | | | | | | | | |
| Shares | | Description (1) | | | | | | | | Value |
| | | | | | | | | | | |
| | Diversified Financial Services (continued) | | | | | | | | | |
| | | | | |
| 320 | | PHH Corporation, (2) | | | | | | | | $ | 6,093 |
| | | | | |
| 10 | | Porfolio Recovery Associates, Inc., (2) | | | | | | | | | 668 |
| | Total Diversified Financial Services | | | | | | | | | 251,274 |
| | Diversified Telecommunication Services – 3.2% | | | | | | | | | |
| | | | | |
| 30 | | Abovenet Communications, (2) | | | | | | | | | 1,415 |
| | | | | |
| 370 | | Alaska Communications Systems Group Inc. | | | | | | | | | 3,141 |
| | | | | |
| 4,080 | | AT&T Inc. | | | | | | | | | 98,695 |
| | | | | |
| 10 | | Cbeyond Inc., (2) | | | | | | | | | 125 |
| | | | | |
| 270 | | CenturyTel, Inc. | | | | | | | | | 8,994 |
| | | | | |
| 30 | | Cogent Communications Group, Inc., (2) | | | | | | | | | 227 |
| | | | | |
| 290 | | Consolidated Communications Holdings, Inc. | | | | | | | | | 4,933 |
| | | | | |
| 30 | | Frontier Communications Corporation | | | | | | | | | 213 |
| | | | | |
| 40 | | General Communication, Inc., (2) | | | | | | | | | 304 |
| | | | | |
| 60 | | Global Crossing Limited, (2) | | | | | | | | | 634 |
| | | | | |
| 30 | | Neutral Tandem Inc., (2) | | | | | | | | | 338 |
| | | | | |
| 1,410 | | Qwest Communications International Inc. | | | | | | | | | 7,403 |
| | | | | |
| 2,260 | | Verizon Communications Inc. | | | | | | | | | 63,325 |
| | | | | |
| 40 | | Windstream Corporation | | | | | | | | | 422 |
| | Total Diversified Telecommunication Services | | | | | | | | | 190,169 |
| | Electric Utilities – 2.6% | | | | | | | | | |
| | | | | |
| 40 | | ALLETE Inc | | | | | | | | | 1,370 |
| | | | | |
| 660 | | American Electric Power Company, Inc. | | | | | | | | | 21,318 |
| | | | | |
| 70 | | Cleco Corporation | | | | | | | | | 1,849 |
| | | | | |
| 10 | | DPL Inc. | | | | | | | | | 239 |
| | | | | |
| 1,440 | | Duke Energy Corporation | | | | | | | | | 23,040 |
| | | | | |
| 270 | | Edison International | | | | | | | | | 8,564 |
| | | | | |
| 130 | | Entergy Corporation | | | | | | | | | 9,311 |
| | | | | |
| 440 | | Exelon Corporation | | | | | | | | | 16,707 |
| | | | | |
| 270 | | FirstEnergy Corp. | | | | | | | | | 9,512 |
| | | | | |
| 20 | | Great Plains Energy Incorporated | | | | | | | | | 340 |
| | | | | |
| 60 | | IDACORP, INC | | | | | | | | | 1,996 |
| | | | | |
| 10 | | ITC Holdings Corporation | | | | | | | | | 529 |
| | | | | |
| 30 | | MGE Energy, Inc. | | | | | | | | | 1,081 |
| | | | | |
| 230 | | NextEra Energy Inc. | | | | | | | | | 11,215 |
| | | | | |
| 130 | | Northeast Utilities | | | | | | | | | 3,312 |
| | | | | |
| 180 | | Pepco Holdings, Inc. | | | | | | | | | 2,822 |
| | | | | |
| 120 | | Pinnacle West Capital Corporation | | | | | | | | | 4,363 |
| | | | | |
| 80 | | PNM Resources Inc. | | | | | | | | | 894 |
| | | | | |
| 100 | | Portland General Electric Company | | | | | | | | | 1,833 |
| | | | | |
| 20 | | PPL Corporation | | | | | | | | | 499 |
| | | | | |
| 220 | | Progress Energy, Inc. | | | | | | | | | 8,628 |
| | | | | |
| 590 | | Southern Company | | | | | | | | | 19,635 |
| | | | | |
| 30 | | Unisource Energy Corporation | | | | | | | | | 905 |
| | | | | |
| 80 | | Unitil Corp. | | | | | | | | | 1,673 |
| | | | | |
| 110 | | Westar Energy Inc. | | | | | | | | | 2,377 |
| | Total Electric Utilities | | | | | | | | | 154,012 |
Portfolio of Investments
Nuveen U.S. Equity Completeness Fund (continued)
June 30, 2010
| | | | | | | | | | | |
| Shares | | Description (1) | | | | | | | | Value |
| | | | | | | | | | | |
| | Electrical Equipment – 0.6% | | | | | | | | | |
| | | | | |
| 60 | | Acuity Brands Inc. | | | | | | | | $ | 2,183 |
| | | | | |
| 180 | | Advanced Battery Technologies Inc., (2) | | | | | | | | | 590 |
| | | | | |
| 20 | | American Superconductor Corporation, (2) | | | | | | | | | 534 |
| | | | | |
| 70 | | Ametek Inc. | | | | | | | | | 2,811 |
| | | | | |
| 50 | | AZZ Inc. | | | | | | | | | 1,839 |
| | | | | |
| 10 | | Belden Inc. | | | | | | | | | 220 |
| | | | | |
| 60 | | Brady Corporation | | | | | | | | | 1,495 |
| | | | | |
| 170 | | Emerson Electric Company | | | | | | | | | 7,427 |
| | | | | |
| 70 | | Encore Wire Corporation | | | | | | | | | 1,273 |
| | | | | |
| 70 | | Ener1 Inc., (2) | | | | | | | | | 237 |
| | | | | |
| 80 | | Franklin Electric Company, Inc. | | | | | | | | | 2,306 |
| | | | | |
| 220 | | Fuelcell Energy Inc., (2) | | | | | | | | | 260 |
| | | | | |
| 100 | | General Cable Corporation, (2) | | | | | | | | | 2,665 |
| | | | | |
| 160 | | GrafTech International Ltd., (2) | | | | | | | | | 2,339 |
| | | | | |
| 10 | | Hubbell Incorporated, Class B | | | | | | | | | 397 |
| | | | | |
| 10 | | II VI Inc., (2) | | | | | | | | | 296 |
| | | | | |
| 90 | | Regal-Beloit Corporation | | | | | | | | | 5,020 |
| | | | | |
| 60 | | Rockwell Automation, Inc. | | | | | | | | | 2,945 |
| | | | | |
| 70 | | Vicor Corporation | | | | | | | | | 874 |
| | | | | |
| 100 | | Woodward Governor Company | | | | | | | | | 2,553 |
| | Total Electrical Equipment | | | | | | | | | 38,264 |
| | Electronic Equipment & Instruments – 0.9% | | | | | | | | | |
| | | | | |
| 80 | | Agilent Technologies, Inc., (2) | | | | | | | | | 2,274 |
| | | | | |
| 60 | | Amphenol Corporation, Class A | | | | | | | | | 2,357 |
| | | | | |
| 30 | | Anixter International Inc., (2) | | | | | | | | | 1,278 |
| | | | | |
| 110 | | Arrow Electronics, Inc., (2) | | | | | | | | | 2,459 |
| | | | | |
| 70 | | Avnet Inc., (2) | | | | | | | | | 1,688 |
| | | | | |
| 180 | | Brightpoint Inc., (2) | | | | | | | | | 1,260 |
| | | | | |
| 130 | | Checkpoint Systems Inc., (2) | | | | | | | | | 2,257 |
| | | | | |
| 40 | | China Security and Surveillance Techology Inc., (2) | | | | | | | | | 185 |
| | | | | |
| 160 | | Cogent Inc., (2) | | | | | | | | | 1,442 |
| | | | | |
| 30 | | Comverge, Inc., (2) | | | | | | | | | 269 |
| | | | | |
| 420 | | Corning Incorporated | | | | | | | | | 6,783 |
| | | | | |
| 70 | | Daktronics Inc. | | | | | | | | | 525 |
| | | | | |
| 30 | | Dolby Laboratories, Inc., (2) | | | | | | | | | 1,881 |
| | | | | |
| 50 | | Electro Scientific Industries Inc., (2) | | | | | | | | | 668 |
| | | | | |
| 390 | | Jabil Circuit Inc. | | | | | | | | | 5,187 |
| | | | | |
| 170 | | L-1 Identity Solutions Inc., (2) | | | | | | | | | 1,392 |
| | | | | |
| 270 | | Methode Electronics, Inc. | | | | | | | | | 2,630 |
| | | | | |
| 450 | | Microvision, Inc., (2) | | | | | | | | | 1,332 |
| | | | | |
| 80 | | Newport Corporation, (2) | | | | | | | | | 725 |
| | | | | |
| 40 | | OSI Systems Inc., (2) | | | | | | | | | 1,111 |
| | | | | |
| 60 | | Plexus Corporation, (2) | | | | | | | | | 1,604 |
| | | | | |
| 250 | | Power One Inc, (2) | | | | | | | | | 1,688 |
| | | | | |
| 10 | | Rofin Sinar Technologies Inc., (2) | | | | | | | | | 208 |
| | | | | | | | | | | |
| Shares | | Description (1) | | | | | | | | Value |
| | | | | | | | | | | |
| | Electronic Equipment & Instruments (continued) | | | | | | | | | |
| | | | | |
| 100 | | ScanSource, Inc., (2) | | | | | | | | $ | 2,493 |
| | | | | |
| 120 | | SYNNEX Corporation, (2) | | | | | | | | | 3,074 |
| | | | | |
| 120 | | Tech Data Corporation, (2) | | | | | | | | | 4,274 |
| | | | | |
| 190 | | TTM Technologies, Inc., (2) | | | | | | | | | 1,805 |
| | | | | |
| 270 | | Vishay Intertechnology Inc., (2) | | | | | | | | | 2,090 |
| | Total Electronic Equipment & Instruments | | | | | | | | | 54,939 |
| | Energy Equipment & Services – 1.7% | | | | | | | | | |
| | | | | |
| 20 | | Atwood Oceanics Inc., (2) | | | | | | | | | 510 |
| | | | | |
| 286 | | Baker Hughes Incorporated | | | | | | | | | 11,889 |
| | | | | |
| 150 | | Bristow Group Inc., (2) | | | | | | | | | 4,410 |
| | | | | |
| 30 | | Carbo Ceramics Inc. | | | | | | | | | 2,166 |
| | | | | |
| 180 | | Cooper Cameron Corporation, (2) | | | | | | | | | 5,854 |
| | | | | |
| 90 | | Dawson Geophysical Company, (2) | | | | | | | | | 1,914 |
| | | | | |
| 70 | | Diamond Offshore Drilling, Inc. | | | | | | | | | 4,353 |
| | | | | |
| 50 | | Dril Quip Inc., (2) | | | | | | | | | 2,201 |
| | | | | |
| 380 | | Global Industries, Limited, (2) | | | | | | | | | 1,706 |
| | | | | |
| 20 | | Gulf Island Fabrication, Inc. | | | | | | | | | 310 |
| | | | | |
| 440 | | Halliburton Company | | | | | | | | | 10,802 |
| | | | | |
| 40 | | Helix Energy Solutions Group, (2) | | | | | | | | | 431 |
| | | | | |
| 90 | | Helmerich & Payne Inc. | | | | | | | | | 3,287 |
| | | | | |
| 90 | | Hercules Offshore Inc., (2) | | | | | | | | | 219 |
| | | | | |
| 200 | | ION Geophysical Corporation, (2) | | | | | | | | | 696 |
| | | | | |
| 60 | | Lufkin Industries Inc. | | | | | | | | | 2,339 |
| | | | | |
| 190 | | Matrix Service Company, (2) | | | | | | | | | 1,769 |
| | | | | |
| 200 | | Nabors Industries Inc., (2) | | | | | | | | | 3,524 |
| | | | | |
| 240 | | National-Oilwell Varco Inc. | | | | | | | | | 7,937 |
| | | | | |
| 20 | | Natural Gas Services Group, (2) | | | | | | | | | 303 |
| | | | | |
| 40 | | Parker Drilling Company, (2) | | | | | | | | | 158 |
| | | | | |
| 10 | | PHI Inc Non-Voting, (2) | | | | | | | | | 141 |
| | | | | |
| 20 | | Pioneer Drilling Company, (2) | | | | | | | | | 113 |
| | | | | |
| 160 | | Pride International Inc., (2) | | | | | | | | | 3,574 |
| | | | | |
| 60 | | Rowan Companies Inc., (2) | | | | | | | | | 1,316 |
| | | | | |
| 110 | | RPC Inc. | | | | | | | | | 1,502 |
| | | | | |
| 330 | | Schlumberger Limited | | | | | | | | | 18,262 |
| | | | | |
| 10 | | SeaCor Smit Inc., (2) | | | | | | | | | 707 |
| | | | | |
| 50 | | Smith International, Inc. | | | | | | | | | 1,883 |
| | | | | |
| 10 | | Superior Energy Services, Inc., (2) | | | | | | | | | 187 |
| | | | | |
| 250 | | Superior Well Services, Inc., (2) | | | | | | | | | 4,180 |
| | | | | |
| 100 | | T-3 Energy Services, Inc., (2) | | | | | | | | | 2,790 |
| | | | | |
| 10 | | Tidewater Inc. | | | | | | | | | 387 |
| | | | | |
| 10 | | Willbros Group Inc., (2) | | | | | | | | | 74 |
| | Total Energy Equipment & Services | | | | | | | | | 101,894 |
| | Food & Staples Retailing – 1.3% | | | | | | | | | |
| | | | | |
| 100 | | Andersons, Inc. | | | | | | | | | 3,259 |
| | | | | |
| 80 | | Costco Wholesale Corporation | | | | | | | | | 4,386 |
| | | | | |
| 580 | | CVS Caremark Corporation | | | | | | | | | 17,006 |
Portfolio of Investments
Nuveen U.S. Equity Completeness Fund (continued)
June 30, 2010
| | | | | | | | | | | |
| Shares | | Description (1) | | | | | | | | Value |
| | | | | | | | | | | |
| | Food & Staples Retailing (continued) | | | | | | | | | |
| | | | | |
| 190 | | Kroger Co. | | | | | | | | $ | 3,741 |
| | | | | |
| 10 | | Nash Finch Company | | | | | | | | | 342 |
| | | | | |
| 40 | | Pantry, Inc., (2) | | | | | | | | | 564 |
| | | | | |
| 80 | | PriceSmart, Inc. | | | | | | | | | 1,858 |
| | | | | |
| 110 | | Ruddick Corporation | | | | | | | | | 3,409 |
| | | | | |
| 510 | | Safeway Inc. | | | | | | | | | 10,027 |
| | | | | |
| 40 | | Spartan Stores, Inc. | | | | | | | | | 549 |
| | | | | |
| 20 | | SUPERVALU INC. | | | | | | | | | 217 |
| | | | | |
| 100 | | Sysco Corporation | | | | | | | | | 2,857 |
| | | | | |
| 60 | | United Natural Foods Inc., (2) | | | | | | | | | 1,793 |
| | | | | |
| 190 | | Walgreen Co. | | | | | | | | | 5,073 |
| | | | | |
| 410 | | Wal-Mart Stores, Inc. | | | | | | | | | 19,709 |
| | | | | |
| 70 | | Whole Foods Market, Inc., (2) | | | | | | | | | 2,521 |
| | Total Food & Staples Retailing | | | | | | | | | 77,311 |
| | Food Products – 1.7% | | | | | | | | | |
| | | | | |
| 140 | | AgFeed Industries Inc., (2) | | | | | | | | | 410 |
| | | | | |
| 230 | | Archer-Daniels-Midland Company | | | | | | | | | 5,939 |
| | | | | |
| 60 | | Bunge Limited | | | | | | | | | 2,951 |
| | | | | |
| 50 | | Campbell Soup Company | | | | | | | | | 1,792 |
| | | | | |
| 10 | | Chiquita Brands International Inc., (2) | | | | | | | | | 122 |
| | | | | |
| 290 | | ConAgra Foods, Inc. | | | | | | | | | 6,763 |
| | | | | |
| 10 | | Corn Products International, Inc. | | | | | | | | | 303 |
| | | | | |
| 30 | | Darling International Inc., (2) | | | | | | | | | 225 |
| | | | | |
| 30 | | Dean Foods Company, (2) | | | | | | | | | 302 |
| | | | | |
| 490 | | Del Monte Foods Company | | | | | | | | | 7,051 |
| | | | | |
| 20 | | Diamond Foods Inc. | | | | | | | | | 822 |
| | | | | |
| 30 | | Dole Food Company Inc., (2) | | | | | | | | | 313 |
| | | | | |
| 10 | | Flowers Foods Inc. | | | | | | | | | 244 |
| | | | | |
| 440 | | General Mills, Inc. | | | | | | | | | 15,629 |
| | | | | |
| 70 | | H.J. Heinz Company | | | | | | | | | 3,025 |
| | | | | |
| 10 | | Hain Celestial Group Inc., (2) | | | | | | | | | 202 |
| | | | | |
| 30 | | Hershey Foods Corporation | | | | | | | | | 1,438 |
| | | | | |
| 160 | | JM Smucker Company | | | | | | | | | 9,635 |
| | | | | |
| 40 | | Kellogg Company | | | | | | | | | 2,012 |
| | | | | |
| 730 | | Kraft Foods Inc. | | | | | | | | | 20,440 |
| | | | | |
| 30 | | Lancaster Colony Corporation | | | | | | | | | 1,601 |
| | | | | |
| 10 | | Lance, Inc. | | | | | | | | | 165 |
| | | | | |
| 60 | | Mead Johnson Nutrition Company, Class A Shares | | | | | | | | | 3,007 |
| | | | | |
| 30 | | Sanderson Farms Inc. | | | | | | | | | 1,522 |
| | | | | |
| 520 | | Sara Lee Corporation | | | | | | | | | 7,332 |
| | | | | |
| 20 | | Seneca Foods Corporation, (2) | | | | | | | | | 645 |
| | | | | |
| 40 | | Treehouse Foods Inc., (2) | | | | | | | | | 1,826 |
| | | | | |
| 170 | | Tyson Foods, Inc., Class A | | | | | | | | | 2,786 |
| | | | | |
| 200 | | Zhongpin Inc., (2) | | | | | | | | | 2,352 |
| | Total Food Products | | | | | | | | | 100,854 |
| | | | | | | | | | | |
| Shares | | Description (1) | | | | | | | | Value |
| | | | | | | | | | | |
| | Gas Utilities – 0.4% | | | | | | | | | |
| | | | | |
| 10 | | AGL Resources Inc. | | | | | | | | $ | 358 |
| | | | | |
| 130 | | Atmos Energy Corporation | | | | | | | | | 3,515 |
| | | | | |
| 50 | | Laclede Group Inc. | | | | | | | | | 1,657 |
| | | | | |
| 60 | | New Jersey Resources Corporation | | | | | | | | | 2,112 |
| | | | | |
| 50 | | Nicor Inc. | | | | | | | | | 2,025 |
| | | | | |
| 80 | | ONEOK, Inc. | | | | | | | | | 3,460 |
| | | | | |
| 80 | | Piedmont Natural Gas Company | | | | | | | | | 2,024 |
| | | | | |
| 170 | | Questar Corporation | | | | | | | | | 7,733 |
| | | | | |
| 10 | | South Jersey Industries Inc. | | | | | | | | | 430 |
| | | | | |
| 10 | | Southwest Gas Corporation | | | | | | | | | 295 |
| | | | | |
| 10 | | UGI Corporation | | | | | | | | | 254 |
| | | | | |
| 10 | | WGL Holdings Inc. | | | | | | | | | 340 |
| | Total Gas Utilities | | | | | | | | | 24,203 |
| | Health Care Equipment & Supplies – 1.7% | | | | | | | | | |
| | | | | |
| 30 | | Abaxis, Inc., (2) | | | | | | | | | 643 |
| | | | | |
| 70 | | Abiomed, Inc., (2) | | | | | | | | | 678 |
| | | | | |
| 230 | | Align Technology, Inc., (2) | | | | | | | | | 3,420 |
| | | | | |
| 210 | | Alphatec Holdings, Inc., (2) | | | | | | | | | 974 |
| | | | | |
| 110 | | American Medical Systems Holdings, Inc., (2) | | | | | | | | | 2,433 |
| | | | | |
| 20 | | AngioDynamics, Inc., (2) | | | | | | | | | 295 |
| | | | | |
| 100 | | Baxter International, Inc. | | | | | | | | | 4,064 |
| | | | | |
| 30 | | Beckman Coulter, Inc. | | | | | | | | | 1,809 |
| | | | | |
| 50 | | Becton, Dickinson and Company | | | | | | | | | 3,381 |
| | | | | |
| 630 | | Boston Scientific Corporation, (2) | | | | | | | | | 3,654 |
| | | | | |
| 250 | | CareFusion Corporation, (2) | | | | | | | | | 5,675 |
| | | | | |
| 40 | | Conceptus Inc., (2) | | | | | | | | | 623 |
| | | | | |
| 90 | | Cooper Companies, Inc. | | | | | | | | | 3,581 |
| | | | | |
| 30 | | Cyberonics, (2) | | | | | | | | | 710 |
| | | | | |
| 150 | | Delcath Systems, Inc., (2) | | | | | | | | | 951 |
| | | | | |
| 60 | | DENTSPLY International Inc. | | | | | | | | | 1,795 |
| | | | | |
| 20 | | DexCom, Inc., (2) | | | | | | | | | 231 |
| | | | | |
| 20 | | Edwards Lifesciences Corporation, (2) | | | | | | | | | 1,120 |
| | | | | |
| 40 | | Exactech, Inc., (2) | | | | | | | | | 683 |
| | | | | |
| 20 | | Haemonetics Corporation, (2) | | | | | | | | | 1,070 |
| | | | | |
| 20 | | Hill Rom Holdings Inc. | | | | | | | | | 609 |
| | | | | |
| 190 | | Hologic Inc., (2) | | | | | | | | | 2,647 |
| | | | | |
| 10 | | Hospira Inc., (2) | | | | | | | | | 575 |
| | | | | |
| 40 | | ICU Medical, Inc., (2) | | | | | | | | | 1,287 |
| | | | | |
| 120 | | Immucor, Inc., (2) | | | | | | | | | 2,286 |
| | | | | |
| 110 | | Insulet Corporation, (2) | | | | | | | | | 1,656 |
| | | | | |
| 40 | | Integra Lifesciences Holdings Corporation, (2) | | | | | | | | | 1,480 |
| | | | | |
| 10 | | Intuitive Surgical, Inc., (2) | | | | | | | | | 3,156 |
| | | | | |
| 70 | | Invacare Corporation | | | | | | | | | 1,452 |
| | | | | |
| 30 | | Inverness Medical Innovation, (2) | | | | | | | | | 800 |
| | | | | |
| 40 | | Kensey Nash Corporation, (2) | | | | | | | | | 948 |
Portfolio of Investments
Nuveen U.S. Equity Completeness Fund (continued)
June 30, 2010
| | | | | | | | | | | |
| Shares | | Description (1) | | | | | | | | Value |
| | | | | | | | | | | |
| | Health Care Equipment & Supplies (continued) | | | | | | | | | |
| | | | | |
| 30 | | Kinetic Concepts Inc., (2) | | | | | | | | $ | 1,095 |
| | | | | |
| 20 | | Mako Surgical Corporation, (2) | | | | | | | | | 249 |
| | | | | |
| 30 | | Masimo Corporation | | | | | | | | | 714 |
| | | | | |
| 30 | | Medical Action Industries, Inc., (2) | | | | | | | | | 360 |
| | | | | |
| 200 | | Medtronic, Inc. | | | | | | | | | 7,254 |
| | | | | |
| 40 | | Meridian Bioscience, Inc. | | | | | | | | | 680 |
| | | | | |
| 30 | | Merit Medical Systems, Inc., (2) | | | | | | | | | 482 |
| | | | | |
| 30 | | Micrus Endovascular Corporation, (2) | | | | | | | | | 624 |
| | | | | |
| 40 | | Natus Medical, Inc., (2) | | | | | | | | | 652 |
| | | | | |
| 90 | | Neogen Corporation, (2) | | | | | | | | | 2,345 |
| | | | | |
| 70 | | NuVasive, Inc., (2) | | | | | | | | | 2,482 |
| | | | | |
| 90 | | Nxstage Medical, Inc., (2) | | | | | | | | | 1,336 |
| | | | | |
| 370 | | OraSure Technologies, Inc., (2) | | | | | | | | | 1,713 |
| | | | | |
| 30 | | Orthofix International NV, (2) | | | | | | | | | 962 |
| | | | | |
| 70 | | Quidel Corporation, (2) | | | | | | | | | 888 |
| | | | | |
| 600 | | RTI Biologics Inc., (2) | | | | | | | | | 1,758 |
| | | | | |
| 60 | | Saint Jude Medical Inc., (2) | | | | | | | | | 2,165 |
| | | | | |
| 80 | | Somanetics Corporation, (2) | | | | | | | | | 1,996 |
| | | | | |
| 50 | | SonoSite, Inc., (2) | | | | | | | | | 1,356 |
| | | | | |
| 200 | | Stereotaxis, Inc., (2) | | | | | | | | | 662 |
| | | | | |
| 90 | | Steris Corporation | | | | | | | | | 2,797 |
| | | | | |
| 60 | | Stryker Corporation | | | | | | | | | 3,004 |
| | | | | |
| 10 | | Surmodics Inc., (2) | | | | | | | | | 164 |
| | | | | |
| 40 | | Teleflex Inc. | | | | | | | | | 2,171 |
| | | | | |
| 50 | | Thoratec Corporation, (2) | | | | | | | | | 2,137 |
| | | | | |
| 20 | | Varian Medical Systems, Inc., (2) | | | | | | | | | 1,046 |
| | | | | |
| 50 | | Volcano Corporation, (2) | | | | | | | | | 1,091 |
| | | | | |
| 40 | | West Pharmaceutical Services Inc. | | | | | | | | | 1,460 |
| | | | | |
| 40 | | Wright Medical Group, Inc., (2) | | | | | | | | | 664 |
| | | | | |
| 90 | | Zimmer Holdings, Inc., (2) | | | | | | | | | 4,865 |
| | | | | |
| 20 | | Zoll Medical Corporation, (2) | | | | | | | | | 542 |
| | Total Health Care Equipment & Supplies | | | | | | | | | 104,400 |
| | Health Care Providers & Services – 2.9% | | | | | | | | | |
| | | | | |
| 250 | | Aetna Inc. | | | | | | | | | 6,595 |
| | | | | |
| 60 | | Air Methods Corporation, (2) | | | | | | | | | 1,785 |
| | | | | |
| 70 | | Alliance Imaging Inc., (2) | | | | | | | | | 283 |
| | | | | |
| 10 | | Almost Family, Inc., (2) | | | | | | | | | 349 |
| | | | | |
| 80 | | Amedisys, Inc., (2) | | | | | | | | | 3,518 |
| | | | | |
| 50 | | American Dental Partners, Inc., (2) | | | | | | | | | 606 |
| | | | | |
| 60 | | AmericGroup Corporation, (2) | | | | | | | | | 1,949 |
| | | | | |
| 40 | | Assisted Living Concepts Inc., (2) | | | | | | | | | 1,184 |
| | | | | |
| 20 | | Bio-Reference Laboratories, Inc., (2) | | | | | | | | | 443 |
| | | | | |
| 70 | | Bioscrip, Inc., (2) | | | | | | | | | 367 |
| | | | | |
| 230 | | Cardinal Health, Inc. | | | | | | | | | 7,730 |
| | | | | |
| 60 | | Catalyst Health Soltuions Inc., (2) | | | | | | | | | 2,070 |
| | | | | | | | | | | |
| Shares | | Description (1) | | | | | | | | Value |
| | | | | | | | | | | |
| | Health Care Providers & Services (continued) | | | | | | | | | |
| | | | | |
| 50 | | Centene Corporation, (2) | | | | | | | | $ | 1,075 |
| | | | | |
| 30 | | Chemed Corporation | | | | | | | | | 1,639 |
| | | | | |
| 240 | | CIGNA Corporation | | | | | | | | | 7,454 |
| | | | | |
| 50 | | Community Health Systems, Inc., (2) | | | | | | | | | 1,691 |
| | | | | |
| 120 | | Coventry Health Care, Inc., (2) | | | | | | | | | 2,122 |
| | | | | |
| 210 | | Cross Country Healthcare, Inc., (2) | | | | | | | | | 1,888 |
| | | | | |
| 40 | | Davita Inc., (2) | | | | | | | | | 2,498 |
| | | | | |
| 90 | | Emergency Medical Services Corporation, (2) | | | | | | | | | 4,413 |
| | | | | |
| 60 | | Emeritus Corporation, (2) | | | | | | | | | 979 |
| | | | | |
| 100 | | Express Scripts, Inc., (2) | | | | | | | | | 4,702 |
| | | | | |
| 40 | | Genoptix Inc., (2) | | | | | | | | | 688 |
| | | | | |
| 40 | | Gentiva Health Services, Inc., (2) | | | | | | | | | 1,080 |
| | | | | |
| 570 | | Health Management Associates Inc., (2) | | | | | | | | | 4,429 |
| | | | | |
| 130 | | Health Net Inc., (2) | | | | | | | | | 3,168 |
| | | | | |
| 140 | | HealthSouth Corporation, (2) | | | | | | | | | 2,619 |
| | | | | |
| 80 | | HealthSpring, Inc., (2) | | | | | | | | | 1,241 |
| | | | | |
| 40 | | Henry Schein Inc., (2) | | | | | | | | | 2,196 |
| | | | | |
| 50 | | HMS Holdings Corporation, (2) | | | | | | | | | 2,711 |
| | | | | |
| 110 | | Humana Inc., (2) | | | | | | | | | 5,024 |
| | | | | |
| 90 | | Inventiv Health, Inc., (2) | | | | | | | | | 2,304 |
| | | | | |
| 30 | | IPC The Hospitalist Company, Inc., (2) | | | | | | | | | 753 |
| | | | | |
| 10 | | Kindred Healthcare Inc., (2) | | | | | | | | | 128 |
| | | | | |
| 10 | | Landauer Inc. | | | | | | | | | 609 |
| | | | | |
| 30 | | Lincare Holdings | | | | | | | | | 975 |
| | | | | |
| 60 | | Magellan Health Services, Inc., (2) | | | | | | | | | 2,179 |
| | | | | |
| 110 | | McKesson HBOC Inc. | | | | | | | | | 7,388 |
| | | | | |
| 10 | | Medax Inc., (2) | | | | | | | | | 556 |
| | | | | |
| 110 | | Medco Health Solutions, Inc., (2) | | | | | | | | | 6,059 |
| | | | | |
| 50 | | Omnicare, Inc. | | | | | | | | | 1,185 |
| | | | | |
| 130 | | Owens and Minor Inc. | | | | | | | | | 3,689 |
| | | | | |
| 60 | | Pharmerica Corporation, (2) | | | | | | | | | 880 |
| | | | | |
| 90 | | PSS World Medical Inc., (2) | | | | | | | | | 1,904 |
| | | | | |
| 90 | | Psychiatric Solutions, Inc., (2) | | | | | | | | | 2,945 |
| | | | | |
| 30 | | Quest Diagnostics Incorporated | | | | | | | | | 1,493 |
| | | | | |
| 70 | | RehabCare Group Inc., (2) | | | | | | | | | 1,525 |
| | | | | |
| 40 | | Select Medical Corporation, (2) | | | | | | | | | 271 |
| | | | | |
| 190 | | Sun Healthcare Group, Inc., (2) | | | | | | | | | 1,535 |
| | | | | |
| 810 | | UnitedHealth Group Incorporated | | | | | | | | | 23,004 |
| | | | | |
| 50 | | Universal Health Services, Inc., Class B | | | | | | | | | 1,908 |
| | | | | |
| 70 | | Wellcare Health Plans Inc., (2) | | | | | | | | | 1,662 |
| | | | | |
| 710 | | Wellpoint Inc., (2) | | | | | | | | | 34,740 |
| | Total Health Care Providers & Services | | | | | | | | | 176,188 |
| | Health Care Technology – 0.2% | | | | | | | | | |
| | | | | |
| 30 | | AthenaHealth Inc., (2) | | | | | | | | | 784 |
| | | | | |
| 20 | | Cerner Corporation, (2) | | | | | | | | | 1,518 |
Portfolio of Investments
Nuveen U.S. Equity Completeness Fund (continued)
June 30, 2010
| | | | | | | | | | | |
| Shares | | Description (1) | | | | | | | | Value |
| | | | | | | | | | | |
| | Health Care Technology (continued) | | | | | | | | | |
| | | | | |
| 10 | | Computer Programs and Systems, Inc. | | | | | | | | $ | 409 |
| | | | | |
| 160 | | Eclipsys Corporation, (2) | | | | | | | | | 2,854 |
| | | | | |
| 40 | | MedAssets Inc., (2) | | | | | | | | | 923 |
| | | | | |
| 90 | | Omnicell, Inc., (2) | | | | | | | | | 1,052 |
| | | | | |
| 50 | | Quality Systems Inc. | | | | | | | | | 2,900 |
| | Total Health Care Technology | | | | | | | | | 10,440 |
| | Hotels, Restaurants & Leisure – 1.5% | | | | | | | | | |
| | | | | |
| 80 | | AFC Enterprises, Inc., (2) | | | | | | | | | 728 |
| | | | | |
| 260 | | Bally Technologies, Inc., (2) | | | | | | | | | 8,421 |
| | | | | |
| 40 | | Bob Evans Farms | | | | | | | | | 985 |
| | | | | |
| 20 | | Buffalo Wild Wings, Inc., (2) | | | | | | | | | 732 |
| | | | | |
| 20 | | California Pizza Kitchen, Inc., (2) | | | | | | | | | 303 |
| | | | | |
| 190 | | Carnival Corporation | | | | | | | | | 5,746 |
| | | | | |
| 20 | | CEC Entertainment Inc., (2) | | | | | | | | | 705 |
| | | | | |
| 130 | | Cheesecake Factory Inc., (2) | | | | | | | | | 2,894 |
| | | | | |
| 40 | | Jack in the Box Inc., Term Loan, (2) | | | | | | | | | 778 |
| | | | | |
| 460 | | Krispy Kreme Doughnuts Inc., (2) | | | | | | | | | 1,550 |
| | | | | |
| 40 | | Las Vegas Sands, (2) | | | | | | | | | 886 |
| | | | | |
| 10 | | Life Time Fitness Inc., (2) | | | | | | | | | 318 |
| | | | | |
| 70 | | Marriott International, Inc., Class A | | | | | | | | | 2,096 |
| | | | | |
| 250 | | McDonald's Corporation | | | | | | | | | 16,468 |
| | | | | |
| 50 | | MGM Mirage Inc., (2) | | | | | | | | | 482 |
| | | | | |
| 30 | | P.F. Changs China Bistro, Inc. | | | | | | | | | 1,190 |
| | | | | |
| 10 | | Panera Bread Company, (2) | | | | | | | | | 753 |
| | | | | |
| 30 | | Papa John's International, Inc., (2) | | | | | | | | | 694 |
| | | | | |
| 30 | | Peets Coffee and Tea Inc., (2) | | | | | | | | | 1,178 |
| | | | | |
| 70 | | Pinnacle Entertainment Inc., (2) | | | | | | | | | 662 |
| | | | | |
| 60 | | Red Robin Gourmet Burgers, Inc., (2) | | | | | | | | | 1,030 |
| | | | | |
| 30 | | Sonic Corporation, (2) | | | | | | | | | 233 |
| | | | | |
| 190 | | Starbucks Corporation | | | | | | | | | 4,617 |
| | | | | |
| 230 | | Starwood Hotels & Resorts Worldwide, Inc. | | | | | | | | | 9,529 |
| | | | | |
| 140 | | WMS Industries Inc., (2) | | | | | | | | | 5,495 |
| | | | | |
| 270 | | Wyndham Worldwide Corporation | | | | | | | | | 5,438 |
| | | | | |
| 100 | | Wynn Resorts Ltd | | | | | | | | | 7,627 |
| | | | | |
| 210 | | YUM! Brands, Inc. | | | | | | | | | 8,198 |
| | Total Hotels, Restaurants & Leisure | | | | | | | | | 89,736 |
| | Household Durables – 1.0% | | | | | | | | | |
| | | | | |
| 110 | | American Greetings Corporation | | | | | | | | | 2,064 |
| | | | | |
| 1,020 | | Beazer Homes USA, Inc., (2) | | | | | | | | | 3,703 |
| | | | | |
| 10 | | Blyth Inc. | | | | | | | | | 341 |
| | | | | |
| 90 | | D.R. Horton, Inc. | | | | | | | | | 885 |
| | | | | |
| 30 | | Ethan Allen Interiors Inc. | | | | | | | | | 420 |
| | | | | |
| 180 | | Fortune Brands Inc. | | | | | | | | | 7,052 |
| | | | | |
| 40 | | Furniture Brands International, Inc., (2) | | | | | | | | | 209 |
| | | | | |
| 30 | | Helen of Troy Limited, (2) | | | | | | | | | 662 |
| | | | | | | | | | | |
| Shares | | Description (1) | | | | | | | | Value |
| | | | | | | | | | | |
| | Household Durables (continued) | | | | | | | | | |
| | | | | |
| 640 | | Hovnanian Enterprises Inc., (2) | | | | | | | | $ | 2,355 |
| | | | | |
| 30 | | Jarden Corporation | | | | | | | | | 806 |
| | | | | |
| 10 | | KB Home | | | | | | | | | 110 |
| | | | | |
| 180 | | La Z Boy Inc., (2) | | | | | | | | | 1,337 |
| | | | | |
| 80 | | Leggett and Platt Inc. | | | | | | | | | 1,605 |
| | | | | |
| 180 | | M/I Homes, Inc., (2) | | | | | | | | | 1,735 |
| | | | | |
| 50 | | Meritage Corporation, (2) | | | | | | | | | 814 |
| | | | | |
| 30 | | Mohawk Industries Inc., (2) | | | | | | | | | 1,373 |
| | | | | |
| 20 | | National Presto Industries Inc. | | | | | | | | | 1,857 |
| | | | | |
| 10 | | NVR Inc., (2) | | | | | | | | | 6,550 |
| | | | | |
| 10 | | Pulte Corporation, (2) | | | | | | | | | 83 |
| | | | | |
| 10 | | Ryland Group Inc. | | | | | | | | | 158 |
| | | | | |
| 180 | | Standard Pacific Corporation, (2) | | | | | | | | | 599 |
| | | | | |
| 60 | | Stanley Black & Decker Inc. | | | | | | | | | 3,031 |
| | | | | |
| 180 | | Tempur Pedic International Inc., (2) | | | | | | | | | 5,535 |
| | | | | |
| 130 | | Tupperware Corporation | | | | | | | | | 5,181 |
| | | | | |
| 60 | | Univeral Electronics Inc., (2) | | | | | | | | | 998 |
| | | | | |
| 130 | | Whirlpool Corporation | | | | | | | | | 11,417 |
| | Total Household Durables | | | | | | | | | 60,880 |
| | Household Products – 1.1% | | | | | | | | | |
| | | | | |
| 80 | | Central Garden & Pet Company, (2) | | | | | | | | | 718 |
| | | | | |
| 50 | | Clorox Company | | | | | | | | | 3,108 |
| | | | | |
| 70 | | Colgate-Palmolive Company | | | | | | | | | 5,513 |
| | | | | |
| 100 | | Kimberly-Clark Corporation | | | | | | | | | 6,063 |
| | | | | |
| 890 | | Procter & Gamble Company | | | | | | | | | 53,382 |
| | Total Household Products | | | | | | | | | 68,784 |
| | Independent Power Producers & Energy Traders – 0.4% | | | | | | | | | |
| | | | | |
| 1,520 | | AES Corporation, (2) | | | | | | | | | 14,045 |
| | | | | |
| 60 | | Constellation Energy Group | | | | | | | | | 1,935 |
| | | | | |
| 50 | | Mirant Corporation, (2) | | | | | | | | | 528 |
| | | | | |
| 250 | | NRG Energy Inc., (2) | | | | | | | | | 5,303 |
| | Total Independent Power Producers & Energy Traders | | | | | | | | | 21,811 |
| | Industrial Conglomerates – 2.0% | | | | | | | | | |
| | | | | |
| 130 | | 3M Co. | | | | | | | | | 10,269 |
| | | | | |
| 6,940 | | General Electric Company | | | | | | | | | 100,075 |
| | | | | |
| 50 | | Raven Industries, Inc. | | | | | | | | | 1,686 |
| | | | | |
| 540 | | Textron Inc. | | | | | | | | | 9,164 |
| | Total Industrial Conglomerates | | | | | | | | | 121,194 |
| | Insurance – 4.4% | | | | | | | | | |
| | | | | |
| 420 | | AFLAC Incorporated | | | | | | | | | 17,921 |
| | | | | |
| 390 | | Allstate Corporation | | | | | | | | | 11,205 |
| | | | | |
| 70 | | Alterra Capital Holdings Limited | | | | | | | | | 1,315 |
| | | | | |
| 30 | | American International Group, (2) | | | | | | | | | 1,033 |
| | | | | |
| 10 | | American National Insurance Company | | | | | | | | | 810 |
| | | | | |
| 20 | | American Physicians Capital, Inc. | | | | | | | | | 617 |
Portfolio of Investments
Nuveen U.S. Equity Completeness Fund (continued)
June 30, 2010
| | | | | | | | | | | |
| Shares | | Description (1) | | | | | | | | Value |
| | | | | | | | | | | |
| | Insurance (continued) | | | | | | | | | |
| | | | | |
| 20 | | Amerisafe, Inc., (2) | | | | | | | | $ | 351 |
| | | | | |
| 210 | | Aon Corporation | | | | | | | | | 7,795 |
| | | | | |
| 60 | | Arch Capital Group Limited, (2) | | | | | | | | | 4,470 |
| | | | | |
| 200 | | Arthur J. Gallagher & Co. | | | | | | | | | 4,876 |
| | | | | |
| 90 | | Aspen Insurance Holdings Limited | | | | | | | | | 2,227 |
| | | | | |
| 160 | | Assurant Inc. | | | | | | | | | 5,552 |
| | | | | |
| 460 | | Assured Guaranty Limited | | | | | | | | | 6,104 |
| | | | | |
| 100 | | Axis Capital Holdings Limited | | | | | | | | | 2,972 |
| | | | | |
| 70 | | Baldwin & Lyons, Class B | | | | | | | | | 1,471 |
| | | | | |
| 280 | | Chubb Corporation | | | | | | | | | 14,003 |
| | | | | |
| 90 | | Cincinnati Financial Corporation | | | | | | | | | 2,328 |
| | | | | |
| 50 | | CNA Surety Corporation, (2) | | | | | | | | | 804 |
| | | | | |
| 540 | | CNO Financial Group Inc., (2) | | | | | | | | | 2,673 |
| | | | | |
| 70 | | Delphi Financial Group, Inc. | | | | | | | | | 1,709 |
| | | | | |
| 40 | | Everest Reinsurance Group Ltd | | | | | | | | | 2,829 |
| | | | | |
| 80 | | Fidelity National Title Group Inc., Class A | | | | | | | | | 1,039 |
| | | | | |
| 100 | | First American Corporation | | | | | | | | | 1,268 |
| | | | | |
| 20 | | Flagstone Reinsurance Holdings SA | | | | | | | | | 216 |
| | | | | |
| 550 | | Genworth Financial Inc., Class A, (2) | | | | | | | | | 7,189 |
| | | | | |
| 50 | | Hanover Insurance Group Inc. | | | | | | | | | 2,175 |
| | | | | |
| 30 | | Harleysville Group, Inc. | | | | | | | | | 931 |
| | | | | |
| 410 | | Hartford Financial Services Group, Inc. | | | | | | | | | 9,073 |
| | | | | |
| 90 | | HCC Insurance Holdings Inc. | | | | | | | | | 2,228 |
| | | | | |
| 20 | | Hilltop Holdings Inc., (2) | | | | | | | | | 200 |
| | | | | |
| 60 | | Horace Mann Educators Corporation | | | | | | | | | 918 |
| | | | | |
| 630 | | Lincoln National Corporation | | | | | | | | | 15,303 |
| | | | | |
| 220 | | Loews Corporation | | | | | | | | | 7,328 |
| | | | | |
| 10 | | Markel Corporation, (2) | | | | | | | | | 3,400 |
| | | | | |
| 200 | | Marsh & McLennan Companies, Inc. | | | | | | | | | 4,510 |
| | | | | |
| 150 | | MBIA Inc., (2) | | | | | | | | | 842 |
| | | | | |
| 60 | | Meadowbrook Insurance Group, Inc. | | | | | | | | | 518 |
| | | | | |
| 20 | | Mercury General Corporation | | | | | | | | | 829 |
| | | | | |
| 360 | | MetLife, Inc. | | | | | | | | | 13,594 |
| | | | | |
| 100 | | Montpelier Re Holdings Limited | | | | | | | | | 1,493 |
| | | | | |
| 190 | | National Financial Partners Corp., (2) | | | | | | | | | 1,856 |
| | | | | |
| 140 | | Old Republic International Corporation | | | | | | | | | 1,698 |
| | | | | |
| 60 | | PartnerRe Limited | | | | | | | | | 4,208 |
| | | | | |
| 70 | | Platinum Underwriters Holdings Limited | | | | | | | | | 2,540 |
| | | | | |
| 50 | | ProAssurance Corporation, (2) | | | | | | | | | 2,838 |
| | | | | |
| 470 | | Progressive Corporation | | | | | | | | | 8,798 |
| | | | | |
| 550 | | Prudential Financial, Inc. | | | | | | | | | 29,513 |
| | | | | |
| 40 | | Reinsurance Group of America Inc. | | | | | | | | | 1,828 |
| | | | | |
| 60 | | RenaisasnceRE Holdings, Limited | | | | | | | | | 3,376 |
| | | | | |
| 20 | | RLI Corporation | | | | | | | | | 1,050 |
| | | | | |
| 150 | | Seabright Insurance Holdings Inc. | | | | | | | | | 1,422 |
| | | | | | | | | | | |
| Shares | | Description (1) | | | | | | | | Value |
| | | | | | | | | | | |
| | Insurance (continued) | | | | | | | | | |
| | | | | |
| 10 | | Stewart Information Services Corporation | | | | | | | | $ | 90 |
| | | | | |
| 10 | | Torchmark Corporation | | | | | | | | | 495 |
| | | | | |
| 50 | | Tower Group Inc. | | | | | | | | | 1,077 |
| | | | | |
| 340 | | Travelers Companies, Inc. | | | | | | | | | 16,745 |
| | | | | |
| 190 | | United America Indemnity Limited, (2) | | | | | | | | | 1,398 |
| | | | | |
| 40 | | Unitrin, Inc. | | | | | | | | | 1,024 |
| | | | | |
| 260 | | Unum Group | | | | | | | | | 5,642 |
| | | | | |
| 10 | | White Mountain Insurance Group | | | | | | | | | 3,242 |
| | | | | |
| 110 | | WR Berkley Corporation | | | | | | | | | 2,911 |
| | | | | |
| 370 | | XL Capital Ltd, Class A | | | | | | | | | 5,924 |
| | Total Insurance | | | | | | | | | 263,794 |
| | Internet & Catalog Retail – 0.5% | | | | | | | | | |
| | | | | |
| 40 | | Amazon.com, Inc., (2) | | | | | | | | | 4,370 |
| | | | | |
| 30 | | Blue Nile Inc., (2) | | | | | | | | | 1,412 |
| | | | | |
| 170 | | Drugstore.com, Inc., (2) | | | | | | | | | 524 |
| | | | | |
| 50 | | Expedia, Inc. | | | | | | | | | 939 |
| | | | | |
| 1,400 | | Liberty Media Holding Corporation Interactive, Class A, (2) | | | | | | | | | 14,700 |
| | | | | |
| 10 | | NetFlix.com Inc., (2) | | | | | | | | | 1,087 |
| | | | | |
| 10 | | Nutri System Inc. | | | | | | | | | 229 |
| | | | | |
| 100 | | Orbitz Worldwide Inc., (2) | | | | | | | | | 381 |
| | | | | |
| 100 | | Overstock.com, Inc., (2) | | | | | | | | | 1,807 |
| | | | | |
| 110 | | Shutterfly, Inc., (2) | | | | | | | | | 2,636 |
| | Total Internet & Catalog Retail | | | | | | | | | 28,085 |
| | Internet Software & Services – 1.0% | | | | | | | | | |
| | | | | |
| 10 | | Archipelago Learning Inc., (2) | | | | | | | | | 114 |
| | | | | |
| 10 | | ComScore Inc., (2) | | | | | | | | | 165 |
| | | | | |
| 30 | | Digital River, Inc., (2) | | | | | | | | | 717 |
| | | | | |
| 280 | | DivX Inc., (2) | | | | | | | | | 2,145 |
| | | | | |
| 460 | | Earthlink, Inc. | | | | | | | | | 3,662 |
| | | | | |
| 630 | | eBay Inc., (2) | | | | | | | | | 12,354 |
| | | | | |
| 20 | | Equinix Inc., (2) | | | | | | | | | 1,624 |
| | | | | |
| 50 | | Google Inc., Class A, (2) | | | | | | | | | 22,248 |
| | | | | |
| 40 | | GSI Commerce, Inc., (2) | | | | | | | | | 1,152 |
| | | | | |
| 160 | | IAC/InterActiveCorp., (2) | | | | | | | | | 3,515 |
| | | | | |
| 310 | | Internap Network Services Corporation, (2) | | | | | | | | | 1,293 |
| | | | | |
| 280 | | Internet Capital Group Inc., (2) | | | | | | | | | 2,128 |
| | | | | |
| 40 | | j2 Global Communications, Inc., (2) | | | | | | | | | 874 |
| | | | | |
| 30 | | Liquidity Services, Inc., (2) | | | | | | | | | 389 |
| | | | | |
| 20 | | NIC, Incorporated | | | | | | | | | 128 |
| | | | | |
| 90 | | ValueClick, Inc., (2) | | | | | | | | | 962 |
| | | | | |
| 10 | | VeriSign, Inc., (2) | | | | | | | | | 266 |
| | | | | |
| 10 | | Vocus, Inc., (2) | | | | | | | | | 153 |
| | | | | |
| 330 | | Yahoo! Inc., (2) | | | | | | | | | 4,564 |
| | Total Internet Software & Services | | | | | | | | | 58,453 |
Portfolio of Investments
Nuveen U.S. Equity Completeness Fund (continued)
June 30, 2010
| | | | | | | | | | | |
| Shares | | Description (1) | | | | | | | | Value |
| | | | | | | | | | | |
| | IT Services – 1.7% | | | | | | | | | |
| | | | | |
| 140 | | Acxiom Corporation, (2) | | | | | | | | $ | 2,057 |
| | | | | |
| 90 | | Amdocs Limited, (2) | | | | | | | | | 2,417 |
| | | | | |
| 80 | | Automatic Data Processing, Inc. | | | | | | | | | 3,221 |
| | | | | |
| 30 | | Broadridge Financial Solutions, Inc. | | | | | | | | | 572 |
| | | | | |
| 30 | | CACI International Inc., (2) | | | | | | | | | 1,274 |
| | | | | |
| 510 | | Ciber, Inc., (2) | | | | | | | | | 1,413 |
| | | | | |
| 60 | | Cognizant Technology Solutions Corporation, Class A, (2) | | | | | | | | | 3,004 |
| | | | | |
| 220 | | Computer Sciences Corporation | | | | | | | | | 9,955 |
| | | | | |
| 50 | | Convergys Corporation, (2) | | | | | | | | | 491 |
| | | | | |
| 100 | | CoreLogic Inc. | | | | | | | | | 1,766 |
| | | | | |
| 50 | | CSG Systems International Inc., (2) | | | | | | | | | 917 |
| | | | | |
| 50 | | Cybersource Corporation, (2) | | | | | | | | | 1,277 |
| | | | | |
| 10 | | Euronet Worldwide, Inc., (2) | | | | | | | | | 128 |
| | | | | |
| 50 | | Exlservice Holdings, Inc., (2) | | | | | | | | | 859 |
| | | | | |
| 100 | | Fidelity National Information Services | | | | | | | | | 2,682 |
| | | | | |
| 100 | | Gartner Inc., (2) | | | | | | | | | 2,325 |
| | | | | |
| 130 | | Genpact Limited, (2) | | | | | | | | | 2,019 |
| | | | | |
| 30 | | IGATE Corporation | | | | | | | | | 385 |
| | | | | |
| 280 | | International Business Machines Corporation (IBM) | | | | | | | | | 34,574 |
| | | | | |
| 20 | | ManTech International Corporation, Class A, (2) | | | | | | | | | 851 |
| | | | | |
| 10 | | MasterCard, Inc. | | | | | | | | | 1,995 |
| | | | | |
| 40 | | Maximus Inc. | | | | | | | | | 2,315 |
| | | | | |
| 10 | | Nci, Inc., (2) | | | | | | | | | 226 |
| | | | | |
| 50 | | NeuStar, Inc., (2) | | | | | | | | | 1,031 |
| | | | | |
| 40 | | Paychex, Inc. | | | | | | | | | 1,039 |
| | | | | |
| 50 | | SAIC, Inc., (2) | | | | | | | | | 837 |
| | | | | |
| 360 | | Sapient Corporation | | | | | | | | | 3,650 |
| | | | | |
| 40 | | SRA International, Inc., (2) | | | | | | | | | 787 |
| | | | | |
| 50 | | Syntel Inc. | | | | | | | | | 1,698 |
| | | | | |
| 80 | | TeleTech Holdings, Inc., (2) | | | | | | | | | 1,031 |
| | | | | |
| 40 | | TNS Inc., (2) | | | | | | | | | 698 |
| | | | | |
| 90 | | Total System Services Inc. | | | | | | | | | 1,224 |
| | | | | |
| 50 | | Unisys Corporation, (2) | | | | | | | | | 925 |
| | | | | |
| 140 | | VeriFone Holdings Inc., (2) | | | | | | | | | 2,650 |
| | | | | |
| 80 | | Visa Inc. | | | | | | | | | 5,660 |
| | | | | |
| 100 | | Western Union Company | | | | | | | | | 1,491 |
| | Total IT Services | | | | | | | | | 99,444 |
| | Leisure Equipment & Products – 0.2% | | | | | | | | | |
| | | | | |
| 20 | | Brunswick Corporation | | | | | | | | | 249 |
| | | | | |
| 30 | | Hasbro, Inc. | | | | | | | | | 1,233 |
| | | | | |
| 10 | | Mattel, Inc. | | | | | | | | | 212 |
| | | | | |
| 10 | | Polaris Industries Inc. | | | | | | | | | 546 |
| | | | | |
| 230 | | Pool Corporation | | | | | | | | | 5,042 |
| | | | | |
| 60 | | RC2 Corporation, (2) | | | | | | | | | 967 |
| | | | | |
| 420 | | Smith & Wesson Holding Corporation, (2) | | | | | | | | | 1,718 |
| | Total Leisure Equipment & Products | | | | | | | | | 9,967 |
| | | | | | | | | | | |
| Shares | | Description (1) | | | | | | | | Value |
| | | | | | | | | | | |
| | Life Sciences Tools & Services – 0.3% | | | | | | | | | |
| | | | | |
| 120 | | Affymetrix, Inc., (2) | | | | | | | | $ | 708 |
| | | | | |
| 10 | | Covance, Inc., (2) | | | | | | | | | 513 |
| | | | | |
| 20 | | Dionex Corporation, (2) | | | | | | | | | 1,489 |
| | | | | |
| 110 | | eResearch Technology, Inc., (2) | | | | | | | | | 867 |
| | | | | |
| 80 | | Life Technologies Corporation, (2) | | | | | | | | | 3,780 |
| | | | | |
| 10 | | Luminex Corporation, (2) | | | | | | | | | 162 |
| | | | | |
| 10 | | Millipore Corporation, (2) | | | | | | | | | 1,067 |
| | | | | |
| 90 | | Perkinelmer Inc. | | | | | | | | | 1,860 |
| | | | | |
| 150 | | Thermo Fisher Scientific, Inc., (2) | | | | | | | | | 7,358 |
| | | | | |
| 30 | | Waters Corporation, (2) | | | | | | | | | 1,941 |
| | Total Life Sciences Tools & Services | | | | | | | | | 19,745 |
| | Machinery – 2.1% | | | | | | | | | |
| | | | | |
| 10 | | Actuant Corporation | | | | | | | | | 188 |
| | | | | |
| 380 | | ArvinMeritor Inc., (2) | | | | | | | | | 4,978 |
| | | | | |
| 180 | | Briggs & Stratton Corporation | | | | | | | | | 3,064 |
| | | | | |
| 220 | | Caterpillar Inc. | | | | | | | | | 13,215 |
| | | | | |
| 10 | | Chart Industries, Inc., (2) | | | | | | | | | 156 |
| | | | | |
| 100 | | Cummins Inc. | | | | | | | | | 6,513 |
| | | | | |
| 120 | | Danaher Corporation | | | | | | | | | 4,454 |
| | | | | |
| 210 | | Deere & Company | | | | | | | | | 11,693 |
| | | | | |
| 20 | | Donaldson Company, Inc. | | | | | | | | | 853 |
| | | | | |
| 50 | | Dover Corporation | | | | | | | | | 2,090 |
| | | | | |
| 190 | | Eaton Corporation | | | | | | | | | 12,434 |
| | | | | |
| 90 | | EnPro Industries Inc., (2) | | | | | | | | | 2,534 |
| | | | | |
| 10 | | Flowserve Corporation | | | | | | | | | 848 |
| | | | | |
| 10 | | Gardner Denver, Inc. | | | | | | | | | 446 |
| | | | | |
| 20 | | Greenbrier Companies Inc., (2) | | | | | | | | | 224 |
| | | | | |
| 160 | | IDEX Corporation | | | | | | | | | 4,571 |
| | | | | |
| 170 | | Illinois Tool Works, Inc. | | | | | | | | | 7,018 |
| | | | | |
| 10 | | Joy Global Inc. | | | | | | | | | 501 |
| | | | | |
| 160 | | Kennametal Inc. | | | | | | | | | 4,069 |
| | | | | |
| 70 | | LB Foster Company, (2) | | | | | | | | | 1,814 |
| | | | | |
| 60 | | Lincoln Electric Holdings Inc. | | | | | | | | | 3,059 |
| | | | | |
| 80 | | Mueller Industries Inc. | | | | | | | | | 1,968 |
| | | | | |
| 40 | | Mueller Water Products Inc. | | | | | | | | | 148 |
| | | | | |
| 70 | | Nacco Industries Inc. | | | | | | | | | 6,213 |
| | | | | |
| 60 | | Nordson Corporation | | | | | | | | | 3,365 |
| | | | | |
| 50 | | Oshkosh Truck Corporation, (2) | | | | | | | | | 1,558 |
| | | | | |
| 50 | | PACCAR Inc. | | | | | | | | | 1,994 |
| | | | | |
| 30 | | Pall Corporation | | | | | | | | | 1,031 |
| | | | | |
| 170 | | Parker Hannifin Corporation | | | | | | | | | 9,428 |
| | | | | |
| 160 | | Pentair, Inc. | | | | | | | | | 5,152 |
| | | | | |
| 20 | | RBC Bearings Inc., (2) | | | | | | | | | 580 |
| | | | | |
| 200 | | Robbins & Myers, Inc. | | | | | | | | | 4,348 |
| | | | | |
| 20 | | SPX Corporation | | | | | | | | | 1,056 |
Portfolio of Investments
Nuveen U.S. Equity Completeness Fund (continued)
June 30, 2010
| | | | | | | | | | | |
| Shares | | Description (1) | | | | | | | | Value |
| | | | | | | | | | | |
| | Machinery (continued) | | | | | | | | | |
| | | | | |
| 20 | | Sun Hydraulics Corporation | | | | | | | | $ | 469 |
| | | | | |
| 20 | | Tennant Company | | | | | | | | | 676 |
| | | | | |
| 310 | | Titan International Inc. | | | | | | | | | 3,091 |
| | | | | |
| 50 | | Trinity Industries Inc. | | | | | | | | | 886 |
| | | | | |
| 10 | | Valmont Industries, Inc. | | | | | | | | | 727 |
| | Total Machinery | | | | | | | | | 127,412 |
| | Marine – 0.0% | | | | | | | | | |
| | | | | |
| 30 | | Alexander and Bald, Inc. | | | | | | | | | 893 |
| | | | | |
| 40 | | Eagle Bulk Shipping Inc., (2) | | | | | | | | | 169 |
| | | | | |
| 20 | | Kirby Corporation, (2) | | | | | | | | | 765 |
| | Total Marine | | | | | | | | | 1,827 |
| | Media – 4.9% | | | | | | | | | |
| | | | | |
| 40 | | Arbitron Inc. | | | | | | | | | 1,025 |
| | | | | |
| 10 | | Ascent Media Corporation, (2) | | | | | | | | | 253 |
| | | | | |
| 280 | | Cablevision Systems Corporation | | | | | | | | | 6,723 |
| | | | | |
| 750 | | CBS Corporation, Class B | | | | | | | | | 9,698 |
| | | | | |
| 30 | | Central European Media Enterprises Limited, (2) | | | | | | | | | 597 |
| | | | | |
| 230 | | Clear Channel Outdoor Holdings Inc., Class A, (2) | | | | | | | | | 1,996 |
| | | | | |
| 3,020 | | Comcast Corporation, Class A | | | | | | | | | 52,457 |
| | | | | |
| 360 | | DIRECTV Group, Inc., (2) | | | | | | | | | 12,211 |
| | | | | |
| 30 | | Dreamworks Animation SKG Inc., (2) | | | | | | | | | 857 |
| | | | | |
| 400 | | Gannett Company Inc. | | | | | | | | | 5,384 |
| | | | | |
| 40 | | Interactive Data Corporation | | | | | | | | | 1,335 |
| | | | | |
| 540 | | Interpublic Group Companies, Inc., (2) | | | | | | | | | 3,850 |
| | | | | |
| 360 | | Knology, Inc., (2) | | | | | | | | | 3,935 |
| | | | | |
| 150 | | Lamar Advertising Company, (2) | | | | | | | | | 3,678 |
| | | | | |
| 300 | | Liberty Global Inc, A Shares, (2) | | | | | | | | | 7,797 |
| | | | | |
| 70 | | Liberty Media Holding Corporation, Capital Tracking Stock, Class A, (2) | | | | | | | | | 2,934 |
| | | | | |
| 170 | | Liberty Media Starz, (2) | | | | | | | | | 8,813 |
| | | | | |
| 10 | | McGraw-Hill Companies, Inc. | | | | | | | | | 281 |
| | | | | |
| 40 | | Morningstar, Inc., (2) | | | | | | | | | 1,701 |
| | | | | |
| 110 | | National CineMedia, Inc. | | | | | | | | | 1,833 |
| | | | | |
| 1,680 | | News Corporation, Class A | | | | | | | | | 20,093 |
| | | | | |
| 60 | | Omnicom Group, Inc. | | | | | | | | | 2,058 |
| | | | | |
| 20 | | RCN Corporation, (2) | | | | | | | | | 296 |
| | | | | |
| 350 | | Regal Entertainment Group, Class A | | | | | | | | | 4,564 |
| | | | | |
| 530 | | Time Warner Cable, Class A | | | | | | | | | 27,602 |
| | | | | |
| 1,280 | | Time Warner Inc. | | | | | | | | | 37,005 |
| | | | | |
| 230 | | Vallassis Communications Inc., (2) | | | | | | | | | 7,296 |
| | | | | |
| 610 | | Viacom Inc., Class B | | | | | | | | | 19,136 |
| | | | | |
| 730 | | Virgin Media, Inc. | | | | | | | | | 12,184 |
| | | | | |
| 1,040 | | Walt Disney Company | | | | | | | | | 32,760 |
| | | | | |
| 270 | | World Wrestling Entertainment Inc. | | | | | | | | | 4,201 |
| | Total Media | | | | | | | | | 294,553 |
| | | | | | | | | | | |
| Shares | | Description (1) | | | | | | | | Value |
| | | | | | | | | | | |
| | Metals & Mining – 1.1% | | | | | | | | | |
| | | | | |
| 300 | | AK Steel Holding Corporation | | | | | | | | $ | 3,576 |
| | | | | |
| 370 | | Alcoa Inc. | | | | | | | | | 3,722 |
| | | | | |
| 40 | | Allegheny Technologies, Inc. | | | | | | | | | 1,768 |
| | | | | |
| 90 | | Allied Nevada Gold Corporation, (2) | | | | | | | | | 1,771 |
| | | | | |
| 40 | | AM Castle & Co, (2) | | | | | | | | | 556 |
| | | | | |
| 70 | | Brush Engineered Material, (2) | | | | | | | | | 1,399 |
| | | | | |
| 100 | | Century Aluminum Company, (2) | | | | | | | | | 883 |
| | | | | |
| 230 | | Cliffs Natural Resources Inc. | | | | | | | | | 10,847 |
| | | | | |
| 90 | | Coeur d'Alene Mines Corporation, (2) | | | | | | | | | 1,420 |
| | | | | |
| 10 | | Commercial Metals Company | | | | | | | | | 132 |
| | | | | |
| 30 | | Compass Minerals International, Inc. | | | | | | | | | 2,108 |
| | | | | |
| 190 | | Freeport-McMoRan Copper & Gold, Inc. | | | | | | | | | 11,235 |
| | | | | |
| 60 | | Haynes International Inc. | | | | | | | | | 1,850 |
| | | | | |
| 340 | | Hecla Mining Company, (2) | | | | | | | | | 1,775 |
| | | | | |
| 20 | | Kaiser Aluminum Corporation | | | | | | | | | 693 |
| | | | | |
| 80 | | Newmont Mining Corporation | | | | | | | | | 4,939 |
| | | | | |
| 80 | | Nucor Corporation | | | | | | | | | 3,062 |
| | | | | |
| 80 | | Olympic Steel Inc. | | | | | | | | | 1,838 |
| | | | | |
| 10 | | Royal Gold, Inc. | | | | | | | | | 480 |
| | | | | |
| 80 | | RTI International Metals, Inc., (2) | | | | | | | | | 1,929 |
| | | | | |
| 10 | | Schnitzer Steel Industries, Inc. | | | | | | | | | 392 |
| | | | | |
| 80 | | Steel Dynamics Inc. | | | | | | | | | 1,055 |
| | | | | |
| 120 | | Titanium Metals Corporation, (2) | | | | | | | | | 2,111 |
| | | | | |
| 100 | | United States Steel Corporation | | | | | | | | | 3,855 |
| | | | | |
| 210 | | US Gold Corporation, (2) | | | | | | | | | 1,052 |
| | | | | |
| 30 | | Walter Industries Inc. | | | | | | | | | 1,826 |
| | Total Metals & Mining | | | | | | | | | 66,274 |
| | Multiline Retail – 0.7% | | | | | | | | | |
| | | | | |
| 60 | | 99 Cents Only Stores, (2) | | | | | | | | | 888 |
| | | | | |
| 40 | | Big Lots, Inc., (2) | | | | | | | | | 1,284 |
| | | | | |
| 320 | | Dillard's, Inc., Class A | | | | | | | | | 6,880 |
| | | | | |
| 40 | | Family Dollar Stores, Inc. | | | | | | | | | 1,508 |
| | | | | |
| 110 | | Freds Inc. | | | | | | | | | 1,217 |
| | | | | |
| 130 | | J.C. Penney Company, Inc. | | | | | | | | | 2,792 |
| | | | | |
| 50 | | Kohl's Corporation, (2) | | | | | | | | | 2,375 |
| | | | | |
| 470 | | Macy's, Inc. | | | | | | | | | 8,413 |
| | | | | |
| 150 | | Nordstrom, Inc. | | | | | | | | | 4,829 |
| | | | | |
| 110 | | Retail Ventures Inc., (2) | | | | | | | | | 860 |
| | | | | |
| 190 | | Saks Inc., (2) | | | | | | | | | 1,442 |
| | | | | |
| 30 | | Sears Holding Corporation, (2) | | | | | | | | | 1,940 |
| | | | | |
| 160 | | Target Corporation | | | | | | | | | 7,867 |
| | Total Multiline Retail | | | | | | | | | 42,295 |
| | Multi-Utilities – 1.9% | | | | | | | | | |
| | | | | |
| 80 | | Alliant Energy Corporation | | | | | | | | | 2,539 |
| | | | | |
| 230 | | Ameren Corporation | | | | | | | | | 5,467 |
Portfolio of Investments
Nuveen U.S. Equity Completeness Fund (continued)
June 30, 2010
| | | | | | | | | | | |
| Shares | | Description (1) | | | | | | | | Value |
| | | | | | | | | | | |
| | Multi-Utilities (continued) | | | | | | | | | |
| | | | | |
| 70 | | Avista Corporation | | | | | | | | $ | 1,367 |
| | | | | |
| 40 | | Black Hills Corporation | | | | | | | | | 1,139 |
| | | | | |
| 90 | | CenterPoint Energy, Inc. | | | | | | | | | 1,184 |
| | | | | |
| 10 | | CH Energy Group Inc. | | | | | | | | | 392 |
| | | | | |
| 260 | | CMS Energy Corporation | | | | | | | | | 3,809 |
| | | | | |
| 160 | | Consolidated Edison, Inc. | | | | | | | | | 6,896 |
| | | | | |
| 340 | | Dominion Resources, Inc. | | | | | | | | | 13,172 |
| | | | | |
| 170 | | DTE Energy Company | | | | | | | | | 7,754 |
| | | | | |
| 40 | | Integrys Energy Group, Inc. | | | | | | | | | 1,750 |
| | | | | |
| 130 | | MDU Resources Group Inc. | | | | | | | | | 2,344 |
| | | | | |
| 250 | | NiSource Inc. | | | | | | | | | 3,625 |
| | | | | |
| 90 | | Northwestern Corporation | | | | | | | | | 2,358 |
| | | | | |
| 80 | | NSTAR | | | | | | | | | 2,800 |
| | | | | |
| 60 | | OGE Energy Corp. | | | | | | | | | 2,194 |
| | | | | |
| 260 | | PG&E Corporation | | | | | | | | | 10,686 |
| | | | | |
| 520 | | Public Service Enterprise Group Incorporated | | | | | | | | | 16,292 |
| | | | | |
| 90 | | Scana Corporation | | | | | | | | | 3,218 |
| | | | | |
| 300 | | Sempra Energy | | | | | | | | | 14,037 |
| | | | | |
| 110 | | TECO Energy, Inc. | | | | | | | | | 1,658 |
| | | | | |
| 10 | | Vectren Corporation | | | | | | | | | 237 |
| | | | | |
| 90 | | Wisconsin Energy Corporation | | | | | | | | | 4,567 |
| | | | | |
| 330 | | Xcel Energy, Inc. | | | | | | | | | 6,801 |
| | Total Multi-Utilities | | | | | | | | | 116,286 |
| | Office Electronics – 0.1% | | | | | | | | | |
| | | | | |
| 750 | | Xerox Corporation | | | | | | | | | 6,030 |
| | Oil, Gas & Consumable Fuels – 9.0% | | | | | | | | | |
| | | | | |
| 110 | | Alpha Natural Resources Inc., (2) | | | | | | | | | 3,726 |
| | | | | |
| 410 | | Anadarko Petroleum Corporation | | | | | | | | | 14,797 |
| | | | | |
| 240 | | Apache Corporation | | | | | | | | | 20,206 |
| | | | | |
| 10 | | Arch Coal Inc. | | | | | | | | | 198 |
| | | | | |
| 30 | | Arena Resources Inc., (2) | | | | | | | | | 957 |
| | | | | |
| 250 | | Atlas Energy Inc, (2) | | | | | | | | | 6,768 |
| | | | | |
| 110 | | ATP Oil & Gas Corporation, (2) | | | | | | | | | 1,165 |
| | | | | |
| 70 | | Berry Petroleum Company | | | | | | | | | 1,800 |
| | | | | |
| 80 | | Bill Barrett Corporation, (2) | | | | | | | | | 2,462 |
| | | | | |
| 40 | | BPZ Resources, Inc., (2) | | | | | | | | | 166 |
| | | | | |
| 200 | | Brigham Exploration Company, (2) | | | | | | | | | 3,076 |
| | | | | |
| 10 | | Cabot Oil & Gas Corporation | | | | | | | | | 313 |
| | | | | |
| 40 | | Carrizo Oil & Gas, Inc., (2) | | | | | | | | | 621 |
| | | | | |
| 430 | | Chesapeake Energy Corporation | | | | | | | | | 9,009 |
| | | | | |
| 1,150 | | Chevron Corporation | | | | | | | | | 78,039 |
| | | | | |
| 60 | | Cimarex Energy Company | | | | | | | | | 4,295 |
| | | | | |
| 90 | | Cobalt International Energy, Inc., (2) | | | | | | | | | 671 |
| | | | | |
| 1,020 | | ConocoPhillips | | | | | | | | | 50,072 |
| | | | | |
| 10 | | Continental Resources Inc., (2) | | | | | | | | | 446 |
| | | | | | | | | | | |
| Shares | | Description (1) | | | | | | | | Value |
| | | | | | | | | | | |
| | Oil, Gas & Consumable Fuels (continued) | | | | | | | | | |
| | | | | |
| 80 | | Crosstex Energy, Inc., (2) | | | | | | | | $ | 513 |
| | | | | |
| 30 | | Denbury Resources Inc., (2) | | | | | | | | | 439 |
| | | | | |
| 220 | | Devon Energy Corporation | | | | | | | | | 13,402 |
| | | | | |
| 480 | | El Paso Corporation | | | | | | | | | 5,333 |
| | | | | |
| 120 | | EOG Resources, Inc. | | | | | | | | | 11,804 |
| | | | | |
| 2,842 | | Exxon Mobil Corporation | | | | | | | | | 162,193 |
| | | | | |
| 20 | | GMX Resources, Inc., (2) | | | | | | | | | 130 |
| | | | | |
| 280 | | Gran Tiera Energy Inc., (2) | | | | | | | | | 1,389 |
| | | | | |
| 170 | | Harvest Natural Resources Inc., (2) | | | | | | | | | 1,253 |
| | | | | |
| 260 | | Hess Corporation | | | | | | | | | 13,088 |
| | | | | |
| 70 | | Holly Corporation | | | | | | | | | 1,861 |
| | | | | |
| 490 | | Marathon Oil Corporation | | | | | | | | | 15,234 |
| | | | | |
| 60 | | Massey Energy Company | | | | | | | | | 1,641 |
| | | | | |
| 150 | | McMoran Exploration Corporation, (2) | | | | | | | | | 1,667 |
| | | | | |
| 120 | | Murphy Oil Corporation | | | | | | | | | 5,946 |
| | | | | |
| 190 | | Newfield Exploration Company, (2) | | | | | | | | | 9,283 |
| | | | | |
| 90 | | Noble Energy, Inc. | | | | | | | | | 5,430 |
| | | | | |
| 90 | | Northern Oil and Gas Inc., (2) | | | | | | | | | 1,156 |
| | | | | |
| 380 | | Occidental Petroleum Corporation | | | | | | | | | 29,317 |
| | | | | |
| 260 | | Patriot Coal Corporation, (2) | | | | | | | | | 3,055 |
| | | | | |
| 50 | | Peabody Energy Corporation | | | | | | | | | 1,957 |
| | | | | |
| 70 | | Penn Virginia Corporation | | | | | | | | | 1,408 |
| | | | | |
| 90 | | Pertoleum Development Corporation, (2) | | | | | | | | | 2,306 |
| | | | | |
| 30 | | Petrohawk Energy Corporation, (2) | | | | | | | | | 509 |
| | | | | |
| 70 | | Pioneer Natural Resources Company | | | | | | | | | 4,162 |
| | | | | |
| 40 | | Range Resources Corporation | | | | | | | | | 1,606 |
| | | | | |
| 140 | | Rex Energy Inc., (2) | | | | | | | | | 1,414 |
| | | | | |
| 100 | | Rosetta Resources, Inc., (2) | | | | | | | | | 1,981 |
| | | | | |
| 40 | | SandRidge Energy Inc., (2) | | | | | | | | | 233 |
| | | | | |
| 50 | | SM Energy Company | | | | | | | | | 2,008 |
| | | | | |
| 20 | | Southern Union Company | | | | | | | | | 437 |
| | | | | |
| 50 | | Southwestern Energy Company, (2) | | | | | | | | | 1,932 |
| | | | | |
| 360 | | Spectra Energy Corporation | | | | | | | | | 7,225 |
| | | | | |
| 30 | | Stone Energy Corporation, (2) | | | | | | | | | 335 |
| | | | | |
| 30 | | Swift Energy Company, (2) | | | | | | | | | 807 |
| | | | | |
| 170 | | Tesoro Corporation | | | | | | | | | 1,984 |
| | | | | |
| 330 | | Valero Energy Corporation | | | | | | | | | 5,933 |
| | | | | |
| 70 | | W&T Offshore Inc. | | | | | | | | | 662 |
| | | | | |
| 80 | | Whiting Petroleum Corporation, (2) | | | | | | | | | 6,274 |
| | | | | |
| 760 | | Williams Companies, Inc. | | | | | | | | | 13,893 |
| | Total Oil, Gas & Consumable Fuels | | | | | | | | | 539,987 |
| | Paper & Forest Products – 0.7% | | | | | | | | | |
| | | | | |
| 100 | | Domtar Corporation | | | | | | | | | 4,915 |
| | | | | |
| 1,150 | | International Paper Company | | | | | | | | | 26,025 |
| | | | | |
| 110 | | KapStone Paper and Packaging Corp., (2) | | | | | | | | | 1,225 |
| | | | | |
| 70 | | Louisiana-Pacific Corporation, (2) | | | | | | | | | 468 |
Portfolio of Investments
Nuveen U.S. Equity Completeness Fund (continued)
June 30, 2010
| | | | | | | | | | | |
| Shares | | Description (1) | | | | | | | | Value |
| | | | | | | | | | | |
| | Paper & Forest Products (continued) | | | | | | | | | |
| | | | | |
| 30 | | MeadWestvaco Corporation | | | | | | | | $ | 666 |
| | | | | |
| 70 | | Neenah Paper, Inc. | | | | | | | | | 1,281 |
| | | | | |
| 70 | | Schweitzer-Mauduit International Inc. | | | | | | | | | 3,532 |
| | | | | |
| 130 | | Weyerhaeuser Company | | | | | | | | | 4,576 |
| | Total Paper & Forest Products | | | | | | | | | 42,688 |
| | Personal Products – 0.6% | | | | | | | | | |
| | | | | |
| 40 | | American Oriental Bioengineering Inc., (2) | | | | | | | | | 101 |
| | | | | |
| 200 | | Avon Products, Inc. | | | | | | | | | 5,300 |
| | | | | |
| 200 | | China Sky One Medical Inc., (2) | | | | | | | | | 2,248 |
| | | | | |
| 220 | | China-Biotics Inc., (2) | | | | | | | | | 2,862 |
| | | | | |
| 60 | | Elizabeth Arden, Inc., (2) | | | | | | | | | 871 |
| | | | | |
| 80 | | Estee Lauder Companies Inc., Class A | | | | | | | | | 4,458 |
| | | | | |
| 210 | | Herbalife, Limited | | | | | | | | | 9,671 |
| | | | | |
| 50 | | Inter Parfums, Inc. | | | | | | | | | 712 |
| | | | | |
| 190 | | NBTY Inc., (2) | | | | | | | | | 6,462 |
| | | | | |
| 20 | | Nu Skin Enterprises, Inc., Class A | | | | | | | | | 499 |
| | | | | |
| 170 | | Revlon Inc., (2) | | | | | | | | | 1,897 |
| | Total Personal Products | | | | | | | | | 35,081 |
| | Pharmaceuticals – 4.8% | | | | | | | | | |
| | | | | |
| 270 | | Abbott Laboratories | | | | | | | | | 12,631 |
| | | | | |
| 40 | | Allergan, Inc. | | | | | | | | | 2,330 |
| | | | | |
| 60 | | Ardea Biosciences Inc., (2) | | | | | | | | | 1,234 |
| | | | | |
| 10 | | Auxilium Pharmaceuticals, Inc., (2) | | | | | | | | | 235 |
| | | | | |
| 10 | | Biomimetic Therapeutics, Inc., (2) | | | | | | | | | 111 |
| | | | | |
| 500 | | BMP Sunstone Corporation, (2) | | | | | | | | | 2,575 |
| | | | | |
| 540 | | Bristol-Myers Squibb Company | | | | | | | | | 13,468 |
| | | | | |
| 410 | | Eli Lilly and Company | | | | | | | | | 13,735 |
| | | | | |
| 40 | | Endo Pharmaceuticals Holdings Inc., (2) | | | | | | | | | 873 |
| | | | | |
| 170 | | Forest Laboratories, Inc., (2) | | | | | | | | | 4,663 |
| | | | | |
| 370 | | Impax Laboratories Inc., (2) | | | | | | | | | 7,052 |
| | | | | |
| 640 | | Johnson & Johnson | | | | | | | | | 37,798 |
| | | | | |
| 3,090 | | Merck & Company Inc. | | | | | | | | | 108,057 |
| | | | | |
| 260 | | Nektar Therapautics, (2) | | | | | | | | | 3,146 |
| | | | | |
| 70 | | Optimer Pharmaceuticals, Inc., (2) | | | | | | | | | 649 |
| | | | | |
| 90 | | Pain Therapeutics, Inc., (2) | | | | | | | | | 500 |
| | | | | |
| 170 | | Par Pharmaceuticals Inc., (2) | | | | | | | | | 4,413 |
| | | | | |
| 4,640 | | Pfizer Inc. | | | | | | | | | 66,166 |
| | | | | |
| 130 | | Salix Pharmaceuticals Limited, (2) | | | | | | | | | 5,074 |
| | | | | |
| 110 | | ViroPharma, Inc., (2) | | | | | | | | | 1,233 |
| | | | | |
| 100 | | Vivus, Inc., (2) | | | | | | | | | 960 |
| | | | | |
| 80 | | Watson Pharmaceuticals Inc., (2) | | | | | | | | | 3,246 |
| | Total Pharmaceuticals | | | | | | | | | 290,149 |
| | Professional Services – 0.3% | | | | | | | | | |
| | | | | |
| 50 | | Corporate Executive Board Company | | | | | | | | | 1,314 |
| | | | | |
| 20 | | CoStar Group, Inc., (2) | | | | | | | | | 776 |
| | | | | | | | | | | |
| Shares | | Description (1) | | | | | | | | Value |
| | | | | | | | | | | |
| | Professional Services (continued) | | | | | | | | | |
| | | | | |
| 20 | | CRA International, Inc., (2) | | | | | | | | $ | 377 |
| | | | | |
| 270 | | Diamond Management & Techology Consultants | | | | | | | | | 2,784 |
| | | | | |
| 20 | | Equifax Inc. | | | | | | | | | 561 |
| | | | | |
| 10 | | FTI Consulting Inc., (2) | | | | | | | | | 436 |
| | | | | |
| 400 | | Hill International, Inc., (2) | | | | | | | | | 1,624 |
| | | | | |
| 120 | | Kelly Services, Inc., (2) | | | | | | | | | 1,784 |
| | | | | |
| 10 | | Korn Ferry International, (2) | | | | | | | | | 139 |
| | | | | |
| 30 | | Manpower Inc. | | | | | | | | | 1,295 |
| | | | | |
| 40 | | Navigant Consulting Inc., (2) | | | | | | | | | 415 |
| | | | | |
| 40 | | Resources Connection, Inc., (2) | | | | | | | | | 544 |
| | | | | |
| 60 | | Robert Half International Inc. | | | | | | | | | 1,413 |
| | | | | |
| 60 | | School Specialty Inc., (2) | | | | | | | | | 1,084 |
| | | | | |
| 170 | | SFN Group, (2) | | | | | | | | | 928 |
| | | | | |
| 10 | | The Advisory Board Company, (2) | | | | | | | | | 430 |
| | | | | |
| 90 | | Towers Watson & Company, Class A Shares | | | | | | | | | 3,497 |
| | | | | |
| 60 | | Verisk Analytics Inc, Class A Shares, (2) | | | | | | | | | 1,794 |
| | Total Professional Services | | | | | | | | | 21,195 |
| | Real Estate – 2.7% | | | | | | | | | |
| | | | | |
| 140 | | Acadia Realty Trust | | | | | | | | | 2,355 |
| | | | | |
| 20 | | Alexandria Real Estate Equities Inc. | | | | | | | | | 1,267 |
| | | | | |
| 60 | | AMB Property Corp. | | | | | | | | | 1,423 |
| | | | | |
| 40 | | American Campus Communities Inc. | | | | | | | | | 1,092 |
| | | | | |
| 430 | | Annaly Capital Management Inc. | | | | | | | | | 7,375 |
| | | | | |
| 110 | | Anworth Mortgage Asset Corporation | | | | | | | | | 783 |
| | | | | |
| 20 | | AvalonBay Communities, Inc. | | | | | | | | | 1,867 |
| | | | | |
| 290 | | BioMed Realty Trust Inc. | | | | | | | | | 4,666 |
| | | | | |
| 50 | | Boston Properties, Inc. | | | | | | | | | 3,567 |
| | | | | |
| 30 | | Camden Property Trust | | | | | | | | | 1,226 |
| | | | | |
| 270 | | Capstead Mortgage Corporation | | | | | | | | | 2,986 |
| | | | | |
| 220 | | CBL & Associates Properties Inc. | | | | | | | | | 2,737 |
| | | | | |
| 220 | | Cedar Shopping Centers Inc. | | | | | | | | | 1,324 |
| | | | | |
| 710 | | Chimera Investments Corporation | | | | | | | | | 2,563 |
| | | | | |
| 90 | | Colonial Properties Trust | | | | | | | | | 1,308 |
| | | | | |
| 70 | | Colony Financial Inc. | | | | | | | | | 1,183 |
| | | | | |
| 40 | | Corporate Office Properties | | | | | | | | | 1,510 |
| | | | | |
| 90 | | Cousins Properties, Inc. | | | | | | | | | 607 |
| | | | | |
| 210 | | DCT Industrial Trust Inc. | | | | | | | | | 949 |
| | | | | |
| 350 | | Developers Diversified Realty Corporation | | | | | | | | | 3,465 |
| | | | | |
| 260 | | DiamondRock Hospitality Company, (2) | | | | | | | | | 2,137 |
| | | | | |
| 90 | | Duke Realty Corporation | | | | | | | | | 1,022 |
| | | | | |
| 60 | | Dupont Fabros Technology Inc. | | | | | | | | | 1,474 |
| | | | | |
| 20 | | EastGroup Properties Inc. | | | | | | | | | 712 |
| | | | | |
| 130 | | Entertainment Properties Trust | | | | | | | | | 4,949 |
| | | | | |
| 20 | | Equity Lifestyles Properties Inc. | | | | | | | | | 965 |
| | | | | |
| 90 | | Equity Residential | | | | | | | | | 3,748 |
Portfolio of Investments
Nuveen U.S. Equity Completeness Fund (continued)
June 30, 2010
| | | | | | | | | | | |
| Shares | | Description (1) | | | | | | | | Value |
| | | | | | | | | | | |
| | Real Estate (continued) | | | | | | | | | |
| | | | | |
| 30 | | Essex Property Trust Inc. | | | | | | | | $ | 2,926 |
| | | | | |
| 90 | | Extra Space Storage Inc. | | | | | | | | | 1,251 |
| | | | | |
| 10 | | Federal Realty Investment Trust | | | | | | | | | 703 |
| | | | | |
| 50 | | Franklin Street Properties Corporation | | | | | | | | | 591 |
| | | | | |
| 30 | | Hatteras Financial Corp. | | | | | | | | | 835 |
| | | | | |
| 90 | | Health Care Property Investors Inc. | | | | | | | | | 2,903 |
| | | | | |
| 60 | | Health Care REIT, Inc. | | | | | | | | | 2,527 |
| | | | | |
| 50 | | Healthcare Realty Trust, Inc. | | | | | | | | | 1,099 |
| | | | | |
| 110 | | Highwoods Properties, Inc. | | | | | | | | | 3,054 |
| | | | | |
| 30 | | Home Properties New York, Inc. | | | | | | | | | 1,352 |
| | | | | |
| 170 | | Hospitality Properties Trust | | | | | | | | | 3,587 |
| | | | | |
| 320 | | Host Hotels & Resorts Inc. | | | | | | | | | 4,314 |
| | | | | |
| 500 | | HRPT Properties Trust | | | | | | | | | 3,105 |
| | | | | |
| 120 | | Investors Real Estate Trust | | | | | | | | | 1,060 |
| | | | | |
| 40 | | Kilroy Realty Corporation | | | | | | | | | 1,189 |
| | | | | |
| 160 | | Kimco Realty Corporation | | | | | | | | | 2,150 |
| | | | | |
| 80 | | LaSalle Hotel Properties | | | | | | | | | 1,646 |
| | | | | |
| 100 | | Liberty Property Trust | | | | | | | | | 2,885 |
| | | | | |
| 30 | | LTC Properties Inc. | | | | | | | | | 728 |
| | | | | |
| 190 | | Macerich Company | | | | | | | | | 7,091 |
| | | | | |
| 40 | | Mack-Cali Realty Corporation | | | | | | | | | 1,189 |
| | | | | |
| 400 | | Medical Properties Trust Inc. | | | | | | | | | 3,776 |
| | | | | |
| 290 | | MFA Mortgage Investments, Inc. | | | | | | | | | 2,146 |
| | | | | |
| 30 | | Mid-America Apartment Communities | | | | | | | | | 1,544 |
| | | | | |
| 20 | | National Health Investors Inc. | | | | | | | | | 771 |
| | | | | |
| 70 | | National Retail Properties, Inc. | | | | | | | | | 1,501 |
| | | | | |
| 80 | | Omega Healthcare Investors Inc. | | | | | | | | | 1,594 |
| | | | | |
| 30 | | Plum Creek Timber Company | | | | | | | | | 1,036 |
| | | | | |
| 50 | | Post Properties, Inc. | | | | | | | | | 1,137 |
| | | | | |
| 100 | | Potlatch Corporation | | | | | | | | | 3,573 |
| | | | | |
| 380 | | ProLogis | | | | | | | | | 3,849 |
| | | | | |
| 40 | | PS Business Parks Inc. | | | | | | | | | 2,231 |
| | | | | |
| 20 | | Public Storage, Inc. | | | | | | | | | 1,758 |
| | | | | |
| 70 | | Rayonier Inc. | | | | | | | | | 3,081 |
| | | | | |
| 40 | | Realty Income Corporation | | | | | | | | | 1,213 |
| | | | | |
| 50 | | Redwood Trust Inc. | | | | | | | | | 732 |
| | | | | |
| 20 | | Regency Centers Corporation | | | | | | | | | 688 |
| | | | | |
| 480 | | Resource Capital Corporation | | | | | | | | | 2,726 |
| | | | | |
| 60 | | Senior Housing Properties Trust | | | | | | | | | 1,207 |
| | | | | |
| 70 | | Simon Property Group, Inc. | | | | | | | | | 5,653 |
| | | | | |
| 60 | | SL Green Realty Corporation | | | | | | | | | 3,302 |
| | | | | |
| 30 | | Sovran Self Storage Inc. | | | | | | | | | 1,033 |
| | | | | |
| 30 | | Starwood Property Trust Inc. | | | | | | | | | 509 |
| | | | | |
| 140 | | Sunstone Hotel Investors Inc., (2) | | | | | | | | | 1,390 |
| | | | | |
| 40 | | Tanger Factory Outlet Centers | | | | | | | | | 1,655 |
| | | | | | | | | | | |
| Shares | | Description (1) | | | | | | | | Value |
| | | | | | | | | | | |
| | Real Estate (continued) | | | | | | | | | |
| | | | | |
| 70 | | UDR Inc. | | | | | | | | $ | 1,339 |
| | | | | |
| 110 | | Ventas Inc. | | | | | | | | | 5,165 |
| | | | | |
| 50 | | Vornado Realty Trust | | | | | | | | | 3,648 |
| | | | | |
| 50 | | Washington Real Estate Investment Trust | | | | | | | | | 1,380 |
| | Total Real Estate | | | | | | | | | 165,082 |
| | Real Estate Management & Development – 0.2% | | | | | | | | | |
| | | | | |
| 530 | | CB Richard Ellis Group, Inc., Class A, (2) | | | | | | | | | 7,213 |
| | | | | |
| 20 | | Forestar Real Estate Group Inc., (2) | | | | | | | | | 359 |
| | | | | |
| 30 | | Jones Lang LaSalle Inc. | | | | | | | | | 1,969 |
| | | | | |
| 10 | | St Joe Company, (2) | | | | | | | | | 232 |
| | | | | |
| 20 | | Tejon Ranch Company, (2) | | | | | | | | | 462 |
| | Total Real Estate Management & Development | | | | | | | | | 10,235 |
| | Road & Rail – 1.0% | | | | | | | | | |
| | | | | |
| 100 | | Arkansas Best Corporation | | | | | | | | | 2,075 |
| | | | | |
| 240 | | Avis Budget Group Inc., (2) | | | | | | | | | 2,357 |
| | | | | |
| 220 | | CSX Corporation | | | | | | | | | 10,919 |
| | | | | |
| 20 | | Hertz Global Holdings Inc., (2) | | | | | | | | | 189 |
| | | | | |
| 30 | | J.B. Hunt Transports Serives Inc. | | | | | | | | | 980 |
| | | | | |
| 200 | | Kansas City Southern Industries, (2) | | | | | | | | | 7,270 |
| | | | | |
| 140 | | Knight Transportation Inc. | | | | | | | | | 2,834 |
| | | | | |
| 60 | | Landstar System | | | | | | | | | 2,339 |
| | | | | |
| 120 | | Marten Transport, Ltd., (2) | | | | | | | | | 2,494 |
| | | | | |
| 170 | | Norfolk Southern Corporation | | | | | | | | | 9,019 |
| | | | | |
| 20 | | Ryder System, Inc. | | | | | | | | | 805 |
| | | | | |
| 190 | | Union Pacific Corporation | | | | | | | | | 13,207 |
| | | | | |
| 180 | | Werner Enterprises, Inc. | | | | | | | | | 3,940 |
| | Total Road & Rail | | | | | | | | | 58,428 |
| | Semiconductors & Equipment – 2.1% | | | | | | | | | |
| | | | | |
| 90 | | Actel Corporation, (2) | | | | | | | | | 1,154 |
| | | | | |
| 710 | | Advanced Micro Devices, Inc., (2) | | | | | | | | | 5,197 |
| | | | | |
| 40 | | Altera Corporation | | | | | | | | | 992 |
| | | | | |
| 230 | | Amkor Technology Inc., (2) | | | | | | | | | 1,267 |
| | | | | |
| 90 | | Analog Devices, Inc. | | | | | | | | | 2,507 |
| | | | | |
| 300 | | Applied Materials, Inc. | | | | | | | | | 3,606 |
| | | | | |
| 140 | | Atheros Communications, Inc., (2) | | | | | | | | | 3,856 |
| | | | | |
| 60 | | Broadcom Corporation, Class A | | | | | | | | | 1,978 |
| | | | | |
| 30 | | Brooks Automation Inc., (2) | | | | | | | | | 232 |
| | | | | |
| 10 | | Cabot Microelectronics Corporation, (2) | | | | | | | | | 346 |
| | | | | |
| 50 | | Cavium Networks, Inc., (2) | | | | | | | | | 1,310 |
| | | | | |
| 40 | | Cirrus Logic Inc., (2) | | | | | | | | | 632 |
| | | | | |
| 30 | | Cree, Inc., (2) | | | | | | | | | 1,801 |
| | | | | |
| 30 | | Cymer, Inc., (2) | | | | | | | | | 901 |
| | | | | |
| 160 | | Diodes Inc., (2) | | | | | | | | | 2,539 |
| | | | | |
| 240 | | Energy Conversion Devices Inc., (2) | | | | | | | | | 984 |
| | | | | |
| 20 | | Fairchild Semiconductor International Inc., Class A, (2) | | | | | | | | | 168 |
Portfolio of Investments
Nuveen U.S. Equity Completeness Fund (continued)
June 30, 2010
| | | | | | | | | | | |
| Shares | | Description (1) | | | | | | | | Value |
| | | | | | | | | | | |
| | Semiconductors & Equipment (continued) | | | | | | | | | |
| | | | | |
| 50 | | FEI Company, (2) | | | | | | | | $ | 986 |
| | | | | |
| 10 | | First Solar Inc., (2) | | | | | | | | | 1,138 |
| | | | | |
| 100 | | FormFactor Inc., (2) | | | | | | | | | 1,080 |
| | | | | |
| 250 | | GT Solar International Inc., (2) | | | | | | | | | 1,400 |
| | | | | |
| 30 | | Hittite Microwave Corporation, (2) | | | | | | | | | 1,342 |
| | | | | |
| 1,460 | | Intel Corporation | | | | | | | | | 28,397 |
| | | | | |
| 110 | | International Rectifier Corporation, (2) | | | | | | | | | 2,047 |
| | | | | |
| 110 | | Intersil Holding Corporation, Class A | | | | | | | | | 1,332 |
| | | | | |
| 10 | | IXYS Corporation, (2) | | | | | | | | | 88 |
| | | | | |
| 50 | | KLA-Tencor Corporation | | | | | | | | | 1,394 |
| | | | | |
| 110 | | Kulicke & Soffa Industries Inc., (2) | | | | | | | | | 772 |
| | | | | |
| 30 | | Lam Research Corporation, (2) | | | | | | | | | 1,142 |
| | | | | |
| 10 | | Linear Technology Corporation | | | | | | | | | 278 |
| | | | | |
| 230 | | LSI Logic Corporation, (2) | | | | | | | | | 1,058 |
| | | | | |
| 100 | | Marvell Technology Group Ltd., (2) | | | | | | | | | 1,576 |
| | | | | |
| 80 | | Maxim Integrated Products, Inc. | | | | | | | | | 1,338 |
| | | | | |
| 10 | | MEMC Electronic Materials, (2) | | | | | | | | | 99 |
| | | | | |
| 600 | | Micron Technology, Inc., (2) | | | | | | | | | 5,094 |
| | | | | |
| 110 | | Microsemi Corporation, (2) | | | | | | | | | 1,609 |
| | | | | |
| 400 | | MIPS Technologies, Inc., (2) | | | | | | | | | 2,044 |
| | | | | |
| 30 | | Monolithic Power Systems, Inc., (2) | | | | | | | | | 536 |
| | | | | |
| 10 | | National Semiconductor Corporation | | | | | | | | | 135 |
| | | | | |
| 60 | | Netlogic Microsystems Inc., (2) | | | | | | | | | 1,632 |
| | | | | |
| 40 | | NVE Corporation, (2) | | | | | | | | | 1,741 |
| | | | | |
| 230 | | NVIDIA Corporation, (2) | | | | | | | | | 2,348 |
| | | | | |
| 100 | | ON Semiconductor Corporation, (2) | | | | | | | | | 638 |
| | | | | |
| 190 | | Photronics Inc., (2) | | | | | | | | | 859 |
| | | | | |
| 40 | | Power Integrations Inc. | | | | | | | | | 1,288 |
| | | | | |
| 570 | | RF Micro Devices, Inc., (2) | | | | | | | | | 2,229 |
| | | | | |
| 100 | | Rubicon Technology Inc., (2) | | | | | | | | | 2,979 |
| | | | | |
| 230 | | Rudolph Technologies, (2) | | | | | | | | | 1,737 |
| | | | | |
| 60 | | Semtech Corporation, (2) | | | | | | | | | 982 |
| | | | | |
| 500 | | Silicon Image, Inc., (2) | | | | | | | | | 1,755 |
| | | | | |
| 290 | | Skyworks Solutions Inc., (2) | | | | | | | | | 4,869 |
| | | | | |
| 10 | | Supertex Inc., (2) | | | | | | | | | 247 |
| | | | | |
| 160 | | Tessera Technologies Inc., (2) | | | | | | | | | 2,568 |
| | | | | |
| 220 | | Texas Instruments Incorporated | | | | | | | | | 5,122 |
| | | | | |
| 270 | | TriQuint Semiconductor, Inc., (2) | | | | | | | | | 1,650 |
| | | | | |
| 200 | | Veeco Instruments Inc., (2) | | | | | | | | | 6,856 |
| | | | | |
| 100 | | Xilinx, Inc. | | | | | | | | | 2,526 |
| | Total Semiconductors & Equipment | | | | | | | | | 126,381 |
| | Software – 2.3% | | | | | | | | | |
| | | | | |
| 20 | | ACI Worldwide, Inc., (2) | | | | | | | | | 389 |
| | | | | |
| 80 | | Activision Blizzard Inc. | | | | | | | | | 839 |
| | | | | |
| 80 | | Adobe Systems Incorporated, (2) | | | | | | | | | 2,114 |
| | | | | | | | | | | |
| Shares | | Description (1) | | | | | | | | Value |
| | | | | | | | | | | |
| | Software (continued) | | | | | | | | | |
| | | | | |
| 10 | | Advent Software Inc., (2) | | | | | | | | $ | 470 |
| | | | | |
| 150 | | Ariba Inc., (2) | | | | | | | | | 2,390 |
| | | | | |
| 70 | | Asiainfo Holdings, Inc., (2) | | | | | | | | | 1,530 |
| | | | | |
| 30 | | Autodesk, Inc., (2) | | | | | | | | | 731 |
| | | | | |
| 170 | | Blackbaud, Inc. | | | | | | | | | 3,701 |
| | | | | |
| 30 | | Blackboard, Inc., (2) | | | | | | | | | 1,120 |
| | | | | |
| 10 | | BMC Software, Inc., (2) | | | | | | | | | 346 |
| | | | | |
| 100 | | CA Inc. | | | | | | | | | 1,840 |
| | | | | |
| 60 | | CommVault Systems, Inc., (2) | | | | | | | | | 1,350 |
| | | | | |
| 20 | | Compuware Corporation, (2) | | | | | | | | | 160 |
| | | | | |
| 60 | | Concur Technologies, Inc., (2) | | | | | | | | | 2,561 |
| | | | | |
| 120 | | Ebix, Inc., (2) | | | | | | | | | 1,882 |
| | | | | |
| 60 | | Epicor Software Corporation, (2) | | | | | | | | | 479 |
| | | | | |
| 10 | | EPIQ Systems, Inc. | | | | | | | | | 129 |
| | | | | |
| 10 | | FactSet Research Systems Inc. | | | | | | | | | 670 |
| | | | | |
| 160 | | Fair Isaac Corporation | | | | | | | | | 3,486 |
| | | | | |
| 120 | | Henry Jack and Associates Inc. | | | | | | | | | 2,866 |
| | | | | |
| 230 | | Informatica Corporation, (2) | | | | | | | | | 5,492 |
| | | | | |
| 50 | | JDA Software Group, (2) | | | | | | | | | 1,099 |
| | | | | |
| 130 | | Lawson Software, Inc., (2) | | | | | | | | | 949 |
| | | | | |
| 50 | | Micros Systems, Inc., (2) | | | | | | | | | 1,594 |
| | | | | |
| 1,440 | | Microsoft Corporation | | | | | | | | | 33,134 |
| | | | | |
| 20 | | Microstrategy Inc., (2) | | | | | | | | | 1,502 |
| | | | | |
| 10 | | Net 1 Ueps Technologies, Inc., (2) | | | | | | | | | 134 |
| | | | | |
| 130 | | NetScout Systems, Inc., (2) | | | | | | | | | 1,849 |
| | | | | |
| 30 | | NetSuite Inc., (2) | | | | | | | | | 379 |
| | | | | |
| 80 | | Novell Inc., (2) | | | | | | | | | 454 |
| | | | | |
| 20 | | Nuance Communications, Inc., (2) | | | | | | | | | 299 |
| | | | | |
| 10 | | OPNET Technologies, Inc. | | | | | | | | | 147 |
| | | | | |
| 820 | | Oracle Corporation | | | | | | | | | 17,597 |
| | | | | |
| 260 | | Parametric Technology Corporation, (2) | | | | | | | | | 4,074 |
| | | | | |
| 10 | | Pegasystems, Inc. | | | | | | | | | 321 |
| | | | | |
| 110 | | Progress Software Corporation, (2) | | | | | | | | | 3,303 |
| | | | | |
| 230 | | PROS Holdings, Inc., (2) | | | | | | | | | 1,495 |
| | | | | |
| 150 | | Quest Software Inc., (2) | | | | | | | | | 2,706 |
| | | | | |
| 60 | | Radiant Systems, Inc., (2) | | | | | | | | | 868 |
| | | | | |
| 40 | | Red Hat, Inc., (2) | | | | | | | | | 1,158 |
| | | | | |
| 20 | | Rosetta Stone Inc., (2) | | | | | | | | | 459 |
| | | | | |
| 20 | | Rovi Corporation, (2) | | | | | | | | | 758 |
| | | | | |
| 20 | | Solarwinds, Inc., (2) | | | | | | | | | 321 |
| | | | | |
| 160 | | Solera Holdings Inc. | | | | | | | | | 5,792 |
| | | | | |
| 250 | | SonicWALL, Inc., (2) | | | | | | | | | 2,938 |
| | | | | |
| 10 | | Sourcefire Inc., (2) | | | | | | | | | 190 |
| | | | | |
| 70 | | SuccessFactors, Inc., (2) | | | | | | | | | 1,455 |
| | | | | |
| 120 | | Symantec Corporation, (2) | | | | | | | | | 1,666 |
Portfolio of Investments
Nuveen U.S. Equity Completeness Fund (continued)
June 30, 2010
| | | | | | | | | | | |
| Shares | | Description (1) | | | | | | | | Value |
| | | | | | | | | | | |
| | Software (continued) | | | | | | | | | |
| | | | | |
| 60 | | Synopsys Inc., (2) | | | | | | | | $ | 1,252 |
| | | | | |
| 10 | | Take-Two Interactive Software, Inc., (2) | | | | | | | | | 90 |
| | | | | |
| 130 | | Taleo Corporation, (2) | | | | | | | | | 3,158 |
| | | | | |
| 10 | | TeleCommunication Systems, (2) | | | | | | | | | 41 |
| | | | | |
| 130 | | THQ, Inc., (2) | | | | | | | | | 562 |
| | | | | |
| 220 | | Tibco Software Inc., (2) | | | | | | | | | 2,653 |
| | | | | |
| 200 | | TiVo, Inc., (2) | | | | | | | | | 1,476 |
| | | | | |
| 20 | | Tyler Technologies Inc., (2) | | | | | | | | | 310 |
| | | | | |
| 50 | | Ultimate Software Group, Inc., (2) | | | | | | | | | 1,643 |
| | | | | |
| 280 | | Vasco Data Security International, Inc., (2) | | | | | | | | | 1,728 |
| | | | | |
| 50 | | VMware Inc., (2) | | | | | | | | | 3,130 |
| | | | | |
| 130 | | Websense Inc., (2) | | | | | | | | | 2,457 |
| | Total Software | | | | | | | | | 139,686 |
| | Specialty Retail – 1.9% | | | | | | | | | |
| | | | | |
| 100 | | Aaron Rents Inc. | | | | | | | | | 1,707 |
| | | | | |
| 20 | | Abercrombie & Fitch Co., Class A | | | | | | | | | 614 |
| | | | | |
| 50 | | Aeropostale, Inc., (2) | | | | | | | | | 1,432 |
| | | | | |
| 40 | | American Eagle Outfitters, Inc. | | | | | | | | | 470 |
| | | | | |
| 100 | | America's Car-Mart, Inc., (2) | | | | | | | | | 2,263 |
| | | | | |
| 90 | | Ann Taylor Stores Corporation, (2) | | | | | | | | | 1,464 |
| | | | | |
| 110 | | Asbury Automotive Group, Inc., (2) | | | | | | | | | 1,159 |
| | | | | |
| 70 | | Barnes & Noble Inc. | | | | | | | | | 903 |
| | | | | |
| 10 | | Bed Bath and Beyond Inc., (2) | | | | | | | | | 371 |
| | | | | |
| 90 | | Best Buy Co., Inc. | | | | | | | | | 3,047 |
| | | | | |
| 30 | | Buckle Inc. | | | | | | | | | 973 |
| | | | | |
| 190 | | Cabela's Incorporated, (2) | | | | | | | | | 2,687 |
| | | | | |
| 60 | | Cato Corporation | | | | | | | | | 1,321 |
| | | | | |
| 40 | | Childrens Place Retail Stores Inc., (2) | | | | | | | | | 1,761 |
| | | | | |
| 230 | | Christopher & Banks Corporation | | | | | | | | | 1,424 |
| | | | | |
| 100 | | Colective Brands Inc., (2) | | | | | | | | | 1,580 |
| | | | | |
| 80 | | Dress Barn, Inc., (2) | | | | | | | | | 1,905 |
| | | | | |
| 10 | | DSW Inc., (2) | | | | | | | | | 225 |
| | | | | |
| 70 | | Finish Line, Inc. | | | | | | | | | 975 |
| | | | | |
| 110 | | Foot Locker, Inc. | | | | | | | | | 1,388 |
| | | | | |
| 30 | | GameStop Corporation, (2) | | | | | | | | | 564 |
| | | | | |
| 120 | | Gap, Inc. | | | | | | | | | 2,335 |
| | | | | |
| 90 | | Group 1 Automotive Inc., (2) | | | | | | | | | 2,118 |
| | | | | |
| 20 | | Guess Inc. | | | | | | | | | 625 |
| | | | | |
| 10 | | Haverty Furniture Companies Inc. | | | | | | | | | 123 |
| | | | | |
| 100 | | Hhgregg Inc., (2) | | | | | | | | | 2,332 |
| | | | | |
| 50 | | Hibbett Sporting Goods, Inc., (2) | | | | | | | | | 1,198 |
| | | | | |
| 620 | | Home Depot, Inc. | | | | | | | | | 17,403 |
| | | | | |
| 40 | | Hot Topic, Inc. | | | | | | | | | 203 |
| | | | | |
| 120 | | J. Crew Group Inc., (2) | | | | | | | | | 4,417 |
| | | | | |
| 50 | | Jo Ann Stores, Inc., (2) | | | | | | | | | 1,876 |
| | | | | | | | | | | |
| Shares | | Description (1) | | | | | | | | Value |
| | | | | | | | | | | |
| | Specialty Retail (continued) | | | | | | | | | |
| | | | | |
| 30 | | Joseph A Bank Clothiers, Inc., (2) | | | | | | | | $ | 1,620 |
| | | | | |
| 120 | | Kirkland's, Inc., (2) | | | | | | | | | 2,025 |
| | | | | |
| 100 | | Limited Brands, Inc. | | | | | | | | | 2,207 |
| | | | | |
| 770 | | Lowe's Companies, Inc. | | | | | | | | | 15,723 |
| | | | | |
| 10 | | Lumber Liquidators Inc., (2) | | | | | | | | | 233 |
| | | | | |
| 90 | | Mens Wearhouse Inc. | | | | | | | | | 1,652 |
| | | | | |
| 10 | | Monro Muffler Brake, Inc. | | | | | | | | | 395 |
| | | | | |
| 160 | | Office Depot, Inc., (2) | | | | | | | | | 646 |
| | | | | |
| 210 | | OfficeMax Inc., (2) | | | | | | | | | 2,743 |
| | | | | |
| 40 | | O'Reilly Automotive Inc., (2) | | | | | | | | | 1,902 |
| | | | | |
| 310 | | Pacific Sunwear of California, Inc., (2) | | | | | | | | | 992 |
| | | | | |
| 40 | | Pep Boys – Manny, Moe & Jack | | | | | | | | | 354 |
| | | | | |
| 10 | | RadioShack Corporation | | | | | | | | | 195 |
| | | | | |
| 60 | | Rent-A-Center Inc., (2) | | | | | | | | | 1,216 |
| | | | | |
| 50 | | Ross Stores, Inc. | | | | | | | | | 2,665 |
| | | | | |
| 20 | | Shoe Carnival, Inc., (2) | | | | | | | | | 410 |
| | | | | |
| 70 | | Signet Jewelers Limited, (2) | | | | | | | | | 1,925 |
| | | | | |
| 110 | | Staples, Inc. | | | | | | | | | 2,096 |
| | | | | |
| 130 | | Talbots, Inc., (2) | | | | | | | | | 1,339 |
| | | | | |
| 90 | | Tiffany & Co. | | | | | | | | | 3,411 |
| | | | | |
| 70 | | TJX Companies, Inc. | | | | | | | | | 2,936 |
| | | | | |
| 50 | | Tractor Supply Company | | | | | | | | | 3,048 |
| | | | | |
| 10 | | Urban Outfitters, Inc., (2) | | | | | | | | | 343 |
| | | | | |
| 30 | | Vitamin Shoppe Inc., (2) | | | | | | | | | 769 |
| | | | | |
| 100 | | Williams-Sonoma Inc. | | | | | | | | | 2,481 |
| | | | | |
| 70 | | Zumiez, Inc., (2) | | | | | | | | | 1,127 |
| | Total Specialty Retail | | | | | | | | | 115,316 |
| | Textiles, Apparel & Luxury Goods – 0.8% | | | | | | | | | |
| | | | | |
| 80 | | Carter's Inc., (2) | | | | | | | | | 2,099 |
| | | | | |
| 160 | | Coach, Inc. | | | | | | | | | 5,847 |
| | | | | |
| 30 | | Deckers Outdoor Corporation, (2) | | | | | | | | | 4,285 |
| | | | | |
| 90 | | Fossil Inc., (2) | | | | | | | | | 3,122 |
| | | | | |
| 40 | | Fuqi International Inc., (2) | | | | | | | | | 271 |
| | | | | |
| 120 | | K Swiss, Inc., (2) | | | | | | | | | 1,347 |
| | | | | |
| 140 | | Maidenform Brands Inc., (2) | | | | | | | | | 2,849 |
| | | | | |
| 170 | | Nike, Inc., Class B | | | | | | | | | 11,483 |
| | | | | |
| 1,130 | | Quicksilver Inc., (2) | | | | | | | | | 4,180 |
| | | | | |
| 10 | | Skechers USA Inc., (2) | | | | | | | | | 364 |
| | | | | |
| 135 | | Steven Madden Limited, (2) | | | | | | | | | 4,254 |
| | | | | |
| 30 | | True Religion Apparel, Inc., (2) | | | | | | | | | 661 |
| | | | | |
| 30 | | VF Corporation | | | | | | | | | 2,134 |
| | | | | |
| 90 | | Warnaco Group, Inc., (2) | | | | | | | | | 3,252 |
| | | | | |
| 20 | | Weyco Group, Inc. | | | | | | | | | 455 |
| | Total Textiles, Apparel & Luxury Goods | | | | | | | | | 46,603 |
Portfolio of Investments
Nuveen U.S. Equity Completeness Fund (continued)
June 30, 2010
| | | | | | | | | | | |
| Shares | | Description (1) | | | | | | | | Value |
| | | | | | | | | | | |
| | Thrifts & Mortgage Finance – 0.4% | | | | | | | | | |
| | | | | |
| 70 | | Astoria Financial Corporation | | | | | | | | $ | 962 |
| | | | | |
| 20 | | Beneficial Mutual Bancorp Inc., (2) | | | | | | | | | 197 |
| | | | | |
| 50 | | Berkshire Hills Bancorp, Inc. | | | | | | | | | 973 |
| | | | | |
| 80 | | First Financial Holdings, Inc. | | | | | | | | | 915 |
| | | | | |
| 70 | | Flushing Financial Corporation | | | | | | | | | 855 |
| | | | | |
| 240 | | Home Federal Bancorp, Inc. | | | | | | | | | 3,030 |
| | | | | |
| 220 | | Hudson City Bancorp, Inc. | | | | | | | | | 2,692 |
| | | | | |
| 320 | | MGIC Investment Corporation, (2) | | | | | | | | | 2,204 |
| | | | | |
| 250 | | New York Community Bancorp, Inc. | | | | | | | | | 3,817 |
| | | | | |
| 120 | | People's United Financial, Inc. | | | | | | | | | 1,619 |
| | | | | |
| 230 | | Provident Financial Services Inc. | | | | | | | | | 2,688 |
| | | | | |
| 170 | | Provident New York Bancorp. | | | | | | | | | 1,504 |
| | | | | |
| 160 | | Radian Group Inc. | | | | | | | | | 1,157 |
| | | | | |
| 60 | | TrustCo Bank Corporation NY | | | | | | | | | 335 |
| | Total Thrifts & Mortgage Finance | | | | | | | | | 22,948 |
| | Tobacco – 0.6% | | | | | | | | | |
| | | | | |
| 50 | | Alliance One International, Inc., (2) | | | | | | | | | 177 |
| | | | | |
| 420 | | Altria Group, Inc. | | | | | | | | | 8,416 |
| | | | | |
| 30 | | Lorillard Inc. | | | | | | | | | 2,158 |
| | | | | |
| 430 | | Philip Morris International | | | | | | | | | 19,710 |
| | | | | |
| 100 | | Reynolds American Inc. | | | | | | | | | 5,211 |
| | | | | |
| 30 | | Vector Group Ltd. | | | | | | | | | 504 |
| | Total Tobacco | | | | | | | | | 36,176 |
| | Trading Companies & Distributors – 0.2% | | | | | | | | | |
| | | | | |
| 20 | | Applied Industrial Technologies Inc. | | | | | | | | | 505 |
| | | | | |
| 180 | | GATX Corporation | | | | | | | | | 4,801 |
| | | | | |
| 20 | | Kaman Corporation | | | | | | | | | 441 |
| | | | | |
| 10 | | MSC Industrial Direct Inc., Class A | | | | | | | | | 506 |
| | | | | |
| 20 | | TAL International Group Inc. | | | | | | | | | 448 |
| | | | | |
| 10 | | W.W. Grainger, Inc. | | | | | | | | | 994 |
| | | | | |
| 50 | | Watsco Inc. | | | | | | | | | 2,895 |
| | | | | |
| 100 | | WESCO International Inc., (2) | | | | | | | | | 3,366 |
| | Total Trading Companies & Distributors | | | | | | | | | 13,956 |
| | Water Utilities – 0.2% | | | | | | | | | |
| | | | | |
| 50 | | American States Water Co | | | | | | | | | 1,656 |
| | | | | |
| 120 | | Aqua America Inc. | | | | | | | | | 2,121 |
| | | | | |
| 10 | | California Water Service Group | | | | | | | | | 356 |
| | | | | |
| 100 | | Connecticut Water Service, Inc. | | | | | | | | | 2,101 |
| | | | | |
| 280 | | Southwest Water Company | | | | | | | | | 2,933 |
| | Total Water Utilities | | | | | | | | | 9,167 |
| | Wireless Telecommunication Services – 0.5% | | | | | | | | | |
| | | | | |
| 40 | | American Tower Corporation, (2) | | | | | | | | | 1,779 |
| | | | | |
| 110 | | Clearwire Corporation, (2) | | | | | | | | | 800 |
| | | | | |
| 70 | | Crown Castle International Corporation, (2) | | | | | | | | | 2,607 |
| | | | | |
| 10 | | Metropcs Communications Inc., (2) | | | | | | | | | 81 |
| | | | | | | | | | | | |
| Shares | | Description (1) | | | | | | | | Value |
| | | | | | | | | | | | |
| | | Wireless Telecommunication Services (continued) | | | | | | | | | |
| | | | | |
| | 150 | | NII Holdings Inc., Class B, (2) | | | | | | | | $ | 4,877 |
| | | | | |
| | 30 | | NTELOS Holdings Corporation | | | | | | | | | 515 |
| | | | | |
| | 4,350 | | Sprint Nextel Corporation, (2) | | | | | | | | | 18,443 |
| | | | | |
| | 70 | | Syniverse Holdings Inc., (2) | | | | | | | | | 1,431 |
| | | | | |
| | 50 | | Telephone and Data Systems Inc. | | | | | | | | | 1,519 |
| | | Total Wireless Telecommunication Services | | | | | | | | | 32,052 |
| | | Total Common Stocks (cost $6,195,821) | | | | | | | | | 5,781,897 |
| | | | | |
Principal
Amount (000) | | Description (1) | | | | Coupon | | Maturity | | Value |
| | | Short-Term Investments – 4.6% | | | | | | | | | |
| | | | | |
| $ | 274 | | Repurchase Agreement with State Street Bank, dated 6/30/10, repurchase price $273,840, collateralized by $270,000 U.S. Treasury Notes, 2.500%, due 4/30/15, value $280,908 | | | | 0.000% | | 7/01/10 | | $ | 273,840 |
| | | Total Short-Term Investments (cost $273,840) | | | | | | | | | 273,840 |
| | | Total Investments (cost $6,469,661) – 100.7% | | | | | | | | | 6,055,737 |
| | | Other Assets Less Liabilities – (0.7)% | | | | | | | | | (39,737) |
| | | Net Assets – 100% | | | | | | | | $ | 6,016,000 |
| | | | For Fund portfolio compliance purposes, the Fund’s industry classifications refer to any one or more of the industry sub-classifications used by one or more widely recognized market indexes, and/or as defined by Fund management. This definition may not apply for purposes of this report, which may combine industry sub-classifications into sectors for reporting ease. |
| | (1) | | All percentages shown in the Portfolio of Investments are based on net assets. |
| | (2) | | Non-income producing; issuer has not declared a dividend within the past twelve months. |
See accompanying notes to financial statements.
Statement of Assets and Liabilities
June 30, 2010
| | | | |
Assets | | | | |
Investments, at value (cost $6,469,661) | | $ | 6,055,737 | |
Cash | | | 19 | |
Receivables: | | | | |
Dividends | | | 8,144 | |
From Adviser | | | 9,475 | |
Investments sold | | | 3,975 | |
Total assets | | | 6,077,350 | |
Liabilities | | | | |
Accrued other expenses | | | 61,350 | |
Total liabilities | | | 61,350 | |
Net assets | | $ | 6,016,000 | |
Shares outstanding | | | 381,344 | |
Net asset value per share | | $ | 15.78 | |
Net Assets Consist of: | | | | |
Capital paid-in | | $ | 7,755,323 | |
Undistributed (Over-distribution of) net investment income | | | 44,671 | |
Accumulated net realized gain (loss) | | | (1,370,070 | ) |
Net unrealized appreciation (depreciation) | | | (413,924 | ) |
Net assets | | $ | 6,016,000 | |
Authorized shares Par value per share | |
| Unlimited
$0.01 |
|
See accompanying notes to financial statements.
Statement of Operations
Year Ended June 30, 2010
| | | | |
Investment Income | | $ | 111,890 | |
Expenses | | | | |
Management fees | | | 30,808 | |
Shareholders’ servicing agent fees and expenses | | | 160 | |
Custodian’s fees and expenses | | | 116,382 | |
Trustees’ fees and expenses | | | 138 | |
Professional fees | | | 9,126 | |
Shareholders’ reports – printing and mailing expenses | | | 25,059 | |
Federal and state registration fees | | | 166 | |
Other expenses | | | 1,126 | |
Total expenses before expense reimbursement | | | 182,965 | |
Expense reimbursement | | | (137,820 | ) |
Net expenses | | | 45,145 | |
Net investment income | | | 66,745 | |
Realized and Unrealized Gain (Loss) | | | | |
Net realized gain (loss) from investments | | | 96,952 | |
Change in net unrealized appreciation (depreciation) of investments | | | 366,562 | |
Net realized and unrealized gain (loss) | | | 463,514 | |
Net increase (decrease) in net assets from operations | | $ | 530,259 | |
See accompanying notes to financial statements.
Statement of Changes in Net Assets
| | | | | | | | |
| | | Year Ended
6/30/10 | | | Year Ended
6/30/09 | |
Operations | | | | | | | | |
Net investment income | | $ | 66,745 | | | $ | 87,039 | |
Net realized gain (loss) from investments | | | 96,952 | | | | (1,468,814 | ) |
Change in net unrealized appreciation (depreciation) of investments | | | 366,562 | | | | (780,486 | ) |
Net increase (decrease) in net assets from operations | | | 530,259 | | | | (2,162,261 | ) |
Distributions to Shareholders | | | | | | | | |
From net investment income | | | (82,988 | ) | | | (24,986 | ) |
Decrease in net assets from distributions to shareholders | | | (82,988 | ) | | | (24,986 | ) |
Fund Share Transactions | | | | | | | | |
Proceeds from sale of shares | | | 1,287,999 | | | | 7,623,977 | |
Cost of shares redeemed | | | (461,000 | ) | | | (695,000 | ) |
Net increase (decrease) in net assets from Fund share transactions | | | 826,999 | | | | 6,928,977 | |
Net increase (decrease) in net assets | | | 1,274,270 | | | | 4,741,730 | |
Net assets at the beginning of year | | | 4,741,730 | | | | — | |
Net assets at the end of year | | $ | 6,016,000 | | | $ | 4,741,730 | |
Undistributed (Over-distribution of) net investment income at the end of year | | $ | 44,671 | | | $ | 60,886 | |
See accompanying notes to financial statements.
Notes to Financial Statements
1. General Information and Significant Accounting Policies
The Nuveen Investment Trust (the “Trust”) is an open-end management investment company registered under the Investment Company Act of 1940, as amended. The Trust is comprised of Nuveen U.S. Equity Completeness Fund, (the “Fund”), among others. The Trust was organized as a Massachusetts business trust in 1996.
The Fund’s investment objective is to provide capital appreciation and to enhance the risk/return profile of the U.S. equity portion of certain “funds of funds” advised by Nuveen Asset Management (the “Adviser”), a wholly-owned subsidiary of Nuveen Investments, Inc. (“Nuveen”).
Under normal market conditions, the Fund will invest primarily in equity securities of U.S. companies. The Fund’s only investors are the Nuveen Conservative Allocation Fund, Nuveen Moderate Allocation Fund and Nuveen Growth Allocation Fund (individually, an “Allocation Fund,” and collectively, the “Allocation Funds”). Each Allocation Fund is a “fund of funds” and invests principally in shares of other registered investment companies, including open-end mutual funds and exchange-traded funds (the “Underlying Funds”). The Fund is managed with the goal of outperforming a customized benchmark that is designed so that, when it is combined with the benchmarks of the U.S. equity-focused Underlying Funds included in the Allocation Funds, it approximates the performance of the Russell 3000 Index. This process seeks to optimize return while targeting a tracking error of 1.50% relative to the customized benchmark.
In June 2009, the Financial Accounting Standards Board (“FASB”) established the FASB Accounting Standards CodificationTM (the “Codification”) as the single source of authoritative accounting principles recognized by the FASB in the preparation of financial statements in conformity with generally accepted accounting principles (“GAAP”). The Codification supersedes existing non-grandfathered, non-SEC accounting and reporting standards. The Codification did not change GAAP but rather organized it into a hierarchy where all guidance within the Codification carries an equal level of authority. The Codification became effective for financial statements issued for interim and annual periods ending after September 15, 2009. The Codification did not have a material effect on the Fund’s financial statements.
The following is a summary of significant accounting policies followed by the Fund in the preparation of its financial statements in accordance with accounting principles generally accepted in the United States (“U.S. GAAP”).
Investment Valuation
Common stocks and other equity-type securities are valued at the last sales price on the securities exchange on which such securities are primarily traded and are generally classified as Level 1. Securities primarily traded on the NASDAQ National Market (“NASDAQ”) are valued, except as indicated below, at the NASDAQ Official Closing Price and are generally classified as Level 1. However, securities traded on a securities exchange or NASDAQ for which there were no transactions on a given day or securities not listed on a securities exchange or NASDAQ are valued at the mean between the quoted bid and ask prices.
Temporary investments in securities that have variable rate and demand features qualifying them as short-term investments are valued at amortized cost, which approximates market value. These securities are generally classified as Level 1.
Certain securities may not be able to be priced by the pre-established pricing methods as described above. Such securities may be valued by the Fund’s Board of Trustees or its designee at fair value. These securities generally include, but are not limited to, restricted securities (securities which may not be publicly sold without registration under the Securities Act) for which a pricing service is unable to provide a market price; securities whose trading has been formally suspended; fixed-income securities that have gone into default and for which there is no current market quotation; a security whose market price is not available from a pre-established pricing source; a security with respect to which an event has occurred that is likely to materially affect the value of the security after the market has closed but before the calculation of the Fund’s net asset value (as may be the case in non-U.S. markets on which the security is primarily traded) or make it difficult or impossible to obtain a reliable market quotation; and a security whose price, as provided by the pricing service, is not deemed to reflect the security’s fair value. As a general principle, the fair value of an issue of securities would appear to be the amount that the owner might reasonably expect to receive for them in a current sale. A variety of factors may be considered in determining the fair value of these securities, which may include consideration of the following: yields or prices of investments of comparable quality, type of issue, coupon, maturity and rating, market quotes or indications of value from security dealers, evaluations of anticipated cash flows or collateral, general market conditions and other information and analysis, including the obligor’s credit characteristics considered relevant. These securities are classified as Level 2 or as Level 3 depending on the priority of the significant inputs. Regardless of the method employed to value a particular security, all valuations are subject to review by the Fund’s Board of Trustees or its designee.
Refer to Footnote 2 – Fair Value Measurements for further details on the leveling of securities held by the Funds as of the end of the reporting period.
Investment Transactions
Investment transactions are recorded on a trade date basis. Realized gains and losses from investment transactions are determined on the specific identification method.
Notes to Financial Statements (continued)
Investment Income
Dividend income is recorded on the ex-dividend date or, for foreign securities, when information is available. Interest income is recorded on an accrual basis.
Income Taxes
The Fund intends to distribute substantially all of its net investment income and net capital gains to shareholders and to otherwise comply with the requirements of Subchapter M of the Internal Revenue Code applicable to regulated investment companies. Therefore, no federal income tax provision is required.
For all open tax years and all major taxing jurisdictions, management of the Fund has concluded that there are no significant uncertain tax positions that would require recognition in the financial statements. Open tax years are those that are open for examination by taxing authorities (i.e., generally the last four tax year ends and the interim tax period since then). Furthermore, management of the Fund is also not aware of any tax positions for which it is reasonably possible that the total amounts of unrecognized tax benefits will significantly change in the next twelve months.
Dividends and Distributions to Shareholders
Dividends from net investment income and net realized capital gains from investment transactions, if any, are declared and distributed to shareholders at least annually. Furthermore, capital gains are distributed only to the extent they exceed available capital loss carryforwards.
Distributions to shareholders are recorded on the ex-dividend date. The amount and timing of distributions are determined in accordance with federal income tax regulations, which may differ from U.S. GAAP.
Sales Charge Program
The Fund’s shares are not subject to any sales charge or 12b-1 distribution or service fees.
Derivative Instruments
The Fund is authorized to invest in futures, options, swaps and other derivative instruments. Although the Fund is authorized to invest in such derivative instruments, and may do so in the future, it did not make any such investments during the fiscal year ended June 30, 2010.
Repurchase Agreements
In connection with transactions in repurchase agreements, it is the Fund’s policy that its custodian take possession of the underlying collateral securities, the fair value of which exceeds the principal amount of the repurchase transaction, including accrued interest, at all times. If the seller defaults, and the fair value of the collateral declines, realization of the collateral may be delayed or limited.
Custodian Fee Credit
The Fund has an arrangement with the custodian bank whereby certain custodian fees and expenses are reduced by net credits earned on the Fund’s cash on deposit with the bank. Such deposit arrangements are an alternative to overnight investments. Credits for cash balances may be offset by charges for any days on which the Fund overdraws its account at the custodian bank.
Indemnifications
Under the Trust’s organizational documents, its officers and trustees are indemnified against certain liabilities arising out of the performance of their duties to the Trust. In addition, in the normal course of business, the Trust enters into contracts that provide general indemnifications to other parties. The Trust’s maximum exposure under these arrangements is unknown as this would involve future claims that may be made against the Trust that have not yet occurred. However, the Trust has not had prior claims or losses pursuant to these contracts and expects the risk of loss to be remote.
Use of Estimates
The preparation of financial statements in conformity with U.S. GAAP requires management to make estimates and assumptions that affect the reported amounts of assets and liabilities at the date of the financial statements and the reported amounts of increases and decreases in net assets from operations during the reporting period. Actual results may differ from those estimates.
2. Fair Value Measurements
In determining the value of the Fund’s investments, various inputs are used. These inputs are summarized in the three broad levels listed below:
| | |
| Level 1 – | | Quoted prices in active markets for identical securities. |
| Level 2 – | | Other significant observable inputs (including quoted prices for similar securities, interest rates, prepayment speeds, credit risk, etc.). |
| Level 3 – | | Significant unobservable inputs (including management’s assumptions in determining the fair value of investments). |
The inputs or methodologies used for valuing securities are not an indication of the risk associated with investing in those securities. The following is a summary of the Fund’s fair value measurements as of June 30, 2010:
| | | | | | | | | | | | |
| | | Level 1 | | Level 2 | | Level 3 | | Total |
Investments: | | | | | | | | | | | | |
Common Stocks | | $ | 5,781,897 | | $ | — | | $ | — | | $ | 5,781,897 |
Short-Term Investments | | | 273,840 | | | — | | | — | | | 273,840 |
Total | | $ | 6,055,737 | | $ | — | | $ | — | | $ | 6,055,737 |
3. Derivative Instruments and Hedging Activities
The Fund records derivative instruments at fair value, with changes in fair value recognized on the Statement of Operations, when applicable. Even though the Fund’s investments in derivatives may represent economic hedges, they are not considered to be hedge transactions for financial reporting purposes. The Fund did not invest in derivative instruments during the fiscal year ended June 30, 2010.
4. Fund Shares
Transactions in Fund shares were as follows:
| | | | | | | | | | | | | | |
| | | Year Ended
6/30/10 | | | Year Ended
6/30/09 | |
| | | Shares | | | Amount | | | Shares | | | Amount | |
Shares sold | | 74,400 | | | $ | 1,287,999 | | | 384,419 | | | $ | 7,623,977 | |
Shares redeemed | | (28,330 | ) | | | (461,000 | ) | | (49,145 | ) | | | (695,000 | ) |
Net increase (decrease) | | 46,070 | | | $ | 826,999 | | | 335,274 | | | $ | 6,928,977 | |
5. Investment Transactions
Purchases and sales (excluding short-term investments) during the fiscal year ended June 30, 2010, aggregated $6,509,539 and $5,728,347, respectively.
6. Income Tax Information
The following information is presented on an income tax basis. Differences between amounts for financial statement and federal income tax purposes are primarily due to timing differences in recognizing certain gains and losses on investment transactions. To the extent that differences arise that are permanent in nature, such amounts are reclassified within the capital accounts as detailed below. Temporary differences do not require reclassification. Temporary and permanent differences do not impact the net asset value of the Fund.
At June 30, 2010, the cost and unrealized appreciation (depreciation) of investments as determined on a federal income tax basis, were as follows:
| | | | |
Cost of investments | | $ | 6,497,724 | |
Gross unrealized: | | | | |
Appreciation | | $ | 292,273 | |
Depreciation | | | (734,260 | ) |
Net unrealized appreciation (depreciation) of investments | | $ | (441,987 | ) |
Permanent differences, primarily due to federal taxes paid and adjustment for investments in Real Estate Investment Trusts resulted in reclassifications among the Fund’s components of net assets at June 30, 2010, the Fund’s tax year end, as follows:
| | | | |
Capital paid-in | | $ | (184 | ) |
Undistributed (Over-distribution of) net investment income | | | 28 | |
Accumulated net realized gain (loss) | | | 156 | |
The tax components of undistributed net ordinary income and net long-term capital gains at June 30, 2010, the Fund’s tax year end, were as follows:
| | | |
| | | |
Undistributed net ordinary income* | | $ | 44,671 |
Undistributed net long-term capital gains | | | — |
| * | Net ordinary income consists of net taxable income derived from dividends, interest, and net short-term capital gains, if any. |
Notes to Financial Statements (continued)
The tax character of distributions paid during the Fund’s tax years ended June 30, 2010 and June 30, 2009, was designated for purposes of the dividends paid deduction as follows:
| | | |
| 2010 | | |
Distributions from net ordinary income* | | $ | 82,988 |
Distributions from net long-term capital gains | | | — |
| |
| 2009 | | |
Distributions from net ordinary income* | | $ | 24,986 |
Distributions from net long-term capital gains | | | — |
| * | Net ordinary income consists of net taxable income derived from dividends, interest and net short-term capital gains, if any. |
At June 30, 2010 the Fund’s tax year end, the Fund had an unused capital loss carryforward of $1,341,941 available for federal income tax purposes to be applied against future capital gains, if any. If not applied, the carryforwards will expire on June 30, 2018.
7. Management Fees and Other Transactions with Affiliates
The Fund’s management fee is separated into two components – a fund-level fee, based only on the amount of assets within the Fund, and a complex-level fee, based on the aggregate amount of all fund assets managed by the Adviser. This pricing structure enables Fund shareholders to benefit from growth in the assets within the Fund as well as from growth in the amount of complex-wide assets managed by the Adviser.
The annual fund-level fee, payable monthly, is .35% of average daily net assets.
The annual complex-level fee, payable monthly, is calculated according to the following schedule:
| | | |
| Complex-Level Managed Asset Breakpoint Level* | | Effective Rate at Breakpoint Level | |
$55 billion | | .2000 | % |
$56 billion | | .1996 | |
$57 billion | | .1989 | |
$60 billion | | .1961 | |
$63 billion | | .1931 | |
$66 billion | | .1900 | |
$71 billion | | .1851 | |
$76 billion | | .1806 | |
$80 billion | | .1773 | |
$91 billion | | .1691 | |
$125 billion | | .1599 | |
$200 billion | | .1505 | |
$250 billion | | .1469 | |
$300 billion | | .1445 | |
| * | The complex-level fee is calculated based upon the aggregate daily managed assets of all Nuveen funds, with such daily managed assets defined separately for each fund in its management agreement, but excluding assets attributable to investments in other Nuveen funds. Daily managed assets include closed-end fund assets managed by the Adviser that are attributable to financial leverage. For these purposes, financial leverage includes the funds’ use of preferred stock and borrowings and certain investments in the residual interest certificates (also called inverse floating rate securities) in tender option bond (TOB) trusts, including the portion of assets held by a TOB trust that has been effectively financed by the trust’s issuance of floating rate securities, subject to an agreement by the Adviser to limit the amount of such assets for determining managed assets in certain circumstances. As of June 30, 2010, the complex-level fee rate was .1857%. |
The management fee compensates the Adviser for overall investment advisory and administrative services and general office facilities. The Adviser has entered into a Sub-Advisory Agreement with Nuveen HydePark Group, LLC (“HydePark”), a subsidiary of Nuveen, under which HydePark manages the investment portfolio of the Fund. HydePark is compensated for its services to the Fund from the management fee paid to the Adviser.
The Adviser has agreed to waive fees and reimburse expenses of the Fund through October 31, 2011, so that total annual Fund operating expenses (excluding interest expenses, taxes, fees incurred in acquiring and disposing of portfolio securities and extraordinary expenses) do not exceed ..80% (1.05% after October 31, 2011) of the average daily net assets of the Fund. The Adviser may also voluntarily reimburse additional expenses from time to time. Voluntary reimbursements may be terminated at any time at the Adviser’s discretion.
The Trust pays no compensation directly to those of its trustees who are affiliated with the Adviser or to its officers, all of whom receive remuneration for their services to the Trust from the Adviser or its affiliates. The Board of Trustees has adopted a deferred compensation plan for independent trustees that enables trustees to elect to defer receipt of all or a portion of the annual compensation they are entitled to receive from certain Nuveen advised funds. Under the plan, deferred amounts are treated as though equal dollar amounts had been invested in shares of select Nuveen advised funds.
At June 30, 2010, Nuveen owned 1,250 shares of the Fund.
8. New Accounting Standards
Fair Value Measurements
On January 21, 2010, FASB issued changes to the authoritative guidance under U.S. GAAP for fair value measurements. The objective of which is to provide guidance on how investment assets and liabilities are to be valued and disclosed. Specifically, the amendment requires reporting entities disclose Level 3 activity for purchases, sales, issuances and settlements in the Level 3 roll-forward on a gross basis rather than as one net number. The effective date of the amendment is for interim and annual periods beginning after December 15, 2010. At this time, management is evaluating the implications of this guidance and the impact it will have to the financial statement amounts and footnote disclosures, if any.
Financial Highlights
| | | | | | | | | | | | | | | | | | | | | | | | | | | | | | | |
| Selected data for a share outstanding throughout each period: | |
| | | | |
| | | | | Investment Operations | | | Less Distributions | | | | |
| | | | | | | | | | | | | | | | | | | | | | | | |
Year Ended
June 30, | | Beginning
Net
Asset
Value | | Net
Invest-
ment
Income(a) | | Net
Realized/
Unrealized
Gain
(Loss) | | | Total | | | Net
Invest-
ment
Income | | | Capital
Gains | | Total | | | Ending
Net
Asset
Value | | Total
Return(b) | |
2010 | | $ | 14.14 | | $ | .19 | | $ | 1.70 | | | $ | 1.89 | | | $ | (.25 | ) | | $ | — | | $ | (.25 | ) | | $ | 15.78 | | 13.25 | % |
2009 | | | 20.00 | | | .28 | | | (6.07 | ) | | | (5.79 | ) | | | (.07 | ) | | | — | | | (.07 | ) | | | 14.14 | | (28.96 | ) |
| | | | | | | | | | | | | | | |
|
Ratios/Supplemental Data | |
| | | Ratios to Average
Net Assets Before
Reimbursement | | | Ratios to Average
Net Assets After
Reimbursement(c) | | | | |
Ending
Net
Assets
(000) | | Expenses | | | Net
Invest-
ment
Income
(Loss) | | | Expenses | | | Net
Invest-
ment
Income
(Loss) | | | Portfolio
Turnover
Rate | |
| $6,016 | | 3.20 | % | | (1.24 | )% | | .79 | % | | 1.17 | % | | 105 | % |
| 4,742 | | 3.38 | | | (.57 | ) | | .80 | | | 2.02 | | | 69 | |
| (a) | Per share Net Investment Income is calculated using the average daily shares method. |
| (b) | Total return is the combination of changes in net asset value, reinvested dividend income at net asset value and reinvested capital gains distributions at net asset value, if any. Total returns are not annualized. |
| (c) | After expense reimbursement from the Adviser, where applicable. Ratios do not reflect the effect of custodian fee credits earned on the Fund’s net cash on deposit with the custodian bank, where applicable. |
See accompanying notes to financial statements.
Trustees and Officers
The management of the Funds, including general supervision of the duties performed for the Funds by the Adviser, is the responsibility of the Board of Trustees of the Funds. The number of trustees of the Funds is currently set at nine. None of the trustees who are not “interested” persons of the Funds (referred to herein as “independent trustees”) has ever been a director or employee of, or consultant to, Nuveen or its affiliates. The names and business addresses of the trustees and officers of the Funds, their principal occupations and other affiliations during the past five years, the number of portfolios each oversees and other directorships they hold are set forth below.
The Funds’ Statement of Additional Information (“SAI”) includes more information about the trustees. To request a free copy, call Nuveen Investments at (800) 257-8787 or visit the Funds’ website at www.nuveen.com.
| | | | | | | | |
Name, Birthdate and Address | | Position(s) Held with the Funds | | Year First Elected or Appointed (1) | | Principal Occupation(s) Including other Directorships During Past 5 Years | | Number of Portfolios in Fund Complex Overseen by Trustee |
| | |
| Independent Trustees: | | | | |
Robert P. Bremner (2) 8/22/40 333 W. Wacker Drive Chicago, IL 60606 | | Chairman of the Board and Trustee | | 1996 | | Private Investor and Management Consultant; Treasurer and Director, Humanities Council of Washington, D.C. | | 200 |
Jack B. Evans 10/22/48 333 W. Wacker Drive Chicago, IL 60606 | | Trustee | | 1999 | | President, The Hall-Perrine Foundation, a private philanthropic corporation (since 1996); Director and Chairman, United Fire Group, a publicly held company; President Pro Tem of the Board of Regents for the State of Iowa University System; Director, Gazette Companies; Life Trustee of Coe College and the Iowa College Foundation; formerly, Director, Alliant Energy; formerly, Director, Federal Reserve Bank of Chicago; formerly, President and Chief Operating Officer, SCI Financial Group, Inc., a regional financial services firm. | | 200 |
William C. Hunter 3/6/48 333 W. Wacker Drive Chicago, IL 60606 | | Trustee | | 2004 | | Dean, Tippie College of Business, University of Iowa (since 2006); Director (since 2004) of Xerox Corporation; Director (since 2005), Beta Gamma Sigma International Honor Society; formerly, Dean and Distinguished Professor of Finance, School of Business at the University of Connecticut (2003-2006); previously, Senior Vice President and Director of Research at the Federal Reserve Bank of Chicago (1995-2003); Director, SS&C Technologies, Inc. (May 2005-October 2005); formerly, Director (1997-2007), Credit Research Center at George Washington University. | | 200 |
David J. Kundert (2) 10/28/42 333 W. Wacker Drive Chicago, IL 60606 | | Trustee | | 2005 | | Director, Northwestern Mutual Wealth Management Company; retired (since 2004) as Chairman, JPMorgan Fleming Asset Management, President and CEO, Banc One Investment Advisors Corporation, and President, One Group Mutual Funds; prior thereto, Executive Vice President, Banc One Corporation and Chairman and CEO, Banc One Investment Management Group; Member, Board of Regents, Luther College; member of the Wisconsin Bar Association; member of Board of Directors, Friends of Boerner Botanical Gardens; member of Board of Directors and Chair of Investment Committee, Greater Milwaukee Foundation. | | 200 |
William J. Schneider (2) 9/24/44 333 W. Wacker Drive Chicago, IL 60606 | | Trustee | | 1997 | | Chairman of Miller-Valentine Partners Ltd., a real estate investment company; formerly, Senior Partner and Chief Operating Officer (retired, 2004) of Miller-Valentine Group; member, University of Dayton Business School Advisory Council; member, Mid-America Health System Board; formerly, member and Chair, Dayton Philharmonic Orchestra Association; formerly, member, Business Advisory Council, Cleveland Federal Reserve Bank. | | 200 |
Judith M. Stockdale 12/29/47 333 W. Wacker Drive Chicago, IL 60606 | | Trustee | | 1997 | | Executive Director, Gaylord and Dorothy Donnelley Foundation (since 1994); prior thereto, Executive Director, Great Lakes Protection Fund (1990-1994). | | 200 |
Carole E. Stone (2) 6/28/47 333 W. Wacker Drive Chicago, IL 60606 | | Trustee | | 2007 | | Director, Chicago Board Options Exchange (since 2006); Director, C2 Options Exchange, Incorporated (since 2009); Commissioner, New York State Commission on Public Authority Reform (since 2005); formerly, Chair, New York Racing Association Oversight Board (2005-2007). | | 200 |
| | | | | | | | |
Name, Birthdate and Address | | Position(s) Held with the Funds | | Year First Elected or Appointed (1) | | Principal Occupation(s) Including other Directorships During Past 5 Years | | Number of Portfolios in Fund Complex Overseen by Trustee |
Terence J. Toth (2) 9/29/59 333 W. Wacker Drive Chicago, IL 60606 | | Trustee | | 2008 | | Director, Legal & General Investment Management America, Inc. (since 2008); Managing Partner, Promus Capital (since 2008); formerly, CEO and President, Northern Trust Global Investments (2004-2007); Executive Vice President, Quantitative Management & Securities Lending (2000-2004); prior thereto, various positions with Northern Trust Company (since 1994); member: Goodman Theatre Board (since 2004); Chicago Fellowship Board (since 2005), University of Illinois Leadership Council Board (since 2007) and Catalyst Schools of Chicago Board (since 2008); formerly, member: Northern Trust Mutual Funds Board (2005-2007), Northern Trust Global Investments Board (2004-2007), Northern Trust Japan Board (2004-2007), Northern Trust Securities Inc. Board (2003-2007) and Northern Trust Hong Kong Board (1997-2004). | | 200 |
| | |
| Interested Trustee: | | | | |
John P. Amboian (3) 6/14/61 333 W. Wacker Drive Chicago, IL 60606 | | Trustee | | 2008 | | Chief Executive Officer (since July 2007), Director (since 1999) and Chairman (since 2007) of Nuveen Investments, Inc.; Chief Executive Officer (since 2007) of Nuveen Asset Management, Nuveen Investments Advisors, Inc.; President (since 2005) of Nuveen Commodities Asset Management, LLC. | | 200 |
Name, Birthdate and Address | | Position(s) Held with the Funds | | Year First Elected or Appointed (4) | | Principal Occupation(s) During Past 5 Years | | Number of Portfolios in Fund Complex Overseen by Officer |
| | |
| Officers of the Funds: | | | | |
Gifford R. Zimmerman 9/9/56 333 W. Wacker Drive Chicago, IL 60606 | | Chief Administrative Officer | | 1988 | | Managing Director (since 2002), Assistant Secretary and Associate General Counsel of Nuveen Investments, LLC; Managing Director, Associate General Counsel and Assistant Secretary, of Nuveen Asset Management (since 2002) and of Symphony Asset Management LLC (since 2003); Vice President and Assistant Secretary of NWQ Investment Management Company, LLC. (since 2002), Nuveen Investments Advisers Inc. (since 2002), Tradewinds Global Investors, LLC, and Santa Barbara Asset Management, LLC (since 2006), Nuveen HydePark Group LLC and Nuveen Investment Solutions, Inc. (since 2007); Managing Director (since 2004) and Assistant Secretary (since 1994) of Nuveen Investments, Inc.; Managing Director (since 2005) of Nuveen Commodities Asset Management, LLC; Chartered Financial Analyst. | | 200 |
Nizida Arriaga 6/1/68 333 W. Wacker Drive Chicago, IL 60606 | | Vice President | | 2009 | | Senior Vice President of Nuveen Investments, LLC (since 2010); formerly, Vice President (2007-2010); previously, Portfolio Manager, Allstate Investments, LLC (1996-2006); Chartered Financial Analyst. | | 200 |
Michael T. Atkinson 2/3/66 333 W. Wacker Drive Chicago, IL 60606 | | Vice President and Assistant Secretary | | 2000 | | Vice President (since 2002) of Nuveen Investments, LLC; Vice President of Nuveen Asset Management (since 2005). | | 200 |
Margo L. Cook 4/11/64 333 W. Wacker Drive Chicago, IL 60606 | | Vice President | | 2009 | | Executive Vice President (since Oct 2008) of Nuveen Investments, Inc.; previously, Head of Institutional Asset Management (2007-2008) of Bear Stearns Asset Management; Head of Institutional Asset Mgt (1986-2007) of Bank of NY Mellon; Chartered Financial Analyst. | | 200 |
Alan A. Brown 8/1/62 333 W. Wacker Drive Chicago, IL 60606 | | Vice President | | 2007 | | Executive Vice President, Global Client Private Group (since 2007); Executive Vice President, Mutual Funds, Nuveen Investments, LLC, (since 2005), previously, Managing Director and Chief Marketing Officer (2001-2005). | | 75 |
Trustees and Officers (continued)
| | | | | | | | |
Name, Birthdate and Address | | Position(s) Held with the Funds | | Year First Elected or Appointed (4) | | Principal Occupation(s) Including other Directorships During Past 5 Years | | Number of Portfolios in Fund Complex Overseen by Officer |
Lorna C. Ferguson 10/24/45 333 W. Wacker Drive Chicago, IL 60606 | | Vice President | | 1998 | | Managing Director (since 2004) of Nuveen Investments, LLC and Managing Director (since 2005) of Nuveen Asset Management. | | 200 |
Stephen D. Foy 5/31/54 333 W. Wacker Drive Chicago, IL 60606 | | Vice President and Controller | | 1998 | | Senior Vice President (since 2010), formerly, Vice President (1993-2010) and Funds Controller (since 1998) of Nuveen Investments, LLC; Vice President (2005-2010) of Nuveen Asset Management; Certified Public Accountant. | | 200 |
Scott S. Grace 8/20/70 333 W. Wacker Drive Chicago, IL 60606 | | Vice President and Treasurer | | 2009 | | Managing Director, Corporate Finance & Development, Treasurer (since 2009) of Nuveen Investments, LLC; Managing Director and Treasurer of Nuveen Asset Management (since 2009); formerly, Treasurer (2006-2009), Senior Vice President (2008-2009), previously, Vice President (2006-2008) of Janus Capital Group, Inc.; formerly, Senior Associate in Morgan Stanley’s Global Financial Services Group (2000-2003); Chartered Accountant Designation. | | 200 |
William T. Huffman 5/7/1969 333 W. Wacker Drive Chicago, IL 60606 | | Vice President | | 2009 | | Chief Operating Officer, Municipal Fixed Income (since 2008) of Nuveen Asset Management; previously, Chairman, President and Chief Executive Officer (2002 – 2007) of Northern Trust Global Advisors, Inc. and Chief Executive Officer (2007) of Northern Trust Global Investments Limited; Certified Public Accountant. | | 136 |
Walter M. Kelly 2/24/70 333 W. Wacker Drive Chicago, IL 60606 | | Chief Compliance Officer and Vice President | | 2003 | | Senior Vice President (since 2008), Vice President (2006-2008) formerly, Assistant Vice President and Assistant General Counsel (2003-2006) of Nuveen Investments, LLC; Senior Vice President (since 2008), formerly, Vice President (2006-2008) and Assistant Secretary (since 2003) of Nuveen Asset Management. | | 200 |
David J. Lamb 3/22/63 333 W. Wacker Drive Chicago, IL 60606 | | Vice President | | 2000 | | Senior Vice President (since 2009), formerly, Vice President (2000-2009) of Nuveen Investments, LLC; Vice President (since 2005) of Nuveen Asset Management, Certified Public Accountant. | | 200 |
Tina M. Lazar 8/27/61 333 W. Wacker Drive Chicago, IL 60606 | | Vice President | | 2002 | | Senior Vice President (since 2009), formerly, Vice President of Nuveen Investments, LLC (1999-2009); Vice President of Nuveen Asset Management (since 2005). | | 200 |
Larry W. Martin 7/27/51 333 W. Wacker Drive Chicago, IL 60606 | | Vice President and Assistant Secretary | | 1988 | | Senior Vice President (since 2010), formerly, Vice President (1993-2010), Assistant Secretary and Assistant General Counsel of Nuveen Investments, LLC; Vice President (since 2005) and Assistant Secretary of Nuveen Investments, Inc.; Vice President (since 2005) and Assistant Secretary (since 1997) of Nuveen Asset Management Vice President and Assistant Secretary of Nuveen Investments Advisers Inc. (since 2002), NWQ Investment Management Company, LLC (since 2002), Symphony Asset Management LLC (since 2003), Tradewinds Global Investors, LLC, Santa Barbara Asset Management, LLC (since 2006) and of Nuveen HydePark Group, LLC and Nuveen Investment Solutions, Inc. (since 2007). | | 200 |
Kevin J. McCarthy 3/26/66 333 W. Wacker Drive Chicago, IL 60606 | | Vice President and Secretary | | 2007 | | Managing Director (since 2008), formerly, Vice President (2007-2008), Nuveen Investments, LLC; Managing Director (since 2008), formerly, Vice President and Assistant Secretary, Nuveen Asset Management and Nuveen Investments Holdings, Inc.; Vice President (since 2007) and Assistant Secretary, Nuveen Investment Advisers Inc., NWQ Investment Management Company, LLC, Tradewinds Global Investors LLC, NWQ Holdings, LLC, Symphony Asset Management LLC, Santa Barbara Asset Management LLC, Nuveen HydePark Group, LLC and Nuveen Investment Solutions, Inc. (since 2007); prior thereto, Partner, Bell, Boyd & Lloyd LLP (1997-2007). | | 200 |
| | | | | | | | |
Name, Birthdate and Address | | Position(s) Held with the Funds | | Year First Elected or Appointed (4) | | Principal Occupation(s) Including other Directorships During Past 5 Years | | Number of Portfolios in Fund Complex Overseen by Officer |
Michelle A. McCarthy 7/6/65 333 West Wacker Drive Chicago, IL 60606 | | Vice President | | 2010 | | Managing Director, Director of Risk Management (since May, 2010), Nuveen Investments, LLC; formerly, Chief Risk Officer (2009-2010) of Russell Investment Group; formerly, SVP (2003-2009), Chief Market & Operational Risk Officer (2006-2009), Washington Mutual Bank. | | 200 |
John V. Miller 4/10/67 333 W. Wacker Drive Chicago, IL 60606 | | Vice President | | 2007 | | Chief Investment Officer and Managing Director (since 2007), formerly, Vice President (2002-2007) of Nuveen Asset Management and Managing Director (since 2007), formerly, Vice President (2002-2007) Nuveen Investments, LLC; Chartered Financial Analyst. | | 136 |
Gregory T. Mino 1/4/71 333 W. Wacker Drive Chicago, IL 60606 | | Vice President | | 2009 | | Senior Vice President (since 2010) of Nuveen Investments, LLC, formerly, Vice President (2008-2010); previously, Director (2004-2007) and Executive Director (2007-2008) of UBS Global Asset Management; previously, Vice President (2000-2003) and Director (2003-2004) of Merrill Lynch Investment Managers; Chartered Financial Analyst. | | 200 |
Christopher M. Rohrbacher 8/1/71 333 W. Wacker Drive Chicago, IL 60606 | | Vice President and Assistant Secretary | | 2008 | | Vice President, Nuveen Investments, LLC (since 2008); Vice President and Assistant Secretary, Nuveen Asset Management (since 2008); prior thereto, Associate, Skadden, Arps, Slate, Meagher & Flom LLP (2002-2008) | | 200 |
James F. Ruane 7/3/62 333 W. Wacker Drive Chicago, IL 60606 | | Vice President and Assistant Secretary | | 2007 | | Vice President, Nuveen Investments (since 2007); prior thereto, Partner, Deloitte & Touche USA LLP (2005-2007), formerly, senior tax manager (2002-2005); Certified Public Accountant. | | 200 |
John S. White 5/12/67 333 W. Wacker Drive Chicago, IL 60606 | | Vice President | | 2007 | | Senior Vice President (since 2009), formerly, Vice President (2006-2009) of Nuveen Investments, LLC, formerly, Assistant Vice President (since 2002); Lieutenant Colonel (since 2007), United States Marine Corps Reserve, formerly, Major (since 2001). | | 75 |
Mark L. Winget 12/21/68 333 W. Wacker Drive Chicago, IL 60606 | | Vice President and Assistant Secretary | | 2008 | | Vice President, Nuveen Investments, LLC (since 2008); Vice President and Assistant Secretary, Nuveen Asset Management (since 2008); prior thereto, Counsel, Vedder Price P.C. (1997-2007). | | 200 |
| (1) | Trustees serve an indefinite term until his/her successor is elected or appointed. The year first elected or appointed represents the year in which the trustee was first elected or appointed to any fund in the Nuveen Fund Complex. |
| (2) | Also serves as a trustee of the Nuveen Diversified Commodity Fund, a Nuveen-sponsored commodity pool that has filed a registration statement on Form S-1 with the SEC for a proposed initial public offering. The S-1 has not been declared effective, and the commodity pool has not commenced operations. |
| (3) | Mr. Amboian is an interested trustee because of his position with Nuveen Investments, Inc. and certain of its subsidiaries, which are affiliates of the Nuveen Funds. |
| (4) | Officers serve one year terms through August of each year. The year first elected or appointed represents the year in which the officer was first elected or appointed to any fund in the Nuveen Fund Complex. |
Annual Investment Management Agreement Approval Process
The Investment Company Act of 1940, as amended (the “1940 Act”), provides, in substance, that each investment advisory agreement between a fund and its investment adviser (including sub-advisers) will continue in effect from year to year only if its continuance is approved at least annually by the fund’s board members, including by a vote of a majority of the board members who are not parties to the advisory agreement or “interested persons” of any parties (the “Independent Board Members”), cast in person at a meeting called for the purpose of considering such approval. In connection with such approvals, the fund’s board members must request and evaluate, and the investment adviser is required to furnish, such information as may be reasonably necessary to evaluate the terms of the advisory agreement. Accordingly, at a meeting held on May 25-26, 2010 (the “May Meeting”), the Board of Trustees (the “Board,” and each Trustee, a “Board Member”) of the Fund, including a majority of the Independent Board Members, considered and approved the continuation of the advisory and sub-advisory agreements for the Fund for an additional one-year period. These agreements include the investment advisory agreement between Nuveen Asset Management (“NAM”) and the Fund and the sub-advisory agreement between NAM and Nuveen HydePark Group, LLC (the “Sub-Adviser”). In preparation for their considerations at the May Meeting, the Board also held a separate meeting on April 21-22, 2010 (the “April Meeting”). Accordingly, the factors considered and determinations made regarding the renewals by the Independent Board Members include those made at the April Meeting.
In addition, in evaluating the advisory agreement (the “Investment Management Agreement”) and the sub-advisory agreement (the “Sub-advisory Agreement,” and the Investment Management Agreement and Sub-advisory Agreement are each an “Advisory Agreement”), the Independent Board Members reviewed a broad range of information relating to the Fund, NAM and the Sub-Adviser (NAM and the Sub-Adviser are each a “Fund Adviser”), including certain performance-related information (as described in further detail below), fee and expense information for the Fund (as described in more detail below), the profitability of Nuveen for its advisory activities (which includes its wholly owned subsidiaries), and other information regarding the organization, personnel, and services provided by the respective Fund Adviser. The Independent Board Members also met quarterly as well as at other times as the need arose during the year and took into account the information provided at such meetings and the knowledge gained therefrom. Prior to approving the renewal of the Advisory Agreements, the Independent Board Members reviewed the foregoing information with their independent legal counsel and with management, reviewed materials from independent legal counsel describing applicable law and their duties in reviewing advisory contracts, and met with independent legal counsel in private sessions without management present. The Independent Board Members considered the legal advice provided by independent legal counsel and relied upon their knowledge of the Fund Adviser, its services and the Fund resulting from their meetings and other interactions throughout the year and their own business judgment in determining the factors to be considered in evaluating the Advisory Agreements. Each Board Member may have accorded different weight to the various factors in reaching his or her conclusions with respect to the Fund’s Advisory Agreements. The Independent Board Members did not identify any single factor as all-important or controlling. The Independent Board Members’ considerations were instead based on a comprehensive consideration of all the information presented. The principal factors considered by the Board and its conclusions are described below.
A. Nature, Extent and Quality of Services
In considering renewal of the Advisory Agreements, the Independent Board Members considered the nature, extent and quality of the Fund Adviser’s services, including advisory services and administrative services. The Independent Board Members reviewed materials outlining, among other things, the Fund Adviser’s organization and business; the types of services that the Fund Adviser or its affiliates provide and are expected to provide to the Fund; certain performance-related information (as described in further detail below); and any initiatives Nuveen had taken for the applicable fund product line, including the development of new practices and coordination among business units with respect to large shareholder transactions, streamlining the classes offered, and adding funds to various distribution platforms.
As part of their review, the Independent Board Members also evaluated the background, experience and track record of the Fund Adviser’s investment personnel. In this regard, the Independent Board Members considered any changes in the personnel, and the impact on the level of services provided to the Fund, if any. The Independent Board Members also reviewed information regarding portfolio manager compensation arrangements to evaluate the Fund Adviser’s ability to attract and retain high quality investment personnel, preserve stability, and reward performance but not provide an incentive for taking undue risks.
In addition to advisory services, the Independent Board Members considered the quality of administrative services provided by NAM and its affiliates including product management, fund administration, oversight of service providers, shareholder services, administration of Board relations, regulatory and portfolio compliance and legal support. Given the importance of compliance, the Independent Board Members also considered NAM’s compliance program, including the report of the chief compliance officer regarding the Fund’s compliance policies and procedures.
The Independent Board Members also considered NAM’s oversight of the performance, business activities and compliance of the Sub-Adviser. In that regard, the Independent Board Members reviewed an evaluation of the Sub-Adviser from NAM. The evaluation also included information relating to the Sub-Adviser’s organization, operations, personnel, assets under management, investment philosophy, strategies and techniques in managing the Fund, developments affecting the Sub-Adviser, and an analysis of the Sub-Adviser. As described in further detail below, the Board also considered certain performance information. In addition, the Board recognized that the Sub-advisory Agreement was essentially an agreement for portfolio management services only and the Sub-Adviser was not expected to supply other significant administrative services to the Fund. As part of their oversight, the Independent
Board Members also continued their program of seeking to visit each sub-adviser to the Nuveen funds at least once over a multiple year rotation, meeting with key investment and business personnel. The Independent Board Members noted that NAM recommended the renewal of the Sub-advisory Agreement and considered the basis for such recommendations.
Based on their review, the Independent Board Members found that, overall, the nature, extent and quality of services provided (and expected to be provided) to the Fund under the Investment Management Agreement or Sub-advisory Agreement, as applicable, were satisfactory.
B. The Investment Performance of the Fund and Fund Advisers
The Board considered the performance results of the Fund. However, the Board noted that the Fund was launched in 2008 and therefore its available performance history was limited. In general, the boards of the various Nuveen funds reviewed, among other things, each such fund’s historic investment performance as well as information comparing the fund’s performance information with that of other funds (the “Performance Peer Group”) based on data provided by an independent provider of mutual fund data and with recognized and/or customized benchmarks. The Board reviewed the Fund’s total return information and performance information of a recognized benchmark for the quarter and one-year periods ending December 31, 2009 and March 31, 2010. Although the Fund underperformed its benchmark for the one-year period, the Board recognized that the performance history of this Fund is relatively short, limiting the ability for a meaningful assessment of performance. In addition, the Board noted the unique structure of this Fund, the shares of which are intended to be offered only to other Nuveen funds. Given this unique structure, the Fund does not have a Performance Peer Group.
C. Fees, Expenses and Profitability
1. Fees and Expenses
The Independent Board Members reviewed the Fund’s gross management fee, net management fee and net expense ratio. In this regard, as indicated above, the Independent Board Members noted the unique structure of this Fund, the shares of which are only intended to be offered to other Nuveen funds. Given the Fund’s unique structure, the Independent Board Members recognized that a comparable universe of funds (i.e., a “Peer Universe”) or a more focused subset of funds thereof (i.e., a “Peer Group”) was not available. The Independent Board Members further considered that the other Nuveen funds investing in the Fund will also be advised by NAM and sub-advised by an affiliated person of NAM. Accordingly, in evaluating the fees and expenses, the Independent Board Members also took into consideration the advisory fees paid to NAM and the affiliated sub-adviser by the Nuveen funds acquiring the Fund.
Based on their review of the fee and expense information provided, the Independent Board Members determined that the Fund’s management fees were reasonable in light of the nature, extent and quality of services provided to the Fund.
2. Comparisons with the Fees of Other Clients
The Independent Board Members further reviewed information regarding the nature of services and fee rates offered by NAM to other clients. Such clients include separately managed accounts (both retail and institutional accounts), foreign investment funds offered by Nuveen and funds that are not offered by Nuveen but are sub-advised by one of Nuveen’s investment management teams. In evaluating the comparisons of fees, the Independent Board Members noted that the fee rates charged to the Fund and other clients vary, among other things, because of the different services involved and the additional regulatory and compliance requirements associated with registered investment companies, such as the Fund. Accordingly, the Independent Board Members considered the differences in the product types, including, but not limited to, the services provided, the structure and operations, product distribution and costs thereof, portfolio investment policies, investor profiles, account sizes and regulatory requirements. The Independent Board Members noted, in particular, that the range of services provided to the Fund (as discussed above) is more extensive than that provided to separately managed accounts. The Independent Board Members noted that the Fund is unique to the Nuveen complex in serving as an underlying fund for other Nuveen funds and there were no comparable unaffiliated investment companies available. Given the inherent differences in the products, particularly the services provided to the Fund, the Independent Board Members believe such facts justify the different levels of fees.
In considering the fees of the Sub-Adviser, the Independent Board Members also considered the pricing schedule or fees that the Sub-Adviser charges for similar investment management services for other fund sponsors or clients (such as retail and/or institutional managed accounts) as applicable.
3. Profitability of Fund Advisers
In conjunction with its review of fees, the Independent Board Members also considered the profitability of Nuveen for its advisory activities (which incorporated Nuveen’s wholly-owned affiliated sub-advisers) and its financial condition. The Independent Board Members reviewed the revenues and expenses of Nuveen’s advisory activities for the last two years, the allocation methodology used in preparing the profitability data and an analysis of the key drivers behind the changes in revenues and expenses that impacted profitability in 2009. The Independent Board Members noted this information supplemented the profitability information requested and received during the year to help keep them apprised of developments affecting profitability (such as changes in fee waivers and expense reimbursement commitments). In this regard, the Independent Board Members noted that they had also appointed an Independent Board Member as a point person to review and keep them apprised of changes to the profitability analysis and/or methodologies during the year. The Independent Board Members also considered Nuveen’s revenues
Annual Investment Management Agreement Approval Process (continued)
for advisory activities, expenses, and profit margin compared to that of various unaffiliated management firms with similar amounts of assets under management and relatively comparable asset composition prepared by Nuveen.
In reviewing profitability, the Independent Board Members recognized the subjective nature of determining profitability which may be affected by numerous factors including the allocation of expenses. Further, the Independent Board Members recognized the difficulties in making comparisons as the profitability of other advisers generally is not publicly available and the profitability information that is available for certain advisers or management firms may not be representative of the industry and may be affected by, among other things, the adviser’s particular business mix, capital costs, types of funds managed and expense allocations. Notwithstanding the foregoing, the Independent Board Members reviewed Nuveen’s methodology and assumptions for allocating expenses across product lines to determine profitability. In reviewing profitability, the Independent Board Members recognized Nuveen’s investment in its fund business. Based on their review, the Independent Board Members concluded that Nuveen’s level of profitability for its advisory activities was reasonable in light of the services provided.
In evaluating the reasonableness of the compensation, the Independent Board Members also considered other amounts paid to a Fund Adviser by the Fund as well as any indirect benefits (such as soft dollar arrangements, if any) the Fund Adviser and its affiliates receive, or are expected to receive, that are directly attributable to the management of the Fund, if any. See Section E below for additional information on indirect benefits a Fund Adviser may receive as a result of its relationship with the Fund. Based on their review of the overall fee arrangements of the Fund, the Independent Board Members determined that the advisory fees and expenses of the Fund were reasonable.
D. Economies of Scale and Whether Fee Levels Reflect These Economies of Scale
With respect to economies of scale, the Independent Board Members have recognized the potential benefits resulting from the costs of a fund being spread over a larger asset base, although economies of scale are difficult to measure and predict with precision, particularly on a fund-by-fund basis. One method to help ensure the shareholders share in these benefits is to include breakpoints in the advisory fee schedule. Generally, management fees for funds in the Nuveen complex are comprised of a fund-level component and a complex-level component. The Independent Board Members recognized, however, that the Fund does not have fund-level breakpoints given its unique structure.
The Board also considered the Fund’s complex-wide fee arrangement. Pursuant to the complex-wide fee arrangement, the fees of the funds in the Nuveen complex are generally reduced as the assets in the fund complex reach certain levels. The complex-wide fee arrangement seeks to provide the benefits of economies of scale to fund shareholders when total fund complex assets increase, even if assets of a particular fund are unchanged or have decreased. The approach reflects the notion that some of Nuveen’s costs are attributable to services provided to all its funds in the complex and therefore all funds benefit if these costs are spread over a larger asset base.
Based on their review, the Independent Board Members concluded that the complex-wide fee arrangement was acceptable and reflects economies of scale to be shared with shareholders when assets under management increase and that the absence of fund-level breakpoints was acceptable.
E. Indirect Benefits
In evaluating fees, the Independent Board Members received and considered information regarding potential “fall out” or ancillary benefits the respective Fund Adviser or its affiliates may receive as a result of its relationship with the Fund. In this regard, the Independent Board Members considered whether each Fund Adviser received any benefits from soft dollar arrangements whereby a portion of the commissions paid by the Fund for brokerage may be used to acquire research that may be useful to the Fund Adviser in managing the assets of the Fund and other clients. With respect to NAM, the Independent Board Members noted that NAM does not currently have any soft dollar arrangements; however, to the extent certain bona fide agency transactions that occur on markets that traditionally trade on a principal basis and riskless principal transactions are considered as generating “commissions,” NAM intends to comply with the applicable safe harbor provisions. With respect to the Sub-Adviser, the Independent Board Members considered that the Sub-Adviser may benefit from its soft dollar arrangements pursuant to which it receives research from brokers that execute the Fund’s portfolio transactions. The Independent Board Members further noted that the Sub-Adviser’s profitability may be lower if it were required to pay for this research with hard dollars.
Based on their review, the Independent Board Members concluded that any indirect benefits received by a Fund Adviser as a result of its relationship with the Fund were reasonable and within acceptable parameters.
F. Other Considerations
The Independent Board Members did not identify any single factor discussed previously as all-important or controlling. The Board Members, including the Independent Board Members, unanimously concluded that the terms of the Investment Management Agreement and Sub-advisory Agreement are fair and reasonable, that the respective Fund Adviser’s fees are reasonable in light of the services provided to the Fund and that the Investment Management Agreement and the Sub-advisory Agreement be renewed.
Notes
Glossary of Terms Used in this Report
Average Annual Total Return: This is a commonly used method to express an investment’s performance over a particular, usually multi-year time period. It expresses the return that would have been necessary each year to equal the investment’s actual cumulative performance (including change in NAV or offer price and reinvested dividends and capital gains distributions, if any) over the time period being considered.
Net Asset Value (NAV): A Fund’s NAV is the dollar value of one share in the Fund. It is calculated by subtracting the liabilities of the Fund from its total assets and then dividing the remainder by the number of shares outstanding. Fund NAVs are calculated at the end of each business day.
Fund Information
Fund Manager
Nuveen Asset Management
333 West Wacker Drive
Chicago, IL 60606
Sub-Advisers
Nuveen HydePark Group, LLC
333 West Wacker Drive
Chicago, IL 60606
Legal Counsel
Chapman and Cutler LLP
Chicago, IL
Independent Registered
Public Accounting Firm
PricewaterhouseCoopers LLP
Chicago, IL
Custodian
State Street Bank & Trust Company
Boston, MA
Transfer Agent and Shareholder Services
Boston Financial
Data Services
Nuveen Investor Services
P.O. Box 8530
Boston, MA 02266-8530
(800) 257-8787
Distribution Information: The Funds hereby designate their percentages of dividends paid from net ordinary income as dividends qualifying for the 70% dividends received deduction (“DRD”) for corporations and their percentages as qualified dividend income (“QDI”) for individuals under Section 1 (h)(11) of the Internal Revenue Code as shown in the accompanying table. The actual qualified dividend income distributions will be reported to shareholders on Form 1099-DIV which will be sent to shareholders shortly after calendar year end.
| | | | |
| Fund | | % of DRD | | % of QDI |
Nuveen U.S. Equity Completeness Fund | | 100% | | 100% |
Quarterly Portfolio of Investments and Proxy Voting Information: You may obtain (i) the Fund’s quarterly portfolio of investments, (ii) information regarding how the Fund voted proxies relating to portfolio securities held during the most recent twelve-month period ended June 30, and (iii) a description of the policies and procedures that the Fund used to determine how to vote proxies relating to portfolio securities without charge, upon request, by calling Nuveen Investments at (800) 257-8787 or on Nuveen’s website at www.nuveen.com.
You may also obtain this and other Fund information directly from the Securities and Exchange Commission (“SEC”). The SEC may charge a copying fee for this information. Visit the SEC on-line at http://www.sec.gov or in person at the SEC’s Public Reference Room in Washington, D.C. Call the SEC at (202) 942-8090 for room hours and operation. You may also request Fund information by sending an e-mail request to publicinfo@sec.gov or by writing to the SEC’s Public Reference Section at 100 F Street NE, Washington, D.C. 20549.
The Financial Industry Regulatory Authority (“FINRA”) provides a Public Disclosure Program which supplies certain information regarding the disciplinary history of FINRA members and their associated persons in response to either telephone inquiries at (800) 289-9999 or written inquiries at www.finra.org. FINRA also provides an investor brochure that includes information describing the Public Disclosure Program.
Nuveen Investments:
Serving Investors For Generations
Since 1898, financial advisors and their clients have relied on Nuveen Investments to provide dependable investment solutions through continued adherence to proven, long-term investing principles. Today, we offer a range of high quality equity and fixed-income solutions designed to be integral components of a well-diversified core portfolio.
Focused on meeting investor needs.
Nuveen Investments is a global investment management firm that seeks to help secure the long-term goals of institutions and high net worth investors as well as the consultants and financial advisors who serve them. We market our growing range of specialized investment solutions under the high-quality brands of HydePark, NWQ, Nuveen, Santa Barbara, Symphony, Tradewinds and Winslow Capital. In total, Nuveen Investments managed approximately $150 billion of assets on June 30, 2010.
Find out how we can help you.
To learn more about the products and services of Nuveen Investments may be able to help you meet your financial goals, talk to your financial advisor, or call us at (800) 257-8787. Please read the information provided carefully before you invest. Investors should consider the investment objective and policies, risk considerations, charges and expenses of any investment carefully. Where applicable, be sure to obtain a prospectus, which contains this and other relevant information. To obtain a prospectus, please contact your securities representative or Nuveen Investments, 333 W. Wacker Dr., Chicago, IL 60606. Please read the prospectus carefully before you invest or send money.
Learn more about Nuveen Funds at: www.nuveen.com/mf
Nuveen makes things e-simple.
It only takes a minute to sign up for e-Reports. Once enrolled, you’ll receive an e-mail as soon as your Nuveen Fund information is ready. No more waiting for delivery by regular mail. Just click on the link within the e-mail to see the report and save it on your computer if you wish.
Free e-Reports right to your e-mail!
www.investordelivery.com
If you receive your Nuveen Fund dividends and statements from your financial advisor or brokerage account.
OR
www.nuveen.com/accountaccess
If you receive your Nuveen Fund dividends and statements directly from Nuveen.
| | |
Distributed by Nuveen Investments, LLC 333 West Wacker Drive Chicago, IL 60606 www.nuveen.com | | |
MAN-COMP-0610P
ITEM 2. CODE OF ETHICS.
As of the end of the period covered by this report, the registrant has adopted a code of ethics that applies to the registrant’s principal executive officer, principal financial officer, principal accounting officer or controller, or persons performing similar functions. There were no amendments to or waivers from the code during the period covered by this report. The registrant has posted the code of ethics on its website at www.nuveen.com/mf. (To view the code, click on the Shareholder Resources drop down menu box, click on Fund Governance and then click on Code of Conduct.)
ITEM 3. AUDIT COMMITTEE FINANCIAL EXPERT.
The registrant’s Board of Trustees determined that the registrant has at least one “audit committee financial expert” (as defined in Item 3 of Form N-CSR) serving on its Audit Committee. The registrant’s audit committee financial expert is Jack B. Evans, who is “independent” for purposes of Item 3 of Form N-CSR.
Mr. Evans was formerly President and Chief Operating Office of SCI Financial Group, Inc., a full service registered broker-dealer and registered investment adviser (“SCI”). As part of his role as President and Chief Operating Officer, Mr. Evans actively supervised the Chief Financial Officer (the “CFO”) and actively supervised the CFO’s preparation of financial statements and other filings with various regulatory authorities. In such capacity, Mr. Evans was actively involved in the preparation of SCI’s financial statements and the resolution of issues raised in connection therewith. Mr. Evans has also served on the audit committee of various reporting companies. At such companies, Mr. Evans was involved in the oversight of audits, audit plans, and the preparation of financial statements. Mr. Evans also formerly chaired the audit committee of the Federal Reserve Bank of Chicago.
ITEM 4. PRINCIPAL ACCOUNTANT FEES AND SERVICES.
The following tables show the amount of fees that PricewaterhouseCoopers LLP, the Trust’s auditor, billed to the Trust during the Trust’s last two full fiscal years. The Audit Committee approved in advance all audit services and non-audit services that PricewaterhouseCoopers LLP provided to the Trust, except for those non-audit services that were subject to the pre-approval exception under Rule 2-01 of Regulation S-X (the “pre-approval exception”). The pre-approval exception for services provided directly to the Trust waives the pre-approval requirement for services other than audit, review or attest services if: (A) the aggregate amount of all such services provided constitutes no more than 5% of the total amount of revenues paid by the Trust during the fiscal year in which the services are provided; (B) the Trust did not recognize the services as non-audit services at the time of the engagement; and (C) the services are promptly brought to the Audit Committee’s attention, and the Committee (or its delegate) approves the services before the audit is completed.
The Audit Committee has delegated certain pre-approval responsibilities to its Chairman (or, in his absence, any other member of the Audit Committee).
SERVICES THAT THE TRUST’S AUDITOR BILLED TO THE TRUST
| | | | | | | | | | | | |
Fiscal Year Ended June 30, 2010 | | Audit Fees Billed
to Funds 1 | | Audit-Related Fees
Billed to Funds 2 | | Tax Fees
Billed to Funds 3 | | All Other Fees
Billed to Funds 4 |
Name of Series | | | | | | | | | | | | |
Moderate Allocation Fund | | | 10,898 | | | 0 | | | 2,750 | | | 0 |
Conservative Allocation Fund | | | 10,899 | | | 0 | | | 2,750 | | | 0 |
Enhanced Core Equity Fund | | | 13,781 | | | 0 | | | 2,750 | | | 0 |
NWQ Equity Income Fund 5 | | | 10,509 | | | 0 | | | 0 | | | 0 |
Enhanced Mid-Cap Fund | | | 13,770 | | | 0 | | | 2,750 | | | 0 |
Multi-Manager Large-Cap Value Fund | | | 13,221 | | | 0 | | | 2,750 | | | 0 |
Growth Allocation Fund | | | 10,578 | | | 0 | | | 2,750 | | | 0 |
NWQ Multi-Cap Value Fund | | | 13,642 | | | 0 | | | 2,750 | | | 0 |
NWQ Small-Cap Value Fund | | | 11,261 | | | 0 | | | 2,750 | | | 0 |
Tradewinds Value Opportunities Fund | | | 24,403 | | | 0 | | | 2,750 | | | 0 |
NWQ Large-Cap Value Fund | | | 11,875 | | | 0 | | | 2,750 | | | 0 |
NWQ Small Mid/Cap Value Fund | | | 10,593 | | | 0 | | | 2,750 | | | 0 |
U.S. Equity Completeness Fund 6 | | | 10,548 | | | 0 | | | 0 | | | 0 |
| | | | | | | | | | | | |
Total | | $ | 165,978 | | $ | 0 | | $ | 30,250 | | $ | 0 |
| 1 | | “Audit Fees” are the aggregate fees billed for professional services for the audit of the Fund’s annual financial statements and services provided in connection with statutory and regulatory filings or engagements. |
| 2 | | “Audit Related Fees” are the aggregate fees billed for assurance and related services reasonably related to the performance of the |
audit or review of financial statements and are not reported under “Audit Fees”.
| 3 | | “Tax Fees” are the aggregate fees billed for professional services for tax advice, tax compliance, and tax planning. |
| 4 | | “All Other Fees” are the aggregate fees billed for products and services other than “Audit Fees”, “Audit Related Fees”, and “Tax Fees”. |
| 5 | | The Fund commenced operations on September 15, 2009. |
| 6 | | The Fund commenced operations on July 01, 2008. |
| | | | | | | | | | | | |
| | | Percentage Approved Pursuant to Pre-approval Exception | |
| | | Audit Fees Billed
to Funds | | | Audit-Related Fees
Billed to Funds | | | Tax Fees
Billed to Funds | | | All Other Fees
Billed to Funds | |
Name of Series | | | | | | | | | | | | |
Moderate Allocation Fund | | 0 | % | | 0 | % | | 0 | % | | 0 | % |
Conservative Allocation Fund | | 0 | % | | 0 | % | | 0 | % | | 0 | % |
Enhanced Core Equity Fund | | 0 | % | | 0 | % | | 0 | % | | 0 | % |
NWQ Equity Income Fund 1 | | 0 | % | | 0 | % | | 0 | % | | 0 | % |
Enhanced Mid-Cap Fund | | 0 | % | | 0 | % | | 0 | % | | 0 | % |
Multi-Manager Large-Cap Value Fund | | 0 | % | | 0 | % | | 0 | % | | 0 | % |
Growth Allocation Fund | | 0 | % | | 0 | % | | 0 | % | | 0 | % |
NWQ Multi-Cap Value Fund | | 0 | % | | 0 | % | | 0 | % | | 0 | % |
NWQ Small-Cap Value Fund | | 0 | % | | 0 | % | | 0 | % | | 0 | % |
Tradewinds Value Opportunities Fund | | 0 | % | | 0 | % | | 0 | % | | 0 | % |
NWQ Large-Cap Value Fund | | 0 | % | | 0 | % | | 0 | % | | 0 | % |
NWQ Small Mid/Cap Value Fund | | 0 | % | | 0 | % | | 0 | % | | 0 | % |
U.S. Equity Completeness Fund 2 | | 0 | % | | 0 | % | | 0 | % | | 0 | % |
| 1 | | The Fund commenced operations on September 15, 2009. |
| 2 | | The Fund commenced operations on July 01, 2008. |
| | | | | | | | | | | | |
| | | | |
Fiscal Year Ended June 30, 2009 | | Audit Fees Billed
to Funds 1 | | Audit-Related Fees
Billed to Funds 2 | | Tax Fees Billed
to Funds 3 | | All Other Fees
Billed to Funds 4 |
Name of Series | | | | | | | | | | | | |
Moderate Allocation Fund | | | 8,744 | | | 0 | | | 2,750 | | | 0 |
Conservative Allocation Fund | | | 9,531 | | | 0 | | | 2,750 | | | 0 |
Enhanced Core Equity Fund | | | 7,532 | | | 0 | | | 2,750 | | | 0 |
NWQ Equity Income Fund 5 | | | N/A | | | N/A | | | N/A | | | N/A |
Enhanced Mid-Cap Fund | | | 5,800 | | | 0 | | | 2,750 | | | 0 |
Multi-Manager Large-Cap Value Fund | | | 28,893 | | | 0 | | | 2,750 | | | 0 |
Growth Allocation Fund | | | 6,366 | | | 0 | | | 2,750 | | | 0 |
NWQ Multi-Cap Value Fund | | | 39,692 | | | 0 | | | 2,750 | | | 0 |
NWQ Small-Cap Value Fund | | | 12,474 | | | 0 | | | 2,750 | | | 0 |
Tradewinds Value Opportunities Fund | | | 64,145 | | | 0 | | | 2,750 | | | 0 |
NWQ Large-Cap Value Fund | | | 7,810 | | | 0 | | | 2,750 | | | 0 |
NWQ Small Mid/Cap Value Fund | | | 6,007 | | | 0 | | | 2,750 | | | 0 |
U.S. Equity Completeness Fund 6 | | | 6,083 | | | 0 | | | 0 | | | 0 |
| | | | | | | | | | | | |
Total | | $ | 203,077 | | $ | 0 | | $ | 30,250 | | $ | 0 |
| 1 | | “Audit Fees” are the aggregate fees billed for professional services for the audit of the Fund’s annual financial statements and services provided in connection with statutory and regulatory filings or engagements. |
| 2 | | “Audit Related Fees” are the aggregate fees billed for assurance and related services reasonably related to the performance of the audit or review of financial statements and are not reported under “Audit Fees”. |
| 3 | | “Tax Fees” are the aggregate fees billed for professional services for tax advice, tax compliance, and tax planning. |
| 4 | | “All Other Fees” are the aggregate fees billed for products and services other than “Audit Fees”, “Audit Related Fees”, and “Tax Fees”. |
| 5 | | The Fund commenced operations on September 15, 2009. |
| 6 | | The Fund commenced operations on July 01, 2008. |
| | | | | | | | | | | | |
| | | Percentage Approved Pursuant to Pre-approval Exception | |
| | | Audit Fees Billed
to Funds | | | Audit-Related Fees
Billed to Funds | | | Tax Fees
Billed to Funds | | | All Other Fees
Billed to Funds | |
Name of Series | | | | | | | | | | | | |
Moderate Allocation Fund | | 0 | % | | 0 | % | | 0 | % | | 0 | % |
Conservative Allocation Fund | | 0 | % | | 0 | % | | 0 | % | | 0 | % |
Enhanced Core Equity Fund | | 0 | % | | 0 | % | | 0 | % | | 0 | % |
NWQ Equity Income Fund 1 | | N/A | | | N/A | | | N/A | | | N/A | |
Enhanced Mid-Cap Fund | | 0 | % | | 0 | % | | 0 | % | | 0 | % |
Multi-Manager Large-Cap Value Fund | | 0 | % | | 0 | % | | 0 | % | | 0 | % |
Growth Allocation Fund | | 0 | % | | 0 | % | | 0 | % | | 0 | % |
NWQ Multi-Cap Value Fund | | 0 | % | | 0 | % | | 0 | % | | 0 | % |
NWQ Small-Cap Value Fund | | 0 | % | | 0 | % | | 0 | % | | 0 | % |
Tradewinds Value Opportunities Fund | | 0 | % | | 0 | % | | 0 | % | | 0 | % |
NWQ Large-Cap Value Fund | | 0 | % | | 0 | % | | 0 | % | | 0 | % |
NWQ Small Mid/Cap Value Fund | | 0 | % | | 0 | % | | 0 | % | | 0 | % |
U.S. Equity Completeness Fund 2 | | 0 | % | | 0 | % | | 0 | % | | 0 | % |
| 1 | | The Fund commenced operations on September 15, 2009. |
| 2 | | The Fund commenced operations on July 01, 2008. |
SERVICES THAT THE TRUST’S AUDITOR BILLED TO THE
ADVISER AND AFFILIATED FUND SERVICE PROVIDERS
The following tables show the amount of fees billed by PricewaterhouseCoopers LLP to Nuveen Asset Management (“NAM” or the “Adviser”), and any entity controlling, controlled by or under common control with NAM that provides ongoing services to the Trust (“Affiliated Fund Service Provider”), for engagements directly related to the Trust’s operations and financial reporting, during the Trust’s last two full fiscal years.
| | | | | | | | | | | | |
Fiscal Year Ended June 30, 2010 | | Audit-Related Fees
Billed to Adviser and
Affiliated Fund
Service Providers | | | Tax Fees Billed to
Adviser and
Affiliated Fund
Service Providers
| | | All Other Fees
Billed to Adviser
and Affiliated Fund
Service Providers | |
Nuveen Investment Trust | | $ | 0 | | | $ | 0 | | | $ | 0 | |
| |
| | | Percentage Approved Pursuant to Pre-approval Exception | |
| | | Audit-Related Fees
Billed to Adviser and
Affiliated Fund
Service Providers | | | Tax Fees Billed to
Adviser and
Affiliated Fund
Service Providers | | | All Other Fees
Billed to Adviser
and Affiliated Fund
Service Providers | |
| | | 0 | % | | | 0 | % | | | 0 | % |
| | | |
Fiscal Year Ended June 30, 2009 | | Audit-Related Fees
Billed to Adviser and
Affiliated Fund
Service Providers | | | Tax Fees Billed to
Adviser and
Affiliated Fund
Service Providers | | | All Other Fees
Billed to Adviser
and Affiliated Fund
Service Providers | |
Nuveen Investment Trust | | $ | 0 | | | $ | 0 | | | $ | 0 | |
| |
| | | Percentage Approved Pursuant to Pre-approval Exception | |
| | | Audit-Related Fees
Billed to Adviser and
Affiliated Fund
Service Providers | | | Tax Fees Billed to
Adviser and
Affiliated Fund
Service Providers | | | All Other Fees
Billed to Adviser
and Affiliated Fund
Service Providers | |
| | | 0 | % | | | 0 | % | | | 0 | % |
The tables also show the percentage of fees subject to the pre-approval exception. The pre-approval exception for services provided to the Adviser and any Affiliated Fund Service Provider (other than audit, review or attest services) waives the pre-approval requirement if: (A) the aggregate amount of all such services provided constitutes no more than 5% of the total amount of revenues paid to PricewaterhouseCoopers LLP by the Trust, the Adviser and Affiliated Fund Service Providers during the fiscal year in which the services are provided that would have to be pre-approved by the Audit Committee; (B) the Trust did not recognize the services as non-audit services at the time of the engagement; and (C) the services are promptly brought to the Audit Committee’s attention, and the Committee (or its delegate) approves the services before the Trust’s audit is completed.
NON-AUDIT SERVICES
| | | | | | | | | | | | |
Fiscal Year Ended June 30, 2010 | | Total Non-Audit Fees
Billed to Trust | | Total Non-Audit Fees
billed to Adviser and
Affiliated Fund Service
Providers (engagements
related directly to the
operations and financial
reporting of the Trust) | | Total Non-Audit Fees
billed to Adviser and
Affiliated Fund Service
Providers (all other
engagements) | | Total |
Name of Series | | | | | | | | | | | | |
Moderate Allocation Fund | | | 2,750 | | | 0 | | | 0 | | | 2,750 |
Conservative Allocation Fund | | | 2,750 | | | 0 | | | 0 | | | 2,750 |
Enhanced Core Equity Fund | | | 2,750 | | | 0 | | | 0 | | | 2,750 |
NWQ Equity Income Fund 1 | | | 0 | | | 0 | | | 0 | | | 0 |
Enhanced Mid-Cap Fund | | | 2,750 | | | 0 | | | 0 | | | 2,750 |
Multi-Manager Large-Cap Value Fund | | | 2,750 | | | 0 | | | 0 | | | 2,750 |
Growth Allocation Fund 2 | | | 3,782 | | | 0 | | | 0 | | | 3,782 |
NWQ Multi-Cap Value Fund | | | 2,750 | | | 0 | | | 0 | | | 2,750 |
NWQ Small-Cap Value Fund | | | 2,750 | | | 0 | | | 0 | | | 2,750 |
Tradewinds Value Opportunities
Fund 2 | | | 5,503 | | | 0 | | | 0 | | | 5,503 |
NWQ Large-Cap Value Fund | | | 2,750 | | | 0 | | | 0 | | | 2,750 |
NWQ Small Mid/Cap Value Fund | | | 2,750 | | | 0 | | | 0 | | | 2,750 |
U.S. Equity Completeness Fund 3 | | | 0 | | | 0 | | | 0 | | | 0 |
| | | | | | | | | | | | |
Total | | $ | 34,035 | | $ | 0 | | $ | 0 | | $ | 34,035 |
“Non-Audit Fees Billed to Trust” represent “Tax Fees” and “All Other Fees” billed to each Fund in their respective amounts from the previous table.
| 1 | | The Fund commenced operations on September 15, 2009. |
| 2 | | The “Total Non-Audit Fees Billed to Fund” includes tax fees paid by the Fund to Ernst & Young, LLP. |
| 3 | | The Fund commenced operations on July 01, 2008. |
| | | | | | | | | | | | |
Fiscal Year Ended June 30, 2009 | | Total Non-Audit Fees
Billed to Trust | | Total Non-Audit Fees
billed to Adviser and
Affiliated Fund Service
Providers (engagements
related directly to the
operations and financial
reporting of the Trust) | | Total Non-Audit Fees
billed to Adviser and
Affiliated Fund Service
Providers (all other
engagements) | | Total |
Name of Series | | | | | | | | | | | | |
Moderate Allocation Fund | | | 2,750 | | | 0 | | | 0 | | | 2,750 |
Conservative Allocation Fund | | | 2,750 | | | 0 | | | 0 | | | 2,750 |
Enhanced Core Equity Fund | | | 2,750 | | | 0 | | | 0 | | | 2,750 |
NWQ Equity Income Fund 1 | | | N/A | | | N/A | | | N/A | | | N/A |
Enhanced Mid-Cap Fund | | | 2,750 | | | 0 | | | 0 | | | 2,750 |
Multi-Manager Large-Cap Value Fund | | | 2,750 | | | 0 | | | 0 | | | 2,750 |
Growth Allocation Fund 2 | | | 3,823 | | | 0 | | | 0 | | | 3,823 |
NWQ Multi-Cap Value Fund | | | 2,750 | | | 0 | | | 0 | | | 2,750 |
NWQ Small-Cap Value Fund | | | 2,750 | | | 0 | | | 0 | | | 2,750 |
Tradewinds Value Opportunities
Fund 2 | | | 5,612 | | | 0 | | | 0 | | | 5,612 |
NWQ Large-Cap Value Fund | | | 2,750 | | | 0 | | | 0 | | | 2,750 |
NWQ Small Mid/Cap Value Fund | | | 2,750 | | | 0 | | | 0 | | | 2,750 |
U.S. Equity Completeness Fund 3 | | | 0 | | | 0 | | | 0 | | | 0 |
| | | | | | | | | | | | |
Total | | $ | 34,185 | | $ | 0 | | $ | 0 | | $ | 34,185 |
“Non-Audit Fees Billed to Trust” represent “Tax Fees” and “All Other Fees” billed to each Fund in their respective amounts from the previous table.
| 1 | | The Fund commenced operations on September 15, 2009. |
| 2 | | The “Total Non-Audit Fees Billed to Fund” includes tax fees paid by the Fund to Ernst & Young, LLP. |
| 3 | | The Fund commenced operations on July 01, 2008. |
Audit Committee Pre-Approval Policies and Procedures. Generally, the Audit Committee must approve (i) all non-audit services to be performed for the Trust by the Trust’s independent accountants and (ii) all audit and non-audit services to be performed by the Trust’s independent accountants for the Affiliated Fund Service Providers with respect to the operations and financial reporting of the Trust. Regarding tax and research projects conducted by the independent accountants for the Trust and Affiliated Fund Service Providers (with respect to operations and financial reports of the Trust), such engagements will be (i) pre-approved by the Audit Committee if they are expected to be for amounts greater than $10,000; (ii) reported to the Audit Committee Chairman for his verbal approval prior to engagement if they are expected to be for amounts under $10,000 but greater than $5,000; and (iii) reported to the Audit Committee at the next Audit Committee meeting if they are expected to be for an amount under $5,000.
ITEM 5. AUDIT COMMITTEE OF LISTED REGISTRANTS
Not applicable to this registrant.
ITEM 6. SCHEDULE OF INVESTMENTS
| a) | | See Portfolio of Investments in Item 1 |
ITEM 7. DISCLOSURE OF PROXY VOTING POLICIES AND PROCEDURES FOR CLOSED-END
MANAGEMENT INVESTMENT COMPANIES
Not applicable to this registrant.
ITEM 8. PORTFOLIO MANAGERS OF CLOSED-END MANAGEMENT INVESTMENT COMPANIES
Not applicable to this registrant.
ITEM 9. PURCHASES OF EQUITY SECURITIES BY CLOSED-END MANAGEMENT INVESTMENT COMPANY AND AFFILIATED PURCHASERS
Not applicable to this registrant.
ITEM 10. SUBMISSION OF MATTERS TO A VOTE OF SECURITY HOLDERS
There have been no material changes to the procedures by which shareholders may recommend nominees to the registrant’s Board of Trustees implemented after the registrant last provided disclosure in response to this Item.
ITEM 11. CONTROLS AND PROCEDURES.
| | (a) | | The registrant’s principal executive and principal financial officers, or persons performing similar functions, have concluded that the registrant’s disclosure controls and procedures (as defined in Rule 30a-3(c) under the Investment Company Act of 1940, as amended (the “1940 Act”) (17 CFR 270.30a-3(c))) are effective, as of a date within 90 days of the filing date of this report that includes the disclosure required by this paragraph, based on their evaluation of the controls and procedures required by Rule 30a-3(b) under the 1940 Act (17 CFR 270.30a-3(b)) and Rules 13a-15(b) or 15d-15(b) under the Securities Exchange Act of 1934, as amended (the “Exchange Act”) (17 CFR 240.13a-15(b) or 240.15d-15(b)). |
| | (b) | | There were no changes in the registrant’s internal control over financial reporting (as defined in Rule 30a-3(d) under the 1940 Act (17 CFR 270.30a-3(d)) that occurred during the second fiscal quarter of the period covered by this report that has materially affected, or is reasonably likely to materially affect, the registrant’s internal control over financial reporting. |
ITEM 12. EXHIBITS
File the exhibits listed below as part of this Form.
| | |
| (a)(1) | | Any code of ethics, or amendment thereto, that is the subject of the disclosure required by Item 2, to the extent that the registrant intends to satisfy the Item 2 requirements through filing of an exhibit: Not applicable because the code is posted on registrant’s website at www.nuveen.com/mf and there were no amendments during the period covered by this report. (To view the code, click on the Shareholder Resources drop down menu box, click on Fund Governance and then Code of Conduct.) |
| |
| (a)(2) | | A separate certification for each principal executive officer and principal financial officer of the registrant as required by
Rule 30a-2(a) under the 1940 Act (17 CFR 270.30a-2(a)) in the exact form set forth below: See EX-99.CERT attached hereto. |
| |
| (a)(3) | | Any written solicitation to purchase securities under Rule 23c-1 under the 1940 Act (17 CFR 270.23c-1) sent or given during the period covered by the report by or on behalf of the registrant to 10 or more persons: Not applicable to this registrant. |
| |
| (b) | | If the report is filed under Section 13(a) or 15(d) of the Exchange Act, provide the certifications required by Rule 30a-2(b) under the 1940 Act (17 CFR 270.30a-2(b)), Rule 13a-14(b) or Rule 15d-14(b) under the Exchange Act (17 CFR 240.13a-14(b) or 240.15d-14(b)), and Section 1350 of Chapter 63 of Title 18 of the United States Code (18 U.S.C. 1350) as an Exhibit. A certification furnished pursuant to this paragraph will not be deemed “filed” for purposes of Section 18 of the Exchange Act (15 U.S.C. 78r), or otherwise subject to the liability of that section. Such certification will not be deemed to be incorporated by reference into any filing under the Securities Act of 1933 or the Exchange Act, except to the extent that the registration specifically incorporates it by reference: See EX-99.906 CERT attached hereto. |
SIGNATURES
Pursuant to the requirements of the Securities Exchange Act of 1934 and the Investment Company Act of 1940, the registrant has duly caused this report to be signed on its behalf by the undersigned, thereunto duly authorized.
(Registrant) Nuveen Investment Trust
| | |
| |
By (Signature and Title) | | /s/ Kevin J. McCarthy |
| | Kevin J. McCarthy |
| | Vice President and Secretary |
Date September 8, 2010
Pursuant to the requirements of the Securities Exchange Act of 1934 and the Investment Company Act of 1940, this report has been signed below by the following persons on behalf of the registrant and in the capacities and on the dates indicated.
| | |
| |
By (Signature and Title) | | /s/ Gifford R. Zimmerman |
| | Gifford R. Zimmerman |
| | Chief Administrative Officer |
| | (principal executive officer) |
Date September 8, 2010
| | |
| |
| By (Signature and Title) | | /s/ Stephen D. Foy |
| | Stephen D. Foy |
| | Vice President and Controller |
| | (principal financial officer) |
Date September 8, 2010