UNITED STATES
SECURITIES AND EXCHANGE COMMISSION
Washington, D.C. 20549
FORM N-CSR
CERTIFIED SHAREHOLDER REPORT OF REGISTERED MANAGEMENT
INVESTMENT COMPANIES
Investment Company Act file number 811-07619
Nuveen Investment Trust
(Exact name of registrant as specified in charter)
Nuveen Investments
333 West Wacker Drive, Chicago, IL 60606
(Address of principal executive offices) (Zip code)
Kevin J. McCarthy
Nuveen Investments
333 West Wacker Drive
Chicago, IL 60606
(Name and address of agent for service)
Registrant’s telephone number, including area code: (312) 917-7700
Date of fiscal year end: June 30
Date of reporting period: June 30, 2012
Form N-CSR is to be used by management investment companies to file reports with the Commission not later than 10 days after the transmission to stockholders of any report that is required to be transmitted to stockholders under Rule 30e-1 under the Investment Company Act of 1940 (17 CFR 270.30e-1). The Commission may use the information provided on Form N-CSR in its regulatory, disclosure review, inspection, and policy making roles.
A registrant is required to disclose the information specified by Form N-CSR, and the Commission will make this information public. A registrant is not required to respond to the collection of information contained in Form N-CSR unless the Form displays a currently valid Office of Management and Budget (“OMB”) control number. Please direct comments concerning the accuracy of the information collection burden estimate and any suggestions for reducing the burden to Secretary, Securities and Exchange Commission, 450 Fifth Street, NW, Washington, DC 20549-0609. The OMB has reviewed this collection of information under the clearance requirements of 44 U.S.C. ss.3507.
ITEM 1. REPORTS TO STOCKHOLDERS.

Mutual Funds
Nuveen Equity Funds
For investors seeking long-term capital appreciation.
Annual Report
June 30, 2012
| | | | | | | | | | |
| | | Share Class / Ticker Symbol |
| | | | | |
| Fund Name | | Class A | | Class B | | Class C | | Class R3 | | Class I |
Nuveen Multi-Manager Large-Cap Value Fund | | NNGAX | | NNGBX | | NNGCX | | NMMTX | | NNGRX |
Nuveen NWQ Multi-Cap Value Fund | | NQVAX | | NQVBX | | NQVCX | | NMCTX | | NQVRX |
Nuveen NWQ Large-Cap Value Fund | | NQCAX | | — | | NQCCX | | NQCQX | | NQCRX |
Nuveen NWQ Small/Mid-Cap Value Fund | | NSMAX | | — | | NSMCX | | NSQRX | | NSMRX |
Nuveen NWQ Small-Cap Value Fund | | NSCAX | | — | | NSCCX | | NSCOX | | NSCRX |
Nuveen Tradewinds Value Opportunities Fund | | NVOAX | | NVOBX | | NVOCX | | NTVTX | | NVORX |
LIFE IS COMPLEX.
Nuveen makes things e-simple.
It only takes a minute to sign up for e-Reports. Once enrolled, you’ll receive an e-mail as soon as your Nuveen Fund information is ready. No more waiting for delivery by regular mail. Just click on the link within the e-mail to see the report and save it on your computer if you wish.
Free e-Reports right to your e-mail!
www.investordelivery.com
If you receive your Nuveen Fund distributions and statements from your financial advisor or brokerage account.
OR
www.nuveen.com/accountaccess
If you receive your Nuveen Fund distributions and statements directly from Nuveen.
| | | | | | |
| Must be preceded by or accompanied by a prospectus. | | NOT FDIC INSURED | | MAY LOSE VALUE | | NO BANK GUARANTEE |
Table of Contents
Chairman’s
Letter to Shareholders

Dear Shareholders,
Investors have many reasons to remain cautious. The challenges in the Euro area are casting a shadow over global economies and financial markets. The political support for addressing fiscal issues is eroding as the economic and social impacts become more visible. At the same time, member nations appear unwilling to provide adequate financial support or to surrender sufficient sovereignty to strengthen the banks or unify the Euro area financial system. The gains made in reducing deficits, and the hard-won progress on winning popular acceptance of the need for economic austerity, are at risk. To their credit, European political leaders press on to find compromise solutions, but there is increasing concern that time will begin to run out.
In the U.S., strong corporate earnings have enabled the equity markets to withstand much of the downward pressures coming from weakening job creation, slower economic growth and political uncertainty. The Fed remains committed to low interest rates but has refrained from predicting another program of quantitative easing unless economic growth were to weaken significantly or the threat of recession appears on the horizon. Pre-election maneuvering has added to the already highly partisan atmosphere in the Congress. The end of the Bush-era tax cuts and implementation of the spending restrictions of the Budget Control Act of 2011, both scheduled to take place at year-end, loom closer.
During the last year, U.S. based investors have experienced a sharp decline and a strong recovery in the equity markets. The experienced investment teams at Nuveen keep their eye on a longer time horizon and use their practiced investment disciplines to negotiate through market peaks and valleys to achieve long-term goals for investors. Experienced professionals pursue investments that will weather short-term volatility and at the same time, seek opportunities that are created by markets that overreact to negative developments. Monitoring this process is an important consideration for the Fund Board as it oversees your Nuveen Fund on your behalf.
As always, I encourage you to contact your financial consultant if you have any questions about your investment in a Nuveen Fund. On behalf of the other members of your Fund Board, we look forward to continuing to earn your trust in the months and years ahead.
Sincerely,

Robert P. Bremner
Chairman of the Board
August 23, 2012
Portfolio Managers’ Comments
Certain statements in this report are forward-looking statements. Discussions of specific investments are for illustration only and are not intended as recommendations of individual investments. The forward-looking statements and other views expressed herein are those of the portfolio managers as of the date of this report. Actual future results or occurrences may differ significantly from those anticipated in any forward-looking statements and the views expressed herein are subject to change at any time, due to numerous market and other fac-tors. The Funds disclaim any obli-gation to update publicly or revise any forward-looking statements or views expressed herein.
The Nuveen Multi-Manager Large Cap Value Fund is co-managed by Institutional Capital LLC (ICAP), Nuveen Asset Management, LLC, and Symphony Asset Management LLC. Nuveen Asset Management and Symphony are affiliates of Nuveen Investments. Jerrold Sensor, CFA, and Thomas Wenzel, CFA, oversee the portion of the Fund’s assets managed by ICAP, while Keith Hembre, CFA and Walter French oversee the Fund’s assets managed by Nuveen Asset Management. Gunther Stein and Ross Sakamoto oversee the portion of the Fund’s assets managed by Symphony. After the reporting period ended, on August 1, 2012, Thomas Cole, CFA was named portfolio manager for the portion of the Fund’s assets managed by ICAP and Joel Drescher was named portfolio manager for the portion of the Fund’s assets managed by Symphony. The Fund’s current portfolio managers will continue to serve as portfolio managers for the Fund.
The Nuveen NWQ Multi-Cap Value Fund, Nuveen NWQ Large-Cap Value Fund, Nuveen NWQ Small/Mid-Cap Value Fund and Nuveen NWQ Small-Cap Value Fund feature equity management by NWQ Investment Management Company, LLC (NWQ), an affiliate of Nuveen Investments. Jon Bosse is the Chief Investment Officer of NWQ and manages the Multi-Cap Value and Large-Cap Value Funds. Phyllis Thomas manages the Nuveen Small/Mid-Cap Value and Small-Cap Value Funds.
The Nuveen Tradewinds Value Opportunities Fund features portfolio management by Tradewinds Global Investors, LLC (Tradewinds), an affiliate of Nuveen Investments. During the reporting period, Tradewinds announced that Dave Iben, Co-President and Chief Investment Officer of Tradewinds, decided to leave the firm during the second calendar quarter. Emily Alejos and Drew Thelen have assumed investment leadership and oversight responsibilities, now serving as Co-Chief Investment Officers for Tradewinds. As integral members of the Tradewinds investment team, Emily and Drew have worked together for more than five years. Each brings significant investment experience to the next stage of Tradewinds’ development. Effective April 1, 2012, Joann Barry, CFA and F. Rowe Michels, CFA were named portfolio managers of the Fund, and David Iben no longer serves as portfolio manager.
What factors affected the U.S. economic and equity market environments during the twelve-month reporting period ended June 30, 2012?
During the reporting period, the U.S. economy’s progress toward recovery from recession remained sluggish. The Federal Reserve (Fed) maintained its efforts to improve the overall economic environment by continuing to hold the benchmark Fed Funds rate at the record low level of zero to 0.25% that it had established in December 2008. At its June 2012 meeting, the central bank affirmed its opinion that economic conditions would likely
warrant keeping the rate at “exceptionally low levels” through at least late 2014. The Fed also announced that it would extend its so-called Operation Twist program, whereby it is lengthening the average maturity of its holdings of U.S. Treasury securities, through the end of December 2012. The goals of this program are to lower longer-term interest rates, make broader financial conditions more accommodating, support a stronger economic recovery and help ensure that inflation remains at levels consistent with the Fed’s mandates of maximum employment and price stability.
In the second quarter of 2012, the U.S. economy slowed to an annualized growth rate of 1.5%, according to initial estimates for U.S. gross domestic product (GDP). While this marked the twelfth consecutive quarter of positive growth, it was also a significant slowdown from the previous few quarters. The Consumer Price Index (CPI) rose 1.7% year-over-year as of June 2012, the same figure as May 2012, which was the lowest twelve-month rate of change since February 2011. Core CPI (which excludes food and energy) increased 2.2% during the period, remaining above the Fed’s unofficial objective of 2.0% or lower for this inflation measure. However, the number was slightly below the 2.3% figure reported in the previous three months. Labor market conditions continued to be slow to improve, with the national unemployment rate registering 8.2% in June 2012. While this figure was down from 9.1% one year ago, it was still a slight uptick from the 8.1% reading in April 2012. The housing market remained the major weak spot in the economy, beleaguered by a high level of distressed properties and difficult credit conditions. For the twelve months ended May 2012 (the most recent data available at the time this report was prepared), the average home price in the Standard & Poor’s (S&P)/Case-Shiller Index of 20 major metropolitan areas lost 0.7%. Housing prices remained at the lowest levels since spring 2003, down more than one-third from their summer 2006 peak. In addition, the U.S. economic picture continued to be clouded by concerns about the European debt crisis and global financial markets in general and efforts to reduce the U.S. federal deficit.
The U.S. equity market appreciated during the reporting period notwithstanding increased concerns regarding global economic growth and a sovereign debt crisis in Europe that have plagued stocks more recently. The best performing sectors in the Russell 1000 Value Index for the year were consumer discretionary, health care and utilities. The worst performing sectors were energy, finance, and materials & processing. Energy stocks performed poorly mostly due to extremely weak natural gas prices, concern that high gasoline prices globally were placing a strain on economic growth, and worries over whether China could maintain a sufficient economic growth rate to drive continued demand growth (an issue for commodities generally).
During the reporting period, global equity markets experienced periods of extreme volatility. The coordinated move by central banks provided a psychological boost in equity markets, but the impact proved to be short lived. Global markets rebounded in the first quarter of 2012, as there were positive returns in broad indices. The Volatility Index (VIX) declined, ending the first quarter at a five-year low and implying a generally confident view among investors. However, the second quarter saw equity declines driven by macro uncertainty. The U.S. financial sector notably retracted first quarter gains, with major banks suffering from Eurozone headwinds via capital markets operations. Energy
companies also broadly traded lower, as investors extrapolated extended soft cyclical demand indefinitely into the future. U.S. treasuries and the U.S. dollar displayed resilience, however, since investors continue to flock to these perceived safe havens.
How did the Funds perform during the twelve-month reporting period ended June 30, 2012?
The tables in the Fund Performance and Expense Ratios section of this report provide Class A Share total returns for the Funds for the one-year, five-year, ten-year and since inception periods ended June 30, 2012. Each Funds’ Class A Share total returns are compared with the performance of their corresponding market indexes and peer group averages. A more detailed account of each Fund’s performance is provided later in this report.
What strategies were used to manage the Funds during the reporting period? How did these strategies influence performance?
Nuveen Multi-Manager Large-Cap Value Fund
The Nuveen Multi-Manager Large-Cap Value Fund’s Class A Shares at net asset value (NAV) outperformed the comparative Lipper classification average, but underperformed both the S&P 500® and the Russell 1000® Value indexes over the twelve-month period ended June 30, 2012.
The Fund uses three separate sub-advisers to seek large capitalization value stocks with the potential for long-term capital appreciation. ICAP uses a value-oriented investment strategy that attempts to identify stocks offering the best relative value and stable to rising earnings from a universe of large and mid-sized companies. It then selects a portion of those stocks that are identified to have a catalyst for change and monitors these holdings closely to determine if circumstances change. For the Nuveen Asset Management portion of the Fund, we create proprietary models to help establish quantitative links between economic/market variables, investment factors and equity market returns. Our proprietary models analyze macroeconomic and market data and other statistics to determine what we believe will be the key drivers of performance in the current economy. We also use historical analysis of these drivers to estimate equity market return and the relative contribution to market returns for a comprehensive list of investment factors. We evaluate each stock in the investable universe to determine its sensitivity to the expected returns for each factor and estimate a potential contribution for each stock. The Fund’s portfolio will include stocks that we believe target the highest expected returns within the established risk budget. Symphony seeks to deliver consistent returns though an investment process that combines quantitative screens and fundamental research. The portfolio construction process utilizes a proprietary optimizer designed to potentially generate an optimal risk reward balance versus the stated benchmark.
The ICAP managed portion of the Fund gained modest value in absolute terms but lagged the results of the Russell 1000 Value Index. The past year was a volatile investment environment, as the stock market dropped sharply in the third quarter of 2011, rebounded strongly in the period’s subsequent two quarters and then pulled back
modestly in the second quarter of 2012. Both security selection and sector allocation detracted from the portfolio’s relative performance. The financials and energy sectors added to results compared with the Russell benchmark, while the health care and consumer staples groups detracted. The portfolio benefited the most from being overweight in consumer staples and underweight in financials. However, the Fund had no exposure to utilities, which, given that sector’s strength, was a negative factor.
Throughout the reporting period, we consistently followed our bottom-up stock-selection investment process. We selected investments individually, based on our assessment of their valuation and prospects for price improvement compared with other stocks. We bought or added to stocks that we believed offered good value as well as a potential catalyst for a rising stock price and continued to sell or reduce exposure to securities that, in our view, offered limited upside potential. We adjusted the portfolio as market conditions changed or when we found opportunities to buy and sell securities that we believed would add value for our shareholders. As one example, the portfolio’s weighting in the capital spending sector increased after we bought shares of diversified conglomerate General Electric and diesel engine manufacturer Cummins Inc. Meanwhile, in the technology sector, we added shares of network communications company Cisco Systems. In contrast, we eliminated the Fund’s stake in beverage and snack food maker PepsiCo and restaurant chain McDonald’s and we reduced the portfolio’s weighting in The Coca-Cola Company, the global beverage giant. On an individual basis, the Fund’s top contributors to relative performance were software maker Microsoft, the Coca-Cola Company and U.K. based wireless communications provider, Vodafone.
The three largest relative detractors were auto-parts manufacturer Johnson Controls, insurance company MetLife and Procter & Gamble, maker of household and personal care products. Johnson Controls was hurt by its high exposure to the underperforming automotive sector. The prospects for continued low interest rates and, accordingly, lower investment income, weighed on shares of MetLife. Procter & Gamble lagged, as increased price competition and higher commodity costs hurt the firm’s profit margins.
The portion of the portfolio managed by Nuveen Asset Management was overweight energy and information technology and underweight staples, utilities, industrials and consumer discretionary. The largest single sector overweight was information technology. This position contributed negatively to the Fund’s relative performance versus the index. Performance attributable to the individual stock holdings within each sector was a negative for the Fund during the reporting period, with the stock picks within the consumer discretionary sector having the largest negative impact. The holdings within the energy, health care and staples sectors were also a negative for the Fund. Holdings within the utilities, industrials and information technology sectors resulted in positive relative performance for the Fund.
For the portion of the portfolio managed by Symphony, we remained invested in companies with relatively strong fundamentals. We benefited from stock selection in the information technology sector, health care and consumer staples sectors. In particular, Expedia and Hewlett-Packard positively contributed to performance. Stock selection in the energy and consumer discretionary sectors detracted from performance. Also negatively impacting performance was Visteon Corporation.
Nuveen NWQ Multi-Cap Value Fund
Class A Shares at net asset value (NAV) for the Nuveen NWQ Multi-Cap Value Fund underperformed S&P 500® and the Russell 3000® Value indexes and its Lipper classification average for the twelve-month period ended June 30, 2012.
The Fund seeks long-term capital appreciation by investing in equity securities of companies with large, medium and small market capitalizations that are selected on an opportunistic basis. Generally, the Fund’s managers look for undervalued companies where catalysts exist that may help unlock value or improve profitability. Such catalysts can be new management, improving fundamentals, renewed management focus, industry consolidation or company restructuring.
During the reporting period, three holdings received takeover bids, including Motorola Mobility Holdings, Northgate Minerals and Petrohawk Energy. Motorola Mobility received an all cash takeover offer from Google Inc. at $40 per share. The catalyst for the acquisition was Motorola’s extensive patent portfolio, which Google plans to use to protect its Android franchise. Northgate Minerals Corp. was acquired by AuRico Gold in an all stock deal. We trimmed our position on strength after the deal was announced, and subsequently repurchased the shares at a lower price. Petrohawk Energy Inc. accepted an all cash takeover offer from BHP Billiton Ltd. for $38.75 per share, a 65% premium to the stock’s previous day closing price.
Several positions detracted from performance, including General Motors. The company declined on concerns regarding the slowing economy and the potential impact on volumes and pricing, as well as struggles with restructuring efforts at its European and Brazilian operations.
Hartford Financial Services Group declined given fundamental challenges in its life operations and the continued low interest rate environment that is pressuring margins. Responding to shareholder pressure, the company recently announced a strategic restructuring whereby it will focus on property casualty by divesting its life and retirement businesses, and put its annuity business into runoff. Lastly, Talisman Energy Inc. underperformed given a sharp decline in natural gas prices and ongoing delays at its Yme project in the North Sea. Historical capital allocation decisions have also been a concern. We believe these issues should subside as new management appears capable at resolving the prior management’s challenges.
We strategically added several positions throughout the reporting period, including American International Group (AIG), Best Buy Co., Canadian Natural Resources, Cisco Systems and Hewlett-Packard. We also eliminated several positions due to more attractive investment opportunities. These included Amgen, Genworth Financial, Hess Corporation, Philip Morris International, Aurizon Mines, Merck & Co., Motorola Solutions and Vertex Pharmaceutical.
Nuveen NWQ Large-Cap Value Fund
Class A Shares at net asset value (NAV) for the Nuveen NWQ Large-Cap Value Fund underperformed its comparative Lipper classification average and the Russell 1000® Value Index for the twelve-month period ended June 30, 2012.
The Fund seeks long-term capital appreciation by investing in equity securities of companies with large market capitalizations that are selected on an opportunistic basis. Generally, the Fund’s managers look for undervalued companies where catalysts exist that may help unlock value or improve profitability. Such catalysts can be new management, improving fundamentals, renewed management focus, industry consolidation or company restructuring.
Several positions positively contributed to performance including Motorola Mobility Holdings, CA Inc. and Phillip Morris International Inc. Motorola Mobility received an all cash takeover offer from Google Inc. at $40 per share. The catalyst for the acquisition was Motorola’s extensive patent portfolio, which Google plans to use to protect its Android franchise. CA Inc. appreciated as management announced that it will return $2.5 billion of capital to shareholders through 2014 by raising its dividend 400% and repurchasing shares (equating to roughly 80% of the company’s free cash flows). These are actions that we have strongly supported. CA’s strengthened management team has made strides to improve the company’s market position and enhance shareholder value through a strategic restructuring and increased focus on internal operations. Philip Morris International Inc. benefited from market share gains in Japan due to supply disruptions by their main competitor Japan Tobacco, and favorable fundamental trends in various markets in Europe.
Declines in the Fund’s energy and finance holdings contributed significantly to underperformance for the year. The Fund’s energy stocks performed poorly due to declining crude oil prices, sluggish demand, and extremely weak natural gas prices. Natural gas prices reached 10 year lows during the period as mild winter weather and falling coal prices resulted in a glut of gas in North America storage. Financial stocks were pressured by concerns of the European sovereign debt crisis, historically low interest rates, and uncertainty regarding the implementation of new regulations. We believe the fundamentals and operating metrics of the Fund’s bank and insurance holdings have improved significantly since the 2008 financial crisis, while valuations reflect extremely low expectations. Several other positions which detracted from performance included General Motors, Hartford Financial Services Group and Talisman Energy. General Motors declined on concerns regarding the slowing economy and the potential impact on volumes and pricing, as well as struggles with restructuring efforts at its European and Brazilian operations. While GM Europe remains a challenge as weak demand and structural overcapacity is pressuring margins, a new product lineup coming out in 2013 that will replace the GMT900 truck platform looks very promising. Overall the GM investment case remains attractive as the company has a healthy balance sheet and is well positioned in emerging markets, particularly China. Hartford Financial Services Group declined given fundamental challenges in its life operations and the continued low interest rate environment that is pressuring margins. Lastly, Talisman Energy Inc. underperformed given a sharp decline in natural gas prices and ongoing delays at its Yme project in the North Sea.
We strategically added several positions throughout the reporting period, including American International Group (AIG), Best Buy Co., Canadian Natural Resources, Cisco Systems and Hewlett-Packard. We also eliminated several positions due to more attractive
investment opportunities. These included Amgen, Genworth Financial, Hess Corporation, Lockhead Martin Corp. and Motorola Solutions.
Nuveen NWQ Small/Mid-Cap Value Fund
The Fund’s Class A Shares at net asset value (NAV) outperformed the Russell 2500® Value Index and its Lipper classification average for the twelve-month period ended June 30, 2012.
The Fund continued to follow its disciplined investment approach which seeks long-term capital appreciation by investing in equity securities of companies with small- to mid-market capitalizations selected using an analyst-driven, value-oriented process. The portfolio manager looks for undervalued companies where catalysts exist to unlock value or improve profitability. Such catalysts can be new management, improving fundamentals, renewed management focus, industry consolidation or company restructuring.
For the twelve-month reporting period, performance was driven by strong stock selection in the health care and consumer discretionary sectors. This was offset by weakness in materials and processing and durables. Several positions contributed to performance including Vertex Pharmaceuticals. The company’s shares rose sharply during the period after announcing interim data from Phase II studies of KALYDECO + VX-809, its combo drug for treatment of a small portion of the cystic fibrosis population. Shares of Elizabeth Arden rose during the period as the company announced several new fragrance licensing agreements and further clarified the timeline for the global relaunch of the Elizabeth Arden brand. Shares were particularly strong on the announcement that the company had acquired the global licenses for Justin Bieber fragrances. The Arden relaunch remains the company’s single biggest opportunity. Also positively contributing to performance was Northgate Minerals. The company was our best performing gold stock as the company entered into a definitive agreement to be acquired by AuRico Gold in an all-stock deal. The new entity will have five operating gold mines and a sixth scheduled to come online in 2012.
Several positions detracted from performance including Thompson Creek. The company’s shares declined on concerns over a funding gap for the company’s Mt. Milligan project in central British Columbia. The company’s copper and gold project at Mt. Milligan should add growth and diversification to the company in the longer term. Real estate operator Forestar underperformed during the period as a result of the mid-cycle economic slowdown and the perception that housing prices could decline again. Our energy stocks declined in conjunction with a weak energy market as oil prices plunged on fears of slowing growth. We continue to believe that rising global demand and limited supply will support oil prices going forward. Denbury Resources detracted from performance, after weather delays prompted the company to lower production guidance at their Bakken Development. We strategically added several positions throughout the reporting period, including Inter Parfums Inc. and TriMas Corporation. We also eliminated several positions due to more attractive investment opportunities, these included Arch Coal and Graftech.
Nuveen NWQ Small-Cap Value Fund
The Fund’s Class A Shares at net asset value (NAV) outperformed the Russell 2000® Value Index and its Lipper classification average for the twelve-month period ended June 30, 2012.
Over the reporting period, the Fund continued to follow its disciplined investment approach. The Fund seeks long-term capital appreciation by investing in equity securities of companies with small market capitalizations selected using an analyst-driven, value-oriented process. NWQ seeks to provide superior risk-adjusted returns through an analyst-driven, value-oriented process. Portfolio managers look for undervalued companies where catalysts exist to unlock value or improve profitability. Such catalysts can be new management, improving fundamentals, renewed management focus, industry consolidation or company restructuring.
Stock selection in the consumer discretionary, technology and consumer staples sectors drove the Fund’s performance. Several positions positively contributed to performance including Smart Balance. Shares of Smart Balance rose sharply in June (2012) after the company’s announcement that it had acquired Udi, the number one producer by sales of gluten-free food products. Also positively contributing to performance was Standard Microsystems. The company’s shares rose during the second quarter following the announced acquisition of the company by Microchip Technology at a significant premium. Under the terms of the agreement, Microchip Technology will acquire all outstanding common stock of Standard Microsystems.
Shares of Elizabeth Arden rose during the period as the company announced several new fragrance licensing agreements and further clarified the timeline for the global relaunch of the Elizabeth Arden brand. Shares were particularly strong on the announcement that the company had acquired the global licenses for Justin Bieber fragrances. The Arden relaunch remains the company’s single biggest opportunity.
Several positions detracted from performance during the reporting period. In particular, the performance of stocks within the energy sector reflected the sharp decline in crude oil prices late in the reporting period. Shares of Carrizo Oil & Gas fell as oil prices weakened due to well-supplied oil inventories, sluggish demand and a strengthening U.S. dollar. While the backdrop of further economic weakness and lower crude prices does have us monitoring the risk/reward of our investments, we continue to find shares of Carrizo extremely attractive. Also detracting from performance was Thompson Creek. The company’s shares declined on concerns over a funding gap for the company’s Mt. Milligan project in central British Columbia. The company’s copper and gold project at Mt. Milligan should add growth and diversification to the company in the longer term. Lastly, real estate operator Forestar underperformed during the period as a result of the mid cycle economic slowdown and the perception that housing prices could decline again.
We strategically added several positions throughout the reporting period, including Inter Parfums Inc., Neenah Paper Inc., GP Strategies Corp., Homestreet Inc. and Methode Electronics. We also eliminated several positions due to more attractive investment opportunities. These included Golfsmith and Temple-Inland.
Nuveen Tradewinds Value Opportunities Fund
The Fund’s Class A Shares at net asset value (NAV) underperformed the Russell 3000 Value Index and the Lipper classification average for the twelve-month period ended June 30, 2012. It should be noted that the Fund has held, and is expected to continue to
hold, securities that are not included in the comparative index shown in this report. Due to the difference between the securities held by the Fund and the composition of the index, we would expect there to be some differences over time between the Fund and the index in terms of performance, composition, and/or risk profile.
The Fund seeks long-term capital appreciation by investing in equity securities of companies with varying market capitalizations selected using an eclectic, value-oriented process.
Appreciation in select technology companies had a positive effect on performance. One of these top contributors was Microsoft Corporation. The company is expected to have major upgrades throughout the next few years, which we believe will drive sales upwards.
Another top contributor to performance was Georgia Gulf Corporation, a producer of chlorovinyls, aromatics and building products. Westlake Chemical offered $30/share in a hostile bid; Georgia Gulf shares were trading above the bid while rumors were swirling that it would take at least $40 to get the deal done. We eventually sold this position after the shares reached what we believed was fair value. Wal-Mart Stores, the world’s largest retailer operating discount stores, supercenters and warehouse clubs was also a top performer. The company experienced an increase in stock price after Investor Day announced a number of positive points on sales, expenses and income guidance. Investors also reacted positively to favorable trends in earnings per share and annual dividend growth. The shares reached fair value, and as a result, we trimmed and eventually sold out of our position in this name.
As has been the case for some time now, one of the areas where we have seen extensive business sustainability yet declining stock prices is in select gold mining companies. Toward the end of 2011, underperformance in gold producers was due to production shortfalls, continued rising input costs and relatively lackluster fourth quarter stock performance following capital flight out of commodities stocks. In 2012, the price-to-earnings measures for some of the gold firms we hold have dipped lower than the average for the general global market, despite historical premium valuations. We have maintained substantial exposures to these companies over the last few years as they have commonly been offered at what we view as “sale prices” in relation to the assets they control. We see recent spot price declines as temporary deviations from the long-term trend of a growing level of demand relative to fewer available quantities of the metal, placing well-resourced producers in a strong operating position. Kinross Gold Corp. is an international gold mining company based in Canada, with operations and development projects in Canada, U.S. and Russia among other countries. During the reporting period, the company drew investor apprehension due to labor and cost challenges at its Tasiast mine in Mauritania and tax negotiations at its Ecuadorian Fruta del Norte project.
Newcrest Mining is a gold mining firm that also produces copper as a byproduct of its activities. The company’s shares have suffered from weakness in gold spot prices. We continue to see the company’s abundant reserves, relatively large production volumes, and diversified mining assets as attractive at current prices.
In the energy sector, Arch Coal Inc. was a bottom performer in the last half of 2011 after the company missed revenue estimates and cut the year’s EPS forecast due to lost production in one of its mines. The company is the second largest coal producer in the U.S. and the second largest by reserves. Price dynamics in natural gas have caused declines in demand for coal, and Arch also suffered after a recent decision to cut its dividend. While sentiment remains negative in the short-term, we believe the company’s recent debt restructuring dramatically reduces liquidity concerns.
Risk Considerations
Mutual fund investing involves risk; principal loss is possible. Equity investments such as those held by the Funds are subject to market risk and common stock risk. Foreign investments involve additional risks, including currency fluctuation, political and economic instability, lack of liquidity and differing legal and accounting standards. These risks are magnified in emerging markets.
Investments in small- and mid-cap companies such as those held in the Nuveen Multi- Manager Large-Cap Value Fund, the Nuveen NWQ Small/Mid-Cap Value Fund, the Nuveen Small-Cap Value Fund, and the Nuveen Tradewinds Value Opportunities Fund are subject to greater volatility.
The Nuveen Multi-Manager Large-Cap Value Fund is also subject to the risk that the sub- advisers’ investment decisions may not complement one another.
Fund Performance and Expense Ratios
The Fund Performance and Expense Ratios for each Fund are shown on the following twelve pages.
Returns quoted represent past performance, which is no guarantee of future results. Current performance may be higher or lower than the performance shown. Investment returns and principal value will fluctuate so that when shares are redeemed, they may be worth more or less than their original cost. Returns without sales charges would be lower if the sales charge were included. Returns do not reflect the deduction of taxes that a shareholder would pay on Fund distributions or the redemption of Fund shares.
Returns may reflect a contractual agreement between certain Funds and the investment adviser to waive certain fees and expenses; see Notes to Financial Statements, Footnote 7 — Management Fees and Other Transactions with Affiliates for more information. In addition, returns may reflect a voluntary expense limitation by the Funds’ investment adviser that may be modified or discontinued at any time without notice. For the most recent month-end performance visit www.nuveen.com or call (800) 257-8787.
Returns reflect differences in sales charges and expenses, which are primarily differences in distribution and service fees. Fund returns assume reinvestment of dividends and capital gains.
Comparative index and Lipper return information is provided for the Funds’ Class A Shares at net asset value (NAV) only.
The expense ratios shown reflect the Funds’ total operating expenses (before fee waivers and/or expense reimbursements, if any) as shown in the Funds’ most recent prospectus. The expense ratios include management fees and other fees and expenses.
Fund Performance and Expense Ratios (continued)
Nuveen Multi-Manager Large-Cap Value Fund
Refer to the first page of this Fund Performance and Expense Ratios section for further explanation of the information included within this page.
Fund Performance
Average Annual Total Returns as of June 30, 2012
| | | | | | | | | | | | |
| |
| | | Average Annual | |
| | | |
| | | 1-Year | | | 5-Year* | | | 10-Year* | |
Class A Shares at NAV | | | 0.19% | | | | -1.43% | | | | 4.67% | |
Class A Shares at maximum Offering Price | | | -5.60% | | | | -2.59% | | | | 4.05% | |
S&P 500® Index** | | | 5.45% | | | | -0.22% | | | | 5.33% | |
Russell 1000® Value Index** | | | 3.01% | | | | -2.19% | | | | 5.28% | |
Lipper Large-Cap Value Funds Classification Average** | | | -0.15% | | | | -2.65% | | | | 4.34% | |
| | | |
Class B Shares w/o CDSC | | | -0.56% | | | | -2.16% | | | | 4.04% | |
Class B Shares w/CDSC | | | -4.51% | | | | -2.31% | | | | 4.04% | |
Class C Shares | | | -0.51% | | | | -2.16% | | | | 3.89% | |
Class R3 Shares | | | 0.04% | | | | -1.71% | | | | 4.39% | |
Class I Shares | | | 0.45% | | | | -1.19% | | | | 4.93% | |
Class A Shares have a maximum 5.75% sales charge (Offering Price). Class A Share purchases of $1 million or more are sold at net asset value without an up-front sales charge but may be subject to a contingent deferred sales charge (CDSC), also known as a back-end sales charge, if redeemed within twelve months of purchase. Class B Shares have a CDSC that begins at 5% for redemptions during the first year and declines periodically until after six years when the charge becomes 0%. Class B Shares automatically convert to Class A Shares eight years after purchase. Class C Shares have a 1% CDSC for redemptions within less than twelve months, which is not reflected in the one-year total return. Class R3 Shares have no sales charge and are available to only certain retirement plan clients of financial intermediaries. Class I Shares have no sales charge and may be purchased under limited circumstances or by specified classes of investors.
Expense Ratios as of Most Recent Prospectus
| | | | | | |
| | |
| | | Gross
Expense
Ratios | | | Net
Expense
Ratios |
Class A Shares | | | 1.22% | | | 1.18% |
Class B Shares | | | 1.97% | | | 1.93% |
Class C Shares | | | 1.97% | | | 1.93% |
Class R3 Shares | | | 1.49% | | | 1.43% |
Class I Shares | | | 0.97% | | | 0.93% |
The Fund’s investment adviser has agreed to waive fees and/or reimburse expenses through October 31, 2012, so that total annual Fund operating expenses (excluding 12b-1 distribution and/or service fees, interest expenses, taxes, fees incurred in acquiring and disposing of portfolio securities and extraordinary expenses) do not exceed 0.95% (1.20% after October 31, 2012) of the average daily net assets of any class of Fund shares. The expense limitation expiring October 31, 2012, may be terminated or modified prior to that date only with the approval of the Board of Trustees of the Fund. The expense limitation in effect thereafter may be terminated or modified only with the approval of shareholders of the Fund.
| * | The returns for Class A, B, C and I Shares are actual. The returns for Class R3 Shares are actual for the periods since class inception on 8/04/08; returns prior to class inception are Class I Share returns adjusted for differences in sales charges and expenses, which are primarily differences in distribution and service fees. |
| ** | Refer to the Glossary of Terms Used in this Report for definitions. Indexes and Lipper averages are not available for direct investment. |
Growth of an Assumed $10,000 Investment as of June 30, 2012 – Class A Shares
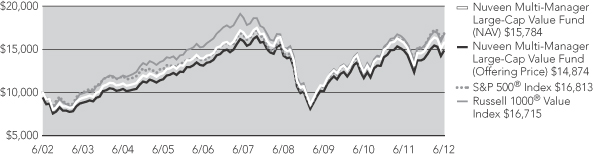
The graphs do not reflect the deduction of taxes that a shareholder may pay on Fund distributions or the redemption of Fund shares.
Fund Performance and Expense Ratios (continued)
Nuveen NWQ Multi-Cap Value Fund
Refer to the first page of this Fund Performance and Expense Ratios section for further explanation of the information included within this page.
Fund Performance
Average Annual Total Returns as of June 30, 2012
| | | | | | | | | | | | |
| |
| | | Average Annual | |
| | | |
| | | 1-Year | | | 5-Year* | | | 10-Year* | |
Class A Shares at NAV | | | -4.29% | | | | -5.97% | | | | 5.07% | |
Class A Shares at maximum Offering Price | | | -9.81% | | | | -7.08% | | | | 4.45% | |
S&P 500® Index** | | | 5.45% | | | | 0.22% | | | | 5.33% | |
Russell 3000® Value Index** | | | 2.64% | | | | -2.10% | | | | 5.37% | |
Lipper Multi-Cap Core Funds Classification Average** | | | -1.69% | | | | -0.99% | | | | 5.29% | |
| | | | | | | | | | | | |
Class B Shares w/o CDSC | | | -4.98% | | | | -6.67% | | | | 4.44% | |
Class B Shares w/CDSC | | | -8.78% | | | | -6.85% | | | | 4.44% | |
Class C Shares | | | -4.98% | | | | -6.67% | | | | 4.29% | |
Class R3 Shares | | | -4.48% | | | | -6.22% | | | | 4.80% | |
Class I Shares | | | -4.02% | | | | -5.73% | | | | 5.34% | |
Effective December 6, 2002, based on shareholder approval, the Nuveen NWQ Multi-Cap Value Fund acquired the assets and performance history of the PBHG Special Equity Fund. The Fund had no assets prior to the acquisition. In addition, on December 14, 2001, the PBHG Special Equity Fund acquired the assets of the NWQ Special Equity Portfolio. The information presented for the Nuveen NWQ Multi-Cap Value Fund prior to the acquisition date represents the expense adjusted performance of the predecessor funds.
Class A Shares have a maximum 5.75% sales charge (Offering Price). Class A Share purchases of $1 million or more are sold at net asset value without an up-front sales charge but may be subject to a contingent deferred sales charge (CDSC), also known as a back-end sales charge, if redeemed within twelve months of purchase. Class B Shares have a CDSC that begins at 5% for redemptions during the first year and declines periodically until after six years when the charge becomes 0%. Class B Shares automatically convert to Class A Shares eight years after purchase. Class C Shares have a 1% CDSC for redemptions within less than twelve months, which is not reflected in the one-year total return. Class R3 Shares have no sales charge and are available to only certain retirement plan clients of financial intermediaries. Class I Shares have no sales charge and may be purchased under limited circumstances or by specified classes of investors.
Expense Ratios as of Most Recent Prospectus
| | | | |
| |
| | | Expense
Ratios | |
Class A Shares | | | 1.38% | |
Class B Shares | | | 2.13% | |
Class C Shares | | | 2.13% | |
Class R3 Shares | | | 1.63% | |
Class I Shares | | | 1.13% | |
| * | The returns for Class I Shares are actual. The returns for Class A, B and C shares are actual for the period since class inception on 12/09/02; returns prior to class inception are Class I Share returns adjusted for differences in sales charges and expense, which are primarily differences in distribution and service fees. The returns for Class R3 Shares are actual for the periods since class inception on 8/04/08; returns prior to class inception are Class I Share returns adjusted for differences in sales charges and expense, which are primarily differences in distribution and service fees. |
| ** | Refer to the Glossary of Terms Used in this Report for definitions. Indexes and Lipper averages are not available for direct investment. |
Growth of an Assumed $10,000 Investment as of June 30, 2012 – Class A Shares
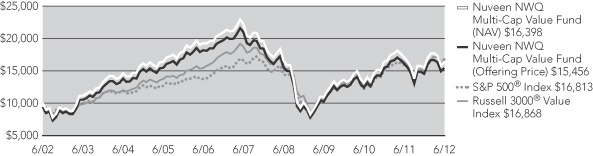
The graphs do not reflect the deduction of taxes that a shareholder may pay on Fund distributions or the redemption of Fund shares.
Fund Performance and Expense Ratios (continued)
Nuveen NWQ Large-Cap Value Fund
Refer to the first page of this Fund Performance and Expense Ratios section for further explanation of the information included within this page.
Fund Performance
Average Annual Total Returns as of June 30, 2012
| | | | | | | | | | | | |
| |
| | | Average Annual | |
| | | |
| | | 1-Year | | | 5-Year* | | | Since
Inception* | |
Class A Shares at NAV | | | -7.99% | | | | -4.17% | | | | -2.61% | |
Class A Shares at maximum Offering Price | | | -13.27% | | | | -5.30% | | | | -3.64% | |
Russell 1000® Value Index** | | | 3.01% | | | | -2.19% | | | | -0.92% | |
Lipper Large-Cap Value Funds Classification Average** | | | -0.15% | | | | -2.65% | | | | 1.20% | |
| | | |
Class C Shares | | | -8.64% | | | | -4.88% | | | | -3.32% | |
Class R3 Shares | | | -8.19% | | | | -4.41% | | | | -2.85% | |
Class I Shares | | | -7.73% | | | | -3.93% | | | | -2.36% | |
Class A Shares have a maximum 5.75% sales charge (Offering Price). Class A Share purchases of $1 million or more are sold at net asset value without an up-front sales charge but may be subject to a contingent deferred sales charge (CDSC), also known as a back-end sales charge, if redeemed within twelve months of purchase. Class C Shares have a 1% CDSC for redemptions within less than twelve months, which is not reflected in the one-year total return. Class R3 Shares have no sales charge and are available to only certain retirement plan clients of financial intermediaries. Class I Shares have no sales charge and may be purchased under limited circumstances or by specified classes of investors.
Expense Ratios as of Most Recent Prospectus
| | | | |
| |
| | | Expense
Ratios | |
Class A Shares | | | 1.20% | |
Class C Shares | | | 1.95% | |
Class R3 Shares | | | 1.45% | |
Class I Shares | | | 0.95% | |
| * | Since inception returns for Class A, C and I Shares, and the comparative index and Lipper classification average, are from 12/15/06. The returns for Class A, C and I Shares are actual. The returns for Class R3 Shares are actual for the periods since class inception on 9/29/09; returns prior to class inception are Class I Share returns adjusted for differences in sales charges and expense, which are primarily differences in distribution and service fees. |
| ** | Refer to the Glossary of Terms Used in this Report for definitions. Indexes and Lipper averages are not available for direct investment. |
Growth of an Assumed $10,000 Investment as of June 30, 2012 – Class A Shares
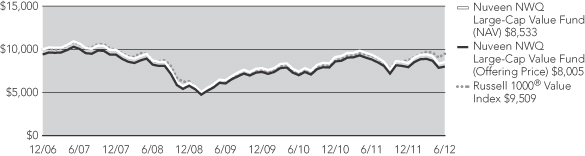
The graphs do not reflect the deduction of taxes that a shareholder may pay on Fund distributions or the redemption of Fund shares.
Fund Performance and Expense Ratios (continued)
Nuveen NWQ Small/Mid-Cap Value Fund
Refer to the first page of this Fund Performance and Expense Ratios section for further explanation of the information included within this page.
Fund Performance
Average Annual Total Returns as of June 30, 2012
| | | | | | | | | | | | |
| |
| | | Average Annual | |
| | | |
| | | 1-Year | | | 5-Year* | | | Since
Inception* | |
Class A Shares at NAV | | | -1.41% | | | | -1.68% | | | | -0.33% | |
Class A Shares at maximum Offering Price | | | -7.05% | | | | -2.84% | | | | -1.39% | |
Russell 2500® Value Index** | | | -1.49% | | | | -0.20% | | | | 0.84% | |
S&P Lipper Small-Cap Core Funds Classification Average** | | | -3.77% | | | | 0.08% | | | | 1.53% | |
| | | |
Class C Shares | | | -2.13% | | | | -2.44% | | | | -1.10% | |
Class R3 Shares | | | -1.63% | | | | -2.16% | | | | -0.79% | |
Class I Shares | | | -1.16% | | | | -1.68% | | | | -0.30% | |
Class A Shares have a maximum 5.75% sales charge (Offering Price). Class A Share purchases of $1 million or more are sold at net asset value without an up-front sales charge but may be subject to a contingent deferred sales charge (CDSC), also known as a back-end sales charge, if redeemed within twelve months of purchase. Class C Shares have a 1% CDSC for redemptions within less than twelve months, which is not reflected in the one-year total return. Class R3 Shares have no sales charge and are available to only certain retirement plan clients of financial intermediaries. Class I Shares have no sales charge and may be purchased under limited circumstances or by specified classes of investors.
Expense Ratios as of Most Recent Prospectus
| | | | | | | | |
| | |
| | | Gross
Expense
Ratios | | | Net
Expense
Ratios | |
Class A Shares | | | 1.88% | | | | 1.33% | |
Class C Shares | | | 2.62% | | | | 2.08% | |
Class R3 Shares | | | 2.13% | | | | 1.58% | |
Class I Shares | | | 1.62% | | | | 1.08% | |
The investment adviser has agreed to waive fees and/or reimburse expenses through October 31, 2012 so that total annual Fund operating expenses (excluding 12b-1 distribution and/or service fees, interest expenses, taxes, fees incurred in acquiring and disposing of portfolio securities and extraordinary expenses) do not exceed 1.10% (1.45% after October 31, 2012) of the average daily net assets of any class of Fund shares. The expense limitation expiring October 31, 2012, may be terminated or modified prior to that date only with the approval of the Board of Trustees of the Fund. The expense limitation in effect thereafter may be terminated or modified only with the approval of shareholders of the Fund.
| * | Since inception returns for Class A, C and I Shares, and the comparative index and Lipper classification average, are from 12/15/06. The returns for Class A, C and I Shares are actual. The returns for Class R3 Shares are actual for the periods since class inception on 9/29/09; returns prior to class inception are Class I Share returns adjusted for differences in sales charges and expense, which are primarily differences in distribution and service fees. |
| ** | Refer to the Glossary of Terms Used in this Report for definitions. Indexes and Lipper averages are not available for direct investment. |
Growth of an Assumed $10,000 Investment as of June 30, 2012 – Class A Shares
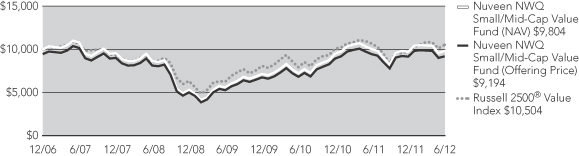
The graphs do not reflect the deduction of taxes that a shareholder may pay on Fund distributions or the redemption of Fund shares.
Fund Performance and Expense Ratios (continued)
Nuveen NWQ Small-Cap Value Fund
Refer to the first page of this Fund Performance and Expense Ratios section for further explanation of the information included within this page.
Fund Performance
Average Annual Total Returns as of June 30, 2012
| | | | | | | | | | | | |
| |
| | | Average Annual | |
| | | |
| | | 1-Year | | | 5-Year* | | | Since
Inception* | |
Class A Shares at NAV | | | 3.09% | | | | -2.32% | | | | 4.22% | |
Class A Shares at maximum Offering Price | | | -2.84% | | | | -3.47% | | | | 3.41% | |
Russell 2000® Value Index** | | | -1.44% | | | | -1.05% | | | | 3.71% | |
Lipper Small-Cap Core Funds Classification Average** | | | -3.77% | | | | 0.08% | | | | 4.66% | |
| | | |
Class C Shares | | | 2.36% | | | | -3.03% | | | | 3.47% | |
Class R3 Shares | | | 2.85% | | | | -2.57% | | | | 3.96% | |
Class I Shares | | | 3.38% | | | | -2.07% | | | | 4.49% | |
Class A Shares have a maximum 5.75% sales charge (Offering Price). Class A Share purchases of $1 million or more are sold at net asset value without an up-front sales charge but may be subject to a contingent deferred sales charge (CDSC), also known as a back-end sales charge, if redeemed within twelve months of purchase. Class C Shares have a 1% CDSC for redemptions within less than twelve months, which is not reflected in the one-year total return. Class R3 Shares have no sales charge and are available to only certain retirement plan clients of financial intermediaries. Class I Shares have no sales charge and may be purchased under limited circumstances or by specified classes of investors.
Expense Ratios as of Most Recent Prospectus
| | | | |
| |
| | |
Expense
Ratios | |
Class A Shares | | | 1.43% | |
Class C Shares | | | 2.18% | |
Class R3 Shares | | | 1.68% | |
Class I Shares | | | 1.18% | |
| * | Since inception returns for Class A, C and I Shares, and the comparative index and Lipper classification average, are from 12/08/04. The returns for Class A, C and I Shares are actual. The returns for Class R3 Shares are actual for the periods since class inception on 9/29/09; returns prior to class inception are Class I Share returns adjusted for differences in sales charges and expense, which are primarily differences in distribution and service fees. |
| ** | Refer to the Glossary of Terms Used in this Report for definitions. Indexes and Lipper averages are not available for direct investment. |
Growth of an Assumed $10,000 Investment as of June 30, 2012 – Class A Shares
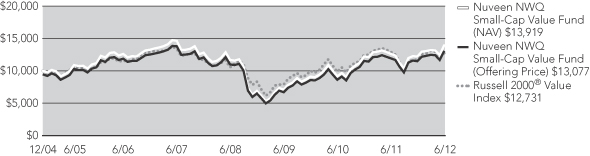
The graphs do not reflect the deduction of taxes that a shareholder may pay on Fund distributions or the redemption of Fund shares.
Fund Performance and Expense Ratios (continued)
Nuveen Tradewinds Value Opportunities Fund
Refer to the first page of this Fund Performance and Expense Ratios section for further explanation of the information included within this page.
Fund Performance
Average Annual Total Returns as of June 30, 2012
| | | | | | | | | | | | |
| |
| | | Average Annual | |
| | | |
| | | 1-Year | | | 5-Year* | | | Since
Inception* | |
Class A Shares at NAV | | | -12.46% | | | | 2.62% | | | | 8.92% | |
Class A Shares at maximum Offering Price | | | -17.49% | | | | 1.41% | | | | 8.07% | |
Russell 3000® Value Index** | | | 2.64% | | | | -2.10% | | | | 3.33% | |
Lipper Global Multi-Cap Core Funds Classification Average** | | | -7.23% | | | | -2.55% | | | | 3.12% | |
| | | |
Class B Shares w/o CDSC | | | -13.14% | | | | 1.85% | | | | 8.10% | |
Class B Shares w/ CDSC | | | -16.34% | | | | 1.69% | | | | 8.10% | |
Class C Shares | | | -13.11% | | | | 1.85% | | | | 8.10% | |
Class R3 Shares | | | -12.67% | | | | 2.36% | | | | 8.64% | |
Class I Shares | | | -12.27% | | | | 2.87% | | | | 9.19% | |
Class A Shares have a maximum 5.75% sales charge (Offering Price). Class A Share purchases of $1 million or more are sold at net asset value without an up-front sales charge but may be subject to a contingent deferred sales charge (CDSC), also known as a back-end sales charge, if redeemed within twelve months of purchase. Class B Shares have a CDSC that begins at 5% for redemptions during the first year and declines periodically until after six years when the charge becomes 0%. Class B Shares automatically convert to Class A Shares eight years after purchase. Class C Shares have a 1% CDSC for redemptions within less than twelve months, which is not reflected in the one-year total return. Class R3 Shares have no sales charge and are available to only certain retirement plan clients of financial intermediaries. Class I Shares have no sales charge and may be purchased under limited circumstances or by specified classes of investors.
Expense Ratios as of Most Recent Prospectus
| | | | |
| |
| | | Expense
Ratios | |
Class A Shares | | | 1.20% | |
Class B Shares | | | 1.95% | |
Class C Shares | | | 1.95% | |
Class R3 Shares | | | 1.45% | |
Class I Shares | | | 0.95% | |
| * | Since inception returns for Class A, B, C and I Shares, and the comparative index and Lipper classification average, are from 12/08/04. The returns for Class A, B, C and I Shares are actual. The returns for Class R3 Shares are actual for the periods since class inception on 8/04/08; returns prior to class inception are Class I Share returns adjusted for differences in sales charges and expense, which are primarily differences in distribution and service fees. |
| ** | Refer to the Glossary of Terms Used in this Report for definitions. Indexes and Lipper averages are not available for direct investment. |
Growth of an Assumed $10,000 Investment as of June 30, 2012 – Class A Shares
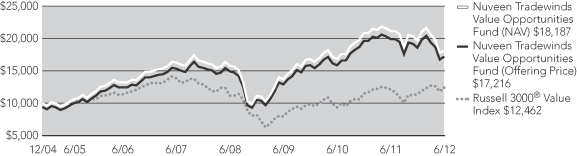
The graphs do not reflect the deduction of taxes that a shareholder may pay on Fund distributions or the redemption of Fund shares.
Holding Summaries as of June 30, 2012
This data relates to the securities held in each Fund’s portfolio of investments. It should not be construed as a measure of performance for the Fund itself.
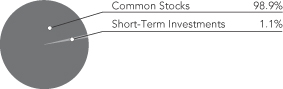
Nuveen Multi-Manager Large-Cap Value Fund
Portfolio Allocation1
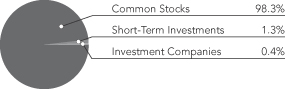
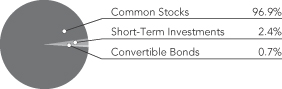
Nuveen NWQ Multi-Cap Value Fund
Portfolio Allocation1

| | | | |
Portfolio Composition1 | | | |
| Oil, Gas & Consumable Fuels | | | 11.6% | |
| Pharmaceuticals | | | 10.3% | |
| Insurance | | | 7.0% | |
| Commercial Banks | | | 5.7% | |
| Diversified Financial Services | | | 4.5% | |
| Media | | | 3.8% | |
| Industrial Conglomerates | | | 3.5% | |
| Diversified Telecommunication Services | | | 3.3% | |
| Health Care Providers & Services | | | 2.9% | |
| Semiconductors & Equipment | | | 2.6% | |
| Aerospace & Defense | | | 2.5% | |
| Communication Equipment | | | 2.1% | |
| Capital Markets | | | 2.1% | |
| Consumer Finance | | | 2.1% | |
| Food Products | | | 2.1% | |
| IT Services | | | 1.9% | |
| Chemicals | | | 1.8% | |
| Software | | | 1.7% | |
| Electric Utilities | | | 1.7% | |
| Health Care Equipment & Supplies | | | 1.6% | |
| Machinery | | | 1.6% | |
| Computers & Peripherals | | | 1.5% | |
| Household Products | | | 1.5% | |
| Internet Software & Services | | | 1.5% | |
| Wireless Telecommunication Services | | | 1.4% | |
| Multiline Retail | | | 1.4% | |
| Energy Equipment & Services | | | 1.0% | |
| Short-Term Investments | | | 1.3% | |
| Other | | | 14.0% | |
| | | | |
| Portfolio Composition1 | | | |
| Insurance | | | 14.8% | |
| Oil, Gas & Consumable Fuels | | | 14.0% | |
| Pharmaceuticals | | | 12.5% | |
| Software | | | 7.7% | |
| Metals & Mining | | | 7.7% | |
| Semiconductors & Equipment | | | 6.0% | |
| Media | | | 5.9% | |
| Diversified Financial Services | | | 5.0% | |
| Machinery | | | 3.6% | |
| Specialty Retail | | | 3.6% | |
| IT Services | | | 2.8% | |
| Computers & Peripherals | | | 2.5% | |
| Short-Term Investments | | | 0.2% | |
| Other | | | 13.7% | |
| | | | |
Top Five Common Stock
Holdings1 | |
| Pfizer Inc. | | | 3.0% | |
| Exxon Mobil Corporation | | | 2.9% | |
| General Electric Company | | | 2.6% | |
| Wells Fargo & Company | | | 2.6% | |
| Merck & Company Inc. | | | 2.5% | |
| | | | |
| Top Five Common Stock Holdings1 | |
| CA Inc. | | | 7.7% | |
| Pfizer Inc. | | | 4.4% | |
| Sanofi-Aventis | | | 4.4% | |
| Apache Corporation | | | 4.0% | |
| Talisman Energy Inc. | | | 3.8% | |
| 1 | As a percentage of total investments as of June 30, 2012. Holdings are subject to change. |
Nuveen NWQ Large-Cap Value Fund
Portfolio Allocation1
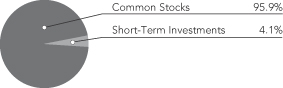
Nuveen NWQ Small/Mid-Cap Value Fund
Portfolio Allocation1
| | | | |
| Portfolio Composition1 | | | |
| Insurance | | | 15.6% | |
| Oil, Gas & Consumable Fuels | | | 13.8% | |
| Pharmaceuticals | | | 12.5% | |
| Software | | | 9.6% | |
| Media | | | 6.4% | |
| Metals & Mining | | | 6.3% | |
| Diversified Financial Services | | | 4.8% | |
| Machinery | | | 3.3% | |
| Communication Equipment | | | 3.0% | |
| Computers & Peripherals | | | 2.3% | |
| Food & Staples Retailing | | | 2.2% | |
| Automobiles | | | 2.2% | |
| Short-Term Investments | | | 4.1% | |
| Other | | | 13.9% | |
| | | | |
| Portfolio Composition1 | | | |
| Insurance | | | 13.0% | |
| Electronic Equipment & Instruments | | | 9.6% | |
| Semiconductors & Equipment | | | 7.9% | |
| Machinery | | | 6.7% | |
| Paper & Forest Products | | | 5.6% | |
| Metals & Mining | | | 5.3% | |
| Commercial Banks | | | 5.1% | |
| Personal Products | | | 5.0% | |
| Hotels, Restaurants & Leisure | | | 4.9% | |
| Oil, Gas & Consumable Fuels | | | 4.5% | |
| Real Estate Management & Development | | | 4.1% | |
| Food Products | | | 4.1% | |
| Building Products | | | 3.1% | |
| Aerospace & Defense | | | 3.0% | |
| Specialty Retail | | | 2.7% | |
| Short-Term Investments | | | 1.1% | |
| Other | | | 14.3% | |
| | | | |
| Top Five Common Stock Holdings1 | |
| CA Inc. | | | 7.1% | |
| Pfizer Inc. | | | 4.7% | |
| Talisman Energy Inc. | | | 4.1% | |
| Sanofi-Aventis | | | 4.1% | |
| AngloGold Ashanti Limited, Sponsored ADR | | | 3.8% | |
| | | | |
| Top Five Common Stock Holdings1 | |
| Bob Evans Farms | | | 4.9% | |
| Elizabeth Arden, Inc. | | | 4.8% | |
| Forestar Real Estate Group Inc. | | | 4.1% | |
| Allied World Assurance Holdings | | | 3.5% | |
| Clearwater Paper Corporation | | | 3.2% | |
| 1 | As a percentage of total investments as of June 30, 2012. Holdings are subject to change. |
Holding Summaries as of June 30, 2012 (continued)
Nuveen NWQ Small-Cap Value Fund
Portfolio Allocation1

Nuveen Tradewinds Value Opportunities Fund
Portfolio Allocation1
| | | | |
| Portfolio Composition1 | | | |
| Machinery | | | 8.1% | |
| Insurance | | | 7.4% | |
| Commercial Banks | | | 7.1% | |
| Semiconductors & Equipment | | | 6.8% | |
| Personal Products | | | 6.7% | |
| Food Products | | | 5.7% | |
| Apparel, Accessories & Luxury Goods | | | 5.0% | |
| Paper & Forest Products | | | 5.0% | |
| Hotels, Restaurants & Leisure | | | 4.8% | |
| Metals & Mining | | | 4.6% | |
| Electronic Equipment & Instruments | | | 4.2% | |
| Real Estate Management & Development | | | 3.9% | |
| Oil, Gas & Consumable Fuels | | | 3.9% | |
| Building Products | | | 3.3% | |
| Thrifts & Mortgage Finance | | | 3.1% | |
| Short-Term Investments | | | 5.3% | |
| Other | | | 15.1% | |
| | | | |
| Portfolio Composition1 | | | |
| Oil, Gas & Consumable Fuels | | | 16.1% | |
| Metals & Mining | | | 15.8% | |
| Insurance | | | 11.3% | |
| Electric Utilities | | | 6.4% | |
| Pharmaceuticals | | | 4.1% | |
| Food & Staples Retailing | | | 4.0% | |
| Energy Equipment & Services | | | 3.8% | |
| Food Products | | | 3.6% | |
| Aerospace & Defense | | | 3.1% | |
| Software | | | 2.6% | |
| Wireless Telecommunication Services | | | 2.4% | |
| Capital Markets | | | 2.2% | |
| Chemicals | | | 2.0% | |
| Diversified Telecommunication Services | | | 2.0% | |
| Electronic Equipment & Instruments | | | 1.6% | |
| Communication Equipment | | | 1.6% | |
| Short-Term Investments | | | 2.4% | |
| Other | | | 15.0% | |
| | | | |
| Top Five Common Stock Holdings1 | |
| Bob Evans Farms | | | 4.8% | |
| Elizabeth Arden, Inc. | | | 4.5% | |
| Forestar Real Estate Group Inc. | | | 3.9% | |
| Carrizo Oil & Gas, Inc. | | | 3.9% | |
| Albany International Corporation, Class A | | | 3.5% | |
| | | | |
| Top Five Common Stock Holdings1 | |
| Barrick Gold Corporation | | | 4.0% | |
| Cameco Corporation | | | 3.6% | |
| Kinross Gold Corporation | | | 3.5% | |
| Newmont Mining Corporation | | | 3.1% | |
| American International Group | | | 3.1% | |
| | | | |
| Country Allocation1 | | | |
| United States | | | 64.3% | |
| Canada | | | 14.1% | |
| France | | | 3.2% | |
| Russia | | | 3.0% | |
| Australia | | | 2.6% | |
| Brazil | | | 1.6% | |
| Israel | | | 1.5% | |
| Japan | | | 1.2% | |
| Switzerland | | | 1.1% | |
| Finland | | | 1.0% | |
| Turkey | | | 1.0% | |
| South Africa | | | 1.0% | |
| South Korea | | | 0.6% | |
| Belgium | | | 0.5% | |
| Italy | | | 0.5% | |
| Indonesia | | | 0.4% | |
| Short-Term Investments | | | 2.4% | |
| 1 | As a percentage of total investments as of June 30, 2012. Holdings are subject to change. |
Expense Examples
As a shareholder of one or more of the Funds, you incur two types of costs: (1) transaction costs, including up-front and back-end sales charges (loads) or redemption fees, where applicable; and (2) ongoing costs, including management fees; distribution and service (12b-1) fees, where applicable; and other Fund expenses. The Examples below are intended to help you understand your ongoing costs (in dollars) of investing in the Funds and to compare these costs with the ongoing costs of investing in other mutual funds.
The Examples below are based on an investment of $1,000 invested at the beginning of the period and held for the period.
The information under “Actual Performance,” together with the amount you invested, allows you to estimate actual expenses incurred over the reporting period. Simply divide your account value by $1,000 (for example, an $8,600 account value divided by $1,000 = 8.60) and multiply the result by the cost shown for your share class, in the row entitled “Expenses Incurred During Period” to estimate the expenses incurred on your account during this period.
The information under “Hypothetical Performance,” provides information about hypothetical account values and hypothetical expenses based on the respective Fund’s actual expense ratio and an assumed rate of return of 5% per year before expenses, which is not the Fund’s actual return. The hypothetical account values and expenses may not be used to estimate the actual ending account balance or expense you incurred for the period. You may use this information to compare the ongoing costs of investing in the Fund and other Funds. To do so, compare this 5% hypothetical example with the 5% hypothetical examples that appear in the shareholder reports of the other funds.
Please note that the expenses shown in the table are meant to highlight your ongoing costs only and do not reflect any transaction costs. Therefore, the hypothetical information is useful in comparing ongoing costs only, and will not help you determine the relative total costs of owning different funds or share classes. In addition, if these transaction costs were included, your costs would have been higher.
Nuveen Multi-Manager Large-Cap Value Fund
| | | | | | | | | | | | | | | | | | | | | | | | | | | | | | | | | | | | | | | | | | |
| | | | | | | | | | | | | | | | | | | | Hypothetical Performance | |
| | | Actual Performance | | (5% annualized return
before expenses) | |
| | | A Shares | | | B Shares | | | C Shares | | | R3 Shares | | | I Shares | | | | | A Shares | | | B Shares | | | C Shares | | | R3 Shares | | | I Shares | |
| Beginning Account Value (1/01/12) | | $ | 1,000.00 | | | $ | 1,000.00 | | | $ | 1,000.00 | | | $ | 1,000.00 | | | $ | 1,000.00 | | | | | $ | 1,000.00 | | | $ | 1,000.00 | | | $ | 1,000.00 | | | $ | 1,000.00 | | | $ | 1,000.00 | |
| Ending Account Value (6/30/12) | | $ | 1,071.10 | | | $ | 1,067.00 | | | $ | 1,067.70 | | | $ | 1,070.10 | | | $ | 1,072.50 | | | | | $ | 1,019.10 | | | $ | 1,015.32 | | | $ | 1,015.37 | | | $ | 1,017.75 | | | $ | 1,020.34 | |
| Expenses Incurred During Period | | $ | 5.97 | | | $ | 9.87 | | | $ | 9.82 | | | $ | 7.36 | | | $ | 4.69 | | | | | $ | 5.82 | | | $ | 9.62 | | | $ | 9.57 | | | $ | 7.17 | | | $ | 4.57 | |
For each class of the Fund, expenses are equal to the Fund’s annualized net expense ratio of 1.16%, 1.92%, 1.91%, 1.43% and ..91% for Classes A, B, C, R3 and I, respectively, multiplied by the average account value over the period, multiplied by 182/366 (to reflect the one-half year period).
Nuveen NWQ Multi-Cap Value Fund
| | | | | | | | | | | | | | | | | | | | | | | | | | | | | | | | | | | | | | | | | | |
| | | | | | | | | | | | | | | | | | | | Hypothetical Performance | |
| | | Actual Performance | | (5% annualized return
before expenses) | |
| | | A Shares | | | B Shares | | | C Shares | | | R3 Shares | | | I Shares | | | | | A Shares | | | B Shares | | | C Shares | | | R3 Shares | | | I Shares | |
| Beginning Account Value (1/01/12) | | $ | 1,000.00 | | | $ | 1,000.00 | | | $ | 1,000.00 | | | $ | 1,000.00 | | | $ | 1,000.00 | | | | | $ | 1,000.00 | | | $ | 1,000.00 | | | $ | 1,000.00 | | | $ | 1,000.00 | | | $ | 1,000.00 | |
| Ending Account Value (6/30/12) | | $ | 1,060.30 | | | $ | 1,056.50 | | | $ | 1,056.50 | | | $ | 1,059.10 | | | $ | 1,062.40 | | | | | $ | 1,018.75 | | | $ | 1,014.97 | | | $ | 1,015.07 | | | $ | 1,017.50 | | | $ | 1,020.19 | |
| Expenses Incurred During Period | | $ | 6.30 | | | $ | 10.18 | | | $ | 10.07 | | | $ | 7.58 | | | $ | 4.82 | | | | | $ | 6.17 | | | $ | 9.97 | | | $ | 9.87 | | | $ | 7.42 | | | $ | 4.72 | |
For each class of the Fund, expenses are equal to the Fund’s annualized net expense ratio of 1.23%, 1.99%, 1.97%, 1.48% and 0.94% for Classes A, B, C, R3 and I, respectively, multiplied by the average account value over the period, multiplied by 182/366 (to reflect the one-half year period).
Nuveen NWQ Large-Cap Value Fund
| | | | | | | | | | | | | | | | | | | | | | | | | | | | | | | | | | |
| | | | | | | | | | | | | | | | | Hypothetical Performance | |
| | | Actual Performance | | (5% annualized return
before expenses) | |
| | | A Shares | | | C Shares | | | R3 Shares | | | I Shares | | | | | A Shares | | | C Shares | | | R3 Shares | | | I Shares | |
| Beginning Account Value (1/01/12) | | $ | 1,000.00 | | | $ | 1,000.00 | | | $ | 1,000.00 | | | $ | 1,000.00 | | | | | $ | 1,000.00 | | | $ | 1,000.00 | | | $ | 1,000.00 | | | $ | 1,000.00 | |
| Ending Account Value (6/30/12) | | $ | 1,022.50 | | | $ | 1,019.30 | | | $ | 1,021.90 | | | $ | 1,024.30 | | | | | $ | 1,019.29 | | | $ | 1,015.66 | | | $ | 1,018.20 | | | $ | 1,020.74 | |
| Expenses Incurred During Period | | $ | 5.63 | | | $ | 9.29 | | | $ | 6.74 | | | $ | 4.18 | | | | | $ | 5.62 | | | $ | 9.27 | | | $ | 6.72 | | | $ | 4.17 | |
For each class of the Fund, expenses are equal to the Fund’s annualized net expense ratio of 1.09%, 1.85%, 1.34% and .83% for Classes A, C, R3 and I, respectively, multiplied by the average account value over the period, multiplied by 182/366 (to reflect the one-half year period).
Expense Examples (continued)
Nuveen NWQ Small/Mid-Cap Value Fund
| | | | | | | | | | | | | | | | | | | | | | | | | | | | | | | | | | |
| | | | | | | | | | | | | | | | | Hypothetical Performance | |
| | | Actual Performance | | | | | (5% annualized return before expenses) | |
| | | A Shares | | | C Shares | | | R3 Shares | | | I Shares | | | | | A Shares | | | C Shares | | | R3 Shares | | | I Shares | |
| Beginning Account Value (1/01/12) | | $ | 1,000.00 | | | $ | 1,000.00 | | | $ | 1,000.00 | | | $ | 1,000.00 | | | | | $ | 1,000.00 | | | $ | 1,000.00 | | | $ | 1,000.00 | | | $ | 1,000.00 | |
| Ending Account Value (6/30/12) | | $ | 1,018.20 | | | $ | 1,014.60 | | | $ | 1,017.30 | | | $ | 1,019.80 | | | | | $ | 1,018.20 | | | $ | 1,014.57 | | | $ | 1,017.16 | | | $ | 1,019.54 | |
| Expenses Incurred During Period | | $ | 6.72 | | | $ | 10.37 | | | $ | 7.77 | | | $ | 5.37 | | | | | $ | 6.72 | | | $ | 10.37 | | | $ | 7.77 | | | $ | 5.37 | |
For each class of the Fund, expenses are equal to the Fund’s annualized net expense ratio of 1.34%, 2.07%, 1.55% and 1.07% for Classes A, C, R3 and I, respectively, multiplied by the average account value over the period, multiplied by 182/366 (to reflect the one-half year period).
Nuveen NWQ Small-Cap Value Fund
| | | | | | | | | | | | | | | | | | | | | | | | | | | | | | | | | | |
| | | | | | | | | | | | | | | | | Hypothetical Performance | |
| | | Actual Performance | | | | | (5% annualized return before expenses) | |
| | | A Shares | | | C Shares | | | R3 Shares | | | I Shares | | | | | A Shares | | | C Shares | | | R3 Shares | | | I Shares | |
| Beginning Account Value (1/01/12) | | $ | 1,000.00 | | | $ | 1,000.00 | | | $ | 1,000.00 | | | $ | 1,000.00 | | | | | $ | 1,000.00 | | | $ | 1,000.00 | | | $ | 1,000.00 | | | $ | 1,000.00 | |
| Ending Account Value (6/30/12) | | $ | 1,067.30 | | | $ | 1,063.10 | | | $ | 1,065.60 | | | $ | 1,068.70 | | | | | $ | 1,017.75 | | | $ | 1,014.02 | | | $ | 1,016.56 | | | $ | 1,019.00 | |
| Expenses Incurred During Period | | $ | 7.35 | | | $ | 11.18 | | | $ | 8.58 | | | $ | 6.07 | | | | | $ | 7.17 | | | $ | 10.92 | | | $ | 8.37 | | | $ | 5.92 | |
For each class of the Fund, expenses are equal to the Fund’s annualized net expense ratio of 1.43%, 2.18%, 1.67% and 1.18% for Classes A, C, R3 and I, respectively, multiplied by the average account value over the period, multiplied by 182/366 (to reflect the one-half year period).
Nuveen Tradewinds Value Opportunities Fund
| | | | | | | | | | | | | | | | | | | | | | | | | | | | | | | | | | | | | | | | | | |
| | | | | | | | | | | | | | | | | | | | Hypothetical Performance | |
| | | Actual Performance | | | | | (5% annualized return before expenses) | |
| | | A Shares | | | B Shares | | | C Shares | | | R3 Shares | | | I Shares | | | | | A Shares | | | B Shares | | | C Shares | | | R3 Shares | | | I Shares | |
| Beginning Account Value (1/01/12) | | $ | 1,000.00 | | | $ | 1,000.00 | | | $ | 1,000.00 | | | $ | 1,000.00 | | | $ | 1,000.00 | | | | | $ | 1,000.00 | | | $ | 1,000.00 | | | $ | 1,000.00 | | | $ | 1,000.00 | | | $ | 1,000.00 | |
| Ending Account Value (6/30/12) | | $ | 939.40 | | | $ | 935.60 | | | $ | 936.00 | | | $ | 938.10 | | | $ | 940.20 | | | | | $ | 1,019.10 | | | $ | 1,015.42 | | | $ | 1,015.37 | | | $ | 1,018.05 | | | $ | 1,020.29 | |
| Expenses Incurred During Period | | $ | 5.59 | | | $ | 9.14 | | | $ | 9.19 | | | $ | 6.60 | | | $ | 4.44 | | | | | $ | 5.82 | | | $ | 9.52 | | | $ | 9.57 | | | $ | 6.87 | | | $ | 4.62 | |
For each class of the Fund, expenses are equal to the Fund’s annualized net expense ratio of 1.16%, 1.90%, 1.91%, 1.37% and ..92% for Classes A, B, C, R3 and I, respectively, multiplied by the average account value over the period, multiplied by 182/366 (to reflect the one-half year period).
Report of Independent Registered Public Accounting Firm
To the Board of Trustees and Shareholders of
Nuveen Investment Trust:
In our opinion, the accompanying statements of assets and liabilities, including the portfolios of investments, and the related statements of operations, of changes in net assets, and the financial highlights present fairly, in all material respects, the financial position of Nuveen Multi-Manager Large-Cap Value Fund, Nuveen NWQ Multi-Cap Value Fund, Nuveen NWQ Large-Cap Value Fund, Nuveen NWQ Small/Mid-Cap Value Fund, Nuveen NWQ Small-Cap Value Fund and Nuveen Tradewinds Value Opportunities Fund (each a series of the Nuveen Investment Trust, hereinafter referred to as the “Funds”) at June 30, 2012, the results of each of their operations for the year then ended, the changes in each of their net assets for each of the two years in the period then ended and the financial highlights for each of the periods presented, in conformity with accounting principles generally accepted in the United States of America. These financial statements and financial highlights (hereafter referred to as “financial statements”) are the responsibility of the Funds’ management; our responsibility is to express an opinion on these financial statements based on our audits. We conducted our audits of these financial statements in accordance with the standards of the Public Company Accounting Oversight Board (United States). Those standards require that we plan and perform the audit to obtain reasonable assurance about whether the financial statements are free of material misstatement. An audit includes examining, on a test basis, evidence supporting the amounts and disclosures in the financial statements, assessing the accounting principles used and significant estimates made by management, and evaluating the overall financial statement presentation. We believe that our audits, which included confirmation of securities at June 30, 2012 by correspondence with the custodian and brokers, provide a reasonable basis for our opinion.
PRICEWATERHOUSECOOPERS LLP
Chicago, IL
August 28, 2012
Portfolio of Investments
Nuveen Multi-Manager Large-Cap Value Fund
June 30, 2012
| | | | | | | | | | | | | | |
| Shares | | | Description (1) | | | | | | | | Value | |
| | | | | | | | | | | | | | |
| | | | COMMON STOCKS – 98.0% | | | | | | | | | | |
| | | | | |
| | | | Aerospace & Defense – 2.5% | | | | | | | | | | |
| | | | | |
| | 5,600 | | | Alliant Techsystems Inc. | | | | | | | | $ | 283,192 | |
| | | | | |
| | 800 | | | Boeing Company | | | | | | | | | 59,440 | |
| | | | | |
| | 17,000 | | | Exelis Inc. | | | | | | | | | 167,620 | |
| | | | | |
| | 10,200 | | | General Dynamics Corporation | | | | | | | | | 672,792 | |
| | | | | |
| | 1,000 | | | Goodrich Corporation | | | | | | | | | 126,900 | |
| | | | | |
| | 64,650 | | | Honeywell International Inc. | | | | | | | | | 3,610,056 | |
| | | | | |
| | 700 | | | Huntington Ingalls Industries Inc., (2) | | | | | | | | | 28,168 | |
| | | | | |
| | 4,900 | | | L-3 Communications Holdings, Inc. | | | | | | | | | 362,649 | |
| | | | | |
| | 8,900 | | | Northrop Grumman Corporation | | | | | | | | | 567,731 | |
| | | | | |
| | 9,600 | | | Raytheon Company | | | | | | | | | 543,264 | |
| | | | | |
| | 35,738 | | | Textron Inc. | | | | | | | | | 888,804 | |
| | | | | |
| | 400 | | | TransDigm Group Inc., (2) | | | | | | | | | 53,720 | |
| | | | Total Aerospace & Defense | | | | | | | | | 7,364,336 | |
| | | | Air Freight & Logistics – 0.0% | | | | | | | | | | |
| | | | | |
| | 300 | | | FedEx Corporation | | | | | | | | | 27,483 | |
| | | | Airlines – 0.1% | | | | | | | | | | |
| | | | | |
| | 15,700 | | | Delta Air Lines, Inc., (2) | | | | | | | | | 171,915 | |
| | | | | |
| | 16,300 | | | Southwest Airlines Co. | | | | | | | | | 150,286 | |
| | | | | |
| | 700 | | | United Continental Holdings Inc., (2) | | | | | | | | | 17,031 | |
| | | | Total Airlines | | | | | | | | | 339,232 | |
| | | | Apparel, Accessories & Luxury Goods – 0.2% | | | | | | | | | | |
| | | | | |
| | 9,571 | | | PVH Corporation | | | | | | | | | 744,528 | |
| | | | Auto Components – 0.8% | | | | | | | | | | |
| | | | | |
| | 91,000 | | | Johnson Controls, Inc. | | | | | | | | | 2,521,610 | |
| | | | Automobiles – 0.2% | | | | | | | | | | |
| | | | | |
| | 26,900 | | | Ford Motor Company | | | | | | | | | 257,971 | |
| | | | | |
| | 10,600 | | | General Motors Company, (2) | | | | | | | | | 209,032 | |
| | | | Total Automobiles | | | | | | | | | 467,003 | |
| | | | Beverages – 0.5% | | | | | | | | | | |
| | | | | |
| | 17,800 | | | Coca-Cola Company | | | | | | | | | 1,391,782 | |
| | | | | |
| | 2,300 | | | Constellation Brands, Inc., Class A, (2) | | | | | | | | | 62,238 | |
| | | | Total Beverages | | | | | | | | | 1,454,020 | |
| | | | Biotechnology – 0.8% | | | | | | | | | | |
| | | | | |
| | 32,230 | | | Amgen Inc. | | | | | | | | | 2,354,079 | |
| | | | | |
| | 400 | | | Biogen Idec Inc., (2) | | | | | | | | | 57,752 | |
| | | | | |
| | 500 | | | Celgene Corporation, (2) | | | | | | | | | 32,080 | |
| | | | Total Biotechnology | | | | | | | | | 2,443,911 | |
| | | | Capital Markets – 2.1% | | | | | | | | | | |
| | | | | |
| | 13,370 | | | Affiliated Managers Group Inc., (2) | | | | | | | | | 1,463,347 | |
| | | | | |
| | 55,158 | | | American Capital Limited, (2) | | | | | | | | | 555,441 | |
| | | | | |
| | 28,894 | | | Ameriprise Financial, Inc. | | | | | | | | | 1,510,000 | |
| | | | | |
| | 23,000 | | | Bank of New York Company, Inc. | | | | | | | | | 504,850 | |
| | | | | |
| | 5,225 | | | BlackRock Inc. | | | | | | | | | 887,310 | |
| | | | | |
| | 3,600 | | | E*Trade Group Inc., (2) | | | | | | | | | 28,944 | |
| | | | | | | | | | | | | | |
| Shares | | | Description (1) | | | | | | | | Value | |
| | | | | | | | | | | | | | |
| | | | Capital Markets (continued) | | | | | | | | | | |
| | | | | |
| | 7,400 | | | Goldman Sachs Group, Inc. | | | | | | | | $ | 709,364 | |
| | | | | |
| | 1,700 | | | Invesco LTD | | | | | | | | | 38,420 | |
| | | | | |
| | 1,900 | | | Jefferies Group, Inc. | | | | | | | | | 24,681 | |
| | | | | |
| | 21,900 | | | Morgan Stanley | | | | | | | | | 319,521 | |
| | | | | |
| | 2,100 | | | Northern Trust Corporation | | | | | | | | | 96,642 | |
| | | | | |
| | 4,000 | | | State Street Corporation | | | | | | | | | 178,560 | |
| | | | Total Capital Markets | | | | | | | | | 6,317,080 | |
| | | | Chemicals – 1.8% | | | | | | | | | | |
| | | | | |
| | 3,623 | | | CF Industries Holdings, Inc. | | | | | | | | | 701,920 | |
| | | | | |
| | 11,200 | | | Dow Chemical Company | | | | | | | | | 352,800 | |
| | | | | |
| | 36,289 | | | LyondellBasell Industries NV | | | | | | | | | 1,461,358 | |
| | | | | |
| | 35,550 | | | Monsanto Company | | | | | | | | | 2,942,829 | |
| | | | Total Chemicals | | | | | | | | | 5,458,907 | |
| | | | Commercial & Professional Services – 0.1% | | | | | | | | | | |
| | | | | |
| | 7,000 | | | Corrections Corporation of America | | | | | | | | | 206,150 | |
| | | | Commercial Banks – 5.7% | | | | | | | | | | |
| | | | | |
| | 10,500 | | | Associated Banc-Corp. | | | | | | | | | 138,495 | |
| | | | | |
| | 86,250 | | | BB&T Corporation | | | | | | | | | 2,660,813 | |
| | | | | |
| | 9,600 | | | CIT Group Inc., (2) | | | | | | | | | 342,144 | |
| | | | | |
| | 1,600 | | | Comerica Incorporated | | | | | | | | | 49,136 | |
| | | | | |
| | 22,400 | | | Fifth Third Bancorp. | | | | | | | | | 300,160 | |
| | | | | |
| | 2,800 | | | First Citizens Bancshs Inc. | | | | | | | | | 466,620 | |
| | | | | |
| | 98,950 | | | First Niagara Financial Group Inc. | | | | | | | | | 756,968 | |
| | | | | |
| | 10,300 | | | First Republic Bank of San Francisco, (2) | | | | | | | | | 346,080 | |
| | | | | |
| | 2,800 | | | Fulton Financial Corporation | | | | | | | | | 27,972 | |
| | | | | |
| | 12,100 | | | Huntington BancShares Inc. | | | | | | | | | 77,440 | |
| | | | | |
| | 173,640 | | | KeyCorp. | | | | | | | | | 1,343,974 | |
| | | | | |
| | 1,800 | | | M&T Bank Corporation | | | | | | | | | 148,626 | |
| | | | | |
| | 9,600 | | | PNC Financial Services Group, Inc. | | | | | | | | | 586,656 | |
| | | | | |
| | 3,920 | | | Popular Inc., (2) | | | | | | | | | 65,111 | |
| | | | | |
| | 19,800 | | | Regions Financial Corporation | | | | | | | | | 133,650 | |
| | | | | |
| | 7,600 | | | SunTrust Banks, Inc. | | | | | | | | | 184,148 | |
| | | | | |
| | 6,800 | | | TCF Financial Corporation | | | | | | | | | 78,064 | |
| | | | | |
| | 50,830 | | | U.S. Bancorp | | | | | | | | | 1,634,693 | |
| | | | | |
| | 231,943 | | | Wells Fargo & Company | | | | | | | | | 7,756,173 | |
| | | | Total Commercial Banks | | | | | | | | | 17,096,923 | |
| | | | Commercial Services & Supplies – 0.2% | | | | | | | | | | |
| | | | | |
| | 8,700 | | | Cintas Corporation | | | | | | | | | 335,907 | |
| | | | | |
| | 10,300 | | | Copart Inc., (2) | | | | | | | | | 244,007 | |
| | | | Total Commercial Services & Supplies | | | | | | | | | 579,914 | |
| | | | Communication Equipment – 2.1% | | | | | | | | | | |
| | | | | |
| | 246,200 | | | Cisco Systems, Inc. | | | | | | | | | 4,227,254 | |
| | | | | |
| | 3,800 | | | Echostar Holding Corporation, Class A, (2) | | | | | | | | | 100,396 | |
| | | | | |
| | 1,200 | | | Harris Corporation | | | | | | | | | 50,220 | |
| | | | | |
| | 5,000 | | | JDS Uniphase Corporation, (2) | | | | | | | | | 55,000 | |
Portfolio of Investments
Nuveen Multi-Manager Large-Cap Value Fund (continued)
June 30, 2012
| | | | | | | | | | | | | | |
| Shares | | | Description (1) | | | | | | | | Value | |
| | | | | | | | | | | | | | |
| | | | Communication Equipment (continued) | | | | | | | | | | |
| | | | | |
| | 35,245 | | | Motorola Solutions Inc. | | | | | | | | $ | 1,695,637 | |
| | | | | |
| | 1,600 | | | QUALCOMM, Inc. | | | | | | | | | 89,088 | |
| | | | | |
| | 51,800 | | | Tellabs Inc. | | | | | | | | | 172,494 | |
| | | | Total Communication Equipment | | | | | | | | | 6,390,089 | |
| | | | Computers & Peripherals – 1.5% | | | | | | | | | | |
| | | | | |
| | 4,100 | | | Apple, Inc., (2) | | | | | | | | | 2,394,400 | |
| | | | | |
| | 97,289 | | | Dell Inc., (2) | | | | | | | | | 1,218,058 | |
| | | | | |
| | 27,900 | | | Hewlett-Packard Company | | | | | | | | | 561,069 | |
| | | | | |
| | 2,700 | | | NCR Corporation, (2) | | | | | | | | | 61,371 | |
| | | | | |
| | 4,300 | | | SanDisk Corporation, (2) | | | | | | | | | 156,864 | |
| | | | | |
| | 2,700 | | | Western Digital Corporation, (2) | | | | | | | | | 82,296 | |
| | | | Total Computers & Peripherals | | | | | | | | | 4,474,058 | |
| | | | Consumer Finance – 2.1% | | | | | | | | | | |
| | | | | |
| | 8,800 | | | American Express Company | | | | | | | | | 512,248 | |
| | | | | |
| | 93,470 | | | Capital One Financial Corporation | | | | | | | | | 5,109,070 | |
| | | | | |
| | 11,100 | | | Discover Financial Services | | | | | | | | | 383,838 | |
| | | | | |
| | 14,700 | | | SLM Corporation | | | | | | | | | 230,937 | |
| | | | Total Consumer Finance | | | | | | | | | 6,236,093 | |
| | | | Containers & Packaging – 0.4% | | | | | | | | | | |
| | | | | |
| | 59,121 | | | Owens-Illinois, Inc., (2) | | | | | | | | | 1,133,350 | |
| | | | Diversified Consumer Services – 0.1% | | | | | | | | | | |
| | | | | |
| | 1,100 | | | Apollo Group, Inc., (2) | | | | | | | | | 39,809 | |
| | | | | |
| | 5,700 | | | Career Education Corporation, (2) | | | | | | | | | 38,133 | |
| | | | | |
| | 2,700 | | | Devry, Inc. | | | | | | | | | 83,619 | |
| | | | | |
| | 4,700 | | | Education Management Corporation, (2) | | | | | | | | | 32,665 | |
| | | | Total Diversified Consumer Services | | | | | | | | | 194,226 | |
| | | | Diversified Financial Services – 4.4% | | | | | | | | | | |
| | | | | |
| | 147,500 | | | Bank of America Corporation | | | | | | | | | 1,206,550 | |
| | | | | |
| | 233,876 | | | Citigroup Inc. | | | | | | | | | 6,410,541 | |
| | | | | |
| | 4,200 | | | CME Group, Inc. | | | | | | | | | 1,126,062 | |
| | | | | |
| | 128,650 | | | JP Morgan Chase & Co. | | | | | | | | | 4,596,665 | |
| | | | | |
| | 800 | | | Leucadia National Corporation | | | | | | | | | 17,016 | |
| | | | Total Diversified Financial Services | | | | | | | | | 13,356,834 | |
| | | | Diversified REIT – 0.2% | | | | | | | | | | |
| | | | | |
| | 7,600 | | | Vornado Realty Trust | | | | | | | | | 638,248 | |
| | | | Diversified Telecommunication Services – 3.3% | | | | | | | | | | |
| | | | | |
| | 85,500 | | | AT&T Inc. | | | | | | | | | 3,048,930 | |
| | | | | |
| | 55,750 | | | BCE INC. | | | | | | | | | 2,296,900 | |
| | | | | |
| | 11,100 | | | CenturyLink Inc. | | | | | | | | | 438,339 | |
| | | | | |
| | 1,900 | | | Level 3 Communications Inc., (2) | | | | | | | | | 42,085 | |
| | | | | |
| | 8,300 | | | TW Telecom Inc., (2) | | | | | | | | | 212,978 | |
| | | | | |
| | 87,399 | | | Verizon Communications Inc. | | | | | | | | | 3,884,012 | |
| | | | | |
| | 6,200 | | | Windstream Corporation | | | | | | | | | 59,892 | |
| | | | Total Diversified Telecommunication Services | | | | | | | | | 9,983,136 | |
| | | | | | | | | | | | | | |
| Shares | | | Description (1) | | | | | | | | Value | |
| | | | | | | | | | | | | | |
| | | | Electric Utilities – 1.7% | | | | | | | | | | |
| | | | | |
| | 4,400 | | | American Electric Power Company, Inc. | | | | | | | | $ | 175,560 | |
| | | | | |
| | 82,207 | | | Duke Energy Corporation, (2) | | | | | | | | | 1,895,693 | |
| | | | | |
| | 6,600 | | | Edison International | | | | | | | | | 304,920 | |
| | | | | |
| | 2,500 | | | Entergy Corporation | | | | | | | | | 169,725 | |
| | | | | |
| | 7,300 | | | Exelon Corporation | | | | | | | | | 274,626 | |
| | | | | |
| | 900 | | | FirstEnergy Corp. | | | | | | | | | 44,271 | |
| | | | | |
| | 2,500 | | | NextEra Energy Inc. | | | | | | | | | 172,025 | |
| | | | | |
| | 8,400 | | | NV Energy Inc. | | | | | | | | | 147,672 | |
| | | | | |
| | 1,500 | | | Pinnacle West Capital Corporation | | | | | | | | | 77,610 | |
| | | | | |
| | 2,500 | | | Progress Energy, Inc. | | | | | | | | | 150,425 | |
| | | | | |
| | 34,354 | | | Southern Company | | | | | | | | | 1,590,590 | |
| | | | Total Electric Utilities | | | | | | | | | 5,003,117 | |
| | | | Electronic Components – 0.5% | | | | | | | | | | |
| | | | | |
| | 2,700 | | | Amphenol Corporation, Class A | | | | | | | | | 148,284 | |
| | | | | |
| | 22,600 | | | AVX Group | | | | | | | | | 241,594 | |
| | | | | |
| | 83,606 | | | Corning Incorporated | | | | | | | | | 1,081,026 | |
| | | | | |
| | 1,100 | | | Dolby Laboratories, Inc., (2) | | | | | | | | | 45,430 | |
| | | | | |
| | 5,700 | | | Vishay Intertechnology Inc., (2) | | | | | | | | | 53,751 | |
| | | | Total Electronic Components | | | | | | | | | 1,570,085 | |
| | | | Electronic Equipment & Instruments – 0.4% | | | | | | | | | | |
| | | | | |
| | 6,800 | | | Arrow Electronics, Inc., (2) | | | | | | | | | 223,108 | |
| | | | | |
| | 10,200 | | | Avnet Inc., (2) | | | | | | | | | 314,772 | |
| | | | | |
| | 2,400 | | | FLIR Systems Inc. | | | | | | | | | 46,800 | |
| | | | | |
| | 5,800 | | | Ingram Micro, Inc., Class A, (2) | | | | | | | | | 101,326 | |
| | | | | |
| | 1,600 | | | Itron Inc., (2) | | | | | | | | | 65,984 | |
| | | | | |
| | 6,000 | | | Jabil Circuit Inc. | | | | | | | | | 121,980 | |
| | | | | |
| | 7,300 | | | TE Connectivity Limited | | | | | | | | | 232,943 | |
| | | | | |
| | 1,500 | | | Trimble Navigation Limited, (2) | | | | | | | | | 69,015 | |
| | | | Total Electronic Equipment & Instruments | | | | | | | | | 1,175,928 | |
| | | | Energy Equipment & Services – 1.0% | | | | | | | | | | |
| | | | | |
| | 4,700 | | | Baker Hughes Incorporated | | | | | | | | | 193,170 | |
| | | | | |
| | 28,596 | | | Halliburton Company | | | | | | | | | 811,840 | |
| | | | | |
| | 4,000 | | | Nabors Industries Inc., (2) | | | | | | | | | 57,600 | |
| | | | | |
| | 26,480 | | | National-Oilwell Varco Inc. | | | | | | | | | 1,706,371 | |
| | | | | |
| | 1,900 | | | Patterson-UTI Energy, Inc. | | | | | | | | | 27,664 | |
| | | | | |
| | 400 | | | SeaCor Smit Inc., (2) | | | | | | | | | 35,752 | |
| | | | | |
| | 2,300 | | | Unit Corporation, (2) | | | | | | | | | 84,847 | |
| | | | Total Energy Equipment & Services | | | | | | | | | 2,917,244 | |
| | | | Food & Staples Retailing – 0.6% | | | | | | | | | | |
| | | | | |
| | 34,140 | | | CVS Caremark Corporation | | | | | | | | | 1,595,362 | |
| | | | | |
| | 3,000 | | | Wal-Mart Stores, Inc. | | | | | | | | | 209,160 | |
| | | | Total Food & Staples Retailing | | | | | | | | | 1,804,522 | |
| | | | Food Products – 2.1% | | | | | | | | | | |
| | | | | |
| | 75,000 | | | Archer-Daniels-Midland Company | | | | | | | | | 2,214,000 | |
| | | | | |
| | 2,500 | | | Dean Foods Company, (2) | | | | | | | | | 42,575 | |
Portfolio of Investments
Nuveen Multi-Manager Large-Cap Value Fund (continued)
June 30, 2012
| | | | | | | | | | | | | | |
| Shares | | | Description (1) | | | | | | | | Value | |
| | | | | | | | | | | | | | |
| | | | Food Products (continued) | | | | | | | | | | |
| | | | | |
| | 15,821 | | | Hershey Foods Corporation | | | | | | | | $ | 1,139,587 | |
| | | | | |
| | 69,491 | | | Kraft Foods Inc. | | | | | | | | | 2,683,742 | |
| | | | | |
| | 4,200 | | | Tyson Foods, Inc., Class A | | | | | | | | | 79,086 | |
| | | | Total Food Products | | | | | | | | | 6,158,990 | |
| | | | Health Care Equipment & Supplies – 1.6% | | | | | | | | | | |
| | | | | |
| | 4,100 | | | Alere Inc., (2) | | | | | | | | | 79,704 | |
| | | | | |
| | 2,500 | | | Baxter International, Inc. | | | | | | | | | 132,875 | |
| | | | | |
| | 2,000 | | | Becton, Dickinson and Company | | | | | | | | | 149,500 | |
| | | | | |
| | 30,100 | | | Boston Scientific Corporation, (2) | | | | | | | | | 170,667 | |
| | | | | |
| | 1,400 | | | C. R. Bard, Inc. | | | | | | | | | 150,416 | |
| | | | | |
| | 6,500 | | | CareFusion Corporation, (2) | | | | | | | | | 166,920 | |
| | | | | |
| | 1,400 | | | Cooper Companies, Inc. | | | | | | | | | 111,664 | |
| | | | | |
| | 46,900 | | | Covidien PLC | | | | | | | | | 2,509,150 | |
| | | | | |
| | 600 | | | Gen-Probe, Inc., (2) | | | | | | | | | 49,320 | |
| | | | | |
| | 5,600 | | | Hill Rom Holdings Inc. | | | | | | | | | 172,760 | |
| | | | | |
| | 3,700 | | | Hologic Inc., (2) | | | | | | | | | 66,748 | |
| | | | | |
| | 8,500 | | | Medtronic, Inc. | | | | | | | | | 329,205 | |
| | | | | |
| | 4,500 | | | Stryker Corporation | | | | | | | | | 247,950 | |
| | | | | |
| | 1,700 | | | Teleflex Inc. | | | | | | | | | 103,547 | |
| | | | | |
| | 900 | | | Thoratec Corporation, (2) | | | | | | | | | 30,222 | |
| | | | | |
| | 4,500 | | | Zimmer Holdings, Inc. | | | | | | | | | 289,620 | |
| | | | Total Health Care Equipment & Supplies | | | | | | | | | 4,760,268 | |
| | | | Health Care Providers & Services – 2.9% | | | | | | | | | | |
| | | | | |
| | 5,700 | | | AmerisourceBergen Corporation | | | | | | | | | 224,295 | |
| | | | | |
| | 7,700 | | | Cardinal Health, Inc. | | | | | | | | | 323,400 | |
| | | | | |
| | 4,000 | | | CIGNA Corporation | | | | | | | | | 176,000 | |
| | | | | |
| | 50,468 | | | HCA Holdings Inc., (2) | | | | | | | | | 1,535,741 | |
| | | | | |
| | 2,400 | | | Henry Schein Inc., (2) | | | | | | | | | 188,376 | |
| | | | | |
| | 31,282 | | | McKesson HBOC Inc. | | | | | | | | | 2,932,688 | |
| | | | | |
| | 2,900 | | | Patterson Companies, Inc. | | | | | | | | | 99,963 | |
| | | | | |
| | 51,700 | | | UnitedHealth Group Incorporated | | | | | | | | | 3,024,450 | |
| | | | | |
| | 3,300 | | | Wellpoint Inc. | | | | | | | | | 210,507 | |
| | | | Total Health Care Providers & Services | | | | | | | | | 8,715,420 | |
| | | | Hotels, Restaurants & Leisure – 0.4% | | | | | | | | | | |
| | | | | |
| | 82,337 | | | International Game Technology | | | | | | | | | 1,296,808 | |
| | | | Household Products – 1.5% | | | | | | | | | | |
| | | | | |
| | 600 | | | Clorox Company | | | | | | | | | 43,476 | |
| | | | | |
| | 71,250 | | | Procter & Gamble Company | | | | | | | | | 4,364,063 | |
| | | | Total Household Products | | | | | | | | | 4,407,539 | |
| | | | Independent Power Producers & Energy Traders – 0.1% | | | | | | | | | | |
| | | | | |
| | 9,200 | | | AES Corporation, (2) | | | | | | | | | 118,036 | |
| | | | | |
| | 8,200 | | | Calpine Corporation, (2) | | | | | | | | | 135,382 | |
| | | | | |
| | 16,000 | | | GenOn Energy Inc., (2) | | | | | | | | | 27,360 | |
| | | | | |
| | 7,000 | | | NRG Energy Inc., (2) | | | | | | | | | 121,520 | |
| | | | Total Independent Power Producers & Energy Traders | | | | | | | | | 402,298 | |
| | | | | | | | | | | | | | |
| Shares | | | Description (1) | | | | | | | | Value | |
| | | | | | | | | | | | | | |
| | | | Industrial Conglomerates – 3.5% | | | | | | | | | | |
| | | | | |
| | 4,800 | | | Danaher Corporation | | | | | | | | $ | 249,984 | |
| | | | | |
| | 379,361 | | | General Electric Company | | | | | | | | | 7,905,882 | |
| | | | | |
| | 45,551 | | | Tyco International Ltd. | | | | | | | | | 2,407,370 | |
| | | | Total Industrial Conglomerates | | | | | | | | | 10,563,236 | |
| | | | Industrial REIT – 0.1% | | | | | | | | | | |
| | | | | |
| | 8,500 | | | Prologis Inc. | | | | | | | | | 282,455 | |
| | | | Insurance – 6.9% | | | | | | | | | | |
| | | | | |
| | 35,550 | | | Ace Limited | | | | | | | | | 2,635,322 | |
| | | | | |
| | 39,642 | | | AFLAC Incorporated | | | | | | | | | 1,688,353 | |
| | | | | |
| | 900 | | | Alleghany Corporation, Term Loan, (2) | | | | | | | | | 305,775 | |
| | | | | |
| | 44,718 | | | Allstate Corporation | | | | | | | | | 1,569,155 | |
| | | | | |
| | 3,300 | | | American Financial Group Inc. | | | | | | | | | 129,459 | |
| | | | | |
| | 39,626 | | | American International Group, (2) | | | | | | | | | 1,271,598 | |
| | | | | |
| | 9,500 | | | AON PLC | | | | | | | | | 444,410 | |
| | | | | |
| | 3,500 | | | Arthur J. Gallagher & Co. | | | | | | | | | 122,745 | |
| | | | | |
| | 22,400 | | | Berkshire Hathaway Inc., Class B, (2) | | | | | | | | | 1,866,592 | |
| | | | | |
| | 4,100 | | | Brown & Brown Inc. | | | | | | | | | 111,807 | |
| | | | | |
| | 16,529 | | | Chubb Corporation | | | | | | | | | 1,203,642 | |
| | | | | |
| | 2,900 | | | CNA Financial Corporation | | | | | | | | | 80,388 | |
| | | | | |
| | 6,200 | | | Fidelity National Title Group Inc., Class A | | | | | | | | | 119,412 | |
| | | | | |
| | 12,100 | | | Genworth Financial Inc., Class A, (2) | | | | | | | | | 68,486 | |
| | | | | |
| | 2,500 | | | Hanover Insurance Group Inc. | | | | | | | | | 97,825 | |
| | | | | |
| | 6,200 | | | Hartford Financial Services Group, Inc. | | | | | | | | | 109,306 | |
| | | | | |
| | 4,100 | | | HCC Insurance Holdings Inc. | | | | | | | | | 128,740 | |
| | | | | |
| | 2,800 | | | Kemper Corporation | | | | | | | | | 86,100 | |
| | | | | |
| | 1,800 | | | Lincoln National Corporation | | | | | | | | | 39,366 | |
| | | | | |
| | 13,600 | | | Loews Corporation | | | | | | | | | 556,376 | |
| | | | | |
| | 500 | | | Markel Corporation, (2) | | | | | | | | | 220,850 | |
| | | | | |
| | 9,900 | | | Marsh & McLennan Companies, Inc. | | | | | | | | | 319,077 | |
| | | | | |
| | 2,900 | | | Mercury General Corporation | | | | | | | | | 120,843 | |
| | | | | |
| | 53,250 | | | MetLife, Inc. | | | | | | | | | 1,642,763 | |
| | | | | |
| | 2,600 | | | Progressive Corporation | | | | | | | | | 54,158 | |
| | | | | |
| | 29,708 | | | Prudential Financial, Inc. | | | | | | | | | 1,438,758 | |
| | | | | |
| | 7,900 | | | Reinsurance Group of America Inc. | | | | | | | | | 420,359 | |
| | | | | |
| | 32,016 | | | Torchmark Corporation | | | | | | | | | 1,618,409 | |
| | | | | |
| | 4,100 | | | Travelers Companies, Inc. | | | | | | | | | 261,744 | |
| | | | | |
| | 8,300 | | | Unum Group | | | | | | | | | 158,779 | |
| | | | | |
| | 3,800 | | | WR Berkley Corporation | | | | | | | | | 147,896 | |
| | | | | |
| | 87,664 | | | XL Capital Ltd, Class A | | | | | | | | | 1,844,451 | |
| | | | Total Insurance | | | | | | | | | 20,882,944 | |
| | | | Internet & Catalog Retail – 0.5% | | | | | | | | | | |
| | | | | |
| | 27,779 | | | Expedia, Inc. | | | | | | | | | 1,335,337 | |
| | | | | |
| | 4,200 | | | Liberty Media Holding Corporation Interactive, Class A, (2) | | | | | | | | | 74,718 | |
| | | | Total Internet & Catalog Retail | | | | | | | | | 1,410,055 | |
Portfolio of Investments
Nuveen Multi-Manager Large-Cap Value Fund (continued)
June 30, 2012
| | | | | | | | | | | | | | |
| Shares | | | Description (1) | | | | | | | | Value | |
| | | | | | | | | | | | | | |
| | | | Internet Software & Services – 1.5% | | | | | | | | | | |
| | | | | |
| | 57,332 | | | eBay Inc., (2) | | | | | | | | $ | 2,408,517 | |
| | | | | |
| | 3,600 | | | IAC/InterActiveCorp. | | | | | | | | | 164,160 | |
| | | | | |
| | 400 | | | VeriSign, Inc., (2) | | | | | | | | | 17,428 | |
| | | | | |
| | 112,586 | | | Yahoo! Inc., (2) | | | | | | | | | 1,782,236 | |
| | | | Total Internet Software & Services | | | | | | | | | 4,372,341 | |
| | | | IT Services – 1.9% | | | | | | | | | | |
| | | | | |
| | 18,400 | | | Amdocs Limited | | | | | | | | | 546,848 | |
| | | | | |
| | 1,700 | | | Automatic Data Processing, Inc. | | | | | | | | | 94,622 | |
| | | | | |
| | 9,000 | | | Booz Allen Hamilton Holding | | | | | | | | | 137,520 | |
| | | | | |
| | 5,000 | | | Broadridge Financial Solutions, Inc. | | | | | | | | | 106,350 | |
| | | | | |
| | 1,000 | | | Cognizant Technology Solutions Corporation, Class A, (2) | | | | | | | | | 60,000 | |
| | | | | |
| | 2,100 | | | Computer Sciences Corporation | | | | | | | | | 52,122 | |
| | | | | |
| | 10,700 | | | CoreLogic Inc., (2) | | | | | | | | | 195,917 | |
| | | | | |
| | 3,400 | | | DST Systems Inc. | | | | | | | | | 184,654 | |
| | | | | |
| | 6,800 | | | Fidelity National Information Services | | | | | | | | | 231,744 | |
| | | | | |
| | 5,200 | | | Fiserv, Inc., (2) | | | | | | | | | 375,544 | |
| | | | | |
| | 400 | | | Paychex, Inc. | | | | | | | | | 12,564 | |
| | | | | |
| | 20,800 | | | SAIC, Inc. | | | | | | | | | 252,096 | |
| | | | | |
| | 5,900 | | | Total System Services Inc. | | | | | | | | | 141,187 | |
| | | | | |
| | 14,975 | | | Visa Inc. | | | | | | | | | 1,851,359 | |
| | | | | |
| | 78,800 | | | Western Union Company | | | | | | | | | 1,326,992 | |
| | | | Total IT Services | | | | | | | | | 5,569,519 | |
| | | | Life Sciences Tools & Services – 0.5% | | | | | | | | | | |
| | | | | |
| | 1,800 | | | Agilent Technologies, Inc. | | | | | | | | | 70,632 | |
| | | | | |
| | 2,400 | | | Bio-Rad Laboratories Inc., (2) | | | | | | | | | 240,024 | |
| | | | | |
| | 3,600 | | | Charles River Laboratories International, Inc., (2) | | | | | | | | | 117,936 | |
| | | | | |
| | 2,300 | | | Life Technologies Corporation, (2) | | | | | | | | | 103,477 | |
| | | | | |
| | 500 | | | Mettler-Toledo International Inc., (2) | | | | | | | | | 77,925 | |
| | | | | |
| | 4,300 | | | Perkinelmer Inc. | | | | | | | | | 110,940 | |
| | | | | |
| | 2,500 | | | Techne Corporation | | | | | | | | | 185,500 | |
| | | | | |
| | 9,500 | | | Thermo Fisher Scientific, Inc. | | | | | | | | | 493,145 | |
| | | | | |
| | 700 | | | Waters Corporation, (2) | | | | | | | | | 55,629 | |
| | | | Total Life Sciences Tools & Services | | | | | | | | | 1,455,208 | |
| | | | Machinery – 1.6% | | | | | | | | | | |
| | | | | |
| | 9,264 | | | Caterpillar Inc. | | | | | | | | | 786,606 | |
| | | | | |
| | 13,900 | | | Cummins Inc. | | | | | | | | | 1,347,049 | |
| | | | | |
| | 33,385 | | | Harsco Corporation | | | | | | | | | 680,386 | |
| | | | | |
| | 27,615 | | | Ingersoll Rand Company Limited, Class A | | | | | | | | | 1,164,801 | |
| | | | | |
| | 500 | | | Navistar International Corporation, (2) | | | | | | | | | 14,185 | |
| | | | | |
| | 10,300 | | | Stanley Black & Decker Inc. | | | | | | | | | 662,908 | |
| | | | Total Machinery | | | | | | | | | 4,655,935 | |
| | | | Media – 3.8% | | | | | | | | | | |
| | | | | |
| | 600 | | | CBS Corporation, Class B | | | | | | | | | 19,668 | |
| | | | | |
| | 600 | | | Charter Communications, Inc., Class A, (2) | | | | | | | | | 42,522 | |
| | | | | |
| | 52,613 | | | Comcast Corporation, Class A | | | | | | | | | 1,682,038 | |
| | | | | | | | | | | | | | |
| Shares | | | Description (1) | | | | | | | | Value | |
| | | | | | | | | | | | | | |
| | | | Media (continued) | | | | | | | | | | |
| | | | | |
| | 8,300 | | | Interpublic Group Companies, Inc. | | | | | | | | $ | 90,055 | |
| | | | | |
| | 25,700 | | | News Corporation, Class A | | | | | | | | | 572,853 | |
| | | | | |
| | 2,700 | | | Omnicom Group, Inc. | | | | | | | | | 131,220 | |
| | | | | |
| | 5,000 | | | Thomson Corporation | | | | | | | | | 142,250 | |
| | | | | |
| | 131,500 | | | Time Warner Inc. | | | | | | | | | 5,062,750 | |
| | | | | |
| | 64,000 | | | Viacom Inc., Class B | | | | | | | | | 3,009,280 | |
| | | | | |
| | 12,500 | | | Walt Disney Company | | | | | | | | | 606,250 | |
| | | | Total Media | | | | | | | | | 11,358,886 | |
| | | | Metals & Mining – 0.9% | | | | | | | | | | |
| | | | | |
| | 55,250 | | | Barrick Gold Corporation | | | | | | | | | 2,075,743 | |
| | | | | |
| | 15,451 | | | Newmont Mining Corporation | | | | | | | | | 749,528 | |
| | | | Total Metals & Mining | | | | | | | | | 2,825,271 | |
| | | | Mortgage REIT – 0.2% | | | | | | | | | | |
| | | | | |
| | 9,500 | | | American Capital Agency Corporation | | | | | | | | | 319,295 | |
| | | | | |
| | 19,000 | | | Annaly Capital Management Inc. | | | | | | | | | 318,820 | |
| | | | | |
| | 39,800 | | | Chimera Investments Corporation | | | | | | | | | 93,928 | |
| | | | Total Mortgage REIT | | | | | | | | | 732,043 | |
| | | | Multiline Retail – 1.4% | | | | | | | | | | |
| | | | | |
| | 19,812 | | | Big Lots, Inc., (2) | | | | | | | | | 808,131 | |
| | | | | |
| | 37,207 | | | Macy’s, Inc. | | | | | | | | | 1,278,060 | |
| | | | | |
| | 36,136 | | | Target Corporation | | | | | | | | | 2,102,754 | |
| | | | Total Multiline Retail | | | | | | | | | 4,188,945 | |
| | | | Multi-Utilities – 0.4% | | | | | | | | | | |
| | | | | |
| | 1,600 | | | Alliant Energy Corporation | | | | | | | | | 72,912 | |
| | | | | |
| | 3,800 | | | Dominion Resources, Inc. | | | | | | | | | 205,200 | |
| | | | | |
| | 2,400 | | | DTE Energy Company | | | | | | | | | 142,392 | |
| | | | | |
| | 3,800 | | | PG&E Corporation | | | | | | | | | 172,026 | |
| | | | | |
| | 19,900 | | | Public Service Enterprise Group Incorporated | | | | | | | | | 646,750 | |
| | | | Total Multi-Utilities | | | | | | | | | 1,239,280 | |
| | | | Office Electronics – 0.5% | | | | | | | | | | |
| | | | | |
| | 204,115 | | | Xerox Corporation | | | | | | | | | 1,606,385 | |
| | | | | |
| | 1,000 | | | Zebra Technologies Corporation, Class A, (2) | | | | | | | | | 34,360 | |
| | | | Total Office Electronics | | | | | | | | | 1,640,745 | |
| | | | Office REIT – 0.2% | | | | | | | | | | |
| | | | | |
| | 4,600 | | | Alexandria Real Estate Equities Inc. | | | | | | | | | 334,512 | |
| | | | | |
| | 400 | | | Boston Properties, Inc. | | | | | | | | | 43,348 | |
| | | | | |
| | 4,500 | | | Corporate Office Properties | | | | | | | | | 105,795 | |
| | | | | |
| | 2,400 | | | SL Green Realty Corporation | | | | | | | | | 192,576 | |
| | | | Total Office REIT | | | | | | | | | 676,231 | |
| | | | Oil, Gas & Consumable Fuels – 11.5% | | | | | | | | | | |
| | | | | |
| | 6,900 | | | Anadarko Petroleum Corporation | | | | | | | | | 456,780 | |
| | | | | |
| | 16,359 | | | Apache Corporation | | | | | | | | | 1,437,793 | |
| | | | | |
| | 7,300 | | | Chesapeake Energy Corporation | | | | | | | | | 135,780 | |
| | | | | |
| | 27,800 | | | Chevron Corporation | | | | | | | | | 2,932,900 | |
| | | | | |
| | 900 | | | Cimarex Energy Company | | | | | | | | | 49,608 | |
| | | | | |
| | 21,700 | | | ConocoPhillips | | | | | | | | | 1,212,596 | |
Portfolio of Investments
Nuveen Multi-Manager Large-Cap Value Fund (continued)
June 30, 2012
| | | | | | | | | | | | | | |
| Shares | | | Description (1) | | | | | | | | Value | |
| | | | | | | | | | | | | | |
| | | | Oil, Gas & Consumable Fuels (continued) | | | | | | | | | | |
| | | | | |
| | 33,577 | | | Devon Energy Corporation | | | | | | | | $ | 1,947,130 | |
| | | | | |
| | 66,650 | | | EnCana Corporation | | | | | | | | | 1,388,320 | |
| | | | | |
| | 1,000 | | | Energen Corporation | | | | | | | | | 45,130 | |
| | | | | |
| | 100,743 | | | Exxon Mobil Corporation | | | | | | | | | 8,620,578 | |
| | | | | |
| | 7,600 | | | Hess Corporation | | | | | | | | | 330,220 | |
| | | | | |
| | 56,323 | | | Marathon Oil Corporation | | | | | | | | | 1,440,179 | |
| | | | | |
| | 48,909 | | | Marathon Petroleum Corporation | | | | | | | | | 2,196,992 | |
| | | | | |
| | 30,804 | | | Murphy Oil Corporation | | | | | | | | | 1,549,133 | |
| | | | | |
| | 4,100 | | | Newfield Exploration Company, (2) | | | | | | | | | 120,171 | |
| | | | | |
| | 2,000 | | | Noble Energy, Inc. | | | | | | | | | 169,640 | |
| | | | | |
| | 71,014 | | | Occidental Petroleum Corporation | | | | | | | | | 6,090,871 | |
| | | | | |
| | 45,775 | | | Phillips 66 | | | | | | | | | 1,521,561 | |
| | | | | |
| | 1,800 | | | Plains Exploration & Production Company, (2) | | | | | | | | | 63,324 | |
| | | | | |
| | 500 | | | QEP Resources Inc. | | | | | | | | | 14,985 | |
| | | | | |
| | 46,050 | | | Southwestern Energy Company, (2) | | | | | | | | | 1,470,377 | |
| | | | | |
| | 16,707 | | | Spectra Energy Corporation | | | | | | | | | 485,505 | |
| | | | | |
| | 400 | | | Tesoro Corporation, (2) | | | | | | | | | 9,984 | |
| | | | | |
| | 13,200 | | | Valero Energy Corporation | | | | | | | | | 318,780 | |
| | | | | |
| | 5,500 | | | Williams Companies, Inc. | | | | | | | | | 158,510 | |
| | | | | |
| | 30,437 | | | WPX Energy Inc., (2) | | | | | | | | | 492,471 | |
| | | | Total Oil, Gas & Consumable Fuels | | | | | | | | | 34,659,318 | |
| | | | Paper & Forest Products – 0.3% | | | | | | | | | | |
| | | | | |
| | 25,991 | | | International Paper Company | | | | | | | | | 751,400 | |
| | | | Pharmaceuticals – 10.3% | | | | | | | | | | |
| | | | | |
| | 3,000 | | | Abbott Laboratories | | | | | | | | | 193,410 | |
| | | | | |
| | 800 | | | Allergan, Inc. | | | | | | | | | 74,056 | |
| | | | | |
| | 69,297 | | | Bristol-Myers Squibb Company | | | | | | | | | 2,491,227 | |
| | | | | |
| | 12,900 | | | Eli Lilly and Company | | | | | | | | | 553,539 | |
| | | | | |
| | 4,200 | | | Endo Pharmaceuticals Holdings Inc., (2) | | | | | | | | | 130,116 | |
| | | | | |
| | 3,700 | | | Forest Laboratories, Inc., (2) | | | | | | | | | 129,463 | |
| | | | | |
| | 400 | | | Hospira Inc., (2) | | | | | | | | | 13,992 | |
| | | | | |
| | 107,087 | | | Johnson & Johnson | | | | | | | | | 7,234,798 | |
| | | | | |
| | 178,348 | | | Merck & Company Inc. | | | | | | | | | 7,446,028 | |
| | | | | |
| | 4,500 | | | Mylan Laboratories Inc., (2) | | | | | | | | | 96,165 | |
| | | | | |
| | 11,100 | | | Novartis AG, Sponsored ADR | | | | | | | | | 620,490 | |
| | | | | |
| | 700 | | | Perrigo Company | | | | | | | | | 82,551 | |
| | | | | |
| | 388,449 | | | Pfizer Inc. | | | | | | | | | 8,934,325 | |
| | | | | |
| | 28,150 | | | Sanofi-Aventis | | | | | | | | | 1,063,507 | |
| | | | | |
| | 6,300 | | | Warner Chilcott Limited, (2) | | | | | | | | | 112,896 | |
| | | | | |
| | 23,142 | | | Watson Pharmaceuticals Inc., (2) | | | | | | | | | 1,712,277 | |
| | | | Total Pharmaceuticals | | | | | | | | | 30,888,840 | |
| | | | Professional Services – 0.3% | | | | | | | | | | |
| | | | | |
| | 700 | | | Dun and Bradstreet Inc. | | | | | | | | | 49,819 | |
| | | | | |
| | 3,400 | | | Equifax Inc. | | | | | | | | | 158,440 | |
| | | | | |
| | 5,000 | | | Manpower Inc. | | | | | | | | | 183,250 | |
| | | | | | | | | | | | | | |
| Shares | | | Description (1) | | | | | | | | Value | |
| | | | | | | | | | | | | | |
| | | | | | | | | | | | | | |
| | | | | |
| | 3,900 | | | Nielsen Holdings BV, (2) | | | | | | | | $ | 102,258 | |
| | | | | |
| | 4,800 | | | Robert Half International Inc. | | | | | | | | | 137,136 | |
| | | | | |
| | 1,600 | | | Towers Watson & Company, Class A Shares | | | | | | | | | 95,840 | |
| | | | | |
| | 4,900 | | | Verisk Analytics Inc, Class A Shares, (2) | | | | | | | | | 241,374 | |
| | | | Total Professional Services | | | | | | | | | 968,117 | |
| | | | Residential REIT – 0.8% | | | | | | | | | | |
| | | | | |
| | 1,400 | | | AvalonBay Communities, Inc. | | | | | | | | | 198,072 | |
| | | | | |
| | 2,700 | | | BRE Properties, Inc. | | | | | | | | | 135,054 | |
| | | | | |
| | 22,482 | | | Camden Property Trust | | | | | | | | | 1,521,357 | |
| | | | | |
| | 7,300 | | | Equity Residential | | | | | | | | | 455,228 | |
| | | | Total Residential REIT | | | | | | | | | 2,309,711 | |
| | | | Retail REIT – 0.7% | | | | | | | | | | |
| | | | | |
| | 1,700 | | | Federal Realty Investment Trust | | | | | | | | | 176,953 | |
| | | | | |
| | 1,900 | | | General Growth Properties Inc. | | | | | | | | | 34,371 | |
| | | | | |
| | 5,800 | | | Kimco Realty Corporation | | | | | | | | | 110,374 | |
| | | | | |
| | 8,977 | | | Simon Property Group, Inc. | | | | | | | | | 1,397,360 | |
| | | | | |
| | 4,500 | | | Taubman Centers Inc. | | | | | | | | | 347,220 | |
| | | | Total Retail REIT | | | | | | | | | 2,066,278 | |
| | | | Road & Rail – 0.8% | | | �� | | | | | | | |
| | | | | |
| | 80,720 | | | CSX Corporation | | | | | | | | | 1,804,899 | |
| | | | | |
| | 10,100 | | | Hertz Global Holdings Inc., (2) | | | | | | | | | 129,280 | |
| | | | | |
| | 2,000 | | | Norfolk Southern Corporation | | | | | | | | | 143,540 | |
| | | | | |
| | 700 | | | Ryder System, Inc. | | | | | | | | | 25,207 | |
| | | | | |
| | 2,600 | | | Union Pacific Corporation | | | | | | | | | 310,206 | |
| | | | Total Road & Rail | | | | | | | | | 2,413,132 | |
| | | | Semiconductors & Equipment – 2.6% | | | | | | | | | | |
| | | | | |
| | 189,750 | | | Applied Materials, Inc. | | | | | | | | | 2,174,535 | |
| | | | | |
| | 1,800 | | | Fairchild Semiconductor International Inc., Class A, (2) | | | | | | | | | 25,380 | |
| | | | | |
| | 3,600 | | | Freescale Semiconductor, Inc., (2) | | | | | | | | | 36,900 | |
| | | | | |
| | 70,700 | | | Intel Corporation | | | | | | | | | 1,884,155 | |
| | | | | |
| | 3,600 | | | International Rectifier Corporation, (2) | | | | | | | | | 71,964 | |
| | | | | |
| | 4,400 | | | Marvell Technology Group Ltd. | | | | | | | | | 49,632 | |
| | | | | |
| | 12,200 | | | Micron Technology, Inc., (2) | | | | | | | | | 76,982 | |
| | | | | |
| | 6,700 | | | SunPower Corporation, (2) | | | | | | | | | 32,227 | |
| | | | | |
| | 120,200 | | | Texas Instruments Incorporated | | | | | | | | | 3,448,538 | |
| | | | Total Semiconductors & Equipment | | | | | | | | | 7,800,313 | |
| | | | Software – 1.7% | | | | | | | | | | |
| | | | | |
| | 2,400 | | | CA Inc. | | | | | | | | | 65,016 | |
| | | | | |
| | 156,835 | | | Microsoft Corporation | | | | | | | | | 4,797,583 | |
| | | | | |
| | 5,300 | | | Symantec Corporation, (2) | | | | | | | | | 77,433 | |
| | | | | |
| | 5,300 | | | Synopsys Inc., (2) | | | | | | | | | 155,979 | |
| | | | Total Software | | | | | | | | | 5,096,011 | |
| | | | Specialized REIT – 0.5% | | | | | | | | | | |
| | | | | |
| | 3,600 | | | Health Care Property Investors Inc. | | | | | | | | | 158,940 | |
| | | | | |
| | 9,700 | | | Host Hotels & Resorts Inc. | | | | | | | | | 153,454 | |
| | | | | |
| | 3,500 | | | Plum Creek Timber Company | | | | | | | | | 138,950 | |
Portfolio of Investments
Nuveen Multi-Manager Large-Cap Value Fund (continued)
June 30, 2012
| | | | | | | | | | | | | | | | | | |
| Shares | | | Description (1) | | | | | | | | | | Value | |
| | | | | | | | | | | | | | | | | | |
| | | | Specialized REIT (continued) | | | | | | | | | | | | | | |
| | | | | |
| | 1,800 | | | Public Storage, Inc. | | | | | | | | | | | | $ | 259,938 | |
| | | | | |
| | 5,400 | | | Rayonier Inc. | | | | | | | | | | | | | 242,460 | |
| | | | | |
| | 20,800 | | | Weyerhaeuser Company | | | | | | | | | | | | | 465,088 | |
| | | | Total Specialized REIT | | | | | | | | | | | | | 1,418,830 | |
| | | | Specialty Retail – 0.4% | | | | | | | | | | | | | | |
| | | | | |
| | 13,987 | | | Home Depot, Inc. | | | | | | | | | | | | | 741,171 | |
| | | | | |
| | 13,300 | | | Lowe’s Companies, Inc. | | | | | | | | | | | | | 378,252 | |
| | | | | |
| | 1,200 | | | Signet Jewelers Limited | | | | | | | | | | | | | 52,812 | |
| | | | | |
| | 3,500 | | | Staples, Inc. | | | | | | | | | | | | | 45,675 | |
| | | | Total Specialty Retail | | | | | | | | | | | | | 1,217,910 | |
| | | | Thrifts & Mortgage Finance – 0.0% | | | | | | | | | | | | | | |
| | | | | |
| | 9,600 | | | Capitol Federal Financial Inc. | | | | | | | | | | | | | 114,048 | |
| | | | | |
| | 1,200 | | | TFS Financial Corporation, (2) | | | | | | | | | | | | | 11,460 | |
| | | | Total Thrifts & Mortgage Finance | | | | | | | | | | | | | 125,508 | |
| | | | Tobacco – 0.9% | | | | | | | | | | | | | | |
| | | | | |
| | 3,300 | | | Altria Group, Inc. | | | | | | | | | | | | | 114,015 | |
| | | | | |
| | 8,410 | | | Lorillard Inc. | | | | | | | | | | | | | 1,109,700 | |
| | | | | |
| | 18,433 | | | Philip Morris International | | | | | | | | | | | | | 1,608,464 | |
| | | | Total Tobacco | | | | | | | | | | | | | 2,832,179 | |
| | | | Trading Companies & Distributors – 0.0% | | | | | | | | | | | | | | |
| | | | | |
| | 5,600 | | | Air Lease Corporation, (2) | | | | | | | | | | | | | 108,584 | |
| | | | Wireless Telecommunication Services – 1.4% | | | | | | | | | | | | | | |
| | | | | |
| | 42,000 | | | Sprint Nextel Corporation, (2) | | | | | | | | | | | | | 136,920 | |
| | | | | |
| | 8,300 | | | Telephone and Data Systems Inc. | | | | | | | | | | | | | 176,707 | |
| | | | | |
| | 1,700 | | | United States Cellular Corporation, (2) | | | | | | | | | | | | | 65,654 | |
| | | | | |
| | 139,950 | | | Vodafone Group PLC, Sponsored ADR | | | | | | | | | | | | | 3,943,791 | |
| | | | Total Wireless Telecommunication Services | | | | | | | | | | | | | 4,323,072 | |
| | | | Total Common Stocks (cost $256,485,242) | | | | | | | | | | | | | 294,471,647 | |
| | | | | |
| Shares | | | Description (1) | | | | | | | | | | Value | |
| | | | INVESTMENT COMPANIES – 0.4% | | | | | | | | | | | | | | |
| | | | | |
| | 20,000 | | | iShares Russell 1000 Value Index Fund | | | | | | | | | | | | $ | 1,364,600 | |
| | | | Total Investment Companies (cost $1,037,342) | | | | | | | | | | | | | 1,364,600 | |
Principal
Amount (000) | | | Description (1) | | Coupon | | | Maturity | | | | | Value | |
| | | | SHORT-TERM INVESTMENTS – 1.3% | | | | | | | | | | | | | | |
| | | | | |
| $ | 3,786 | | | Repurchase Agreement with Fixed Income Clearing Corporation, dated 6/29/12, repurchase price $3,786,063, collateralized by $2,760,000 U.S. Treasury Bonds, 4.625%, due 2/15/40, value $3,864,767 | | | 0.010% | | | | 7/02/12 | | | | | $ | 3,786,060 | |
| | | | Total Short-Term Investments (cost $3,786,060) | | | | | | | | | | | | | 3,786,060 | |
| | | | Total Investments (cost $261,308,644) – 99.7% | | | | | | | | | | | | | 299,622,307 | |
| | | | Other Assets Less Liabilities – 0.3% | | | | | | | | | | | | | 893,538 | |
| | | | Net Assets – 100% | | | | | | | | | | | | $ | 300,515,845 | |
| | | | For Fund portfolio compliance purposes, the Fund’s industry classifications refer to any one or more of the industry sub-classifications used by one or more widely recognized market indexes or ratings group indexes, and/or as defined by the Fund management. This definition may not apply for purposes of this report, which may combine industry sub-classifications into sectors for reporting ease. |
| | (1) | | All percentages shown in the Portfolio of Investments are based on net assets. |
| | (2) | | Non-income producing; issuer has not declared a dividend within the past twelve months. |
| | ADR | | American Depositary Receipt. |
See accompanying notes to financial statements.
Portfolio of Investments
Nuveen NWQ Multi-Cap Value Fund
June 30, 2012
| | | | | | | | | | | | | | |
| Shares | | | Description (1) | | | | | | | | Value | |
| | | | | | | | | | | | | | |
| | | | COMMON STOCKS – 100.1% | | | | | | | | | | |
| | | | | |
| | | | Automobiles – 2.1% | | | | | | | | | | |
| | | | | |
| | 184,800 | | | General Motors Company, (2) | | | | | | | | $ | 3,644,256 | |
| | | | Capital Markets – 2.2% | | | | | | | | | | |
| | | | | |
| | 1,376,900 | | | FBR Capital Markets Corporation, (2) | | | | | | | | | 3,814,013 | |
| | | | Commercial Banks – 1.7% | | | | | | | | | | |
| | | | | |
| | 200,000 | | | Privatebancorp, Inc. | | | | | | | | | 2,952,000 | |
| | | | Commercial Services & Supplies – 0.8% | | | | | | | | | | |
| | | | | |
| | 89,000 | | | Pitney Bowes Inc. | | | | | | | | | 1,332,330 | |
| | | | Communication Equipment – 2.4% | | | | | | | | | | |
| | | | | |
| | 240,000 | | | Cisco Systems, Inc. | | | | | | | | | 4,120,800 | |
| | | | Computers & Peripherals – 2.5% | | | | | | | | | | |
| | | | | |
| | 210,000 | | | Hewlett-Packard Company | | | | | | | | | 4,223,100 | |
| | | | Diversified Financial Services – 5.0% | | | | | | | | | | |
| | | | | |
| | 195,000 | | | Citigroup Inc. | | | | | | | | | 5,344,950 | |
| | | | | |
| | 88,000 | | | JP Morgan Chase & Co. | | | | | | | | | 3,144,240 | |
| | | | Total Diversified Financial Services | | | | | | | | | 8,489,190 | |
| | | | Energy Equipment & Services – 1.4% | | | | | | | | | | |
| | | | | |
| | 81,000 | | | Halliburton Company | | | | | | | | | 2,299,590 | |
| | | | Independent Power Producers & Energy Traders – 1.1% | | | | | | | | | | |
| | | | | |
| | 107,600 | | | NRG Energy Inc., (2) | | | | | | | | | 1,867,936 | |
| | | | Insurance – 14.9% | | | | | | | | | | |
| | | | | |
| | 115,100 | | | American International Group, (2) | | | | | | | | | 3,693,559 | |
| | | | | |
| | 78,000 | | | AON PLC | | | | | | | | | 3,648,840 | |
| | | | | |
| | 322,900 | | | Hartford Financial Services Group, Inc. | | | | | | | | | 5,692,727 | |
| | | | | |
| | 85,000 | | | Loews Corporation | | | | | | | | | 3,477,350 | |
| | | | | |
| | 69,487 | | | Reinsurance Group of America Inc. | | | | | | | | | 3,697,403 | |
| | | | | |
| | 266,000 | | | Unum Group | | | | | | | | | 5,088,580 | |
| | | | Total Insurance | | | | | | | | | 25,298,459 | |
| | | | IT Services – 2.8% | | | | | | | | | | |
| | | | | |
| | 319,300 | | | Convergys Corporation | | | | | | | | | 4,716,061 | |
| | | | Machinery – 3.7% | | | | | | | | | | |
| | | | | |
| | 73,200 | | | Ingersoll Rand Company Limited, Class A | | | | | | | | | 3,087,576 | |
| | | | | |
| | 80,000 | | | PACCAR Inc. | | | | | | | | | 3,135,200 | |
| | | | Total Machinery | | | | | | | | | 6,222,776 | |
| | | | Media – 5.9% | | | | | | | | | | |
| | | | | |
| | 385,000 | | | Interpublic Group Companies, Inc. | | | | | | | | | 4,177,250 | |
| | | | | |
| | 124,697 | | | Viacom Inc., Class B | | | | | | | | | 5,863,253 | |
| | | | Total Media | | | | | | | | | 10,040,503 | |
| | | | Metals & Mining – 7.7% | | | | | | | | | | |
| | | | | |
| | 166,999 | | | AngloGold Ashanti Limited, Sponsored ADR | | | | | | | | | 5,734,746 | |
| | | | | |
| | 449,132 | | | AuRico Gold Inc., (2) | | | | | | | | | 3,597,547 | |
| | | | | |
| | 100,000 | | | Barrick Gold Corporation | | | | | | | | | 3,757,000 | |
| | | | Total Metals & Mining | | | | | | | | | 13,089,293 | |
| | | | Mortgage REIT – 2.0% | | | | | | | | | | |
| | | | | |
| | 273,000 | | | Redwood Trust Inc. | | | | | | | | | 3,407,040 | |
| | | | | | | | | | | | | | | | | | |
| Shares | | | Description (1) | | | | | | | | | | Value | |
| | | | | | | | | | | | | | | | | | |
| | | | Oil, Gas & Consumable Fuels – 14.0% | | | | | | | | | | | | | | |
| | | | | |
| | 78,500 | | | Apache Corporation | | | | | | | | | | | | $ | 6,899,365 | |
| | | | | |
| | 174,800 | | | Canadian Natural Resources Limited | | | | | | | | | | | | | 4,693,380 | |
| | | | | |
| | 205,000 | | | Denbury Resources Inc., (2) | | | | | | | | | | | | | 3,097,550 | |
| | | | | |
| | 32,000 | | | Noble Energy, Inc. | | | | | | | | | | | | | 2,714,240 | |
| | | | | |
| | 562,900 | | | Talisman Energy Inc. | | | | | | | | | | | | | 6,450,834 | |
| | | | Total Oil, Gas & Consumable Fuels | | | | | | | | | | | | | 23,855,369 | |
| | | | Pharmaceuticals – 12.6% | | | | | | | | | | | | | | |
| | | | | |
| | 329,000 | | | Pfizer Inc. | | | | | | | | | | | | | 7,567,000 | |
| | | | | |
| | 40,000 | | | Salix Pharmaceuticals Limited, (2) | | | | | | | | | | | | | 2,177,600 | |
| | | | | |
| | 197,500 | | | Sanofi-Aventis | | | | | | | | | | | | | 7,461,550 | |
| | | | | |
| | 105,000 | | | Teva Pharmaceutical Industries Limited, Sponsored ADR | | | | | | | | | | | | | 4,141,200 | |
| | | | Total Pharmaceuticals | | | | | | | | | | | | | 21,347,350 | |
| | | | Semiconductors & Equipment – 6.0% | | | | | | | | | | | | | | |
| | | | | |
| | 353,000 | | | Intersil Holding Corporation, Class A | | | | | | | | | | | | | 3,759,450 | |
| | | | | |
| | 476,244 | | | Mattson Technology, Inc., (2) | | | | | | | | | | | | | 833,427 | |
| | | | | |
| | 72,000 | | | MKS Instruments Inc. | | | | | | | | | | | | | 2,082,960 | |
| | | | | |
| | 585,000 | | | PMC-Sierra, Inc., (2) | | | | | | | | | | | | | 3,591,900 | |
| | | | Total Semiconductors & Equipment | | | | | | | | | | | | | 10,267,737 | |
| | | | Software – 7.7% | | | | | | | | | | | | | | |
| | | | | |
| | 485,077 | | | CA Inc. | | | | | | | | | | | | | 13,140,736 | |
| | | | Specialty Retail – 3.6% | | | | | | | | | | | | | | |
| | | | | |
| | 135,000 | | | Best Buy Co., Inc. | | | | | | | | | | | | | 2,829,600 | |
| | | | | |
| | 110,800 | | | Guess Inc. | | | | | | | | | | | | | 3,364,996 | |
| | | | Total Specialty Retail | | | | | | | | | | | | | 6,194,596 | |
| | | | Total Common Stocks (cost $159,778,890) | | | | | | | | | | | | | 170,323,135 | |
| | | | | |
Principal
Amount (000) | | | Description (1) | | | | Coupon | | | Maturity | | | Value | |
| | | | SHORT-TERM INVESTMENTS – 0.2% | | | | | | | | | | | | | | |
| | | | | |
| $ | 386 | | | Repurchase Agreement with Fixed Income Clearing Corporation, dated 6/29/12, repurchase price $386,167, collateralized by $385,000 U.S. Treasury Notes, 1.500%, due 3/31/19, value $397,513 | | | | | 0.010% | | | | 7/02/12 | | | $ | 386,167 | |
| | | | Total Short-Term Investments (cost $386,167) | | | | | | | | | | | | | 386,167 | |
| | | | Total Investments (cost $160,165,057) – 100.3% | | | | | | | | | | | | | 170,709,302 | |
| | | | Other Assets Less Liabilities – (0.3)% | | | | | | | | | | | | | (561,645) | |
| | | | Net Assets – 100% | | | | | | | | | | | | $ | 170,147,657 | |
| | | | For Fund portfolio compliance purposes, the Fund’s industry classifications refer to any one or more of the industry sub-classifications used by one or more widely recognized market indexes or ratings group indexes, and/or as defined by the Fund management. This definition may not apply for purposes of this report, which may combine industry sub-classifications into sectors for reporting ease. |
| | (1) | | All percentages shown in the Portfolio of Investments are based on net assets. |
| | (2) | | Non-income producing; issuer has not declared a dividend within the past twelve months. |
| | ADR | | American Depositary Receipt. |
See accompanying notes to financial statements.
Portfolio of Investments
Nuveen NWQ Large-Cap Value Fund
June 30, 2012
| | | | | | | | | | | | | | |
| Shares | | | Description (1) | | | | | | | | Value | |
| | | | | | | | | | | | | | |
| | | | COMMON STOCKS – 95.7% | | | | | | | | | | |
| | | | | |
| | | | Aerospace & Defense – 1.5% | | | | | | | | | | |
| | | | | |
| | 300,030 | | | Raytheon Company | | | | | | | | $ | 16,978,698 | |
| | | | Automobiles – 2.2% | | | | | | | | | | |
| | | | | |
| | 1,227,900 | | | General Motors Company, (2) | | | | | | | | | 24,214,188 | |
| | | | Capital Markets – 2.2% | | | | | | | | | | |
| | | | | |
| | 250,100 | | | Goldman Sachs Group, Inc. | | | | | | | | | 23,974,586 | |
| | | | Chemicals – 1.5% | | | | | | | | | | |
| | | | | |
| | 300,000 | | | Mosaic Company | | | | | | | | | 16,428,000 | |
| | | | Commercial Banks – 2.0% | | | | | | | | | | |
| | | | | |
| | 668,630 | | | Wells Fargo & Company | | | | | | | | | 22,358,987 | |
| | | | Commercial Services & Supplies – 0.4% | | | | | | | | | | |
| | | | | |
| | 300,830 | | | Pitney Bowes Inc. | | | | | | | | | 4,503,425 | |
| | | | Communication Equipment – 3.0% | | | | | | | | | | |
| | | | | |
| | 1,926,500 | | | Cisco Systems, Inc. | | | | | | | | | 33,078,005 | |
| | | | Computers & Peripherals – 2.3% | | | | | | | | | | |
| | | | | |
| | 1,250,000 | | | Hewlett-Packard Company | | | | | | | | | 25,137,500 | |
| | | | Consumer Finance – 0.7% | | | | | | | | | | |
| | | | | |
| | 134,000 | | | Capital One Financial Corporation | | | | | | | | | 7,324,440 | |
| | | | Diversified Financial Services – 4.8% | | | | | | | | | | |
| | | | | |
| | 1,250,020 | | | Citigroup Inc. | | | | | | | | | 34,263,048 | |
| | | | | |
| | 520,970 | | | JP Morgan Chase & Co. | | | | | | | | | 18,614,258 | |
| | | | Total Diversified Financial Services | | | | | | | | | 52,877,306 | |
| | | | Energy Equipment & Services – 1.4% | | | | | | | | | | |
| | | | | |
| | 559,110 | | | Halliburton Company | | | | | | | | | 15,873,133 | |
| | | | Food & Staples Retailing – 2.2% | | | | | | | | | | |
| | | | | |
| | 525,400 | | | CVS Caremark Corporation | | | | | | | | | 24,551,942 | |
| | | | Independent Power Producers & Energy Traders – 0.5% | | | | | | | | | | |
| | | | | |
| | 301,250 | | | NRG Energy Inc., (2) | | | | | | | | | 5,229,700 | |
| | | | Insurance – 15.6% | | | | | | | | | | |
| | | | | |
| | 691,500 | | | American International Group, (2) | | | | | | | | | 22,190,235 | |
| | | | | |
| | 525,110 | | | AON PLC | | | | | | | | | 24,564,646 | |
| | | | | |
| | 1,914,710 | | | Hartford Financial Services Group, Inc. | | | | | | | | | 33,756,337 | |
| | | | | |
| | 192,000 | | | Lincoln National Corporation | | | | | | | | | 4,199,040 | |
| | | | | |
| | 500,031 | | | Loews Corporation | | | | | | | | | 20,456,268 | |
| | | | | |
| | 1,100,780 | | | MetLife, Inc. | | | | | | | | | 33,959,063 | |
| | | | | |
| | 1,750,780 | | | Unum Group | | | | | | | | | 33,492,421 | |
| | | | Total Insurance | | | | | | | | | 172,618,010 | |
| | | | Machinery – 3.3% | | | | | | | | | | |
| | | | | |
| | 475,270 | | | Ingersoll Rand Company Limited, Class A | | | | | | | | | 20,046,889 | |
| | | | | |
| | 425,000 | | | PACCAR Inc. | | | | | | | | | 16,655,750 | |
| | | | Total Machinery | | | | | | | | | 36,702,639 | |
| | | | Media – 6.4% | | | | | | | | | | |
| | | | | |
| | 650,090 | | | Interpublic Group Companies, Inc. | | | | | | | | | 7,053,477 | |
| | | | | |
| | 625,000 | | | Time Warner Inc. | | | | | | | | | 24,062,500 | |
| | | | | |
| | 840,120 | | | Viacom Inc., Class B | | | | | | | | | 39,502,442 | |
| | | | Total Media | | | | | | | | | 70,618,419 | |
| | | | | | | | | | | | | | | | | | |
| Shares | | | Description (1) | | | | | | | | | | Value | |
| | | | | | | | | | | | | | | | | | |
| | | | Metals & Mining – 6.3% | | | | | | | | | | | | | | |
| | | | | |
| | 1,225,151 | | | AngloGold Ashanti Limited, Sponsored ADR | | | | | | | | | | | | $ | 42,071,685 | |
| | | | | |
| | 750,290 | | | Barrick Gold Corporation | | | | | | | | | | | | | 28,188,395 | |
| | | | Total Metals & Mining | | | | | | | | | | | | | 70,260,080 | |
| | | | Oil, Gas & Consumable Fuels – 13.7% | | | | | | | | | | | | | | |
| | | | | |
| | 475,030 | | | Apache Corporation | | | | | | | | | | | | | 41,750,387 | |
| | | | | |
| | 1,150,960 | | | Canadian Natural Resources Limited | | | | | | | | | | | | | 30,903,276 | |
| | | | | |
| | 200,000 | | | Noble Energy, Inc. | | | | | | | | | | | | | 16,964,000 | |
| | | | | |
| | 195,295 | | | Occidental Petroleum Corporation | | | | | | | | | | | | | 16,750,452 | |
| | | | | |
| | 4,000,870 | | | Talisman Energy Inc. | | | | | | | | | | | | | 45,849,970 | |
| | | | Total Oil, Gas & Consumable Fuels | | | | | | | | | | | | | 152,218,085 | |
| | | | Pharmaceuticals – 12.5% | | | | | | | | | | | | | | |
| | | | | |
| | 350,060 | | | Merck & Company Inc. | | | | | | | | | | | | | 14,615,005 | |
| | | | | |
| | 2,237,240 | | | Pfizer Inc. | | | | | | | | | | | | | 51,456,520 | |
| | | | | |
| | 1,200,930 | | | Sanofi-Aventis | | | | | | | | | | | | | 45,371,135 | |
| | | | | |
| | 677,200 | | | Teva Pharmaceutical Industries Limited, Sponsored ADR | | | | | | | | | | | | | 26,708,768 | |
| | | | Total Pharmaceuticals | | | | | | | | | | | | | 138,151,428 | |
| | | | Road & Rail – 1.3% | | | | | | | | | | | | | | |
| | | | | |
| | 125,040 | | | Union Pacific Corporation | | | | | | | | | | | | | 14,918,522 | |
| | | | Software – 9.6% | | | | | | | | | | | | | | |
| | | | | |
| | 2,900,000 | | | CA Inc. | | | | | | | | | | | | | 78,561,002 | |
| | | | | |
| | 919,310 | | | Microsoft Corporation | | | | | | | | | | | | | 28,121,693 | |
| | | | Total Software | | | | | | | | | | | | | 106,682,695 | |
| | | | Specialty Retail – 1.5% | | | | | | | | | | | | | | |
| | | | | |
| | 796,000 | | | Best Buy Co., Inc. | | | | | | | | | | | | | 16,684,160 | |
| | | | Tobacco – 0.8% | | | | | | | | | | | | | | |
| | | | | |
| | 107,220 | | | Philip Morris International | | | | | | | | | | | | | 9,356,017 | |
| | | | Total Common Stocks (cost $1,089,429,523) | | | | | | | | | | | | | 1,060,739,965 | |
| | | | | |
Principal Amount (000) | | | Description (1) | | | | Coupon | | | Maturity | | | Value | |
| | | | SHORT-TERM INVESTMENTS – 4.1% | | | | | | | | | | | | | | |
| | | | | |
| $ | 45,720 | | | Repurchase Agreement with State Street Bank, dated 6/29/12, repurchase price $45,719,771, collateralized by $44,535,000 U.S. Treasury Notes, 1.750%, due 5/31/16, value $46,635,627 | | | | | 0.010% | | | | 7/02/12 | | | $ | 45,719,733 | |
| | | | Total Short-Term Investments (cost $45,719,733) | | | | | | | | | | | | | 45,719,733 | |
| | | | Total Investments (cost $1,135,149,256) – 99.8% | | | | | | | | | | | | | 1,106,459,698 | |
| | | | Other Assets Less Liabilities – 0.2% | | | | | | | | | | | | | 1,838,331 | |
| | | | Net Assets – 100% | | | | | | | | | | | | $ | 1,108,298,029 | |
| | | | For Fund portfolio compliance purposes, the Fund’s industry classifications refer to any one or more of the industry sub-classifications used by one or more widely recognized market indexes or ratings group indexes, and/or as defined by the Fund management. This definition may not apply for purposes of this report, which may combine industry sub-classifications into sectors for reporting ease. |
| | (1) | | All percentages shown in the Portfolio of Investments are based on net assets. |
| | (2) | | Non-income producing; issuer has not declared a dividend within the past twelve months. |
| | ADR | | American Depositary Receipt. |
See accompanying notes to financial statements.
Portfolio of Investments
Nuveen Small/Mid-Cap Value Fund
June 30, 2012
| | | | | | | | | | | | | | |
| Shares | | | Description (1) | | | | | | | | Value | |
| | | | | | | | | | | | | | |
| | | | COMMON STOCKS – 98.4% | | | | | | | | | | |
| | | | | |
| | | | Aerospace & Defense – 3.0% | | | | | | | | | | |
| | | | | |
| | 50,050 | | | Orbital Sciences Corporation, (2) | | | | | | | | $ | 646,646 | |
| | | | Biotechnology – 1.8% | | | | | | | | | | |
| | | | | |
| | 7,200 | | | Vertex Pharmaceuticals Inc., (2) | | | | | | | | | 402,624 | |
| | | | Building Products – 3.1% | | | | | | | | | | |
| | | | | |
| | 79,550 | | | Griffon Corporation | | | | | | | | | 682,539 | |
| | | | Commercial Banks – 5.1% | | | | | | | | | | |
| | | | | |
| | 14,900 | | | Privatebancorp, Inc. | | | | | | | | | 219,924 | |
| | | | | |
| | 12,400 | | | Texas Capital BancShares, Inc., (2) | | | | | | | | | 500,836 | |
| | | | | |
| | 43,050 | | | Western Alliance Bancorporation, (2) | | | | | | | | | 402,948 | |
| | | | Total Commercial Banks | | | | | | | | | 1,123,708 | |
| | | | Commercial Services & Supplies – 2.2% | | | | | | | | | | |
| | | | | |
| | 38,401 | | | Schawk Inc. | | | | | | | | | 487,693 | |
| | | | Communication Equipment – 2.3% | | | | | | | | | | |
| | | | | |
| | 101,950 | | | Brocade Communications Systems Inc., (2) | | | | | | | | | 502,614 | |
| | | | Electronic Equipment & Instruments – 9.6% | | | | | | | | | | |
| | | | | |
| | 17,650 | | | Arrow Electronics, Inc., (2) | | | | | | | | | 579,097 | |
| | | | | |
| | 20,750 | | | Avnet Inc., (2) | | | | | | | | | 640,345 | |
| | | | | |
| | 14,500 | | | Coherent Inc., (2) | | | | | | | | | 627,850 | |
| | | | | |
| | 5,300 | | | FEI Company | | | | | | | | | 253,552 | |
| | | | Total Electronic Equipment & Instruments | | | | | | | | | 2,100,844 | |
| | | | Food & Staples Retailing – 1.0% | | | | | | | | | | |
| | | | | |
| | 3,650 | | | Casey’s General Stores, Inc. | | | | | | | | | 215,314 | |
| | | | Food Products – 4.1% | | | | | | | | | | |
| | | | | |
| | 11,100 | | | Hormel Foods Corporation | | | | | | | | | 337,662 | |
| | | | | |
| | 8,883 | | | Treehouse Foods Inc., (2) | | | | | | | | | 553,322 | |
| | | | Total Food Products | | | | | | | | | 890,984 | |
| | | | Hotels, Restaurants & Leisure – 4.9% | | | | | | | | | | |
| | | | | |
| | 26,450 | | | Bob Evans Farms | | | | | | | | | 1,063,288 | |
| | | | Insurance – 12.9% | | | | | | | | | | |
| | | | | |
| | 9,650 | | | Allied World Assurance Holdings | | | | | | | | | 766,885 | |
| | | | | |
| | 11,100 | | | Alterra Capital Holdings Limited | | | | | | | | | 259,185 | |
| | | | | |
| | 9,800 | | | Axis Capital Holdings Limited | | | | | | | | | 318,990 | |
| | | | | |
| | 7,950 | | | PartnerRe Limited | | | | | | | | | 601,577 | |
| | | | | |
| | 8,350 | | | Reinsurance Group of America Inc. | | | | | | | | | 444,304 | |
| | | | | |
| | 12,100 | | | Willis Group Holdings PLC | | | | | | | | | 441,529 | |
| | | | Total Insurance | | | | | | | | | 2,832,470 | |
| | | | Machinery – 6.7% | | | | | | | | | | |
| | | | | |
| | 13,500 | | | CIRCOR International Inc. | | | | | | | | | 460,215 | |
| | | | | |
| | 3,250 | | | Middleby Corporation, (2) | | | | | | | | | 323,733 | |
| | | | | |
| | 4,450 | | | Timken Company | | | | | | | | | 203,766 | |
| | | | | |
| | 23,700 | | | TriMas Corporation, (2) | | | | | | | | | 476,370 | |
| | | | Total Machinery | | | | | | | | | 1,464,084 | |
| | | | | | | | | | | | | | |
| Shares | | | Description (1) | | | | | | | | Value | |
| | | | | | | | | | | | | | |
| | | | Metals & Mining – 5.3% | | | | | | | | | | |
| | | | | |
| | 80,675 | | | AuRico Gold Inc., (2) | | | | | | | | $ | 646,207 | |
| | | | | |
| | 70,200 | | | Aurizon Mines Ltd, (2) | | | | | | | | | 316,602 | |
| | | | | |
| | 60,900 | | | Thompson Creek Metals Company Inc., (2) | | | | | | | | | 194,271 | |
| | | | Total Metals & Mining | | | | | | | | | 1,157,080 | |
| | | | Oil, Gas & Consumable Fuels – 4.4% | | | | | | | | | | |
| | | | | |
| | 7,500 | | | Alpha Natural Resources Inc., (2) | | | | | | | | | 65,325 | |
| | | | | |
| | 16,000 | | | Carrizo Oil & Gas, Inc., (2) | | | | | | | | | 376,160 | |
| | | | | |
| | 35,200 | | | Denbury Resources Inc., (2) | | | | | | | | | 531,872 | |
| | | | Total Oil, Gas & Consumable Fuels | | | | | | | | | 973,357 | |
| | | | Paper & Forest Products – 5.5% | | | | | | | | | | |
| | | | | |
| | 20,200 | | | Clearwater Paper Corporation, (2) | | | | | | | | | 689,223 | |
| | | | | |
| | 8,600 | | | Deltic Timber Corporation | | | | | | | | | 524,428 | |
| | | | Total Paper & Forest Products | | | | | | | | | 1,213,651 | |
| | | | Personal Products – 5.0% | | | | | | | | | | |
| | | | | |
| | 27,050 | | | Elizabeth Arden, Inc., (2) | | | | | | | | | 1,049,810 | |
| | | | | |
| | 2,200 | | | Inter Parfums, Inc. | | | | | | | | | 37,994 | |
| | | | Total Personal Products | | | | | | | | | 1,087,804 | |
| | | | Pharmaceuticals – 2.5% | | | | | | | | | | |
| | | | | |
| | 10,200 | | | Salix Pharmaceuticals Limited, (2) | | | | | | | | | 555,288 | |
| | | | Professional Services – 1.1% | | | | | | | | | | |
| | | | | |
| | 9,200 | | | Mistras Group Inc., (2) | | | | | | | | | 241,776 | |
| | | | Real Estate Management & Development – 4.1% | | | | | | | | | | |
| | | | | |
| | 70,200 | | | Forestar Real Estate Group Inc., (2) | | | | | | | | | 899,261 | |
| | | | Semiconductors & Equipment – 7.8% | | | | | | | | | | |
| | | | | |
| | 19,400 | | | MKS Instruments Inc. | | | | | | | | | 561,242 | |
| | | | | |
| | 77,900 | | | PMC-Sierra, Inc., (2) | | | | | | | | | 478,306 | |
| | | | | |
| | 48,400 | | | Teradyne Inc., (2) | | | | | | | | | 680,504 | |
| | | | Total Semiconductors & Equipment | | | | | | | | | 1,720,052 | |
| | | | Specialty Retail – 2.7% | | | | | | | | | | |
| | | | | |
| | 19,350 | | | Guess Inc. | | | | | | | | | 587,660 | |
| | | | Thrifts & Mortgage Finance – 2.4% | | | | | | | | | | |
| | | | | |
| | 19,550 | | | Northwest Bancshares Inc. | | | | | | | | | 228,931 | |
| | | | | |
| | 26,300 | | | People’s United Financial, Inc. | | | | | | | | | 305,343 | |
| | | | Total Thrifts & Mortgage Finance | | | | | | | | | 534,274 | |
| | | | Trading Companies & Distributors – 0.9% | | | | | | | | | | |
| | | | | |
| | 3,600 | | | WESCO International Inc., (2) | | | | | | | | | 207,180 | |
| | | | Total Common Stocks (cost $19,181,935) | | | | | | | | | 21,590,191 | |
Portfolio of Investments
Nuveen Small/Mid-Cap Value Fund (continued)
June 30, 2012
| | | | | | | | | | | | | | | | | | |
Principal
Amount (000) | | | Description (1) | | | | Coupon | | | Maturity | | | Value | |
| | | | SHORT-TERM INVESTMENTS – 1.0% | | | | | | | | | | | | | | |
| | | | | |
| $ | 232 | | | Repurchase Agreement with State Street Bank, dated 6/29/12, repurchase price $231,588, collateralized by $230,000 U.S. Treasury Notes, 1.750%, due 5/31/16, value $240,849 | | | | | 0.010% | | | | 7/02/12 | | | $ | 231,588 | |
| | | | Total Short-Term Investments (cost $231,588) | | | | | | | | | | | | | 231,588 | |
| | | | Total Investments (cost $19,413,523) – 99.4% | | | | | | | | | | | | | 21,821,779 | |
| | | | Other Assets Less Liabilities – 0.6% | | | | | | | | | | | | | 129,428 | |
| | | | Net Assets – 100% | | | | | | | | | | | | $ | 21,951,207 | |
| | | | For Fund portfolio compliance purposes, the Fund’s industry classifications refer to any one or more of the industry sub-classifications used by one or more widely recognized market indexes or ratings group indexes, and/or as defined by the Fund management. This definition may not apply for purposes of this report, which may combine industry sub-classifications into sectors for reporting ease. |
| | (1) | | All percentages shown in the Portfolio of Investments are based on net assets. |
| | (2) | | Non-income producing; issuer has not declared a dividend within the past twelve months. |
See accompanying notes to financial statements.
Portfolio of Investments
Nuveen NWQ Small-Cap Value Fund
June 30, 2012
| | | | | | | | | | | | | | |
| Shares | | | Description (1) | | | | | | | | Value | |
| | | | | | | | | | | | | | |
| | | | COMMON STOCKS – 94.8% | | | | | | | | | | |
| | | | | |
| | | | Aerospace & Defense – 2.7% | | | | | | | | | | |
| | | | | |
| | 218,150 | | | Orbital Sciences Corporation, (2) | | | | | | | | $ | 2,818,498 | |
| | | | Apparel, Accessories & Luxury Goods – 5.0% | | | | | | | | | | |
| | | | | |
| | 150,415 | | | Maidenform Brands Inc., (2) | | | | | | | | | 2,996,267 | |
| | | | | |
| | 75,000 | | | True Religion Apparel, Inc. | | | | | | | | | 2,173,500 | |
| | | | Total Apparel, Accessories & Luxury Goods | | | | | | | | | 5,169,767 | |
| | | | Building Products – 3.3% | | | | | | | | | | |
| | | | | |
| | 392,450 | | | Griffon Corporation | | | | | | | | | 3,367,221 | |
| | | | Commercial Banks – 7.1% | | | | | | | | | | |
| | | | | |
| | 47,450 | | | Pacwest Bancorp. | | | | | | | | | 1,123,142 | |
| | | | | |
| | 124,290 | | | Privatebancorp, Inc. | | | | | | | | | 1,834,520 | |
| | | | | |
| | 64,550 | | | Texas Capital BancShares, Inc., (2) | | | | | | | | | 2,607,175 | |
| | | | | |
| | 189,450 | | | Western Alliance Bancorporation, (2) | | | | | | | | | 1,773,252 | |
| | | | Total Commercial Banks | | | | | | | | | 7,338,089 | |
| | | | Commercial Services & Supplies – 0.9% | | | | | | | | | | |
| | | | | |
| | 89,900 | | | TMS International Corporation, Class A Shares, (2) | | | | | | | | | 896,303 | |
| | | | Communication Equipment – 2.3% | | | | | | | | | | |
| | | | | |
| | 478,550 | | | Brocade Communications Systems Inc., (2) | | | | | | | | | 2,359,252 | |
| | | | Construction & Engineering – 1.4% | | | | | | | | | | |
| | | | | |
| | 203,250 | | | Orion Marine Group Inc., (2) | | | | | | | | | 1,414,620 | |
| | | | Electronic Equipment & Instruments – 4.2% | | | | | | | | | | |
| | | | | |
| | 64,500 | | | Coherent Inc., (2) | | | | | | | | | 2,792,850 | |
| | | | | |
| | 179,350 | | | Methode Electronics, Inc. | | | | | | | | | 1,526,269 | |
| | | | Total Electronic Equipment & Instruments | | | | | | | | | 4,319,119 | |
| | | | Food & Staples Retailing – 1.1% | | | | | | | | | | |
| | | | | |
| | 19,500 | | | Casey’s General Stores, Inc. | | | | | | | | | 1,150,305 | |
| | | | Food Products – 5.7% | | | | | | | | | | |
| | | | | |
| | 348,250 | | | Smart Balance Inc., (2) | | | | | | | | | 3,270,068 | |
| | | | | |
| | 40,850 | | | Treehouse Foods Inc., (2) | | | | | | | | | 2,544,547 | |
| | | | Total Food Products | | | | | | | | | 5,814,615 | |
| | | | Hotels, Restaurants & Leisure – 4.8% | | | | | | | | | | |
| | | | | |
| | 122,600 | | | Bob Evans Farms | | | | | | | | | 4,928,520 | |
| | | | Household Durables – 1.9% | | | | | | | | | | |
| | | | | |
| | 166,395 | | | Hooker Furniture Corporation | | | | | | | | | 1,961,797 | |
| | | | Insurance – 7.4% | | | | | | | | | | |
| | | | | |
| | 40,550 | | | Allied World Assurance Holdings | | | | | | | | | 3,222,509 | |
| | | | | |
| | 44,300 | | | Alterra Capital Holdings Limited | | | | | | | | | 1,034,405 | |
| | | | | |
| | 116,550 | | | Aspen Insurance Holdings Limited | | | | | | | | | 3,368,295 | |
| | | | Total Insurance | | | | | | | | | 7,625,209 | |
| | | | IT Services – 2.5% | | | | | | | | | | |
| | | | | |
| | 170,750 | | | Convergys Corporation | | | | | | | | | 2,521,978 | |
| | | | Machinery – 8.2% | | | | | | | | | | |
| | | | | |
| | 192,700 | | | Albany International Corporation, Class A | | | | | | | | | 3,605,416 | |
| | | | | |
| | 65,950 | | | CIRCOR International Inc. | | | | | | | | | 2,248,235 | |
| | | | | |
| | 15,300 | | | Middleby Corporation, (2) | | | | | | | | | 1,524,032 | |
| | | | | |
| | 49,200 | | | TriMas Corporation, (2) | | | | | | | | | 988,919 | |
| | | | Total Machinery | | | | | | | | | 8,366,602 | |
Portfolio of Investments
Nuveen NWQ Small-Cap Value Fund (continued)
June 30, 2012
| | | | | | | | | | | | | | | | | | |
| Shares | | | Description (1) | | | | | | | | | | Value | |
| | | | | | | | | | | | | | | | | | |
| | | | Metals & Mining – 4.6% | | | | | | | | | | | | | | |
| | | | | |
| | 322,303 | | | AuRico Gold Inc., (2) | | | | | | | | | | | | $ | 2,581,647 | |
| | | | | |
| | 307,800 | | | Aurizon Mines Ltd, (2) | | | | | | | | | | | | | 1,388,178 | |
| | | | | |
| | 250,150 | | | Thompson Creek Metals Company Inc., (2) | | | | | | | | | | | | | 797,979 | |
| | | | Total Metals & Mining | | | | | | | | | | | | | 4,767,804 | |
| | | | Oil, Gas & Consumable Fuels – 3.9% | | | | | | | | | | | | | | |
| | | | | |
| | 169,500 | | | Carrizo Oil & Gas, Inc., (2) | | | | | | | | | | | | | 3,984,945 | |
| | | | Paper & Forest Products – 5.0% | | | | | | | | | | | | | | |
| | | | | |
| | 32,403 | | | Buckeye Technologies Inc. | | | | | | | | | | | | | 923,161 | |
| | | | | |
| | 35,000 | | | Deltic Timber Corporation | | | | | | | | | | | | | 2,134,300 | |
| | | | | |
| | 78,713 | | | Neenah Paper, Inc. | | | | | | | | | | | | | 2,100,850 | |
| | | | Total Paper & Forest Products | | | | | | | | | | | | | 5,158,311 | |
| | | | Personal Products – 6.7% | | | | | | | | | | | | | | |
| | | | | |
| | 120,500 | | | Elizabeth Arden, Inc., (2) | | | | | | | | | | | | | 4,676,605 | |
| | | | | |
| | 128,800 | | | Inter Parfums, Inc. | | | | | | | | | | | | | 2,224,376 | |
| | | | Total Personal Products | | | | | | | | | | | | | 6,900,981 | |
| | | | Professional Services – 0.8% | | | | | | | | | | | | | | |
| | | | | |
| | 45,436 | | | GP Strategies Corporation, (2) | | | | | | | | | | | | | 839,203 | |
| | | | Real Estate Management & Development – 3.9% | | | | | | | | | | | | | | |
| | | | | |
| | 313,285 | | | Forestar Real Estate Group Inc., (2) | | | | | | | | | | | | | 4,013,181 | |
| | | | Road & Rail – 1.5% | | | | | | | | | | | | | | |
| | | | | |
| | 70,500 | | | Marten Transport, Ltd. | | | | | | | | | | | | | 1,498,830 | |
| | | | Semiconductors & Equipment – 6.8% | | | | | | | | | | | | | | |
| | | | | |
| | 258,250 | | | Entegris Inc., (2) | | | | | | | | | | | | | 2,205,455 | |
| | | | | |
| | 91,900 | | | MKS Instruments Inc. | | | | | | | | | | | | | 2,658,667 | |
| | | | | |
| | 350,600 | | | PMC-Sierra, Inc., (2) | | | | | | | | | | | | | 2,152,684 | |
| | | | Total Semiconductors & Equipment | | | | | | | | | | | | | 7,016,806 | |
| | | | Thrifts & Mortgage Finance – 3.1% | | | | | | | | | | | | | | |
| | | | | |
| | 68,470 | | | HomeStreet Inc., (2) | | | | | | | | | | | | | 2,190,355 | |
| | | | | |
| | 81,200 | | | Northwest Bancshares Inc. | | | | | | | | | | | | | 950,852 | |
| | | | Total Thrifts & Mortgage Finance | | | | | | | | | | | | | 3,141,207 | |
| | | | Total Common Stocks (cost $86,064,728) | | | | | | | | | | | | | 97,373,163 | |
| | | | | |
Principal Amount (000) | | | Description (1) | | | | Coupon | | | Maturity | | | Value | |
| | | | SHORT-TERM INVESTMENTS – 5.3% | | | | | | | | | | | | | | |
| | | | | |
| $ | 5,469 | | | Repurchase Agreement with Fixed Income Clearing Corporation, dated 6/29/12, repurchase price $5,468,763, collateralized by $4,990,000 U.S. Treasury Notes, 2.750%, due 2/15/19, value $5,582,563 | | | | | 0.010% | | | | 7/02/12 | | | $ | 5,468,758 | |
| | | | Total Short-Term Investments (cost $5,468,758) | | | | | | | | | | | | | 5,468,758 | |
| | | | Total Investments (cost $91,533,486) – 100.1% | | | | | | | | | | | | | 102,841,921 | |
| | | | Other Assets Less Liabilities – (0.1)% | | | | | | | | | | | | | (141,289) | |
| | | | Net Assets – 100% | | | | | | | | | | | | $ | 102,700,632 | |
| | | | For Fund portfolio compliance purposes, the Fund’s industry classifications refer to any one or more of the industry sub-classifications used by one or more widely recognized market indexes or ratings group indexes, and/or as defined by the Fund management. This definition may not apply for purposes of this report, which may combine industry sub-classifications into sectors for reporting ease. |
| | (1) | | All percentages shown in the Portfolio of Investments are based on net assets. |
| | (2) | | Non-income producing; issuer has not declared a dividend within the past twelve months. |
See accompanying notes to financial statements.
Portfolio of Investments
Nuveen Tradewinds Value Opportunities Fund
June 30, 2012
| | | | | | | | | | | | | | |
| Shares | | | Description (1) | | | | | | | | Value | |
| | | | | | | | | | | | | | |
| | | | COMMON STOCKS – 96.5% | | | | | | | | | | |
| | | | | |
| | | | Aerospace & Defense – 3.1% | | | | | | | | | | |
| | | | | |
| | 342,880 | | | Alliant Techsystems Inc. | | | | | | | | $ | 17,339,442 | |
| | | | | |
| | 2,891,281 | | | Finmeccanica SPA, ADR, (2) | | | | | | | | | 5,609,085 | |
| | | | | |
| | 133,471 | | | Lockheed Martin Corporation | | | | | | | | | 11,622,655 | |
| | | | Total Aerospace & Defense | | | | | | | | | 34,571,182 | |
| | | | Airlines – 1.5% | | | | | | | | | | |
| | | | | |
| | 879,700 | | | SkyWest Inc. | | | | | | | | | 5,744,441 | |
| | | | | |
| | 1,255,727 | | | Southwest Airlines Co. | | | | | | | | | 11,577,803 | |
| | | | Total Airlines | | | | | | | | | 17,322,244 | |
| | | | Beverages – 1.0% | | | | | | | | | | |
| | | | | |
| | 275,971 | | | Molson Coors Brewing Company, Class B | | | | | | | | | 11,483,153 | |
| | | | Biotechnology – 1.3% | | | | | | | | | | |
| | | | | |
| | 1,997,803 | | | Dendreon Corporation, (2) | | | | | | | | | 14,783,742 | |
| | | | Capital Markets – 2.2% | | | | | | | | | | |
| | | | | |
| | 266,837 | | | Northern Trust Corporation | | | | | | | | | 12,279,839 | |
| | | | | |
| | 1,069,545 | | | UBS AG, (2) | | | | | | | | | 12,524,372 | |
| | | | Total Capital Markets | | | | | | | | | 24,804,211 | |
| | | | Chemicals – 2.0% | | | | | | | | | | |
| | | | | |
| | 407,878 | | | Mosaic Company | | | | | | | | | 22,335,399 | |
| | | | Commercial Banks – 1.0% | | | | | | | | | | |
| | | | | |
| | 3,741,760 | | | Sumitomo Mitsui Trust Holdings, ADR | | | | | | | | | 10,963,357 | |
| | | | Communication Equipment – 1.6% | | | | | | | | | | |
| | | | | |
| | 1,028,180 | | | Cisco Systems, Inc. | | | | | | | | | 17,653,851 | |
| | | | Computers & Peripherals – 1.1% | | | | | | | | | | |
| | | | | |
| | 421,611 | | | Western Digital Corporation, (2) | | | | | | | | | 12,850,703 | |
| | | | Construction & Engineering – 1.1% | | | | | | | | | | |
| | | | | |
| | 464,204 | | | Shaw Group Inc., (2) | | | | | | | | | 12,677,411 | |
| | | | Diversified Telecommunication Services – 2.0% | | | | | | | | | | |
| | | | | |
| | 120,834 | | | PT Telekomunikasi Indonesia, ADR | | | | | | | | | 4,208,648 | |
| | | | | |
| | 983,148 | | | Vivendi SA, ADR | | | | | | | | | 18,101,731 | |
| | | | Total Diversified Telecommunication Services | | | | | | | | | 22,310,379 | |
| | | | Electric Utilities – 6.4% | | | | | | | | | | |
| | | | | |
| | 1,850,884 | | | Centrais Electricas Brasileiras SA, Electrobras, ADR, (2) | | | | | | | | | 17,731,469 | |
| | | | | |
| | 4,134,916 | | | Electricite de France S.A., ADR | | | | | | | | | 18,069,583 | |
| | | | | |
| | 518,787 | | | Exelon Corporation | | | | | | | | | 19,516,767 | |
| | | | | |
| | 7,043,097 | | | RusHydro, ADR, (2) | | | | | | | | | 16,410,416 | |
| | | | Total Electric Utilities | | | | | | | | | 71,728,235 | |
| | | | Electronic Components – 1.0% | | | | | | | | | | |
| | | | | |
| | 912,081 | | | Corning Incorporated | | | | | | | | | 11,793,207 | |
| | | | Electronic Equipment & Instruments – 1.6% | | | | | | | | | | |
| | | | | |
| | 1,040,042 | | | Ingram Micro, Inc., Class A, (2) | | | | | | | | | 18,169,534 | |
| | | | Energy Equipment & Services – 3.8% | | | | | | | | | | |
| | | | | |
| | 274,547 | | | Baker Hughes Incorporated | | | | | | | | | 11,283,882 | |
| | | | | |
| | 159,158 | | | Transocean Inc., (2) | | | | | | | | | 7,119,137 | |
| | | | | |
| | 1,899,117 | | | Weatherford International Ltd, (2) | | | | | | | | | 23,985,848 | |
| | | | Total Energy Equipment & Services | | | | | | | | | 42,388,867 | |
Portfolio of Investments
Nuveen Tradewinds Value Opportunities Fund (continued)
June 30, 2012
| | | | | | | | | | | | | | |
| Shares | | | Description (1) | | | | | | | | Value | |
| | | | | | | | | | | | | | |
| | | | Food & Staples Retailing – 4.0% | | | | | | | | | | |
| | | | | |
| | 967,470 | | | Kroger Co. | | | | | | | | $ | 22,435,629 | |
| | | | | |
| | 774,386 | | | Walgreen Co. | | | | | | | | | 22,906,338 | |
| | | | Total Food & Staples Retailing | | | | | | | | | 45,341,967 | |
| | | | Food Products – 3.6% | | | | | | | | | | |
| | | | | |
| | 757,633 | | | Archer-Daniels-Midland Company | | | | | | | | | 22,365,326 | |
| | | | | |
| | 822,700 | | | Smithfield Foods, Inc., (2) | | | | | | | | | 17,795,001 | |
| | | | Total Food Products | | | | | | | | | 40,160,327 | |
| | | | Health Care Equipment & Supplies – 0.6% | | | | | | | | | | |
| | | | | |
| | 96,575 | | | Zimmer Holdings, Inc. | | | | | | | | | 6,215,567 | |
| | | | Insurance – 11.2% | | | | | | | | | | |
| | | | | |
| | 3,019,830 | | | Ageas, ADR | | | | | | | | | 5,737,677 | |
| | | | | |
| | 1,072,077 | | | American International Group, (2) | | | | | | | | | 34,402,951 | |
| | | | | |
| | 387,332 | | | AON PLC | | | | | | | | | 18,119,391 | |
| | | | | |
| | 372,226 | | | Axis Capital Holdings Limited | | | | | | | | | 12,115,956 | |
| | | | | |
| | 317,646 | | | Endurance Specialty Holdings Limited | | | | | | | | | 12,172,195 | |
| | | | | |
| | 717,921 | | | Loews Corporation | | | | | | | | | 29,370,148 | |
| | | | | |
| | 1,766,340 | | | Old Republic International Corporation | | | | | | | | | 14,642,959 | |
| | | | Total Insurance | | | | | | | | | 126,561,277 | |
| | | | IT Services – 1.5% | | | | | | | | | | |
| | | | | |
| | 699,950 | | | Computer Sciences Corporation | | | | | | | | | 17,372,759 | |
| | | | Machinery – 1.3% | | | | | | | | | | |
| | | | | |
| | 249,680 | | | AGCO Corporation, (2) | | | | | | | | | 11,417,866 | |
| | | | | |
| | 50,657 | | | Japan Steel Works Limited, ADR | | | | | | | | | 2,753,208 | |
| | | | Total Machinery | | | | | | | | | 14,171,074 | |
| | | | Media – 1.4% | | | | | | | | | | |
| | | | | |
| | 121,420 | | | Scholastic Corporation | | | | | | | | | 3,419,187 | |
| | | | | |
| | 146,311 | | | Time Warner Cable, Class A | | | | | | | | | 12,012,133 | |
| | | | Total Media | | | | | | | | | 15,431,320 | |
| | | | Metals & Mining – 15.7% | | | | | | | | | | |
| | | | | |
| | 1,190,703 | | | Barrick Gold Corporation | | | | | | | | | 44,734,712 | |
| | | | | |
| | 660,104 | | | Impala Platinum Holdings Limited, Sponsored ADR | | | | | | | | | 10,838,908 | |
| | | | | |
| | 4,800,600 | | | Kinross Gold Corporation | | | | | | | | | 39,124,890 | |
| | | | | |
| | 1,241,054 | | | Newcrest Mining Limited, Sponsored ADR | | | | | | | | | 29,214,411 | |
| | | | | |
| | 718,294 | | | Newmont Mining Corporation | | | | | | | | | 34,844,442 | |
| | | | | |
| | 1,983,975 | | | NovaGold Resources Inc., (2) | | | | | | | | | 10,475,388 | |
| | | | | |
| | 714,514 | | | Silver Standard Resources, Inc., (2) | | | | | | | | | 8,031,137 | |
| | | | Total Metals & Mining | | | | | | | | | 177,263,888 | |
| | | | Oil, Gas & Consumable Fuels – 15.3% | | | | | | | | | | |
| | | | | |
| | 3,411,449 | | | Arch Coal Inc. | | | | | | | | | 23,504,884 | |
| | | | | |
| | 1,845,725 | | | Cameco Corporation | | | | | | | | | 40,513,664 | |
| | | | | |
| | 624,800 | | | Chesapeake Energy Corporation | | | | | | | | | 11,621,280 | |
| | | | | |
| | 567,411 | | | CONSOL Energy Inc. | | | | | | | | | 17,158,509 | |
| | | | | |
| | 193,109 | | | Devon Energy Corporation | | | | | | | | | 11,198,391 | |
| | | | | |
| | 1,870,649 | | | Gazprom OAO, ADR | | | | | | | | | 17,771,166 | |
| | | | | |
| | 418,139 | | | Hess Corporation | | | | | | | | | 18,168,140 | |
| | | | | |
| | 491,494 | | | Peabody Energy Corporation | | | | | | | | | 12,051,433 | |
| | | | | | | | | | | | | | | | | | | | |
| Shares | | | Description (1) | | | | | | | | | | | Value | |
| | | | | | | | | | | | | | | | | | | | |
| | | | Oil, Gas & Consumable Fuels (continued) | | | | | | | | | | | | | | | | |
| | | | | |
| | 180,104 | | | Southwestern Energy Company, (2) | | | | | | | | | | | | | | $ | 5,750,721 | |
| | | | | |
| | 1,335,877 | | | Talisman Energy Inc. | | | | | | | | | | | | | | | 15,309,150 | |
| | | | Total Oil, Gas & Consumable Fuels | | | | | | | | | | | | | | | 173,047,338 | |
| | | | Paper & Forest Products – 1.0% | | | | | | | | | | | | | | | | |
| | | | | |
| | 1,889,000 | | | Stora Enso Oyj, ADR | | | | | | | | | | | | | | | 11,541,790 | |
| | | | Pharmaceuticals – 4.1% | | | | | | | | | | | | | | | | |
| | | | | |
| | 261,250 | | | Eli Lilly and Company | | | | | | | | | | | | | | | 11,210,238 | |
| | | | | |
| | 521,827 | | | Forest Laboratories, Inc., (2) | | | | | | | | | | | | | | | 18,258,727 | |
| | | | | |
| | 424,906 | | | Teva Pharmaceutical Industries Limited, Sponsored ADR | | | | | | | | | | | | | | | 16,758,293 | |
| | | | Total Pharmaceuticals | | | | | | | | | | | | | | | 46,227,258 | |
| | | | Professional Services – 0.5% | | | | | | | | | | | | | | | | |
| | | | | |
| | 157,967 | | | Manpower Inc. | | | | | | | | | | | | | | | 5,789,491 | |
| | | | Software – 2.6% | | | | | | | | | | | | | | | | |
| | | | | |
| | 970,117 | | | Microsoft Corporation | | | | | | | | | | | | | | | 29,675,875 | |
| | | | Specialty Retail – 0.6% | | | | | | | | | | | | | | | | |
| | | | | |
| | 297,353 | | | Best Buy Co., Inc. | | | | | | | | | | | | | | | 6,232,519 | |
| | | | Wireless Telecommunication Services – 2.4% | | | | | | | | | | | | | | | | |
| | | | | |
| | 964,372 | | | NII Holdings Inc., Class B, (2) | | | | | | | | | | | | | | | 9,865,526 | |
| | | | | |
| | 527,783 | | | SK Telecom Company Limited, ADR | | | | | | | | | | | | | | | 6,386,174 | |
| | | | | |
| | 888,022 | | | Turkcell Iletisim Hizmetleri A.S., ADR, (2) | | | | | | | | | | | | | | | 11,144,676 | |
| | | | Total Wireless Telecommunication Services | | | | | | | | | | | | | | | 27,396,376 | |
| | | | Total Common Stocks (cost $1,115,256,114) | | | | | | | | | | | | | | | 1,088,264,301 | |
| | | | | |
Principal
Amount (000) | | | Description (1) | | Coupon | | | Maturity | | | Ratings (3) | | | Value | |
| | | | CONVERTIBLE BONDS – 0.7% | | | | | | | | | | | | | | | | |
| | | | | |
| | | | Oil, Gas & Consumable Fuels – 0.7% | | | | | | | | | | | | | | | | |
| | | | | |
| $ | 15,731 | | | USEC Inc. | | | 3.000% | | | | 10/01/14 | | | | Caa2 | | | $ | 7,629,535 | |
| $ | 15,731 | | | Total Convertible Bonds (cost $13,292,130) | | | | | | | | | | | | | | | 7,629,535 | |
| | | | | |
Principal
Amount (000) | | | Description (1) | | Coupon | | | Maturity | | | | | | Value | |
| | | | SHORT-TERM INVESTMENTS – 2.3% | | | | | | | | | | | | | | | | |
| | | | | |
| $ | 26,647 | | | Repurchase Agreement with Fixed Income Clearing Corporation, dated 6/29/12, repurchase price $26,646,696, collateralized by:
$3,625,000 U.S. Treasury Bonds, 4.625%, due 2/15/40, value
$5,076,008, $18,760,000 U.S. Treasury Notes, 2.750%, due
2/15/19, value $20,987,750 and $1,085,000 U.S. Treasury Notes,
1.500%, due 3/31/19, value $1,120,263 | | | 0.010% | | | | 7/02/12 | | | | | | | $ | 26,646,674 | |
| | | | Total Short-Term Investments (cost $26,646,674) | | | | | | | | | | | | | | | 26,646,674 | |
| | | | Total Investments (cost $1,155,194,918) – 99.5% | | | | | | | | | | | | | | | 1,122,540,510 | |
| | | | Other Assets Less Liabilities – 0.5% | | | | | | | | | | | | | | | 5,404,980 | |
| | | | Net Assets – 100% | | | | | | | | | | | | | | $ | 1,127,945,490 | |
Portfolio of Investments
Nuveen Tradewinds Value Opportunities Fund (continued)
June 30, 2012
| | | | For Fund portfolio compliance purposes, the Fund’s industry classifications refer to any one or more of the industry sub-classifications used by one or more widely recognized market indexes or ratings group indexes, and/or as defined by the Fund management. This definition may not apply for purposes of this report, which may combine industry sub-classifications into sectors for reporting ease. |
| | (1) | | All percentages shown in the Portfolio of Investments are based on net assets. |
| | (2) | | Non-income producing; issuer has not declared a dividend within the past twelve months. |
| | (3) | | Ratings (not covered by the report of independent registered public accounting firm): Using the highest of Standard & Poor’s Group (“Standard & Poor’s”), Moody’s Investors Service, Inc. (“Moody’s”) or Fitch, Inc. (“Fitch”) rating. Ratings below BBB by Standard & Poor’s, Baa by Moody’s or BBB by Fitch are considered to be below investment grade. |
| | ADR | | American Depositary Receipt. |
See accompanying notes to financial statements.
Statement of Assets and Liabilities
June 30, 2012
| | | | | | | | | | | | | | | | | | | | | | | | |
| | | Multi-Manager
Large-Cap Value | | | Multi-Cap
Value | | | Large-Cap
Value | | | Small/Mid- Cap Value | | | Small-Cap
Value | | | Value
Opportunities | |
Assets | | | | | | | | | | | | | | | | | | | | | | | | |
Investments, at value (cost $261,308,644, $160,165,057, $1,135,149,256, $19,413,523, $91,533,486 and $1,155,194,918 respectively) | | $ | 299,622,307 | | | $ | 170,709,302 | | | $ | 1,106,459,698 | | | $ | 21,821,779 | | | $ | 102,841,921 | | | $ | 1,122,540,510 | |
Cash | | | 13,501 | | | | — | | | | — | | | | — | | | | — | | | | — | |
Receivables: | | | | | | | | | | | | | | | | | | | | | | | | |
Dividends | | | 607,952 | | | | 151,190 | | | | 1,225,829 | | | | 5,667 | | | | 45,683 | | | | 2,054,878 | |
Interest | | | — | | | | — | | | | 25 | | | | — | | | | — | | | | 117,997 | |
Investments sold | | | 3,142,486 | | | | — | | | | — | | | | 122,304 | | | | 38,711 | | | | 66,175,550 | |
Shares sold | | | 176,207 | | | | 80,060 | | | | 4,040,812 | | | | 102,573 | | | | 192,971 | | | | 2,866,085 | |
Other assets | | | 106,101 | | | | 48,405 | | | | 5,582 | | | | 16 | | | | 95 | | | | 84,077 | |
Total assets | | | 303,668,554 | | | | 170,988,957 | | | | 1,111,731,946 | | | | 22,052,339 | | | | 103,119,381 | | | | 1,193,839,097 | |
Liabilities | | | | | | | | | | | | | | | | | | | | | | | | |
Payables: | | | | | | | | | | | | | | | | | | | | | | | | |
Investments purchased | | | 2,102,011 | | | | — | | | | 957,800 | | | | 26,774 | | | | — | | | | 48,395,392 | |
Shares redeemed | | | 688,227 | | | | 455,048 | | | | 1,423,557 | | | | 3,715 | | | | 227,731 | | | | 15,365,770 | |
Accrued expenses: | | | | | | | | | | | | | | | | | | | | | | | | |
Management fees | | | 174,944 | | | | 111,893 | | | | 670,610 | | | | 8,322 | | | | 84,721 | | | | 770,530 | |
12b-1 distribution and service fees | | | 65,486 | | | | 57,897 | | | | 13,421 | | | | 2,517 | | | | 4,839 | | | | 300,794 | |
Other | | | 122,041 | | | | 216,462 | | | | 368,529 | | | | 59,804 | | | | 101,458 | | | | 1,061,121 | |
Total liabilities | | | 3,152,709 | | | | 841,300 | | | | 3,433,917 | | | | 101,132 | | | | 418,749 | | | | 65,893,607 | |
Net assets | | $ | 300,515,845 | | | $ | 170,147,657 | | | $ | 1,108,298,029 | | | $ | 21,951,207 | | | $ | 102,700,632 | | | $ | 1,127,945,490 | |
Class A Shares | | | | | | | | | | | | | | | | | | | | | | | | |
Net assets | | $ | 258,324,311 | | | $ | 42,088,809 | | | $ | 39,939,957 | | | $ | 4,670,689 | | | $ | 7,107,194 | | | $ | 492,396,921 | |
Shares outstanding | | | 12,893,725 | | | | 2,300,582 | | | | 2,371,293 | | | | 237,881 | | | | 273,269 | | | | 17,273,615 | |
Net asset value per share | | $ | 20.03 | | | $ | 18.29 | | | $ | 16.84 | | | $ | 19.63 | | | $ | 26.01 | | | $ | 28.51 | |
Offering price per share (net asset value per share plus maximum sales charge of 5.75% of offering price) | | $ | 21.25 | | | $ | 19.41 | | | $ | 17.87 | | | $ | 20.83 | | | $ | 27.60 | | | $ | 30.25 | |
Class B Shares | | | | | | | | | | | | | | | | | | | | | | | | |
Net assets | | $ | 925,904 | | | $ | 9,010,026 | | | | N/A | | | | N/A | | | | N/A | | | $ | 4,788,131 | |
Shares outstanding | | | 47,618 | | | | 518,503 | | | | N/A | | | | N/A | | | | N/A | | | | 172,415 | |
Net asset value and offering price per share | | $ | 19.44 | | | $ | 17.38 | | | | N/A | | | | N/A | | | | N/A | | | $ | 27.77 | |
Class C Shares | | | | | | | | | | | | | | | | | | | | | | | | |
Net assets | | $ | 16,643,655 | | | $ | 51,646,256 | | | $ | 6,902,624 | | | $ | 1,928,128 | | | $ | 4,308,467 | | | $ | 224,079,094 | |
Shares outstanding | | | 857,565 | | | | 2,972,237 | | | | 422,009 | | | | 102,479 | | | | 173,952 | | | | 8,071,519 | |
Net asset value and offering price per share | | $ | 19.41 | | | $ | 17.38 | | | $ | 16.36 | | | $ | 18.81 | | | $ | 24.77 | | | $ | 27.76 | |
Class R3 Shares | | | | | | | | | | | | | | | | | | | | | | | | |
Net assets | | $ | 75,835 | | | $ | 152,752 | | | $ | 55,079 | | | $ | 202,306 | | | $ | 71,910 | | | $ | 6,297,948 | |
Shares outstanding | | | 3,766 | | | | 8,437 | | | | 3,281 | | | | 10,451 | | | | 2,767 | | | | 220,927 | |
Net asset value and offering price per share | | $ | 20.14 | | | $ | 18.11 | | | $ | 16.79 | | | $ | 19.36 | | | $ | 25.99 | | | $ | 28.51 | |
Class I Shares | | | | | | | | | | | | | | | | | | | | | | | | |
Net assets | | $ | 24,546,140 | | | $ | 67,249,814 | | | $ | 1,061,400,369 | | | $ | 15,150,084 | | | $ | 91,213,061 | | | $ | 400,383,396 | |
Shares outstanding | | | 1,219,760 | | | | 3,655,624 | | | | 62,913,644 | | | | 772,073 | | | | 3,470,030 | | | | 13,990,587 | |
Net asset value and offering price per share | | $ | 20.12 | | | $ | 18.40 | | | $ | 16.87 | | | $ | 19.62 | | | $ | 26.29 | | | $ | 28.62 | |
Net assets consist of: | | | | | | | | | | | | | | | | | | | | | | | | |
Capital paid-in | | $ | 318,478,311 | | | $ | 409,023,319 | | | $ | 1,128,149,248 | | | $ | 51,522,057 | | | $ | 135,559,056 | | | $ | 1,187,683,407 | |
Undistributed (Over-distribution of) net investment income | | | 3,933,280 | | | | 454,744 | | | | 6,801,997 | | | | (47,866 | ) | | | (247,085 | ) | | | 25,388,478 | |
Accumulated net realized gain (loss) | | | (60,209,585 | ) | | | (249,874,753 | ) | | | 2,035,668 | | | | (31,931,240 | ) | | | (43,919,774 | ) | | | (52,473,210 | ) |
Net unrealized appreciation (depreciation) | | | 38,313,839 | | | | 10,544,347 | | | | (28,688,884 | ) | | | 2,408,256 | | | | 11,308,435 | | | | (32,653,185 | ) |
Net assets | | $ | 300,515,845 | | | $ | 170,147,657 | | | $ | 1,108,298,029 | | | $ | 21,951,207 | | | $ | 102,700,632 | | | $ | 1,127,945,490 | |
Authorized shares | | | Unlimited | | | | Unlimited | | | | Unlimited | | | | Unlimited | | | | Unlimited | | | | Unlimited | |
Par value per share | | $ | 0.01 | | | $ | 0.01 | | | $ | 0.01 | | | $ | 0.01 | | | $ | 0.01 | | | $ | 0.01 | |
| N/A — | Large-Cap Value, Small/Mid-Cap Value and Small-Cap Value do not offer Class B Shares. Class B Shares of Large-Cap Value converted to Class A Shares at the close of business on February 15, 2012 and are no longer available for dividend reinvestment or through an exchange from other Nuveen mutual funds. |
See accompanying notes to financial statements.
Statement of Operations
Year Ended June 30, 2012
| | | | | | | | | | | | |
| | | Multi-Manager
Large-Cap Value | | | Multi-Cap Value | | | Large-Cap Value | |
Investment Income | | | | | | | | | | | | |
Dividends (net of foreign tax withheld of $75,244, $126,258 and $575,588, respectively) | | $ | 7,576,716 | | | $ | 3,820,598 | | | $ | 12,511,514 | |
Interest | | | 372 | | | | 449 | | | �� | 3,528 | |
Total investment income | | | 7,577,088 | | | | 3,821,047 | | | | 12,515,042 | |
Expenses | | | | | | | | | | | | |
Management fees | | | 2,173,758 | | | | 2,039,094 | | | | 4,146,324 | |
12b-1 service fees – Class A | | | 651,873 | | | | 126,028 | | | | 84,814 | |
12b-1 distribution and service fees – Class B | | | 12,351 | | | | 109,694 | | | | N/A | |
12b-1 distribution and service fees – Class C | | | 159,204 | | | | 585,774 | | | | 75,525 | |
12b-1 distribution and service fees – Class R3 | | | 602 | | | | 858 | | | | 280 | |
Shareholders’ servicing agent fees and expenses | | | 334,644 | | | | 466,704 | | | | 476,875 | |
Custodian’s fees and expenses | | | 74,028 | | | | 42,999 | | | | 70,345 | |
Trustees’ fees and expenses | | | 9,106 | | | | 7,585 | | | | 13,341 | |
Professional fees | | | 37,027 | | | | 36,370 | | | | 48,814 | |
Shareholders’ reports – printing and mailing expenses | | | 57,535 | | | | 87,243 | | | | 112,755 | |
Federal and state registration fees | | | 60,128 | | | | 28,917 | | | | 129,054 | |
Other expenses | | | 19,510 | | | | 16,961 | | | | 24,538 | |
Total expenses before custodian fee credit and expense reimbursement | | | 3,589,766 | | | | 3,548,227 | | | | 5,182,665 | |
Custodian fee credit | | | (20 | ) | | | (38 | ) | | | (47 | ) |
Expense reimbursement | | | — | | | | — | | | | — | |
Net expenses | | | 3,589,746 | | | | 3,548,189 | | | | 5,182,618 | |
Net investment income (loss) | | | 3,987,342 | | | | 272,858 | | | | 7,332,424 | |
Realized and Unrealized Gain (Loss) | | | | | | | | | | | | |
Net realized gain (loss) from investments and foreign currency | | | 11,456,296 | | | | 24,820,483 | | | | 4,498,099 | |
Change in net unrealized appreciation (depreciation) of investments and foreign currency | | | (17,674,329 | ) | | | (47,759,560 | ) | | | (75,767,040 | ) |
Net realized and unrealized gain (loss) | | | (6,218,033 | ) | | | (22,939,077 | ) | | | (71,268,941 | ) |
Net increase (decrease) in net assets from operations | | $ | (2,230,691 | ) | | $ | (22,666,219 | ) | | $ | (63,936,517 | ) |
| N/A — | Large-Cap Value does not offer Class B Shares. Class B Shares of Large-Cap Value converted to Class A Shares at the close of business on February 15, 2012 and are no longer available for dividend reinvestment or through an exchange from other Nuveen mutual funds. |
See accompanying notes to financial statements.
| | | | | | | | | | | | |
| | | Small/Mid
Cap Value | | | Small-Cap Value | | | Value Opportunities | |
Investment Income | | | | | | | | | | | | |
Dividends (net of foreign tax withheld of $—, $— and $3,069,951, respectively) | | $ | 194,038 | | | $ | 743,615 | | | $ | 56,822,184 | |
Interest | | | 81 | | | | 323 | | | | 5,477,698 | |
Total investment income | | | 194,119 | | | | 743,938 | | | | 62,299,882 | |
Expenses | | | | | | | | | | | | |
Management fees | | | 172,868 | | | | 899,600 | | | | 21,211,607 | |
12b-1 service fees – Class A | | | 14,753 | | | | 16,349 | | | | 2,687,237 | |
12b-1 distribution and service fees – Class B | | | N/A | | | | N/A | | | | 60,188 | |
12b-1 distribution and service fees – Class C | | | 15,236 | | | | 41,817 | | | | 3,774,957 | |
12b-1 distribution and service fees – Class R3 | | | 502 | | | | 362 | | | | 40,134 | |
Shareholders’ servicing agent fees and expenses | | | 38,668 | | | | 127,992 | | | | 2,851,813 | |
Custodian’s fees and expenses | | | 10,348 | | | | 21,291 | | | | 426,588 | |
Trustees’ fees and expenses | | | 814 | | | | 2,924 | | | | 84,371 | |
Professional fees | | | 19,985 | | | | 24,732 | | | | 238,560 | |
Shareholders’ reports – printing and mailing expenses | | | 17,339 | | | | 38,429 | | | | 735,585 | |
Federal and state registration fees | | | 30,266 | | | | 32,360 | | | | 8,099 | |
Other expenses | | | 8,432 | | | | 11,475 | | | | 129,144 | |
Total expenses before custodian fee credit and expense reimbursement | | | 329,211 | | | | 1,217,331 | | | | 32,248,283 | |
Custodian fee credit | | | (5 | ) | | | (6 | ) | | | (891 | ) |
Expense reimbursement | | | (58,934 | ) | | | — | | | | — | |
Net expenses | | | 270,272 | | | | 1,217,325 | | | | 32,247,392 | |
Net investment income (loss) | | | (76,153 | ) | | | (473,387 | ) | | | 30,052,490 | |
Realized and Unrealized Gain (Loss) | | | | | | | | | | | | |
Net realized gain (loss) from investments and foreign currency | | | 1,307,707 | | | | 12,299,332 | | | | (8,150,418 | ) |
Change in net unrealized appreciation (depreciation) of investments and foreign currency | | | (1,332,990 | ) | | | (9,342,539 | ) | | | (310,437,320 | ) |
Net realized and unrealized gain (loss) | | | (25,283 | ) | | | 2,956,793 | | | | (318,587,738 | ) |
Net increase (decrease) in net assets from operations | | $ | (101,436 | ) | | $ | 2,483,406 | | | $ | (288,535,248 | ) |
| N/A | — Small/Mid-Cap Value and Small-Cap Value do not offer Class B Shares. |
See accompanying notes to financial statements.
Statement of Changes in Net Assets
| | | | | | | | | | | | | | | | |
| | | Multi-Manager Large-Cap Value | | | Multi-Cap Value | |
| | | Year Ended
6/30/12 | | | Year Ended
6/30/11 | | | Year Ended
6/30/12 | | | Year Ended
6/30/11 | |
Operations | | | | | | | | | | | | | | | | |
Net investment income (loss) | | $ | 3,987,342 | | | $ | 3,627,880 | | | $ | 272,858 | | | $ | (445,594 | ) |
Net realized gain (loss) from: | | | | | | | | | | | | | | | | |
Investments and foreign currency | | | 11,456,296 | | | | 28,249,798 | | | | 24,820,483 | | | | 21,484,838 | |
Redemptions in-kind | | | — | | | | — | | | | — | | | | — | |
Change in net unrealized appreciation (depreciation) of investments and foreign currency | | | (17,674,329 | ) | | | 46,238,142 | | | | (47,759,560 | ) | | | 76,177,341 | |
Net increase (decrease) in net assets from operations | | | (2,230,691 | ) | | | 78,115,820 | | | | (22,666,219 | ) | | | 97,216,585 | |
Distributions to Shareholders | | | | | | | | | | | | | | | | |
From net investment income: | | | | | | | | | | | | | | | | |
Class A | | | (3,241,771 | ) | | | (3,374,398 | ) | | | — | | | | — | |
Class B | | | (6,060 | ) | | | (9,369 | ) | | | — | | | | — | |
Class C | | | (79,394 | ) | | | (82,745 | ) | | | — | | �� | | — | |
Class R3 | | | (1,708 | ) | | | (495 | ) | | | — | | | | — | |
Class I | | | (366,885 | ) | | | (388,686 | ) | | | — | | | | — | |
From accumulated net realized gains: | | | | | | | | | | | | | | | | |
Class A | | | — | | | | — | | | | — | | | | — | |
Class B | | | — | | | | — | | | | — | | | | — | |
Class C | | | — | | | | — | | | | — | | | | — | |
Class R3 | | | — | | | | — | | | | — | | | | — | |
Class I | | | — | | | | — | | | | — | | | | — | |
Decrease in net assets from distributions to shareholders | | | (3,695,818 | ) | | | (3,855,693 | ) | | | — | | | | — | |
Fund Share Transactions | | | | | | | | | | | | | | | | |
Proceeds from sale of shares | | | 21,346,603 | | | | 31,376,189 | | | | 35,004,423 | | | | 102,534,298 | |
Proceeds from shares issued to shareholders due to reinvestment of distributions | | | 3,008,329 | | | | 3,040,868 | | | | — | | | | — | |
| | | 24,354,932 | | | | 34,417,057 | | | | 35,004,423 | | | | 102,534,298 | |
Cost of shares redeemed | | | (62,597,297 | ) | | | (59,347,740 | ) | | | (209,204,482 | ) | | | (204,384,238 | ) |
Cost of redemptions in-kind | | | — | | | | — | | | | — | | | | — | |
Net increase (decrease) in net assets from Fund share transactions | | | (38,242,365 | ) | | | (24,930,683 | ) | | | (174,200,059 | ) | | | (101,849,940 | ) |
Net increase (decrease) in net assets | | | (44,168,874 | ) | | | 49,329,444 | | | | (196,866,278 | ) | | | (4,633,355 | ) |
Net assets at the beginning of period | | | 344,684,719 | | | | 295,355,275 | | | | 367,013,935 | | | | 371,647,290 | |
Net assets at the end of period | | $ | 300,515,845 | | | $ | 344,684,719 | | | $ | 170,147,657 | | | $ | 367,013,935 | |
Undistributed (Over-distribution of) net investment income at the end of period | | $ | 3,933,280 | | | $ | 3,641,860 | | | $ | 454,744 | | | $ | (53,182 | ) |
See accompanying notes to financial statements.
| | | | | | | | | | | | | | | | |
| | | Large-Cap Value | | | Small/Mid-Cap Value | |
| | | Year Ended
6/30/12 | | | Year Ended
6/30/11 | | | Year Ended
6/30/12 | | | Year Ended
6/30/11 | |
Operations | | | | | | | | | | | | | | | | |
Net investment income (loss) | | $ | 7,332,424 | | | $ | 1,432,478 | | | $ | (76,153 | ) | | $ | (63,507 | ) |
Net realized gain (loss) from: | | | | | | | | | | | | | | | | |
Investments and foreign currency | | | 4,498,099 | | | | 7,285,480 | | | | 1,307,707 | | | | 1,980,649 | |
Redemptions in-kind | | | — | | | | (2,103,361 | ) | | | — | | | | — | |
Change in net unrealized appreciation (depreciation) of investments and foreign currency | | | (75,767,040 | ) | | | 61,059,587 | | | | (1,332,990 | ) | | | 2,631,331 | |
Net increase (decrease) in net assets from operations | | | (63,936,517 | ) | | | 67,674,184 | | | | (101,436 | ) | | | 4,548,473 | |
Distributions to Shareholders | | | | | | | | | | | | | | | | |
From net investment income: | | | | | | | | | | | | | | | | |
Class A | | | (28,665 | ) | | | (31,669 | ) | | | — | | | | — | |
Class B | | | N/A | | | | — | | | | N/A | | | | N/A | |
Class C | | | — | | | | — | | | | — | | | | — | |
Class R3 | | | — | | | | — | | | | — | | | | — | |
Class I | | | (1,469,402 | ) | | | (1,171,295 | ) | | | — | | | | — | |
From accumulated net realized gains: | | | | | | | | | | | | | | | | |
Class A | | | (414,075 | ) | | | — | | | | — | | | | — | |
Class B | | | N/A | | | | — | | | | N/A | | | | N/A | |
Class C | | | (94,389 | ) | | | — | | | | — | | | | — | |
Class R3 | | | (689 | ) | | | — | | | | — | | | | — | |
Class I | | | (5,198,771 | ) | | | — | | | | — | | | | — | |
Decrease in net assets from distributions to shareholders | | | (7,205,991 | ) | | | (1,202,964 | ) | | | — | | | | — | |
Fund Share Transactions | | | | | | | | | | | | | | | | |
Proceeds from sale of shares | | | 937,871,289 | | | | 243,412,496 | | | | 15,399,908 | | | | 10,589,304 | |
Proceeds from shares issued to shareholders due to reinvestment of distributions | | | 6,174,282 | | | | 1,143,195 | | | | — | | | | — | |
| | | 944,045,571 | | | | 244,555,691 | | | | 15,399,908 | | | | 10,589,304 | |
Cost of shares redeemed | | | (200,902,815 | ) | | | (133,179,546 | ) | | | (14,685,678 | ) | | | (5,034,171 | ) |
Cost of redemptions in-kind | | | — | | | | (14,097,131 | ) | | | — | | | | — | |
Net increase (decrease) in net assets from Fund share transactions | | | 743,142,756 | | | | 97,279,014 | | | | 714,230 | | | | 5,555,133 | |
Net increase (decrease) in net assets | | | 672,000,248 | | | | 163,750,234 | | | | 612,794 | | | | 10,103,606 | |
Net assets at the beginning of period | | | 436,297,781 | | | | 272,547,547 | | | | 21,338,413 | | | | 11,234,807 | |
Net assets at the end of period | | $ | 1,108,298,029 | | | $ | 436,297,781 | | | $ | 21,951,207 | | | $ | 21,338,413 | |
Undistributed (Over-distribution of) net investment income at the end of period | | $ | 6,801,997 | | | $ | 968,738 | | | $ | (47,866 | ) | | $ | — | |
| N/A — | Large-Cap Value and Small/Mid-Cap Value do not offer Class B Shares. Class B Shares of Large-Cap Value converted to Class A Shares at close of business on February 15, 2012 and are no longer available for dividend reinvestment or through an exchange from other Nuveen mutual funds. |
See accompanying notes to financial statements.
Statement of Changes in Net Assets (continued)
| | | | | | | | | | | | | | | | |
| | | Small-Cap Value | | | Value Opportunities | |
| | | Year Ended
6/30/12 | | | Year Ended
6/30/11 | | | Year Ended
6/30/12 | | | Year Ended
6/30/11 | |
Operations | | | | | | | | | | | | | | | | |
Net investment income (loss) | | $ | (473,387 | ) | | $ | (710,456 | ) | | $ | 30,052,490 | | | $ | 19,030,540 | |
Net realized gain (loss) from: | | | | | | | | | | | | | | | | |
Investments and foreign currency | | | 12,299,332 | | | | 12,240,975 | | | | (8,150,418 | ) | | | 320,911,163 | |
Redemptions in-kind | | | — | | | | — | | | | — | | | | — | |
Change in net unrealized appreciation (depreciation) of
investments and foreign currency | | | (9,342,539 | ) | | | 22,021,396 | | | | (310,437,320 | ) | | | 172,998,798 | |
Net increase (decrease) in net assets from operations | | | 2,483,406 | | | | 33,551,915 | | | | (288,535,248 | ) | | | 512,940,501 | |
Distributions to Shareholders | | | | | | | | | | | | | | | | |
From net investment income: | | | | | | | | | | | | | | | | |
Class A | | | — | | | | — | | | | (30,516,121 | ) | | | (15,223,937 | ) |
Class B | | | N/A | | | | N/A | | | | (93,629 | ) | | | (52,942 | ) |
Class C | | | — | | | | — | | | | (6,159,226 | ) | | | (2,428,403 | ) |
Class R3 | | | — | | | | — | | | | (172,981 | ) | | | (33,059 | ) |
Class I | | | — | | | | — | | | | (38,927,620 | ) | | | (22,462,376 | ) |
From accumulated net realized gains: | | | | | | | | | | | | | | | | |
Class A | | | — | | | | — | | | | (74,345,248 | ) | | | (32,302,076 | ) |
Class B | | | N/A | | | | N/A | | | | (375,408 | ) | | | (224,961 | ) |
Class C | | | — | | | | — | | | | (24,536,785 | ) | | | (9,988,549 | ) |
Class R3 | | | — | | | | — | | | | (486,200 | ) | | | (72,577 | ) |
Class I | | | — | | | | — | | | | (90,830,654 | ) | | | (41,366,702 | ) |
Decrease in net assets from distributions to shareholders | | | — | | | | — | | | | (266,443,872 | ) | | | (124,155,582 | ) |
Fund Share Transactions | | | | | | | | | | | | | | | | |
Proceeds from sale of shares | | | 33,355,544 | | | | 41,569,383 | | | | 874,992,201 | | | | 1,972,518,147 | |
Proceeds from shares issued to shareholders due to reinvestment of distributions | | | — | | | | — | | | | 204,685,951 | | | | 92,637,725 | |
| | | 33,355,544 | | | | 41,569,383 | | | | 1,079,678,152 | | | | 2,065,155,872 | |
Cost of shares redeemed | | | (30,116,155 | ) | | | (63,521,319 | ) | | | (2,887,574,384 | ) | | | (867,673,014 | ) |
Cost of redemptions in-kind | | | — | | | | — | | | | — | | | | — | |
Net increase (decrease) in net assets from Fund share transactions | | | 3,239,389 | | | | (21,951,936 | ) | | | (1,807,896,232 | ) | | | 1,197,482,858 | |
Net increase (decrease) in net assets | | | 5,722,795 | | | | 11,599,979 | | | | (2,362,875,352 | ) | | | 1,586,267,777 | |
Net assets at the beginning of period | | | 96,977,837 | | | | 85,377,858 | | | | 3,490,820,842 | | | | 1,904,553,065 | |
Net assets at the end of period | | $ | 102,700,632 | | | $ | 96,977,837 | | | $ | 1,127,945,490 | | | $ | 3,490,820,842 | |
Undistributed (Over-distribution of) net investment income at the end of period | | $ | (247,085 | ) | | $ | — | | | $ | 25,388,478 | | | $ | 56,608,504 | |
| N/A — | Small-Cap Value does not offer Class B Shares. |
See accompanying notes to financial statements.
[THIS PAGE INTENTIONALLY LEFT BLANK]
Financial Highlights
| | | | | | | | | | | | | | | | | | | | | | | | | | | | | | | | |
| Selected data for a share outstanding throughout each period: | | | | |
| | | | | | |
| Class (Commencement Date) | | | | | | | | | | | | | | | | | | | |
| | | | | | Investment Operations | | | Less Distributions | | | | |
| | | | | |
MULTI-MANAGER LARGE-CAP VALUE | | | | | | | | | | | | | | | | |
Year Ended
June 30, | | Beginning
Net
Asset
Value | | | Net
Invest-
ment
Income
(Loss)(a) | | | Net
Realized/
Unrealized
Gain
(Loss) | | | Total | | | Net
Invest-
ment
Income | | | Capital
Gains(b) | | | Total | | | Ending
Net
Asset
Value | |
Class A (8/96) | | | | | | | | | | | | | | | | | | | | | | | | | | | | | |
2012 | | $ | 20.25 | | | $ | .26 | | | $ | (.24 | ) | | $ | .02 | | | $ | (.24 | ) | | $ | — | | | $ | (.24 | ) | | $ | 20.03 | |
2011 | | | 16.11 | | | | .21 | | | | 4.15 | | | | 4.36 | | | | (.22 | ) | | | — | | | | (.22 | ) | | | 20.25 | |
2010 | | | 14.23 | | | | .16 | | | | 2.02 | | | | 2.18 | | | | (.30 | ) | | | — | | | | (.30 | ) | | | 16.11 | |
2009 | | | 22.53 | | | | .29 | | | | (6.82 | ) | | | (6.53 | ) | | | (.19 | ) | | | (1.58 | ) | | | (1.77 | ) | | | 14.23 | |
2008 | | | 30.05 | | | | .32 | | | | (3.15 | ) | | | (2.83 | ) | | | (.30 | ) | | | (4.39 | ) | | | (4.69 | ) | | | 22.53 | |
Class B (8/96) | | | | | | | | | | | | | | | | | | | | | | | | | | | | | |
2012 | | | 19.65 | | | | .11 | | | | (.23 | ) | | | (.12 | ) | | | (.09 | ) | | | — | | | | (.09 | ) | | | 19.44 | |
2011 | | | 15.65 | | | | .06 | | | | 4.03 | | | | 4.09 | | | | (.09 | ) | | | — | | | | (.09 | ) | | | 19.65 | |
2010 | | | 13.84 | | | | .04 | | | | 1.96 | | | | 2.00 | | | | (.19 | ) | | | — | | | | (.19 | ) | | | 15.65 | |
2009 | | | 21.90 | | | | .18 | | | | (6.63 | ) | | | (6.45 | ) | | | (.03 | ) | | | (1.58 | ) | | | (1.61 | ) | | | 13.84 | |
2008 | | | 29.32 | | | | .11 | | | | (3.06 | ) | | | (2.95 | ) | | | (.08 | ) | | | (4.39 | ) | | | (4.47 | ) | | | 21.90 | |
Class C (8/96) | | | | | | | | | | | | | | | | | | | | | | | | | | | | | |
2012 | | | 19.61 | | | | .11 | | | | (.22 | ) | | | (.11 | ) | | | (.09 | ) | | | — | | | | (.09 | ) | | | 19.41 | |
2011 | | | 15.61 | | | | .06 | | | | 4.03 | | | | 4.09 | | | | (.09 | ) | | | — | | | | (.09 | ) | | | 19.61 | |
2010 | | | 13.80 | | | | .04 | | | | 1.96 | | | | 2.00 | | | | (.19 | ) | | | — | | | | (.19 | ) | | | 15.61 | |
2009 | | | 21.86 | | | | .17 | | | | (6.62 | ) | | | (6.45 | ) | | | (.03 | ) | | | (1.58 | ) | | | (1.61 | ) | | | 13.80 | |
2008 | | | 29.27 | | | | .12 | | | | (3.06 | ) | | | (2.94 | ) | | | (.08 | ) | | | (4.39 | ) | | | (4.47 | ) | | | 21.86 | |
Class R3 (8/08) | | | | | | | | | | | | | | | | | | | | | | | | | | | | | |
2012 | | | 20.34 | | | | .22 | | | | (.23 | ) | | | (.01 | ) | | | (.19 | ) | | | — | | | | (.19 | ) | | | 20.14 | |
2011 | | | 16.19 | | | | .18 | | | | 4.15 | | | | 4.33 | | | | (.18 | ) | | | — | | | | (.18 | ) | | | 20.34 | |
2010 | | | 14.31 | | | | .12 | | | | 2.03 | | | | 2.15 | | | | (.27 | ) | | | — | | | | (.27 | ) | | | 16.19 | |
2009(f) | | | 22.05 | | | | .23 | | | | (6.25 | ) | | | (6.02 | ) | | | (.14 | ) | | | (1.58 | ) | | | (1.72 | ) | | | 14.31 | |
Class I (8/96) | | | | | | | | | | | | | | | | | | | | | | | | | | | | | |
2012 | | | 20.34 | | | | .31 | | | | (.24 | ) | | | .07 | | | | (.29 | ) | | | — | | | | (.29 | ) | | | 20.12 | |
2011 | | | 16.18 | | | | .26 | | | | 4.17 | | | | 4.43 | | | | (.27 | ) | | | — | | | | (.27 | ) | | | 20.34 | |
2010 | | | 14.28 | | | | .21 | | | | 2.03 | | | | 2.24 | | | | (.34 | ) | | | — | | | | (.34 | ) | | | 16.18 | |
2009 | | | 22.64 | | | | .33 | | | | (6.87 | ) | | | (6.54 | ) | | | (.24 | ) | | | (1.58 | ) | | | (1.82 | ) | | | 14.28 | |
2008 | | | 30.18 | | | | .39 | | | | (3.17 | ) | | | (2.78 | ) | | | (.37 | ) | | | (4.39 | ) | | | (4.76 | ) | | | 22.64 | |
| | | | | | | | | | | | | | | | | | | | | | | | | | |
| | | | | | | | | | | | | | | | | | | | |
| | | | |
| | | | | | | | | | | | | | |
| | | | Ratios/Supplemental Data | |
| | | | | | | Ratios to Average
Net Assets Before
Reimbursement(e) | | | Ratios to Average
Net Assets After
Reimbursement(d)(e) | | | | |
Total
Return(c) | | | Ending
Net
Assets
(000) | | | Expenses | | | Net
Invest-
ment
Income
(Loss) | | | Expenses | | | Net
Invest-
ment
Income
(Loss) | | | Portfolio
Turnover
Rate | |
| | | | | | | | | | | | | | | | | | | | | | | | | | |
| | .19 | % | | $ | 258,324 | | | | 1.16 | % | | | 1.33 | % | | | 1.16 | % | | | 1.33 | % | | | 99 | % |
| | 27.15 | | | | 295,093 | | | | 1.22 | | | | 1.07 | | | | 1.18 | | | | 1.11 | | | | 78 | |
| | 15.19 | | | | 254,730 | | | | 1.26 | | | | .91 | | | | 1.19 | | | | .97 | | | | 74 | |
| | (28.95 | ) | | | 239,210 | | | | 1.27 | | | | 1.71 | | | | 1.20 | | | | 1.83 | | | | 85 | |
| | (10.74 | ) | | | 389,240 | | | | 1.24 | | | | 1.20 | | | | 1.21 | | | | 1.23 | | | | 131 | |
| | | | | | | | | | | | | | | | | | | | | | | | | | |
| | (.56 | ) | | | 926 | | | | 1.91 | | | | .57 | | | | 1.91 | | | | .57 | | | | 99 | |
| | 26.23 | | | | 1,760 | | | | 1.97 | | | | .31 | | | | 1.93 | | | | .34 | | | | 78 | |
| | 14.26 | | | | 2,000 | | | | 2.01 | | | | .16 | | | | 1.94 | | | | .23 | | | | 74 | |
| | (29.46 | ) | | | 3,033 | | | | 2.01 | | | | .97 | | | | 1.95 | | | | 1.10 | | | | 85 | |
| | (11.39 | ) | | | 8,891 | | | | 1.99 | | | | .43 | | | | 1.96 | | | | .46 | | | | 131 | |
| | | | | | | | | | | | | | | | | | | | | | | | | | |
| | (.51 | ) | | | 16,644 | | | | 1.91 | | | | .58 | | | | 1.91 | | | | .58 | | | | 99 | |
| | 26.21 | | | | 17,518 | | | | 1.97 | | | | .32 | | | | 1.93 | | | | .36 | | | | 78 | |
| | 14.37 | | | | 15,565 | | | | 2.01 | | | | .16 | | | | 1.94 | | | | .22 | | | | 74 | |
| | (29.52 | ) | | | 15,803 | | | | 2.02 | | | | .96 | | | | 1.95 | | | | 1.08 | | | | 85 | |
| | (11.41 | ) | | | 25,007 | | | | 1.99 | | | | .45 | | | | 1.96 | | | | .48 | | | | 131 | |
| | | | | | | | | | | | | | | | | | | | | | | | | | |
| | .04 | | | | 76 | | | | 1.41 | | | | 1.14 | | | | 1.41 | | | | 1.14 | | | | 99 | |
| | 26.80 | | | | 164 | | | | 1.49 | | | | .91 | | | | 1.43 | | | | .97 | | | | 78 | |
| | 14.88 | | | | 110 | | | | 1.50 | | | | .66 | | | | 1.44 | | | | .72 | | | | 74 | |
| | (27.29 | ) | | | 97 | | | | 1.53 | * | | | 1.55 | * | | | 1.45 | * | | | 1.63 | * | | | 85 | |
| | | | | | | | | | | | | | | | | | | | | | | | | | |
| | .45 | | | | 24,546 | | | | .91 | | | | 1.59 | | | | .91 | | | | 1.59 | | | | 99 | |
| | 27.46 | | | | 30,150 | | | | .97 | | | | 1.32 | | | | .93 | | | | 1.36 | | | | 78 | |
| | 15.53 | | | | 22,950 | | | | 1.00 | | | | 1.16 | | | | .94 | | | | 1.22 | | | | 74 | |
| | (28.83 | ) | | | 16,604 | | | | 1.02 | | | | 1.95 | | | | .95 | | | | 2.08 | | | | 85 | |
| | (10.52 | ) | | | 23,684 | | | | .99 | | | | 1.45 | | | | .96 | | | | 1.48 | | | | 131 | |
| (a) | Per share Net Investment Income (Loss) is calculated using the average daily shares method. |
| (b) | Distributions from Capital Gains include short-term capital gains, if any. |
| (c) | Total return is the combination of changes in net asset value without any sales charge, reinvested dividend income at net asset value and reinvested capital gains distributions at net asset value, if any. Total returns are not annualized. |
| (d) | After expense reimbursement from the Adviser, where applicable. |
| (e) | Ratios do not reflect the effect of custodian fee credits earned on the Fund’s net cash on deposit with the custodian bank, where applicable. |
| (f) | For the period August 4, 2008 (commencement of operations) through June 30, 2009. |
See accompanying notes to financial statements.
Financial Highlights (continued)
| | | | | | | | | | | | | | | | | | | | | | | | | | | | | | | | | | | | |
| Selected data for a share outstanding throughout each period: | | | | | | | | | | | | | | | | |
| | | | | | | |
| Class (Commencement Date) | | | | | | | | | | | | | | | | | | | | | | |
| | | | | | Investment Operations | | | Less Distributions | | | | |
| | | | | | | | |
| MULTI-CAP VALUE | | | | | | | | | | | | | | | | | | | | | | | | | |
Year Ended
June 30, | | Beginning
Net
Asset
Value | | | Net
Invest-
ment
Income
(Loss)(a) | | | Net
Realized/
Unrealized
Gain
(Loss) | | | Total | | | Net
Invest-
ment
Income | | | Capital
Gains(b) | | | Return
of
Capital | | | Total | | | Ending
Net
Asset
Value | |
Class A (12/02) | | | | | | | | | | | | | | | | | | | | | | | | | | | | | | | | | | | | |
2012 | | $ | 19.11 | | | $ | .04 | | | $ | (.86 | ) | | $ | (.82 | ) | | $ | — | | | $ | — | | | $ | — | | | $ | — | | | $ | 18.29 | |
2011 | | | 14.73 | | | | (.02 | ) | | | 4.40 | | | | 4.38 | | | | — | | | | — | | | | — | | | | — | | | | 19.11 | |
2010 | | | 12.22 | | | | (.06 | ) | | | 2.61 | | | | 2.55 | | | | (.03 | ) | | | — | | | | (.01 | ) | | | (.04 | ) | | | 14.73 | |
2009 | | | 18.54 | | | | .04 | | | | (6.36 | ) | | | (6.32 | ) | | | — | | | | — | | | | — | | | | — | | | | 12.22 | |
2008 | | | 26.15 | | | | .04 | | | | (6.62 | ) | | | (6.58 | ) | | | (.02 | ) | | | (.94 | ) | | | (.07 | ) | | | (1.03 | ) | | | 18.54 | |
Class B (12/02) | | | | | | | | | | | | | | | | | | | | | | | | | | | | | | | | | | | | |
2012 | | | 18.29 | | | | (.10 | ) | | | (.81 | ) | | | (.91 | ) | | | — | | | | — | | | | — | | | | — | | | | 17.38 | |
2011 | | | 14.21 | | | | (.14 | ) | | | 4.22 | | | | 4.08 | | | | — | | | | — | | | | — | | | | — | | | | 18.29 | |
2010 | | | 11.84 | | | | (.16 | ) | | | 2.53 | | | | 2.37 | | | | — | | | | — | | | | — | | | | — | | | | 14.21 | |
2009 | | | 18.10 | | | | (.06 | ) | | | (6.20 | ) | | | (6.26 | ) | | | — | | | | — | | | | — | | | | — | | | | 11.84 | |
2008 | | | 25.64 | | | | (.13 | ) | | | (6.47 | ) | | | (6.60 | ) | | | — | | | | (.94 | ) | | | — | | | | (.94 | ) | | | 18.10 | |
Class C (12/02) | | | | | | | | | | | | | | | | | | | | | | | | | | | | | | | | | | | | |
2012 | | | 18.29 | | | | (.09 | ) | | | (.82 | ) | | | (.91 | ) | | | — | | | | — | | | | — | | | | — | | | | 17.38 | |
2011 | | | 14.21 | | | | (.14 | ) | | | 4.22 | | | | 4.08 | | | | — | | | | — | | | | — | | | | — | | | | 18.29 | |
2010 | | | 11.84 | | | | (.16 | ) | | | 2.53 | | | | 2.37 | | | | — | | | | — | | | | — | | | | — | | | | 14.21 | |
2009 | | | 18.10 | | | | (.06 | ) | | | (6.20 | ) | | | (6.26 | ) | | | — | | | | — | | | | — | | | | — | | | | 11.84 | |
2008 | | | 25.64 | | | | (.13 | ) | | | (6.47 | ) | | | (6.60 | ) | | | — | | | | (.94 | ) | | | — | | | | (.94 | ) | | | 18.10 | |
Class R3 (8/08) | | | | | | | | | | | | | | | | | | | | | | | | | | | | | | | | | | | | |
2012 | | | 18.96 | | | | — | ** | | | (.85 | ) | | | (.85 | ) | | | — | | | | — | | | | — | | | | — | | | | 18.11 | |
2011 | | | 14.66 | | | | (.06 | ) | | | 4.36 | | | | 4.30 | | | | — | | | | — | | | | — | | | | — | | | | 18.96 | |
2010 | | | 12.16 | | | | (.08 | ) | | | 2.59 | | | | 2.51 | | | | (.01 | ) | | | — | | | | — | ** | | | (.01 | ) | | | 14.66 | |
2009(e) | | | 17.60 | | | | .01 | | | | (5.45 | ) | | | (5.44 | ) | | | — | | | | — | | | | — | | | | — | | | | 12.16 | |
Class I (11/97) | | | | | | | | | | | | | | | | | | | | | | | | | | | | | | | | | | | | |
2012 | | | 19.17 | | | | .07 | | | | (.84 | ) | | | (.77 | ) | | | — | | | | — | | | | — | | | | — | | | | 18.40 | |
2011 | | | 14.74 | | | | .03 | | | | 4.40 | | | | 4.43 | | | | — | | | | — | | | | — | | | | — | | | | 19.17 | |
2010 | | | 12.22 | | | | (.01 | ) | | | 2.60 | | | | 2.59 | | | | (.05 | ) | | | — | | | | (.02 | ) | | | (.07 | ) | | | 14.74 | |
2009 | | | 18.50 | | | | .07 | | | | (6.35 | ) | | | (6.28 | ) | | | — | | | | — | | | | — | | | | — | | | | 12.22 | |
2008 | | | 26.09 | | | | .09 | | | | (6.59 | ) | | | (6.50 | ) | | | (.02 | ) | | | (.94 | ) | | | (.13 | ) | | | (1.09 | ) | | | 18.50 | |
| | | | | | | | | | | | | | | | | | |
| | | | | | | | | | | | | | |
| | |
| | | | | | | | |
| | | | Ratios/Supplemental Data | |
| | | |
| | | | | | | Ratios to Average
Net Assets(d) | | | | |
Total
Return(c) | | | Ending
Net
Assets
(000) | | | Expenses | | | Net
Invest-
ment
Income
(Loss) | | | Portfolio
Turnover
Rate | |
| | | | | | | | | | | | | | | | | | |
| | (4.29 | )% | | $ | 42,089 | | | | 1.32 | % | | | .20 | % | | | 37 | % |
| | 29.74 | | | | 61,438 | | | | 1.38 | | | | (.10 | ) | | | 24 | |
| | 20.85 | | | | 61,514 | | | | 1.47 | | | | (.38 | ) | | | 34 | |
| | (34.12 | ) | | | 76,785 | | | | 1.50 | | | | .27 | | | | 32 | |
| | (25.65 | ) | | | 293,777 | | | | 1.33 | | | | .17 | | | | 25 | |
| | | | | | | | | | | | | | | | | | |
| | (4.98 | ) | | | 9,010 | | | | 2.07 | | | | (.57 | ) | | | 37 | |
| | 28.71 | | | | 15,631 | | | | 2.13 | | | | (.85 | ) | | | 24 | |
| | 20.02 | | | | 16,016 | | | | 2.21 | | | | (1.12 | ) | | | 34 | |
| | (34.62 | ) | | | 16,599 | | | | 2.28 | | | | (.46 | ) | | | 32 | |
| | (26.20 | ) | | | 36,024 | | | | 2.08 | | | | (.59 | ) | | | 25 | |
| | | | | | | | | | | | | | | | | | |
| | (4.98 | ) | | | 51,646 | | | | 2.06 | | | | (.54 | ) | | | 37 | |
| | 28.71 | | | | 71,116 | | | | 2.13 | | | | (.84 | ) | | | 24 | |
| | 20.02 | | | | 71,209 | | | | 2.21 | | | | (1.13 | ) | | | 34 | |
| | (34.62 | ) | | | 78,225 | | | | 2.27 | | | | (.46 | ) | | | 32 | |
| | (26.20 | ) | | | 189,475 | | | | 2.08 | | | | (.58 | ) | | | 25 | |
| | | | | | | | | | | | | | | | | | |
| | (4.48 | ) | | | 153 | | | | 1.57 | | | | (.01 | ) | | | 37 | |
| | 29.33 | | | | 156 | | | | 1.63 | | | | (.32 | ) | | | 24 | |
| | 20.62 | | | | 202 | | | | 1.65 | | | | (.55 | ) | | | 34 | |
| | (30.91 | ) | | | 104 | | | | 1.81 | * | | | .12 | * | | | 32 | |
| | | | | | | | | | | | | | | | | | |
| | (4.02 | ) | | | 67,250 | | | | 1.07 | | | | .41 | | | | 37 | |
| | 30.05 | | | | 218,673 | | | | 1.13 | | | | .18 | | | | 24 | |
| | 21.18 | | | | 222,707 | | | | 1.18 | | | | (.08 | ) | | | 34 | |
| | (33.95 | ) | | | 227,320 | | | | 1.29 | | | | .55 | | | | 32 | |
| | (25.47 | ) | | | 274,886 | | | | 1.09 | | | | .39 | | | | 25 | |
| (a) | Per share Net Investment Income (Loss) is calculated using the average daily shares method. |
| (b) | Distributions from Capital Gains include short-term capital gains, if any. |
| (c) | Total return is the combination of changes in net asset value without any sales charge, reinvested dividend income at net asset value and reinvested capital gains distributions at net asset value, if any. Total returns are not annualized. |
| (d) | Ratios do not reflect the effect of custodian fee credits earned on the Fund’s net cash on deposit with the custodian bank, where applicable. |
| (e) | For the period August 4, 2008 (commencement of operations) through June 30, 2009. |
| ** | Rounds to less than $.01 per share. |
See accompanying notes to financial statements.
Financial Highlights (continued)
| | | | | | | | | | | | | | | | | | | | | | | | | | | | | | | | |
| Selected data for a share outstanding throughout each period: | | | | | | | | | | | | | | | | |
| | | | | | |
| Class (Commencement Date) | | | | | | | | | | | | | | | | | | | |
| | | | | | Investment Operations | | | Less Distributions | | | | |
| | | | | | | |
| LARGE-CAP VALUE | | | | | | | | | | | | | | | | | | | | | | |
Year Ended
June 30, | | Beginning
Net
Asset
Value | | | Net
Invest-
ment
Income (Loss)(a) | | | Net
Realized/
Unrealized
Gain (Loss) | | | Total | | | Net
Invest-
ment
Income | | | Capital
Gains(b) | | | Total | | | Ending
Net
Asset
Value | |
Class A (12/06) | | | | | | | | | | | | | | | | | | | | | | | | | | | | | |
2012 | | $ | 18.56 | | | $ | .14 | | | $ | (1.64 | ) | | $ | (1.50 | ) | | $ | (.01 | ) | | $ | (.21 | ) | | $ | (.22 | ) | | $ | 16.84 | |
2011 | | | 14.73 | | | | .03 | | | | 3.83 | | | | 3.86 | | | | (.03 | ) | | | — | | | | (.03 | ) | | | 18.56 | |
2010 | | | 12.71 | | | | .03 | | | | 1.99 | | | | 2.02 | | | | — | | | | — | | | | — | | | | 14.73 | |
2009 | | | 17.41 | | | | .10 | | | | (4.73 | ) | | | (4.63 | ) | | | (.07 | ) | | | — | | | | (.07 | ) | | | 12.71 | |
2008 | | | 21.38 | | | | .15 | | | | (4.04 | ) | | | (3.89 | ) | | | (.08 | ) | | | — | ** | | | (.08 | ) | | | 17.41 | |
Class C (12/06) | | | | | | | | | | | | | | | | | | | | | | | | | | | | | |
2012 | | | 18.15 | | | | .01 | | | | (1.59 | ) | | | (1.58 | ) | | | — | | | | (.21 | ) | | | (.21 | ) | | | 16.36 | |
2011 | | | 14.49 | | | | (.09 | ) | | | 3.75 | | | | 3.66 | | | | — | | | | — | | | | — | | | | 18.15 | |
2010 | | | 12.60 | | | | (.08 | ) | | | 1.97 | | | | 1.89 | | | | — | | | | — | | | | — | | | | 14.49 | |
2009 | | | 17.28 | | | | — | ** | | | (4.68 | ) | | | (4.68 | ) | | | — | | | | — | | | | — | | | | 12.60 | |
2008 | | | 21.30 | | | | — | ** | | | (4.02 | ) | | | (4.02 | ) | | | — | | | | — | ** | | | — | ** | | | 17.28 | |
Class R3 (9/09) | | | | | | | | | | | | | | | | | | | | | | | | | | | | | |
2012 | | | 18.53 | | | | .09 | | | | (1.62 | ) | | | (1.53 | ) | | | — | | | | (.21 | ) | | | (.21 | ) | | | 16.79 | |
2011 | | | 14.71 | | | | (.01 | ) | | | 3.83 | | | | 3.82 | | | | — | | | | — | | | | — | | | | 18.53 | |
2010(f) | | | 15.24 | | | | — | ** | | | (.53 | ) | | | (.53 | ) | | | — | | | | — | | | | — | | | | 14.71 | |
Class I (12/06) | | | | | | | | | | | | | | | | | | | | | | | | | | | | | |
2012 | | | 18.59 | | | | .22 | | | | (1.67 | ) | | | (1.45 | ) | | | (.06 | ) | | | (.21 | ) | | | (.27 | ) | | | 16.87 | |
2011 | | | 14.75 | | | | .08 | | | | 3.83 | | | | 3.91 | | | | (.07 | ) | | | — | | | | (.07 | ) | | | 18.59 | |
2010 | | | 12.72 | | | | .08 | | | | 1.97 | | | | 2.05 | | | | (.02 | ) | | | — | | | | (.02 | ) | | | 14.75 | |
2009 | | | 17.43 | | | | .12 | | | | (4.72 | ) | | | (4.60 | ) | | | (.11 | ) | | | — | | | | (.11 | ) | | | 12.72 | |
2008 | | | 21.41 | | | | .20 | | | | (4.05 | ) | | | (3.85 | ) | | | (.13 | ) | | | — | ** | | | (.13 | ) | | | 17.43 | |
| | | | | | | | | | | | | | | | | | | | | | | | | | |
| | | | | | | | | | | | | | | | | | | | |
| | | | |
| | | | | | | | | | | | | | |
| | | | Ratios/Supplemental Data | |
| | | | |
| | | | | | | Ratios to Average
Net Assets Before
Reimbursement(e) | | | Ratios to Average
Net Assets After
Reimbursement(d)(e) | | | | |
Total
Return(c) | | | Ending
Net
Assets
(000) | | | Expenses | | | Net
Invest-
ment
Income
(Loss) | | | Expenses | | | Net
Invest-
ment
Income
(Loss) | | | Portfolio
Turnover
Rate | |
| | | | | | | | | | | | | | | | | | | | | | | | | | |
| | (7.99 | )% | | $ | 39,940 | | | | 1.11 | % | | | .84 | % | | | 1.11 | % | | | .84 | % | | | 35 | % |
| | 26.22 | | | | 26,143 | | | | 1.20 | | | | .19 | | | | 1.20 | | | | .19 | | | | 27 | |
| | 15.89 | | | | 13,820 | | | | 1.32 | | | | .20 | | | | 1.32 | | | | .20 | | | | 15 | |
| | (26.57 | ) | | | 6,075 | | | | 1.61 | | | | .49 | | | | 1.35 | | | | .76 | | | | 16 | |
| | (18.24 | ) | | | 5,080 | | | | 1.66 | | | | .45 | | | | 1.33 | | | | .77 | | | | 13 | |
| | | | | | | | | | | | | | | | | | | | | | | | | | |
| | (8.64 | ) | | | 6,903 | | | | 1.86 | | | | .04 | | | | 1.86 | | | | .04 | | | | 35 | |
| | 25.26 | | | | 8,660 | | | | 1.95 | | | | (.55 | ) | | | 1.95 | | | | (.55 | ) | | | 27 | |
| | 15.00 | | | | 4,665 | | | | 2.07 | | | | (.55 | ) | | | 2.07 | | | | (.55 | ) | | | 15 | |
| | (27.13 | ) | | | 2,217 | | | | 2.37 | | | | (.25 | ) | | | 2.10 | | | | .02 | | | | 16 | |
| | (18.82 | ) | | | 2,484 | | | | 2.42 | | | | (.33 | ) | | | 2.08 | | | | — | *** | | | 13 | |
| | | | | | | | | | | | | | | | | | | | | | | | | | |
| | (8.19 | ) | | | 55 | | | | 1.36 | | | | .55 | | | | 1.36 | | | | .55 | | | | 35 | |
| | 25.97 | | | | 61 | | | | 1.45 | | | | (.06 | ) | | | 1.45 | | | | (.06 | ) | | | 27 | |
| | (3.48 | ) | | | 48 | | | | 1.58 | * | | | (.02 | )* | | | 1.58 | * | | | (.02 | )* | | | 15 | |
| | | | | | | | | | | | | | | | | | | | | | | | | | |
| | (7.73 | ) | | | 1,061,400 | | | | .85 | | | | 1.29 | | | | .85 | | | | 1.29 | | | | 35 | |
| | 26.54 | | | | 400,859 | | | | .95 | | | | .45 | | | | .95 | | | | .45 | | | | 27 | |
| | 16.13 | | | | 253,558 | | | | 1.08 | | | | .53 | | | | 1.08 | | | | .53 | | | | 15 | |
| | (26.35 | ) | | | 52,618 | | | | 1.36 | | | | .71 | | | | 1.10 | | | | .97 | | | | 16 | |
| | (18.05 | ) | | | 15,719 | | | | 1.40 | | | | .71 | | | | 1.08 | | | | 1.02 | | | | 13 | |
| (a) | Per share Net Investment Income (Loss) is calculated using the average daily shares method. |
| (b) | Distributions from Capital Gains include short-term capital gains, if any. |
| (c) | Total return is the combination of changes in net asset value without any sales charge, reinvested dividend income at net asset value and reinvested capital gains distributions at net asset value, if any. Total returns are not annualized. |
| (d) | After expense reimbursement from the Adviser, where applicable. |
| (e) | Ratios do not reflect the effect of custodian fee credits earned on the Fund’s net cash on deposit with the custodian bank, where applicable. |
| (f) | For the period September 29, 2009 (commencement of operations) through June 30, 2010. |
| ** | Rounds to less than $.01 per share. |
| *** | Rounds to less than .01%. |
See accompanying notes to financial statements.
Financial Highlights (continued)
| | | | | | | | | | | | | | | | | | | | | | | | | | | | | | | | |
| Selected data for a share outstanding throughout each period: | | | | | | | | | | | | | | | | |
| | | | | | |
| Class (Commencement Date) | | | | | | | | | | | | | | | | | | | |
| | | | | | Investment Operations | | | Less Distributions | | | | |
| | | | | | | |
| SMALL/MID-CAP VALUE | | | | | | | | | | | | | | | | | | | | | | |
Year Ended
June 30, | | Beginning
Net
Asset
Value | | | Net
Invest-
ment
Income
(Loss)(a) | | | Net
Realized/
Unrealized
Gain (Loss) | | | Total | | | Net
Invest-
ment
Income | | | Capital
Gains(b) | | | Total | | | Ending
Net
Asset
Value | |
Class A (12/06) | | | | | | | | | | | | | | | | | | | | | | | | | | | | | |
2012 | | $ | 19.91 | | | $ | (.09 | ) | | $ | (.19 | ) | | $ | (.28 | ) | | $ | — | | | $ | — | | | $ | — | | | $ | 19.63 | |
2011 | | | 14.32 | | | | (.09 | ) | | | 5.68 | | | | 5.59 | | | | — | | | | — | | | | — | | | | 19.91 | |
2010 | | | 11.05 | | | | (.09 | ) | | | 3.36 | | | | 3.27 | | | | — | | | | — | | | | — | | | | 14.32 | |
2009 | | | 17.12 | | | | — | ** | | | (6.07 | ) | | | (6.07 | ) | | | — | | | | — | | | | — | | | | 11.05 | |
2008 | | | 21.37 | | | | (.09 | ) | | | (4.16 | ) | | | (4.25 | ) | | | — | ** | | | — | | | | — | ** | | | 17.12 | |
Class C (12/06) | | | | | | | | | | | | | | | | | | | | | | | | | | | | | |
2012 | | | 19.22 | | | | (.23 | ) | | | (.18 | ) | | | (.41 | ) | | | — | | | | — | | | | — | | | | 18.81 | |
2011 | | | 13.93 | | | | (.22 | ) | | | 5.51 | | | | 5.29 | | | | — | | | | — | | | | — | | | | 19.22 | |
2010 | | | 10.83 | | | | (.19 | ) | | | 3.29 | | | | 3.10 | | | | — | | | | — | | | | — | | | | 13.93 | |
2009 | | | 16.92 | | | | (.07 | ) | | | (6.02 | ) | | | (6.09 | ) | | | — | | | | — | | | | — | | | | 10.83 | |
2008 | | | 21.28 | | | | (.22 | ) | | | (4.14 | ) | | | (4.36 | ) | | | — | | | | — | | | | — | | | | 16.92 | |
Class R3 (9/09) | | | | | | | | | | | | | | | | | | | | | | | | | | | | | |
2012 | | | 19.68 | | | | (.13 | ) | | | (.19 | ) | | | (.32 | ) | | | — | | | | — | | | | — | | | | 19.36 | |
2011 | | | 14.19 | | | | (.13 | ) | | | 5.62 | | | | 5.49 | | | | — | | | | — | | | | — | | | | 19.68 | |
2010(f) | | | 13.53 | | | | (.09 | ) | | | .75 | | | | .66 | | | | — | | | | — | | | | — | | | | 14.19 | |
Class I (12/06) | | | | | | | | | | | | | | | | | | | | | | | | | | | | | |
2012 | | | 19.85 | | | | (.04 | ) | | | (.19 | ) | | | (.23 | ) | | | — | | | | — | | | | — | | | | 19.62 | |
2011 | | | 14.24 | | | | (.05 | ) | | | 5.66 | | | | 5.61 | | | | — | | | | — | | | | — | | | | 19.85 | |
2010 | | | 10.96 | | | | (.05 | ) | | | 3.33 | | | | 3.28 | | | | — | | | | — | | | | — | | | | 14.24 | |
2009 | | | 17.11 | | | | (.01 | ) | | | (6.14 | ) | | | (6.15 | ) | | | — | | | | — | | | | — | | | | 10.96 | |
2008 | | | 21.41 | | | | (.04 | ) | | | (4.21 | ) | | | (4.25 | ) | | | (.05 | ) | | | — | | | | (.05 | ) | | | 17.11 | |
| | | | | | | | | | | | | | | | | | | | | | | | | | |
| | | | | | | | | | | | | | | | | | | | |
| | | | |
| | | | | | | | | | | | | | |
| | | | Ratios/Supplemental Data | |
| | | | |
| | | | | | | Ratios to Average
Net Assets Before
Reimbursement(e) | | | Ratios to Average
Net Assets After
Reimbursement(d)(e) | | | | |
Total
Return(c) | | | Ending
Net
Assets
(000) | | | Expenses | | | Net
Invest-
ment
Income
(Loss) | | | Expenses | | | Net
Invest-
ment
Income
(Loss) | | | Portfolio
Turnover
Rate | |
| | | | | | | | | | | | | | | | | | | | | | | | | | |
| | (1.41 | )% | | $ | 4,671 | | | | 1.58 | % | | | (.72 | )% | | | 1.33 | % | | | (.46 | )% | | | 54 | % |
| | 39.13 | | | | 5,261 | | | | 1.88 | | | | (1.04 | ) | | | 1.33 | | | | (.50 | ) | | | 46 | |
| | 29.50 | | | | 3,267 | | | | 2.32 | | | | (1.51 | ) | | | 1.44 | | | | (.63 | ) | | | 64 | |
| | (35.34 | ) | | | 1,382 | | | | 3.03 | | | | (1.60 | ) | | | 1.45 | | | | (.02 | ) | | | 204 | |
| | (20.02 | )*** | | | 3,595 | | | | 1.65 | | | | (.70 | ) | | | 1.43 | | | | (.49 | ) | | | 84 | |
| | | | | | | | | | | | | | | | | | | | | | | | | | |
| | (2.13 | ) | | | 1,928 | | | | 2.36 | | | | (1.49 | ) | | | 2.08 | | | | (1.21 | ) | | | 54 | |
| | 38.07 | | | | 1,202 | | | | 2.62 | | | | (1.80 | ) | | | 2.08 | | | | (1.26 | ) | | | 46 | |
| | 28.53 | | | | 636 | | | | 3.11 | | | | (2.29 | ) | | | 2.19 | | | | (1.37 | ) | | | 64 | |
| | (35.88 | ) | | | 610 | | | | 4.11 | | | | (2.50 | ) | | | 2.20 | | | | (.59 | ) | | | 204 | |
| | (20.63 | )*** | | | 1,093 | | | | 2.39 | | | | (1.40 | ) | | | 2.18 | | | | (1.20 | ) | | | 84 | |
| | | | | | | | | | | | | | | | | | | | | | | | | | |
| | (1.63 | ) | | | 202 | | | | 1.87 | | | | (1.00 | ) | | | 1.58 | | | | (.70 | ) | | | 54 | |
| | 38.69 | | | | 73 | | | | 2.13 | | | | (1.29 | ) | | | 1.58 | | | | (.74 | ) | | | 46 | |
| | 4.88 | | | | 52 | | | | 2.54 | * | | | (1.67 | )* | | | 1.69 | * | | | (.81 | )* | | | 64 | |
| | | | | | | | | | | | | | | | | | | | | | | | | | |
| | (1.16 | ) | | | 15,150 | | | | 1.34 | | | | (.47 | ) | | | 1.08 | | | | (.20 | ) | | | 54 | |
| | 39.40 | | | | 14,803 | | | | 1.62 | | | | (.80 | ) | | | 1.08 | | | | (.26 | ) | | | 46 | |
| | 29.93 | | | | 7,279 | | | | 2.09 | | | | (1.26 | ) | | | 1.19 | | | | (.36 | ) | | | 64 | |
| | (35.98 | ) | | | 3,792 | | | | 1.44 | | | | (.33 | ) | | | 1.20 | | | | (.08 | ) | | | 204 | |
| | (19.82 | )*** | | | 38,574 | | | | 1.16 | | | | (.20 | ) | | | 1.16 | | | | (.20 | ) | | | 84 | |
| (a) | Per share Net Investment Income (Loss) is calculated using the average daily shares method. |
| (b) | Distributions from Capital Gains include short-term capital gains, if any. |
| (c) | Total return is the combination of changes in net asset value without any sales charge, reinvested dividend income at net asset value and reinvested capital gains distributions at net asset value, if any. Total returns are not annualized. |
| (d) | After expense reimbursement from the Adviser, where applicable. |
| (e) | Ratios do not reflect the effect of custodian fee credits earned on the Fund’s net cash on deposit with the custodian bank, where applicable. |
| (f) | For the period September 29, 2009 (commencement of operations) through June 30, 2010. |
| ** | Rounds to less than $.01 per share. |
| *** | During the year ended June 30, 2008, the Adviser reimbursed the Fund $89,561 for a cash balance maintained in the Fund. This reimbursement resulted in an increase of .23%, .28%, ..19% and .14% to Classes A, B, C and I, respectively. |
See accompanying notes to financial statements.
Financial Highlights (continued)
| | | | | | | | | | | | | | | | | | | | | | | | | | | | | | | | | | | | |
| Selected data for a share outstanding throughout each period: | | | | | | | | | | | | | | | | |
| | | | | | | |
| Class (Commencement Date) | | | | | | | | | | | | | | | | | | | | | | |
| | | | | | Investment Operations | | | Less Distributions | | | | |
| | | | | | | | |
| SMALL-CAP VALUE | | | | | | | | | | | | | | | | | | | | | �� | | | | |
Year Ended
June 30, | | Beginning
Net
Asset
Value | | | Net
Invest-
ment
Income
(Loss)(a) | | | Net
Realized/
Unrealized
Gain
(Loss) | | | Total | | | Net
Invest-
ment
Income | | | Capital
Gains(b) | | | Return
of
Capital | | | Total | | | Ending
Net
Asset
Value | |
Class A (12/04) | | | | | | | | | | | | | | | | | | | | | | | | | | | | | | | | | |
2012 | | $ | 25.22 | | | $ | (.17 | ) | | $ | .96 | | | $ | .79 | | | $ | — | | | $ | — | | | $ | — | | | $ | — | | | $ | 26.01 | |
2011 | | | 18.30 | | | | (.18 | ) | | | 7.10 | | | | 6.92 | | | | — | | | | — | | | | — | | | | — | | | | 25.22 | |
2010 | | | 14.14 | | | | (.10 | ) | | | 4.27 | | | | 4.17 | | | | (.01 | ) | | | — | | | | — | | | | (.01 | ) | | | 18.30 | |
2009 | | | 23.29 | | | | .02 | | | | (9.17 | ) | | | (9.15 | ) | | | — | | | | — | | | | — | | | | — | | | | 14.14 | |
2008 | | | 30.12 | | | | (.04 | ) | | | (6.08 | ) | | | (6.12 | ) | | | (.02 | ) | | | (.69 | ) | | | — | ** | | | (.71 | ) | | | 23.29 | |
Class C (12/04) | | | | | | | | | | | | | | | | | | | | | | | | | | | | | | | | | |
2012 | | | 24.20 | | | | (.34 | ) | | | .91 | | | | .57 | | | | — | | | | — | | | | — | | | | — | | | | 24.77 | |
2011 | | | 17.68 | | | | (.35 | ) | | | 6.87 | | | | 6.52 | | | | — | | | | — | | | | — | | | | — | | | | 24.20 | |
2010 | | | 13.76 | | | | (.21 | ) | | | 4.13 | | | | 3.92 | | | | — | | | | — | | | | — | | | | — | | | | 17.68 | |
2009 | | | 22.83 | | | | (.11 | ) | | | (8.96 | ) | | | (9.07 | ) | | | — | | | | — | | | | — | | | | — | | | | 13.76 | |
2008 | | | 29.73 | | | | (.23 | ) | | | (5.98 | ) | | | (6.21 | ) | | | — | | | | (.69 | ) | | | — | | | | (.69 | ) | | | 22.83 | |
Class R3 (9/09) | | | | | | | | | | | | | | | | | | | | | | | | | | | | | | | | | |
2012 | | | 25.26 | | | | (.23 | ) | | | .96 | | | | .73 | | | | — | | | | — | | | | — | | | | — | | | | 25.99 | |
2011 | | | 18.37 | | | | (.25 | ) | | | 7.14 | | | | 6.89 | | | | — | | | | — | | | | — | | | | — | | | | 25.26 | |
2010(f) | | | 18.07 | | | | (.08 | ) | | | .38 | | | | .30 | | | | — | | | | — | | | | — | | | | — | | | | 18.37 | |
Class I (12/04) | | | | | | | | | | | | | | | | | | | | | | | | | | | | | | | | | |
2012 | | | 25.42 | | | | (.11 | ) | | | .98 | | | | .87 | | | | — | | | | — | | | | — | | | | — | | | | 26.29 | |
2011 | | | 18.40 | | | | (.14 | ) | | | 7.16 | | | | 7.02 | | | | — | | | | — | | | | — | | | | — | | | | 25.42 | |
2010 | | | 14.21 | | | | (.04 | ) | | | 4.28 | | | | 4.24 | | | | (.05 | ) | | | — | | | | — | | | | (.05 | ) | | | 18.40 | |
2009 | | | 23.34 | | | | .05 | | | | (9.18 | ) | | | (9.13 | ) | | | — | | | | — | | | | — | | | | — | | | | 14.21 | |
2008 | | | 30.18 | | | | .02 | | | | (6.08 | ) | | | (6.06 | ) | | | (.08 | ) | | | (.69 | ) | | | (.01 | ) | | | (.78 | ) | | | 23.34 | |
| | | | | | | | | | | | | | | | | | | | | | | | | | |
| | | | | | | | | | | | | | | | | | | | |
| | | | |
| | | | | | | | | | | | | | |
| | | | Ratios/Supplemental Data | |
| | | | |
| | | | | | | Ratios to Average
Net Assets Before
Reimbursement(e) | | | Ratios to Average
Net Assets After
Reimbursement(d)(e) | | | | |
Total
Return(c) | | | Ending
Net
Assets
(000) | | | Expenses | | | Net
Invest-
ment
Income
(Loss) | | | Expenses | | | Net
Invest-
ment
Income
(Loss) | | | Portfolio
Turnover
Rate | |
| | | | | | | | | | | | | | | | | | | | | | | | | | |
| | 3.09 | % | | $ | 7,107 | | | | 1.45 | % | | | (.68 | )% | | | 1.45 | % | | | (.68 | )% | | | 44 | % |
| | 37.94 | | | | 7,365 | | | | 1.43 | | | | (.82 | ) | | | 1.43 | | | | (.82 | ) | | | 51 | |
| | 29.41 | | | | 7,009 | | | | 1.47 | | | | (.56 | ) | | | 1.45 | | | | (.54 | ) | | | 58 | |
| | (39.29 | ) | | | 7,733 | | | | 1.46 | | | | .13 | | | | 1.46 | | | | .13 | | | | 71 | |
| | (20.41 | ) | | | 54,264 | | | | 1.47 | | | | (.16 | ) | | | 1.47 | | | | (.16 | ) | | | 48 | |
| | | | | | | | | | | | | | | | | | | | | | | | | | |
| | 2.36 | | | | 4,308 | | | | 2.19 | | | | (1.43 | ) | | | 2.19 | | | | (1.43 | ) | | | 44 | |
| | 36.96 | | | | 4,401 | | | | 2.18 | | | | (1.58 | ) | | | 2.18 | | | | (1.58 | ) | | | 51 | |
| | 28.42 | | | | 3,494 | | | | 2.21 | | | | (1.23 | ) | | | 2.19 | | | | (1.21 | ) | | | 58 | |
| | (39.70 | ) | | | 3,446 | | | | 2.23 | | | | (.70 | ) | | | 2.23 | | | | (.70 | ) | | | 71 | |
| | (21.03 | ) | | | 9,682 | | | | 2.22 | | | | (.91 | ) | | | 2.22 | | | | (.91 | ) | | | 48 | |
| | | | | | | | | | | | | | | | | | | | | | | | | | |
| | 2.85 | | | | 72 | | | | 1.69 | | | | (.93 | ) | | | 1.69 | | | | (.93 | ) | | | 44 | |
| | 37.64 | | | | 75 | | | | 1.68 | | | | (1.08 | ) | | | 1.68 | | | | (1.08 | ) | | | 51 | |
| | 1.60 | | | | 51 | | | | 1.68 | * | | | (.57 | )* | | | 1.68 | * | | | (.57 | )* | | | 58 | |
| | | | | | | | | | | | | | | | | | | | | | | | | | |
| | 3.38 | | | | 91,213 | | | | 1.19 | | | | (.43 | ) | | | 1.19 | | | | (.43 | ) | | | 44 | |
| | 38.28 | | | | 85,136 | | | | 1.18 | | | | (.58 | ) | | | 1.18 | | | | (.58 | ) | | | 51 | |
| | 29.74 | | | | 74,824 | | | | 1.21 | | | | (.23 | ) | | | 1.19 | | | | (.21 | ) | | | 58 | |
| | (39.12 | ) | | | 62,423 | | | | 1.24 | | | | .29 | | | | 1.24 | | | | .29 | | | | 71 | |
| | (20.22 | ) | | | 108,064 | | | | 1.22 | | | | .08 | | | | 1.22 | | | | .08 | | | | 48 | |
| (a) | Per share Net Investment Income (Loss) is calculated using the average daily shares method. |
| (b) | Distributions from Capital Gains include short-term capital gains, if any. |
| (c) | Total return is the combination of changes in net asset value without any sales charge, reinvested dividend income at net asset value and reinvested capital gains distributions at net asset value, if any. Total returns are not annualized. |
| (d) | After expense reimbursement from the Adviser, where applicable. |
| (e) | Ratios do not reflect the effect of custodian fee credits earned on the Fund’s net cash on deposit with the custodian bank, where applicable. |
| (f) | For the period September 29, 2009 (commencement of operations) through June 30, 2010. |
| ** | Rounds to less than $.01 per share. |
See accompanying notes to financial statements.
Financial Highlights (continued)
| | | | | | | | | | | | | | | | | | | | | | | | | | | | | | | | |
| Selected data for a share outstanding throughout each period: | | | | | | | | | | | | | |
| | | | | | | |
| Class (Commencement Date) | | | | | | | | | | | | | | | | | | | | | | |
| | | | | | Investment Operations
| | | Less Distributions | | | | |
| | | | | | | |
| VALUE OPPORTUNITIES | | | | | | | | | | | | | | | | | | | | | | |
Year Ended
June 30, | | Beginning
Net
Asset
Value | | | Net
Invest-
ment
Income
(Loss)(a) | | | Net
Realized/
Unrealized
Gain (Loss) | | | Total | | | Net
Invest-
ment
Income | | | Capital
Gains(b) | | | Total | | | Ending
Net
Asset
Value | |
Class A (12/04) | | | | | | | | | | | | | | | | | | | | | | | | | | | | | |
2012 | | $ | 35.58 | | | $ | .34 | | | $ | (4.64 | ) | | $ | (4.30 | ) | | $ | (.75 | ) | | $ | (2.02 | ) | | $ | (2.77 | ) | | $ | 28.51 | |
2011 | | | 29.76 | | | | .23 | | | | 7.26 | | | | 7.49 | | | | (.51 | ) | | | (1.16 | ) | | | (1.67 | ) | | | 35.58 | |
2010 | | | 24.17 | | | | .13 | | | | 5.46 | | | | 5.59 | | | | — | | | | — | | | | — | | | | 29.76 | |
2009 | | | 29.60 | | | | .20 | | | | (4.53 | ) | | | (4.33 | ) | | | (.05 | ) | | | (1.05 | ) | | | (1.10 | ) | | | 24.17 | |
2008 | | | 32.48 | | | | .20 | | | | (1.03 | ) | | | (.83 | ) | | | (.59 | ) | | | (1.46 | ) | | | (2.05 | ) | | | 29.60 | |
Class B (12/04) | | | | | | | | | | | | | | | | | | | | | | | | | | | | | |
2012 | | | 34.69 | | | | .15 | | | | (4.57 | ) | | | (4.42 | ) | | | (.48 | ) | | | (2.02 | ) | | | (2.50 | ) | | | 27.77 | |
2011 | | | 29.07 | | | | (.04 | ) | | | 7.08 | | | | 7.04 | | | | (.26 | ) | | | (1.16 | ) | | | (1.42 | ) | | | 34.69 | |
2010 | | | 23.78 | | | | (.09 | ) | | | 5.38 | | | | 5.29 | | | | — | | | | — | | | | — | | | | 29.07 | |
2009 | | | 29.29 | | | | .03 | | | | (4.49 | ) | | | (4.46 | ) | | | — | | | | (1.05 | ) | | | (1.05 | ) | | | 23.78 | |
2008 | | | 32.15 | | | | (.03 | ) | | | (1.02 | ) | | | (1.05 | ) | | | (.35 | ) | | | (1.46 | ) | | | (1.81 | ) | | | 29.29 | |
Class C (12/04) | | | | | | | | | | | | | | | | | | | | | | | | | | | | | |
2012 | | | 34.68 | | | | .13 | | | | (4.55 | ) | | | (4.42 | ) | | | (.48 | ) | | | (2.02 | ) | | | (2.50 | ) | | | 27.76 | |
2011 | | | 29.06 | | | | (.03 | ) | | | 7.07 | | | | 7.04 | | | | (.26 | ) | | | (1.16 | ) | | | (1.42 | ) | | | 34.68 | |
2010 | | | 23.77 | | | | (.09 | ) | | | 5.38 | | | | 5.29 | | | | — | | | | — | | | | — | | | | 29.06 | |
2009 | | | 29.29 | | | | .03 | | | | (4.50 | ) | | | (4.47 | ) | | | — | | | | (1.05 | ) | | | (1.05 | ) | | | 23.77 | |
2008 | | | 32.16 | | | | (.03 | ) | | | (1.03 | ) | | | (1.06 | ) | | | (.35 | ) | | | (1.46 | ) | | | (1.81 | ) | | | 29.29 | |
Class R3 (8/08) | | | | | | | | | | | | | | | | | | | | | | | | | | | | | |
2012 | | | 35.57 | | | | .30 | | | | (4.67 | ) | | | (4.37 | ) | | | (.67 | ) | | | (2.02 | ) | | | (2.69 | ) | | | 28.51 | |
2011 | | | 29.76 | | | | .17 | | | | 7.23 | | | | 7.40 | | | | (.43 | ) | | | (1.16 | ) | | | (1.59 | ) | | | 35.57 | |
2010 | | | 24.23 | | | | .07 | | | | 5.46 | | | | 5.53 | | | | — | | | | — | | | | — | | | | 29.76 | |
2009(f) | | | 28.93 | | | | .15 | | | | (3.80 | ) | | | (3.65 | ) | | | — | | | | (1.05 | ) | | | (1.05 | ) | | | 24.23 | |
Class I (12/04) | | | | | | | | | | | | | | | | | | | | | | | | | | | | | |
2012 | | | 35.72 | | | | .42 | | | | (4.66 | ) | | | (4.24 | ) | | | (.84 | ) | | | (2.02 | ) | | | (2.86 | ) | | | 28.62 | |
2011 | | | 29.87 | | | | .31 | | | | 7.29 | | | | 7.60 | | | | (.59 | ) | | | (1.16 | ) | | | (1.75 | ) | | | 35.72 | |
2010 | | | 24.19 | | | | .20 | | | | 5.48 | | | | 5.68 | | | | — | | | | — | | | | — | | | | 29.87 | |
2009 | | | 29.66 | | | | .26 | | | | (4.57 | ) | | | (4.31 | ) | | | (.11 | ) | | | (1.05 | ) | | | (1.16 | ) | | | 24.19 | |
2008 | | | 32.54 | | | | .28 | | | | (1.03 | ) | | | (.75 | ) | | | (.67 | ) | | | (1.46 | ) | | | (2.13 | ) | | | 29.66 | |
| | | | | | | | | | | | | | | | | | | | | | | | | | |
| | | | | | | | | | | | | | | | | | | | |
| | | | |
| | | | | | | | | | | | | | |
| | | | Ratios/Supplemental Data | |
| | | | |
| | | | | | | Ratios to Average
Net Assets Before
Reimbursement(e) | | | Ratios to Average
Net Assets After
Reimbursement(d)(e) | | | | |
Total
Return(c) | | | Ending
Net
Assets
(000) | | | Expenses | | | Net
Invest-
ment
Income
(Loss) | | | Expenses | | | Net
Invest-
ment
Income
(Loss) | | | Portfolio
Turnover
Rate | |
| | | | | | | | | | | | | | | | | | | | | | | | | | |
| | (12.46 | )% | | $ | 492,397 | | | | 1.17 | % | | | 1.05 | % | | | 1.17 | % | | | 1.05 | % | | | 97 | % |
| | 25.31 | | | | 1,291,888 | | | | 1.20 | | | | .65 | | | | 1.20 | | | | .65 | | | | 77 | |
| | 23.13 | | | | 658,037 | | | | 1.43 | | | | .44 | | | | 1.43 | | | | .44 | | | | 48 | |
| | (13.47 | ) | | | 378,845 | | | | 1.48 | | | | .89 | | | | 1.48 | | | | .89 | | | | 61 | |
| | (2.65 | ) | | | 368,093 | | | | 1.42 | | | | .63 | | | | 1.42 | | | | .63 | | | | 48 | |
| | | | | | | | | | | | | | | | | | | | | | | | | | |
| | (13.14 | ) | | | 4,788 | | | | 1.91 | | | | .47 | | | | 1.91 | | | | .47 | | | | 97 | |
| | 24.38 | | | | 6,863 | | | | 1.95 | | | | (.13 | ) | | | 1.95 | | | | (.13 | ) | | | 77 | |
| | 22.25 | | | | 5,801 | | | | 2.17 | | | | (.32 | ) | | | 2.17 | | | | (.32 | ) | | | 48 | |
| | (14.10 | ) | | | 5,080 | | | | 2.22 | | | | .14 | | | | 2.22 | | | | .14 | | | | 61 | |
| | (3.39 | ) | | | 6,816 | | | | 2.17 | | | | (.11 | ) | | | 2.17 | | | | (.11 | ) | | | 48 | |
| | | | | | | | | | | | | | | | | | | | | | | | | | |
| | (13.11 | ) | | | 224,079 | | | | 1.91 | | | | .40 | | | | 1.91 | | | | .40 | | | | 97 | |
| | 24.39 | | | | 436,074 | | | | 1.95 | | | | (.07 | ) | | | 1.95 | | | | (.07 | ) | | | 77 | |
| | 22.25 | | | | 192,332 | | | | 2.19 | | | | (.31 | ) | | | 2.19 | | | | (.31 | ) | | | 48 | |
| | (14.14 | ) | | | 98,742 | | | | 2.22 | | | | .14 | | | | 2.22 | | | | .14 | | | | 61 | |
| | (3.39 | ) | | | 116,463 | | | | 2.17 | | | | (.10 | ) | | | 2.17 | | | | (.10 | ) | | | 48 | |
| | | | | | | | | | | | | | | | | | | | | | | | | | |
| | (12.67 | ) | | | 6,298 | | | | 1.40 | | | | .93 | | | | 1.40 | | | | .93 | | | | 97 | |
| | 25.00 | | | | 6,880 | | | | 1.45 | | | | .49 | | | | 1.45 | | | | .49 | | | | 77 | |
| | 22.82 | | | | 1,444 | | | | 1.71 | | | | .22 | | | | 1.71 | | | | .22 | | | | 48 | |
| | (11.47 | ) | | | 414 | | | | 1.76 | * | | | .73 | * | | | 1.75 | * | | | .75 | * | | | 61 | |
| | | | | | | | | | | | | | | | | | | | | | | | | | |
| | (12.27 | ) | | | 400,383 | | | | .92 | | | | 1.28 | | | | .92 | | | | 1.28 | | | | 97 | |
| | 25.64 | | | | 1,749,117 | | | | .95 | | | | .91 | | | | .95 | | | | .91 | | | | 77 | |
| | 23.48 | | | | 1,046,939 | | | | 1.18 | | | | .69 | | | | 1.18 | | | | .69 | | | | 48 | |
| | (13.29 | ) | | | 580,149 | | | | 1.24 | | | | 1.19 | | | | 1.23 | | | | 1.20 | | | | 61 | |
| | (2.39 | ) | | | 278,649 | | | | 1.17 | | | | .89 | | | | 1.17 | | | | .89 | | | | 48 | |
| (a) | Per share Net Investment Income (Loss) is calculated using the average daily shares method. |
| (b) | Distributions from Capital Gains include short-term capital gains, if any. |
| (c) | Total return is the combination of changes in net asset value without any sales charge, reinvested dividend income at net asset value and reinvested capital gains distributions at net asset value, if any. Total returns are not annualized. |
| (d) | After expense reimbursement from the Adviser, where applicable. |
| (e) | Ratios do not reflect the effect of custodian fee credits earned on the Fund’s net cash on deposit with the custodian bank, where applicable. |
| (f) | For the period August 4, 2008 (commencement of operations) through June 30, 2009. |
See accompanying notes to financial statements.
Notes to Financial Statements
1. General Information and Significant Accounting Policies
General Information
The Nuveen Investment Trust (the “Trust”), is an open-end management investment company registered under the Investment Company Act of 1940, as amended. The Trust is comprised of the Nuveen Multi-Manager Large-Cap Value Fund (“Multi-Manager Large-Cap Value”), Nuveen NWQ Multi-Cap Value Fund (“Multi-Cap Value”), Nuveen NWQ Large-Cap Value Fund (“Large-Cap Value”), Nuveen NWQ Small/Mid-Cap Value Fund (“Small/Mid-Cap Value”), Nuveen NWQ Small-Cap Value Fund (“Small-Cap Value”) and Nuveen Tradewinds Value Opportunities Fund (“Value Opportunities”) (each a “Fund” and collectively, the “Funds”), among others. The Trust was organized as a Massachusetts business trust in 1996.
Multi-Manager Large-Cap Value’s investment objective is to provide long-term capital appreciation. Under normal market conditions, the Fund invests at least 80% of its net assets in equity securities of companies with market capitalizations at the time of investment comparable to companies in the Russell 1000® Value Index. The Fund will not be forced to sell a stock because it has exceeded or fallen below the current market capitalization range. The Fund’s investment portfolio is managed by three sub-advisers, Institutional Capital LLC (“ICAP”), Nuveen Asset Management, LLC, a wholly-owned subsidiary of Nuveen Fund Advisors, Inc. (the “Adviser”), a wholly-owned subsidiary of Nuveen Investments, Inc. (“Nuveen”), and Symphony Asset Management LLC (“Symphony”), subsidiary of Nuveen. The Adviser maintains a strategic asset allocation of between 25% and 40% of the Fund’s assets with each sub-adviser. The Fund may also invest up to 25% of its net assets in non-U.S. equity securities that are U.S. dollar-denominated.
Multi-Cap Value’s investment objective is to provide long-term capital appreciation. Under normal market conditions, the Fund invests at least 80% of its net assets in equity securities of companies with large, medium and small capitalizations. The Fund’s sub-adviser, NWQ Investment Management Company, LLC (“NWQ”), a subsidiary of Nuveen, seeks to identify under-valued companies with a catalyst to unlock value or improve profitability. NWQ maintains a long-term investment view and a focus on securities it believes can appreciate over an extended time, regardless of interim fluctuations. NWQ will sell securities or reduce positions if it feels that the company no longer possesses favorable risk/reward characteristics, attractive valuations or catalysts. The Fund invests primarily in U.S. equity securities, but it may invest up to 35% of its net assets in non-U.S. equity securities, including up to 10% of its net assets in equity securities of companies located in emerging market countries.
Large-Cap Value’s, Small/Mid-Cap Value’s and Small-Cap Value’s investment objective is to provide long-term capital appreciation. Under normal market conditions, Large-Cap Value and Small/Mid-Cap Value invest at least 80% of their net assets in equity securities of companies with market capitalizations at the time of investment comparable to companies in the Russell 1000® Index and Russell 2500® Value Index, respectively. Under normal market conditions, Small-Cap Value invests at least 80% of its net assets in equity securities of companies with market capitalizations at the time of investment comparable to companies in either the Russell® 2000 Value Index or the Standard & Poor’s Small Cap 600 Index. The Funds will not be forced to sell a stock because it has exceeded or fallen below the current market capitalization range. The Funds’ sub-adviser, NWQ, seeks to identify under-valued companies with a catalyst to unlock value or improve profitability. NWQ maintains a long-term investment view and a focus on securities it believes can appreciate over an extended time, regardless of interim fluctuations. NWQ will sell securities or reduce positions if it feels that the company no longer possesses favorable risk/reward characteristics, attractive valuation or catalysts. Each Fund invests primarily in U.S. equity securities, but may invest up to 35% of its net assets in non-U.S. equity securities, including up to 10% of its net assets in equity securities of companies located in emerging market countries.
Value Opportunities’ investment objective is to provide long-term capital appreciation. Under normal market conditions, the Fund invests primarily in equity securities of companies with varying market capitalizations, which may include small-, mid- and large-capitalization companies. The Fund’s sub-adviser, Tradewinds Global Investors, LLC (“Tradewinds”), a subsidiary of Nuveen, seeks to identify under-valued companies considering absolute valuation and security pricing in the context of industry and market conditions. Tradewinds’ disciplined, value-oriented investment strategy focuses on rigorous financial statements and valuation analysis, qualitative factors and portfolio downside protection. The Fund invests primarily in U.S. equity securities, but it may invest up to 35% of its net assets in non-U.S. equity securities, including up to 15% of its net assets in equity securities of companies located in emerging market countries.
The Funds’ most recent prospectus provides further descriptions of each Fund’s investment objective, principal investment strategies, and principal risks.
Effective at the close of business on July 29, 2011, Value Opportunities was closed to new investments, except for investments by the following categories of investors:
| | • | | Existing shareholders of record as of July 29, 2011; |
| | • | | Defined contribution retirement plans that purchased shares of the Fund prior to October 31, 2011; |
| | • | | Full-time and retired employees of Nuveen and its affiliates as well as their immediate family members; |
| | • | | Officers, trustees and former trustees of the Nuveen funds; and |
| | • | | Benefit plans sponsored by Nuveen or its affiliates. |
Effective May 7, 2012, Value Opportunities re-opened to all investors who meet the eligibility and minimum initial investment requirements described in the Fund’s most recent prospectus.
Effective at the close of business on February 15, 2012, Class B Shares of Large-Cap Value were converted to Class A Shares and are no longer available for dividend reinvestment or through an exchange from other Nuveen mutual funds.
Significant Accounting Policies
The following is a summary of significant accounting policies followed by the Funds in the preparation of their financial statements in accordance with accounting principles generally accepted in the United States (“U.S. GAAP”).
Investment Valuation
Common stocks and other equity-type securities are valued at the last sales price on the securities exchange on which such securities are primarily traded and are generally classified as Level 1 for fair value measurement purposes. Securities primarily traded on the NASDAQ National Market (“NASDAQ”) are valued, except as indicated below, at the NASDAQ Official Closing Price and are generally classified as Level 1. However, securities traded on a securities exchange or NASDAQ for which there were no transactions on a given day or securities not listed on a securities exchange or NASDAQ are valued at the quoted bid price and are generally classified as Level 2. Prices of certain American Depositary Receipts (“ADR”) held by the Funds that trade in the United States are valued based on the last traded price, official closing price, or the most recent bid price of the underlying non-U.S.-traded stock, adjusted as appropriate for the underlying-to-ADR conversion ratio and foreign exchange rate, and from time-to-time may also be adjusted further to take into account material events that may take place after the close of the local non-U.S. market but before the close of the New York Stock Exchange (“NYSE”). These securities may represent a transfer from a Level 1 to a Level 2 security.
Investments in investment companies are valued at their respective net asset values on valuation date. These investment vehicles are generally classified as Level 1.
Prices of fixed-income securities are provided by a pricing service approved by the Funds’ Board of Trustees. These securities are generally classified as Level 2. The pricing service establishes a security’s fair value using methods that may include consideration of the following: yields or prices of investments of comparable quality, type of issue, coupon, maturity and rating, market quotes or indications of value from security dealers, evaluations of anticipated cash flows or collateral, general market conditions and other information and analysis, including the obligor’s credit characteristics considered relevant. In pricing certain securities, particularly less liquid and lower quality securities, the pricing service may consider information about a security, its issuer, or market activity provided by the Adviser. These securities are generally classified as Level 2 or Level 3 depending on the priority of the significant inputs.
Repurchase agreements are valued at contract amount plus accrued interest, which approximates market value. These securities are generally classified as Level 2.
Certain securities may not be able to be priced by the pre-established pricing methods as described above. Such securities may be valued by the Funds’ Board of Trustees or its designee at fair value. These securities generally include, but are not limited to, restricted securities (securities which may not be publicly sold without registration under the Securities Act of 1933, as amended) for which a pricing service is unable to provide a market price; securities whose trading has been formally suspended; debt securities that have gone into default and for which there is no current market quotation; a security whose market price is not available from a pre-established pricing source; a security with respect to which an event has occurred that is likely to materially affect the value of the security after the market has closed but before the calculation of a Fund’s net asset value (as may be the case in non-U.S. markets on which the security is primarily traded) or make it difficult or impossible to obtain a reliable market quotation; and a security whose price, as provided by the pricing service, is not deemed to reflect the security’s fair value. As a general principle, the fair value of a security would appear to be the amount that the owner might reasonably expect to receive for it in a current sale. A variety of factors may be considered in determining the fair value of such securities, which may include consideration of the following: yields or prices of investments of comparable quality, type of issue, coupon, maturity and rating, market quotes or indications of value from security dealers, evaluations of anticipated cash flows or collateral, general market conditions and other information and analysis, including the obligor’s credit characteristics considered relevant. These securities are generally classified as Level 2 or Level 3 depending on the priority of the significant inputs. Regardless of the method employed to value a particular security, all valuations are subject to review by the Funds’ Board of Trustees or its designee.
Refer to Footnote 2 – Fair Value Measurements for further details on the leveling of securities held by the Funds as of the end of the reporting period.
Investment Transactions
Investment transactions are recorded on a trade date basis. Realized gains and losses from investment transactions are determined on the specific identification method, which is the same basis used for federal income tax purposes. Investments purchased on a when-issued/delayed delivery basis may have extended settlement periods. Any investments so purchased are subject to market fluctuation during this period. The Funds have instructed the custodian to earmark securities in the Funds’ portfolios with a current value at least equal to the amount of the when-issued/delayed delivery purchase commitments. At June 30, 2012, there were no outstanding purchase commitments in any of the Funds.
Notes to Financial Statements (continued)
Investment Income
Dividend income is recorded on the ex-dividend date or, for foreign securities, when information is available. Interest income, which includes the amortization of premiums and accretion of discounts for financial reporting purposes, is recorded on an accrual basis. Interest income also includes paydown gains and losses, if any.
Income Taxes
Each Fund is a separate taxpayer for federal income tax purposes. Each Fund intends to distribute substantially all of its net investment income and net capital gains to shareholders and to otherwise comply with the requirements of Subchapter M of the Internal Revenue Code applicable to regulated investment companies (“RICs”). Therefore, no federal income tax provision is required.
For all open tax years and all major taxing jurisdictions, management of the Funds has concluded that there are no significant uncertain tax positions that would require recognition in the financial statements. Open tax years are those that are open for examination by taxing authorities (i.e., generally the last four tax year ends and the interim tax period since then). Furthermore, management of the Funds is also not aware of any tax positions for which it is reasonably possible that the total amounts of unrecognized tax benefits will significantly change in the next twelve months.
Dividends and Distributions to Shareholders
Dividends from net investment income and net realized capital gains from investment transactions, if any, are declared and distributed to shareholders at least annually. Furthermore, capital gains are distributed only to the extent they exceed available capital loss carryforwards.
Distributions to shareholders are recorded on the ex-dividend date. The amount and timing of distributions are determined in accordance with federal income tax regulations, which may differ from U.S. GAAP.
In-Kind Redemptions
In certain circumstances, a Fund may distribute portfolio securities rather than cash as payment for redemption of Fund shares (“in-kind redemptions”). For financial reporting purposes, the Fund recognizes a gain on the in-kind redemptions to the extent the value of the distributed securities on the date of redemption exceeds the cost of those securities; the Fund recognizes a loss if cost exceeds value. Gains and losses realized on the in-kind redemptions are not recognized for tax purposes, and are reclassified from undistributed realized gain or loss to paid-in capital. During the fiscal year ended June 30, 2012, the Funds did not have any in-kind redemptions.
Flexible Sales Charge Program
Class A Shares are generally sold with an up-front sales charge and incur a .25% annual 12b-1 service fee. Class A Share purchases of $1 million or more are sold at net asset value without an up-front sales charge but may be subject to a contingent deferred sales charge (“CDSC”) if redeemed within twelve months of purchase. Class B Shares were sold without an up-front sales charge but incur a .75% annual 12b-1 distribution fee and a .25% annual 12b-1 service fee. Class B Shares are subject to a CDSC of up to 5% depending upon the length of time the shares are held by the investor (CDSC is reduced to 0% at the end of six years). Class B Shares convert to Class A Shares eight years after purchase. Class C Shares are sold without an up-front sales charge but incur a .75% annual 12b-1 distribution fee and a ..25% annual 12b-1 service fee. Class C Shares are subject to a CDSC of 1% if redeemed within twelve months of purchase. Class R3 Shares are sold without an up-front sales charge but incur a .50% annual 12b-1 distribution and service fee. Class I Shares are not subject to any sales charge or 12b-1 distribution or service fees.
Foreign Currency Transactions
Each Fund is authorized to engage in foreign currency exchange transactions, including foreign currency forwards, futures, options and swap contracts. To the extent that the Funds invest in securities and/or contracts that are denominated in a currency other than U.S. dollars, the Funds will be subject to currency risk, which is the risk that an increase in the U.S. dollar relative to the foreign currency will reduce returns or portfolio value. Generally, when the U.S. dollar rises in value against a foreign currency, the Funds’ investments denominated in that currency will lose value because its currency is worth fewer U.S. dollars; the opposite effect occurs if the U.S. dollar falls in relative value. Investments and other assets and liabilities denominated in foreign currencies are converted into U.S. dollars on a spot (i.e. cash) basis at the spot rate prevailing in the foreign currency exchange market at the time of valuation. Purchases and sales of investments and income denominated in foreign currencies are translated into U.S. dollars on the respective dates of such transactions.
The books and records of the Funds are maintained in U.S. dollars. Foreign currencies, investments and other assets and liabilities are translated into U.S. dollars at 4:00 p.m. Eastern time. Investments, income and expenses are translated on the respective dates of such transactions. Net realized foreign currency gains and losses resulting from changes in exchange rates include foreign currency gains and losses between trade date and settlement date of the transactions, foreign currency transactions, and the difference between the amounts of interest and dividends recorded on the books of a Fund and the amounts actually received.
The realized gains and losses resulting from changes in foreign currency exchange rates and changes in foreign exchange rates associated with other assets and liabilities on investments are recognized as a component of “Net realized gain (loss) from investments and foreign currency,” on the Statement of Operations, when applicable.
The unrealized gains and losses resulting from changes in foreign currency exchange rates and changes in foreign exchange rates associated with other assets and liabilities on investments are recognized as a component of “Change in net unrealized appreciation (depreciation) of investments and foreign currency,” on the Statement of Operations, when applicable.
Derivative Financial Instruments
Each Fund is authorized to invest in certain derivative instruments, including foreign currency forwards, futures, options and swap contracts. Although the Funds are authorized to invest in such derivative instruments, and may do so in the future, they did not make any such investments during the fiscal year ended June 30, 2012.
Market and Counterparty Credit Risk
In the normal course of business each Fund may invest in financial instruments and enter into financial transactions where risk of potential loss exists due to changes in the market (market risk) or failure of the other party to the transaction to perform (counterparty credit risk). The potential loss could exceed the value of the financial assets recorded on the financial statements. Financial assets, which potentially expose each Fund to counterparty credit risk, consist principally of cash due from counterparties on forward, option and swap transactions, when applicable. The extent of each Fund’s exposure to counterparty credit risk in respect to these financial assets approximates their carrying value as recorded on the Statement of Assets and Liabilities. Futures contracts, when applicable, expose a Fund to minimal counterparty credit risk as they are exchange traded and the exchange’s clearinghouse, which is counterparty to all exchange traded futures, guarantees the futures contracts against default.
Each Fund helps manage counterparty credit risk by entering into agreements only with counterparties the Adviser believes have the financial resources to honor their obligations and by having the Adviser monitor the financial stability of the counterparties. Additionally, counterparties may be required to pledge collateral daily (based on the daily valuation of the financial asset) on behalf of each Fund with a value approximately equal to the amount of any unrealized gain above a pre-determined threshold. Reciprocally, when each Fund has an unrealized loss, the Funds have instructed the custodian to pledge assets of the Funds as collateral with a value approximately equal to the amount of the unrealized loss above a pre-determined threshold. Collateral pledges are monitored and subsequently adjusted if and when the valuations fluctuate, either up or down, by at least the predetermined threshold amount.
Repurchase Agreements
In connection with transactions in repurchase agreements, it is each Fund’s policy that its custodian take possession of the underlying collateral securities, the fair value of which exceeds the principal amount of the repurchase transaction, including accrued interest, at all times. If the counterparty defaults, and the fair value of the collateral declines, realization of the collateral may be delayed or limited.
Multiclass Operations and Allocations
Income and expenses of the Funds that are not directly attributable to a specific class of shares were prorated among the classes based on the relative net assets of each class. Expenses directly attributable to a class of shares, which presently only include 12b-1 distribution fees and shareholder service fees, are recorded to the specific class.
Income, realized and unrealized capital gains and losses of the Funds are prorated among the classes based on the relative net assets of each class.
Custodian Fee Credit
Each Fund has an arrangement with the custodian bank whereby certain custodian fees and expenses are reduced by net credits earned on each Fund’s cash on deposit with the bank. Such deposit arrangements are an alternative to overnight investments. Credits for cash balances may be offset by charges for any days on which a Fund overdraws its account at the custodian bank.
Indemnifications
Under the Trust’s organizational documents, its officers and trustees are indemnified against certain liabilities arising out of the performance of their duties to the Trust. In addition, in the normal course of business, the Trust enters into contracts that provide general indemnifications to other parties. The Trust’s maximum exposure under these arrangements is unknown as this would involve future claims that may be made against the Trust that have not yet occurred. However, the Trust has not had prior claims or losses pursuant to these contracts and expects the risk of loss to be remote.
Use of Estimates
The preparation of financial statements in conformity with U.S. GAAP requires management to make estimates and assumptions that affect the reported amounts of assets and liabilities at the date of the financial statements and the reported amounts of increases and decreases in net assets from operations during the reporting period. Actual results may differ from those estimates.
2. Fair Value Measurements
Fair value is defined as the price that the Funds would receive upon selling an investment or transferring a liability in an orderly transaction to an independent buyer in the principal or most advantageous market for the investment. A three-tier hierarchy is used to maximize the use of observable market data and minimize the use of unobservable inputs and to establish classification of fair value measurements for disclosure purposes. Observable inputs reflect the assumptions market participants would use in pricing the asset or liability. Observable inputs are based on market data obtained from sources independent of the reporting entity. Unobservable inputs reflect the reporting entity’s own assumptions about the assumptions market participants would use in pricing the asset or liability. Unobservable inputs are based on the best information available in the circumstances. The following is a summary of the three-tiered hierarchy of valuation input levels.
| | |
| Level 1 – | | Inputs are unadjusted and prices are determined using quoted prices in active markets for identical securities. |
| Level 2 – | | Prices are determined using other significant observable inputs (including quoted prices for similar securities, interest rates, prepayment speeds, credit risk, etc.). |
| Level 3 – | | Prices are determined using significant unobservable inputs (including management’s assumptions in determining the fair value of investments). |
Notes to Financial Statements (continued)
The inputs or methodologies used for valuing securities are not an indication of the risks associated with investing in those securities.
The following is a summary of each Fund’s fair value measurements as of the end of the reporting period:
| | | | | | | | | | | | | | | | |
| Multi-Manager Large-Cap Value | | Level 1 | | | Level 2 | | | Level 3 | | | Total | |
Long-Term Investments*: | | | | | | | | | | | | | | | | |
Common Stocks | | $ | 294,471,647 | | | $ | — | | | $ | — | | | $ | 294,471,647 | |
Investment Companies | | | 1,364,600 | | | | — | | | | — | | | | 1,364,600 | |
Short-Term Investments: | | | | | | | | | | | | | | | | |
Repurchase Agreements | | | — | | | | 3,786,060 | | | | — | | | | 3,786,060 | |
Total | | $ | 295,836,247 | | | $ | 3,786,060 | | | $ | — | | | $ | 299,622,307 | |
| | | | |
| Multi-Cap Value | | Level 1 | | | Level 2 | | | Level 3 | | | Total | |
Long-Term Investments*: | | | | | | | | | | | | | | | | |
Common Stocks | | $ | 170,323,135 | | | $ | — | | | $ | — | | | $ | 170,323,135 | |
Short-Term Investments: | | | | | | | | | | | | | | | | |
Repurchase Agreements | | | — | | | | 386,167 | | | | — | | | | 386,167 | |
Total | | $ | 170,323,135 | | | $ | 386,167 | | | $ | — | | | $ | 170,709,302 | |
| | | | |
| Large-Cap Value | | Level 1 | | | Level 2 | | | Level 3 | | | Total | |
Long-Term Investments*: | | | | | | | | | | | | | | | | |
Common Stocks | | $ | 1,060,739,965 | | | $ | — | | | $ | — | | | $ | 1,060,739,965 | |
Short-Term Investments: | | | | | | | | | | | | | | | | |
Repurchase Agreements | | | — | | | | 45,719,733 | | | | — | | | | 45,719,733 | |
Total | | $ | 1,060,739,965 | | | $ | 45,719,733 | | | $ | — | | | $ | 1,106,459,698 | |
| | | | |
| Small/Mid-Cap Value | | Level 1 | | | Level 2 | | | Level 3 | | | Total | |
Long-Term Investments*: | | | | | | | | | | | | | | | | |
Common Stocks | | $ | 21,590,191 | | | $ | — | | | $ | — | | | $ | 21,590,191 | |
Short-Term Investments: | | | | | | | | | | | | | | | | |
Repurchase Agreements | | | — | | | | 231,588 | | | | — | | | | 231,588 | |
Total | | $ | 21,590,191 | | | $ | 231,588 | | | $ | — | | | $ | 21,821,779 | |
| | | | |
| Small-Cap Value | | Level 1 | | | Level 2 | | | Level 3 | | | Total | |
Long-Term Investments*: | | | | | | | | | | | | | | | | |
Common Stocks | | $ | 97,373,163 | | | $ | — | | | $ | — | | | $ | 97,373,163 | |
Short-Term Investments: | | | | | | | | | | | | | | | | |
Repurchase Agreements | | | — | | | | 5,468,758 | | | | — | | | | 5,468,758 | |
Total | | $ | 97,373,163 | | | $ | 5,468,758 | | | $ | — | | | $ | 102,841,921 | |
| | | | |
| Value Opportunities | | Level 1 | | | Level 2 | | | Level 3 | | | Total | |
Long-Term Investments*: | | | | | | | | | | | | | | | | |
Common Stocks | | $ | 1,088,264,301 | | | $ | — | | | $ | — | | | $ | 1,088,264,301 | |
Convertible Bonds | | | — | | | | 7,629,535 | | | | — | | | | 7,629,535 | |
Short-Term Investments: | | | | | | | | | | | | | | | | |
Repurchase Agreements | | | — | | | | 26,646,674 | | | | — | | | | 26,646,674 | |
Total | | $ | 1,088,264,301 | | | $ | 34,276,209 | | | $ | — | | | $ | 1,122,540,510 | |
| * | Refer to the Fund’s Portfolio of Investments for industry classifications. |
The Nuveen funds’ Board of Directors/Trustees is responsible for the valuation process and has delegated the oversight of the daily valuation process to the Adviser’s Valuation Committee. The Valuation Committee, pursuant to the valuation policies and procedures adopted by the Board of Directors/Trustees, is responsible for making fair value determinations, evaluating the effectiveness of the funds’ pricing policies, and reporting to the Board of Directors/Trustees. The Valuation Committee is aided in its efforts by the Adviser’s dedicated Securities Valuation Team, which is responsible for administering the daily valuation process and applying fair value methodologies as approved by the Valuation Committee. When determining the reliability of independent pricing services for investments owned by the funds, the Valuation Committee, among other things, conducts due diligence reviews of the pricing services and monitors the quality of security prices received through various testing reports conducted by the Securities Valuation Team.
The Valuation Committee will consider pricing methodologies it deems relevant and appropriate when making fair value determinations. Examples of possible methodologies include, but are not limited to, multiple of earnings; discount from market of a similar freely traded security; discounted cash-flow analysis; book value or a multiple thereof; risk premium/yield analysis; yield to maturity; and/or fundamental investment analysis. The Valuation Committee will also consider factors it deems relevant and appropriate in light of the facts and circumstances. Examples of possible factors include, but are not limited to, the type of security;
the issuer’s financial statements; the purchase price of the security; the discount from market value of unrestricted securities of the same class at the time of purchase; analysts’ research and observations from financial institutions; information regarding any transactions or offers with respect to the security; the existence of merger proposals or tender offers affecting the security; the price and extent of public trading in similar securities of the issuer or comparable companies; and the existence of a shelf registration for restricted securities.
For each portfolio security that has been fair valued pursuant to the policies adopted by the Board of Directors/Trustees, the fair value price is compared against the last available and next available market quotations. The Valuation Committee reviews the results of such testing and fair valuation occurrences are reported to the Board of Directors/Trustees.
3. Derivative Instruments and Hedging Activities
The Funds record derivative instruments at fair value, with changes in fair value recognized on the Statement of Operations, when applicable. Even though the Funds’ investments in derivatives may represent economic hedges, they are not considered to be hedge transactions for financial reporting purposes. The Funds did not invest in derivative instruments during the fiscal year ended June 30, 2012.
4. Fund Shares
Transactions in Fund shares were as follows:
| | | | | | | | | | | | | | | | |
| | | Multi-Manager Large-Cap Value | |
| | | Year Ended
6/30/12 | | | Year Ended
6/30/11 | |
| | | Shares | | | Amount | | | Shares | | | Amount | |
Shares sold: | | | | | | | | | | | | | | | | |
Class A | | | 845,732 | | | $ | 16,012,029 | | | | 1,146,918 | | | $ | 21,421,203 | |
Class A – automatic conversion of Class B Shares | | | 5,440 | | | | 104,726 | | | | 6,381 | | | | 125,090 | |
Class B | | | 2,445 | | | | 46,371 | | | | 4,726 | | | | 87,375 | |
Class C | | | 115,213 | | | | 2,256,357 | | | | 78,056 | | | | 1,447,381 | |
Class R3 | | | 1,293 | | | | 23,117 | | | | 5,307 | | | | 108,254 | |
Class I | | | 149,860 | | | | 2,904,003 | | | | 421,332 | | | | 8,186,886 | |
Shares issued to shareholders due to reinvestment of distributions: | | | | | | | | | | | | | | | | |
Class A | | | 138,807 | | | | 2,606,795 | | | | 137,700 | | | | 2,645,224 | |
Class B | | | 237 | | | | 4,337 | | | | 350 | | | | 6,555 | |
Class C | | | 3,220 | | | | 58,788 | | | | 3,150 | | | | 58,810 | |
Class R3 | | | — | | | | — | | | | — | | | | — | |
Class I | | | 17,962 | | | | 338,409 | | | | 17,140 | | | | 330,279 | |
| | | | 1,280,209 | | | | 24,354,932 | | | | 1,821,060 | | | | 34,417,057 | |
Shares redeemed: | | | | | | | | | | | | | | | | |
Class A | | | (2,672,024 | ) | | | (50,648,304 | ) | | | (2,529,784 | ) | | | (47,871,458 | ) |
Class B | | | (39,001 | ) | | | (706,518 | ) | | | (36,822 | ) | | | (669,595 | ) |
Class B – automatic conversion to Class A Shares | | | (5,606 | ) | | | (104,726 | ) | | | (6,544 | ) | | | (125,090 | ) |
Class C | | | (154,199 | ) | | | (2,849,604 | ) | | | (184,860 | ) | | | (3,387,231 | ) |
Class R3 | | | (5,592 | ) | | | (109,544 | ) | | | (4,045 | ) | | | (75,035 | ) |
Class I | | | (430,615 | ) | | | (8,178,601 | ) | | | (374,681 | ) | | | (7,219,331 | ) |
| | | | (3,307,037 | ) | | | (62,597,297 | ) | | | (3,136,736 | ) | | | (59,347,740 | ) |
Net increase (decrease) | | | (2,026,828 | ) | | $ | (38,242,365 | ) | | | (1,315,676 | ) | | $ | (24,930,683 | ) |
Notes to Financial Statements (continued)
| | | | | | | | | | | | | | | | |
| | | Multi-Cap Value | |
| | | Year Ended
6/30/12 | | | Year Ended
6/30/11 | |
| | | Shares | | | Amount | | | Shares | | | Amount | |
Shares sold: | | | | | | | | | | | | | | | | |
Class A | | | 247,520 | | | $ | 4,515,222 | | | | 257,568 | | | $ | 4,693,322 | |
Class A – automatic conversion of Class B Shares | | | 10,844 | | | | 207,951 | | | | 1,662 | | | | 29,720 | |
Class B | | | — | | | | — | | | | 738 | | | | 13,235 | |
Class C | | | 74,453 | | | | 1,258,961 | | | | 206,600 | | | | 3,691,066 | |
Class R3 | | | 3,232 | | | | 56,629 | | | | — | | | | — | |
Class I | | | 1,620,370 | | | | 28,965,660 | | | | 5,275,849 | | | | 94,106,955 | |
Shares issued to shareholders due to reinvestment of distributions: | | | | | | | | | | | | | | | | |
Class A | | | — | | | | — | | | | — | | | | — | |
Class B | | | — | | | | — | | | | — | | | | — | |
Class C | | | — | | | | — | | | | — | | | | — | |
Class R3 | | | — | | | | — | | | | — | | | | — | |
Class I | | | — | | | | — | | | | — | | | | — | |
| | | | 1,956,419 | | | | 35,004,423 | | | | 5,742,417 | | | | 102,534,298 | |
Shares redeemed: | | | | | | | | | | | | | | | | |
Class A | | | (1,172,912 | ) | | | (21,661,723 | ) | | | (1,219,158 | ) | | | (21,543,518 | ) |
Class B | | | (324,947 | ) | | | (5,469,358 | ) | | | (271,607 | ) | | | (4,594,805 | ) |
Class B – automatic conversion to Class A Shares | | | (11,379 | ) | | | (207,951 | ) | | | (1,726 | ) | | | (29,720 | ) |
Class C | | | (991,255 | ) | | | (17,030,431 | ) | | | (1,330,310 | ) | | | (22,630,843 | ) |
Class R3 | | | (3,039 | ) | | | (52,860 | ) | | | (5,545 | ) | | | (95,540 | ) |
Class I | | | (9,374,263 | ) | | | (164,782,159 | ) | | | (8,977,010 | ) | | | (155,489,812 | ) |
| | | | (11,877,795 | ) | | | (209,204,482 | ) | | | (11,805,356 | ) | | | (204,384,238 | ) |
Net increase (decrease) | | | (9,921,376 | ) | | $ | (174,200,059 | ) | | | (6,062,939 | ) | | $ | (101,849,940 | ) |
| |
| | | Large-Cap Value | |
| | | Year Ended
6/30/12 | | | Year Ended
6/30/11 | |
| | | Shares | | | Amount | | | Shares | | | Amount | |
Shares sold: | | | | | | | | | | | | | | | | |
Class A | | | 2,023,048 | | | $ | 34,030,063 | | | | 750,248 | | | $ | 13,506,650 | |
Class A – automatic conversion of Class B Shares | | | 24,970 | | | | 451,455 | | | | — | | | | — | |
Class B | | | 38 | | | | 588 | | | | 2,507 | | | | 44,509 | |
Class C | | | 128,117 | | | | 2,179,623 | | | | 231,440 | | | | 4,162,335 | |
Class R3 | | | 163 | | | | 2,999 | | | | — | | | | — | |
Class I | | | 51,455,595 | | | | 901,206,561 | | | | 12,462,365 | | | | 225,699,002 | |
Shares issued to shareholders due to reinvestment of distributions: | | | | | | | | | | | | | | | | |
Class A | | | 26,860 | | | | 428,819 | | | | 1,685 | | | | 30,408 | |
Class B | | | 318 | | | | 4,930 | | | | — | | | | — | |
Class C | | | 5,015 | | | | 77,839 | | | | — | | | | — | |
Class R3 | | | — | | | | — | | | | — | | | | — | |
Class I | | | 351,987 | | | | 5,662,694 | | | | 61,650 | | | | 1,112,787 | |
| | | | 54,016,111 | | | | 944,045,571 | | | | 13,509,895 | | | | 244,555,691 | |
Shares redeemed: | | | | | | | | | | | | | | | | |
Class A | | | (1,112,286 | ) | | | (18,878,453 | ) | | | (281,473 | ) | | | (4,910,989 | ) |
Class B | | | (6,404 | ) | | | (104,314 | ) | | | (2,321 | ) | | | (41,081 | ) |
Class B – automatic conversion to Class A Shares | | | (25,651 | ) | | | (451,455 | ) | | | — | | | | — | |
Class C | | | (188,332 | ) | | | (3,143,502 | ) | | | (76,312 | ) | | | (1,320,386 | ) |
Class R3 | | | (163 | ) | | | (2,944 | ) | | | — | | | | — | |
Class I | | | (10,460,457 | ) | | | (178,322,147 | ) | | | (7,359,209 | ) | | | (126,907,090 | ) |
Class I – In-kind | | | — | | | | — | | | | (790,197 | ) | | | (14,097,131 | ) |
| | | | (11,793,293 | ) | | | (200,902,815 | ) | | | (8,509,512 | ) | | | (147,276,677 | ) |
Net increase (decrease) | | | 42,222,818 | | | $ | 743,142,756 | | | | 5,000,383 | | | $ | 97,279,014 | |
| | | | | | | | | | | | | | | | |
| | | Small/Mid-Cap Value | |
| | | Year Ended
6/30/12 | | | Year Ended
6/30/11 | |
| | | Shares | | | Amount | | | Shares | | | Amount | |
Shares sold: | | | | | | | | | | | | | | | | |
Class A | | | 327,952 | | | $ | 6,247,935 | | | | 125,266 | | | $ | 2,330,322 | |
Class C | | | 62,283 | | | | 1,187,222 | | | | 38,567 | | | | 717,006 | |
Class R3 | | | 8,627 | | | | 174,606 | | | | — | | | | — | |
Class I | | | 395,045 | | | | 7,790,145 | | | | 402,138 | | | | 7,541,976 | |
Shares issued to shareholders due to reinvestment of distributions: | | | | | | | | | | | | | | | | |
Class A | | | — | | | | — | | | | — | | | | — | |
Class C | | | — | | | | — | | | | — | | | | — | |
Class R3 | �� | | — | | | | — | | | | — | | | | — | |
Class I | | | — | | | | — | | | | — | | | | — | |
| | | | 793,907 | | | | 15,399,908 | | | | 565,971 | | | | 10,589,304 | |
Shares redeemed: | | | | | | | | | | | | | | | | |
Class A | | | (354,368 | ) | | | (7,057,064 | ) | | | (89,087 | ) | | | (1,569,528 | ) |
Class C | | | (22,322 | ) | | | (421,915 | ) | | | (21,715 | ) | | | (381,001 | ) |
Class R3 | | | (1,871 | ) | | | (37,128 | ) | | | — | | | | — | |
Class I | | | (368,745 | ) | | | (7,169,571 | ) | | | (167,368 | ) | | | (3,083,642 | ) |
| | | | (747,306 | ) | | | (14,685,678 | ) | | | (278,170 | ) | | | (5,034,171 | ) |
Net increase (decrease) | | | 46,601 | | | $ | 714,230 | | | | 287,801 | | | $ | 5,555,133 | |
| |
| | | Small-Cap Value | |
| | | Year Ended
6/30/12 | | | Year Ended
6/30/11 | |
| | | Shares | | | Amount | | | Shares | | | Amount | |
Shares sold: | | | | | | | | | | | | | | | | |
Class A | | | 135,049 | | | $ | 3,392,392 | | | | 137,861 | | | $ | 3,142,610 | |
Class C | | | 29,761 | | | | 699,132 | | | | 34,660 | | | | 799,980 | |
Class R3 | | | — | | | | — | | | | 214 | | | | 5,400 | |
Class I | | | 1,161,844 | | | | 29,264,020 | | | | 1,616,836 | | | | 37,621,393 | |
Shares issued to shareholders due to reinvestment of distributions: | | | | | | | | | | | | | | | | |
Class A | | | — | | | | — | | | | — | | | | — | |
Class C | | | — | | | | — | | | | — | | | | — | |
Class R3 | | | — | | | | — | | | | — | | | | — | |
Class I | | | — | | | | — | | | | — | | | | — | |
| | | | 1,326,654 | | | | 33,355,544 | | | | 1,789,571 | | | | 41,569,383 | |
Shares redeemed: | | | | | | | | | | | | | | | | |
Class A | | | (153,794 | ) | | | (3,696,846 | ) | | | (228,916 | ) | | | (5,393,959 | ) |
Class C | | | (37,685 | ) | | | (886,913 | ) | | | (50,367 | ) | | | (1,124,106 | ) |
Class R3 | | | (214 | ) | | | (5,545 | ) | | | — | | | | — | |
Class I | | | (1,040,377 | ) | | | (25,526,851 | ) | | | (2,335,883 | ) | | | (57,003,254 | ) |
| | | | (1,232,070 | ) | | | (30,116,155 | ) | | | (2,615,166 | ) | | | (63,521,319 | ) |
Net increase (decrease) | | | 94,584 | | | $ | 3,239,389 | | | | (825,595 | ) | | $ | (21,951,936 | ) |
Notes to Financial Statements (continued)
| | | | | | | | | | | | | | | | |
| | | Value Opportunities | |
| | | Year Ended
6/30/12 | | | Year Ended
6/30/11 | |
| | | Shares | | | Amount | | | Shares | | | Amount | |
Shares sold: | | | | | | | | | | | | | | | | |
Class A | | | 12,031,010 | | | $ | 398,955,957 | | | | 21,475,323 | | | $ | 744,550,597 | |
Class A – automatic conversion of Class B Shares | | | 179 | | | | 6,132 | | | | 738 | | | | 24,973 | |
Class B | | | 9,315 | | | | 306,950 | | | | 15,614 | | | | 530,405 | |
Class C | | | 1,206,678 | | | | 39,524,376 | | | | 6,952,830 | | | | 235,972,429 | |
Class R3 | | | 190,034 | | | | 6,263,621 | | | | 187,394 | | | | 6,566,510 | |
Class I | | | 12,690,671 | | | | 429,935,165 | | | | 28,299,535 | | | | 984,873,233 | |
Shares issued to shareholders due to reinvestment of distributions: | | | | | | | | | | | | | | | | |
Class A | | | 3,155,445 | | | | 96,095,067 | | | | 1,243,318 | | | | 43,508,206 | |
Class B | | | 13,640 | | | | 403,860 | | | | 6,776 | | | | 230,906 | |
Class C | | | 761,915 | | | | 22,551,160 | | | | 268,889 | | | | 9,160,217 | |
Class R3 | | | 14,420 | | | | 438,872 | | | | 901 | | | | 31,501 | |
Class I | | | 2,785,366 | | | | 85,196,992 | | | | 1,130,122 | | | | 39,706,895 | |
| | | | 32,858,673 | | | | 1,079,678,152 | | | | 59,581,440 | | | | 2,065,155,872 | |
Shares redeemed: | | | | | | | | | | | | | | | | |
Class A | | | (34,224,206 | ) | | | (1,091,692,179 | ) | | | (8,516,105 | ) | | | (296,306,385 | ) |
Class B | | | (48,169 | ) | | | (1,462,049 | ) | | | (23,366 | ) | | | (786,635 | ) |
Class B – automatic conversion to Class A Shares | | | (184 | ) | | | (6,132 | ) | | | (748 | ) | | | (24,973 | ) |
Class C | | | (6,470,059 | ) | | | (194,403,741 | ) | | | (1,266,428 | ) | | | (42,580,995 | ) |
Class R3 | | | (176,965 | ) | | | (5,878,757 | ) | | | (43,378 | ) | | | (1,517,789 | ) |
Class I | | | (50,452,170 | ) | | | (1,594,131,526 | ) | | | (15,510,421 | ) | | | (526,456,237 | ) |
| | | | (91,371,753 | ) | | | (2,887,574,384 | ) | | | (25,360,446 | ) | | | (867,673,014 | ) |
Net increase (decrease) | | | (58,513,080 | ) | | $ | (1,807,896,232 | ) | | | 34,220,994 | | | $ | 1,197,482,858 | |
5. Investment Transactions
Purchases and sales (including maturities but excluding short-term investments) during the fiscal year ended June 30, 2012, were as follows:
| | | | | | | | | | | | | | | | | | | | | | | | |
| | | Multi-Manager
Large-Cap
Value | | | Multi-Cap
Value | | | Large-Cap
Value | | | Small/Mid-Cap
Value | | | Small-Cap
Value | | | Value
Opportunities | |
Purchases | | $ | 300,180,840 | | | $ | 94,749,546 | | | $ | 908,546,192 | | | $ | 12,903,346 | | | $ | 42,123,954 | | | $ | 2,472,412,901 | |
Sales and maturities | | | 340,119,890 | | | | 251,536,374 | | | | 199,154,852 | | | | 11,712,237 | | | | 48,472,452 | | | | 3,950,244,319 | |
6. Income Tax Information
The following information is presented on an income tax basis. Differences between amounts for financial statement and federal income tax purposes are primarily due to timing differences in recognizing certain gains and losses on investment transactions. To the extent that differences arise that are permanent in nature, such amounts are reclassified within the capital accounts as detailed below. Temporary differences do not require reclassification. Temporary and permanent differences do not impact the net asset values of the Funds.
At June 30, 2012, the cost and unrealized appreciation (depreciation) of investments as determined on a federal income tax basis, were as follows:
| | | | | | | | | | | | | | | | | | | | | | | | |
| | | Multi-Manager
Large-Cap
Value | | | Multi-Cap
Value | | | Large-Cap
Value | | | Small/Mid-Cap
Value | | | Small-Cap
Value | | | Value
Opportunities | |
Cost of investments | | $ | 271,183,659 | | | $ | 166,049,138 | | | $ | 1,136,118,525 | | | $ | 19,676,903 | | | $ | 93,276,915 | | | $ | 1,170,013,834 | |
Gross unrealized: | | | | | | | | | | | | | | | | | | | | | | | | |
Appreciation | | $ | 45,971,846 | | | $ | 27,166,388 | | | $ | 52,670,573 | | | $ | 3,974,260 | | | $ | 21,246,437 | | | $ | 67,409,873 | |
Depreciation | | | (17,533,198 | ) | | | (22,506,224 | ) | | | (82,329,400 | ) | | | (1,829,384 | ) | | | (11,681,431 | ) | | | (114,883,197 | ) |
Net unrealized appreciation (depreciation) of investments | | $ | 28,438,648 | | | $ | 4,660,164 | | | $ | (29,658,827 | ) | | $ | 2,144,876 | | | $ | 9,565,006 | | | $ | (47,473,324 | ) |
Permanent differences, primarily due to federal taxes paid, distribution reclasses, net operating losses, tax equalization, foreign currency reclassifications, and adjustments for investments in passive foreign investment companies, resulted in reclassifications among the Funds’ components of net assets at June 30, 2012, the Funds’ tax year end, as follows:
| | | | | | | | | | | | | | | | | | | | | | | | |
| | | Multi-Manager
Large-Cap
Value | | | Multi-Cap
Value | | | Large-Cap
Value | | | Small/Mid-Cap
Value | | | Small-Cap
Value | | | Value
Opportunities | |
Capital paid-in | | $ | — | | | $ | (235,120 | ) | | $ | (46,752 | ) | | $ | (28,287 | ) | | $ | (226,302 | ) | | $ | (1,202,695 | ) |
Undistributed (Over-distribution of) net investment income | | | (104 | ) | | | 235,068 | | | | (1,098 | ) | | | 28,287 | | | | 226,302 | | | | 14,597,061 | |
Accumulated net realized gain (loss) | | | 104 | | | | 52 | | | | 47,850 | | | | — | | | | — | | | | (13,394,366 | ) |
The tax components of undistributed net ordinary income and net long-term capital gains at June 30, 2012, the Funds’ tax year end, were as follows:
| | | | | | | | | | | | | | | | | | | | | | | | |
| | | Multi-Manager
Large-Cap
Value | | | Multi-Cap
Value | | | Large-Cap
Value | | | Small/Mid-Cap
Value | | | Small-Cap
Value | | | Value
Opportunities | |
Undistributed net ordinary income* | | $ | 3,933,280 | | | $ | 502,955 | | | $ | 7,586,713 | | | $ | — | | | $ | — | | | $ | 25,470,256 | |
Undistributed net long-term capital gains | | | — | | | | — | | | | 2,446,811 | | | | — | | | | — | | | | — | |
| * | Net ordinary income consists of net taxable income derived from dividends, interest, and net short-term capital gains, if any. |
The tax character of distributions paid during the Funds’ tax years ended June 30, 2012 and June 30, 2011, was designated for purposes of the dividends paid deduction as follows:
| | | | | | | | | | | | | | | | | | | | | | | | |
| 2012 | | Multi-Manager
Large-Cap
Value | | | Multi-Cap
Value | | | Large-Cap
Value | | | Small/Mid-Cap
Value | | | Small-Cap
Value | | | Value
Opportunities | |
Distributions from net ordinary income* | | $ | 3,695,818 | | | $ | — | | | $ | 3,805,178 | | | $ | — | | | $ | — | | | $ | 128,646,179 | |
Distributions from net long-term capital gains** | | | — | | | | — | | | | 3,400,813 | | | | — | | | | — | | | | 137,797,693 | |
| | | | | | | | | | | | | | | | | | | | | | | | |
| 2011 | | Multi-Manager
Large-Cap
Value | | | Multi-Cap
Value | | | Large-Cap
Value | | | Small/Mid-Cap
Value | | | Small-Cap
Value | | | Value
Opportunities | |
Distributions from net ordinary income* | | $ | 3,855,693 | | | $ | — | | | $ | 1,202,964 | | | $ | — | | | $ | — | | | $ | 89,346,972 | |
Distributions from net long-term capital gains | | | — | | | | — | | | | — | | | | — | | | | — | | | | 34,808,611 | |
| * | Net ordinary income consists of net taxable income derived from dividends, interest, and net short-term capital gains, if any. |
| ** | The Funds designate as long-term capital gain dividend, pursuant to the Internal Revenue Code Section 852(b)(3), the amount necessary to reduce earnings and profits of the Funds related to net capital gain to zero for the tax year ended June 30, 2012. |
At June 30, 2012, the Funds’ tax year end, the following Funds had unused capital loss carryforwards available for federal tax purposes to be applied against future capital gains, if any. If not applied, the carryforwards will expire as follows:
| | | | | | | | | | | | | | | | |
| | | Multi-Manager
Large-Cap
Value | | | Multi-Cap
Value | | | Small/Mid-Cap
Value* | | | Small-Cap
Value | |
Expiration: | | | | | | | | | | | | | | | | |
June 30, 2016 | | $ | — | | | $ | — | | | $ | 9,696,398 | | | $ | — | |
June 30, 2017 | | | — | | | | 143,374,877 | | | | 21,132,667 | | | | — | |
June 30, 2018 | | | 50,334,571 | | | | 100,615,795 | | | | 838,796 | | | | 42,176,345 | |
Total | | $ | 50,334,571 | | | $ | 243,990,672 | | | $ | 31,667,861 | | | $ | 42,176,345 | |
| * | A portion of Small/Mid-Cap Value’s capital loss carryforwards are subject to an annual limitation under the Internal Revenue Code and related regulations. |
During the Funds’ tax year ended June 30, 2012, the following Funds utilized their capital loss carryforwards as follows:
| | | | | | | | | | | | | | | | |
| | | Multi-Manager
Large-Cap
Value
| | | Multi-Cap
Value
| | | Small/Mid-Cap
Value
| | | Small-Cap
Value
| |
Utilized capital loss carryforwards | | $ | 13,790,606 | | | $ | 25,939,528 | | | $ | 1,507,039 | | | $ | 11,016,656 | |
On December 22, 2010, the Regulated Investment Company Modernization Act of 2010 (the “Act”) was enacted, which changed various technical rules governing the tax treatment of RICs. The changes are generally effective for taxable years beginning after the date of enactment. One of the more prominent changes addresses capital loss carryforwards. Under the Act, each Fund will be
Notes to Financial Statements (continued)
permitted to carry forward capital losses incurred in taxable years beginning after the date of enactment for an unlimited period. However, any losses incurred during those future taxable years will be required to be utilized prior to the losses incurred in pre-enactment taxable years, which carry an expiration date. As a result of this ordering rule, pre-enactment capital loss carryforwards may be more likely to expire unused. Additionally, post-enactment capital loss carryforwards will retain their character as either short-term or long-term capital losses rather than being considered all short-term as permitted under previous regulation.
The Act also contains several provisions aimed at preserving the character of distributions made by a fiscal year RIC during the portion of its taxable year ending after October 31 or December 31, reducing the circumstances under which a RIC might be required to file amended Forms 1099 to restate previously reported distributions.
During the Funds’ tax year ended June 30, 2012, there were no post-enactment capital losses generated.
The Funds have elected to defer losses incurred from November 1, 2011 through June 30, 2012, the Funds’ tax year end, in accordance with federal income tax rules. These losses are treated as having arisen on the first day of the following fiscal year. The following Funds have elected to defer losses as follows:
| | | | | | | | | | | | | | | | |
| | | Large-Cap
Value | | | Small/Mid-Cap
Value | | | Small-Cap
Value | | | Value
Opportunities | |
Post-October capital losses | | $ | 226,590 | | | $ | — | | | $ | — | | | $ | 37,654,294 | |
Late-year ordinary losses | | | — | | | | 47,866 | | | | 247,085 | | | | — | |
7. Management Fees and Other Transactions with Affiliates
Each Fund’s management fee consists of two components – a fund-level fee, based only on the amount of assets within each individual Fund, and a complex-level fee, based on the aggregate amount of all eligible fund assets managed by the Adviser. This pricing structure enables each Fund’s shareholders to benefit from growth in the assets within their respective Fund as well as from growth in the amount of complex-wide assets managed by the Adviser.
The annual fund-level fee for each Fund, payable monthly, is calculated according to the following schedule:
| | | | | | | | | | | | | | | | | | | | | | | | |
| Average Daily Net Assets | | Multi-Manager
Large-Cap
Value
Fund-Level
Fee Rate | | | Multi-Cap
Value
Fund-Level
Fee Rate | | | Large-Cap
Value
Fund-Level
Fee Rate | | | Small/Mid-Cap
Value
Fund-Level
Fee Rate | | | Small-Cap
Value
Fund-Level
Fee Rate | | | Value
Opportunities
Fund-Level
Fee Rate | |
For the first $125 million | | | .5500 | % | | | .6300 | % | | | .5500 | % | | | .6000 | % | | | .7500 | % | | | .6300 | % |
For the next $125 million | | | .5375 | | | | .6175 | | | | .5375 | | | | .5875 | | | | .7375 | | | | .6175 | |
For the next $250 million | | | .5250 | | | | .6050 | | | | .5250 | | | | .5750 | | | | .7250 | | | | .6050 | |
For the next $500 million | | | .5125 | | | | .5925 | | | | .5125 | | | | .5625 | | | | .7125 | | | | .5925 | |
For the next $1 billion | | | .5000 | | | | .5800 | | | | .5000 | | | | .5500 | | | | .7000 | | | | .5800 | |
For net assets over $2 billion | | | .4750 | | | | .5550 | | | | .4750 | | | | .5250 | | | | .6750 | | | | .5550 | |
The annual complex-level fee for each Fund, payable monthly, is calculated according to the following schedule:
| | | | |
| Complex-Level Asset Breakpoint Level* | | Effective Rate at Breakpoint Level | |
$55 billion | | | .2000 | % |
$56 billion | | | .1996 | |
$57 billion | | | .1989 | |
$60 billion | | | .1961 | |
$63 billion | | | .1931 | |
$66 billion | | | .1900 | |
$71 billion | | | .1851 | |
$76 billion | | | .1806 | |
$80 billion | | | .1773 | |
$91 billion | | | .1691 | |
$125 billion | | | .1599 | |
$200 billion | | | .1505 | |
$250 billion | | | .1469 | |
$300 billion | | | .1445 | |
| * | The complex-level fee is calculated based upon the aggregate daily “eligible assets” of all Nuveen Funds. Eligible assets do not include assets attributable to investments in other Nuveen Funds or assets in excess of $2 billion added to the Nuveen Fund complex in connection with the Adviser’s assumption of the management of the former First American Funds effective January 1, 2011. Eligible assets include closed-end fund assets managed by the Adviser that are attributable to financial leverage. For these purposes, financial leverage includes the closed-end funds’ use of preferred stock and borrowings and certain investments in the residual interest certificates (also called inverse floating rate securities) in tender option bond (TOB) trusts, including the portion of assets held by a TOB trust that has been effectively financed by the trust’s issuance of floating rate securities, subject to an agreement by the Adviser as to certain funds to limit the amount of such assets for determining eligible assets in certain circumstances. As of June 30, 2012, the complex-level fee rate for each of these Funds was .1731%. |
The management fee compensates the Adviser for overall investment advisory and administrative services and general office facilities. The Adviser is responsible for each Fund’s overall strategy and asset allocation decisions. The Adviser has entered into sub-advisory agreements with Nuveen Asset Management, LLC, Symphony, ICAP, NWQ and Tradewinds (collectively, the “Sub-Advisers”), under which the Sub-Advisers manage the investment portfolio for their respective Funds. The Sub-Advisers are compensated for their services to the Funds from the management fees paid to the Adviser.
The Adviser has agreed to waive fees and/or reimburse expenses (“Expense Cap”) of each Fund so that total annual Fund operating expenses (excluding 12b-1 distribution and/or service fees, interest expenses, taxes, fees incurred in acquiring and disposing of portfolio securities, and extraordinary expenses) do not exceed the average daily net assets of any class of Fund shares in the amounts and for the time periods stated in the following table.
| | | | | | | | | | | | |
| Fund | | Temporary
Expense Cap | | | Temporary
Expense Cap
Expiration Date | | | Permanent
Expense Cap | |
Multi-Manager Large-Cap Value | | | 0.95 | % | | | October 31, 2012 | | | | 1.20 | % |
Large-Cap Value | | | 1.10 | | | | October 31, 2012 | | | | 1.35 | |
Small/Mid-Cap Value | | | 1.10 | | | | October 31, 2012 | | | | 1.45 | |
Small-Cap Value | | | N/A | | | | N/A | | | | 1.50 | |
Value Opportunities | | | N/A | | | | N/A | | | | 1.50 | |
The Adviser may voluntarily reimburse expenses from time to time in any of the Funds. Voluntary reimbursements may be terminated at any time at the Adviser's discretion.
The Trust pays no compensation directly to those of its trustees who are affiliated with the Adviser or to its officers, all of whom receive remuneration for their services to the Trust from the Adviser or its affiliates. The Board of Trustees has adopted a deferred compensation plan for independent trustees that enables trustees to elect to defer receipt of all or a portion of the annual compensation they are entitled to receive from certain Nuveen-advised funds. Under the plan, deferred amounts are treated as though equal dollar amounts had been invested in shares of select Nuveen-advised funds.
During the fiscal year ended June 30, 2012, Nuveen Securities, LLC (the “Distributor”) , a wholly-owned subsidiary of Nuveen, collected sales charges on purchases of Class A Shares, the majority of which were paid out as concessions to financial intermediaries as follows:
| | | | | | | | | | | | | | | | | | | | | | | | |
| | | Multi-Manager
Large-Cap
Value | | | Multi-Cap
Value | | | Large-Cap
Value | | | Small/Mid-Cap
Value | | | Small-Cap
Value | | | Value
Opportunities | |
Sales charges collected (Unaudited) | | $ | 20,273 | | | $ | 21,006 | | | $ | 45,918 | | | $ | 26,812 | | | $ | 3,949 | | | $ | 696,064 | |
Paid to financial intermediaries (Unaudited) | | | 17,736 | | | | 18,361 | | | | 40,159 | | | | 23,483 | | | | 3,435 | | | | 622,200 | |
The Distributor also received 12b-1 service fees on Class A Shares, substantially all of which were paid to compensate financial intermediaries for providing services to shareholders relating to their investments.
During the fiscal year ended June 30, 2012, the Distributor compensated financial intermediaries directly with commission advances at the time of purchase as follows:
| | | | | | | | | | | | | | | | | | | | | | | | |
| | | Multi-Manager
Large-Cap
Value | | | Multi-Cap
Value | | | Large-Cap
Value | | | Small/Mid-Cap
Value | | | Small-Cap
Value | | | Value
Opportunities | |
Commission advances (Unaudited) | | $ | 3,435 | | | $ | 9,173 | | | $ | 19,325 | | | $ | 8,840 | | | $ | 5,847 | | | $ | 378,619 | |
To compensate for commissions advanced to financial intermediaries, all 12b-1 service and distribution fees collected on Class B Shares during the first year following a purchase, all 12b-1 distribution fees collected on Class B Shares, and all 12b-1 service and distribution fees collected on Class C Shares during the first year following a purchase are retained by the Distributor. During the fiscal year ended June 30, 2012, the Distributor retained such 12b-1 fees as follows:
| | | | | | | | | | | | | | | | | | | | | | | | |
| | | Multi-Manager
Large-Cap
Value | | | Multi-Cap
Value | | | Large-Cap
Value | | | Small/Mid-Cap
Value | | | Small-Cap
Value | | | Value
Opportunities | |
12b-1 fees retained (Unaudited) | | $ | 15,850 | | | $ | 102,268 | | | $ | 28,516 | | | $ | 6,041 | | | $ | 5,887 | | | $ | 1,278,717 | |
The remaining 12b-1 fees charged to the Funds were paid to compensate financial intermediaries for providing services to shareholders relating to their investments.
Notes to Financial Statements (continued)
The Distributor also collected and retained CDSC on share redemptions during the fiscal year ended June 30, 2012, as follows:
| | | | | | | | | | | | | | | | | | | | | | | | |
| | | Multi-Manager
Large-Cap
Value | | | Multi-Cap
Value | | | Large-Cap
Value | | | Small/Mid-Cap Value | | | Small-Cap
Value | | | Value
Opportunities | |
CDSC retained (Unaudited) | | $ | 1,355 | | | $ | 51,039 | | | $ | 31,111 | | | $ | 818 | | | $ | 1,781 | | | $ | 252,994 | |
At June 30, 2012, Nuveen owned shares of the Funds as follows:
| | | | | | | | | | | | | | | | | | | | | | | | |
| | | Multi-Manager
Large-Cap
Value | | | Multi-Cap
Value | | | Large-Cap
Value | | | Small/Mid-Cap
Value | | | Small-Cap
Value | | | Value
Opportunities | |
Class A | | | — | | | | — | | | | — | | | | — | | | | — | | | | — | |
Class B | | | — | | | | — | | | | N/A | | | | N/A | | | | N/A | | | | — | |
Class C | | | — | | | | — | | | | — | | | | — | | | | — | | | | — | |
Class R3 | | | 2,757 | | | | — | | | | 3,281 | | | | 3,695 | | | | 2,767 | | | | — | |
Class I | | | — | | | | — | | | | — | | | | — | | | | — | | | | — | |
New Accounting Pronouncements
Financial Accounting Standards Board (“FASB”) Balance Sheet (Topic 210): Disclosures about Offsetting Assets and Liabilities
In December 2011, the FASB issued Accounting Standards Update (“ASU”) No. 2011-11 (“ASU No. 2011-11”)to enhance disclosures about financial instruments and derivative instruments that are subject to offsetting (“netting”) on the Statement of Assets and Liabilities. This information will enable users of the entity’s financial statements to evaluate the effect or potential effect of netting arrangements on the entity’s financial position. ASU No. 2011-11 is effective prospectively during interim or annual periods beginning on or after January 1, 2013. At this time, management is evaluating the implications of this guidance and the impact it will have to the financial statements amounts and footnote disclosures, if any.
Trustees and Officers (Unaudited)
The management of the Funds, including general supervision of the duties performed for the Funds by the Adviser, is the responsibility of the Board of Trustees of the Funds. The number of trustees of the Funds is currently set at ten. None of the trustees who are not “interested” persons of the Funds (referred to herein as “independent trustees”) has ever been a director or employee of, or consultant to, Nuveen or its affiliates. The names and business addresses of the trustees and officers of the Funds, their principal occupations and other affiliations during the past five years, the number of portfolios each oversees and other directorships they hold are set forth below.
The Funds’ Statement of Additional Information (“SAI”) includes more information about the trustees. To request a free copy, call Nuveen Investments at (800) 257-8787 or visit the Funds’ website at www.nuveen.com.
| | | | | | | | |
Name, Birthdate and Address | | Position(s) Held with the Funds | | Year First Elected or Appointed (1) | | Principal Occupation(s) Including other Directorships During Past 5 Years | | Number of Portfolios in Fund Complex Overseen by Trustee |
| | |
| Independent Trustees: | | | | |
Robert P. Bremner 8/22/40 333 W. Wacker Drive Chicago, IL 60606 | | Chairman of the Board and Trustee | | 1996 | | Private Investor and Management Consultant; Treasurer and Director, Humanities Council of Washington, D.C.; Board Member, Independent Directors Council affiliated with the Investment Company Institute. | | 220 |
Jack B. Evans 10/22/48 333 W. Wacker Drive Chicago, IL 60606 | | Trustee | | 1999 | | President, The Hall-Perrine Foundation, a private philanthropic corporation (since 1996); Director and Chairman, United Fire Group, a publicly held company; member of the Board of Regents for the State of Iowa University System; Director, Source Media Group; Life Trustee of Coe College and the Iowa College Foundation; formerly, Director, Alliant Energy; formerly, Director, Federal Reserve Bank of Chicago; formerly, President and Chief Operating Officer, SCI Financial Group, Inc., a regional financial services firm. | | 220 |
William C. Hunter 3/6/48 333 W. Wacker Drive Chicago, IL 60606 | | Trustee | | 2004 | | Dean Emeritus (since June 30, 2012), formerly, Dean, Tippie College of Business, University of Iowa (2006-2012); Director (since 2004) of Xerox Corporation; Director (since 2005), and President (since July 2012) Beta Gamma Sigma International Honor Society; Director of Wellmark, Inc. (since 2009); formerly, Dean and Distinguished Professor of Finance, School of Business at the University of Connecticut (2003-2006); previously, Senior Vice President and Director of Research at the Federal Reserve Bank of Chicago (1995-2003); formerly, Director (1997-2007), Credit Research Center at George Washington University. | | 220 |
David J. Kundert 10/28/42 333 W. Wacker Drive Chicago, IL 60606 | | Trustee | | 2005 | | Director, Northwestern Mutual Wealth Management Company; retired (since 2004) as Chairman, JPMorgan Fleming Asset Management, President and CEO, Banc One Investment Advisors Corporation, and President, One Group Mutual Funds; prior thereto, Executive Vice President, Banc One Corporation and Chairman and CEO, Banc One Investment Management Group; Member, Board of Regents, Luther College; member of the Wisconsin Bar Association; member of Board of Directors, Friends of Boerner Botanical Gardens; member of Board of Directors and Chair of Investment Committee, Greater Milwaukee Foundation. | | 220 |
William J. Schneider 9/24/44 333 W. Wacker Drive Chicago, IL 60606 | | Trustee | | 1996 | | Chairman of Miller-Valentine Partners Ltd., a real estate investment company; formerly, Senior Partner and Chief Operating Officer (retired 2004) of Miller-Valentine Group; member, University of Dayton Business School Advisory Council; member, Mid-America Health System Board; formerly, member and chair, Dayton Philharmonic Orchestra Association; formerly, member, Business Advisory Council, Cleveland Federal Reserve Bank. | | 220 |
Judith M. Stockdale 12/29/47 333 W. Wacker Drive Chicago, IL 60606 | | Trustee | | 1997 | | Executive Director, Gaylord and Dorothy Donnelley Foundation (since 1994); prior thereto, Executive Director, Great Lakes Protection Fund (1990-1994). | | 220 |
Carole E. Stone 6/28/47 333 W. Wacker Drive Chicago, IL 60606 | | Trustee | | 2007 | | Director, Chicago Board Options Exchange (since 2006); Director, C2 Options Exchange, Incorporated (since 2009); formerly, Commissioner, New York State Commission on Public Authority Reform (2005-2010); formerly, Chair, New York Racing Association Oversight Board (2005-2007). | | 220 |
Trustees and Officers (Unaudited) (continued)
| | | | | | | | |
Name, Birthdate and Address | | Position(s) Held with the Funds | | Year First Elected or Appointed (1) | | Principal Occupation(s) During Past Five Years | | Number of Portfolios in Fund Complex Overseen by Trustee |
Virginia L. Stringer 8/16/44 333 West Wacker Drive Chicago, IL 60606 | | Trustee | | 2011 | | Board Member, Mutual Fund Directors Forum; former governance consultant and non-profit board member; former Owner and President, Strategic Management Resources, Inc. a management consulting firm; former Member, Governing Board, Investment Company Institute’s Independent Directors Council; previously, held several executive positions in general management, marketing and human resources at IBM and The Pillsbury Company; Independent Director, First American Fund Complex (1987-2010) and Chair (1997-2010). | | 220 |
Terence J. Toth 9/29/59 333 W. Wacker Drive Chicago, IL 60606 | | Trustee | | 2008 | | Director, Legal & General Investment Management America, Inc. (since 2008); Managing Partner, Promus Capital (since 2008); formerly, CEO and President, Northern Trust Global Investments (2004-2007); Executive Vice President, Quantitative Management & Securities Lending (2000-2004); prior thereto, various positions with Northern Trust Company (since 1994); member: Goodman Theatre Board (since 2004), Chicago Fellowship Board (since 2005), Catalyst Schools of Chicago Board (since 2008); Mather Foundation Board (since 2012) and a member of its investment committee; formerly, member: Northern Trust Mutual Funds Board (2005-2007), Northern Trust Global Investments Board (2004-2007), Northern Trust Japan Board (2004-2007), Northern Trust Securities Inc. Board (2003-2007) and Northern Trust Hong Kong Board (1997-2004). | | 220 |
| | |
| Interested Trustee: | | | | |
John P. Amboian (2) 6/14/61 333 W. Wacker Drive Chicago, IL 60606 | | Trustee | | 2008 | | Chief Executive Officer and Chairman (since 2007) and Director (since 1999) of Nuveen Investments, Inc., formerly, President (1999-2007); Chief Executive Officer (since 2007) of Nuveen Investments Advisers Inc.; Director (since 1998) formerly, Chief Executive Officer (2007-2010) of Nuveen Fund Advisors, Inc. | | 220 |
Name, Birthdate and Address | | Position(s) Held with the Funds | | Year First Elected or Appointed (3) | | Principal Occupation(s) During Past 5 Years | | Number of Portfolios in Fund Complex Overseen by Officer |
| | |
| Officers of the Funds: | | | | |
Gifford R. Zimmerman 9/9/56 333 W. Wacker Drive Chicago, IL 60606 | | Chief Administrative Officer | | 1988 | | Managing Director (since 2002), Assistant Secretary of Nuveen Securities, LLC; Managing Director (since 2004) and Assistant Secretary (since 1994) of Nuveen Investments, Inc.; Managing Director (since 2002), Assistant Secretary (since 1997) and Co-General Counsel (since 2011) of Nuveen Fund Advisors, Inc.; Managing Director, Assistant Secretary and Associate General Counsel of Nuveen Asset Management, LLC (since 2011); Managing Director, Associate General Counsel and Assistant Secretary of Symphony Asset Management LLC (since 2003); Vice President and Assistant Secretary of NWQ Investment Management Company, LLC (since 2002), Nuveen Investments Advisers Inc. (since 2002), Santa Barbara Asset Management, LLC (since 2006) and of Winslow Capital Management Inc. (since 2010); Chief Administrative Officer and Chief Compliance Officer (since 2006) of Nuveen Commodities Asset Management, LLC; Chartered Financial Analyst. | | 220 |
Margo L. Cook 4/11/64 333 W. Wacker Drive Chicago, IL 60606 | | Vice President | | 2009 | | Executive Vice President (since 2008) of Nuveen Investments, Inc. and of Nuveen Fund Advisors, Inc. (since 2011); Managing Director – Investment Services of Nuveen Commodities Asset Management, LLC (since August 2011) previously, Head of Institutional Asset Management (2007-2008) of Bear Stearns Asset Management; Head of Institutional Asset Management (1986-2007) of Bank of NY Mellon; Chartered Financial Analyst. | | 220 |
| | | | | | | | |
Name, Birthdate and Address | | Position(s) Held with the Funds | | Year First Elected or Appointed (3) | | Principal Occupation(s) During Past 5 Years | | Number of Portfolios in Fund Complex Overseen by Officer |
Lorna C. Ferguson 10/24/45 333 W. Wacker Drive Chicago, IL 60606 | | Vice President | | 1998 | | Managing Director (since 2005) of Nuveen Fund Advisors, Inc. and Nuveen Securities, LLC (since 2004). | | 220 |
Stephen D. Foy 5/31/54 333 W. Wacker Drive Chicago, IL 60606 | | Vice President and Controller | | 1998 | | Senior Vice President (since 2010), formerly, Vice President (2005-2010) and Funds Controller of Nuveen Securities, LLC; Vice President of Nuveen Fund Advisors, Inc.; Chief Financial Officer of Nuveen Commodities Asset Management, LLC (since 2010); Certified Public Accountant. | | 220 |
Scott S. Grace 8/20/70 333 W. Wacker Drive Chicago, IL 60606 | | Vice President and Treasurer | | 2009 | | Managing Director, Corporate Finance & Development, Treasurer (since 2009) of Nuveen Securities, LLC; Managing Director and Treasurer (since 2009) of Nuveen Fund Advisors, Inc., Nuveen Investments Advisers, Inc., Nuveen Investments Holdings Inc. and (since 2011) Nuveen Asset Management, LLC; Vice President and Treasurer of NWQ Investment Management Company, LLC, Tradewinds Global Investors, LLC, Symphony Asset Management LLC and Winslow Capital Management, Inc.; Vice President of Santa Barbara Asset Management, LLC; formerly, Treasurer (2006-2009), Senior Vice President (2008-2009), previously, Vice President (2006-2008) of Janus Capital Group, Inc.; formerly, Senior Associate in Morgan Stanley’s Global Financial Services Group (2000-2003); Chartered Accountant Designation. | | 220 |
Walter M. Kelly 2/24/70 333 W. Wacker Drive Chicago, IL 60606 | | Chief Compliance Officer and Vice President | | 2003 | | Senior Vice President (since 2008) and Assistant Secretary (since 2003) of Nuveen Fund Advisors, Inc; Senior Vice President (since 2008) of Nuveen Investments Holdings, Inc; formerly, Senior Vice President (2008-2011) of Nuveen Securities, LLC. | | 220 |
Tina M. Lazar 8/27/61 333 W. Wacker Drive Chicago, IL 60606 | | Vice President | | 2002 | | Senior Vice President (since 2010), formerly, Vice President (2005-2010) of Nuveen Fund Advisors, Inc. | | 220 |
Name, Birthdate and Address | | Position(s) Held with the Funds | | Year First Elected or Appointed (3) | | Principal Occupation(s) Including other Directorships During Past 5 Years | | Number of Portfolios in Fund Complex Overseen by Officer |
Kevin J. McCarthy 3/26/66 333 W. Wacker Drive Chicago, IL 60606 | | Vice President and Secretary | | 2007 | | Managing Director and Assistant Secretary (since 2008), formerly, Vice President (2007-2008), Nuveen Securities, LLC; Managing Director (since 2008), Assistant Secretary (since 2007) and Co-General Counsel (since 2011) of Nuveen Fund Advisors, Inc.; Managing Director, Assistant Secretary and Associate General Counsel (since 2011) of Nuveen Asset Management, LLC; Managing Director (since 2008), and Assistant Secretary, Nuveen Investment Holdings, Inc.; Vice President (since 2007) and Assistant Secretary of Nuveen Investments Advisers Inc., NWQ Investment Management Company, LLC, Tradewinds Global Investors LLC, NWQ Holdings, LLC, Symphony Asset Management LLC, Santa Barbara Asset Management, LLC, and of Winslow Capital Management, Inc. (since 2010); Vice President and Secretary (since 2010) of Nuveen Commodities Asset Management, LLC; prior thereto, Partner, Bell, Boyd & Lloyd LLP (1997-2007). | | 220 |
Kathleen L. Prudhomme 3/30/53 901 Marquette Avenue Minneapolis, MN 55402 | | Vice President and Assistant Secretary | | 2011 | | Managing Director, Assistant Secretary and Co-General Counsel (since 2011) of Nuveen Fund Advisors, Inc.; Managing Director, Assistant Secretary and Associate General Counsel (since 2011) of Nuveen Asset Management, LLC; Managing Director and Assistant Secretary (since 2011) of Nuveen Securities, LLC; formerly, Deputy General Counsel, FAF Advisors, Inc. (2004-2010). | | 220 |
Trustees and Officers (Unaudited) (continued)
| | | | | | | | |
Name, Birthdate and Address | | Position(s) Held with the Funds | | Year First Elected or Appointed (3) | | Principal Occupation(s) Including other Directorships During Past 5 Years | | Number of Portfolios in Fund Complex Overseen by Officer |
Jeffery M. Wilson 3/13/56 333 West Wacker Drive Chicago, IL 60606 | | Vice President | | 2011 | | Senior Vice President of Nuveen Securities, LLC (since 2011); formerly, Senior Vice President of FAF Advisors, Inc. (2000-2010). | | 102 |
| (1) | Trustees serve an indefinite term until his/her successor is elected or appointed. The year first elected or appointed represents the year in which the trustee was first elected or appointed to any fund in the Nuveen Fund Complex. |
| (2) | Mr. Amboian is an interested trustee because of his position with Nuveen Investments, Inc. and certain of its subsidiaries, which are affiliates of the Nuveen Funds. |
| (3) | Officers serve one year terms through August of each year. The year first elected or appointed represents the year in which the officer was first elected or appointed to any fund in the Nuveen Fund Complex. |
Annual Investment Management Agreement Approval Process
(Unaudited)
The Board of Trustees (each, a “Board” and each Trustee, a “Board Member”) of the Funds, including the Board Members who are not parties to the Funds’ advisory or sub-advisory agreements or “interested persons” of any such parties (the “Independent Board Members”), is responsible for approving the advisory agreements (each, an “Investment Management Agreement”) between each Fund and Nuveen Fund Advisors, Inc. (the “Advisor”) and the sub-advisory agreements (each, a “Sub-Advisory Agreement”) between (a) the Advisor and NWQ Investment Management Company, LLC (“NWQ”) on behalf of each of the following Funds: the Nuveen NWQ Multi-Cap Value Fund, the Nuveen NWQ Large-Cap Value Fund, the Nuveen NWQ Small/Mid-Cap Value Fund and the Nuveen NWQ Small-Cap Value Fund; (b) the Advisor and Tradewinds Global Investors, LLC (“Tradewinds”) on behalf of the Nuveen Tradewinds Value Opportunities Fund; and (c) the Advisor and Institutional Capital LLC (“ICAP”), Nuveen Asset Management, LLC (“Nuveen Asset Management”) and Symphony Asset Management LLC (“Symphony”), respectively, on behalf of the Nuveen Multi-Manager Large-Cap Value Fund, and their periodic continuation. NWQ, Tradewinds, ICAP, Nuveen Asset Management and Symphony are each a “Sub-Advisor” and the Investment Management Agreements and the Sub-Advisory Agreements are referred to collectively as the “Advisory Agreements.” Pursuant to the Investment Company Act of 1940, as amended (the “1940 Act”), the Board is required to consider the continuation of the Advisory Agreements on an annual basis. Accordingly, at an in-person meeting held on May 21-23, 2012 (the “May Meeting”), the Board, including a majority of the Independent Board Members, considered and approved the continuation of the Advisory Agreements for the Funds for an additional one-year period.
In preparation for their considerations at the May Meeting, the Board requested and received extensive materials prepared in connection with the review of the Advisory Agreements. The materials provided a broad range of information regarding the Funds, the Advisor and the Sub-Advisors (the Advisor and the Sub-Advisors are collectively, the “Fund Advisers” and each, a “Fund Adviser”). As described in more detail below, the information provided included, among other things, a review of Fund performance, including Fund investment performance assessments against peer groups and appropriate benchmarks, a comparison of Fund fees and expenses relative to peers, a description and assessment of shareholder service levels for the Funds, a summary of the performance of certain service providers, a review of product initiatives and shareholder communications and an analysis of the Advisor’s profitability with comparisons to comparable peers in the managed fund business. As part of their annual review, the Board also held a separate meeting on April 18-19, 2012, to review the Funds’ investment performance and consider an analysis provided by the Advisor of the Sub-Advisors which generally evaluated the Sub-Advisors’ investment teams, investment mandate, organizational structure and history, investment philosophy and process, performance of the applicable Fund, and significant changes to the foregoing. As a result of their review of the materials and discussions, the Board presented the Advisor with questions and the Advisor responded.
The materials and information prepared in connection with the annual review of the Advisory Agreements supplement the information and analysis provided to the Board during the year. In this regard, throughout the year, the Board, acting directly or through its committees, regularly reviews the performance and various services provided by the Advisor and the Sub-Advisors. The Board meets at least quarterly as well as at other times as the need arises. At its quarterly meetings, the Board reviews reports by the Advisor which include, among other things, Fund performance, a review of the investment teams and reports on compliance, regulatory matters and risk management. The Board also meets with key investment personnel managing the Fund portfolios during the year. In October 2011, the Board also created two new standing committees (the Open-end Fund Committee and the Closed-end Fund Committee) to assist the full Board in monitoring and gaining a deeper insight into the distinctive issues and business practices of open-end and closed-end funds.
In addition, the Board continues its program of seeking to have the Board Members or a subset thereof visit each sub-advisor to the Nuveen funds at least once over a multiple year rotation, meeting with key investment and business personnel. In this regard, the Independent Board Members made site visits to Tradewinds and NWQ in February 2011 during which Symphony also gave a presentation. Further, an ad hoc committee of the Board visited the then-current transfer agents of the Nuveen funds in 2011 and the audit committee of the Board visited the various pricing agents for the Nuveen funds in January 2012.
The Board considers factors and information that are relevant to its annual consideration of the renewal of the Advisory Agreements at the meetings held throughout the year. Accordingly, the Board considers the information provided and knowledge gained at these meetings when performing its annual review of the Advisory Agreements. The Independent Board Members are assisted throughout the process by independent legal counsel who provided materials describing applicable law and the duties of directors or trustees in reviewing advisory contracts and met with the Independent Board Members in executive sessions without management present. In addition, it is important to recognize that the management arrangements for the Nuveen funds are the result of many years of review and discussion between the Independent Board Members and fund management and that the Board Members’ conclusions may be based, in part, on their consideration of fee arrangements and other factors developed in previous years.
The Board considered all factors it believed relevant with respect to each Fund, including among other factors: (a) the nature, extent and quality of the services provided by the Fund Advisers, (b) the investment performance of the Fund and Fund Advisers, (c) the advisory fees and costs of the services to be provided to the Funds and the profitability of the Fund Advisers, (d) the extent of any economies of scale, (e) any benefits derived by the Fund Advisers from the relationship with the Fund and (f) other factors. Each Board Member may have accorded different weight to the various factors in reaching his or her conclusions with respect to a Fund’s Advisory Agreements. The Independent Board Members did not identify any single factor as all important or controlling. The Independent
Annual Investment Management Agreement Approval Process
(Unaudited) (continued)
Board Members’ considerations were instead based on a comprehensive consideration of all the information presented. The principal factors considered by the Board and its conclusions are described below.
A. Nature, Extent and Quality of Services
In considering renewal of the Advisory Agreements, the Independent Board Members considered the nature, extent and quality of the Fund Adviser’s services, including advisory services and the resulting Fund performance and administrative services. The Independent Board Members further considered the overall reputation and capabilities of the Advisor and its affiliates, the commitment of the Advisor to provide high quality service to the Funds, their overall confidence in the Advisor’s integrity and the Advisor’s responsiveness to questions and concerns raised by them. The Independent Board Members reviewed materials outlining, among other things, the Fund Adviser’s organization and business; the types of services that the Fund Adviser or its affiliates provide to the Funds; the performance record of the applicable Fund (as described in further detail below); and any initiatives Nuveen had taken for the applicable fund product line.
In considering advisory services, the Board recognized that the Advisor provides various oversight, administrative, compliance and other services for the Funds and the Sub-Advisors generally provide the portfolio investment management services to the applicable Funds. In reviewing the portfolio management services provided to each Fund, the Board reviewed the materials provided by the Nuveen Investment Services Oversight Team analyzing, among other things, each applicable Sub-Advisor’s investment team and changes thereto, organization and history, assets under management, Fund objectives and mandate, each investment team’s philosophy and strategies in managing the Fund, developments affecting the Sub-Advisor(s) or Fund and Fund performance (and, in addition, with respect to the Nuveen Multi-Manager Large-Cap Value Fund (the “Multi-Manager Fund”), the performance of the portion of such Fund’s portfolio allocated to the respective Sub-Advisors). The Independent Board Members also reviewed portfolio manager compensation arrangements to evaluate each Fund Adviser’s ability to attract and retain high quality investment personnel, preserve stability, and reward performance but not provide an inappropriate incentive to take undue risks. In addition, the Board considered the Advisor’s execution of its oversight responsibilities over the Sub-Advisors. Given the importance of compliance, the Independent Board Members also considered Nuveen’s compliance program, including the report of the chief compliance officer regarding the Funds’ compliance policies and procedures; the resources dedicated to compliance; and the record of compliance with the policies and procedures.
In addition to advisory services, the Board considered the quality and extent of administrative and other non-investment advisory services the Advisor and its affiliates provide to the Funds, including product management, investment services (such as oversight of investment policies and procedures, risk management, and pricing), fund administration, oversight of service providers, shareholder services and communications, administration of Board relations, regulatory and portfolio compliance and legal support. The Board further recognized Nuveen’s additional investments in personnel, including in compliance and risk management. In reviewing the services provided, the Board also reviewed materials describing various notable initiatives and projects the Advisor performed in connection with the open-end fund product line. These initiatives included efforts to eliminate product overlap through mergers or liquidations; commencement of various new funds; elimination of insurance mandates for various funds; updates in investment policies or guidelines for several funds; and reductions in management fees and expense caps for certain funds.
Based on their review, the Independent Board Members found that, overall, the nature, extent and quality of services provided to the respective Funds under each applicable Advisory Agreement were satisfactory.
B. The Investment Performance of the Funds and Fund Advisers
The Board, including the Independent Board Members, reviewed and considered the performance history of each Fund over various time periods. The Board reviewed, among other things, each Fund’s historic investment performance as well as information comparing the Fund’s performance information with that of other funds (the “Performance Peer Group”) based on data compiled by Nuveen that was provided by an independent provider of mutual fund data and with recognized and/or customized benchmarks (i.e., benchmarks derived from multiple recognized benchmarks).
The Board reviewed reports, including a comprehensive analysis of the Funds’ performance and the applicable investment team. In this regard, the Board reviewed each Fund’s total return information compared to the returns of its Performance Peer Group and recognized and/or customized benchmarks for the quarter, one-, three- and five-year periods ending December 31, 2011, as well as performance information reflecting the first quarter of 2012. With respect to the Multi-Manager Fund, the Independent Board Members also reviewed, among other things, the returns of each sleeve of such Fund relative to the benchmark of such sleeve for the quarter, one- and three-year periods ending December 2011 as well as performance information reflecting the first quarter of 2012.
In reviewing performance comparison information, the Independent Board Members recognized that the usefulness of the comparisons of the performance of certain funds with the performance of their respective Performance Peer Group may be limited because the Performance Peer Group may not adequately represent the objectives and strategies of the applicable funds or may be limited in size or number. The Independent Board Members also noted that the investment experience of a particular shareholder in the Nuveen funds will vary depending on when such shareholder invests in the applicable fund, the class held (if multiple classes are offered in a fund) and the performance of the fund (or respective class) during that shareholder’s investment period. In addition, although the performance below reflects the performance results for the time periods ending as of the most recent calendar year end (unless otherwise indicated), the Board also recognized that selecting a different ending time period may derive different results.
Furthermore, while the Board is cognizant of the relevant performance of a fund’s peer set and/or benchmark(s), the Board evaluated fund performance in light of the respective fund’s investment objectives, investment parameters and guidelines and recognized that the objectives, investment parameters and guidelines of peers and/or benchmarks may differ to some extent, thereby resulting in differences in performance results. Nevertheless, with respect to any Nuveen funds that the Board considers to have underperformed their peers and/or benchmarks from time to time, the Board monitors such funds closely and considers any steps necessary or appropriate to address such issues.
In considering the results of the comparisons, the Independent Board Members observed, among other things, that the Multi-Manager Fund had demonstrated generally favorable performance in comparison to peers, performing in the first or second quartile over various periods. The Nuveen NWQ Small/Mid-Cap Value Fund (the “Small/Mid-Cap Fund”), also demonstrated generally favorable performance, performing in the first quartile for the one- and three-year periods, although such Fund was in the third quartile for the five-year period. The Independent Board Members observed that the Nuveen NWQ Small-Cap Value Fund (the “Small-Cap Fund”) lagged its peers somewhat in the longer five-year period, but its performance had improved in the recent one-year period (noting that although such Fund was in the fourth quartile in the five-year period, it was in the first quartile in the one- and three-year periods). Further, they noted that the Nuveen Tradewinds Value Opportunities Fund (the “Value Opportunities Fund”) lagged its peers somewhat in the short-term one-year period, but demonstrated more favorable performance in the longer three- and/or five-year periods. Finally, with respect to the Nuveen NWQ Large-Cap Value Fund (the “Large-Cap Value Fund”) and the Nuveen NWQ Multi-Cap Value Fund, (the “Multi-Cap Value Fund”), the Independent Board Members noted that such Funds had lagged their peers and/or benchmarks over various periods (although the Multi-Cap Value Fund was in the second quartile for the three-year period and the first quartile for the first quarter of 2012). With respect to the Nuveen funds that have shown periods of underperformance, the Board considered the factors affecting performance and was satisfied with the process followed in seeking to address any performance issues in light of the fund’s investment strategy.
Based on their review, the Independent Board Members determined that each Fund’s investment performance had been satisfactory.
C. Fees, Expenses and Profitability
1. Fees and Expenses
The Board evaluated the management fees and expenses of each Fund reviewing, among other things, such Fund’s gross management fees, net management fees and net expense ratios in absolute terms as well as compared to the fee and expenses of a comparable universe of funds provided by an independent fund data provider (the “Peer Universe”) and to a more focused subset of funds in the Peer Universe (the “Peer Group”) and any expense limitations.
The Independent Board Members further reviewed the methodology regarding the construction of the applicable Peer Universe and Peer Group. In reviewing the comparisons of fee and expense information, the Independent Board Members took into account that in certain instances various factors such as: the limited size and particular composition of the Peer Universe or Peer Group (including the inclusion of other Nuveen funds in the peer set); expense anomalies; changes in the funds comprising the Peer Universe or Peer Group from year to year; levels of reimbursement or fee waivers; and the timing of information used may impact the comparative data, thereby limiting somewhat the ability to make a meaningful comparison with peers.
In reviewing the fee schedule for a Fund, the Independent Board Members also considered the fund-level and complex-wide breakpoint schedules (described in further detail below) and any fee waivers and reimbursements provided by Nuveen. In reviewing fees and expenses, the Board considered the expenses and fees to be higher if they were over 10 basis points higher, slightly higher if they were approximately 6 to 10 basis points higher, in line if they were within approximately 5 basis points higher than the peer average and below if they were below the peer average of the Peer Group. In reviewing the reports, the Board noted that the overwhelming majority of the Nuveen funds were at, close to or below their Peer Group or Peer Universe (if no separate Peer Group) average based on the net total expense ratio. The Independent Board Members noted that the Multi-Manager Fund and the Small-Cap Fund each had net management fees slightly higher or higher than the peer average but net expense ratios below or in line with the peer average. In addition, the Independent Board Members noted that the Multi-Cap Value Fund and the Value Opportunities Fund each had slightly higher net management fees than their peer average and a slightly higher or higher net expense ratio compared to their peer average, although they recognized the limits of the peer comparisons for the Multi-Cap Value Fund and noted that the management fee for the Value Opportunities Fund was reduced effective July 1, 2010. With respect to the Large-Cap Value Fund and the Small/Mid Cap Value Fund, the Independent Board Members observed that such Funds had net management fees and net expense ratios (including fee waivers and expense reimbursements, if any) below or in line with their peer averages.
Based on their review of the fee and expense information provided, the Independent Board Members determined that each Fund’s management fees were reasonable in light of the nature, extent and quality of services provided to the Fund.
2. Comparisons with the Fees of Other Clients
The Independent Board Members further reviewed information regarding the nature of services and range of fees offered by the Advisor to other clients, including separately managed accounts (both retail and institutional accounts), collective trusts, foreign investment funds offered by Nuveen and funds that are not offered by Nuveen but are sub-advised by one of Nuveen’s investment
Annual Investment Management Agreement Approval Process
(Unaudited) (continued)
management teams. In evaluating the comparisons of fees, the Independent Board Members noted that the fee rates charged to the Funds and other clients vary, among other things, because of the different services involved and the additional regulatory and compliance requirements associated with registered investment companies, such as the Funds. Accordingly, the Independent Board Members considered the differences in the product types, including, but not limited to, the services provided, the structure and operations, product distribution and costs thereof, portfolio investment policies, investor profiles, account sizes and regulatory requirements. The Independent Board Members noted, in particular, that the range of services provided to the Funds (as discussed above) is much more extensive than that provided to separately managed accounts. Given the inherent differences in the various products, particularly the extensive services provided to the Funds, the Independent Board Members believe such facts justify the different levels of fees.
In considering the fees of the Sub-Advisors, the Independent Board Members also considered the pricing schedule or fees that the Sub-Advisors charge for similar investment management services for other Nuveen funds (if any), funds of other sponsors (if any), and other clients (such as retail and/or institutional managed accounts), as applicable. With respect to Symphony, the Independent Board Members also reviewed the fees it assesses for equity and taxable fixed-income hedge funds it manages, which include a performance fee. The Independent Board Members noted that with respect to ICAP, the sub-advisory fees were the result of arm’s-length negotiations.
3. Profitability of Fund Advisers
In conjunction with its review of fees, the Independent Board Members also considered the profitability of Nuveen for its advisory activities and its financial condition. The Independent Board Members reviewed the revenues and expenses of Nuveen’s advisory activities for the last two calendar years, the allocation methodology used in preparing the profitability data and an analysis of the key drivers behind the changes in revenues and expenses that impacted profitability in 2011. The Independent Board Members noted this information supplemented the profitability information requested and received during the year to help keep them apprised of developments affecting profitability (such as changes in fee waivers and expense reimbursement commitments). In this regard, the Independent Board Members noted that they have an Independent Board Member serve as a point person to review and keep them apprised of changes to the profitability analysis and/or methodologies during the year. The Independent Board Members also considered Nuveen’s revenues for advisory activities, expenses, and profit margin compared to that of various unaffiliated management firms with comparable assets under management (based on asset size and asset composition).
In reviewing profitability, the Independent Board Members recognized the Advisor’s continued investment in its business to enhance its services, including capital improvements to investment technology, updated compliance systems, and additional personnel in compliance, risk management, and product development as well as its ability to allocate resources to various areas of the Advisor as the need arises. In addition, in evaluating profitability, the Independent Board Members also recognized the subjective nature of determining profitability which may be affected by numerous factors including the allocation of expenses. Further, the Independent Board Members recognized the difficulties in making comparisons as the profitability of other advisers generally is not publicly available and the profitability information that is available for certain advisers or management firms may not be representative of the industry and may be affected by, among other things, the adviser’s particular business mix, capital costs, types of funds managed and expense allocations. Notwithstanding the foregoing, the Independent Board Members reviewed Nuveen’s methodology and assumptions for allocating expenses across product lines to determine profitability. In reviewing profitability, the Independent Board Members recognized Nuveen’s investment in its fund business. Based on their review, the Independent Board Members concluded that the Advisor’s level of profitability for its advisory activities was reasonable in light of the services provided.
With respect to sub-advisers affiliated with Nuveen, including Symphony, NWQ, Tradewinds and Nuveen Asset Management, the Independent Board Members reviewed the sub-adviser’s revenues, expenses and profitability margins (pre- and post-tax) for its advisory activities and the methodology used for allocating expenses among the internal sub-advisers. Similarly, with respect to ICAP, the Independent Board Members also considered the Sub-Advisor’s revenues, expenses and profitability margins (pre- and post-tax) for its advisory activities with the Multi-Manager Fund. Based on their review, the Independent Board Members were satisfied that each Sub-Advisor’s level of profitability was reasonable in light of the services provided.
In evaluating the reasonableness of the compensation, the Independent Board Members also considered other amounts paid to a Fund Adviser by the Funds as well as any indirect benefits (such as soft dollar arrangements, if any) the Fund Adviser and its affiliates receive, or are expected to receive, that are directly attributable to the management of the Funds, if any. See Section E below for additional information on indirect benefits a Fund Adviser may receive as a result of its relationship with the Funds. Based on their review of the overall fee arrangements of each Fund, the Independent Board Members determined that the advisory fees and expenses of the respective Fund were reasonable.
D. Economies of Scale and Whether Fee Levels Reflect These Economies of Scale
With respect to economies of scale, the Independent Board Members have recognized the potential benefits resulting from the costs of a fund being spread over a larger asset base, although economies of scale are difficult to measure and predict with precision, particularly on a fund-by-fund basis. One method to help ensure the shareholders share in these benefits is to include breakpoints in the advisory fee schedule. Generally, management fees for funds in the Nuveen complex are comprised of a fund-level component
and a complex-level component, subject to certain exceptions. Accordingly, the Independent Board Members reviewed and considered the applicable fund-level breakpoints in the advisory fee schedules that reduce advisory fees as asset levels increase.
In addition to fund-level advisory fee breakpoints, the Board also considered the Funds’ complex-wide fee arrangement. Pursuant to the complex-wide fee arrangement, the fees of the funds in the Nuveen complex are generally reduced as the assets in the fund complex reach certain levels. The complex-wide fee arrangement seeks to provide the benefits of economies of scale to fund shareholders when total fund complex assets increase, even if assets of a particular fund are unchanged or have decreased. The approach reflects the notion that some of Nuveen’s costs are attributable to services provided to all its funds in the complex and therefore all funds benefit if these costs are spread over a larger asset base. In addition, with the acquisition of the funds previously advised by FAF Advisors, Inc., the Board noted that a portion of such funds’ assets at the time of acquisition were deemed eligible to be included in the complex-wide fee calculation in order to deliver fee savings to shareholders in the combined complex and such funds were subject to differing complex-level fee rates.
Based on their review, the Independent Board Members concluded that the breakpoint schedules and complex-wide fee arrangement were acceptable and reflect economies of scale to be shared with shareholders when assets under management increase.
E. Indirect Benefits
In evaluating fees, the Independent Board Members received and considered information regarding potential “fall out” or ancillary benefits the respective Fund Adviser or its affiliates may receive as a result of its relationship with each Fund. In this regard, the Independent Board Members considered, among other things, any sales charges, distribution fees and shareholder services fees received and retained by the Funds’ principal underwriter, an affiliate of the Advisor, which includes fees received pursuant to any 12b-1 plan. The Independent Board Members, therefore, considered the 12b-1 fees retained by Nuveen during the last calendar year.
In addition to the above, the Independent Board Members considered whether the Fund Advisers received any benefits from soft dollar arrangements whereby a portion of the commissions paid by a Fund for brokerage may be used to acquire research that may be useful to the Fund Adviser in managing the assets of the Funds and other clients. The Independent Board Members recognized that the Advisor and Nuveen Asset Management have the authority to pay a higher commission in return for brokerage and research services if they determine in good faith that the commission paid is reasonable in relation to the value of the brokerage and research services provided and may benefit from such soft dollar arrangements. In addition, the Independent Board Members considered that ICAP, NWQ and Tradewinds may benefit from their soft dollar arrangements pursuant to which they receive research from brokers that execute the applicable Funds’ portfolio transactions. Similarly, the Board recognized that the research received pursuant to soft dollar arrangements by the foregoing Fund Advisers may also benefit a Fund and shareholders to the extent the research enhances the ability of the Fund Adviser to manage the Fund. The Independent Board Members noted that these Fund Advisers’ profitability may be somewhat lower if they did not receive the research services pursuant to the soft dollar arrangements and had to acquire such services directly. The Board considered that Symphony currently does not enter into soft dollar arrangements; however, it has adopted a soft dollar policy in the event it does so in the future.
Based on their review, the Independent Board Members concluded that any indirect benefits received by a Fund Adviser as a result of its relationship with the Funds were reasonable and within acceptable parameters.
F. Other Considerations
The Independent Board Members did not identify any single factor discussed previously as all-important or controlling. The Board Members, including the Independent Board Members, unanimously concluded that the terms of each Advisory Agreement are fair and reasonable, that the respective Fund Adviser’s fees are reasonable in light of the services provided to each Fund and that the Advisory Agreements be renewed.
Notes
Notes
Glossary of Terms Used in this Report
Average Annual Total Return: This is a commonly used method to express an investment’s performance over a particular, usually multi-year time period. It expresses the return that would have been necessary each year to equal the investment’s actual cumulative performance (including change in NAV or offer price and reinvested dividends and capital gains distributions, if any) over the time period being considered.
Lipper Global Multi-Cap Core Funds Classification Average: Represents the average annualized total return for all reporting funds in the Lipper Global Multi-Cap Core Classification. Lipper returns account for the effects of management fees and assume reinvestment of distributions, but do not reflect any applicable sales charge.
Lipper Large-Cap Value Funds Classification Average: Represents the average annualized total return for all reporting funds in the Lipper Large-Cap Value Funds Classification. The Lipper returns account for the effects of management fees and assume reinvestment of distributions, but do not reflect any applicable sales charge.
Lipper Multi-Cap Core Funds Classification Average: Represents the average annualized total return for all reporting funds in the Lipper Multi-Cap Core Funds Classification. The Lipper returns account for the effects of management fees and assume reinvestment of distributions, but do not reflect any applicable sales charge.
Lipper Small-Cap Core Funds Classification Average: Represents the average annualized total return for all reporting funds in the Lipper Small-Cap Core Funds Classification. The Lipper returns account for the effects of management fees and assume reinvestment of distributions, but do not reflect any applicable sales charge.
Net Asset Value (NAV): The net market value of all securities held in a portfolio.
Net Asset Value (NAV) Per Share: The market value of one share of a mutual fund or closed-end fund. For a Fund, the NAV is calculated daily by taking the Fund’s total assets (securities, cash, and accrued earnings), subtracting the Fund’s liabilities, and dividing by the number of shares outstanding.
Russell 1000® Value Index: An index that measures the performance of those Russell 1000 companies with lower price-to-book ratios and lower forecasted growth values. Index returns assume reinvestment of distributions, but do not include the effects of any applicable sales charges or management fees.
Russell 2000® Value Index: An index that measures the performance of those Russell 2000 companies with lower price-to-book ratios and lower forecasted growth values. Index returns assume reinvestment of distributions, but do not include the effects of any applicable sales charges or management fees.
Russell 2500® Index: An index that measures the performance of the 2,500 smallest companies in the Russell 3000 Index, which represents approximately 20% of the total market capitalization of the Russell 3000 Index. Index returns assume reinvestment of dividends, but do not include the effects of any applicable sales charges or management fees.
Russell 3000® Value Index: An index that measures the performance of those Russell 3000 companies with lower price-to-book ratios and higher forecasted growth values. Index returns assume reinvestment of distributions, but do not include the effects of any applicable sales charges or management fees.
S&P 500® Index: An unmanaged index generally considered representative of the U.S. stock market. Index returns assume reinvestment of distributions, but do not include the effects of any applicable sales charges or management fees.
Tax Equalization: The practice of treating a portion of the distribution made to a redeeming shareholder, which represents his proportionate part of undistributed net investment income and capital gain as a distribution for tax purposes. Such amounts are referred to as the equalization debits (or payments) and will be considered a distribution to the shareholder of net investment income and capital gain for calculation of the Fund’s dividends paid deduction.
Additional Fund Information
Fund Manager
Nuveen Fund Advisors, Inc.
333 West Wacker Drive
Chicago, IL 60606
Sub-Advisers
Institutional Capital LLC
225 West Wacker Drive
Chicago, IL 60606
Nuveen Asset Management, LLC
333 West Wacker Drive,
Chicago, IL 60603
NWQ Investment Management Company, LLC
2049 Century Park East, 16th Floor
Los Angeles, CA 90067
Symphony Asset Management LLC
555 California Street
Rene Suite 2975
San Francisco, CA 94104
Tradewinds Global Investors, LLC
2049 Century Park East, 20th Floor
Los Angeles, CA 90067
Legal Counsel
Chapman and Cutler LLP
Chicago, IL
Independent Registered Public Accounting Firm
PricewaterhouseCoopers LLP
Chicago, IL
Custodian
State Street Bank & Trust Company
Boston, MA
Transfer Agent and Shareholder Services
Boston Financial
Data Services
Nuveen Investor Services
P.O. Box 8530
Boston, MA 02266-8530
(800) 257-8787
Distribution Information: The following Funds hereby designate their percentages of dividends paid from net ordinary income as dividends qualifying for the 70% dividends received deduction (“DRD”) for corporations and their percentages as qualified dividend income (“QDI”) for individuals under Section 1 (h)(11) of the Internal Revenue Code as shown in the accompanying table. The actual qualified dividend income distributions will be reported to shareholders on Form 1099-DIV which will be sent to shareholders shortly after calendar year end.
| | | | | | | | |
| Fund | | % of DRD | | | % of QDI | |
Nuveen Multi-Manager Large-Cap Value Fund | | | 100 | % | | | 100 | % |
Nuveen NWQ Large-Cap Value Fund | | | 100 | % | | | 100 | % |
Nuveen Tradewinds Value Opportunities Fund | | | 23.07 | % | | | 29.96 | % |
Quarterly Portfolio of Investments and Proxy Voting Information: You may obtain (i) each Fund’s quarterly portfolio of investments, (ii) information regarding how the Funds voted proxies relating to portfolio securities held during the most recent twelve-month period ended June 30, and (iii) a description of the policies and procedures that the Funds used to determine how to vote proxies relating to portfolio securities without charge, upon request, by calling Nuveen Investments at (800) 257-8787 or on Nuveen’s website at www.nuveen.com.
You may also obtain this and other Fund information directly from the Securities and Exchange Commission (SEC). The SEC may charge a copying fee for this information. Visit the SEC on-line at http://www.sec.gov or in person at the SEC’s Public Reference Room in Washington, D.C. Call the SEC at (202) 942-8090 for room hours and operation. You may also request Fund information by sending an e-mail request to publicinfo@sec.gov or by writing to the SEC’s Public Reference Section at 100 F Street NE, Washington, D.C. 20549.
The Financial Industry Regulatory Authority (FINRA) provides a Public Disclosure Program which supplies certain information regarding the disciplinary history of FINRA members and their associated persons in response to either telephone inquiries at (800) 289-9999 or written inquiries at www.finra.org. FINRA also provides an investor brochure that includes information describing the Public Disclosure Program.
Nuveen Investments:
Serving Investors for Generations
Since 1898, financial advisors and their clients have relied on Nuveen Investments to provide dependable investment solutions through continued adherence to proven, long-term investing principles. Today, we offer a range of high quality equity and fixed-income solutions designed to be integral components of a well-diversified core portfolio.
Focused on meeting investor needs.
Nuveen Investments provides high-quality investment services designed to help secure the long-term goals of institutional and individual investors as well as the consultants and financial advisors who serve them. Nuveen Investments markets a wide range of specialized investment solutions which provide investors access to capabilities of its high-quality boutique investment affiliates-Nuveen Asset Management, Symphony Asset Management, NWQ Investment Management Company, Santa Barbara Asset Management, Tradewinds Global Investors, Winslow Capital Management, and Gresham Investment Management. In total, Nuveen Investments managed $212 billion as of June 30, 2012.
Find out how we can help you.
To learn more about how the products and services of Nuveen Investments may be able to help you meet your financial goals, talk to your financial advisor, or call us at (800) 257-8787. Please read the information provided carefully before you invest. Investors should consider the investment objective and policies, risk considerations, charges and expenses of any investment carefully. Where applicable, be sure to obtain a prospectus, which contains this and other relevant information. To obtain a prospectus, please contact your securities representative or Nuveen Investments, 333 W. Wacker Dr., Chicago, IL 60606. Please read the prospectus carefully before you invest or send money.
Learn more about Nuveen Funds at: www.nuveen.com/mf
| | |
Distributed by Nuveen Securities, LLC 333 West Wacker Drive Chicago, IL 60606 www.nuveen.com | | |
MAN-NWQ-0612D

Mutual Funds
Nuveen Income Funds
For investors seeking attractive monthly income and portfolio diversification potential.
Annual Report
June 30, 2012
| | | | | | | | |
| | | Share Class / Ticker Symbol |
| | | | |
| Fund Name | | Class A | | Class C | | Class R3 | | Class I |
Nuveen Global Total Return Bond Fund | | NGTAX | | NGTCX | | NGTRX | | NGTIX |
LIFE IS COMPLEX.
Nuveen makes things e-simple.
It only takes a minute to sign up for e-Reports. Once enrolled, you’ll receive an e-mail as soon as your Nuveen Fund information is ready. No more waiting for delivery by regular mail. Just click on the link within the e-mail to see the report and save it on your computer if you wish.
Free e-Reports right to your e-mail!
www.investordelivery.com
If you receive your Nuveen Fund distributions and statements from your financial advisor or brokerage account.
OR
www.nuveen.com/accountaccess
If you receive your Nuveen Fund distributions and statements directly from Nuveen.
| | | | | | |
| Must be preceded by or accompanied by a prospectus. | | NOT FDIC INSURED | | MAY LOSE VALUE | | NO BANK GUARANTEE |
Table of Contents
Chairman’s
Letter to Shareholders

Dear Shareholders,
Investors have many reasons to remain cautious. The challenges in the Euro area are casting a shadow over global economies and financial markets. The political support for addressing fiscal issues is eroding as the economic and social impacts become more visible. At the same time, member nations appear unwilling to provide adequate financial support or to surrender sufficient sovereignty to strengthen the banks or unify the Euro area financial system. The gains made in reducing deficits, and the hard-won progress on winning popular acceptance of the need for economic austerity, are at risk. To their credit, European political leaders press on to find compromise solutions, but there is increasing concern that time will begin to run out.
In the U.S., strong corporate earnings have enabled the equity markets to withstand much of the downward pressures coming from weakening job creation, slower economic growth and political uncertainty. The Fed remains committed to low interest rates but has refrained from predicting another program of quantitative easing unless economic growth were to weaken significantly or the threat of recession appears on the horizon. Pre-election maneuvering has added to the already highly partisan atmosphere in the Congress. The end of the Bush-era tax cuts and implementation of the spending restrictions of the Budget Control Act of 2011, both scheduled to take place at year-end, loom closer.
During the last year, U.S. based investors have experienced a sharp decline and a strong recovery in the equity markets. The experienced investment teams at Nuveen keep their eye on a longer time horizon and use their practiced investment disciplines to negotiate through market peaks and valleys to achieve long-term goals for investors. Experienced professionals pursue investments that will weather short-term volatility and at the same time, seek opportunities that are created by markets that overreact to negative developments. Monitoring this process is an important consideration for the Fund Board as it oversees your Nuveen Fund on your behalf.
As always, I encourage you to contact your financial consultant if you have any questions about your investment in a Nuveen Fund. On behalf of the other members of your Fund Board, we look forward to continuing to earn your trust in the months and years ahead.
Sincerely,

Robert P. Bremner
Chairman of the Board
August 23, 2012
Portfolio Managers’ Comments
Certain statements in this report are forward-looking statements. Discussions of specific investments are for illustration only and are not intended as recommendations of individual investments. The forward-looking statements and other views expressed herein are those of the portfolio managers as of the date of this report. Actual future results or occurrences may differ significantly from those anticipated in any forward-looking statements and the views expressed herein are subject to change at any time, due to numerous market and other factors. The Fund disclaims any obligation to update publicly or revise any forward-looking statements or views expressed herein.
Ratings shown are the highest rating given by one of the following national rating agencies: Standard & Poor’s Group, Moody’s Investors Service, Inc. or Fitch, Inc. Credit ratings are subject to change. AAA, AA, A and BBB are investment grade ratings; BB, B, CCC, CC, C and D are below-investment grade ratings. Certain bonds backed by U.S. Government or agency securities are regarded as having an implied rating equal to the rating of such securities. Holdings designated N/R are not rated by a national rating agency.
The Fund features portfolio management by Nuveen Asset Management, LLC, an affiliate of Nuveen Investments. Timothy Palmer, CFA, with 26 years of investment experience and Steven Lee, CFA, who has 17 years of investment experience, have managed the Fund since its inception on December 2, 2011. Here they examine economic and fixed income market conditions, key investment strategies and the Fund’s performance during the period December 2, 2011 through June 30, 2012.
What factors affected the economic and fixed income market environments during the reporting period ended June 30, 2012?
During the period, the U.S. economy’s progress toward recovery from recession remained sluggish. The Federal Reserve (Fed) maintained its efforts to improve the overall economic environment by continuing to hold the benchmark Fed Funds rate at the record low level of zero to 0.25% that it had established in December 2008. At its June 2012 meeting, the central bank affirmed its opinion that economic conditions would likely warrant keeping the rate at “exceptionally low levels” through at least late 2014. The Fed also announced that it would extend its so-called Operation Twist program, whereby it is lengthening the average maturity of its holdings of U.S. Treasury securities, through the end of December 2012. The goals of this program are to lower longer-term interest rates, make broader financial conditions more accommodating, support a stronger economic recovery and help ensure that inflation remains at levels consistent with the Fed’s mandates of maximum employment and price stability.
In the second quarter of 2012, the U.S. economy slowed to an annualized growth rate of 1.5%, according to initial estimates for U.S. gross domestic product (GDP). While this marked the twelfth consecutive quarter of positive growth, it was also a significant slowdown from the previous few quarters. The Consumer Price Index (CPI) rose 1.7% year-over-year as of June 2012, the same figure as May 2012, which was the lowest twelve-month rate of change since February 2011. Core CPI (which excludes food and energy) increased 2.2% during the period, remaining above the Fed’s unofficial objective of 2.0% or lower for this inflation measure. However, the number was slightly below the 2.3% figure reported in the previous three months. Labor market conditions continued to be slow to improve, with the national unemployment rate registering 8.2% in June 2012. While this figure was down from 9.1% one year ago, it was still a slight uptick from the 8.1% reading in April 2012. The housing market remained the major weak spot in the economy, beleaguered by a high level of distressed properties and difficult credit conditions. For the twelve months ended May 2012 (the most recent data available at the time this report was prepared), the average home price in the Standard & Poor’s (S&P)/Case-Shiller Index of 20 major metropolitan areas lost 0.7%. Housing prices remained at the lowest levels since spring 2003, down more than one-third from their summer 2006 peak.
Throughout the fiscal period, fixed income markets were buffeted by concerns about the tepid U.S. economic recovery combined with the ballooning U.S. federal deficit, the seemingly unending European debt crisis and a broader slowdown in global growth, especially emerging markets. These macro events caused the financial markets to fluctuate between embracing risk and shunning risk. Risk premiums on non-government bonds widened as U.S. Treasuries renewed their safe haven status, outperforming other riskier asset classes. When all was said and done, longer maturity Treasuries and Treasury Inflation-Protected Securities (TIPS) ended the period as the top performing asset classes in the taxable fixed income market. While short-term Treasury rates remained at historically low levels throughout the fiscal year, dipping even lower midway through the period, intermediate and longer term Treasuries saw their rates fall fairly steadily throughout the period. For example, yields on five-year Treasuries dropped from 1.80% at the beginning of July 2011 to 0.72% as of June 30, 2012, while 30-year Treasuries started at 4.40% and ended at 2.69%. The prices of these securities move in the opposite direction of interest rates. Meanwhile, investment-grade corporate bonds also turned in relatively strong results over the period, outperforming other non-government bonds such as high-yield corporate bonds, CMBS, MBS and asset-backed securities, with a 9.54% return as measured by Barclays Corporate Investment Grade Index.
How did the Fund perform during the period ended June 30, 2012?
The table in the Fund Performance and Expense Ratios section of this report provides total return performance information for the since inception period ending June 30, 2012. The Fund’s Class A Share total returns are compared with the performance of the appropriate Barclays Index and Lipper classification average. The Fund’s Class A Shares at net asset value (NAV) outperformed the Barclays Global Aggregate Unhedged Bond Index and the Lipper Global Income Funds Classification Average over the period from the Fund’s inception on December 2, 2011, through June 30, 2012. The Fund was launched and became fully invested midway through the fiscal period.
What strategies were used to manage the Fund during the reporting period? How did these strategies influence performance?
Based on our outlook for continued moderate global growth and improving financial conditions, we positioned the Fund at its start-up with significant overweights to non-government sectors, while our country and currency selection favored higher growth markets. This positioning included an overweight to investment-grade credit, with an emphasis on U.S. financials and globally based, cyclically sensitive corporate bonds. We also invested a portion of the Fund’s assets in the high yield sector, increasingly emphasizing bottom-up company specific investment ideas. At the same time, we underweighted government securities from large markets such as the United States, Japan and peripheral Europe. Instead, we favored higher real interest rate markets and non-government sectors broadly. We also emphasized growth sensitive, developed and emerging market (EM) currencies, including the Mexican peso, Australian dollar, Canadian dollar, Brazilian real and Polish zloty, with corresponding underweights to the Japanese yen, European euro and the U.S. dollar.
All of these allocations benefited the Fund’s performance during the abbreviated reporting period. The combination of a steady economy, a reduction of European financial risk and ongoing easy monetary policy proved to be an optimal environment for risk assets, despite a “flight-to-quality” market late in the period driven by renewed fears about the stability of Europe. In particular, the Fund’s overweights in growth-sensitive, developed and EM currencies, including Mexico, Australia, Canada and India, and underweights to the Japanese yen and U.S. dollar were significant sources of outperformance for the overall period, but detracted from returns later on as the markets experienced a “risk-off” shock. The Fund benefited from an overweight to the financial sector within corporate bonds, while economically sensitive credits underperformed. Country selection with regard to interest rate positioning was also a source of positive return for the Fund.
Although we kept most of the Fund’s primary investment themes intact during the period, we did make smaller scaled shifts that were geared toward improving its profile in response to changing economic developments and valuations. For example, we reduced the Fund’s U.S. dollar exposure while adding to or establishing new positions in currencies meeting our fundamental investment criteria late in the period. These currencies had substantially cheapened during the risk aversion and growth scare prevailing in the latter part of the period. We maintained our main strategic sector emphasis that favors credit sectors, finding significant opportunities in investment-grade and high yield credits from both emerging and developed markets. We selectively reduced the Fund’s positions in European credits, given the increasing economic and financing strains. We also reduced the Fund’s mortgage-backed securities weight in favor of what we believed to be better opportunities elsewhere. We added interest rate exposure in high quality, non-European markets such as Canada, the United Kingdom and Japan. At the same time, we moved out of Australia following interest rate cuts and reduced exposure to core eurozone bonds given poor valuations and uncertain fundamentals.
Risk Considerations
Mutual fund investing involves risk; principal loss is possible. Debt securities such as those held by the Fund, are subject to market risk, credit risk, interest rate risk, call risk, and income risk. As interest rates rise, bond prices fall. Below investment grade or high yield debt securities are subject to liquidity risk and heightened credit risk. Non U.S. or foreign investments involve additional risks, including currency fluctuation, political or economic instability, and differing legal or tax standards. These risks are magnified in emerging markets. Asset-backed and mortgage-backed securities are also subject to prepayment risk, liquidity risk, default risk and adverse economic developments. The Fund’s potential use of derivative instruments involves a high degree of financial risk and additional transaction costs.
The Fund is presently exempt from regulation by the Commodity Futures Trading Commission (“CFTC”). However, the CFTC has recently adopted amendments to its rules, which, upon their compliance dates, may subject the Fund to regulation by the CFTC and impose on it additional disclosure, reporting and recordkeeping obligations.
Compliance with these additional obligations may increase Fund expenses. Certain of the rules that would apply to the Fund if it becomes subject to CFTC regulation have not yet been adopted, and it is unclear what effect such rules would have on the Fund if they are adopted.
Investments in Derivatives
The Fund invested in futures contracts. We used long and short U.S. Treasury note and bond futures to manage portfolio duration and yield curve exposure. For example, to increase the duration of the Fund’s portfolio, a long U.S. Treasury bond or Treasury note futures position would be acquired. The Fund also entered into foreign interest rate futures to manage foreign interest rate exposures.
The Fund entered into credit default swap contacts to express a view on credit as part of an overall portfolio sector management strategy. For example, to increase the Fund’s credit exposure to the High Yield Bond segment of the market, a long CDX High Yield Index swap would be acquired.
The Fund utilized forward foreign currency exchange contracts to manage foreign currency exposure. For example, to reduce unwanted currency exposure from the Fund’s portfolio, a short foreign currency forward would be acquired.
The Fund purchased futures options on U.S. Treasury notes as part of an overall portfolio interest rate strategy. For example, call options may be purchased to hedge the portfolio against adverse interest rate movements while limiting downside exposure to the portfolio. The Fund also purchased short term call options on the Brazilian real, sold higher strike calls on the same currency, and reduced the foreign currency exchange contracts to rebalance the Fund’s net currency exposure to the Brazilian real. These option transactions would have benefited from a moderate appreciate in this currency. The options expired prior to the close of the reporting period.
Fund Performance and Expense Ratios
The Fund Performance and Expense Ratios for the Fund are shown on the following two pages.
Returns quoted represent past performance, which is no guarantee of future results. Current performance may be higher or lower than the performance shown. Investment returns and principal value will fluctuate so that when shares are redeemed, they may be worth more or less than their original cost. Returns without sales charges would be lower if the sales charge were included. Returns do not reflect the deduction of taxes that a shareholder would pay on Fund distributions or the redemption of Fund shares.
Returns may reflect a contractual agreement between the Fund and the investment adviser to waive certain fees and expenses; see Notes to Financial Statements, Footnote 7 — Management Fees and Other Transactions with Affiliates for more information. In addition, returns may reflect a voluntary expense limitation by the Fund’s investment adviser that may be modified or discontinued at any time without notice. For the most recent month-end performance visit www.nuveen.com or call (800) 257-8787.
Returns reflect differences in sales charges and expenses, which are primarily differences in distribution and service fees. Fund returns assume reinvestment of dividends and capital gains.
Comparative index and Lipper return information is provided for the Fund’s Class A Shares at net asset value (NAV) only.
The expense ratios shown reflect the Fund’s total operating expenses (before fee waivers or expense reimbursements, if any) as shown in the Fund’s most recent prospectus. The expense ratios include management fees and other fees and expenses.
Fund Performance and Expense Ratios (continued)
Nuveen Global Total Return Bond Fund
Refer to the first page of this Fund Performance and Expense Ratios section for further explanation of the information included within this page.
Fund Performance
Cumulative Total Returns as of June 30, 2012
| | | | |
| |
| | | Cumulative | |
| |
| | | Since Inception* | |
Class A Shares at NAV | | | 7.42% | |
Class A Shares at maximum Offering Price | | | 2.31% | |
Barclays Global Aggregate Unhedged Bond Index** | | | 1.98% | |
Lipper Global Income Funds Classification Average** | | | 3.81% | |
| |
Class C Shares | | | 7.10% | |
Class R3 Shares | | | 7.38% | |
Class I Shares | | | 7.71% | |
Class A Shares have a maximum 4.75% sales charge (Offering Price). Class A Share purchases of $1 million or more are sold at net asset value without an up-front sales charge but may be subject to a contingent deferred sales charge (CDSC), also known as a back-end sales charge, if redeemed within eighteen months of purchase. Class C Shares have a 1% CDSC for redemptions within less than twelve months, which is not reflected in the one-year total return. Class R3 Shares have no sales charge and are available to only certain retirement plans. Class I Shares have no sales charge and may be purchased under limited circumstances or by specified classes of investors.
Expense Ratios as of Most Recent Prospectus
| | | | | | | | |
| | |
| | | Gross Expense Ratios | | | Net Expense Ratios | |
Class A Shares | | | 1.18% | | | | 1.00% | |
Class C Shares | | | 1.93% | | | | 1.75% | |
Class R3 Shares | | | 1.43% | | | | 1.25% | |
Class I Shares | | | 0.93% | | | | 0.75% | |
The Fund’s investment adviser has agreed to waive fees and/or reimburse expenses through October 31, 2014, so that total annual Fund operating expenses (excluding 12b-1 distribution and/or service fees, interest expenses, taxes, fees incurred in acquiring and disposing of portfolio securities, and extraordinary expenses) do not exceed 0.75% of the average daily net assets of any class of Fund shares. The expense limitation expiring October 31, 2014, may be terminated or modified prior to that date only with the approval of the Board of Trustees of the Fund.
| * | Since inception returns are from 12/02/11. |
| ** | Refer to the Glossary of Terms Used in this Report for definitions. Indexes and Lipper averages are not available for direct investment. |
Growth of an Assumed $10,000 Investment as of June 30, 2012 — Class A Shares

The graph does not reflect the deduction of taxes, that a shareholder may pay on Fund distributions or the redemption of Fund shares.
Yields as of June 30, 2012
Dividend Yield is the most recent dividend per share (annualized) divided by the offering price per share.
The SEC 30-Day Yield is a standardized measure of a Fund’s yield that accounts for the future amortization of premiums or discounts of bonds held in the Fund’s portfolio. The SEC 30-Day Yield is computed under an SEC standardized formula and is based on the maximum offer price per share. Dividend Yield may differ from the SEC 30-Day Yield because the Fund may be paying out more or less than it is earning and it may not include the effect of amortization of bond premium.
| | | | | | | | |
| | |
| | | Dividend
Yield | | | SEC 30-Day
Yield | |
Class A Shares1 | | | 4.10% | | | | 3.03% | |
Class C Shares | | | 3.54% | | | | 2.45% | |
Class R3 Shares | | | 4.05% | �� | | | 2.93% | |
Class I Shares | | | 4.56% | | | | 3.42% | |
| 1 | The SEC Yield for Class A Shares quoted in the table reflects the maximum sales load. Investors paying a reduced load because of volume discounts, investors paying no load because they qualify for one of the several exclusions from the load, and existing shareholders who previously paid a load but would like to know the SEC Yield applicable to their shares on a going-forward basis, should understand that the SEC Yield effectively applicable to them would be higher than the figure quoted in the table. |
Holding Summaries as of June 30, 2012
This data relates to the securities held in the Fund’s portfolio of investments. It should not be construed as a measure of performance for the Fund itself.
Ratings shown are the highest rating given by one of the following national rating agencies: Standard & Poor’s Group, Moody’s Investors Service, Inc. or Fitch, Inc. Credit ratings are subject to change. AAA, AA, A and BBB are investment grade ratings; BB, B, CCC, CC, C and D are below investment grade ratings. Certain bonds backed by U.S. Government or agency securities are regarded as having an implied rating equal to the rating of such securities. Holdings designated N/R are not rated by a national rating agency.
Portfolio Credit Quality1
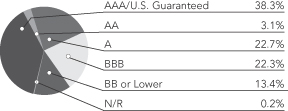
| | | | |
| Portfolio Allocation2 | | | |
| Corporate Bonds | | | 38.2% | |
| Sovereign Debt | | | 47.5% | |
| Asset-Backed and Mortgage-Backed Securities | | | 6.1% | |
| $25 Par (or similar) Preferred Securities | | | 1.3% | |
| Capital Preferred Securities | | | 0.3% | |
| U.S. Government and Agency Obligations | | | 0.1% | |
| Short-Term Investments | | | 6.5% | |
| | | | |
| Country Allocation2 | |
| United States | | | 31.9% | |
| United Kingdom | | | 12.7% | |
| Mexico | | | 5.9% | |
| Brazil | | | 5.5% | |
| Canada | | | 4.7% | |
| Turkey | | | 3.8% | |
| Netherlands | | | 3.1% | |
| France | | | 2.9% | |
| Norway | | | 2.9% | |
| Sweden | | | 2.8% | |
| New Zealand | | | 2.5% | |
| South Africa | | | 2.4% | |
| Other | | | 18.9% | |
| | | | |
| Corporate Debt: Industries3 | | | |
| Metals & Mining | | | 12.0% | |
| Diversified Financial Services | | | 11.2% | |
| Oil, Gas & Consumable Fuels | | | 10.5% | |
| Capital Markets | | | 8.0% | |
| Food Products | | | 5.6% | |
| Diversified Telecommunication Services | | | 5.1% | |
| Media | | | 4.4% | |
| Consumer Finance | | | 4.0% | |
| Biotechnology | | | 3.7% | |
| Chemicals | | | 3.4% | |
| Construction & Engineering | | | 3.2% | |
| Commercial Banks | | | 3.1% | |
| Insurance | | | 2.5% | |
| Wireless Telecommunication Services | | | 2.2% | |
| Containers & Packaging | | | 2.0% | |
| Other | | | 19.1% | |
| 1 | As a percentage of total investments (excluding short-term investments and investments in derivatives) as of June 30, 2012. Holdings are subject to change. |
| 2 | As a percentage of total investments (excluding investments in derivatives) as of June 30, 2012. Holdings are subject to change. |
| 3 | As a percentage of total corporate debt holdings as of June 30, 2012. Corporate debt holdings include corporate bonds (high-yield investment grade rated), convertible bonds, and any other debt instruments issued by a corporation (or that references a corporation) held by the Fund at the end of the reporting period. Holdings are subject to change. |
Expense Examples
As a shareholder of the Fund, you incur two types of costs: (1) transaction costs, including up-front and back-end sales charges (loads) or redemption fees, where applicable; and (2) ongoing costs, including management fees; distribution and service (12b-1) fees, where applicable; and other Fund expenses. This Example is intended to help you understand your ongoing costs (in dollars) of investing in the Fund and to compare these costs with the ongoing costs of investing in other mutual funds.
The Example below is based on an investment of $1,000 invested at the beginning of the period and held for the period.
The information under “Actual Performance,” together with the amount you invested, allows you to estimate actual expenses incurred over the reporting period. Simply divide your account value by $1,000 (for example, an $8,600 account value divided by $1,000 = 8.60) and multiply the result by the cost shown for your share class, in the row entitled “Expenses Incurred During Period” to estimate the expenses incurred on your account during this period.
The information under “Hypothetical Performance,” provides information about hypothetical account values and hypothetical expenses based on the Fund’s actual expense ratio and an assumed rate of return of 5% per year before expenses, which is not the Fund’s actual return. The hypothetical account values and expenses may not be used to estimate the actual ending account balance or expense you incurred for the period. You may use this information to compare the ongoing costs of investing in the Fund and other funds. To do so, compare this 5% hypothetical example with the 5% hypothetical examples that appear in the shareholder reports of the other funds.
Please note that the expenses shown in the table are meant to highlight your ongoing costs only and do not reflect any transaction costs. Therefore, the hypothetical information is useful in comparing ongoing costs only, and will not help you determine the relative total costs of owning different funds or share classes. In addition, if these transaction costs were included, your costs would have been higher.
| | | | | | | | | | | | | | | | | | | | | | | | | | | | | | | | | | |
| | | Actual Performance | | | | | Hypothetical Performance
(5% annualized return before expenses) | |
| | | A Shares | | | C Shares | | | R3 Shares | | | I Shares | | | | | A Shares | | | C Shares | | | R3 Shares | | | I Shares | |
| Beginning Account Value (1/01/12) | | $ | 1,000.00 | | | $ | 1,000.00 | | | $ | 1,000.00 | | | $ | 1,000.00 | | | | | $ | 1,000.00 | | | $ | 1,000.00 | | | $ | 1,000.00 | | | $ | 1,000.00 | |
| Ending Account Value (6/30/12) | | $ | 1,078.00 | | | $ | 1,075.30 | | | $ | 1,078.10 | | | $ | 1,080.90 | | | | | $ | 1,020.14 | | | $ | 1,016.21 | | | $ | 1,018.70 | | | $ | 1,021.23 | |
| Expenses Incurred During Period | | $ | 4.91 | | | $ | 8.98 | | | $ | 6.41 | | | $ | 3.78 | | | | | $ | 4.77 | | | $ | 8.72 | | | $ | 6.22 | | | $ | 3.67 | |
For each class of the Fund, expenses are equal to the Fund’s annualized net expense ratio of .95%, 1.74%, 1.24% and .73% for Classes A, C, R3, and I, respectively, multiplied by the average account value over the period, multiplied by 182/366 (to reflect the one-half year period).
Report of Independent Registered Public Accounting Firm
To the Board of Trustees and Shareholders of
Nuveen Investment Trust:
In our opinion, the accompanying statement of assets and liabilities, including the portfolio of investments, and the related statement of operations, of changes in net assets, and the financial highlights present fairly, in all material respects, the financial position of Nuveen Global Total Return Bond Fund (a series of the Nuveen Investment Trust, hereinafter referred to as the “Fund”) at June 30, 2012, the results of its operations, the changes in its net assets and the financial highlights for the period December 2, 2011 (commencement of operations) through June 30, 2012 in conformity with accounting principles generally accepted in the United States of America. These financial statements and financial highlights (hereafter referred to as “financial statements”) are the responsibility of the Fund’s management; our responsibility is to express an opinion on these financial statements based on our audit. We conducted our audit of these financial statements in accordance with the standards of the Public Company Accounting Oversight Board (United States). Those standards require that we plan and perform the audit to obtain reasonable assurance about whether the financial statements are free of material misstatement. An audit includes examining, on a test basis, evidence supporting the amounts and disclosures in the financial statements, assessing the accounting principles used and significant estimates made by management, and evaluating the overall financial statement presentation. We believe that our audit, which included confirmation of securities at June 30, 2012 by correspondence with the custodian and brokers, provides a reasonable basis for our opinion.
PRICEWATERHOUSECOOPERS LLP
Chicago, IL
August 28, 2012
Portfolio of Investments
Nuveen Global Total Return Bond Fund
June 30, 2012
| | | | | | | | | | | | | | | | | | | | |
Principal Amount (000) | | | Description (1) | | Coupon | | | Maturity | | | Ratings (2) | | | Value | |
| | | | | | | | | | | | | | | | | | | | |
| | | | CORPORATE BONDS – 38.7% | | | | | | | | | | | | | | | | |
| | | | | |
| | | | Aerospace & Defense – 0.1% | | | | | | | | | | | | | | | | |
| | | | | |
| $ | 20 | | | Huntington Ingalls Industries Inc., 144A | | | 7.125% | | | | 3/15/21 | | | | BB | | | $ | 20,900 | |
| | | | Auto Components – 0.1% | | | | | | | | | | | | | | | | |
| | | | | |
| | 20 | | | Dana Holding Corporation | | | 6.500% | | | | 2/15/19 | | | | BB | | | | 21,250 | |
| | | | Automobiles – 0.2% | | | | | | | | | | | | | | | | |
| | | | | |
| | 30 | | | Chrysler GP/CG Company | | | 8.000% | | | | 6/15/19 | | | | B | | | | 30,825 | |
| | | | Biotechnology – 1.5% | | | | | | | | | | | | | | | | |
| | | | | |
| | 200 | | | Sinopec Group Overseas Development 2012, 144A | | | 3.900% | | | | 5/17/22 | | | | Aa3 | | | | 208,487 | |
| | | | | |
| | 20 | | | STHI Holding Corporation, 144A | | | 8.000% | | | | 3/15/18 | | | | B | | | | 21,150 | |
| | 220 | | | Total Biotechnology | | | | | | | | | | | | | | | 229,637 | |
| | | | Building Products – 0.4% | | | | | | | | | | | | | | | | |
| | | | | |
| | 25 | | | Associated Materials Inc. | | | 9.125% | | | | 11/01/17 | | | | B– | | | | 22,313 | |
| | | | | |
| | 25 | | | Corporativo Javer S.A. de C.V, 144A | | | 9.875% | | | | 4/06/21 | | | | B1 | | | | 23,500 | |
| | | | | |
| | 20 | | | Texas Industries Inc. | | | 9.250% | | | | 8/15/20 | | | | B– | | | | 20,000 | |
| | 70 | | | Total Building Products | | | | | | | | | | | | | | | 65,813 | |
| | | | Capital Markets – 3.3% | | | | | | | | | | | | | | | | |
| | | | | |
| | 125 | | | Goldman Sachs Group, Inc. | | | 6.000% | | | | 6/15/20 | | | | A | | | | 133,446 | |
| | | | | |
| | 70 | | | Morgan Stanley | | | 6.625% | | | | 4/01/18 | | | | A | | | | 73,190 | |
| | | | | |
| | 125 | | | Morgan Stanley | | | 5.500% | | | | 7/24/20 | | | | A | | | | 122,296 | |
| | | | | |
| | 140 | | | Morgan Stanley | | | 5.500% | | | | 7/28/21 | | | | A | | | | 137,936 | |
| | | | | |
| | 25 | | | UBS AG Stamford | | | 4.875% | | | | 8/04/20 | | | | A | | | | 26,711 | |
| | 485 | | | Total Capital Markets | | | | | | | | | | | | | | | 493,579 | |
| | | | Chemicals – 1.4% | | | | | | | | | | | | | | | | |
| | | | | |
| | 30 | | | Ecolab Inc. | | | 4.350% | | | | 12/08/21 | | | | BBB+ | | | | 33,251 | |
| | | | | |
| | 20 | | | Georgia Gulf Corporation | | | 9.000% | | | | 1/15/17 | | | | BB | | | | 22,300 | |
| | | | | |
| | 25 | | | Huntsman International LLC, Convertible Bond, Series 2011 | | | 8.625% | | | | 3/15/21 | | | | B+ | | | | 28,188 | |
| | | | | |
| | 70 | | | Ineos Finance PLC, 144A | | | 7.500% | | | | 5/01/20 | | | | B+ | | | | 70,525 | |
| | | | | |
| | 50 | | | Taminco Global Chemical Corporation, 144A | | | 9.750% | | | | 3/31/20 | | | | B– | | | | 51,375 | |
| | 195 | | | Total Chemicals | | | | | | | | | | | | | | | 205,639 | |
| | | | Commercial Banks – 1.2% | | | | | | | | | | | | | | | | |
| | | | | |
| | 25 | | | HSBC Holdings PLC | | | 6.800% | | | | 6/01/38 | | | | AA– | | | | 28,634 | |
| | | | | |
| | 135 | | | Rabobank Nederland | | | 3.875% | | | | 2/08/22 | | | | AA | | | | 137,326 | |
| | | | | |
| | 20 | | | Royal Bank of Scotland Group PLC | | | 6.400% | | | | 10/21/19 | | | | A | | | | 21,327 | |
| | 180 | | | Total Commercial Banks | | | | | | | | | | | | | | | 187,287 | |
| | | | Commercial Services & Supplies – 0.1% | | | | | | | | | | | | | | | | |
| | | | | |
| | 10 | | | Ceridian Corporation, 144A | | | 8.875% | | | | 7/15/19 | | | | BB | | | | 10,325 | |
| | | | Computers & Peripherals – 0.3% | | | | | | | | | | | | | | | | |
| | | | | |
| | 30 | | | Hewlett Packard Company | | | 4.650% | | | | 12/09/21 | | | | A | | | | 31,446 | |
| | | | | |
| | 20 | | | Seagate HDD Cayman | | | 6.875% | | | | 5/01/20 | | | | BB+ | | | | 21,500 | |
| | 50 | | | Total Computers & Peripherals | | | | | | | | | | | | | | | 52,946 | |
| | | | Construction & Engineering – 1.3% | | | | | | | | | | | | | | | | |
| | | | | |
| | 200 | | | Odebrecht Finance Limited, 144A | | | 5.125% | | | | 6/26/22 | | | | BBB– | | | | 198,060 | |
| | | | Consumer Finance – 1.6% | | | | | | | | | | | | | | | | |
| | | | | |
| | 30 | | | Capital One Bank | | | 8.800% | | | | 7/15/19 | | | | Baa1 | | | | 37,781 | |
| | | | | |
| | 90 | | | Discover Financial Services | | | 5.200% | | | | 4/27/22 | | | | BBB | | | | 94,147 | |
| | | | | | | | | | | | | | | | | | | | |
Principal Amount (000) | | | Description (1) | | Coupon | | | Maturity | | | Ratings (2) | | | Value | |
| | | | | | | | | | | | | | | | | | | | |
| | | | Consumer Finance (continued) | | | | | | | | | | | | | | | | |
| | | | | |
| $ | 100 | | | Ford Motor Credit Company | | | 6.625% | | | | 8/15/17 | | | | Baa3 | | | $ | 113,747 | |
| | 220 | | | Total Consumer Finance | | | | | | | | | | | | | | | 245,675 | |
| | | | Containers & Packaging – 0.8% | | | | | | | | | | | | | | | | |
| | | | | |
| | 15 | | | Intertape Polymer US Inc. | | | 8.500% | | | | 8/01/14 | | | | CCC+ | | | | 15,038 | |
| | | | | |
| | 100 | | | Reynolds Group, 144A | | | 7.125% | | | | 4/15/19 | | | | BB– | | | | 104,750 | |
| | 115 | | | Total Containers & Packaging | | | | | | | | | | | | | | | 119,788 | |
| | | | Diversified Consumer Services – 0.7% | | | | | | | | | | | | | | | | |
| | | | | |
| | 100 | | | Bank of America Corporation | | | 5.700% | | | | 1/24/22 | | | | A | | | | 110,129 | |
| | | | Diversified Financial Services – 4.5% | | | | | | | | | | | | | | | | |
| | | | | |
| | 115 | | | Bank of America Corporation | | | 5.875% | | | | 1/05/21 | | | | A | | | | 125,558 | |
| | | | | |
| | 50 | | | Bank of America Corporation | | | 5.750% | | | | 12/01/17 | | | | A | | | | 53,360 | |
| | | | | |
| | 80 | | | Citigroup Inc. | | | 5.375% | | | | 8/09/20 | | | | A | | | | 86,448 | |
| | | | | |
| | 30 | | | Citigroup Inc. | | | 6.125% | | | | 8/25/36 | | | | BBB+ | | | | 29,507 | |
| | | | | |
| | 30 | | | General Electric Capital Corporation | | | 5.300% | | | | 2/11/21 | | | | AA | | | | 33,671 | |
| | | | | |
| | 25 | | | General Electric Capital Corporation | | | 6.875% | | | | 1/10/39 | | | | AA+ | | | | 32,253 | |
| | | | | |
| | 105 | | | JPMorgan Chase & Company | | | 4.350% | | | | 8/15/21 | | | | A+ | | | | 110,817 | |
| | | | | |
| | 150 | | | JPMorgan Chase & Company | | | 4.500% | | | | 1/24/22 | | | | A+ | | | | 161,583 | |
| | | | | |
| | 45 | | | JPMorgan Chase & Company | | | 6.400% | | | | 5/15/38 | | | | A+ | | | | 54,105 | |
| | 630 | | | Total Diversified Financial Services | | | | | | | | | | | | | | | 687,302 | |
| | | | Diversified Telecommunication Services – 2.0% | | | | | | | | | | | | | | | | |
| | | | | |
| | 25 | | | AT&T, Inc. | | | 5.550% | | | | 8/15/41 | | | | A2 | | | | 29,799 | |
| | | | | |
| | 35 | | | Brasil Telecom SA, 144A | | | 5.750% | | | | 2/10/22 | | | | Baa2 | | | | 35,665 | |
| | | | | |
| | 150 | | | Deutsche Telekom International Finance BV, 144A | | | 4.875% | | | | 3/06/42 | | | | BBB+ | | | | 142,506 | |
| | | | | |
| | 25 | | | Telecom Italia Capital S.p.A | | | 7.175% | | | | 6/18/19 | | | | BBB | | | | 24,875 | |
| | | | | |
| | 50 | | | Telefonica Emisiones SAU | | | 4.949% | | | | 1/15/15 | | | | BBB+ | | | | 47,270 | |
| | | | | |
| | 35 | | | Telefonica Emisiones SAU | | | 5.462% | | | | 2/16/21 | | | | BBB+ | | | | 30,478 | |
| | 320 | | | Total Diversified Telecommunication Services | | | | | | | | | | | | | | | 310,593 | |
| | | | Energy Equipment & Services – 0.8% | | | | | | | | | | | | | | | | |
| | | | | |
| | 20 | | | Diamond Offshore Drilling Inc. | | | 5.700% | | | | 10/15/39 | | | | A– | | | | 23,794 | |
| | | | | |
| | 30 | | | NGPL PipeCo LLC | | | 7.119% | | | | 12/15/17 | | | | Ba3 | | | | 30,000 | |
| | | | | |
| | 30 | | | Rowan Companies Inc. | | | 7.875% | | | | 8/01/19 | | | | BBB– | | | | 36,215 | |
| | | | | |
| | 25 | | | Weatherford International Limited | | | 7.000% | | | | 3/15/38 | | | | BBB | | | | 28,550 | |
| | 105 | | | Total Energy Equipment & Services | | | | | | | | | | | | | | | 118,559 | |
| | | | Food Products – 2.3% | | | | | | | | | | | | | | | | |
| | | | | |
| | 200 | | | BRF Brasil Foods SA, 144A | | | 5.875% | | | | 6/06/22 | | | | BBB– | | | | 206,000 | |
| | | | | |
| | 100 | | | JBS Finance II Limited, 144A | | | 8.250% | | | | 1/29/18 | | | | BB | | | | 97,000 | |
| | | | | |
| | 40 | | | Tyson Foods | | | 4.500% | | | | 6/15/22 | | | | BBB | | | | 41,200 | |
| | 340 | | | Total Food Products | | | | | | | | | | | | | | | 344,200 | |
| | | | Gas Utilities – 0.2% | | | | | | | | | | | | | | | | |
| | | | | |
| | 25 | | | AmeriGas Finance LLC | | | 6.750% | | | | 5/20/20 | | | | Ba2 | | | | 25,500 | |
| | | | Health Care Providers & Services – 0.2% | | | | | | | | | | | | | | | | |
| | | | | |
| | 25 | | | HCA Holdings Inc. | | | 7.750% | | | | 5/15/21 | | | | B– | | | | 26,813 | |
| | | | Independent Power Producers & Energy Traders – 0.3% | | | | | | | | | | | | | | | | |
| | | | | |
| | 25 | | | Constellation Energy Group | | | 5.150% | | | | 12/01/20 | | | | BBB+ | | | | 27,674 | |
| | | | | |
| | 25 | | | NRG Energy Inc. | | | 7.875% | | | | 5/15/21 | | | | BB | | | | 25,250 | |
| | 50 | | | Total Independent Power Producers & Energy Traders | | | | | | | | | | | | | | | 52,924 | |
Portfolio of Investments
Nuveen Global Total Return Bond Fund (continued)
June 30, 2012
| | | | | | | | | | | | | | | | | | | | |
Principal Amount (000) | | | Description (1) | | Coupon | | | Maturity | | | Ratings (2) | | | Value | |
| | | | | | | | | | | | | | | | | | | | |
| | | | Industrial Conglomerates – 0.1% | | | | | | | | | | | | | | | | |
| | | | | |
| $ | 20 | | | Abengoa Finance SAU, 144A | | | 8.875% | | | | 11/01/17 | | | | B+ | | | $ | 17,700 | |
| | | | Insurance – 1.0% | | | | | | | | | | | | | | | | |
| | | | | |
| | 30 | | | Allied World Assurance Holdings Limited | | | 7.500% | | | | 8/01/16 | | | | BBB+ | | | | 34,589 | |
| | | | | |
| | 30 | | | Genworth Financial Inc. | | | 6.515% | | | | 5/22/18 | | | | BBB | | | | 28,749 | |
| | | | | |
| | 35 | | | Hartford Financial Services Group Inc. | | | 6.000% | | | | 1/15/19 | | | | BBB | | | | 37,491 | |
| | | | | |
| | 25 | | | MetLife Inc. | | | 6.750% | | | | 6/01/16 | | | | A– | | | | 29,315 | |
| | | | | |
| | 20 | | | Prudential Financial Inc. | | | 5.500% | | | | 3/15/16 | | | | A | | | | 22,148 | |
| | 140 | | | Total Insurance | | | | | | | | | | | | | | | 152,292 | |
| | | | Media – 1.8% | | | | | | | | | | | | | | | | |
| | | | | |
| | 20 | | | Comcast Corporation | | | 6.400% | | | | 5/15/38 | | | | BBB+ | | | | 24,380 | |
| | | | | |
| | 55 | | | DIRECTV Holdings LLC | | | 5.200% | | | | 3/15/20 | | | | BBB | | | | 60,865 | |
| | | | | |
| | 30 | | | NBC Universal Media LLC | | | 4.375% | | | | 4/01/21 | | | | BBB+ | | | | 33,004 | |
| | | | | |
| | 20 | | | News America Holdings Inc. | | | 6.650% | | | | 11/15/37 | | | | BBB+ | | | | 23,346 | |
| | | | | |
| | 40 | | | Time Warner Inc. | | | 6.100% | | | | 7/15/40 | | | | BBB | | | | 46,016 | |
| | | | | |
| | 20 | | | Viacom Inc. | | | 6.875% | | | | 4/30/36 | | | | BBB+ | | | | 25,895 | |
| | | | | |
| | 60 | | | Vivendi SA, 144A | | | 4.750% | | | | 4/12/22 | | | | BBB | | | | 59,212 | |
| | 245 | | | Total Media | | | | | | | | | | | | | | | 272,718 | |
| | | | Metals & Mining – 4.9% | | | | | | | | | | | | | | | | |
| | | | | |
| | 55 | | | Alcoa Inc. | | | 5.400% | | | | 4/15/21 | | | | BBB– | | | | 54,767 | |
| | | | | |
| | 25 | | | Anglogold Holdings PLC | | | 6.500% | | | | 4/15/40 | | | | Baa2 | | | | 24,349 | |
| | | | | |
| | 50 | | | ArcelorMittal | | | 6.250% | | | | 2/25/22 | | | | Baa3 | | | | 48,970 | |
| | | | | |
| | 35 | | | ArcelorMittal | | | 7.000% | | | | 10/15/39 | | | | Baa3 | | | | 33,973 | |
| | | | | |
| | 35 | | | Cliffs Natural Resources Inc. | | | 4.800% | | | | 10/01/20 | | | | BBB– | | | | 34,506 | |
| | | | | |
| | 200 | | | Evraz Group S.A, 144A | | | 7.400% | | | | 4/24/17 | | | | BB– | | | | 196,036 | |
| | | | | |
| | 50 | | | FMG Resources, 144A | | | 6.000% | | | | 4/01/17 | | | | BB+ | | | | 50,250 | |
| | | | | |
| | 25 | | | Freeport McMoRan Copper & Gold, Inc. | | | 3.550% | | | | 3/01/22 | | | | BBB | | | | 24,597 | |
| | | | | |
| | 20 | | | Inmet Mining Corporation, 144A | | | 8.750% | | | | 6/01/20 | | | | B+ | | | | 19,800 | |
| | | | | |
| | 20 | | | JMC Steel Group, 144A | | | 8.250% | | | | 3/15/18 | | | | B | | | | 19,850 | |
| | | | | |
| | 100 | | | Northland Resources AB | | | 13.000% | | | | 3/06/17 | | | | B– | | | | 98,500 | |
| | | | | |
| | 20 | | | Taseko Mines Limited | | | 7.750% | | | | 4/15/19 | | | | B | | | | 19,100 | |
| | | | | |
| | 35 | | | Teck Resources Limited | | | 6.250% | | | | 7/15/41 | | | | BBB | | | | 39,185 | |
| | | | | |
| | 20 | | | Thompson Creek Metals Company | | | 7.375% | | | | 6/01/18 | | | | CCC+ | | | | 16,050 | |
| | | | | |
| | 25 | | | Vale Overseas Limited | | | 6.875% | | | | 11/10/39 | | | | A– | | | | 29,209 | |
| | | | | |
| | 35 | | | WPE International Cooperatief U.A, 144A | | | 10.375% | | | | 9/30/20 | | | | B+ | | | | 27,650 | |
| | 750 | | | Total Metals & Mining | | | | | | | | | | | | | | | 736,792 | |
| | | | Oil, Gas & Consumable Fuels – 4.2% | | | | | | | | | | | | | | | | |
| | | | | |
| | 20 | | | Anadarko Petroleum Corporation | | | 6.200% | | | | 3/15/40 | | | | BBB– | | | | 22,701 | |
| | | | | |
| | 100 | | | Bumi Capital Pte Limited, 144A | | | 12.000% | | | | 11/10/16 | | | | BB | | | | 104,250 | |
| | | | | |
| | 25 | | | Deep Drilling Company | | | 14.250% | | | | 3/05/15 | | | | N/R | | | | 24,756 | |
| | | | | |
| | 20 | | | Kodiak Oil and Gas Corporation, 144A | | | 8.125% | | | | 12/01/19 | | | | CCC+ | | | | 20,600 | |
| | | | | |
| | 25 | | | Nexen Inc. | | | 6.400% | | | | 5/15/37 | | | | BBB– | | | | 26,492 | |
| | | | | |
| | 30 | | | Noble Energy Inc. | | | 4.150% | | | | 12/15/21 | | | | BBB | | | | 31,546 | |
| | | | | |
| | 25 | | | OGX Petroleo e Gas Participacoes SA, 144A | | | 8.500% | | | | 6/01/18 | | | | B1 | | | | 22,250 | |
| | | | | |
| | 50 | | | Petrobras International Finance Company | | | 5.375% | | | | 1/27/21 | | | | A3 | | | | 53,889 | |
| | | | | | | | | | | | | | | | | | | | |
Principal Amount (000) | | | Description (1) | | Coupon | | | Maturity | | | Ratings (2) | | | Value | |
| | | | | | | | | | | | | | | | | | | | |
| | | | Oil, Gas & Consumable Fuels (continued) | | | | | | | | | | | | | | | | |
| | | | | |
| $ | 50 | | | Petrobras International Finance Company | | | 6.875% | | | | 1/20/40 | | | | A3 | | | $ | 59,476 | |
| | | | | |
| | 250 | | | Reliance Holdings USA Inc., 144A | | | 5.400% | | | | 2/14/22 | | | | BBB | | | | 249,985 | |
| | | | | |
| | 25 | | | Valero Energy Corporation | | | 6.125% | | | | 2/01/20 | | | | BBB | | | | 28,864 | |
| | 620 | | | Total Oil, Gas & Consumable Fuels | | | | | | | | | | | | | | | 644,809 | |
| | | | Paper & Forest Products – 0.3% | | | | | | | | | | | | | | | | |
| | | | | |
| | 30 | | | International Paper Company | | | 8.700% | | | | 6/15/38 | | | | BBB | | | | 42,340 | |
| | | | Pharmaceuticals – 0.2% | | | | | | | | | | | | | | | | |
| | | | | |
| | 30 | | | Valeant Pharmaceuticals International, 144A | | | 6.875% | | | | 12/01/18 | | | | BB– | | | | 31,013 | |
| | | | Real Estate Investment Trust – 0.8% | | | | | | | | | | | | | | | | |
| | | | | |
| | 20 | | | Boston Properties Limited Partnership | | | 4.125% | | | | 5/15/21 | | | | A– | | | | 21,007 | |
| | | | | |
| | 30 | | | HCP Inc. | | | 3.750% | | | | 2/01/19 | | | | BBB+ | | | | 29,947 | |
| | | | | |
| | 15 | | | Prologis Inc. | | | 6.875% | | | | 3/15/20 | | | | Baa2 | | | | 17,941 | |
| | | | | |
| | 20 | | | Simon Property Group, L.P. | | | 5.650% | | | | 2/01/20 | | | | A– | | | | 23,330 | |
| | | | | |
| | 30 | | | Vornado Realty LP | | | 4.250% | | | | 4/01/15 | | | | BBB | | | | 31,638 | |
| | 115 | | | Total Real Estate Investment Trust | | | | | | | | | | | | | | | 123,863 | |
| | | | Real Estate Management & Development – 0.7% | | | | | | | | | | | | | | | | |
| | | | | |
| | 100 | | | Agile Property Holdings Limited, 144A | | | 10.000% | | | | 11/14/16 | | | | BB | | | | 103,500 | |
| | | | Thrifts & Mortgage Finance – 0.3% | | | | | | | | | | | | | | | | |
| | | | | |
| | 40 | | | WEA Finance LLC, 144A | | | 4.625% | | | | 5/10/21 | | | | A2 | | | | 42,273 | |
| | | | Tobacco – 0.2% | | | | | | | | | | | | | | | | |
| | | | | |
| | 20 | | | Altria Group Inc. | | | 4.750% | | | | 5/05/21 | | | | Baa1 | | | | 22,681 | |
| | | | Wireless Telecommunication Services – 0.9% | | | | | | | | | | | | | | | | |
| | | | | |
| | 25 | | | American Tower Company | | | 5.050% | | | | 9/01/20 | | | | Baa3 | | | | 26,259 | |
| | | | | |
| | 100 | | | VimpelCom Limited/VIP Finance Ireland, 144A | | | 9.125% | | | | 4/30/18 | | | | BB | | | | 106,250 | |
| | 125 | | | Total Wireless Telecommunication Services | | | | | | | | | | | | | | | 132,509 | |
| $ | 5,645 | | | Total Corporate Bonds (cost $5,708,245) | | | | | | | | | | | | | | | 5,880,234 | |
| | | | | |
| Shares | | | Description (1) | | Coupon | | | Maturity | | | Ratings (2) | | | Value | |
| | | | CAPITAL PREFERRED SECURITIES – 0.3% | | | | | | | | | | | | | | | | |
| | | | | |
| | | | Capital Markets – 0.3% | | | | | | | | | | | | | | | | |
| | | | | |
| | 75 | | | Goldman Sachs Capital II | | | 4.000% | | | | 6/01/43 | | | | BB+ | | | $ | 50,777 | |
| | 75 | | | Total Capital Preferred Securities (cost $75,000) | | | | | | | | | | | | | | | 50,777 | |
| | | | | |
| Shares | | | Description (1) | | Coupon | | | | | | Ratings (2) | | | Value | |
| | | | $25 PAR (OR SIMILAR) PREFERRED SECURITIES – 1.3% | | | | | | | | | | | | | | | | |
| | | | | |
| | | | Commercial Banks – 0.4% | | | | | | | | | | | | | | | | |
| | | | | |
| | 2,400 | | | PNC Financial Services, Inc. | | | 6.125% | | | | | | | | BBB | | | $ | 63,240 | |
| | | | Diversified Financial Services – 0.5% | | | | | | | | | | | | | | | | |
| | | | | |
| | 75 | | | Bank of America Corporation | | | 7.250% | | | | | | | | BB+ | | | | 73,125 | |
| | | | Insurance – 0.4% | | | | | | | | | | | | | | | | |
| | | | | |
| | 2,400 | | | Hartford Financial Services Group Inc. | | | 7.875% | | | | | | | | BB+ | | | | 64,896 | |
| | | | Total $25 Par (or similar) Preferred Securities (cost $183,225) | | | | | | | | | | | | | | | 201,261 | |
Portfolio of Investments
Nuveen Global Total Return Bond Fund (continued)
June 30, 2012
| | | | | | | | | | | | | | | | | | | | |
Principal Amount (000) | | | Description (1) | | Coupon | | | Maturity | | | Ratings (2) | | | Value | |
| | | | | | | | | | | | | | | | | | | | |
| | | | U.S. GOVERNMENT AND AGENCY OBLIGATIONS – 0.1% | | | | | | | | | | | | | | | | |
| | | | | |
| $ | 10 | | | U.S. Treasury Notes | | | 1.750% | | | | 5/15/22 | | | | Aaa | | | $ | 10,081 | |
| $ | 10 | | | Total U.S. Government and Agency Obligations (cost $10,112) | | | | | | | | | | | | | | | 10,081 | |
| | | | | |
Principal
Amount (000) | | | Description (1) | | Coupon | | | Maturity | | | Ratings (2) | | | Value | |
| | | | ASSET BACKED AND MORTGAGE-BACKED SECURITIES – 6.1% | | | | | | | | | | | | | | | | |
| | | | | |
| $ | 140 | | | Fannie Mae TBA Mortgage Pool, (WI/DD) | | | 4.500% | | | | TBA | | | | Aaa | | | $ | 150,172 | |
| | | | | |
| | 250 | | | Fannie Mae TBA Mortgage Pool, (WI/DD) | | | 4.000% | | | | TBA | | | | Aaa | | | | 266,055 | |
| | | | | |
| | 250 | | | Fannie Mae TBA Mortgage Pool, (WI/DD) | | | 3.500% | | | | TBA | | | | Aaa | | | | 262,773 | |
| | | | | |
| | 250 | | | Holmes Master Issuer PLC, Residential Mortgage Pool,
Series 2012–1A, 144A | | | 2.105% | | | | 10/15/54 | | | | AAA | | | | 251,909 | |
| $ | 890 | | | Total Asset-Backed and Mortgage-Backed Securities (cost $927,544) | | | | | | | | 930,909 | |
| | | | | |
Principal
Amount (000) (3) | | | Description (1) | | Coupon | | | Maturity | | | Ratings (2) | | | Value | |
| | | | SOVEREIGN DEBT – 48.2% | | | | | | | | | | | | | | | | |
| | | | | |
| | | | Argentina – 0.6% | | | | | | | | | | | | | | | | |
| | | | | |
| $ | 100 | | | Republic of Argentina International Bond | | | 8.750% | | | | 6/02/17 | | | | B | | | $ | 86,000 | |
| | | | Australia – 1.5% | | | | | | | | | | | | | | | | |
| | | | | |
| | 100 AUD | | | Australian Government Bond | | | 5.750% | | | | 5/15/21 | | | | AAA | | | | 124,653 | |
| | | | | |
| | 100 AUD | | | Australian Government Bond | | | 6.500% | | | | 5/15/13 | | | | Aaa | | | | 105,534 | |
| | 200 AUD | | | Total Australia | | | | | | | | | | | | | | | 230,187 | |
| | | | Brazil – 1.0% | | | | | | | | | | | | | | | | |
| | | | | |
| | 130 | | | Federative Republic of Brazil | | | 4.875% | | | | 1/22/21 | | | | Baa2 | | | | 150,345 | |
| | | | Canada – 3.7% | | | | | | | | | | | | | | | | |
| | | | | |
| | 275 CAD | | | Canadian Government Bond | | | 2.750% | | | | 9/01/16 | | | | AAA | | | | 286,731 | |
| | | | | |
| | 250 CAD | | | Canadian Government Bond, (4) | | | 3.250% | | | | 6/01/21 | | | | AAA | | | | 278,337 | |
| | 525 CAD | | | Total Canada | | | | | | | | | | | | | | | 565,068 | |
| | | | Finland – 2.3% | | | | | | | | | | | | | | | | |
| | | | | |
| | 250 EUR | | | Finland Government Bond | | | 3.375% | | | | 4/15/20 | | | | AAA | | | | 352,711 | |
| | | | France – 2.6% | | | | | | | | | | | | | | | | |
| | | | | |
| | 300 EUR | | | French Government Bond | | | 3.000% | | | | 4/25/22 | | | | Aaa | | | | 389,749 | |
| | | | Indonesia – 0.8% | | | | | | | | | | | | | | | | |
| | | | | |
| | 100 | | | Republic of Indonesia, 144A | | | 5.875% | | | | 3/13/20 | | | | Baa3 | | | | 115,250 | |
| | | | Italy – 1.9% | | | | | | | | | | | | | | | | |
| | | | | |
| | 225 EUR | | | Republic of Italy | | | 3.000% | | | | 4/01/14 | | | | A3 | | | | 281,919 | |
| | | | Mexico – 5.9% | | | | | | | | | | | | | | | | |
| | | | | |
| | 40 MXN | | | Mexico Bonos de DeSarrollo | | | 9.500% | | | | 12/18/14 | | | | A– | | | | 333,004 | |
| | | | | |
| | 20 MXN | | | Mexico Bonos de DeSarrollo | | | 6.500% | | | | 6/10/21 | | | | A– | | | | 162,157 | |
| | | | | |
| | 50 MXN | | | Mexico Bonos de DeSarrollo | | | 6.250% | | | | 6/16/16 | | | | A– | | | | 394,180 | |
| | 110 MXN | | | Total Mexico | | | | | | | | | | | | | | | 889,341 | |
| | | | Netherlands – 2.3% | | | | | | | | | | | | | | | | |
| | | | | |
| | 150 EUR | | | Netherlands Government | | | 2.750% | | | | 1/15/15 | | | | AAA | | | | 200,824 | |
| | | | | |
| | 100 EUR | | | Netherlands Government | | | 3.750% | | | | 1/15/23 | | | | Aaa | | | | 145,118 | |
| | 250 EUR | | | Total Netherlands | | | | | | | | | | | | | | | 345,942 | |
| | | | | | | | | | | | | | | | | | | | |
| | | | | |
Principal
Amount (000) (3) | | | Description (1) | | Coupon | | | Maturity | | | Ratings (2) | | | Value | |
| | | | | | | | | | | | | | | | | | | | |
| | | | New Zealand – 2.1% | | | | | | | | | | | | | | | | |
| | | | | |
| | 350 NZD | | | New Zealand Government | | | 6.000% | | | | 12/15/17 | | | | Aaa | | | $ | 322,945 | |
| | | | Norway – 2.9% | | | | | | | | | | | | | | | | |
| | | | | |
| | 2,300 NOK | | | Norway Government Bond | | | 3.750% | | | | 5/25/21 | | | | AAA | | | | 444,488 | |
| | | | Philipines – 0.7% | | | | | | | | | | | | | | | | |
| | | | | |
| | 100 | | | Republic of the Philippines | | | 4.000% | | | | 1/15/21 | | | | BB+ | | | | 107,625 | |
| | | | Poland – 1.1% | | | | | | | | | | | | | | | | |
| | | | | |
| | 150 | | | Republic of Poland | | | 5.000% | | | | 3/23/22 | | | | A2 | | | | 163,725 | |
| | | | South Africa – 2.3% | | | | | | | | | | | | | | | | |
| | | | | |
| | 2,800 ZAR | | | Republic of South Africa | | | 7.250% | | | | 1/15/20 | | | | A | | | | 344,188 | |
| | | | Sweden – 2.2% | | | | | | | | | | | | | | | | |
| | | | | |
| | 2,000 SEK | | | Swedish Government | | | 3.500% | | | | 6/01/22 | | | | AAA | | | | 339,071 | |
| | | | Turkey – 3.9% | | | | | | | | | | | | | | | | |
| | | | | |
| | 1,100 TRY | | | Turkey Government Bond | | | 0.000% | | | | 11/07/12 | | | | BBB– | | | | 589,000 | |
| | | | United Kingdom – 10.4% | | | | | | | | | | | | | | | | |
| | | | | |
| | 100 GBP | | | United Kingdom, Gilt | | | 4.500% | | | | 3/07/13 | | | | AAA | | | | 161,080 | |
| | | | | |
| | 350 GBP | | | United Kingdom, Gilt | | | 3.750% | | | | 9/07/21 | | | | AAA | | | | 645,229 | |
| | | | | |
| | 70 GBP | | | United Kingdom, Gilt | | | 4.250% | | | | 9/07/39 | | | | Aaa | | | | 135,071 | |
| | | | | |
| | 100 GBP | | | United Kingdom, Gilt | | | 4.000% | | | | 9/07/16 | | | | AAA | | | | 178,350 | |
| | | | | |
| | 250 GBP | | | United Kingdom, Gilt | | | 3.750% | | | | 9/07/19 | | | | AAA | | | | 457,756 | |
| | 870 GBP | | | Total United Kingdom | | | | | | | | | | | | | | | 1,577,486 | |
| | | | Total Sovereign Debt (cost $7,155,651) | | | | | | | | | | | | | | | 7,295,040 | |
| | | | | |
Principal
Amount (000) | | | Description (1) | | Coupon | | | Maturity | | | | | | Value | |
| | | | SHORT-TERM INVESTMENTS – 6.6% | | | | | | | | | | | | | | | | |
| | | | | |
| | | | Repurchase Agreements – 6.6% | | | | | | | | | | | | | | | | |
| | | | | |
| $ | 1,007 | | | Repurchase Agreement with State Street Bank, dated 6/29/12, repurchase price $1,006,826, collateralized by $985,000 U.S. Treasury Notes, 1.750%, 5/31/16, value $1,031,460 | | | 0.010% | | | | 7/02/12 | | | | | | | $ | 1,006,825 | |
| | | | Total Short-Term Investments (cost $1,006,825) | | | | | | | | | | | | | | | 1,006,825 | |
| | | | Total Investments (cost $15,066,602) – 101.3% | | | | | | | | | | | | | | | 15,375,127 | |
| | | | Other Assets Less Liabilities – (1.3)% (5) | | | | | | | | | | | | | | | (192,765) | |
| | | | Net Assets – 100% | | | | | | | | | | | | | | $ | 15,182,362 | |
Investments in Derivatives at June 30, 2012
Forward Foreign Currency Exchange Contracts outstanding:
| | | | | | | | | | | | | | | | | | | | | | |
| Counterparty | | Currency Contracts to Deliver | | Amount
(Local Currency) | | | In Exchange
For Currency | | | Amount
(Local Currency) | | | Settlement
Date | | | Unrealized
Appreciation (Depreciation) (U.S. Dollars) (5) | |
Morgan Stanley | | British Pound | | | 450,000 | | | | U.S. Dollar | | | | 708,350 | | | | 7/2/12 | | | $ | 3,588 | |
Citigroup | | Canadian Dollar | | | 440,000 | | | | U.S. Dollar | | | | 422,153 | | | | 7/23/12 | | | | (9,792) | |
Morgan Stanley | | Euro | | | 871,832 | | | | U.S. Dollar | | | | 1,101,629 | | | | 8/21/12 | | | | (2,232 | ) |
Morgan Stanley | | Japanese Yen | | | 114,900,000 | | | | U.S. Dollar | | | | 1,449,550 | | | | 8/21/12 | | | | 11,034 | |
Citigroup | | U.S. Dollar | | | 118,959 | | | | Austrailian Dollar | | | | 123,000 | | | | 8/3/12 | | | | 6,502 | |
Citigroup | | U.S. Dollar | | | 935,729 | | | | Austrailian Dollar | | | | 975,000 | | | | 8/3/12 | | | | 58,775 | |
Morgan Stanley | | U.S. Dollar | | | 732,029 | | | | British Pound | | | | 450,000 | | | | 7/2/12 | | | | (27,267 | ) |
Portfolio of Investments
Nuveen Global Total Return Bond Fund (continued)
June 30, 2012
Investments in Derivatives at June 30, 2012 (continued)
Forward Foreign Currency Exchange Contracts outstanding (continued):
| | | | | | | | | | | | | | | | | | | | | | |
| Counterparty | | Currency Contracts to Deliver | | Amount
(Local Currency) | | | In Exchange
For Currency | | | Amount
(Local Currency) | | | Settlement
Date | | | Unrealized
Appreciation (Depreciation) (U.S. Dollars) (5) | |
Citigroup | | U.S. Dollar | | | 443,696 | | | | Canadian Dollar | | | | 440,000 | | | | 7/23/12 | | | $ | (11,751 | ) |
Citigroup | | U.S. Dollar | | | 422,093 | | | | Canadian Dollar | | | | 440,000 | | | | 8/3/12 | | | | 9,740 | |
Morgan Stanley | | U.S. Dollar | | | 1,756,842 | | | | Canadian Dollar | | | | 1,831,223 | | | | 8/3/12 | | | | 40,390 | |
Citigroup | | U.S. Dollar | | | 166,586 | | | | Chilean Peso | | | | 86,000,000 | | | | 7/10/12 | | | | 4,889 | |
JPMorgan | | U.S. Dollar | | | 406,204 | | | | Indian Rupee | | | | 22,000,000 | | | | 7/9/12 | | | | (13,041 | ) |
Morgan Stanley | | U.S. Dollar | | | 2,202,886 | | | | Japanese Yen | | | | 173,900,000 | | | | 8/21/12 | | | | (25,707 | ) |
Morgan Stanley | | U.S. Dollar | | | 445,711 | | | | Malaysian Ringgit | | | | 1,400,000 | | | | 7/23/12 | | | | (5,579 | ) |
Morgan Stanley | | U.S. Dollar | | | 804,851 | | | | Mexican Peso | | | | 10,500,000 | | | | 7/23/12 | | | | (19,619 | ) |
Morgan Stanley | | U.S. Dollar | | | 768,145 | | | | Chinese Yuan | | | | 4,900,000 | | | | 12/7/12 | | | | (260 | ) |
Citigroup | | U.S. Dollar | | | 649,408 | | | | South Korean Won | | | | 740,000,000 | | | | 7/13/12 | | | | (3,964 | ) |
Citigroup | | U.S. Dollar | | | 431,313 | | | | South Korean Won | | | | 500,000,000 | | | | 7/13/12 | | | | 4,797 | |
JPMorgan | | U.S. Dollar | | | 440,827 | | | | South Korean Won | | | | 520,000,000 | | | | 8/3/12 | | | | 12,059 | |
Citigroup | | U.S. Dollar | | | 429,428 | | | | Swedish Krona | | | | 3,100,000 | | | | 8/7/12 | | | | 18,046 | |
| | | | | | | | | | | | | | | | | | | | | $ | 50,608 | |
Credit Default Swaps outstanding:
| | | | | | | | | | | | | | | | | | | | | | | | | | | | | | |
| Counterparty | | Reference Entity | | Buy/Sell
Protection (6) | | | Current
Credit
Spread (7) | | | Notional
Amount | | | Fixed
Rate* | | | Termination
Date | | | Value
(U.S. Dollars) | | | Unrealized
Appreciation
(Depreciation)
(U.S. Dollars) (5) | |
JPMorgan | | Markit CDX NA HY18 Index | | | Sell | | | | 5.88 | | | | 594,000 USD | | | | 5.000 | % | | | 6/20/17 | | | | (21,143 | ) | | $ | (1,779 | ) |
Morgan Stanley | | ITRAXX Asia EX Japan Index | | | Sell | | | | 1.74 | | | | 500,000 USD | | | | 1.000 | | | | 6/20/17 | | | | (16,902 | ) | | | (2,440 | ) |
| | | | | | | | | | | | | | | | | | | | | | | | | | | | | $ | (4,219) | |
Futures Contracts oustanding:
| | | | | | | | | | | | | | | | | | | | |
| Type | | Contract
Position | | | Number of
Contracts | | | Contract
Expiration | | | Value
(U.S. Dollars) | | | Unrealized
Appreciation
(Depreciation)
(U.S. Dollars) | |
Long Gilt Future | | | Long | | | | 2 | | | | 9/12 | | | | 373,087 | | | $ | 1,594 | |
Canadian 10-Year Bond | | | Long | | | | 4 | | | | 9/12 | | | | 543,954 | | | | 1,912 | |
Japanese 10-Year Bond | | | Long | | | | 1 | | | | 9/12 | | | | 1,797,586 | | | | 6,249 | |
U.S. Treasury 10-Year Note | | | Short | | | | (8 | ) | | | 9/12 | | | | (1,067,000 | ) | | | (2,964 | ) |
U.S. Treasury 5-Year Note | | | Short | | | | (1 | ) | | | 9/12 | | | | (123,969 | ) | | | 247 | |
U.S. Treasury Long Bond | | | Short | | | | (8 | ) | | | 9/12 | | | | (1,183,750 | ) | | | (930 | ) |
| | | | | | | | | | | | | | | | | | | $ | 6,108 | |
| | (1) | | All percentages shown in the Portfolio of Investments are based on net assets. |
| | (2) | | Ratings (not covered by the report of independent registered public accounting firm): Using the highest of Standard & Poor’s Group (“Standard & Poor’s”), Moody’s Investors Service, Inc. (“Moody’s”) or Fitch, Inc. (“Fitch”) rating. Ratings below BBB by Standard & Poor’s, Baa by Moody’s or BBB by Fitch are considered to be below investment grade. Holdings designated N/R are not rated by any of these national rating agencies. |
| | (3) | | Principal Amount (000) denominated in U.S. Dollars, unless otherwise noted. |
| | (4) | | Investment, or portion of investment, has been pledged to collateralize the net payment obligations for investments in derivatives. |
| | (5) | | Other Assets Less Liabilities, includes the Unrealized Appreciation (Depreciation) of derivative instruments as noted within Investments in Derivatives at June 30, 2012. |
| | (6) | | The Fund entered into the credit default swaps to gain investment exposure to the referenced entity. Selling protection has a similar credit risk position to owning the referenced entity. Buying protection has a similar credit risk position to selling the referenced entity short. |
| | (7) | | The credit spread generally serves as an indication of the current status of the payment/performance risk and therefore the likelihood of default of the credit derivative. The credit spread also reflects the cost of buying/selling protection and may include upfront payments required to be made to enter into a credit default swap contract. Higher credit spreads are indicative of higher likelihood of performance by the seller of protection. |
| | TBA | | To be announced. Maturity date not known prior to settlement of this transaction. |
| | WI/DD | | Purchased on a when-issued or delayed delivery basis. |
| | 144A | | Investment is exempt from registration under Rule 144A of the Securities Act of 1933, as amended. These investments may only be resold in transactions exempt from registration, which are normally those transactions with qualified institutional buyers. |
See accompanying notes to financial statements.
Statement of Assets & Liabilities
June 30, 2012
| | | | |
Assets | | | | |
Investments, at value (cost $14,059,777) | | $ | 14,368,302 | |
Short-Term investments (at cost, which approximates value) | | | 1,006,825 | |
Cash denominated in foreign currencies (cost $189,302) | | | 192,184 | |
Unrealized appreciation on forward foreign currency exchange contracts | | | 165,858 | |
Receivables: | | | | |
Dividends | | | 2,672 | |
From Adviser | | | 23,433 | |
Interest | | | 150,669 | |
Investments sold | | | 278,758 | |
Shares sold | | | 58,644 | |
Variation margin on futures contracts | | | 12,264 | |
Total assets | | | 16,259,609 | |
Liabilities | | | | |
Cash overdraft | | | 27,415 | |
Credit default swap premiums received | | | 32,825 | |
Unrealized depreciation on: | | | | |
Credit default swaps | | | 4,219 | |
Forward foreign currency exchange contracts | | | 115,250 | |
Payables: | | | | |
Dividends | | | 56,285 | |
Investments purchased | | | 787,380 | |
Shares redeemed | | | 221 | |
Accrued expenses: | | | | |
12b-1 distribution and service fees | | | 123 | |
Other | | | 53,529 | |
Total liabilities | | | 1,077,247 | |
Net assets | | $ | 15,182,362 | |
Class A Shares | | | | |
Net assets | | $ | 309,712 | |
Shares outstanding | | | 14,615 | |
Net asset value per share | | $ | 21.19 | |
Offering price per share (net asset value per share plus
maximum sales charge of 4.75% of offering price) | | $ | 22.25 | |
Class C Shares | | | | |
Net assets | | $ | 52,944 | |
Shares outstanding | | | 2,500 | |
Net asset value and offering price per share | | $ | 21.18 | |
Class R3 Shares | | | | |
Net assets | | $ | 53,007 | |
Shares outstanding | | | 2,500 | |
Net asset value and offering price per share | | $ | 21.20 | |
Class I Shares | | | | |
Net assets | | $ | 14,766,699 | |
Shares outstanding | | | 695,644 | |
Net asset value and offering price per share | | $ | 21.23 | |
Net assets consist of: | | | | |
Capital paid-in | | $ | 14,322,773 | |
Undistributed (Over-distribution of) net investment income | | | 405,210 | |
Accumulated net realized gain (loss) | | | 91,088 | |
Net unrealized appreciation (depreciation) | | | 363,291 | |
Net assets | | $ | 15,182,362 | |
Authorized shares | | | Unlimited | |
Par value per share | | $ | 0.01 | |
See accompanying notes to financial statements.
Statement of Operations
For the Period December 2, 2011 (commencement of operations) through June 30, 2012
| | | | |
Dividend and Interest Income | | $ | 355,080 | |
Expenses | | | | |
Management fees | | | 48,904 | |
12b-1 service fees – Class A | | | 191 | |
12b-1 distribution and service fees – Class C | | | 303 | |
12b-1 distribution and service fees – Class R3 | | | 152 | |
Shareholders’ servicing agent fees and expenses | | | 9,284 | |
Custodian’s fees and expenses | | | 29,911 | |
Trustees’ fees and expenses | | | 256 | |
Professional fees | | | 49,771 | |
Shareholders’ reports – printing and mailing expenses | | | 4,271 | |
Federal and state registration fees | | | 5,614 | |
Other expenses | | | 1,085 | |
Total expenses before expense reimbursement | | | 149,742 | |
Expense reimbursement | | | (86,963 | ) |
Net expenses | | | 62,779 | |
Net investment income (loss) | | | 292,301 | |
Realized and Unrealized Gain (Loss) | | | | |
Net realized gain (loss) from: | | | | |
Investments and foreign currency | | | 2,886 | |
Forward foreign currency exchange contracts | | | 324,366 | |
Futures contracts | | | 2,222 | |
Options purchased | | | (29,297 | ) |
Options written | | | 2,460 | |
Swaps | | | 119,949 | |
Change in net unrealized appreciation (depreciation) of: | | | | |
Investments and foreign currency | | | 310,794 | |
Forward foreign currency exchange contracts | | | 50,608 | |
Futures contracts | | | 6,108 | |
Swaps | | | (4,219 | ) |
Net realized and unrealized gain (loss) | | | 785,877 | |
Net increase (decrease) in net assets from operations | | $ | 1,078,178 | |
See accompanying notes to financial statements.
Statement of Changes in Net Assets
| | | | |
| | | Period 12/02/11 (commencement of operations) through 6/30/12 | |
Operations | | | | |
Net investment income (loss) | | $ | 292,301 | |
Net realized gain (loss) from: | | | | |
Investments and foreign currency | | | 2,886 | |
Forward foreign currency exchange contracts | | | 324,366 | |
Futures contracts | | | 2,222 | |
Options purchased | | | (29,297 | ) |
Options written | | | 2,460 | |
Swaps | | | 119,949 | |
Change in net unrealized appreciation (depreciation) of: | | | | |
Investments and foreign currency | | | 310,794 | |
Forward foreign currency exchange contracts | | | 50,608 | |
Futures contracts | | | 6,108 | |
Swaps | | | (4,219 | ) |
Net increase (decrease) in net assets from operations | | | 1,078,178 | |
Distributions to Shareholders | | | | |
From net investment income: | | | | |
Class A | | | (2,712 | ) |
Class C | | | (596 | ) |
Class R3 | | | (688 | ) |
Class I | | | (215,380 | ) |
Decrease in net assets from distributions to shareholders | | | (219,376 | ) |
Fund Share Transactions | | | | |
Proceeds from sale of shares | | | 14,322,080 | |
Proceeds from shares issued to shareholders due to reinvestment of distributions | | | 1,978 | |
| | | 14,324,058 | |
Cost of shares redeemed | | | (498 | ) |
Net increase (decrease) in net assets from Fund share transactions | | | 14,323,560 | |
Net increase (decrease) in net assets | | | 15,182,362 | |
Net assets at the beginning of period | | | — | |
Net assets at the end of period | | $ | 15,182,362 | |
Undistributed (Over-distribution of) net investment income at the end of period | | $ | 405,210 | |
See accompanying notes to financial statements.
[THIS PAGE INTENTIONALLY LEFT BLANK]
Financial Highlights
| | | | | | | | | | | | | | | | | | | | | | | | | | | | | | | | | | | | |
| Selected data for a share outstanding throughout each period: | |
| | | | | | | |
| Class (Commencement Date) | | | | | | | | | | | | | | | | | | | | | | |
| | | | | | Investment Operations | | | Less Distributions | | | | | | | |
| | | | | | | |
| | | | | | | | | | | | | | | | | | | | | | | |
Year Ended
June 30, | | Beginning
Net
Asset
Value | | | Net
Invest-
ment
Income
(Loss)(a) | | | Net
Realized/
Unrealized
Gain
(Loss) | | | Total | | | Net
Invest-
ment
Income | | | Capital
Gains(b) | | | Total | | | Ending
Net
Asset
Value | | | Total
Return(c) | |
CLASS A (12/11) | | | | | | | | | | | | | | | | | | | | | | | | | | | | | |
2012(e) | | $ | 20.00 | | | $ | .41 | | | $ | 1.07 | | | $ | 1.48 | | | $ | (.29 | ) | | $ | — | | | $ | (.29 | ) | | $ | 21.19 | | | | 7.42 | % |
CLASS C (12/11) | | | | | | | | | | | | | | | | | | | | | | | | | | | | | |
2012(e) | | | 20.00 | | | | .29 | | | | 1.13 | | | | 1.42 | | | | (.24 | ) | | | — | | | | (.24 | ) | | | 21.18 | | | | 7.10 | |
CLASS R3 (12/11) | | | | | | | | | | | | | | | | | | | | | | | | | | | | | |
2012(e) | | | 20.00 | | | | .35 | | | | 1.13 | | | | 1.48 | | | | (.28 | ) | | | — | | | | (.28 | ) | | | 21.20 | | | | 7.38 | |
CLASS I (12/11) | | | | | | | | | | | | | | | | | | | | | | | | | | | | | |
2012(e) | | | 20.00 | | | | .42 | | | | 1.12 | | | | 1.54 | | | | (.31 | ) | | | — | | | | (.31 | ) | | | 21.23 | | | | 7.71 | |
| | | | | | | | | | | | | | | | | | | | | | |
| | | | | | | | | | | | | | | | | |
| | | | |
| | | | | | | | | | | | | | |
| Ratios/Supplemental Data | |
| | | | Ratios to Average
Net Assets Before
Reimbursement | | | Ratios to Average
Net Assets After
Reimbursement(d) | | | | |
Ending
Net
Assets
(000) | | | Expenses | | | Net
Invest-
ment
Income
(Loss) | | | Expenses | | | Net
Invest-
ment
Income
(Loss) | | | Portfolio
Turnover
Rate | |
| | | | | | | | | | | | | | | | | | | | | | |
| $ | 310 | | | | 2.44 | %* | | | 1.99 | %* | | | .98 | %* | | | 3.46 | %* | | | 116 | % |
| | | | | | | | | | | | | | | | | | | | | | |
| | 53 | | | | 2.74 | * | | | 1.41 | * | | | 1.72 | * | | | 2.42 | * | | | 116 | |
| | | | | | | | | | | | | | | | | | | | | | |
| | 53 | | | | 2.24 | * | | | 1.91 | * | | | 1.23 | * | | | 2.92 | * | | | 116 | |
| | | | | | | | | | | | | | | | | | | | | | |
| | 14,767 | | | | 1.74 | * | | | 2.41 | * | | | .73 | * | | | 3.42 | * | | | 116 | |
| (a) | Per share Net Investment Income (Loss) is calculated using the average daily shares method. |
| (b) | Distributions from Capital Gains include short-term capital gains, if any. |
| (c) | Total return is the combination of changes in net asset value without any sales charge, reinvested dividend income at net asset value and reinvested capital gains distributions at net asset value, if any. Total returns are not annualized. |
| (d) | After expense reimbursement from the Adviser, where applicable. |
| (e) | For the period December 2, 2011 (commencement of operations) through June 30, 2012. |
See accompanying notes to financial statements.
Notes to Financial Statements
1. General Information and Significant Accounting Policies
General Information
Nuveen Investment Trust (the “Trust”), is an open-end management investment company registered under the Investment Company Act of 1940, as amended. The Trust is comprised of the Nuveen Global Total Return Bond Fund (the “Fund”), among others. The Trust was organized as a Massachusetts business trust in 1996.
The Fund’s investment objective is to seek total return. Under normal market conditions, the Fund invests at least 80% of its net assets, plus the amount of any borrowings for investment purposes in bonds from issuers located around the world. The bonds in which the Fund may invest may be of any maturity and include debt obligations of foreign governments, domestic and foreign corporate debt obligations, including obligations issued by special-purpose entities that are backed by corporate debt obligations; U.S. government securities (securities issued or guaranteed by the U.S. government or its agencies or instrumentalities), residential and commercial mortgage-backed securities, and asset-backed securities. Under normal market conditions, the Fund invests at least 40% of its net assets in non-U.S. issuers and is invested in issuers located in at least three countries (including the U.S.). The Fund may invest in debt obligations issued by governmental and corporate issuers located in emerging markets countries. The Fund invests in securities that are U.S. dollar-denominated and in securities that are denominated in foreign currencies. The Fund invests primarily in securities rated investment grade at the time of purchase or in unrated securities of comparable quality as determined by Nuveen Asset Management, LLC (the “Sub-Adviser”), a wholly-owned subsidiary of Nuveen Fund Advisors, Inc. (the “Adviser”), a wholly-owned subsidiary of Nuveen Investments, Inc. (“Nuveen”). Up to 30% of the Fund’s net assets may be invested in securities rated lower than investment grade or in unrated securities of comparable quality as determined by the Sub-Adviser (securities commonly referred to as “high yield” or “junk bonds”).
The Fund may invest in derivative financial instruments in an attempt to manage market risk, currency risk, credit risk and yield curve risk, to manage the effective maturity or duration of securities in the Fund’s portfolio or for speculative purposes in an effort to enhance returns. The Fund may also use derivatives to gain exposure to non-dollar denominated securities markets to the extent it does not do so through direct investments.
The Fund’s most recent prospectus provides further description of the Fund’s investment objective, principal investment strategies and principal risks.
Significant Accounting Policies
The following is a summary of significant accounting policies followed by the Fund in the preparation of its financial statements in accordance with accounting principles generally accepted in the United States (“U.S. GAAP”).
Investment Valuation
Prices of fixed-income securities, forward foreign currency exchange contracts and swap contracts are provided by a pricing service approved by the Fund’s Board of Trustees. These securities are generally classified as Level 2 for fair value measurement purposes. The pricing service establishes a security’s fair value using methods that may include consideration of the following: yields or prices of investments of comparable quality, type of issue, coupon, maturity and rating, market quotes or indications of value from security dealers, evaluations of anticipated cash flows or collateral, general market conditions and other information and analysis, including the obligor’s credit characteristics considered relevant. In pricing certain securities, particularly less liquid and lower quality securities, the pricing service may consider information about a security, its issuer, or market activity provided by the Adviser. These securities are generally classified as Level 2 or Level 3 depending on the priority of the significant inputs.
If significant market events occur between the time of determination of the closing price of a foreign security on an exchange and the time that the Fund’s net asset value (NAV) is determined, or if under the Fund’s procedures, the closing price of a foreign security is not deemed to be reliable, the security would be valued at fair value as determined in accordance with procedures established in good faith by the Fund’s Board of Trustees. These securities are generally classified as Level 2 or Level 3 depending on the priority of the significant inputs.
The value of exchange-traded options are based on the mean of the closing bid and ask prices. Futures contracts are valued using the closing settlement price or, in the absence of such a price, the last traded price. Exchange-traded options and futures contracts are generally classified as Level 1. Options traded in the over-the counter market are valued using an evaluated mean price and are generally classified as Level 2.
Repurchase agreements are valued at contract amount plus accrued interest, which approximates market value. These securities are generally classified as Level 2.
Certain securities may not be able to be priced by the pre-established pricing methods as described above. Such securities may be valued by the Fund’s Board of Trustees or its designee at fair value. These securities generally include, but are not limited to, restricted securities (securities which may not be publicly sold without registration under the Securities Act of 1933, as amended) for which a pricing service is unable to provide a market price; securities whose trading has been formally suspended; debt securities that have gone into default and for which there is no current market quotation; a security whose market price is not available from a pre-established pricing source; a security with respect to which an event has occurred that is likely to materially affect the value of the
security after the market has closed but before the calculation of the Fund’s net asset value (as may be the case in non-U.S. markets on which the security is primarily traded) or make it difficult or impossible to obtain a reliable market quotation; and a security whose price, as provided by the pricing service, is not deemed to reflect the security’s fair value. As a general principle, the fair value of a security would appear to be the amount that the owner might reasonably expect to receive for it in a current sale. A variety of factors may be considered in determining the fair value of such securities, which may include consideration of the following: yields or prices of investments of comparable quality, type of issue, coupon, maturity and rating, market quotes or indications of value from security dealers, evaluations of anticipated cash flows or collateral, general market conditions and other information and analysis, including the obligor’s credit characteristics considered relevant. These securities are generally classified as Level 2 or Level 3 depending on the priority of the significant inputs. Regardless of the method employed to value a particular security, all valuations are subject to review by the Fund’s Board of Trustees or its designee.
Refer to Footnote 2 – Fair Value Measurements for further details on the leveling of securities held by the Fund as of the end of the reporting period.
Investment Transactions
Investment transactions are recorded on a trade date basis. Realized gains and losses from investment transactions are determined on the specific identification method, which is the same basis used for federal income tax purposes. Investments purchased on a when-issued/delayed delivery basis may have extended settlement periods. Any investments so purchased are subject to market fluctuation during this period. The Fund has instructed the custodian to earmark securities in the Fund’s portfolio with a current value at least equal to the amount of the when-issued/delayed delivery purchase commitments. At June 30, 2012, the Fund had outstanding when issued/delayed delivery purchase commitments of $677,544.
Investment Income
Dividend income is recorded on the ex-dividend date or, for foreign securities, when information is available. Interest income, which reflects the amortization of premiums and includes accretion of discounts for financial reporting purposes, is recorded on an accrual basis. Interest income also reflects paydown gains and losses, if any.
Income Taxes
The Fund intends to distribute substantially all of its net investment income and net capital gains to shareholders and to otherwise comply with the requirements of Subchapter M of the Internal Revenue Code applicable to regulated investment companies (“RICs”). Therefore, no federal income tax provision is required.
For all open tax years and all major taxing jurisdictions, management of the Fund has concluded that there are no significant uncertain tax positions that would require recognition in the financial statements. Open tax years are those that are open for examination by taxing authorities (i.e., generally the last four tax year ends and the interim tax period since then). Furthermore, management of the Fund is also not aware of any tax positions for which it is reasonably possible that the total amounts of unrecognized tax benefits will significantly change in the next twelve months.
Dividends and Distributions to Shareholders
The Fund declares dividends from its net investment income daily and pays shareholders monthly. Fund shares begin to accrue dividends on the business day after the day when the monies used to purchase Fund shares are collected by the Fund’s transfer agent.
Net realized capital gains from investment transactions, if any, are declared and distributed to shareholders at least annually. Furthermore, capital gains are distributed only to the extent they exceed available capital loss carry forwards.
Distributions to shareholders are recorded on the ex-dividend date. The amount and timing of distributions are determined in accordance with federal income tax regulations, which may differ from U.S. GAAP.
Flexible Sales Charge Program
Class A Shares are generally sold with an up-front sales charge and incur a .25% annual 12b-1 service fee. Class A Share purchases of $1 million or more are sold at net asset value without an up-front sales charge but may be subject to a contingent deferred sales charge (“CDSC”) if redeemed within eighteen months of purchase. Class C Shares are sold without an up-front sales charge but incur a .75% annual 12b-1 distribution fee and a .25% annual 12b-1 service fee. Class C Shares are subject to a CDSC of 1% if redeemed within twelve months of purchase. Class R3 Shares are sold without an up-front sales charge but incur a .25% annual 12b-1 distribution fee and a .25% annual 12b-1 service fee. Class I Shares are not subject to any sales charge or 12b-1 distribution or service fees.
Foreign Currency Transactions
The Fund is authorized to engage in foreign currency exchange transactions, including foreign currency exchange contracts, futures, options and swap contracts. To the extent that the Fund invests in securities and/or contracts that are denominated in a currency other than U.S. dollars, the Fund will be subject to currency risk, which is the risk that an increase in the U.S. dollar relative to the foreign currency will reduce returns or portfolio value. Generally, when the U.S. dollar rises in value against a foreign currency, the Fund’s investments denominated in that currency will lose value because its currency is worth fewer U.S. dollars; the opposite effect occurs if the U.S. dollar falls in relative value. Investments and other assets and liabilities denominated in foreign currencies are converted into U.S. dollars on a spot (i.e. cash) basis at the spot rate prevailing in the foreign currency exchange market at the time of valuation. Purchases and sales of investments and income denominated in foreign currencies are translated into U.S. dollars on the respective dates of such transactions.
Notes to Financial Statements (continued)
The books and records of the Fund are maintained in U.S. dollars. Foreign currencies, assets and liabilities are translated into U.S. dollars at 4:00 p.m. Eastern time. Investment transactions, income and expenses are translated on the respective dates of such transactions. Net realized foreign currency gains and losses resulting from changes in exchange rates include foreign currency gains and losses between trade date and settlement date of the transactions, foreign currency transactions, and the difference between the amounts of interest and dividends recorded on the books of the Fund and the amounts actually received.
The realized gains and losses resulting from changes in foreign currency exchange rates and changes in foreign exchange rates associated with other assets and liabilities on investments, forward foreign currency exchange contracts, futures, options purchased, options written and swap contracts are recognized as a component of “Net realized gain (loss) from investments and foreign currency” on the Statement of Operations.
The unrealized gains and losses resulting from changes in foreign currency exchange rates and changes in foreign exchange rates associated with other assets and liabilities on investments are recognized as a component of “Change in net unrealized appreciation (depreciation) of investments and foreign currency” on the Statement of Operations, when applicable. The unrealized gains and losses resulting from changes in foreign exchange rates associated with forward foreign currency exchange contracts, futures, options purchased, options written and swap contracts are recognized as a component of “Change in net unrealized appreciation (deprecation) of forward foreign currency exchange contracts, futures and swaps, respectively” on the Statement of Operations, when applicable.
Forward Foreign Currency Exchange Contracts
The Fund is subject to foreign currency exchange rate risk in the normal course of pursuing its investment objectives and is authorized to enter into forward foreign currency exchange contracts in an attempt to manage such risk under two circumstances: (i) when a Fund enters into a contract for the purchase or sale of a security denominated in a foreign currency to “lock in” the U.S. exchange rate of the transaction, with such period being a short-dated contract covering the period between transaction date and settlement date; or (ii) when the Sub-Adviser, believes that the currency of a particular foreign country may experience a substantial movement against the U.S. dollar or against another foreign currency. Forward foreign currency exchange contracts are valued daily at the forward rate and are recognized as a component of “Unrealized appreciation or depreciation on forward foreign currency exchange contracts” on the Statement of Assets and Liabilities. The change in value of the contracts during the reporting period is recognized as a component of “Change in net unrealized appreciation (depreciation) of forward foreign currency exchange contracts” on the Statement of Operations. When the contract is closed or offset with the same counterparty, the Fund recognizes the difference between the value of the contract at the time it was entered and the value at the time it was closed or offset as a component of “Net realized gain (loss) from forward foreign currency exchange contracts” on the Statement of Operations.
Forward foreign currency exchange contracts will generally not be entered into for terms greater than three months, but may have maturities of up to six months or more. The use of forward foreign currency exchange contracts does not eliminate fluctuations in the underlying prices of the Fund’s investment securities; however, it does establish a rate of exchange that can be achieved in the future. The use of forward foreign currency exchange contracts involves the risk that anticipated currency movements will not be accurately predicted. A forward foreign currency exchange contract would limit the risk of loss due to a decline in the value of a particular currency; however, it also would limit any potential gain that might result should the value of the currency increase instead of decrease. These contracts may involve market risk in excess of the unrealized gain or loss reflected on the Statement of Assets and Liabilities. Forward foreign currency exchange contracts are subject to counterparty risk if the counterparty fails to perform as specified in the contract due to financial impairment or other reason.
During the period December 2, 2011 (commencement of operations) through June 30, 2012, the Fund invested in forward foreign currency exchange contracts to manage foreign currency exposure. To reduce unwanted currency exposure from the Fund’s Portfolio of Investments, the Fund acquired a short foreign currency forward.
The average number of forward foreign currency exchange contracts outstanding during the period December 2, 2011 (commencement of operations) through June 30, 2012, was as follows:
| | | | |
Average number of forward foreign currency exchange contracts outstanding* | | | 25 | |
| * | The average number of outstanding contracts is calculated based on the outstanding contracts at the beginning of the fiscal year and at the end of each fiscal quarter within the current fiscal year. |
Refer to Footnote 3 – Derivative Instruments and Hedging Activities for further details on forward foreign currency exchange contract activity.
Futures Contracts
The Fund is subject to interest rate risk in the normal course of pursuing its investment objectives and is authorized to invest in futures contracts in attempt to manage such risk. Upon entering into a futures contract, the Fund is required to deposit with the broker an amount of cash or liquid securities equal to a specified percentage of the contract amount. This is known as the “initial margin.” Cash held by the broker to cover initial margin requirements on open futures contracts, if any, is recognized as “Deposits with brokers for open futures contracts” on the Statement of Assets and Liabilities. Subsequent payments (“variation margin”) are made or received by the Fund each day, depending on the daily fluctuation of the value of the contract. Variation margin is recognized as a receivable or payable for “Variation margin on futures contracts” on the Statement of Assets and Liabilities, when applicable.
During the period the futures contract is open, changes in the value of the contract are recognized as an unrealized gain or loss by “marking-to-market” on a daily basis to reflect the changes in market value of the contract, which is recognized as “Change in net unrealized appreciation (depreciation) of futures contracts” on the Statement of Operations. When the contract is closed or expired, the Fund records a realized gain or loss equal to the difference between the value of the contract on the closing date and value of the contract when originally entered into, which is recognized as “Net realized gain (loss) from futures contracts” on the Statement of Operations.
Risks of investments in futures contracts include the possible adverse movement in the price of the securities or indices underlying the contracts, the possibility that there may not be a liquid secondary market for the contracts and/or that a change in the value of the contract may not correlate with a change in the value of the underlying securities or indices.
During the period December 2, 2011 (commencement of operations) through June 30, 2012, the Fund used long and short U.S. Treasury note and bond futures to manage portfolio duration and yield curve exposure. To increase the duration of the Fund’s Portfolio of Investments, the Fund acquired a long U.S. Treasury note or bond futures position. The Fund entered into foreign interest rate futures to manage foreign interest rate exposures.
The average number of futures contracts outstanding during the period December 2, 2011 (commencement of operations) through June 30, 2012, was as follows:
| | | | |
Average number of futures contracts outstanding* | | | 28 | |
| * | The average number of outstanding contracts is calculated based on the outstanding contracts at the beginning of the fiscal year and at the end of each fiscal quarter within the current fiscal year. |
Refer to Footnote 3 – Derivative Instruments and Hedging Activities for further details on futures contract activity.
Options Transactions
The Fund is subject to foreign currency risk and interest rate risk in the normal course of pursuing its investment objectives and is authorized to purchase and write (sell) call and put options on securities, futures contracts, swaps (“swaptions”) or currencies in an attempt to manage such risk. The purchase of options and/or swaptions involves the risk of loss of all or a part of the cash paid for the options (the premium). The market risk associated with purchasing options and/or swaptions is limited to the premium paid. The counterparty credit risk of purchasing options and/or swaptions, however, needs also to take into account the current value of the option, as this is the performance expected from the counterparty. When the Fund purchases an option and/or swaption, an amount equal to the premium paid (the premium plus commission) is recognized as a component of “Options and/or Swaptions purchased, at value” on the Statement of Assets and Liabilities. When the Fund writes an option and/or swaption, an amount equal to the net premium received (the premium less commission) is recognized as a component of “Options and/or Swaptions written, at value” on the Statement of Assets and Liabilities and is subsequently adjusted to reflect the current value of the written option and/or swaption until the option and/or swaption is exercised or expires or the Fund enters into a closing purchase transaction. The changes in the value of options and/or swaptions purchased during the reporting period are recognized as a component of “Change in net unrealized appreciation (depreciation) of options and/or swaptions purchased” on the Statement of Operations. The changes in the value of options and/or swaptions written during the reporting period are recognized as a component of “Change in net unrealized appreciation (depreciation) of options and/or swaptions written” on the Statement of Operations. When an option and/or swaption is exercised or expires or the Fund enters into a closing purchase transaction, the difference between the net premium received and any amount paid at expiration or on executing a closing purchase transaction, including commission, is recognized as a component of “Net realized gain (loss) from options and/or swaptions purchased and/or written” on the Statement of Operations. The Fund, as a writer of an option has no control over whether the underlying instrument may be sold (called) or purchased (put) and as a result bears the risk of an unfavorable change in the market value of the instrument underlying the written option and/or swaption. There is also the risk the Fund may not be able to enter into a closing transaction because of an illiquid market.
During the period December 2, 2011 (commencement of operations) through June 30, 2012, the Fund did not purchase or write any swaptions. During the period December 2, 2011 (commencement of operations) through June 30, 2012, the Fund purchased options on note/bond futures as part of an overall portfolio interest rate strategy. Call options may be purchased to hedge the portfolio against adverse interest rate movements while limiting downside exposure to the portfolio. The Fund also sold short term call options on the Brazilian real to benefit if the Brazilian real declined – but purchased higher strike calls on the Brazilian real as protection in case the Brazilian real instead rose.
The average number of options contracts outstanding during the period December 2, 2011 (commencement of operations) through June 30, 2012, were as follows:
| | | | |
Average number of purchased option contracts outstanding* | | | 6 | |
Average number of written option contracts outstanding* | | | — | ** |
| * | The average number of option contracts is calculated based on the outstanding contracts at the beginning of the fiscal year and at the end of each fiscal quarter within the current fiscal year. |
Notes to Financial Statements (continued)
Refer to Footnote 3 – Derivative Instruments and Hedging Activities and Footnote 5 – Investment Transactions for further details on option activity.
Swap Contracts
The Fund is authorized to enter into swap contracts consistent with its investment objectives and policies to reduce, increase or otherwise alter its risk profile or to alter its portfolio characteristics (i.e. duration, yield curve positioning and credit quality).
Credit Default Swaps
The Fund is subject to credit risk in the normal course of pursuing its investment objectives. The Fund may enter into a credit default swap contract to seek to maintain a total return on a particular investment or portion of its portfolio, or to take an active long or short position with respect to the likelihood of a particular issuer’s default. Credit default swap contracts involve one party making a stream of payments to another party in exchange for the right to receive a specified return if/when there is a credit event by a third party. Generally, a credit event means bankruptcy, failure to pay, or restructuring. The specific credit events applicable for each credit default swap are stated in the terms of the particular swap agreement. As a purchaser of a credit default swap contract, the Fund pays to the counterparty a periodic interest fee based on the notional amount of the credit default swap. This interest fee is accrued daily and recognized with the daily change in the market value of the contract as a component of “Unrealized appreciation or depreciation on credit default swaps (, net)” on the Statement of Assets and Liabilities and is recorded as a realized loss upon payment. Upon occurrence of a specific credit event with respect to the underlying referenced entity, the Fund is obligated to deliver that security, or an equivalent amount of cash, to the counterparty in exchange for receipt of the notional amount from the counterparty. The difference between the value of the security delivered and the notional amount received is recorded as a realized gain. Payments received or made at the beginning of the measurement period are recognized as a component of “Credit default swap premiums paid and/or received” on the Statement of Assets and Liabilities, when applicable. As a seller of a credit default swap contract, the Fund generally receives from the counterparty a periodic interest fee based on the notional amount of the credit default swap. This interest fee is accrued daily as a component of unrealized appreciation or depreciation and is recorded as a realized gain upon payment. Upon occurrence of a specific credit event with respect to the underlying referenced entity, the Fund will either receive that security, or an equivalent amount of cash, from the counterparty in exchange for payment of the notional amount to the counterparty, or pay a net settlement amount of the credit default swap contract less the recovery value of the referenced obligation or underlying securities comprising the referenced index. The difference between the value of the security received and the notional amount paid is recorded as a realized loss. Changes in the value of a credit default swap during the reporting period are recognized as a component of “Change in net unrealized appreciation (depreciation) of swaps”, and realized gains and losses are recognized as a component of “Net realized gain (loss) from swaps” on the Statement of Operations. The maximum potential amount of future payments the Fund could incur as a seller of protection in a credit default swap contract is limited to the notional amount of the contract. The maximum potential amount would be offset by the recovery value, if any, of the respective referenced entity.
During the period December 2, 2011 (commencement of operations) through June 30, 2012, the Fund invested in credit default swap contacts to express a view on credit as part of an overall portfolio sector management strategy. To increase the Fund’s credit exposure to the high yield bond segment of the market, a long CDX High Yield Index swap would be acquired.
The average number of credit default swap contracts outstanding during the period December 2, 2011 (commencement of operations) through June 30, 2012, was as follows:
| | | | |
Average number of credit default swap contracts outstanding* | | | 3 | |
| * | The average notional amount is calculated based on the outstanding contracts at the beginning of the fiscal year and at the end of each fiscal quarter within the current fiscal year. |
Refer to Footnote 3 – Derivative Instruments and Hedging Activities for further details on swap contract activity.
Market and Counterparty Credit Risk
In the normal course of business the Fund may invest in financial instruments and enter into financial transactions where risk of potential loss exists due to changes in the market (market risk) or failure of the other party to the transaction to perform (counterparty credit risk). The potential loss could exceed the value of the financial assets recorded on the financial statements. Financial assets, which potentially expose the Fund to counterparty credit risk, consist principally of cash due from counterparties on forward, option and swap transactions, when applicable. The extent of the Fund’s exposure to counterparty credit risk in respect to these financial assets approximates their carrying value as recorded on the Statement of Assets and Liabilities. Futures contracts, when applicable, expose the Fund to minimal counterparty credit risk as they are exchange traded and the exchange’s clearinghouse, which is counterparty to all exchange traded futures, guarantees the futures contracts against default.
The Fund helps manage counterparty credit risk by entering into agreements only with counterparties the Adviser believes have the financial resources to honor their obligations and by having the Adviser monitor the financial stability of the counterparties. Additionally, counterparties may be required to pledge collateral daily (based on the daily valuation of the financial asset) on behalf of the Fund with a value approximately equal to the amount of any unrealized gain above a predetermined threshold. Reciprocally, when the Fund has an unrealized loss, the Fund has instructed the custodian to pledge assets of the Fund as collateral with a value approximately equal to the amount of the unrealized loss above a pre-determined threshold. Collateral pledges are monitored and subsequently adjusted if and when the valuations fluctuate, either up or down, by at least the pre-determined threshold amount.
Zero Coupon Securities
The Fund is authorized to invest in zero coupon securities. A zero coupon security does not pay a regular interest coupon to its holders during the life of the security. Income to the holder of the security comes from accretion of the difference between the original purchase price of the security at issuance and the par value of the security at maturity and is effectively paid at maturity. The market prices of zero coupon securities generally are more volatile than the market prices of securities that pay interest periodically.
Multiclass Operations and Allocations
Income and expenses of the Fund that are not directly attributable to a specific class of shares are prorated among the classes based on the relative settled shares of each class. Expenses directly attributable to a class of shares, which presently only include 12b-1 distribution and shareholder service fees, are recorded to the specific class.
Realized and unrealized capital gains and losses of the Fund are prorated among the classes based on the relative net assets of each class.
Indemnifications
Under the Trust’s organizational documents, its officers and trustees are indemnified against certain liabilities arising out of the performance of their duties to the Trust. In addition, in the normal course of business, the Trust enters into contracts that provide general indemnifications to other parties. The Trust’s maximum exposure under these arrangements is unknown as this would involve future claims that may be made against the Trust that have not yet occurred. However, the Trust has not had prior claims or losses pursuant to these contracts and expects the risk of loss to be remote.
Use of Estimates
The preparation of financial statements in conformity with U.S. GAAP requires management to make estimates and assumptions that affect the reported amounts of assets and liabilities at the date of the financial statements and the reported amounts of increases and decreases in net assets from operations during the reporting period. Actual results may differ from those estimates.
2. Fair Value Measurements
Fair value is defined as the price that the Fund would receive upon selling an investment or transferring a liability in an orderly transaction to an independent buyer in the principal or most advantageous market for the investment. A three-tier hierarchy is used to maximize the use of observable market data and minimize the use of unobservable inputs and to establish classification of fair value measurements for disclosure purposes. Observable inputs reflect the assumptions market participants would use in pricing the asset or liability. Observable inputs are based on market data obtained from sources independent of the reporting entity. Unobservable inputs reflect the reporting entity’s own assumptions about the assumptions market participants would use in pricing the asset or liability. Unobservable inputs are based on the best information available in the circumstances. The following is a summary of the three-tiered hierarchy of valuation input levels:
| | |
| Level 1 – | | Inputs are unadjusted and prices are determined using quoted prices in active markets for identical securities. |
| Level 2 – | | Prices are determined using other significant observable inputs (including quoted prices for similar securities, interest rates, prepayment speeds, credit risk, etc.). |
| Level 3 – | | Prices are determined using significant unobservable inputs (including management’s assumptions in determining the fair value of investments). |
The inputs or methodologies used for valuing securities are not an indication of the risks associated with investing in those securities. The following is a summary of the Fund’s fair value measurements as of the end of the reporting period:
| | | | | | | | | | | | | | | | |
| | | | |
| | | Level 1 | | | Level 2 | | | Level 3 | | | Total | |
Long-Term Investments*: | | | | | | | | | | | | | | | | |
Corporate Bonds | | $ | — | | | $ | 5,880,234 | | | $ | — | | | $ | 5,880,234 | |
Capital Preferred Securities | | | — | | | | 50,777 | | | | — | | | | 50,777 | |
$25 Par (or similar) Preferred Securities | | | 201,261 | | | | — | | | | — | | | | 201,261 | |
U.S. Government and Agency Obligations | | | — | | | | 10,081 | | | | — | | | | 10,081 | |
Asset-Backed and Mortgage-Backed Securities | | | — | | | | 930,909 | | | | — | | | | 930,909 | |
Sovereign Debt | | | — | | | | 7,295,040 | | | | — | | | | 7,295,040 | |
Short-Term Investments: | | | | | | | | | | | | | | | | |
Repurchase Agreement | | | — | | | | 1,006,825 | | | | — | | | | 1,006,825 | |
Derivatives: | | | | | | | | | | | | | | | | |
Forward Foreign Currency Exchange Contracts** | | | — | | | | 50,608 | | | | — | | | | 50,608 | |
Credit Default Swaps** | | | — | | | | (4,219 | ) | | | — | | | | (4,219 | ) |
Futures Contracts** | | | 6,108 | | | | — | | | | — | | | | 6,108 | |
Total | | $ | 207,369 | | | $ | 15,220,255 | | | $ | — | | | $ | 15,427,624 | |
| * | Refer to the Fund’s Portfolio of Investments for industry classifications. |
| ** | Represents net unrealized appreciation (depreciation) as reported in the Fund’s Portfolio of Investments. |
Notes to Financial Statements (continued)
The Nuveen funds’ Board of Directors/Trustees is responsible for the valuation process and has delegated the oversight of the daily valuation process to the Adviser’s Valuation Committee. The Valuation Committee, pursuant to the valuation policies and procedures adopted by the Board of Directors/Trustees, is responsible for making fair value determinations, evaluating the effectiveness of the funds’ pricing policies, and reporting to the Board of Directors/Trustees. The Valuation Committee is aided in its efforts by the Adviser’s dedicated Securities Valuation Team, which is responsible for administering the daily valuation process and applying fair value methodologies as approved by the Valuation Committee. When determining the reliability of independent pricing services for investments owned by the funds, the Valuation Committee, among other things, conducts due diligence reviews of the pricing services and monitors the quality of security prices received through various testing reports conducted by the Securities Valuation Team.
The Valuation Committee will consider pricing methodologies it deems relevant and appropriate when making fair value determinations. Examples of possible methodologies include, but are not limited to, multiple of earnings; discount from market of a similar freely traded security; discounted cash-flow analysis; book value or a multiple thereof; risk premium/yield analysis; yield to maturity; and/or fundamental investment analysis. The Valuation Committee will also consider factors it deems relevant and appropriate in light of the facts and circumstances. Examples of possible factors include, but are not limited to, the type of security; the issuer’s financial statements; the purchase price of the security; the discount from market value of unrestricted securities of the same class at the time of purchase; analysts’ research and observations from financial institutions; information regarding any transactions or offers with respect to the security; the existence of merger proposals or tender offers affecting the security; the price and extent of public trading in similar securities of the issuer or comparable companies; and the existence of a shelf registration for restricted securities.
For each portfolio security that has been fair valued pursuant to the policies adopted by the Board of Directors/Trustees, the fair value price is compared against the last available and next available market quotations. The Valuation Committee reviews the results of such testing and fair valuation occurrences are reported to the Board of Directors/Trustees.
3. Derivative Instruments and Hedging Activities
The Fund records derivative instruments at fair value, with changes in fair value recognized on the Statement of Operations, when applicable. Even though the Fund’s investments in derivatives may represent economic hedges, they are not considered to be hedge transactions for financial reporting purposes. For additional information on the derivative instruments in which the Fund was invested during and at the end of the reporting period, refer to the Portfolio of Investments, Financial Statements and Footnote 1 – General Information and Significant Accounting Policies.
The following table presents the fair value of all derivative instruments held by the Fund as of June 30, 2012, the location of these instruments on the Statement of Assets and Liabilities, and the primary underlying risk exposure.
| | | | | | | | | | | | | | |
| | | | | Location on the Statement of Assets and Liabilities | |
Underlying
Risk Exposure | | Derivative
Instrument | | Asset Derivatives | | | Liability Derivatives | |
| | | Location | | Value | | | Location | | Value | |
Foreign Currency
Exchange Rate | | Forward Foreign
Currency Exchange
Contracts | | Unrealized appreciation on
forward foreign currency
exchange contracts | | $ | 165,858 | | | Unrealized depreciation on
forward foreign currency
exchange contracts | | $ | (115,250 | ) |
Interest Rate | | Futures Contracts | | Deposits with brokers for open
futures contracts and
Receivable for variation margin
on futures contracts* | | | 10,002 | | | Deposits with brokers for
open futures contracts and
Receivable for variation
margin on futures
contracts* | | | (3,894 | ) |
Credit | | Swaps | | — | | $ | — | | | Unrealized depreciation on
credit default swaps** | | $ | (4,219 | ) |
Total | | | | | | $ | 175,860 | | | | | $ | (123,363 | ) |
| * | Value represents unrealized appreciation (depreciation) of futures contracts as reported in the Fund’s Portfolio of Investments, and not the deposits with brokers, if any, or the receivable or payable for variation margin presented on the Statement of Assets and Liabilities. |
| ** | Some swap contracts require a counterparty to pay or receive a premium, which is disclosed on the Statement of Assets and Liabilities but is not reflected in the unrealized appreciation (depreciation) presented above. |
The following tables present the amount of net realized gain (loss) and change in net unrealized appreciation (depreciation) recognized for the period December 2, 2011 (commencement of operations) through June 30, 2012, on derivative instruments, as well as the primary risk exposure associated with each.
| | | | |
| Net Realized Gain (Loss) from Forward Foreign Currency Exchange Contracts | | | |
Risk Exposure | | | | |
Foreign Currency Exchange Rate | | $ | 324,366 | |
| | | | |
| Net Realized Gain (Loss) from Futures Contracts | | | |
Risk Exposure | | | | |
Interest Rate | | $ | 2,222 | |
| | | | |
| Net Realized Gain (Loss) from Options Purchased | | | |
Risk Exposure | | | | |
Interest Rate | | $ | (20,867 | ) |
Foreign Currency Exchange Rate | | | (8,430 | ) |
Total | | $ | (29,297 | ) |
| | | | |
| Net Realized Gain (Loss) from Options Written | | | |
Risk Exposure | | | | |
Foreign Currency Exchange Rate | | $ | 2,460 | |
| | | | |
| Net Realized Gain (Loss) from Swaps | | | |
Risk Exposure | | | | |
Credit | | $ | 119,949 | |
| | | | |
| Change in Net Unrealized Appreciation (Depreciation) of Forward Foreign Currency Exchange Contracts | | | |
Risk Exposure | | | | |
Foreign Currency Exchange Rate | | $ | 50,608 | |
| | | | |
| Change in Net Unrealized Appreciation (Depreciation) of Futures Contracts | | | |
Risk Exposure | | | | |
Interest Rate | | $ | 6,108 | |
| | | | |
| Change in Net Unrealized Appreciation (Depreciation) of Swaps | | | |
Risk Exposure | | | | |
Credit | | $ | (4,219 | ) |
4. Fund Shares
Transactions in Fund shares were as follows:
| | | | | | | | | | | | |
| | | | | | | For the period 12/02/11
(commencement of operations)
through 6/30/12 | |
| | | | | | | Shares | | | Amount | |
Shares sold: | | | | | | | | | | | | |
Class A | | | | | | | 14,546 | | | $ | 306,302 | |
Class C | | | | | | | 2,500 | | | | 50,000 | |
Class R3 | | | | | | | 2,500 | | | | 50,000 | |
Class I | | | | | | | 695,643 | | | | 13,915,778 | |
Shares issued to shareholders due to reinvestment of distributions: | | | | | | | | | | | | |
Class A | | | | | | | 93 | | | | 1,966 | |
Class C | | | | | | | — | | | | — | |
Class R3 | | | | | | | — | | | | — | |
Class I | | | | | | | 1 | | | | 12 | |
| | | | | | | | 715,283 | | | | 14,324,058 | |
Shares redeemed: | | | | | | | | | | | | |
Class A | | | | | | | (24 | ) | | | (498 | ) |
Class C | | | | | | | — | | | | — | |
Class R3 | | | | | | | — | | | | — | |
Class I | | | | | | | — | | | | — | |
| | | | | | | | (24 | ) | | | (498 | ) |
Net increase (decrease) | | | | | | | 715,259 | | | $ | 14,323,560 | |
Notes to Financial Statements (continued)
5. Investment Transactions
Purchases and sales (including maturities but excluding short-term investments and derivative transactions, where applicable) during the period December 2, 2011 (commencement of operations) through June 30, 2012, were as follows:
| | | | |
Purchases: | | | | |
Investment securities | | $ | 17,761,037 | |
U.S. Government and agency obligations | | | 13,226,201 | |
Sales and maturities: | | | | |
Investment securities | | | 4,374,423 | |
U.S. Government and agency obligations | | | 12,598,035 | |
Transactions in call options written during the period December 2, 2011 (commencement of operations) through June 30, 2012, were as follows:
| | | | | | | | |
| | | Number of
Contracts | | | Premiums
Received | |
Options outstanding, beginning of period | | | — | | | $ | — | |
Options written | | | 1 | | | | 2,460 | |
Options terminated in closing purchase transactions | | | — | | | | — | |
Options expired | | | (1 | ) | | | (2,460 | ) |
Options outstanding, end of period | | | — | | | $ | — | |
6. Income Tax Information
The following information is presented on an income tax basis. Differences between amounts for financial statement and federal income tax purposes are primarily due to timing differences in recognizing certain gains and losses on investment transactions. To the extent that differences arise that are permanent in nature, such amounts are reclassified within the capital accounts as detailed below. Temporary differences do not require reclassification. Temporary and permanent differences do not impact the net asset values of the Fund.
At June 30, 2012, the cost and unrealized appreciation (depreciation) of investments (excluding investments in derivatives), as determined on a federal income tax basis, were as follows:
| | | | |
Cost of investments | | $ | 15,066,602 | |
Gross unrealized: | | | | |
Appreciation | | | 412,058 | |
Depreciation | | | (103,533 | ) |
Net unrealized appreciation (depreciation) of investments | | $ | 308,525 | |
Permanent differences, primarily due to treatment of notional principal contracts and foreign currency reclassifications resulted in reclassifications among the Fund’s components of net assets at June 30, 2012, the Fund’s tax year end as follows:
| | | | |
Capital paid-in | | $ | (788 | ) |
Undistributed (Over-distribution of) net investment income | | | 332,285 | |
Accumulated net realized gain (loss) | | | (331,497 | ) |
The tax components of undistributed net ordinary income and net long-term capital gains at June 30, 2012, the Fund’s tax year end were as follows:
| | | | |
Undistributed net ordinary income* | | $ | 727,571 | |
Undistributed net long-term capital gains | | | 50,648 | |
| * | Net ordinary income consists of net taxable income derived from dividends, interest and net short-term capital gains, if any. |
| | Undistributed net ordinary income (on a tax basis) has not been reduced for the dividends declared during the period June 1, 2012 through June 30, 2012 and paid on July 2, 2012. |
The tax character of distributions paid during the Fund’s tax year ended June 30, 2012, was designated for purposes of the dividends paid deduction as follows:
| | | | |
| For the Period December 2, 2011 (commencement of operations) through June 30, 2012 | | | |
Distributions from net ordinary income* | | $ | 162,229 | |
Distributions from net long-term capital gains | | | — | |
| * | Net ordinary income consists of net taxable income derived from dividends, interest and net short-term capital gains, if any. |
On December 22, 2010, the Regulated Investment Company Modernization Act of 2010 (the “Act”) was enacted, which changed various technical rules governing the tax treatment of RICs. The changes are generally effective for taxable years beginning after the
date of enactment. One of the more prominent changes addresses capital loss carryforwards. Under the Act, the Fund will be permitted to carry forward capital losses incurred in taxable years beginning after the date of enactment for an unlimited period. However, any losses incurred during those future taxable years will be required to be utilized prior to the losses incurred in pre-enactment taxable years, which carry an expiration date. As a result of this ordering rule, pre-enactment capital loss carryforwards may be more likely to expire unused. Additionally, post-enactment capital loss carryforwards will retain their character as either short-term or long-term capital losses rather than being considered all short-term as permitted under previous regulation.
The Act also contains several provisions aimed at preserving the character of distributions made by a fiscal year RIC during the portion of its taxable year ending after October 31 or December 31, reducing the circumstances under which a RIC might be required to file amended Forms 1099 to restate previously reported distributions.
During the Fund’s tax year ended June 30, 2012, there were no post-enactment capital losses generated.
7. Management Fees and Other Transactions with Affiliates
The Fund’s management fee consists of two components – a fund-level fee, based only on the amount of assets within the Fund, and a complex-level fee, based on the aggregate amount of all eligible fund assets managed by the Adviser. This pricing structure enables Fund shareholders to benefit from growth in the assets within their Fund as well as from growth in the amount of complex-wide assets managed by the Adviser.
The annual fund-level fee for the Fund, payable monthly, is calculated according to the following schedule:
| | | | |
| Average Daily Net Assets | | Fund Level Fee Rate | |
For the first $125 million | | | .4000 | % |
For the next $125 million | | | .3875 | |
For the next $250 million | | | .3750 | |
For the next $500 million | | | .3625 | |
For the next $1 billion | | | .3500 | |
For net assets over $2 billion | | | .3250 | |
The annual complex-level fee for the Fund, payable monthly, is determined by taking the complex-level fee rate, which is based on the aggregate amount of “eligible assets” of all Nuveen funds as set forth in the schedule below, and making, as appropriate, an upward adjustment to that rate based upon the percentage of the particular fund’s assets that are not “eligible assets.” The complex-level fee schedule for the Fund is as follows:
| | | | |
| Complex-Level Asset Breakpoint Level* | | Effective Rate at Breakpoint Level | |
$55 billion | | | .2000 | % |
$56 billion | | | .1996 | |
$57 billion | | | .1989 | |
$60 billion | | | .1961 | |
$63 billion | | | .1931 | |
$66 billion | | | .1900 | |
$71 billion | | | .1851 | |
$76 billion | | | .1806 | |
$80 billion | | | .1773 | |
$91 billion | | | .1691 | |
$125 billion | | | .1599 | |
$200 billion | | | .1505 | |
$250 billion | | | .1469 | |
$300 billion | | | .1445 | |
| * | The complex-level fee is calculated based upon the aggregate daily “eligible assets” of all Nuveen Funds. Eligible assets do not include assets attributable to investments in other Nuveen Funds or assets in excess of $2 billion added to the Nuveen Fund complex in connection with the Adviser’s assumption of the management of the former First American Funds effective January 1, 2011. Eligible assets include closed-end fund assets managed by the Adviser that are attributable to financial leverage. For these purposes, financial leverage includes the closed-end funds’ use of preferred stock and borrowings and certain investments in the residual interest certificates (also called inverse floating rate securities) in tender option bond (TOB) trusts, including the portion of assets held by the TOB trust that has been effectively financed by the trust’s issuance of floating rate securities, subject to an agreement by the Adviser as to certain funds to limit the amount of such assets for determining eligible assets in certain circumstances. As of June 30, 2012, the complex-level fee rate for the Fund was .1731%. |
The management fee compensates the Adviser for overall investment advisory and administrative services and general office facilities. The Adviser is responsible for the Fund’s overall investment strategy and asset allocation decisions. The Adviser has entered into a sub-advisory agreement with the Sub-Adviser under which the Sub-Adviser manages the investment portfolios of the Fund. The Sub-Adviser is compensated for its services to the Fund from the management fees paid to the Adviser.
The Adviser has agreed to waive fees and/or reimburse expenses (“Expense Cap”) through October 31, 2014, so that total annual Fund operating expenses (excluding 12b-1 distribution and/or service fees, interest expenses, taxes, fees incurred in acquiring and disposing of portfolio securities and extraordinary expenses) do not exceed .75% of the average daily net assets of any class of Fund shares. The Adviser may also voluntarily reimburse expenses from time to time. Voluntarily reimbursements may be terminated at any time at the Adviser’s discretion.
Notes to Financial Statements (continued)
The Trust pays no compensation directly to those of its trustees who are affiliated with the Adviser or to its officers, all of whom receive remuneration for their services to the Trust from the Adviser or its affiliates. The Board of Trustees has adopted a deferred compensation plan for independent trustees that enable trustees to elect to defer receipt of all or a portion of the annual compensation they are entitled to receive from certain Nuveen-advised funds. Under the plan, deferred amounts are treated as though equal dollar amounts had been invested in shares of select Nuveen-advised funds.
During the period December 2, 2011 (commencement of operations) through June 30, 2012, Nuveen Securities, LLC. (the “Distributor”), a wholly-owned subsidiary of Nuveen, collected sales charges on purchases of Class A Shares, the majority of which were paid out as concessions to financial intermediaries as follows:
| | | | |
Sales charges collected (Unaudited) | | $ | 474 | |
Paid to financial intermediaries (Unaudited) | | | 425 | |
The Distributor also received 12b-1 service fees on Class A Shares, substantially all of which were paid to compensate financial intermediaries for providing services to shareholders relating to their investments.
During the period December 2, 2011 (commencement of operations) through June 30, 2012, the Distributor compensated financial intermediaries directly with commission advances at the time of purchase as follows:
| | | | |
Commission advances (Unaudited) | | $ | — | |
To compensate for commissions advanced to financial intermediaries, all 12b-1 service and distribution fees collected on Class C Shares during the first year following a purchase were retained by the Distributor. During the period December 2, 2011 (commencement of operations) through June 30, 2012, the Distributor retained such 12b-1 fees as follows:
| | | | |
12b-1 fees retained (Unaudited) | | $ | 303 | |
The remaining 12b-1 fees charged to the Fund were paid to compensate financial intermediaries for providing services to shareholders relating to their investments.
The Distributor also collected and retained CDSC on share redemptions during the period December 2, 2011 (commencement of operations) through June 30, 2012, as follows:
| | | | |
CDSC retained (Unaudited) | | $ | — | |
At June 30, 2012, Nuveen owned 2,500, 2,500, 2,500 and 692,500 Shares of Class A, C, R3 and I, respectively, of the Fund.
8. New Accounting Pronouncements
Financial Accounting Standards Board (“FASB”) Balance Sheet (Topic 210): Disclosures about Offsetting Assets and Liabilities
In December 2011, the FASB issued Accounting Standards Update (“ASU”) No. 2011-11 (“ASU No. 2011-11”)to enhance disclosures about financial instruments and derivative instruments that are subject to offsetting (“netting”) on the Statement of Assets and Liabilities. This information will enable users of the entity’s financial statements to evaluate the effect or potential effect of netting arrangements on the entity’s financial position. ASU No. 2011-11 is effective prospectively during interim or annual periods beginning on or after January 1, 2013. At this time, management is evaluating the implications of this guidance and the impact it will have to the financial statements amounts and footnote disclosures, if any.
Trustees and Officers (Unaudited)
The management of the Funds, including general supervision of the duties performed for the Funds by the Adviser, is the responsibility of the Board of Trustees of the Funds. The number of trustees of the Funds is currently set at ten. None of the trustees who are not “interested” persons of the Funds (referred to herein as “independent trustees”) has ever been a director or employee of, or consultant to, Nuveen or its affiliates. The names and business addresses of the trustees and officers of the Funds, their principal occupations and other affiliations during the past five years, the number of portfolios each oversees and other directorships they hold are set forth below.
The Funds’ Statement of Additional Information (“SAI”) includes more information about the trustees. To request a free copy, call Nuveen Investments at (800) 257-8787 or visit the Funds’ website at www.nuveen.com.
| | | | | | | | |
Name, Birthdate and Address | | Position(s) Held with the Funds | | Year First Elected or Appointed (1) | | Principal Occupation(s) Including other Directorships During Past 5 Years | | Number of Portfolios in Fund Complex Overseen by Trustee |
| | |
| Independent Trustees: | | | | |
Robert P. Bremner 8/22/40 333 W. Wacker Drive Chicago, IL 60606 | | Chairman of the Board and Trustee | | 1996 | | Private Investor and Management Consultant; Treasurer and Director, Humanities Council of Washington, D.C.; Board Member, Independent Directors Council affiliated with the Investment Company Institute. | | 220 |
Jack B. Evans 10/22/48 333 W. Wacker Drive Chicago, IL 60606 | | Trustee | | 1999 | | President, The Hall-Perrine Foundation, a private philanthropic corporation (since 1996); Director and Chairman, United Fire Group, a publicly held company; member of the Board of Regents for the State of Iowa University System; Director, Source Media Group; Life Trustee of Coe College and the Iowa College Foundation; formerly, Director, Alliant Energy; formerly, Director, Federal Reserve Bank of Chicago; formerly, President and Chief Operating Officer, SCI Financial Group, Inc., a regional financial services firm. | | 220 |
William C. Hunter 3/6/48 333 W. Wacker Drive Chicago, IL 60606 | | Trustee | | 2004 | | Dean Emeritus (since June 30, 2012), formerly, Dean, Tippie College of Business, University of Iowa (2006-2012); Director (since 2004) of Xerox Corporation; Director (since 2005), and President (since July 2012) Beta Gamma Sigma International Honor Society; Director of Wellmark, Inc. (since 2009); formerly, Dean and Distinguished Professor of Finance, School of Business at the University of Connecticut (2003-2006); previously, Senior Vice President and Director of Research at the Federal Reserve Bank of Chicago (1995-2003); formerly, Director (1997-2007), Credit Research Center at George Washington University. | | 220 |
David J. Kundert 10/28/42 333 W. Wacker Drive Chicago, IL 60606 | | Trustee | | 2005 | | Director, Northwestern Mutual Wealth Management Company; retired (since 2004) as Chairman, JPMorgan Fleming Asset Management, President and CEO, Banc One Investment Advisors Corporation, and President, One Group Mutual Funds; prior thereto, Executive Vice President, Banc One Corporation and Chairman and CEO, Banc One Investment Management Group; Member, Board of Regents, Luther College; member of the Wisconsin Bar Association; member of Board of Directors, Friends of Boerner Botanical Gardens; member of Board of Directors and Chair of Investment Committee, Greater Milwaukee Foundation. | | 220 |
William J. Schneider 9/24/44 333 W. Wacker Drive Chicago, IL 60606 | | Trustee | | 1996 | | Chairman of Miller-Valentine Partners Ltd., a real estate investment company; formerly, Senior Partner and Chief Operating Officer (retired 2004) of Miller-Valentine Group; member, University of Dayton Business School Advisory Council; member, Mid-America Health System Board; formerly, member and chair, Dayton Philharmonic Orchestra Association; formerly, member, Business Advisory Council, Cleveland Federal Reserve Bank. | | 220 |
Judith M. Stockdale 12/29/47 333 W. Wacker Drive Chicago, IL 60606 | | Trustee | | 1997 | | Executive Director, Gaylord and Dorothy Donnelley Foundation (since 1994); prior thereto, Executive Director, Great Lakes Protection Fund (1990-1994). | | 220 |
Carole E. Stone 6/28/47 333 W. Wacker Drive Chicago, IL 60606 | | Trustee | | 2007 | | Director, Chicago Board Options Exchange (since 2006); Director, C2 Options Exchange, Incorporated (since 2009); formerly, Commissioner, New York State Commission on Public Authority Reform (2005-2010); formerly, Chair, New York Racing Association Oversight Board (2005-2007). | | 220 |
Trustees and Officers (Unaudited) (continued)
| | | | | | | | |
Name, Birthdate and Address | | Position(s) Held with the Funds | | Year First Elected or Appointed (1) | | Principal Occupation(s) During Past Five Years | | Number of Portfolios in Fund Complex Overseen by Trustee |
Virginia L. Stringer 8/16/44 333 West Wacker Drive Chicago, IL 60606 | | Trustee | | 2011 | | Board Member, Mutual Fund Directors Forum; former governance consultant and non-profit board member; former Owner and President, Strategic Management Resources, Inc. a management consulting firm; former Member, Governing Board, Investment Company Institute’s Independent Directors Council; previously, held several executive positions in general management, marketing and human resources at IBM and The Pillsbury Company; Independent Director, First American Fund Complex (1987-2010) and Chair (1997-2010). | | 220 |
Terence J. Toth 9/29/59 333 W. Wacker Drive Chicago, IL 60606 | | Trustee | | 2008 | | Director, Legal & General Investment Management America, Inc. (since 2008); Managing Partner, Promus Capital (since 2008); formerly, CEO and President, Northern Trust Global Investments (2004-2007); Executive Vice President, Quantitative Management & Securities Lending (2000-2004); prior thereto, various positions with Northern Trust Company (since 1994); member: Goodman Theatre Board (since 2004), Chicago Fellowship Board (since 2005), Catalyst Schools of Chicago Board (since 2008); Mather Foundation Board (since 2012) and a member of its investment committee; formerly, member: Northern Trust Mutual Funds Board (2005-2007), Northern Trust Global Investments Board (2004-2007), Northern Trust Japan Board (2004-2007), Northern Trust Securities Inc. Board (2003-2007) and Northern Trust Hong Kong Board (1997-2004). | | 220 |
| | |
| Interested Trustee: | | | | |
John P. Amboian (2) 6/14/61 333 W. Wacker Drive Chicago, IL 60606 | | Trustee | | 2008 | | Chief Executive Officer and Chairman (since 2007) and Director (since 1999) of Nuveen Investments, Inc., formerly, President (1999-2007); Chief Executive Officer (since 2007) of Nuveen Investments Advisers Inc.; Director (since 1998) formerly, Chief Executive Officer (2007-2010) of Nuveen Fund Advisors, Inc. | | 220 |
Name, Birthdate and Address | | Position(s) Held with the Funds | | Year First Elected or Appointed (3) | | Principal Occupation(s) During Past 5 Years | | Number of Portfolios in Fund Complex Overseen by Officer |
| | |
| Officers of the Funds: | | | | |
Gifford R. Zimmerman 9/9/56 333 W. Wacker Drive Chicago, IL 60606 | | Chief Administrative Officer | | 1988 | | Managing Director (since 2002), Assistant Secretary of Nuveen Securities, LLC; Managing Director (since 2004) and Assistant Secretary (since 1994) of Nuveen Investments, Inc.; Managing Director (since 2002), Assistant Secretary (since 1997) and Co-General Counsel (since 2011) of Nuveen Fund Advisors, Inc.; Managing Director, Assistant Secretary and Associate General Counsel of Nuveen Asset Management, LLC (since 2011); Managing Director, Associate General Counsel and Assistant Secretary of Symphony Asset Management LLC (since 2003); Vice President and Assistant Secretary of NWQ Investment Management Company, LLC (since 2002), Nuveen Investments Advisers Inc. (since 2002), Santa Barbara Asset Management, LLC (since 2006) and of Winslow Capital Management Inc. (since 2010); Chief Administrative Officer and Chief Compliance Officer (since 2006) of Nuveen Commodities Asset Management, LLC; Chartered Financial Analyst. | | 220 |
Margo L. Cook 4/11/64 333 W. Wacker Drive Chicago, IL 60606 | | Vice President | | 2009 | | Executive Vice President (since 2008) of Nuveen Investments, Inc. and of Nuveen Fund Advisors, Inc. (since 2011); Managing Director – Investment Services of Nuveen Commodities Asset Management, LLC (since August 2011) previously, Head of Institutional Asset Management (2007-2008) of Bear Stearns Asset Management; Head of Institutional Asset Management (1986-2007) of Bank of NY Mellon; Chartered Financial Analyst. | | 220 |
| | | | | | | | |
Name, Birthdate and Address | | Position(s) Held with the Funds | | Year First Elected or Appointed (3) | | Principal Occupation(s) During Past 5 Years | | Number of Portfolios in Fund Complex Overseen by Officer |
Lorna C. Ferguson 10/24/45 333 W. Wacker Drive Chicago, IL 60606 | | Vice President | | 1998 | | Managing Director (since 2005) of Nuveen Fund Advisors, Inc. and Nuveen Securities, LLC (since 2004). | | 220 |
Stephen D. Foy 5/31/54 333 W. Wacker Drive Chicago, IL 60606 | | Vice President and Controller | | 1998 | | Senior Vice President (since 2010), formerly, Vice President (2005-2010) and Funds Controller of Nuveen Securities, LLC; Vice President of Nuveen Fund Advisors, Inc.; Chief Financial Officer of Nuveen Commodities Asset Management, LLC (since 2010); Certified Public Accountant. | | 220 |
Scott S. Grace 8/20/70 333 W. Wacker Drive Chicago, IL 60606 | | Vice President and Treasurer | | 2009 | | Managing Director, Corporate Finance & Development, Treasurer (since 2009) of Nuveen Securities, LLC; Managing Director and Treasurer (since 2009) of Nuveen Fund Advisors, Inc., Nuveen Investments Advisers, Inc., Nuveen Investments Holdings Inc. and (since 2011) Nuveen Asset Management, LLC; Vice President and Treasurer of NWQ Investment Management Company, LLC, Tradewinds Global Investors, LLC, Symphony Asset Management LLC and Winslow Capital Management, Inc.; Vice President of Santa Barbara Asset Management, LLC; formerly, Treasurer (2006-2009), Senior Vice President (2008-2009), previously, Vice President (2006-2008) of Janus Capital Group, Inc.; formerly, Senior Associate in Morgan Stanley’s Global Financial Services Group (2000-2003); Chartered Accountant Designation. | | 220 |
Walter M. Kelly 2/24/70 333 W. Wacker Drive Chicago, IL 60606 | | Chief Compliance Officer and Vice President | | 2003 | | Senior Vice President (since 2008) and Assistant Secretary (since 2003) of Nuveen Fund Advisors, Inc; Senior Vice President (since 2008) of Nuveen Investments Holdings, Inc; formerly, Senior Vice President (2008-2011) of Nuveen Securities, LLC. | | 220 |
Tina M. Lazar 8/27/61 333 W. Wacker Drive Chicago, IL 60606 | | Vice President | | 2002 | | Senior Vice President (since 2010), formerly, Vice President (2005-2010) of Nuveen Fund Advisors, Inc. | | 220 |
Name, Birthdate and Address | | Position(s) Held with the Funds | | Year First Elected or Appointed (3) | | Principal Occupation(s) Including other Directorships During Past 5 Years | | Number of Portfolios in Fund Complex Overseen by Officer |
Kevin J. McCarthy 3/26/66 333 W. Wacker Drive Chicago, IL 60606 | | Vice President and Secretary | | 2007 | | Managing Director and Assistant Secretary (since 2008), formerly, Vice President (2007-2008), Nuveen Securities, LLC; Managing Director (since 2008), Assistant Secretary (since 2007) and Co-General Counsel (since 2011) of Nuveen Fund Advisors, Inc.; Managing Director, Assistant Secretary and Associate General Counsel (since 2011) of Nuveen Asset Management, LLC; Managing Director (since 2008), and Assistant Secretary, Nuveen Investment Holdings, Inc.; Vice President (since 2007) and Assistant Secretary of Nuveen Investments Advisers Inc., NWQ Investment Management Company, LLC, Tradewinds Global Investors LLC, NWQ Holdings, LLC, Symphony Asset Management LLC, Santa Barbara Asset Management, LLC, and of Winslow Capital Management, Inc. (since 2010); Vice President and Secretary (since 2010) of Nuveen Commodities Asset Management, LLC; prior thereto, Partner, Bell, Boyd & Lloyd LLP (1997-2007). | | 220 |
Kathleen L. Prudhomme 3/30/53 901 Marquette Avenue Minneapolis, MN 55402 | | Vice President and Assistant Secretary | | 2011 | | Managing Director, Assistant Secretary and Co-General Counsel (since 2011) of Nuveen Fund Advisors, Inc.; Managing Director, Assistant Secretary and Associate General Counsel (since 2011) of Nuveen Asset Management, LLC; Managing Director and Assistant Secretary (since 2011) of Nuveen Securities, LLC; formerly, Deputy General Counsel, FAF Advisors, Inc. (2004-2010). | | 220 |
Trustees and Officers (Unaudited) (continued)
| | | | | | | | |
Name, Birthdate and Address | | Position(s) Held with the Funds | | Year First Elected or Appointed (3) | | Principal Occupation(s) Including other Directorships During Past 5 Years | | Number of Portfolios in Fund Complex Overseen by Officer |
Jeffery M. Wilson 3/13/56 333 West Wacker Drive Chicago, IL 60606 | | Vice President | | 2011 | | Senior Vice President of Nuveen Securities, LLC (since 2011); formerly, Senior Vice President of FAF Advisors, Inc. (2000-2010). | | 102 |
| (1) | Trustees serve an indefinite term until his/her successor is elected or appointed. The year first elected or appointed represents the year in which the trustee was first elected or appointed to any fund in the Nuveen Fund Complex. |
| (2) | Mr. Amboian is an interested trustee because of his position with Nuveen Investments, Inc. and certain of its subsidiaries, which are affiliates of the Nuveen Funds. |
| (3) | Officers serve one year terms through August of each year. The year first elected or appointed represents the year in which the officer was first elected or appointed to any fund in the Nuveen Fund Complex. |
Annual Investment Management Agreement Approval Process
(Unaudited)
The Board of Trustees (the “Board,” and each Trustee, a “Board Member”) of the Nuveen Global Total Return Bond Fund (the “Fund”), including the Board Members who are not parties to its advisory or sub-advisory agreements or “interested persons” of any such parties (the “Independent Board Members”), is responsible for approving advisory arrangements for the Fund. At a meeting held on November 14-16, 2011 (the “Meeting”), the Board Members, including the Independent Board Members, considered and approved the investment management agreement (the “Investment Management Agreement”) between the Fund and Nuveen Fund Advisors, Inc. (the “Advisor”) and the investment sub-advisory agreement (the “Sub-Advisory Agreement”) between the Advisor and Nuveen Asset Management, LLC (the “Sub-Adviser”), on behalf of the Fund. The Advisor and the Sub-Adviser are each hereafter a “Fund Adviser.” The Investment Management Agreement and the Sub-Advisory Agreement are each hereafter an “Advisory Agreement.”
To assist the Board in its evaluation of an Advisory Agreement with a Fund Adviser at the Meeting, the Independent Board Members had received, in adequate time in advance of the Meeting or at prior meetings, materials which outlined, among other things:
| | • | | the nature, extent and quality of services expected to be provided by the Fund Adviser; |
| | • | | the organization of the Fund Adviser, including the responsibilities of various departments and key personnel; |
| | • | | the expertise and background of the Fund Adviser with respect to the Fund’s investment strategy; |
| | • | | certain performance-related information (as described below); |
| | • | | the profitability of Nuveen Investments, Inc. (“Nuveen”) (which incorporated Nuveen’s wholly-owned affiliated sub-advisers); |
| | • | | the proposed management fees of the Fund Adviser, including comparisons of such fees with the management fees of comparable funds; |
| | • | | the expected expenses of the Fund, including comparisons of the Fund’s expected expense ratio with the expense ratios of comparable funds; and |
| | • | | the soft dollar practices of the Fund Adviser, if any. |
At the Meeting, the Advisor made a presentation to and responded to questions from the Board. During the Meeting, the Independent Board Members also met privately with their legal counsel to review the Board’s duties under the Investment Company Act of 1940 (the “1940 Act”), the general principles of state law in reviewing and approving advisory contracts, the standards used by courts in determining whether investment company boards of directors have fulfilled their duties, factors to be considered in voting on advisory contracts and an adviser’s fiduciary duty with respect to advisory agreements and compensation. It is with this background that the Independent Board Members considered the Advisory Agreements with the Fund Advisers for the Fund. As outlined in more detail below, the Independent Board Members considered all factors they believed relevant with respect to the Fund, including the following: (a) the nature, extent and quality of the services to be provided by the Fund Adviser; (b) investment performance, as described below; (c) the advisory fees and costs of the services to be provided to the Fund and the profitability of Nuveen and its affiliates; (d) the extent of any economies of scale; and (e) any benefits derived by the Fund Advisers from the relationship with the Fund.
A. Nature, Extent and Quality of Services
The Independent Board Members considered the nature, extent and quality of the respective Fund Adviser’s services, including advisory services and administrative services. As the Advisor and the Sub-Adviser already serve as adviser and sub-adviser, respectively, to other Nuveen funds overseen by the Board Members, the Board has a good understanding of each such Fund Adviser’s organization, operations and personnel. As the Independent Board Members meet regularly throughout the year to oversee the Nuveen funds, including funds currently advised by the Fund Advisers, the Independent Board Members have relied upon their knowledge from their meetings and any other interactions throughout the year of the respective Fund Adviser and its services in evaluating the Advisory Agreements.
At the Meeting and at prior meetings, the Independent Board Members reviewed materials outlining, among other things, the respective Fund Adviser’s organization and business; the types of services that such Fund Adviser or its affiliates provide to the Nuveen funds and are expected to provide to the Fund; and the experience of the respective Fund Adviser with applicable investment strategies. Further, the Independent Board Members have evaluated the background and experience of the Fund Adviser’s investment personnel.
In addition to advisory services, the Independent Board Members considered the quality and extent of administrative or other non-advisory services to be provided. In this regard, the Advisor is expected to provide the Fund with such administrative and other services (exclusive of, and in addition to, any such services provided by others for the Fund) and officers and other personnel as are necessary for the operations of the Fund. In addition to investment management services, the Advisor and its affiliates will provide the Fund with a wide range of services, including, among other things, product management, investment services (such as oversight of investment policies and procedures, risk management, and pricing), fund administration, oversight of service providers, shareholder services, administration of Board relations, regulatory and portfolio compliance and legal support. The Independent Board Members also recognized that the Advisor would oversee the Sub-Adviser.
Annual Investment Management Agreement Approval Process
(Unaudited) (continued)
In evaluating the services of the Sub-Adviser, the Independent Board Members noted that the Sub-Advisory Agreement was essentially an agreement for portfolio management services only and the Sub-Adviser was not expected to supply other significant administrative services to the Fund. In addition, the Board Members recognized the Sub-Adviser’s experience and established philosophy and process.
Based on their review, the Independent Board Members found that, overall, the nature, extent and quality of services expected to be provided to the Fund under each Advisory Agreement were satisfactory.
B. Investment Performance
The Fund was new and therefore did not have its own performance history. However, the Independent Board Members are familiar with the Sub-Adviser’s track record in managing fixed income strategies as well as with the performance records of other Nuveen funds advised by the Advisor and sub-advised by the Sub-Adviser, including the Nuveen Total Return Bond Fund (the “Total Return Fund”) (currently, the Nuveen Strategic Income Fund), a domestic-oriented variation of the Fund. In this regard, the Independent Board Members were provided with performance information for the Total Return Fund, including returns for the one-year, three-year, five-year and ten-year periods, and the period since inception, in each case ending September 30, 2011.
C. Fees, Expenses and Profitability
1. Fees and Expenses
In evaluating the management fees and expenses that the Fund was expected to bear, the Independent Board Members considered, among other things, the Fund’s proposed management fee structure, the rationale for its proposed fee levels, and its expected expense ratios in absolute terms as well as compared with the fees and expense ratios of comparable funds.
The Independent Board Members reviewed, among other things, the management fees and expense ratios of various other unaffiliated funds classified as global income funds. In this regard, the Independent Board Members noted that, for the Fund, the proposed gross management fee is at, and the net expense ratio is slightly below, the medians for this peer set.
In addition, the Independent Board Members considered the fund-level breakpoint schedule and the complex-wide breakpoint schedule (described in further detail below) and any applicable fee waivers and expense reimbursements expected to be provided. Based on their review of the fee and expense information provided, the Independent Board Members determined that the Fund’s management fees were reasonable in light of the nature, extent and quality of services to be provided to the Fund.
2. Comparisons with the Fees of Other Clients
Due to their experience with other Nuveen funds, the Board Members were familiar with the fees the Advisor assesses to other clients, including separately managed accounts (both retail and institutional accounts), foreign investment funds offered by Nuveen and funds that are not offered by Nuveen but are sub-advised by one of Nuveen’s investment management teams. In evaluating the comparisons of fees, the Independent Board Members have noted, at the Meeting or at prior meetings, that the fee rates charged to a fund (such as the Fund) and charged to other clients vary, among other things, because of the different services involved and the additional regulatory and compliance requirements associated with registered investment companies, such as the Fund. Accordingly, the Independent Board Members have considered the differences in the product types, including, but not limited to, the services to be provided, the structure and operations, product distribution and costs thereof, portfolio investment policies, investor profiles, account sizes and regulatory requirements. The Independent Board Members have noted, in particular, that the range of services as described above to be provided to a fund (such as the Fund) is much more extensive than that provided to separately managed accounts. Given the inherent differences in the products, particularly the extensive services to be provided to the Fund, the Independent Board Members believe such facts justify the different levels of fees. In considering the advisory fees of the Sub-Adviser, the Independent Board Members are familiar with the pricing schedule or fees the Sub-Adviser charges for similar investment management services for other Nuveen funds.
3. Profitability of Fund Advisers
In conjunction with its review of fees at prior meetings, the Independent Board Members have considered the profitability of Nuveen for its advisory activities (which incorporated Nuveen’s wholly-owned affiliated sub-advisers) and its financial condition. At the Meeting or prior meetings, the Independent Board Members reviewed the revenues and expenses of Nuveen’s advisory activities, the allocation methodology used in preparing the profitability data and an analysis of the key drivers behind the changes in revenues and expenses that impacted profitability. They also reviewed financial statements as of June 30, 2011 and certain other financial information pertaining to Nuveen. The Independent Board Members have also considered, at the Meeting or at prior meetings, Nuveen’s revenues for advisory activities, expenses, and profit margin compared to that of various unaffiliated management firms with similar amounts of assets under management and relatively comparable asset composition prepared by Nuveen.
In reviewing profitability, the Independent Board Members have recognized the subjective nature of determining profitability, which may be affected by numerous factors, including the allocation of expenses. Further, the Independent Board Members have recognized the difficulties in making comparisons as the profitability of other advisers generally is not publicly available and the profitability information that is available for certain advisers or management firms may not be representative of the industry and
may be affected by, among other things, the adviser’s particular business mix, capital costs, types of funds managed and expense allocations. Notwithstanding the foregoing, the Independent Board Members reviewed Nuveen’s methodology and assumptions for allocating expenses across product lines to determine profitability. In reviewing profitability, the Independent Board Members recognized Nuveen’s investment in its fund business. Based on their review, the Independent Board Members concluded that Nuveen’s level of profitability for its advisory activities was reasonable in light of the services to be provided.
In evaluating the reasonableness of the compensation, the Independent Board Members also considered any other amounts expected to be paid to a Fund Adviser as well as any indirect benefits (such as soft dollar arrangements, if any) the respective Fund Adviser and its affiliates are expected to receive that are directly attributable to their management of the Fund, if any. See Section E below for additional information on indirect benefits a Fund Adviser may receive as a result of its relationship with the Fund. Based on their review of the overall fee arrangements of the Fund, the Independent Board Members determined that the advisory fees and expected expenses of the Fund were reasonable.
D. Economies of Scale and Whether Fee Levels Reflect These Economies of Scale
With respect to economies of scale, the Independent Board Members have recognized the potential benefits resulting from the costs of a fund being spread over a larger asset base, although economies of scale are difficult to measure and predict with precision, particularly on a fund-by-fund basis. The Independent Board Members therefore considered whether the Fund could be expected to benefit from any economies of scale. One method to help ensure that shareholders share in these benefits is to include breakpoints in the advisory fee schedule. Generally, management fees for funds in the Nuveen complex are comprised of a fund-level component and a complex-level component. Accordingly, the Independent Board Members received and reviewed the schedule of proposed advisory fees for the Fund, including fund-level breakpoints thereto.
In addition to fund-level advisory fee breakpoints, the Board also considered the Fund’s complex-wide fee arrangement. Pursuant to the complex-wide fee arrangement, the fees of the funds in the Nuveen complex, including the Fund, are generally reduced as the assets in the fund complex reach certain levels. In evaluating the complex-wide fee arrangement, the Independent Board Members have considered that the complex-wide fee arrangement seeks to provide the benefits of economies of scale to fund shareholders when total fund complex assets increase, even if assets of a particular fund are unchanged or have decreased. The approach reflects the notion that some of Nuveen’s costs are attributable to services provided to all its funds in the complex and therefore all funds benefit if these costs are spread over a larger asset base. Based on their review, the Independent Board Members concluded that the breakpoint schedules and complex-wide fee arrangement were acceptable and reflect economies of scale to be shared with the Fund’s shareholders when assets under management increase.
E. Indirect Benefits
In evaluating fees, the Independent Board Members also considered information regarding potential “fall out” or ancillary benefits that a Fund Adviser or its affiliates may receive as a result of its relationship with the Fund. In this regard, the Independent Board Members considered, among other things, any sales charges, distribution fees and shareholder services fees expected to be received and retained by the Fund’s principal underwriter, an affiliate of the Advisor, including fees to be received pursuant to any 12b-1 plan.
In addition to the above, the Independent Board Members considered whether the Fund Advisers will receive any benefits from soft dollar arrangements whereby a portion of the commissions paid by the Fund for brokerage may be used to acquire research that may be useful to a Fund Adviser in managing the assets of the Fund and other clients. The Independent Board Members recognized that each of the Fund Advisers has authority to pay a higher commission in return for brokerage and research services if it determines in good faith that the commission paid is reasonable in relation to the value of the brokerage and research services provided. Nevertheless, the Independent Board Members noted that commissions are generally not paid in connection with fixed income securities transactions which are typically executed on a principal basis.
Based on their review, the Independent Board Members concluded that any indirect benefits received by a Fund Adviser as a result of its relationship with the Fund were reasonable and within acceptable parameters.
F. Approval
The Independent Board Members did not identify any single factor discussed previously as all-important or controlling. The Board Members, including a majority of the Independent Board Members, concluded that the terms of the Investment Management Agreement and Sub-Advisory Agreement were fair and reasonable, that the respective Fund Adviser’s fees are reasonable in light of the services to be provided to the Fund and that the Investment Management Agreement and Sub-Advisory Agreement should be and were approved on behalf of the Fund.
Notes
Notes
Glossary of Terms Used in this Report
Asset-Backed Securities (ABS): Securities whose value and income payments are derived from and collateralized by a specific pool of underlying assets. The pool of assets typically is a group of small and/or illiquid assets that may be difficult to sell individually. The underlying pools of asset-backed securities often include payments from credit cards, auto loans or mortgage loans.
Barclays Global Aggregate Unhedged Bond Index: An index that provides a broad-based measure of the global investment-grade fixed-rate debt markets. Index returns assume reinvestment of distributions, but do not include the effects of any applicable sales charges or management fees.
Commercial Mortgage-Backed Securities (CMBS): Commercial mortgage-backed securities are backed by cash flows of a mortgage or pool of mortgages on commercial real estate. CMBS generally are structured to provide protection to the senior class investors against potential losses on the underlying mortgage loans. CMBS are typically characterized by the following: i) loans on multi-family housing, non-residential property, ii) payments based on the amortization schedule of 25 - 30 years with a balloon payment due usually after 10 years, and iii) restrictions on prepayments.
Duration: A measure of the price sensitivity of a security or fund to changes in prevailing interest rates. The longer the duration, the more price sensitivity to interest rate movements in either direction.
Lipper Global Income Funds Classification Average: Represents the average annualized returns for all reporting funds in the Lipper Global Income Funds Classification. Lipper returns account for the effects of management fees and assume reinvestment of distributions, but do not reflect any applicable sales charge.
Mortgage-Backed Securities (MBS): Mortgage-backed securities (MBS) are bonds backed by pools of mortgages, usually with similar characteristics, and which return principal and interest in each payment. MBS are composed of residential mortgages (RMBS) or commercial mortgages (CMBS). RMBS are further divided into agency RMBS and non-agency RMBS, depending on the issuer.
Net Asset Value (NAV): The net market value of all securities held in a portfolio.
Net Asset Value (NAV) Per Share: The market value of one share of a mutual fund or closed-end fund. For a Fund, the NAV is calculated daily by taking the Fund’s total assets (securities, cash, and accrued earnings), subtracting the Fund’s liabilities, and dividing by the number of shares outstanding.
Residential Mortgage-Backed Securities (RMBS): Residential mortgage-backed securities are securities the payments on which depend primarily on the cash flow from residential mortgage loans made to borrowers that are secured by residential real estate. RMBS consist of agency and non-agency RMBS. Agency RMBS have agency guarantees that assure investors that they will receive timely payment of interest and principal, regardless of delinquency or default rates on the underlying loans. Agency RMBS include securities issued by the Government National Mortgage Association, the Federal National Mortgage Association and the Federal Home Loan Mortgage Corporation, and other federal agencies, or issues guaranteed by them. Non-agency RMBS do not have agency guarantees. Non-agency RMBS have credit enhancement built into the structure to shield investors from borrower delinquencies. The spectrum of non-agency residential mortgage loans includes traditional jumbo loans (prime), alternative-A loans (Alt-A), and home equity loans (sub-prime).
Tax Equalization: The practice of treating a portion of the distribution made to a redeeming shareholder, which represents his proportionate part of undistributed net investment income and capital gain as a distribution for tax purposes. Such amounts are referred to as the equalization debits (or payments) and will be considered a distribution to the shareholder of net investment income and capital gain for calculation of the Fund’s dividends paid deduction.
Additional Fund Information
Fund Manager
Nuveen Fund Advisors, Inc.
333 West Wacker Drive
Chicago, IL 60606
Sub-Adviser
Nuveen Asset Management, LLC
333 West Wacker Drive
Chicago, IL 60606
Legal Counsel
Chapman and Cutler LLP
Chicago, IL
Independent Registered Public Accounting Firm
PricewaterhouseCoopers LLP
Chicago, IL
Custodian
State Street Bank & Trust Company
Boston, MA
Transfer Agent and Shareholder Services
Boston Financial
Data Services, Inc.
Nuveen Investor Services
P.O. Box 8530
Boston, MA 02266-8530
(800) 257-8787
Distribution Information: The following federal income tax information is provided with respect to the Fund’s distributions paid during the taxable year ended June 30, 2012. Nuveen Global Total Return Fund hereby designates 54% (or the maximum amount eligible) of ordinary income distributions as Interest-Related Dividends as defined in Internal Revenue Code Section 871(k) for the taxable year ended June 30, 2012.
Quarterly Portfolio of Investments and Proxy Voting information: You may obtain (i) the Fund’s quarterly portfolio of investments, (ii) information regarding how the Fund voted proxies relating to portfolio securities held during the most recent twelve-month period ended June 30, and (iii) a description of the policies and procedures that the Fund used to determine how to vote proxies relating to portfolio securities without charge, upon request, by calling Nuveen Investments at (800) 257-8787 or on Nuveen’s website at www.nuveen.com.
You may also obtain this and other Fund information directly from the Securities and Exchange Commission (SEC). The SEC may charge a copying fee for this information. Visit the SEC on-line at http://www.sec.gov or in person at the SEC’s Public Reference Room in Washington, D.C. Call the SEC at (202) 942-8090 for room hours and operation. You may also request Fund information by sending an e-mail request to publicinfo@sec.gov or by writing to the SEC’s Public Reference Section at 100 F Street NE, Washington, D.C. 20549.
The Financial Industry Regulatory Authority (FINRA) provides a Public Disclosure Program which supplies certain information regarding the disciplinary history of FINRA members and their associated persons in response to either telephone inquiries at (800) 289-9999 or written inquiries at www.finra.org. FINRA also provides an investor brochure that includes information describing the Public Disclosure Program.
Nuveen Investments:
Serving Investors for Generations
Since 1898, financial advisors and their clients have relied on Nuveen Investments to provide dependable investment solutions through continued adherence to proven, long-term investing principles. Today, we offer a range of high quality equity and fixed-income solutions designed to be integral components of a well-diversified core portfolio.
Focused on meeting investor needs.
Nuveen Investments provides high-quality investment services designed to help secure the long-term goals of institutional and individual investors as well as the consultants and financial advisors who serve them. Nuveen Investments markets a wide range of specialized investment solutions which provide investors access to capabilities of its high-quality boutique investment affiliates-Nuveen Asset Management, Symphony Asset Management, NWQ Investment Management Company, Santa Barbara Asset Management, Tradewinds Global Investors, Winslow Capital Management, and Gresham Investment Management. In total, Nuveen Investments managed $212 billion as of June 30, 2012.
Find out how we can help you.
To learn more about how the products and services of Nuveen Investments may be able to help you meet your financial goals, talk to your financial advisor, or call us at (800) 257-8787. Please read the information provided carefully before you invest. Investors should consider the investment objective and policies, risk considerations, charges and expenses of any investment carefully. Where applicable, be sure to obtain a prospectus, which contains this and other relevant information. To obtain a prospectus, please contact your securities representative or Nuveen Investments, 333 W. Wacker Dr., Chicago, IL 60606. Please read the prospectus carefully before you invest or send money.
Learn more about Nuveen Funds at: www.nuveen.com/mf
| | |
Distributed by Nuveen Securities, LLC 333 West Wacker Drive Chicago, IL 60606 www.nuveen.com | | |
MAN-GTRB-0612P

Mutual Funds
Nuveen Equity Funds
For investors seeking high current income and long-term capital appreciation.
Annual Report
June 30, 2012
| | | | | | | | |
Nuveen NWQ Equity Income Fund | | | | | | | | |
LIFE IS COMPLEX.
Nuveen makes things e-simple.
It only takes a minute to sign up for e-Reports. Once enrolled, you’ll receive an e-mail as soon as your Nuveen Fund information is ready. No more waiting for delivery by regular mail. Just click on the link within the e-mail to see the report and save it on your computer if you wish.
Free e-Reports right to your e-mail!
www.investordelivery.com
If you receive your Nuveen Fund distributions and statements from your financial advisor or brokerage account.
OR
www.nuveen.com/accountaccess
If you receive your Nuveen Fund distributions and statements directly from Nuveen.
| | | | | | |
| Must be preceded by or accompanied by a prospectus. | | NOT FDIC INSURED | | MAY LOSE VALUE | | NO BANK GUARANTEE |
Table of Contents
Chairman’s
Letter to Shareholders

Dear Shareholders,
Investors have many reasons to remain cautious. The challenges in the Euro area are casting a shadow over global economies and financial markets. The political support for addressing fiscal issues is eroding as the economic and social impacts become more visible. At the same time, member nations appear unwilling to provide adequate financial support or to surrender sufficient sovereignty to strengthen the banks or unify the Euro area financial system. The gains made in reducing deficits, and the hard-won progress on winning popular acceptance of the need for economic austerity, are at risk. To their credit, European political leaders press on to find compromise solutions, but there is increasing concern that time will begin to run out.
In the U.S., strong corporate earnings have enabled the equity markets to withstand much of the downward pressures coming from weakening job creation, slower economic growth and political uncertainty. The Fed remains committed to low interest rates but has refrained from predicting another program of quantitative easing unless economic growth were to weaken significantly or the threat of recession appears on the horizon. Pre-election maneuvering has added to the already highly partisan atmosphere in the Congress. The end of the Bush-era tax cuts and implementation of the spending restrictions of the Budget Control Act of 2011, both scheduled to take place at year-end, loom closer.
During the last year, U.S. based investors have experienced a sharp decline and a strong recovery in the equity markets. The experienced investment teams at Nuveen keep their eye on a longer time horizon and use their practiced investment disciplines to negotiate through market peaks and valleys to achieve long-term goals for investors. Experienced professionals pursue investments that will weather short-term volatility and at the same time, seek opportunities that are created by markets that overreact to negative developments. Monitoring this process is an important consideration for the Fund Board as it oversees your Nuveen Fund on your behalf.
As always, I encourage you to contact your financial consultant if you have any questions about your investment in a Nuveen Fund. On behalf of the other members of your Fund Board, we look forward to continuing to earn your trust in the months and years ahead.
Sincerely,

Robert P. Bremner
Chairman of the Board
August 23, 2012
Portfolio Manager’s Comments
Certain statements in this report are forward-looking statements. Discussions of specific investments are for illustration only and are not intended as recommendations of individual investments. The forward-looking statements and other views expressed herein are those of the portfolio manager as of the date of this report. Actual future results or occurrences may differ significantly from those anticipated in any forward-looking statements and the views expressed herein are subject to change at any time, due to numerous market and other factors. The Fund disclaims any obligation to update publicly or revise any forward-looking statements or views expressed herein.
The Nuveen NWQ Equity Income Fund features management by NWQ Investment Management Company, LLC, an affiliate of Nuveen Investments. Jon Bosse, Chief Investment Officer of NWQ, leads the Fund’s management team at that firm. He has more than 30 years of corporate finance and investment management experience. Here Jon talks about the economic and equity market conditions, management strategies and the performance of the Fund for the twelve-month reporting period ended June 30, 2012.
What factors affected the U.S. economic and equity market environments during the twelve-month reporting period ended June 30, 2012?
During the period, the U.S. economy’s progress toward recovery from recession remained sluggish. The Federal Reserve (Fed) maintained its efforts to improve the overall economic environment by continuing to hold the benchmark Fed Funds rate at the record low level of zero to 0.25% that it had established in December 2008. At its June 2012 meeting, the central bank affirmed its opinion that economic conditions would likely warrant keeping the rate at “exceptionally low levels” through at least late 2014. The Fed also announced that it would extend its so-called Operation Twist program, whereby it is lengthening the average maturity of its holdings of U.S. Treasury securities, through the end of December 2012. The goals of this program are to lower longer-term interest rates, make broader financial conditions more accommodating, support a stronger economic recovery and help ensure that inflation remains at levels consistent with the Fed’s mandates of maximum employment and price stability.
In the second quarter of 2012, the U.S. economy slowed to an annualized growth rate of 1.5%, according to initial estimates for U.S. gross domestic product (GDP). While this marked the twelfth consecutive quarter of positive growth, it was also a significant slowdown from the previous few quarters. The Consumer Price Index (CPI) rose 1.7% year-over-year as of June 2012, the same figure as May 2012, which was the lowest twelve-month rate of change since February 2011. Core CPI (which excludes food and energy) increased 2.2% during the period, remaining above the Fed’s unofficial objective of 2.0% or lower for this inflation measure. However, the number was slightly below the 2.3% figure reported in the previous three months. Labor market conditions continued to be slow to improve, with the national unemployment rate registering 8.2% in June 2012. While this figure was down from 9.1% one year ago, it was still a slight uptick from the 8.1% reading in April 2012. The housing market remained the major weak spot in the economy, beleaguered by a high level of distressed properties and difficult credit conditions. For the twelve months ended May 2012 (the most recent data available at the time this report was prepared), the average home price in the Standard & Poor’s (S&P)/Case-Shiller Index of 20 major metropolitan areas lost 0.7%. Housing prices remained at
the lowest levels since spring 2003, down more than one-third from their summer 2006 peak. In addition, the U.S. economic picture continued to be clouded by concerns about the European debt crisis and global financial markets in general and efforts to reduce the U.S. federal deficit.
The U.S. equity market appreciated during the reporting period notwithstanding increased concerns regarding global economic growth and a sovereign debt crisis in Europe that have plagued stocks more recently. The best performing sectors in the Russell 1000 Value Index for the year were consumer discretionary, health care and utilities. The worst performing sectors were energy, finance and materials & processing. Energy stocks performed poorly mostly due to extremely weak natural gas prices, concern that high gasoline prices globally were placing a strain on economic growth and worries over whether China could maintain a sufficient economic growth rate to drive continued demand growth (an issue for commodities generally).
How did the Fund perform during the twelve-month reporting period ended June 30, 2012?
The table in the Fund Performance and Expense Ratios section of this report provides total returns for the Fund’s Class A Shares for the one-year and since inception periods ended June 30, 2012. The Fund’s Class A Share total returns are compared with the performance of their corresponding market index and Lipper classification average. A more detailed account of the Fund’s performance is provided later in this report.
What is the Fund’s investment strategy?
The Fund is designed to seek high current income and capital appreciation. NWQ attempts to meet this investment objective by investing primarily in dividend-paying equity securities, including common stocks, preferred stocks, warrants to purchase common stocks or preferred stocks, securities convertible into common or preferred stocks (such as convertible bonds and debentures) and other securities with equity characteristics. The Fund did not invest more than 25% of its net assets in non-common stock investments. Although the Fund invests primarily in U.S. equity securities, the Fund may invest up to 35% of its net assets in non-U.S. equity securities. The Fund also has the ability to write (sell) covered call options.
How did this strategy influence performance during the twelve-month reporting period ended June 30, 2012?
The Fund’s Class A Shares at net asset value (NAV) underperformed the Russell 1000 Value Index and the Lipper Equity Income Funds Classification Average during the twelve-month reporting period ended June 30, 2012.
During the reporting period, several positions detracted from performance including General Motors. The company declined on concerns regarding the slowing economy and the potential impact on volumes and pricing, as well as struggles with restructuring efforts at its European and Brazilian operations. Also negatively impacting performance was Hartford Financial Services Group, which declined given fundamental challenges in its life operations and the continued low interest rate environment. Responding to shareholder
pressure, the company recently announced a strategic restructuring whereby it will focus on property casualty by divesting its life and retirement businesses, and put its annuity business into runoff. Lastly, Talisman Energy Inc. underperformed given a sharp decline in natural gas prices and ongoing delays at its Yme project in the North Sea. Historical capital allocation decisions have also been a concern. We believe these issues should subside as new management appears capable at resolving the prior management’s challenges.
We strategically added several positions throughout the reporting period, including American International Group (AIG), Best Buy Co., Canadian Natural Resources, Cisco Systems and Hewlett-Packard. We also eliminated several positions due to more attractive investment opportunities. These included Hess Corporation, Philip Morris International, Aurizon Mines, Merck & Co., Motorola Solutions and Vertex Pharmaceutical.
We also wrote (sold) covered call options on individual stocks held in the Fund’s portfolio to enhance returns while foregoing some upside potential.
Risk Considerations
Mutual fund investing involves risk; principal loss is possible. Equity investments are subject to market risk. Foreign investments involve additional risks, including currency fluctuation, political and economic instability, lack of liquidity and differing legal and accounting standards. These risks are magnified in emerging markets. Convertible securities involve risks as the value of the Fund’s convertible securities may decline in response to such factors as rising interest rates and fluctuations in the market price of the common stock underlying the convertible securities. The value of call options sold (written) will be affected by, among other things, changes in the value of the securities or indexes underlying the options and the remaining time to the options’ expiration. By writing call options, the Fund may not participate in any appreciation of its equity portfolio as fully as it would if the Fund did not sell call options.
Fund Performance and Expense Ratios
Nuveen NWQ Equity Income Fund
Returns quoted represent past performance, which is no guarantee of future results. Current performance may be higher or lower than the performance shown. Investment returns and principal value will fluctuate so that when shares are redeemed, they may be worth more or less than their original cost. Returns without sales charges would be lower if the sales charge were included. Returns do not reflect the deduction of taxes that a shareholder would pay on Fund distributions or the redemption of Fund shares.
Returns may reflect a contractual agreement between the Fund and the investment adviser to waive certain fees and expenses; see Notes to Financial Statements, Footnote 7 — Management Fees and Other Transactions with Affiliates for more information. In addition, returns may reflect a voluntary expense limitation by the Fund’s investment adviser that may be modified or discontinued at any time without notice. For the most recent month-end performance call (800) 257-8787.
Returns reflect differences in sales charges and expenses, which are primarily differences in distribution and service fees. Fund returns assume reinvestment of dividends and capital gains.
Comparative index and Lipper return information is provided for the Fund’s Class A Shares at net asset value (NAV) only.
The expense ratios shown reflect the Fund’s total operating expenses (before fee waivers or expense reimbursements, if any) as shown in the Fund’s most recent prospectus. The expense ratios include management fees and other fees and expenses.
Average Annual Total Returns as of June 30, 2012
| | | | | | | | |
| |
| | | Average Annual | |
| | |
| | | 1-Year | | | Since
Inception* | |
Class A Shares at NAV | | | -3.57% | | | | 7.21% | |
Class A Shares at maximum Offering Price | | | -9.11% | | | | 4.96% | |
Russell 1000 Value Index** | | | 3.01% | | | | 10.27% | |
Lipper Equity Income Funds Classification Average** | | | 3.04% | | | | 11.14% | |
| | |
Class C Shares | | | -4.30% | | | | 6.40% | |
Class R3 Shares | | | -3.81% | | | | 6.94% | |
Class I Shares | | | -3.28% | | | | 7.49% | |
Class A Shares have a maximum 5.75% sales charge (Offering Price). Class A Share purchases of $1 million or more are sold at net asset value without an up-front sales charge but may be subject to a contingent deferred sales charge (CDSC), also known as a back-end sales charge, if redeemed within twelve months of purchase. Class C Shares have a 1% CDSC for redemptions within less than twelve months, which is not reflected in the one-year total return. Class R3 Shares have no sales charge and are available to only certain retirement plans. Class I Shares have no sales charge and may be purchased under limited circumstances or by specified classes of investors.
Expense Ratios as of Most Recent Prospectus
| | | | | | |
| | |
| | | Gross
Expense
Ratios | | | Net
Expense
Ratios |
Class A Shares | | | 5.29% | | | 1.13% |
Class C Shares | | | 6.04% | | | 1.88% |
Class R3 Shares | | | 5.54% | | | 1.38% |
Class I Shares | | | 5.04% | | | 0.88% |
The investment adviser has agreed to waive fees and/or reimburse expenses through October 31, 2012, so that total annual Fund operating expenses (excluding 12b-1 distribution and/or service fees, interest expenses, taxes, fees incurred in acquiring and disposing of portfolio securities and extraordinary expenses) do not exceed .90% (1.15% after October 31, 2012) of the average daily net assets of any class of Fund shares. The expense limitation expiring October 31, 2012, may be terminated or modified prior to that date only with the approval of the Board of Trustees of the Fund. The expense limitation in effect thereafter may be terminated or modified only with the approval of shareholders of the Fund.
| * | Since inception returns are from 9/15/09. |
| ** | Refer to the Glossary of Terms Used in this Report for definitions. Indexes and Lipper averages are not available for direct investment. |
Growth of an Assumed $10,000 Investment as of June 30, 2012 – Class A Shares
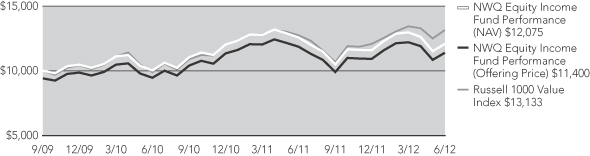
The graphs do not reflect the deduction of taxes that a shareholder may pay on Fund distributions or the redemption of Fund shares.
Holding Summaries as of June 30, 2012
This data relates to the securities held in the Fund’s portfolio of investments. It should not be construed as a measure of performance for the Fund itself.
Portfolio Allocation1

| | | | |
| Portfolio Composition1 | | | |
Pharmaceuticals | | | 18.6% | |
Insurance | | | 11.5% | |
Media | | | 10.9% | |
Oil, Gas & Consumable Fuels | | | 8.9% | |
Software | | | 8.7% | |
Metals & Mining | | | 6.6% | |
Diversified Financial Services | | | 6.3% | |
Commercial Banks | | | 3.9% | |
Machinery | | | 3.3% | |
Communications Equipment | | | 2.7% | |
| Other | | | 18.6% | |
| | | | |
| Top Five Common Stock Holdings1 | |
CA Inc. | | | 5.7% | |
Pfizer Inc. | | | 5.7% | |
Sanofi-Aventis, Sponsored ADR | | | 4.4% | |
Wells Fargo & Company | | | 3.9% | |
Merck & Company, Inc. | | | 3.6% | |
| 1 | As a percentage of total investments (excluding investments in derivatives) as of June 30, 2012. Holdings are subject to change. |
Expense Example
As a shareholder of the Fund, you incur two types of costs: (1) transaction costs, including up-front and back-end sales charges (loads) or redemption fees, where applicable; and (2) ongoing costs, including management fees; distribution and service (12b-1) fees, where applicable; and other Fund expenses. This Example below is intended to help you understand your ongoing costs (in dollars) of investing in the Fund and to compare these costs with the ongoing costs of investing in other mutual funds.
The Example below is based on an investment of $1,000 invested at the beginning of the period and held for the period.
The information under “Actual Performance,” together with the amount you invested, allows you to estimate actual expenses incurred over the reporting period. Simply divide your account value by $1,000 (for example, an $8,600 account value divided by $1,000 = 8.60) and multiply the result by the cost shown for your share class, in the row entitled “Expenses Incurred During Period” to estimate the expenses incurred on your account during this period.
The information under “Hypothetical Performance,” provides information about hypothetical account values and hypothetical expenses based on the Fund’s actual expense ratio and an assumed rate of return of 5% per year before expenses, which is not the Fund’s actual return. The hypothetical account values and expenses may not be used to estimate the actual ending account balance or expense you incurred for the period. You may use this information to compare the ongoing costs of investing in the Fund and other Funds. To do so, compare this 5% hypothetical example with the 5% hypothetical examples that appear in the shareholder reports of the other funds.
Please note that the expenses shown in the table are meant to highlight your ongoing costs only and do not reflect any transaction costs. Therefore, the hypothetical information is useful in comparing ongoing costs only, and will not help you determine the relative total costs of owning different funds or share classes. In addition, if these transaction costs were included, your costs would have been higher.
| | | | | | | | | | | | | | | | | | | | | | | | | | | | | | | | | | |
| | | | | | | | | | | | | | | | | Hypothetical Performance | |
| | | Actual Performance | | | | | (5% annualized return before expenses) | |
| | | A Shares | | | C Shares | | | R3 Shares | | | I Shares | | | | | A Shares | | | C Shares | | | R3 Shares | | | I Shares | |
| Beginning Account Value (1/01/12) | | $ | 1,000.00 | | | $ | 1,000.00 | | | $ | 1,000.00 | | | $ | 1,000.00 | | | | | $ | 1,000.00 | | | $ | 1,000.00 | | | $ | 1,000.00 | | | $ | 1,000.00 | |
| Ending Account Value (6/30/12) | | $ | 1,048.40 | | | $ | 1,044.60 | | | $ | 1,050.20 | | | $ | 1,047.10 | | | | | $ | 1,019.29 | | | $ | 1,015.56 | | | $ | 1,018.05 | | | $ | 1,020.54 | |
| Expenses Incurred During Period | | $ | 5.70 | | | $ | 9.51 | | | $ | 6.98 | | | $ | 4.43 | | | | | $ | 5.62 | | | $ | 9.37 | | | $ | 6.87 | | | $ | 4.37 | |
For each class of the Fund, expenses are equal to the Fund’s annualized net expense ratio of 1.12%, 1.87%, 1.37% and .87% for Classes A, C, R3 and I, respectively, multiplied by the average account value over the period, multiplied by 182/366 (to reflect the one-half year period).
Report of Independent Registered Public Accounting Firm
To the Board of Trustees and Shareholders of
Nuveen Investment Trust:
In our opinion, the accompanying statement of assets and liabilities, including the portfolio of investments, and the related statement of operations, of changes in net assets, and the financial highlights present fairly, in all material respects, the financial position of Nuveen NWQ Equity Income Fund (a series of the Nuveen Investment Trust, hereinafter referred to as the “Fund”) at June 30, 2012, the results of its operations for the year then ended, the changes in its net assets for each of the two years in the period then ended and the financial highlights for each of the periods presented, in conformity with accounting principles generally accepted in the United States of America. These financial statements and financial highlights (hereafter referred to as “financial statements”) are the responsibility of the Fund’s management; our responsibility is to express an opinion on these financial statements based on our audits. We conducted our audits of these financial statements in accordance with the standards of the Public Company Accounting Oversight Board (United States). Those standards require that we plan and perform the audit to obtain reasonable assurance about whether the financial statements are free of material misstatement. An audit includes examining, on a test basis, evidence supporting the amounts and disclosures in the financial statements, assessing the accounting principles used and significant estimates made by management, and evaluating the overall financial statement presentation. We believe that our audits, which included confirmation of securities at June 30, 2012 by correspondence with the custodian and brokers, provide a reasonable basis for our opinion.
PRICEWATERHOUSECOOPERS LLP
Chicago, IL
August 28, 2012
Portfolio of Investments
Nuveen NWQ Equity Income Fund
June 30, 2012
| | | | | | | | | | | | | | |
| Shares | | | Description (1) | | | | | | | | Value | |
| | | | | | | | | | | | | | |
| | | | COMMON STOCKS – 102.0% | | | | | | | | | | |
| | | | | |
| | | | Aerospace & Defense – 1.1% | | | | | | | | | | |
| | | | | |
| | 200 | | | Raytheon Company | | | | | | | | $ | 11,318 | |
| | | | Automobiles – 1.9% | | | | | | | | | | |
| | | | | |
| | 975 | | | General Motors Company, (2) | | | | | | | | | 19,227 | |
| | | | Chemicals – 1.1% | | | | | | | | | | |
| | | | | |
| | 200 | | | Mosaic Company | | | | | | | | | 10,952 | |
| | | | Commercial Banks – 4.0% | | | | | | | | | | |
| | | | | |
| | 1,200 | | | Wells Fargo & Company | | | | | | | | | 40,128 | |
| | | | Communications Equipment – 2.7% | | | | | | | | | | |
| | | | | |
| | 1,600 | | | Cisco Systems, Inc. | | | | | | | | | 27,472 | |
| | | | Computers & Peripherals – 1.2% | | | | | | | | | | |
| | | | | |
| | 600 | | | Hewlett-Packard Company | | | | | | | | | 12,066 | |
| | | | Diversified Financial Services – 6.4% | | | | | | | | | | |
| | | | | |
| | 1,200 | | | Citigroup Inc. | | | | | | | | | 32,892 | |
| | | | | |
| | 900 | | | JP Morgan Chase & Co. | | | | | | | | | 32,157 | |
| | | | Total Diversified Financial Services | | | | | | | | | 65,049 | |
| | | | Diversified Telecommunication Services – 1.0% | | | | | | | | | | |
| | | | | |
| | 2,700 | | | Frontier Communications Corporation | | | | | | | | | 10,341 | |
| | | | Energy Equipment & Services – 1.1% | | | | | | | | | | |
| | | | | |
| | 400 | | | Halliburton Company | | | | | | | | | 11,356 | |
| | | | Food & Staples Retailing – 2.8% | | | | | | | | | | |
| | | | | |
| | 600 | | | CVS Caremark Corporation | | | | | | | | | 28,038 | |
| | | | Industrial Conglomerates – 0.9% | | | | | | | | | | |
| | | | | |
| | 450 | | | General Electric Company | | | | | | | | | 9,378 | |
| | | | Insurance – 11.7% | | | | | | | | | | |
| | | | | |
| | 650 | | | American International Group, (2) | | | | | | | | | 20,859 | |
| | | | | |
| | 1,810 | | | Hartford Financial Services Group, Inc. | | | | | | | | | 31,910 | |
| | | | | |
| | 850 | | | MetLife, Inc. | | | | | | | | | 26,223 | |
| | | | | |
| | 800 | | | Symetra Financial Corporation | | | | | | | | | 10,096 | |
| | | | | |
| | 1,550 | | | Unum Group | | | | | | | | | 29,652 | |
| | | | Total Insurance | | | | | | | | | 118,740 | |
| | | | Machinery – 3.3% | | | | | | | | | | |
| | | | | |
| | 400 | | | Ingersoll Rand Company Limited, Class A, (5) | | | | | | | | | 16,872 | |
| | | | | |
| | 425 | | | PACCAR Inc. | | | | | | | | | 16,656 | |
| | | | Total Machinery | | | | | | | | | 33,528 | |
| | | | Media – 11.1% | | | | | | | | | | |
| | | | | |
| | 2,100 | | | Interpublic Group Companies, Inc., (5) | | | | | | | | | 22,785 | |
| | | | | |
| | 1,650 | | | National CineMedia, Inc. | | | | | | | | | 25,031 | |
| | | | | |
| | 600 | | | News Corporation, Class A | | | | | | | | | 13,374 | |
| | | | | |
| | 800 | | | Time Warner Inc., (5) | | | | | | | | | 30,800 | |
| | | | | |
| | 425 | | | Viacom Inc., Class B, (5) | | | | | | | | | 19,984 | |
| | | | Total Media | | | | | | | | | 111,974 | |
| | | | Metals & Mining – 6.8% | | | | | | | | | | |
| | | | | |
| | 800 | | | AngloGold Ashanti Limited, Sponsored ADR | | | | | | | | | 27,472 | |
| | | | | |
| | 600 | | | Barrick Gold Corporation, (5) | | | | | | | | | 22,542 | |
Portfolio of Investments
Nuveen NWQ Equity Income Fund (continued)
June 30, 2012
| | | | | | | | | | | | | | |
| Shares | | | Description (1) | | | | | | | | Value | |
| | | | | | | | | | | | | | |
| | | | Metals & Mining (continued) | | | | | | | | | | |
| | | | | |
| | 250 | | | Freeport-McMoRan Copper & Gold, Inc. | | | | | | | | $ | 8,518 | |
| | | | | |
| | 200 | | | Newmont Mining Corporation | | | | | | | | | 9,702 | |
| | | | Total Metals & Mining | | | | | | | | | 68,234 | |
| | | | Oil, Gas & Consumable Fuels – 9.1% | | | | | | | | | | |
| | | | | |
| | 125 | | | Occidental Petroleum Corporation | | | | | | | | | 10,721 | |
| | | | | |
| | 475 | | | Royal Dutch Shell PLC, Class A | | | | | | | | | 32,029 | |
| | | | | |
| | 2,700 | | | Talisman Energy Inc., (5) | | | | | | | | | 30,942 | |
| | | | | |
| | 400 | | | Total SA, Sponsored ADR | | | | | | | | | 17,980 | |
| | | | Total Oil, Gas & Consumable Fuels | | | | | | | | | 91,672 | |
| | | | Pharmaceuticals – 19.0% | | | | | | | | | | |
| | | | | |
| | 700 | | | GlaxoSmithKline PLC | | | | | | | | | 31,899 | |
| | | | | |
| | 900 | | | Merck & Company Inc. | | | | | | | | | 37,575 | |
| | | | | |
| | 2,550 | | | Pfizer Inc. | | | | | | | | | 58,650 | |
| | | | | |
| | 1,200 | | | Sanofi-Aventis, Sponsored ADR | | | | | | | | | 45,336 | |
| | | | | |
| | 475 | | | Teva Pharmaceutical Industries Limited, Sponsored ADR | | | | | | | | | 18,734 | |
| | | | Total Pharmaceuticals | | | | | | | | | 192,194 | |
| | | | Real Estate Investment Trust – 1.0% | | | | | | | | | | |
| | | | | |
| | 800 | | | Redwood Trust Inc. | | | | | | | | | 9,984 | |
| | | | Semiconductors & Equipment – 1.4% | | | | | | | | | | |
| | | | | |
| | 1,300 | | | Intersil Holding Corporation, Class A | | | | | | | | | 13,845 | |
| | | | Software – 8.9% | | | | | | | | | | |
| | | | | |
| | 2,175 | | | CA Inc. | | | | | | | | | 58,918 | |
| | | | | |
| | 1,000 | | | Microsoft Corporation | | | | | | | | | 30,590 | |
| | | | Total Software | | | | | | | | | 89,508 | |
| | | | Specialty Retail – 1.2% | | | | | | | | | | |
| | | | | |
| | 575 | | | Best Buy Co., Inc. | | | | | | | | | 12,052 | |
| | | | Tobacco – 1.9% | | | | | | | | | | |
| | | | | |
| | 225 | | | Philip Morris International | | | | | | | | | 19,634 | |
| | | | Wireless Telecommunication Services – 2.4% | | | | | | | | | | |
| | | | | |
| | 850 | | | Vodafone Group PLC, Sponsored ADR | | | | | | | | | 23,953 | |
| | | | Total Investments (cost $1,021,329) – 102.0% | | | | | | | | | 1,030,643 | |
| | | | Other Assets Less Liabilities – (2.0)% (3) | | | | | | | | | (20,601) | |
| | | | Net Assets – 100% | | | | | | | | $ | 1,010,042 | |
Investments in Derivatives at June 30, 2012
Call Options Written outstanding:
| | | | | | | | | | | | | | | | | | | | |
Number of
Contracts | | | Type | | Notional
Amount (4) | | | Expiration
Date | | | Strike
Price | | | Value (3) | |
| | (2) | | | Barrick Gold Corporation | | $ | (9,000 | ) | | | 7/21/12 | | | $ | 45.0 | | | $ | (8 | ) |
| | (4) | | | Ingersoll Rand Company Limited, Class A | | | (17,200 | ) | | | 9/22/12 | | | | 43.0 | | | | (810 | ) |
| | (11) | | | Interpublic Group of Companies, Inc. | | | (13,200 | ) | | | 7/21/12 | | | | 12.0 | | | | (55 | ) |
| | (16) | | | Talisman Energy Inc. | | | (19,200 | ) | | | 10/20/12 | | | | 12.0 | | | | (1,320 | ) |
| | (3) | | | Time Warner Inc. | | | (11,400 | ) | | | 8/18/12 | | | | 38.0 | | | | (456 | ) |
| | (4) | | | Viacom Inc., Class B | | | (20,000 | ) | | | 7/21/12 | | | | 50.0 | | | | (60 | ) |
| | (40) | | | Total Call Options Written (premiums received $3,740) | | $ | (90,000 | ) | | | | | | | | | | $ | (2,709 | ) |
| | | | For Fund portfolio compliance purposes, the Fund’s industry classifications refer to any one or more of the industry sub-classifications used by one or more widely recognized market indexes or ratings group indexes, and/or as defined by the Fund management. This definition may not apply for purposes of this report, which may combine industry sub-classifications into sectors for reporting ease. |
| | (1) | | All percentages shown in the Portfolio of Investments are based on net assets. |
| | (2) | | Non-income producing; issuer has not declared a dividend within the past twelve months. |
| | (3) | | Other Assets Less Liabilities includes Value of derivative instruments as listed within Investments in Derivatives at June 30, 2012. |
| | (4) | | For disclosure purposes, Notional Amount is calculated by multiplying the Number of Contracts by the Strike Price by 100. |
| | (5) | | Investment, or portion of investment, has been pledged as collateral for all options written during and as of the end of the reporting period. |
| | ADR | | American Depositary Receipt. |
See accompanying notes to financial statements.
Statement of Assets and Liabilities
June 30, 2012
| | | | |
Assets | | | | |
Investments, at value (cost $1,021,329) | | $ | 1,030,643 | |
Cash | | | 12,022 | |
Receivables: | | | | |
Dividends | | | 2,653 | |
Reclaims | | | 91 | |
Total assets | | | 1,045,409 | |
Liabilities | | | | |
Call options written, at value (premiums received $3,740) | | | 2,709 | |
Payables: | | | | |
Dividends | | | 5,516 | |
Investments purchased | | | 4,685 | |
Accrued expenses: | | | | |
Management fees | | | 1,040 | |
12b-1 distribution and service fees | | | 351 | |
Professional fees | | | 11,229 | |
Shareholders’ reports – printing and mailing expenses | | | 6,796 | |
Other | | | 3,041 | |
Total liabilities | | | 35,367 | |
Net assets | | $ | 1,010,042 | |
Class A Shares | | | | |
Net assets | | $ | 252,539 | |
Shares outstanding | | | 12,500 | |
Net asset value per share | | $ | 20.20 | |
Offering price per share (net asset value per share plus maximum sales charge of 5.75% of offering price) | | $ | 21.43 | |
Class C Shares | | | | |
Net assets | | $ | 252,430 | |
Shares outstanding | | | 12,500 | |
Net asset value and offering price per share | | $ | 20.19 | |
Class R3 Shares | | | | |
Net assets | | $ | 252,500 | |
Shares outstanding | | | 12,500 | |
Net asset value and offering price per share | | $ | 20.20 | |
Class I Shares | | | | |
Net assets | | $ | 252,573 | |
Shares outstanding | | | 12,500 | |
Net asset value and offering price per share | | $ | 20.21 | |
Net assets consist of: | | | | |
Capital paid-in | | $ | 998,320 | |
Undistributed (Over-distribution of) net investment income | | | 210 | |
Accumulated net realized gain (loss) | | | 1,167 | |
Net unrealized appreciation (depreciation) | | | 10,345 | |
Net assets | | $ | 1,010,042 | |
Authorized shares | | | Unlimited | |
Par value per share | | $ | 0.01 | |
See accompanying notes to financial statements.
Statement of Operations
Year Ended June 30, 2012
| | | | |
Dividend and Interest Income (net of foreign tax withheld of $890) | | $ | 31,062 | |
Expenses | | | | |
Management fees | | | 7,065 | |
12b-1 service fees – Class A | | | 654 | |
12b-1 distribution and service fees – Class C | | | 2,611 | |
12b-1 distribution and service fees – Class R3 | | | 1,307 | |
Shareholders’ servicing agent fees and expenses | | | 255 | |
Custodian’s fees and expenses | | | 4,657 | |
Trustees’ fees and expenses | | | 196 | |
Professional fees | | | 11,266 | |
Shareholders’ reports – printing and mailing expenses | | | 14,634 | |
Other expenses | | | 2,857 | |
Total expenses before custodian fee credit and expense reimbursement | | | 45,502 | |
Custodian fee credit | | | (23 | ) |
Expense reimbursement | | | (31,774 | ) |
Net expenses | | | 13,705 | |
Net investment income (loss) | | | 17,357 | |
Realized and Unrealized Gain (Loss) | | | | |
Net realized gain (loss) from: | | | | |
Investments | | | 2,435 | |
Call options written | | | 4,139 | |
Change in net in unrealized appreciation (depreciation) of: | | | | |
Investments | | | (77,645 | ) |
Call options written | | | 1,031 | |
Net realized and unrealized gain (loss) | | | (70,040 | ) |
Net increase (decrease) in net assets from operations | | $ | (52,683 | ) |
See accompanying notes to financial statements.
Statement of Changes in Net Assets
| | | | | | | | |
| | | Year Ended
6/30/12 | | | Year Ended 6/30/11 | |
Operations | | | | | | | | |
Net investment income (loss) | | $ | 17,357 | | | $ | 15,032 | |
Net realized gain (loss) from: | | | | | | | | |
Investments | | | 2,435 | | | | 78,517 | |
Call options written | | | 4,139 | | | | 13,904 | |
Change in net unrealized appreciation (depreciation) of: | | | | | | | | |
Investments | | | (77,645 | ) | | | 138,525 | |
Call options written | | | 1,031 | | | | (205 | ) |
Net increase (decrease) in net assets from operations | | | (52,683 | ) | | | 245,773 | |
Distributions to Shareholders | | | | | | | | |
From net investment income: | | | | | | | | |
Class A | | | (4,851 | ) | | | (4,536 | ) |
Class C | | | (2,886 | ) | | | (2,404 | ) |
Class R3 | | | (4,195 | ) | | | (3,824 | ) |
Class I | | | (5,509 | ) | | | (5,249 | ) |
From accumulated net realized gains: | | | | | | | | |
Class A | | | (24,562 | ) | | | (10,394 | ) |
Class C | | | (24,562 | ) | | | (10,394 | ) |
Class R3 | | | (24,562 | ) | | | (10,394 | ) |
Class I | | | (24,562 | ) | | | (10,394 | ) |
Decrease in net assets from distributions to shareholders | | | (115,689 | ) | | | (57,589 | ) |
Fund Share Transactions | | | | | | | | |
Net proceeds from sale of shares | | | — | | | | — | |
Net increase (decrease) in net assets from Fund share transactions | | | — | | | | — | |
Net increase (decrease) in net assets | | | (168,372 | ) | | | 188,184 | |
Net assets at the beginning of period | | | 1,178,414 | | | | 990,230 | |
Net assets at the end of period | | $ | 1,010,042 | | | $ | 1,178,414 | |
Undistributed (Over-distribution of) net investment income at the end of period | | $ | 210 | | | $ | 294 | |
See accompanying notes to financial statements.
[THIS PAGE INTENTIONALLY LEFT BLANK]
Financial Highlights
| | | | | | | | | | | | | | | | | | | | | | | | | | | | | | | | | | | | |
| Selected data for a share outstanding throughout the period: | |
| | | | | | | |
| Class (Commencement Date) | | | | | | | | | | | | | | | | | | | | | | |
| | | | | | Investment Operations | | | Less Distributions | | | | |
| | | | | | | | | | | | | | | | | | | | | | | | | | | | |
Year Ended
June 30, | | Beginning
Net
Asset
Value | | | Net
Invest-
ment
Income
(Loss)(a) | | | Net
Realized/
Unrealized
Gain
(Loss) | | | Total | | | Net
Invest-
ment
Income | | | Capital
Gains(b) | | | Total | | | Ending
Net
Asset
Value | | | Total
Return(c) | |
Class A (9/09) | | | | | | | | | | | | | | | | | | | | | | | | | | | | | | | | | | | | |
2012 | | $ | 23.57 | | | $ | .39 | | | $ | (1.40 | ) | | $ | (1.01 | ) | | $ | (.39 | ) | | $ | (1.97 | ) | | $ | (2.36 | ) | | $ | 20.20 | | | | (3.57 | )% |
2011 | | | 19.81 | | | | .34 | | | | 4.61 | | | | 4.95 | | | | (.36 | ) | | | (.83 | ) | | | (1.19 | ) | | | 23.57 | | | | 25.34 | |
2010(f) | | | 20.00 | | | | .30 | | | | (.19 | ) | | | .11 | | | | (.30 | ) | | | — | | | | (.30 | ) | | | 19.81 | | | | .48 | |
Class C (9/09) | | | | | | | | | | | | | | | | | | | | | | | | | | | | | | | | | | | | |
2012 | | | 23.56 | | | | .23 | | | | (1.40 | ) | | | (1.17 | ) | | | (.23 | ) | | | (1.97 | ) | | | (2.20 | ) | | | 20.19 | | | | (4.30 | ) |
2011 | | | 19.80 | | | | .17 | | | | 4.61 | | | | 4.78 | | | | (.19 | ) | | | (.83 | ) | | | (1.02 | ) | | | 23.56 | | | | 24.43 | |
2010(f) | | | 20.00 | | | | .18 | | | | (.20 | ) | | | (.02 | ) | | | (.18 | ) | | | — | | | | (.18 | ) | | | 19.80 | | | | (.14 | ) |
Class R3 (9/09) | | | | | | | | | | | | | | | | | | | | | | | | | | | | | | | | | | | | |
2012 | | | 23.57 | | | | .33 | | | | (1.39 | ) | | | (1.06 | ) | | | (.34 | ) | | | (1.97 | ) | | | (2.31 | ) | | | 20.20 | | | | (3.81 | ) |
2011 | | | 19.80 | | | | .29 | | | | 4.62 | | | | 4.91 | | | | (.31 | ) | | | (.83 | ) | | | (1.14 | ) | | | 23.57 | | | | 25.09 | |
2010(f) | | | 20.00 | | | | .26 | | | | (.20 | ) | | | .06 | | | | (.26 | ) | | | — | | | | (.26 | ) | | | 19.80 | | | | .24 | |
Class I (9/09) | | | | | | | | | | | | | | | | | | | | | | | | | | | | | | | | | | | | |
2012 | | | 23.57 | | | | .44 | | | | (1.39 | ) | | | (.95 | ) | | | (.44 | ) | | | (1.97 | ) | | | (2.41 | ) | | | 20.21 | | | | (3.28 | ) |
2011 | | | 19.81 | | | | .40 | | | | 4.61 | | | | 5.01 | | | | (.42 | ) | | | (.83 | ) | | | (1.25 | ) | | | 23.57 | | | | 25.64 | |
2010(f) | | | 20.00 | | | | .35 | | | | (.20 | ) | | | .15 | | | | (.34 | ) | | | — | | | | (.34 | ) | | | 19.81 | | | | .67 | |
| | | | | | | | | | | | | | | | | | | | | | |
| | | | | | | | | | | | | | | | | |
| | | |
| | | | | | | | | | | |
| Ratios/Supplemental Data | |
| | | | Ratios to Average
Net Assets Before
Reimbursement(d) | | | Ratios to Average
Net Assets After
Reimbursement(d)(e) | | | | |
Ending
Net
Assets
(000) | | | Expenses | | | Net
Invest-
ment
Income
(Loss) | | | Expenses | | | Net
Invest-
ment
Income
(Loss) | | | Portfolio
Turnover
Rate | |
| | | | | | | | | | | | | | | | | | | | | | |
| $ | 253 | | | | 4.16 | % | | | (1.19 | )% | | | 1.13 | % | | | 1.85 | % | | | 32 | % |
| | 295 | | | | 5.29 | | | | (2.65 | ) | | | 1.13 | | | | 1.51 | | | | 44 | |
| | 248 | | | | 3.79 | * | | | (.82 | )* | | | 1.14 | * | | | 1.83 | * | | | 24 | |
| | | | | | | | | | | | | | | | | | | | | | |
| | 252 | | | | 4.91 | | | | (1.94 | ) | | | 1.88 | | | | 1.09 | | | | 32 | |
| | 294 | | | | 6.04 | | | | (3.40 | ) | | | 1.88 | | | | .76 | | | | 44 | |
| | 248 | | | | 4.54 | * | | | (1.57 | )* | | | 1.89 | * | | | 1.08 | * | | | 24 | |
| | | | | | | | | | | | | | | | | | | | | | |
| | 253 | | | | 4.42 | | | | (1.45 | ) | | | 1.38 | | | | 1.59 | | | | 32 | |
| | 295 | | | | 5.54 | | | | (2.90 | ) | | | 1.38 | | | | 1.26 | | | | 44 | |
| | 248 | | | | 4.04 | * | | | (1.07 | )* | | | 1.39 | * | | | 1.58 | * | | | 24 | |
| | | | | | | | | | | | | | | | | | | | | | |
| | 253 | | | | 3.91 | | | | (.94 | ) | | | .88 | | | | 2.10 | | | | 32 | |
| | 295 | | | | 5.04 | | | | (2.40 | ) | | | .88 | | | | 1.76 | | | | 44 | |
| | 248 | | | | 3.54 | * | | | (.57 | )* | | | .89 | * | | | 2.08 | * | | | 24 | |
| (a) | Per share Net Investment Income (Loss) is calculated using the average daily shares method. |
| (b) | Distributions from Capital Gains include short-term capital gains, if any. |
| (c) | Total return is the combination of changes in net asset value without any sales charge, reinvested dividend income at net asset value and reinvested capital gains distributions at net asset value, if any. Total returns are not annualized. |
| (d) | Ratios do not reflect the effect of custodian credits earned on the Fund’s net cash on deposit with the custodian bank, where applicable. |
| (e) | After expense reimbursement from the Adviser, where applicable. |
| (f) | For the period September 15, 2009 (commencement of operations) through June 30, 2010. |
See accompanying notes to financial statements.
Notes to Financial Statements
1. General Information and Significant Accounting Policies
General Information
The Nuveen Investment Trust (the “Trust”) is an open-end investment company registered under the Investment Company Act of 1940, as amended. The Trust is comprised of Nuveen NWQ Equity Income Fund (the “Fund”), among others. The Trust was organized as a Massachusetts business trust in 1996.
The Fund’s investment objective is to provide high current income and long-term capital appreciation. Under normal market conditions, the Fund invests at least 80% of its net assets in equity securities. The Fund invests primarily in income producing common stocks, but may also invest in preferred securities, convertible securities and corporate debt securities. The Fund may also write covered call options on securities in which the Fund holds a long position. The Fund may invest up to 20% of its net assets in fixed-income securities, including up to 10% of its net assets in below investment-grade debt securities, commonly referred to as “high yield,” “high risk” or “junk” bonds. The Fund may also invest up to 25% of its net assets in non-U.S. securities, including up to 10% of its net assets in securities of companies located in emerging markets.
The Fund’s most recent prospectus provides further descriptions of the Fund’s investment objective, principal investment strategies and principal risks.
Significant Accounting Policies
The following is a summary of significant accounting policies followed by the Fund in the preparation of its financial statements in accordance with accounting principles generally accepted in the United States (“U.S. GAAP”).
Investment Valuation
Common stocks and other equity-type securities are valued at the last sales price on the securities exchange on which such securities are primarily traded and are generally classified as Level 1 for fair value measurement purposes. Securities primarily traded on the NASDAQ National Market (“NASDAQ”) are valued, except as indicated below, at the NASDAQ Official Closing Price and are generally classified as Level 1. However, securities traded on a securities exchange or NASDAQ for which there were no transactions on a given day or securities not listed on a securities exchange or NASDAQ are valued at the last quoted bid price and are generally classified as Level 2. Prices of certain American Depository Receipts (“ADR”) held by the Fund that trade only in limited volume in the United States are valued based on the last traded price, official closing price, or the most recent bid price of the underlying non-U.S.-traded stock, adjusted as appropriate for the underlying-to-ADR conversion ratio and foreign exchange rate, and from time-to-time may also be adjusted further to take into account material events that may take place after the close of the local non-U.S. market but before the close of the New York Stock Exchange. These securities may represent a transfer from a Level 1 to a Level 2 security.
Prices of fixed-income securities are provided by a pricing service approved by the Fund’s Board of Trustees. These securities are generally classified as Level 2. The pricing service establishes a security’s fair value using methods that may include consideration of the following: yields or prices of investments of comparable quality, type of issue, coupon, maturity and rating, market quotes or indications of value from security dealers, evaluations of anticipated cash flows or collateral, general market conditions and other information and analysis, including the obligor’s credit characteristics considered relevant. In pricing certain securities, particularly less liquid and lower quality securities, the pricing service may consider information about a security, its issuer, or market activity provided by Nuveen Fund Advisors, Inc. (the “Adviser”), a wholly-owned subsidiary of Nuveen Investments, Inc. (“Nuveen”). These securities are generally classified as Level 2 or Level 3 depending on the priority of the significant inputs.
The value of exchange-traded options are based on the mean of the closing bid and ask prices. Exchange-traded options are generally classified as Level 1. Options traded in the over-the-counter market are valued using an evaluated mean price and are generally classified as Level 2.
Certain securities may not be able to be priced by the pre-established pricing methods as described above. Such securities may be valued by the Fund’s Board of Trustees or its designee at fair value. These securities generally include, but are not limited to, restricted securities (securities which may not be publicly sold without registration under the Securities Act of 1933, as amended) for which a pricing service is unable to provide a market price; securities whose trading has been formally suspended; debt securities that have gone into default and for which there is no current market quotation; a security whose market price is not available from a pre-established pricing source; a security with respect to which an event has occurred that is likely to materially affect the value of the security after the market has closed but before the calculation of the Fund’s net asset value (as may be the case in non-U.S. markets on which the security is primarily traded) or make it difficult or impossible to obtain a reliable market quotation; and a security whose price, as provided by the pricing service, is not deemed to reflect the security’s fair value. As a general principle, the fair value of a security would appear to be the amount that the owner might reasonably expect to receive for it in a current sale. A variety of factors may be considered in determining the fair value of such securities, which may include consideration of the following: yields or prices of investments of comparable quality, type of issue, coupon, maturity and rating, market quotes or indications of value from security dealers, evaluations of anticipated cash flows or collateral, general market conditions and other information and analysis, including the obligor’s credit characteristics considered relevant. These securities are generally classified as Level 2 or as Level 3 depending on the priority of the significant inputs. Regardless of the method employed to value a particular security, all valuations are subject to review by the Fund’s Board of Trustees or its designee.
Refer to Footnote 2 – Fair Value Measurements for further details on the leveling of securities held by the Fund as of the end of the reporting period.
Investment Transactions
Investment transactions are recorded on a trade date basis. Realized gains and losses from investment transactions are determined on the specific identification method, which is the same basis used for federal income tax purposes. Investments purchased on a when-issued/delayed delivery basis may have extended settlement periods. Any investments so purchased are subject to market fluctuation during this period. The Fund has instructed the custodian to earmark securities in the Fund’s portfolio with a current value at least equal to the amount of the when-issued/delayed delivery purchase commitments. At June 30, 2012, the Fund had no such outstanding purchase commitments.
Investment Income
Dividend income is recorded on the ex-dividend date or, for foreign securities, when information is available. Interest income, which includes the amortization of premiums and accretion of discounts for financial reporting purposes, is recorded on an accrual basis. Interest income also includes paydown gains and losses, if any.
Income Taxes
The Fund intends to distribute substantially all of its net investment income and net capital gains to shareholders and to otherwise comply with the requirements of Subchapter M of the Internal Revenue Code applicable to regulated investment companies (“RIC’s”). Therefore, no federal income tax provision is required.
For all open tax years and all major taxing jurisdictions, management of the Fund has concluded that there are no significant uncertain tax positions that would require recognition in the financial statements. Open tax years are those that are open for examination by taxing authorities (i.e., generally the last four tax year ends and the interim tax period since then). Furthermore, management of the Fund is also not aware of any tax positions for which it is reasonably possible that the total amounts of unrecognized tax benefits will significantly change in the next twelve months.
Dividends and Distributions to Shareholders
Dividends from net investment income are declared and distributed to shareholders quarterly. Net realized capital gains from investment transactions, if any, are declared and distributed to shareholders at least annually. Furthermore, capital gains are distributed only to the extent they exceed available capital loss carryforwards.
Distributions to shareholders are recorded on the ex-dividend date. The amount and timing of distributions are determined in accordance with federal income tax regulations, which may differ from U.S. GAAP.
Flexible Sales Charge Program
Class A Shares are generally sold with an up-front sales charge and incur a .25% annual 12b-1 service fee. Class A Share purchases of $1 million or more are sold at net asset value without an up-front sales charge but may be subject to a contingent deferred sales charge (“CDSC”) if redeemed within twelve months of purchase. Class C Shares are sold without an up-front sales charge but incur a .75% annual 12b-1 distribution fee and a .25% annual 12b-1 service fee. Class C Shares are subject to a CDSC of 1% if redeemed within twelve months of purchase. Class R3 Shares are sold without an up-front sales charge but incur a .25% annual 12b-1 distribution fee and a .25% annual 12b-1 service fee. Class I Shares are not subject to any sales charge or 12b-1 distribution or service fees.
Options Transactions
The Fund is subject to equity price risk in the normal course of pursuing its investment objectives and is authorized to write (sell) call options on securities in an attempt to manage such risk. When the Fund writes a call option, an amount equal to the net premium received (the premium less commission) is recognized as a component of “Call options written, at value” on the Statement of Assets and Liabilities and is subsequently adjusted to reflect the current value of the written option until the option is exercised or expires or the Fund enters into a closing purchase transaction. The changes in the value of options written during the fiscal period are recognized as a component of “Change in net unrealized appreciation (depreciation) of call options written” on the Statement of Operations. When a call option is exercised or expires or the Fund enters into a closing purchase transaction, the difference between the net premium received and any amount paid at expiration or on executing a closing purchase transaction, including commission, is recognized as a component of “Net realized gain (loss) from call options written” on the Statement of Operations. The Fund, as writer of a call option, has no control over whether the underlying instrument may be sold (called) and as a result bears the risk of an unfavorable change in the market value of the instrument underlying the written option. There is also the risk the Fund may not be able to enter into a closing transaction because of an illiquid market.
During the fiscal year ended June 30, 2012, the Fund wrote covered call options on individual stocks held in its portfolio to enhance returns while foregoing some upside potential. The average notional amount of call options written during the fiscal year ended June 30, 2012, was ($40,870). The average notional amount is calculated based on the outstanding amount at the beginning of the fiscal year and at the end of each fiscal quarter within the current fiscal year. Refer to Footnote 3 – Derivative Instruments and Hedging Activities and Footnote 5 – Investment Transactions for further details on call options written.
Notes to Financial Statements (continued)
Market and Counterparty Credit Risk
In the normal course of business the Fund may invest in financial instruments and enter into financial transactions where risk of potential loss exists due to changes in the market (market risk) or failure of the other party to the transaction to perform (counterparty credit risk). The potential loss could exceed the value of the financial assets recorded on the financial statements. Financial assets, which potentially expose the Fund to counterparty credit risk, consist principally of cash due from counterparties on forward, option and swap transactions, when applicable. The extent of the Fund’s exposure to counterparty credit risk in respect to these financial assets approximates their carrying value as recorded on the Statement of Assets and Liabilities. Futures contracts, when applicable, expose the Fund to minimal counterparty credit risk as they are exchange traded and the exchange’s clearinghouse, which is counterparty to all exchange traded futures, guarantees the futures contract against default.
The Fund helps manage counterparty credit risk by entering into agreements only with counterparties the Adviser, believes have the financial resources to honor their obligations and by having the Adviser monitor the financial stability of the counterparties. Additionally, counterparties may be required to pledge collateral daily (based on the daily valuation of the financial asset) on behalf of the Fund with a value approximately equal to the amount of any unrealized gain above a pre-determined threshold. Reciprocally, when the Fund has an unrealized loss, the Fund has instructed the custodian to pledge assets of the Fund as collateral with a value approximately equal to the amount of the unrealized loss above a pre-determined threshold. Collateral pledges are monitored and subsequently adjusted if and when the valuations fluctuate, either up or down, by at least the pre-determined threshold amount.
Multiclass Operations and Allocations
Income and expenses of the Fund that are not directly attributable to a specific class of shares are prorated among the classes based on the relative net assets of each class. Expenses directly attributable to a class of shares, which presently only include 12b-1 distribution and service fees, are recorded to the specific class.
Income, realized and unrealized capital gains and losses of the Fund are prorated among the classes based on the relative net assets of each class.
Custodian Fee Credit
The Fund has an arrangement with the custodian bank whereby certain custodian fees and expenses are reduced by net credits earned on the Fund’s cash on deposit with the bank. Such deposit arrangements are an alternative to overnight investments. Credits for cash balances may be offset by charges for any days on which the Fund overdraws its account at the custodian bank.
Indemnifications
Under the Trust’s organizational documents, its officers and trustees are indemnified against certain liabilities arising out of the performance of their duties to the Trust. In addition, in the normal course of business, the Trust enters into contracts that provide general indemnifications to other parties. The Trust’s maximum exposure under these arrangements is unknown as this would involve future claims that may be made against the Trust that have not yet occurred. However, the Trust has not had prior claims or losses pursuant to these contracts and expects the risk of loss to be remote.
Use of Estimates
The preparation of financial statements in conformity with U.S. GAAP requires management to make estimates and assumptions that affect the reported amounts of assets and liabilities at the date of the financial statements and the reported amounts of increases and decreases in net assets from operations during the reporting period. Actual results may differ from those estimates.
2. Fair Value Measurements
Fair value is defined as the price that the Fund would receive upon selling an investment or transferring a liability in an orderly transaction to an independent buyer in the principal or most advantageous market for the investment. A three-tier hierarchy is used to maximize the use of observable market data and minimize the use of unobservable inputs and to establish classification of fair value measurements for disclosure purposes. Observable inputs reflect the assumptions market participants would use in pricing the asset or liability. Observable inputs are based on market data obtained from sources independent of the reporting entity. Unobservable inputs reflect the reporting entity’s own assumptions about the assumptions market participants would use in pricing the asset or liability. Unobservable inputs are based on the best information available in the circumstances. The following is a summary of the three-tier hierarchy of valuation input levels.
| | |
| Level 1 – | | Inputs are unadjusted and prices are determined using quoted prices in active markets for identical securities. |
| Level 2 – | | Prices are determined using other significant observable inputs (including quoted prices for similar securities, interest rates, prepayment speeds, credit risk, etc.). |
| Level 3 – | | Prices are determined using significant unobservable inputs (including management’s assumptions in determining the fair value of investments). |
The inputs or methodologies used for valuing securities are not an indication of the risks associated with investing in those securities. The following is a summary of the Fund’s fair value measurements as of the end of the reporting period:
| | | | | | | | | | | | | | | | |
| | | Level 1 | | | Level 2 | | | Level 3 | | | Total | |
Long-Term Investments*: | | | | | | | | | | | | | | | | |
Common Stocks | | $ | 1,030,643 | | | $ | — | | | $ | — | | | $ | 1,030,643 | |
Derivatives: | | | | | | | | | | | | | | | | |
Call Options Written | | | (2,709 | ) | | | — | | | | — | | | | (2,709 | ) |
Total | | $ | 1,027,934 | | | $ | — | | | $ | — | | | $ | 1,027,934 | |
| * | Refer to the Fund’s Portfolio of Investments for industry classifications. |
The Nuveen funds’ Board of Directors/Trustees is responsible for the valuation process and has delegated the oversight of the daily valuation process to the Adviser’s Valuation Committee. The Valuation Committee, pursuant to the valuation policies and procedures adopted by the Board of Directors/Trustees, is responsible for making fair value determinations, evaluating the effectiveness of the funds’ pricing policies, and reporting to the Board of Directors/Trustees. The Valuation Committee is aided in its efforts by the Adviser’s dedicated Securities Valuation Team, which is responsible for administering the daily valuation process and applying fair value methodologies as approved by the Valuation Committee. When determining the reliability of independent pricing services for investments owned by the funds, the Valuation Committee, among other things, conducts due diligence reviews of the pricing services and monitors the quality of security prices received through various testing reports conducted by the Securities Valuation Team.
The Valuation Committee will consider pricing methodologies it deems relevant and appropriate when making fair value determinations. Examples of possible methodologies include, but are not limited to, multiple of earnings; discount from market of a similar freely traded security; discounted cash-flow analysis; book value or a multiple thereof; risk premium/yield analysis; yield to maturity; and/or fundamental investment analysis. The Valuation Committee will also consider factors it deems relevant and appropriate in light of the facts and circumstances. Examples of possible factors include, but are not limited to, the type of security; the issuer’s financial statements; the purchase price of the security; the discount from market value of unrestricted securities of the same class at the time of purchase; analysts’ research and observations from financial institutions; information regarding any transactions or offers with respect to the security; the existence of merger proposals or tender offers affecting the security; the price and extent of public trading in similar securities of the issuer or comparable companies; and the existence of a shelf registration for restricted securities.
For each portfolio security that has been fair valued pursuant to the policies adopted by the Board of Directors/Trustees, the fair value price is compared against the last available and next available market quotations. The Valuation Committee reviews the results of such testing and fair valuation occurrences are reported to the Board of Directors/Trustees.
3. Derivative Instruments and Hedging Activities
The Fund records derivative instruments at fair value, with changes in fair value recognized on the Statement of Operations, when applicable. Even though the Fund’s investments in derivatives may represent economic hedges, they are not considered to be hedge transactions for financial reporting purposes. For additional information on the derivative instruments in which the Fund was invested during and at the end of the reporting period, refer to the Portfolio of Investments, Financial Statements and Footnote 1 – General Information and Significant Accounting Policies.
The following table presents the fair value of all derivative instruments held by the Fund as of June 30, 2012, the location of these instruments on the Statement of Assets and Liabilities, and the primary underlying risk exposure.
| | | | | | | | | | | | | | |
| | | | | Location on the Statement of Assets and Liabilities | |
Underlying
Risk Exposure | | Derivative
Instrument | | Asset Derivatives | | | Liability Derivatives | |
| | | Location | | Value | | | Location | | Value | |
Equity Price | | Options | | — | | $ | — | | | Call options written, at value | | $ | 2,709 | |
The following tables present the amount of net realized gain (loss) and change in net unrealized appreciation (depreciation) recognized for the fiscal year ended June 30, 2012, on derivative instruments, as well as the primary risk exposure associated with each.
| | | | |
| Net Realized Gain (Loss) from Call Options Written | | | |
Risk Exposure | | | | |
Equity Price | | $ | 4,139 | |
| |
| Change in Net Unrealized Appreciation (Depreciation) of Call Options Written | | | |
Risk Exposure | | | | |
Equity Price | | $ | 1,031 | |
Notes to Financial Statements (continued)
4. Fund Shares
Transactions in Fund shares were as follows:
| | | | | | | | | | | | | | | | |
| | | Year Ended
6/30/12 | | | Year Ended
6/30/11 | |
| | | Shares | | | Amount | | | Shares | | | Amount | |
Shares sold: | | | | | | | | | | | | | | | | |
Class A | | | — | | | $ | — | | | | — | | | $ | — | |
Class C | | | — | | | | — | | | | — | | | | — | |
Class R3 | | | — | | | | — | | | | — | | | | — | |
Class I | | | — | | | | — | | | | — | | | | — | |
Net increase (decrease) | | | — | | | $ | — | | | | — | | | $ | — | |
5. Investment Transactions
Purchases and sales (excluding short-term investments and derivative transactions) during the fiscal year ended June 30, 2012, aggregated $334,553 and $412,267, respectively.
Transactions in call options written during the fiscal year ended June 30, 2012, were as follows:
| | | | | | | | |
| | | Number of
Contracts | | | Premiums
Received | |
Outstanding, beginning of period | | | — | | | $ | — | |
Call options written | | | 70 | | | | 8,722 | |
Call options terminated in closing purchase transactions | | | (11 | ) | | | (2,219 | ) |
Call options expired | | | (14 | ) | | | (2,263 | ) |
Call options exercised | | | (5 | ) | | | (500 | ) |
Outstanding, end of period | | | 40 | | | $ | 3,740 | |
6. Income Tax Information
The following information is presented on an income tax basis. Differences between amounts for financial statement and federal income tax purposes are primarily due to timing differences in recognizing certain gains and losses on investment transactions. To the extent that differences arise that are permanent in nature, such amounts are reclassified within the capital accounts as detailed below. Temporary differences do not require reclassification. Temporary and permanent differences do not impact the net asset values of the Fund.
At June 30, 2012, the cost and unrealized appreciation (depreciation) of investments (excluding investments in derivatives), as determined on a federal income tax basis, were as follows:
| | | | |
Cost of investments | | $ | 1,022,035 | |
Gross unrealized: | | | | |
Appreciation | | $ | 99,218 | |
Depreciation | | | (90,610 | ) |
Net unrealized appreciation (depreciation) of investments | | $ | 8,608 | |
The tax components of undistributed net ordinary income and net long-term capital gains at June 30, 2012, the Fund’s tax year end, were as follows:
| | | | |
Undistributed net ordinary income* | | $ | 7,600 | |
Undistributed net long-term capital gains | | | — | |
| * | Net ordinary income consists of net taxable income derived from dividends, interest, and net short-term capital gains, if any. |
| | Undistributed net ordinary income (on a tax basis) has not been reduced for the dividend declared June 28, 2012 and paid on July 2, 2012. |
The tax character of distributions paid during the Fund’s tax years ended June 30, 2012 and June 30, 2011, was designated for purposes of the dividends paid deduction as follows:
| | | | |
| 2012 | | | |
Distributions from net ordinary income* | | $ | 72,747 | |
Distributions from net long-term capital gains** | | | 43,250 | |
| | | | |
| 2011 | | | |
Distributions from net ordinary income* | | $ | 56,860 | |
Distributions from net long-term capital gains | | | — | |
| * | Net ordinary income consists of net taxable income derived from dividends, interest, and net short-term capital gains, if any. |
| ** | The Fund designates as long-term capital gain dividend, pursuant to the Internal Revenue Code Section 852(b)(3), the amount necessary to reduce earnings and profits of the Fund related to net capital gain to zero for the tax year ended June 30, 2012. |
On December 22, 2010, the Regulated Investment Company Modernization Act of 2010 (the “Act”) was enacted, which changed various technical rules governing the tax treatment of RICs. The changes are generally effective for taxable years beginning after the date of enactment. One of the more prominent changes addresses capital loss carryforwards. Under the Act, the Fund will be permitted to carry forward capital losses incurred in taxable years beginning after the date of enactment for an unlimited period. However, any losses incurred during those future taxable years will be required to be utilized prior to the losses incurred in pre-enactment taxable years, which carry an expiration date. As a result of this ordering rule, pre-enactment capital loss carryforwards may be more likely to expire unused. Additionally, post-enactment capital loss carryforwards will retain their character as either short-term or long-term capital losses rather than being considered all short-term as permitted under previous regulation.
The Act also contains several provisions aimed at preserving the character of distributions made by a fiscal year RIC during the portion of its taxable year ending after October 31 or December 31, reducing the circumstances under which a RIC might be required to file amended Forms 1099 to restate previously reported distributions.
During the Fund’s tax year ended June 30, 2012, there were no post-enactment capital losses generated.
7. Management Fees and Other Transactions with Affiliates
The Fund’s management fee consists of two components – a fund-level fee, based only on the amount of assets within the Fund, and a complex-level fee, based on the aggregate amount of all eligible fund assets managed by the Adviser. This pricing structure enables Fund shareholders to benefit from growth in the assets within the Fund as well as from growth in the amount of complex-wide assets managed by the Adviser.
The annual fund-level fee, payable monthly, is calculated according to the following schedule:
| | | | |
| Average Daily Net Assets | | Fund-Level Fee Rate | |
For the first $125 million | | | 0.5000 | % |
For the next $125 million | | | 0.4875 | |
For the next $250 million | | | 0.4750 | |
For the next $500 million | | | 0.4625 | |
For the next $1 billion | | | 0.4500 | |
For net assets over $2 billion | | | 0.4250 | |
The annual complex-level fee, payable monthly, is calculated according to the following schedule:
| | | | |
| Complex-Level Asset Breakpoint Level* | | Effective Rate at Breakpoint Level | |
$55 billion | | | .2000 | % |
$56 billion | | | .1996 | |
$57 billion | | | .1989 | |
$60 billion | | | .1961 | |
$63 billion | | | .1931 | |
$66 billion | | | .1900 | |
$71 billion | | | .1851 | |
$76 billion | | | .1806 | |
$80 billion | | | .1773 | |
$91 billion | | | .1691 | |
$125 billion | | | .1599 | |
$200 billion | | | .1505 | |
$250 billion | | | .1469 | |
$300 billion | | | .1445 | |
| * | The complex-level fee is calculated based upon the aggregate daily “eligible assets” of all Nuveen Funds. Eligible assets do not include assets attributable to investments in other Nuveen Funds or assets in excess of $2 billion added to the Nuveen Fund complex in connection with the Adviser’s assumption of the management of the former First American Funds effective January 1, 2011. Eligible assets include closed-end fund assets managed by the Adviser that are attributable to financial leverage. For these purposes, financial leverage includes the closed-end funds’ use of preferred stock and borrowings and certain investments in the residual interest certificates (also called inverse floating rate securities) in tender option bond (TOB) trusts, including the portion of assets held by a TOB trust that has been effectively financed by the trust’s issuance of floating rate securities, subject to an agreement by the Adviser as to certain funds to limit the amount of such assets for determining eligible assets in certain circumstances. As of June 30, 2012, the complex-level fee rate for the Fund was .1731%. |
The management fee compensates the Adviser for the overall investment advisory and administrative services and general office facilities. The Adviser is responsible for the Fund’s overall strategy and asset allocation decisions. The Adviser has entered into a sub-advisory agreement with NWQ Investment Management Company, LLC (“NWQ”), an affiliate of Nuveen, under which NWQ manages the investment portfolio of the Fund, including its options strategy. NWQ is compensated for its services to the Fund from the management fees paid to the Adviser.
The Adviser has agreed to waive fees and/or reimburse expenses through October 31, 2012, so that total annual Fund operating expenses (excluding 12b-1 distribution and/or service fees, interest expenses, taxes, fees incurred in acquiring and disposing of portfolio securities and extraordinary expenses) do not exceed .90% (1.15% after October 31, 2012) of the average daily net assets of any class of Fund shares. The Adviser may also voluntarily reimburse additional expenses from time to time. Voluntary reimbursements may be terminated at any time at the Adviser’s discretion.
Notes to Financial Statements (continued)
The Trust pays no compensation directly to those of its trustees who are affiliated with the Adviser or to its officers, all of whom receive remuneration for their services to the Trust from the Adviser or its affiliates. The Board of Trustees has adopted a deferred compensation plan for independent trustees that enables trustees to elect to defer receipt of all or a portion of the annual compensation they are entitled to receive from certain Nuveen-advised funds. Under the plan, deferred amounts are treated as though equal dollar amounts had been invested in shares of select Nuveen-advised funds.
During the fiscal year ended June 30, 2012, Nuveen Securities, LLC, a wholly-owned subsidiary of Nuveen, retained all 12b-1 fees.
At June 30, 2012, Nuveen owned shares of the Fund as follows:
| | | | |
Class A Shares | | | 12,500 | |
Class C Shares | | | 12,500 | |
Class R3 Shares | | | 12,500 | |
Class I Shares | | | 12,500 | |
8. New Accounting Pronouncements
Financial Accounting Standards Board (“FASB”) Balance Sheet (Topic 210): Disclosures about Offsetting Assets and Liabilities
In December 2011, the FASB issued Accounting Standards Update (“ASU”) No. 2011-11 (“ASU No. 2011-11”) to enhance disclosures about financial instruments and derivative instruments that are subject to offsetting (“netting”) on the Statement of Assets and Liabilities. This information will enable users of the entity’s financial statements to evaluate the effect or potential effect of netting arrangements on the entity’s financial position. ASU No. 2011-11 is effective prospectively during interim or annual periods beginning on or after January 1, 2013. At this time, management is evaluating the implications of this guidance and the impact it will have to the financial statements amounts and footnote disclosures, if any.
Trustees and Officers (Unaudited)
The management of the Funds, including general supervision of the duties performed for the Funds by the Adviser, is the responsibility of the Board of Trustees of the Funds. The number of trustees of the Funds is currently set at ten. None of the trustees who are not “interested” persons of the Funds (referred to herein as “independent trustees”) has ever been a director or employee of, or consultant to, Nuveen or its affiliates. The names and business addresses of the trustees and officers of the Funds, their principal occupations and other affiliations during the past five years, the number of portfolios each oversees and other directorships they hold are set forth below.
The Funds’ Statement of Additional Information (“SAI”) includes more information about the trustees. To request a free copy, call Nuveen Investments at (800) 257-8787 or visit the Funds’ website at www.nuveen.com.
| | | | | | | | |
Name, Birthdate and Address | | Position(s) Held with the Funds | | Year First Elected or Appointed (1) | | Principal Occupation(s) Including other Directorships During Past 5 Years | | Number of Portfolios in Fund Complex Overseen by Trustee |
| | |
| Independent Trustees: | | | | |
Robert P. Bremner 8/22/40 333 W. Wacker Drive Chicago, IL 60606 | | Chairman of the Board and Trustee | | 1996 | | Private Investor and Management Consultant; Treasurer and Director, Humanities Council of Washington, D.C.; Board Member, Independent Directors Council affiliated with the Investment Company Institute. | | 220 |
Jack B. Evans 10/22/48 333 W. Wacker Drive Chicago, IL 60606 | | Trustee | | 1999 | | President, The Hall-Perrine Foundation, a private philanthropic corporation (since 1996); Director and Chairman, United Fire Group, a publicly held company; member of the Board of Regents for the State of Iowa University System; Director, Source Media Group; Life Trustee of Coe College and the Iowa College Foundation; formerly, Director, Alliant Energy; formerly, Director, Federal Reserve Bank of Chicago; formerly, President and Chief Operating Officer, SCI Financial Group, Inc., a regional financial services firm. | | 220 |
William C. Hunter 3/6/48 333 W. Wacker Drive Chicago, IL 60606 | | Trustee | | 2004 | | Dean Emeritus (since June 30, 2012), formerly, Dean, Tippie College of Business, University of Iowa (2006-2012); Director (since 2004) of Xerox Corporation; Director (since 2005), and President (since July 2012) Beta Gamma Sigma International Honor Society; Director of Wellmark, Inc. (since 2009); formerly, Dean and Distinguished Professor of Finance, School of Business at the University of Connecticut (2003-2006); previously, Senior Vice President and Director of Research at the Federal Reserve Bank of Chicago (1995-2003); formerly, Director (1997-2007), Credit Research Center at George Washington University. | | 220 |
David J. Kundert 10/28/42 333 W. Wacker Drive Chicago, IL 60606 | | Trustee | | 2005 | | Director, Northwestern Mutual Wealth Management Company; retired (since 2004) as Chairman, JPMorgan Fleming Asset Management, President and CEO, Banc One Investment Advisors Corporation, and President, One Group Mutual Funds; prior thereto, Executive Vice President, Banc One Corporation and Chairman and CEO, Banc One Investment Management Group; Member, Board of Regents, Luther College; member of the Wisconsin Bar Association; member of Board of Directors, Friends of Boerner Botanical Gardens; member of Board of Directors and Chair of Investment Committee, Greater Milwaukee Foundation. | | 220 |
William J. Schneider 9/24/44 333 W. Wacker Drive Chicago, IL 60606 | | Trustee | | 1996 | | Chairman of Miller-Valentine Partners Ltd., a real estate investment company; formerly, Senior Partner and Chief Operating Officer (retired 2004) of Miller-Valentine Group; member, University of Dayton Business School Advisory Council; member, Mid-America Health System Board; formerly, member and chair, Dayton Philharmonic Orchestra Association; formerly, member, Business Advisory Council, Cleveland Federal Reserve Bank. | | 220 |
Judith M. Stockdale 12/29/47 333 W. Wacker Drive Chicago, IL 60606 | | Trustee | | 1997 | | Executive Director, Gaylord and Dorothy Donnelley Foundation (since 1994); prior thereto, Executive Director, Great Lakes Protection Fund (1990-1994). | | 220 |
Carole E. Stone 6/28/47 333 W. Wacker Drive Chicago, IL 60606 | | Trustee | | 2007 | | Director, Chicago Board Options Exchange (since 2006); Director, C2 Options Exchange, Incorporated (since 2009); formerly, Commissioner, New York State Commission on Public Authority Reform (2005-2010); formerly, Chair, New York Racing Association Oversight Board (2005-2007). | | 220 |
Trustees and Officers (Unaudited) (continued)
| | | | | | | | |
Name, Birthdate and Address | | Position(s) Held with the Funds | | Year First Elected or Appointed (1) | | Principal Occupation(s) During Past Five Years | | Number of Portfolios in Fund Complex Overseen by Trustee |
Virginia L. Stringer 8/16/44 333 West Wacker Drive Chicago, IL 60606 | | Trustee | | 2011 | | Board Member, Mutual Fund Directors Forum; former governance consultant and non-profit board member; former Owner and President, Strategic Management Resources, Inc. a management consulting firm; former Member, Governing Board, Investment Company Institute’s Independent Directors Council; previously, held several executive positions in general management, marketing and human resources at IBM and The Pillsbury Company; Independent Director, First American Fund Complex (1987-2010) and Chair (1997-2010). | | 220 |
Terence J. Toth 9/29/59 333 W. Wacker Drive Chicago, IL 60606 | | Trustee | | 2008 | | Director, Legal & General Investment Management America, Inc. (since 2008); Managing Partner, Promus Capital (since 2008); formerly, CEO and President, Northern Trust Global Investments (2004-2007); Executive Vice President, Quantitative Management & Securities Lending (2000-2004); prior thereto, various positions with Northern Trust Company (since 1994); member: Goodman Theatre Board (since 2004), Chicago Fellowship Board (since 2005), Catalyst Schools of Chicago Board (since 2008); Mather Foundation Board (since 2012) and a member of its investment committee; formerly, member: Northern Trust Mutual Funds Board (2005-2007), Northern Trust Global Investments Board (2004-2007), Northern Trust Japan Board (2004-2007), Northern Trust Securities Inc. Board (2003-2007) and Northern Trust Hong Kong Board (1997-2004). | | 220 |
| | |
| Interested Trustee: | | | | |
John P. Amboian (2) 6/14/61 333 W. Wacker Drive Chicago, IL 60606 | | Trustee | | 2008 | | Chief Executive Officer and Chairman (since 2007) and Director (since 1999) of Nuveen Investments, Inc., formerly, President (1999-2007); Chief Executive Officer (since 2007) of Nuveen Investments Advisers Inc.; Director (since 1998) formerly, Chief Executive Officer (2007-2010) of Nuveen Fund Advisors, Inc. | | 220 |
Name, Birthdate and Address | | Position(s) Held with the Funds | | Year First Elected or Appointed (3) | | Principal Occupation(s) During Past 5 Years | | Number of Portfolios in Fund Complex Overseen by Officer |
| | |
| Officers of the Funds: | | | | |
Gifford R. Zimmerman 9/9/56 333 W. Wacker Drive Chicago, IL 60606 | | Chief Administrative Officer | | 1988 | | Managing Director (since 2002), Assistant Secretary of Nuveen Securities, LLC; Managing Director (since 2004) and Assistant Secretary (since 1994) of Nuveen Investments, Inc.; Managing Director (since 2002), Assistant Secretary (since 1997) and Co-General Counsel (since 2011) of Nuveen Fund Advisors, Inc.; Managing Director, Assistant Secretary and Associate General Counsel of Nuveen Asset Management, LLC (since 2011); Managing Director, Associate General Counsel and Assistant Secretary of Symphony Asset Management LLC (since 2003); Vice President and Assistant Secretary of NWQ Investment Management Company, LLC (since 2002), Nuveen Investments Advisers Inc. (since 2002), Santa Barbara Asset Management, LLC (since 2006) and of Winslow Capital Management Inc. (since 2010); Chief Administrative Officer and Chief Compliance Officer (since 2006) of Nuveen Commodities Asset Management, LLC; Chartered Financial Analyst. | | 220 |
Margo L. Cook 4/11/64 333 W. Wacker Drive Chicago, IL 60606 | | Vice President | | 2009 | | Executive Vice President (since 2008) of Nuveen Investments, Inc. and of Nuveen Fund Advisors, Inc. (since 2011); Managing Director – Investment Services of Nuveen Commodities Asset Management, LLC (since August 2011) previously, Head of Institutional Asset Management (2007-2008) of Bear Stearns Asset Management; Head of Institutional Asset Management (1986-2007) of Bank of NY Mellon; Chartered Financial Analyst. | | 220 |
| | | | | | | | |
Name, Birthdate and Address | | Position(s) Held with the Funds | | Year First Elected or Appointed (3) | | Principal Occupation(s) During Past 5 Years | | Number of Portfolios in Fund Complex Overseen by Officer |
Lorna C. Ferguson 10/24/45 333 W. Wacker Drive Chicago, IL 60606 | | Vice President | | 1998 | | Managing Director (since 2005) of Nuveen Fund Advisors, Inc. and Nuveen Securities, LLC (since 2004). | | 220 |
Stephen D. Foy 5/31/54 333 W. Wacker Drive Chicago, IL 60606 | | Vice President and Controller | | 1998 | | Senior Vice President (since 2010), formerly, Vice President (2005-2010) and Funds Controller of Nuveen Securities, LLC; Vice President of Nuveen Fund Advisors, Inc.; Chief Financial Officer of Nuveen Commodities Asset Management, LLC (since 2010); Certified Public Accountant. | | 220 |
Scott S. Grace 8/20/70 333 W. Wacker Drive Chicago, IL 60606 | | Vice President and Treasurer | | 2009 | | Managing Director, Corporate Finance & Development, Treasurer (since 2009) of Nuveen Securities, LLC; Managing Director and Treasurer (since 2009) of Nuveen Fund Advisors, Inc., Nuveen Investments Advisers, Inc., Nuveen Investments Holdings Inc. and (since 2011) Nuveen Asset Management, LLC; Vice President and Treasurer of NWQ Investment Management Company, LLC, Tradewinds Global Investors, LLC, Symphony Asset Management LLC and Winslow Capital Management, Inc.; Vice President of Santa Barbara Asset Management, LLC; formerly, Treasurer (2006-2009), Senior Vice President (2008-2009), previously, Vice President (2006-2008) of Janus Capital Group, Inc.; formerly, Senior Associate in Morgan Stanley’s Global Financial Services Group (2000-2003); Chartered Accountant Designation. | | 220 |
Walter M. Kelly 2/24/70 333 W. Wacker Drive Chicago, IL 60606 | | Chief Compliance Officer and Vice President | | 2003 | | Senior Vice President (since 2008) and Assistant Secretary (since 2003) of Nuveen Fund Advisors, Inc; Senior Vice President (since 2008) of Nuveen Investments Holdings, Inc; formerly, Senior Vice President (2008-2011) of Nuveen Securities, LLC. | | 220 |
Tina M. Lazar 8/27/61 333 W. Wacker Drive Chicago, IL 60606 | | Vice President | | 2002 | | Senior Vice President (since 2010), formerly, Vice President (2005-2010) of Nuveen Fund Advisors, Inc. | | 220 |
Name, Birthdate and Address | | Position(s) Held with the Funds | | Year First Elected or Appointed (3) | | Principal Occupation(s) Including other Directorships During Past 5 Years | | Number of Portfolios in Fund Complex Overseen by Officer |
Kevin J. McCarthy 3/26/66 333 W. Wacker Drive Chicago, IL 60606 | | Vice President and Secretary | | 2007 | | Managing Director and Assistant Secretary (since 2008), formerly, Vice President (2007-2008), Nuveen Securities, LLC; Managing Director (since 2008), Assistant Secretary (since 2007) and Co-General Counsel (since 2011) of Nuveen Fund Advisors, Inc.; Managing Director, Assistant Secretary and Associate General Counsel (since 2011) of Nuveen Asset Management, LLC; Managing Director (since 2008), and Assistant Secretary, Nuveen Investment Holdings, Inc.; Vice President (since 2007) and Assistant Secretary of Nuveen Investments Advisers Inc., NWQ Investment Management Company, LLC, Tradewinds Global Investors LLC, NWQ Holdings, LLC, Symphony Asset Management LLC, Santa Barbara Asset Management, LLC, and of Winslow Capital Management, Inc. (since 2010); Vice President and Secretary (since 2010) of Nuveen Commodities Asset Management, LLC; prior thereto, Partner, Bell, Boyd & Lloyd LLP (1997-2007). | | 220 |
Kathleen L. Prudhomme 3/30/53 901 Marquette Avenue Minneapolis, MN 55402 | | Vice President and Assistant Secretary | | 2011 | | Managing Director, Assistant Secretary and Co-General Counsel (since 2011) of Nuveen Fund Advisors, Inc.; Managing Director, Assistant Secretary and Associate General Counsel (since 2011) of Nuveen Asset Management, LLC; Managing Director and Assistant Secretary (since 2011) of Nuveen Securities, LLC; formerly, Deputy General Counsel, FAF Advisors, Inc. (2004-2010). | | 220 |
Trustees and Officers (Unaudited) (continued)
| | | | | | | | |
Name, Birthdate and Address | | Position(s) Held with the Funds | | Year First Elected or Appointed (3) | | Principal Occupation(s) Including other Directorships During Past 5 Years | | Number of Portfolios in Fund Complex Overseen by Officer |
Jeffery M. Wilson 3/13/56 333 West Wacker Drive Chicago, IL 60606 | | Vice President | | 2011 | | Senior Vice President of Nuveen Securities, LLC (since 2011); formerly, Senior Vice President of FAF Advisors, Inc. (2000-2010). | | 102 |
| (1) | Trustees serve an indefinite term until his/her successor is elected or appointed. The year first elected or appointed represents the year in which the trustee was first elected or appointed to any fund in the Nuveen Fund Complex. |
| (2) | Mr. Amboian is an interested trustee because of his position with Nuveen Investments, Inc. and certain of its subsidiaries, which are affiliates of the Nuveen Funds. |
| (3) | Officers serve one year terms through August of each year. The year first elected or appointed represents the year in which the officer was first elected or appointed to any fund in the Nuveen Fund Complex. |
Annual Investment Management Agreement Approval Process
(Unaudited)
The Board of Trustees (the ”Board” and each Trustee, a “Board Member”) of the Fund, including the Board Members who are not parties to the Fund’s advisory or sub-advisory agreement or “interested persons” of any such parties (the “Independent Board Members”), is responsible for approving the advisory agreement (the “Investment Management Agreement”) between the Fund and Nuveen Fund Advisors, Inc. (the “Advisor”) and the sub-advisory agreement (the “Sub-Advisory Agreement”) between the Advisor and NWQ Investment Management Company, LLC (the “Sub-Advisor”) (the Investment Management Agreement and the Sub-Advisory Agreement are referred to collectively as the “Advisory Agreements”) and their periodic continuation. Pursuant to the Investment Company Act of 1940, as amended (the “1940 Act”), the Board is required to consider the continuation of the Advisory Agreements on an annual basis. Accordingly, at an in-person meeting held on May 21-23, 2012 (the “May Meeting”), the Board, including a majority of the Independent Board Members, considered and approved the continuation of the Advisory Agreements for the Fund for an additional one-year period.
In preparation for their considerations at the May Meeting, the Board requested and received extensive materials prepared in connection with the review of the Advisory Agreements. The materials provided a broad range of information regarding the Fund, the Advisor and the Sub-Advisor (the Advisor and the Sub-Advisor are collectively, the “Fund Advisers” and each, a “Fund Adviser”). As described in more detail below, the information provided included, among other things, a review of Fund performance, including Fund investment performance assessments against peer groups and appropriate benchmarks, a comparison of Fund fees and expenses relative to peers, a description and assessment of shareholder service levels for the Fund, a summary of the performance of certain service providers, a review of product initiatives and shareholder communications and an analysis of the Advisor’s profitability with comparisons to comparable peers in the managed fund business. As part of their annual review, the Board also held a separate meeting on April 18-19, 2012, to review the Fund’s investment performance and consider an analysis provided by the Advisor of the Sub-Advisor which generally evaluated the Sub-Advisor’s investment team, investment mandate, organizational structure and history, investment philosophy and process, performance of the Fund, and significant changes to the foregoing. As a result of their review of the materials and discussions, the Board presented the Advisor with questions and the Advisor responded.
The materials and information prepared in connection with the annual review of the Advisory Agreements supplement the information and analysis provided to the Board during the year. In this regard, throughout the year, the Board, acting directly or through its committees, regularly reviews the performance and various services provided by the Advisor and the Sub-Advisor. The Board meets at least quarterly as well as at other times as the need arises. At its quarterly meetings, the Board reviews reports by the Advisor which include, among other things, Fund performance, a review of the investment teams and reports on compliance, regulatory matters and risk management. The Board also meets with key investment personnel managing the Fund portfolios during the year. In October 2011, the Board also created two new standing committees (the Open-end Fund Committee and the Closed-end Fund Committee) to assist the full Board in monitoring and gaining a deeper insight into the distinctive issues and business practices of open-end and closed-end funds.
In addition, the Board continues its program of seeking to have the Board Members or a subset thereof visit each sub-advisor to the Nuveen funds at least once over a multiple year rotation, meeting with key investment and business personnel. In this regard, the Independent Board Members made a site visit to the Sub-Advisor in February 2011. Further, an ad hoc committee of the Board visited the then-current transfer agents of the Nuveen funds in 2011 and the audit committee of the Board visited the various pricing agents for the Nuveen funds in January 2012.
The Board considers factors and information that are relevant to its annual consideration of the renewal of the Advisory Agreements at the meetings held throughout the year. Accordingly, the Board considers the information provided and knowledge gained at these meetings when performing its annual review of the Advisory Agreements. The Independent Board Members are assisted throughout the process by independent legal counsel who provided materials describing applicable law and the duties of directors or trustees in reviewing advisory contracts and met with the Independent Board Members in executive sessions without management present. In addition, it is important to recognize that the management arrangements for the Nuveen funds are the result of many years of review and discussion between the Independent Board Members and fund management and that the Board Members’ conclusions may be based, in part, on their consideration of fee arrangements and other factors developed in previous years.
The Board considered all factors it believed relevant with respect to the Fund, including among other factors: (a) the nature, extent and quality of the services provided by the Fund Advisers, (b) the investment performance of the Fund and Fund Advisers, (c) the advisory fees and costs of the services to be provided to the Fund and the profitability of the Fund Advisers, (d) the extent of any economies of scale, (e) any benefits derived by the Fund Advisers from the relationship with the Fund and (f) other factors. Each Board Member may have accorded different weight to the various factors in reaching his or her conclusions with respect to the Fund’s Advisory Agreements. The Independent Board Members did not identify any single factor as all important or controlling. The Independent Board Members’ considerations were instead based on a comprehensive consideration of all the information presented. The principal factors considered by the Board and its conclusions are described below.
A. Nature, Extent and Quality of Services
In considering renewal of the Advisory Agreements, the Independent Board Members considered the nature, extent and quality of the Fund Adviser’s services, including advisory services and the resulting Fund performance and administrative services. The Independent Board Members further considered the overall reputation and capabilities of the Advisor and its affiliates, the commitment of the
Annual Investment Management Agreement Approval Process
(Unaudited) (continued)
Advisor to provide high quality service to the Fund, their overall confidence in the Advisor’s integrity and the Advisor’s responsiveness to questions and concerns raised by them. The Independent Board Members reviewed materials outlining, among other things, the Fund Adviser’s organization and business; the types of services that the Fund Adviser or its affiliates provide to the Fund; the performance record of the Fund (as described in further detail below); and any initiatives Nuveen had taken for the applicable fund product line.
In considering advisory services, the Board recognized that the Advisor provides various oversight, administrative, compliance and other services for the Fund and the Sub-Advisor generally provides the portfolio investment management services to the Fund. In reviewing the portfolio management services provided to the Fund, the Board reviewed the materials provided by the Nuveen Investment Services Oversight Team analyzing, among other things, the Sub-Advisor’s investment team and changes thereto, organization and history, assets under management, Fund objectives and mandate, the investment team’s philosophy and strategies in managing the Fund, developments affecting the Sub-Advisor or Fund and Fund performance. The Independent Board Members also reviewed portfolio manager compensation arrangements to evaluate each Fund Adviser’s ability to attract and retain high quality investment personnel, preserve stability, and reward performance but not provide an inappropriate incentive to take undue risks. In addition, the Board considered the Advisor’s execution of its oversight responsibilities over the Sub-Advisor. Given the importance of compliance, the Independent Board Members also considered Nuveen’s compliance program, including the report of the chief compliance officer regarding the Fund’s compliance policies and procedures; the resources dedicated to compliance; and the record of compliance with the policies and procedures.
In addition to advisory services, the Board considered the quality and extent of administrative and other non-investment advisory services the Advisor and its affiliates provide to the Fund, including product management, investment services (such as oversight of investment policies and procedures, risk management, and pricing), fund administration, oversight of service providers, shareholder services and communications, administration of Board relations, regulatory and portfolio compliance and legal support. The Board further recognized Nuveen’s additional investments in personnel, including in compliance and risk management. In reviewing the services provided, the Board also reviewed materials describing various notable initiatives and projects the Advisor performed in connection with the open-end fund product line. These initiatives included efforts to eliminate product overlap through mergers or liquidations; commencement of various new funds; elimination of insurance mandates for various funds; updates in investment policies or guidelines for several funds; and reductions in management fees and expense caps for certain funds.
Based on their review, the Independent Board Members found that, overall, the nature, extent and quality of services provided to the Fund under each Advisory Agreement were satisfactory.
B. The Investment Performance of the Fund and Fund Advisers
The Board, including the Independent Board Members, reviewed and considered the performance history of the Fund over various time periods. The Board reviewed, among other things, the Fund’s historic investment performance as well as information comparing the Fund’s performance information with that of other funds (the “Performance Peer Group”) based on data compiled by Nuveen that was provided by an independent provider of mutual fund data and with recognized and/or customized benchmarks (i.e., benchmarks derived from multiple recognized benchmarks).
The Board reviewed reports, including a comprehensive analysis of the Fund’s performance and the applicable investment team. In this regard, the Board reviewed the Fund’s total return information compared to the returns of its Performance Peer Group and recognized and/or customized benchmarks for the quarter and one-year periods ending December 31, 2011, as well as performance information reflecting the first quarter of 2012.
In reviewing performance comparison information, the Independent Board Members recognized that the usefulness of the comparisons of the performance of certain funds with the performance of their respective Performance Peer Group may be limited because the Performance Peer Group may not adequately represent the objectives and strategies of the applicable funds or may be limited in size or number. The Independent Board Members also noted that the investment experience of a particular shareholder in the Nuveen funds will vary depending on when such shareholder invests in the applicable fund, the class held (if multiple classes are offered in a fund) and the performance of the fund (or respective class) during that shareholder’s investment period. In addition, although the performance below reflects the performance results for the time periods ending as of the most recent calendar year end (unless otherwise indicated), the Board also recognized that selecting a different ending time period may derive different results. Furthermore, while the Board is cognizant of the relevant performance of a fund’s peer set and/or benchmark(s), the Board evaluated fund performance in light of the respective fund’s investment objectives, investment parameters and guidelines and recognized that the objectives, investment parameters and guidelines of peers and/or benchmarks may differ to some extent, thereby resulting in differences in performance results. Nevertheless, with respect to any Nuveen funds that the Board considers to have underperformed their peers and/or benchmarks from time to time, the Board monitors such funds closely and considers any steps necessary or appropriate to address such issues.
In reviewing the performance information, the Independent Board Members noted that the Fund was relatively new with a shorter performance history available, thereby limiting the ability to make a meaningful assessment of performance.
C. Fees, Expenses and Profitability
1. Fees and Expenses
The Board evaluated the management fees and expenses of the Fund reviewing, among other things, the Fund’s gross management fees, net management fees and net expense ratios in absolute terms as well as compared to the fee and expenses of a comparable universe of funds provided by an independent fund data provider (the “Peer Universe”) and to a more focused subset of funds in the Peer Universe (the “Peer Group”) and any expense limitations.
The Independent Board Members further reviewed the methodology regarding the construction of the applicable Peer Universe and Peer Group. In reviewing the comparisons of fee and expense information, the Independent Board Members took into account that in certain instances various factors such as: the limited size and particular composition of the Peer Universe or Peer Group (including the inclusion of other Nuveen funds in the peer set); expense anomalies; changes in the funds comprising the Peer Universe or Peer Group from year to year; levels of reimbursement or fee waivers; and the timing of information used may impact the comparative data, thereby limiting somewhat the ability to make a meaningful comparison with peers.
In reviewing the fee schedule for the Fund, the Independent Board Members also considered the fund-level and complex-wide breakpoint schedules (described in further detail below) and any fee waivers and reimbursements provided by Nuveen. In reviewing fees and expenses, the Board considered the expenses and fees to be higher if they were over 10 basis points higher, slightly higher if they were approximately 6 to 10 basis points higher, in line if they were within approximately 5 basis points higher than the peer average and below if they were below the peer average of the Peer Group. In reviewing the reports, the Board noted that the overwhelming majority of the Nuveen funds were at, close to or below their Peer Group or Peer Universe (if no separate Peer Group) average based on the net total expense ratio. The Independent Board Members noted that the Fund had net management fees and a net expense ratio (including fee waivers and expense reimbursements, if any) below its peer averages.
Based on their review of the fee and expense information provided, the Independent Board Members determined that the Fund’s management fees were reasonable in light of the nature, extent and quality of services provided to it.
2. Comparisons with the Fees of Other Clients
The Independent Board Members further reviewed information regarding the nature of services and range of fees offered by the Advisor to other clients, including separately managed accounts (both retail and institutional accounts), collective trusts, foreign investment funds offered by Nuveen and funds that are not offered by Nuveen but are sub-advised by one of Nuveen’s investment management teams. In evaluating the comparisons of fees, the Independent Board Members noted that the fee rates charged to the Fund and other clients vary, among other things, because of the different services involved and the additional regulatory and compliance requirements associated with registered investment companies, such as the Fund. Accordingly, the Independent Board Members considered the differences in the product types, including, but not limited to, the services provided, the structure and operations, product distribution and costs thereof, portfolio investment policies, investor profiles, account sizes and regulatory requirements. The Independent Board Members noted, in particular, that the range of services provided to the Fund (as discussed above) is much more extensive than that provided to separately managed accounts. Given the inherent differences in the various products, particularly the extensive services provided to the Fund, the Independent Board Members believe such facts justify the different levels of fees.
In considering the fees of the Sub-Advisor, the Independent Board Members also considered the pricing schedule or fees that the Sub-Advisor charges for similar investment management services for other Nuveen funds, funds of other sponsors (if any), and other clients (such as retail and/or institutional managed accounts).
3. Profitability of Fund Advisers
In conjunction with its review of fees, the Independent Board Members also considered the profitability of Nuveen for its advisory activities and its financial condition. The Independent Board Members reviewed the revenues and expenses of Nuveen’s advisory activities for the last two calendar years, the allocation methodology used in preparing the profitability data and an analysis of the key drivers behind the changes in revenues and expenses that impacted profitability in 2011. The Independent Board Members noted this information supplemented the profitability information requested and received during the year to help keep them apprised of developments affecting profitability (such as changes in fee waivers and expense reimbursement commitments). In this regard, the Independent Board Members noted that they have an Independent Board Member serve as a point person to review and keep them apprised of changes to the profitability analysis and/or methodologies during the year. The Independent Board Members also considered Nuveen’s revenues for advisory activities, expenses, and profit margin compared to that of various unaffiliated management firms with comparable assets under management (based on asset size and asset composition).
In reviewing profitability, the Independent Board Members recognized the Advisor’s continued investment in its business to enhance its services, including capital improvements to investment technology, updated compliance systems, and additional personnel in compliance, risk management, and product development as well as its ability to allocate resources to various areas of the Advisor as the need arises. In addition, in evaluating profitability, the Independent Board Members also recognized the subjective nature of determining profitability which may be affected by numerous factors including the allocation of expenses. Further, the Independent Board Members recognized the difficulties in making comparisons as the profitability of other advisers
Annual Investment Management Agreement Approval Process
(Unaudited) (continued)
generally is not publicly available and the profitability information that is available for certain advisers or management firms may not be representative of the industry and may be affected by, among other things, the adviser’s particular business mix, capital costs, types of funds managed and expense allocations. Notwithstanding the foregoing, the Independent Board Members reviewed Nuveen’s methodology and assumptions for allocating expenses across product lines to determine profitability. In reviewing profitability, the Independent Board Members recognized Nuveen’s investment in its fund business. Based on their review, the Independent Board Members concluded that the Advisor’s level of profitability for its advisory activities was reasonable in light of the services provided.
With respect to sub-advisers affiliated with Nuveen, including the Sub-Advisor, the Independent Board Members reviewed the sub-adviser’s revenues, expenses and profitability margins (pre- and post-tax) for its advisory activities and the methodology used for allocating expenses among the internal sub-advisers. Based on their review, the Independent Board Members were satisfied that the Sub-Advisor’s level of profitability was reasonable in light of the services provided.
In evaluating the reasonableness of the compensation, the Independent Board Members also considered other amounts paid to a Fund Adviser by the Fund as well as any indirect benefits (such as soft dollar arrangements, if any) the Fund Adviser and its affiliates receive, or are expected to receive, that are directly attributable to the management of the Fund, if any. See Section E below for additional information on indirect benefits a Fund Adviser may receive as a result of its relationship with the Fund. Based on their review of the overall fee arrangements of the Fund, the Independent Board Members determined that the advisory fees and expenses of the Fund were reasonable.
D. Economies of Scale and Whether Fee Levels Reflect These Economies of Scale
With respect to economies of scale, the Independent Board Members have recognized the potential benefits resulting from the costs of a fund being spread over a larger asset base, although economies of scale are difficult to measure and predict with precision, particularly on a fund-by-fund basis. One method to help ensure the shareholders share in these benefits is to include breakpoints in the advisory fee schedule. Generally, management fees for funds in the Nuveen complex are comprised of a fund-level component and a complex-level component, subject to certain exceptions. Accordingly, the Independent Board Members reviewed and considered the applicable fund-level breakpoints in the advisory fee schedules that reduce advisory fees as asset levels increase.
In addition to fund-level advisory fee breakpoints, the Board also considered the Fund’s complex-wide fee arrangement. Pursuant to the complex-wide fee arrangement, the fees of the funds in the Nuveen complex are generally reduced as the assets in the fund complex reach certain levels. The complex-wide fee arrangement seeks to provide the benefits of economies of scale to fund shareholders when total fund complex assets increase, even if assets of a particular fund are unchanged or have decreased. The approach reflects the notion that some of Nuveen’s costs are attributable to services provided to all its funds in the complex and therefore all funds benefit if these costs are spread over a larger asset base. In addition, with the acquisition of the funds previously advised by FAF Advisors, Inc., the Board noted that a portion of such funds’ assets at the time of acquisition were deemed eligible to be included in the complex-wide fee calculation in order to deliver fee savings to shareholders in the combined complex and such funds were subject to differing complex-level fee rates.
Based on their review, the Independent Board Members concluded that the breakpoint schedules and complex-wide fee arrangement were acceptable and reflect economies of scale to be shared with shareholders when assets under management increase.
E. Indirect Benefits
In evaluating fees, the Independent Board Members received and considered information regarding potential “fall out” or ancillary benefits the respective Fund Adviser or its affiliates may receive as a result of its relationship with the Fund. In this regard, the Independent Board Members considered, among other things, any sales charges, distribution fees and shareholder services fees received and retained by the Fund’s principal underwriter, an affiliate of the Advisor, which includes fees received pursuant to any 12b-1 plan. The Independent Board Members, therefore, considered the 12b-1 fees retained by Nuveen during the last calendar year.
In addition to the above, the Independent Board Members considered whether the Fund Advisers received any benefits from soft dollar arrangements whereby a portion of the commissions paid by the Fund for brokerage may be used to acquire research that may be useful to the Fund Adviser in managing the assets of the Fund and other clients. The Independent Board Members recognized that the Advisor has the authority to pay a higher commission in return for brokerage and research services if it determines in good faith that the commission paid is reasonable in relation to the value of the brokerage and research services provided and may benefit from such soft dollar arrangements. In addition, the Independent Board Members considered that the Sub-Advisor may benefit from its soft dollar arrangements pursuant to which it receives research from brokers that execute the Fund’s portfolio transactions. Similarly, the Board recognized that the research received pursuant to soft dollar arrangements by a Fund Adviser may also benefit the Fund and shareholders to the extent the research enhances the ability of the Fund Adviser to manage the Fund. The Independent Board Members noted that the Fund Advisers’ profitability may be somewhat lower if they did not receive the research services pursuant to the soft dollar arrangements and had to acquire such services directly.
Based on their review, the Independent Board Members concluded that any indirect benefits received by a Fund Adviser as a result of its relationship with the Fund were reasonable and within acceptable parameters.
F. Other Considerations
The Independent Board Members did not identify any single factor discussed previously as all-important or controlling. The Board Members, including the Independent Board Members, unanimously concluded that the terms of each Advisory Agreement are fair and reasonable, that the respective Fund Adviser’s fees are reasonable in light of the services provided to the Fund and that the Advisory Agreements be renewed.
Glossary of Terms Used in this Report
Average Annual Total Return: This is a commonly used method to express an investment’s performance over a particular, usually multi-year time period. It expresses the return that would have been necessary each year to equal the investment’s actual cumulative performance (including change in NAV or offer price and reinvested dividends and capital gains distributions, if any) over the time period being considered.
Lipper Equity Income Funds Classification Average: Represents the average annualized total return for all reporting funds in the Lipper Equity Income Funds Classification. Lipper returns account for the effects of management fees and assume reinvestment of distributions, but do not reflect any applicable sales charge.
Net Asset Value (NAV): The net market value of all securities held in a portfolio.
Net Asset Value (NAV) Per Share: The market value of one share of a mutual fund or closed-end fund. For a Fund, the NAV is calculated daily by taking the Fund’s total assets (securities, cash, and accrued earnings), subtracting the Fund’s liabilities, and dividing by the number of shares outstanding.
Russell 1000 Value Index: An index that measures the performance of those Russell 1000 companies with lower price-to-book ratios and lower forecasted growth values. Index returns assume reinvestment of distributions, but do not include the effects of any applicable sales charges or management fees.
Additional Fund Information
Fund Manager
Nuveen Fund Advisors, Inc.
333 West Wacker Drive
Chicago, IL 60606
Sub-Adviser
NWQ Investment Management
Company, LLC
2049 Century Park East
Los Angeles, CA 90097
Legal Counsel
Chapman and Cutler LLP
Chicago, IL
Independent Registered
Public Accounting Firm
PricewaterhouseCoopers LLP
Chicago, IL
Custodian
State Street Bank & Trust Company
Boston, MA
Transfer Agent and Shareholder Services
Boston Financial
Data Services
Nuveen Investor Services
P.O. Box 8530
Boston, MA 02266-8530
(800) 257-8787
Distribution Information: The Fund hereby designates its percentages of dividends paid from net ordinary income as dividends qualifying for the 70% dividends received deduction (“DRD”) for corporations and its percentages as qualified dividend income (“QDI”) for individuals under Section 1 (h)(11) of the Internal Revenue Code as shown in the accompanying table. The actual qualified dividend income distributions will be reported to shareholders on Form 1099-DIV which will be sent to shareholders shortly after calendar year end.
| | | | | | | | |
| | | % of DRD | | | % of QDI | |
Nuveen NWQ Equity Income Fund | | | 37.71 | % | | | 52.46 | % |
Fund’s Quarterly Portfolio of Investments and Proxy Voting Information: You may obtain (i) the Fund’s quarterly portfolio of investments, (ii) information regarding how the Fund voted proxies relating to portfolio securities held during the most recent twelve-month period ended June 30, and (iii) a description of the policies and procedures that the Fund used to determine how to vote proxies relating to portfolio securities without charge, upon request, by calling Nuveen Investments at (800) 257-8787 or on Nuveen’s website at www.nuveen.com.
You may also obtain this and other Fund information directly from the Securities and Exchange Commission (SEC). The SEC may charge a copying fee for this information. Visit the SEC on-line at http://www.sec.gov or in person at the SEC’s Public Reference Room in Washington, D.C. Call the SEC at (202) 942-8090 for room hours and operation. You may also request Fund information by sending an e-mail request to publicinfo@sec.gov or by writing to the SEC’s Public Reference Section at 100 F Street NE, Washington, D.C. 20549.
The Financial Industry Regulatory Authority (FINRA) provides a Public Disclosure Program which supplies certain information regarding the disciplinary history of FINRA members and their associated persons in response to either telephone inquiries at (800) 289-9999 or written inquiries at www.finra.org. FINRA also provides an investor brochure that includes information describing the Public Disclosure Program.
Nuveen Investments:
Serving Investors for Generations
Since 1898, financial advisors and their clients have relied on Nuveen Investments to provide dependable investment solutions through continued adherence to proven, long-term investing principles. Today, we offer a range of high quality equity and fixed-income solutions designed to be integral components of a well-diversified core portfolio.
Focused on meeting investor needs.
Nuveen Investments provides high-quality investment services designed to help secure the long-term goals of institutional and individual investors as well as the consultants and financial advisors who serve them. Nuveen Investments markets a wide range of specialized investment solutions which provide investors access to capabilities of its high-quality boutique investment affiliates-Nuveen Asset Management, Symphony Asset Management, NWQ Investment Management Company, Santa Barbara Asset Management, Tradewinds Global Investors, Winslow Capital Management, and Gresham Investment Management. In total, Nuveen Investments managed $212 billion as of June 30, 2012.
Find out how we can help you.
To learn more about how the products and services of Nuveen Investments may be able to help you meet your financial goals, talk to your financial advisor, or call us at (800) 257-8787. Please read the information provided carefully before you invest. Investors should consider the investment objective and policies, risk considerations, charges and expenses of any investment carefully. Where applicable, be sure to obtain a prospectus, which contains this and other relevant information. To obtain a prospectus, please contact your securities representative or Nuveen Investments, 333 W. Wacker Dr., Chicago, IL 60606. Please read the prospectus carefully before you invest or send money.
Learn more about Nuveen Funds at: www.nuveen.com/mf
| | |
Distributed by Nuveen Securities, LLC 333 West Wacker Drive Chicago, IL 60606 www.nuveen.com | | |
MAN-NEQI-0612P
ITEM 2. CODE OF ETHICS.
As of the end of the period covered by this report, the registrant has adopted a code of ethics that applies to the registrant’s principal executive officer, principal financial officer, principal accounting officer or controller, or persons performing similar functions. There were no amendments to or waivers from the code during the period covered by this report. The registrant has posted the code of ethics on its website at www.nuveen.com/mf. (To view the code, click on the Shareholder Resources drop down menu box, click on Fund Governance and then click on Code of Conduct.)
ITEM 3. AUDIT COMMITTEE FINANCIAL EXPERT.
The registrant’s Board of Trustees determined that the registrant has at least one “audit committee financial expert” (as defined in Item 3 of Form N-CSR) serving on its Audit Committee. The registrant’s audit committee financial expert is Carole E. Stone, who is “independent” for purposes of Item 3 of Form N-CSR.
Ms. Stone served for five years as Director of the New York State Division of the Budget. As part of her role as Director, Ms. Stone was actively involved in overseeing the development of the State’s operating, local assistance and capital budgets, its financial plan and related documents; overseeing the development of the State’s bond-related disclosure documents and certifying that they fairly presented the State’s financial position; reviewing audits of various State and local agencies and programs; and coordinating the State’s system of internal audit and control. Prior to serving as Director, Ms Stone worked as a budget analyst/examiner with increasing levels of responsibility over a 30 year period, including approximately five years as Deputy Budget Director. Ms. Stone has also served as Chair of the New York State Racing Association Oversight Board, as Chair of the Public Authorities Control Board, as a Commissioner on the New York State Commission on Public Authority Reform and as a member of the Boards of Directors of several New York State public authorities. These positions have involved overseeing operations and finances of certain entities and assessing the adequacy of project/entity financing and financial reporting. Currently, Ms. Stone is on the Board of Directors of CBOE Holdings, Inc., of the Chicago Board Options Exchange, and of C2 Options Exchange. Ms. Stone’s position on the boards of these entities and as a member of both CBOE Holdings’ Audit Committee and its Finance Committee has involved, among other things, the oversight of audits, audit plans and preparation of financial statements.
ITEM 4. PRINCIPAL ACCOUNTANT FEES AND SERVICES.
The following tables show the amount of fees that PricewaterhouseCoopers LLP, the Trust’s auditor, billed to the Trust during the Trust’s last two full fiscal years. The Audit Committee approved in advance all audit services and non-audit services that PricewaterhouseCoopers LLP provided to the Trust, except for those non-audit services that were subject to the pre-approval exception under Rule 2-01 of Regulation S-X (the “pre-approval exception”). The pre-approval exception for services provided directly to the Trust waives the pre-approval requirement for services other than audit, review or attest services if: (A) the aggregate amount of all such services provided constitutes no more than 5% of the total amount of revenues paid by the Trust during the fiscal year in which the services are provided; (B) the Trust did not recognize the services as non-audit services at the time of the engagement; and (C) the services are promptly brought to the Audit Committee’s attention, and the Committee (or its delegate) approves the services before the audit is completed.
The Audit Committee has delegated certain pre-approval responsibilities to its Chairman (or, in his absence, any other member of the Audit Committee).
SERVICES THAT THE TRUST’S AUDITOR BILLED TO THE TRUST
| | | | | | | | | | | | | | | | |
Fiscal Year Ended June 30, 2012 | | Audit Fees Billed
to Funds 1 | | | Audit-Related Fees
Billed to Funds 2 | | | Tax Fees
Billed to Funds 3 | | | All Other Fees
Billed to Funds 4 | |
Name of Series | | | | | | | | | | | | | | | | |
Global Total Return Fund 5 | | | 35,050 | | | | 0 | | | | 0 | | | | 0 | |
Multi-Manager Large-Cap Value Fund | | | 12,612 | | | | 0 | | | | 2,940 | | | | 0 | |
NWQ Equity Income Fund | | | 11,205 | | | | 0 | | | | 0 | | | | 0 | |
NWQ Large-Cap Value Fund | | | 13,547 | | | | 0 | | | | 2,940 | | | | 0 | |
NWQ Multi-Cap Value Fund | | | 12,201 | | | | 0 | | | | 2,940 | | | | 0 | |
NWQ Small/Mid-Cap Value Fund | | | 11,318 | | | | 0 | | | | 2,940 | | | | 0 | |
NWQ Small-Cap Value Fund | | | 11,675 | | | | 0 | | | | 2,940 | | | | 0 | |
Tradewinds Value Opportunities Fund | | | 26,202 | | | | 0 | | | | 4,440 | | | | 0 | |
| | | | | | | | | | | | | | | | |
Total | | $ | 133,810 | | | $ | 0 | | | $ | 19,140 | | | $ | 0 | |
| 1 | | “Audit Fees” are the aggregate fees billed for professional services for the audit of the Fund’s annual financial statements and services provided in connection with statutory and regulatory filings or engagements. |
| 2 | | “Audit Related Fees” are the aggregate fees billed for assurance and related services reasonably related to the performance of the audit or review of financial statements and are not reported under “Audit Fees”. |
| 3 | | “Tax Fees” are the aggregate fees billed for professional services for tax advice, tax compliance, and tax planning. |
| 4 | | “All Other Fees” are the aggregate fees billed for products and services other than “Audit Fees”, “Audit Related Fees”, and “Tax Fees”. |
| 5 | | The Fund commenced operations on 12/02/2011. |
| | | | | | | | | | | | | | | | |
| | | Percentage Approved Pursuant to Pre-approval Exception | |
| | | Audit Fees Billed
to Funds | | | Audit-Related Fees
Billed to Funds | | | Tax Fees
Billed to Funds | | | All Other Fees
Billed to Funds | |
Name of Series | | | | | | | | | | | | | | | | |
Global Total Return Fund | | | 0 | % | | | 0 | % | | | 0 | % | | | 0 | % |
Multi-Manager Large-Cap Value Fund | | | 0 | % | | | 0 | % | | | 0 | % | | | 0 | % |
NWQ Equity Income Fund | | | 0 | % | | | 0 | % | | | 0 | % | | | 0 | % |
NWQ Large-Cap Value Fund | | | 0 | % | | | 0 | % | | | 0 | % | | | 0 | % |
NWQ Multi-Cap Value Fund | | | 0 | % | | | 0 | % | | | 0 | % | | | 0 | % |
NWQ Small/Mid-Cap Value Fund | | | 0 | % | | | 0 | % | | | 0 | % | | | 0 | % |
NWQ Small-Cap Value Fund | | | 0 | % | | | 0 | % | | | 0 | % | | | 0 | % |
Tradewinds Value Opportunities Fund | | | 0 | % | | | 0 | % | | | 0 | % | | | 0 | % |
| | | | |
Fiscal Year Ended June 30, 2011 | | Audit Fees Billed
to Funds 1 | | | Audit-Related Fees
Billed to Funds 2 | | | Tax Fees
Billed to Funds 3 | | | All Other Fees
Billed to Funds 4 | |
Name of Series | | | | | | | | | | | | | | | | |
Global Total Return Fund | | | N/A | | | | N/A | | | | N/A | | | | N/A | |
Multi-Manager Large-Cap Value Fund | | | 13,548 | | | | 0 | | | | 2,850 | | | | 0 | |
NWQ Equity Income Fund | | | 11,009 | | | | 0 | | | | 0 | | | | 0 | |
NWQ Large-Cap Value Fund | | | 14,010 | | | | 0 | | | | 2,850 | | | | 0 | |
NWQ Multi-Cap Value Fund | | | 13,715 | | | | 0 | | | | 2,850 | | | | 0 | |
NWQ Small/Mid-Cap Value Fund | | | 11,159 | | | | 0 | | | | 2,850 | | | | 0 | |
NWQ Small-Cap Value Fund | | | 11,941 | | | | 0 | | | | 2,850 | | | | 0 | |
Tradewinds Value Opportunities Fund | | | 34,448 | | | | 0 | | | | 2,850 | | | | 0 | |
| | | | | | | | | | | | | | | | |
Total | | $ | 109,830 | | | $ | 0 | | | $ | 17,100 | | | $ | 0 | |
| 1 | | “Audit Fees” are the aggregate fees billed for professional services for the audit of the Fund’s annual financial statements and services provided in connection with statutory and regulatory filings or engagements. |
| 2 | | “Audit Related Fees” are the aggregate fees billed for assurance and related services reasonably related to the performance of the audit or review of financial statements and are not reported under “Audit Fees”. |
| 3 | | “Tax Fees” are the aggregate fees billed for professional services for tax advice, tax compliance, and tax planning. |
| 4 | | “All Other Fees” are the aggregate fees billed for products and services other than “Audit Fees”, “Audit Related Fees”, and “Tax Fees”. |
| | | | | | | | | | | | | | | | |
| | | Percentage Approved Pursuant to Pre-approval Exception | |
| | | Audit Fees Billed
to Funds | | | Audit-Related Fees
Billed to Funds | | | Tax Fees
Billed to Funds | | | All Other Fees
Billed to Funds | |
Name of Series | | | | | | | | | | | | | | | | |
Global Total Return Fund | | | N/A | | | | N/A | | | | N/A | | | | N/A | |
Multi-Manager Large-Cap Value Fund | | | 0 | % | | | 0 | % | | | 0 | % | | | 0 | % |
NWQ Equity Income Fund | | | 0 | % | | | 0 | % | | | 0 | % | | | 0 | % |
NWQ Large-Cap Value Fund | | | 0 | % | | | 0 | % | | | 0 | % | | | 0 | % |
NWQ Multi-Cap Value Fund | | | 0 | % | | | 0 | % | | | 0 | % | | | 0 | % |
NWQ Small/Mid-Cap Value Fund | | | 0 | % | | | 0 | % | | | 0 | % | | | 0 | % |
NWQ Small-Cap Value Fund | | | 0 | % | | | 0 | % | | | 0 | % | | | 0 | % |
Tradewinds Value Opportunities Fund | | | 0 | % | | | 0 | % | | | 0 | % | | | 0 | % |
| | | | | | | | | | | | |
Fiscal Year Ended June 30, 2012 | | Audit-Related Fees
Billed to Adviser and
Affiliated Fund
Service Providers | | | Tax Fees Billed to
Adviser and
Affiliated Fund
Service Providers | | | All Other Fees
Billed to Adviser
and Affiliated Fund
Service Providers | |
Nuveen Investment Trust | | $ | 0 | | | $ | 0 | | | $ | 0 | |
| |
| | | Percentage Approved Pursuant to Pre-approval Exception | |
| | | Audit-Related Fees
Billed to Adviser and
Affiliated Fund
Service Providers | | | Tax Fees Billed to
Adviser and
Affiliated Fund
Service Providers | | | All Other Fees
Billed to Adviser
and Affiliated Fund
Service Providers | |
| | | 0 | % | | | 0 | % | | | 0 | % |
| | | |
Fiscal Year Ended June 30, 2011 | | Audit-Related Fees
Billed to Adviser and
Affiliated Fund
Service Providers | | | Tax Fees Billed to
Adviser and
Affiliated Fund
Service Providers | | | All Other Fees
Billed to Adviser
and Affiliated Fund
Service Providers | |
Nuveen Investment Trust | | $ | 0 | | | $ | 0 | | | $ | 0 | |
| |
| | | Percentage Approved Pursuant to Pre-approval Exception | |
| | | Audit-Related Fees
Billed to Adviser and
Affiliated Fund
Service Providers | | | Tax Fees Billed to
Adviser and
Affiliated Fund
Service Providers | | | All Other Fees
Billed to Adviser
and Affiliated Fund
Service Providers | |
| | | 0 | % | | | 0 | % | | | 0 | % |
| | | | | | | | | | | | | | | | |
Fiscal Year Ended June 30, 2012 | | Total Non-Audit Fees
Billed to Trust | | | Total Non-Audit Fees
billed to Adviser and
Affiliated Fund Service
Providers (engagements
related directly to the
operations and financial
reporting of the Trust) | | | Total Non-Audit Fees
billed to Adviser and
Affiliated Fund Service
Providers (all other
engagements) | | | Total | |
Name of Series | | | | | | | | | | | | | | | | |
Global Total Return Fund 1 | | | 0 | | | | 0 | | | | 0 | | | | 0 | |
Multi-Manager Large-Cap Value Fund | | | 2,940 | | | | 0 | | | | 0 | | | | 2,940 | |
NWQ Equity Income Fund | | | 0 | | | | 0 | | | | 0 | | | | 0 | |
NWQ Large-Cap Value Fund | | | 2,940 | | | | 0 | | | | 0 | | | | 2,940 | |
NWQ Multi-Cap Value Fund | | | 2,940 | | | | 0 | | | | 0 | | | | 2,940 | |
NWQ Small/Mid-Cap Value Fund | | | 2,940 | | | | 0 | | | | 0 | | | | 2,940 | |
NWQ Small-Cap Value Fund | | | 2,940 | | | | 0 | | | | 0 | | | | 2,940 | |
Tradewinds Value Opportunities Fund | | | 4,440 | | | | 0 | | | | 0 | | | | 4,440 | |
| | | | | | | | | | | | | | | | |
Total | | $ | 19,140 | | | $ | 0 | | | $ | 0 | | | $ | 19,140 | |
“Non-Audit Fees Billed to Trust” represent “Tax Fees” and “All Other Fees” billed to each Fund in their respective amounts from the previous table.
| 1 | | The Fund commenced operations on 12/02/2011. |
| | | | | | | | | | | | | | | | |
Fiscal Year Ended June 30, 2011 | | Total Non-Audit Fees
Billed to Trust | | | Total Non-Audit Fees
billed to Adviser and
Affiliated Fund Service
Providers (engagements
related directly to the
operations and financial
reporting of the Trust) | | | Total Non-Audit Fees
billed to Adviser and
Affiliated Fund Service
Providers (all other
engagements) | | | Total | |
Name of Series | | | | | | | | | | | | | | | | |
Global Total Return Fund | | | N/A | | | | N/A | | | | N/A | | | | N/A | |
Multi-Manager Large-Cap Value Fund | | | 2,850 | | | | 0 | | | | 0 | | | | 2,850 | |
NWQ Equity Income Fund | | | 0 | | | | 0 | | | | 0 | | | | 0 | |
NWQ Large-Cap Value Fund | | | 2,850 | | | | 0 | | | | 0 | | | | 2,850 | |
NWQ Multi-Cap Value Fund | | | 2,850 | | | | 0 | | | | 0 | | | | 2,850 | |
NWQ Small/Mid-Cap Value Fund | | | 2,850 | | | | 0 | | | | 0 | | | | 2,850 | |
NWQ Small-Cap Value Fund | | | 2,850 | | | | 0 | | | | 0 | | | | 2,850 | |
Tradewinds Value Opportunities Fund | | | 2,850 | | | | 0 | | | | 0 | | | | 2,850 | |
| | | | | | | | | | | | | | | | |
Total | | $ | 17,100 | | | $ | 0 | | | $ | 0 | | | $ | 17,100 | |
“Non-Audit Fees Billed to Trust” represent “Tax Fees” and “All Other Fees” billed to each Fund in their respective amounts from the previous table.
Audit Committee Pre-Approval Policies and Procedures. Generally, the Audit Committee must approve (i) all non-audit services to be performed for the Trust by the Trust’s independent accountants and (ii) all audit and non-audit services to be performed by the Trust’s independent accountants for the Affiliated Fund Service Providers with respect to the operations and financial reporting of the Trust. Regarding tax and research projects conducted by the independent accountants for the Trust and Affiliated Fund Service Providers (with respect to operations and financial reports of the Trust), such engagements will be (i) pre-approved by the Audit Committee if they are expected to be for amounts greater than $10,000; (ii) reported to the Audit Committee Chairman for his verbal approval prior to engagement if they are expected to be for amounts under $10,000 but greater than $5,000; and (iii) reported to the Audit Committee at the next Audit Committee meeting if they are expected to be for an amount under $5,000.
ITEM 5. AUDIT COMMITTEE OF LISTED REGISTRANTS.
Not applicable to this registrant.
ITEM 6. SCHEDULE OF INVESTMENTS.
| a) | | See Portfolio of Investments in Item 1. |
ITEM 7. DISCLOSURE OF PROXY VOTING POLICIES AND PROCEDURES FOR CLOSED-END
MANAGEMENT INVESTMENT COMPANIES.
Not applicable to this registrant.
ITEM 8. PORTFOLIO MANAGERS OF CLOSED-END MANAGEMENT INVESTMENT COMPANIES.
Not applicable to this registrant.
ITEM 9. PURCHASES OF EQUITY SECURITIES BY CLOSED-END MANAGEMENT INVESTMENT COMPANY AND AFFILIATED PURCHASERS.
Not applicable to this registrant.
ITEM 10. SUBMISSION OF MATTERS TO A VOTE OF SECURITY HOLDERS.
There have been no material changes to the procedures by which shareholders may recommend nominees to the registrant’s Board of Trustees implemented after the registrant last provided disclosure in response to this Item.
ITEM 11. CONTROLS AND PROCEDURES.
| | (a) | | The registrant’s principal executive and principal financial officers, or persons performing similar functions, have concluded that the registrant’s disclosure controls and procedures (as defined in Rule 30a-3(c) under the Investment Company Act of 1940, as amended (the “1940 Act”) (17 CFR 270.30a-3(c))) are effective, as of a date within 90 days of the filing date of this report that includes the disclosure required by this paragraph, based on their evaluation of the controls and procedures required by Rule 30a-3(b) under the 1940 Act (17 CFR 270.30a-3(b)) and Rules 13a-15(b) or 15d-15(b) under the Securities Exchange Act of 1934, as amended (the “Exchange Act”) (17 CFR 240.13a-15(b) or 240.15d-15(b)). |
| | (b) | | There were no changes in the registrant’s internal control over financial reporting (as defined in Rule 30a-3(d) under the 1940 Act (17 CFR 270.30a-3(d)) that occurred during the second fiscal quarter of the period covered by this report that has materially affected, or is reasonably likely to materially affect, the registrant’s internal control over financial reporting. |
ITEM 12. EXHIBITS.
File the exhibits listed below as part of this Form.
| | |
| (a)(1) | | Any code of ethics, or amendment thereto, that is the subject of the disclosure required by Item 2, to the extent that the registrant intends to satisfy the Item 2 requirements through filing of an exhibit: Not applicable because the code is posted on registrant’s website at www.nuveen.com/mf and there were no amendments during the period covered by this report. (To view the code, click on the Shareholder Resources drop down menu box, click on Fund Governance and then Code of Conduct.) |
| |
| (a)(2) | | A separate certification for each principal executive officer and principal financial officer of the registrant as required by Rule 30a-2(a) under the 1940 Act (17 CFR 270.30a-2(a)) in the exact form set forth below: See EX-99.CERT attached hereto. |
| |
| (a)(3) | | Any written solicitation to purchase securities under Rule 23c-1 under the 1940 Act (17 CFR 270.23c-1) sent or given during the period covered by the report by or on behalf of the registrant to 10 or more persons: Not applicable to this registrant. |
| |
| (b) | | If the report is filed under Section 13(a) or 15(d) of the Exchange Act, provide the certifications required by Rule 30a-2(b) under the 1940 Act (17 CFR 270.30a-2(b)), Rule 13a-14(b) or Rule 15d-14(b) under the Exchange Act (17 CFR 240.13a-14(b) or 240.15d-14(b)), and Section 1350 of Chapter 63 of Title 18 of the United States Code (18 U.S.C. 1350) as an Exhibit. A certification furnished pursuant to this paragraph will not be deemed “filed” for purposes of Section 18 of the Exchange Act (15 U.S.C. 78r), or otherwise subject to the liability of that section. Such certification will not be deemed to be incorporated by reference into any filing under the Securities Act of 1933 or the Exchange Act, except to the extent that the registration specifically incorporates it by reference: See EX-99.906 CERT attached hereto. |
SIGNATURES
Pursuant to the requirements of the Securities Exchange Act of 1934 and the Investment Company Act of 1940, the registrant has duly caused this report to be signed on its behalf by the undersigned, thereunto duly authorized.
(Registrant) Nuveen Investment Trust
| | |
| |
By (Signature and Title) | | /s/ Kevin J. McCarthy |
| | Kevin J. McCarthy |
| | Vice President and Secretary |
Date: September 7, 2012
Pursuant to the requirements of the Securities Exchange Act of 1934 and the Investment Company Act of 1940, this report has been signed below by the following persons on behalf of the registrant and in the capacities and on the dates indicated.
| | |
| |
By (Signature and Title) | | /s/ Gifford R. Zimmerman |
| | Gifford R. Zimmerman |
| | Chief Administrative Officer |
| | (principal executive officer) |
Date: September 7, 2012
| | |
| |
| By (Signature and Title) | | /s/ Stephen D. Foy |
| | Stephen D. Foy |
| | Vice President and Controller |
| | (principal financial officer) |
Date: September 7, 2012