UNITED STATES
SECURITIES AND EXCHANGE COMMISSION
Washington, D.C. 20549
FORM N-CSR
CERTIFIED SHAREHOLDER REPORT OF REGISTERED MANAGEMENT
INVESTMENT COMPANIES
Investment Company Act file number 811-07619
Nuveen Investment Trust
(Exact name of registrant as specified in charter)
Nuveen Investments
333 West Wacker Drive, Chicago, IL 60606
(Address of principal executive offices) (Zip code)
Kevin J. McCarthy
Nuveen Investments
333 West Wacker Drive
Chicago, IL 60606
(Name and address of agent for service)
Registrant’s telephone number, including area code: (312) 917-7700
Date of fiscal year end: August 31
Date of reporting period: August 31, 2012
Form N-CSR is to be used by management investment companies to file reports with the Commission not later than 10 days after the transmission to stockholders of any report that is required to be transmitted to stockholders under Rule 30e-1 under the Investment Company Act of 1940 (17 CFR 270.30e-1). The Commission may use the information provided on Form N-CSR in its regulatory, disclosure review, inspection, and policy making roles.
A registrant is required to disclose the information specified by Form N-CSR, and the Commission will make this information public. A registrant is not required to respond to the collection of information contained in Form N-CSR unless the Form displays a currently valid Office of Management and Budget (“OMB”) control number. Please direct comments concerning the accuracy of the information collection burden estimate and any suggestions for reducing the burden to Secretary, Securities and Exchange Commission, 450 Fifth Street, NW, Washington, DC 20549-0609. The OMB has reviewed this collection of information under the clearance requirements of 44 U.S.C. ss.3507.
ITEM 1. REPORTS TO STOCKHOLDERS.

Mutual Funds
Nuveen Asset Allocation Funds
For investors seeking a risk-managed approach to asset allocation.
Annual Report
August 31, 2012
| | | | | | | | |
| | | Share Class / Ticker Symbol |
| | | | |
| Fund Name | | Class A | | Class C | | Class R3 | | Class I |
Nuveen Intelligent Risk Growth Allocation Fund | | NIGAX | | NIGCX | | NIGRX | | NIGIX |
Nuveen Intelligent Risk Moderate Allocation Fund | | NIDAX | | NIMCX | | NIMRX | | NIMIX |
Nuveen Intelligent Risk Conservative Allocation Fund | | NICAX | | NICCX | | NICRX | | NICIX |
LIFE IS COMPLEX.
Nuveen makes things e-simple.
It only takes a minute to sign up for e-Reports. Once enrolled, you’ll receive an e-mail as soon as your Nuveen Fund information is ready. No more waiting for delivery by regular mail. Just click on the link within the e-mail to see the report and save it on your computer if you wish.
Free e-Reports right to your e-mail!
www.investordelivery.com
If you receive your Nuveen Fund distributions and statements from your financial advisor or brokerage account.
OR
www.nuveen.com/accountaccess
If you receive your Nuveen Fund distributions and statements directly from Nuveen.
| | | | | | |
| Must be preceded by or accompanied by a prospectus. | | NOT FDIC INSURED | | MAY LOSE VALUE | | NO BANK GUARANTEE |
Table of Contents
Chairman’s
Letter to Shareholders

Dear Shareholders,
Investors have many reasons to remain cautious. The challenges in the Euro area are casting a shadow over global economies and financial markets. The political support for addressing fiscal issues is eroding as the economic and social impacts become more visible. At the same time, member nations appear unwilling to provide adequate financial support or to surrender sufficient sovereignty to strengthen the banks or unify the Euro area financial system. The gains made in reducing deficits, and the hard-won progress on winning popular acceptance of the need for economic austerity, are at risk. To their credit, European political leaders press on to find compromise solutions, but there is increasing concern that time will begin to run out.
In the U.S., strong corporate earnings have enabled the equity markets to withstand much of the downward pressures coming from weakening job creation, slower economic growth and political uncertainty. The Fed remains committed to low interest rates and announced on September 13, 2012 (after the close of this reporting period) another program of quantitative easing (QE3) to continue until mid-2015. Pre-election maneuvering has added to the already highly partisan atmosphere in Congress. The end of the Bush-era tax cuts and implementation of the spending restrictions of the Budget Control Act of 2011, both scheduled to take place at year-end, loom closer.
During the last year, U.S. based investors have experienced a sharp decline and a strong recovery in the equity markets. The experienced investment teams at Nuveen keep their eye on a longer time horizon and use their practiced investment disciplines to negotiate through market peaks and valleys to achieve long-term goals for investors. Experienced professionals pursue investments that will weather short-term volatility and at the same time, seek opportunities that are created by markets that overreact to negative developments. Monitoring this process is an important consideration for the Fund Board as it oversees your Nuveen Fund on your behalf.
As always, I encourage you to contact your financial consultant if you have any questions about your investment in a Nuveen Fund. On behalf of the other members of your Fund Board, we look forward to continuing to earn your trust in the months and years ahead.
Sincerely,

Robert P. Bremner
Chairman of the Board
October 22, 2012
Portfolio Managers’ Comments
Certain statements in this report are forward-looking statements. Discussions of specific investments are for illustration only and are not intended as recommendations of individual investments. The forward-looking statements and other views expressed herein are those of the portfolio managers as of the date of this report. Actual future results or occurrences may differ significantly from those anticipated in any forward-looking statements and the views expressed herein are subject to change at any time, due to numerous market and other factors. The Funds disclaim any obligation to update publicly or revise any forward-looking statements or views expressed herein.
Nuveen Intelligent Risk Allocation Funds
These Funds feature portfolio management by Nuveen Asset Management, LLC, an affiliate of Nuveen Investments. Portfolio managers James Colon and Derek Bloom discuss the key investment strategies and the Funds’ performance during the period ending August 31, 2012. James and Derek have managed the Funds since their inception on May 4, 2012.
While this is an annual report, the Funds’ performance discussions encompass an abbreviated reporting period from inception on May 4, 2012 through August 31, 2012.
How did the Funds perform during this abbreviated reporting period ending August 31, 2012?
The tables in the Fund Performance and Expense Ratios section of this report provide total return performance information for the since inception period ended August 31, 2012. Each Fund’s Class A Share total returns at net asset value (NAV) are compared with the performance of the appropriate Morningstar Index and Lipper classification average.
What strategies were used to manage the Funds during the abbreviated reporting period? How did these strategies influence performance?
All three Nuveen Intelligent Risk Allocation Funds launched and became fully invested during the reporting period. We manage each of the three risk categories of our Intelligent Risk Funds, Growth, Moderate and Conservative, using the same investment process. Our goal with each Fund is to provide investors with a stable level of risk that matches their risk tolerance through changing market conditions. Therefore, each Fund targets its own explicite daily volatility range that we believe to be appropriate for its risk category:
| | |
| Fund | | Daily Volatility Target (Annualized) |
Nuveen Intelligent Risk Growth Allocation Fund | | 12% to 18% |
Nuveen Intelligent Risk Moderate Allocation Fund | | 7% to 12% |
Nuveen Intelligent Risk Conservative Allocation Fund | | 3.5% to 7% |
To keep volatility within the target range, we use our proprietary risk forecasting models to forecast future volatility across asset classes, and in turn, use that information to construct a risk-targeted portfolio. Risk forecasting and portfolio construction processes attempt to limit fluctuations in each portfolio’s volatility primarily by having exposure to a variety of different asset classes and periodically adjusting its exposure to different asset classes. To gain exposure to these different asset classes, the Funds are currently invested in a diverse blend of exchange-traded funds (ETFs) with broad exposures in equities, fixed income, real estate, commodities and cash.
Each Fund’s wide ranging investable universe gives us the flexibility to reduce exposure to risky assets during periods of high volatility and increase exposure to risky assets during periods of low volatility, while maintaining a stable risk profile. This strategy offers the potential to meet each Fund’s investment objective in a range of economic environments and to capitalize on market upswings, while mitigating risk in down markets. Our goal is to proactively anticipate market volatility to help protect investors from unintentionally taking on risk that is inconsistent with each Fund’s respective risk tolerance.
What was the overall volatility environment during the abbreviated reporting period?
During the last two months of the second quarter, volatility levels across asset classes remained fairly consistent with long-term averages. While Moody’s downgraded 28 Spanish banks in June, this news was tempered by a positive outcome in the second Greek election (i.e., the pro-bailout New Democracy party won the election) that occurred in the weeks preceding the downgrade. Throughout July and August, however, volatility across asset classes fell to levels not seen since the low-volatility environment of 2004 to 2007. Many believed that the European holiday season was to blame for the falling trading volumes and declining volatility. However, the volatility that hit markets in August of 2011, when the VIX Index rose above 48, stands as a reminder that volatility can change quickly, even when many Europeans are “on holiday.”
During the Funds’ abbreviated fiscal year, our volatility forecasts remained fairly stable across most asset classes before declining at the end of August 2012. Our estimates for U.S. large cap annualized daily volatility fell from 14.5% at the beginning of May to 10.7% by the end of August 2012. One exception to the declining volatility environment was 20+ year Treasuries. Our forecasts for 20+ year Treasuries increased from 11.9% at the beginning of May 2012, to 17.5% by the end of the month, before declining to 14.2% at the end of August 2012. In response to our changing volatility forecasts, we made several adjustments to the compositions of each portfolio to keep their volatility profiles stable, as discussed in the following sections.
How did the Funds perform and what changes were made to their portfolio allocations during this reporting period?
Nuveen Intelligent Risk Growth Allocation Fund
The Fund’s Class A Shares at NAV underperformed the Morningstar Index and Lipper average for the since inception period May 4, 2012 through August 31, 2012. Also during the abbreviated fiscal period, the Intelligent Risk Growth Allocation Fund stayed within its expected volatility range 81% of the time. Due to the uncertainty in Europe and the potential for an increase in volatility as a result of several macro events, we decided to target a volatility level toward the bottom of the Fund’s range. However, volatility remained lower than expected during most of the reporting period. Consequently, when the strategy did deliver volatility outside the target range, it was mostly under the lower end of the target (i.e., we seldom delivered volatility levels higher than the top of our target).
In an effort to keep the Fund’s expected volatility between 12% and 18%, we continued to increase its exposure to higher risk assets during the reporting period. At the beginning of May, the Fund maintained a target allocation to fixed income. While we did increase the Fund’s exposure to 20+ year U.S. Treasuries during the first two months of the reporting period, we ultimately sold the majority of the position going into September. The proceeds from that sale largely were reallocated to large-cap U.S. equities and gold ETFs.
The shift from lower risk assets to higher risk assets proved beneficial to Fund shareholders. During May, higher risk assets generated mostly negative returns. Large cap U.S. equities and emerging market equities were down during the month, while 20+ year U.S. Treasuries rose. As volatility receded toward the end of the reporting period, returns in the higher risk assets turned positive. From the beginning of June through the end of August, large cap U.S. equities, commodities and U.S. public real estate generated positive returns.
Nuveen Intelligent Risk Moderate Allocation Fund
The Fund’s Class A Shares at NAV outperformed the Morningstar Index and Lipper average for the since inception period May 4, 2012 through August 31, 2012. Also during the abbreviated fiscal period, the Intelligent Risk Moderate Allocation Fund stayed within its expected volatility range 100% of the time.
In an effort to keep the Fund’s expected volatility between 7% and 12% during the reporting period, we made several adjustments to increase its exposure to higher risk assets. As volatility levels fell, we sold the remainder of the Fund’s exposures in low duration, fixed income securities and invested much of the proceeds in emerging market equities, commodities and 20+ year U.S. Treasuries.
At the beginning of May, the Fund maintained a target allocation to low duration asset classes. As volatility fell, we repeatedly reduced the Fund’s low duration fixed income exposure, and by the end of August, we had removed all low duration exposure. Concurrently, we increased the Fund’s target exposure to 20+ year U.S. Treasuries during the May to August period. We also increased exposure to international developed equities.
The shift from lower risk assets to higher risk assets proved beneficial to Fund shareholders. During May, higher risk assets generated mostly negative returns. Large cap U.S. equities and emerging market equities were down, while 20+ year U.S. Treasuries rose. As volatility receded toward the end of the reporting period, returns in the higher risk assets turned positive. From the beginning of June through the end of August, large cap U.S. equities, commodities, and U.S. public real estate generated positive returns.
Nuveen Intelligent Risk Conservative Allocation Fund
The Fund’s Class A Shares at NAV outperformed the Morningstar Index and performed in line with the Lipper average for the since inception period May 4, 2012 through August 31, 2012. Also during the abbreviated fiscal period, the Intelligent Risk Conservative Allocation Fund stayed within its expected volatility range 100% of the time.
In an effort to keep the Fund’s expected volatility between 3.5% and 7% during the reporting period, we reallocated assets away from lower risk to higher risk asset classes. We reduced the Fund’s target allocations to most of its low-duration fixed income exposures, and increased its target allocations to U.S. corporate high yield, U.S. public real estate and other higher risk asset classes.
At the beginning of May 2012, the Fund maintained an allocation to one-three year U.S. Treasuries. As volatility fell, we continued to reduce the Fund’s exposure to the asset class, and by the end of August 2012, its target exposure was zero. Alternatively, we increased the Fund’s target exposure to U.S. corporate high yield from the beginning of May through August.
The shift from lower risk assets to higher risk assets proved beneficial to Fund shareholders. During May, higher risk assets generated mostly negative returns. Large cap U.S. equities and emerging market equities were both down during the month, while municipals and 20+ year U.S. Treasuries rose. As volatility receded toward the end of the reporting period, returns in the higher risk assets turned positive. From the beginning of June through the end of August 2012, large-cap U.S. equities, commodities and U.S. public real estate each generated positive returns.
Risk Considerations
Mutual fund investing involves risk; principal loss is possible. There is no guarantee that the Funds will achieve their investment objectives and the portfolio managers’ asset allocation decisions may adversely affect Fund performance. Each Fund is exposed to the risks of the underlying derivative instruments, ETFs, municipal bonds, corporate bonds, foreign government bonds, equity securities, commodities, real estate, asset-backed securities, mortgage-backed securities, inflation-protected securities and short-term securities that may be held in the portfolio. These risks include market risk, frequent trading risk, index methodology risk, other investment companies risk, liquidity risk, interest rate risk, and credit risk. As interest rates rise, bond prices fall. The credit risk and liquidity risk is heightened for non-investment grade or high-yield securities. The use of derivatives involves substantial financial risks and transaction costs. Commodities may be highly volatile and foreign investments are subject to additional risks including currency fluctuations, and economic or political instability. These risks are magnified in emerging markets. In addition, each Fund will bear its proportionate share of any fees and expenses paid by the ETFs in which it invests.
Fund Performance and Expense Ratios
The Fund Performance and Expense Ratios for each Fund are shown on the following six pages.
Returns quoted represent past performance, which is no guarantee of future results. Current performance may be higher or lower than the performance shown. Investment returns and principal value will fluctuate so that when shares are redeemed, they may be worth more or less than their original cost. Returns without sales charges would be lower if the sales charge were included. Returns do not reflect the deduction of taxes that a shareholder would pay on Fund distributions or the redemption of Fund shares.
Returns may reflect a contractual agreement between certain Funds and the investment adviser to waive certain fees and expenses; see Notes to Financial Statements, Footnote 7 — Management Fees and Other Transactions with Affiliates for more information. In addition, returns may reflect a voluntary expense limitation by the Funds’ investment adviser that may be modified or discontinued at any time without notice. For the most recent month-end performance visit www.nuveen.com or call (800) 257-8787.
Returns reflect differences in sales charges and expenses, which are primarily differences in distribution and service fees. Fund returns assume reinvestment of dividends and capital gains.
Comparative index and Lipper return information is provided for the Funds’ Class A Shares at net asset value (NAV) only.
The expense ratios shown reflect the Funds’ total operating expenses (before fee waivers and/or expense reimbursements, if any) as shown in the Funds’ most recent prospectus. The expense ratios include management fees and other fees and expenses.
Fund Performance and Expense Ratios (continued)
Nuveen Intelligent Risk Growth Allocation Fund
Refer to the first page of this Fund Performance and Expense Ratios section for further explanation of the information included within this page.
Fund Performance
Cumulative Total Returns as of August 31, 2012
| | | | |
| | | Cumulative | |
| | | Since
Inception* | |
Class A Shares at NAV | | | 0.80% | |
Class A Shares at maximum Offering Price | | | -5.00% | |
Morningstar Moderately Aggressive Target Risk Index** | | | 1.68% | |
Lipper Mixed-Asset Target Allocation Growth Funds Classification Average** | | | 1.91% | |
| |
Class C Shares | | | 0.55% | |
Class R3 Shares | | | 0.70% | |
Class I Shares | | | 0.90% | |
Cumulative Total Returns as of September 30, 2012 (Most Recent Calendar Quarter)
| | | | |
| | | Cumulative | |
| | | Since
Inception* | |
Class A Shares at NAV | | | 3.35% | |
Class A Shares at maximum Offering Price | | | -2.59% | |
Class C Shares | | | 3.05% | |
Class R3 Shares | | | 3.25% | |
Class I Shares | | | 3.45% | |
Class A Shares have a maximum 5.75% sales charge (Offering Price). Class A Share purchases of $1 million or more are sold at net asset value without an up-front sales charge but may be subject to a contingent deferred sales charge (CDSC), also known as a back-end sales charge, if redeemed within twelve months of purchase. Class C Shares have a 1% CDSC for redemptions within less than twelve months, which is not reflected in the one-year total return. Class R3 Shares have no sales charge and are available only to certain retirement plans. Class I Shares have no sales charge and may be purchased under limited circumstances or by specified classes of investors.
Expense Ratios as of Most Recent Prospectus
| | | | | | | | |
| | |
| | | Gross
Expense
Ratios*** | | | Net
Expense
Ratios*** | |
Class A Shares | | | 1.77% | | | | 1.37% | |
Class C Shares | | | 2.52% | | | | 2.12% | |
Class R3 Shares | | | 2.02% | | | | 1.62% | |
Class I Shares | | | 1.52% | | | | 1.12% | |
The Fund’s investment adviser has agreed to waive fees and/or reimburse expenses through October 31, 2014 so that total annual Fund operating expenses (excluding 12b-1 distribution and/or service fees, interest expenses, taxes, fees incurred in acquiring and disposing of portfolio securities, acquired fund fees and expenses, and extraordinary expenses) do not exceed 0.71% of the average daily net assets of any class of Fund shares. The expense limitation expiring October 31, 2014 may be terminated or modified prior to that date only with the approval of the Board of Trustees of the Fund.
| * | Returns less than one-year are cumulative. Since inception returns are from 5/04/12. |
| ** | Refer to the Glossary of Terms Used in the Report for definitions. Indexes and Lipper averages are not available for direct investment. |
| *** | The expense ratios include acquired fund fees and expenses of 0.41%, which reflect the fees and expenses of the exchange-traded funds in which the Fund invests. |
Growth of an Assumed $10,000 Investment as of August 31, 2012 – Class A Shares
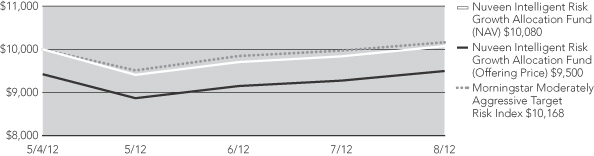
The graphs do not reflect the deduction of taxes that a shareholder may pay on Fund distributions or the redemption of Fund shares.
Fund Performance and Expense Ratios (continued)
Nuveen Intelligent Risk Moderate Allocation Fund
Refer to the first page of this Fund Performance and Expense Ratios section for further explanation of the information included within this page.
Fund Performance
Cumulative Total Returns as of August 31, 2012
| | | | |
| | | Cumulative | |
| | | Since
Inception* | |
Class A Shares at NAV | | | 3.30% | |
Class A Shares at maximum Offering Price | | | -2.64% | |
Morningstar Moderate Target Risk Index** | | | 1.85% | |
Lipper Mixed-Asset Target Allocation Moderate Funds Classification Average** | | | 2.06% | |
| |
Class C Shares | | | 3.05% | |
Class R3 Shares | | | 3.20% | |
Class I Shares | | | 3.40% | |
Cumulative Total Returns as of September 30, 2012 (Most Recent Calendar Quarter)
| | | | |
| | | Cumulative | |
| | | Since
Inception* | |
Class A Shares at NAV | | | 4.74% | |
Class A Shares at maximum Offering Price | | | -1.29% | |
Class C Shares | | | 4.39% | |
Class R3 Shares | | | 4.62% | |
Class I Shares | | | 4.80% | |
Class A Shares have a maximum 5.75% sales charge (Offering Price). Class A Share purchases of $1 million or more are sold at net asset value without an up-front sales charge but may be subject to a contingent deferred sales charge (CDSC), also known as a back-end sales charge, if redeemed within twelve months of purchase. Class C Shares have a 1% CDSC for redemptions within less than twelve months, which is not reflected in the one-year total return. Class R3 Shares have no sales charge and are available only to certain retirement plans. Class I Shares have no sales charge and may be purchased under limited circumstances or by specified classes of investors.
Expense Ratios as of Most Recent Prospectus
| | | | | | | | |
| | |
| | | Gross
Expense
Ratios*** | | | Net
Expense
Ratios*** | |
Class A Shares | | | 1.71% | | | | 1.31% | |
Class C Shares | | | 2.46% | | | | 2.06% | |
Class R3 Shares | | | 1.96% | | | | 1.56% | |
Class I Shares | | | 1.46% | | | | 1.06% | |
The Fund’s investment adviser has agreed to waive fees and/or reimburse expenses through October 31, 2014 so that total annual Fund operating expenses (excluding 12b-1 distribution and/or service fees, interest expenses, taxes, fees incurred in acquiring and disposing of portfolio securities, acquired fund fees and expenses, and extraordinary expenses) do not exceed 0.71% of the average daily net assets of any class of Fund shares. The expense limitation expiring October 31, 2014 may be terminated or modified prior to that date only with the approval of the Board of Trustees of the Fund.
| * | Returns less than one-year are cumulative. Since inception returns are from 5/04/12. |
| ** | Refer to the Glossary of Terms Used in the Report for definitions. Indexes and Lipper averages are not available for direct investment. |
| *** | The expense ratios include acquired fund fees and expenses of 0.35%, which reflect the fees and expenses of the exchange-traded funds in which the Fund invests. |
Growth of an Assumed $10,000 Investment as of August 31, 2012 – Class A Shares
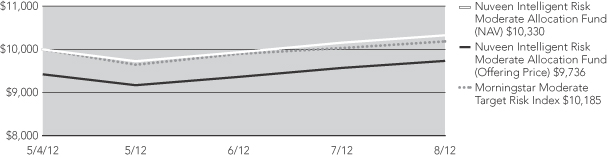
The graphs do not reflect the deduction of taxes that a shareholder may pay on Fund distributions or the redemption of Fund shares.
Fund Performance and Expense Ratios (continued)
Nuveen Intelligent Risk Conservative Allocation Fund
Refer to the first page of this Fund Performance and Expense Ratios section for further explanation of the information included within this page.
Fund Performance
Cumulative Total Returns as of August 31, 2012
| | | | |
| | | Cumulative | |
| | | Since
Inception* | |
Class A Shares at NAV | | | 2.17% | |
Class A Shares at maximum Offering Price | | | -3.71% | |
Morningstar Moderately Conservative Target Risk Index** | | | 1.78% | |
Lipper Mixed-Asset Target Allocation Conservative Funds Classification Average** | | | 2.15% | |
| |
Class C Shares | | | 1.94% | |
Class R3 Shares | | | 2.11% | |
Class I Shares | | | 2.27% | |
Cumulative Total Returns as of September 30, 2012 (Most Recent Calendar Quarter)
| | | | |
| | | Cumulative | |
| | | Since
Inception* | |
Class A Shares at NAV | | | 3.20% | |
Class A Shares at maximum Offering Price | | | -2.73% | |
Class C Shares | | | 2.91% | |
Class R3 Shares | | | 3.12% | |
Class I Shares | | | 3.33% | |
Class A Shares have a maximum 5.75% sales charge (Offering Price). Class A Share purchases of $1 million or more are sold at net asset value without an up-front sales charge but may be subject to a contingent deferred sales charge (CDSC), also known as a back-end sales charge, if redeemed within twelve months of purchase. Class C Shares have a 1% CDSC for redemptions within less than twelve months, which is not reflected in the one-year total return. Class R3 Shares have no sales charge and are available only to certain retirement plans. Class I Shares have no sales charge and may be purchased under limited circumstances or by specified classes of investors.
Expense Ratios as of Most Recent Prospectus
| | | | | | | | |
| | |
| | | Gross
Expense
Ratios*** | | | Net
Expense
Ratios*** | |
Class A Shares | | | 1.69% | | | | 1.29% | |
Class C Shares | | | 2.44% | | | | 2.04% | |
Class R3 Shares | | | 1.94% | | | | 1.54% | |
Class I Shares | | | 1.44% | | | | 1.04% | |
The Fund’s investment adviser has agreed to waive fees and/or reimburse expenses through October 31, 2014 so that total annual Fund operating expenses (excluding 12b-1 distribution and/or service fees, interest expenses, taxes, fees incurred in acquiring and disposing of portfolio securities, acquired fund fees and expenses, and extraordinary expenses) do not exceed 0.71% of the average daily net assets of any class of Fund shares. The expense limitation expiring October 31, 2014 may be terminated or modified prior to that date only with the approval of the Board of Trustees of the Fund.
| * | Returns less than one-year are cumulative. Since inception returns are from 5/04/12. |
| ** | Refer to the Glossary of Terms Used in the Report for definitions. Indexes and Lipper averages are not available for direct investment. |
| *** | The expense ratios include acquired fund fees and expenses of 0.33%, which reflect the fees and expenses of the exchange-traded funds in which the Fund invests. |
Growth of an Assumed $10,000 Investment as of August 31, 2012 – Class A Shares
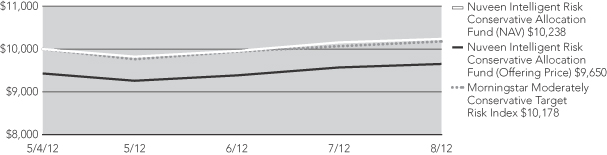
The graphs do not reflect the deduction of taxes that a shareholder may pay on Fund distributions or the redemption of Fund shares.
Holding Summaries as of August 31, 2012
This data relates to the securities held in each Fund’s portfolio of investments. It should not be construed as a measure of performance for the Fund itself.
A copy of the most recent financial statements for the exchange-traded funds in which the Fund invests can be obtained directly from the Securities and Exchange Commission on its website at http://www.sec.gov.
Nuveen Intelligent Risk Growth Allocation Fund
| | | | | | | | |
| Exchange-Traded Funds | | Weighting1 | | | 1-Year
Total Returns2 | |
iShares Barclays 20+ Year Treasury Bond Fund | | | 5.4% | | | | 22.02% | |
iShares Barclays Aggregate Bond Fund | | | 1.9% | | | | 5.63% | |
iShares Barclays Credit Bond Fund | | | 2.0% | | | | 9.42% | |
iShares Barclays TIPS Bond Fund | | | 1.9% | | | | 8.10% | |
iShares Dow Jones U.S. Real Estate Index Fund | | | 14.0% | | | | 18.99% | |
iShares MSCI EAFE Index Fund | | | 11.1% | | | | (0.14)% | |
iShares Russell 1000 Index Fund | | | 10.1% | | | | 17.18% | |
iShares Russell 2000 Index Fund | | | 10.0% | | | | 13.47% | |
iShares S&P North American Natural Resources Sector Index Fund | | | 11.8% | | | | (4.07)% | |
PowerShares DB Commodity Index Tracking Fund | | | 6.2% | | | | (4.87)% | |
PowerShares DB Gold Fund | | | 15.1% | | | | (9.36)% | |
Vanguard MSCI Emerging Markets ETF | | | 11.2% | | | | (6.14)% | |
| | | | |
| Short-Term Investments | | Weighting1 | |
First American Treasury Obligations Fund (Class Z) | | | 0.4% | |
| 1 | As a percentage of total net assets as of August 31, 2012. Holdings are subject to change. Percentages will not add to 100% due to the exclusion of Other Assets Less Liabilities. |
Nuveen Intelligent Risk Moderate Allocation Fund
| | | | | | | | |
| Exchange-Traded Funds | | Weighting1 | | | 1-Year
Total Returns2 | |
iShares Barclays 20+ Year Treasury Bond Fund | | | 32.0% | | | | 22.02% | |
iShares Barclays Aggregate Bond Fund | | | 0.5% | | | | 5.63% | |
iShares Barclays Credit Bond Fund | | | 0.4% | | | | 9.42% | |
iShares Barclays TIPS Bond Fund | | | 0.6% | | | | 8.10% | |
iShares Dow Jones U.S. Real Estate Index Fund | | | 7.0% | | | | 18.99% | |
iShares MSCI EAFE Index Fund | | | 9.2% | | | | (0.14)% | |
iShares Russell 1000 Index Fund | | | 8.2% | | | | 17.18% | |
iShares Russell 2000 Index Fund | | | 6.9% | | | | 13.47% | |
iShares S&P National AMT-Free Municipal Bond Fund | | | 0.9% | | | | 8.73% | |
iShares S&P North American Natural Resources Sector Index Fund | | | 6.2% | | | | (4.07)% | |
PowerShares DB Commodity Index Tracking Fund | | | 9.0% | | | | (4.87)% | |
PowerShares DB Gold Fund | | | 9.4% | | | | (9.36)% | |
SPDR Barclays Capital High Yield Bond Fund | | | 0.6% | | | | 13.06% | |
Vanguard MSCI Emerging Markets ETF | | | 8.8% | | | | (6.14)% | |
| | | | |
| Short-Term Investments | | Weighting1 | |
First American Treasury Obligations Fund (Class Z) | | | 0.4% | |
| 1 | As a percentage of total net assets as of August 31, 2012. Holdings are subject to change. Percentages will not add to 100% due to the exclusion of Other Assets Less Liabilities. |
Holding Summaries (continued) as of August 31, 2012
Nuveen Intelligent Risk Conservation Allocation Fund
| | | | | | | | |
| Exchange-Traded Funds | | Weighting1 | | | 1-Year
Total Returns2 | |
iShares Barclays 20+ Year Treasury Bond Fund | | | 15.1% | | | | 22.02% | |
iShares Dow Jones U.S. Real Estate Index Fund | | | 5.3% | | | | 18.99% | |
iShares MSCI EAFE Index Fund | | | 2.9% | | | | (0.14)% | |
iShares Russell 1000 Index Fund | | | 4.6% | | | | 17.18% | |
iShares Russell 2000 Index Fund | | | 3.9% | | | | 13.47% | |
iShares S&P National AMT-Free Municipal Bond Fund | | | 33.8% | | | | 8.73% | |
iShares S&P North American Natural Resources Sector Index Fund | | | 1.6% | | | | (4.07)% | |
PowerShares DB Commodity Index Tracking Fund | | | 3.4% | | | | (4.87)% | |
PowerShares DB Gold Fund | | | 5.1% | | | | (9.36)% | |
SPDR Barclays Capital High Yield Bond Fund | | | 21.3% | | | | 13.06% | |
Vanguard MSCI Emerging Markets ETF | | | 3.6% | | | | (6.14)% | |
| | | | |
| Short-Term Investments | | Weighting1 | |
First American Treasury Obligations Fund (Class Z) | | | 2.5% | |
| 1 | As a percentage of total net assets as of August 31, 2012. Holdings are subject to change. Percentages will not add to 100% due to the exclusion of Other Assets Less Liabilities. |
Expense Examples
As a shareholder of one or more of the Funds, you incur two types of costs: (1) transaction costs, including up-front and back-end sales charges (loads) or redemption fees, where applicable; and (2) ongoing costs, including management fees; distribution and service (12b-1) fees, where applicable; and other Fund expenses. The Examples below are intended to help you understand your ongoing costs (in dollars) of investing in the Funds and to compare these costs with the ongoing costs of investing in other mutual funds. Since the Funds expense examples below reflect only the first 120 days of the Funds’ operations they may not provide a meaningful understanding of the Funds’ ongoing expenses.
The Examples below are based on an investment of $1,000 invested at the beginning of the period and held for the period.
The information under “Actual Performance,” together with the amount you invested, allows you to estimate actual expenses incurred over the reporting period. Simply divide your account value by $1,000 (for example, an $8,600 account value divided by $1,000 = 8.60) and multiply the result by the cost shown for your share class, in the row entitled “Expenses Incurred During Period” to estimate the expenses incurred on your account during this period.
The information under “Hypothetical Performance,” provides information about hypothetical account values and hypothetical expenses based on the respective Fund’s actual expense ratio and an assumed rate of return of 5% per year before expenses, which is not the Fund’s actual return. The hypothetical account values and expenses may not be used to estimate the actual ending account balance or expense you incurred for the period. You may use this information to compare the ongoing costs of investing in the Fund and other funds. To do so, compare this 5% hypothetical example with the 5% hypothetical examples that appear in the shareholder reports of the other funds.
Please note that the expenses shown in the tables are meant to highlight your ongoing costs only and do not reflect any transaction costs. Therefore, the hypothetical information is useful in comparing ongoing costs only, and will not help you determine the relative total costs of owning different funds or share classes. In addition, if these transaction costs were included, your costs would have been higher.
In addition to the fees and expenses which the Funds bear directly; the Funds indirectly bear a pro rata share of the fees and expenses of the exchange-traded funds in which the Funds invest. Because the exchange-traded funds have varied expenses and fee levels and the Funds may own different proportions at different times, the amount of fees and expenses incurred indirectly by the Funds will vary. These exchange-traded fund fees and expenses are not included in the expenses shown in the table.
Expense Examples (continued)
Nuveen Intelligent Risk Growth Allocation Fund
| | | | | | | | | | | | | | | | | | | | | | | | | | | | | | | | | | |
| | | | | | | | Hypothetical Performance | |
| | | Actual Performance | | | | | (5% annualized return before expenses) | |
| | | A Shares | | | C Shares | | | R3 Shares | | | I Shares | | | | | A Shares | | | C Shares | | | R3 Shares | | | I Shares | |
| Beginning Account Value (5/04/12) | | $ | 1,000.00 | | | $ | 1,000.00 | | | $ | 1,000.00 | | | $ | 1,000.00 | | | | | $ | 1,000.00 | | | $ | 1,000.00 | | | $ | 1,000.00 | | | $ | 1,000.00 | |
| Ending Account Value (8/31/12) | | $ | 1,008.00 | | | $ | 1,005.50 | | | $ | 1,007.00 | | | $ | 1,009.00 | | | | | $ | 1,013.38 | | | $ | 1,010.92 | | | $ | 1,012.56 | | | $ | 1,014.20 | |
| Expenses Incurred During Period | | $ | 3.07 | | | $ | 5.54 | | | $ | 3.89 | | | $ | 2.25 | | | | | $ | 3.08 | | | $ | 5.55 | | | $ | 3.90 | | | $ | 2.25 | |
For each class of the Fund, expenses are equal to the Fund’s annualized net expense ratio of .93%, 1.68%, 1.18% and .68% for Classes A, C, R3 and I, respectively, multiplied by the average account value over the period, multiplied by 120/365 (to reflect the 120 days in the period since commencement of operations).
Nuveen Intelligent Risk Moderate Allocation Fund
| | | | | | | | | | | | | | | | | | | | | | | | | | | | | | | | | | |
| | | | | | | | | | | | | | | | | Hypothetical Performance | |
| | | Actual Performance | | | | | (5% annualized return before expenses) | |
| | | A Shares | | | C Shares | | | R3 Shares | | | I Shares | | | | | A Shares | | | C Shares | | | R3 Shares | | | I Shares | |
| Beginning Account Value (5/04/12) | | $ | 1,000.00 | | | $ | 1,000.00 | | | $ | 1,000.00 | | | $ | 1,000.00 | | | | | $ | 1,000.00 | | | $ | 1,000.00 | | | $ | 1,000.00 | | | $ | 1,000.00 | |
| Ending Account Value (8/31/12) | | $ | 1,033.00 | | | $ | 1,030.50 | | | $ | 1,032.00 | | | $ | 1,034.00 | | | | | $ | 1,013.38 | | | $ | 1,010.92 | | | $ | 1,012.56 | | | $ | 1,014.20 | |
| Expenses Incurred During Period | | $ | 3.11 | | | $ | 5.61 | | | $ | 3.94 | | | $ | 2.27 | | | | | $ | 3.08 | | | $ | 5.55 | | | $ | 3.90 | | | $ | 2.25 | |
For each class of the Fund, expenses are equal to the Fund’s annualized net expense ratio of .93%, 1.68%, 1.18% and .68% for Classes A, C, R3 and I, respectively, multiplied by the average account value over the period, multiplied by 120/365 (to reflect the 120 days in the period since commencement of operations.).
Nuveen Intelligent Risk Conservative Allocation Fund
| | | | | | | | | | | | | | | | | | | | | | | | | | | | | | | | | | |
| | | | | | | | | | | | | | | | | Hypothetical Performance | |
| | | Actual Performance | | | | | (5% annualized return before expenses) | |
| | | A Shares | | | C Shares | | | R3 Shares | | | I Shares | | | | | A Shares | | | C Shares | | | R3 Shares | | | I Shares | |
| Beginning Account Value (5/04/12) | | $ | 1,000.00 | | | $ | 1,000.00 | | | $ | 1,000.00 | | | $ | 1,000.00 | | | | | $ | 1,000.00 | | | $ | 1,000.00 | | | $ | 1,000.00 | | | $ | 1,000.00 | |
| Ending Account Value (8/31/12) | | $ | 1,021.70 | | | $ | 1,019.40 | | | $ | 1,021.10 | | | $ | 1,022.70 | | | | | $ | 1,013.38 | | | $ | 1,010.92 | | | $ | 1,012.56 | | | $ | 1,014.20 | |
| Expenses Incurred During Period | | $ | 3.09 | | | $ | 5.58 | | | $ | 3.92 | | | $ | 2.26 | | | | | $ | 3.08 | | | $ | 5.55 | | | $ | 3.90 | | | $ | 2.25 | |
For each class of the Fund, expenses are equal to the Fund’s annualized net expense ratio of .93%, 1.68%, 1.18% and .68% for Classes A, C, R3 and I, respectively, multiplied by the average account value over the period, multiplied by 120/365 (to reflect the 120 days in the period since commencement of operations.).
Report of Independent Registered Public Accounting Firm
To the Board of Trustees and Shareholders of
Nuveen Investment Trust:
In our opinion, the accompanying statements of assets and liabilities, including the portfolios of investments, and the related statements of operations, of changes in net assets, and the financial highlights present fairly, in all material respects, the financial position of Nuveen Intelligent Risk Growth Allocation Fund, Nuveen Intelligent Risk Moderate Allocation Fund, and Nuveen Intelligent Risk Conservative Allocation Fund (each a series of the Nuveen Investment Trust, hereinafter referred to as the “Funds”) at August 31, 2012, the results of each of their operations, the changes in each of their net assets and the financial highlights for the period May 4, 2012 (commencement of operations) through August 31, 2012, in conformity with accounting principles generally accepted in the United States of America. These financial statements and financial highlights (hereafter referred to as “financial statements”) are the responsibility of the Funds’ management; our responsibility is to express an opinion on these financial statements based on our audits. We conducted our audits of these financial statements in accordance with the standards of the Public Company Accounting Oversight Board (United States). Those standards require that we plan and perform the audit to obtain reasonable assurance about whether the financial statements are free of material misstatement. An audit includes examining, on a test basis, evidence supporting the amounts and disclosures in the financial statements, assessing the accounting principles used and significant estimates made by management, and evaluating the overall financial statement presentation. We believe that our audits, which included confirmation of securities at August 31, 2012 by correspondence with the custodian and brokers, provide a reasonable basis for our opinion.
PricewaterhouseCoopers LLP
Chicago, IL
October 26, 2012
Portfolio of Investments
Nuveen Intelligent Risk Growth Allocation Fund
August 31, 2012
| | | | | | | | | | | | | | |
| Shares | | | Description (1)(4) | | | | | | | | Value | |
| | | | | | | | | | | | | | |
| | | | EXCHANGE-TRADED FUNDS – 100.7% | | | | | | | | | | |
| | | | | |
| | | | Commodity Funds – 21.3% | | | | | | | | | | |
| | | | | |
| | 2,184 | | | PowerShares DB Commodity Index Tracking Fund, (2) | | | | | | | | $ | 62,877 | |
| | | | | |
| | 2,607 | | | PowerShares DB Gold Fund, (2) | | | | | | | | | 151,962 | |
| | | | Total Commodity Funds | | | | | | | | | 214,839 | |
| | | | Equity Funds – 68.2% | | | | | | | | | | |
| | | | | |
| | 2,145 | | | iShares Dow Jones U.S. Real Estate Index Fund | | | | | | | | | 140,776 | |
| | | | | |
| | 2,165 | | | iShares MSCI EAFE Index Fund | | | | | | | | | 111,714 | |
| | | | | |
| | 1,314 | | | iShares Russell 1000 Index Fund | | | | | | | | | 102,282 | |
| | | | | |
| | 1,237 | | | iShares Russell 2000 Index Fund | | | | | | | | | 100,432 | |
| | | | | |
| | 3,126 | | | iShares S&P North American Natural Resources Sector Index Fund | | | | | | | | | 119,069 | |
| | | | | |
| | 2,829 | | | Vanguard MSCI Emerging Markets ETF | | | | | | | | | 113,585 | |
| | | | Total Equity Funds | | | | | | | | | 687,858 | |
| | | | Fixed Income Funds – 11.2% | | | | | | | | | | |
| | | | | |
| | 427 | | | iShares Barclays 20+ Year Treasury Bond Fund | | | | | | | | | 54,536 | |
| | | | | |
| | 172 | | | iShares Barclays Aggregate Bond Fund | | | | | | | | | 19,328 | |
| | | | | |
| | 173 | | | iShares Barclays Credit Bond Fund | | | | | | | | | 19,677 | |
| | | | | |
| | 161 | | | iShares Barclays TIPS Bond Fund | | | | | | | | | 19,504 | |
| | | | Total Fixed Income Funds | | | | | | | | | 113,045 | |
| | | | Total Exchange-Traded Funds (cost $995,784) | | | | | | | | | 1,015,742 | |
| | | | | |
| Shares | | | Description (1) | | | | | | | | Value | |
| | | | SHORT-TERM INVESTMENTS – 0.4% | | | | | | | | | | |
| | | | | |
| | | | Money Market Funds – 0.4% | | | | | | | | | | |
| | | | | |
| | 3,976 | | | First American Treasury Obligations Fund, Class Z, 0.000%, (3) | | | | | | | | $ | 3,976 | |
| | | | Total Short-Term Investments (cost $3,976) | | | | | | | | | 3,976 | |
| | | | Total Investments (cost $999,760) – 101.1% | | | | | | | | | 1,019,718 | |
| | | | Other Assets Less Liabilities – (1.1)% | | | | | | | | | (11,193) | |
| | | | Net Assets – 100% | | | | | | | | $ | 1,008,525 | |
| | (1) | | All percentages shown in the Portfolio of Investments are based on net assets. |
| | (2) | | Non-income producing; fund has not declared a dividend within the past twelve months. |
| | (3) | | The rate shown is the annualized seven-day yield as of August 31, 2012. |
| | (4) | | A copy of the most recent financial statements for the exchange-traded funds in which the Fund invests can be obtained directly from the Securities and Exchange Commission on its website at http://www.sec.gov. |
See accompanying notes to financial statements.
Portfolio of Investments
Nuveen Intelligent Risk Moderate Allocation Fund
August 31, 2012
| | | | | | | | | | | | | | |
| Shares | | | Description (1)(4) | | | | | | | | Value | |
| | | | | | | | | | | | | | |
| | | | EXCHANGE-TRADED FUNDS – 99.7% | | | | | | | | | | |
| | | | | |
| | | | Commodity Funds – 18.4% | | | | | | | | | | |
| | | | | |
| | 3,450 | | | PowerShares DB Commodity Index Tracking Fund, (2) | | | | | | | | $ | 99,326 | |
| | | | | |
| | 1,783 | | | PowerShares DB Gold Fund, (2) | | | | | | | | | 103,931 | |
| | | | Total Commodity Funds | | | | | | | | | 203,257 | |
| | | | Equity Funds – 46.9% | | | | | | | | | | |
| | | | | |
| | 1,181 | | | iShares Dow Jones U.S. Real Estate Index Fund | | | | | | | | | 77,509 | |
| | | | | |
| | 1,972 | | | iShares MSCI EAFE Index Fund | | | | | | | | | 101,755 | |
| | | | | |
| | 1,165 | | | iShares Russell 1000 Index Fund | | | | | | | | | 90,684 | |
| | | | | |
| | 947 | | | iShares Russell 2000 Index Fund | | | | | | | | | 76,887 | |
| | | | | |
| | 1,799 | | | iShares S&P North American Natural Resources Sector Index Fund | | | | | | | | | 68,524 | |
| | | | | |
| | 157 | | | SPDR Barclays Capital High Yield Bond Fund | | | | | | | | | 6,302 | |
| | | | | |
| | 2,421 | | | Vanguard MSCI Emerging Markets ETF | | | | | | | | | 97,202 | |
| | | | Total Equity Funds | | | | | | | | | 518,863 | |
| | | | Fixed Income Funds – 34.4% | | | | | | | | | | |
| | | | | |
| | 2,766 | | | iShares Barclays 20+ Year Treasury Bond Fund | | | | | | | | | 353,274 | |
| | | | | |
| | 51 | | | iShares Barclays Aggregate Bond Fund | | | | | | | | | 5,731 | |
| | | | | |
| | 38 | | | iShares Barclays Credit Bond Fund | | | | | | | | | 4,322 | |
| | | | | |
| | 55 | | | iShares Barclays TIPS Bond Fund | | | | | | | | | 6,663 | |
| | | | | |
| | 86 | | | iShares S&P National AMT-Free Municipal Bond Fund | | | | | | | | | 9,600 | |
| | | | Total Fixed Income Funds | | | | | | | | | 379,590 | |
| | | | Total Exchange-Traded Funds (cost $1,062,138) | | | | | | | | | 1,101,710 | |
| | | | | |
| Shares | | | Description (1) | | | | | | | | Value | |
| | | | SHORT-TERM INVESTMENTS – 0.4% | | | | | | | | | | |
| | | | | |
| | | | Money Market Funds – 0.4% | | | | | | | | | | |
| | | | | |
| | 4,570 | | | First American Treasury Obligations Fund, Class Z, 0.000%, (3) | | | | | | | | $ | 4,570 | |
| | | | Total Short-Term Investments (cost $4,570) | | | | | | | | | 4,570 | |
| | | | Total Investments (cost $1,066,708) – 100.1% | | | | | | | | | 1,106,280 | |
| | | | Other Assets Less Liabilities – (0.1)% | | | | | | | | | (743) | |
| | | | Net Assets – 100% | | | | | | | | $ | 1,105,537 | |
| | (1) | | All percentages shown in the Portfolio of Investments are based on net assets. |
| | (2) | | Non-income producing; fund has not declared a dividend within the past twelve months. |
| | (3) | | The rate shown is the annualized seven-day yield as of August 31, 2012. |
| | (4) | | A copy of the most recent financial statements for the exchange-traded funds in which the Fund invests can be obtained directly from the Securities and Exchange Commission on its website at http://www.sec.gov. |
See accompanying notes to financial statements.
Portfolio of Investments
Nuveen Intelligent Risk Conservative Allocation Fund (continued)
August 31, 2012
| | | | | | | | | | | | | | |
| Shares | | | Description (1)(4) | | | | | | | | Value | |
| | | | | | | | | | | | | | |
| | | | EXCHANGE-TRADED FUNDS – 100.6% | | | | | | | | | | |
| | | | | |
| | | | Commodity Funds – 8.5% | | | | | | | | | | |
| | | | | |
| | 1,273 | | | PowerShares DB Commodity Index Tracking Fund, (2) | | | | | | | | $ | 36,650 | |
| | | | | |
| | 920 | | | PowerShares DB Gold Fund, (2) | | | | | | | | | 53,627 | |
| | | | Total Commodity Funds | | | | | | | | | 90,277 | |
| | | | Equity Funds – 43.2% | | | | | | | | | | |
| | | | | |
| | 847 | | | iShares Dow Jones U.S. Real Estate Index Fund | | | | | | | | | 55,589 | |
| | | | | |
| | 601 | | | iShares MSCI EAFE Index Fund | | | | | | | | | 31,012 | |
| | | | | |
| | 624 | | | iShares Russell 1000 Index Fund | | | | | | | | | 48,572 | |
| | | | | |
| | 502 | | | iShares Russell 2000 Index Fund | | | | | | | | | 40,757 | |
| | | | | |
| | 441 | | | iShares S&P North American Natural Resources Sector Index Fund | | | | | | | | | 16,798 | |
| | | | | |
| | 5,587 | | | SPDR Barclays Capital High Yield Bond Fund | | | | | | | | | 224,262 | |
| | | | | |
| | 936 | | | Vanguard MSCI Emerging Markets ETF | | | | | | | | | 37,580 | |
| | | | Total Equity Funds | | | | | | | | | 454,570 | |
| | | | Fixed Income Funds – 48.9% | | | | | | | | | | |
| | | | | |
| | 1,245 | | | iShares Barclays 20+ Year Treasury Bond Fund | | | | | | | | | 159,011 | |
| | | | | |
| | 3,184 | | | iShares S&P National AMT-Free Municipal Bond Fund | | | | | | | | | 355,430 | |
| | | | Total Fixed Income Funds | | | | | | | | | 514,441 | |
| | | | Total Exchange-Traded Funds (cost $1,038,837) | | | | | | | | | 1,059,288 | |
| | | | | |
| Shares | | | Description (1) | | | | | | | | Value | |
| | | | SHORT-TERM INVESTMENTS – 2.5% | | | | | | | | | | |
| | | | | |
| | | | Money Market Funds – 2.5% | | | | | | | | | | |
| | | | | |
| | 25,875 | | | First American Treasury Obligations Fund, Class Z, 0.000%, (3) | | | | | | | | $ | 25,875 | |
| | | | Total Short-Term Investments (cost $25,875) | | | | | | | | | 25,875 | |
| | | | Total Investments (cost $1,064,712) – 103.1% | | | | | | | | | 1,085,163 | |
| | | | Other Assets Less Liabilities – (3.1)% | | | | | | | | | (32,968) | |
| | | | Net Assets – 100% | | | | | | | | $ | 1,052,195 | |
| | (1) | | All percentages shown in the Portfolio of Investments are based on net assets. |
| | (2) | | Non-income producing; fund has not declared a dividend within the past twelve months. |
| | (3) | | The rate shown is the annualized seven-day yield as of August 31, 2012. |
| | (4) | | A copy of the most recent financial statements for the exchange-traded funds in which the Fund invests can be obtained directly from the Securities and Exchange Commission on its website at http://www.sec.gov. |
See accompanying notes to financial statements.
Statement of Assets and Liabilities
August 31, 2012
| | | | | | | | | | | | |
| | | Intelligent Risk
Growth Allocation | | | Intelligent Risk
Moderate Allocation | | | Intelligent Risk
Conservative Allocation | |
Assets | | | | | | | | | | | | |
Investments, at value (cost $999,760, $1,066,708 and $1,064,712, respectively) | | $ | 1,019,718 | | | $ | 1,106,280 | | | $ | 1,085,163 | |
Receivables: | | | | | | | | | | | | |
From Adviser | | | 5,472 | | | | 5,432 | | | | 5,482 | |
Shares sold | | | — | | | | 10,495 | | | | — | |
Other assets | | | 262 | | | | 263 | | | | 263 | |
Total assets | | | 1,025,452 | | | | 1,122,470 | | | | 1,090,908 | |
Liabilities | | | | | | | | | | | | |
Payables: | | | | | | | | | | | | |
Dividends | | | — | | | | — | | | | 1,929 | |
Investments purchased | | | — | | | | — | | | | 19,856 | |
Accrued expenses: | | | | | | | | | | | | |
Trustees’ Fees | | | 3 | | | | 3 | | | | 3 | |
12b-1 distribution and service fees | | | 74 | | | | 80 | | | | 75 | |
Other | | | 16,850 | | | | 16,850 | | | | 16,850 | |
Total liabilities | | | 16,927 | | | | 16,933 | | | | 38,713 | |
Net assets | | $ | 1,008,525 | | | $ | 1,105,537 | | | $ | 1,052,195 | |
Class A Shares | | | | | | | | | | | | |
Net assets | | $ | 50,400 | | | $ | 97,755 | | | $ | 70,921 | |
Shares outstanding | | | 2,500 | | | | 4,732 | | | | 3,488 | |
Net asset value per share | | $ | 20.16 | | | $ | 20.66 | | | $ | 20.33 | |
Offering price per share (net asset value per share plus maximum sales charge of 5.75% of offering price) | | $ | 21.39 | | | $ | 21.92 | | | $ | 21.57 | |
Class C Shares | | | | | | | | | | | | |
Net assets | | $ | 50,276 | | | $ | 62,014 | | | $ | 50,794 | |
Shares outstanding | | | 2,500 | | | | 3,009 | | | | 2,500 | |
Net asset value and offering price per share | | $ | 20.11 | | | $ | 20.61 | | | $ | 20.32 | |
Class R3 Shares | | | | | | | | | | | | |
Net assets | | $ | 50,358 | | | $ | 51,604 | | | $ | 50,817 | |
Shares outstanding | | | 2,500 | | | | 2,500 | | | | 2,500 | |
Net asset value and offering price per share | | $ | 20.14 | | | $ | 20.64 | | | $ | 20.33 | |
Class I Shares | | | | | | | | | | | | |
Net assets | | $ | 857,491 | | | $ | 894,164 | | | $ | 879,663 | |
Shares outstanding | | | 42,500 | | | | 43,248 | | | | 43,255 | |
Net asset value and offering price per share | | $ | 20.18 | | | $ | 20.68 | | | $ | 20.34 | |
Net assets consist of: | | | | | | | | | | | | |
Capital paid-in | | $ | 999,793 | | | $ | 1,070,516 | | | $ | 1,034,842 | |
Undistributed (Over-distribution of) net investment income | | | 3,334 | | | | 3,312 | | | | 414 | |
Accumulated net realized gain (loss) | | | (14,560 | ) | | | (7,863 | ) | | | (3,512 | ) |
Net unrealized appreciation (depreciation) | | | 19,958 | | | | 39,572 | | | | 20,451 | |
Net assets | | $ | 1,008,525 | | | $ | 1,105,537 | | | $ | 1,052,195 | |
Authorized shares | | | Unlimited | | | | Unlimited | | | | Unlimited | |
Par value per share | | $ | 0.01 | | | $ | 0.01 | | | $ | 0.01 | |
See accompanying notes to financial statements.
Statement of Operations
For the period May 4, 2012 (commencement of operations) through August 31, 2012
| | | | | | | | | | | | |
| | | Intelligent Risk
Growth Allocation | | | Intelligent Risk
Moderate Allocation | | | Intelligent Risk
Conservative Allocation | |
Investment Income | | $ | 5,578 | | | $ | 5,646 | | | $ | 8,248 | |
Expenses | | | | | | | | | | | | |
Management fees | | | 2,461 | | | | 2,555 | | | | 2,539 | |
12b-1 service fees – Class A | | | 40 | | | | 46 | | | | 41 | |
12b-1 distribution and service fees – Class C | | | 159 | | | | 163 | | | | 163 | |
12b-1 distribution and service fees – Class R3 | | | 79 | | | | 81 | | | | 81 | |
Shareholders’ servicing agent fees and expenses | | | 35 | | | | 34 | | | | 35 | |
Custodian’s fees and expenses | | | 481 | | | | 477 | | | | 506 | |
Trustees’ fees and expenses | | | 8 | | | | 8 | | | | 8 | |
Professional fees | | | 15,022 | | | | 15,022 | | | | 15,022 | |
Shareholders’ reports – printing and mailing expenses | | | 2,928 | | | | 2,928 | | | | 2,928 | |
Federal and state registration fees | | | 296 | | | | 296 | | | | 296 | |
Other expenses | | | 1,639 | | | | 1,639 | | | | 1,640 | |
Total expenses before expense reimbursement | | | 23,148 | | | | 23,249 | | | | 23,259 | |
Expense reimbursement | | | (20,697 | ) | | | (20,703 | ) | | | (20,732 | ) |
Net expenses | | | 2,451 | | | | 2,546 | | | | 2,527 | |
Net investment income (loss) | | | 3,127 | | | | 3,100 | | | | 5,721 | |
Realized and Unrealized Gain (Loss) | | | | | | | | | | | | |
Net realized gain (loss) from investments | | | (14,560 | ) | | | (7,863 | ) | | | (3,512 | ) |
Change in net unrealized appreciation (depreciation) of investments | | | 19,958 | | | | 39,572 | | | | 20,451 | |
Net realized and unrealized gain (loss) | | | 5,398 | | | | 31,709 | | | | 16,939 | |
Net increase (decrease) in net assets from operations | | $ | 8,525 | | | $ | 34,809 | | | $ | 22,660 | |
See accompanying notes to financial statements.
Statement of Changes in Net Assets
| | | | | | | | | | | | |
| | | Intelligent Risk
Growth Allocation | | | Intelligent Risk
Moderate Allocation | | | Intelligent Risk
Conservative Allocation | |
| | | For the Period 5/04/12
(commencement
of operations)
through 8/31/12 | | | For the Period 5/04/12
(commencement
of operations)
through 8/31/12 | | | For the Period 5/04/12
(commencement
of operations)
through 8/31/12 | |
Operations | | | | | | | | | | | | |
Net investment income (loss) | | $ | 3,127 | | | $ | 3,100 | | | $ | 5,721 | |
Net realized gain (loss) from investments | | | (14,560 | ) | | | (7,863 | ) | | | (3,512 | ) |
Change in net unrealized appreciation (depreciation) of investments | | | 19,958 | | | | 39,572 | | | | 20,451 | |
Net increase (decrease) in net assets from operations | | | 8,525 | | | | 34,809 | | | | 22,660 | |
Distributions to Shareholders | | | | | | | | | | | | |
From net investment income: | | | | | | | | | | | | |
Class A | | | — | | | | — | | | | (258 | ) |
Class C | | | — | | | | — | | | | (167 | ) |
Class R3 | | | — | | | | — | | | | (227 | ) |
Class I | | | — | | | | — | | | | (4,868 | ) |
Decrease in net assets from distributions to shareholders | | | — | | | | — | | | | (5,520 | ) |
Fund Share Transactions | | | | | | | | | | | | |
Proceeds from sale of shares | | | 1,000,000 | | | | 1,070,728 | | | | 1,035,000 | |
Proceeds from shares issued to shareholders due to reinvestment of distributions | | | — | | | | — | | | | 55 | |
| | | 1,000,000 | | | | 1,070,728 | | | | 1,035,055 | |
Cost of shares redeemed | | | — | | | | — | | | | — | |
Net increase (decrease) in net assets from Fund share transactions | | | 1,000,000 | | | | 1,070,728 | | | | 1,035,055 | |
Net increase (decrease) in net assets | | | 1,008,525 | | | | 1,105,537 | | | | 1,052,195 | |
Net assets at the beginning of period | | | — | | | | — | | | | — | |
Net assets at the end of period | | $ | 1,008,525 | | | $ | 1,105,537 | | | $ | 1,052,195 | |
Undistributed (Over-distribution of) net investment income at the end of period | | $ | 3,334 | | | $ | 3,312 | | | $ | 414 | |
See accompanying notes to financial statements.
Financial Highlights
| | | | | | | | | | | | | | | | | | | | | | | | | | | | | | | | |
| Selected data for a share outstanding throughout each period: | |
| | | | | | |
| Class (Commencement Date) | | | | | | | | | | | | | | | | | | | |
| | | | | | Investment Operations | | | Less Distributions | | | | |
| | | | | | |
| INTELLIGENT RISK GROWTH ALLOCATION | | | | | | | | | | | | | | | | | | | |
Year Ended
August 31, | | Beginning
Net
Asset
Value | | | Net
Invest-
ment
Income
(Loss)(a) | | |
Net
Realized/
Unrealized
Gain
(Loss) | | | Total | | | Net
Invest-
ment
Income | | | Capital
Gains(b) | | | Total | | | Ending
Net
Asset
Value | |
CLASS A (5/12) | | | | | | | | | | | | | | | | | | | | | | | | | |
2012(e) | | $ | 20.00 | | | $ | .05 | | | $ | .11 | | | $ | .16 | | | $ | — | | | $ | — | | | $ | — | | | $ | 20.16 | |
CLASS C (5/12) | | | | | | | | | | | | | | | | | | | | | | | | | |
2012(e) | | | 20.00 | | | | — | ** | | | .11 | | | | .11 | | | | — | | | | — | | | | — | | | | 20.11 | |
CLASS R3 (5/12) | | | | | | | | | | | | | | | | | | | | | | | | | |
2012(e) | | | 20.00 | | | | .04 | | | | .10 | | | | .14 | | | | — | | | | — | | | | — | | | | 20.14 | |
CLASS I (5/12) | | | | | | | | | | | | | | | | | | | | | | | | | |
2012(e) | | | 20.00 | | | | .07 | | | | .11 | | | | .18 | | | | — | | | | — | | | | — | | | | 20.18 | |
| | | | | | | | | | | | | | | | | | | | | | | | | | |
| | | | | | | | | | | | | | | | | | | | |
| | | | |
| | | | | | | | | | | | | | |
| Ratios/Supplemental Data | |
| | | | | | |
Ratios to Average
Net Assets Before
Reimbursement | | | Ratios to Average
Net Assets After
Reimbursement(d) | | | | |
| | | | | | |
Total
Return(c) | | | Ending
Net
Assets
(000) | | | Expenses(f) | | | Net
Invest-
ment
Income
(Loss) | | | Expenses(f) | | | Net
Invest-
ment
Income
(Loss) | | | Portfolio
Turnover
Rate | |
| | | | | | | | | | | | | | | | | | | | | | | | | | |
| | .80 | % | | $ | 50 | | | | 7.41 | %* | | | (5.66 | )%* | | | .93 | %* | | | .82 | %* | | | 25 | % |
| | | | | | | | | | | | | | | | | | | | | | | | | | |
| | .55 | | | | 50 | | | | 8.16 | * | | | (6.41 | )* | | | 1.68 | * | | | .07 | * | | | 25 | |
| | | | | | | | | | | | | | | | | | | | | | | | | | |
| | .70 | | | | 50 | | | | 7.66 | * | | | (5.91 | )* | | | 1.18 | * | | | .57 | * | | | 25 | |
| | | | | | | | | | | | | | | | | | | | | | | | | | |
| | .90 | | | | 857 | | | | 7.16 | * | | | (5.42 | )* | | | .68 | * | | | 1.07 | * | | | 25 | |
| (a) | Per share Net Investment Income (Loss) is calculated using the average daily shares method. |
| (b) | Distributions from Capital Gains include short-term capital gains, if any. |
| (c) | Total return is the combination of changes in net asset value without any sales charge, reinvested dividend income at net asset value and reinvested capital gains distributions at net asset value, if any. Total returns are not annualized. |
| (d) | After expense reimbursement from the Adviser, where applicable. |
| (e) | For the period May 4, 2012 (commencement of operations) through August 31, 2012. |
| (f) | In addition to the fees and expenses which the Fund bears directly; the Fund indirectly bears a pro rata share of the fees and expenses of the exchange-traded funds in which the Fund invests. These exchange-traded fund fees and expenses are not reflected in the expense ratios. Because the exchange-traded funds have varied expenses and fee levels and the Fund may own different proportions at different times, the amount of fees and expenses incurred indirectly by the Fund will vary. |
| ** | Rounds to less than $.01 per share. |
See accompanying notes to financial statements.
Financial Highlights (continued)
| | | | | | | | | | | | | | | | | | | | | | | | | | | | | | | | |
| Selected data for a share outstanding throughout each period: | |
| | | | | | |
| Class (Commencement Date) | | | | | | | | | | | | | | | | | | | |
| | | | | | Investment Operations | | | Less Distributions | | | | |
| | | | | | |
| INTELLIGENT RISK MODERATE ALLOCATION | | | | | | | | | | | | | | | | | | | |
Year Ended
August 31, | | Beginning
Net
Asset
Value | | |
Net
Invest-
ment
Income
(Loss)(a) | | | Net
Realized/
Unrealized
Gain
(Loss) | | | Total | | | Net
Invest-
ment
Income | | | Capital
Gains(b) | | | Total | | | Ending
Net
Asset
Value | |
CLASS A (5/12) | | | | | | | | | | | | | | | | | | | | | | | | | |
2012(e) | | $ | 20.00 | | | $ | .04 | | | $ | .62 | | | $ | .66 | | | $ | — | | | $ | — | | | $ | — | | | $ | 20.66 | |
CLASS C (5/12) | | | | | | | | | | | | | | | | | | | | | | | | | |
2012(e) | | | 20.00 | | | | — | ** | | | .61 | | | | .61 | | | | — | | | | — | | | | — | | | | 20.61 | |
CLASS R3 (5/12) | | | | | | | | | | | | | | | | | | | | | | | | | |
2012(e) | | | 20.00 | | | | .04 | | | | .60 | | | | .64 | | | | — | | | | — | | | | — | | | | 20.64 | |
CLASS I (5/12) | | | | | | | | | | | | | | | | | | | | | | | | | |
2012(e) | | | 20.00 | | | | .07 | | | | .61 | | | | .68 | | | | — | | | | — | | | | — | | | | 20.68 | |
| | | | | | | | | | | | | | | | | | | | | | | | | | |
| | | | | | | | | | | | | | | | | | | | |
| | | | |
| | | | | | | | | | | | | | |
| Ratios/Supplemental Data | |
| | | | | | |
Ratios to Average
Net Assets Before
Reimbursement | | | Ratios to Average
Net Assets After
Reimbursement(d) | | | | |
| | | | | | |
Total
Return(c) | | | Ending
Net
Assets
(000) | | | Expenses(f) | | | Net
Invest-
ment
Income
(Loss) | | | Expenses(f) | | | Net
Invest-
ment
Income
(Loss) | | | Portfolio
Turnover
Rate | |
| | | | | | | | | | | | | | | | | | | | | | | | | | |
| | 3.30 | % | | $ | 98 | | | | 7.40 | %* | | | (5.86 | )%* | | | .93 | %* | | | .60 | %* | | | 21 | % |
| | | | | | | | | | | | | | | | | | | | | | | | | | |
| | 3.05 | | | | 62 | | | | 7.90 | * | | | (6.18 | )* | | | 1.68 | * | | | .04 | * | | | 21 | |
| | | | | | | | | | | | | | | | | | | | | | | | | | |
| | 3.20 | | | | 52 | | | | 7.41 | * | | | (5.68 | )* | | | 1.18 | * | | | .54 | * | | | 21 | |
| | | | | | | | | | | | | | | | | | | | | | | | | | |
| | 3.40 | | | | 894 | | | | 6.91 | * | | | (5.20 | )* | | | .68 | * | | | 1.03 | * | | | 21 | |
| (a) | Per share Net Investment Income (Loss) is calculated using the average daily shares method. |
| (b) | Distributions from Capital Gains include short-term capital gains, if any. |
| (c) | Total return is the combination of changes in net asset value without any sales charge, reinvested dividend income at net asset value and reinvested capital gains distributions at net asset value, if any. Total returns are not annualized. |
| (d) | After expense reimbursement from the Adviser, where applicable. |
| (e) | For the period May 4, 2012 (commencement of operations) through August 31, 2012. |
| (f) | In addition to the fees and expenses which the Fund bears directly; the Fund indirectly bears a pro rata share of the fees and expenses of the exchange-traded funds in which the Fund invests. These exchange-traded fund fees and expenses are not reflected in the expense ratios. Because the exchange-traded funds have varied expenses and fee levels and the Fund may own different proportions at different times, the amount of fees and expenses incurred indirectly by the Fund will vary. |
| ** | Rounds to less than $.01 per share. |
See accompanying notes to financial statements.
Financial Highlights (continued)
| | | | | | | | | | | | | | | | | | | | | | | | | | | | | | | | |
| Selected data for a share outstanding throughout each period: | |
| | | | | | |
| Class (Commencement Date) | | | | | | | | | | | | | | | | | | | |
| | | | | | Investment Operations | | | Less Distributions | | | | |
| | | | | |
| INTELLIGENT RISK CONSERVATIVE ALLOCATION | | | | | | | | | | | | | | | | |
Year Ended
August 31, | | Beginning
Net
Asset
Value | | | Net
Invest-
ment
Income
(Loss)(a) | | |
Net
Realized/
Unrealized
Gain
(Loss) | | | Total | | | Net
Invest-
ment
Income | | | Capital
Gains(b) | | | Total | | | Ending
Net
Asset
Value | |
CLASS A (5/12) | | | | | | | | | | | | | | | | | | | | | | | | | |
2012(e) | | $ | 20.00 | | | $ | .10 | | | $ | .33 | | | $ | .43 | | | $ | (.10 | ) | | $ | — | | | $ | (.10 | ) | | $ | 20.33 | |
CLASS C (5/12) | | | | | | | | | | | | | | | | | | | | | | | | | |
2012(e) | | | 20.00 | | | | .05 | | | | .34 | | | | .39 | | | | (.07 | ) | | | — | | | | (.07 | ) | | | 20.32 | |
CLASS R3 (5/12) | | | | | | | | | | | | | | | | | | | | | | | | | |
2012(e) | | | 20.00 | | | | .09 | | | | .33 | | | | .42 | | | | (.09 | ) | | | — | | | | (.09 | ) | | | 20.33 | |
CLASS I (5/12) | | | | | | | | | | | | | | | | | | | | | | | | | |
2012(e) | | | 20.00 | | | | .12 | | | | .33 | | | | .45 | | | | (.11 | ) | | | — | | | | (.11 | ) | | | 20.34 | |
| | | | | | | | | | | | | | | | | | | | | | | | | | |
| | | | | | | | | | | | | | | | | | | | |
| | | | |
| | | | | | | | | | | | | | |
| Ratios/Supplemental Data | |
| | | | | | |
Ratios to Average
Net Assets Before
Reimbursement | | | Ratios to Average
Net Assets After
Reimbursement(d) | | | | |
| | | | | | |
Total
Return(c) | | | Ending
Net
Assets
(000) | | | Expenses(f) | | | Net
Invest-
ment
Income
(Loss) | | | Expenses(f) | | | Net
Invest-
ment
Income
(Loss) | | | Portfolio
Turnover
Rate | |
| | | | | | | | | | | | | | | | | | | | | | | | | | |
| | 2.17 | % | | $ | 71 | | | | 7.34 | %* | | | (4.84 | )%* | | | .93 | %* | | | 1.57 | %* | | | 25 | % |
| | | | | | | | | | | | | | | | | | | | | | | | | | |
| | 1.94 | | | | 51 | | | | 7.95 | * | | | (5.45 | )* | | | 1.68 | * | | | .83 | * | | | 25 | |
| | | | | | | | | | | | | | | | | | | | | | | | | | |
| | 2.11 | | | | 51 | | | | 7.46 | * | | | (4.95 | )* | | | 1.18 | * | | | 1.33 | * | | | 25 | |
| | | | | | | | | | | | | | | | | | | | | | | | | | |
| | 2.27 | | | | 880 | | | | 6.97 | * | | | (4.47 | )* | | | .68 | * | | | 1.82 | * | | | 25 | |
| (a) | Per share Net Investment Income (Loss) is calculated using the average daily shares method. |
| (b) | Distributions from Capital Gains include short-term capital gains, if any. |
| (c) | Total return is the combination of changes in net asset value without any sales charge, reinvested dividend income at net asset value and reinvested capital gains distributions at net asset value, if any. Total returns are not annualized. |
| (d) | After expense reimbursement from the Adviser, where applicable. |
| (e) | For the period May 4, 2012 (commencement of operations) through August 31, 2012. |
| (f) | In addition to the fees and expenses which the Fund bears directly; the Fund indirectly bears a pro rata share of the fees and expenses of the exchange-traded funds in which the Fund invests. These exchange-traded fund fees and expenses are not reflected in the expense ratios. Because the exchange-traded funds have varied expenses and fee levels and the Fund may own different proportions at different times, the amount of fees and expenses incurred indirectly by the Fund will vary. |
See accompanying notes to financial statements.
Notes to Financial Statements
1. General Information and Significant Accounting Policies
General Information
The Nuveen Investment Trust (the “Trust”), is an open-end management investment company registered under the Investment Company Act of 1940, as amended. The Trust is comprised of the Nuveen Intelligent Risk Growth Allocation Fund (“Intelligent Risk Growth Allocation”), Nuveen Intelligent Risk Moderate Allocation Fund (“Intelligent Risk Moderate Allocation”) and Nuveen Intelligent Risk Conservative Allocation Fund (“Intelligent Risk Conservative Allocation”), (each a “Fund” and collectively, the “Funds”), among others. The Funds commenced operations on May 4, 2012. The Trust was organized as a Massachusetts business trust in 1996.
Each Fund’s investment objective is to seek total return. Under normal market conditions, each Fund attempts to maintain a consistent risk level through changing market conditions by investing in exchange-traded funds (“ETFs”) and certain derivatives whose performance is expected to correspond to a variety of different asset classes. Intelligent Risk Growth Allocation, Intelligent Risk Moderate Allocation and Intelligent Risk Conservative Allocation seek to maintain a consistent risk level by attempting to keep their daily volatility range (i.e., fluctuations in value) within 12% to 18% (annualized), 7% to 12% (annualized) and 3.5% to 7% (annualized), respectively.
Each Fund may invest in ETFs and derivatives in order to gain exposure to any asset class, including: any commodity; any currency; U.S. and foreign (including emerging markets) equity securities; U.S. and foreign (including emerging markets) real estate; U.S. and foreign (including emerging markets) corporate bonds; U.S. and foreign (including emerging markets) government bonds; asset-backed securities; mortgage-backed securities; inflation-protected securities; and municipal bonds. The equity securities to which a Fund may have exposure may be of any market capitalization. The bonds to which a Fund may have exposure may be of any maturity and of any credit quality, including high yield or “junk” bonds. Each Fund may also invest in cash and cash equivalent instruments, some of which may serve as margin or collateral for the Fund’s obligations under derivative transactions.
The Funds’ most recent prospectus provides further descriptions of each Fund’s investment objective, principal investment strategies and principal risks.
Significant Accounting Policies
The following is a summary of significant accounting policies followed by the Funds in the preparation of their financial statements in accordance with accounting principles generally accepted in the United States (“U.S. GAAP”).
Investment Valuation
ETFs are valued at the last sales price on the securities exchange on which such securities are primarily traded and are generally classified as Level 1 for fair value measurement purposes.
Investments in investment companies are valued at their respective net asset values on the valuation date. These investment vehicles are generally classified as Level 1.
Certain securities may not be able to be priced by the pre-established pricing methods as described above. Such securities may be valued by the Funds’ Board of Trustees or its designee at fair value. These securities generally include, but are not limited to, restricted securities (securities which may not be publicly sold without registration under the Securities Act of 1933, as amended) for which a pricing service is unable to provide a market price; securities whose trading has been formally suspended; debt securities that have gone into default and for which there is no current market quotation; a security whose market price is not available from a pre-established pricing source; a security with respect to which an event has occurred that is likely to materially affect the value of the security after the market has closed but before the calculation of a Fund’s net asset value (as may be the case in non-U.S. markets on which the security is primarily traded) or make it difficult or impossible to obtain a reliable market quotation; and a security whose price, as provided by the pricing service, is not deemed to reflect the security’s fair value. As a general principle, the fair value of a security would appear to be the amount that the owner might reasonably expect to receive for it in a current sale. A variety of factors may be considered in determining the fair value of such securities, which may include consideration of the following: yields or prices of investments of comparable quality, type of issue, coupon, maturity and rating, market quotes or indications of value from security dealers, evaluations of anticipated cash flows or collateral, general market conditions and other information and analysis, including the obligor’s credit characteristics considered relevant. These securities are classified as Level 2 or Level 3 depending on the priority of the significant inputs. Regardless of the method employed to value a particular security, all valuations are subject to review by the Funds’ Board of Trustees or its designee.
Refer to Footnote 2 – Fair Value Measurements for further details on the leveling of securities held by the Funds as of the end of the reporting period.
Investment Transactions
Investment transactions are recorded on a trade date basis. Realized gains and losses from investment transactions are determined on the specific identification method, which is the same basis used for federal income tax purposes.
Investment Income
Dividend income, and realized gain distributions from the ETFs are recorded on the ex-dividend date. Interest income is recorded on an accrual basis.
Income Taxes
Each Fund is a separate taxpayer for federal income tax purposes. Each Fund intends to distribute substantially all of its net investment income and net capital gains to shareholders and to otherwise comply with the requirements of Subchapter M of the Internal Revenue Code applicable to regulated investment companies. Therefore, no federal income tax provision is required.
For all open tax years and all major taxing jurisdictions, management of the Funds has concluded that there are no significant uncertain tax positions that would require recognition in the financial statements. Open tax years are those that are open for examination by taxing authorities (i.e., generally the last four tax year ends and the interim tax period since then). Furthermore, management of the Funds is also not aware of any tax positions for which it is reasonably possible that the total amounts of unrecognized tax benefits will significantly change in the next twelve months.
Dividends and Distributions to Shareholders
Dividends from net investment income are declared and distributed to shareholders annually for Intelligent Risk Growth Allocation, quarterly for Intelligent Risk Moderate Allocation and monthly for Intelligent Risk Conservative Allocation. Net realized capital gains from investment transactions, if any, are declared and distributed to shareholders at least annually. Furthermore, capital gains are distributed only to the extent they exceed available capital loss carryforwards.
Distributions to shareholders are recorded on the ex-dividend date. The amount and timing of distributions are determined in accordance with federal income tax regulations, which may differ from U.S. GAAP.
Flexible Sales Charge Program
Class A Shares are generally sold with an up-front sales charge and incur a .25% annual 12b-1 service fee. Class A Share purchases of $1 million or more are sold at net asset value without an up-front sales charge but may be subject to a contingent deferred sales charge (“CDSC”) if redeemed within twelve months of purchase. Class C Shares are sold without an up-front sales charge but incur a .75% annual 12b-1 distribution fee and a .25% annual 12b-1 service fee. Class C Shares are subject to a CDSC of 1% if redeemed within twelve months of purchase. Class R3 Shares are sold without an up-front sales charge but incur a .25% annual 12b-1 distribution fee and a .25% annual 12b-1 service fee. Class I Shares are not subject to any sales charge or 12b-1 distribution or service fees.
Derivative Financial Instruments
Each Fund is authorized to invest in certain derivative instruments, including forward foreign currency exchange contracts, futures, options and swap contracts. Although the Funds are authorized to invest in such financial instruments, and may do so in the future, they did not make any such investments from the commencement of operations May 4, 2012 through August 31, 2012.
Market and Counterparty Credit Risk
In the normal course of business each Fund may invest in financial instruments and enter into financial transactions where risk of potential loss exists due to changes in the market (market risk) or failure of the other party to the transaction to perform (counterparty credit risk). The potential loss could exceed the value of the financial assets recorded on the financial statements. Financial assets, which potentially expose each Fund to counterparty credit risk, consist principally of cash due from counterparties on forward, option and swap transactions, when applicable. The extent of each Fund’s exposure to counterparty credit risk in respect to these financial assets approximates their carrying value as recorded on the Statement of Assets and Liabilities. Futures contracts, when applicable, expose a Fund to minimal counterparty credit risk as they are exchange traded and the exchange’s clearinghouse, which is counterparty to all exchange traded futures, guarantees the futures contracts against default.
Each Fund helps manage counterparty credit risk by entering into agreements only with counterparties Nuveen Fund Advisors, Inc. (the “Adviser”), a wholly-owned subsidiary of Nuveen Investments, Inc. (“Nuveen”), believes have the financial resources to honor their obligations and by having the Adviser monitor the financial stability of the counterparties. Additionally, counterparties may be required to pledge collateral daily (based on the daily valuation of the financial asset) on behalf of each Fund with a value approximately equal to the amount of any unrealized gain above a pre-determined threshold. Reciprocally, when each Fund has an unrealized loss, the Funds have instructed the custodian to pledge assets of the Funds as collateral with a value approximately equal to the amount of the unrealized loss above a pre-determined threshold. Collateral pledges are monitored and subsequently adjusted if and when the valuations fluctuate, either up or down, by at least the pre-determined threshold amount.
Multiclass Operations and Allocations
Income and expenses of the Funds that are not directly attributable to a specific class of shares are prorated among the classes based on the relative net assets of each class. Expenses directly attributable to a class of shares, which presently only include 12b-1 distribution fees and shareholder service fees, are recorded to the specific class.
Realized and unrealized capital gains and losses of the Funds are prorated among the classes based on the relative net assets of each class.
Indemnifications
Under the Trust’s organizational documents, its officers and trustees are indemnified against certain liabilities arising out of the performance of their duties to the Trust. In addition, in the normal course of business, the Trust enters into contracts that provide general indemnifications to other parties. The Trust’s maximum exposure under these arrangements is unknown as this would involve future claims that may be made against the Trust that have not yet occurred. However, the Trust has not had prior claims or losses pursuant to these contracts and expects the risk of loss to be remote.
Notes to Financial Statements (continued)
Use of Estimates
The preparation of financial statements in conformity with U.S. GAAP requires management to make estimates and assumptions that affect the reported amounts of assets and liabilities at the date of the financial statements and the reported amounts of increases and decreases in net assets from operations during the reporting period. Actual results may differ from those estimates.
2. Fair Value Measurements
Fair value is defined as the price that the Funds would receive upon selling an investment or transferring a liability in an orderly transaction to an independent buyer in the principal or most advantageous market for the investment. A three-tier hierarchy is used to maximize the use of observable market data and minimize the use of unobservable inputs and to establish classification of fair value measurements for disclosure purposes. Observable inputs reflect the assumptions market participants would use in pricing the asset or liability. Observable inputs are based on market data obtained from sources independent of the reporting entity. Unobservable inputs reflect the reporting entity’s own assumptions about the assumptions market participants would use in pricing the asset or liability. Unobservable inputs are based on the best information available in the circumstances. The following is a summary of the three-tiered hierarchy of valuation input levels.
| | |
| Level 1 – | | Inputs are unadjusted and prices are determined using quoted prices in active markets for identical securities. |
| Level 2 – | | Prices are determined using other significant observable inputs (including quoted prices for similar securities, interest rates, prepayment speeds, credit risk, etc.). |
| Level 3 – | | Prices are determined using significant unobservable inputs (including management’s assumptions in determining the fair value of investments). |
The inputs or methodologies used for valuing securities are not an indication of the risk associated with investing in those securities. The following is a summary of each Fund’s fair value measurements as of the end of the reporting period:
| | | | | | | | | | | | | | | | |
| Intelligent Risk Growth Allocation | | Level 1 | | | Level 2 | | | Level 3 | | | Total | |
Long-Term Investments: | | | | | | | | | | | | | | | | |
Exchange-Traded Funds | | $ | 1,015,742 | | | $ | — | | | $ | — | | | $ | 1,015,742 | |
Short-Term Investments: | | | | | | | | | | | | | | | | |
Money Market Funds | | | 3,976 | | | | — | | | | — | | | | 3,976 | |
Total | | $ | 1,019,718 | | | $ | — | | | $ | — | | | $ | 1,019,718 | |
| | | | |
| Intelligent Risk Moderate Allocation | | Level 1 | | | Level 2 | | | Level 3 | | | Total | |
Long-Term Investments: | | | | | | | | | | | | | | | | |
Exchange-Traded Funds | | $ | 1,101,710 | | | $ | — | | | $ | — | | | $ | 1,101,710 | |
Short-Term Investments: | | | | | | | | | | | | | | | | |
Money Market Funds | | | 4,570 | | | | — | | | | — | | | | 4,570 | |
Total | | $ | 1,106,280 | | | $ | — | | | $ | — | | | $ | 1,106,280 | |
| | | | |
| Intelligent Risk Conservative Allocation | | Level 1 | | | Level 2 | | | Level 3 | | | Total | |
Long-Term Investments: | | | | | | | | | | | | | | | | |
Exchange-Traded Funds | | $ | 1,059,288 | | | $ | — | | | $ | — | | | $ | 1,059,288 | |
Short-Term Investments: | | | | | | | | | | | | | | | | |
Money Market Funds | | | 25,875 | | | | — | | | | — | | | | 25,875 | |
Total | | $ | 1,085,163 | | | $ | — | | | $ | — | | | $ | 1,085,163 | |
The Nuveen funds’ Board of Directors/Trustees is responsible for the valuation process and has delegated the oversight of the daily valuation process to the Adviser’s Valuation Committee. The Valuation Committee, pursuant to the valuation policies and procedures adopted by the Board of Directors/Trustees, is responsible for making fair value determinations, evaluating the effectiveness of the funds’ pricing policies, and reporting to the Board of Directors/Trustees. The Valuation Committee is aided in its efforts by the Adviser’s dedicated Securities Valuation Team, which is responsible for administering the daily valuation process and applying fair value methodologies as approved by the Valuation Committee. When determining the reliability of independent pricing services for investments owned by the funds, the Valuation Committee, among other things, conducts due diligence reviews of the pricing services and monitors the quality of security prices received through various testing reports conducted by the Securities Valuation Team.
The Valuation Committee will consider pricing methodologies it deems relevant and appropriate when making fair value determinations. Examples of possible methodologies include, but are not limited to, multiple of earnings; discount from market of a similar freely traded security; discounted cash-flow analysis; book value or a multiple thereof; risk premium/yield analysis; yield to maturity; and/or fundamental investment analysis. The Valuation Committee will also consider factors it deems relevant and appropriate in light of the facts and circumstances. Examples of possible factors include, but are not limited to, the type of security; the issuer’s financial statements; the purchase price of the security; the discount from market value of unrestricted securities of the same class at the time of purchase; analysts’ research and observations from financial institutions; information regarding any
transactions or offers with respect to the security; the existence of merger proposals or tender offers affecting the security; the price and extent of public trading in similar securities of the issuer or comparable companies; and the existence of a shelf registration for restricted securities.
For each portfolio security that has been fair valued pursuant to the policies adopted by the Board of Directors/Trustees, the fair value price is compared against the last available and next available market quotations. The Valuation Committee reviews the results of such testing and fair valuation occurrences are reported to the Board of Directors/Trustees.
3. Derivative Instruments and Hedging Activities
The Funds record derivative instruments at fair value, with changes in fair value recognized on the Statement of Operations, when applicable. Even though the Funds’ investments in derivatives may represent economic hedges, they are not considered to be hedge transactions for financial reporting purposes. The Funds did not invest in derivative instruments during the period from commencement of operations May 4, 2012 through August 31, 2012.
4. Fund Shares
Transactions in Fund shares were as follows:
| | | | | | | | | | | | | | | | |
| | | Intelligent Risk
Growth Allocation | | | Intelligent Risk
Moderate Allocation | |
| | For the period 5/04/12
(commencement of
operations) through 8/31/12 | | | For the period 5/04/12
(commencement of
operations) through 8/31/12 | |
| | Shares | | | Amount | | | Shares | | | Amount | |
Shares sold: | |
Class A | | | 2,500 | | | $ | 50,000 | | | | 4,732 | | | $ | 95,233 | |
Class C | | | 2,500 | | | | 50,000 | | | | 3,009 | | | | 60,495 | |
Class R3 | | | 2,500 | | | | 50,000 | | | | 2,500 | | | | 50,000 | |
Class I | | | 42,500 | | | | 850,000 | | | | 43,248 | | | | 865,000 | |
Net increase | | | 50,000 | | | $ | 1,000,000 | | | | 53,489 | | | $ | 1,070,728 | |
| | | | | | | | |
| | | Intelligent Risk
Conservative Allocation | |
| | | For the period 5/04/12
(commencement of
operations) through 8/31/12 | |
| | | Shares | | | Amount | |
Shares sold: | | | | | | | | |
Class A | | | 3,488 | | | $ | 70,000 | |
Class C | | | 2,500 | | | | 50,000 | |
Class R3 | | | 2,500 | | | | 50,000 | |
Class I | | | 43,252 | | | | 865,000 | |
Shares issued to shareholders due to reinvestment of distributions: | | | | | | | | |
Class A | | | — | | | | — | |
Class C | | | — | | | | — | |
Class R3 | | | — | | | | — | |
Class I | | | 3 | | | | 55 | |
Net increase | | | 51,743 | | | $ | 1,035,055 | |
5. Investment Transactions
Purchases and sales (excluding short-term investments) for the period May 4, 2012 (commencement of operations) through August 31, 2012, were as follows:
| | | | | | | | | | | | |
| | | Intelligent Risk
Growth Allocation | | | Intelligent Risk
Moderate Allocation | | | Intelligent Risk
Conservative Allocation | |
Purchases | | $ | 1,253,417 | | | $ | 1,289,829 | | | $ | 1,298,802 | |
Sales | | | 243,072 | | | | 219,828 | | | | 256,453 | |
Notes to Financial Statements (continued)
6. Income Tax Information
The following information is presented on an income tax basis. Differences between amounts for financial statement and federal income tax purposes are primarily due to timing differences in recognizing certain gains and losses on investment transactions. To the extent that differences arise that are permanent in nature, such amounts are reclassified within the capital accounts as detailed below. Temporary differences do not require reclassification. Temporary and permanent differences do not impact the net asset values of the Funds.
At August 31, 2012, the cost and unrealized appreciation (depreciation) of investments, as determined on a federal income tax basis, were as follows:
| | | | | | | | | | | | |
| | | Intelligent Risk
Growth Allocation | | | Intelligent Risk
Moderate Allocation | | | Intelligent Risk
Conservative Allocation | |
Cost of investments | | $ | 1,003,489 | | | $ | 1,067,531 | | | $ | 1,065,693 | |
Gross unrealized: | | | | | | | | | | | | |
Appreciation | | | 24,163 | | | | 43,389 | | | | 21,738 | |
Depreciation | | | (7,934 | ) | | | (4,640 | ) | | | (2,268 | ) |
Net unrealized appreciation (depreciation) of investments | | $ | 16,229 | | | $ | 38,749 | | | $ | 19,470 | |
Permanent differences, primarily due to nondeductible stock issuance costs resulted in reclassifications among the Funds’ components of net assets at August 31, 2012, the Funds’ tax year-end, as follows:
| | | | | | | | | | | | |
| | | Intelligent Risk
Growth Allocation | | | Intelligent Risk
Moderate Allocation | | | Intelligent Risk
Conservative Allocation | |
Capital paid-in | | $ | (207 | ) | | $ | (212 | ) | | $ | (213 | ) |
Undistributed (Over-distribution of) net investment income | | | 207 | | | | 212 | | | | 213 | |
Accumulated net realized gain (loss) | | | — | | | | — | | | | — | |
The tax components of undistributed net ordinary income and net long-term capital gains at August 31, 2012, the Funds’ tax year end, were as follows:
| | | | | | | | | | | | |
| | | Intelligent Risk
Growth Allocation | | | Intelligent Risk
Moderate Allocation | | | Intelligent Risk
Conservative Allocation | |
Undistributed net ordinary income* | | $ | 3,334 | | | $ | 3,312 | | | $ | 2,376 | |
Undistributed net long-term capital gains | | | — | | | | — | | | | — | |
| * | Net ordinary income consists of net taxable income derived from dividends, interest, and net short-term capital gains, if any. |
The tax character of distributions paid during the period May 4, 2012 (commencement of operations) through August 31, 2012, the Funds’ tax year end, was designated for purposes of the dividends paid deduction as follows:
| | | | | | | | | | | | |
| | | Intelligent Risk
Growth Allocation | | | Intelligent Risk
Moderate Allocation | | | Intelligent Risk
Conservative Allocation | |
Distributions from net ordinary income* | | $ | — | | | $ | — | | | $ | 3,558 | |
Distributions from net long-term capital gains | | | — | | | | — | | | | — | |
| * | Net ordinary income consists of net taxable income derived from dividends, interest, and net short-term capital gains, if any. |
During the Funds’ tax year ended August 31, 2012, there were no capital losses generated.
The Funds have elected to defer losses incurred from May 4, 2012 (commencement of operations) through August 31, 2012, the Funds’ tax year end, in accordance with federal income tax rules. These losses are treated as having arisen on the first day of the following fiscal year. The Funds have elected to defer losses as follows:
| | | | | | | | | | | | |
| | | Intelligent Risk
Growth Allocation | | | Intelligent Risk
Moderate Allocation | | | Intelligent Risk
Conservative Allocation | |
Post-October capital losses | | $ | 10,831 | | | $ | 7,040 | | | $ | 2,531 | |
Late-year ordinary losses | | | — | | | | — | | | | — | |
7. Management Fees and Other Transactions with Affiliates
Each Fund’s management fee consists of two components – a fund-level fee, based only on the amount of assets within each individual Fund, and a complex-level fee, based on the aggregate amount of all eligible fund assets managed by the Adviser. This pricing structure enables each Fund’s shareholders to benefit from growth in the assets within their respective Fund as well as from growth in the amount of complex-wide assets managed by the Adviser.
The annual fund-level fee for each Fund, payable monthly, is calculated according to the following schedule:
| | | | |
| Average Daily Net Assets | | Fund-Level Fee Rate | |
For the first $125 million | | | .6000 | % |
For the next $125 million | | | .5875 | |
For the next $250 million | | | .5750 | |
For the next $500 million | | | .5625 | |
For the next $1 billion | | | .5500 | |
For net assets over $2 billion | | | .5250 | |
The annual complex-level fee for each Fund, payable monthly, is calculated according to the following schedule:
| | | | |
| Complex-Level Asset Breakpoint Level* | | Effective Rate at Breakpoint Level | |
$55 billion | | | .2000 | % |
$56 billion | | | .1996 | |
$57 billion | | | .1989 | |
$60 billion | | | .1961 | |
$63 billion | | | .1931 | |
$66 billion | | | .1900 | |
$71 billion | | | .1851 | |
$76 billion | | | .1806 | |
$80 billion | | | .1773 | |
$91 billion | | | .1691 | |
$125 billion | | | .1599 | |
$200 billion | | | .1505 | |
$250 billion | | | .1469 | |
$300 billion | | | .1445 | |
| * | The complex-level fee is calculated based upon the aggregate daily “eligible assets” of all Nuveen Funds. Eligible assets do not include assets attributable to investments in other Nuveen Funds or assets in excess of $2 billion added to the Nuveen Fund complex in connection with the Adviser’s assumption of the management of the former First American Funds effective January 1, 2011. Eligible assets include closed-end fund assets managed by the Adviser that are attributable to financial leverage. For these purposes, financial leverage includes the closed-end funds’ use of preferred stock and borrowings and investments in the residual interest certificates (also called inverse floating rate securities) in tender option bond (TOB) trusts, including the portion of assets held by a TOB trust that has been effectively financed by the trust’s issuance of floating rate securities, subject to an agreement by the Adviser as to certain funds to limit the amount of such assets for determining eligible assets in certain circumstances. As of August 31, 2012, the complex-level fee rate for each of these Funds was ..1702% |
The management fee compensates the Adviser for the overall investment advisory and administrative services and general office facilities. The Adviser is responsible for each Fund’s overall strategy and asset allocation decisions. The Adviser has entered into sub-advisory agreements with Nuveen Asset Management, LLC (the “Sub-Adviser”), a wholly-owned subsidiary of the Adviser, under which the Sub-Adviser manages the investment portfolios of the Funds. The Sub-Adviser is compensated for its services to the Funds from the management fees paid to the Adviser.
The Adviser has agreed to waive fees and/or reimburse expenses of each Fund through October 31, 2014, so that total annual Fund operating expenses (excluding 12B-1 distribution and/or service fees, interest expenses, taxes, fees incurred in acquiring and disposing of portfolio securities, acquired fund fees and expenses and extraordinary expenses), for each Fund do not exceed 0.71% of the average daily net assets of any class of Fund shares.
The Adviser may voluntarily reimburse expenses from time to time in any of the Funds. Voluntary reimbursements may be terminated at any time at the Adviser’s discretion.
The Trust pays no compensation directly to those of its trustees who are affiliated with the Adviser or to its officers, all of whom receive remuneration for their services to the Trust from the Adviser or its affiliates. The Board of Trustees has adopted a deferred compensation plan for independent trustees that enables trustees to elect to defer receipt of all or a portion of the annual compensation they are entitled to receive from certain Nuveen-advised funds. Under the plan, deferred amounts are treated as though equal dollar amounts had been invested in shares of select Nuveen-advised funds.
During the period May 4, 2012 (commencement of operations) through August 31, 2012, Nuveen Securities, LLC (the “Distributor”), a wholly-owned subsidiary of Nuveen, collected sales charges on purchases of Class A Shares, the majority of which were paid out as concessions to financial intermediaries as follows:
| | | | | | | | | | | | |
| | | Intelligent Risk Growth Allocation | | | Intelligent Risk
Moderate Allocation | | | Intelligent Risk
Conservative Allocation | |
Sales charges collected (Unaudited) | | $ | — | | | $ | 2,767 | | | $ | — | |
Paid to financial intermediaries (Unaudited) | | | — | | | | 2,400 | | | | — | |
The Distributor also received 12b-1 service fees on Class A Shares, substantially all of which were paid to compensate financial intermediaries for providing services to shareholders relating to their investments.
Notes to Financial Statements (continued)
During the period May 4, 2012 (commencement of operations) through August 31, 2012, the Distributor compensated financial intermediaries directly with commission advances at the time of purchase as follows:
| | | | | | | | | | | | |
| | | Intelligent Risk
Growth Allocation | | | Intelligent Risk
Moderate Allocation | | | Intelligent Risk
Conservative Allocation | |
Commission advances (Unaudited) | | $ | — | | | $ | — | | | $ | — | |
To compensate for commissions advanced to financial intermediaries, all 12b-1 service and distribution fees collected on C Shares during the first year following a purchase were retained by the Distributor. During the period May 4, 2012 (commencement of operations) through August 31, 2012, the Distributor retained such 12b-1 fees as follows:
| | | | | | | | | | | | |
| | | Intelligent Risk
Growth Allocation | | | Intelligent Risk
Moderate Allocation | | | Intelligent Risk
Conservative Allocation | |
12b-1 fees retained (Unaudited) | | $ | 159 | | | $ | 163 | | | $ | 163 | |
The remaining 12b-1 fees charged to the Funds were paid to compensate financial intermediaries for providing services to shareholders relating to their investments.
The Distributor also collected and retained CDSC on share redemptions during the period May 4, 2012 (commencement of operations) through August 31, 2012, as follows:
| | | | | | | | | | | | |
| | | Intelligent Risk
Growth Allocation | | | Intelligent Risk
Moderate Allocation | | | Intelligent Risk
Conservative Allocation | |
CDSC retained (Unaudited) | | $ | — | | | $ | — | | | $ | — | |
At August 31, 2012, Nuveen owned shares of the Funds as follows:
| | | | | | | | | | | | |
| | | Intelligent Risk
Growth Allocation | | | Intelligent Risk
Moderate Allocation | | | Intelligent Risk
Conservative Allocation | |
Class A Shares | | $ | 2,500 | | | $ | 2,500 | | | $ | 2,500 | |
Class C Shares | | | 2,500 | | | | 2,500 | | | | 2,500 | |
Class R3 Shares | | | 2,500 | | | | 2,500 | | | | 2,500 | |
Class I Shares | | | 42,500 | | | | 42,500 | | | | 42,500 | |
8. New Accounting Pronouncements
Financial Accounting Standards Board (“FASB”) Balance Sheet (Topic 210): Disclosures about Offsetting Assets and Liabilities
In December 2011, the FASB issued Accounting Standards Update (“ASU”) No. 2011-11 (“ASU No. 2011-11”) to enhance disclosures about financial instruments and derivative instruments that are subject to offsetting (“netting”) on the Statement of Assets and Liabilities. This information will enable users of the entity’s financial statements to evaluate the effect or potential effect of netting arrangements on the entity’s financial position. ASU No. 2011-11 is effective prospectively during interim or annual periods beginning on or after January 1, 2013. At this time, management is evaluating the implications of this guidance and the impact it will have to the financial statements amounts and footnote disclosures, if any.
Trustees and Officers (Unaudited)
The management of the Funds, including general supervision of the duties performed for the Funds by the Adviser, is the responsibility of the Board of Trustees of the Funds. The number of trustees of the Funds is currently set at ten. None of the trustees who are not “interested” persons of the Funds (referred to herein as “independent trustees”) has ever been a director or employee of, or consultant to, Nuveen or its affiliates. The names and business addresses of the trustees and officers of the Funds, their principal occupations and other affiliations during the past five years, the number of portfolios each oversees and other directorships they hold are set forth below.
The Funds’ Statement of Additional Information (“SAI”) includes more information about the trustees. To request a free copy, call Nuveen Investments at (800) 257-8787 or visit the Funds’ website at www.nuveen.com.
| | | | | | | | |
Name, Birthdate and Address | | Position(s) Held with the Funds | | Year First Elected or Appointed (1) | | Principal Occupation(s) Including other Directorships During Past 5 Years | | Number of Portfolios in Fund Complex Overseen by Trustee |
| | |
| Independent Trustees: | | | | |
Robert P. Bremner 8/22/40 333 W. Wacker Drive Chicago, IL 60606 | | Chairman of the Board and Trustee | | 1996 | | Private Investor and Management Consultant; Treasurer and Director, Humanities Council of Washington, D.C.; Board Member, Independent Directors Council affiliated with the Investment Company Institute. | | 217 |
Jack B. Evans 10/22/48 333 W. Wacker Drive Chicago, IL 60606 | | Trustee | | 1999 | | President, The Hall-Perrine Foundation, a private philanthropic corporation (since 1996); Director and Chairman, United Fire Group, a publicly held company; member of the Board of Regents for the State of Iowa University System; Director, Source Media Group; Life Trustee of Coe College and the Iowa College Foundation; formerly, Director, Alliant Energy; formerly, Director, Federal Reserve Bank of Chicago; formerly, President and Chief Operating Officer, SCI Financial Group, Inc., a regional financial services firm. | | 217 |
William C. Hunter 3/6/48 333 W. Wacker Drive Chicago, IL 60606 | | Trustee | | 2004 | | Dean Emeritus (since June 30, 2012), formerly, Dean, Tippie College of Business, University of Iowa (2006-2012); Director (since 2004) of Xerox Corporation; Director (since 2005), and President (since July 2012) Beta Gamma Sigma, Inc., The International Honor Society; Director of Wellmark, Inc. (since 2009); formerly, Dean and Distinguished Professor of Finance, School of Business at the University of Connecticut (2003-2006); previously, Senior Vice President and Director of Research at the Federal Reserve Bank of Chicago (1995-2003); formerly, Director (1997-2007), Credit Research Center at George Washington University. | | 217 |
David J. Kundert 10/28/42 333 W. Wacker Drive Chicago, IL 60606 | | Trustee | | 2005 | | Director, Northwestern Mutual Wealth Management Company; retired (since 2004) as Chairman, JPMorgan Fleming Asset Management, President and CEO, Banc One Investment Advisors Corporation, and President, One Group Mutual Funds; prior thereto, Executive Vice President, Banc One Corporation and Chairman and CEO, Banc One Investment Management Group; Member, Board of Regents, Luther College; member of the Wisconsin Bar Association; member of Board of Directors, Friends of Boerner Botanical Gardens; member of Board of Directors and Chair of Investment Committee, Greater Milwaukee Foundation. | | 217 |
William J. Schneider 9/24/44 333 W. Wacker Drive Chicago, IL 60606 | | Trustee | | 1996 | | Chairman of Miller-Valentine Partners Ltd., a real estate investment company; formerly, Senior Partner and Chief Operating Officer (retired 2004) of Miller-Valentine Group; member, University of Dayton Business School Advisory Council; member, Mid-America Health System Board; formerly, member and chair, Dayton Philharmonic Orchestra Association; formerly, member, Business Advisory Council, Cleveland Federal Reserve Bank. | | 217 |
Judith M. Stockdale 12/29/47 333 W. Wacker Drive Chicago, IL 60606 | | Trustee | | 1997 | | Executive Director, Gaylord and Dorothy Donnelley Foundation (since 1994); prior thereto, Executive Director, Great Lakes Protection Fund (1990-1994). | | 217 |
Carole E. Stone 6/28/47 333 W. Wacker Drive Chicago, IL 60606 | | Trustee | | 2007 | | Director, Chicago Board Options Exchange (since 2006); Director, C2 Options Exchange, Incorporated (since 2009); formerly, Commissioner, New York State Commission on Public Authority Reform (2005-2010); formerly, Chair, New York Racing Association Oversight Board (2005-2007). | | 217 |
Trustees and Officers (Unaudited) (continued)
| | | | | | | | |
Name, Birthdate and Address | | Position(s) Held with the Funds | | Year First Elected or Appointed (1) | | Principal Occupation(s) During Past Five Years | | Number of Portfolios in Fund Complex Overseen by Trustee |
Virginia L. Stringer 8/16/44 333 West Wacker Drive Chicago, IL 60606 | | Trustee | | 2011 | | Board Member, Mutual Fund Directors Forum; former governance consultant and non-profit board member; former Owner and President, Strategic Management Resources, Inc. a management consulting firm; former Member, Governing Board, Investment Company Institute’s Independent Directors Council; previously, held several executive positions in general management, marketing and human resources at IBM and The Pillsbury Company; Independent Director, First American Fund Complex (1987-2010) and Chair (1997-2010). | | 217 |
Terence J. Toth 9/29/59 333 W. Wacker Drive Chicago, IL 60606 | | Trustee | | 2008 | | Director, Legal & General Investment Management America, Inc. (since 2008); Managing Partner, Promus Capital (since 2008); formerly, CEO and President, Northern Trust Global Investments (2004-2007); Executive Vice President, Quantitative Management & Securities Lending (2000-2004); prior thereto, various positions with Northern Trust Company (since 1994); member: Goodman Theatre Board (since 2004), Chicago Fellowship Board (since 2005), Catalyst Schools of Chicago Board (since 2008); Mather Foundation Board (since 2012) and a member of its investment committee; formerly, member: Northern Trust Mutual Funds Board (2005-2007), Northern Trust Global Investments Board (2004-2007), Northern Trust Japan Board (2004-2007), Northern Trust Securities Inc. Board (2003-2007) and Northern Trust Hong Kong Board (1997-2004). | | 217 |
| | |
| Interested Trustee: | | | | |
John P. Amboian (2) 6/14/61 333 W. Wacker Drive Chicago, IL 60606 | | Trustee | | 2008 | | Chief Executive Officer and Chairman (since 2007) and Director (since 1999) of Nuveen Investments, Inc., formerly, President (1999-2007); Chief Executive Officer (since 2007) of Nuveen Investments Advisers Inc.; Director (since 1998) formerly, Chief Executive Officer (2007-2010) of Nuveen Fund Advisors, Inc. | | 217 |
Name, Birthdate and Address | | Position(s) Held with the Funds | | Year First Elected or Appointed (3) | | Principal Occupation(s) During Past 5 Years | | Number of Portfolios in Fund Complex Overseen by Officer |
| | |
| Officers of the Funds: | | | | |
Gifford R. Zimmerman 9/9/56 333 W. Wacker Drive Chicago, IL 60606 | | Chief Administrative Officer | | 1988 | | Managing Director (since 2002), Assistant Secretary of Nuveen Securities, LLC; Managing Director (since 2004) and Assistant Secretary (since 1994) of Nuveen Investments, Inc.; Managing Director (since 2002), Assistant Secretary (since 1997) and Co-General Counsel (since 2011) of Nuveen Fund Advisors, Inc.; Managing Director, Assistant Secretary and Associate General Counsel of Nuveen Asset Management, LLC (since 2011); Managing Director, Associate General Counsel and Assistant Secretary of Symphony Asset Management LLC (since 2003); Vice President and Assistant Secretary of NWQ Investment Management Company, LLC (since 2002), Nuveen Investments Advisers Inc. (since 2002), Santa Barbara Asset Management, LLC (since 2006) and of Winslow Capital Management, LLC, (since 2010); Chief Administrative Officer and Chief Compliance Officer (since 2006) of Nuveen Commodities Asset Management, LLC; Chartered Financial Analyst. | | 217 |
Margo L. Cook 4/11/64 333 W. Wacker Drive Chicago, IL 60606 | | Vice President | | 2009 | | Executive Vice President (since 2008) of Nuveen Investments, Inc. and of Nuveen Fund Advisors, Inc. (since 2011); Managing Director – Investment Services of Nuveen Commodities Asset Management, LLC (since August 2011) previously, Head of Institutional Asset Management (2007-2008) of Bear Stearns Asset Management; Head of Institutional Asset Management (1986-2007) of Bank of NY Mellon; Chartered Financial Analyst. | | 217 |
| | | | | | | | |
Name, Birthdate and Address | | Position(s) Held with the Funds | | Year First Elected or Appointed (3) | | Principal Occupation(s) During Past 5 Years | | Number of Portfolios in Fund Complex Overseen by Officer |
Lorna C. Ferguson 10/24/45 333 W. Wacker Drive Chicago, IL 60606 | | Vice President | | 1998 | | Managing Director (since 2005) of Nuveen Fund Advisors, Inc. and Nuveen Securities, LLC (since 2004). | | 217 |
Stephen D. Foy 5/31/54 333 W. Wacker Drive Chicago, IL 60606 | | Vice President and Controller | | 1998 | | Senior Vice President (since 2010), formerly, Vice President (2005-2010) and Funds Controller of Nuveen Securities, LLC; Vice President of Nuveen Fund Advisors, Inc.; Chief Financial Officer of Nuveen Commodities Asset Management, LLC (since 2010); Certified Public Accountant. | | 217 |
Scott S. Grace 8/20/70 333 W. Wacker Drive Chicago, IL 60606 | | Vice President and Treasurer | | 2009 | | Managing Director, Corporate Finance & Development, Treasurer (since 2009) of Nuveen Securities, LLC; Managing Director and Treasurer (since 2009) of Nuveen Fund Advisors, Inc., Nuveen Investments Advisers, Inc., Nuveen Investments Holdings Inc. and (since 2011) Nuveen Asset Management, LLC; Vice President and Treasurer of NWQ Investment Management Company, LLC, Tradewinds Global Investors, LLC, Symphony Asset Management LLC and Winslow Capital Management, LLC.; Vice President of Santa Barbara Asset Management, LLC; formerly, Treasurer (2006-2009), Senior Vice President (2008-2009), previously, Vice President (2006-2008) of Janus Capital Group, Inc.; formerly, Senior Associate in Morgan Stanley’s Global Financial Services Group (2000-2003); Chartered Accountant Designation. | | 217 |
Walter M. Kelly 2/24/70 333 W. Wacker Drive Chicago, IL 60606 | | Chief Compliance Officer and Vice President | | 2003 | | Senior Vice President (since 2008) and Assistant Secretary (since 2003) of Nuveen Fund Advisors, Inc; Senior Vice President (since 2008) of Nuveen Investments Holdings, Inc; formerly, Senior Vice President (2008-2011) of Nuveen Securities, LLC. | | 217 |
Tina M. Lazar 8/27/61 333 W. Wacker Drive Chicago, IL 60606 | | Vice President | | 2002 | | Senior Vice President (since 2010), formerly, Vice President (2005-2010) of Nuveen Fund Advisors, Inc. | | 217 |
Name, Birthdate and Address | | Position(s) Held with the Funds | | Year First Elected or Appointed (3) | | Principal Occupation(s) Including other Directorships During Past 5 Years | | Number of Portfolios in Fund Complex Overseen by Officer |
Kevin J. McCarthy 3/26/66 333 W. Wacker Drive Chicago, IL 60606 | | Vice President and Secretary | | 2007 | | Managing Director and Assistant Secretary (since 2008), formerly, Vice President (2007-2008), Nuveen Securities, LLC; Managing Director (since 2008), Assistant Secretary (since 2007) and Co-General Counsel (since 2011) of Nuveen Fund Advisors, Inc.; Managing Director, Assistant Secretary and Associate General Counsel (since 2011) of Nuveen Asset Management, LLC; Managing Director (since 2008), and Assistant Secretary, Nuveen Investment Holdings, Inc.; Vice President (since 2007) and Assistant Secretary of Nuveen Investments Advisers Inc., NWQ Investment Management Company, LLC, Tradewinds Global Investors LLC, NWQ Holdings, LLC, Symphony Asset Management LLC, Santa Barbara Asset Management, LLC, and of Winslow Capital Management, LLC. (since 2010); Vice President and Secretary (since 2010) of Nuveen Commodities Asset Management, LLC; prior thereto, Partner, Bell, Boyd & Lloyd LLP (1997-2007). | | 217 |
Kathleen L. Prudhomme 3/30/53 901 Marquette Avenue Minneapolis, MN 55402 | | Vice President and Assistant Secretary | | 2011 | | Managing Director, Assistant Secretary and Co-General Counsel (since 2011) of Nuveen Fund Advisors, Inc.; Managing Director, Assistant Secretary and Associate General Counsel (since 2011) of Nuveen Asset Management, LLC; Managing Director and Assistant Secretary (since 2011) of Nuveen Securities, LLC; formerly, Deputy General Counsel, FAF Advisors, Inc. (2004-2010). | | 217 |
Trustees and Officers (Unaudited) (continued)
| | | | | | | | |
Name, Birthdate and Address | | Position(s) Held with the Funds | | Year First Elected or Appointed (3) | | Principal Occupation(s) Including other Directorships During Past 5 Years | | Number of Portfolios in Fund Complex Overseen by Officer |
Jeffery M. Wilson 3/13/56 333 West Wacker Drive Chicago, IL 60606 | | Vice President | | 2011 | | Senior Vice President of Nuveen Securities, LLC (since 2011); formerly, Senior Vice President of FAF Advisors, Inc. (2000-2010). | | 100 |
| (1) | Trustees serve an indefinite term until his/her successor is elected or appointed. The year first elected or appointed represents the year in which the trustee was first elected or appointed to any fund in the Nuveen Fund Complex. |
| (2) | Mr. Amboian is an interested trustee because of his position with Nuveen Investments, Inc. and certain of its subsidiaries, which are affiliates of the Nuveen Funds. |
| (3) | Officers serve one year terms through August of each year. The year first elected or appointed represents the year in which the officer was first elected or appointed to any fund in the Nuveen Fund Complex. |
Annual Investment Management Agreement Approval Process
(Unaudited)
The Board of Trustees (the “Board,” and each Trustee, a “Board Member”) of the Funds, including the Board Members who are not parties to the Funds’ advisory or sub-advisory agreements or “interested persons” of any such parties (the “Independent Board Members”), is responsible for approving advisory arrangements for the Funds. At a meeting held on April 18-19, 2012 (the “Meeting”), the Board Members, including the Independent Board Members, considered and approved the investment management agreements (each, an “Investment Management Agreement”) between each Fund and Nuveen Fund Advisors, Inc. (the “Advisor”) and the investment sub-advisory agreements (each, a “Sub-Advisory Agreement”) between the Advisor and Nuveen Asset Management, LLC (the “Sub-Adviser”), on behalf of each Fund. The Sub-Adviser and the Advisor are each hereafter a “Fund Adviser.” The Investment Management Agreements and the Sub-Advisory Agreements are each hereafter an “Advisory Agreement.”
To assist the Board in its evaluation of an Advisory Agreement with a Fund Adviser at the Meeting, the Independent Board Members had received, in adequate time in advance of the Meeting or at prior meetings, materials which outlined, among other things:
| | • | | the nature, extent and quality of services expected to be provided by the Fund Adviser; |
| | • | | the organization of the Fund Adviser, including the responsibilities of various departments and key personnel; |
| | • | | the expertise and background of the Fund Adviser with respect to the respective Fund’s investment strategy; |
| | • | | certain performance-related information (as described below); |
| | • | | the profitability of Nuveen Investments, Inc. (“Nuveen”) (which incorporated Nuveen’s wholly-owned affiliated sub-advisers); |
| | • | | the proposed management fees of the Fund Adviser, including comparisons of such fees with the management fees of comparable funds; |
| | • | | the expected expenses of the respective Fund, including comparisons of the Fund’s expected expense ratio with the expense ratios of comparable funds; and |
| | • | | the soft dollar practices of the Fund Adviser, if any. |
At the Meeting, the Advisor made a presentation to and responded to questions from the Board of each Fund. During the Meeting, the Independent Board Members also met privately with their legal counsel to review the Board’s duties under the Investment Company Act of 1940 (the “1940 Act”), the general principles of state law in reviewing and approving advisory contracts, the standards used by courts in determining whether investment company boards of directors have fulfilled their duties, factors to be considered in voting on advisory contracts and an adviser’s fiduciary duty with respect to advisory agreements and compensation. It is with this background that the Independent Board Members considered the Advisory Agreements. As outlined in more detail below, the Independent Board Members considered all factors they believed relevant with respect to the Funds, including the following: (a) the nature, extent and quality of the services to be provided by the Fund Advisers; (b) investment performance, as described below; (c) the advisory fees and costs of the services to be provided to the Funds and the profitability of Nuveen and its affiliates; (d) the extent of any anticipated economies of scale; and (e) any benefits expected to be derived by the Fund Advisers from their relationships with the Funds.
A. Nature, Extent and Quality of Services
The Independent Board Members considered the nature, extent and quality of the respective Fund Adviser’s services, including advisory services and administrative services. As the Advisor and the Sub-Adviser already serve as adviser and sub-adviser, respectively, to other Nuveen funds overseen by the Board Members, the Board has a good understanding of each such Fund Adviser’s organization, operations and personnel. As the Independent Board Members meet regularly throughout the year to oversee the Nuveen funds, including funds currently advised by the Fund Advisers, the Independent Board Members have relied upon their knowledge from their meetings and any other interactions throughout the year of the respective Fund Adviser and its services in evaluating the Advisory Agreements.
At the Meeting and at prior meetings, the Independent Board Members reviewed materials outlining, among other things, the respective Fund Adviser’s organization and business; the types of services that such Fund Adviser or its affiliates provide to the Nuveen funds and are expected to provide to the Funds; and the experience of the respective Fund Adviser with applicable investment strategies. Further, the Independent Board Members have evaluated the background and experience of the Fund Adviser’s investment personnel.
In addition to advisory services, the Independent Board Members considered the quality and extent of administrative or other non-advisory services to be provided. In this regard, the Advisor is expected to provide the Funds with such administrative and other services (exclusive of, and in addition to, any such services provided by others for the Funds) and officers and other personnel as are necessary for the operations of the Funds. In addition to investment management services, the Advisor and its affiliates will provide the Funds with a wide range of services, including, among other things, product management, investment services (such as oversight of investment policies and procedures, risk management, and pricing), fund administration, oversight of service providers, shareholder services, administration of Board relations, regulatory and portfolio compliance and legal support. The Independent Board Members also recognized that the Advisor would oversee the Sub-Adviser.
Annual Investment Management Agreement Approval Process
(Unaudited) (continued)
In evaluating the services of the Sub-Adviser, the Independent Board Members noted that the Sub-Adviser was expected to supply portfolio investment management services to the Funds. In addition, the Board Members recognized the Sub-Adviser’s experience, philosophy, process and performance.
Based on their review, the Independent Board Members found that, overall, the nature, extent and quality of services expected to be provided to the Funds under each Advisory Agreement were satisfactory.
B. Investment Performance
Each Fund was new and therefore did not have its own performance history. However, the Independent Board Members are familiar with the performance records of other Nuveen funds advised by the Adviser and sub-advised by the Sub-Adviser, including other asset allocation funds in the Nuveen fund complex that have various long-term strategic asset mixes, and the Nuveen Tactical Market Opportunities Fund (the “Nuveen TMO Fund”), which is designed to generate returns through tactical asset allocation positions. Moreover, the Independent Board Members recognized that the portfolio management team that is expected to manage the Funds has managed portfolios similar to those anticipated for the Funds (“Intelligent Risk Portfolios”) as separately managed account strategies since June 2009. In this regard, the Independent Board Members were provided with performance information for the Intelligent Risk Portfolios, including, among other things, return information for the one-year and since inception periods ending February 29, 2012 and return information for the 2010 and 2011 calendar years.
C. Fees, Expenses and Profitability
1. Fees and Expenses
In evaluating the management fees and expenses that each Fund was expected to bear, the Independent Board Members considered, among other things, the Fund’s proposed management fee structure, the rationale for its proposed fee levels, and its expected expense ratio in absolute terms as well as compared with the fees and expense ratios of comparable funds. In this regard, the Independent Board Members reviewed, among other things, comparative data pertaining to the management fees of various other funds comprising the relevant asset allocation category as well as the “risk parity” investment category, a custom peer group comprised of funds with risk allocation investment strategies.
In addition, the Independent Board Members considered the fund-level breakpoint schedule and the complex-wide breakpoint schedule (described in further detail below) and any applicable fee waivers and expense reimbursements expected to be provided. Based on their review of the fee and expense information provided, the Independent Board Members determined that each Fund’s management fees were reasonable in light of the nature, extent and quality of services to be provided to the respective Fund.
2. Comparisons with the Fees of Other Clients
Due to their experience with other Nuveen funds, the Board Members were familiar with the fees the Advisor assesses to other clients. Such other clients include separately managed accounts (both retail and institutional accounts), foreign investment funds offered by Nuveen and funds that are not offered by Nuveen but are sub-advised by one of Nuveen’s investment management teams. In evaluating the comparisons of fees, the Independent Board Members have noted, at the Meeting or at prior meetings, that the fee rates charged to a fund (such as the Funds) and charged to other clients vary, among other things, because of the different services involved and the additional regulatory and compliance requirements associated with registered investment companies, such as the Funds. Accordingly, the Independent Board Members have considered the differences in the product types, including, but not limited to, the services to be provided, the structure and operations, product distribution and costs thereof, portfolio investment policies, investor profiles, account sizes and regulatory requirements. The Independent Board Members have noted, in particular, that the range of services as described above to be provided to a fund (such as the Funds) is much more extensive than that provided to separately managed accounts. Given the inherent differences in the products, particularly the extensive services to be provided to the Funds, the Independent Board Members believe such facts justify the different levels of fees. In addition, the Independent Board Members recognized that the proposed annual fund-level fee for each Fund follows the same schedule as the Nuveen TMO Fund.
In considering the advisory fees of the Sub-Adviser, the Independent Board Members are familiar with the pricing schedule the Sub-Adviser charges for similar investment management services for other clients (such as institutional separate accounts, various separately managed accounts and other Nuveen funds).
3. Profitability of Fund Advisers
In conjunction with its review of fees at prior meetings, the Independent Board Members have considered the profitability of Nuveen for its advisory activities (which incorporated Nuveen’s wholly-owned affiliated sub-advisers) and its financial condition. At the Meeting or prior meetings, the Independent Board Members reviewed the revenues and expenses of Nuveen’s advisory activities, the allocation methodology used in preparing the profitability data and an analysis of the key drivers behind the changes in revenues and expenses that impacted profitability. They also reviewed certain financial information dated March 21, 2012 and Nuveen’s 2011 consolidated financial statements. The Independent Board Members have also considered, at the Meeting or at prior meetings, Nuveen’s revenues for advisory activities, expenses, and profit margin compared to that of various unaffiliated management firms with similar amounts of assets under management and relatively comparable asset composition prepared by Nuveen.
In reviewing profitability, the Independent Board Members have recognized the subjective nature of determining profitability, which may be affected by numerous factors, including the allocation of expenses. Further, the Independent Board Members have recognized the difficulties in making comparisons as the profitability of other advisers generally is not publicly available and the profitability information that is available for certain advisers or management firms may not be representative of the industry and may be affected by, among other things, the adviser’s particular business mix, capital costs, types of funds managed and expense allocations. Notwithstanding the foregoing, the Independent Board Members reviewed Nuveen’s methodology and assumptions for allocating expenses across product lines to determine profitability. In reviewing profitability, the Independent Board Members recognized Nuveen’s investment in its fund business. Based on their review, the Independent Board Members concluded that Nuveen’s level of profitability for its advisory activities was reasonable in light of the services to be provided.
In evaluating the reasonableness of the compensation, the Independent Board Members also considered any other amounts expected to be paid to a Fund Adviser as well as any indirect benefits (such as soft dollar arrangements, if any) the respective Fund Adviser and its affiliates are expected to receive that are directly attributable to their management of the Funds, if any. See Section E below for additional information on indirect benefits a Fund Adviser may receive as a result of its relationship with the respective Fund. Based on their review of the overall fee arrangements of each Fund, the Independent Board Members determined that the advisory fees and expected expenses of the respective Fund were reasonable.
D. Economies of Scale and Whether Fee Levels Reflect These Economies of Scale
With respect to economies of scale, the Independent Board Members have recognized the potential benefits resulting from the costs of a fund being spread over a larger asset base, although economies of scale are difficult to measure and predict with precision, particularly on a fund-by-fund basis. The Independent Board Members therefore considered whether the Funds could be expected to benefit from any economies of scale. One method to help ensure that shareholders share in these benefits is to include breakpoints in the advisory fee schedule. Generally, management fees for funds in the Nuveen complex are comprised of a fund-level component and a complex-level component. Accordingly, the Independent Board Members received and reviewed the schedule of proposed advisory fees for each Fund, including fund-level breakpoints thereto.
In addition to fund-level advisory fee breakpoints, the Board also considered the Funds’ complex-wide fee arrangement. Pursuant to the complex-wide fee arrangement, the fees of the funds in the Nuveen complex, including the Funds, are generally reduced as the assets in the fund complex reach certain levels. In evaluating the complex-wide fee arrangement, the Independent Board Members have considered that the complex-wide fee arrangement seeks to provide the benefits of economies of scale to fund shareholders when total fund complex assets increase, even if assets of a particular fund are unchanged or have decreased. The approach reflects the notion that some of Nuveen’s costs are attributable to services provided to all its funds in the complex and therefore all funds benefit if these costs are spread over a larger asset base. Based on their review, the Independent Board Members concluded that the breakpoint schedules and complex-wide fee arrangement were acceptable and reflect economies of scale to be shared with each Fund’s respective shareholders when assets under management increase.
E. Indirect Benefits
In evaluating fees, the Independent Board Members also considered information regarding potential “fall out” or ancillary benefits that a Fund Adviser or its affiliates may receive as a result of its relationship with the respective Fund. In this regard, the Independent Board Members considered, among other things, any sales charges, distribution fees and shareholder services fees expected to be received and retained by such Fund’s principal underwriter, an affiliate of the Advisor, including fees to be received pursuant to any 12b-1 plan.
In addition to the above, the Independent Board Members considered whether the Fund Advisers will receive any benefits from soft dollar arrangements whereby a portion of the commissions paid by the respective Fund for brokerage may be used to acquire research that may be useful to a Fund Adviser in managing the assets of the Fund and other clients. The Independent Board Members recognized that each Fund Adviser has authority to pay a higher commission in return for brokerage and research services if it determines in good faith that the commission paid is reasonable in relation to the value of the brokerage and research services provided.
Based on their review, the Independent Board Members concluded that any indirect benefits received by a Fund Adviser as a result of its relationship with the Funds were reasonable and within acceptable parameters.
F. Approval
The Independent Board Members did not identify any single factor discussed previously as all-important or controlling. The Board Members, including a majority of the Independent Board Members, concluded that the terms of the Investment Management Agreements and Sub-Advisory Agreements were fair and reasonable, that the respective Fund Adviser’s fees are reasonable in light of the services to be provided to each Fund and that the Investment Management Agreements and Sub-Advisory Agreements should be and were approved on behalf of the Funds.
Notes
Notes
Glossary of Terms Used in this Report
Average Annual Total Return: This is a commonly used method to express an investment’s performance over a particular, usually multi-year time period. It expresses the return that would have been necessary each year to equal the investment’s actual cumulative performance (including change in NAV or offer price and reinvested dividends and capital gains distributions, if any) over the time period being considered.
Lipper Mixed-Asset Target Allocation Conservative Funds Classification Average: Represents the average annualized total return for all reporting funds in the Lipper Mixed-Asset Target Allocation Conservative Funds Classification Average. Lipper returns account for the effects of management fees and assume reinvestment of distributions, but do not reflect any applicable sales charges or management fees.
Lipper Mixed-Asset Target Allocation Growth Funds Classification Average: Represents the average annualized total return for all reporting funds in the Lipper Mixed-Asset Target Allocation Growth Funds Classification Average. Lipper returns account for the effects of management fees and assume reinvestment of distributions, but do not reflect any applicable sales charges.
Lipper Mixed-Asset Target Allocation Moderate Funds Classification Average: Represents the average annualized total return for all reporting funds in the Lipper Mixed-Asset Target Allocation Moderate Funds Classification Average. Lipper returns account for the effects of management fees and assume reinvestment of distributions, but do not reflect any applicable sales charges.
Morningstar Moderately Aggressive Target Risk Index: An index that represents a portfolio of global equities, bonds and traditional inflation hedges such as commodities and TIPS. This portfolio is held in a static allocation appropriate for U.S. investors who seek a slightly above-average exposure to equity market risk and returns.
Morningstar Moderately Conservative Target Risk Index: An index that represents a portfolio of global equities, bonds and traditional inflation hedges such as commodities and TIPS. This portfolio is held in a static allocation appropriate for U.S. investors who seek a slightly below-average exposure to equity market risk and returns.
Morningstar Moderate Target Risk Index: An index that represents a portfolio of global equities, bonds, and traditional inflation hedges, such as commodities and TIPS. This portfolio is held in a static allocation of 60% equities and 40% fixed income, which is appropriate for U.S. investors who seek average exposure to equity market risk and returns.
Net Asset Value (NAV): The net market value of all securities held in a portfolio.
Net Asset Value (NAV) Per Share: The market value of one share of a mutual fund or closed-end fund. For a Fund, the NAV is calculated daily by taking the Fund’s total assets (securities, cash, and accrued earnings), subtracting the Fund’s liabilities, and dividing by the number of shares outstanding.
Additional Fund Information
Fund Manager
Nuveen Fund Advisors, Inc.
333 West Wacker Drive
Chicago, IL 60606
Sub-Adviser
Nuveen Asset Management, LLC
333 West Wacker Drive
Chicago, IL 60606
Legal Counsel
Chapman and Cutler LLP
Chicago, IL
Independent Registered Public Accounting Firm
PricewaterhouseCoopers LLP
Chicago, IL
Custodian
U.S. Bank National Association
St. Paul, MN
Transfer Agent and Shareholder Services
Boston Financial
Data Services, Inc.
Nuveen Investor Services
P.O. Box 8530
Boston, MA 02266-8530
(800)257-8787
Quarterly Portfolio of Investments and Proxy Voting Information: You may obtain (i) each Fund’s quarterly portfolio of investments, (ii) information regarding how the Funds voted proxies relating to portfolio securities held during the most recent twelve-month period ended June 30, and (iii) a description of the policies and procedures that the Funds used to determine how to vote proxies relating to portfolio securities without charge, upon request, by calling Nuveen Investments at (800) 257-8787 or on Nuveen’s website at www.nuveen.com.
You may also obtain this and other Fund information directly from the Securities and Exchange Commission (SEC). The SEC may charge a copying fee for this information. Visit the SEC on-line at http://www.sec.gov or in person at the SEC’s Public Reference Room in Washington, D.C. Call the SEC at (202) 942-8090 for room hours and operation. You may also request Fund information by sending an e-mail request to publicinfo@sec.gov or by writing to the SEC’s Public Reference Section at 100 F Street NE, Washington, D.C. 20549.
The Financial Industry Regulatory Authority (FINRA) provides a Public Disclosure Program which supplies certain information regarding the disciplinary history of FINRA members and their associated persons in response to either telephone inquiries at (800) 289-9999 or written inquiries at www.finra.org. FINRA also provides an investor brochure that includes information describing the Public Disclosure Program.
Nuveen Investments:
Serving Investors for Generations
Since 1898, financial advisors and their clients have relied on Nuveen Investments to provide dependable investment solutions through continued adherence to proven, long-term investing principles. Today, we offer a range of high quality equity and fixed-income solutions designed to be integral components of a well-diversified core portfolio.
Focused on meeting investor needs.
Nuveen Investments provides high-quality investment services designed to help secure the long-term goals of institutional and individual investors as well as the consultants and financial advisors who serve them. Nuveen Investments markets a wide range of specialized investment solutions which provide investors access to capabilities of its high-quality boutique investment affiliates-Nuveen Asset Management, Symphony Asset Management, NWQ Investment Management Company, Santa Barbara Asset Management, Tradewinds Global Investors, Winslow Capital Management, and Gresham Investment Management. In total, Nuveen Investments managed $212 billion as of June 30, 2012.
Find out how we can help you.
To learn more about how the products and services of Nuveen Investments may be able to help you meet your financial goals, talk to your financial advisor, or call us at (800) 257-8787. Please read the information provided carefully before you invest. Investors should consider the investment objective and policies, risk considerations, charges and expenses of any investment carefully. Where applicable, be sure to obtain a prospectus, which contains this and other relevant information. To obtain a prospectus, please contact your securities representative or Nuveen Investments, 333 W. Wacker Dr., Chicago, IL 60606. Please read the prospectus carefully before you invest or send money.
Learn more about Nuveen Funds at: www.nuveen.com/mf
| | |
Distributed by Nuveen Securities, LLC 333 West Wacker Drive Chicago, IL 60606 www.nuveen.com | | |
MAN-INTELR-0812P
ITEM 2. CODE OF ETHICS.
As of the end of the period covered by this report, the registrant has adopted a code of ethics that applies to the registrant’s principal executive officer, principal financial officer, principal accounting officer or controller, or persons performing similar functions. There were no amendments to or waivers from the code during the period covered by this report. The registrant has posted the code of ethics on its website at www.nuveen.com/mf. (To view the code, click on the Shareholder Resources drop down menu box, click on Fund Governance and then click on Code of Conduct.)
ITEM 3. AUDIT COMMITTEE FINANCIAL EXPERT.
The registrant’s Board of Trustees determined that the registrant has at least one “audit committee financial expert” (as defined in Item 3 of Form N-CSR) serving on its Audit Committee. The registrant’s audit committee financial expert is Carole E. Stone, who is “independent” for purposes of Item 3 of Form N-CSR.
Ms. Stone served for five years as Director of the New York State Division of the Budget. As part of her role as Director, Ms. Stone was actively involved in overseeing the development of the State’s operating, local assistance and capital budgets, its financial plan and related documents; overseeing the development of the State’s bond-related disclosure documents and certifying that they fairly presented the State’s financial position; reviewing audits of various State and local agencies and programs; and coordinating the State’s system of internal audit and control. Prior to serving as Director, Ms. Stone worked as a budget analyst/examiner with increasing levels of responsibility over a 30 year period, including approximately five years as Deputy Budget Director. Ms. Stone has also served as Chair of the New York State Racing Association Oversight Board, as Chair of the Public Authorities Control Board, as a Commissioner on the New York State Commission on Public Authority Reform and as a member of the Boards of Directors of several New York State public authorities. These positions have involved overseeing operations and finances of certain entities and assessing the adequacy of project/entity financing and financial reporting. Currently, Ms. Stone is on the Board of Directors of CBOE Holdings, Inc., of the Chicago Board Options Exchange, and of C2 Options Exchange. Ms. Stone’s position on the boards of these entities and as a member of both CBOE Holdings’ Audit Committee and its Finance Committee has involved, among other things, the oversight of audits, audit plans and preparation of financial statements.
ITEM 4. PRINCIPAL ACCOUNTANT FEES AND SERVICES.
The following tables show the amount of fees that PricewaterhouseCoopers LLP, the Trust’s auditor, billed to the Trust during the Trust’s last two full fiscal years. The Audit Committee approved in advance all audit services and non-audit services that PricewaterhouseCoopers LLP provided to the Trust, except for those non-audit services that were subject to the pre-approval exception under Rule 2-01 of Regulation S-X (the “pre-approval exception”). The pre-approval exception for services provided directly to the Trust waives the pre-approval requirement for services other than audit, review or attest services if: (A) the aggregate amount of all such services provided constitutes no more than 5% of the total amount of revenues paid by the Trust during the fiscal year in which the services are provided; (B) the Trust did not recognize the services as non-audit services at the time of the engagement; and (C) the services are promptly brought to the Audit Committee’s attention, and the Committee (or its delegate) approves the services before the audit is completed.
The Audit Committee has delegated certain pre-approval responsibilities to its Chairman (or, in his absence, any other member of the Audit Committee).
SERVICES THAT THE TRUST’S AUDITOR BILLED TO THE TRUST
| | | | | | | | | | | | | | | | |
Fiscal Year Ended August 31, 2012 | | Audit Fees Billed
to Funds 1 | | | Audit-Related Fees
Billed to Funds 2 | | | Tax Fees
Billed to Funds 3 | | | All Other Fees
Billed to Funds 4 | |
Name of Series | | | | | | | | | | | | | | | | |
Intelligent Risk Growth Allocation Fund 5 | | | 10,475 | | | | 0 | | | | 0 | | | | 0 | |
Intelligent Risk Moderate Allocation Fund 5 | | | 10,475 | | | | 0 | | | | 0 | | | | 0 | |
Intelligent Risk Conservative Allocation Fund 5 | | | 10,475 | | | | 0 | | | | 0 | | | | 0 | |
| | | | | | | | | | | | | | | | |
Total | | $ | 31,425 | | | $ | 0 | | | $ | 0 | | | $ | 0 | |
| 1 | | “Audit Fees” are the aggregate fees billed for professional services for the audit of the Fund’s annual financial statements and services provided in connection with statutory and regulatory filings or engagements. |
| 2 | | “Audit Related Fees” are the aggregate fees billed for assurance and related services reasonably related to the performance of the audit or review of financial statements and are not reported under “Audit Fees”. |
| 3 | | “Tax Fees” are the aggregate fees billed for professional services for tax advice, tax compliance, and tax planning. |
| 4 | | “All Other Fees” are the aggregate fees billed for products and services other than “Audit Fees”, “Audit Related Fees”, and “Tax Fees”. |
| 5 | | The Fund commenced operations on May 4, 2012. |
| | | | | | | | | | | | | | | | |
| | | Percentage Approved Pursuant to Pre-approval Exception | |
| | | Audit Fees Billed
to Funds | | | Audit-Related Fees
Billed to Funds | | | Tax Fees
Billed to Funds | | | All Other Fees
Billed to Funds | |
Name of Series | | | | | | | | | | | | | | | | |
Intelligent Risk Growth Allocation Fund | | | 0 | % | | | 0 | % | | | 0 | % | | | 0 | % |
Intelligent Risk Moderate Allocation Fund | | | 0 | % | | | 0 | % | | | 0 | % | | | 0 | % |
Intelligent Risk Conservative Allocation Fund | | | 0 | % | | | 0 | % | | | 0 | % | | | 0 | % |
| | | | | | | | | | | | | | | | |
Fiscal Year Ended August 31, 2011 | | Audit Fees Billed
to Funds 1 | | | Audit-Related Fees
Billed to Funds 2 | | | Tax Fees
Billed to Funds 3 | | | All Other Fees
Billed to Funds 4 | |
Name of Series | | | | | | | | | | | | | | | | |
Intelligent Risk Growth Allocation Fund | | | N/A | | | | N/A | | | | N/A | | | | N/A | |
Intelligent Risk Moderate Allocation Fund | | | N/A | | | | N/A | | | | N/A | | | | N/A | |
Intelligent Risk Conservative Allocation Fund | | | N/A | | | | N/A | | | | N/A | | | | N/A | |
| | | | | | | | | | | | | | | | |
Total | | | N/A | | | | N/A | | | | N/A | | | | N/A | |
| 1 | | “Audit Fees” are the aggregate fees billed for professional services for the audit of the Fund’s annual financial statements and services provided in connection with statutory and regulatory filings or engagements. |
| 2 | | “Audit Related Fees” are the aggregate fees billed for assurance and related services reasonably related to the performance of the audit or review of financial statements and are not reported under “Audit Fees”. |
| 3 | | “Tax Fees” are the aggregate fees billed for professional services for tax advice, tax compliance, and tax planning. |
| 4 | | “All Other Fees” are the aggregate fees billed for products and services other than “Audit Fees”, “Audit Related Fees”, and “Tax Fees”. |
| | | | | | | | | | | | | | | | |
| | | Percentage Approved Pursuant to Pre-approval Exception | |
| | | Audit Fees Billed
to Funds | | | Audit-Related Fees
Billed to Funds | | | Tax Fees
Billed to Funds | | | All Other Fees
Billed to Funds | |
Name of Series | | | | | | | | | | | | | | | | |
Intelligent Risk Growth Allocation Fund | | | N/A | | | | N/A | | | | N/A | | | | N/A | |
Intelligent Risk Moderate Allocation Fund | | | N/A | | | | N/A | | | | N/A | | | | N/A | |
Intelligent Risk Conservative Allocation Fund | | | N/A | | | | N/A | | | | N/A | | | | N/A | |
| | | | | | | | | | | | |
Fiscal Year Ended August 31, 2012 | | Audit-Related Fees
Billed to Adviser and
Affiliated Fund
Service Providers | | | Tax Fees Billed to
Adviser and
Affiliated Fund
Service Providers | | | All Other Fees
Billed to Adviser
and Affiliated Fund
Service Providers | |
Nuveen Investment Trust | | $ | 0 | | | $ | 0 | | | $ | 0 | |
| |
| | | Percentage Approved Pursuant to Pre-approval Exception | |
| | | Audit-Related Fees
Billed to Adviser and
Affiliated Fund
Service Providers | | | Tax Fees Billed to
Adviser and
Affiliated Fund
Service Providers | | | All Other Fees
Billed to Adviser
and Affiliated Fund
Service Providers | |
| | | 0 | % | | | 0 | % | | | 0 | % |
| | | |
Fiscal Year Ended August 31, 2011 | | Audit-Related Fees
Billed to Adviser and
Affiliated Fund
Service Providers | | | Tax Fees Billed to
Adviser and
Affiliated Fund
Service Providers | | | All Other Fees
Billed to Adviser
and Affiliated Fund
Service Providers | |
Nuveen Investment Trust | | | N/A | | | | N/A | | | | N/A | |
| |
| | | Percentage Approved Pursuant to Pre-approval Exception | |
| | | Audit-Related Fees
Billed to Adviser and
Affiliated Fund
Service Providers | | | Tax Fees Billed to
Adviser and
Affiliated Fund
Service Providers | | | All Other Fees
Billed to Adviser
and Affiliated Fund
Service Providers | |
| | | N/A | | | | N/A | | | | N/A | |
| | | | | | | | | | | | | | | | |
Fiscal Year Ended August 31, 2012 | | Total Non-Audit Fees
Billed to Trust | | | Total Non-Audit Fees
billed to Adviser and
Affiliated Fund Service
Providers (engagements
related directly to the
operations and financial
reporting of the Trust) | | | Total Non-Audit Fees
billed to Adviser and
Affiliated Fund Service
Providers (all other
engagements) | | | Total | |
Name of Series | | | | | | | | | | | | | | | | |
Intelligent Risk Growth Allocation Fund 1 | | | 0 | | | | 0 | | | | 0 | | | | 0 | |
Intelligent Risk Moderate Allocation Fund 1 | | | 0 | | | | 0 | | | | 0 | | | | 0 | |
Intelligent Risk Conservative Allocation Fund 1 | | | 0 | | | | 0 | | | | 0 | | | | 0 | |
| | | | | | | | | | | | | | | | |
Total | | $ | 0 | | | $ | 0 | | | $ | 0 | | | $ | 0 | |
“Non-Audit Fees Billed to Trust” represent “Tax Fees” and “All Other Fees” billed to each Fund in their respective amounts from the previous table.
| 1 | | The Funds commenced operations on May 4, 2012. |
| | | | | | | | | | | | | | | | |
Fiscal Year Ended August 31, 2011 | | Total Non-Audit Fees
Billed to Trust | | | Total Non-Audit Fees
billed to Adviser and
Affiliated Fund Service
Providers (engagements
related directly to the
operations and financial
reporting of the Trust) | | | Total Non-Audit Fees
billed to Adviser and
Affiliated Fund Service
Providers (all other
engagements) | | | Total | |
Name of Series | | | | | | | | | | | | | | | | |
Intelligent Risk Growth Allocation Fund | | | N/A | | | | N/A | | | | N/A | | | | N/A | |
Intelligent Risk Moderate Allocation Fund | | | N/A | | | | N/A | | | | N/A | | | | N/A | |
Intelligent Risk Conservative Allocation Fund | | | N/A | | | | N/A | | | | N/A | | | | N/A | |
| | | | | | | | | | | | | | | | |
Total | | | N/A | | | | N/A | | | | N/A | | | | N/A | |
“Non-Audit Fees Billed to Trust” represent “Tax Fees” and “All Other Fees” billed to each Fund in their respective amounts from the previous table.
Audit Committee Pre-Approval Policies and Procedures. Generally, the Audit Committee must approve (i) all non-audit services to be performed for the Trust by the Trust’s independent accountants and (ii) all audit and non-audit services to be performed by the Trust’s independent accountants for the Affiliated Fund Service Providers with respect to the operations and financial reporting of the Trust. Regarding tax and research projects conducted by the independent accountants for the Trust and Affiliated Fund Service Providers (with respect to operations and financial reports of the Trust), such engagements will be (i) pre-approved by the Audit Committee if they are expected to be for amounts greater than $10,000; (ii) reported to the Audit Committee Chairman for his verbal approval prior to engagement if they are expected to be for amounts under $10,000 but greater than $5,000; and (iii) reported to the Audit Committee at the next Audit Committee meeting if they are expected to be for an amount under $5,000.
ITEM 5. AUDIT COMMITTEE OF LISTED REGISTRANTS.
Not applicable to this registrant.
ITEM 6. SCHEDULE OF INVESTMENTS.
| a) | | See Portfolio of Investments in Item 1. |
ITEM 7. DISCLOSURE OF PROXY VOTING POLICIES AND PROCEDURES FOR CLOSED-END
MANAGEMENT INVESTMENT COMPANIES.
Not applicable to this registrant.
ITEM 8. PORTFOLIO MANAGERS OF CLOSED-END MANAGEMENT INVESTMENT COMPANIES.
Not applicable to this registrant.
ITEM 9. PURCHASES OF EQUITY SECURITIES BY CLOSED-END MANAGEMENT INVESTMENT COMPANY AND AFFILIATED PURCHASERS.
Not applicable to this registrant.
ITEM 10. SUBMISSION OF MATTERS TO A VOTE OF SECURITY HOLDERS.
There have been no material changes to the procedures by which shareholders may recommend nominees to the registrant’s Board of Trustees implemented after the registrant last provided disclosure in response to this Item.
ITEM 11. CONTROLS AND PROCEDURES.
| | (a) | | The registrant’s principal executive and principal financial officers, or persons performing similar functions, have concluded that the registrant’s disclosure controls and procedures (as defined in Rule 30a-3(c) under the Investment Company Act of 1940, as amended (the “1940 Act”) (17 CFR 270.30a-3(c))) are effective, as of a date within 90 days of the filing date of this report that includes the disclosure required by this paragraph, based on their evaluation of the controls and procedures required by Rule 30a-3(b) under the 1940 Act (17 CFR 270.30a-3(b)) and Rules 13a-15(b) or 15d-15(b) under the Securities Exchange Act of 1934, as amended (the “Exchange Act”) (17 CFR 240.13a-15(b) or 240.15d-15(b)). |
| | (b) | | There were no changes in the registrant’s internal control over financial reporting (as defined in Rule 30a-3(d) under the 1940 Act (17 CFR 270.30a-3(d)) that occurred during the second fiscal quarter of the period covered by this report that has materially affected, or is reasonably likely to materially affect, the registrant’s internal control over financial reporting. |
ITEM 12. EXHIBITS.
File the exhibits listed below as part of this Form.
| | |
| (a)(1) | | Any code of ethics, or amendment thereto, that is the subject of the disclosure required by Item 2, to the extent that the registrant intends to satisfy the Item 2 requirements through filing of an exhibit: Not applicable because the code is posted on registrant’s website at www.nuveen.com/mf and there were no amendments during the period covered by this report. (To view the code, click on the Shareholder Resources drop down menu box, click on Fund Governance and then Code of Conduct.) |
| |
| (a)(2) | | A separate certification for each principal executive officer and principal financial officer of the registrant as required by Rule 30a-2(a) under the 1940 Act (17 CFR 270.30a-2(a)) in the exact form set forth below: See EX-99.CERT attached hereto. |
| |
| (a)(3) | | Any written solicitation to purchase securities under Rule 23c-1 under the 1940 Act (17 CFR 270.23c-1) sent or given during the period covered by the report by or on behalf of the registrant to 10 or more persons: Not applicable to this registrant. |
| |
| (b) | | If the report is filed under Section 13(a) or 15(d) of the Exchange Act, provide the certifications required by Rule 30a-2(b) under the 1940 Act (17 CFR 270.30a-2(b)), Rule 13a-14(b) or Rule 15d-14(b) under the Exchange Act (17 CFR 240.13a-14(b) or 240.15d-14(b)), and Section 1350 of Chapter 63 of Title 18 of the United States Code (18 U.S.C. 1350) as an Exhibit. A certification furnished pursuant to this paragraph will not be deemed “filed” for purposes of Section 18 of the Exchange Act (15 U.S.C. 78r), or otherwise subject to the liability of that section. Such certification will not be deemed to be incorporated by reference into any filing under the Securities Act of 1933 or the Exchange Act, except to the extent that the registration specifically incorporates it by reference: See EX-99.906 CERT attached hereto. |
SIGNATURES
Pursuant to the requirements of the Securities Exchange Act of 1934 and the Investment Company Act of 1940, the registrant has duly caused this report to be signed on its behalf by the undersigned, thereunto duly authorized.
(Registrant) Nuveen Investment Trust
| | |
| |
By (Signature and Title) | | /s/ Kevin J. McCarthy |
| | Kevin J. McCarthy |
| | Vice President and Secretary |
Date: November 8, 2012
Pursuant to the requirements of the Securities Exchange Act of 1934 and the Investment Company Act of 1940, this report has been signed below by the following persons on behalf of the registrant and in the capacities and on the dates indicated.
| | |
| |
By (Signature and Title) | | /s/ Gifford R. Zimmerman |
| | Gifford R. Zimmerman |
| | Chief Administrative Officer |
| | (principal executive officer) |
Date: November 8, 2012
| | |
| |
| By (Signature and Title) | | /s/ Stephen D. Foy |
| | Stephen D. Foy |
| | Vice President and Controller |
| | (principal financial officer) |
Date: November 8, 2012