UNITED STATES
SECURITIES AND EXCHANGE COMMISSION
Washington, D.C. 20549
FORM 10-Q
[ x ] QUARTERLY REPORT PURSUANT TO SECTION 13 OR 15(d) OF
THE SECURITIES EXCHANGE ACT OF 1934
For the quarterly period ended September 30, 2007
[ ] TRANSITION REPORT PURSUANT TO SECTION 13 OR 15(d) OF
THE SECURITIES EXCHANGE ACT OF 1934
For the transition period from _________ to _________
Commission file number: 000-32409
UNITED MORTGAGE TRUST
(Exact name of registrant as specified in its charter)
Maryland | 75-6493585 |
| (State or other jurisdiction of incorporation or organization) | (I.R.S. Employer Identification No.) |
1702 N. Collins Blvd, Suite 100
Richardson, Texas 75080
(Address of principal executive offices)(Zip Code)
(214) 237-9305
(Registrant’s telephone number, including area code)
Indicate by check mark whether the registrant (1) has filed all reports required to be filed by Section 13 or 15(d) of the Securities Exchange Act of 1934 during the preceding 12 months (or for such shorter period that the registrant was required to file such reports), and (2) has been subject to such filing requirements for the past 90 days. Yes X No ___
Indicate by check mark whether the registrant is a large accelerated filer, an accelerated filer, or a non-accelerated filer.
Large accelerated filer___ Accelerated filer____ Non-accelerated filer X__
Indicate by check mark whether the registrant is a shell company (as defined in Rule 12b-2 of the Exchange Act) Yes No X__
The number of shares outstanding of the Registrant’s shares of beneficial interest, par value $0.01 per share, as of the close of business on October 15, 2007 was 6,686,490.
UNITED MORTGAGE TRUST
INDEX
PART I - FINANCIAL INFORMATION
| | | Page |
ITEM 1. | Financial Statements | |
| | | |
| | Consolidated Balance Sheets as of September 30, 2007 (unaudited) and December 31, 2006 | 3 |
| | Consolidated Statements of Income for the three months and nine months ended September 30, 2007 and 2006 (unaudited) | 4 |
| | Consolidated Statements of Cash Flows for the nine months ended September 30, 2007 and 2006 (unaudited) | 5 |
| | Notes to Consolidated Financial Statements (unaudited) | 6 |
| | | |
ITEM 2. | Management’s Discussion and Analysis of Financial Condition and Results of Operations | 9 |
ITEM 3. | Quantitative and Qualitative Disclosures about Market Risk | 20 |
ITEM 4. | Controls and Procedures | 20 |
| | | |
PART II - OTHER INFORMATION |
| | | |
ITEM 1. | Legal Proceedings | 21 |
ITEM 1A. | Risk Factors | 21 |
ITEM 2. | Unregistered Sales of Equity Securities and Use of Proceeds | 21 |
ITEM 3. | Defaults Upon Senior Securities | 22 |
ITEM 4. | Submission of Matters to a Vote of Security Holders | 22 |
ITEM 5. | Other Information | 22 |
UNITED MORTGAGE TRUST
CONSOLIDATED BALANCE SHEETS
| | | September 30, 2007 | | | December 31, 2006 | |
| | | (unaudited) | | | (audited) | |
Assets | | | | | | |
| Cash and cash equivalents | | $ | 716,251 | | | $ | 3,661,724 | |
| Mortgage investments: | | | | | | | | |
| Investment in trust receivable | | | 5,330,846 | | | | 5,473,508 | |
| Interim loans, affiliates | | | 66,438,940 | | | | 64,883,388 | |
| Interim loans | | | 12,540,828 | | | | 17,825,519 | |
| Allowance for loan losses | | | (1,332,205 | ) | | | (1,011,975 | ) |
| Total mortgage investments | | | 82,978,409 | | | | 87,170,440 | |
| | | | | | | | | |
| Line of credit receivable, affiliate | | | 30,696,766 | | | | 33,056,189 | |
| Accrued interest receivable | | | 537,604 | | | | 390,315 | |
| Accrued interest receivable, affiliate | | | 4,401,727 | | | | 3,331,204 | |
| Receivable from affiliate | | | - | | | | 230,861 | |
| Recourse obligations, affiliates | | | 14,612,605 | | | | 11,975,234 | |
| Residential mortgages and contracts for deed foreclosed | | | 292,394 | | | | 359,517 | |
| Interim mortgages foreclosed | | | 401,805 | | | | 776,643 | |
| Equipment, less accumulated depreciation of $25,856 and $22,120, respectively | | | - | | | | 3,737 | |
| Other assets | | | 636,544 | | | | 757,382 | |
| Total assets | | $ | 135,274,105 | | | $ | 141,713,246 | |
| | | | | | | | | |
Liabilities and Shareholders' Equity | | | | | | | | |
| Liabilities: | | | | | | | | |
| Line of credit payable | | $ | 23,597,236 | | | $ | 27,976,642 | |
| Dividend payable | | | 835,813 | | | | 806,000 | |
| Accounts payable and accrued liabilities | | | 5,443 | | | | 4,718 | |
| Total liabilities | | | 24,438,492 | | | | 28,787,360 | |
| | | | | | | | | |
| Commitments and contingencies | | | - | | | | - | |
| | | | | | | | | |
| Shareholders' equity: | | | | | | | | |
| Shares of beneficial interest; $.01 par value; 100,000,000 shares authorized; 8,079,111 and 7,985,423 shares issued, respectively; and 6,721,937 and 6,917,443 outstanding, respectively | | | 80,791 | | | | 79,854 | |
| Additional paid-in capital | | | 142,656,509 | | | | 140,783,690 | |
| Advisor's reimbursement | | | 397,588 | | | | 397,588 | |
| | | | | | | | | |
| Cumulative distributions in excess of earnings | | | (5,862,312 | ) | | | (7,366,618 | ) |
| | | | | | | | | |
| | | | 137,272,576 | | | | 133,894,514 | |
| | | | | | | | | |
| Less treasury stock of 1,357,174 and 1,067,980 shares, respectively, at cost | | | (26,436,963 | ) | | | (20,968,628 | ) |
| | | | | | | | | |
| Total shareholders' equity | | | 110,835,613 | | | | 112,925,886 | |
| | | | | | | | | |
| Total liabilities and shareholders' equity | | $ | 135,274,105 | | | $ | 141,713,246 | |
| | | | | | | | | |
| | | | | | | | | |
| See accompanying notes to consolidated financial statements. | | | | | | | | |
UNITED MORTGAGE TRUST
CONSOLIDATED STATEMENTS OF INCOME
(unaudited)
| | | Three months ended September 30, | | | Nine months ended September 30, | |
| | | 2007 | | | 2006 | | | 2007 | | | 2006 | |
Revenues: | | | | | | | | | | | | |
| Interest income derived from affiliates | | $ | 3,710,739 | | | $ | 3,380,556 | | | $ | 11,053,889 | | | $ | 9,477,248 | |
| Interest income | | | 699,744 | | | | 1,053,695 | | | | 2,185,362 | | | | 3,162,011 | |
| | | | 4,410,483 | | | | 4,434,251 | | | | 13,239,251 | | | | 12,639,259 | |
Expenses: | | | | | | | | | | | | | | | | |
| Trust administration fee | | | 254,352 | | | | 214,714 | | | | 625,081 | | | | 641,916 | |
| Loan servicing fee | | | 1,313 | | | | 3,434 | | | | 7,365 | | | | 38,220 | |
| Merger expense | | | - | | | | 11,975 | | | | - | | | | 1,039,606 | |
| General and administrative | | | 203,979 | | | | 392,934 | | | | 694,576 | | | | 796,363 | |
| Provision for loan losses | | | 933,603 | | | | 507,136 | | | | 1,140,914 | | | | 1,783,769 | |
| Interest expense | | | 547,342 | | | | 486,909 | | | | 1,785,653 | | | | 1,040,388 | |
| | | | 1,940,589 | | | | 1,617,102 | | | | 4,253,589 | | | | 5,340,262 | |
| | | | | | | | | | | | | | | | | |
| Net income | | $ | 2,469,894 | | | $ | 2,817,149 | | | $ | 8,985,662 | | | $ | 7,298,997 | |
| | | | | | | | | | | | | | | | | |
| Net income per share of beneficial interest | | $ | 0.36 | | | $ | 0.40 | | | $ | 1.31 | | | $ | 1.04 | |
| | | | | | | | | | | | | | | | | |
| Weighted average shares outstanding | | | 6,770,599 | | | | 7,001,511 | | | | 6,849,920 | | | | 6,991,424 | |
| | | | | | | | | | | | | | | | | |
| Distributions per weighted share outstanding | | $ | 0.37 | | | $ | 0.35 | | | $ | 1.09 | | | $ | 1.06 | |
See accompanying notes to consolidated financial statements.
UNITED MORTGAGE TRUST
CONSOLIDATED STATEMENTS OF CASH FLOWS
(unaudited)
| | | For the Nine Months Ended | |
| | | September 30, | |
| | | 2007 | | | 2006 | |
Cash Flows from Operating Activities: | | | | | | |
| Net income | | $ | 8,985,662 | | | $ | 7,298,997 | |
| Adjustments to reconcile net income to net cash provided by operating activities: | | | | | | | | |
| Provision for loan losses | | | 1,140,914 | | | | 1,783,769 | |
| Depreciation | | | 3,737 | | | | 10,411 | |
| Net amortization of discount on mortgage investments | | | - | | | | 166,404 | |
| Changes in assets and liabilities: | | | | | | | | |
| Accrued interest receivable | | | (1,217,812 | ) | | | (1,393,911 | ) |
| Other assets | | | 120,839 | | | | 1,305,570 | |
| Accounts payable and accrued liabilities | | | 725 | | | | (128,001 | ) |
| Net cash provided by operating activities | | | 9,034,065 | | | | 9,043,239 | |
| | | | | | | | | |
Cash Flows from Investing Activities: | | | | | | | | |
| Investment in residential mortgages and contracts for deed | | | (573,904 | ) | | | (762,162 | ) |
| Principal receipts on residential mortgages and contracts for deed | | | 631,478 | | | | 1,491,000 | |
| Investment in interim mortgage notes | | | (45,642,201 | ) | | | (70,452,168 | ) |
| Principal receipts on interim mortgage notes | | | 45,794,655 | | | | 56,827,360 | |
| Proceeds from recourse obligations, affiliates | | | 645,678 | | | | 910,541 | |
| Line-of-credit receivable, affiliate, net | | | 2,359,423 | | | | (3,489,152 | ) |
| Receivable from affiliate | | | 230,861 | | | | 49,724 | |
| Net cash provided by (used in) investing activities | | | 3,445,990 | | | | (15,424,857 | ) |
| | | | | | | | | |
Cash Flows from Financing Activities: | | | | | | | | |
| Proceeds from issuance of shares of beneficial interest | | | 1,873,756 | | | | 2,015,767 | |
| Purchase of treasury stock | | | (5,468,337 | ) | | | (4,077,608 | ) |
| Net borrowings (payments) on line-of-credit, payable | | | (4,379,405 | ) | | | 11,140,462 | |
| Dividends | | | (7,451,542 | ) | | | (7,376,284 | ) |
| Net cash provided by (used in) financing activities | | | (15,425,528 | ) | | | 1,702,337 | |
| | | | | | | | | |
| Net decrease in cash and cash equivalents | | | (2,945,473 | ) | | | (4,679,281 | ) |
| Cash and cash equivalents at beginning of period | | | 3,661,724 | | | | 5,548,421 | |
| Cash and cash equivalents at end of period | | $ | 716,251 | | | $ | 869,140 | |
| | | | | | | | | |
Supplemental Disclosure of Cash Flow Information | | | | | | | | |
| Cash paid during the period for interest | | $ | 1,785,653 | | | $ | 1,040,388 | |
| | | | | | | | | |
Supplemental Disclosure of Non-cash Information | | | | | | | | |
| Transfer of loans into recourse obligations, affiliates | | $ | 3,283,049 | | | $ | 3,180,403 | |
| | | | | | | | | |
| See accompanying notes to consolidated financial statements. | | | | | | | | |
NOTES TO CONSOLIDATED FINANCIAL STATEMENTS
(unaudited)
United Mortgage Trust (the “Company”) is a Maryland real estate investment trust which qualifies as a real estate investment trust (a “REIT”) under federal income tax laws. The Company invests in: (i) first lien secured mortgage loans with initial terms of 12 months or less for the acquisition and renovation of single family homes, which we refer to as “interim loans”; (ii) first lien secured construction loans for the acquisition of lots and construction of single-family homes, which we refer to as “construction loans”; (iii) lines of credit and secured loans for the acquisition and development of single-family home lots, referred to as “land development loans”; (iv) lines of credit and loans secured by developed single-family lots, referred to as “finished lot loans”; (v) lines of credit and loans secured by completed model homes, referred to as “model home loans”; and, formerly we invested in (vi) first lien, fixed rate mortgages secured by single-family residential property, which we refer to as “residential mortgages”. Additionally, our portfolio includes loans to affiliates of our Advisor, which we refer to as “recourse loans,” all of which are referred to as the Company’s “Mortgage Investments.” Such loans are originated by others to the Company’s specifications or to specifications approved by the Company. Most, if not all, of such loans are not insured or guaranteed by a federally owned or guaranteed mortgage agency.
The Company has no employees. Effective August 1, 2006, the Company entered into a one-year advisory services agreement with UMTH General Services, L.P. (“UMTHGS”), an affiliate of the Company. Under the agreement, UMT pays a monthly trust administration fee for services relating to the Company’s daily operations, including payroll for its employees who are directly and indirectly involved in the day-to-day management of the Company. The advisory services agreement was extended on a month-to-month basis until December 31, 2007, while under review by the Trustees and UMTHGS.
Prior to August 1, 2006, UMT Advisors, Inc. (“UMTA”) performed similar functions and was paid a monthly trust administration fee.
These financial statements have been prepared in accordance with generally accepted accounting principles (“GAAP”) for interim financial information and with the instructions for Form 10-Q and Article 10 of Regulation S-X. Accordingly, they do not include all of the information and footnotes required by GAAP for complete financial statements. In the opinion of management, all adjustments (consisting of normal recurring adjustments) considered necessary for a fair presentation have been included. Operating results for the three and nine months ended September 30, 2007 are not necessarily indicative of the results that may be expected for the year ended December 31, 2007. For further information, refer to the consolidated financial statements and footnotes thereto included in our Annual Report on Form 10-K for the year ended December 31, 2006.
3. Line of Credit Payable
On November 8, 2004, with trustee approval, the Company entered into a three year loan agreement for a $15 million revolving credit facility with a commercial bank. The line of credit payable was collateralized by certain interim mortgages and construction loans. Interest on the outstanding balance accrues at the higher of the Prime Rate or the sum of the Federal Funds rate plus 1/2% per annum. On July 31, 2006 the Company executed the fourth modification of its credit facility to increase the borrowing base to $30,000,000. On July 1, 2007 the Company executed the fifth modification to its credit facility which, in addition to minor modifications, 1) added single family lots as eligible collateral, 2) increased the days past due for an eligible mortgage note from 20 to 60 days, 3) set a maximum aggregate loan limit to any one borrower at $2 million dollars and 4) modified the tangible net worth amount to $95 million dollars. Outstanding balances on the credit facility at September 30, 2007 and December 31, 2006 were $23,597,236 and $27,976,642, respectively. The interest rate at September 30, 2007 and 2006 was 8.75%. The Company is negotiating a new line of credit with its current lender and others.
4. Related Party Transactions
The Company relies on affiliates of its Advisor for the sourcing and origination of a majority of its Mortgage Investments.
a) Capital Reserve Group, Inc. (“CRG”) is a Texas corporation that is 50% owned by Todd Etter, an officer and principal shareholder of the former Advisor and shareholder and director of UMT Services, Inc. (“UMTSI”), the General Partner of UMTHGS. CRG was in the business of financing home purchases and renovations by real estate investors. The Company loaned money to CRG to make loans to other borrowers. During 2006 the Company took direct assignment with full recourse of the remaining CRG loans and has been liquidating them. The Company funded $ 37,571 on the former CRG loans in the nine months ended September 30, 2007. The unpaid principal balance (“UPB”) of the loans as of September 30, 2007 was $429,888.
b) South Central Mortgage, Inc. (“SCMI”) is a Texas based mortgage bank of which the sole beneficial shareholder is Todd Etter, an officer and principal shareholder of the former Advisor and shareholder and director of UMTSI. Christine “Cricket” Griffin, the Company’s President and one of its trustees, was the Chief Financial Officer of SCMI from September 1995 until July 1996. The Company purchased first lien secured, fixed rate residential real estate mortgage loans sourced by or originated by SCMI. The loans were assigned to the Company when purchased. SCMI provided the Company with limited recourse on loans it sourced or originated and assigned to the Company. At September 30, 2007 and 2006, there was no remaining unpaid principal balance on loans sourced or originated by SCMI.
c) Ready America Funding (“RAFC”) is a Texas corporation that is 50% owned by SCMI. RAFC is in the business of financing interim mortgages for the purchase of land and the construction of modular and manufactured single-family homes placed on the land by real estate investors. Although the Company no longer loans money to RAFC, it has continued to fund current projects directly to RAFC’s borrowers. The Company funded $ 4,380,062 in draws against the remaining properties in RAFC’s portfolio during the nine months ended September 30, 2007. The UPB of the loans as of September 30, 2007 was $22,297,537.
d) UMT Holdings, LP (“UMTH”) is a Delaware limited partnership which is in the real estate finance business. Christine “Cricket” Griffin, the Company’s President; Todd Etter and Tim Kopacka, who own 100% of the Company's former Advisor; Craig Pettit, who owns 100% of Ready Mortgage Corp. and 100% of Eastern Intercorp Inc. which in turn owns 50% of RAFC; and William Lowe, who owns 50% of CRG, are limited partners in UMTH. Mr. Etter is a shareholder and director of UMTSI, the general partner of UMTH. UMTHGS is a subsidiary of UMTH and the Company’s Advisor. REO Property Company (“REOPC”) is a subsidiary of UMTH that provides real estate management services to the Company. Prospect Service Corp. (“PSC”) is a subsidiary of UMTH that acts as a mortgage servicer for the Company, and UMTH holds a 99% limited partnership interest in UMTH Land Development, L.P., which holds a 50% profit interest in UDF and acts as UDF's asset manager.
e) UMTH Lending Company, L.P. (“UMTHLC”) is a Delaware limited partnership owned by UMTH. The Company has loaned and will continue to loan money to UMTHLC to make loans to other borrowers. The loans are then collaterally assigned to the Company as security for the promissory note between UMTHLC and the Company. The Company funded $36,746,706 in draws against existing loans and new loans during the nine months ended September 30, 2007. The UPB of the loans as of September 30, 2007 was $42,079,119. The deterioration in residential mortgage market, specifically the discontinuation of sub-prime and Alt – A products, (the “credit crisis”), and the continued slow down in existing home sales are directly and indirectly affecting the ability of the Company’s borrowers to sell the properties securing its loans, pay interest due the Company and repay the loans when due. Interim borrowers are experiencing difficulty in sourcing financing for retail buyers. As a result, increasing amounts of interim loans remain outstanding after maturity. Subsequent to September 30, 2007 the Company further reduced its interim loan portfolio by approximately $19 million. In addition the Company is currently considering accepting a secured note for shortfalls from foreclosed properties to enable UMTHLC to efficiently manage past due and foreclosed accounts throughout the duration of the “credit
crisis”. (See Executive Summary following for a discussion of the current conditions of the single family housing industry and mortgage markets).
f) Recourse Obligations, Affiliates Secured Notes: The Company is aware that the principal balances of the Obligation have exceeded the maximum note balances for CRG, RAFC and SCMI by $680,896, $1,812,276 and $23,450 respectively. The Company and those affiliated parties analyzed why this occurred and found that the rate at which foreclosed properties were selling was faster than the original model anticipated. Although the minimum payments were met and exceeded, for the first two quarters of 2007, they were outpaced by the rapid sell off of REO properties. The Company and the affiliates are discussing modifications to the loan agreements, which include a pledge of additional collateral and loan modifications to allow for increased maximum note amounts through the remainder of the CRC and RAFC portfolio liquidations. Outstanding balances as of September 30, 2007 were:
Name | Loan Balances |
| CRG | $4,053,800 |
| RAFC | $7,086,712 |
| SCMI | $3,472,093 |
The Secured Notes bear interest at a rate of 10% per annum. The CRG and RAFC Secured Notes amortize over 15 years. The SCMI Secured Note amortizes over 22 years, which was the remaining term of the underlying notes SCMI had recoursed. The Secured Notes require the originating company to make monthly payments equal to the greater of (1) principal and interest amortized over 180 months and 264 months, respectively, or 2) the amount of any distributions paid to the originating company with respect to the pledged Class C units of UMTH. UMTH has also guaranteed the obligations of CRG, SCMI and RAFC under the Secured Notes up to the maximum loan amount defined in the respective notes. The “credit crisis” as well as the decline in new home sales have indirectly affected the earnings of UMTH which, in turn, is expected to affect the distributions associated with the security pledged on the Recourse Obligations. The Company is considering modifications to the Recourse Obligations rate and amortization requirement in response to the mortgage market and new home sales environments. (See Executive Summary following for a discussion of the current conditions of the single family housing industry and mortgage markets).
g) UDF is a Nevada real estate finance company in which UMTH holds a limited partnership profit interest. On September 20, 2006, with Trustee approval, the Company extended and modified its line of credit with UDF. The term remained at five years and the interest rate was modified to a uniform 15% and the borrowing base increased to $45,000,000. UDF makes loans to real estate developers for the acquisition of land and development of single family residential lots. The Company funded $1,750,000 of draws during the nine months ended September 30, 2007. The UPB of the line of credit as of September 30, 2007 was $30,696,766.
Effective September 1, 2006, United Development Funding III, L.P. (“UDF III”) issued a guaranty to the Company for the UDF debt to a maximum of $30,000,000 subject to reductions based on UDF equity. In conjunction with the issuance of the guaranty, the interest rate on the UDF line was reduced to 14%.
h) The Company entered into an Advisory Agreement with UMTHGS effective August 1, 2006. Under the agreement, UMTHGS is paid an advisory fee calculated monthly as 1/12 of 1% of total income producing assets. Advisory services fees paid during the nine months ended September 30, 2007 were $625,081.
As consideration for obtaining the advisory agreement, UMTHGS has paid the Company $500,000 in total over twelve monthly installments, the term of the agreement. The fee was recognized as a reduction of trust administration fees over a one-year term, concluding on August 1, 2007. The fee recognized during the nine months ended September 30, 2007 was $291,667, and was recorded as a reduction of trust administration fee expenses.
i) The Company paid loan servicing fees to PSC under the terms of a Mortgage Servicing Agreement to service its residential mortgages and contracts for deed in the amount of $7,365 during the nine months ended September 30, 2007. In addition, the Company paid PSC to sell its foreclosed properties. Fees paid during the nine months ended September 30, 2007 were $12,394.
5. Subsequent Event
Subsequent to the end of the September 2007 quarter, UMTHLC acquired a bank line of credit and reduced its investment with the Company by approximately $19 million. This action was anticipated by the Company and reduced the Company’s investment in Interim Loans from approximately $42 million to approximately $23 million. The Company used the funds to reduce its own line of credit. By agreement and trustee approval, the Company retains a subordinated piece of UMTHLC’s pledged collateral not to exceed $12 million. At the time the transaction occurred the subordinated balance was approximately $8.5 million.
On November 7, 2007 the Company’s line of credit with Texas Capital Bank matured. The Company is currently negotiating the renewal and extension of the line of credit. There is no assurance that the Company will be successful in negotiating a renewal and extension of the line of credit.
| ITEM 2. MANAGEMENT’S DISCUSSION AND ANALYSIS OF FINANCIAL CONDITION AND RESULTS OF OPERATIONS |
| Cautionary Statement Regarding Forward-Looking Statements |
The following section contains forward-looking statements within the meaning of Section 27A of the Securities Act and Section 21E of the Exchange Act and should be read in conjunction with the consolidated financial statements and related notes appearing in this Form 10-Q. Actual results could differ materially from those contained in these forward-looking statements for a variety of reasons including, but not limited to, those discussed in our Annual Report on Form 10-K for the year ended December 31, 2006 under the caption “Risk Factors”, as well as those discussed in this report, as well as other unknown and unpredictable factors. You should not place undue reliance on these forward-looking statements. Such forward looking statements may be identified by the words “anticipate,” “believe,” “estimate,” “expect” or “intend” and similar expressions. Forward-looking statements are likely to address such matters as our business strategy, future operating results, future sources of funding for mortgage loans acquired by us, future economic conditions and pending litigation involving us.
In light of these risks, uncertainties and assumptions, the forward-looking events discussed in this Form 10-Q may not occur. We undertake no obligation to update or revise our forward-looking statements, whether as a result of new information, future events or otherwise.
RESULTS OF OPERATIONS FOR THE THREE AND NINE MONTHS ENDED SEPTEMBER 30, 2007 AND 2006
General Investment Information
United Mortgage Trust (the “Company”, “we” or “us”) is a Maryland real estate investment trust which qualifies as a real estate investment trust (a “REIT”) under federal income tax laws. The Company invests in: (i) first lien secured mortgage loans with initial terms of 12 months or less for the acquisition and renovation of single family homes, which we refer to as “interim loans”; (ii) first lien secured construction loans for the acquisition of lots and construction of single-family homes, which we refer to as “construction loans”; (iii) lines of credit and secured loans for the acquisition and development of single-family home lots, referred to as “land development loans”; (iv) lines of credit and loans secured by developed single-family lots, referred to as “finished lot loans”; (v) lines of credit and loans secured by completed model homes, referred to as “model home loans”; and, formerly we invested in (vi) first lien, fixed rate mortgages secured by single-family residential property, which we refer to as “residential mortgages”. Additionally, our portfolio includes loans to affiliates of our Advisor, which we refer to as “recourse loans,” all of which are referred to as the Company’s “Mortgage Investments.” Such loans are originated
by others to the Company’s specifications or to specifications approved by the Company. Most, if not all, of such loans are not insured or guaranteed by a federally owned or guaranteed mortgage agency.
Material Trends Affecting Our Business
Nationally, the number of new single-family residential homes sold has been declining, average sales prices have been falling, and the median sales price has been rising. The sales of new single-family residential homes in September 2007 were at a seasonally adjusted annual rate of 770,000 units, according to estimates released jointly by the U.S. Census Bureau and the Department of Housing and Urban Development. This is approximately 23% below the September 2006 estimate of 1,004,000 units. According to the same sources, the average sales price of new houses sold in September 2007 was $288,000; the median sales price was $238,000. This is approximately 2.8% below the September 2006 average sales price of $296,200 and approximately 5% above the September 2006 median sales price of $226,700. The seasonally adjusted estimate of new houses for sale at the end of September was 523,000, which represents a supply of 8.3 months at the September sales rate. The seasonally adjusted estimate of new houses for sale at the end of September 2006 was 560,000, which represents a supply of 6.8 months at the September 2006 sales rate.
According to the same sources, new single-family residential home permits and starts have also declined nationally, as a result and in anticipation of a rising supply of new single-family residential homes and a declining demand for new single-family residential homes. Single-family homes authorized by building permits in September 2007 were at a seasonally adjusted annual rate of 868,000 units. This is 28.6% below the September 2006 estimate of 1,215,000 units. Single-family home starts were at a seasonally adjusted annual rate of 963,000 units. This is 30.8% below the September 2006 estimate of 1,391,000 units.
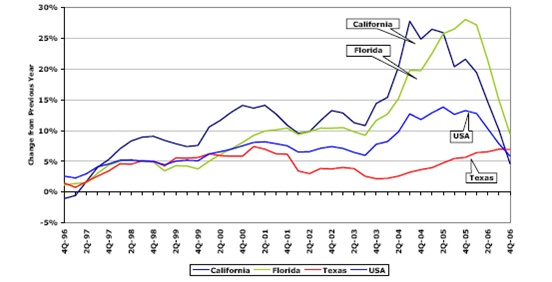
While housing markets generally remain difficult across the nation, with those difficulties most pronounced in those markets that had experienced rapid growth, steep increases in property values and speculation, such as in California, Florida, Arizona and Nevada. However, a few markets, such as Texas, are continuing to remain fairly healthy. The table below illustrates the recent declines in annual home price appreciation rates nationally, as well as in California and Florida, while showing that Texas has not experienced such declines.
10 Year Home Price Appreciation
Source: Office of Federal Housing Enterprise Oversight and Real Estate Center at Texas A&M University
As of September 30, 2007, the great majority of our loans were secured by single-family homes in Texas. We believe the Texas markets have remained fairly healthy due to strong demographics, economies and housing affordability ratios. The National Association of Homebuilders estimates that the median new home prices for 2007 in the metropolitan areas of Austin, Houston, Dallas, San Antonio and Lubbock are $188,025, $204,895, $207,076, $160,764 and $97,199, respectively. These amounts are significantly below the September 2007 national median sales price of new homes sold of $238,000. Using the Department of Housing and Urban Development’s estimated 2007 median family income for the respective metropolitan areas of Austin, Houston, Dallas, San Antonio and
Lubbock, the median income earner in those areas has 1.25 times, 0.95 times, 1.02 times, 1.13 times and 1.71 times the income required to qualify for a mortgage to purchase the median priced new home in the respective metropolitan area. Using the U.S. Census Bureau’s income data to project estimated median income for the United States for 2007 of $59,000 and the September 2007 national median sales prices of new homes sold of $238,000, we conclude that the national median income earners has 0.84 times the income required to qualify for a mortgage loan to purchase the median priced new home in the United States. We further conclude that the above Texas metropolitan areas have new home housing affordability which exceeds the national new home housing affordability by between 1.13 to 2.0 times. The above housing affordability is determined as the ratio of median family income to the income required to qualify for a 90 percent, 30-year fixed-rate mortgage to purchase the median-priced new home, assuming an annual mortgage insurance premium of 45 basis points for private mortgage insurance and a cost that includes estimated property taxes and insurance for the home.
The United States Department of Labor reports that as of September 2007, Texas led the nation with the largest job gains over the past twelve months with 217,400 new jobs created. This is nearly 33% more jobs created during this period than in the nation’s second largest state for job growth, California, and more than two times the jobs created during this period in the nation’s third largest state for job growth, Florida. The Texas Workforce Commission reports that as of September 2007, the Texas metropolitan areas of Austin, Houston, Dallas, San Antonio and Lubbock experienced, during the last twelve months, the creation of 25,900, 64,500, 67,900, 15,100 and 3,400 new jobs, respectively.
The United States Census Bureau reported on June 28, 2007 that Texas’ five major cities – Austin, Houston, San Antonio, Dallas and Fort Worth – were among the top ten in the nation for population growth from 2005 to 2006. San Antonio was second in the nation with a population change of 33,084 from July 1, 2005 to July 1, 2006, Fort Worth was third in the nation with a population change of 30,201 during that period, Houston was fourth in the nation with a population change of 26,554 during that period, Austin was sixth in the nation with population change of 18,630 during that period, and Dallas was eighth in the nation with a population change of 16,676 during that period.
The Fall 2007 U.S. Market Risk Index, a study prepared by PMI Mortgage Insurance Co., the U.S. subsidiary of The PMI Group, Inc., which ranks the nation’s 50 largest metropolitan statistical areas according to the likelihood that home prices will be lower in two years, reported that Texas cities lead the nation in home price stability. The San Francisco-based company recently analyzed housing price trends in 50 U.S. metropolitan areas for its quarterly report, released October 9, 2007. Major Texas cities in the study are considered among the least likely in the country to see home prices decline. The study predicts there is less than a 10% chance that the Dallas/Fort Worth-area and Houston home prices will fall during the next two years, a 12% chance that San Antonio home prices will fall during the next two years and a 15% chance that Austin home prices will fall during the next two years.
In Texas markets, home builders and developers remain disciplined on new home construction and project development. New home starts have been declining year-on-year and are outpaced by new home sales in all of our Texas markets where such data is readily available. Inventories of finished new homes and finished lot supplies are healthy, with the exception of Dallas-Fort Worth where homebuilders have slowed housing starts as the market had become slightly oversupplied with finished new homes and finished lot supplies.
The Real Estate Center at Texas A&M University has reported that the sales of existing homes remain healthy in our Texas markets, as well. As of September 2007, the number of existing homes sold year-to-date in Austin is 22,299, down 5% year-on-year; San Antonio is 18,699, down 8% year-on-year; Houston is 60,446, down 2% year-on-year, Dallas is 45,311, down 6% year-on-year, Fort Worth is 8,800, down 4% year-on-year, and Lubbock is 2,747, up 5% year-on-year. The median sales price increased 7% year-on-year in Austin, increased 6% year-on-year in San Antonio, increased 2% year-on-year in Houston, increased 2% year-on-year in Dallas, was flat year-on-year in Fort Worth, and increased 4% year-on-year in Lubbock. The number of months of home inventory for sale in Austin, San Antonio, Houston, Dallas, Fort Worth and Lubbock is 4.7 months, 6.3 months, 6.5 months, 6.7 months, 6.5 months, and 6.5 months, respectively. A 6-month supply of inventory is considered a balanced market with more than 6 months of inventory generally being considered a buyer’s market and less than 6 months of inventory generally being considered a seller’s market.
In managing and understanding the markets and submarkets in which we make loans, we monitor the fundamentals of supply and demand. We monitor the economic fundamentals in each of the markets in which we
make loans, analyzing demographics, household formation, job growth, and housing affordability. We also monitor movements in home prices and the presence of market disruption activity, such as investor or speculator activity that
can create false demand and an oversupply of homes in a market. Further, we study new home starts, new home closings, finished home inventories, finished lot inventories, existing home sales, existing home prices, absorption, prices with respect to new and existing home sales, finished lots and land, and the presence of sales incentives, discounts, or both, in a market.
The residential homebuilding industry is cyclical and is highly sensitive to changes in general economic conditions, such as levels of employment, consumer confidence and income, availability of financing for acquisition, construction and permanent mortgages, interest rate levels and demand for housing. Sales of new homes are also affected by the condition of the resale market for used homes, including foreclosed homes. Housing demand is, in general, adversely affected by increases in interest rates, housing costs and unemployment and by decreases in the availability of mortgage financing.
We are not aware of any material trends or uncertainties, favorable or unfavorable, other than national economic conditions affecting real estate and interest rates generally, including what is referred to as the “sub-prime or credit crisis” that we reasonably anticipate to have a material impact on either the income to be derived from our investments in mortgage loans, or in entities that obtain mortgage loans, other than those referred to in our Annual Report on Form 10-K. Despite the overall stability in the Texas market where we make the great majority of our loans, the recent disruption of mortgage markets stemming from the sharp rise in defaults in the sub-prime mortgage market, in combination with a significant amount of negative national press discussing chaos in mortgage markets and the poor condition of the national housing industry, including declining home prices and new home sales concessions and discounts, have made potential home purchasers and real estate lenders very cautious. We anticipate that this may result in a slowing of interim loan originations and of the sales of finished lots developed by clients of United Development Funding, L.P., (“UDF”) one of our major borrowers and an affiliate of our Advisor, in certain markets; however, we believe that the prices of those homes and lots should not change materially. The cautiousness being exhibited by lenders and borrowers as well as the publicity about the sub-prime crisis is also resulting in increased foreclosures and may affect the ability of our borrowers to sell the assets securing their loans, pay interest due us and repay the loans when due and may in the near term and longer term expose us to greater loan losses than we have historically experienced.
Executive Summary
Earnings for the first nine months of 2007 met our expectations, at $1.31 per share outstanding compared to $1.04 per share in the same 2006 period. Distributions to shareholders were $1.09 and $1.06 per share, respectively. Earnings for the 2007 and 2006 third quarters were $0.36 and $0.40 per share, respectively, and distributions to shareholders were $0.37 and $0.35 per share, respectively.
Approximately 63% and 60% of our income was generated from interim loans during the nine months ended September 30, 2007 and 2006, respectively, and although the percentage invested in interim loans increased between comparable periods, the number of new loan originations decreased during the three and nine months of 2007 by 70% and 36% when compared to loan originations in comparable 2006 periods. The expected decline was a function of our intention to stop investing in interim construction loans and interim loans secured by modular and manufactured lots and homes.
The deterioration in residential mortgage market, specifically the discontinuation of sub-prime and Alt – A products, referred to herein as the credit crisis, and the continued slow down in new home sales are directly and indirectly affecting the ability of our borrowers to sell the assets securing their loans, pay interest due us and repay the loans when due. New and existing home financing solutions are being introduced by both the private and public sectors. Housing inventories are slowly beginning to reduce to sustainable levels. However, consumer confidence remains low. Industry-wide lenders are reevaluating and restructuring credits affected by residential mortgage markets and the housing sales decline. Overall recovery of the single family housing industry is likely to be prolonged. We believe that a pragmatic and pro-active approach to managing our credits will allow us to maximize repayments and properly report asset values. In consideration of the above, we are:
| · | reducing our investment in interim loans dependent on sub-prime and Alt-A mortgage products for repayment of our loan. We funded 63% fewer loans in the three-months ended September 30, 2007 compared to the same period in 2006 Interim loan payoffs as a percentage of loans originated during the three and nine-month comparable periods were 174% and 107% in 2007 compared to 90% and 83% during the 2006 periods. Subsequent to September 30, 2007 we reduced our investment in Interim Loans by approximately 45%, from $42million to $23 million. |
| · | considering accepting a secured note for shortfalls from foreclosed properties to enable UMTHLC to efficiently manage past due and foreclosed accounts throughout the duration of the credit crisis. |
| · | increasing loss reserves for non-recourse interim and construction loans where full collection of the indebtedness is not assured. |
| · | reevaluating collateral value on specific loans deemed to be affected by current mortgage and housing environments and reserving for unsecured deficiencies. |
UMTHLC also reports that foreclosures as a function of loans originated during 2007 increased to 15% compared to a four year historical rate of 8.77%. Accordingly UMTHLC has increased its loss reserves to accommodate projected losses. UMTHLC reports that the higher rate is a factor of different underwriting criteria employed during 2006 and the inability of its borrowers to sell properties to consumers because it is more difficult for consumers to qualify for mortgage loans in today’s economic environment.
Approximately 25% of our income was derived from lines of credit and secured loans for the acquisition and development of single-family home lots, referred to as “land development loans” during the nine months ended September 30, 2007 and 2006, respectively. At September 30, 2007 our investment in the line of credit to our affiliate, UDF, was approximately $30.7 million. We had anticipated our investment in land development loans to grow to 35% by year end, but now project that increase to occur in the second quarter 2008, as we renegotiate our bank line of credit to accommodate land development loans as pledged collateral. We intend to use our line of credit to build this portion of our portfolio.
In addition, we have been reviewing opportunities in two loan categories we have not yet entered: lot banking loans and model home banking loans. Our Advisor and Trustees are reviewing prospects for investment, and we hope to find suitable investments during the last quarter of the year.
During the nine months ended September 30, 2007 and 2006, approximately 8% and 6% of our income, respectively, came from payments made by affiliates under secured promissory notes issued by them to us to evidence their accrued obligations to reimburse us for any defaulted loans that we acquire from them, which notes we refer to as “Recourse Obligations.” The Recourse Obligations have maximum note amounts which have been exceeded by SCMI and CRG. We intend to modify the maximum note amount with respect to SCMI and CRG affiliate loan and reclassify those amounts as Recourse Obligations, as each of those affiliates have liquidated substantially all of their portfolios and the value of the security pledged by both SCMI and CRG exceeds the proposed maximum note amounts. We anticipate that RAFC’s amount will continue to grow over the next twelve months, as it further liquidates its portfolio.
The Secured Notes require the originating company to make monthly payments equal to the greater of (1) principal and interest amortized over 180 months and 264 months, respectively, or 2) the amount of any distributions paid to the originating company with respect to the pledged Class C units of UMTH. UMTH has guaranteed the obligations of CRG, SCMI and RAFC under the Secured Notes up to the maximum loan amount defined in the respective notes. The “sub-prime or credit crisis” as well as the decline in new home sales have indirectly affected the earnings of UMTH which, in turn, is expected to affect the distributions associated with the security pledged on the Recourse Obligations. The Company monitors the value of the security pledged by the originating companies and is considering modifications to the Recourse Obligations rate and amortization requirement to allow UMTH to structure payments under the Recourse Obligations in relation to its earnings as impacted by the mortgage market and new home sales environments.
Results of Operations
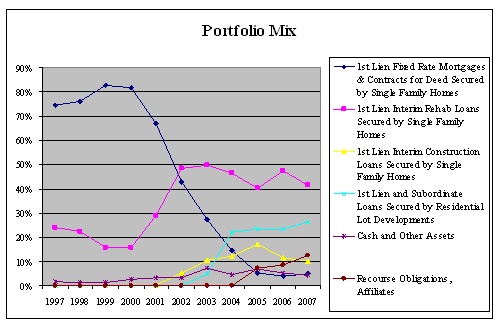
| · | Our portfolio concentrations have shifted over ten years of investing, and particularly since 2000, as we have sought adequate supplies of suitable loans in a changing real estate finance market. The chart below demonstrates the transition from a portfolio with a concentration on long term 1st lien single family loans to one comprised primarily of first lien interim loans of 12 months or less in term for the purchase and renovation of single family homes and loans secured by 1st lien and subordinate single family lot development loans. We intend to continue to adapt to changes in the real estate finance market and thus the composition of our loan portfolio is likely to continue to evolve over time based on factors such as interest rates paid under various types of real estate loans, our assessment of the level of risk of the different types of loans, availability of loans, regulatory considerations and other factors. Subsequent to September 30, 2007 we reduced our investment in Interim Loans by approximately 45%, from $42million to $23 million. The chart below takes into consideration the subsequent reduction. Management estimates that investment in land development loans will grow to at least 35%, or to as much as 75%, of our portfolio by the end of 2008. |
 Loans Purchased
During the three and nine months ended September 30, 2007 and 2006, we acquired interim mortgages from both affiliates and others, and funded draws on the UDF line of credit.
| | Three months ended | Nine months ended |
| | September 30, | September 30, |
| | 2007 | 2006 | 2007 | 2006 |
| Interim Mortgages Purchased | | | | |
| Funded with affiliates | $ 7,357,000 | $ 19,618,000 | $ 42,394,000 | $ 53,395,000 |
| Funded with others | 320,000 | 6,533,000 | 3,248,000 | 17,057,000 |
| Total funded | $ 7,677,000 | $ 26,151,000 | $ 45,642,000 | $ 70,452,000 |
| | | | | |
| Number of loans funded with affiliates | 90 | 320 | 538 | 776 |
| Number of loans funded with others | - | 74 | 5 | 118 |
| Total number of loans funded | 90 | 394 | 543 | 894 |
| | | | | |
| Principal paid off with affiliates | $ 9,713,000 | $ 10,980,000 | $ 37,262,000 | $ 37,422,000 |
| Principal paid off with other | 2,876,000 | 11,618,000 | 8,533,000 | 19,405,000 |
| Total principal paid off | $ 12,589,000 | $ 22,598,000 | $ 45,795,000 | $ 56,827,000 |
| | | | | |
| Number of loans with affiliates paid off | 163 | 196 | 571 | 661 |
| Number of loans with other paid off | 18 | 81 | 72 | 159 |
| Total number of loans paid off | 181 | 277 | 643 | 820 |
| | | | | |
| Line of Credit, Affiliate | | | | |
| Draws funded | $ - | $ 6,153,000 | $ 1,750,000 | $ 15,562,000 |
| Paid down | - | (3,900,000) | (4,109,000) | (12,073,000) |
| Net change | $ - | $ 2,253,000 | $ (2,359,000) | $ 3,489,000 |
| | | | | |
| Investment in Trust Receivable | | | | |
| Residential Mortgages and Contracts for Deed | | | | |
| Purchase price | $ 278,000 | $ 267,000 | $ 574,000 | $ 762,000 |
| Number purchased from other sources | 1 | 5 | 13 | 16 |
| Aggregate principal balance | 278,000 | 267,000 | 574,000 | 762,000 |
| Average principal balance | $ 278,000 | $ 53,400 | $ 44,200 | $ 47,600 |
Below is a table that summarizes our mortgage portfolio at the end of each quarter indicated:
| | At September 30, |
| | 2007 | 2006 |
Interim Mortgages Balances at September 30 | | |
| Affiliates unpaid principal balance | $66,438,940 | $60,177,157 |
| Unpaid principal balance others | $12,540,828 | $22,196,251 |
| Total | $78,979,768 | $82,373,408 |
| | | |
| Interim foreclosed, other | $401,805 | $1,259,238 |
| | | |
| Number of affiliate interim loans | 819 | 819 |
| Number of unaffiliated interim loans | 169 | 268 |
| | 988 | 1,087 |
| | | |
| Average unpaid principal balance | $79,939 | $75,781 |
| Remaining term in months: less than | 12 | 12 |
| Yield on investments | 13.03% | 13.60% |
| | | |
Line of Credit, Affiliate Balances at September 30 | $30,696,766 | $33,806,189 |
| Term remaining in months | 27 | 39 |
| Yield on investment | 13.86% | 13.86% |
| | | |
Recourse Obligations Balance at September 30 | | |
| Recourse obligations | $14,612,605 | $11,534,095 |
| Yield on investment | 9.96% | 9.81% |
| | | |
Investment in Trust Receivable at September 30 | | |
| Loans owned outright | 63 | 46 |
| Rental properties | 1 | 2 |
| Unpaid principal balance loans/properties owned outright | $2,215,344 | $1,763,171 |
| Securitized loans B piece balance | $3,115,502 | $3,759,966 |
| Term remaining in months | 233 | 250 |
| Yield on investments | 12.95% | 13.98% |
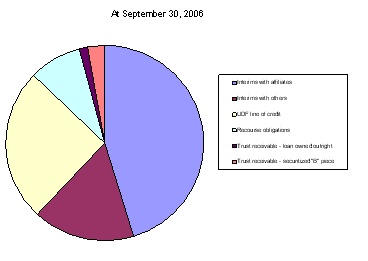
The following table illustrates percentage of our portfolio dedicated to each loan category:
| | At September 30, |
| | 2007 | 2006 |
| | | |
| Interims with affiliates | 51% | 45% |
| Interims with others | 10% | 17% |
| UDF line of credit | 24% | 25% |
| Recourse obligations | 11% | 9% |
| Trust receivable - loan owned outright | 2% | 1% |
| Trust receivable - securitized "B" piece | 2% | 3% |
The pie charts below compare the percentages of income producing assets as of the periods indicated.
All of the properties that are security for the mortgage investments are located in the United States. Each of the properties were adequately covered by a mortgagee’s title insurance policy and hazard insurance.
During the three and nine-month periods ended September 30, 2007 and 2006, our investments generated approximately $4,410,000 and $4,434,000 and $13,239,000 and $12,639,000 of interest income, respectively, representing a 1% decrease and 5% increase over the prior periods. The decrease during the September quarter was a function of an overall smaller portfolio of income producing assets.
Operating expenses for the three and nine-month periods ended September 30, 2007 and 2006 were approximately $1,941,000 and $1,617,000 and $4,254,000 and $5,340,000 respectively, representing 20% increase and 20% decrease between 2007 and 2006 comparable periods. The increase in the 2007 quarter was primarily due to an increase in provision for loan losses and the decrease between the nine-month periods was primarily due to the one time charge to merger expenses we took when the merger agreement terminated in September 2006 and lower provision for loan losses offset by higher interest expense. Other changes in major categories of operating expenses are explained below:
Trust administration fee - $254,000 and $215,000 (a 18% increase) between the comparable three-month periods and $625,000 and $642,000 (a 3% decrease) between the comparable nine-month periods of 2007 and 2006, respectively. Effective August 1, 2006 we entered into an advisory services agreement with
UMTHGS and annual fees were increased from a blended rate of 0.8% to 1%. As part of the agreement, UMTHGS paid $500,000 to the Company, in 12 monthly installments. The fee was recognized as a reduction of trust administration fees over the 12 month term. The fee recognized during the three and nine months ended September 30, 2007 and 2006 were $42,000 and $83,000 and $292,000 and $83,000, respectively.
General and administrative - $204,000 and $393,000 (a 48% decrease) between the comparable three-month periods and $695,000 and $796,000 (a 13% decrease) between the comparable nine-month periods of 2007 and 2006, respectively. The decreases were primarily decreases in amortization expense and legal fees.
Interest expense - $547,000 and $487,000 (a 12% increase) between the comparable three-month periods and $1,786,000 and $1,040,000 (a 72% increase) between comparable nine-month periods of 2007 and 2006, respectively. In September 2006 we modified our line of credit to allow up to $30,000,000 in total borrowing, and have used the increase during 2007 to fund growth in our mortgage investments resulting in increased interest expense.
Operating expenses, net of interest expense, provision for loan losses and merger expenses, as a percentage of income were 10.42% and 13.78% for the comparable three-month and 10.02% and 11.68% for the comparable nine-month periods of 2007 and 2006, respectively. As a percentage of average invested assets operating expenses, net, were 0.35% and 0.47% for the comparable three-month periods and 0.98% and 1.17% for the comparable nine-month periods, respectively.
We recorded an allowance for loan losses for the quarter ended September 30, 2007 in the amount of approximately $934,000 compared to $507,000 for the 2006 quarter. Allowances for loan losses recorded during the nine months ended September 30, 2007 and 2006 were $1,141,000 and $1,784,000, respectively. We realized loan losses of approximately $966,000 and $424,000 during the comparable three-month periods of 2007 and 2006, respectively, and $1,837,000 and $2,217,000 during the comparable nine-month periods of 2007 and 2006, respectively. Loss reserves are estimates of future losses based on historical default rates and estimated loss on sale of real estate owned. The Company is currently reevaluating collateral value on specific loans deemed to be affected by current mortgage and housing environments and intends to establish reserves for any expected deficiencies that are not otherwise secured. From inception through September 30, 2007 we have acquired approximately $566 million of loans. We have recorded losses approximating 2.18% of those assets to date. We anticipate loan losses to continue, primarily in our long-term loan portfolio, and therefore continue to assess the adequacy of our loan loss reserve.
Foreclosed residential mortgage and contracts for deed were 3.93% and 1.70% of the outstanding loans at September 30, 2007 and 2006, respectively. Foreclosed third party interim mortgages loans were 6.02% and 8.71% of outstanding loans at September 30, 2007 and 2006, respectively.
Net income was approximately $2,470,000 and $2,817,000 for the three-month periods and $8,986,000 and $7,299,000 for the nine-month periods of 2007 and 2006, respectively, a 12% decrease and 23% increase. Earnings for the three months ended September 30, 2007 and 2006 were $0.36 and $0.40 per share and $1.31 and $1.04 for the nine months ended September 30, 2007 and 2006, respectively.
Distributions to shareholders per share of beneficial interest in the 2007 and 2006 three-month periods were $0.37 and $0.35 and $1.09 and $1.06 for the nine-month periods, respectively.
CAPITAL RESOURCES AND LIQUIDITY FOR THE THREE MONTHS ENDED SEPTEMBER 30, 2007 AND 2006
Our sources of funds for liquidity consist of our dividend reinvestment plan, our bank line of credit and repayments of principal on our loans made to purchase mortgage investments.
| | Three Months Ended September 30, | Nine months ended September 30, |
| | 2007 | 2006 | 2007 | 2006 |
| Shares issued in dividend reinvestment | 31,641 | 30,717 | 93,688 | 100,137 |
| Gross proceeds | 631,755 | 627,767 | 1,873,755 | 2,015,767 |
| Share repurchases | (3,076,337) | (1,001,608) | (5,468,337) | (4,077,608) |
| Principal receipts from Residential Mortgages and Contracts for Deed | 364,478 | 432,000 | 631,478 | 1,491,000 |
| Principal receipts from Interim Mortgages | 12,618,655 | 23,593,360 | 45,794,655 | 56,827,360 |
| Funding (payments) on Line of Credit, Affiliate | - | (2,253,152) | 2,359,423 | (3,489,152) |
| Net advances (payments) on Line of Credit payable | (3,375,405) | 4,499,462 | (4,379,405) | 11,140,462 |
We are not currently offering shares in the public markets except to existing shareholders through our dividend reinvestment plan. In July 2006 we registered an additional 1,000,000 shares to be offered through our dividend reinvestment plan.
Shares issued in the aggregate, as of September 30, 2007 and 2006, were 8,079,111 and 7,954,174, respectively. Shares retired to treasury through our share redemption plan in the aggregate were 1,357,174 and 1,027,782 through September 30, 2007 and 2006, respectively. Total shares outstanding were 6,721,937 and 6,926,392, respectively. Inception to date gross offering proceeds from all public offerings were approximately $161,382,000 and net proceeds after fees, marketing reallowance and commissions were approximately $142,737,000.
Since entering into a three year loan agreement on November 8, 2004 with our lending bank, we have amended and restated the original $15 million revolving credit facility five times. The most recent amendment was effective July 1, 2007 which, in addition to minor modifications, 1) added single family lots as eligible collateral, 2) increased the days past due for an eligible mortgage note from 20 to 60 days, 3) set a maximum aggregate loan limit to any one borrower at $2 million dollars and 4) modified the tangible net worth amount to $95 million dollars. The line of credit was collateralized by certain interim mortgages, construction loans and land development loans.. Interest on the outstanding balance accrues at prime plus 0.5% per annum, or 8.75% at September 30, 2007 and 2006. On November 7, 2007 the Company’s line of credit with Texas Capital Bank matured. We are currently negotiating the renewal and extension of the line of credit. There is no assurance that we will be successful in negotiating a renewal and extension of the line of credit. The outstanding balance on the line of credit was approximately $23,597,000 and $24,949,000 at September 30, 2007 and 2006, respectively.
Critical Accounting Policies and Estimates
We prepare our accounting statements in accordance with GAAP. The preparation of consolidated financial statements requires us to make estimates and judgments that affect the reported amounts of assets, liabilities, revenues and expenses, and related disclosure of contingent assets and liabilities. On an on-going basis, we evaluate our estimates, including those related to accrual of interest income, loan loss reserves and valuation of foreclosed properties. We base our estimates on historical experience and on various other assumptions that are believed to be reasonable under the circumstances, the results of which form the basis for making judgments about the carrying values of assets and liabilities that are not readily apparent from other sources. Actual results may differ from these estimates under different assumptions or conditions.
Significant accounting policies are described in the audited consolidated financial statements and notes thereto included in our Annual Report on Form 10-K for the year ended December 31, 2006. The following critical
accounting policies affect our more significant judgments and estimates used in the preparation of our consolidated financial statements:
Interest is accrued monthly on outstanding principal balances. Payments are either received monthly for interest or at payoff. Any deficiencies in unpaid interest are either charged off to the reserve for loan losses or charged against the related recourse obligations.
We maintain a reserve for loan losses for estimated losses resulting from the inability of our borrowers to make required payments resulting in property foreclosure and losses from the sale of foreclosed property.. If the financial condition of our borrowers was to deteriorate, resulting in an impairment of their ability to make payments or, if the market value of the properties securing our loans decreases additional reserves may be required.
We record foreclosed properties at an estimated net realizable value based on our assessment of real estate market conditions and historical discount percentages on the sale of foreclosed properties. Should market conditions deteriorate or loss percentages increase, additional valuation adjustments may be required.
ITEM 3. QUANTITATIVE AND QUALITATIVE DISCLOSURES ABOUT MARKET RISK
We are exposed to interest rate changes primarily as a result of the method by which our bank credit facility is calculated at 1/2% over bank prime lending rate. Subsequent to the end of the September 2007 quarter the lending rate has decreased by one quarter percent to 7.5% and we do not anticipate increases during 2008.
We have no long-term borrowings.
We provide a line of credit to UDF. UDF is a real estate finance limited partnership which derives a substantial portion of its income by originating, purchasing, participating in and holding for investment mortgage loans made directly by UDF to persons and entities for the acquisition and development of real property as single-family residential lots that will be marketed and sold to home builders. Changes in interest rates may impact both demand for UDF’s real estate finance products and the rate of interest on the loans UDF makes. In most instances, the loans UDF will make will be junior in the right of repayment to senior lenders who will provide loans representing 70% to 80% of total project costs. As senior lender interest rates available to our borrowers increase, demand for our mortgage loans may decrease, and vice versa.
Developers to whom UDF makes mortgage loans use the proceeds of such loans to develop raw real estate into residential home lots. The developers obtain the money to repay these development loans by selling the residential home lots to home builders or individuals who will build single-family residences on the lots, and by obtaining replacement financing from other lenders. If interest rates increase, the demand for single-family residences may decrease. Also, if mortgage financing underwriting criteria become more strict, demand for single-family residences may decrease. In such an interest rate and/or mortgage financing climate, developers may be unable to generate sufficient income from the resale of single-family residential lots to repay loans from UDF, and developers’ costs of funds obtained from lenders in addition to us may increase, as well. Accordingly, increases in single-family mortgage interest rates or decreases in the availability of mortgage financing could increase the number of defaults on development loans made by UDF, and correspondingly impact UDF’s ability to make payments under its line of credit.
ITEM 4. CONTROLS AND PROCEDURES
Evaluation of Disclosure Controls and Procedures
An evaluation was performed by the Company’s management, consisting of the individual who serves as our Chief Executive Officer and Chief Financial Officer, of the effectiveness of Company’s disclosure controls and procedures (as defined in Rule 13a-15(e) under the Securities Exchange Act of 1934) as of September 30, 2007. Based on such evaluation, management has concluded that, as of the end of such period, the Company’s disclosure controls and procedures are effective.
Changes in Internal Controls Over Financial Reporting
There have been no changes in the Company’s internal control over financial reporting that occurred during the nine months ended September 30, 2007, that have materially affected, or are reasonably likely to materially affect, the Company’s internal control over financial reporting.
PART II - OTHER INFORMATION
ITEM 1. LEGAL PROCEEDINGS
None.
ITEM 1A. RISK FACTORS
We are not aware of any material trends or uncertainties, favorable or unfavorable, other than national economic conditions affecting real estate and interest rates generally, that we reasonably anticipate to have a material impact on either the income to be derived from our investments in mortgage loans and entities that make mortgage loans, other than those referred to in our Annual Report on Form 10-K.
The recent disruption of mortgage markets, in combination with a significant amount of negative national press discussing chaos in mortgage markets and the poor condition of the national housing industry, including declining home prices, have made potential new home purchasers and real estate lenders very cautious. We anticipate that this may result in a slowing of the sales of finished lots developed by UDF’s clients in certain markets; however, we believe that the prices of those lots should not change materially.
In addition, the deterioration in residential mortgage market, specifically the discontinuation of sub-prime and Alt – A products, (the “sub-prime” or “credit crisis”), and the continued slow down in existing home sales are directly and indirectly affecting the ability of the Company’s borrowers to sell the properties securing interim loans, pay interest due us and repay the interim loans when due. Interim borrowers are experiencing difficulty in sourcing financing for retail buyers. As a result, increasing amounts of interim loans remain outstanding after maturity.
ITEM 2. UNREGISTERED SALES OF EQUITY SECURITIES AND USE OF PROCEEDS
There is currently no established public trading market for our shares. As an alternative means of providing limited liquidity for our shareholders, we maintain a share redemption plan (“SRP”).
Under our SRP, shareholders who have held the shares for at least one year are eligible to request that we repurchase their shares. In any consecutive 12 month period we may not repurchase more than 5% of the outstanding shares at the beginning of the 12 month period. The repurchase price is based on the value of our assets less our obligations or a fixed pricing schedule, as determined by the trustees' business judgment based on our book value, operations to date and general market and economic conditions and may not, in any event, exceed any current public offering price. We have also purchased a limited number of shares outside of our SRP from shareholders with special hardship considerations.
Share repurchases have been at prices between NAV, which is calculated and adjusted as necessary on a quarterly basis, and $20 per share. Shares repurchased at the lower price were 1) shares held by shareholders for less than 12 months or 2) shares purchased outside of our SRP.
The following table sets forth information relating to shares of beneficial interest repurchased into treasury during the period covered by this report.
| | Total number of shares purchased | Average price per share | Total number of shares purchased as part of publicly announced plan | Total number of shares purchased outside of publicly announced plan |
| | | | | |
| Jan | 17,803 | $18.41 | 10,073 | 7,730 |
| Feb | 20,551 | $18.22 | 10,534 | 10,017 |
| Mar | 12,223 | $19.08 | 9,139 | 3,084 |
| Apr | 15,409 | $19.01 | 11,250 | 4,158 |
| May | 13,793 | $19.37 | 11,323 | 2,470 |
| Jun | 52,095 | $17.21 | 10,747 | 41,347 |
| Jul | 40,859 | $19.71 | 37,472 | 3,387 |
| Aug | 55,218 | $19.67 | 50,006 | 5,211 |
| Sep | 61,244 | $19.35 | 49,999 | 11,245 |
| | | | | |
| | 289,195 | $18.91 | 200,543 | 88,649 |
ITEM 3. DEFAULTS UPON SENIOR SECURITIES
Not applicable.
ITEM 4. SUBMISSION OF MATTERS TO A VOTE OF SECURITY HOLDERS
None.
ITEM 5. OTHER INFORMATION
Subsequent to the end of the September 2007 quarter, UMTLC acquired a bank line of credit and reduced its borrowings from the Company by approximately $19 million. This action was anticipated by the Company. The Company used the funds to reduce its own line of credit. By agreement and trustee approval, the Company retains a subordinated piece of UMTHLC’s pledged collateral not to exceed $10 million. At the time the transaction occurred the subordinated balance was approximately $8.5 million.
ITEM 6. EXHIBITS
| Exhibit 31. Certification of Chief Executive Officer pursuant to Section 302 of the Sarbanes-Oxley Act of 2002 |
| Exhibit 32. Certification of Chief Executive Officer pursuant to Section 906 of the Sarbanes-Oxley Act of 2002 |
SIGNATURE
Pursuant to the requirements of Section 13 or 15(d) of the Securities Exchange Act of 1934, the Registrant has duly caused this report to be signed on their behalf by the undersigned, thereunto duly authorized.
| | |
| |
| | |
| | |
| President and Chief Executive Officer |