UNITED STATES
SECURITIES AND EXCHANGE COMMISSION
Washington, D.C. 20549
FORM 10-Q
[ x ] QUARTERLY REPORT PURSUANT TO SECTION 13 OR 15(d) OF
THE SECURITIES EXCHANGE ACT OF 1934
For the quarterly period ended September 30, 2008
[ ] TRANSITION REPORT PURSUANT TO SECTION 13 OR 15(d) OF
THE SECURITIES EXCHANGE ACT OF 1934
For the transition period from _________ to _________
Commission file number: 000-32409
UNITED MORTGAGE TRUST
(Exact name of registrant as specified in its charter)
| Maryland | 75-6493585 |
| (State or other jurisdiction of incorporation or organization) | (I.R.S. Employer Identification No.) |
1301 Municipal Way, Suite 220
Grapevine, Texas 76051
(Address of principal executive offices)(Zip Code)
(214) 237-9305
(Registrant’s telephone number, including area code)
1702 N. Collins Blvd, Ste 100, Richardson, TX 75080
(Former address)
Indicate by check mark whether the registrant (1) has filed all reports required to be filed by Section 13 or 15(d) of the Securities Exchange Act of 1934 during the preceding 12 months (or for such shorter period that the registrant was required to file such reports), and (2) has been subject to such filing requirements for the past 90 days. Yes X No ___
Indicate by check mark whether the registrant is a large accelerated filer, an accelerated filer, a non-accelerated filer, or a smaller reporting company. See the definitions of “large accelerated filer,” “accelerated filer” and “smaller reporting company” in Rule 12b-2 of the Exchange Act
Large accelerated filer___ Accelerated filer____ Non-accelerated filer (Do not check if a smaller reporting company)
X Smaller Reporting Company
Indicate by check mark whether the registrant is a shell company (as defined in Rule 12b-2 of the Exchange Act) Yes No X
The number of shares outstanding of the Registrant’s shares of beneficial interest, par value $0.01 per share, as of the close of business on November 14, 2008 was 6,540,302.
UNITED MORTGAGE TRUST
INDEX
PART I - FINANCIAL INFORMATION
| | | Page |
| ITEM 1. | Financial Statements | |
| | | |
| | Consolidated Balance Sheets as of September 30, 2008 (unaudited) and December 31, 2007 | 3 |
| | Consolidated Statements of Income for the three months and nine months ended September 30, 2008 and September 30, 2007 (unaudited) | 4 |
| | Consolidated Statements of Cash Flows for the nine months ended September 30, 2008 and September 30, 2007 (unaudited) | 5 |
| | Notes to Consolidated Financial Statements (unaudited) | 6 |
| | | |
| ITEM 2. | Management’s Discussion and Analysis of Financial Condition and Results of Operations | 13 |
| ITEM 3. | Quantitative and Qualitative Disclosures about Market Risk | 24 |
| ITEM 4. | Controls and Procedures | 24 |
| |
| PART II - OTHER INFORMATION |
| | | |
| ITEM 1. | Legal Proceedings | 25 |
| ITEM 2. | Unregistered Sales of Equity Securities and Use of Proceeds | 25 |
| ITEM 3. | Defaults Upon Senior Securities | 26 |
| ITEM 4. | Submission of Matters to a Vote of Security Holders | 26 |
| ITEM 5. | Other Information | 26 |
| ITEM 6. | Exhibits | 26 |
UNITED MORTGAGE TRUST
CONSOLIDATED BALANCE SHEETS
| | | | | | |
| | | | | | | | |
| | | | | |
Cash and cash equivalents | | | | | | | |
| | | | | | | | |
| | | | | | | |
Investment in trust receivable | | | | | | | |
Interim mortgages, affiliates | | | | | | | |
| | | | | | | |
Allowance for loan losses | | | | | | | |
Total mortgage investments | | | | | | | |
| | | | | | | | |
Line of credit receivable, affiliate | | | | | | | |
Accrued interest receivable | | | | | | | |
Accrued interest receivable, affiliate | | | | | | | |
Recourse obligations, affiliates | | | | | | | |
Residential mortgages and contracts for deed | | | | | | | |
Interim mortgages foreclosed | | | | | | | |
| | | | | | | |
Deficiency note, affiliate | | | | | | | |
| | | | | | | |
| | | | | | | |
| | | | | | | | |
Liabilities and Shareholders’ Equity | | | | | | | |
| | | | | | | |
| | | | | | | |
Accounts payable and accrued liabilities | | | | | | | |
Participation payable, affiliate | | | | | | | |
| | | | | | | |
| | | | | | | | |
Commitments and contingencies | | | | | | | |
| | | | | | | | |
| | | | | | | |
Shares of beneficial interest; $0.01 par value; 100,000,000 shares authorized; 8,198,572 and 8,110,684 shares issued, respectively; and 6,495,815 and 6,649,916 outstanding, respectively | | | | | | | |
Additional paid-in capital | | | | | | | |
| | | | | | | |
Cumulative distributions in excess of earnings | | | | | | | |
| | | | | | | | |
Less treasury stock of 1,702,757and 1,460,768 shares, respectively, at cost | | | | | | | |
Total shareholders' equity | | | | | | | |
Total liabilities and shareholders' equity | | | | | | | |
See accompanying notes to consolidated financial statements.
UNITED MORTGAGE TRUST
CONSOLIDATED STATEMENTS OF INCOME
(unaudited)
| | | Three Months Ended September 30, | | Nine Months Ended September 30, |
| | | | | | | | | |
| | | | | |
Interest income derived from affiliates | | | | | | | | | |
| | | | | | | | | |
| | | | | | | | | | |
| | | | | | | | | |
| | | | | | | | | |
| | | | | | | | | |
General and administrative | | | | | | | | | |
Provision for loan losses | | | | | | | | | |
| | | | | | | | | |
| | | | | | | | | | |
| | | | | | | | | | |
| | | | | | | | | |
| | | | | | | | | | |
Net income per share of beneficial interest | | | | | | | | | |
| | | | | | | | | | |
Weighted average shares outstanding | | | | | | | | | |
| | | | | | | | | | |
Distributions per weighted share outstanding | | | | | | | | | |
See accompanying notes to consolidated financial statements.
UNITED MORTGAGE TRUST
CONSOLIDATED STATEMENTS OF CASH FLOWS
(unaudited)
| | | Nine Months Ended September 30, | |
| | | 2008 | | 2007 | |
| | | | | |
| $ | | $ | | |
Adjustments to reconcile net income to net cash provided | | | | | |
| | | | | |
Provision for loan losses | | | | | |
Depreciation and amortization | | | | | |
Changes in assets and liabilities: | | | | | |
Accrued interest receivable | | | ) | | ) |
| | | | | |
Accounts payable and accrued liabilities | | | ) | | |
Net cash provided by operating activities | | | | | |
| | | | | | |
| | | | | |
Investment in trust receivable | | | ) | | |
Principal receipts on trust receivable | | | | | |
Investment in interim mortgages | | | ) | | ) |
Principal receipts on interim mortgages | | | | | |
Investments in interim mortgages, affiliates | | | ) | | ) |
Principal receipts on interim mortgages, affiliates | | | | | |
Investments in residential mortgages and contracts for deed | | | | | ) |
Principal receipts on residential mortgages and contracts for deed | | | | | |
Line of credit receivable, affiliate, net | | | | | |
Receivable from affiliate | | | | | |
Principal receipts from (investments in) recourse obligations | | | ) | | |
Net cash provided by investing activities | | | | | |
| | | | | | |
| | | | | |
Proceeds from issuance of shares of beneficial interest | | | | | |
Line of credit payable, net | | | | | ) |
Purchase of treasury stock | | | ) | | ) |
| | | ) | | ) |
Net cash used in financing activities | | | ) | | ) |
| | | | | | |
Net decrease in cash and cash equivalents | | | | | ) |
Cash and cash equivalents at beginning of period | | | | | |
Cash and cash equivalents at end of period | $ | | $ | | |
| | | | | | |
Supplemental Disclosure of Cash Flow Information | | | | | |
Cash paid during the period for interest | $ | | $ | | |
Non-Cash Financing and Investing Activity | | | | | |
Transfers of affiliate and non-affiliate loans to foreclosed properties or recourse obligations | $ | | $ | | |
Participation receivable, affiliate | $ | | $ | | |
Participation payable, affiliate | $ | | $ | | |
Participation accrued interest receivable, affiliate | $ | | $ | | |
Participation accrued interest payable, affiliate | $ | | $ | | |
See accompanying notes to consolidated financial statements.
UNITED MORTGAGE TRUST
NOTES TO CONSOLIDATED FINANCIAL STATEMENTS
(unaudited)
United Mortgage Trust (the “Company”) is a Maryland real estate investment trust that qualifies as a real estate investment trust (a “REIT”) under federal income tax laws. The Company invests exclusively in: (i) first lien secured mortgage loans with initial terms of 12 months or less for the acquisition and renovation of single family homes, which we refer to as “interim loans”; (ii) lines of credit and secured loans for the acquisition and development of single-family home lots, referred to as “land development loans”; (iii) lines of credit and loans secured by developed single-family lots, referred to as “finished lot loans”; (iv) lines of credit and loans secured by completed model homes, referred to as “model home loans”; (v) first lien secured construction loans for the acquisition of lots and construction of single-family homes, which we refer to as “construction loans”; and formerly the Company invested in (vi) first lien, fixed rate mortgages secured by single-family residential property, which we refer to as “residential mortgages”. Additionally, the Company’s portfolio includes obligations of affiliates of its Advisor, which we refer to as “recourse loans.” Loans are originated by others to the Company’s specifications or to specifications approved by the Company. Most, if not all, of such loans are not insured or guaranteed by a federally owned or guaranteed mortgage agency.
The Company has no employees. The Company pays a monthly trust administration fee to UMTH General Services, L.P. (“UMTHGS” or “Advisor”), a subsidiary of UMT Holdings, L.P. (“UMTH”), a Delaware real estate finance company and affiliate, for the services relating to its daily operations. The Company’s offices are located in Grapevine, Texas.
These financial statements have been prepared in accordance with generally accepted accounting principles (“GAAP”) for interim financial information and with the instructions for Form 10-Q and Article 10 of Regulation S-X. Accordingly, they do not include all of the information and footnotes required by GAAP for complete financial statements. In the opinion of management, all adjustments (consisting of normal recurring adjustments) considered necessary for a fair presentation have been included. Operating results for the three and nine months ended September 30, 2008, are not necessarily indicative of the results that may be expected for the year ended December 31, 2008. Certain prior period amounts have been reclassified to conform with current period presentation. For further information, refer to the consolidated financial statements and footnotes thereto included in our Annual Report on Form 10-K for the year ended December 31, 2007.
| 3. | Impact of Recently Issued Accounting Standards |
In September 2006, the Financial Accounting Standards Board (“FASB”) issued Statement of Financial Accounting Standard (“SFAS”) No. 157, Fair Value Measurements (“SFAS 157”). SFAS 157 defines fair value, establishes a market-based framework or hierarchy for measuring fair value, and expands disclosures about fair value measurements. SFAS 157 is applicable whenever another accounting pronouncement requires or permits assets and liabilities to be measured at fair value. SFAS 157 does not expand or require any new fair value measures; however, the application of this statement may change current practice. The requirements of SFAS 157 are first effective for the Company for the fiscal year beginning January 1, 2008. However, in February 2008 the FASB decided that an entity need not apply this standard to nonfinancial assets and liabilities that are recognized or disclosed at fair value in the financial statements on a nonrecurring basis until the subsequent year. Accordingly, the Company’s adoption of this standard on January 1, 2008 is limited to financial assets and liabilities. The Company’s adoption of SFAS 157 has not had a material impact on its financial condition or results of operations.
In February 2007, the FASB issued SFAS No. 159, The Fair Value Option for Financial Assets and Financial Liabilities Including an Amendment of FASB Statement No. 115 (“SFAS 159”). The fair value option permits entities to choose to measure eligible financial instruments at fair value at specified election dates. The entity will report unrealized gains and losses on the items on which it has elected the fair value option in earnings. The Company’s adoption of SFAS 159 has not had a material impact on the Company’s results of operations or financial condition.
In December 2007, the FASB issued SFAS No. 160, Noncontrolling Interests in Consolidated Financial Statements. SFAS No. 160 amends ARB 51 to establish accounting and reporting standards for the noncontrolling interest in a subsidiary and for the deconsolidation of a subsidiary and clarifies that a noncontrolling interest in a subsidiary is an ownership interest in the consolidated entity that should be reported as equity in the consolidated financial statements. This Statement is effective for fiscal years beginning on or after December 15, 2008. The adoption of this Statement is not expected to have a material impact on the Company’s financial position or results of operations.
In March 2008, the FASB issued SFAS No. 161, Disclosures about Derivative Instruments and Hedging Activities, an Amendment of FASB Statement No. 133. SFAS No. 161 amends SFAS No. 133 and requires entities to enhance their disclosures about (a) how and why an entity uses derivative instruments, (b) how derivative instruments and related hedged items are accounted for under SFAS No. 133 and its related interpretations, and (c) how derivative instruments and related hedged items affect an entity’s financial position, financial performance, and cash flows. SFAS No. 161 is effective for fiscal years beginning on or after November 15, 2008. The adoption of SFAS No. 161 is not expected to have a material impact on the Company’s financial position or results of operations.
On October 10, 2008, the FASB issued FASB Staff Position 157-3 (FSP 157-3), Determining the Fair Value of a Financial Asset When the Market for that Asset Is Not Active. FSP 157-3 clarifies the application of Statement 157 in a market that is not active and provides an example to illustrate key considerations in determining the fair value of a financial asset when the market for the financial asset is not active. FSP 157-3 was effective upon issuance, including prior periods for which financial statements have not been issued. The adaption of FSP 157-3 is not expected to have a material impact on the Company’s financial position or results of operations.
4. Deficiency Notes – Affiliate and Non-Affiliate
The Company has made loans in the normal course of business to affiliates and non-affiliates, the proceeds from which have been used to originate underlying loans that are pledged to us as security for such obligations. When principal and interest on an underlying loan is due in full, at maturity or otherwise, the corresponding obligation owed by the originating company to the Company is also due in full. If the borrower or the Company foreclosed on property securing an underlying loan, or if the Company foreclosed on property securing a purchased loan, and the proceeds from the sale were insufficient to pay the loan in full, the originating company had the option of (1) repaying the outstanding balance owed to the Company associated with the underlying loan or purchased loan, as the case may be, or (2) delivering to the Company an unsecured deficiency note in the amount of the deficiency.
As of September 30, 2008, the Company had two deficiency notes with non-affiliates in the amount of approximately $5,685,000.
As of December 31, 2007, the Company had one deficiency note with a non-affiliate in the amount of approximately $1,726,000.
As of December 31, 2007, UMTHLC issued to the Company a variable amount promissory note in the amount of $5,100,000 to evidence its deficiency obligations to the Company. The initial principal amount of the note was approximately $1,848,000. The principal balance will fluctuate from time to time based on the underlying loan activity and the amount of deficiencies realized by the affiliate. The note bears interest at a rate of 10%, and requires monthly principal and interest payments based on a ten-year amortization for the outstanding principal balance. The note is secured by a limited guaranty by UMTHGS, the Advisor, equal to a monthly amount not to exceed 33% of the advisory fee received by UMTHGS under the terms of its advisory agreement with the Company. This note had a balance of approximately $4,758,000 and $1,848,000 at September 30, 2008 and December 31, 2007 respectively.
5. Related Party Transactions
The Company relies on affiliates of its Advisor for the sourcing and origination of a majority of its mortgage investments.
1) UMT Holdings, L.P. (“UMTH”) is a Delaware limited partnership which is in the real estate finance business. UMTH holds a 99.9% limited partnership interest in UMTH Lending Company, L.P., which originates interim loans that the Company is assigned, UMTH Land Development, L.P., which holds a 50% profit interest in United Development Funding, LP (“UDF”) and acts as UDF's asset manager and originates land development, lot banking and construction loans that the Company is assigned, and Prospect Service Corp. (“PSC”), which services the Company’s residential mortgages and contracts for deed and manages the Company’s real estate owned ("REO"). In addition, UMTH has a limited guarantee of the obligations of Capital Reserve Group (“CRG”), Ready America Funding Corporation (“RAFC”) and South Central Mortgage, Inc. (“SCMI”) under the Recourse Obligations - Affiliates. The Company’s President, Christine “Cricket” Griffin, is a partner of UMTH.
2) UMTH Lending Company, L.P. (“UMTHLC”) is a Delaware limited partnership, and subsidiary of UMTH. The Company has loaned money to UMTHLC so it can make interim loans to its borrowers. The interim loans are collaterally assigned to the Company, as security for the promissory note between UMTHLC and the Company. The unpaid principal balance of the loans at September 30, 2008 and December 31, 2007 was approximately $18,400,000 and $19,776,000, respectively. UMTH Land Development, L.P. (“UMTHLD”) is a Delaware limited partnership and subsidiary of UMTH. The Company has purchased land development loans, lot banking loans and construction loans originated by UMTHLD.
3) Ready America Funding (“RAFC”) is a Texas corporation that is 50% owned by SCMI, which is owned by Todd Etter. RAFC is in the business of financing interim loans for the purchase of land and the construction of modular and manufactured single-family homes placed on the land by real estate investors. The Company continues to directly fund obligations under one existing RAFC loan, which was collaterally assigned to the Company, but does not fund new originations. The unpaid principal balance of the loans at September 30, 2008 and December 31, 2007 was approximately $23,215,000 and $21,866,000, respectively.
4) Wonder Funding, LP (“Wonder”) is a Delaware limited partnership that is owned by Ready Mortgage Corp. (“RMC”). RMC is beneficially owned by Craig Pettit. Wonder is in the business of financing interim loans for the purchase of land and the construction of single family homes. The Company has ceased funding any new originations. As of December 31, 2007, all remaining obligations owed by Wonder to the Company are included in the recourse obligations discussed below.
5) Recourse Obligations. The Company has made recourse loans to (a) Capital Reserve Group, ("CRG"), Inc. which is owned by Todd Etter and William Lowe, (b) RAFC, which is owned by SCMI and two companies owned by Craig Pettit, Eastern Intercorp, Inc. and RMC, and (c) SCMI, which is owned by Todd Etter, (these companies are referred to as the "Originating Companies"). In addition to the Originating Companies discussed above, the Company made loans with recourse to Wonder. Each of these entities used the proceeds from such loans to originate loans, that are referred to as "Underlying Loans," that are pledged to the Company as security for such Originating Company's obligations to the Company. When principal and interest on an Underlying Loan are due in full, at maturity or otherwise, the corresponding obligation owed by the Originating Company to the Company is also due in full.
In addition, some of the Originating Companies have sold loans to the Company, referred to as the "Purchased Loans," and entered into recourse agreements under which the originating company agreed to repay certain losses the Company incurred with respect to Purchased Loans.
If the Originating Company forecloses on property securing an Underlying Loan, or the Company forecloses on property securing a Purchased Loan, and the proceeds from the sale are insufficient to pay the loan in full, the Originating Company has the option of (1) repaying the outstanding balance owed to the Company associated with the Underlying Loan or Purchased Loan, as the case may be, or (2) delivering an unsecured deficiency note in the amount of the deficiency to the Company.
On March 30, 2006, but effective December 31, 2005, the Company and each Originating Company agreed to consolidate (1) all outstanding amounts owed by such Originating Company to the Company under the loans made by the Company to the Originating Company and under the deficiency notes described above and (2) the estimated maximum future liability to the Company under the recourse arrangements described above, into secured promissory notes. Each Originating Company issued to the Company a secured variable amount promissory note dated December 31, 2005 (the “Secured Notes”) in the principal amounts shown below, which amounts represent all principal and accrued interest owed as of such date. The initial principal amounts are subject to increase up to the maximum amounts shown below if the Company incurs losses upon the foreclosure of loans covered by recourse arrangements with the Originating Company. The Secured Notes (including related guaranties discussed below) are secured by an assignment of the distributions on the Class C units, Class D units and Class EIA units of limited partnership interest of UMTH held by each Originating Company.
| Name | Initial principal amount | Balance at September 30, 2008 | Promissory Note principle amount (2) | | Units pledged as security | Units distributed in 2008 | C Units remaining | Nominal Collateral Value (3) |
| | | | | | | | |
| | | | | | | | |
| | | | | | | | |
| | | | | | | | |
| | | | | | | | |
| | | | | | | | |
| | | | | | | | |
| (1) | Wonder is collateralized by an indemnification agreement from RMC in the amount of $1,134,000, which includes the pledge of 3,870 C Units. |
| (2) | The CRG, SCMI, and Wonder balances at September 30, 2008 exceeded the stated principal amount per their variable Secured Notes by approximately $182,000, $37,000, and $558,000, respectively. Per the terms of the Secured Notes, the unpaid principal balance may be greater or less than the initial principal amount of the note and is not considered an event of default. The rapid rate of liquidation of the remaining portfolio of properties caused a more rapid increase in the Unpaid Principal Balance (“UPB”) than the Company originally anticipated and out paced the minimum principal reductions scheduled for the loans. |
| (3) | Nominal collateral value does not reflect pledge of D units of limited partnership interest of UMTH held by WLL, Ltd. and RAFC. |
Through September 2007, the Secured Notes incurred interest at a rate of 10% per annum. The CRG and RAFC Secured Notes amortize over 15 years. The SCMI Secured Note amortizes over approximately 22 years, which was the initial amortization of the deficiency notes from SCMI that were consolidated. The Secured Notes required the Originating Company to make monthly payments equal to the greater of (1) principal and interest amortized over 180 months and 264 months, respectively, or (2) the amount of any distributions paid to the Originating Company with respect to the pledged Class C and EIA units. Effective October 2007, the recourse loans were modified to accommodate the anticipated increases in principal balances throughout the remaining liquidation periods of the underlying assets, suspend the principal component of the amortized loans for the period of July 2007 through June 2009, and reduce the interest rate from 10% to 6%.
The Secured Notes have also been guaranteed by the following entities under the arrangements described below, all of which are dated effective December 31, 2005:
| - | UMT Holdings. This guaranty is limited to a maximum of $10,582,336 due under all of the Secured Notes and is unsecured. |
| - | WLL, Ltd., an affiliate of CRG. This guaranty is of all amounts due under the Secured Note from CRG and is non-recourse and is secured by an assignment of 2,492 Class C Units and 732 Class D units of limited partnership interest of UMT Holdings held by WLL, Ltd. |
| - | RMC. This guaranty is non-recourse, is limited to 50% of all amounts due under the Secured Note from RAFC and is secured by an assignment of 3,870 Class C units of limited partnership interest of UMT Holdings. |
| - | Wonder. Wonder Funding obligations are evidenced by a note from RAFC (“RAFC Wonder Note”) and are secured by a pledge of a certain Indemnification Agreement given by UMTH to RAFC and assigned to UMT in the amount of $1,134,000, which amount is included in the UMTH limited guarantee referenced above. |
In addition, WLL, Ltd. has obligations to UMT Holdings under an indemnification agreement between UMT Holdings, WLL, Ltd. and William Lowe, under which UMT Holdings is indemnified for certain losses on loans and advances made to William Lowe by UMT Holdings. That indemnification agreement allows UMT Holdings to offset any amounts subject to indemnification against distributions made to WLL, Ltd. with respect to the Class C and Class D units of limited partnership interest held by WLL, Ltd. Because WLL, Ltd. has pledged these Class C and Class D units to the Company to secure its guaranty of Capital Reserve Corp.'s obligations under its Secured Note, UMT Holdings and the Company entered into an Intercreditor and Subordination Agreement under which UMT Holdings has agreed to subordinate its rights to offset amounts owed to it by WLL, Ltd. to the Company’s lien on such units.
6) On June 20, 2006, the Company entered into a Second Amended and Restated Secured Line of Credit Promissory Note (the "Amendment") with UDF, a Nevada limited partnership that is affiliated with the Company's Advisor, UMTHGS. The Amendment increased an existing revolving line of credit facility ("Loan") to $45 million. The Loan matures on December 31, 2009. The purpose of the Loan is to finance UDF's loans and investments in real estate development projects. The Loan is secured by the pledge of all of UDF's land development loans and equity investments. Those UDF loans may be first lien loans or subordinate loans.
Prior to December 31, 2007, the Loan interest rate was the lower of 15% or the highest rate allowed by law, further adjusted with the addition of a credit enhancement to a minimum of 14%. Effective January 1, 2008, UDF negotiated for the release of the credit enhancement associated with the Company’s affiliate line of credit and reducing the effective interest rate to 14%.
UDF may use the Loan proceeds to finance indebtedness associated with the acquisition of any assets to seek income that qualifies under the Real Estate Investment Trust provisions of the Internal Revenue Code to the extent such indebtedness, including indebtedness financed by funds advanced under the Loan and indebtedness financed by funds advanced from any other source, including Senior Debt, is no more than 85% of 80% (68%) of the appraised value of all subordinate loans and equity interests for land development and/or land acquisition owned by UDF and 75% for first lien secured loans for land development and/or acquisitions owned by UDF.
As a condition of the Amendment, UDF III, a newly formed public limited partnership that is affiliated with UDF and with the Company’s Advisor, has provided a guarantee of payment and performance of the Loan up to $30 million. The UDF III guarantee was released effective January 1, 2008.
The Loan is subordinate to UDF Senior Debt, which is defined as all indebtedness due and owing by UDF pursuant to (i) that certain loan guaranty to Colonial Bank in the amount of $8,750,000, (ii) that certain loan to OU Land Acquisition, L.P. in the principal amount of $25,000,000, (iii) a line of credit provided by Textron Financial Corporation in the amount of $30,000,000, and (iv) all other indebtedness of UDF to any national or state chartered banking association or other institutional lender that is approved by the Company in writing. The outstanding loan balance was paid in full by UDF on September 19, 2008.In September 2008, UMT entered into an Economic Interest Participation Agreement with UDF III pursuant to which UDF III purchased (i) an economic interest in the $45,000,000 revolving credit facility described above (the “UMT Loan”) from UMT to UDF and (ii) a purchase option to acquire a full ownership participation interest in the UMT Loan (the “ Option”).
The UMT Loan is the $45,000,000 revolving line of credit facility evidenced by a Second Amended and Restated Secured Line of Credit Promissory Note dated as of June 20, 2006, as modified by an amendment effective September 1, 2006 (as amended, the “Amendment”). The UMT Loan is secured by a security interest in the assets of UDF including UDF's land development loans and equity investments pursuant to the First Amended and Restated Security Agreement dated as of September 30, 2004, executed by UDF in favor of UMT (the “Security Agreement”).
Pursuant to the Economic Interest Participation Agreement, each time UDF requests an advance of principal under the UMT Loan, UDF III will fund the required amount to UMT and UDF III’s economic interest in the UMT Loan increases proportionately. UDF III’s economic interest in the UMT Loan gives UDF III the right to receive payment from UMT of principal and accrued interest relating to amounts funded by UDF III to UMT which are applied towards UMT’s funding obligations to UDF under the UMT Loan. UDF III may abate its funding obligations under the Economic Participation Agreement at any time for a period of up to twelve months by giving UMT notice of the abatement.
The Option gives UDF III the right to convert its economic interest into a full ownership participation interest in the UMT Loan at any time by giving written notice to UMT and paying an exercise price of $100. The participation interest includes all rights incidental to ownership of the UMT Loan and the Security Agreement, including participation in the management and control of the UMT Loan. UMT will continue to manage and control the UMT Loan while UDF III owns an economic interest in the UMT Loan. If UDF III exercises its Option and acquires a participation interest in the UMT Loan, UMT will serve as the loan administrator but both UDF III and UMT will participate in the control and management of the UMT Loan. The UMT Loan matures on December 31, 2009. UDF III exercised its Option on September 30, 2008.
The purpose of the UMT Loan is to finance UDF's investments in real estate development projects. The UMT Loan interest rate is the lower of 14% or the highest rate allowed by law. UDF may use the UMT Loan proceeds to finance indebtedness associated with the acquisition of any assets to seek income that qualifies under the Real Estate Investment Trust provisions of the Internal Revenue Code to the extent such indebtedness, including indebtedness financed by funds advanced under the UMT Loan and indebtedness financed by funds advanced from any other source, including Senior Debt, is no less than 85% of 80% (68%) of the appraised value of all subordinate loans and equity interests for land development and/or land acquisition owned by UDF and 75% for first lien secured loans for land development and/or acquisitions owned by UDF. At September 30, 2008 UDF III had funded approximately $23,700,000 to UDF under this agreement.
The UMT Loan is subordinate to UDF Senior Debt, which includes a line of credit provided by Textron Financial Corporation in the amount of $30,000,000, and all other indebtedness of UDF to any national or state chartered banking association or other institutional lender that is approved by UMT in writing
7) Until July 31, 2006 the Company’s Advisor was UMTA. As of August 1, 2006, (now subject to an Advisory Agreement effective January 1, 2008) the Company entered into an Advisory Agreement with UMTHGS. Under the terms of the agreement, UMTHGS is paid a monthly trust administration fee. The fee is calculated monthly depending on the Company’s annual distribution rate, ranging from 1/12th of 1% up to 1/12th of 2% of the amount of average invested assets per month. During the three months ended September 30, 2008 and September 30, 2007, the net fees paid to the Company’s Advisors were approximately $266,000 and $254,000 respectively. During the nine months ended September 30, 2008 and September 30, 2007, the net fees paid to the Company’s Advisors were approximately $812,000 and $625,000, respectively. Upon entering into the Advisory Agreement with UMTHGS, UMTHGS agreed to pay the Company $500,000 and assume the $377,000 due from the previous advisor over a period of 12 months. During 2007, approximately $300,000 of the consideration fee was received by the Company and netted against trust administration fees, while $200,000 of the assumed debt was paid in 2007. Both the assumed debt and the agreed fee have been paid in full.
The agreement also provides for a subordinated incentive fee equal to 25% of the amount by which the Company’s net income for a year exceeds a 10% per annum non-compounded cumulative return on its adjusted contributions. No incentive fee was paid during 2008 or 2007. In addition, for each year in which it receives a subordinated incentive fee, the Advisor will receive a 5-year option to purchase 10,000 shares of the Company at a price of $20.00 per share (not to exceed 50,000 shares). As of September 30, 2008, the Advisor has not received options to purchase shares under this arrangement.
The Advisor and its affiliates are also entitled to reimbursement of costs of goods, materials and services obtained from unaffiliated third parties for the Company’s benefit, except for note servicing and for travel and expenses incurred in connection with efforts to acquire investments for the Company or to dispose of any of its investments. During the three months ended September 30, 2008 and September 30, 2007, the Company paid the Advisor approximately $19,000 and $19,000, respectively, as reimbursement for costs associated with providing shareholder relations activities. During the nine months ended September 30, 2008 and 2007, the Company paid the Advisor approximately $57,000 and $38,000, respectively, as reimbursement for costs associated with providing shareholder relations activities.
The Advisory Agreement provides for the Advisor to pay all of the Company’s expenses and for the Company to reimburse the Advisor for any third-party expenses that should have been paid by the Company but which were instead paid by the Advisor. However, the Advisor remains obligated to pay: (1) the employment expenses of its employees, (2) its rent, utilities and other office expenses and (3) the cost of other items that are part of the Advisor's overhead that is directly related to the performance of services for which it otherwise receives fees from the Company.
The Advisory Agreement also provides for the Company to pay to the Advisor a debt placement fee. The Company may engage the Advisor, or an Affiliate of the Advisor, to negotiate lines of credit on behalf of the Company. UMT shall pay a negotiated fee, not to exceed 1% of the amount of the line of credit secured, upon successful placement of the line of credit.
8) The Company pays loan servicing fees to PSC, a subsidiary of UMTH, under the terms of a Mortgage Servicing Agreement. During the three months ended September 30, 2008 and September 30, 2007, the Company paid loan servicing fees of approximately $1,400 and $1,300, respectively. During the nine months ended September 30, 2008 and September 30, 2007, the Company paid loan servicing fees of approximately $4,200 and $7,400, respectively.
9) RMC, a Texas based real estate finance company, is owned by Craig Pettit, who was a limited partner of UMTH. The Company loaned money to RMC to make loans to its borrowers. The loans were collaterally assigned to the Company as security for the promissory note between RMC and the Company. There were no outstanding borrowings owed to the Company from RMC as of September 30, 2008 and December 31, 2007.
10) REOPC was a Texas limited partnership owned by UMTH. Its mission was to manage and sell REO properties, including the Company’s, for which it received a fee. The Company loaned money to REOPC to acquire foreclosed properties from CRG and UMTHLC. There were no unpaid principal balances owed to the Company as of September 30, 2008.
6. Subsequent Events
On October 28, 2008, the Company executed two construction loan agreements with a homebuilder. Each loan agreement has a maximum commitment of up to $15,000,000 for a total maximum commitment of up to $30,000,000 and a termination date of October 28, 2009. Advances made will be at the base rate of 13.0% and will be secured by first liens on the projects under construction. The loan agreements limits advances to no more than 85% of the projected sale price of the finished home (85% LTV) and limits are also in place regarding the number of spec and model homes allowed in each approved subdivision.
| | ITEM 2. MANAGEMENT’S DISCUSSION AND ANALYSIS OF FINANCIAL CONDITION AND RESULTS OF OPERATIONS |
| | Cautionary Statement Regarding Forward-Looking Statements |
This Form 10-Q contains forward-looking statements within the meaning of Section 27A of the Securities Act of 1933, as amended, and Section 21E of the Securities Exchange Act of 1934, as amended. Such statements involve known and unknown risks, uncertainties, and other factors which may cause our actual results, performance, or achievements to be materially different from future results, performance or achievements expressed or implied by such forward-looking statements. Such factors include, but are not limited to, our ability to find suitable mortgage investments, the difficulties of the real estate industry generally in response to the “sub-prime crisis” and the “credit crisis,” changes in the overall economic environment and the requirement to maintain qualification as a real estate investment trust. Although we believe that the assumptions underlying the forward-looking statements contained herein are reasonable, any of the assumptions could be inaccurate, and therefore we cannot give assurance that such statements included in this Form 10-Q will prove to be accurate. In light of the significant uncertainties inherent in the forward-looking statements included herein, the inclusion of such information should not be regarded as a representation by us or by any other person that the results or conditions described in such statements or in our objectives and plans will be realized. Readers should carefully review our financial statements and the notes thereto contained in our Annual Report on Form 10-K for the year ended December 31, 2007, as well as those statements contained in this report, and in our other filings with the Securities and Exchange Commission.
In light of these risks, uncertainties and assumptions, the forward-looking events discussed in this Form 10-Q may not occur. We undertake no obligation to update or revise our forward-looking statements, whether as a result of new information, future events or otherwise.
RESULTS OF OPERATIONS FOR THE THREE AND NINE MONTHS ENDED SEPTEMBER 30, 2008 AND SEPTEMBER 30, 2007
General Investment Information
United Mortgage Trust (the “Company”) is a Maryland real estate investment trust that qualifies as a real estate investment trust (a “REIT”) under federal income tax laws. The Company invests exclusively in: (i) first lien secured mortgage loans with initial terms of 12 months or less for the acquisition and renovation of single family homes, which we refer to as “interim loans”; (ii) lines of credit and secured loans for the acquisition and development of single-family home lots, referred to as “land development loans”; (iii) lines of credit and loans secured by developed single-family lots, referred to as “finished lot loans”; (iv) lines of credit and loans secured by completed model homes, referred to as “model home loans”; (v) first lien secured construction loans for the acquisition of lots and construction of single-family homes, which we refer to as “construction loans”; and formerly we invested in (vi) first lien, fixed rate mortgages secured by single-family residential property, which we refer to as “residential mortgages”. Additionally, our portfolio includes obligations of affiliates of our Advisor, which we refer to as “recourse loans.” Loans are originated by others to the Company’s specifications or to specifications approved by the Company. Most, if not all, of such loans are not insured or guaranteed by a federally owned or guaranteed mortgage agency.
Material Trends Affecting Our Business
The residential homebuilding industry is cyclical and is highly sensitive to changes in general economic conditions, such as levels of employment, consumer confidence and income, availability of financing for acquisition, construction and permanent mortgages, interest rate levels and demand for housing. Sales of new homes are also affected by the condition of the resale market for used homes, including foreclosed homes. Housing demand is, in general, adversely affected by increases in interest rates, housing costs and unemployment and by decreases in the availability of mortgage financing.
The current credit crisis and disruption of mortgage markets, in combination with a significant amount of negative national press discussing chaos in financial and mortgage markets and the poor condition of the national housing industry, including declining home prices, have made potential new home purchasers and real estate lenders very cautious. As a result of these factors, the national housing market is experiencing a protracted decline and the time necessary to correct, may indicate a corresponding slow recovery for the housing industry. We anticipate that this may result in a slowing of the sales of finished lots developed by our clients in certain markets; however, we believe that the prices of those lots should not change materially. Capital constraints at the heart of the credit crisis have reduced the number of real estate lenders able or willing to finance development, construction and the purchase of homes. With credit less available and more expensive, mortgages to purchase homes will become harder to get. Further, the liquidity provided in the secondary market by Fannie Mae and Freddie Mac (Government Sponsored Enterprises or “GSEs”) to the mortgage industry is very important to the housing market. These entities have recently reported losses as a result of deteriorating housing and credit market conditions. These losses have reduced their equity and limited their ability to acquire mortgages. The director of the Federal Housing Finance Agency (FHFA), James B. Lockhart III, on September 7, 2008 announced his decision to place two Government sponsored enterprises (GSEs), Fannie Mae (Federal National Mortgage Association) and Freddie Mac (Federal Home Loan Mortgage Corporation), into conservatorship run by FHFA. That plan contained three measures: an increase in the line of credit available to the GSEs from the Treasury, so as to provide liquidity; the right for the Treasury to purchase equity in the GSEs, so as to provide capital; and a consultative role for the Federal Reserve in a reformed GSE regulatory system. The U.S Treasury's support of the two GSEs while under conservatorship of the FHFA is intended to promote stability in the secondary mortgage market and lower the cost of funding. The GSEs will modestly increase their MBS portfolios through the end of 2009. Then, to address systemic risk, in 2010 their portfolios will begin to be gradually reduced at the rate of 10 percent per year, largely through natural run off, eventually stabilizing at a lower, less risky size. To further support the availability of mortgage financing for millions of Americans, Treasury is initiating a temporary program to purchase GSE Mortgage Backed Securities (“MBS’s”). This program will expire with the Treasury's temporary authorities in December 2009. Any limitations or restrictions on the availability of such financing or on the liquidity provided by such enterprises could adversely affect interest rates and mortgage availability and could cause the number of homebuyers to decrease, which would increase the likelihood of defaults on our loans and, consequently, reduce our ability to pay distributions to our shareholders.
The Economic Stabilization Act of 2008 was signed into law on October 3, 2008. The “bailout”, which gives the government broad authority to buy up toxic mortgage-related investments and other distressed assets from undercapitalized financial institutions and ease accounting rules that require financial institutions to show the deflated value of assets on their balance sheets is intended to re-capitalize the banking sector and increase the supply of loanable funds and enable financial institutions to raise additional capital. With the necessary capital, lenders will be able to lend money for the development, construction and purchase of homes. However, the Economic Stabilization Act was just the beginning of a much larger task as Congress is expected to further overhaul housing policy and financial regulation in a 2009 legislative effort.
Nationally, the number of new single-family residential homes sold has been declining, and average and median sales prices have been falling. The sales of new single-family residential homes in September 2008 were at a seasonally adjusted annual rate of 464,000 units, according to estimates released jointly by the U.S. Census Bureau and the Department of Housing and Urban Development. This is approximately 33.1% below the September 2007 estimate of 694,000 units and 54.5% below the December 2006 estimate of 1,019,000. According to the same sources, the average sales price of new houses sold in September 2008 was $275,500; the median sales price was $218,400. This is approximately 4.3% below the September 2007 average sales price of $288,000 and 11.6% below the December 2006 average sales price of $311,600. In addition, the median sales price is approximately 8.2% below and 11.5% below the September 2007 median sales price of $238,000 and the December 2006 median price of $246,900, respectively. The seasonally adjusted estimate of new houses for sale at the end of September 2008 was 394,000, which represents a supply of 10.2 months at the September 2008 sales rate. The seasonally adjusted estimate of new houses for sale at the end of September 2007 was 523,000, which represented a supply of 9.0 months at the September 2007 sales rate. We believe that this significant drop in the number of new houses for sale, year-over-year, by an estimated 129,000 units reflects the homebuilding industry’s extensive efforts to bring the new housing market back to equilibrium by continuing to reduce new housing starts and selling existing new home inventory. We further believe that housing inventories will continue to fall until they reach between 350,000 and 375,000 units in the first half of 2009, a point we believe will mark a tightened housing market.
According to the same sources, new single-family residential home permits and starts have also declined nationally, as a result and in anticipation of a rising supply of new single-family residential homes and a declining demand for new single-family residential homes. Single-family homes authorized by building permits in September 2008 were at a rate of 532,000 units. This is 38.7% below and 54.9% below the September 2007 estimate of 868,000 units and the December 2006 estimate of 1,181,000, respectively. Single-family home starts for September 2008 were at a rate of 544,000 units. This is 43.5% below the September 2007 estimate of 963,000 units and 55.8% below the December 2006 estimate of 1,241,000.
We believe that select housing markets across the United States are presently reacting to several years of unsustainable appreciation in home prices and speculation and homebuilding economics that created overbuilding. Housing markets generally are declining on a national basis with those declines and difficulties most pronounced in those markets that had experienced rapid growth, steep increases in property values and speculation, such as in California, Florida, Arizona and Nevada. In these markets, the supply of new and existing homes, finished lots and lots under development and to-be developed exceed present, short-term demand. Also, we believe as a result of the significant and, in some cases, rapid decline in the price of a new home in those markets, that consumer confidence has declined and that such consumers have postponed a new home purchase until home prices stabilize. Additionally, we believe that in select housing markets across the United States, to restore market balance, new and existing homes prices will continue to decrease and, for homebuilders to restore profitability, the price of finished lots and land must also decrease. We believe that this reduction in single-family home, finished lot and land prices is necessary to correct unfavorable market conditions in select housing markets necessitated for various reasons. These reasons include: oversupply and high inventory levels of unentitled and entitled land and lots, finished and/or new and existing homes; price declines of new and existing homes; slower absorption rates increasing carry and opportunity cost of owning lots and finished home inventories. We further believe that in the short-term, lots and land in many markets in the United States will be sold at reduced prices due to the current oversupply and other temporary negative market factors. Markets where supply currently exceeds demand should return to equilibrium as inventories are reduced. Markets with sound housing fundamentals such as employment, in-migration, increasing household formation and affordability should experience a continued and robust long-term demand for lots and land to facilitate new single-family home starts. For example, we expect that the abandonment and cessation of development activities in overbuilt markets such as Phoenix, Las Vegas and California make it quite possible that, within the next 18 to 30 months, there will be shortages of available residential lots in these markets, which will restore demand and the underlying prices for those lots.
We believe that the long-term demand for single-family residential housing in the United States remains strong. According to a recent article by the Homeownership Alliance, which is a Washington, D.C.-based coalition of more than 15 organizations committed to ensuring support for the American housing system, new single-family home annual starts over the ten year period 2004-2013 are projected to fall in a range from 1,316,000 to 1,628,000 units per year, and new single-family home annual sales during that same period are projected to fall in a range from 970,000 to 1,130,000 units per year.
The National Association of Home Builders forecasts average new single-family home annual starts over the ten year period 2006-2015 to be 1,447,000, ranging from a low of 1,330,000 to a high of 1,507,000, and the average annual new single-family home sales during that same period to be 1,068,000, ranging between 951,000 and 1,117,000 units per year. Long-term demand will be fueled by a growing population, household formation, population migration and immigration. The U.S. Census Bureau forecasts that California, Florida and Texas will account for nearly one-half of the total U.S. population growth between 2000 and 2030 and that the total population of Arizona and Nevada will double during that period. The U.S. Census Bureau projects that between 2000 and 2030 the total populations of Arizona and Nevada will grow from approximately 5 million to over 10.7 million and from approximately 2 million to nearly 4.3 million, respectively; Florida will grow nearly 80% between 2000 and 2030 from nearly 16 million to nearly 28.7 million; Texas population will increase 60% between 2000 and 2030 from nearly 21 million to approximately 33.3 million; and California will grow 37% between 2000 and 2030, from approximately 34 million to nearly 46.5 million.
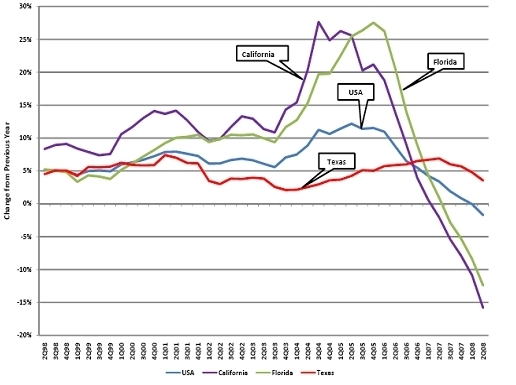
While housing woes beleaguer the national economy, Texas housing markets have held up as some of the best in the country. We believe the Texas markets have remained fairly healthy due to strong demographics, economies and housing affordability ratios. The table below illustrates the recent declines in home price appreciation nationally, as well as in California and Florida, while showing that Texas has not experienced such declines.
10 Year Home Price Appreciation
Source: Office of Federal Housing Enterprise Oversight and Real Estate Center at Texas A&M University
The Office of Federal Housing Enterprise Oversight (“OFHEO”) analyzes the combined mortgage records of Fannie Mae and Freddie Mac, which form the nation’s largest database of conventional, conforming mortgage transactions. OFHEO’s all-transactions house price index tracks average house price changes in repeat sales or refinancing of the same single-family properties and is based on data obtained from Fannie Mae and Freddie Mac for mortgages originated over the past 34 years.
As of September 30, 2008, the great majority of our loans are secured by assets located in Texas. While housing woes beleaguer the national economy, Texas housing markets have held up as some of the best in the country. We believe the Texas markets have remained fairly healthy due to continued strong population and job growth, economies, housing affordability ratios, and home building and development discipline on the part of home builders and developers operating in Texas markets. The National Association of Homebuilders estimates that the median new home prices for 2007 in the metropolitan areas of Austin, Houston, Dallas, San Antonio and Lubbock are $188,025, $204,895, $207,076, $160,764 and $97,199, respectively. These amounts are below the December 2007 national median sales price of new homes sold of $219,500. Using the Department of Housing and Urban Development’s estimated 2007 median family income for the respective metropolitan areas of Austin, Houston, Dallas, San Antonio and Lubbock, the median income earner in those areas has 1.32 times, 1.00 times, 1.08 times, 1.20 times and 1.80 times the income required to qualify for a mortgage to purchase the median priced new home in the respective metropolitan area. Using the U.S. Census Bureau’s income data to project estimated median income for the United States for 2007 of $59,000 and the December 2007 national median sales prices of new homes sold of $219,500, we conclude that the national median income earner has 0.97 times the income required to qualify for a mortgage loan to purchase the median priced new home in the United States. We further conclude that the aforementioned Texas metropolitan areas have new home housing affordability ratios that are 1.03 to 1.86 times the national new home housing affordability ratio. The above housing affordability is determined as the ratio of median family income to the income required to qualify for a 90 percent, 30-year fixed-rate mortgage to purchase the median-priced new home, assuming an annual mortgage insurance premium of 50 basis points for private mortgage insurance and a cost that includes estimated property taxes and insurance for the home.
The United States Department of Labor reports that as of September 2008, Texas led the nation with the largest job gains over the past twelve months with 247,900 new jobs created. This is over 8.7 times greater than the number of jobs created during this period in the nation’s second largest state for job growth, Maryland, and more than 9.8 times the jobs created during this period in the nation’s third largest state for job growth, Colorado. The United States Department of Labor reports that the largest over-the-year percentage increases in employment in the country’s large metropolitan areas were recorded in the four top metropolitan areas of Texas: Austin-Round Rock (+1.9%), Houston-Sugar Land-Baytown, (+2.2%), San Antonio (+2.1%), and Dallas-Fort Worth-Arlington, (+1.8%). The Texas metropolitan areas of Austin, Houston, Dallas, San Antonio and Lubbock experienced, during the last twelve months, the creation of 14,600, 55,700, 54,300, 17,400 and 300 new jobs, respectively.
The United States Census Bureau reported in its 2007 Estimate of Population Change July 1, 2006 to July 1, 2007 that Texas led the country in population growth during that period. The estimate concluded that Texas grew by 496,751 people, or 2.12%, a number which was 1.6 times greater than the next closest state in terms of raw population growth, California, and more than 2.5 times the second closest state in terms of raw population growth, Georgia. The United States Census Bureau also reported that among the 10 counties that added the largest number of residents between July 1, 2006 and July 1, 2007, half were in Texas (Harris (Houston), Tarrant (Fort Worth), Bexar (San Antonio), Collin (North Dallas) and Travis (Austin). On June 28, 2007, the United States Census Bureau reported that Texas’ five major cities – Austin, Houston, San Antonio, Dallas and Fort Worth – were among the top ten in the nation for population growth from 2005 to 2006. San Antonio was second in the nation with a population change of 33,084 from July 1, 2005 to July 1, 2006, Fort Worth was third in the nation with a population change of 30,201 during that period, Houston was fourth in the nation with a population change of 26,554 during that period, Austin was sixth in the nation with population change of 18,630 during that period, and Dallas was eighth in the nation with a population change of 16,676 during that period.
The Fall 2008 U.S. Market Risk Index, a study prepared by PMI Mortgage Insurance Co., the U.S. subsidiary of The PMI Group, Inc., which ranks the nation’s 50 largest metropolitan areas according to the likelihood that home prices will be lower in two years, reported that Texas cities lead the nation in home price stability. The San Francisco-based company recently analyzed housing price trends in 50 U.S. metropolitan areas for its quarterly report, released October 1, 2008. The index also considers the impact of foreclosure rates and excess housing supply and the consequential impact on home prices. The study predicts there is less than a 1% chance that the Dallas/Fort Worth-area, Houston-area, San Antonio-area, and Austin-area home prices will fall during the next two years. All Texas metropolitan areas included in the report are in the Top 12 least likely areas to experience a decline in home prices in two years, of the nation’s 50 largest metropolitan areas. Fort Worth-Arlington, Texas is the nation’s least likely metropolitan area included in the study to see a price decline in the next two years, Dallas-Plano-Irving, Texas is second-least likely, Houston-Sugar Land-Baytown, Texas is third-least likely, San Antonio, Texas is fifth-least likely and Austin, Texas is ninth-least likely.
In sharp contrast to the conditions of other homebuilding markets in the country where unsold housing inventory remains a challenge, in Texas markets, new home sales are greater than new home starts, which indicates that home builders in Texas are focused on maintaining a balance of new home demand and new home supply. Home builders and developers in Texas have remained disciplined on new home construction and project development. New home starts have been declining year-on-year and are outpaced by new home sales in all of our Texas markets where such data is readily available. Inventories of finished new homes and total new housing (finished vacant, under construction and model homes) remain at healthy and balanced levels in all four major Texas markets, Austin, Dallas-Fort Worth, Houston and San Antonio. Each major Texas market is experiencing a rise of finished lot inventories as homebuilders continue to reduce the number of new home starts, with Houston and Austin reaching slightly elevated above equilibrium levels of 30 to 36 months. Though the absolute number of finished lots has not changed much, Dallas-Fort Worth and San Antonio have an estimated inventory of finished lots of approximately 52.8 months and 50.7 months, respectively, which has been the result of a significant decline of new home starts. The Federal Reserve Bank Dallas has stated that although the Texas economy has weakened in the fourth quarter of 2007, the Texas economy “is still quite healthy and stronger than the national economy.”
Austin continues to be one of the strongest homebuilding markets in the country. Annual new home sales in Austin outpace starts 11,903 versus 10,541, with annual new home sales declining year-on-year by approximately 21%. With the decline in housing starts, the Austin new homebuilding market has changed from an area with a very tight lot supply to a market that is now generally balanced. Finished housing inventory and total new housing inventory (finished vacant, under construction and model homes) remain at healthy and balanced levels of 2.3 months and 6.3 months, respectively. The considered equilibrium levels for finished housing inventory and total new housing inventory is 2 to 2.5 months supply and a 6.0 month supply, respectively. Finished lot supplies have edged up to slightly elevated levels of 35.3 months but generally below 30 months for finished lots for the construction of new homes priced below $300,000. A 24-28 month supply is considered equilibrium for finished lot supplies. With the discipline evident in Austin markets, we would expect to see a decline in finished lot inventories in coming quarters as new projects have been significantly reduced. San Antonio is also a healthy homebuilding market. Annual new home sales in San Antonio outpace starts 11,636 versus 9,444, with annual new home sales declining year-on-year by approximately 29%. Finished housing inventory and total new housing inventory remain at healthy levels with a 2.3 month supply and 5.8 month supply, respectively, each within or significantly below the considered equilibrium levels. Finished lot supplies have increased to 50.7 months. Houston is also a healthy homebuilding market. Annual new home sales in Houston outpace starts 34,840 versus 29,032, with annual new home sales declining year-on-year by approximately 22.6%. Finished housing inventory and total new housing inventory have been increasing to a 2.6 month supply and 6.4 month supply, respectively, each slightly above the considered equilibrium level. Finished lot supplies remain at slightly elevated levels of 29.7 months. All numbers are as publicly released by Residential Strategies, Inc. or Metrostudy, leading providers of primary and secondary market information.
The Real Estate Center at Texas A&M University has reported that the sales of existing homes remain healthy in our Texas markets, as well, but the inventory levels are beginning to rise. The number of months of home inventory for sale in Austin, San Antonio, Houston, Dallas, Fort Worth and Lubbock is 6.0 months, 8.0 months, 6.6 months, 6.4 months, 6.0 months, and 5.2 months, respectively. A 6-month supply of inventory is considered a balanced market with more than 6 months of inventory generally being considered a buyer’s market and less than 6 months of inventory generally being considered a seller’s market. As of September 2008, the number of existing homes sold year-to-date in (a) Austin is 18,441, down 18.3% year-on-year; (b) San Antonio is 15,376, down 18.9% year-on-year; (c) Houston is 51,535, down 15.0% year-on-year, (d) Dallas is 39,229, down 14.5% year-on-year, (e) Fort Worth is 7,729, down 14.4% year-on-year, and (f) Lubbock is 2,701, down 1.7% year-on-year.
The Office of Federal Housing Enterprise Oversight (“OFHEO”) reports that Texas had healthy existing home price appreciation between the second quarter of 2007 and the second quarter of 2008 of 3.55%. That same report provides that existing home price appreciation between the second quarter of 2007 and the second quarter of 2008 for (a) Austin is 4.98%, (b) San Antonio is 4.02%, (c) Houston is 4.43%, (d) Dallas is 2.05%, (e) Fort Worth is 3.05%, and (f) Lubbock is 2.61%. The OFHEO tracks average house price changes in repeat sales or refinancing of the same single-family properties utilizing conventional, conforming mortgage transactions.
In managing and understanding the markets and submarkets in which we purchase loans, our advisor and its affiliates monitor the fundamentals of supply and demand. They monitor the economic fundamentals in each of the markets in which we purchase loans, analyzing demographics, household formation, population growth, job growth, migration, immigration and housing affordability. They also monitor movements in home prices and the presence of market disruption activity, such as investor or speculator activity that can create false demand and an oversupply of homes in a market. Further, we study new home starts, new home closings, finished home inventories, finished lot inventories, existing home sales, existing home prices, foreclosures, absorption, prices with respect to new and existing home sales, finished lots and land, and the presence of sales incentives, discounts, or both, in a market.
Outlook
We expect the difficulties and challenges to the housing and mortgage lending marketplace to continue over the next few years. Those conditions could increase delinquencies and credit losses for us above those we have experienced on a historical basis. However, we believe we have established appropriate reserves for such potential increased losses, and we anticipate that our assets will overall produce positive returns. We believe that United Mortgage Trust has been active in monitoring the current crises and in implementing various measures to manage our risk and protect our return on our investments by shifting our portfolio to investments that are less directly sensitive to the adverse market conditions and that produce higher yields and by aggressively liquidating non-performing loans. Based on that assessment, we do not anticipate a significant disruption to our normal business. The repayment of bank debt associated with management’s decision to reduce our investment in interim loans has resulted in a decrease in portfolio leverage and a corresponding decrease in portfolio yield. Further, in accordance with management’s decision to discontinue the purchase of construction loans and aggressively liquidate assets securing construction loans purchased we have increased loss reserves which adversely impact current earnings. Our Advisor is negotiating with lenders to secure credit facilities to support the growth of our land development, lot banking and construction loan portfolios. The decreased earnings resulting from our portfolio shift and related use of leverage is an expected consequence and we believe we will realize improved portfolio performance in the long term as a result of these actions. Nevertheless, our assessments inherently involve predicting future events and we cannot be sure of the length or extent of the current sub-prime and credit crises and if they continue over an extended period of time, or if their severity increases, their impact on the economy as a whole and on the housing and mortgage lending market could cause us to suffer a higher level of delinquencies and losses than we are currently predicting and result in a material adverse impact on our business.
Loan Portfolio Overview
The deterioration in residential mortgage market, specifically the discontinuation of sub-prime and Alt – A products, referred to herein as the sub-prime credit crisis, and the continued slowdown in new home sales are directly and indirectly affecting the ability of our borrowers to sell the assets securing their loans, pay interest due us and repay the loans when due. New and existing home financing solutions are being introduced by both the private and public sectors. Housing inventories are slowly beginning to reduce to sustainable levels. However, consumer confidence remains low. Industry-wide lenders are reevaluating and restructuring credits affected by residential mortgage markets and the housing sales decline. Overall recovery of the single family housing industry is likely to be prolonged. We believe that a pragmatic and pro-active approach to managing our credits will allow us to maximize repayments and properly report asset values. In consideration of the above, we are:
| | · | reducing our investment in interim loans dependent on sub-prime and Alt-A mortgage products for repayment of our loan. We funded 88% fewer loans in the nine-months ended September 30, 2008, compared to the same period in 2007. Interim loan payoffs as a percentage of loans originated during the nine-month periods in 2008 and 2007 were 42% and 100%, respectively. |
| | · | accepting a secured note from UMTHLC for shortfalls from foreclosed properties to enable UMTHLC to efficiently manage past due and foreclosed accounts throughout the duration of the credit crisis. |
| | · | increasing loss reserves for non-recourse interim and construction loans where full collection of the indebtedness is not assured. |
| | · | re-evaluating collateral value on specific loans deemed to be affected by current mortgage and housing environments and reserving for unsecured deficiencies. |
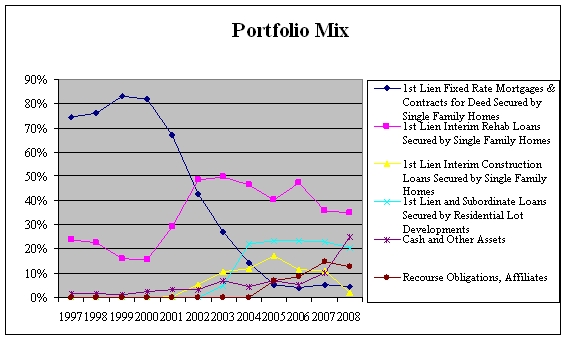
Portfolio Mix
Our portfolio concentrations have shifted during the past decade of investing, and particularly since 2000, as we have sought adequate supplies of suitable loans in a changing real estate finance market. The chart below demonstrates the transition from a portfolio with a concentration on long term, 1st lien single family loans to one comprised primarily of first lien interim loans of 12 months or less in term for the purchase and renovation of single family homes and loans secured by 1st lien and subordinate single family lot development loans. We intend to continue to adapt to changes in the real estate finance market and thus the composition of our loan portfolio is likely to continue to evolve over time based on factors such as interest rates paid under various types of real estate loans, our assessment of the level of risk of the different types of loans, availability of loans, regulatory considerations and other factors.
Mortgage Activity
The following table summarizes our investment portfolio activity for the three and nine months ended September 30, 2008, and September 30, 2007:
| | Three Months Ended September 30, | | Nine Months Ended September 30, |
| | | | | | | | | |
| | | | | | | | |
Interims funded with affiliates | | | | | | | | |
Interims funded with others | | | | | | | | |
| | | | | | | | | |
Number of loans funded with affiliates | | | | | | | | |
Number of loans funded with others | | | | | | | | |
| | | | | | | | |
| | | | | | | | | |
Affiliate interims – payments received | | | | | | | | |
Other interims – payments received | | | | | | | | |
| | | | | | | | | |
Number of affiliated interims | | | | | | | | |
| | | | | | | | |
| | | | | | | | |
| | | | | | | | | |
Average interim mortgage loan funded during year | | | | | | | | |
Remaining term in months: less than | | | | | | | | |
| | | | | | | | |
| | | | | | | | | |
Line of Credit, Affiliate | | | | | | | | |
| | | | | | | | |
| | | | | | | | |
| | | | | | | | |
| | | | | | | | |
| | | | | | | | | |
Lot Banking Transactions (2) | | | | | | | | |
| | | | | | | | |
| | | | | | | | |
| | | | | | | | |
| | | | | | | | |
| | | | | | | | | |
Investment in Trust Receivable | | | | | | | | |
Number purchased from other sources | | | | | | | | |
| | | | | | | | | |
Aggregate principal balance of new loans acquired | | | | | | | | |
Average principal balance | | | | | | | | |
| | | | | | | | |
| | | | | | | | |
(1) These transactions represent new loan fundings and advances made and payments received on existing loans.
(2) These transactions are included in Line of Credit Receivable, Affiliate in the accompanying financial statements.
The following table summarizes our mortgage portfolio as of September 30, 2008 and September 30, 2007:
| | 2008 | | 2007 | |
| | | | |
| Affiliates unpaid principal balance | $41,615,000 | | $66,439,000 | |
Unpaid principal balance others | | | | |
| Total | $44,479,000 | | $78,980,000 | |
| | | | | |
| Interim mortgages, foreclosed | $4,664,000 | | $402,000 | |
| | | | | |
| Number of affiliate interim loans | 347 | | 819 | |
Number of unaffiliated interim loans | | | | |
| | 384 | | 988 | |
| | | | | |
| Average unpaid principal balance (2) | $116,000 | | $80,000 | |
Remaining term in months: less than | | | | |
| Yield on investments | 13.54 | % | 13.03 | % |
| | | | | |
| Line of Credit Receivable, Affiliate | $23,699,000 | | $30,697,000 | |
| | | | |
| Yield on investment | 13.21 | % | 13.86 | % |
| | | | | |
| Lot Banking Transactions (1) | $2,891,000 | | - | |
| | | | |
| Yield on investment | 12.49 | % | - | |
| | | | | |
| Recourse Obligations, Affiliates | | | | |
| | | | |
| Yield on investment | 6.08 | % | 9.96 | % |
| | | | | |
| Residential mortgages and contracts for deed, foreclosed | $245,000 | | - | |
| | | | | |
| Investment in Trust Receivable | | | | |
| | | | |
| Rental properties | - | | 1 | |
Unpaid principal balance loans/properties owned outright | | | | |
| Securitized loans B piece balance | $2,799,000 | | $3,116,000 | |
| | | | |
| Yield on investments | 12.66 | % | 12.95 | % |
| (1) | These transactions are included in Lines of Credit, Affiliate in the accompanying financial statements. |
| (2) | The calculation of average unpaid principal balance is adjusted to reflect the number of additional interim loans associated with the Company’s subordinate investment in UMTHLC loans, whose loan balance is included in the outstanding affiliate unpaid principal balance above. |
The following table illustrates the percentage of our portfolio dedicated to each loan category as of September 30, 2008 and September 30, 2007:
| | |
Interim mortgages with affiliates | | |
Interim mortgages with others | | |
| | |
Recourse obligations with affiliates | | |
Trust receivables – loans owned outright | | |
Trust receivables – securitized “B” piece | | |
Results of Operations
Revenues for the three months ended September 30, 2008, were approximately $2,758,000 compared to approximately $4,410,000 for the comparable period in the prior year. This decrease of approximately $1,652,000 was attributable primarily to decreases in the outstanding balances of interim mortgage loans, the payoff of the UDF line of credit, and a reduction in the interest rate on recourse obligations from 10% to 6% in October 2007. The decrease in interim loans was primarily attributable to a $19,000,000 reduction in loans receivable from UMTH Lending Company as a result of their obtaining third party financing from another lender in October 2007, the proceeds of which were used to pay down their UMT balances. UMT received pay-downs on the UDF line of credit of approximately $7,700,000 in the quarter ended December 31, 2007, approximately $4,750,000 in the quarter ended March 31, 2008, and approximately $18,300,000 in the quarter ended September 30, 2008. Revenues for the nine months ended September 30, 2008, were approximately $8,981,000, compared to approximately $13,239,000 for the comparable period in the prior year. The decline was primarily attributable to the reduction in our interim loan portfolio, UDF line of credit and reduced interest rates on our recourse obligation notes as noted above. Revenues from interim loans accounted for approximately 59% of revenues for the three months ended September 30, 2008 compared to 63% in the same period in the prior year. Revenues from interim loans accounted for 57% of revenues for the nine months ended September 30, 2008, compared to 63% in the same period in the prior year. Our interim mortgage portfolio decreased primarily as a result of our affiliate obtaining third party financing from another lender in October 2007, proceeds from which were used to reduce our outstanding loan balance by approximately $19 million. The remaining decline in our interim portfolio was a function of our intention to reduce our investment in interim construction loans and interim loans secured by modular and manufactured homes and related lots. The affiliate recourse obligation notes were modified in October 2007, to accommodate the anticipated increases in principal balances throughout the remaining liquidation periods of the underlying assets, suspend principal payments through June 2009, and reduce the interest rate from 10% to 6%.
During the three months ended September 30, 2008 and September 30, 2007, approximately 22% and 25%, respectively, of our revenues were derived from lines of credit and lot banking transactions, (these secured loans for the acquisition and development of single-family home lots are referred to as “land development loans” and “lot banking transactions”). Approximately 23% and 25% of our revenues were derived from lines of credit and lot banking transactions during the nine months ended September 30, 2008 and September 30, 2007, respectively. At September 30, 2008, our investment in the lines of credit to our affiliate, UDF, and lot banking transactions was approximately $26.6 million. We anticipate our investment in land development, lot banking and construction loans to increase during the remainder of 2008, as we negotiate a new bank credit facility to accommodate land development, lot banking and construction loans as pledged collateral. We intend to use our line of credit to build this portion of our portfolio.
During the three months ended September 30, 2008 and September 30, 2007, approximately 9% and 8% of our revenues, respectively, were derived from secured promissory notes issued by affiliates as evidence of their accrued obligations to reimburse UMT for any defaulted loans that we acquire from them, which notes we refer to as “Recourse Obligations.” During the nine months ended September 30, 2008 and September 30, 2007, approximately 8% of our revenues were derived from secured promissory notes issued by affiliates. As noted above, the Recourse Obligations were modified during October 2007 to reflect current market conditions. Such modifications included but were not limited to a reduction in the interest rate on these notes.
The Secured Notes require the originating company to make certain interest and principal payments, as defined by the agreements. Further, these notes are liquidated by any distributions paid to the originating company with respect to the pledged Class C units of UMTH. UMTH has guaranteed the obligations of CRG, SCMI and RAFC under the Secured Notes up to the maximum loan amounts defined in the respective notes. The sub-prime credit crisis, as well as the decline in new home sales, have indirectly adversely affected the earnings of UMTH which, in turn, is expected to have an adverse effect on the distributions associated with the security pledged on the Recourse Obligations. The Company monitors the value of the security pledged by the originating companies and will consider further modifications to the Recourse Obligations notes to allow UMTH to structure payments under the Recourse Obligations in relation to its earnings, as impacted by the mortgage market and new home sales environments. Any such modifications would be very likely to result in a decline in the return being realized by the Company under the Recourse Obligation notes.
Operating Expenses for the three months ended September 30, 2008 and September 30, 2007 were approximately $821,000 and $1,941,000 respectively. Operating expenses for the nine months ended September 30, 2008 and 2007 were approximately $3,440,000 and $4,254,000, respectively. These decreases from prior periods are primarily due to lower interest expense as a result of the Company’s pay-off of its line of credit with a bank in November 2007. This was partially offset by additional provisions for loan loss expense of $1,000,000 in June 2008. The additional provision is a consequence of management’s decision to aggressively liquidate assets and assess the collectability of certain loans. Other fluctuations in operating expense line items are discussed below for the three and nine month periods ended September 30, 2008:
Trust administration fees - $266,000 and $254,000 (a 5% increase) between the comparable three month periods ended September 30, 2008 and 2007, respectively, and $812,000 and $625,000 (a 30% increase) between the comparable nine-month periods ended September 30, 2008 and 2007, respectively. Upon execution of the Company’s advisory agreement in August 2006, the Advisor agreed to pay the Company $500,000 over a twelve-month period as consideration for obtaining the advisory services agreement. This consideration was recorded as a reduction of trust administration fees when received. The 2007 expense, as reported, is net of this consideration which was fully paid in July 2007.
General and administrative expenses - $293,000 and $204,000 (a 44% increase) between the comparable three month periods ended September 30, 2008 and 2007, respectively, and $853,000 and $695,000 (a 23% increase) between the comparable nine-month periods ended September 30, 2008 2007, respectively. The increase was primarily due to $137,000 increase in expense related to the maintenance of foreclosed properties, as well as $73,000 in contract labor to manage and sell foreclosed properties.
Interest expense - $0 and $547,000 for the three month periods ended September 30, 2008 and 2007, respectively, and $0 and $1,786,000 for the nine months ended September 30, 2008 and 2007, respectively. As noted above, the Company’s line of credit matured during November 2007 and was paid in full. The Company currently does not have any interest bearing debt outstanding. Management is currently negotiating with a bank to replace the line of credit with similar or more favorable terms.
Provision for loan losses - We recorded a provision for loan losses for the three months ended September 30, 2008 and September 30, 2007 of $260,000 and $934,000 respectively. For the nine months ended September 30, 2008 and September 30, 2007, we recorded a provision for loan losses of approximately $1,770,000 and $1,141,000 respectively. We realized loan losses of approximately $350,000 and $1,837,000 during the comparable nine-month periods of 2008 and 2007, respectively. Loss reserves are estimates of future losses based on historical default rates and estimated losses on the sale of real estate owned and expectations of future economic conditions and activity. The Company continually re-evaluates collateral value on specific loans deemed to be affected by current mortgage and housing environments and intends to establish reserves for any expected deficiencies that are not otherwise secured. From inception through September 30, 2008, we have acquired approximately $742 million of loans. We have recorded losses approximating 1.2% of those assets to date. We anticipate loan losses to continue, primarily in our long-term and construction loan portfolio, and therefore continue to assess the adequacy of our loan loss reserve.
Net income was approximately $1,937,000 and $2,470,000 for the three months ended September 30, 2008 and 2007, respectively. Net income was approximately $5,542,000 and $8,986,000 for the nine months ended September 30, 2008 and 2007, respectively. Earnings per share of beneficial interest for the three months ended September 30, 2008 and 2007 were $0.30 and $0.36 per share respectively. Earnings per share of beneficial interest for the nine months ended September, 2008 and 2007 were $0.84 and $1.31 per share, respectively.
Distributions, per share, to shareholders were $0.30 and $0.37 per share for the three months ended September 30, 2008 and 2007, respectively and $1.05 and $1.09 per share for the nine months ended September 30, 2008 and 2007, respectively.
CAPITAL RESOURCES AND LIQUIDITY FOR THE NINE MONTHS ENDED SEPTEMBER 30, 2008 AND 2007
Our sources of funds for liquidity consist of our dividend reinvestment plan, repayments of principal on our loans made to purchase mortgage investments, and bank lines of credit. The table below summarizes our liquidity sources for the nine-month periods ended September 30, 2008 and September 30, 2007:
| | | | | |
| | | | |
Dividend reinvestment proceeds | | | | |
Number of shares returned to treasury | | | | |
Value of shares repurchased | | | | |
Principal receipts (payments): | | | | |
Residential mortgages and contracts for deed | | | | |
| | | | |
Net borrowings – bank line of credit | | | | |
Payments received under line of credit, affiliate | | | | |
We are not currently offering shares in the public markets except to existing shareholders through our dividend reinvestment plan. In July 2006, we registered an additional 1,000,000 shares to be offered through our dividend reinvestment plan.
Shares issued in the aggregate, as of September 30, 2008 and 2007 were 8,198,572 and 8,079,111, respectively. Shares retired to treasury through our share redemption plan in the aggregate were 1,702,757 and 1,357,174 through September 30, 2008 and 2007, respectively. Total shares outstanding were 6,495,815 and 6,721,937, at September 30, 2008 and 2007, respectively. As of September 30, 2008, inception to date gross offering proceeds from all public offerings were approximately $163,771,000 and net proceeds after fees, marketing reallowance and commissions were approximately $145,442,000.
Through November 2007, the Company had a line of credit with a bank which was collateralized by certain interim mortgages, construction loans and land development loans. Interest on the outstanding balance accrued at prime plus 0.5% per annum, and allowed for maximum borrowings up to $30 million. This credit facility expired at its maturity date in November 2007 and was paid in full. Management is currently negotiating with a lender for a new credit facility at similar or more favorable terms. There is no assurance that we will be successful in negotiating a new credit facility.
Critical Accounting Policies and Estimates
We prepare our financial statements in accordance with GAAP. The preparation of consolidated financial statements requires us to make estimates and judgments that affect the reported amounts of assets, liabilities, revenues and expenses, and related disclosure of contingent assets and liabilities. On an on-going basis, we evaluate our estimates, including those related to accrual of interest income, loan loss reserves and valuation of foreclosed properties. We base our estimates on historical experience and on various other assumptions that are believed to be reasonable under the circumstances, the results of which form the basis for making judgments about the carrying values of assets and liabilities that are not readily apparent from other sources. Actual results may differ from these estimates under different assumptions or conditions.
Significant accounting policies are described in the audited consolidated financial statements and notes thereto included in our Annual Report on Form 10-K for the year ended December 31, 2007. The following critical accounting policies affect our more significant judgments and estimates used in the preparation of our consolidated financial statements:
Interest is accrued monthly on outstanding principal balances. Payments are either received monthly for interest or at payoff. Any deficiencies in unpaid interest are either charged off to the reserve for loan losses or charged against the related recourse obligations.
We maintain a reserve for loan losses for estimated losses resulting from the inability of our borrowers to make required payments resulting in property foreclosure and losses from the sale of foreclosed property. If the financial condition of our borrowers was to deteriorate, resulting in an impairment of their ability to make payments or, if the market value of the properties securing our loans decreases additional reserves may be required.
We record foreclosed properties at an estimated net realizable value based on our assessment of real estate market conditions and historical discount percentages on the sale of foreclosed properties. Should market conditions deteriorate or loss percentages increase, additional valuation adjustments may be required.
ITEM 3. QUANTITATIVE AND QUALITATIVE DISCLOSURES ABOUT MARKET RISK
In prior periods, we were exposed to interest rate changes primarily as a result of the method by which our bank credit facility is calculated at 1/2% over bank prime lending rate. Management anticipates we will have similar interest rate exposure with our new credit facilities, when consummated, as they will most likely have variable interest rates associated with them.
We provide a line of credit to UDF. UDF is a real estate finance limited partnership which derives a substantial portion of its income by originating, purchasing, participating in and holding for investment mortgage loans made directly by UDF to persons and entities for the acquisition and development of real property as single-family residential lots that will be marketed and sold to home builders. Changes in interest rates may impact both demand for UDF’s real estate finance products and the rate of interest on the loans UDF makes. In most instances, the loans UDF will make will be junior in the right of repayment to senior lenders who will provide loans representing 70% to 80% of total project costs. As senior lender interest rates available to our borrowers increase, demand for our mortgage loans may decrease, and vice versa.
Developers to whom UDF makes mortgage loans use the proceeds of such loans to develop raw real estate into residential home lots. The developers obtain the money to repay these development loans by selling the residential home lots to home builders or individuals who will build single-family residences on the lots, and by obtaining replacement financing from other lenders. If interest rates increase, the demand for single-family residences may decrease. Also, if mortgage financing underwriting criteria become more strict, demand for single-family residences may decrease. In such an interest rate and/or mortgage financing climate, developers may be unable to generate sufficient income from the resale of single-family residential lots to repay loans from UDF, and developers’ costs of funds obtained from lenders in addition to us may increase, as well. Accordingly, increases in single-family mortgage interest rates or decreases in the availability of mortgage financing could increase the number of defaults on development loans made by UDF, and correspondingly impact UDF’s ability to make payments under its line of credit.
ITEM 4. CONTROLS AND PROCEDURES
Evaluation of Disclosure Controls and Procedures
An evaluation was performed by the Company’s management, consisting of the individual who serves as our Chief Executive Officer and Chief Financial Officer, of the effectiveness of the Company’s disclosure controls and procedures (as defined in Rule 13a-15(e) under the Securities Exchange Act of 1934) as of September 30, 2008. Based on such evaluation, management has concluded that, as of the end of such period, the Company’s disclosure controls and procedures are effective.
The Company does not control the financial reporting process, and is solely dependent on UMTHGS, its Advisor, who is responsible for providing the Company with financial statements in accordance with generally accepted accounting principles in the United States. The Advisor’s disclosure controls and procedures were effective to provide reasonable assurance regarding the reliability of financial reporting and the preparation of financial statements for external purposes in accordance with accounting principles generally accepted in the United States.
Management’s Report on Internal Control Over Financial Reporting
The management of UMTHGS, the Company’s Advisor, is responsible for establishing and maintaining adequate internal control over the Company’s financial reporting, as such term is defined in Exchange Act Rule 13a-15(f). Because of its inherent limitations, internal control over financial reporting may not prevent or detect misstatements. Also, projections of any evaluation of effectiveness to future periods are subject to risk that controls may become inadequate because of changes in conditions, or that the degree of compliance with the policies or procedures may deteriorate.
An evaluation was conducted under the supervision of management, and with the participation of the Advisor’s management, of the effectiveness of the Company’s disclosure controls and procedures (as defined in Rule 13a-15(e) and 15d-15(e) under the Securities Exchange Act of 1934). Based upon that evaluation, management concluded that the Company’s disclosure controls and procedures were effective as of September 30, 2008. There has been no change in the Company’s internal control over financial reporting that occurred during the nine months ended September 30, 2008, that has materially affected, or is reasonably likely to materially affect, the Company’s internal control over financial reporting.
The Company was a “non-accelerated filer” for the 2007 fiscal year and will be a “smaller reporting company filer” in the 2008 fiscal year. Accordingly, the Company’s independent registered public accounting firm will be required to issue an initial audit report on the Company’s internal control over financial reporting for the 2009 fiscal year.
Changes in Internal Controls Over Financial Reporting
There have been no changes in the Company’s internal control over financial reporting that occurred during the third fiscal quarter of 2008, that have materially affected, or are reasonably likely to materially affect, the Company’s internal control over financial reporting.
PART II - OTHER INFORMATION
ITEM 1. LEGAL PROCEEDINGS
None.
ITEM 2. UNREGISTERED SALES OF EQUITY SECURITIES AND USE OF PROCEEDS
There is currently no established public trading market for our shares. As an alternative means of providing limited liquidity for our shareholders, we maintain a share redemption plan (“SRP”).
Under our SRP, shareholders who have held the shares for at least one year are eligible to request that we repurchase their shares. In any consecutive 12 month period we may not repurchase more than 5% of the outstanding shares at the beginning of the 12 month period. The repurchase price is based on the value of our assets less our obligations or a fixed pricing schedule, as determined by the trustees' business judgment based on our book value, operations to date and general market and economic conditions and may not, in any event, exceed any current public offering price. We have also purchased a limited number of shares outside of our SRP from shareholders with special hardship considerations.
Share repurchases have been at prices between NAV, which is calculated and adjusted as necessary on a quarterly basis, and $20 per share. Shares repurchased at the lower price were 1) shares held by shareholders for less than 12 months or 2) shares purchased outside of our SRP.
The following table sets forth information relating to shares of beneficial interest repurchased into treasury during the period covered by this report.
| Total number of shares repurchased | | Total number of shares purchased as part of a publicly announced plan | Total number of shares purchased outside of plan |
| | | | |
| | | | |
| | | | |
| | | | |
| | | | |
| | | | |
| | | | |
| | | | |
| | | | |
| | | | |
ITEM 3. DEFAULTS UPON SENIOR SECURITIES
Not applicable.
ITEM 4. SUBMISSION OF MATTERS TO A VOTE OF SECURITY HOLDERS
None.
ITEM 5. OTHER INFORMATION
None.
ITEM 6. EXHIBITS
| | Exhibit 31.1 Certification of Chief Executive Officer pursuant to Section 302 of the Sarbanes-Oxley Act of 2002 |
| | Exhibit 31.2 Certification of Chief Executive Officer pursuant to Section 906 of the Sarbanes-Oxley Act of 2002 |
| | Exhibit 10.1 Economic Interest Participation Agreement and Purchase Option between United Mortgage Trust and UDF III dated September 19, 2008 |
| | Exhibit 10.2 Participation Agreement between United Mortgage Trust and UDF III dated September 30, 2008 |
SIGNATURE
Pursuant to the requirements of Section 13 or 15(d) of the Securities Exchange Act of 1934, the Registrant has duly caused this report to be signed on their behalf by the undersigned, thereunto duly authorized.
| | | |
| | |
| | |
| | |
| | President, Chief Executive Officer and Chief Financial Officer |