UNITED STATES
SECURITIES AND EXCHANGE COMMISSION
Washington, D.C. 20549
FORM 10-Q
[ x ] QUARTERLY REPORT PURSUANT TO SECTION 13 OR 15(d) OF
THE SECURITIES EXCHANGE ACT OF 1934
For the quarterly period ended June 30, 2009
[ ] TRANSITION REPORT PURSUANT TO SECTION 13 OR 15(d) OF
THE SECURITIES EXCHANGE ACT OF 1934
For the transition period from _________ to _________
Commission file number: 000-32409
UNITED MORTGAGE TRUST
(Exact name of registrant as specified in its charter)
| Maryland | 75-6493585 |
| (State or other jurisdiction of incorporation or organization) | (I.R.S. Employer Identification No.) |
1301 Municipal Way, Suite 220
Grapevine, Texas 76051
(Address of principal executive offices)(Zip Code)
(214) 237-9305
(Registrant’s telephone number, including area code)
Indicate by check mark whether the registrant (1) has filed all reports required to be filed by Section 13 or 15(d) of the Securities Exchange Act of 1934 during the preceding 12 months (or for such shorter period that the registrant was required to file such reports), and (2) has been subject to such filing requirements for the past 90 days. Yes X No ___
Indicate by check mark whether the registrant is a large accelerated filer, an accelerated filer, a non-accelerated filer, or a smaller reporting company. See the definitions of “large accelerated filer,” “accelerated filer” and “smaller reporting company” in Rule 12b-2 of the Exchange Act
Large accelerated filer___ Accelerated filer____ Non-accelerated filer (Do not check if a smaller reporting company)
X Smaller Reporting Company
Indicate by check mark whether the registrant has submitted electronically and posted to its corporate Web site, if any, every Interactive Data File required to be submitted and posted pursuant to Rule 405 of Regulation S-T (Section 232.405 of this chapter during the preceding 12 months (or for such shorter period that the registrant was required to submit and post such files). Yes[X] No [_]
Indicate by check mark whether the registrant is a shell company (as defined in Rule 12b-2 of the Exchange Act) Yes No X
The number of shares outstanding of the Registrant’s shares of beneficial interest, par value $0.01 per share, as of the close of business on August 14, 2009 was 6,415,626.
UNITED MORTGAGE TRUST
INDEX
PART I - FINANCIAL INFORMATION
| | | Page |
| ITEM 1. | Financial Statements | |
| | | |
| | Consolidated Balance Sheets as of June 30, 2009 (unaudited) and December 31, 2008 | 3 |
| | Consolidated Statements of Income for the three months and six months ended June 30, 2009 and June 30, 2008 (unaudited) | 4 |
| | Consolidated Statements of Cash Flows for the six months ended June 30, 2009 and June 30, 2008 (unaudited) | 5 |
| | Notes to Consolidated Financial Statements (unaudited) | 6 |
| | | |
| ITEM 2. | Management’s Discussion and Analysis of Financial Condition and Results of Operations | 14 |
| ITEM 3. | Quantitative and Qualitative Disclosures about Market Risk | 24 |
| ITEM 4. | Controls and Procedures | 25 |
| |
| PART II - OTHER INFORMATION |
| | | |
| ITEM 1. | Legal Proceedings | 25 |
| ITEM 2. | Unregistered Sales of Equity Securities and Use of Proceeds | 25 |
| ITEM 3. | Defaults Upon Senior Securities | 26 |
| ITEM 4. | Submission of Matters to a Vote of Security Holders | 26 |
| ITEM 5. | Other Information | 26 |
| ITEM 6. | Exhibits | 27 |
| | Signatures | 28 |
UNITED MORTGAGE TRUST
CONSOLIDATED BALANCE SHEETS
| | | | | | |
| | | | | | |
| | | | | |
Cash and cash equivalents | $ | | $ | | |
| | | | | | |
| | | | | |
Investment in trust receivable | | | | | |
Interim mortgages, affiliates | | | | | |
| | | | | |
Allowance for loan losses | | | ) | | |
Total mortgage investments | | | | | |
| | | | | | |
Line of credit receivable, affiliate | | | | | |
Line of credit receivable, non-affiliate | | | | | |
Accrued interest receivable | | | | | |
Accrued interest receivable, affiliate | | | | | |
Recourse obligations, affiliates | | | | | |
Residential mortgages and contracts for deed foreclosed | | | | | |
Interim mortgages foreclosed | | | | | |
| | | | | |
Deficiency note, affiliate | | | | | |
Allowance for loan losses – deficiency notes | | | | | |
| | | | | |
| $ | | $ | | |
| | | | | | |
Liabilities and Shareholders’ Equity | | | | | |
| | | | | |
| $ | | $ | | |
Accounts payable and accrued liabilities | | | | | |
Participation payable, affiliate | | | | | |
| | | | | |
| | | | | | |
Commitments and contingencies | | | | | |
| | | | | | |
| | | | | |
Shares of beneficial interest; $0.01 par value; 100,000,000 shares authorized; 8,245,906 and 8,218,591 shares issued in 2009 and 2008, respectively; and 6,418,725 and 6,436,569 outstanding in 2009 and 2008, respectively | | | | | |
Additional paid-in capital | | | | | |
| | | | | |
Cumulative distributions in excess of earnings | | | | | |
| | | | | | |
Less treasury stock of 1,827,181 and 1,782,022 shares in 2009 and 2008, respectively, at cost | | | ) | | ) |
Total shareholders' equity | | | | | |
Total liabilities and shareholders' equity | $ | | $ | | |
See accompanying notes to consolidated financial statements.
UNITED MORTGAGE TRUST
CONSOLIDATED STATEMENTS OF INCOME
(unaudited)
| | | Three Months Ended June 30, | | Six Months Ended June 30, |
| | | | | | | | | |
| | | | | |
Interest income, affiliates | | | | | | | | | |
Interest income, non-affiliates | | | | | | | | | |
| | | | | | | | | | |
| | | | | | | | | |
| | | | | | | | | |
| | | | | | | | | |
General and administrative | | | | | | | | | |
Provision for loan losses | | | | | | | | | |
| | | | | | | | | |
| | | | | | | | | | |
| | | | | | | | | | |
| | | | | | | | | |
| | | | | | | | | | |
Net income per share of beneficial interest | | | | | | | | | |
| | | | | | | | | | |
Weighted average shares outstanding | | | | | | | | | |
| | | | | | | | | | |
Distributions per weighted share outstanding | | | | | | | | | |
See accompanying notes to consolidated financial statements.
UNITED MORTGAGE TRUST
CONSOLIDATED STATEMENTS OF CASH FLOWS
(unaudited)
| | | Six Months Ended June 30, | |
| | | 2009 | | 2008 | |
| | | | | |
| $ | | $ | | |
Adjustments to reconcile net income to net cash provided | | | | | |
| | | | | |
Provision for loan losses | | | | | |
Depreciation and amortization | | | | | |
Changes in assets and liabilities: | | | | | |
Accrued interest receivable | | | ) | | ) |
| | | | | |
Accounts payable and accrued liabilities | | | ) | | |
Net cash provided by operating activities | | | | | |
| | | | | | |
| | | | | |
Investment in trust receivable | | | ) | | ) |
Principal receipts on trust receivable | | | | | |
Investment in interim mortgages | | | ) | | ) |
Principal receipts on interim mortgages | | | | | |
Investments in interim mortgages, affiliates | | | ) | | ) |
Principal receipts on interim mortgages, affiliates | | | | | |
Principal receipts on residential mortgages and contracts for deed | | | | | |
Principal receipts on line of credit receivable, affiliate, net | | | | | |
Investments in line of credit receivable, non-affiliate, net | | | ) | | |
Principal receipts from recourse obligations | | | | | |
Net cash provided by investing activities | | | ) | | |
| | | | | | |
| | | | | |
Proceeds from issuance of shares of beneficial interest | | | | | |
Purchase of treasury stock | | | ) | | ) |
| | | ) | | ) |
Net cash used in financing activities | | | ) | | ) |
| | | | | | |
Net decrease in cash and cash equivalents | | | ) | | ) |
Cash and cash equivalents at beginning of period | | | | | |
Cash and cash equivalents at end of period | $ | | $ | | |
| | | | | | |
Supplemental Disclosure of Cash Flow Information | | | | | |
Transfers of affiliate and non-affiliate loans to foreclosed properties or recourse obligations | | | | | |
Participation receivable, affiliate | | | ) | | |
Participation payable, affiliate | | | | | |
Participation accrued interest receivable, affiliate | | | ) | | |
Participation accrued interest payable, affiliate | | | | | |
See accompanying notes to consolidated financial statements.
UNITED MORTGAGE TRUST
NOTES TO CONSOLIDATED FINANCIAL STATEMENTS
(unaudited)
United Mortgage Trust (the “Company” and “UMT”) is a Maryland real estate investment trust that qualifies as a real estate investment trust (a “REIT”) under federal income tax laws. The Company’s principal investment objectives are to invest proceeds from its dividend reinvestment plan, financing proceeds, capital transaction proceeds and retained earnings in the following types of investments: (i) first lien secured interim mortgage loans with initial terms of 12 months or less for the acquisition and renovation of single-family homes, which we refer to as “Interim Loans”; (ii) secured, line of credit to UMTH Lending Company, L.P. for origination of Interim Loans; (iii) lines of credit and secured loans for the acquisition and development of single-family home lots, referred to as “Land Development Loans”; (iv) lines of credit and loans secured by entitled and developed single-family lots, referred to as “Finished Lot Loans”; (v) lines of credit and loans secured by completed model homes, referred to as “Model Home Loans”; (vi) loans provided to entities that have recently filed for bankruptcy protection under Chapter 11 of the U.S. bankruptcy code, secured by a priority lien over pre-bankruptcy secured creditors, referred to as “Debtor in Possession Loans”, (vii) lines of credit and loans, with terms of 18 months or less, secured by single family lots and homes constructed thereon, referred to as “Construction Loans”; (viii) first lien secured mortgage loans with terms of 12 to 360 months for the acquisition of single-family homes, referred to as “Residential Mortgages”, and, (ix) discounted cash flows secured by assessments on real property. We collectively refer the above listed loans as “Mortgage Investments”. Additionally, our portfolio includes obligations of affiliates of our Advisor, which we refer to as “recourse loans.”
The Company has no employees. The Company pays a monthly trust administration fee to UMTH General Services, L.P. (“UMTHGS” or “Advisor”), a subsidiary of UMT Holdings, L.P. (“UMTH”), a Delaware real estate finance company and affiliate, for the services relating to its daily operations. The Company’s offices are located in Grapevine, Texas.
These financial statements have been prepared in accordance with generally accepted accounting principles (“GAAP”) for interim financial information and with the instructions for Form 10-Q and Article 10 of Regulation S-X. Accordingly, they do not include all of the information and footnotes required by GAAP for complete financial statements. In the opinion of management, all adjustments (consisting of normal recurring adjustments) considered necessary for a fair presentation have been included. Operating results for the six months ended June 30, 2009, are not necessarily indicative of the results that may be expected for the year ended December 31, 2009. Certain prior period amounts have been reclassified to conform to current period presentation. For further information, refer to the consolidated financial statements and footnotes thereto included in our Annual Report on Form 10-K for the year ended December 31, 2008.
| 3. | Impact of Recently Issued Accounting Standards |
In September 2006, the Financial Accounting Standards Board (“FASB”) issued SFAS No. 157, Fair Value Measurements (“SFAS 157”). SFAS 157 defines fair value, establishes a market-based framework or hierarchy for measuring fair value, and expands disclosures about fair value measurements. SFAS 157 is applicable whenever another accounting pronouncement requires or permits assets and liabilities to be measured at fair value. SFAS 157 does not expand or require any new fair value measures; however the application of this statement may change current practice. The requirements of SFAS 157 are first effective for the Company for the fiscal year beginning January 1, 2008. However, in February 2008, the FASB issued FASB Staff Position (“FSP”) 157-2, Effective Date of FASB Statement No. 157 (“FSP 157-2”). FSP 157-2 delays the effective date of SFAS 157 for all nonfinancial assets and nonfinancial liabilities, except for items that are recognized or disclosed at fair value in the financial statements on a recurring basis (at least annually), until the beginning of the first quarter 2009. Accordingly, the Company’s adoption of this standard on January 1, 2008 was limited to financial assets and liabilities. The Company’s adoption of SFAS 157 as of January 1, 2009, has not had a material impact on the Company’s financial condition or results of operations.
In February 2007, FASB issued SFAS No. 159, “The Fair Value Option for Financial Assets and Financial Liabilities Including an Amendment of FASB Statement No. 115.” The fair value option permits entities to choose to measure eligible financial instruments at fair value at specified election dates. The entity will report unrealized gains and losses on the items on which it has elected the fair value option in earnings. SFAS 159 is effective beginning in fiscal year 2008. The adoption of FAS 159 did not have a material impact on the Company’s financial position or results of operations.
In December 2007, the FASB issued Statement No. 141R, Business Combinations (“SFAS 141”), and Statement No. 160, Non-controlling Interests in Consolidated Financial Statements, an amendment of ARB No. 51 (“SFAS 160”). SFAS 141R modifies the accounting and disclosure requirements for business combinations and broadens the scope of the previous standard to apply to all transactions in which one entity obtains control over another business. SFAS 160 establishes new accounting and reporting standards for non-controlling interests in subsidiaries. The Company was required to apply the provisions of the new standards in the first quarter of 2009. Early adoption was not permitted for these new standards. The adoption of SFAS 141R and SFAS 160 did not have a material impact on the Company’s financial position or results from operations.
In March 2008, the FASB issued SFAS No. 161, Disclosures about Derivative Instruments and Hedging Activities, an Amendment of FASB Statement No. 133. SFAS No. 161 amends SFAS No. 133 and requires entities to enhance their disclosures about (a) how and why an entity uses derivative instruments, (b) how derivative instruments and related hedged items are accounted for under SFAS No. 133 and its related interpretations, and (c) how derivative instruments and related hedged items affect an entity’s financial position, financial performance, and cash flows. SFAS No. 161 is effective for fiscal years beginning on or after November 15, 2008. The adoption of SFAS No. 161 has not had a material impact on the Company’s financial position or results of operations.
On October 10, 2008, the FASB issued FSP 157-3 (“FSP 157-3”), Determining the Fair Value of a Financial Asset When the Market for that Asset Is Not Active. FSP 157-3 clarifies the application of Statement 157 in a market that is not active and provides an example to illustrate key considerations in determining the fair value of a financial asset when the market for the financial asset is not active. FSP 157-3 was effective upon issuance, including prior periods for which financial statements have not been issued. The adoption of FSP 157-3 did not have a material impact on the Company’s financial position or results of operations.
4. Deficiency Notes – Affiliate and Non-Affiliate
The Company has made loans in the normal course of business to affiliates and non-affiliates, the proceeds from which have been used to originate underlying loans that are pledged to the Company as security for such obligations. When principal and interest on an underlying loan is due in full, at maturity or otherwise, the corresponding obligation owed by the originating company to the Company is also due in full. If the borrower or the Company foreclosed on property securing an underlying loan, or if the Company foreclosed on property securing a purchased loan, and the proceeds from the sale were insufficient to pay the loan in full, the originating company had the option of (1) repaying the outstanding balance owed to the Company associated with the underlying loan or purchased loan, as the case may be, or (2) delivering to the Company an unsecured deficiency note in the amount of the deficiency.
As of June 30, 2009 and December 31, 2008, the Company had two deficiency notes with non-affiliates in the amount of approximately $7,167,000 and $6,981,000, respectively. One note in the amount of approximately $1,726,000 at June 30, 2009 and December 31, 2008, bears interest at a rate of 14% per annum. The second note in the amount of approximately $5,441,000 and $5,255,000 at June 30, 2009 and December 31, 2008, respectively, does not accrue interest as the underlying collateral approximates the note balance.
As of December 31, 2007, UMTH Land Development, L.P.(“UMTHLC”) issued to the Company a variable amount promissory note in the amount of $5,100,000 to evidence its deficiency obligations to the Company. The initial principal amount of the note was approximately $1,848,000. The principal balance will fluctuate from time to time based on the underlying loan activity and the amount of deficiencies realized by the affiliate. The note bears interest at a rate of 10%, and requires monthly principal and interest payments based on a ten-year amortization for the outstanding principal balance. The note is secured by a limited guaranty by UMTHGS, the Advisor, equal to a monthly amount not to exceed 33% of the advisory fee received by UMTHGS under the terms of its advisory agreement with the Company. This note had a balance of approximately $6,532,000 and $5,332,000 at June 30, 2009 and December 31, 2008, respectively.
5. Related Party Transactions
1) UMTH is a Delaware limited partnership which is in the real estate finance business. UMTH holds a 99.9% limited partnership interest in UMTH Lending Company, L.P., which originates interim loans that the Company is assigned, UMTH Land Development, L.P., which holds a 50% profit interest in United Development Funding, L.P. (“UDF”) and acts as UDF's asset manager, and Prospect Service Corp. (“PSC”), which services the Company’s residential mortgages and contracts for deed and manages the Company’s REO. In addition, UMTH has a limited guarantee of the obligations of Capital Reserve Group (“CRG”), Ready America Funding Corp (“RAFC”), and South Central Mortgage, Incorporated (“SCMI”), a Texas corporation that sold mortgage investments to the Company, under the Secured Notes. United Development Funding III, L.P., (“UDF III”) which is managed by UMTH Land Development, L.P., has previously provided a limited guarantee of the UDF line of credit. The Company’s President, Christine “Cricket” Griffin, is a partner of UMTH.
2) UMTHLC is a Delaware limited partnership, and subsidiary of UMTH. The Company loans money to UMTHLC so it can make loans to its borrowers. The loans are collaterally assigned to the Company, as security for the promissory note between UMTHLC and the Company. The unpaid principal balance of the loans at June 30, 2009 and December 31, 2008 was approximately $18,199,000 and $18,195,000, respectively. UMTH Land Development, L.P. (“UMTHLD”) is a Delaware limited partnership and subsidiary of UMTH.
On March 26, 2009, the Company executed a secured line of credit promissory note with UMTH Lending, Company, L.P. in the amount of $8,000,000. The note bears interest at 12.50% per annum, matures on March 26, 2012 and is secured by first lien mortgage interests in single family residential properties. At June 30, 2009, the outstanding balance on this line of credit was approximately $6,828,000.
3) RAFC is a Texas corporation that is 50% owned by SCMI, which is owned by Todd Etter. RAFC is in the business of financing interim loans for the purchase of land and the construction of modular and manufactured single-family homes placed on the land by real estate investors. The Company continues to directly fund obligations under one existing RAFC loan, which was collaterally assigned to the Company, but does not fund new originations. The unpaid principal balance of the loans at June 30, 2009 and December 31, 2008 was approximately $23,698,000 and $23,380,000, respectively.
4) Wonder Funding, LP (“Wonder”) is a Delaware limited partnership that is owned by Ready Mortgage Corp. (“RMC”). RMC is beneficially owned by Craig Pettit, a partner of UMTH and the sole proprietor of two companies that own 50% of RAFC. Wonder is in the business of financing interim loans for the purchase of land and the construction of single family homes. The Company has ceased funding any new originations. As of June 30, 2009 and December 31, 2008, respectively, all remaining obligations owed by Wonder to the Company are included in the recourse obligations discussed below.
5) Recourse Obligations. The Company has made recourse loans to (a) CRG, which is owned by Todd Etter and William Lowe, (b) RAFC, which is owned by SCMI and two companies owned by Craig Pettit, Eastern Intercorp, Inc. and Ready Mortgage Corp. (“RMC”), and (c) SCMI, which is owned by Todd Etter, (these companies are referred to as the "originating companies"). In addition to the originating companies discussed above, the Company made loans with recourse to Wonder. Each of these entities used the proceeds from such loans to originate loans, that are referred to as "underlying loans," that are pledged to the Company as security for such originating company's obligations to the Company. When principal and interest on an underlying loan are due in full, at maturity or otherwise, the corresponding obligation owed by the originating company to the Company is also due in full.
In addition, some of the originating companies have sold loans to the Company, referred to as the "purchased loans," and entered into recourse agreements under which the originating company agreed to repay certain losses the Company incurred with respect to purchased loans.
If the originating company forecloses on property securing an underlying loan, or the Company forecloses on property securing a purchased loan, and the proceeds from the sale are insufficient to pay the loan in full, the originating company has the option of (1) repaying the outstanding balance owed to the Company associated with the underlying loan or purchased loan, as the case may be, or (2) delivering an unsecured deficiency note in the amount of the deficiency to the Company.
On March 30, 2006, but effective December 31, 2005, the Company and each originating company agreed to consolidate (1) all outstanding amounts owed by such originating company to the Company under the loans made by the Company to the originating company and under the deficiency notes described above and (2) the estimated maximum future liability to the Company under the recourse arrangements described above, into secured promissory notes. Each originating company issued to the Company a secured variable amount promissory note dated December 31, 2005 (the “Secured Notes”) in the principal amounts shown below, which amounts represent all principal and accrued interest owed as of such date. The initial principal amounts are subject to increase up to the maximum amounts shown below if the Company incurs losses upon the foreclosure of loans covered by recourse arrangements with the originating company. The Secured Notes (including related guaranties discussed below) are secured by an assignment of the distributions on the Class C units, Class D units and Class EIA units of limited partnership interest of UMT Holdings held by each originating company.
| Name | Initial principal amount | Balance at June 30, 2009 | Promissory Note principle amount (2) | | Units pledged as security | C Units distributed in 2009 | Units remaining | Nominal Collateral Value (3) |
| | | | | 4,984 Class C and 2,710 Class D | | 3,616 Class C and 2,710 Class D | |
| | | | | 11,165Class C and 6,659 Class D and 1,066 Class EIA | | 9,331 Class C, 6,659 Class D and 1,066 EIA | |
| | | | | 4,545 Class and 3,000 Class D | | 2,971 Class C and 3,000 Class D | |
| | | | | | | | |
Wonder Indemnification (1) | | | | | | | | |
| | | | | | | | |
| | (1) Wonder is collateralized by an indemnification agreement from RMC in the amount of $1,134,000, which includes the pledge of 3,870 C Units. 2,213 of the pledged C Units also cross-collateralize the RAFC obligation. |
| | (2) The CRG and Wonder balances at June 30, 2009 exceeded the stated principal amount per their variable Secured Notes by approximately $202,000 and $561,000, respectively. Per the terms of the Secured Notes, the unpaid principal balance may be greater or less than the initial principal amount of the note and is not considered an event of default. The rapid rate of liquidation of the remaining portfolio of properties caused a more rapid increase in the Unpaid Principal Balance (“UPB”) than we originally anticipated and outpaced the minimum principal reductions scheduled for the loans. |
| | (3) Nominal collateral value does not reflect pledge of D units of limited partnership interest of UMTH held by WLL, Ltd., RAFC and KLA, Ltd. UMTH D units represent equity interests in UMT Holdings, LP. Pledge of the UMTH D units entitles the beneficiary to a pro-rata share of UMTH partnership D unit cash distributions. |
Through September 2007, the Secured Notes incurred interest at a rate of 10% per annum. The CRG, RAFC and RAF/Wonder Secured Notes amortize over 15 years. The SCMI Secured Note amortizes over approximately 22 years, which was the initial amortization of the deficiency notes from SCMI that were consolidated. The Secured Notes required the originating company to make monthly payments equal to the greater of (1) principal and interest amortized over 180 months and 264 months, respectively, or (2) the amount of any distributions paid to the originating company with respect to the pledged Class C and EIA units. Effective, October, 2007, the recourse loans were modified to accommodate the anticipated increases in principal balances throughout the remaining liquidation periods of the underlying assets, suspended the principal component of the amortized loans for the period of July 2007 through June 2009, and reduced the interest rate from 10% to 6%. Effective, July 2009, the above modifications were extended through December 31, 2009. See Note 6 - Subsequent Events for further discussion.
The Secured Notes have also been guaranteed by the following entities under the arrangements described below, all of which are dated effective December 31, 2005:
| - | UMT Holdings. This guaranty is limited to a maximum of $10,582,336 due under all of the Secured Notes and is unsecured. |
| - | WLL, Ltd., an affiliate of CRG. This guaranty is of all amounts due under Secured Note from CRG is non-recourse and is secured by an assignment of 2,492 Class C Units and 1,355 Class D units of limited partnership interest of UMT Holdings held by WLL, Ltd. |
| - | RMC. This guaranty is non-recourse, is limited to 50% of all amounts due under the Secured Note from RAFC and is secured by an assignment of 3,870 Class C units of limited partnership interest of UMT Holdings |
| - | Wonder. Wonder Funding obligations are evidenced by a note from RAFC (“RAFC Wonder Note”) and are secured by a pledge of a certain Indemnification Agreement given by UMTH to RAFC and assigned to UMT in the amount of $1,134,000, which amount is included in the UMTH limited guarantee referenced above. |
In addition, WLL, Ltd. has obligations to UMT Holdings under an indemnification agreement between UMT Holdings, WLL, Ltd. and William Lowe, under which UMT Holdings is indemnified for certain losses on loans and advances made to William Lowe by UMT Holdings. That indemnification agreement allows UMT Holdings to offset any amounts subject to indemnification against distributions made to WLL, Ltd., with respect to the Class C and Class D units of limited partnership interest held by WLL, Ltd. Because WLL, Ltd. has pledged these Class C and Class D units to the Company to secure its guaranty of Capital Reserve Corp.'s obligations under its Secured Note, UMT Holdings and the Company entered into an Intercreditor and Subordination Agreement under which UMT Holdings has agreed to subordinate its rights to offset amounts owed to it by WLL, Ltd. to the Company’s lien on such units.
6) On June 20, 2006, the Company entered into a Second Amended and Restated Secured Line of Credit Promissory Note (the "Amendment") with UDF, a Nevada limited partnership that is affiliated with the Company's Advisor, UMTHGS. The Amendment increased an existing revolving line of credit facility ("Loan") to $45 million. The Loan matures on December 31, 2009. The purpose of the Loan is to finance UDF's loans and investments in real estate development projects.
The Loan is secured by the pledge of all of UDF's land development loans and equity investments. Those UDF loans may be first lien loans or subordinate loans.
The Loan interest rate is the lower of 15% or the highest rate allowed by law, further adjusted with the addition of a credit enhancement to a minimum of 14%.
UDF may use the Loan proceeds to finance indebtedness associated with the acquisition of any assets to seek income that qualifies under the Real Estate Investment Trust provisions of the Internal Revenue Code to the extent such indebtedness, including indebtedness financed by funds advanced under the Loan and indebtedness financed by funds advanced from any other source, including Senior Debt, is no more than 85% of 80% (68%) of the appraised value of all subordinate loans and equity interests for land development and/or land acquisition owned by UDF and 75% for first lien secured loans for land development and/or acquisitions owned by UDF.
As a condition of the Amendment, UDF III, a public limited partnership that is affiliated with UDF and with the Company’s Advisor, had provided a guarantee of payment and performance of the Loan up to $30 million. The Company released the UDF III Guarantee January 1, 2008.
On September 19, 2008, UMT entered into an Economic Interest Participation Agreement with UDF III pursuant to which UDF III purchased (i) an economic interest in the $45,000,000 revolving credit facility (“Loan”) from UMT to UDF I and (ii) a purchase option to acquire a full ownership participation interest in the Loan (the “Option”).
The Loan is the $45,000,000 revolving line of credit facility evidenced by a Second Amended and Restated Secured Line of Credit Promissory Note dated as of June 20, 2006, as modified by an amendment effective September 1, 2006 (as amended, the “Amendment””). The UMT Loan is secured by a security interest in the assets of UDF including UDF's land development loans and equity investments pursuant to the First Amended and Restated Security Agreement dated as of September 30, 2004, executed by UDF in favor of UMT (the “Security Agreement”).
Pursuant to the Economic Interest Agreement, each time UDF requests an advance of principal under the UMT Loan, UDF III will fund the required amount to UMT and UDF III’s economic interest in the UMT Loan increases proportionately. UDF III’s economic interest in the UMT Loan gives UDF III the right to receive payment from UMT of principal and accrued interest relating to amounts funded by UDF III to UMT which are applied towards UMT’s funding obligations to UDF under the UMT Loan. UDF III may abate its funding obligations under the Economic Participation Agreement at any time for a period of up to twelve months by giving UMT notice of the abatement.
The Option gives UDF III the right to convert its economic interest into a full ownership participation interest in the UMT Loan at any time by giving written notice to UMT and paying an exercise price of $100. The participation interest includes all rights incidental to ownership of the UMT Loan and the Security Agreement, including participation in the management and control of the UMT Loan. UMT will continue to manage and control the UMT Loan while UDF III owns an economic interest in the UMT Loan. If UDF III exercises its Option and acquires a participation interest in the UMT Loan, UMT will serve as the loan administrator but both UDF III and UMT will participate in the control and management of the UMT Loan. The UMT Loan matures on December 31, 2009. At June 30, 2009, UDF III had funded approximately $44,957,000 to UDF under this agreement. On July 29, 2009 our trustees approved an increase of the revolving line of credit facility to an amount not to exceed $60,000,000. See Subsequent Events for further discussion.
The UMT Loan is subordinate to UDF Senior Debt, which includes a line of credit provided by Textron Financial Corporation in the amount of $30,000,000, and all other indebtedness of UDF to any national or state chartered banking association or other institutional lender that is approved by UMT in writing.
7) Loans are made to certain affiliates of the Advisor. Below is a table of the aggregate principal amount of mortgages funded during the quarters ended June 30, 2009 and June 30, 2008, respectively, from the companies affiliated with the Advisor, and named in the table and aggregate amount of draws made by UDF under the line of credit, during the two quarters indicated:
8) Until July 31, 2006 the Company’s Advisor was UMT Advisors, L.P. (“UMTA”). As of August 1, 2006, (now subject to an Advisory Agreement effective January 1, 2009) the Company entered into an Advisory Agreement with UMTHGS. Under the terms of the agreement, UMTHGS is paid a monthly trust administration fee. The fee is calculated monthly depending on the Company’s annual distribution rate, ranging from 1/12th of 1% up to 1/12th of 2% of the amount of average invested assets per month. During the three months ended June 30, 2009 and June 30, 2008, the net fees paid to the Company’s Advisors were approximately $256,000 and $272,000, respectively. During the six months ended June 30, 2009 and June 30, 2008, the net fees paid to the Company’s Advisors were approximately $514,000 and $543,000, respectively.
The agreement also provides for a subordinated incentive fee equal to 25% of the amount by which the Company’s net income for a year exceeds a 10% per annum non-compounded cumulative return on its adjusted contributions. No incentive fee was paid during 2009 or 2008. In addition, for each year in which it receives a subordinated incentive fee, the Advisor will receive a 5-year option to purchase 10,000 shares at a price of $20.00 per share (not to exceed 50,000 shares). As of June 30, 2009, the Advisor has not received options to purchase shares under this arrangement.
The Advisor and its affiliates are also entitled to reimbursement of costs of goods, materials and services obtained from unaffiliated third parties for the Company’s benefit, except for note servicing and for travel and expenses incurred in connection with efforts to acquire investments for the Company or to dispose of any of its investments. During each of the three months ended June 30, 2009 and June 30, 2008, the Company paid the Advisor approximately $19,000 as reimbursement for costs associated with providing shareholder relations activities. During each of the six months ended June 30, 2009 and June 30, 2008, the Company paid the Advisor approximately $38,000 as reimbursement for costs associated with providing shareholder relations activities.
The Advisory Agreement provides for the Advisor to pay all of the Company’s expenses and for the Company to reimburse the Advisor for any third-party expenses that should have been paid by the Company but which were instead paid by the Advisor. However, the Advisor remains obligated to pay: (1) the employment expenses of its employees, (2) its rent, utilities and other office expenses and (3) the cost of other items that are part of the Advisor's overhead that is directly related to the performance of services for which it otherwise receives fees from the Company.
The Advisor Agreement also provides for the Company to pay to the Advisor a debt placement fee. The Company may engage the Advisor, or an Affiliate of the Advisor, to negotiate lines of credit on behalf of the Company. UMT shall pay a negotiated fee, not to exceed 1% of the amount of the line of credit secured, upon successful placement of the line of credit.
9) The Company pays loan servicing fees to PSC, a subsidiary of UMTH, under the terms of a Mortgage Servicing Agreement. During the three months ended June 30, 2009 and June 30, 2008, the Company paid loan servicing fees of approximately $1,600 and $2,000, respectively. During the six months ended June 30, 2009 and June 30, 2008, the Company paid loan servicing fees of approximately $4,000 and $2,700, respectively.
6. Fair Value of Financial Instruments
In accordance with the reporting requirements of SFAS No. 107, Disclosures About Fair Value of Financial Instruments, the Company calculates the fair value of its assets and liabilities that qualify as financial instruments under this statement and includes additional information in notes to the Company’s consolidated financial statements when the fair value is different than the carrying value of those financial instruments. The estimated fair value of cash equivalents, accrued interest receivable, receivable from affiliate, accounts payable and accrued liabilities approximate the carrying value due to the relatively short maturity of these instruments. The carrying value of residential mortgages and contracts for deed, interim loans, lines of credit, recourse obligations from affiliates, deficiency notes and the Company’s line of credit payable also approximate fair value since these instruments bear market rates of interest. None of these instruments are held for trading purposes.
7. Subsequent Events
Regarding the Recourse Obligation Notes more fully discussed in Note 5, certain modified terms and conditions were due to expire June 30, 2009. Effective, July 2009, such modifications were extended through December 31, 2009.
The Company is currently negotiating a revolving line of credit with a bank for $5,000,000. The line of credit will bear interest at prime plus one percent and will require monthly interest payments. Principal and all unpaid interest will be due at maturity, which will be August 2012. The line will be collateralized by a first lien security interest in the underlying real estate financed by the line of credit. Management expects the line of credit to be executed during August 2009.
On July 29, 2009, the board of trustees approved an amendment to the Second Amended and Restated Line of Credit Promissory Note with UDF. The amendment increased the revolving line of credit facility to $60 million.
On July 29, 2009, Christine “Cricket” Griffin announced her retirement as President, Chief Financial Officer, and Chairman of the Board of Trustees of United Mortgage Trust, effective August 14, 2009.
On July 29, 2009, the board of trustees appointed Charles M. Gillis, a member of the board of trustees, to fill the remaining term of Chairman of the Board of Trustees of Ms. Griffin.
On July 29, 2009, the board of trustees appointed Leslie Wylie as a member of the board of trustees to fill the remaining term of Ms. Griffin.
On July 29, 2009, the board of trustees appointed Stuart Ducote as President and Chief Financial Officer of United Mortgage Trust, effective with Ms Griffin’s retirement.
Management has evaluated and disclosed subsequent events up to and including August 14, 2009 which is the date the statements were available for issuance.
| | ITEM 2. MANAGEMENT’S DISCUSSION AND ANALYSIS OF FINANCIAL CONDITION AND RESULTS OF OPERATIONS |
| | Cautionary Statement Regarding Forward-Looking Statements |
This Form 10-Q contains forward-looking statements within the meaning of Section 27A of the Securities Act of 1933, as amended, and Section 21E of the Securities Exchange Act of 1934, as amended. Such statements involve known and unknown risks, uncertainties, and other factors which may cause our actual results, performance, or achievements to be materially different from future results, performance or achievements expressed or implied by such forward-looking statements. Such factors include, but are not limited to, our ability to find suitable mortgage investments, the difficulties of the real estate industry generally in response to the “sub-prime crisis” and the “credit crisis,” changes in the overall economic environment and the requirement to maintain qualification as a real estate investment trust. Although we believe that the assumptions underlying the forward-looking statements contained herein are reasonable, any of the assumptions could be inaccurate, and therefore we cannot give assurance that such statements included in this Form 10-Q will prove to be accurate. In light of the significant uncertainties inherent in the forward-looking statements included herein, the inclusion of such information should not be regarded as a representation by us or by any other person that the results or conditions described in such statements or in our objectives and plans will be realized. Readers should carefully review our financial statements and the notes thereto contained in our Annual Report on Form 10-K for the year ended December 31, 2008, as well as those statements contained in this report, and in our other filings with the Securities and Exchange Commission.
In light of these risks, uncertainties and assumptions, the forward-looking events discussed in this Form 10-Q may not occur. We undertake no obligation to update or revise our forward-looking statements, whether as a result of new information, future events or otherwise.
RESULTS OF OPERATIONS FOR THE THREE AND SIX MONTHS ENDED JUNE 30, 2009 AND JUNE 30, 2008
General Investment Information
United Mortgage Trust (the “Company”) is a Maryland real estate investment trust that qualifies as a real estate investment trust (a “REIT”) under federal income tax laws. Our principal investment objectives are to invest proceeds from our dividend reinvestment plan, financing proceeds, capital transaction proceeds and retained earnings in following types of investments:
| | (i) first lien secured interim mortgage loans with initial terms of 12 months or less for the acquisition and renovation of single-family homes, which we refer to as “Interim Loans”; |
(ii) secured, subordinate line of credit to UMTH Lending Company, L.P. for origination of Interim Loans;
| | (iii) | lines of credit and secured loans for the acquisition and development of single-family home lots, referred to as “Land Development Loans”; |
| | (iv) | lines of credit and loans secured by entitled and developed single-family lots, referred to as “Finished Lot Loans”; and, |
| | (v) | lines of credit and loans secured by completed model homes, referred to as “Model Home Loans”; and, |
| | (vi) | loans provided to entities that have recently filed for bankruptcy protection under Chapter 11 of the U.S. bankruptcy code, secured by a priority lien over pre-bankruptcy secured creditors, referred to as “Debtor in Possession Loans” and, |
| | (vii) | lines of credit and loans, with terms of 18 months or less, secured by single family lots and homes constructed thereon, referred to as “Construction Loans,, |
| | (viii) | first lien secured mortgage loans with terms of 12 to 360 months for the acquisition of single-family homes, referred to as “Residential Mortgages”, and, |
| | (ix) | discounted cash flows secured by assessments levied on real property. |
We collectively refer to the above listed loans as “Mortgage Investments”. Additionally, our portfolio includes obligations of affiliates of our Advisor, which we refer to as “recourse loans.” Loans are originated by others to the Company’s specifications or to specifications approved by the Company. Most, if not all, of such loans are not insured or guaranteed by a federally owned or guaranteed mortgage agency.
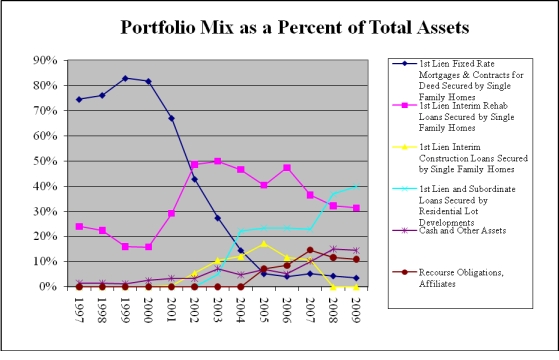
The following table illustrates the percentage of our mortgage portfolio dedicated to each mortgage loan category as of June 30, 2009 and December 31, 2008:
| | |
| | |
First lien secured interim mortgages 12 months or less and residential mortgages and contracts for deed | | |
Secured LOC to UMTH Lending Co., L.P. | | |
| | |
| | |
The following table summarizes mortgage loans by type and original loan size held by United Mortgage Trust at June 30, 2009.
| | | | | | Face amount of Mortgage (1) | Carrying amount of Mortgage (2) | |
Single family residential 1st mortgages and interim loans (5): | | | | | | | | |
Original balance > $100,000 | | | | | | | | |
Original balance $50,000 - $99,999 | | | | | | | | |
Original balance $20,000 - $49,999 | | | | | | | | |
Original balance under $20,000 | | | | | | | | |
| | | | | | | | | |
First Lien secured interim mortgages | | | | | | | | |
Ready America Funding (4) | | | | | | | | |
Howe Note Consolidation (5) | | | | | | | | |
| | | | | | | | | |
Secured, subordinate LOC to UMTH Lending Co., L.P. (4), (5) | | | | | | | | |
| | | | | | | | | |
| | | | | | | | |
UDF III Economic Interest Participation | | | | | | | | |
UDF III Bear Creek Participation | | | | | | | | |
| | | | | | | | | |
| | | | | | | | |
| | | | | | | | | |
| | | | | | | | |
| | | | | | | | |
| (1) | Current book value of loans. |
| (2) | Net of allowance for loan losses on mortgage loans of $811,701 at June 30, 2009. |
| (3) | Amounts greater than thirty (30) days past due. |
| (4) | Lines of credit with Ready America Funding and UMTH Lending Co., L.P. are collateralized by 18 and 172 loans, respectively. |
| (5) | No specific maturity date as UMT has first lien collateral position in these loans funded by the originator. |
Below is a reconciliation and walk forward of mortgage loans, net of allowance for loan losses, for the six months ended June 30 2009.
Balance at beginning of period | |
| |
| |
| |
| | |
Deductions during period: | |
| |
Other decreases in principal | |
| |
Other (net change of Allowance) | |
Balance at close of period | |
Material Trends Affecting Our Business
We are a real estate investment trust and derive a substantial portion of our income from loans secured by single-family homes (both finished homes and homes under construction), single-family home lots, and entitled land under development into single-family home lots. We intend to concentrate our lending activities in the southeast and southwest sections of the United States, particularly in Texas. We believe these areas continue to experience demand for new construction of single-family homes; however, the U.S. housing market has suffered declines over the past three years, particularly in geographic areas that had experienced rapid growth, steep increases in property values and speculation. Additionally, we intend to concentrate our lending activities with national and regional homebuilders and developers who sell single-family residential home lots to such national and regional homebuilders. National and regional homebuilders are expected to reduce the number of new homes constructed in 2009 as compared to 2008. However, we expect to see continued healthy demand for our products as the supply of finished new homes and land is once again aligned with our market demand.
Generally, demand for new homes continued to deteriorate throughout 2008, accelerating with the cascading events in credit and equity markets in September and October, and has continued to fall in 2009. Consumer confidence improved significantly in the second quarter from the historic lows to which it fell in early 2009, but remains depressed, particularly in consumers’ assessment of current conditions. Market conditions remain challenging as many potential home buyers appear to have postponed their purchases of new homes until signs that the economy and employment are improving, or at least are not continuing to deteriorate. These challenges have persisted in spite of tax credits and other incentives offered by the government and homebuilders to encourage new home purchases. Our view is that the perspective of many potential home buyers is less concerned with home affordability and price and more concerned with job security and economic stability.
Nationally, new single-family home sales and new home inventory both significantly improved in the second quarter. The sales of new single-family residential homes in June 2009 were at a seasonally adjusted annual rate of 384,000 units. This number is much improved from the first quarter figure of 332,000, though it is still approximately 21.3% below the June 2008 estimate of 488,000. The seasonally adjusted estimate of new houses for sale at the end of June 2009 was 281,000, which represents a supply of 8.8 months at the current sales rate – a significant reduction from the first quarter supply of 10.7 months. We believe that this drop in the number of new houses for sale by approximately 155,000 units year-over-year reflects the homebuilding industry’s extensive efforts to bring the new home market back to equilibrium by reducing new housing starts and selling existing new home inventory. According to the sources identified above, new single-family residential home permits and starts have fallen nationally, as a result and in anticipation of an elevated supply of and decreased demand for new single-family residential homes. Single-family homes authorized by building permits in June 2009 were at a seasonally adjusted annual rate of 430,000 units. This is 28.93% below the June 2008 estimate of 605,000 units. Single-family home starts for June 2009 were at a seasonally adjusted annual rate of 470,000 units. This is 28.24% below the June 2008 estimate of 655,000 units. We believe that, with these reductions, new home inventory levels are approaching equilibrium and that what is necessary to regain prosperity in housing markets is the return of healthy levels of demand.
The primary factors affecting new home sales are housing prices, home affordability, and housing demand. Housing supply may affect both new home prices and demand for new homes. When new home supplies exceed new home demand, new home prices may generally be expected to decline. Declining new home prices may result in diminished new home demand as people postpone a new home purchase until such time as they are comfortable that stable price levels have been reached.
Generally, housing markets remain difficult across the country and are declining on a national basis with those declines and difficulties most pronounced in markets that previously experienced rapid growth, steep increases in property values, and speculation, such as in California, Florida, Arizona, and Nevada. However, a few markets, such as Texas, though weakened from its high in 2007, continue to remain fairly healthy relative to national trends. The graph below illustrates the recent declines in national home price and prices in Arizona, California, Nevada, and Florida. The chart also illustrates that Texas has maintained price stability and avoided such pronounced declines.
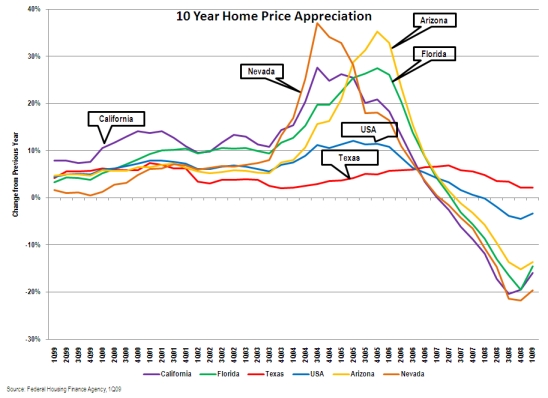
The Federal Housing Finance Agency (“FHFA”) analyzes the combined mortgage records of Fannie Mae and Freddie Mac, which form the nation’s largest database of conventional, conforming mortgage transactions, and produces an all-transactions house price index that tracks average house price changes in repeat sales or refinancings of the same single-family properties. The index is based on data obtained from Fannie Mae and Freddie Mac for mortgages originated over the past 35 years.
The First Quarter 2009 all-transactions house price index reports that over the past twelve months, home prices have risen 2.10% on average in Texas while, nationally, home prices have fallen 3.35% over that same period. According to that same source, only 16 states have seen home prices increase over the past 12 months, while 34 states and the District of Columbia have seen home prices fall. Furthermore, only four states, Texas, Oklahoma, North Dakota, and South Dakota, have seen home prices rise by more than 2.0% over the past 12 months while four states, Arizona, Florida, Nevada, and California, have seen home prices fall by more than 13.0% over that period. Home prices in the states of Arizona, Florida, California, and Nevada fell 13.63%, 14.57%, 15.96%, and 19.65%, respectively.
As of June 30, 2009, a great majority of our assets are secured by assets located in Texas. While housing woes beleaguer the national economy, Texas housing markets have held up as some of the best in the country. Texas housing markets have held up as some of the best in the country even as housing woes continue to beleaguer the national economy. We believe the Texas markets have remained relatively healthy due to continued strong population growth, diverse economies, affordable housing, and home building and development discipline on the part of home builders and developers operating in Texas markets. Though recent job growth has ceased due to the current economic climate, the Texas Comptroller of Public Accounts reports that Texas has added nearly one million new jobs over the past five years, and we believe that the long term fundamentals remain sound.
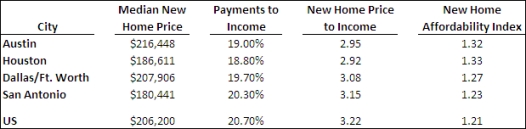
According to numbers publicly released by Residential Strategies, Inc. or Metrostudy, leading providers of primary and secondary market information, the median new home prices for June 2009 in the metropolitan areas of Austin, Houston, Dallas, and San Antonio are $213,525, $186,611, $208,133 and $180,441, respectively. These amounts are at par with or slightly above the June 2009 national median sales price of new homes sold of $206,200, according to estimates released jointly by the U.S. Census Bureau and the Department of Housing and Urban Development.
Using the Department of Housing and Urban Development’s estimated 2009 median family income for the respective metropolitan areas of Austin, Houston, Dallas, and San Antonio, the median income earner in those areas has 1.32 times, 1.24 times, 1.27 times, and 1.22 times the income required to qualify for a mortgage to purchase the median priced new home in the respective metropolitan area. These numbers illustrate that Texas homes are among the most affordable in the country. Our measurement of housing affordability, as referenced above, is determined as the ratio of median family income to the income required to qualify for a 90 percent, 30-year fixed-rate mortgage to purchase the median-priced new home, assuming an annual mortgage insurance premium of 50 basis points for private mortgage insurance and a cost that includes estimated property taxes and insurance for the home.
Using the U.S. Census Bureau’s 2009 income data to project an estimated median income for the United States of $64,000 and the June 2009 national median sales prices of new homes sold of $206,200, we conclude that the national median income earner has 1.21 times the income required to qualify for a mortgage loan to purchase the median-priced new home in the United States. This estimation reflects the increase in home affordability in housing markets outside of Texas over the past 24 months, as new home prices in housing markets outside of Texas generally have fallen. Indeed, the national median new home price of $206,200 has fallen by 11.99% from the June 2008 median new home sales price of $234,300, according to the Department of Housing and Urban Development. As a result of falling home prices, we believe that affordability has been restored to the national housing market.
Additional indicators that provide insight into the extent of new home affordability are the ratio of new home prices to median income and the percentage of income required for new home payments. Historically, the ratio of new home prices to median income in stable markets is between 3 and 4, and the average percentage of monthly income needed to service a conforming mortgage has been between 19% and 25%, between 29% and 37% for a first-time home purchase. By each of these historical measures, new home prices are affordable both nationally and within the four major Texas markets.
Sources: Residential Strategies, MetroStudy, Federal Housing Finance Board, U.S. Census Bureau, United Development Funding
The Second Quarter 2009 U.S. Market Risk Index, a study prepared by PMI Mortgage Insurance Co., the U.S. subsidiary of The PMI Group, Inc., which ranks the nation’s 50 largest metropolitan areas through the first quarter of 2009 according to the likelihood that home prices will be lower in two years, reported that Texas cities lead the nation in home price stability. This index analyzes housing price trends, the impact of foreclosure rates, and the consequence of excess housing supply on home prices. The quarterly report projects that there is less than a 6.0% chance that the Dallas/Fort Worth-area and Houston-area home prices will fall during the next two years; a 2.8% chance that San Antonio-area home prices will fall during the next two years; and a 28.1% chance that Austin-area home prices will fall during the next two years. Except for the Austin area, all Texas metropolitan areas included in the report are in the Top 8 least-likely areas to experience a decline in home prices in two years. The Austin area is ranked the fourteenth least-likely area to experience a decline. Dallas-Plano-Irving, Texas is the nation’s sixth least-likely metropolitan area, Fort Worth-Arlington, Texas is seventh least-likely, Houston-Sugar Land-Baytown, Texas is fifth least-likely, and San Antonio, Texas is fourth least-likely.
FHFA all-transaction price index reports that Texas had a healthy existing home price appreciation between the first quarter of 2009 and the first quarter of 2008 of 2.10%. That report provides that existing home price appreciation between the first quarter of 2009 and the first quarter of 2008 for (a) Austin was 1.49%; (b) Houston was 3.83%; (c) Dallas was 2.21%; (d) Fort Worth was 3.11%; (e) San Antonio was 1.68%; and (f) Lubbock was 2.35%. The FHFA tracks average house price changes in repeat sales or refinancings of the same single-family properties utilizing conventional, conforming mortgage transactions.
We also believe that changes in population and employment affect new home demand. The United States Census Bureau reported in its 2008 Estimate of Population Change July 1, 2007 to July 1, 2008 that Texas led the country in population growth during that period. The estimate concluded that Texas grew by 483,542 people, or 2.00% – a number that was 1.28 times greater in terms of raw population growth than the next closest state, California, and more than 2.67 times the second closest state, North Carolina. According to the same source, Texas also led the country in population growth during the previous year of July 1, 2006 to July 1, 2007 with an estimated population growth of 496,751 people, or 2.12%. The United States Census Bureau also reported that Texas had the most counties of any state among the 100 fastest-growing counties in the nation with 19 counties and that Texas had the most counties that added the greatest number of residents between July 1, 2007 and July 1, 2008. Six of the top 15 counties were in Texas: Harris (Houston), Tarrant (Fort Worth), Bexar (San Antonio), Collin (North Dallas), Dallas (Dallas) and Travis (Austin). Additionally, the United States Census Bureau reported that four out of Texas’ five major cities – Austin, Houston, Dallas and Fort Worth – were among the top ten in the nation for population growth from 2007 to 2008 for metropolitan statistical areas with a population estimate exceeding 1 million. Dallas-Fort Worth-Arlington led the nation in numerical population growth with an estimated population increase of 146,532, with Dallas-Plano-Irving showing an estimated increase of 97,036 and Fort Worth-Arlington showing an estimated increase of 49,496. Houston-Sugarland-Baytown was second in the nation in numerical population growth with an estimated increase of 130,185. Austin-Round Rock had an estimated population growth of 60,012. San Antonio ranked fifteenth with an estimated population growth of 46,524 over this same period. The percentage increase in population for these major Texas cities ranged from 2.34% to 3.77%.
As stated earlier, the Texas economy has added a net of nearly 1.0 million new jobs over the past five years. However, due to the national and global recession, the Texas economy has begun to slow, beginning in the fourth quarter of 2008 and continuing through the first two quarters of 2009. Over the twelve month period ending June 2009, the United States Department of Labor reported that Texas lost approximately 266,300 jobs and the unemployment rate is 7.5%, up from 4.8% in June 2008. However, the same report states that, nationally, the United States lost approximately 5,542,000 jobs, nearly double the percentage of jobs cut in Texas over that same period, and the unemployment rate rose to 9.5% from 5.6% in June 2008.
The Texas Workforce Commission reports that as of June 2009, the unemployment rate for Austin-Round Rock, Texas was 7.1%, up from 4.5% in June 2008; Dallas-Fort Worth-Arlington, Texas was 8.2%, up from 5.1%; Houston-Sugar Land-Baytown, Texas was 8.0%, up from 5.0%; and San Antonio, Texas was 6.9%, up from 4.9%. The Texas metropolitan area of Austin was the last major city in Texas to transition from jobs created to jobs lost. In the most recent quarter Austin went from 3,300 jobs created year-over-year to a net loss of 1,200 jobs year-over-year for the twelve month period ending June 2009. During those same 12 months, Houston, Dallas-Fort Worth, and San Antonio experienced net losses of 69,600, 58,300, and 6,300 jobs, respectively. However, these cities have added an estimated net total of 710,400 jobs over the past five years. Austin added 111,800; Dallas-Fort Worth added 250,400; Houston added 257,700; and San Antonio added 90,500.
Due to the national and global recession, we believe it is likely that the Texas economy will continue to slow and that Texas will suffer a net loss of jobs in 2009. The National Bureau of Economic Research has concluded that the U.S. economy entered into a recession in December 2007, ending an economic expansion that began in November 2001. We believe that the transition from month-over-month and year-over-year job gains in Texas, to year-over-year and month-over-month job losses indicates that the Texas economy has slowed significantly, beginning in the fourth quarter of 2008 when we believe Texas followed the nation into recession. However, we also believe that the Texas economy will continue to outperform the national economy. According to the Texas Workforce Commission, Texas tends to enter into recessions after the national economy has entered a recession and usually leads among states in the economic recovery. In the current downturn, Texas’ recession trailed the national recession by nearly a year.
In sharp contrast to the conditions of many homebuilding markets in the country where unsold housing inventory remains a challenge, new home sales are greater than new home starts in Texas markets, indicating that home builders in Texas are focused on preserving a balance between new home demand and new home supply. Home builders and developers in Texas have remained disciplined on new home construction and project development. New home starts have been declining year-over-year and are outpaced by new home sales in all of our Texas markets where such data is available. Inventories of finished new homes and total new housing (finished vacant, under construction, and model homes) remain at healthy and balanced levels in all four major Texas markets, Austin, Dallas-Fort Worth, Houston, and San Antonio. Each major Texas market is experiencing a rise in the number of months of finished lot inventories as homebuilders continue to reduce the number of new home starts, with each major Texas market reaching elevated levels. Houston has an estimated inventory of finished lots of approximately 43.8 months, Austin has an estimated inventory of finished lots of approximately 51.4 months, San Antonio has an estimated inventory of finished lots of approximately 63.2 months, and Dallas-Fort Worth has an estimated inventory of finished lots of approximately 80.0 months. A 24-28 month supply is considered equilibrium for finished lot supplies.
The recent rise in month’s supply of finished lot inventory in Texas markets owes itself principally to the decrease in the pace of annual starts rather than an increase in the raw number of developed lots. Indeed, the number of finished lots dropped by more than 1,100 lots in Austin, Houston, and Dallas-Fort Worth and by more than 400 lots in San Antonio in the second of quarter of 2009. Annual starts in each of the Austin, San Antonio, Houston, and Dallas-Fort Worth markets are outpacing lot deliveries. With the discipline evident in these markets, we expect to see a continued decline in raw numbers of finished lot inventories in coming quarters as new projects have been significantly reduced.
Texas markets continue to be some of the strongest homebuilding markets in the country, though home building in Texas has weakened through the past few quarters. Annual new home sales in Austin outpace starts 8,978 versus 6,977, with annual new home sales declining year-over-year by approximately 32.5%. While the decline in housing starts has caused vacant lot inventory to become elevated from its previously balanced position, it has also maintained a balance in the housing inventory. Finished housing inventory and total new housing inventory (finished vacant, under construction and model homes) remain at healthy and balanced levels of 2.5 months and 6.1 months, respectively. The generally accepted equilibrium levels for finished housing inventory and total new housing inventory are a 2-to-2.5 month supply and a 6.0 month supply, respectively. Like Austin, San Antonio is also a healthy homebuilding market. Annual new home sales in San Antonio outpace starts 9,054 versus 7,549, with annual new home sales declining year-over-year by approximately 31.4%. Finished housing inventory and total new housing inventory remain at healthy levels with a 2.6 month supply and 6.0 month supply, respectively, each within or below the considered equilibrium levels. Houston too is a healthy homebuilding market. Annual new home sales there outpace starts 23,600 versus 18,177, with annual new home sales declining year-over-year by approximately 30.8%. Finished housing inventory and total new housing inventory have been balanced at a 2.83 month supply – slightly above equilibrium – and a 6.2 month supply, which is within the considered equilibrium level. Dallas-Fort Worth is healthy homebuilding market as well. Annual new home sales in Dallas-Fort Worth outpace starts 20,093 versus 13,845, with annual new home sales declining year-over-year by approximately 35.4%. Finished housing inventory and total new housing inventory have risen to a 3.2 month supply and 6.3 month supply, respectively, each slightly above the considered equilibrium level. All numbers are as publicly released by Residential Strategies, Inc. or Metrostudy, leading providers of primary and secondary market information.
The Real Estate Center at Texas A&M University has reported that the sales of existing homes remain relatively healthy in our Texas markets, as well. Though the year-over-year sales pace has fallen between 18% and 22% in each of the four largest Texas markets, inventory levels have generally remained stable. The number of months of home inventory for sale in Austin, Houston, Dallas, Fort Worth, and Lubbock is 6.5 months, 6.3 months, 6.6 months, 6.4 months, and 5.5 months, respectively. San Antonio is slightly elevated with an 8.3 month home for sale inventory. A 6-month supply of inventory is considered a balanced market with more than 6 months of inventory generally being considered a buyer’s market and less than 6 months of inventory generally being considered a seller’s market. Through June 2009, the number of existing homes sold year-to-date in (a) Austin is 9,446, down 22% year-over-year; (b) San Antonio is 8,448, down 18% year-over-year; (c) Houston is 27,387, down 21% year-over-year, (d) Dallas is 21,090, down 21% year-over-year, (e) Fort Worth is 3,834, down 25% year-over-year, and (f) Lubbock is 1,623, down 8% year-over-year.
In managing and understanding the markets and submarkets in which we make loans, we monitor the fundamentals of supply and demand. We track the economic fundamentals in each of the respective markets, analyzing demographics, household formation, population growth, employment, migration, immigration, and housing affordability. We also watch movements in home prices and the presence of market disruption activity, such as investor or speculator activity that can create a false impression of demand and result in an oversupply of homes in a market. Further, we study new home starts, new home closings, finished home inventories, finished lot inventories, existing home sales, existing home prices, foreclosures, absorption, prices with respect to new and existing home sales, finished lots and land, and the presence of sales incentives, discounts, or both, in a market.
Generally, the residential homebuilding industry is cyclical and highly sensitive to changes in broader economic conditions, such as levels of employment, consumer confidence, income, availability of financing for acquisition, construction, and permanent mortgages, interest rate levels, and demand for housing. The condition of the resale market for used homes, including foreclosed homes, also has an impact on new home sales. In general, housing demand is adversely affected by increases in interest rates, housing costs, and unemployment and by decreases in the availability of mortgage financing or in consumer confidence, which can occur for numerous reasons, including increases in energy costs, interest rates, housing costs, and unemployment.
We face a risk of loss resulting from deterioration in the value of the land purchased by the developer with the proceeds of loans from us, a diminution of the site improvement and similar reimbursements used to repay loans made by us, and a decrease in the sales price of the single-family residential lots developed with the proceeds of loans from us. Deterioration in the value of the land, a diminution of the site improvement and similar reimbursements, and a decrease in the sales price of the residential lots can occur in cases where the developer pays too much for the land to be developed, the developer is unable or unwilling to develop the land in accordance with the assumptions required to generate sufficient income to repay the loans made by us, or is unable to sell the residential lots to homebuilders at a price that allows the developer to generate sufficient income to repay the loans made by us. Our Advisor actively monitors the markets and submarkets in which we make loans, including mortgage markets, homebuilding economies, the supply and demand for homes, finished lots, and land and housing affordability to mitigate such risks. Our Advisor also actively manages our loan portfolio in the context of events occurring with respect to the loan and in the market and submarket in which we made the loan. We anticipate that there may be defaults on development loans made by us and that we will take action with respect to such defaults at any such time that we determine it prudent to do so, including such time as we determine it prudent to maintain and protect the value of the collateral securing a loan by originating another development loan to another developer with respect to the same project to maintain and protect the value of the collateral securing our initial loan.
We face a risk of loss resulting from adverse changes in interest rates. Changes in interest rates may affect both demand for our real estate finance products and the rate of interest on the loans we make. In most instances, the loans we make will be junior in the right of repayment to senior lenders, who will provide loans representing 70% to 80% of total project costs. As senior lender interest rates available to our borrowers increase, demand for our mortgage loans may decrease, and vice versa.
Developers to whom we make mortgage loans use the proceeds of such loans to develop raw real estate into residential home lots. The developers obtain the money to repay these development loans by selling the residential home lots to home builders or individuals who will build single-family residences on the lots, receiving qualifying site improvement reimbursements, and by obtaining replacement financing from other lenders. If interest rates increase, the demand for single-family residences may decrease. Also, if mortgage financing underwriting criteria become stricter, demand for single-family residences may decrease. In such an interest rate and/or mortgage financing climate, developers may be unable to generate sufficient income from the resale of single-family residential lots to repay loans from us, and developers’ costs of funds obtained from lenders in addition to us may increase as well. If credit markets deteriorate, developers may not be able to obtain replacement financing from other lenders. Accordingly, increases in single-family mortgage interest rates, decreases in the availability of mortgage financing, or decreases in the availability of replacement financing could increase the number of defaults on development loans made by us.
We are not aware of any material trends or uncertainties, favorable or unfavorable, other than national economic conditions affecting real estate and interest rates generally, that it reasonably anticipates to have a material impact on either the income to be derived from our investments in mortgage loans or entities that make mortgage loans, other than those referred to in this Quarterly Report on Form 10-Q. The disruption of mortgage markets, in combination with a significant amount of negative national press discussing turmoil in mortgage markets and the poor condition of the national housing industry, including declining home prices, have made potential new home purchasers and real estate lenders very cautious. The economic downturn that continues to occur, the failure of highly respected financial institutions, significant decline in equity markets around the world, unprecedented administrative and legislative actions in the United States, and actions taken by central banks around the globe to stabilize the economy have further caused many prospective home purchasers in our markets to postpone their purchases. In summary, we believe there is a general lack of urgency to purchase homes in these times of economic uncertainty. We believe that this has further slowed the sales of new homes and expect that this will result in a slowing of the sales of finished lots developed by our clients in certain markets; however, we do not anticipate the prices of those lots changing materially. We also expect that the decrease in the availability of replacement financing may increase the number of defaults on development loans made by us or extend the time period anticipated for the repayment of our loans.
Outlook
In summary, we believe there is a general lack of urgency to purchase homes in these times of economic uncertainty. We believe that this has further slowed the sales of new homes and expect that this will result in a slowing of the sales of finished lots developed by our borrowers in certain markets; however, we continue to believe that the prices of those lots should not change materially. We also anticipate that the decrease in the availability of replacement financing may increase the number of defaults on development loans we invest in or extend the time period anticipated for the repayment of loans we invest in. We believe that United Mortgage Trust has been active in monitoring current market conditions and in implementing various measures to manage our risk and protect our return on our investments by shifting our portfolio to investments that are less directly sensitive to the adverse market conditions and that produce higher yields and by aggressively liquidating non-performing loans. Based on that assessment, we do not anticipate a significant disruption to our normal business operations. Nevertheless, our assessments inherently involve predicting future events and we cannot be sure of the length or extent of the current credit crisis and if it continues over an extended period of time, or if its severity increases, its impact on the economy as a whole and on the housing and mortgage lending market could cause us to suffer a higher level of delinquencies and losses than we are currently predicting and result in a material adverse impact on our business.
Loan Portfolio Overview
The deterioration in the residential mortgage market, specifically the discontinuation of sub-prime and Alt – A products, referred to herein as the sub-prime credit crisis, and the continued slowdown in new home sales are directly and indirectly affecting the ability of our borrowers to sell the assets securing their loans, pay interest due us and repay the loans when due. New and existing home financing solutions are being introduced by both the private and public sectors. Housing inventories are slowly beginning to reduce to sustainable levels. However, consumer confidence remains low. Industry-wide lenders are reevaluating and restructuring credits affected by residential mortgage markets as housing sales decline. Overall recovery of the single family housing industry is likely to be prolonged. We believe that a pragmatic and pro-active approach to managing our credits will allow us to maximize repayments and properly report asset values. In consideration of the above, we are:
| | · | reducing our investment in interim loans dependent on sub-prime and Alt-A mortgage products for repayment of our loan. |
| | · | accepting a secured note from UMTHLC for shortfalls from foreclosed properties to enable UMTHLC to efficiently manage past due and foreclosed accounts throughout the duration of the credit crisis. |
| | · | increasing loss reserves for certain deficiency loans where full collection of the indebtedness is not assured. |
| | · | re-evaluating collateral value on specific loans deemed to be affected by current mortgage and housing environments and reserving for unsecured deficiencies. |
Portfolio Mix
Our portfolio concentrations have shifted during the past decade of investing, and particularly since 2000, as we have sought adequate supplies of suitable loans in a changing real estate finance market. The chart below demonstrates the transition from a portfolio with a concentration on long term, 1st lien single family loans to one comprised primarily of first lien interim loans of 12 months or less in term for the purchase and renovation of single family homes and loans secured by 1st lien and subordinate single family lot development loans. We intend to continue to adapt to changes in the real estate finance market and thus the composition of our loan portfolio is likely to continue to evolve over time based on factors such as interest rates paid under various types of real estate loans, our assessment of the level of risk of the different types of loans, availability of loans, regulatory considerations and other factors.
Results of Operations
Revenues for the three months ended June 30, 2009, were approximately $2,363,000 compared to approximately $3,040,000 for the comparable period in the prior year. This decrease of approximately $677,000 was due primarily to the reduction in the amount of the UDF line of credit held by us, which decreased interest income approximately $640,000. Revenues for the six months ended June 30, 2009, were approximately $4,501,000 compared to approximately $6,224,000 for the comparable period in the prior year. This decrease of approximately $1,723,000 was due primarily to reduced interest income of approximately $1,400,000 as a result of the reduction in the amount of the UDF line of credit held by us, and reduced interest income of approximately $295,000 due to the placement of certain other loans on non-accrual status on January 1, 2009. Revenues from interim loans accounted for approximately 54% of revenues for the three months ended June, 2009 compared to 56% in the same period in the prior year. Revenues from interim loans accounted for approximately 56% of revenues for the six months ended June, 2009 compared to 57% in the same period in the prior year. The decline in our interim portfolio was a function of our intention to reduce our investment in interim construction loans secured by modular and manufactured homes and related lots.
During the three months ended June 30, 2009 and June 30, 2008, approximately 21% and 25%, respectively, of our revenues were derived from lines of credit and lot banking transactions, (these secured loans for the acquisition and development of single-family home lots are referred to as “land development loans” and “lot banking transactions”). Approximately 21% and 25% of our revenues were derived from lines of credit and lot banking transactions during the six months ended June 30, 2009 and June 30, 2008, respectively. At June 30, 2009, our investment in the lines of credit to our affiliate, UDF, through the Economic Interest Agreement, and lot banking transactions was approximately $60 million. We anticipate our investment in construction loans will increase during the remainder of 2009, as we initiate a new bank credit facility to accommodate construction loans. We intend to use our line of credit to build this portion of our portfolio. See Note 7 – Subsequent Events for further discussion.
During the three months ended June 30, 2009 and June 30, 2008, approximately 11% and 8% of our revenues, respectively, were derived from secured promissory notes issued by affiliates as evidence of their accrued obligations to reimburse UMT for any defaulted loans that we acquired from them, which notes we refer to as “Recourse Obligations.” During the six months ended June 30, 2009 and June 30, 2008, approximately 11% and 8% of our revenues were derived from secured promissory notes issued by affiliates. These Recourse Obligations were modified during October 2007 to reflect current market conditions. Such modifications included but were not limited to a reduction in the interest rate on these notes.
The Secured Notes require the originating company to make certain interest and principal payments, as defined by the agreements. Further, these notes are liquidated by any distributions paid to the originating company with respect to the pledged Class C units of UMTH. UMTH has guaranteed the obligations of CRG, SCMI and RAFC under the Secured Notes up to the maximum loan amounts defined in the respective notes. The sub-prime credit crisis, as well as the decline in new home sales, have indirectly adversely affected the earnings of UMTH which, in turn, is expected to have an adverse effect on the distributions associated with the security pledged on the Recourse Obligations. The Company monitors the value of the security pledged by the originating companies and will consider further modifications to the Recourse Obligations notes to allow UMTH to structure payments under the Recourse Obligations in relation to its earnings, as impacted by the mortgage market and new home sales environments. Any such modifications would be likely to result in a decline in the return being realized by the Company under the Recourse Obligation notes.
Operating Expenses for the three months ended June 30, 2009 and June 30, 2008, were approximately $1,238,000 and $1,855,000, respectively. Operating Expenses for the six months ended June 30, 2009 and June 30, 2008, were approximately $2,200,000 and $2,619,000, respectively. The decreases from prior year periods is primarily due to reduced loan loss provisions recognized in 2009, based on the Company’s assessment of the underlying collateral value of its loan portfolio. Other fluctuations in operating expense line items are discussed below for the three and six month periods ended June 30, 2009:
Trust administration fees - $256,000 and $272,000 (a 6% decrease) between the comparable three month periods ended June 30, 2009 and 2008, respectively, and $514,000 and $545,000 (a 6% increase) between the comparable six month periods ended June 30, 2009 and 2008, respectively. This fee is approximately 1/12 of 1.0% monthly of total assets under management. The decrease in the fee is due to a decrease in the Company’s qualifying assets under management during these periods.
General and administrative expenses - $310,000 and $326,000 (a 5% decrease) between the comparable three month periods ended June 30, 2009 and 2008, respectively, and $609,000 and $560,000 (a 9% increase) between the comparable six month periods ended June 30, 2009 and 2008, respectively. The increase was primarily due to increases in REO expenses offset by a decrease in franchise tax expense during the six month period ended June 30, 2009.
Provision for loan losses - The Company recorded a provision for loan losses for the three months ended June 30, 2009 and 2008 of $670,000 and $1,255,000 respectively. For the six months ended June 30, 2009 and 2008, we recorded a provision of $1,073,000 and $1,510,000, respectively. The Company realized loan losses of approximately $371,000 and $350,000 during the comparable six-month periods of 2009 and 2008, respectively. Loss reserves are estimates of future losses based on historical default rates, estimated losses on the sale of real estate owned and expectations of future economic conditions and activity. The Company continually re-evaluates collateral value on specific loans deemed to be affected by current mortgage and housing environments and intends to establish reserves for any expected deficiencies that are not otherwise secured. From inception through June 30, 2009, we have acquired approximately $796 million of loans. We have recorded losses approximating 1.2% of those assets to date. We anticipate loan losses to continue, primarily in our long-term and un-affiliated construction loan portfolio, and therefore continue to assess the adequacy of our loan loss reserves.
Net income was approximately $1,125,000 and $1,185,000 for the three months ended June 30, 2009 and 2008, respectively. Net income was approximately $2,301,000 and $3,605,000 for the six months ended June 30, 2009 and 2008, respectively. Earnings per share of beneficial interest for the three months ended June 30, 2009 and 2008 were $0.18 per share. Earnings per share of beneficial interest for the six months ended June 30, 2009 and 2008 were $0.36 and $0.55 per share, respectively.
Distributions, per share, to shareholders were $0.09 and $0.37 per share for the three months ended June 30, 2009 and 2008, respectively and $0.39 and $0.75 per share for the six months ended June 30, 2009 and 2008, respectively
CAPITAL RESOURCES AND LIQUIDITY FOR THE SIX MONTHS ENDED JUNE 30, 2009 AND 2008
Our sources of funds for liquidity consist of our dividend reinvestment plan, repayments of principal on our loans made to purchase mortgage investments, and bank lines of credit. The table below summarizes certain liquidity sources and uses for the six-month periods ended June 30, 2009 and June 30, 2008:
| | | | | |
| | | | |
Dividend reinvestment proceeds | | | | |
Number of shares returned to treasury | | | | |
Value of shares repurchased | | | | |
Principal receipts (payments): | | | | |
Residential mortgages and contracts for deed | | | | |
| | | | |
Investments in line of credit, non-affiliate | | | | |
Payments received under line of credit, affiliate | | | | |
We are not currently offering shares in the public markets except to existing shareholders through our dividend reinvestment plan. In July 2006, we registered an additional 1,000,000 shares to be offered through our dividend reinvestment plan.
On March 18, 2009, the Board approved certain modifications to the Company’s Share Repurchase Plan (“SRP”) and Dividend Reinvestment Plan (“DRIP”), which modifications were disclosed in a report on Form 8-K which we filed with the SEC on March 19, 2009. Pursuant to the requirements of the SRP and DRIP, the Company sent its shareholders notice of amendment of the SRP and the DRIP, both of which were effective on May 1, 2009.
Shares issued in the aggregate, as of June 30, 2009 and 2008 were 8,245,906 and 8,172,378, respectively. Shares retired to treasury through our share redemption plan in the aggregate were 1,827,181 and 1,624,957 through June 30, 2009 and 2008, respectively. Total shares outstanding were 6,418,725 and 6,547,421, at June 30, 2009 and 2008, respectively. As of June 30, 2009, inception to date gross offering proceeds from all public offerings were approximately $164,718,000 and net proceeds after fees, marketing reallowance and commissions were approximately $145,565,000.
Our Advisor is negotiating a new revolving line of credit facility with a bank for $5,000,000. The line of credit will bear interest at prime plus one percent and will require monthly interest payments. Principal and all unpaid interest will be due at maturity, which is August 2012. The line will be collateralized by a first lien security interest in the underlying real estate financed by the line of credit. Management expects the line of credit to be executed during August 2009.
Critical Accounting Policies and Estimates
We prepare our financial statements in accordance with GAAP. The preparation of consolidated financial statements requires us to make estimates and judgments that affect the reported amounts of assets, liabilities, revenues and expenses, and related disclosure of contingent assets and liabilities. On an on-going basis, we evaluate our estimates, including those related to accrual of interest income, loan loss reserves and valuation of foreclosed properties. We base our estimates on historical experience and on various other assumptions that are believed to be reasonable under the circumstances, the results of which form the basis for making judgments about the carrying values of assets and liabilities that are not readily apparent from other sources. Actual results may differ from these estimates under different assumptions or conditions.
Significant accounting policies are described in the audited consolidated financial statements and notes thereto included in our Annual Report on Form 10-K for the year ended December 31, 2008. The following critical accounting policies affect our more significant judgments and estimates used in the preparation of our consolidated financial statements:
Interest is accrued monthly on outstanding principal balances. Payments are either received monthly for interest or at payoff. Any deficiencies in unpaid interest are either charged off to the reserve for loan losses or charged against the related recourse obligations.
We maintain a reserve for loan losses for estimated losses resulting from the inability of our borrowers to make required payments resulting in property foreclosure and losses from the sale of foreclosed property. If the financial condition of our borrowers was to deteriorate, resulting in an impairment of their ability to make payments or, if the market value of the properties securing our loans decreases additional reserves may be required.
We record foreclosed properties at an estimated net realizable value based on our assessment of real estate market conditions and historical discount percentages on the sale of foreclosed properties. Should market conditions deteriorate or loss percentages increase, additional valuation adjustments may be required.
ITEM 3. QUANTITATIVE AND QUALITATIVE DISCLOSURES ABOUT MARKET RISK
In prior periods, we were exposed to interest rate changes primarily as a result of the method by which our bank credit facility was calculated at 1/2% over bank prime lending rate. Management anticipates we will have similar interest rate exposure with our new credit facilities, when consummated, as they will most likely have variable interest rates associated with them.
We provide a line of credit to UDF. UDF is a real estate finance limited partnership which derives a substantial portion of its income by originating, purchasing, participating in and holding for investment mortgage loans made directly by UDF to persons and entities for the acquisition and development of real property as single-family residential lots that will be marketed and sold to home builders. Changes in interest rates may impact both demand for UDF’s real estate finance products and the rate of interest on the loans UDF makes. In most instances, the loans UDF will make will be junior in the right of repayment to senior lenders who will provide loans representing 70% to 80% of total project costs. As senior lender interest rates available to our borrowers increase, demand for our mortgage loans may decrease, and vice versa.
Developers to whom UDF makes mortgage loans use the proceeds of such loans to develop raw real estate into residential home lots. The developers obtain the money to repay these development loans by selling the residential home lots to home builders or individuals who will build single-family residences on the lots, and by obtaining replacement financing from other lenders. If interest rates increase, the demand for single-family residences may decrease. Also, if mortgage financing underwriting criteria become more strict, demand for single-family residences may decrease. In such an interest rate and/or mortgage financing climate, developers may be unable to generate sufficient income from the resale of single-family residential lots to repay loans from UDF, and developers’ costs of funds obtained from lenders in addition to us may increase, as well. Accordingly, increases in single-family mortgage interest rates or decreases in the availability of mortgage financing could increase the number of defaults on development loans made by UDF, and correspondingly impact UDF’s ability to make payments under its line of credit.
ITEM 4. CONTROLS AND PROCEDURES
Evaluation of Disclosure Controls and Procedures
An evaluation was performed by the Company’s management, consisting of the individual who serves as our Chief Executive Officer and Chief Financial Officer, of the effectiveness of the Company’s disclosure controls and procedures (as defined in Rule 13a-15(e) under the Securities Exchange Act of 1934) as of June 30, 2009. Based on such evaluation, management has concluded that, as of the end of such period, the Company’s disclosure controls and procedures are effective.
The Company does not control the financial reporting process, and is solely dependent on UMTHGS, its Advisor, who is responsible for providing the Company with financial statements in accordance with generally accepted accounting principles in the United States. The Advisor’s disclosure controls and procedures were effective to provide reasonable assurance regarding the reliability of financial reporting and the preparation of financial statements for external purposes in accordance with accounting principles generally accepted in the United States.
Changes in Internal Controls over Financial Reporting
There have been no changes in the Company’s internal control over financial reporting that occurred during the second fiscal quarter of 2009, that have materially affected, or are reasonably likely to materially affect, the Company’s internal control over financial reporting.
PART II - OTHER INFORMATION
ITEM 1. LEGAL PROCEEDINGS
None.
ITEM 2. UNREGISTERED SALES OF EQUITY SECURITIES AND USE OF PROCEEDS
There is currently no established public trading market for our shares. As an alternative means of providing limited liquidity for our shareholders, we maintain a share redemption plan (“SRP”).
Under our SRP, shareholders who have held the shares for at least one year are eligible to request that we repurchase their shares. In any consecutive 12 month period we may not repurchase more than 5% of the outstanding shares at the beginning of the 12 month period. The repurchase price is based on the value of our assets less our obligations or a fixed pricing schedule, as determined by the trustees' business judgment based on our book value, operations to date and general market and economic conditions and may not, in any event, exceed any current public offering price. We have also purchased a limited number of shares outside of our SRP from shareholders with special hardship considerations.
Share repurchases have been at prices between NAV, which is calculated and adjusted as necessary on a quarterly basis, and $20 per share. Shares repurchased at the lower price were 1) shares held by shareholders for less than 12 months or 2) shares purchased outside of our SRP. Our stated NAV at December 31, 2008 was $16.03 per share. Our stated NAV at June 30, 2009 was $15.92 per share.
The following table sets forth information relating to shares of beneficial interest repurchased into treasury during the period covered by this report.
| Total number of shares repurchased | | Total number of shares purchased as part of a publicly announced plan | Total number of shares purchased outside of plan |
| | | | |
| | | | |
| | | | |
| | | | |
| | | | |
| | | | |
| | | | |
ITEM 3. DEFAULTS UPON SENIOR SECURITIES
Not applicable.
ITEM 4. SUBMISSION OF MATTERS TO A VOTE OF SECURITY HOLDERS
At the Company’s 2009 Annual Meeting of Shareholders held on June 10, 2009 at the Company’s principal executive office at 1301 Municipal Way Suite 200, Grapevine, Texas, 76051, the shareholders of the Company elected the following directors, constituting the entire Board of Trustees of the Company to serve one year terms expiring at the Company’s 2010 Annual meeting of Shareholders.
At the Company’s 2009 Annual Meeting of Shareholders held on June 10, 2009, the shareholders of the Company also ratified the appointment of Whitley Penn LLP as the Company’s independent registered public accounting firm for the year ending December 31, 2009 as follows:
| | | | |
Ratification of Whitley Penn LLP as the Company’s independent registered public accounting firm | | | |
ITEM 5. OTHER INFORMATION
None.
ITEM 6. EXHIBITS
| 3.1 | Form of Second Amended Restated Declaration of Trust | * |
| 3.2 | Bylaws of the Company | * |
| 4.1 | Form of certificate representing the shares | * |
| 4.2 | Dividend Reinvestment Plan (incorporated by reference from the prospectus to the Company's Registration Statement on Form S-3POS (File no, 333-136107), that became effective October 16, 2006)) | ** |
| 4.3 | Description of Share Repurchase Program (incorporated by reference from the prospectus to the Company's Registration Statement on Form S-3POS (File no, 333-136107), that became effective October 16, 2006)) | ** |
| 10.1 | Economic Interest Participation Agreement and Purchase Option between United Mortgage Trust and UDF III dated September 19, 2008 (filed as Exhibit 10.1 to Form 10-Q for the Quarter Ended September 30, 2008 and incorporated herein by reference) | |
| 10.2 | Participation Agreement between United Mortgage Trust and UDF III dated September 30, 2008 (filed as Exhibit 10.2 t o Form 10-Q for the Quarter Ended September 30, 2008 and incorporated here in by reference) | |
| 10.3 | Advisory Agreement dated August 14, 2006 between the Company and UMTH General Services, L.P. (incorporated by reference from Form 8-K filed August 16, 2006) | |
| 10.4 | Form of Mortgage Servicing Agreement between the Company and South Central Mortgage, Inc. at a later date assigned to Prospect Service Corp. | * |
| | | |
| | | |
| 10.5 | Second Amended Secured Line of Credit Promissory Note and Security Agreement between the Company and United Development Funding, L.P. dated June 20, 2006 (incorporated by reference from Form 8-K filed June 21, 2006) | |
| | | |
| 10.6 | Secured Variable Amount Promissory Note dated December 31, 2005 issued by Capital Reserve Group, Inc. (incorporated by reference from Form 8-K filed March 31, 2006) | |
| 10.7 | Secured Variable Amount Promissory Note dated December 31, 2005 issued by South Central Mortgage, Inc. (incorporated by reference from Form 8-K filed March 31, 2006) | |
| 10.8 | Secured Variable Amount Promissory Note dated December 31, 2005 issued by Ready America Funding Corp. (incorporated by reference from Form 8-K filed March 31, 2006) | |
| 10.9 | Form of Assignment of Limited Partnership Interest as Collateral Dated December 31, 2005 between the Company and Capital Reserve Group, Inc., South Central Mortgage, Inc., Ready America Funding Corp. and WLL, L.P. (incorporated by reference from Form 8-K filed March 31, 2006) | |
| 10.10 | Guaranty dated December 31, 2005 between the Company and Ready Mortgage Corp. (incorporated by reference from Form 8-K filed March 31, 2006) | |
| 10.11 | Guaranty dated December 31, 2005 between the Company and WLL, L.P. (incorporated by reference from Form 8-K filed March 31, 2006) | |
| 10.12 | Guaranty dated December 31, 2005 between the Company and UMT Holdings, L.P. (incorporated by reference from Form 8-K filed March 31, 2006) | |
| 10.13 | Intercreditor and Subordination Agreement dated December 31, 2005 between the Company and UMT Holdings, L.P. (incorporated by reference from Form 8-K filed March 31, 2006) | |
| 31.1 | Certification of Chief Executive Officer pursuant to Section 302 of the Sarbanes-Oxley Act of 2002 | |
| 31.2 | Certification of Chief Executive Officer pursuant to Section 906 of the Sarbanes-Oxley Act of 2002 | |
The exhibits marked with “*” are incorporated by reference from the Company's Registration Statement on Form S-11 (File No. 333-10109) that was declared effective on March 5, 1997. The exhibit marked with “**” is incorporated by reference from the Company's registration statement on Form S-11 (File No. 333-56520) that was declared effective on June 4, 2001.
SIGNATURE
Pursuant to the requirements of Section 13 or 15(d) of the Securities Exchange Act of 1934, the Registrant has duly caused this report to be signed on their behalf by the undersigned, thereunto duly authorized.
| | | |
| | |
| | |
| | |
| | President, Chief Executive Officer and Chief Financial Officer |